TRANSDERMAL DELIVERY OF THERAPEUTIC COMPOUNDS BY IONTOPHORESIS By MICHAEL A. MEMBRINO A DISSERTATION PRESENTED TO THE GRADUATE SCHOOL OF THE UNIVERSITY OF FLORIDA IN PARTIAL FULFILLMENT OF THE REQUIREMENTS FOR THE DEGREE OF DOCTOR OF PHILOSOPHY UNIVERSITY OF FLORIDA 2002

Welcome message from author
This document is posted to help you gain knowledge. Please leave a comment to let me know what you think about it! Share it to your friends and learn new things together.
Transcript

TRANSDERMAL DELIVERY OF THERAPEUTIC COMPOUNDSBY IONTOPHORESIS
By
MICHAEL A. MEMBRINO
A DISSERTATION PRESENTED TO THE GRADUATE SCHOOLOF THE UNIVERSITY OF FLORIDA IN PARTIAL FULFILLMENT
OF THE REQUIREMENTS FOR THE DEGREE OFDOCTOR OF PHILOSOPHY
UNIVERSITY OF FLORIDA
2002
ACKNOWLEDGMENTS
I would like to express my sincere gratitude to the numerous individuals who
contributed to this work. Sincere thanks and appreciation go to my advisor, Dr.
Mark E. Orazem, for his technical guidance, patience and unwavering commit-
ment to research excellence. His insightful comments and suggestions played an
integral role in the success of this project. I am grateful that he gave me the oppor-
tunity to explore my scientific curiosity. I also thank the members of my research
committee Dr. Oscar Crisalle, Dr. Raj Rajagopalan, Dr. Fan Ren and Dr. Kenneth
Sloan. Special thanks go to Dr. Kenneth Sloan for sharing his expertise of the
physical and biochemical properties of the skin.
I extend gratitude to my colleagues Steve Carson and Paul Wojcik for their as-
sistance in the development of the software to control the electrochemical equip-
ment. Genuine appreciation goes to Doug Riemer for maintaining our research
group’s computer network and for his help in designing the dual beam spectrom-
eter cell. I thank Madhav Durbha and Kerry Allahar for their discussions and
advice related to the modeling work. I express my gratitude to Pavan Shukla for
his assistance in the statistical analysis of the impedance data and Nellian Perez-
Garcia for her help with the UV-vis absorption spectroscopy experiments.
I thank the legion of lab assistants who served as my hands for the experi-
ments. I extend special recognition to Maria Corena, Steve Achinger, Jun Gao,
Scott Buntin, Glendon Parker, Juan Varela, Nathan Aldous, Ian Johns, Erika Varela,
Doug Hoffman, Craig Vitan, Whitney Kurz and Ann Farrell for their dedicated
service.
ii

I acknowledge the National Science Foundation, ALZA Corporation and the
Department of Chemical Engineering at the University of Florida for their finan-
cial support of this project. I extend special recognition to Dr. Gerald Westermann-
Clark for his efforts in helping me to secure the National Science Foundation MEDI
fellowship and obtain funds for my lab assistants. I want to thank Dean Warren
”Bud” Viessman for his personal support and involvement in my graduate career.
Special thanks goes to Marla Kendig of ALZA for preparing the skin specimens
used in this work.
I graciously acknowledge the efforts of my friends and family who attended
to my medical needs and daily living activities. The success of this project would
have been impossible without their hard work and dedication. I extend special
thanks to my brother, Matt, for living with me and maintaining my home. He
bailed me out of more emergencies than I care to mention. His efforts permitted
me to focus my attention on the research presented here.
Finally, and most importantly I extend a deep expression of gratitude to my
parents, Robert and Denise. My parents made numerous personal and profes-
sional sacrifices over the years to give me opportunities that they never had. Their
generous and unwavering support allowed me to pursue my dreams. They are
tremendous people and I am truly blessed to have such wonderful parents. The
sense of respect and admiration that I have for them is unbounded. Words can-
not adequately express the true feelings of gratitude and appreciation that I will
always have for my parents.
iii

TABLE OF CONTENTS
page
ACKNOWLEDGMENTS . . . . . . . . . . . . . . . . . . . . . . . . . . . . ii
LIST OF TABLES . . . . . . . . . . . . . . . . . . . . . . . . . . . . . . . . viii
LIST OF FIGURES . . . . . . . . . . . . . . . . . . . . . . . . . . . . . . . x
KEY TO SYMBOLS . . . . . . . . . . . . . . . . . . . . . . . . . . . . . . . xv
ABSTRACT . . . . . . . . . . . . . . . . . . . . . . . . . . . . . . . . . . . xvi
CHAPTERS
1 INTRODUCTION . . . . . . . . . . . . . . . . . . . . . . . . . . . . . 1
2 PHYSICOCHEMICAL PROPERTIES OF SKIN . . . . . . . . . . . . . . 5
2.1 Structure and Function of Skin . . . . . . . . . . . . . . . . . . . . . 52.2 Dermis . . . . . . . . . . . . . . . . . . . . . . . . . . . . . . . . . . . 72.3 Epidermis . . . . . . . . . . . . . . . . . . . . . . . . . . . . . . . . . 7
2.3.1 Stratum Basale . . . . . . . . . . . . . . . . . . . . . . . . . . 92.3.2 Stratum Spinosum . . . . . . . . . . . . . . . . . . . . . . . . 92.3.3 Stratum Granulosum . . . . . . . . . . . . . . . . . . . . . . . 10
2.4 Stratum Corneum . . . . . . . . . . . . . . . . . . . . . . . . . . . . . 102.4.1 Corneocytes . . . . . . . . . . . . . . . . . . . . . . . . . . . . 122.4.2 Stratum Corneum Lipids . . . . . . . . . . . . . . . . . . . . 122.4.3 Model Membrane Systems . . . . . . . . . . . . . . . . . . . 172.4.4 Intercellular Lamellar Lipid Organization . . . . . . . . . . . 182.4.5 Domain Mosaic Model . . . . . . . . . . . . . . . . . . . . . . 23
2.5 Intercellular Appendages . . . . . . . . . . . . . . . . . . . . . . . . 252.5.1 Hair Follicles . . . . . . . . . . . . . . . . . . . . . . . . . . . 262.5.2 Sweat Glands . . . . . . . . . . . . . . . . . . . . . . . . . . . 27
2.6 Influence of Electric Fields on Skin Properties . . . . . . . . . . . . . 282.6.1 Electrical Properties of the Stratum Corneum . . . . . . . . . 282.6.2 Iontophoretic Transport Pathways . . . . . . . . . . . . . . . 33
2.7 Summary of Skin Properties Affecting Iontophoretic Transport . . . 34
iv

3 MODELS FOR TRANSDERMAL IONTOPHORESIS . . . . . . . . . . 36
3.1 Nernst-Planck Continuum Models . . . . . . . . . . . . . . . . . . . 363.2 Hindered Transport Models . . . . . . . . . . . . . . . . . . . . . . . 383.3 Refined Hindered Transport Models . . . . . . . . . . . . . . . . . . 403.4 Nonequilibrium Thermodynamic Models . . . . . . . . . . . . . . . 443.5 Kinetic Rate Theory Based Models . . . . . . . . . . . . . . . . . . . 473.6 Electrochemical Impedance Spectroscopy . . . . . . . . . . . . . . . 50
3.6.1 Electrical Circuit Models of Skin Impedance Response . . . 513.6.2 Refined Circuit Models . . . . . . . . . . . . . . . . . . . . . 533.6.3 Limitations of Ideal Circuit Models . . . . . . . . . . . . . . 56
3.7 Summary . . . . . . . . . . . . . . . . . . . . . . . . . . . . . . . . . . 58
4 EXPERIMENTAL METHODOLOGY . . . . . . . . . . . . . . . . . . . 60
4.1 Electrochemical Impedance Spectroscopy . . . . . . . . . . . . . . . 614.1.1 Principles of Electrochemical Impedance Spectroscopy . . . 614.1.2 Modulation Procedure for EIS Experiments . . . . . . . . . . 664.1.3 Methodology . . . . . . . . . . . . . . . . . . . . . . . . . . . 674.1.4 Statistical Analysis of Impedance Spectra . . . . . . . . . . . 70
4.2 Potential and Current Step-Change Studies . . . . . . . . . . . . . . 744.3 Materials . . . . . . . . . . . . . . . . . . . . . . . . . . . . . . . . . . 754.4 UV-vis Absorption Spectroscopy . . . . . . . . . . . . . . . . . . . . 77
4.4.1 Instrumentation and Data Collection . . . . . . . . . . . . . . 784.4.2 Software Control . . . . . . . . . . . . . . . . . . . . . . . . . 824.4.3 Calibration Studies . . . . . . . . . . . . . . . . . . . . . . . . 82
4.5 Investigation of Transdermal Iontophoresis . . . . . . . . . . . . . . 83
5 DEVELOPMENT OF VAG MODULATION . . . . . . . . . . . . . . . 85
5.1 Preliminary Investigation of Skin Impedance . . . . . . . . . . . . . 855.1.1 Kramers-Kronig Consistency Check . . . . . . . . . . . . . . 885.1.2 Proposed Driving Force for Skin Property Changes . . . . . 915.1.3 Deviation in Potential Response from Linearity . . . . . . . 93
5.2 Development of VAG Modulation Technique . . . . . . . . . . . . . 965.2.1 Kramers-Kronig Consistency Check of Impedance Spectra . 1005.2.2 Comparison of Modulation Methods . . . . . . . . . . . . . 109
5.3 Comparison of Experiments with Literature Results . . . . . . . . . 111
6 RESULTS AND DISCUSSION OF SKIN IMPEDANCE STUDIES . . . . 114
6.1 Influence of Reference Electrode . . . . . . . . . . . . . . . . . . . . 1166.1.1 Results . . . . . . . . . . . . . . . . . . . . . . . . . . . . . . . 1186.1.2 K-K Consistency Check for Calomel Electrode Data . . . . . 1186.1.3 K-K Consistency Check for Micro-Reference Electrode Data 1236.1.4 Comparison of Calomel and Micro-Reference Electrodes . . 124
6.2 Influence of Hydration on Skin Impedance . . . . . . . . . . . . . . 127
v
6.2.1 Direct Analysis of Hydration Data . . . . . . . . . . . . . . . 1286.2.2 Influence of Cation Charge on Skin Hydration . . . . . . . . 133
6.3 Influence of Electrolyte Cation Charge on Skin Impedance . . . . . 1336.3.1 Impedance of Skin Immersed in Monovalent Electrolyte . . 1356.3.2 Impedance of Skin Immersed in Divalent Electrolyte . . . . 1376.3.3 Kramers-Kronig Consistency Assessment . . . . . . . . . . . 139
6.4 Influence of Large-Amplitude AC Potential Swings on Skin . . . . . 1406.5 Influence of DC Current Bias on Skin Impedance . . . . . . . . . . . 145
6.5.1 Comparison of Skin Impedance Spectra . . . . . . . . . . . . 1466.5.2 Identification of Corrupted Data . . . . . . . . . . . . . . . . 1486.5.3 Polarization Resistance and Open-circuit Potential Data . . 149
6.6 Variation of Properties with Location . . . . . . . . . . . . . . . . . . 1536.7 Comparison of Impedance Data with Literature Results . . . . . . . 154
7 STATISTICAL ANALYSIS OF VARIATION IN SKIN IMPEDANCE . . 160
7.1 Statistical Model for Skin Impedance Data . . . . . . . . . . . . . . . 1627.2 Analysis of Skin Impedance Data for Normal Distribution Charac-
teristics . . . . . . . . . . . . . . . . . . . . . . . . . . . . . . . . . . . 1647.3 Variance Components of Polarization Resistance . . . . . . . . . . . 1687.4 Variance Components of Critical Frequency . . . . . . . . . . . . . . 1707.5 Effect of Electrolyte on Skin Properties . . . . . . . . . . . . . . . . . 1737.6 Correlation Between Critical Frequency and Polarization Resistance 1757.7 Comparison of Variation in Skin Impedance with Literature Results 178
8 POTENTIAL AND CURRENT STEP-CHANGE STUDIES . . . . . . . 180
8.1 Potential Step-Change Results . . . . . . . . . . . . . . . . . . . . . . 1818.1.1 Model Predictions of Skin Polarization Resistance . . . . . . 1818.1.2 Calculated Deviation From Constant Properties . . . . . . . 182
8.2 Current Step-Change Results . . . . . . . . . . . . . . . . . . . . . . 1858.2.1 Measured Potential Difference Across the Skin . . . . . . . . 1868.2.2 Calculated Polarization Resistance . . . . . . . . . . . . . . . 1888.2.3 Comparison of Responses for Skin Samples 1 and 2. . . . . . 191
9 TRANSDERMAL LIDOCAINE FLUX MEASUREMENTS . . . . . . . 197
9.1 Spectroscopy System Stability . . . . . . . . . . . . . . . . . . . . . . 1979.2 Lidocaine Calibration Study. . . . . . . . . . . . . . . . . . . . . . . . 201
9.2.1 Comparison of Absorbance Spectra. . . . . . . . . . . . . . . 2029.2.2 Determination of Lidocaine Extinction Coefficients. . . . . . 204
9.3 Absorbance Changes from Skin Species . . . . . . . . . . . . . . . . 2099.4 Transdermal Delivery of Lidocaine by Iontophoresis . . . . . . . . . 211
10 MATHEMATICAL MODEL OF TRANSDERMAL IONTOPHORESIS . 220
10.1 System Description . . . . . . . . . . . . . . . . . . . . . . . . . . . . 22010.2 Boundary Conditions . . . . . . . . . . . . . . . . . . . . . . . . . . . 22210.3 Bulk Solution Compositions . . . . . . . . . . . . . . . . . . . . . . . 223
vi
10.4 Governing Equations . . . . . . . . . . . . . . . . . . . . . . . . . . . 22410.4.1 Molar Flux . . . . . . . . . . . . . . . . . . . . . . . . . . . . . 22410.4.2 Material Balance Expressions . . . . . . . . . . . . . . . . . . 22510.4.3 Homogeneous Reactions . . . . . . . . . . . . . . . . . . . . . 22710.4.4 Electroneutrality . . . . . . . . . . . . . . . . . . . . . . . . . 23010.4.5 Numerical Method . . . . . . . . . . . . . . . . . . . . . . . . 230
11 MODEL SIMULATION RESULTS . . . . . . . . . . . . . . . . . . . . 232
11.1 Calculated Flux Profiles . . . . . . . . . . . . . . . . . . . . . . . . . 23311.2 Influence of Buffer on pH Within Stratum Corneum . . . . . . . . . 235
12 CONCLUSIONS . . . . . . . . . . . . . . . . . . . . . . . . . . . . . . 237
13 SUGGESTED RESEARCH . . . . . . . . . . . . . . . . . . . . . . . . . 242
APPENDICES
A PREPARATION OF EPIDERMIS . . . . . . . . . . . . . . . . . . . . . 245
B VAG MODULATION FOR IMPEDANCE SPECTROSCOPY . . . . . . 247
B.1 Design Equations . . . . . . . . . . . . . . . . . . . . . . . . . . . . . 247B.2 Error Analysis of VAG Modulation Scheme . . . . . . . . . . . . . . 248
C STATISTICAL OUTPUT . . . . . . . . . . . . . . . . . . . . . . . . . . 252
C.1 Distribution Statistics from EIS Measurements of Skin Hydration . 252C.2 Analysis of Variance for EIS Measurements of Skin Hydration . . . 253
C.2.1 Regression to Polarization Resistance . . . . . . . . . . . . . 254C.2.2 Regression to Critical Frequency . . . . . . . . . . . . . . . . 255
C.3 Histograms of Selected Skin Properties During Hydration . . . . . 257
REFERENCES . . . . . . . . . . . . . . . . . . . . . . . . . . . . . . . . . . 262
BIOGRAPHICAL SKETCH . . . . . . . . . . . . . . . . . . . . . . . . . . 283
vii

LIST OF TABLES
Table page
5-1 Minimum frequencies and associated membrane potential differ-ences for Kramers-Kronig consistent portions of skin impedancespectra. . . . . . . . . . . . . . . . . . . . . . . . . . . . . . . . . . . . 91
5-2 Error structure parameters of skin impedance spectra. . . . . . . . . 101
7-1 Proposed hypotheses for model effects on polarization resistance . 164
7-2 Distribution statistics for critical frequency as a function of elec-trolyte type . . . . . . . . . . . . . . . . . . . . . . . . . . . . . . . . . 168
7-3 Distribution statistics for log10 of critical frequency as a function ofelectrolyte type . . . . . . . . . . . . . . . . . . . . . . . . . . . . . . 169
7-4 Calculated contributions to the overall variance in the log10 of skinpolarization resistance . . . . . . . . . . . . . . . . . . . . . . . . . . 169
7-5 Calculated contributions to the total variance in the log10 of skinpolarization resistance. . . . . . . . . . . . . . . . . . . . . . . . . . . 170
7-6 Calculated contributions to the total variance of the log10 of skinpolarization resistance for pieces immersed in divalent electrolyte . 170
7-7 Calculated contributions to the overall variance in the log10 of skincritical frequency . . . . . . . . . . . . . . . . . . . . . . . . . . . . . 171
7-8 Calculated contributions to the total variance of the log10 of skincritical frequency for pieces immersed in monovalent electrolyte . . 171
7-9 Calculated contributions to the total variance of the log10 of skincritical frequency for pieces immersed in divalent electrolyte . . . . 172
7-10 Proposed hypotheses for comparison of means . . . . . . . . . . . . 173
7-11 Proposed hypotheses for comparison of variance . . . . . . . . . . . 174
viii

7-12 F-test statistics for comparison of variances in the log10 of polariza-tion resistance for each electrolyte type . . . . . . . . . . . . . . . . . 175
7-13 F-test parameters for comparison of variances in the log10 of criticalfrequency for each electrolyte type . . . . . . . . . . . . . . . . . . . 175
7-14 Student’s t-test output statistics for comparison of means in thelog10 of polarization resistance for each electrolyte type . . . . . . . 176
7-15 Student’s t-test output statistics for comparison of means in thelog10 of critical frequency for each electrolyte type . . . . . . . . . . 176
8-1 Regression parameters for estimation of skin properties . . . . . . . 182
9-1 Regression parameters for calculation of extinction coefficients fromabsorbance data of lidocaine solutions with concentrations greaterthan 200 µM . . . . . . . . . . . . . . . . . . . . . . . . . . . . . . . . 206
9-2 Extinction coefficients and regression parameters calculated fromabsorbance data of lidocaine solutions with concentrations less than175 µM . . . . . . . . . . . . . . . . . . . . . . . . . . . . . . . . . . . 207
9-3 Optically coupled spectroscopy experiment settings . . . . . . . . . 212
10-1 Diffusion coefficients and bulk solution concentrations for the speciespresent in the transdermal iontophoretic simulation . . . . . . . . . 224
C-1 Distribution statistics for skin polarization resistance and criticalfrequency as a function electrolyte type . . . . . . . . . . . . . . . . 253
C-2 Distribution statistics for log10 of skin polarization resistance andcritical frequency as a function electrolyte . . . . . . . . . . . . . . . 254
C-3 Distribution statistics for square root of skin polarization resistanceand critical frequency as a function electrolyte . . . . . . . . . . . . 255
C-4 Calculated contributions to variance . . . . . . . . . . . . . . . . . . 255
C-5 Calculated contributions to variance from regression of GLM modelto skin polarization resistance data . . . . . . . . . . . . . . . . . . . 255
C-6 Calculated contributions to the total variance from regression ofGLM model to the critical frequency of skin . . . . . . . . . . . . . . 256
C-7 Calculated contributions to the total variance from regression ofGLM model to the critical frequency . . . . . . . . . . . . . . . . . . 256
ix

LIST OF FIGURES
Figure page
2-1 Relative thickness and structure of the dermis and epidermis. . . . 6
2-2 Relative thickness and structure of corneocytes in the various layersof the epidermis. . . . . . . . . . . . . . . . . . . . . . . . . . . . . . 8
2-3 Classification scheme of stratum corneum ceramides based on chem-ical structure and composition. . . . . . . . . . . . . . . . . . . . . . 16
2-4 Alternating-width layered structure of stratum corneum lamellarlipids. . . . . . . . . . . . . . . . . . . . . . . . . . . . . . . . . . . . . 19
2-5 Structural organization of stratum corneum lipid phases. . . . . . . 21
2-6 Structure of skin appendages that penetrate the stratum corneum. . 26
2-7 Potential routes for transport of therapeutic compounds during trans-dermal iontophoresis. . . . . . . . . . . . . . . . . . . . . . . . . . . . 33
3-1 Schematic representation of fluid flow through constrained pores. . 41
3-2 Proposed scheme for step-wise transport of dissolved species throughthe stratum corneum. . . . . . . . . . . . . . . . . . . . . . . . . . . . 50
3-3 Equivalent circuit model for stratum corneum impedance. . . . . . 52
3-4 Impedance-plane plot of skin immersed in 50 mM CaCl2. . . . . . . 54
3-5 Equivalent circuit models of transmission lines. . . . . . . . . . . . . 55
3-6 Constant phase element network representation of stratum corneumimpedance. . . . . . . . . . . . . . . . . . . . . . . . . . . . . . . . . . 56
4-1 Polarization plot for a typical electrochemical system. . . . . . . . . 62
4-2 Impedance-plane plot of skin immersed in 100 mM NaCl. . . . . . . 65
4-3 Bode magnitude plot of a typical impedance response of skin. . . . 66
x
4-4 Micrograph of heat-separated cadaver skin. Picture taken at a mag-nification of 92x. . . . . . . . . . . . . . . . . . . . . . . . . . . . . . . 76
4-5 Dual spectrometer system configuration. . . . . . . . . . . . . . . . 79
4-6 Dual spectrometer diffusion cell configuration. . . . . . . . . . . . . 81
4-7 Dual spectrometer diffusion cell photograph. . . . . . . . . . . . . . 81
5-1 Impedance response of skin when subjected to a series of constant-amplitude modulated experiments. . . . . . . . . . . . . . . . . . . . 87
5-2 Normalized real residual errors from an imaginary fit of the Mea-surement Model to the 50 µA spectrum. . . . . . . . . . . . . . . . . 90
5-3 Potential difference across the skin as a function of frequency. . . . 93
5-4 Calculated DC limit of potential difference across skin in responseto a series of constant-amplitude galvanostatic impedance scans. . 94
5-5 Impedance response of skin as measured by VAG and constant-amplitude galvanostatic modulation. . . . . . . . . . . . . . . . . . . 98
5-6 Normalized residual errors from real fit of the Measurement Modelto a 10 mV VAG scan of skin in CaCl2 electrolyte. . . . . . . . . . . . 103
5-7 Normalized residual errors from an imaginary fit of the Measure-ment Model to a 10 mV VAG scan of skin in CaCl2 electrolyte. . . . 105
5-8 Normalized residual errors from a fit of the Measurement Modelto the real part of a 10 µA constant-amplitude galvanostatic scan ofskin in CaCl2 electrolyte. . . . . . . . . . . . . . . . . . . . . . . . . . 107
5-9 Normalized residual errors from a fit of the Measurement Model tothe imaginary part of a selected 10 µA constant-amplitude galvano-static scan of skin in CaCl2 electrolyte. . . . . . . . . . . . . . . . . . 108
5-10 Skin impedance as a function of frequency collected by both VAGand constant-amplitude modulation. . . . . . . . . . . . . . . . . . . 109
6-1 Impedance-plane plots of successive 100 µA impedance scans offully hydrated skin. . . . . . . . . . . . . . . . . . . . . . . . . . . . . 119
6-2 Normalized residual errors from a fit of the Measurement Model tothe real part of skin impedance. . . . . . . . . . . . . . . . . . . . . . 120
xi

6-3 Normalized residual errors from an imaginary fit of the Measure-ment Model to a selected impedance spectrum of hydrated skinmeasured with calomel reference electrodes. . . . . . . . . . . . . . 122
6-4 Normalized residual errors from a real fit of the Measurement Modelto a selected impedance spectrum of hydrated skin measured withAg/AgCl micro-reference electrodes. . . . . . . . . . . . . . . . . . . 125
6-5 Normalized residual errors from an imaginary fit to a selected imped-ance spectrum of hydrated skin measured with Ag/AgCl micro-reference electrodes. . . . . . . . . . . . . . . . . . . . . . . . . . . . 126
6-6 Selected sequential impedance scans of skin hydration in bufferedCaCl2 electrolyte. . . . . . . . . . . . . . . . . . . . . . . . . . . . . . 130
6-7 Open-circuit potential across skin during the hydration study. . . . 130
6-8 Normalized polarization resistance plots of skin. . . . . . . . . . . . 132
6-9 Impedance-plane plot of skin immersed in 150 mM NaCl bufferedelectrolyte. . . . . . . . . . . . . . . . . . . . . . . . . . . . . . . . . . 135
6-10 Polarization impedance and potential difference across skin immersedin buffered 150 mM NaCl electrolyte. . . . . . . . . . . . . . . . . . . 136
6-11 Impedance-plane plot of skin immersed in 50 mM CaCl2 bufferedelectrolyte. . . . . . . . . . . . . . . . . . . . . . . . . . . . . . . . . . 138
6-12 Polarization impedance and potential difference across skin immersedin buffered 50 mM CaCl2 electrolyte. . . . . . . . . . . . . . . . . . . 139
6-13 Impedance-plane plot of skin where the target potential drop acrossthe skin was increased periodically. . . . . . . . . . . . . . . . . . . . 142
6-14 Skin polarization resistance upon completion of the elevated targetpotential impedance scans. . . . . . . . . . . . . . . . . . . . . . . . . 143
6-15 Polarization resistance (solid blue diamonds) and voltage drop acrossthe skin (solid yellow circles) for the elevated target potential imped-ance scans. . . . . . . . . . . . . . . . . . . . . . . . . . . . . . . . . . 144
6-16 Impedance spectra collected to determine the influence of DC cur-rent on skin properties. . . . . . . . . . . . . . . . . . . . . . . . . . . 147
6-17 Skin polarization resistance in response to 6 amplitudes of appliedcurrent. . . . . . . . . . . . . . . . . . . . . . . . . . . . . . . . . . . . 149
xii

6-18 Open-circuit potential difference across the stratum corneum beforeand after impedance scans. . . . . . . . . . . . . . . . . . . . . . . . 151
6-19 Impedance spectra and the relative locations for skin sample extrac-tion of four pieces of skin. . . . . . . . . . . . . . . . . . . . . . . . . 155
7-1 Proposed sources of variation in skin properties. . . . . . . . . . . . 161
7-2 Histograms of the critical frequency of heat-separated epidermis. . 166
7-3 Relationship of characteristic skin impedance parameters, log10( fc)and log10(Rp). . . . . . . . . . . . . . . . . . . . . . . . . . . . . . . . 177
8-1 Sample regression of linear model to potential step-change data topredict skin properties. . . . . . . . . . . . . . . . . . . . . . . . . . . 182
8-2 Deviation in the measured current from the current associated withpotential independent polarization resistance skin. . . . . . . . . . . 184
8-3 Potential difference across epidermis. . . . . . . . . . . . . . . . . . 186
8-4 Calculated polarization resistance of skin. . . . . . . . . . . . . . . . 189
8-5 Response of skin samples to 14 µ/cm2 step-change. . . . . . . . . . 195
8-6 Response of skin samples to a 140 µ/cm2 step-change. . . . . . . . . 196
9-1 Mean values for the dark-corrected transmission intensity spectracollected over 2.4 hours. . . . . . . . . . . . . . . . . . . . . . . . . . 199
9-2 Ratio of slave and master spectrometer transmission intensities. . . 201
9-3 Normalized absorbance spectra for calibration of lidocaine concen-tration. . . . . . . . . . . . . . . . . . . . . . . . . . . . . . . . . . . . 203
9-4 Absorbance as a function of lidocaine concentration at selected wave-lengths. . . . . . . . . . . . . . . . . . . . . . . . . . . . . . . . . . . . 205
9-5 Dependence of calculated extinction coefficient on light wavelength. 209
9-6 Absorbance spectra of skin immersed in buffered NaCl solution. . . 210
9-7 Evolution of the absorbance response during the transdermal ionto-phoresis experiment. . . . . . . . . . . . . . . . . . . . . . . . . . . . 212
xiii

9-8 Temporal evolution of the calculated lidocaine concentration andflux in the receptor cell. . . . . . . . . . . . . . . . . . . . . . . . . . . 214
9-9 Temporal evolution of skin polarization resistance and transdermallidocaine flux. . . . . . . . . . . . . . . . . . . . . . . . . . . . . . . . 216
10-1 Dimensions of the simulated system for transdermal iontophoresis. 221
10-2 Flow pattern of dissolved species through the system domain. . . . 226
11-1 Potential profile within the stratum corneum. . . . . . . . . . . . . . 232
11-2 Calculated flux profiles of the major ionic species throughout sys-tem domain. . . . . . . . . . . . . . . . . . . . . . . . . . . . . . . . . 233
11-3 Calculated flux profile of lidocaine throughout system domain. . . 234
11-4 Calculated pH profiles within stratum corneum. . . . . . . . . . . . 236
B-1 Percent relative error for prediction of impedance from VAG algo-rithm. . . . . . . . . . . . . . . . . . . . . . . . . . . . . . . . . . . . . 250
C-1 Histograms of the polarization resistance of skin immersed in mono-valent electrolyte. . . . . . . . . . . . . . . . . . . . . . . . . . . . . . 258
C-2 Histograms of polarization resistance of skin immersed in divalentelectrolyte. . . . . . . . . . . . . . . . . . . . . . . . . . . . . . . . . . 259
C-3 Histograms of skin critical frequency for pieces immersed in mono-valent electrolyte. . . . . . . . . . . . . . . . . . . . . . . . . . . . . . 260
C-4 Histograms of the critical frequency of skin immersed in divalentelectrolyte. . . . . . . . . . . . . . . . . . . . . . . . . . . . . . . . . . 261
xiv

KEY TO SYMBOLS
i = Current density
F = Faraday’s constant
R = Universal gas constant
T = Absolute temperature
k = Kinetic rate constant
Φ = Electrostatic potential
VOC = Open-circuit potential
κ = Conductivity
ci = Concentration of species i
t = Time
Ni = Net flux of species i
Ri = Rate of generation of species i
Di = Diffusion coefficient for species i
zi = Ionic charge of species i
ui = Mobility of species i
I = Ionic strength
vx = Bulk solution velocity in the x-direction
EIS = Electrochemical Impedance Spectroscopy
VAG = Variable-Amplitude Galvanostatic (modulation)
xv
Abstract of Dissertation Presented to the Graduate Schoolof the University of Florida in Partial Fulfillment of theRequirements for the Degree of Doctor of Philosophy
TRANSDERMAL DELIVERY OF THERAPEUTIC COMPOUNDSBY IONTOPHORESIS
By
Michael A. Membrino
May 2002
Chair: Dr. Mark E. OrazemMajor Department: Chemical Engineering
Therapeutic administration of pharmaceuticals requires that safe and con-
trolled delivery rates be achieved. Iontophoresis is a promising technique for
delivering ionic drugs across the skin. Topical delivery of therapeutic agents by
iontophoresis is attractive because the large surface area of skin provides for easy
access. The top-most skin layer, the stratum corneum, does not favor the transport
of most therapeutically active compounds under normal physiological conditions.
Iontophoresis takes advantage of the negative background charge of skin which
favors delivery of positively charged species. During iontophoresis a driving force
for enhanced transport across skin is provided by an applied electric field. A lim-
itation of the approach is that skin may be altered during the process.
The object of this work was to identify the influence of electric fields on the
physicochemical properties of skin. The effect of electrolyte solution composition
on these properties was also studied. Electrochemical impedance spectroscopy
was applied to monitor the properties of skin before, during and after iontophor-
xvi
esis. Statistical models were regressed to the data to identify nonstationary and
nonlinear behavior. Results indicated that skin properties began to change as
the potential across the skin exceeded a critical value. An adaptive modulation
strategy was developed to prevent alterations to membrane properties during the
impedance experiment.
The delivery rate of lidocaine across the skin was studied by UV-vis absorp-
tion spectroscopy. A customized dual-beam diffusion cell was developed to ac-
count for the mildly nonstationary behavior of the spectroscopy system. The work
indicated that applied current enhanced the transdermal flux of lidocaine.
An additional goal of this work was to identify the influence of controlled
variables on concentration and flux profiles within the skin. A one-dimensional
steady-state mathematical model was developed to provide insight into the cou-
pled phenomena that occur in the stratum corneum. The governing equations
for the model account for diffusion and migration, homogeneous reactions in the
electrolyte and the negative background charge of skin. Sample calculations are
provided to demonstrate the complex nature of the interactions among the species
in the system during iontophoresis.
xvii
CHAPTER 1INTRODUCTION
The object of this work was to provide insight into the important factors that in-
fluence administration of therapeutic agents by transdermal iontophoresis. Trans-
dermal iontophoresis is a technique for delivering ionic compounds across the
skin with an applied electric current. The motivation for using the applied cur-
rent is to provide an additional driving force for transport, by way of the induced
electric field, to overcome the low permeability of skin. An attractive feature of
transdermal iontophoresis is that the drug delivery rate is directly proportional to
current. Therapeutic levels of drug concentration may be achieved by adjusting
the magnitude of the applied current. This relationship, in principle, makes the
electrical and mechanical design of clinical devices relatively straight-forward.
The development of iontophoretic devices requires an understanding of skin
transport properties under applied-current conditions. A major focus of this work
was to determine the influence of the applied current on skin transport properties.
In accordance with this goal, a variety of experimental techniques were applied.
As part of the design process, experimental techniques were refined to minimize
the influence of the experiment on skin properties.
The structure and chemical composition of skin under normal physiological
conditions are described in Chapter 2. An emphasis was placed on skin properties
which affect the drug delivery process. A literature review of the influence of ap-
plied electric fields on skin properties is presented in Section 2.6. The object of the
review was to establish a foundation for the development of experimental tech-
1
2
niques to investigate transdermal iontophoresis. The information was also used
to interpret results and to develop theoretical models for transdermal iontophor-
esis.
A literature review of mathematical models for transdermal iontophoresis was
also performed. The important features of the transport models are summarized
in Chapter 3. The limitations and underlying assumptions associated with the
various models are described.
The experimental efforts were directed along two general themes. The first was
to identify the influence of electric fields on the physicochemical properties of skin.
The second was to evaluate the enhancement of transdermal delivery rates of the
model drug lidocaine by an applied electric field. The literature indicates that skin
properties may be altered by the applied electric fields.1−3 The potential impact of
this behavior on the design of iontophoretic devices is significant should the alter-
ations be shown to be irreversible or associated with adverse reactions. Therefore,
a strong emphasis was placed on identifying the magnitude of potential or current
where the properties of skin begin to change. The reversibility of the changes in
skin properties was also assessed. Heat-separated human cadaver skin was se-
lected as the model for skin; therefore, all of the experiments were conducted in
vitro.
Electrochemical Impedance Spectroscopy and current and potential step-change
experiments were conducted to achieve this goal. The implementation of these
techniques is discussed in Chapter 4. Preliminary studies of skin by impedance
spectroscopy indicated that the traditional modulation method can alter mem-
brane properties. An adaptive modulation strategy was developed to prevent
changes in skin properties. The results from the preliminary studies and the im-
plementation of the adaptive modulation method are discussed in Chapter 5.
3
Chapter 6 provides a discussion of the skin impedance studies conducted un-
der a wide range of experimental conditions. For example, the dynamics of skin
hydration were studied performing periodic impedance experiments in the ab-
sence of an applied current. This investigation provided an estimate of the base-
line properties of skin. Iontophoretic conditions were simulated by applying a
current bias across the skin. A comparison of the results provided an estimate for
the influence of current on skin properties.
A large database of skin impedance spectra was collected in this work. The
skin samples were obtained from the dorsal and abdominal regions of 18 human
cadavers. Multiple pieces of skin from each macroscopic skin sample were stud-
ied by Electrochemical Impedance Spectroscopy. Visual inspection of the spectra
revealed a large variation in the impedance response of skin. The statistical pro-
cedure used to assess the relative contributions to the overall variation in skin
properties is described in Chapter 7. For example, the variation was assumed to
be caused by differences among the donors (inter-individual differences), differ-
ences within a given donor (intra-individual differences) or stochastic measure-
ment errors. Estimates for the contributions to the overall variation were obtained
by regressing a nested statistical model to the impedance data. The polarization
resistance and critical frequency were selected as the independent variables for the
regressions to reduce computational effort.
The results for the step-change experiments are presented in Chapter 8. The
objective was to identify the response of skin to prolonged exposure to electric
fields. Two studies were performed where the applied step-change was either
current or potential. The work was designed to supplement the impedance work.
The application of UV-vis absorption spectroscopy for in vitro monitoring of
transdermal lidocaine fluxes is described in Chapter 9. The technique was used
4
in conjunction with electrochemical impedance spectroscopy to simultaneously
measure drug delivery rates and monitor skin transport properties during trans-
dermal iontophoresis. The combined methodology provided for a more accurate
assessment of the important factors affecting transdermal iontophoresis.
A steady-state mathematical model was developed to provide insight into the
experimental results. The model was derived from macroscopic transport theory
and was designed to simulate the conditions of the experimental system. Contri-
butions to the total flux from diffusion, migration and convection were included.
A unique feature of the model was that the migration contribution was evaluated
without assuming a constant field within the skin. Furthermore, multiple homo-
geneous reactions, such as the dissociation of water, were included. The develop-
ment of the mathematical model is discussed in Chapter 10 and the results from
the simulations are presented in Chapter 11.
Conclusions from the work presented in this report are discussed in Chapter 12.
Suggestions for future research of transdermal iontophoresis are provided in Chap-
ter 13. Proposals for supplemental experimental studies are described here. Rec-
ommendations for refinements to the mathematical model for transdermal ionto-
phoresis are also included.
CHAPTER 2PHYSICOCHEMICAL PROPERTIES OF SKIN
An extensive body of research related to transdermal iontophoresis is available
in the literature. This chapter of the report is a description of the structure and
chemical composition of the skin under normal physiological conditions. Particu-
lar focus is given to the top-most layer of the skin, the stratum corneum, since it is
considered to be the dominant barrier to percutaneous absorption. The physical
behavior of the stratum corneum during iontophoresis is described in Section 2.6.
2.1 Structure and Function of Skin
Development of efficient clinical devices for transdermal iontophoresis requires
knowledge of the chemical composition and physical structure of the skin. The
commonly accepted view of these properties under normal physiological condi-
tions is summarized in this section. The physicochemical properties that influence
transport of species through the skin are emphasized. Unless otherwise noted, the
material presented here is limited to the properties of skin under normal physio-
logical conditions. More extensive discussions describing the anatomy and phys-
iology of skin are available elsewhere.4−9
The skin, also known as the integument, is the largest organ of the human
body. The total surface area of skin for an average adult is approximately 2 m2.10
Skin is a very dynamic organ that functions to accommodate mechanical stresses,
prevent excessive water loss, facilitate transpirational cooling, protect against the
harmful radiation of the sun, provide for skin cell renewal and prevent absorption
of foreign bodies.11, 12
5
6
In order to perform such a wide variety of tasks, human skin has evolved into
a highly specialized heterogeneous membrane possessing a complex morpholog-
ical structure and chemical composition. Physiological properties such as thick-
ness, sweat production and barrier function exhibit considerable variability for
different anatomical sites of the body. Variations in these properties are directly
linked to differences in the chemical composition and structural organization of
the skin.4, 13−18
The skin is composed of two distinct macroscopic regions which are referred
to as the epidermis and the dermis.19, 20 This anatomical division becomes obvious
upon closer inspection of the unique morphological structure and physiological
function of each of these regions. For example, the vascular dermis is a physiolog-
ically active region that makes up the majority of skin.21 The second macroscopic
region of the skin, the epidermis, is located directly on top of the dermis and com-
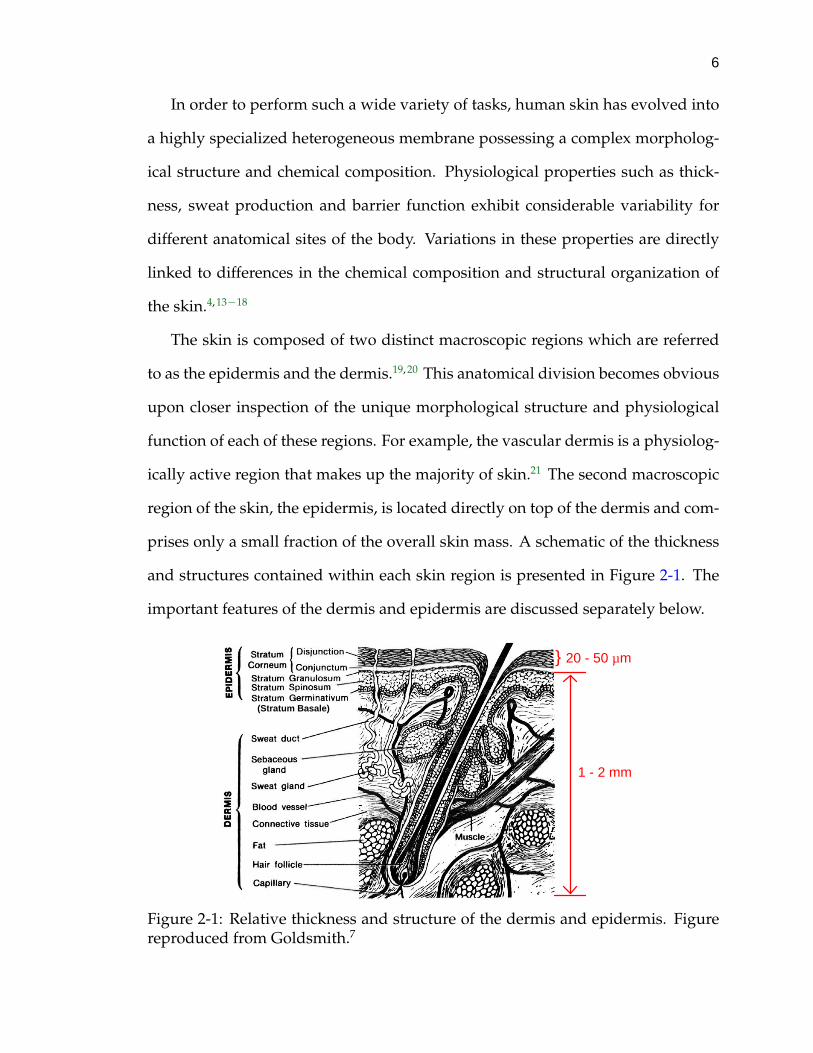
prises only a small fraction of the overall skin mass. A schematic of the thickness
and structures contained within each skin region is presented in Figure 2-1. The
important features of the dermis and epidermis are discussed separately below.
20 - 50 µm
1 - 2 mm
(Stratum Basale)
Figure 2-1: Relative thickness and structure of the dermis and epidermis. Figurereproduced from Goldsmith.7

7
2.2 Dermis
The dermis is a composite network of fibrous and elastic tissue sparsely pop-
ulated with cells.22 Fibrous proteins of the dermis include collagen, elastin and
reticulin.23 The organization of these tissues provide skin with its ability to with-
stand a variety of mechanical stresses.24 There is considerable variation in dermal
thickness with location on the body. The typical thickness of the dermis is on the
order of 1-2 mm where the maximum thickness of 4 mm is found on the back.25
Embedded in the dermis is a dense network of blood vessels, nerve endings,
and lymphatic vessels. The capillaries located in the dermis provide for nutri-
ent and heat exchange.4 The capillaries are also believed to act as a sink for
molecules diffusing through the skin.26, 27 Appendages such as sebaceous glands,
sweat glands and hair follicles originate in the dermis. These structures have been
implicated as routes of transport during iontophoresis.28−31 Discussion of the im-
portant characteristics of skin appendages is provided in Section 2.5.
2.3 Epidermis
The epidermis is a dynamic multi-layered structure that performs a broad range
of physiological functions. The epidermis is avascular in comparison to the der-
mis and has a thickness of approximately 100 microns.20 The epidermis is nor-
mally subdivided into four anatomical regions. The innermost layer is the stratum
basale, which is also referred to as the stratum germinativum. The next three re-
gions are the overlying stratum spinosum, the intermediate stratum granulosum,
and the outermost layer known as the stratum corneum.11 The unique features of
each of these regions are discussed in the subsequent sections of this chapter.
Corneocytes, also known as keratinocytes, compose the majority of epidermal
cells. There is a constant turnover of corneocytes in all regions of the epidermis.
Migration of cells occurs in an upward direction from the innermost layers of the

8
epidermis to the surface of the skin. As the corneocytes travel through the epider-
mis a variety of enzymatic processes change the chemical composition and struc-
tural organization of the cells.32 Upon reaching the surface, the corneocytes are
eventually shed from the body. The turnover rate through the complete epidermis
is approximately 28-42 days.21
Although blood vessels are absent from the epidermis, nutrient exchange oc-
curs via passive diffusion through the interstitial space.4 The structure, composi-
tion, and organization of the corneocytes and lipids in each of the regions of the
epidermis correlate with the state of differentiation and physiological function.
The cellular structure and relative thickness in each of the respective layers of the
epidermis are illustrated in Figure 2-2.
Figure 2-2: Relative thickness and structure of corneocytes in the various layers ofthe epidermis. Figure reproduced from Schaefer and Redelmeier.4

9
2.3.1 Stratum Basale
The stratum basale, also known as the basal layer, consists of a band of colum-
nar cells located directly above the dermis. The cells in this region are physiologi-
cally active and possess intact cell membranes, functional nuclei and typical cellu-
lar organelles such as mitochondria and Golgi apparatus.21 The stratum basale is
the source of all corneocytes found in the epidermis. Upon mitosis the corneocytes
gradually migrate upward. After leaving the stratum basale, the corneocytes lose
the ability to perform cellular division.
The lipids present in the stratum basale primarily consist of phospholipids.
The phospholipids make up the cell membranes of the corneocytes in this region
of the epidermis.4 The interior of the corneocytes contain bundles of the fibrous
protein keratin. Keratin exhibits a high affinity for water,24 although it is extremely
insoluble in water.33 An additional property of keratin is that it has a high sulfur
content due to the cysteine residues of the protein.24
Connection between adjacent corneocytes is made by fibrous proteinaceous
units called desmosomes. The desmosomes maintain connection between the
corneocytes as they migrate toward the surface of the epidermis. The desmoso-
mal connections are believed to degrade in the uppermost layers of the stratum
corneum to facilitate corneocyte exfoliation.22 The corneocyte production rate in
the stratum basale leads to the formation of approximately one new cell layer per
day. As the cells mature they migrate into the stratum spinosum at approximately
the same rate to maintain constant basal layer thickness.34
2.3.2 Stratum Spinosum
The stratum spinosum lies directly on top of the basal layer. The corneocyte
cells of this region are shaped like ovoids. The surface of the corneocytes pos-
sess spinous extensions that help to maintain adhesion between adjacent cells.

10
The interior of the cells contain larger bundles of keratin filaments. The concen-
tration of keratin bundles in the stratum spinosum corneocytes is higher than in
the basal layer corneocytes. The corneocytes in the upper layers of the stratum
spinosum contain newly developed organelles known as lamellar granules.11 En-
closed within the lamellar granules is an abundance of phospholipids, glycolipids
and cholesterol organized into lamellar sheets.35, 36 The lamellar granules also con-
tain enzymes that begin to synthesize the lipids that eventually fill the intercellular
space of the stratum corneum.37
2.3.3 Stratum Granulosum
The corneocytes of the stratum granulosum exhibit a gradual transition in
chemical composition and structural organization as they migrate toward the sur-
face of the skin. As the corneocytes move upward through successive layers of
the stratum granulosum they gradually begin to lose their ovoid shape as they
become more elongated and flattened. The concentration of proteins continues
to increase and highly cross-linked proteins begin to aggregate around the outer
periphery of the corneocytes. The number of lamellar granules also increases in
the stratum granulosum. The lamellar granules begin to organize near the corneo-
cyte borders to facilitate the extrusion of the internal lipids and enzymes into the
intercellular space.36−38 The lipid composition of the granular layers also exhibits
a gradual increase in the relative concentration of ceramides, cholesterol and fatty
acids.4, 6, 39
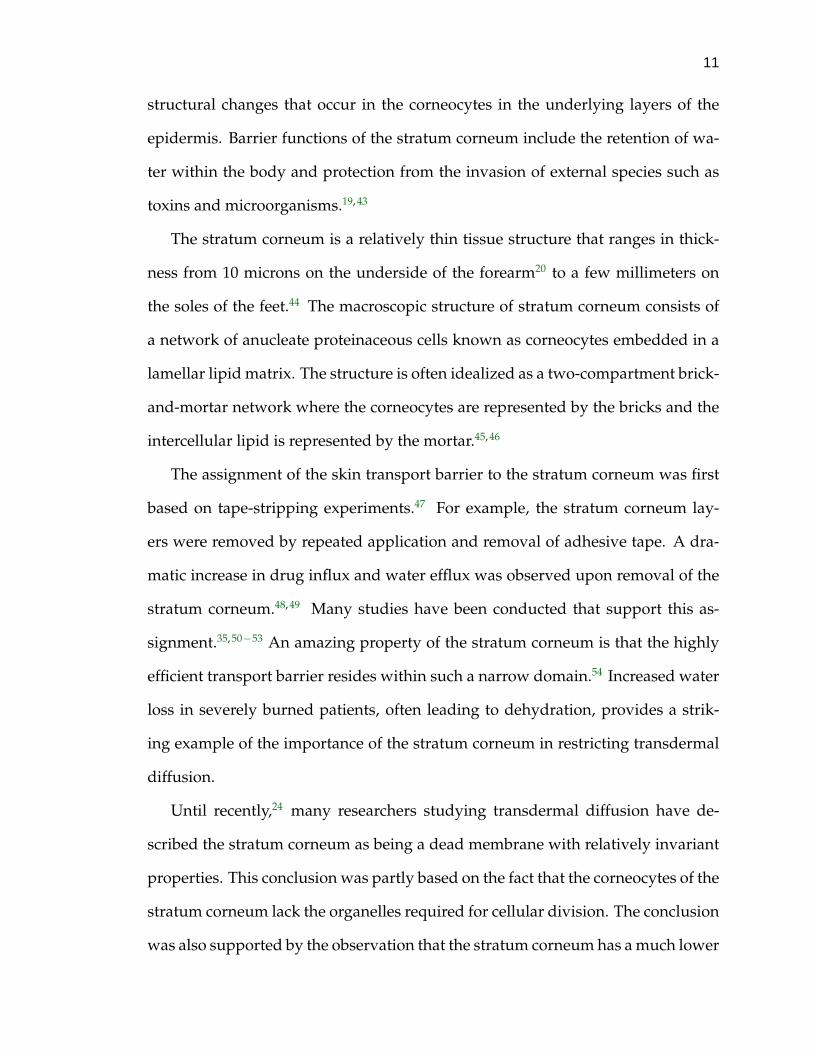
2.4 Stratum Corneum
The outermost layer of the skin is the stratum corneum. The stratum corneum
is described in detail in this section of the report because it is generally regarded
as the dominant barrier to transport in the epidermis.20, 23, 24, 40−42 The excellent bar-
rier properties of the stratum corneum are mostly provided by the chemical and
11
structural changes that occur in the corneocytes in the underlying layers of the
epidermis. Barrier functions of the stratum corneum include the retention of wa-
ter within the body and protection from the invasion of external species such as
toxins and microorganisms.19, 43
The stratum corneum is a relatively thin tissue structure that ranges in thick-
ness from 10 microns on the underside of the forearm20 to a few millimeters on
the soles of the feet.44 The macroscopic structure of stratum corneum consists of
a network of anucleate proteinaceous cells known as corneocytes embedded in a
lamellar lipid matrix. The structure is often idealized as a two-compartment brick-
and-mortar network where the corneocytes are represented by the bricks and the
intercellular lipid is represented by the mortar.45, 46
The assignment of the skin transport barrier to the stratum corneum was first
based on tape-stripping experiments.47 For example, the stratum corneum lay-
ers were removed by repeated application and removal of adhesive tape. A dra-
matic increase in drug influx and water efflux was observed upon removal of the
stratum corneum.48, 49 Many studies have been conducted that support this as-
signment.35, 50−53 An amazing property of the stratum corneum is that the highly
efficient transport barrier resides within such a narrow domain.54 Increased water
loss in severely burned patients, often leading to dehydration, provides a strik-
ing example of the importance of the stratum corneum in restricting transdermal
diffusion.
Until recently,24 many researchers studying transdermal diffusion have de-
scribed the stratum corneum as being a dead membrane with relatively invariant
properties. This conclusion was partly based on the fact that the corneocytes of the
stratum corneum lack the organelles required for cellular division. The conclusion
was also supported by the observation that the stratum corneum has a much lower
12
water content than most of the other soft tissues in the body. Despite this anecdo-
tal evidence, much of the recent literature suggests that the stratum corneum is a
highly functionalized membrane with considerable enzymatic activity.55
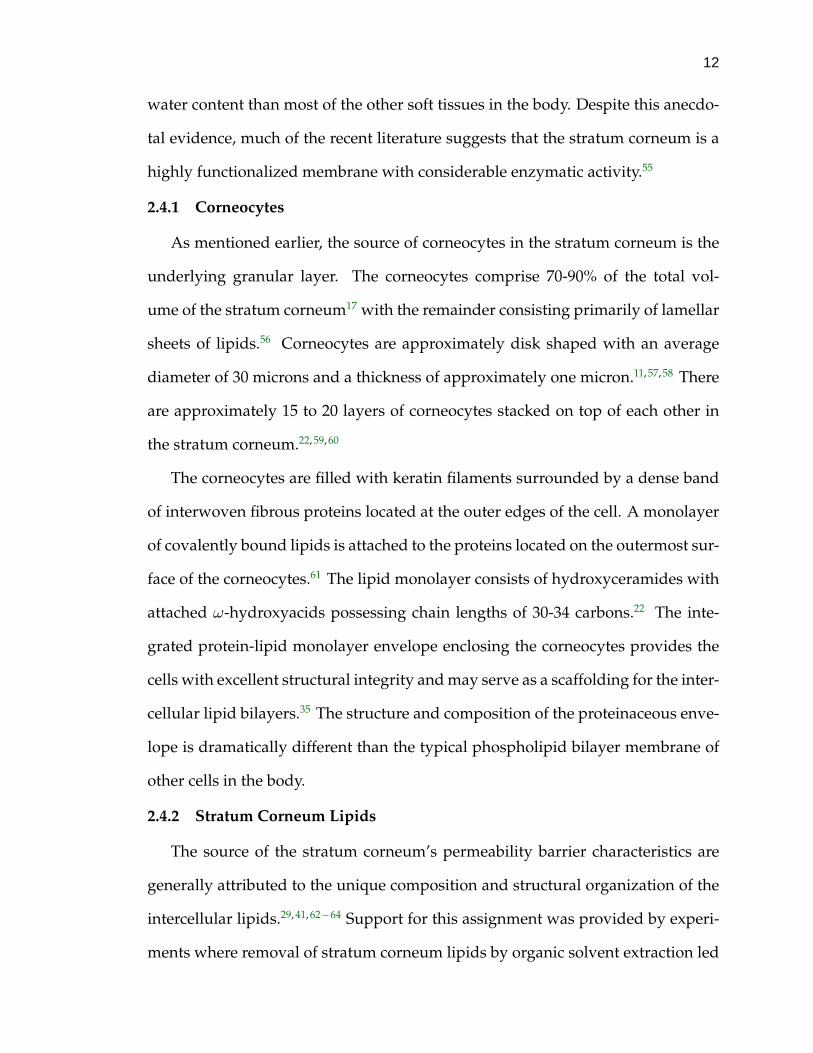
2.4.1 Corneocytes
As mentioned earlier, the source of corneocytes in the stratum corneum is the
underlying granular layer. The corneocytes comprise 70-90% of the total vol-
ume of the stratum corneum17 with the remainder consisting primarily of lamellar
sheets of lipids.56 Corneocytes are approximately disk shaped with an average
diameter of 30 microns and a thickness of approximately one micron.11, 57, 58 There
are approximately 15 to 20 layers of corneocytes stacked on top of each other in
the stratum corneum.22, 59, 60
The corneocytes are filled with keratin filaments surrounded by a dense band
of interwoven fibrous proteins located at the outer edges of the cell. A monolayer
of covalently bound lipids is attached to the proteins located on the outermost sur-
face of the corneocytes.61 The lipid monolayer consists of hydroxyceramides with
attached ω-hydroxyacids possessing chain lengths of 30-34 carbons.22 The inte-
grated protein-lipid monolayer envelope enclosing the corneocytes provides the
cells with excellent structural integrity and may serve as a scaffolding for the inter-
cellular lipid bilayers.35 The structure and composition of the proteinaceous enve-
lope is dramatically different than the typical phospholipid bilayer membrane of
other cells in the body.
2.4.2 Stratum Corneum Lipids
The source of the stratum corneum’s permeability barrier characteristics are
generally attributed to the unique composition and structural organization of the
intercellular lipids.29, 41, 62−64 Support for this assignment was provided by experi-
ments where removal of stratum corneum lipids by organic solvent extraction led
13
to a dramatic increase in water loss from the skin.65, 66 Furthermore, the lipid com-
position of skin from patients with pathologically compromised barrier function
was found to be different than the skin of healthy patients.63
Considerable effort has been directed toward identifying the exact composition
and structural organization of the stratum corneum lipids. Despite the progress
made in this work, the relationship between lipid properties and corresponding
anatomical function is not completely understood. An overview of the important
chemical and physical characteristics of stratum corneum lipids is presented in
this section. The currently accepted views of the relationship between lipid struc-
ture and anatomical function is also discussed. The intent was to develop a phys-
ical basis for interpretation of the transdermal iontophoretic studies conducted in
this work. Manuscripts providing detailed discussions of stratum corneum lipids
are available elsewhere.14, 17, 22, 35, 56, 67
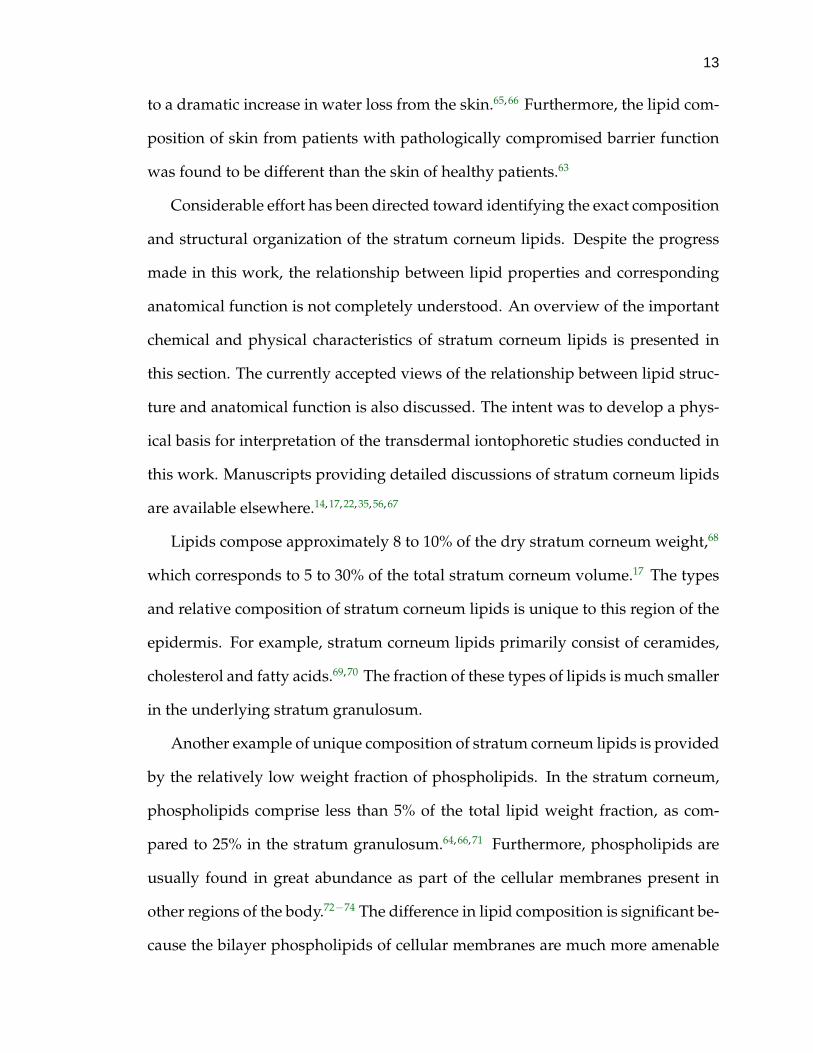
Lipids compose approximately 8 to 10% of the dry stratum corneum weight,68
which corresponds to 5 to 30% of the total stratum corneum volume.17 The types
and relative composition of stratum corneum lipids is unique to this region of the
epidermis. For example, stratum corneum lipids primarily consist of ceramides,
cholesterol and fatty acids.69, 70 The fraction of these types of lipids is much smaller
in the underlying stratum granulosum.
Another example of unique composition of stratum corneum lipids is provided
by the relatively low weight fraction of phospholipids. In the stratum corneum,
phospholipids comprise less than 5% of the total lipid weight fraction, as com-
pared to 25% in the stratum granulosum.64, 66, 71 Furthermore, phospholipids are
usually found in great abundance as part of the cellular membranes present in
other regions of the body.72−74 The difference in lipid composition is significant be-
cause the bilayer phospholipids of cellular membranes are much more amenable
14
to aqueous transport. This provides a partial explanation as to why the unique
composition of stratum corneum lipids is considered as the primary source of the
membrane’s low permeability characteristics.
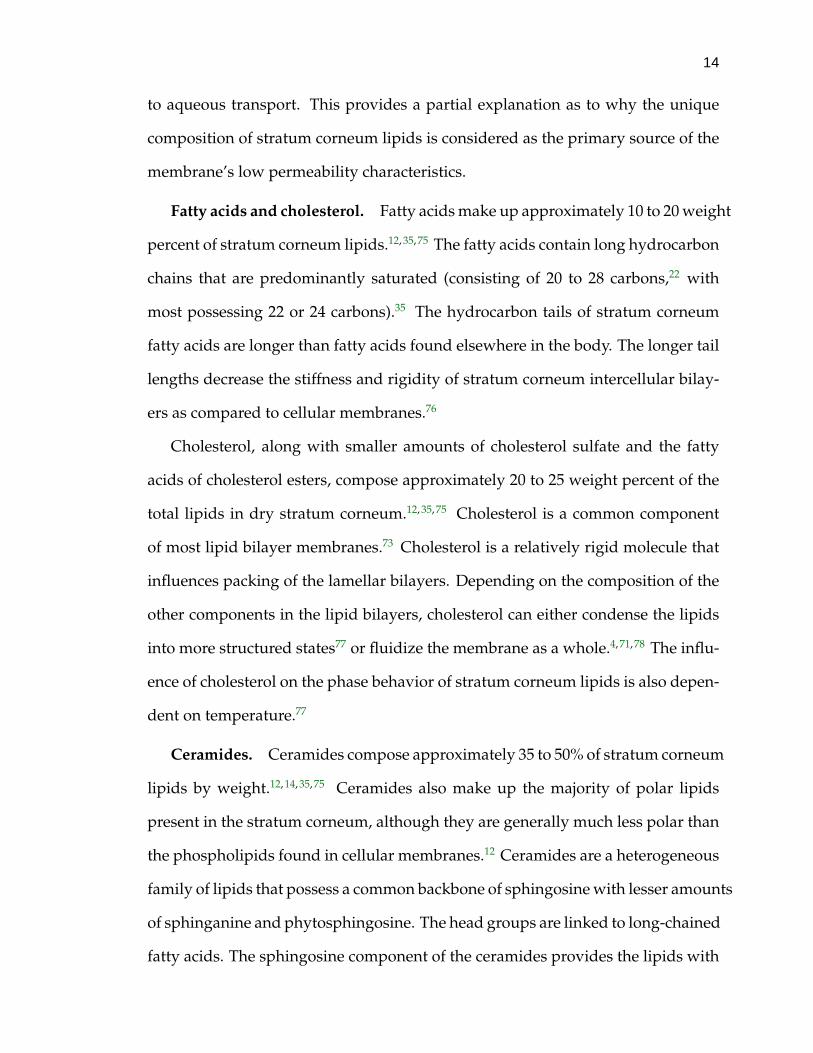
Fatty acids and cholesterol. Fatty acids make up approximately 10 to 20 weight
percent of stratum corneum lipids.12, 35, 75 The fatty acids contain long hydrocarbon
chains that are predominantly saturated (consisting of 20 to 28 carbons,22 with
most possessing 22 or 24 carbons).35 The hydrocarbon tails of stratum corneum
fatty acids are longer than fatty acids found elsewhere in the body. The longer tail
lengths decrease the stiffness and rigidity of stratum corneum intercellular bilay-
ers as compared to cellular membranes.76
Cholesterol, along with smaller amounts of cholesterol sulfate and the fatty
acids of cholesterol esters, compose approximately 20 to 25 weight percent of the
total lipids in dry stratum corneum.12, 35, 75 Cholesterol is a common component
of most lipid bilayer membranes.73 Cholesterol is a relatively rigid molecule that
influences packing of the lamellar bilayers. Depending on the composition of the
other components in the lipid bilayers, cholesterol can either condense the lipids
into more structured states77 or fluidize the membrane as a whole.4, 71, 78 The influ-
ence of cholesterol on the phase behavior of stratum corneum lipids is also depen-
dent on temperature.77
Ceramides. Ceramides compose approximately 35 to 50% of stratum corneum
lipids by weight.12, 14, 35, 75 Ceramides also make up the majority of polar lipids
present in the stratum corneum, although they are generally much less polar than
the phospholipids found in cellular membranes.12 Ceramides are a heterogeneous
family of lipids that possess a common backbone of sphingosine with lesser amounts
of sphinganine and phytosphingosine. The head groups are linked to long-chained
fatty acids. The sphingosine component of the ceramides provides the lipids with
15
a polar region. The fatty acids attached to the ceramides possess characteristically
long hydrocarbon tails (22-34 carbons) that are predominantly saturated or mo-
nounsaturated.35 In general, lipids with extra unsaturation decrease the stiffness
and rigidity of the intercellular bilayers.76
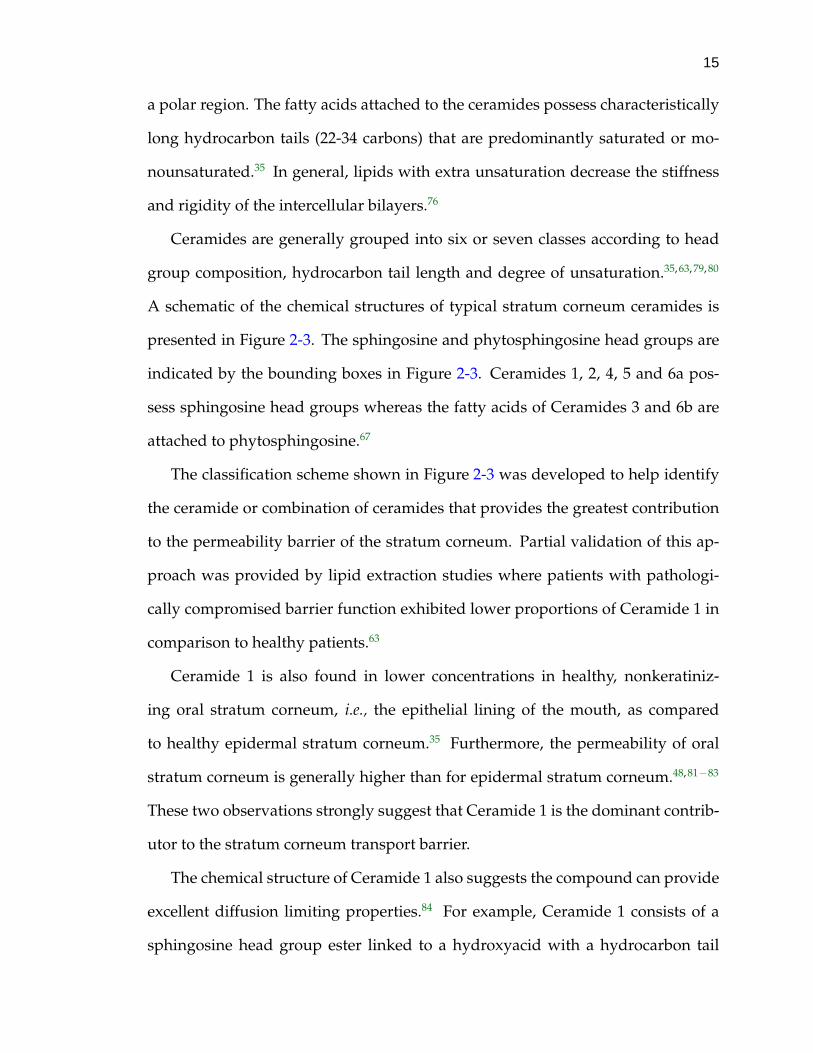
Ceramides are generally grouped into six or seven classes according to head
group composition, hydrocarbon tail length and degree of unsaturation.35, 63, 79, 80
A schematic of the chemical structures of typical stratum corneum ceramides is
presented in Figure 2-3. The sphingosine and phytosphingosine head groups are
indicated by the bounding boxes in Figure 2-3. Ceramides 1, 2, 4, 5 and 6a pos-
sess sphingosine head groups whereas the fatty acids of Ceramides 3 and 6b are
attached to phytosphingosine.67
The classification scheme shown in Figure 2-3 was developed to help identify
the ceramide or combination of ceramides that provides the greatest contribution
to the permeability barrier of the stratum corneum. Partial validation of this ap-
proach was provided by lipid extraction studies where patients with pathologi-
cally compromised barrier function exhibited lower proportions of Ceramide 1 in
comparison to healthy patients.63
Ceramide 1 is also found in lower concentrations in healthy, nonkeratiniz-
ing oral stratum corneum, i.e., the epithelial lining of the mouth, as compared
to healthy epidermal stratum corneum.35 Furthermore, the permeability of oral
stratum corneum is generally higher than for epidermal stratum corneum.48, 81−83
These two observations strongly suggest that Ceramide 1 is the dominant contrib-
utor to the stratum corneum transport barrier.
The chemical structure of Ceramide 1 also suggests the compound can provide
excellent diffusion limiting properties.84 For example, Ceramide 1 consists of a
sphingosine head group ester linked to a hydroxyacid with a hydrocarbon tail
16
Figure 2-3: Classification scheme of stratum corneum ceramides based on chemi-cal structure and composition. Figure adapted from Schurer.17
of much longer length than tails of the other ceramides present in the stratum
corneum.22 The longer hydrocarbon tail was used to develop a structural model
for the organization of the intercellular stratum corneum lipids.22, 38 The model
is discussed further in Section 2.4.4 The long hydrocarbon tail also provides the
intercellular bilayer with a more rigid structure. The rigid organization of the
bilayers provides for an enhanced transport resistance to diffusing compounds.85

17
2.4.3 Model Membrane Systems
The diverse number of lipids present in the bilayers makes it difficult to isolate
contributions to overall barrier function from specific components. Determination
of the relationship between lipid composition and barrier function in vivo is fur-
ther complicated by the presence of sebaceous lipids on the surface of the skin.
In order to study the relationship between relative lipid composition and mem-
brane structure/permeability, a variety of model membrane systems have been
developed.64, 69, 71, 84−89
The model membrane approach has been successful in relating structure and
composition to cellular function in bilayer membranes.90 Model membranes for
transdermal studies are typically constructed from the major classes of lipids found
in this stratum corneum such as ceramides, cholesterol and fatty acids. The gen-
eral approach involves adjusting the relative concentration of individual lipid
species and observing the phase behavior and permeability. The studies were
designed to isolate a specific lipid or combination of lipids that provides the dom-
inant contribution to the overall permeability barrier. In addition, the influence of
pH and temperature on the molecular organization of the model lipids has been
investigated. For example, an increase in pH can promote the long range ordering
of the bilayers.84
The development of model membranes has helped to identify many of the
physical processes governing the interactions between stratum corneum lipids.
Specifically, insight regarding the physical interactions between select classes of
stratum corneum lipids has been obtained using this approach. For example, an
increase in the relative concentration of cholesterol resulted in an increase in the
permeability of a model lipid membrane. The observed increase in permeabil-
18
ity of the cholesterol rich membrane was only slightly higher than the membrane
composed of lipids in proportions similar to normal stratum corneum bilayers.75
Although standard procedures are available, it is generally difficult to con-
struct bilayers with compositions and structural organizations similar to those of
anatomical stratum corneum lipids. Despite this experimental limitation, many
of the important features of stratum corneum lipids that affect transdermal diffu-
sion have been identified. A more complete understanding of the physical interac-
tions that occur between stratum corneum lipids and the corneocytes is required to
characterize transdermal diffusion completely. A general description of the molec-
ular forces governing organization of stratum corneum lipids is presented in the
next section.
2.4.4 Intercellular Lamellar Lipid Organization
The intercellular lipids of the stratum corneum form broad, sheet-like struc-
tures that are parallel to the surface of the skin.79 The bilayers are vertically stacked
into repeating units that results in an overall lamellar arrangement. Ruthenium
tetroxide fixation studies have revealed that the relative thickness of the repeating
lipid units exhibits alternating bands of broad and narrow regions.38, 91−93 The unit
cell for the repeating lamellar structure was identified as being broad:narrow:broad.
The thickness of the broad and narrow regions was estimated to be 13 µm and
6 µm. The alternating layer structure has been confirmed by X-ray diffraction
studies.94−96 It was proposed that the broad regions corresponded to the hydro-
carbon tails of lipid bilayers. In contrast, the narrow regions were believed to be
hydrocarbon tails of monolayers. The macroscopic organization of the lamellar
lipids provides for a continuous hydrophobic phase around the corneocytes.
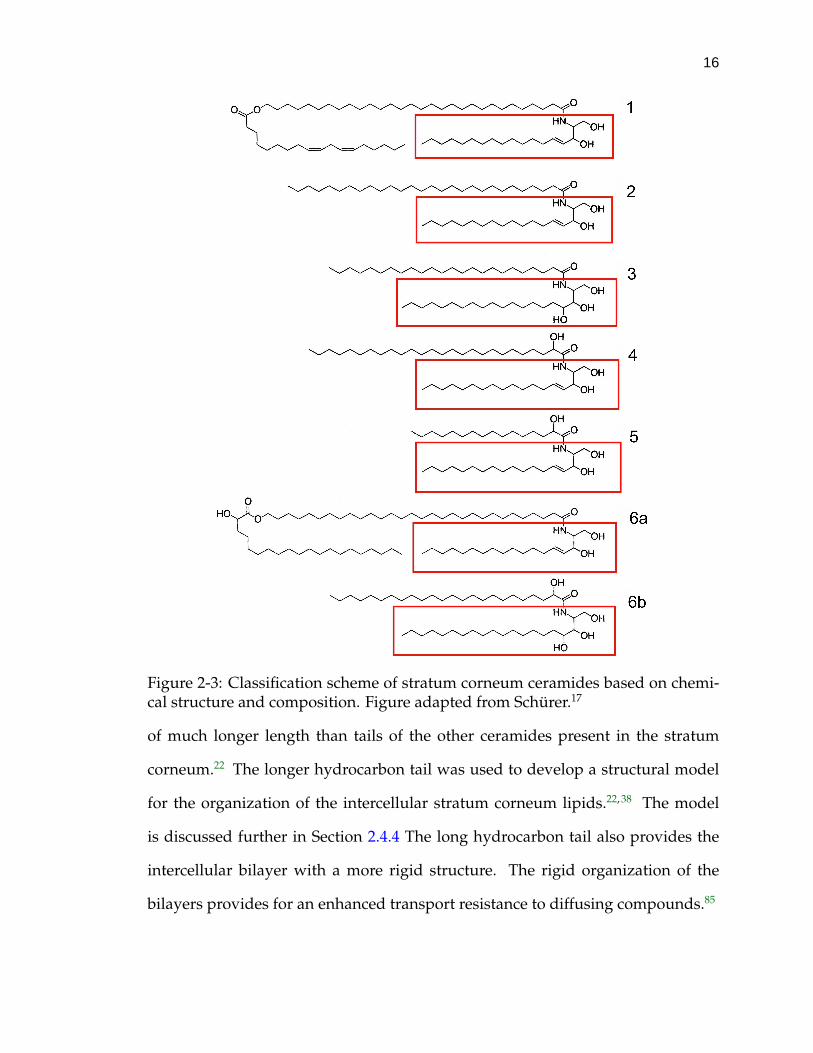
A structural model was developed to explain the alternating regions of broad
and narrow lipid layers. It was proposed that the lipid regions of the fatty acids
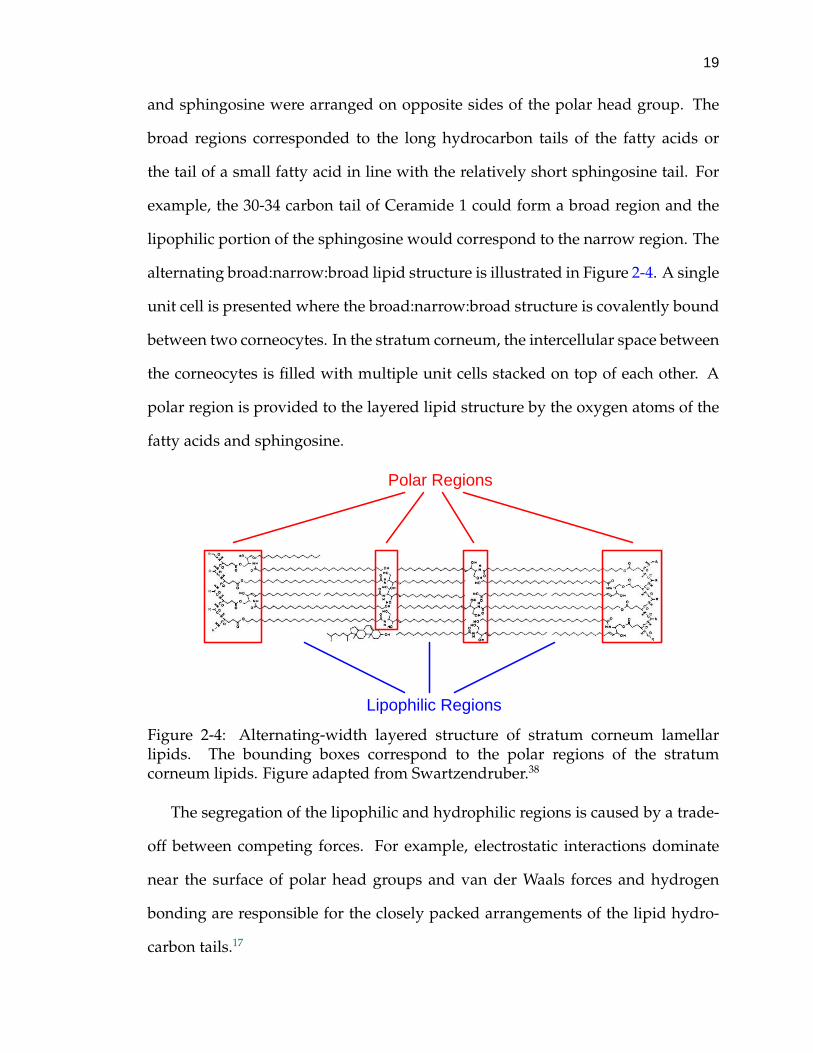
19
and sphingosine were arranged on opposite sides of the polar head group. The
broad regions corresponded to the long hydrocarbon tails of the fatty acids or
the tail of a small fatty acid in line with the relatively short sphingosine tail. For
example, the 30-34 carbon tail of Ceramide 1 could form a broad region and the
lipophilic portion of the sphingosine would correspond to the narrow region. The
alternating broad:narrow:broad lipid structure is illustrated in Figure 2-4. A single
unit cell is presented where the broad:narrow:broad structure is covalently bound
between two corneocytes. In the stratum corneum, the intercellular space between
the corneocytes is filled with multiple unit cells stacked on top of each other. A
polar region is provided to the layered lipid structure by the oxygen atoms of the
fatty acids and sphingosine.
Polar Regions
Lipophilic Regions
Figure 2-4: Alternating-width layered structure of stratum corneum lamellarlipids. The bounding boxes correspond to the polar regions of the stratumcorneum lipids. Figure adapted from Swartzendruber.38
The segregation of the lipophilic and hydrophilic regions is caused by a trade-
off between competing forces. For example, electrostatic interactions dominate
near the surface of polar head groups and van der Waals forces and hydrogen
bonding are responsible for the closely packed arrangements of the lipid hydro-
carbon tails.17
20
It is generally accepted in the literature that the long hydrocarbon tails of the
ceramides and fatty acids are ideally suited to form highly organized, densely
packed membrane structures.12 As mentioned earlier, extensive research has been
conducted to characterize the interactions between diffusing molecules and the
stratum corneum lipids. Particular emphasis has been placed on identifying the
relationship between lipid microstructure and the diffusion rate of compounds.
The biophysical properties of stratum corneum lipids, such as phase behavior and
structural organization, have been studied by a variety of experimental techniques
including 2H nuclear magnetic resonance,31, 64, 71 Raman spectroscopy,88, 97, 98 in-
frared spectroscopy,54, 99−104 differential scanning calorimetry,88, 99, 103, 105, 106 freeze-
fracture electron microscopy,36, 59, 71, 94, 107 ruthenium staining analysis37, 38, 91 and x-
ray diffraction studies.12, 94, 96, 108, 109
An important characteristic of stratum corneum lipids identified in these stud-
ies is that order-disorder phase transition temperatures are generally higher than
the normal physiological temperature of 37 C.70, 99 In contrast, the lipids present in
the cellular membranes in other regions of the body have transition temperatures
which are usually lower than 37C.20 The high transition temperature of stratum
corneum lipids is consistent with more ordered packing arrangements at normal
physiological temperature.
The relatively high phase transition temperatures of stratum corneum lipids
are due to the large thermal energy required to fluidize the long hydrocarbon tails.
For example, a two carbon increase in the length of hydrocarbon tail of phospho-
lipids is accompanied by a 20C increase in the gel to liquid crystalline transition
temperature.4 The densely packed arrangements of stratum corneum lipid bilay-
ers typically observed at physiological temperatures greatly restricts the diffusion
of water and ionic species directly through the membrane.
21
Lipid polymorphism. The mixture of lipids in the stratum corneum bilayers
exhibit complex phase behavior. For example, the lipids demonstrate considerable
lateral anisotropy in chemical composition and structural organization. Instead of
assembling into a single phase with uniform composition, the bilayers are orga-
nized into clustered domains which are arranged in different packing states.24, 100
Within a given bilayer, stratum corneum lipids are predominantly assembled in
either a lamellar gel or lamellar liquid-crystalline state.69, 97 Both of these phases
correspond to highly ordered structures; however, in the liquid-crystalline phase
the hydrocarbon tails are less tightly packed.73, 85
The comparatively looser packing arrangement of liquid-crystalline lipids pro-
vides for a two order of magnitude increase in membrane fluidity upon transition
from the gel state.73 At higher temperatures (> 80C) hexagonal packing of the
lipids has been observed. The hexagonal packed structure is much more fluid and
porous than the gel or liquid-crystalline phase which are associated with lower
temperatures. A schematic of the structural organization of the various phases
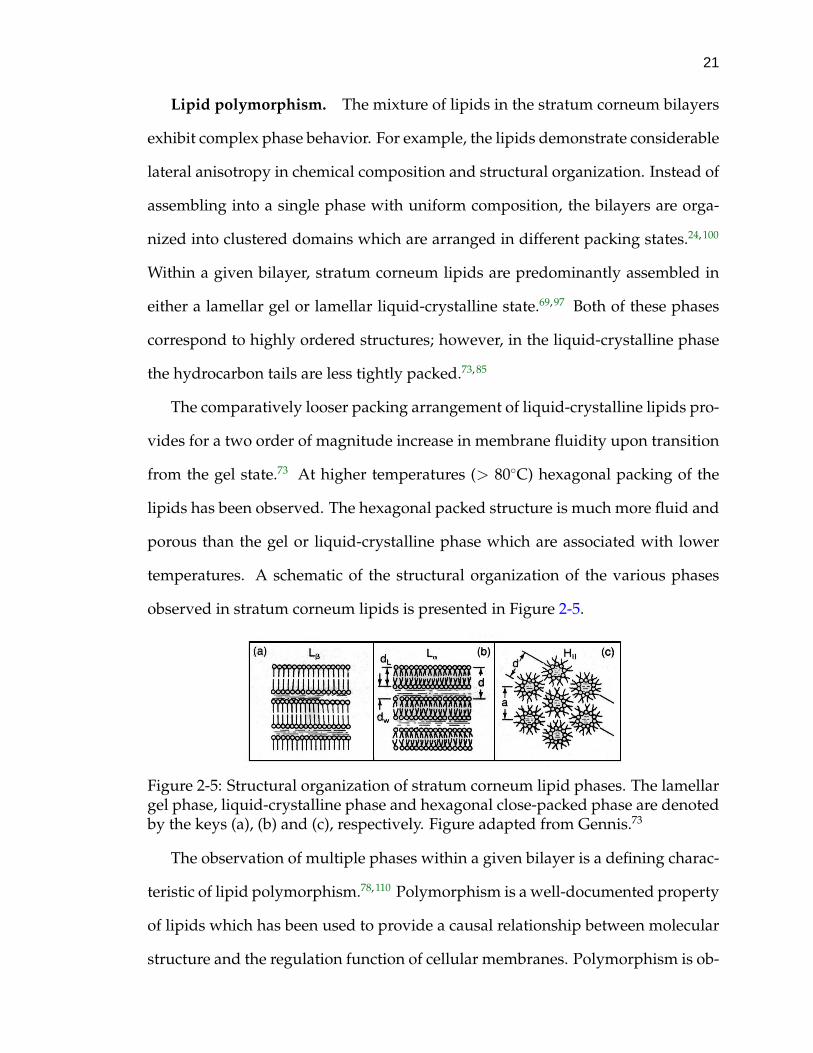
observed in stratum corneum lipids is presented in Figure 2-5.
Figure 2-5: Structural organization of stratum corneum lipid phases. The lamellargel phase, liquid-crystalline phase and hexagonal close-packed phase are denotedby the keys (a), (b) and (c), respectively. Figure adapted from Gennis.73
The observation of multiple phases within a given bilayer is a defining charac-
teristic of lipid polymorphism.78, 110 Polymorphism is a well-documented property
of lipids which has been used to provide a causal relationship between molecular
structure and the regulation function of cellular membranes. Polymorphism is ob-

22
served in bilayers with uniform lipid composition as well as in more chemically
diverse systems.73, 110 Temperature, water content, pH, protein content and local
composition of lipids influence the structure of the localized phase domains of the
bilayers.24, 73, 78, 84
An important biophysical property associated with polymorphism is that lipids
are able to diffuse laterally within a given bilayer.73, 77 The relatively high mobility
of cellular lipid bilayers observed at physiological temperatures is consistent with
the flexible and fluid packing arrangements seen in the liquid-crystalline phase.
As the hydrocarbon tails of stratum corneum lipids are generally longer than in
cellular membrane lipids, it is likely that there is less lateral diffusion in the skin.
Intercellular water. Water is an important contributor to the overall lipid or-
ganization of the stratum corneum bilayers. The weight percentage of water in
the stratum corneum is approximately 20% as opposed to 70-80% in the stratum
granulosum.111, 112 There is also a water concentration gradient across the stra-
tum corneum. The concentration of water is highest in the innermost layers of
the stratum corneum and gradually decreases toward the surface of the skin.113
Most of the water is bound to the corneocyte proteins; however, results from x-ray
scattering experiments suggested that small amounts of water were present in the
intercellular lipid matrix.95 The water was believed to reside along the polar head
groups of the lipid bilayers.95, 114
The stratum corneum possesses an amazing ability to absorb large quantities
of water. It has been reported that water is absorbed in quantities equal to three to
four times the dry weight of the stratum corneum.59 The hydration process is not
instantaneous. As the water content of the stratum corneum increases over time
the corneocytes begin to swell. Experiments with fully hydrated skin revealed that
23
corneocyte expansion does not lead to significant structural alteration of individ-
ual lipid bilayers.59, 91, 95, 96, 115, 116
The studies indicated that water was generally aggregated into small pools
located near the jagged interfaces of lipid regions. The pools of water were be-
lieved to have been caused by phase separation between the hydrophobic regions
of the lipid bilayers and the water.59 Although not directly observed, the authors
proposed that the pools were interconnected. Such a scheme could result in a
continuous network of aqueous pathways for diffusion of ionic substances.
2.4.5 Domain Mosaic Model
A complete framework establishing the link between the morphological struc-
ture and chemical composition of stratum corneum lipids and the correspond-
ing physiological function is not yet complete. The Domain Mosaic Model devel-
oped by Forslind incorporates the physicochemical properties of stratum corneum
lipids with many of the observed anatomical features and physiological func-
tions of the skin.24 This model is an extension of the brick-and-mortar network
model proposed by Michaels et al.45 An inherent assumption of the brick-and-
mortar model was that transport of molecules occurred through the lipid matrix
and around the corneocytes. The corneocytes were assumed to be impermeable;
however, absorption of compounds along the outside surface of the cells was con-
sidered.
The Domain Mosaic model was developed where the interactions between dif-
fusing compounds and stratum corneum lipids were emphasized. The Domain
Mosaic model considered the absorption of water into the corneocytes. For exam-
ple, it was argued that the corneocytes require a small flux of water to prevent cell
embrittlement. The model included a mechanism for diffusion of water through
24
the lipid bilayers. The proposed transport pathway was consistent with the com-
position and structure of the lipid matrix was incorporated into the model.
Forslind’s Domain Mosaic model is an adaptation of the Fluid Mosaic model of
phospholipid bilayers developed by Singer and Nicolson.117 Lipid polymorphism
was used extensively in both of these models to establish the relationship between
membrane structure and transport properties. Forslind applied thermodynamic
arguments to propose that stratum corneum lipids aggregate into crystalline sub-
domains. The composition of each sub-domain would in turn consist of lipids
with hydrocarbon tails of similar lengths. The high-energy grain boundaries at
the interface between the crystalline sub domains could provide routes of aqueous
transport across the lamellar lipids.
Once water diffused across a given bilayer it could then travel laterally in the
aqueous regions located between the polar head groups of the lamellar bilayers.
Transport would continue parallel to the surface of the skin direction until an-
other lipid-phase grain boundary was encountered. The alternating process of lat-
eral and transverse diffusion could provide for transport across the entire stratum
corneum. An implication of this model is that aqueous transport occurs along a
tortuous route. A tortuous pathway would require a longer diffusion path length
in comparison to transport directly through the stratum corneum.
The relatively low observed transport rates of water across the skin is consis-
tent with extended diffusion pathway.75, 81, 114 For example, diffusion coefficients
obtained from experiments with fully hydrated skin were 20-30% of their corre-
sponding free solution values.59, 118 The lateral diffusion of water along the polar
regions has been shown to be relatively fast.119 Therefore, the rate limiting step in
the overall transport process will likely be movement from one bilayer to another.
25
Although the Domain Mosaic model is fairly successful in relating the complex
structure of stratum corneum lipids to the barrier properties of skin, unresolved
issues remain. For example, the model cannot be directly applied for prediction of
transport rates across the skin. It should be emphasized that the model was devel-
oped to account for the transport properties of the stratum corneum under normal
physiological conditions. It is likely that the bilayers will be significantly disturbed
by the presence of an electric field during iontophoresis. A variety of predictive
models have been developed to account for the influence of the electric field on
the transport of species through the skin.120−124 Most of the predictive models are
based on macroscopic transport theory and do not account for the range of interac-
tions considered in the Domain Mosaic model. Additional discussion of predictive
transdermal transport models is provided in Chapter 3.
2.5 Intercellular Appendages
Interspersed throughout the skin is a variety of appendageal structures which
provide passageways for water and metabolites from the dermis to the surface
of the skin.10, 125 The three types of appendages in human skin are hair follicles,
sebaceous glands and sweat glands. The structure of these dermal appendages is
illustrated in Figure 2-6.
Appendages account for only 0.1% to 1% of the total surface area of skin.6, 126
Although appendages make up such a small fraction of the overall skin surface,
these macroscopic structures may serve as potential routes of transport for trans-
dermal drug delivery. The proposal is based on the observation that appendages
bypass the diffusion barrier of the stratum corneum and provide direct access to
the dermis.4 A brief discussion of the anatomical structure and physiological activ-
ity of these appendages is provided here. The objective was to describe the types

26
Figure 2-6: Structure of skin appendages that penetrate the stratum corneum. Fig-ure reproduced from Orkin.5
of interactions that diffusing molecules might encounter as they pass through the
appendages.
2.5.1 Hair Follicles
Hair follicles are composed of closely packed, proteinaceous cells assembled
into a long, fibrous cylindrical shaft. Hair proteins are predominantly arranged
in filaments that are cross-linked by sulfur bonds.6 Similar to the proteins in the
corneocytes, hair proteins are also made of keratin. In the lower regions of the
skin the hair follicle is completely surrounded by cells. The cells help to anchor
the follicle in the skin and promote growth of the shaft. In the upper regions of the
dermis the hair follicle is located in the annular space of the follicular canal. The
density of hair follicles varies throughout the body. A follicular density of 300-
500/cm2 is found on the scalp. The scalp has the highest density of follicles which

27
is in stark contrast to the soles of the feet where these structures are essentially
absent.4
Associated with hair follicles are sebaceous glands. Sebaceous glands are pouch
shaped structures that are connected via ducts to the hair follicle canals. Similar
to hair follicles, the density of sebaceous glands also varies over the surface of
the body. The highest density of sebaceous glands is found on the forehead and
upper regions of the body. This maximum glandular density corresponds to 400
to 900 glands/cm2. The remainder of the body has approximately 100 sebaceous
glands/cm2.19
Sebaceous glands excrete an amorphous mixture of lipids, known as sebum.
Sebum is released into the hair follicle canals and deposited on the surface of the
skin. The types of lipids present in sebum are primarily composed of triglycerides,
wax esters and small amounts of cholesterol esters.127 The triglycerides are par-
tially hydrolyzed which maintains the acidic pH (∼ 5) of sebum.7, 128 The acidic
nature of sebum helps to provide skin with its antimicrobial character.35, 129 The
thickness and content of sebum present on the surface of the skin varies greatly
with anatomical location.127 The high lipid content of sebum will likely prevent
the passage of drug salts through the hair follicles.
2.5.2 Sweat Glands
Sweat glands form the majority of appendages present on the surface of the
body. Sweat glands are classified as being either apocrine sweat glands or ec-
crine sweat glands. Apocrine sweat glands are predominantly found in the geni-
tal and underarm regions and therefore will not likely be subjected to iontophor-
esis. Eccrine glands comprise approximately 80% of the total sweat glands. They
are distributed over the entire body with an average density of approximately
400 glands/cm2.4

28
The main function of eccrine sweat glands is to facilitate thermoregulation via
sweating. The structure of sweat glands consists of coiled tubular bundles located
in the dermis which are attached to cylindrical ducts with openings on top of the
stratum corneum (see, for example, Figure 2-6). The secretions from sweat glands
are 99% water and have a pH of approximately 5 under rest conditions and 7 under
maximum sweating.130 The efflux of the aqueous secretions from the sweat glands
may prevent the influx of material from the surface of the skin into the body. It
could also be argued that the aqueous nature of the secretions might be favorable
for the transport of ionic compounds.
2.6 Influence of Electric Fields on Skin Properties
The material presented in Sections 2-2.5 described the properties of skin un-
der homeostatic conditions. During iontophoresis the application of current will
induce a nonequilibrium electric field in the skin. Although an imposed current
can increase the transdermal flux of charged compounds, skin properties may be
altered during the process. The object of this section was to describe the behavior
of skin during iontophoresis.
2.6.1 Electrical Properties of the Stratum Corneum
The electrical properties of the stratum corneum are directly linked to the chem-
ical composition and structural arrangement of the membrane’s constituent molecules.
It is generally accepted that the stratum corneum possesses a net negative back-
ground charge.114, 120, 131−135 The negative background charge favors the transport
of cations over anions through the skin. The transport of anions is restricted in
order to maintain electroneutrality within the membrane. Transference number
experiments with monovalent cations of chloride salts provided the first evidence
for this conclusion.131, 133

29
Although the negative background charge of skin is generally accepted in the
literature, the exact source of the charge is still unclear. For example, it has been
proposed that the protein residues in the corneocytes provide the negative back-
ground charge.120, 131 This would require an excess of amino acid residues with
negative charges (such as carboxylic acid groups) as opposed to positive moieties
such as amine groups.131 It has also been proposed that a small fraction of the
negative charge resides with the polar head groups of the lipid bilayers.114 The
overall charge is probably concentrated in the interior of the corneocytes with a
minor component distributed throughout the lamellar lipid matrix.
Electroosmotic flow of water through skin lipids. In addition to supporting
the preferential transport of cations, the negative background charge of skin can
also facilitate the bulk flow of water during iontophoresis. The mechanism for the
solvent transport is based on the assumption that the negative charge is localized
along the surface of approximately cylindrical pores. The negative charge along
the pore walls will introduce a diffuse region of positive charge in the adjacent
electrolyte solution to maintain system electroneutrality.
The thickness of the diffuse region of charge is inversely related to ionic strength
of the electrolyte and the charge density on the surface of the pore walls. When
a voltage difference is applied across the skin during iontophoresis an electrical
body force will be exerted on the thin layer of positively charged fluid. The elec-
tric force on the positively charged electrolyte will cause bulk fluid flow through
the system. This type of electrically induced flow is referred to as electroosmosis
which is a subset of the more general class of behavior known as electrokinetic
phenomena.136, 137
The mechanism for the flow of bulk water through skin was first proposed
by Grimnes.138 Evidence for electroosmosis during transdermal iontophoresis

30
was provided by experiments where neutral species were delivered through the
skin.121, 131, 135, 139−146 Sophisticated mathematical models have been developed to
account for electroosmotic flow through skin. The models are described in more
detail in Section 3.2.
Macroscopic electrical properties of the stratum corneum. Skin has an iso-
electric point at pH values between 3 and 4.23, 112, 147 This implies that skin will be
negatively charged when the pH of the surrounding solution is above this value
and positively charged at more acidic pH. The isoelectric point must be consid-
ered when compiling drug formulations. Improper selection of solution pH could
lead to neutralization of the background charge which would produce a reversal
of the cation selectivity of the membrane. As a result, the iontophoretic delivery
of the target molecule would become more difficult.148
Excised stratum corneum exhibits characteristically high polarization resist-
ance values which are generally on the order of 100 kΩ/cm2.1, 111 The electrical
resistance of whole skin, as measured in vivo, is generally one to two orders of
magnitude higher.1, 149 The cause for the difference in the in vitro and in vivo val-
ues of skin resistance remains unresolved. However, it is likely that the proce-
dure used to extract the stratum corneum from the underlying layers of the skin is
largely responsible for the lower electrical resistance of excised epidermal tissue.
The relatively high percentage of lipids and low percentage of water in the stra-
tum corneum is responsible for the high electrical resistance of the membrane. Ex-
periments have shown that the electrical resistance is inversely proportional to the
water content of the stratum corneum.112, 150, 151 Another interesting feature of skin
is that the impedance can vary dramatically depending on anatomical location.16, 44
The in vivo impedance values from adjacent skin sites in the same anatomical re-
gion have been shown to differ by several orders of magnitude.152

31
Skin also exhibits a nonlinear response to large applied-current signals.2, 3, 153, 154
The nonlinear properties of skin correspond to decreased values of skin imped-
ance with increased values of current density. The range of applied-current den-
sities for the onset of nonlinear behavior lies between 0.1µA/cm2 and 75µA/cm2.
The potential difference across the membrane at these applied-current densities
falls between 0.1 V and 2 V.3 The alterations to the skin may or may not be re-
versible. The degree of reversibility depends on the skin hydration, the amplitude
of the imposed current and the duration of the applied current.153
The decrease in skin resistance to large electrical signals strongly suggests that
the internal structure of the stratum corneum has been modified. Such structural
modifications may introduce additional pathways for enhanced transport. A vari-
ety of mechanisms have been proposed for the formation of new pathways during
iontophoresis. For example, it has been proposed that electrical burns on the skin
are caused by localized regions of high current density.3 The high current den-
sity pathways would likely experience Joule heating. If the increase in thermal
energy was large enough, stratum corneum lipids could undergo phase transi-
tions to more fluid and permeable configurations.3 This hypothesis is supported
by the observation of increased skin permeability at temperatures above the glass
transition temperature of stratum corneum lipids.155
Influence of electrical field on skin lipids. The effect of electric fields on bi-
ological membranes is a well studied phenomenon. For example, the coupling
of concentration polarization and potential gradients across cell membranes can
produce short-duration current pulses. This type of mechanism is responsible for
the conduction of nerve impulses and the contraction of muscle fibers.156, 157 The
structures and mechanisms responsible for physiological and metabolic processes
are diverse. For example, electrochemically coupled transmembrane exchange of
32
calcium in cardiac muscles occurs in hydrophilic protein channels that span across
the lipid bilayers which enclose the muscle cells.156 In the stratum corneum, the
lamellar lipids lack these type of protein channels which helps to explain the low
permeability of skin.
Another mechanism responsible for exchange of species across membranes re-
quires an additional carrier molecule to complex with the physiologically active
compound. The carrier molecule serves as an escort through the membrane in
order to overcome the otherwise unfavorable interactions in the cellular lipid bi-
layers. This type of transport is responsible for the exchange of glucose across
erythrocyte membranes.73 The concept of carrier molecules was used to develop
liposomes for topical delivery of therapeutic compounds.158, 159
Typically for liposomal transport the ionic drug is encapsulated in the aqueous
inner core of micelles. The outer lipophilic region of the micelles provides for en-
ergetically favorable interactions between the liposomes and the lamellar bilayers
of the stratum corneum. The reduction of hydrophilic-hydrophobic interactions
between the ionic drug and the lipid bilayers provides for enhanced transport
rates.
A dramatic example of the therapeutic use of applied electric fields for ma-
nipulating biological bilayers is provided by electroporation. Electroporation con-
sists of the application of high-voltage pulses in short duration to reversibly open
pores in lipid bilayer systems. The technique was developed to introduce genetic
material across the lipid bilayers of cellular membranes.160−162 The electric fields
applied during transdermal iontophoresis might also be expected to cause the
formation of new channels for aqueous transport. However, the mechanism for
structural changes will likely be different in iontophoresis as the electric fields are
applied at much lower amplitudes for longer periods of time.
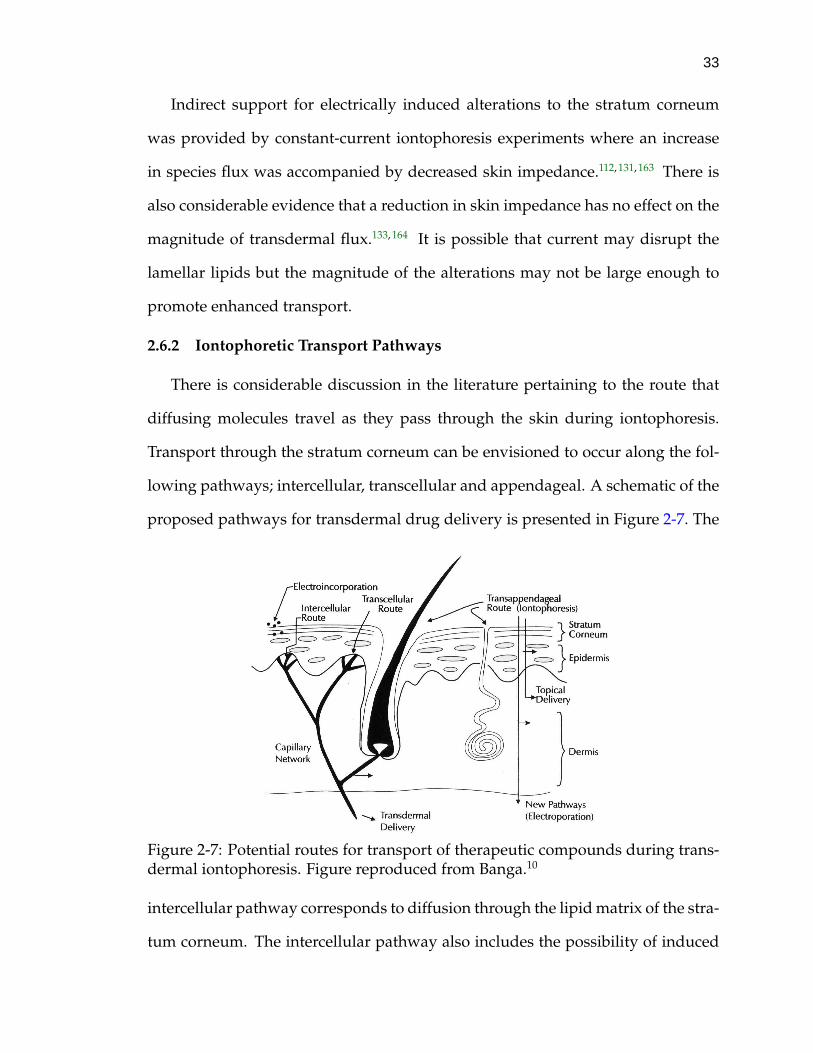
33
Indirect support for electrically induced alterations to the stratum corneum
was provided by constant-current iontophoresis experiments where an increase
in species flux was accompanied by decreased skin impedance.112, 131, 163 There is
also considerable evidence that a reduction in skin impedance has no effect on the
magnitude of transdermal flux.133, 164 It is possible that current may disrupt the
lamellar lipids but the magnitude of the alterations may not be large enough to
promote enhanced transport.
2.6.2 Iontophoretic Transport Pathways
There is considerable discussion in the literature pertaining to the route that
diffusing molecules travel as they pass through the skin during iontophoresis.
Transport through the stratum corneum can be envisioned to occur along the fol-
lowing pathways; intercellular, transcellular and appendageal. A schematic of the
proposed pathways for transdermal drug delivery is presented in Figure 2-7. The
Figure 2-7: Potential routes for transport of therapeutic compounds during trans-dermal iontophoresis. Figure reproduced from Banga.10
intercellular pathway corresponds to diffusion through the lipid matrix of the stra-
tum corneum. The intercellular pathway also includes the possibility of induced
34
pores or pathways caused by the alteration of the lipid bilayers during the passage
of current. The transcellular route refers to transport which alternates between the
lipid region and directly through the corneocytes. The appendageal pathway is
described by transport through the macroscopic shunts in the stratum corneum
such as hair follicle canals and sweat glands. Relatively little experimental evi-
dence is available for the transcellular route; however, there is significant exper-
imental support for both the intercellular54, 58, 62, 120, 165 and the appendageal path-
ways.28−31, 166−168 During transdermal iontophoresis, it is likely that both intercell-
ular and appendageal pathways contribute to the overall flux of molecules across
the skin.
The physicochemical properties of the diffusing species will strongly influence
the transport route during iontophoresis. For example, lipophilic compounds
will most likely travel through the intercellular lipid matrix whereas sterically
hindered, high molecular weight species might be expected to pass through the
appendageal shunt pathways. Target molecule properties for predicting the mag-
nitude and location of iontophoretic transport include charge, molecular weight,
molecular size, pKa and lipid-water partition coefficient.23, 81, 120, 139, 145, 169, 170
2.7 Summary of Skin Properties Affecting Iontophoretic Transport
In Sections 2.1-2.5 the structure and composition of human skin under normal
physiological conditions was described. A dominant of those sections was that the
physicochemical properties of skin are extremely complex. Although the anatomy
and physiology of skin is complicated, some important generalizations related to
percutaneous transport can be made. For example, the dominant barrier to trans-
dermal drug delivery is the top-most layer of the skin, the stratum corneum. The
thickness across the heterogeneous membrane is only 10 to 20 microns over most
35
of the body. The stratum corneum is comprised of disk shaped cells surrounded
by a lamellar lipid matrix.
The unique composition and relatively high percentage of lipids in the stra-
tum corneum is generally considered to provide a major contribution to the low
permeability characteristics of the membrane. Although the cells of the stratum
corneum, the corneocytes, are not capable of mitotic division there is considerable,
physiological and enzymatic activity in this region.55 Important characteristics of
the stratum corneum include a low permeability to hydrophilic compounds and a
relatively low percentage of water.
Section 2.6 describes the electrical properties of the stratum corneum. Major
features of the stratum corneum under homeostatic conditions include a negative
background charge and a high electrical resistance. Another important character-
istic of stratum corneum is that the electrical resistance drops dramatically when
the applied voltage is greater than the 0.1 to 2 V. It is imperative that these prop-
erties be considered for the development of transdermal drug delivery modalities
such as iontophoresis. Although a comprehensive description of the interactions
and mechanisms involved in iontophoresis remains unresolved, it is clear that an
imposed electric field can enhance transdermal delivery rates of both ionic120, 142, 171−179
and uncharged121, 131, 135, 139−146, 178 compounds.

CHAPTER 3MODELS FOR TRANSDERMAL IONTOPHORESIS
A variety of mathematical models have been developed to provide insight into
the important factors affecting transdermal iontophoresis. These models have
been used for the prediction of transdermal drug delivery rates for given values
of applied current and as a tool for the identification of the mechanisms involved
in the transport process. The approaches used to formulate these models are di-
verse, however most are based on continuum, hindered transport, nonequilibrium
thermodynamic, or kinetic rate concepts.
The final sections of this chapter (see, for example, Sections 3.6.1 - 3.6.3) pro-
vide a discussion of ideal electric circuit models developed for the prediction of
the impedance response of skin. Electrochemical Impedance Spectroscopy (EIS)
is commonly used to study skin transport properties during iontophoresis. The
formulation of the overall circuit network involves the semi-empirical addition
of circuit elements until the model provides an accurate description of the skin
impedance response. Upon the establishment of an appropriate network, a deduc-
tive process is then used to relate the properties of the skin to the individual circuit
elements that comprise the overall network. A summary of the assumptions and
limitations associated with each of the modeling frameworks is provided.
3.1 Nernst-Planck Continuum Models
One of the most common approaches for modeling transdermal iontophoresis
is based on the Nernst-Planck definition of species flux through homogeneous
media. Dilute-solution theory is also applied in these derivations. Several au-
36

37
thors have implemented the Nernst-Planck formalism to develop predictive ex-
pressions of species flux in steady-state122, 132, 140, 144, 145, 180−182 and time varying sys-
tems.27, 121, 140, 183, 184
The overall flux is driven by the electrochemical potential gradient and by the
net flow of the bulk solution. The flux resulting from the electrochemical potential
gradient is typically decoupled into an electromigration term that accounts for the
force of the electric field on charged molecules and a diffusion term corresponding
to activity or concentration gradient driven flow. The Nernst-Planck flux, that
account for these driving forces, is presented by
Ni = −DiziFRT
ci∇Φ− Di∇ci + vci (3-1)
where Ni is the flux density, Di is the diffusion coefficient, zi is the charge number
of the species i, F is Faraday’s constant, R is the universal gas constant, T corre-
sponds to the absolute temperature, ci is the concentration of species i, ∇Φ is elec-
trostatic potential gradient and v is the net velocity of the solution. The terms on
the right hand side of Equation (3-1) correspond to the contributions to the over-
all flux from electromigration, diffusion and convection, respectively. Transport
throughout the entire system domain is generally characterized by integrating the
flux equations with appropriate boundary conditions. The approach leads to ex-
pressions for potential and concentration profiles within the membrane.
The nonlinear electromigration term in the flux expression makes direct analy-
sis intractable except for in a few restricted cases. As a result, simplifying assump-
tions are usually invoked to obtain an analytical solution to the flux equation. For
most of the models available in the literature it is assumed that the electric field
through the skin is constant or that the system is everywhere electrically neutral.
The constant field assumption removes the nonlinearity in the electromigration
term. The simplification allows for direct solution for the species flux under the

38
additional assumption of a time invariant system.180 An alternative approach is
to relax the constant field condition and assume the system is electrically neutral
everywhere. In the restricted case where the electrolyte solution is composed of a
single binary 1:1 salt, such as NaCl, application of the electroneutrality assumption
will also lead to a system of equations that is amenable to analytical solution.
In clinical iontophoretic delivery systems, drug formulations are usually be
composed of drug salts, buffers and supporting electrolytes. The electroneutral-
ity condition is insufficient to provide for direct solution of the flux expressions
corresponding to these more complex mixtures. Numerical methods must be im-
plemented to obtain transdermal profiles of species flux, concentration and poten-
tial from mathematical models based on the Nernst-Planck definition of flux. A
goal of the work presented here was to investigate the effect of solution compo-
sition on the drug delivery rate and the concentration, pH and potential profiles.
In accordance with this objective, iterative numerical techniques were applied in
the development of the model for transdermal iontophoresis. The details of the
approach are described in Chapter 10.
3.2 Hindered Transport Models
As demonstrated in Chapter 1, skin cannot be described as being a homoge-
neous membrane. In order to account for the complex structure of the skin many
authors have utilized hindered transport theory to develop mathematical models
for transdermal iontophoresis.120−124 Hindered transport theory is an extension
of the Nernst-Planck description of flux where the effects of constrained flow ge-
ometries and electrostatic interactions on the fluid are considered. An inherent
assumption made in the development of models for transdermal iontophoresis
based on hindered transport theory is that transport occurs through aqueous pores
in the stratum corneum. The hypothesized pores could be considered to be inte-
39
gral structures of the skin or temporary channels induced upon the application of
current during iontophoresis.
The hindered transport or pore restriction model framework was originally
developed to characterize flow through long, narrow passages such as capillar-
ies and straight channeled porous membranes.185−189 The diffusing particles are
assumed to be of the same dimensions as the flow channels. Under these condi-
tions, interparticle interactions and particle-wall interactions constitute a signifi-
cant fraction of the overall resistance to flow through the membrane. The same
types of interactions are also present in larger channels; however, in this situation,
the relative influence on the hydrodynamic flow profile can usually be neglected.
The approach has provided for successful prediction of species flux through cap-
illary systems. In contrast, direct application of the standard Nernst-Planck flux
expressions to similar constrained networks overpredicts transport rates as com-
pared to experiment.
The general form for species flux based on hindered transport theory is di-
rectly analogous to the standard Nernst-Planck expression. However, the correc-
tion terms, H and W are introduced to account for the additional transport resist-
ance through narrow channels. The flux expression for hindered transport theory
is presented by
Ni = ε
[−HDi
(ziFci
RTdΦdx
+dci
dx
)±Wvxci
](3-2)
where the void fraction of the membrane is lumped together with the tortuosity
factor in the parameter ε. H represents the hindrance factor for diffusion and
migration and W represents the hindrance factor for convection. On a molecular
scale, the term, H , accounts for steric and long-range electrostatic interactions.
The term, W , accounts for the enhanced hydrodynamic drag on particles caused
by the presence of the pore wall.
40
Predicted values for the hindrance factors, H and W , are usually obtained from
correlations based on the ratio of the radii of the fluid particles to the radii of the
pore walls. In general, the correction factors H and W increase as the size of the
diffusing particles approaches the size of the pore openings. The standard expres-
sions for the hindrance factors, H and W , developed by Anderson and Quinn185
for spherical particles are given by
H(λ∗) = (1− λ∗)2(1− 2.144λ∗ + 2.089λ∗3 − 0.0948λ∗
5 (3-3)
W(λ∗) = (1− λ∗)2(2− (1− λ∗)2)(1− 23λ∗
2 − 0.163λ∗3) (3-4)
where the independent variable λ∗, is defined by
λ∗ =rparticle
rpore(3-5)
where rparticle is the particle radius and rpore is the pore radius.
3.3 Refined Hindered Transport Models: Solute Interactions with Pore Walls
An attractive feature of the hindered transport formalism is that the negative
background charge of skin can be considered. It is typically assumed that the
charge is located on the surface of cylindrical pores with large aspect ratios. The
negative charge on the pore wall causes a diffuse region of positive charge to de-
velop in the electrolyte solution adjacent to the pore surface. The function of the
positively charged region is to maintain system electroneutrality
The Debye screening length provides an estimate for thickness of the diffuse
charge region.136 The expression for calculating the Debye length is given by
λ =[
εRTF2 ∑ zi
2ci,bulk
](3-6)
where ε, R, T and F are the solution permittivity, which is also referred to as the
dielectric constant, universal gas constant, absolute temperature and Faraday’s
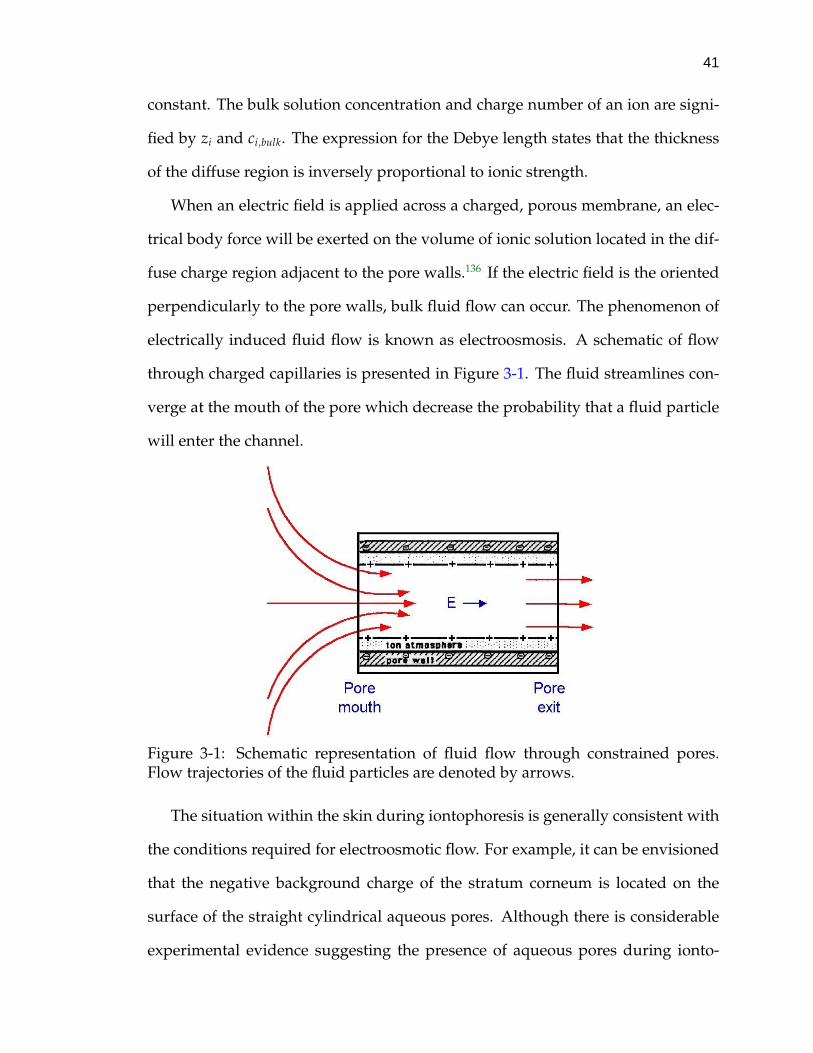
41
constant. The bulk solution concentration and charge number of an ion are signi-
fied by zi and ci,bulk. The expression for the Debye length states that the thickness
of the diffuse region is inversely proportional to ionic strength.
When an electric field is applied across a charged, porous membrane, an elec-
trical body force will be exerted on the volume of ionic solution located in the dif-
fuse charge region adjacent to the pore walls.136 If the electric field is the oriented
perpendicularly to the pore walls, bulk fluid flow can occur. The phenomenon of
electrically induced fluid flow is known as electroosmosis. A schematic of flow
through charged capillaries is presented in Figure 3-1. The fluid streamlines con-
verge at the mouth of the pore which decrease the probability that a fluid particle
will enter the channel.
Figure 3-1: Schematic representation of fluid flow through constrained pores.Flow trajectories of the fluid particles are denoted by arrows.
The situation within the skin during iontophoresis is generally consistent with
the conditions required for electroosmotic flow. For example, it can be envisioned
that the negative background charge of the stratum corneum is located on the
surface of the straight cylindrical aqueous pores. Although there is considerable
experimental evidence suggesting the presence of aqueous pores during ionto-

42
phoresis, the exact structure of these pores has not been completely character-
ized.30, 31, 54, 58, 62, 118, 122, 165 The assumption that transport occurs through straight
channeled pores seems unrealistic given the complex morphological structure of
skin. Even if transport does occur through cylindrical pores it is likely that there is
a distribution of pore sizes in skin. Despite these limitations the types of molecular
interactions considered in hindered transport theory can explain the observation
of electroosmotic flow during iontophoresis.
Many authors have applied models of transdermal iontophoresis based on hin-
dered transport theory to estimate an equivalent pore size based on measured flux
values.120, 123 As part of the calculation process, the electric field through the skin
was considered to be uniform. Calculated values of the pore radii were in the
range of 8-30 A. The estimates for the pore sizes provided in the literature could
be used with the corresponding models to predict upper and lower bounds of
drug delivery rates for a given current.
The predicted dimensions of the cylindrical pathways are much smaller than
those associated with the appendageal pathways. This could imply that trans-
port is occurring intercellularly or that the effective pore sizes present in the ap-
pendages are smaller than their structural dimensions. Models based on hindered
transport theory have provided insight into potential routes of transport through
the skin during iontophoresis. Although application of the hindered transport
models suggest mechanisms that affect transdermal iontophoresis, the approach
cannot be applied directly to estimate species fluxes.
Roberts et al. developed a refined model of transdermal iontophoresis based
on the hindered transport formalism where the effects of partially ionized solutes
and irregularly shaped particles were considered.124 The model also accounted
for electrostatic interactions between the solution ions and a charged pore wall.
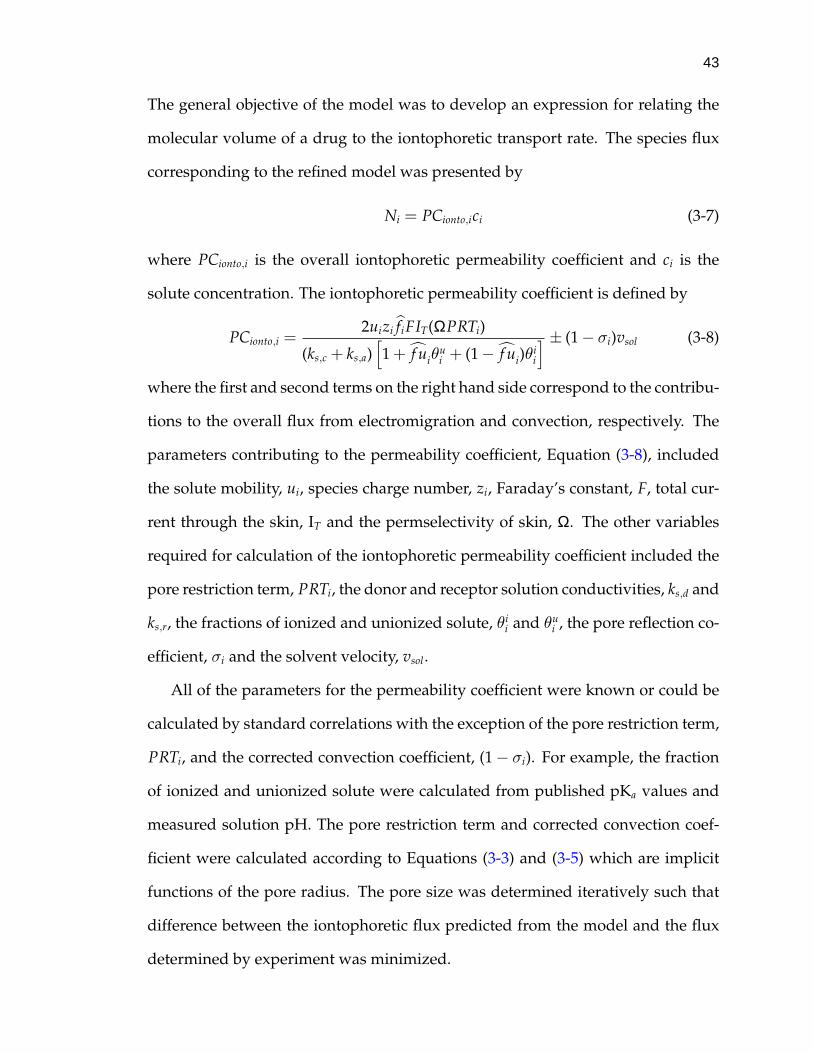
43
The general objective of the model was to develop an expression for relating the
molecular volume of a drug to the iontophoretic transport rate. The species flux
corresponding to the refined model was presented by
Ni = PCionto,ici (3-7)
where PCionto,i is the overall iontophoretic permeability coefficient and ci is the
solute concentration. The iontophoretic permeability coefficient is defined by
PCionto,i =2uizi fiFIT(ΩPRTi)
(ks,c + ks,a)[1 + f uiθ
ui + (1− f ui)θ
ii
] ± (1− σi)vsol (3-8)
where the first and second terms on the right hand side correspond to the contribu-
tions to the overall flux from electromigration and convection, respectively. The
parameters contributing to the permeability coefficient, Equation (3-8), included
the solute mobility, ui, species charge number, zi, Faraday’s constant, F, total cur-
rent through the skin, IT and the permselectivity of skin, Ω. The other variables
required for calculation of the iontophoretic permeability coefficient included the
pore restriction term, PRTi, the donor and receptor solution conductivities, ks,d and
ks,r, the fractions of ionized and unionized solute, θii and θu
i , the pore reflection co-
efficient, σi and the solvent velocity, vsol.
All of the parameters for the permeability coefficient were known or could be
calculated by standard correlations with the exception of the pore restriction term,
PRTi, and the corrected convection coefficient, (1− σi). For example, the fraction
of ionized and unionized solute were calculated from published pKa values and
measured solution pH. The pore restriction term and corrected convection coef-
ficient were calculated according to Equations (3-3) and (3-5) which are implicit
functions of the pore radius. The pore size was determined iteratively such that
difference between the iontophoretic flux predicted from the model and the flux
determined by experiment was minimized.
44
A limitation of the refined hindered transport model is that a priori estima-
tion of iontophoretic drug fluxes is not possible. This is because the relationship
between pore size and drug physicochemical properties of the drug must deter-
mined experimentally. Bulk solution values of physicochemical properties, such
as solute mobility and pH, were used for the regression of Equation (3-7) to the
flux data. It is likely that these parameters will be different in the constrained
environment of the narrow pore. Although these types of errors will lead to inac-
curate estimates of pore sizes, the model accounts for the interactions which are
expected to be important for transdermal iontophoresis.
3.4 Nonequilibrium Thermodynamic Models
Numerous mathematical models based on nonequilibrium thermodynamics
have been developed for molecular transport across biological membranes.156, 190
Models of transdermal iontophoresis based on nonequilibrium thermodynamics
are attractive because skin subjected to constant current will not be under equilib-
rium conditions. Although many models for the exchange of metabolic species
across cellular membranes have been developed from nonequilibrium thermo-
dynamics only a limited number of attempts have been made to apply the in-
frastructure to transdermal iontophoresis.172, 175, 191−193The goal here is to provide
a summary of the application of nonequilibrium thermodynamics for biological
membrane transport. An outline of the governing equations and limitations of the
theoretical infrastructure is provided.
The application of nonequilibrium thermodynamics for modeling biological
membrane transport was pioneered by Kedem and Katchalsky.194−196 The objec-
tive of their work was to account for specific interactions between the membrane
and the electrolyte solution components. In this work, the solvent was consid-
ered as a diffusing species. Therefore, bulk fluid flow, which has been observed

45
in biological membrane transport, was considered explicitly.194 The treatment rep-
resented a point of departure from the classical Nernst-Planck formalism for dif-
fusion processes. The governing equations for membrane transport developed in
this work are still widely accepted by the biological community. The derivation of
the equations for membrane transport based on nonequilibrium thermodynamics
presented here loosely follows the explanation presented by Friedman.156
An underlying assumption of nonequilibrium thermodynamics, also known
as irreversible thermodynamics, is that the forces and fluxes of a given system
are directly related. This assumption also holds for equilibrium thermodynamics,
however, the approach for defining the flux equations is different. For example,
the electrochemical potential gradient is considered to be the driving force for the
flux in the Nernst-Planck formalism.
The forces and fluxes for nonequilibrium thermodynamics are constrained by
the dissipation function. The integrated form of the dissipation function anticipa-
tion function is defined according to
Φ = T∫ a
0
diSdt
dx (3-9)
where Φ is the integrated form of the dissipation function, di Sdt corresponds to the
rate of entropy generation per unit volume of the membrane and the absolute
temperature, T, is placed outside the integral because biological systems are es-
sentially isothermal. The integrated form of the dissipation function is usually
applied for membrane transport because it is difficult to assess the local forces
within the interior of the membrane.
The fluxes are related to the dissipation function according to
Φ = ∑i
JiXi (3-10)

46
where the Ji’s are the fluxes and the Xi’s are the driving forces for the fluxes. Equa-
tion (3-10) states that the fluxes contribute to the entropy of the system at a rate
that is proportional to the driving force. The general form of species flux for irre-
versible thermodynamics, subject to the constraint defined by Equation (3-10), is
described by
Ji = ∑i
Li jXi (3-11)
where the only new variable, Li j, is the phenomenological coefficient. The phe-
nomenological coefficients are proportionality constants that represent the contri-
bution to the species fluxes from a given force. The subscript j, is included to
account for the interaction of species i, with all other components in the solution.
The approach accounts for interactions between the solvent and the various solute
molecules. Interactions with molecules of the same type are also considered (i.e.
when i = j).
Since explicit consideration of all of the possible interactions between the vari-
ous components in the system is provided by this framework, the number of phe-
nomenological coefficients increases dramatically as the number of species in a
given system increases. Upon inspection of Equation (3-11) the number of phe-
nomenological coefficients necessary to characterize the system should equal n2,
where n is the number of unique components in the system. However, the On-
sager reciprocal relation states that Li j = L ji, which reduces the number of unique
phenomenological coefficients to n2+n2 . For multicomponent solutions it is usually
assumed that the interactions between a given solute and the remaining solutes
do not affect the flux of the selected species. The assumption implies Li j = 0 for
i 6= j which reduces the number of independent coefficients to 2n-1.
A difficulty with this modeling approach is that the phenomenological con-
stants must be determined experimentally. Any modification to the solution com-
47
position requires additional experimentation to determine a new set of phenomeno-
logical coefficients. The manner in which the flux equations for irreversible ther-
modynamics are defined provides no information regarding the transport mecha-
nisms.156 Furthermore, the structure of the physical system cannot be assessed by
nonequilibrium thermodynamics. The approach instead yields expressions for re-
lating mass transport across membranes to measurable quantities such as solution
compositions. The large number of parameters required to characterize the sys-
tem coupled with lack of mechanistic insight of the transport process may explain
the limited application of irreversible thermodynamics for mathematical models
of transdermal iontophoresis.193, 197
3.5 Kinetic Rate Theory Based Models
The multilaminate structure of the stratum corneum has prompted the devel-
opment of mathematical models for transdermal drug delivery which assume
that the overall transport process is composed of a series of discrete transport
events.60, 154, 198 The approach has also been applied successfully to model trans-
port through cellular membranes.199 It is assumed that drug compounds must
overcome a series of potential energy barriers in order to pass through the skin.
The spatial distribution of the potential energy barriers is generally considered
to be located at the interfacial region between the various layers of the stratum
corneum. Formal relationships between the transport rate across each of the en-
ergy barriers and the local concentration is established by the application of kinetic
rate theory, also referred to as the theory of activated rate processes.60 The general
approach for modeling transdermal transport by this formalism is outlined here;
however, the methodology was not applied for interpreting the experiments pre-
sented in this report.

48
An expression for species flux can be developed by assuming that particles
move across a given energy barrier in both the forward and backward directions.
Generally a unique amount of energy is required for particle movement from each
side of the barrier. The probability for a transport event to occur is inversely pro-
portional to the energy required to overcome the barrier. In addition, the probabil-
ity for transport across an energy barrier is directly proportional to the local con-
centration of a species. The velocity of particles, or transport rate, over the barrier
is directly related to the probability associated with movement from the respective
direction. The expressions for the forward and backward velocities based on the
local concentration are
v fi, j = Ki, jci, j (3-12)
vbi, j = Ki, j+1ci, j+1 (3-13)
where v fi, j and vbi, j are the velocities of species i crossing barrier j in the forward
and backward direction, respectively. The forward and backward rate constants
are signified by Ki, j and Ki, j+1. The concentrations of species i to the left and right
of barrier j are indicated by ci, j and ci, j+1.
The net flux across a given energy barrier, defined in terms of the velocities
associated with each direction of transport, is
Ji, j = v fi, j − vbi, j = Ki, jci, j − Ki, j+1ci, j+1 (3-14)
where Ji, j is the flux of species i across barrier j and the remaining terms are de-
fined according to Equations (3-12) and (3-13). The rate constants Ki, j and Ki, j+1
are typically functions of energy barrier length, temperature, and electrical state
of the system. The general approach for calculating flux through a system is to in-
clude expressions of the form presented in Equation (3-14) for each energy barrier.
49
The expressions are used in combination with the mass conservation principle to
determined the overall flux.
An Arrhenius form can be assigned to the rate constants to reflect the depen-
dence on the state of the system. For example, the rate constants are commonly
presented by
Ki j = ki, je
(−∆Gi, j
RT
)(3-15)
where ki, j is the proportionality constant, ∆Gi, j is the Gibbs free energy and RT is
the system thermal energy. The exponential term corresponds to the activation
energy required to cross an energy barrier. It should be noted that proportionality
constant, ki, j, has an implicit dependence on the width of the energy barrier.
The Gibbs free energy term can be deconvoluted to include a driving force
based on the electrical potential and a term corresponding to the chemical poten-
tial. With this type of separation it is possible to examine the effect of electrical
potential on the transport rate of charged compounds.
A schematic representing the sequence of transport events which are assumed
to occur within the skin is shown in Figure 3-2. Transport through the skin is
envisioned as occurring from left to right. The skin surface is located at the left-
hand side of the figure and entrance into the circulatory system is assumed to
occur at the right hand side. The vertical dashed lines correspond to the locations
of the potential energy barriers.
An advantage of models for transdermal iontophoresis developed from the
activated rate formalism is that fluxes can be predicted in the absence of a di-
rect mechanism for the transport process. The difficulty lies in identifying cor-
rect values for each of the proportionality constants, ki, j. Furthermore, selection
of the number and spatial locations of the energy barriers present in the stratum
corneum is completely arbitrary. Most authors have assumed that there are 15-20
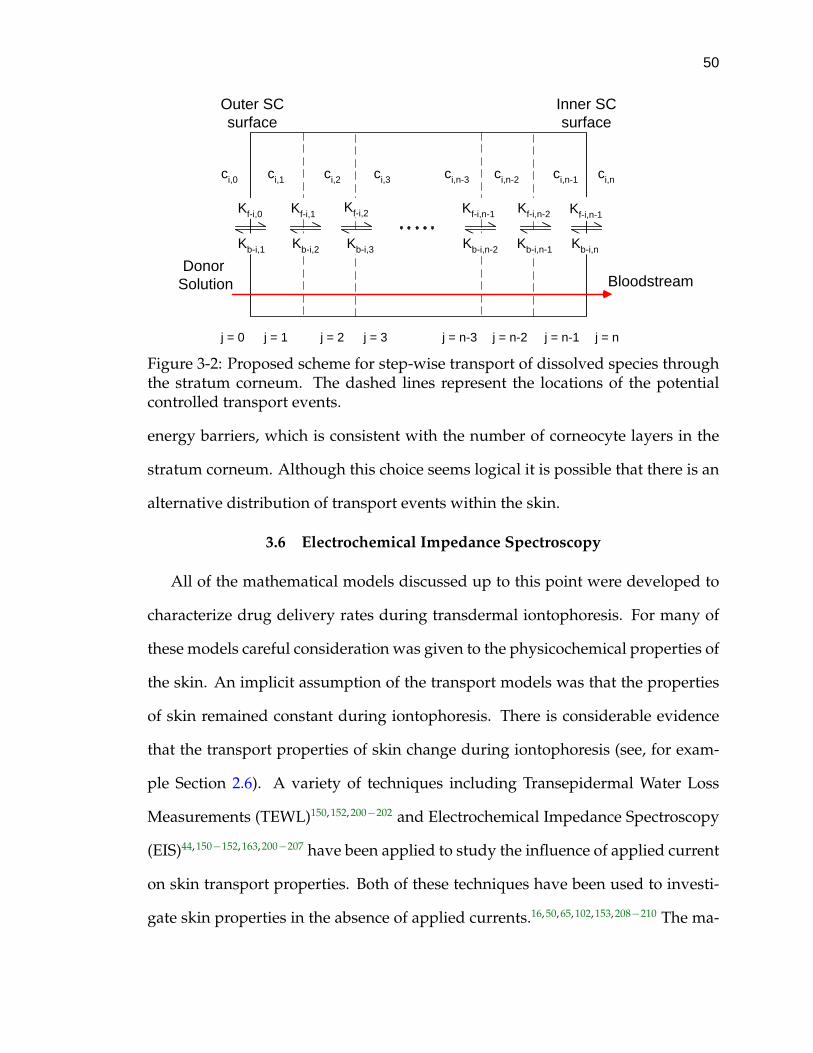
50
j = 0 j = 1 j = 2 j = nj = n-3 j = n-1
Outer SCsurface
Inner SCsurface
Donor Solution Bloodstream
ci,0 ci,1 ci,2
j = 3
ci,n-3ci,3 ci,n-2 ci,n-1 ci,n
j = n-2
Kf-i,2Kf-i,0 Kf-i,1 Kf-i,n-1Kf-i,n-1 Kf-i,n-2
Kb-i,3Kb-i,2Kb-i,1 Kb-i,nKb-i,n-1Kb-i,n-2
Figure 3-2: Proposed scheme for step-wise transport of dissolved species throughthe stratum corneum. The dashed lines represent the locations of the potentialcontrolled transport events.
energy barriers, which is consistent with the number of corneocyte layers in the
stratum corneum. Although this choice seems logical it is possible that there is an
alternative distribution of transport events within the skin.
3.6 Electrochemical Impedance Spectroscopy
All of the mathematical models discussed up to this point were developed to
characterize drug delivery rates during transdermal iontophoresis. For many of
these models careful consideration was given to the physicochemical properties of
the skin. An implicit assumption of the transport models was that the properties
of skin remained constant during iontophoresis. There is considerable evidence
that the transport properties of skin change during iontophoresis (see, for exam-
ple Section 2.6). A variety of techniques including Transepidermal Water Loss
Measurements (TEWL)150, 152, 200−202 and Electrochemical Impedance Spectroscopy
(EIS)44, 150−152, 163, 200−207 have been applied to study the influence of applied current
on skin transport properties. Both of these techniques have been used to investi-
gate skin properties in the absence of applied currents.16, 50, 65, 102, 153, 208−210 The ma-
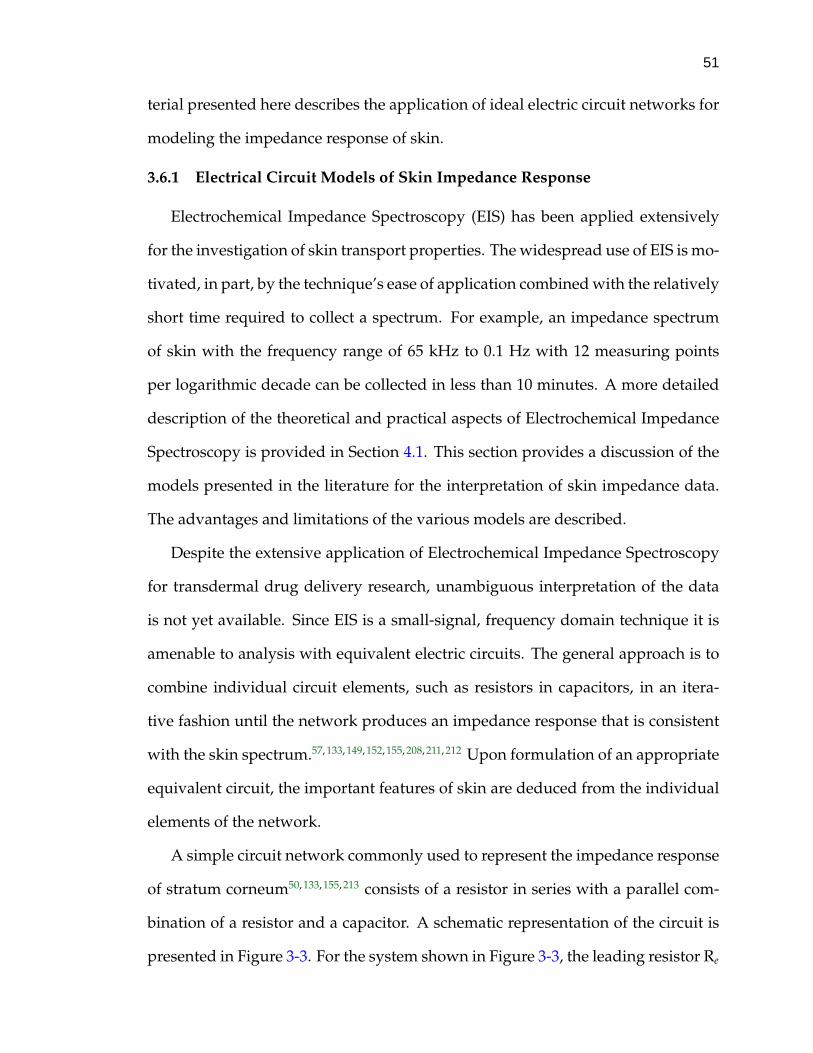
51
terial presented here describes the application of ideal electric circuit networks for
modeling the impedance response of skin.
3.6.1 Electrical Circuit Models of Skin Impedance Response
Electrochemical Impedance Spectroscopy (EIS) has been applied extensively
for the investigation of skin transport properties. The widespread use of EIS is mo-
tivated, in part, by the technique’s ease of application combined with the relatively
short time required to collect a spectrum. For example, an impedance spectrum
of skin with the frequency range of 65 kHz to 0.1 Hz with 12 measuring points
per logarithmic decade can be collected in less than 10 minutes. A more detailed
description of the theoretical and practical aspects of Electrochemical Impedance
Spectroscopy is provided in Section 4.1. This section provides a discussion of the
models presented in the literature for the interpretation of skin impedance data.
The advantages and limitations of the various models are described.
Despite the extensive application of Electrochemical Impedance Spectroscopy
for transdermal drug delivery research, unambiguous interpretation of the data
is not yet available. Since EIS is a small-signal, frequency domain technique it is
amenable to analysis with equivalent electric circuits. The general approach is to
combine individual circuit elements, such as resistors in capacitors, in an itera-
tive fashion until the network produces an impedance response that is consistent
with the skin spectrum.57, 133, 149, 152, 155, 208, 211, 212 Upon formulation of an appropriate
equivalent circuit, the important features of skin are deduced from the individual
elements of the network.
A simple circuit network commonly used to represent the impedance response
of stratum corneum50, 133, 155, 213 consists of a resistor in series with a parallel com-
bination of a resistor and a capacitor. A schematic representation of the circuit is
presented in Figure 3-3. For the system shown in Figure 3-3, the leading resistor Re
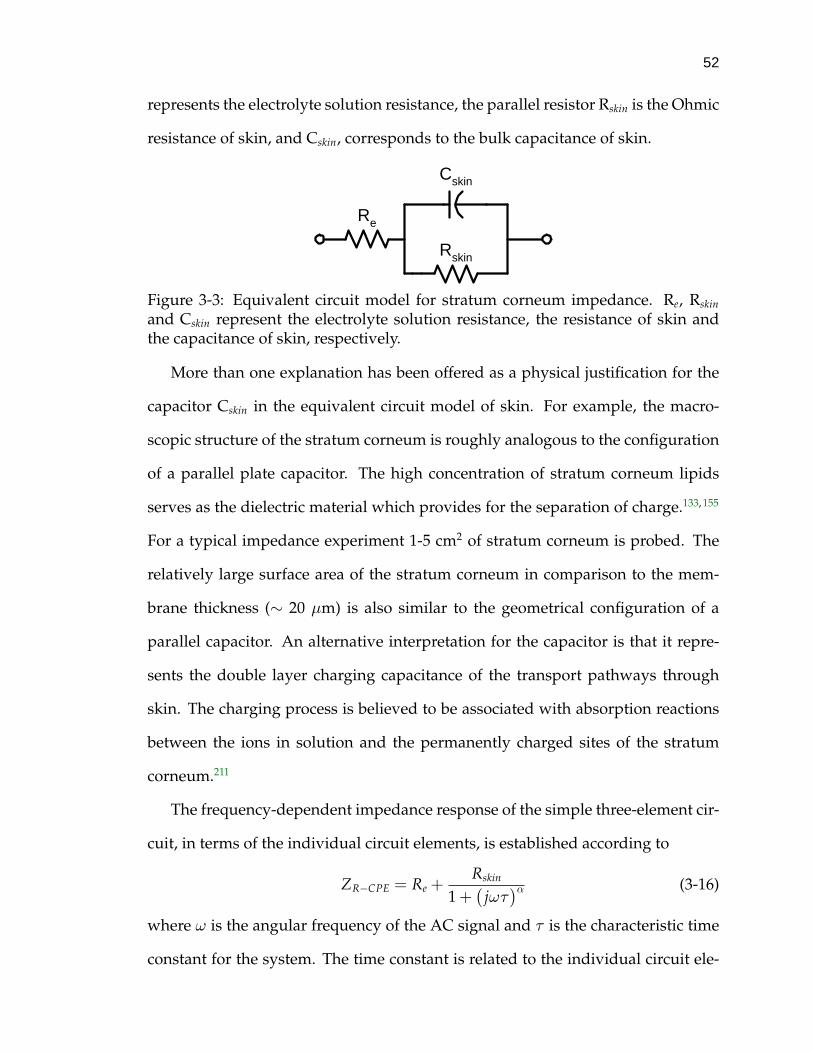
52
represents the electrolyte solution resistance, the parallel resistor Rskin is the Ohmic
resistance of skin, and Cskin, corresponds to the bulk capacitance of skin.
Cskin
Rskin
Re
Figure 3-3: Equivalent circuit model for stratum corneum impedance. Re, Rskin
and Cskin represent the electrolyte solution resistance, the resistance of skin andthe capacitance of skin, respectively.
More than one explanation has been offered as a physical justification for the
capacitor Cskin in the equivalent circuit model of skin. For example, the macro-
scopic structure of the stratum corneum is roughly analogous to the configuration
of a parallel plate capacitor. The high concentration of stratum corneum lipids
serves as the dielectric material which provides for the separation of charge.133, 155
For a typical impedance experiment 1-5 cm2 of stratum corneum is probed. The
relatively large surface area of the stratum corneum in comparison to the mem-
brane thickness (∼ 20 µm) is also similar to the geometrical configuration of a
parallel capacitor. An alternative interpretation for the capacitor is that it repre-
sents the double layer charging capacitance of the transport pathways through
skin. The charging process is believed to be associated with absorption reactions
between the ions in solution and the permanently charged sites of the stratum
corneum.211
The frequency-dependent impedance response of the simple three-element cir-
cuit, in terms of the individual circuit elements, is established according to
ZR−CPE = Re +Rskin
1 +(
jωτ)α (3-16)
where ω is the angular frequency of the AC signal and τ is the characteristic time
constant for the system. The time constant is related to the individual circuit ele-

53
ments according to τ = RskinCskin. The characteristic frequency, ωc, is equal to the
inverse of the time constant, τ . The exponent α, is equal to one for the simple
circuit shown in circuit shown in Figure 3-3. When α is between 0 and 1 the circuit
is referred to as a constant phase element. The significance of the constant phase
element discussed in more detail in Section 3.6.2. In general, parameter values for
the circuit elements are determined by regressing the model to skin impedance
data. Complex nonlinear least squares (CNLR) regression routines are usually
implemented with a computer to provide for rapid determination of the circuit
parameters.
A typical plot of skin impedance data presented in the impedance-plane is
shown in Figure 3-4. An impedance-plane plot displays the imaginary compo-
nent of the impedance, Z j, on the positive y-axis and the real part of the imped-
ance, Zr on the x-axis. This type of plot is sometimes referred to as a Nyquist
plot. The impedance response of the three-element circuit with the same charac-
teristic frequency and the same polarization impedance of skin, as determined by
experiment, is displayed as the top curve of Figure 3-4. Visual inspection of the
impedance-plane plot shows that the three-element circuit is insufficient to model
the skin impedance response.
3.6.2 Refined Circuit Models
In general, CNLR regression of the three-element circuit shown in Figure 3-3
to most skin impedance spectra will not provide statistically adequate fits. A typi-
cal impedance-plane plot of skin impedance data, as shown in Figure 3-4, exhibits
a depressed semicircle where the locus of the semicircle lies below the real axis.
This type of impedance response is characteristic of a system with a distribution
of relaxation processes. For example, impedance-plane plots of metallic electrodes
often exhibit a similar depression. It is generally accepted that morphological in-
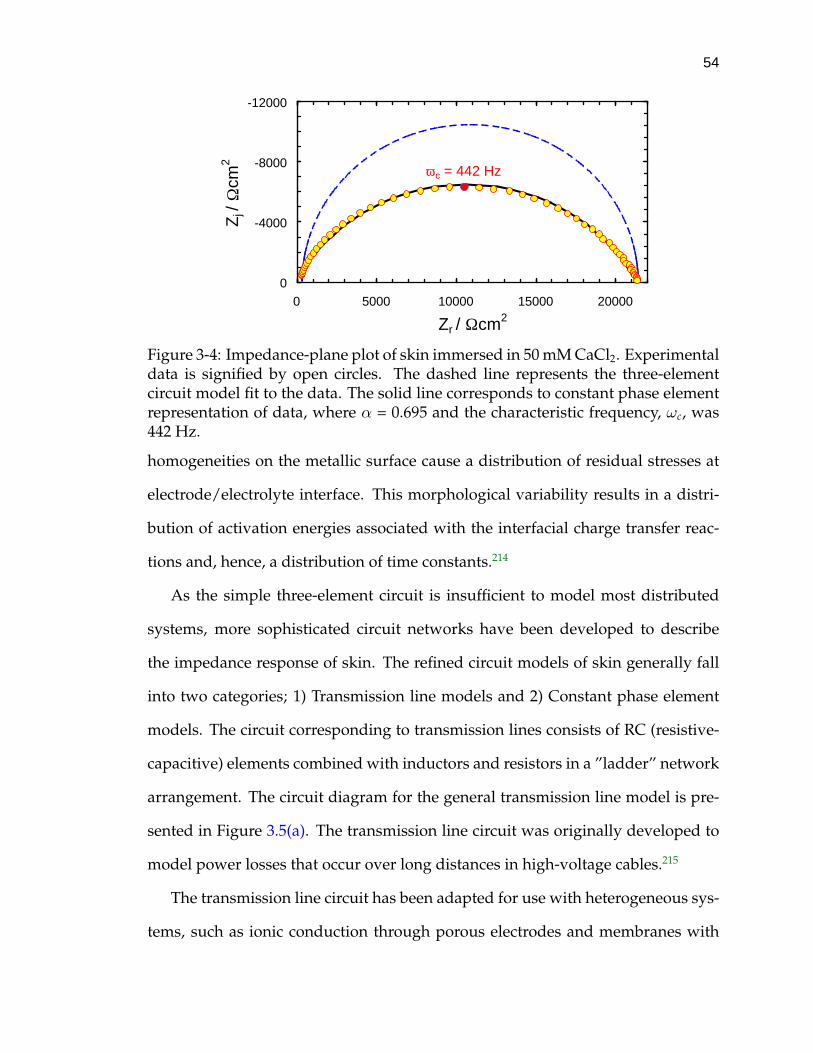
54
-12000
-8000
-4000
00 5000 10000 15000 20000
Zr / Ωcm2
Zj /
Ωcm
2
ωc = 442 Hz
Figure 3-4: Impedance-plane plot of skin immersed in 50 mM CaCl2. Experimentaldata is signified by open circles. The dashed line represents the three-elementcircuit model fit to the data. The solid line corresponds to constant phase elementrepresentation of data, where α = 0.695 and the characteristic frequency, ωc, was442 Hz.
homogeneities on the metallic surface cause a distribution of residual stresses at
electrode/electrolyte interface. This morphological variability results in a distri-
bution of activation energies associated with the interfacial charge transfer reac-
tions and, hence, a distribution of time constants.214
As the simple three-element circuit is insufficient to model most distributed
systems, more sophisticated circuit networks have been developed to describe
the impedance response of skin. The refined circuit models of skin generally fall
into two categories; 1) Transmission line models and 2) Constant phase element
models. The circuit corresponding to transmission lines consists of RC (resistive-
capacitive) elements combined with inductors and resistors in a ”ladder” network
arrangement. The circuit diagram for the general transmission line model is pre-
sented in Figure 3.5(a). The transmission line circuit was originally developed to
model power losses that occur over long distances in high-voltage cables.215
The transmission line circuit has been adapted for use with heterogeneous sys-
tems, such as ionic conduction through porous electrodes and membranes with
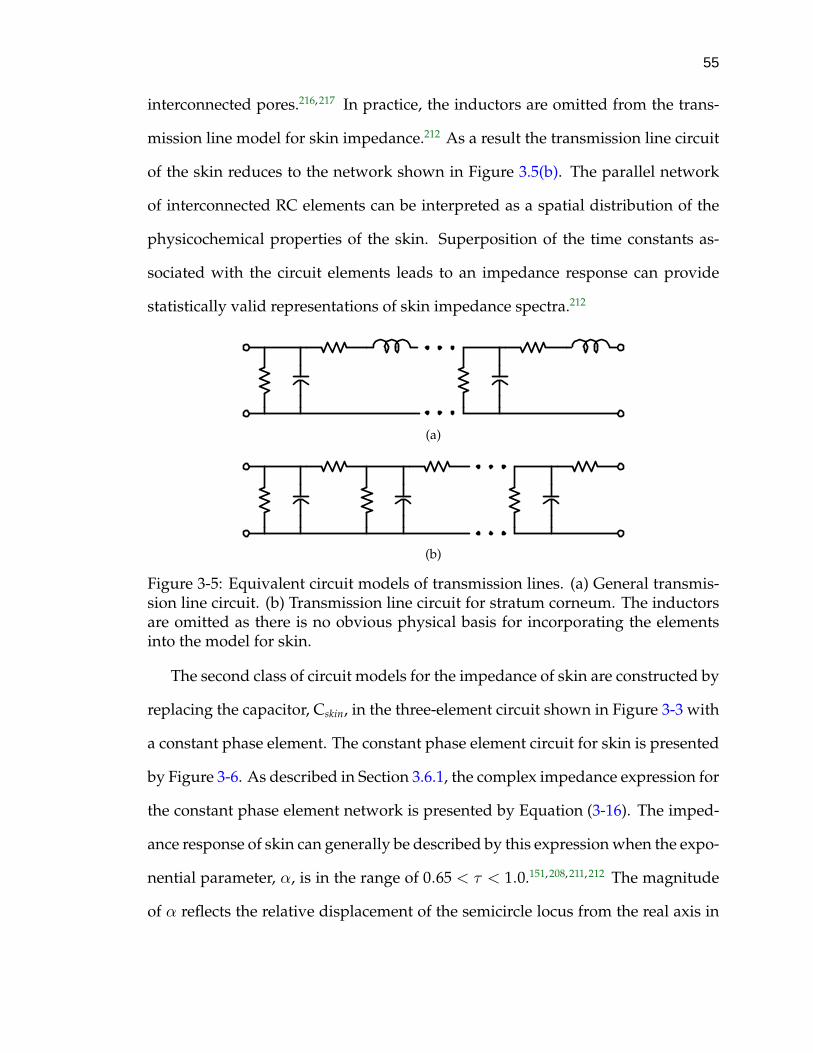
55
interconnected pores.216, 217 In practice, the inductors are omitted from the trans-
mission line model for skin impedance.212 As a result the transmission line circuit
of the skin reduces to the network shown in Figure 3.5(b). The parallel network
of interconnected RC elements can be interpreted as a spatial distribution of the
physicochemical properties of the skin. Superposition of the time constants as-
sociated with the circuit elements leads to an impedance response can provide
statistically valid representations of skin impedance spectra.212
(a)
(b)
Figure 3-5: Equivalent circuit models of transmission lines. (a) General transmis-sion line circuit. (b) Transmission line circuit for stratum corneum. The inductorsare omitted as there is no obvious physical basis for incorporating the elementsinto the model for skin.
The second class of circuit models for the impedance of skin are constructed by
replacing the capacitor, Cskin, in the three-element circuit shown in Figure 3-3 with
a constant phase element. The constant phase element circuit for skin is presented
by Figure 3-6. As described in Section 3.6.1, the complex impedance expression for
the constant phase element network is presented by Equation (3-16). The imped-
ance response of skin can generally be described by this expression when the expo-
nential parameter, α, is in the range of 0.65 < τ < 1.0.151, 208, 211, 212 The magnitude
of α reflects the relative displacement of the semicircle locus from the real axis in
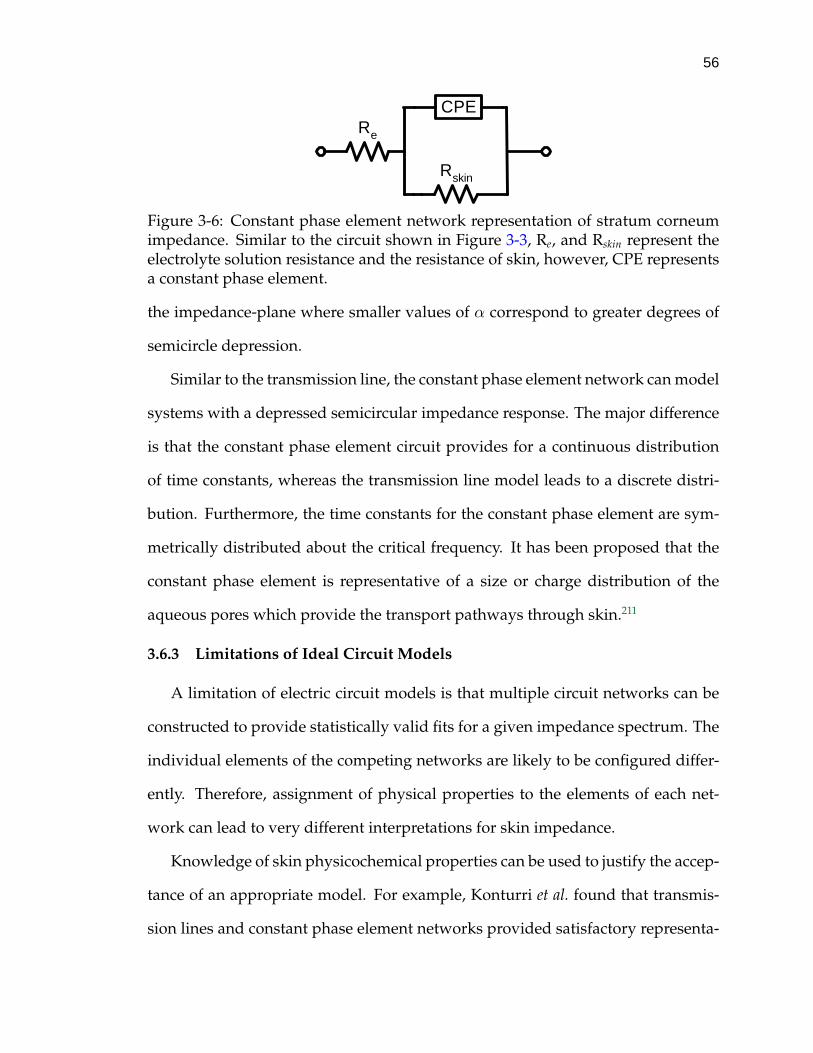
56
CPE
Rskin
Re
Figure 3-6: Constant phase element network representation of stratum corneumimpedance. Similar to the circuit shown in Figure 3-3, Re, and Rskin represent theelectrolyte solution resistance and the resistance of skin, however, CPE representsa constant phase element.
the impedance-plane where smaller values of α correspond to greater degrees of
semicircle depression.
Similar to the transmission line, the constant phase element network can model
systems with a depressed semicircular impedance response. The major difference
is that the constant phase element circuit provides for a continuous distribution
of time constants, whereas the transmission line model leads to a discrete distri-
bution. Furthermore, the time constants for the constant phase element are sym-
metrically distributed about the critical frequency. It has been proposed that the
constant phase element is representative of a size or charge distribution of the
aqueous pores which provide the transport pathways through skin.211
3.6.3 Limitations of Ideal Circuit Models
A limitation of electric circuit models is that multiple circuit networks can be
constructed to provide statistically valid fits for a given impedance spectrum. The
individual elements of the competing networks are likely to be configured differ-
ently. Therefore, assignment of physical properties to the elements of each net-
work can lead to very different interpretations for skin impedance.
Knowledge of skin physicochemical properties can be used to justify the accep-
tance of an appropriate model. For example, Konturri et al. found that transmis-
sion lines and constant phase element networks provided satisfactory representa-
57
tions of skin impedance.211, 212 The authors selected the constant phase network
as the better model because they could not find a physical justification for the
inclusion of the inductor.212 Although this type of deductive process seemed rea-
sonable, a better approach would be to apply complementary experimental and
modeling techniques to select the most appropriate circuit network. A methodol-
ogy for modeling skin impedance is described briefly at the end of this section.
A constraint of ideal circuit models is that the elements which compose the
overall circuit network, i.e., the resistors, the capacitors and the inductors, etc.,
are assumed to behave linearly with respect to potential.218 This implies that the
proportionality between the input and output signals for a given element is inde-
pendent of the potential across the element. For real systems, there is a limited
range of potential where the design equations for ideal circuits are applicable. For
skin, this range corresponds to 0.1-2 V,3 (for further discussion see Section 2.6).
It should be noted that the properties associated with a given circuit element,
such as resistance, capacitance and inductance are established without close re-
gard to the internal structure of the element. This ”lumped-sum” description of
ideal circuit element properties greatly limits the utility of circuit networks for
interpretation of the physical properties and the kinetic processes of the skin. A
more rigorous methodology for interpreting impedance data is to develop deter-
ministic models based on the governing equations which describe the physics and
chemistry of skin. The model can then be regressed to skin impedance spectra
to obtain parameter estimates for the physical properties of the system. This ap-
proach has been applied successfully for a limited number of systems such as the
electrodissolution of copper; however, the methodology has not yet been applied
to complex systems such as human skin. More detailed descriptions of the general
procedure are provided in the literature.219−223
58
3.7 Summary
The literature provides a wide array of mathematical models of transdermal
iontophoresis with varying degrees of sophistication. The models were developed
from the traditional Nernst-Planck equilibrium description of transport, the for-
malism for hindered transport through constrained geometries, nonequilibrium
thermodynamics and kinetic rate theory. The number of unique chemical species
included in the models reviewed here was usually limited to two or three ions.
Results from these models must be viewed cautiously because the body contains
a complex mixture of ionic compounds. Predictions of the concentration and po-
tential profiles within the skin cannot be obtained from these models with the
exception of the simplest models based on Nernst-Planck theory.
A common feature of most of these developments is that the electric field across
the skin is assumed to be uniform. Although this assumption greatly simplifies
the mathematical analysis of the governing equations, the physical basis for this
assumption is questionable due to the heterogeneous structure of the skin. De-
spite these limitations, the mathematical models discussed here have provided a
method to predict drug delivery rates for given applied potentials and external
electrolyte solution compositions.
In addition to the large number of models developed to predict transdermal
drug delivery rates, a variety of ideal circuit networks have been developed to
model the transport properties of skin. Electrochemical Impedance Spectroscopy
is a commonly used technique to study the transport properties of skin and the
circuit networks were developed to model the impedance response of skin. It is
important to point out that although the various circuit models described in this
review can adequately represent skin impedance data, the approach is severely
limited in that there is not necessarily a direct connection between the individ-

59
ual elements of the circuit network and the physicochemical properties of the
skin. Despite these limitations, the work reviewed here serves as a good starting
point for the development of clinical systems and/or more sophisticated models
of transdermal drug delivery.
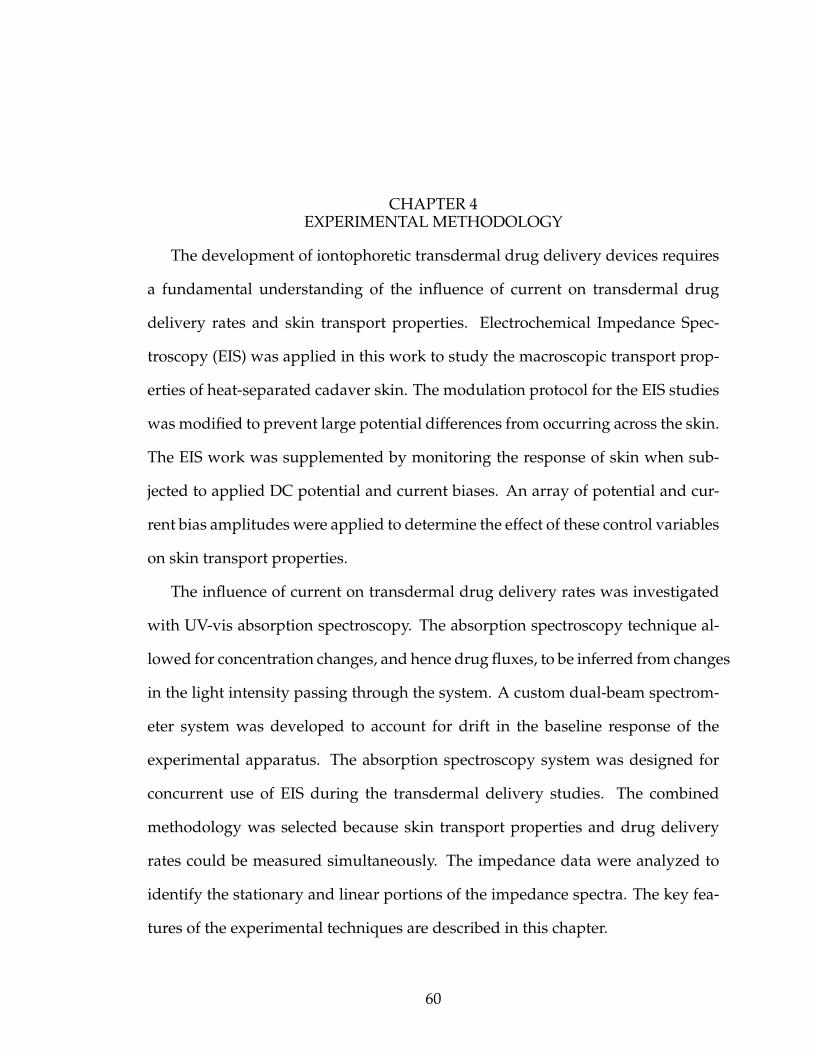
CHAPTER 4EXPERIMENTAL METHODOLOGY
The development of iontophoretic transdermal drug delivery devices requires
a fundamental understanding of the influence of current on transdermal drug
delivery rates and skin transport properties. Electrochemical Impedance Spec-
troscopy (EIS) was applied in this work to study the macroscopic transport prop-
erties of heat-separated cadaver skin. The modulation protocol for the EIS studies
was modified to prevent large potential differences from occurring across the skin.
The EIS work was supplemented by monitoring the response of skin when sub-
jected to applied DC potential and current biases. An array of potential and cur-
rent bias amplitudes were applied to determine the effect of these control variables
on skin transport properties.
The influence of current on transdermal drug delivery rates was investigated
with UV-vis absorption spectroscopy. The absorption spectroscopy technique al-
lowed for concentration changes, and hence drug fluxes, to be inferred from changes
in the light intensity passing through the system. A custom dual-beam spectrom-
eter system was developed to account for drift in the baseline response of the
experimental apparatus. The absorption spectroscopy system was designed for
concurrent use of EIS during the transdermal delivery studies. The combined
methodology was selected because skin transport properties and drug delivery
rates could be measured simultaneously. The impedance data were analyzed to
identify the stationary and linear portions of the impedance spectra. The key fea-
tures of the experimental techniques are described in this chapter.
60

61
4.1 Electrochemical Impedance Spectroscopy
Electrochemical Impedance Spectroscopy (EIS) has been applied for the inves-
tigation of a wide variety of electroactive systems including ceramic, polymeric
and biological membranes.222, 224−231 The negative background charge of skin makes
EIS an attractive methodology for studying skin because it can be applied eas-
ily and in a noninvasive manner. A brief overview of electrochemical impedance
spectroscopy is provided because the technique was used extensively in this work.
Detailed discussions of the technical and theoretical issues associated with electro-
chemical impedance spectroscopy are available elsewhere.219, 220, 232, 233
4.1.1 Principles of Electrochemical Impedance Spectroscopy
Electrochemical impedance spectroscopy is a small-signal technique where a
sinusoidal current or potential perturbation is imposed on the system of interest
and the corresponding potential or current response is measured. Comparison
of the input and output signals provides for the measurement of the impedance
at a given perturbation frequency. An appealing feature of EIS is that systems
with characteristic time constants distributed over a wide-range of time scales can
be studied. For example, transient phenomena, such as diffusion, double layer
charging and charge transfer reactions, typically occur over periods of 1-10−1 s,
10−2-10−3 s and 10−4 s, respectively.234 Investigation of the various processes is
accomplished in a typical experiment by incrementally adjusting the frequency of
the incident waveform over a wide range and measuring the impedance at each
frequency.
Electrochemical impedance spectroscopy has been applied extensively for
studying interfacial electrochemical reactions such as in the corrosion of metals.
The technique is also suitable for the investigation of solid-state and membrane
systems. A short discussion of electrochemical reactions is provided to introduce
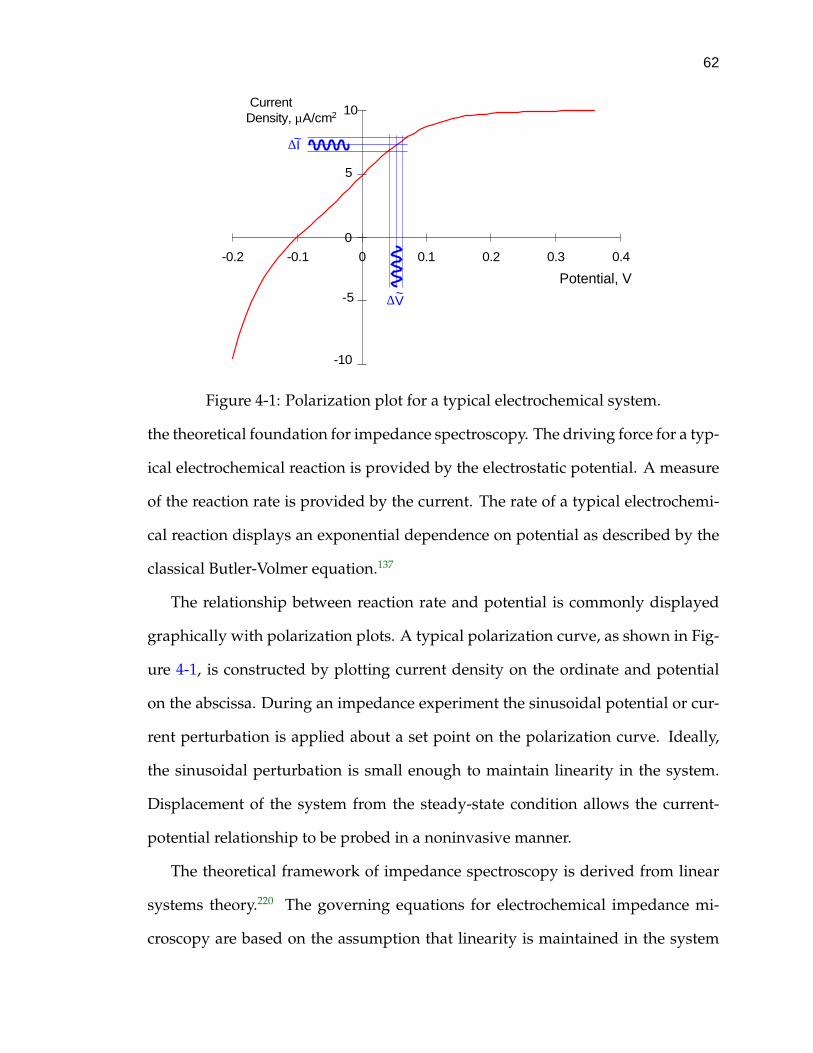
62
-10
-5
0
5
10
-0.2 -0.1 0 0.1 0.2 0.3 0.4
Potential, V
CurrentDensity, µA/cm2
~∆I
∆V~
Figure 4-1: Polarization plot for a typical electrochemical system.
the theoretical foundation for impedance spectroscopy. The driving force for a typ-
ical electrochemical reaction is provided by the electrostatic potential. A measure
of the reaction rate is provided by the current. The rate of a typical electrochemi-
cal reaction displays an exponential dependence on potential as described by the
classical Butler-Volmer equation.137
The relationship between reaction rate and potential is commonly displayed
graphically with polarization plots. A typical polarization curve, as shown in Fig-
ure 4-1, is constructed by plotting current density on the ordinate and potential
on the abscissa. During an impedance experiment the sinusoidal potential or cur-
rent perturbation is applied about a set point on the polarization curve. Ideally,
the sinusoidal perturbation is small enough to maintain linearity in the system.
Displacement of the system from the steady-state condition allows the current-
potential relationship to be probed in a noninvasive manner.
The theoretical framework of impedance spectroscopy is derived from linear
systems theory.220 The governing equations for electrochemical impedance mi-
croscopy are based on the assumption that linearity is maintained in the system

63
over the course of the experiment. The instantaneous response, y(t), of a linear
system is related to the forcing function, x(t), according to
b0dny(t)
dtn + b1dn−1y(t)
dtn−1 + . . . + bny(t) = a0dmx(t)
dtm + a1dm−1x(t)
dtm−1 + . . . + amx(t) (4-1)
where the right side of Equation (4-1) is a linear combination of the terms associ-
ated with the input function. The terms on the left side of Equation (4-1) corre-
spond to the contributions to the system response.
In an electrochemical impedance spectroscopy experiment, the forcing func-
tion, x(t), corresponds to either the sinusoidal potential or current input signal
and the response, y(t), is the current or potential output signal. For an experi-
ment conducted under galvanostatic control, the current is the input signal and
the potential is the response signal. The instantaneous value of the input current
waveform can be expressed in polar and Cartesian coordinates, respectively, ac-
cording to
I (t) = I0 sin(ωt) (4-2)
and the response signal corresponding to the potential at time, t, is
V (t) = V0 sin(ωt + φ) (4-3)
where I0 and V0 are the amplitudes of the current and potential signals, respec-
tively. The frequency of the perturbation is denoted by ω, j is√−1 and φ is the
phase lag of the output response. Replacement of I0 with V0 in Equation (4-2), the
expression for the input signal, and V0 with I0 in Equation (4-3), the expression for
the response signal, provides the appropriate relationship for experiments con-
ducted under potentiostatic modulation.
The complex impedance of the system is obtained from the input and output
signals by way of a transfer function which is analogous to Ohm’s law. In Carte-

64
sian and polar coordinates the impedance, Z, is calculated by
Z =VI
=V0 sin(ωt + φ)
I0 sin(ωt)=
V0eφ
I0= |Z|eφ (4-4)
The complex impedance can be converted from polar to Cartesian coordinates and
vice versa by applying Euler’s identity. The relationship is expressed according to
|Z|e jφ = |Z|(cosφ + j sinφ) (4-5)
The real part of the impedance is described by
Zr = |Z| cosφ (4-6)
and the imaginary part as
Z j = |Z| sinφ (4-7)
The modulus of the impedance is related to the real and the imaginary compo-
nents according to
|Z| =√
Zr2 + Z j
2 (4-8)
and the phase angle, or phase lag, of the system is
φ = arctanZ j
Zr(4-9)
A variety of analytical and graphical approaches have been developed to interpret
impedance responses. The techniques generally rely upon the impedance quan-
tities defined in Equations (4-6) through (4-9). A few of the commonly applied
presentation formats for impedance data include Bode, impedance-plane and ad-
mittance plots. The Bode representation displays the modulus of the impedance
and the phase angle versus frequency. An impedance-plane plot, also known as
a Nyquist plot, displays the imaginary part of the impedance, Z j, versus the real
part of the impedance, Zr. A typical impedance-plane plot of human skin is shown

65
-15000
-10000
-5000
00 10000 20000 30000 40000
Zr / Ωcm2
Z j /
Ωcm
2-Zj,max
Zr,max
Figure 4-2: Impedance-plane plot of skin immersed in 100 mM NaCl. The max-imum magnitudes of the real and imaginary components of the complex imped-ance are presented by the dashed horizontal and solid vertical lines, respectively.
in Figure 4-2. The shape of the impedance response of skin, as presented in the
impedance-plane, is often described as being a ”depressed” semicircle.
The terminology ”depressed” semicircle has been adopted because the maxi-
mum magnitude of the imaginary component of the impedance, -Z j,max response
is less than one half of the maximum of the real part, Zr,max. The depressed semi-
circular response can usually be modeled by the constant phase element circuit
presented in Section 3.6.2 which suggests that skin possesses a distribution of char-
acteristic time constants. A depressed semicircular shaped impedance response is
generally consistent with a linear system with constant properties. A combina-
tion of impedance-plane plots and ideal circuit models can provide estimates for
the polarization impedance, capacitance and characteristic frequency of skin. The
procedure to extract the circuit parameters is described in Section 3.6.1.
The inverse of impedance, known as the admittance, is frequently presented
as an alternative method for displaying impedance data. The general form of ad-
mittance plots is similar to the Bode display format or the impedance-plane plot
presentation of impedance data. Admittance plots are appealing because the ad-
mittance quantity is sensitive to changes at high frequencies.
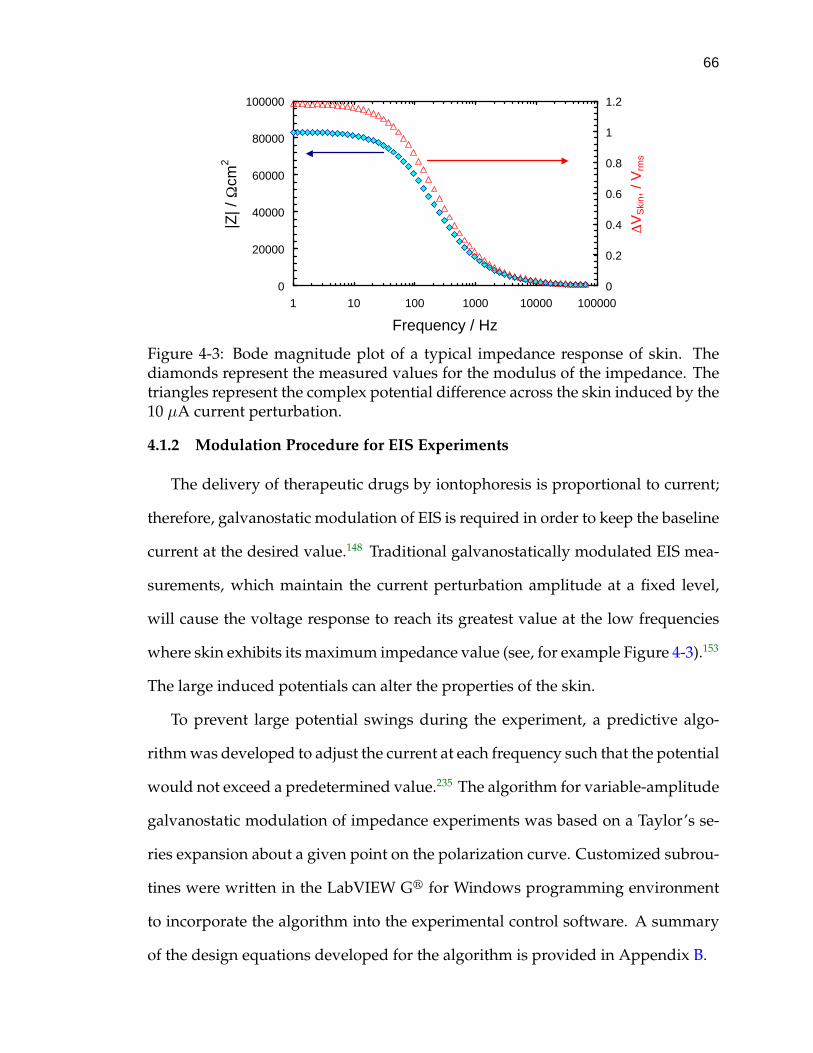
66
0
20000
40000
60000
80000
100000
1 10 100 1000 10000 100000
Frequency / Hz
|Z| /
Ωcm
2
0
0.2
0.4
0.6
0.8
1
1.2
∆VS
kin,
/ V
rms
Figure 4-3: Bode magnitude plot of a typical impedance response of skin. Thediamonds represent the measured values for the modulus of the impedance. Thetriangles represent the complex potential difference across the skin induced by the10 µA current perturbation.
4.1.2 Modulation Procedure for EIS Experiments
The delivery of therapeutic drugs by iontophoresis is proportional to current;
therefore, galvanostatic modulation of EIS is required in order to keep the baseline
current at the desired value.148 Traditional galvanostatically modulated EIS mea-
surements, which maintain the current perturbation amplitude at a fixed level,
will cause the voltage response to reach its greatest value at the low frequencies
where skin exhibits its maximum impedance value (see, for example Figure 4-3).153
The large induced potentials can alter the properties of the skin.
To prevent large potential swings during the experiment, a predictive algo-
rithm was developed to adjust the current at each frequency such that the potential
would not exceed a predetermined value.235 The algorithm for variable-amplitude
galvanostatic modulation of impedance experiments was based on a Taylor’s se-
ries expansion about a given point on the polarization curve. Customized subrou-
tines were written in the LabVIEW Gr for Windows programming environment
to incorporate the algorithm into the experimental control software. A summary
of the design equations developed for the algorithm is provided in Appendix B.
67
4.1.3 Methodology
A preliminary study was conducted to determine the efficacy of the traditional
constant-amplitude galvanostatic modulation method for measuring skin prop-
erties by impedance spectroscopy. Ideally, skin properties should not be altered
by the experiment as impedance spectroscopy was developed to be a noninva-
sive technique. The approach here was to collect multiple impedance spectra by
constant-amplitude modulation. The amplitude of the current perturbation was
adjusted before each spectrum was collected. The perturbation amplitudes for the
impedance scans were between 10 µA and 100 µA. The objective was to determine
whether the skin impedance response was independent of the current perturba-
tion amplitude. The results from these experiments are presented in Section 5.1.
For the next portion of this work, two types of galvanostatically modulated
EIS experiments were conducted. The first experiment maintained the amplitudes
of perturbation at values of 1 µA and 10 µA. For the second type of experiment,
the current amplitude was adjusted at each frequency to maintain the voltage re-
sponse of the skin below a predetermined value chosen at the beginning of the
experiment.235 In accordance with the variable-amplitude galvanostatic modula-
tion algorithm, previously measured impedance values were used to predict the
impedance at the frequency of the measurement being conducted.
A series of variable-amplitude impedance experiments were conducted on each
sample of skin, where, periodically, a series of constant-current galvanostatic imped-
ance measurements were performed. To compare the difference between the two
techniques, a series of replicate variable-amplitude experiments was performed
subsequent to the constant-amplitude studies. The idea was to determine the most
appropriate modulation strategy for conducting skin impedance experiments.

68
Both modulation techniques were applied to skin samples immersed in NaCl
solution and in CaCl2 solution, respectively. The AC current perturbation was
superimposed about a DC current bias of 0 Amperes/cm2. The skin impedance
spectra collected from both modulation techniques are discussed in Section 5.2.
In general, 12 measurements were taken for logarithmic decade for frequencies
between 65 kHz and 1 Hz. For some of the impedance experiments, the low-
frequency portion of the spectra was extended to 0.1 Hz
The methodology described up to this point was designed to identify an exper-
imental approach for collecting skin impedance spectra in a noninvasive manner.
For the next phase of this study, impedance experiments were performed to deter-
mine the influence of prolonged electrolyte exposure on skin transport properties.
The approach was to collect skin impedance spectra intermittently over a period of
24 hours. The variable-amplitude galvanostatic modulation strategy was applied
for the hydration study. The sinusoidal current perturbations were modulated
about a DC bias of 0 µA/cm2. The target amplitude of the potential drop across
the skin was set to± 10 mV. The study provided a baseline to estimate the changes
in skin transport properties caused by the addition of water into the membrane.
The results from this investigation are presented in Section 6.2.
It has been proposed that the recovery of skin properties to large electrical per-
turbations is more rapid in divalent cation solutions than in monovalent cation
solutions.152 The influence of solution composition on the recovery of skin proper-
ties is described in Section 6.3. A detailed discussion of the experimental approach
for the study is provided there. If it is shown that the recovery of skin properties is
enhanced in the presence of divalent cations, the information could be used to de-
velop transdermal iontophoretic protocols. For example, supporting electrolytes
69
with divalent cations could be included in drug formulations to enhance the re-
covery rate of skin properties after iontophoresis.
The influence of large potential swings on skin properties was also studied
by electrochemical impedance spectroscopy. The approach was to collect a series
of skin impedance spectra by variable-amplitude galvanostatic modulation. The
amplitude of the target potential was adjusted incrementally from 50 mV to 1 V
at the beginning of each experiment. Four spectra were collected for each set of
experimental conditions. The results from the studies are described in Section 6.4.
During transdermal iontophoresis a DC current bias is applied to enhance the
flux of ionic drug compounds into the body. The objective of the next investigation
was to characterize the impedance response of skin under applied DC current
conditions. For this work, a sinusoidal current signal was superimposed about
the applied-current bias. The amplitudes of the current biases were between 0
µA/cm2 and 855 µA/cm2. This range was consistent with the currents applied
by clinical iontophoretic systems.177, 201, 236 The results of the impedance studies on
the influence of DC current on skin properties are discussed in Section 6.5.
The literature indicates there is a regional variation in skin properties for any
given person. Furthermore, skin properties also vary from person-to-person. A
limited number of studies have been performed to characterize the variation in the
electrical and transport properties of skin. A demonstration of the large regional
variation in skin transport properties is provided in Section 6.6. The methodology
used for the investigation is described there. Although visual inspection of the
spectra from the various pieces of skin revealed a large variation in epidermal
properties, rigorous statistical assessment of the sources contributing to the overall
variation was performed. The approach for the statistical analysis of the variation
in the impedance response of skin is described in Chapter 7.

70
4.1.4 Statistical Analysis of Impedance Spectra
A major portion of this work was focused on the development of in experimen-
tal techniques for monitoring skin properties during transdermal iontophoresis.
Biological membranes, such as skin, often exhibit nonlinear and/or nonstationary
behavior when subjected to large electric fields. This situation is likely to occur
during transdermal iontophoresis because of the characteristically high resistance
of the stratum corneum. The transport properties of skin may also change as the
ionic solution penetrates the membrane. It is possible that these changes occur
during the time period required to complete a transdermal iontophoresis experi-
ment. The evolution of the system was monitored by impedance spectroscopy for
all of the experiments conducted here.
Statistical analysis of the impedance data was performed to determine the
Kramers-Kronig consistent portions of the spectra. The Kramers-Kronig relations
are a set of integral equations that can be used to convert between the real and
the imaginary components of the complex impedance. Impedance spectra that are
stationary, linear, causal and stable conform to the Kramers-Kronig relations.
The Measurement Model approach developed by Agarwal et al.237−239 was ap-
plied in this work to assess Kramers-Kronig consistent portions of the impedance
spectra. The Measurement Model selected for that development was the Voigt cir-
cuit model.237 The Voigt model is similar to the ideal circuit network presented in
Figure 3-3 with additional RC elements connected in series. The complex imped-
ance expression for the Voigt circuit is defined according to
Z(ω) = Z0 +n
∑k
Rk
(1 + jτkω)(4-10)
where Z0 is the electrolyte solution resistance, τk and Rk are the time constant and
resistance for the kth RC element and n is the maximum number of line shapes that
71
can be justified according to the noise in the measurement. Equation (4-10) is con-
sistent with the Kramers-Kronig relations. Therefore, a statistically significant fit
of the Voigt model to an impedance spectrum implies that the data are consistent
with the Kramers-Kronig relations.
The Measurement Model for each impedance spectrum was built iteratively
by the successive addition of RC line shapes. The Measurement Model Tools soft-
ware developed by Orazem et al.240 was used to regress the measurement model to
the impedance spectra. Complex nonlinear least squares (CNLS) regression was
applied at each step of the model building procedure to obtain parameter esti-
mates. The confidence intervals for the parameter estimates were calculated from
Monte Carlo simulations.239 The total number of parameters for the model was
constrained such that the 95.4% confidence intervals must not include zero for
each of the parameter estimates.
The Measurement Model approach was used to determine the nature of exper-
imental errors. The residual errors from the regression procedure consist of deter-
ministic and stochastic errors. For example, deterministic errors may be caused
by an insufficient or incomplete model, nonstationary system behavior and/or in-
strumental bias. The stochastic errors were assumed to be randomly distributed
with a mean value of 0 and a standard deviation σ. The contributions to the total
error from the regression are defined by
Z− Z = εlo f + εns + εinstr + εstoch (4-11)
where Z and Z are the complex impedance values from the experiment and the
model, εlo f is the lack of fit error due to model inadequacy, εns is the error from
nonstationary effects, εinstr is the error from instrumental artifacts and εstoch is the
stochastic error.
72
In accordance with the Measurement Model technique, replicate impedance
spectra were collected for each set of experimental conditions. A Measurement
Model was regressed to each impedance spectra separately. The regressions were
weighted by the modulus of the impedance. Each of the models was selected to
have the same number of line shapes and the regression parameters were adjusted
for each replicate. Under the assumption that the system was evolving slowly, this
approach served as a filter for the nonstationary component of the regression error.
The lack of fit errors were assumed to be constant for all of the regressions since
all of the Measurement Models possessed the same number of line shapes. Instru-
mental errors were also assumed to be constant because the control parameters for
the impedance apparatus were kept constant. The general approach of regressing
a measurement model to each replicate spectra resulted in the extraction of the
stochastic component of the total error.
The stochastic component of the regression error typically exhibits a strong
dependence on frequency for impedance data. As a unique Measurement Model
with an equal number of parameters was regressed to each of the impedance spec-
tra separately, a family of frequency-dependent residual errors was produced for
each replicate. The variance and the mean of the real and imaginary residual er-
rors were calculated according to
σ2r = ∑
k
εres,r,k − ε2res,r
N− 1(4-12)
σ2j = ∑
k
εres, j,k − ε2res, j
N− 1(4-13)
where σ2 is the variance, N is the number of data points collected at each fre-
quency, ε is the regression error and ε is the mean fitting error. The mean fitting
can be further decoupled to
ε = mean(εlo f + εinstr) (4-14)
73
where εlo f is the contribution to the fitting error from model inadequacies and εinstr
is the contribution from systematic errors in the measuring equipment.
Agarwal et al. developed a model for the frequency-dependent, stochastic com-
ponent of the error.238 For the development of the error structure model it was
assumed that the standard deviation of the real and imaginary components were
equal. This assumption was subsequently validated by Durbha et al. for Kramers-
Kronig consistent data where the real and imaginary components of the imped-
ance are collected simultaneously.241 The error structure model accounts for the
method by which impedance data is collected and is described according to
σ j = σr = σ = α|Z j|+ β|Zr|+ γ|Z|2Rm
+ δ (4-15)
where Rm is the resistance of the potentiostat measuring resistor, and α, β, γ and
δ are the model constants. Parameter estimates are obtained by the regression of
the error structure model to the residual errors obtained from the Measurement
Model regression procedure.
Impedance spectra were assessed for consistency with the Kramers-Kronig re-
lationship by weighting the Measurement Model regression with the experimen-
tally determined error structure. This approach is generally superior to modulus
weighting as an emphasis is placed on data with less noise content in comparison
to data with more noise content. Measurement Model parameters were obtained
from the complex nonlinear least squares regression by minimizing the objective
function
J = ∑k
Zr,k − Zr,k2
σ2r,k
+ ∑k
Z j,k − Z j,k2
σ2j,k
(4-16)
where Zr,k and Z j,k are the real and imaginary components of the impedance,
whereas σ2r,k and σ2
j,k are the error structure variances of the real and imaginary
parts of impedance at each frequency.
74
The quality of information obtained from impedance data was increased by
regressing the Measurement Model according to the noise in the measurement.
The regression scheme described here provided for statistically rigorous evalua-
tion of the Kramers-Kronig consistent parts of impedance data. This information
was used to identify measuring frequencies where the impedance response of skin
was not causal, stable, linear or stationary. For example, data that did not conform
to the Kramers-Kronig relations was associated with changes in skin properties.
All of the impedance spectra presented in this work were assessed for consistency
with the Kramers-Kronig relations.
4.2 Potential and Current Step-Change Studies
The transient response of skin to constant-amplitude DC potential and current
signals was monitored to supplement the impedance results. The objective was
to identify the response of skin to the prolonged application of electrical signals.
Two types of experiments were performed for the study. For the first set of experi-
ments a constant amplitude DC potential bias was applied across the skin and the
current response was monitored for a period of 20 minutes. The current response
was sampled at a rate of 52.9 mHz, which corresponds to the collection of one
measurement every 20 seconds. The skin was then allowed to relax for at least 15
minutes after the potential bias was terminated.
The influence of the potential bias amplitude on skin properties was assessed
by incrementally increasing the potential bias over a range of values. The mag-
nitude of the applied biases were 10, 50, 100, 250, 500 and 1,000 mV, respectively.
For this study, the smallest bias amplitude was applied at the beginning of the
experiment. The experimental protocol was repeated four times, twice with sam-
ples of skin immersed in NaCl solution and twice with samples of skin immersed
in CaCl2 solution. The objective was to determine whether the effects of solution

75
cation charge and applied potential magnitude on the transport properties of skin
were coupled. The results from the potential step-change studies are presented in
Section 8.1.
For the second type of experiment, skin was subjected to a series of step-
changes in current and the potential response was monitored. The amplitudes
of the DC current signals were 1.4 µA/cm2, 14 µA/cm2 and 140 µA/cm2. In gen-
eral, the current step-change was held at the elevated condition for 40 minutes.
Four 10 mV variable-amplitude galvanostatically modulated impedance spectra
were collected before and after skin was subjected to the elevated DC current. The
results from the current step-changes studies are discussed in Section 8.2.
4.3 Materials
Heat-separated excised human skin was the model membrane studied in all
of the experiments. The separation procedure involved physical and mechanical
manipulations to extract the stratum corneum and the adjoining layers of the epi-
dermis from the underlying dermis. In compliance with the standard protocol,
deionized water was the only solvent added during the process.242 A complete
description of the heat-separation procedure is presented in Appendix A. The
thickness of the epidermal membranes was approximately 100 µm. The excised
skin was obtained from the abdomen or the back. The samples were pliable and
semi-translucent to visible light. A micrograph of a skin specimen is shown in
Figure 4-4. The out of focus regions of the picture were caused by water bubbles
trapped between the slide glass and the membrane.
The skin samples were mounted between glass diffusion cells prior to each
impedance study and replaced upon changing the ionic solution. The skin and the
solution were maintained at constant temperature with a water-jacketed diffusion
cell. The diffusion cell provided separation between the ionic solutions and the

76
Figure 4-4: Micrograph of heat-separated cadaver skin. Picture taken at a magni-fication of 92x.
exterior heating bath. Magnetic stir bars were added to the diffusion cell to keep
the solution well mixed.
The applied bias signals for the step-change experiments were provided by a
Schlumberger 1286 potentiostat. The electrochemical impedance measurements
were conducted with a Schlumberger 1286/1250 impedance couple. In order to
monitor conditions across the skin a four-electrode configuration was used for
all of the studies. The Ag/AgCl counter and working electrodes were produced
by In Vivo Metric. The Ag/AgCl reference electrodes were fabricated by Micro
Electrodes, Inc.
The electrochemical impedance spectroscopy experiments designed to demon-
strate the efficacy of variable-amplitude galvanostatic modulation were conducted
in solutions of 100 mM NaCl at a pH of 5.23 and 100 mM CaCl2 solution at a pH
of 4.92. The ionic strength of the CaCl2 solution was a factor 1.8 greater than the
NaCl solution. Since activity coefficient corrections are proportional to the square
root of ionic strength this difference was considered negligible.136 The water bath
for these experiments was maintained at room temperature.
The ionic solutions used for the other experiments in this work were either 150
mM NaCl / 20 mM HEPES, 150 mM KCl / 20 mM HEPES, 50 mM CaCl2 / 20 mM
HEPES or 50 mM MgCl2 / 20 mM HEPES. The pH of the solutions was approxi-
77
mately 7. The temperature of the heating bath was maintained at 32 C. The water
bath temperature was consistent with the surface temperature of skin. To ensure
that activity coefficient corrections were roughly equivalent for experiments con-
ducted in the two electrolytes, the electrolyte concentrations were chosen to yield
the same ionic strength.
4.4 UV-vis Absorption Spectroscopy
Transdermal drug delivery rates under applied-current conditions were cal-
culated with UV-vis absorption spectroscopy. The anesthetic, lidocaine, was the
model drug molecule studied in this work. The aromatic group of lidocaine pro-
vides the molecule with light absorbance properties in the UV portion of the elec-
tromagnetic spectrum. The typical absorption peak for aromatic molecules occurs
between 200 and 300 nm, where the addition of functional groups shifts the ab-
sorption peak to longer wavelengths.243
A fundamental assumption of absorption spectroscopy is that the absorption
intensity is proportional to the chromophore (light absorbing molecule) concen-
tration and the length of the light path through the sample. The formal expression
for relating light absorbance to chromophore concentration consistent with the
Beer-Lambert law is presented by243
A = logP0
P= εbci (4-17)
where A is the absorbance of species, P0 is the energy of electromagnetic radiation
reaching the detector in the absence of the chromophore and P is the energy of
radiation reaching the detector for a chromophore concentration of ci. The path-
length through the sample is, b and ε is the molar extinction coefficient.
According to the Beer-Lambert law, the molar extinction coefficient should the-
oretically be independent of concentration. For real systems, this criteria is satis-
78
fied only over a limited range of concentrations and must be determined exper-
imentally. In general, the absorbance response is consistent with Beer-Lambert
theory when the concentration of the light absorbing molecule is less than 10 mM.
Above this critical threshold, nonlinear behavior is observed because of specific
interactions between the light absorbing species.244
Philbrick164 successfully applied UV-vis absorption spectroscopy for measure-
ment of lidocaine drug delivery rates. The magnitude of applied DC currents used
for the study was 1 µA and 100 µA. The calibration study performed for that work
provided accurate measurement of lidocaine concentration in the range of 0.5 µM
to 30 µM. Drug delivery rates were estimated from the time rate of change of li-
docaine concentration. Results from the study demonstrated that the transdermal
delivery rate of lidocaine increased in response to applied current. Elevated li-
docaine flux values were observed after the current was terminated. This result
suggested that the skin serves as a reservoir for the temporary storage of lidocaine.
A possible explanation for the source of the reservoir capacity was that absorption
reactions were occurring between the negative background charge of the skin and
the positively charged lidocaine ions.
4.4.1 Instrumentation and Data Collection
Considerable emphasis was placed on developing accurate and reliable method-
ologies for measuring drug delivery rates during transdermal iontophoresis. The
absorption spectroscopy apparatus was designed in compliance with the general
principle of a dual-beam spectrophotometers.245 The advantage of the dual-beam
system over a single beam unit is that fluctuations in the light source output as
well as drift in the photodiode array of the spectrometer can be monitored.
The main components of the absorption spectroscopy apparatus consisted of a
light source, a customized dual-beam absorption spectroscopy cell, a parallel com-
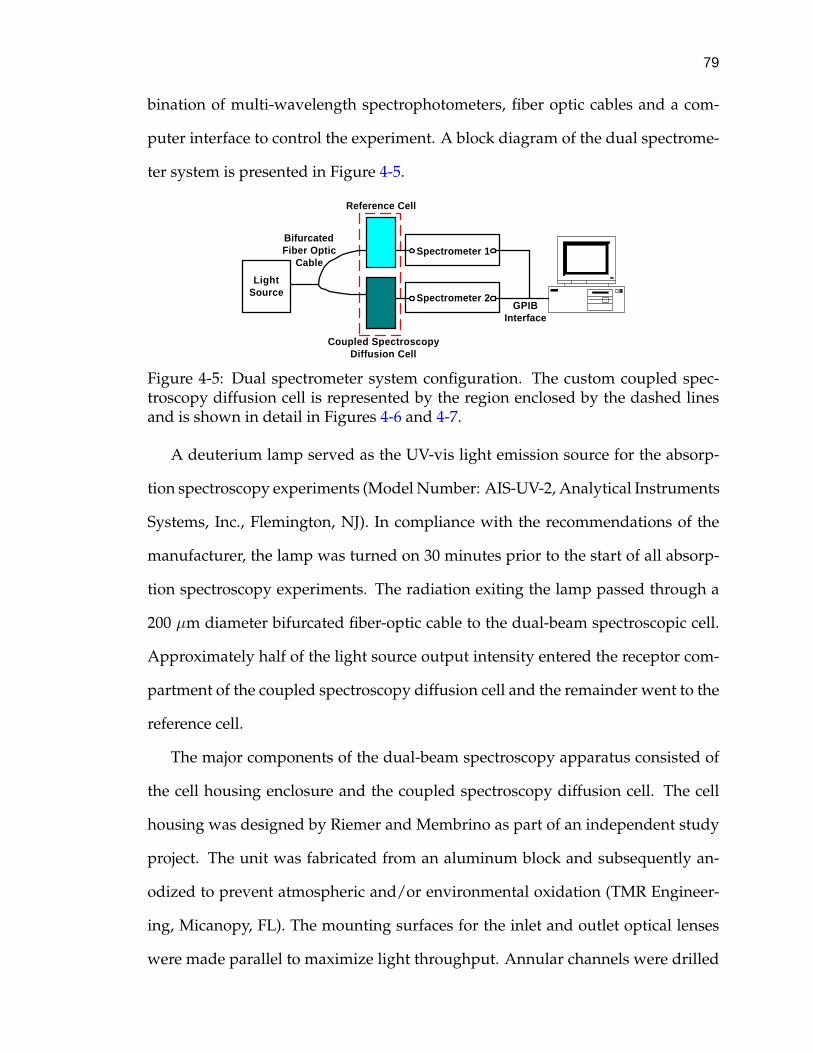
79
bination of multi-wavelength spectrophotometers, fiber optic cables and a com-
puter interface to control the experiment. A block diagram of the dual spectrome-
ter system is presented in Figure 4-5.
GPIBInterface
Spectrometer 1
Spectrometer 2
LightSource
BifurcatedFiber Optic
Cable
Reference Cell
Coupled SpectroscopyDiffusion Cell
Figure 4-5: Dual spectrometer system configuration. The custom coupled spec-troscopy diffusion cell is represented by the region enclosed by the dashed linesand is shown in detail in Figures 4-6 and 4-7.
A deuterium lamp served as the UV-vis light emission source for the absorp-
tion spectroscopy experiments (Model Number: AIS-UV-2, Analytical Instruments
Systems, Inc., Flemington, NJ). In compliance with the recommendations of the
manufacturer, the lamp was turned on 30 minutes prior to the start of all absorp-
tion spectroscopy experiments. The radiation exiting the lamp passed through a
200 µm diameter bifurcated fiber-optic cable to the dual-beam spectroscopic cell.
Approximately half of the light source output intensity entered the receptor com-
partment of the coupled spectroscopy diffusion cell and the remainder went to the
reference cell.
The major components of the dual-beam spectroscopy apparatus consisted of
the cell housing enclosure and the coupled spectroscopy diffusion cell. The cell
housing was designed by Riemer and Membrino as part of an independent study
project. The unit was fabricated from an aluminum block and subsequently an-
odized to prevent atmospheric and/or environmental oxidation (TMR Engineer-
ing, Micanopy, FL). The mounting surfaces for the inlet and outlet optical lenses
were made parallel to maximize light throughput. Annular channels were drilled
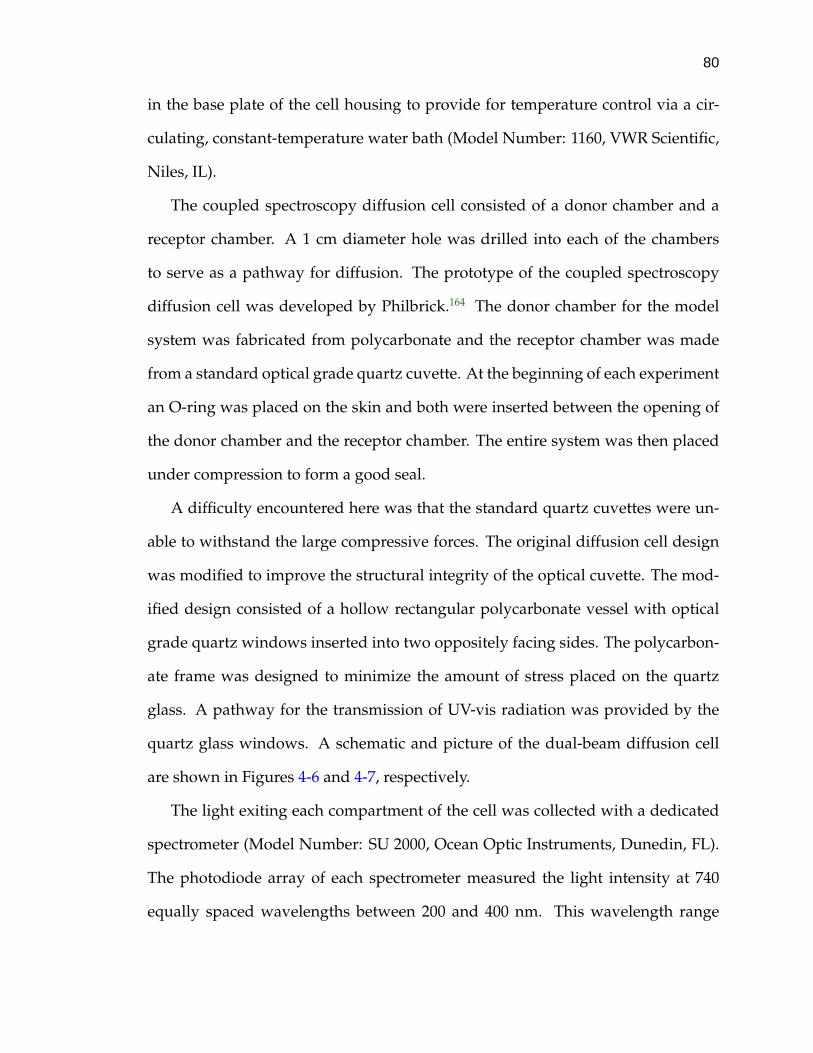
80
in the base plate of the cell housing to provide for temperature control via a cir-
culating, constant-temperature water bath (Model Number: 1160, VWR Scientific,
Niles, IL).
The coupled spectroscopy diffusion cell consisted of a donor chamber and a
receptor chamber. A 1 cm diameter hole was drilled into each of the chambers
to serve as a pathway for diffusion. The prototype of the coupled spectroscopy
diffusion cell was developed by Philbrick.164 The donor chamber for the model
system was fabricated from polycarbonate and the receptor chamber was made
from a standard optical grade quartz cuvette. At the beginning of each experiment
an O-ring was placed on the skin and both were inserted between the opening of
the donor chamber and the receptor chamber. The entire system was then placed
under compression to form a good seal.
A difficulty encountered here was that the standard quartz cuvettes were un-
able to withstand the large compressive forces. The original diffusion cell design
was modified to improve the structural integrity of the optical cuvette. The mod-
ified design consisted of a hollow rectangular polycarbonate vessel with optical
grade quartz windows inserted into two oppositely facing sides. The polycarbon-
ate frame was designed to minimize the amount of stress placed on the quartz
glass. A pathway for the transmission of UV-vis radiation was provided by the
quartz glass windows. A schematic and picture of the dual-beam diffusion cell
are shown in Figures 4-6 and 4-7, respectively.
The light exiting each compartment of the cell was collected with a dedicated
spectrometer (Model Number: SU 2000, Ocean Optic Instruments, Dunedin, FL).
The photodiode array of each spectrometer measured the light intensity at 740
equally spaced wavelengths between 200 and 400 nm. This wavelength range
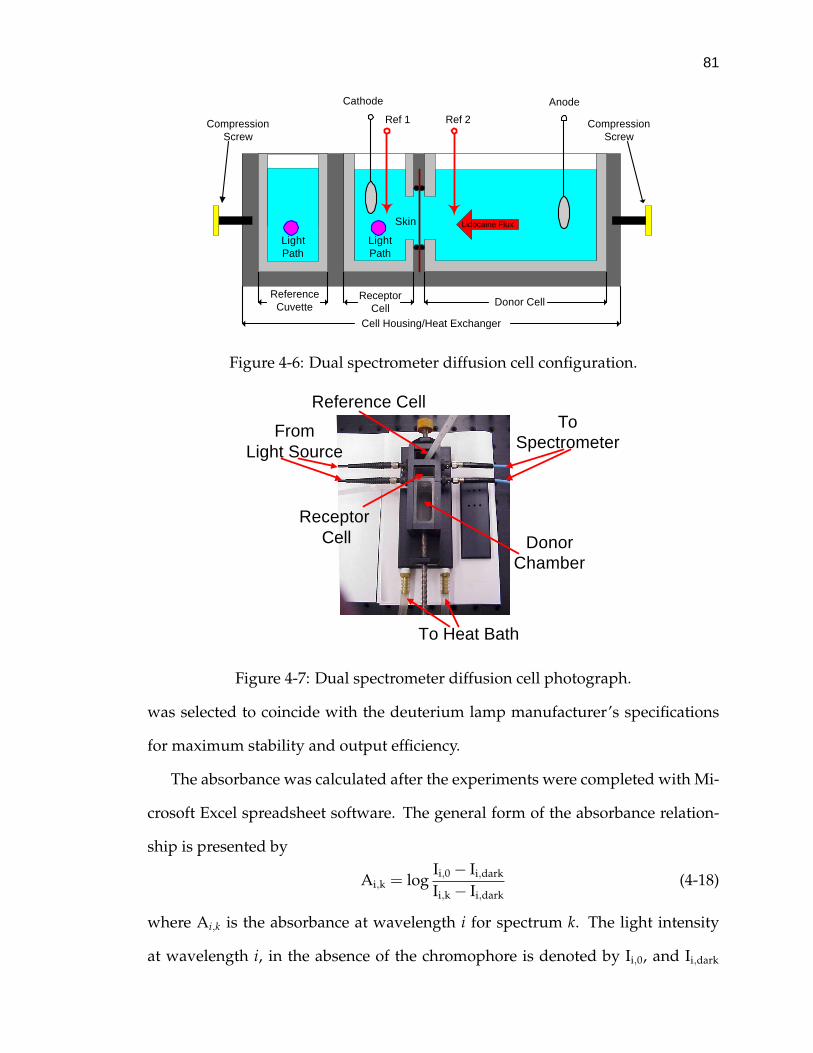
81
Lidocaine Flux
ReferenceCuvette
Cathode Anode
Ref 1 Ref 2
Donor Cell
Skin
ReceptorCell
LightPath
LightPath
Cell Housing/Heat Exchanger
CompressionScrew
CompressionScrew
Figure 4-6: Dual spectrometer diffusion cell configuration.
To Heat Bath
ToSpectrometer
DonorChamber
Reference Cell
Receptor Cell
FromLight Source
Figure 4-7: Dual spectrometer diffusion cell photograph.
was selected to coincide with the deuterium lamp manufacturer’s specifications
for maximum stability and output efficiency.
The absorbance was calculated after the experiments were completed with Mi-
crosoft Excel spreadsheet software. The general form of the absorbance relation-
ship is presented by
Ai,k = logIi,0 − Ii,dark
Ii,k − Ii,dark(4-18)
where Ai,k is the absorbance at wavelength i for spectrum k. The light intensity
at wavelength i, in the absence of the chromophore is denoted by Ii,0, and Ii,dark
82
is the intensity at wavelength i, when light is absent from the spectrometer. Prior
to each diffusion study the light source was blocked with a black metal plate and
spectra were collected by the spectrophotometers. These spectra provided for di-
rect evaluation of the dark signal and corresponded to the baseline response of the
photodiode array.
4.4.2 Software Control
The LabVIEW Gr software driver for the spectrometers, as purchased from
Ocean Optic Instruments, lacked an option for storage of the intensity spectra in
spreadsheet-compatible output files. The LabVIEW Gr driver was modified to
enable collection of the spectra from the reference cell and the diffusion cell. An
option was added which allowed the user to select the range of wavelengths for
the collection of intensity data. The option helped to reduce the size of the output
files. An additional option allowed the user to specify the time interval between
collection of subsequent spectra. The changes to the software driver facilitated
the control of the UV-vis absorption spectroscopy experiment and storage of data
with the computer.
4.4.3 Calibration Studies
A multi-step calibration procedure was completed prior to the transdermal
iontophoresis experiments. The first part of the calibration was designed to char-
acterize the transient behavior of the spectrometers. This was accomplished by
placing deionized water in both the reference cell and the diffusion cell and col-
lecting spectra intermittently for 2.4 hours. Since no chromophore was present,
any changes in the absorbance response were assumed to be caused by system-
atic changes in the equipment. The results from the assessment of system drift are
presented in Section 9.1.
83
The second part of the calibration was designed to identify the range of lido-
caine concentrations for which the absorbance response could be described by
Beer-Lambert theory. This was accomplished by collecting absorption spectra
from solutions with known lidocaine concentrations. The approach was to succes-
sively add small aliquots of concentrated lidocaine solution to an initially dilute
mixture. All mixing was performed in the coupled spectroscopy diffusion cell in
order to incorporate the effects of the cell geometry on the absorption response.
The concentration of the lidocaine solutions ranged from 0.5 µM to 1.8 mM. The
extinction coefficient at each wavelength in the spectra was calculated from the
absorbance data according to the Beer-Lambert law. The results of the lidocaine
calibration studies are presented in Section 9.2.
An additional study was conducted to identify the influence of prolonged im-
mersion of skin in electrolyte solutions on the absorbance response. The goal was
to determine the rate at which chromophoric species diffuse from the skin. The
approach provided for the calculation of the relative contributions of skin species
and lidocaine to the overall absorbance response. For the study, skin was placed
in the coupled spectroscopy diffusion cell and immersed in a buffered solution of
150 mM NaCl. Absorbance spectra were collected over approximately 2.5 hours
at three-minute intervals. The temperature of the diffusion cell was maintained at
32C. A detailed description of the work is provided in Section 9.3
4.5 Investigation of Transdermal Iontophoresis with Coupled Spectroscopy
The coupled spectroscopy methodology was applied to investigate transder-
mal iontophoresis upon completion of the calibration studies. The system was
maintained at 32C. Transdermal iontophoresis was simulated by periodically ap-
plying a DC current bias of 14 mA/cm2 and monitoring the absorption response
with the spectrometers. At the start of the experiment skin was immersed in

84
buffered 150 mM NaCl and 3.5 ml of the lidocaine cocktail were added. The
temperature was maintained at 32C by the circulating water bath. Replicate
impedance spectra were collected while the current was maintained at 0 µA/cm2.
The electrochemical impedance spectroscopy experiments were conducted under
variable-amplitude galvanostatic control. The experimental results are described
in Section 9.4.

CHAPTER 5DEVELOPMENT OF VAG MODULATION FOR SKIN IMPEDANCE STUDIES
A preliminary goal of this research was to develop an appropriate method-
ology for measuring skin properties by electrochemical impedance spectroscopy.
Ideally, in the absence of an applied current bias the impedance spectroscopy ex-
periment should not alter skin properties. In Section 5.1 it is demonstrated that
the traditional methodology for conducting skin impedance experiments can alter
skin transport properties. An adaptive modulation strategy was implemented to
prevent the impedance experiment from changing skin properties. Development
and application of the adaptive modulation strategy is described in Section 5.2.
Skin impedance spectra collected by the adaptive methodology were shown to
be consistent with a membrane with unaltered properties. As a result, the adap-
tive modulation technique was applied extensively in subsequent skin impedance
experiments.
5.1 Preliminary Investigation of Skin Impedance
The conventional methodology for studying skin transport properties by elec-
trochemical impedance spectroscopy is to apply a constant-amplitude sinusoidal
current signal and measure the potential response over a wide range of pertur-
bation frequencies.131, 151, 233 A preliminary study was conducted to determine the
influence of current modulation amplitude on the impedance response of skin.
The objective of the preliminary work was to determine whether skin impedance
spectra obtained with the traditional constant-amplitude galvanostatic modula-
tion technique were consistent with a membrane with unaltered properties. For
85
86
example, the skin was assumed to be unaltered by the impedance experiment if
the corresponding spectrum satisfied the Kramers-Kronig relations.
There is a general consensus in the literature that the stratum corneum exhibits
a nonlinear response to electrical impulses between 0.1 V and 2 V, especially at fre-
quencies below 10 Hz.2, 3, 153, 154 In a literature survey, Prausnitz reported that direct
current densities between 0.1 µ/cm2 and 75 µ/cm2 can also introduce a nonlinear
response in skin (for a more complete discussion see, for example, Section 2.6).3
The objective of this investigation was to determine the threshold value of
current or potential for the onset of nonlinear behavior. This was accomplished
by adjusting the amplitude of the applied-current perturbation and checking the
impedance response for consistency with the Kramers-Kronig (KK) relations. As
described in Section 4.1.4, the Kramers-Kronig relations are a set of integral equa-
tions which transform the real and imaginary components of complex quantities.
Data that conform to the Kramers-Kronig relations are linear, stationary, causal
and stable. Therefore, spectra that were found to be consistent with the Kramers-
Kronig relations were associated with a membrane with constant transport prop-
erties.
It is possible that the nonlinear skin impedance response described in the liter-
ature was induced by the applied electrical perturbation. The preliminary imped-
ance studies were designed to identify a set of experimental input parameters
which could yield a skin impedance response that was linear for the majority
of the frequency range. The approach was to collect a series of eight constant-
amplitude galvanostatic impedance scans, all with different applied perturbation
amplitudes, from the same piece of skin. The skin was immersed in 150 mM NaCl
electrolyte solution which was buffered at a pH of approximately 7. The modu-
lation amplitudes for the impedance experiments were adjusted between 10 and
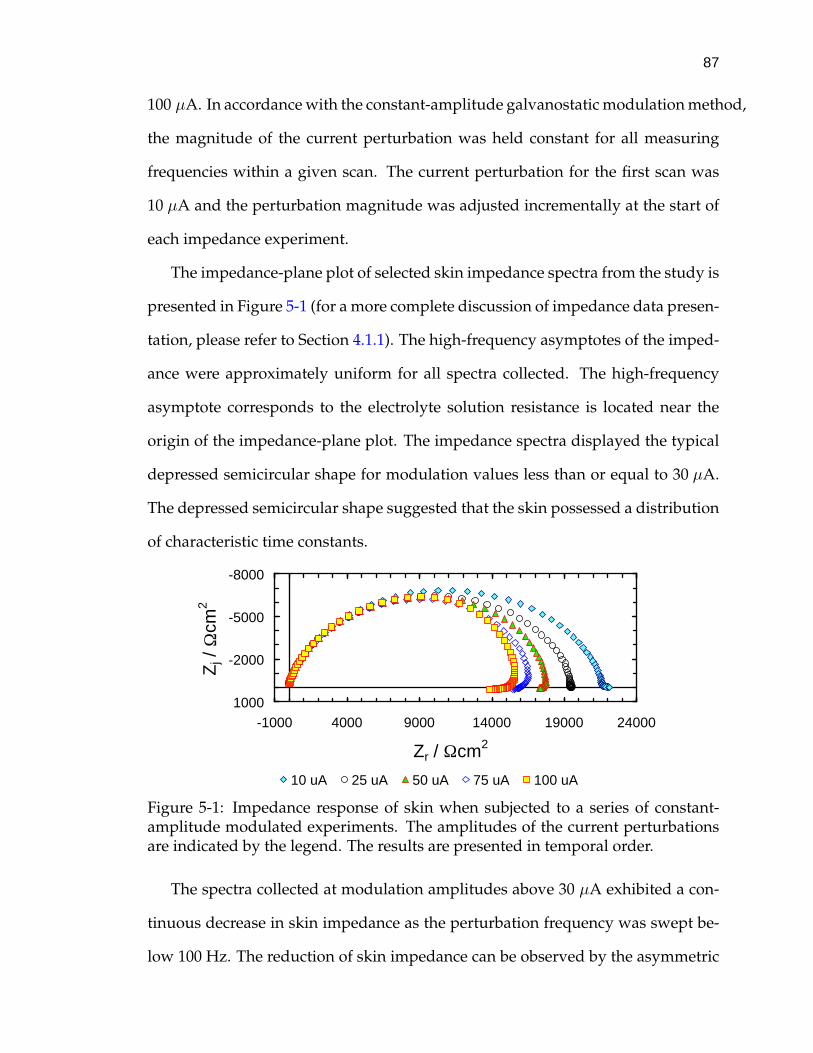
87
100 µA. In accordance with the constant-amplitude galvanostatic modulation method,
the magnitude of the current perturbation was held constant for all measuring
frequencies within a given scan. The current perturbation for the first scan was
10 µA and the perturbation magnitude was adjusted incrementally at the start of
each impedance experiment.
The impedance-plane plot of selected skin impedance spectra from the study is
presented in Figure 5-1 (for a more complete discussion of impedance data presen-
tation, please refer to Section 4.1.1). The high-frequency asymptotes of the imped-
ance were approximately uniform for all spectra collected. The high-frequency
asymptote corresponds to the electrolyte solution resistance is located near the
origin of the impedance-plane plot. The impedance spectra displayed the typical
depressed semicircular shape for modulation values less than or equal to 30 µA.
The depressed semicircular shape suggested that the skin possessed a distribution
of characteristic time constants.
-8000
-5000
-2000
1000-1000 4000 9000 14000 19000 24000
Zr / Ωcm2
Zj /
Ωcm
2
10 uA 25 uA 50 uA 75 uA 100 uA
Figure 5-1: Impedance response of skin when subjected to a series of constant-amplitude modulated experiments. The amplitudes of the current perturbationsare indicated by the legend. The results are presented in temporal order.
The spectra collected at modulation amplitudes above 30 µA exhibited a con-
tinuous decrease in skin impedance as the perturbation frequency was swept be-
low 100 Hz. The reduction of skin impedance can be observed by the asymmetric
88
”curl” or ”hook” in the data located in the lower right hand region of Figure 5-1.
The curvature of the ”hook” was proportional to the perturbation amplitude. The
data points associated with the ”hook” represent the low-frequency impedance
response of skin. The low-frequency asymptote of the impedance corresponds to
the polarization resistance of skin. Ideally, a system with linear transport prop-
erties should have a polarization resistance which is independent of the applied
current.
The decrease in polarization resistance associated with perturbation ampli-
tudes greater than 30 µA suggested that skin properties had been altered. Rig-
orous support for the proposed effect of the perturbations on skin properties was
provided by assessing the data for consistency with the Kramers-Kronig relations.
The details of the assessment procedure are presented in the next section.
5.1.1 Kramers-Kronig Consistency Check of Preliminary Impedance Data
The impedance spectra were assessed for consistency with the Kramers-Kronig
relations by regressing the Voigt circuit Measurement Model to the data. Detailed
examples of the assessment procedure are provided here. However, a more com-
plete discussion of the approach used to apply the Measurement Model for assess-
ing impedance data for consistency with the Kramers-Kronig relations is provided
in Section 4.1.4. For the first part of the assessment procedure, complex fits of the
Measurement Model to the spectra yielded a maximum of 2 line shapes. The lim-
ited number of line shapes resulted in large fitting errors.
Visual inspection of the impedance-plane plot of skin impedance revealed that
the high-frequency asymptote, which corresponds to the electrolyte solution resist-
ance, was negative. An apparent negative solution resistance is a common symp-
tom of instrumental artifact. The difficulty was circumvented by performing an
imaginary fit of the Measurement Model to the 10 µA modulated spectrum. The

89
solution resistance for this regression was set to 0 Ω. An appropriate solution
resistance was selected by iteratively adjusting the solution resistance until the
normalized real residual errors from the regression were normally distributed
about a mean of 0 Ω.
The normalized residual errors were calculated at each frequency by dividing
the fitting errors by the impedance magnitude of the real and imaginary compo-
nents according to
Real residual error =Zr,data −Zr,model
Zr,data(5-1)
Imaginary residual error =Zj,data −Zj,model
Zj,data(5-2)
where Zr,data and Zj,data represent the measured values of the real and imaginary
impedance components. The terms Zr,model and Zj,model correspond to the calcu-
lated values for the real and imaginary impedance quantities. It was determined
that an electrolyte solution resistance of -55 Ω yielded the best distribution of resid-
ual errors for the 10 µA modulated experiment. Therefore, the electrolyte solution
resistance was set to -55 Ω for all of the subsequent regressions. A similar ap-
proach was applied for regressing the Measurement Model to other impedance
spectra with an apparent negative solution resistance.
The selection of a negative solution resistance for the regressions was not con-
sistent with the state of the system. However, the goal here was to develop a
method for obtaining improved fits of the Voigt circuit model to skin impedance
spectra. For this discussion, an improved fit was associated with an increase in
the number of model parameters used to represent the impedance spectrum. The
added line shapes helped to reduce the magnitude of the normalized residual
fitting errors. For example, the regressions where the electrolyte solution resist-
ance was set to -55 Ω yielded a minimum of 6 shapes for all of the impedance

90
spectra. The fitting errors for the regressions were within the noise level of the
measurements. The improved fits of the Measurement Model made it possible
to determine whether the low-frequency impedance response of skin satisfied the
Kramers-Kronig relations. An emphasis was placed on the low-frequency portion
of the spectra because the data contains information on skin properties which are
affected by iontophoresis.
The low-frequency portions of the skin impedance spectra were assessed for
consistency with the Kramers-Kronig relations by regressing the Measurement
Model to the imaginary component of the experimental data. The circuit element
parameters obtained from the regressions were used to estimate the real compo-
nent at each frequency. Normalized real residual errors which fell outside the
95.4% confidence interval were considered to be inconsistent with the Kramers-
Kronig relations. A sample plot for the frequency-dependent real residual errors
from an imaginary fit of the Measurement Model to the spectrum collected by the
50 µA perturbation is presented in Figure 5-2. The solid yellow circles correspond
-0.20
-0.15
-0.10
-0.05
0.00
0.05
0.10
0.15
0.20
0.1 1 10 100 1000 10000 100000
Frequency / Hz
Rea
l Res
idua
l Err
or
Figure 5-2: Normalized real residual errors from an imaginary fit of the Measure-ment Model to the 50 µA spectrum. Red lines indicate the 95.4% confidence inter-val.

91
to the normalized errors for the prediction of the real component of skin imped-
ance. The red lines represent the 95.4% confidence interval. The residual errors fell
outside the confidence interval at frequencies below 44.3 Hz and therefore, were
considered to be inconsistent with the Kramers-Kronig relations. This procedure
was repeated for each impedance spectrum collected in this investigation.
The regressions revealed that the spectra collected with current perturbation
magnitudes less than 35 µA were consistent with the Kramers-Kronig relations
over the entire frequency range. The conformity of the data implied that skin prop-
erties were not changed by the experiment. At higher current perturbation ampli-
tudes there was a critical frequency, below which data were inconsistent with the
Kramers-Kronig relations. The inconsistent data implied that skin properties had
changed. The measuring frequencies at which skin properties began to change for
each current perturbation amplitude are listed in Table 5-1.
Table 5-1: Minimum frequencies and associated membrane potential differencesfor Kramers-Kronig consistent portions of skin impedance spectra.
Current Perturbation Amplitude / µAParameter 10 100 75 50 25 30 35 30Low Freq.
Cut-off / Hz 0.1 2056 249 44.3 0.1 0.116 0.37 0.1Potential atCut-off / V ± 0.32 ± 0.65 ± 1.32 ± 1.25 ± 0.69 ± 0.84 ± 0.94 ± 0.86
5.1.2 Proposed Driving Force for Skin Property Changes
It has been reported in the literature that skin properties begin to change when
the potential difference across the membrane exceeds a critical value.3 Galvanos-
tatic or square wave current control was applied in those studies. The literature
results were used to formulate a working hypothesis that the changes in mem-
brane properties observed in the preliminary impedance spectroscopy study were
caused by large potential differences across the skin.
92
Skin impedance experiments employing the traditional constant-amplitude gal-
vanostatic modulation method maintain the current perturbation amplitude at a
constant value over the entire frequency-range. As the experiment progresses
from high-frequency to low-frequency the impedance of skin typically increases
in magnitude from approximately 50 Ωcm2 to as high as 250 kΩcm2. Since a
uniform current perturbation amplitude is used throughout the experiment, the
largest potential drop across the membrane will be observed in the low-frequency
portion of the impedance spectrum. Since the current perturbation is maintained
at a uniform amplitude, deviations from linearity in the low-frequency imped-
ance response of skin would be consistent with the concept of potential as being
the cause of changes to the epidermis.
The voltage difference for the experiments presented in Section 5.1 was calcu-
lated according to Ohm’s law by multiplying the current modulation amplitude by
the complex impedance at each frequency. The potential difference across skin at
the threshold frequencies for which property changes were observed is presented
in Table 5-1. The results indicate that skin properties were constant for potential
drops less than approximately 800 mV.
The frequency-dependent potential drop across the epidermis associated with
the impedance data displayed in Figure 5-1 is presented in Figure 5-3. The po-
tential difference across the skin in response to the 100 µA perturbation increased
continuously as the experiment progressed from high-frequency to low-frequency
until a maximum value of 2.23 V was observed at 24 Hz. For frequencies be-
low this maximum, the potential difference decreased for the remainder of the
impedance scan. A similar trend was observed for the 75 µA scan, however, the
maximum potential difference of 1.77 V occurred at 11.5 Hz. A maximum poten-
tial difference of 1.27 V was observed for the 50 µA perturbation at 3.65 Hz. The
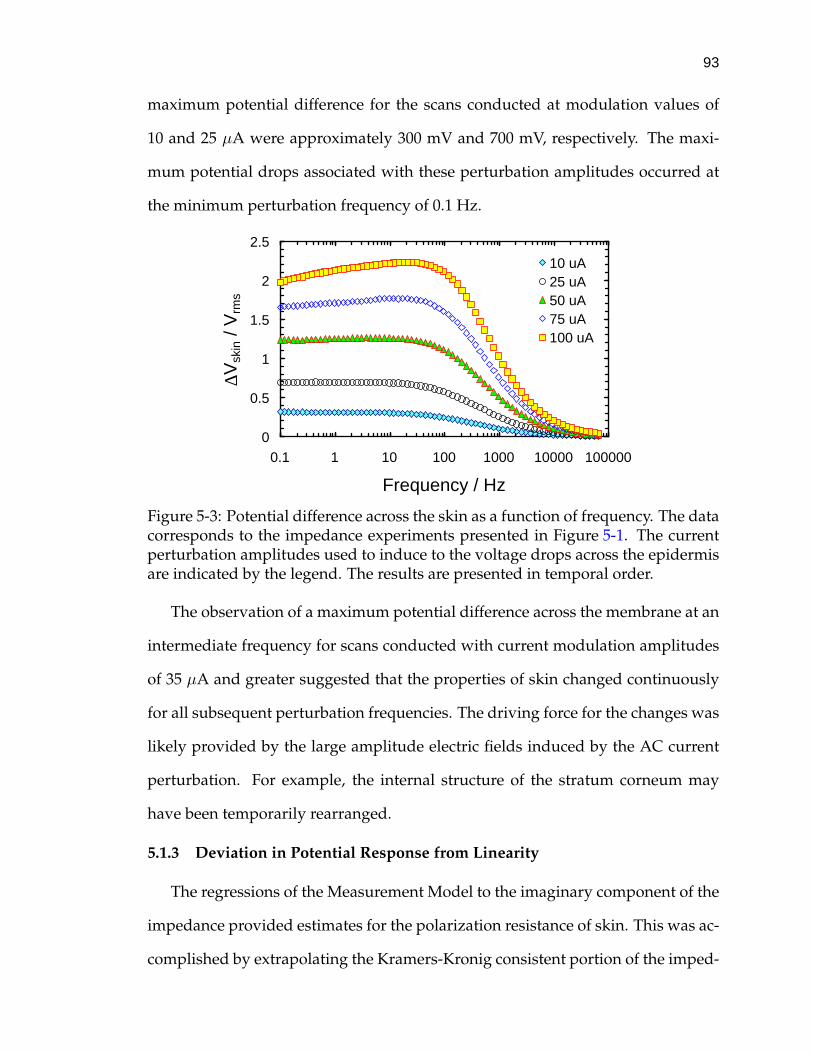
93
maximum potential difference for the scans conducted at modulation values of
10 and 25 µA were approximately 300 mV and 700 mV, respectively. The maxi-
mum potential drops associated with these perturbation amplitudes occurred at
the minimum perturbation frequency of 0.1 Hz.
0
0.5
1
1.5
2
2.5
0.1 1 10 100 1000 10000 100000
Frequency / Hz
∆V
skin /
Vrm
s
10 uA25 uA50 uA75 uA100 uA
Figure 5-3: Potential difference across the skin as a function of frequency. The datacorresponds to the impedance experiments presented in Figure 5-1. The currentperturbation amplitudes used to induce to the voltage drops across the epidermisare indicated by the legend. The results are presented in temporal order.
The observation of a maximum potential difference across the membrane at an
intermediate frequency for scans conducted with current modulation amplitudes
of 35 µA and greater suggested that the properties of skin changed continuously
for all subsequent perturbation frequencies. The driving force for the changes was
likely provided by the large amplitude electric fields induced by the AC current
perturbation. For example, the internal structure of the stratum corneum may
have been temporarily rearranged.
5.1.3 Deviation in Potential Response from Linearity
The regressions of the Measurement Model to the imaginary component of the
impedance provided estimates for the polarization resistance of skin. This was ac-
complished by extrapolating the Kramers-Kronig consistent portion of the imped-
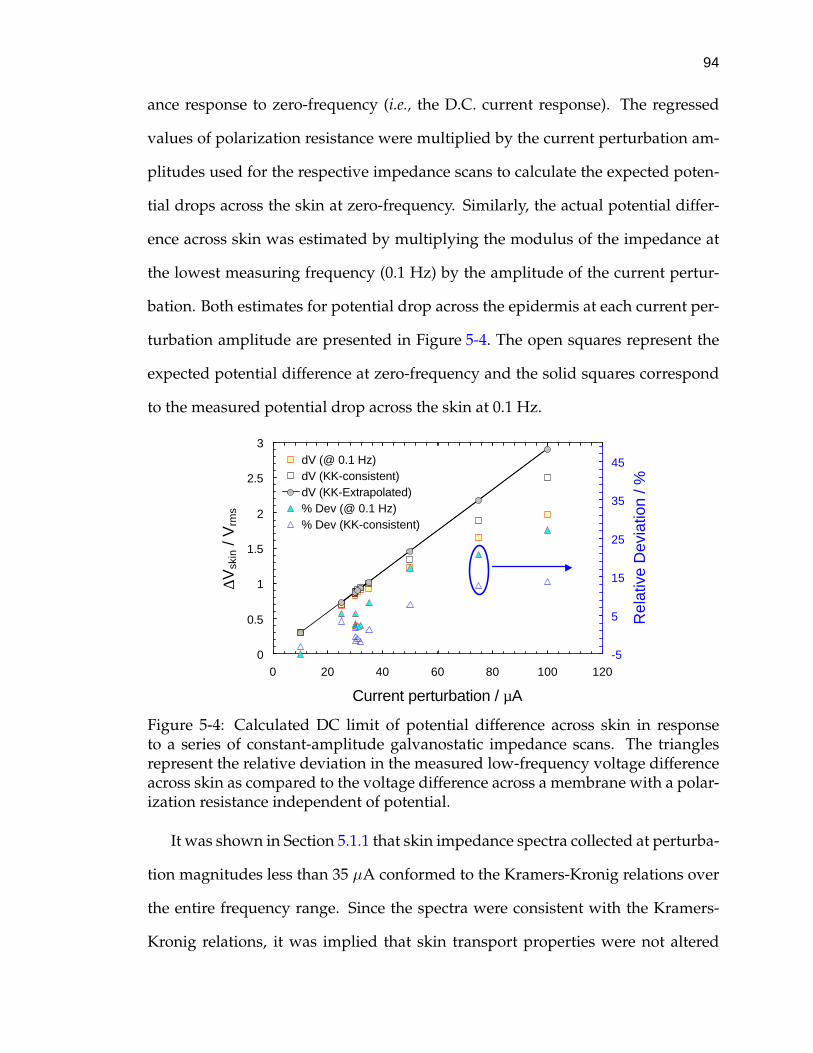
94
ance response to zero-frequency (i.e., the D.C. current response). The regressed
values of polarization resistance were multiplied by the current perturbation am-
plitudes used for the respective impedance scans to calculate the expected poten-
tial drops across the skin at zero-frequency. Similarly, the actual potential differ-
ence across skin was estimated by multiplying the modulus of the impedance at
the lowest measuring frequency (0.1 Hz) by the amplitude of the current pertur-
bation. Both estimates for potential drop across the epidermis at each current per-
turbation amplitude are presented in Figure 5-4. The open squares represent the
expected potential difference at zero-frequency and the solid squares correspond
to the measured potential drop across the skin at 0.1 Hz.
0
0.5
1
1.5
2
2.5
3
0 20 40 60 80 100 120
Current perturbation / µA
∆Vsk
in /
Vrm
s
-5
5
15
25
35
45
Rel
ativ
e D
evia
tion
/ %
dV (@ 0.1 Hz)dV (KK-consistent)dV (KK-Extrapolated)% Dev (@ 0.1 Hz)% Dev (KK-consistent)
Figure 5-4: Calculated DC limit of potential difference across skin in responseto a series of constant-amplitude galvanostatic impedance scans. The trianglesrepresent the relative deviation in the measured low-frequency voltage differenceacross skin as compared to the voltage difference across a membrane with a polar-ization resistance independent of potential.
It was shown in Section 5.1.1 that skin impedance spectra collected at perturba-
tion magnitudes less than 35 µA conformed to the Kramers-Kronig relations over
the entire frequency range. Since the spectra were consistent with the Kramers-
Kronig relations, it was implied that skin transport properties were not altered

95
by the impedance experiments. The extrapolated polarization resistance values
associated with the Kramers-Kronig consistent spectra collected with current per-
turbations less than 35 µA were used to calculate the expected potential response
of a membrane with constant electrical properties to current perturbation ampli-
tudes greater than 35 µA.
The approach was to plot the estimated potential differences from the imped-
ance experiments with perturbation magnitudes less than 35 µA as a function of
current. A linear model was regressed to the data set. The slope and intercept
calculated from the regression were 2.7x10³Ω and 3.97 V, respectively. The r2 cor-
relation parameter for the regression was 0.966 indicating that the data set was
reasonably described by a linear model. The linear model for the expected poten-
tial difference across skin as a function of current is presented by the solid black
line in Figure 5-4.
The potential difference across skin calculated from the linear model at each
perturbation amplitude was selected as a reference for comparison with the cal-
culated potential difference from the impedance experiments. The deviation of
skin impedance from linearity was calculated by subtracting the measured poten-
tial difference across skin from the potential difference obtained from the linear
model according to
Relative error ∆Vskin =∆Vcalculated − ∆Vmodel
∆Vcalculatedx100% (5-3)
where ∆Vcalculated is voltage difference across skin calculated from the impedance
at 0.1 Hz or the extrapolated polarization resistance and ∆Vmodel is the voltage
difference across skin predicted by the linear model. The difference in voltage
quantities at each perturbation current represented the deviation in the measured
voltage response from the response expected from skin with constant properties.

96
The relative deviations in the potential drops across the epidermal membrane
are also presented as a function of the current perturbation magnitude in Figure 5-4.
The filled triangles represent the percent relative deviation in the potential re-
sponse at 0.1 Hz to the expected response of skin with properties independent
of potential. The open triangles correspond to the relative percent difference in
the potential response estimated by the Kramers-Kronig consistent polarization
impedance obtained from regression of the Measurement Model to each spectrum
from constant skin properties.
The relative percent differences in the low-frequency potential responses for
the spectra collected with current perturbation amplitudes below 35 µA were all
less than 10%. The deviation in the measured potential difference from the ideal
response was proportional to the current for perturbation amplitudes greater than
35 µA. Furthermore, the relative deviations in the potential response estimated
from the impedance at 0.1 Hz were generally larger than for potential difference
calculated from the Kramers-Kronig consistent polarization resistance.
This study indicated that traditional constant-amplitude galvanostatic modu-
lation of impedance spectroscopy experiments can alter the properties of skin. A
working hypothesis was proposed that there is a critical value of potential differ-
ence across the membrane at which skin properties begin to change. An adaptive
modulation strategy was developed to maintain the potential difference across the
membrane below the critical value. The development of the adaptive modulation
protocol is discussed in the next section.
5.2 Development of VAG Modulation Technique
The preliminary constant-amplitude galvanostatic impedance studies indicated
that skin properties can change during an experiment. The changes occurred
at high current perturbation amplitudes where the induced potential differences

97
across the skin were on the order of 1 V. An adaptive modulation technique for
collecting impedance spectra was implemented to prevent the experiment from
altering skin properties. The adaptive method for collecting impedance spectra
applied variable-amplitude galvanostatic (VAG) modulation.235 The development
of the variable-amplitude galvanostatic modulation technique is described in Sec-
tion 4.1.2 and Appendix B.
Impedance experiments were conducted to verify the efficacy of the variable-
amplitude galvanostatic modulation in preventing changes to skin properties. The
approach was to collect replicate skin impedance spectra under variable-amplitude
galvanostatic and constant-amplitude modulation. Multiple perturbation ampli-
tudes were selected for each modulation technique. The spectra from the respec-
tive modulation strategies were assessed for consistency with the Kramers-Kronig
relations. The consistent portions of the spectra associated with each modulation
technique were compared to determine which approach did not alter skin proper-
ties.
The experimental approach was repeated for samples of skin immersed in
buffered solutions of CaCl2 and NaCl. The results from the impedance experi-
ments of skin in CaCl2 electrolyte are described in detail. The results from the
impedance studies of skin in NaCl are not presented as they were comparable to
the CaCl2 experiments. Minor differences in the skin impedance results for the
two electrolyte solutions are described in Section 5.2.2
The impedance spectra obtained by the two modulation techniques are pre-
sented in the impedance-plane in Figure 5-5. The shapes of the skin impedance
spectra were directly related to the modulation technique and the magnitude of
the current perturbation. For example, the spectra corresponding to the 1 µA
constant-amplitude and 10 mV VAG experiments exhibited a semicircular shape.

98
In contrast, the spectra corresponding to the 10 µA fixed-amplitude galvanos-
tatic experiments displayed a distinctive ”hook” in the low-frequency range. The
”hook” shape was similar to the skin impedance response observed in the experi-
ments discussed in Section 5.1.
-200000
-150000
-100000
-50000
00 200000 400000 600000
Zr / Ωcm2
Zj /
Ωcm
2
VAG Scan 1 VAG Scan 2 VAG Scan 3 1 uA Scan 1
1 uA Scan 2 10 uA Scan 1 10 uA Scan 2 VAG Scan 4
VAG Scan 5 VAG Scan 6 10 uA Scan 3 10 uA Scan 4
10 uA Scan 5 VAG Scan 7 VAG Scan 8 VAG Scan 9
Figure 5-5: Impedance response of skin as measured by VAG and constant-amplitude galvanostatic modulation. The skin was immersed in buffered CaCl2
electrolyte.
The spectra for the first series of 10 mV VAG experiments, denoted by the solid
diamonds in Figure 5-5, displayed the highest impedance values. The frequency-
dependent impedance responses of the three spectra obtained by VAG modulation
were approximately uniform. Spectra collected with a 1 µA constant-amplitude
current perturbation are indicated by the cross marks in Figure 5-5. The imped-
ance response of skin at the 1 µA perturbation amplitude was similar to the spectra
collected by 10 mV VAG modulation.
The results from the 10 µA constant-amplitude impedance experiments are
shown by the solid triangles in Figure 5-5. As the constant-amplitude current
perturbation was increased from 1 µA to 10 µA, the impedance decreased dramat-
ically in the low-frequency portion of the spectra. The decrease in skin impedance

99
was characterized by the ”hook” shape of the low-frequency portion of the 10 µA
spectra. Spectra from subsequent constant-amplitude 10 µA showed a continuous
decrease in impedance from experiment to experiment. The decrease in imped-
ance from scan to scan suggested that skin properties had been changed.
The recovery of skin to the 10 µA perturbations was monitored by collecting
three 10 mV VAG impedance spectra which are indicated by the curves with filled
squares in Figure 5-5. As the modulation technique was switched from 10 µA
constant-amplitude galvanostatic control to 10 mV VAG control, the shape of the
impedance spectra changed from a ”hook” back to a semi-circle. Subsequent 10
mV VAG scans demonstrated a continuous increase in skin impedance for a given
frequency. The increase in skin impedance, as measured by the three 10 mV VAG
scans, suggested that the membrane properties had recovered. However, the re-
covery toward the impedance response measured from the first 10 mV VAG scan
was incomplete over the course of the experiment.
A quantitative assessment of the relative recovery of skin properties was made
by comparing the calculated polarization resistance of each spectra to the polar-
ization impedance associated with the first 10 mV VAG scan. This spectrum was
used as the reference response because the largest magnitudes of skin impedance
were observed for this data set. The recovery of the impedance response following
the first group of 10 µA constant-amplitude galvanostatic scans, as measured by a
10 mV VAG technique, was 85%, 89% and 91%, respectively.
The spectra from the second set of 10 µA constant-amplitude galvanostati-
cally modulated experiments is presented by the solid circles in Figure 5-5. Upon
changing modulation technique back to 10 µA constant-amplitude galvanostatic
control, the impedance response once again exhibited a ”hook” in the low-frequency
region. Successive replicates collected by 10 µA constant-amplitude galvanostatic

100
modulation decreased continuously in the low-frequency portions of the spectra.
The low-frequency impedance of skin corresponding to the second set of 10 µA
constant-amplitude galvanostatic scans was less than the response associated with
the first set of 10 µA constant-amplitude galvanostatic scans.
The 10 mV VAG modulated impedance scans collected after the second set
of constant-amplitude galvanostatic impedance spectra indicated skin impedance
had partially recovered. The relative recovery in the low-frequency region of the
impedance spectra was 77%, 80% and 83%, respectively. The analysis described
here strongly suggested that skin properties were altered by the 10 µA constant-
amplitude galvanostatically modulated impedance experiments.
An interesting result of this study, was that the changes in skin properties oc-
curred at lower perturbation amplitudes than the experiments described in Section 5.1.
The difference can be explained by the higher impedance response of the skin sam-
ple used for this investigation. For a given current perturbation amplitude, the
potential difference across the high impedance skin was higher than for the low
impedance skin studied in Section 5.1. This observation was consistent with the
hypothesis that skin properties begin to change above a critical potential.
Rigorous support for the apparent changes in skin properties caused by the
10 µA constant-amplitude impedance experiments was provided by assessing the
spectra for consistency with the Kramers-Kronig relations. The spectra from the
10 mV VAG modulated experiments were also evaluated for consistency with the
Kramers-Kronig relations to determine whether the adaptive modulation tech-
nique measured skin properties in a noninvasive manner.
5.2.1 Kramers-Kronig Consistency Check of Impedance Spectra
The Measurement Model approach developed by Agarwal et al.237−239 was ap-
plied to check impedance spectra for consistency with the Kramers-Kronig rela-

101
tions. The Kramers-Kronig relations must be satisfied for spectra that are linear,
causal, stationary, and stable. Data that conforms to the Kramers-Kronig relations
is consistent with a system with constant properties. In contrast, data that does
not satisfy the Kramers-Kronig relations indicates that the system has changed.
The Measurement Model was regressed to the complex impedance of the spec-
tra obtained by the constant-amplitude and variable-amplitude galvanostatic mod-
ulation techniques. Since replicate impedance spectra were collected for each ex-
perimental protocol the frequency-dependent error structures were determined.
Subsequent regressions of the Measurement Model to the data set was weighted
according to the error structure of the measurement. For example, data with large
standard deviation values are weighted less than data with small standard devi-
ations. Error structure weighting generally enhances the amount of information
which can be extracted from the data. The error structure was calculated for each
set of experimental conditions. The parameter values corresponding to the error
structure model shown in Equation (4-15) are presented in Table 5-2.
Table 5-2: Error structure parameters of skin impedance spectra. Skin sample wasimmersed in CaCl2 solution and parameters are listed in temporal order of exper-iments.
Modulation Method Error Structure10 mV VAG α=1.48x10⁻³ ± 1.28x10⁻⁵; β=4.36x10⁻³ ± 6.23x10⁻⁶
1 µA Galv. α=1.81x10⁻³ ± 6.89x10⁻⁵; γ=1.72x10⁻⁴ ± 5.51x10⁻⁶
∆ = 7.07x10⁻¹ ±3.32x10⁻⁴
10 µA Galv. β =3.98x10⁻³ ± 4.41x10⁻⁵; γ=2.91x10⁻⁴ ± 1.42x10⁻⁵
10 mV VAG α=1.55x10⁻³ ± 7.68x10⁻⁵; γ=3.98x10⁻⁴ ± 2.00x10⁻⁵
10 µA Galv. α=1.84x10⁻³ ± 3.51x10⁻⁵; β=1.84x10⁻³ ± 1.55x10⁻⁵
10 mV VAG α=5.42x10⁻⁴ ± 2.47x10⁻⁵; β=4.04x10⁻³ ± 1.08x10⁻⁵
After the error structure was determined, the Measurement Model was re-
gressed to the spectra to filter out Kramers-Kronig inconsistent data. The regres-
sions were weighted according to the error structure. The first step was to per-
form a real fit to the data and predict the imaginary part. Data located outside
102
the confidence interval at high frequencies was considered to be inconsistent with
the Kramers-Kronig relations. The inconsistent high-frequency data points were
omitted from subsequent regressions. Low-frequency data corresponding to the
real component of the impedance located outside of the confidence interval was
considered not to satisfy Kramers-Kronig relations. The analysis of the spectra
obtained from each modulation technique is discussed separately below.
KK consistency check for 10 mV VAG spectra. The normalized real residual
errors for a fit of the Measurement Model to the real part of the impedance data
are presented in Figure 5.6(a). The real residual errors are indicated by the solid
circles and the noise level of the measurement is illustrated by the dashed green
lines. The real residual errors were generally on the order of 1% and were mostly
within the noise level of the measurement. As the residual errors were small and
randomly distributed about 0, it was concluded that a good fit of the model to the
data had been obtained.
The normalized residual errors from the prediction of the imaginary part of
the impedance are presented in Figure 5.6(b). The solid triangles correspond to
the imaginary residual errors and the dashed red lines correspond to the 95.4%
conference interval. The residual errors were less than 5% of the measurement
value and were contained within the 95.4% confidence interval at high-frequency.
Therefore, the entire data set was included for the imaginary fit. The solution
resistance calculated from the real fit was set to a constant value for the imaginary
fit. The same procedure for eliminating inconsistent high-frequency data was ap-
plied to the other skin impedance spectra described in this work.
The normalized residual fitting errors corresponding to the regression of the
Measurement Model to the imaginary component of skin impedance are displayed
in Figure 5.7(a). The imaginary residual errors were all less than 5% of the mea-
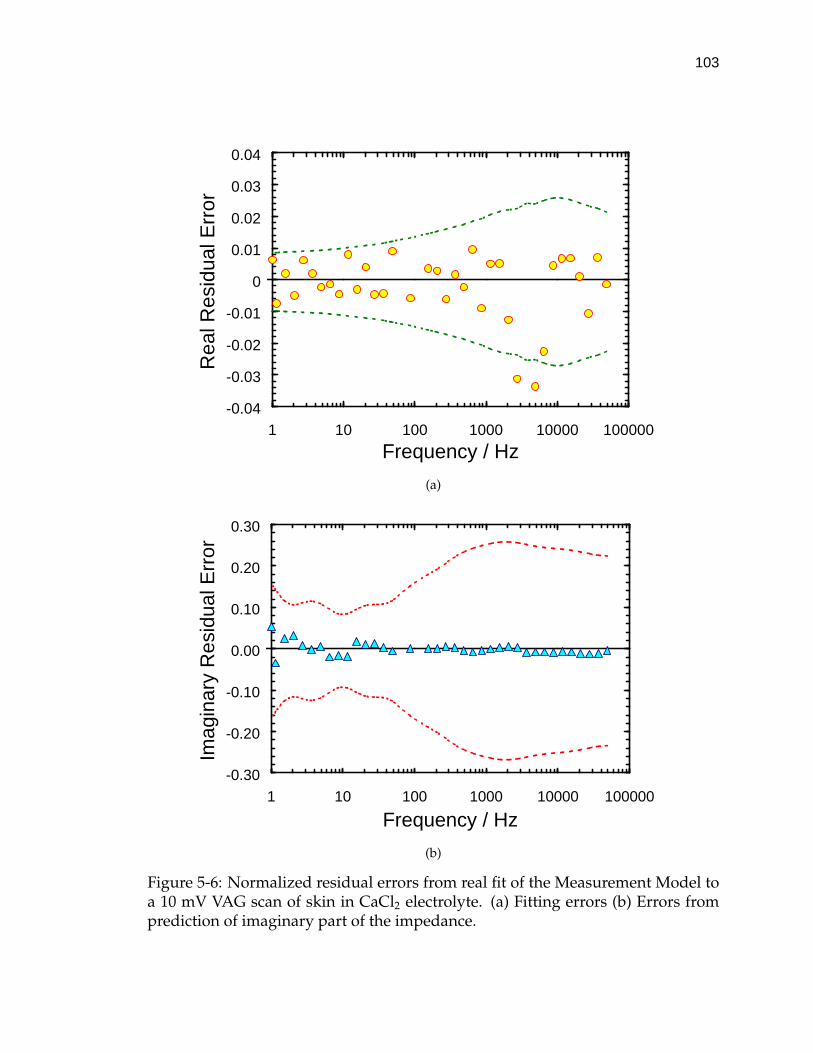
103
-0.04
-0.03
-0.02
-0.01
0
0.01
0.02
0.03
0.04
1 10 100 1000 10000 100000
Frequency / Hz
Rea
l Res
idua
l Err
or
(a)
-0.30
-0.20
-0.10
0.00
0.10
0.20
0.30
1 10 100 1000 10000 100000
Frequency / Hz
Imag
inar
y R
esid
ual E
rror
(b)
Figure 5-6: Normalized residual errors from real fit of the Measurement Model toa 10 mV VAG scan of skin in CaCl2 electrolyte. (a) Fitting errors (b) Errors fromprediction of imaginary part of the impedance.

104
surement values, randomly distributed and completely contained within the noise
level of the measurement. These results indicated that the Measurement Model
provided a good fit to the skin impedance data.
The prediction of the real part of the impedance from the fit to the imagi-
nary component of impedance is illustrated in Figure 5.7(b). The normalized real
residual errors were all contained within the 95.4% confidence interval. This ob-
servation led to the conclusion that the entire spectrum was consistent with the
Kramers-Kronig relations. Consistency with the Kramers-Kronig relations was
observed for all impedance spectra collected by the 10 mV VAG modulation tech-
nique.
Although not presented here, the impedance spectra collected by 1 µA constant-
amplitude galvanostatic modulation were also consistent with the Kramers-Kronig
relations over the entire frequency range. The consistency of impedance spectra
collected at the 1 µA perturbation amplitude indicated that the properties of skin
were not altered by the measurement technique. An important aspect of these
experiments was that the potential difference across the skin was not larger than
0.55 V. The transdermal voltage drops associated with the 1 µA spectra are signifi-
cantly smaller than for the 10 µA constant-amplitude galvanostatically modulated
spectra discussed in the next section.
KK consistency check for 10 µA constant-amplitude galvanostatic spectra.
The procedure for identifying data that is not consistent with the Kramers-Kronig
relations described in Section 5.2.1 was applied here. The normalized real residual
errors for a fit to the real part of the data are presented in Figure 5.8(a). The resid-
ual errors demonstrated significant trending and were on the order of 10% of the
measurement. Furthermore, many of the residual errors were located outside the
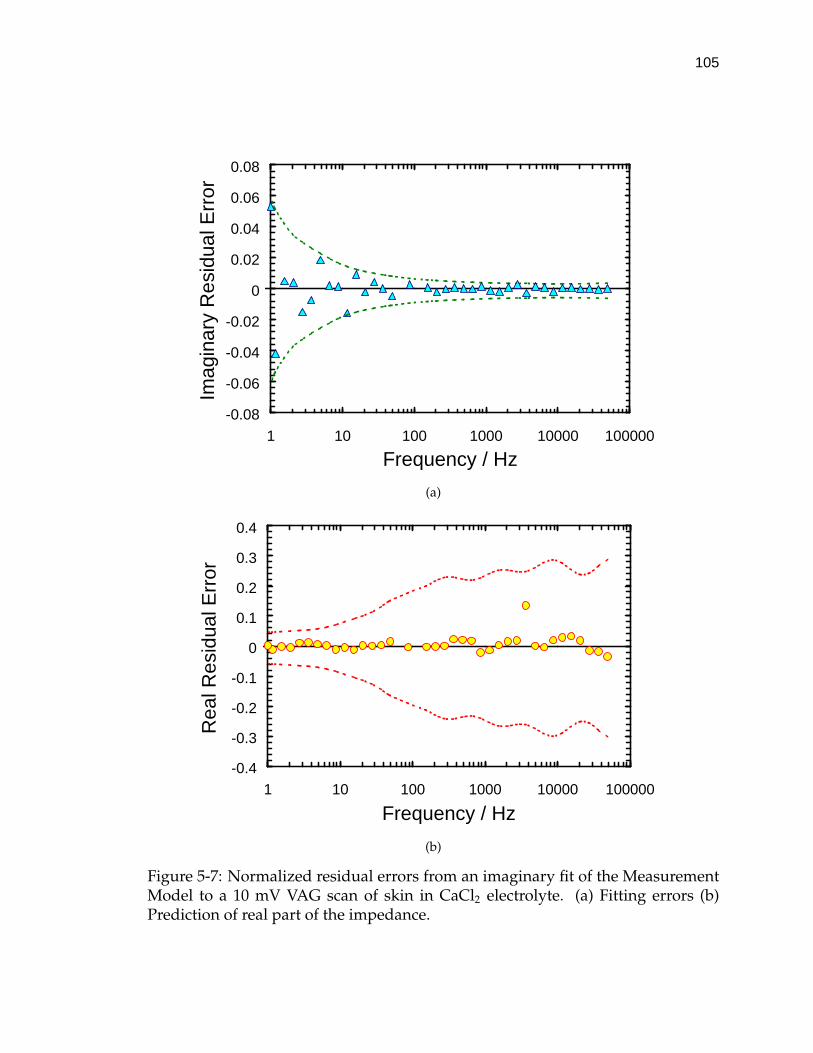
105
-0.08
-0.06
-0.04
-0.02
0
0.02
0.04
0.06
0.08
1 10 100 1000 10000 100000
Frequency / Hz
Imag
inar
y R
esid
ual E
rror
(a)
-0.4
-0.3
-0.2
-0.1
0
0.1
0.2
0.3
0.4
1 10 100 1000 10000 100000
Frequency / Hz
Rea
l Res
idua
l Err
or
(b)
Figure 5-7: Normalized residual errors from an imaginary fit of the MeasurementModel to a 10 mV VAG scan of skin in CaCl2 electrolyte. (a) Fitting errors (b)Prediction of real part of the impedance.

106
noise level of the measurement. The distribution characteristics of the real residual
errors were consistent with a poor fit.
The residual errors associated with the prediction of the imaginary part of the
impedance are shown in Figure 5.8(b). The imaginary residual errors were approx-
imately equal to 10 percent of the impedance at frequencies greater than 100 Hz.
The residuals associated with frequencies below 100 Hz were as large as 200% of
the measurement value. The skin impedance data collected at frequencies above
10 kHz fell within the 95.4% confidence interval. Despite the relatively poor qual-
ity of this fit, the entire spectrum was included for the fit of the measurement
model to the imaginary part of the impedance.
The normalized residual errors for the fit of the Measurement Model to the
imaginary part of the impedance are presented in Figure 5.9(a). All of the resid-
ual errors fell within the noise level of the measurement and were approximately
equal to 1% of the measurement. The residuals from the prediction of the real
part of the impedance are presented in Figure 5.9(b). The real residual errors for
frequencies less than 100 Hz were located outside the confidence interval. Further-
more, the magnitude of the residual errors increased with decreasing frequency.
Therefore, the impedance data collected at frequencies below 100 Hz were consid-
ered to be inconsistent with the Kramers-Kronig relations.
The inconsistent data points were obtained when the potential variation across
the skin exceeded 1.06 V which corresponded to the measurement at 100 Hz. Dur-
ing the impedance experiment, the potential difference across the membrane con-
tinued to increase until 5 Hz where a maximum of approximately 4.97 V was ob-
served. The range of potential for which changes in membrane properties were
observed was consistent with the reported threshold of voltage for skin changes
of 0.1 to 2 V.3
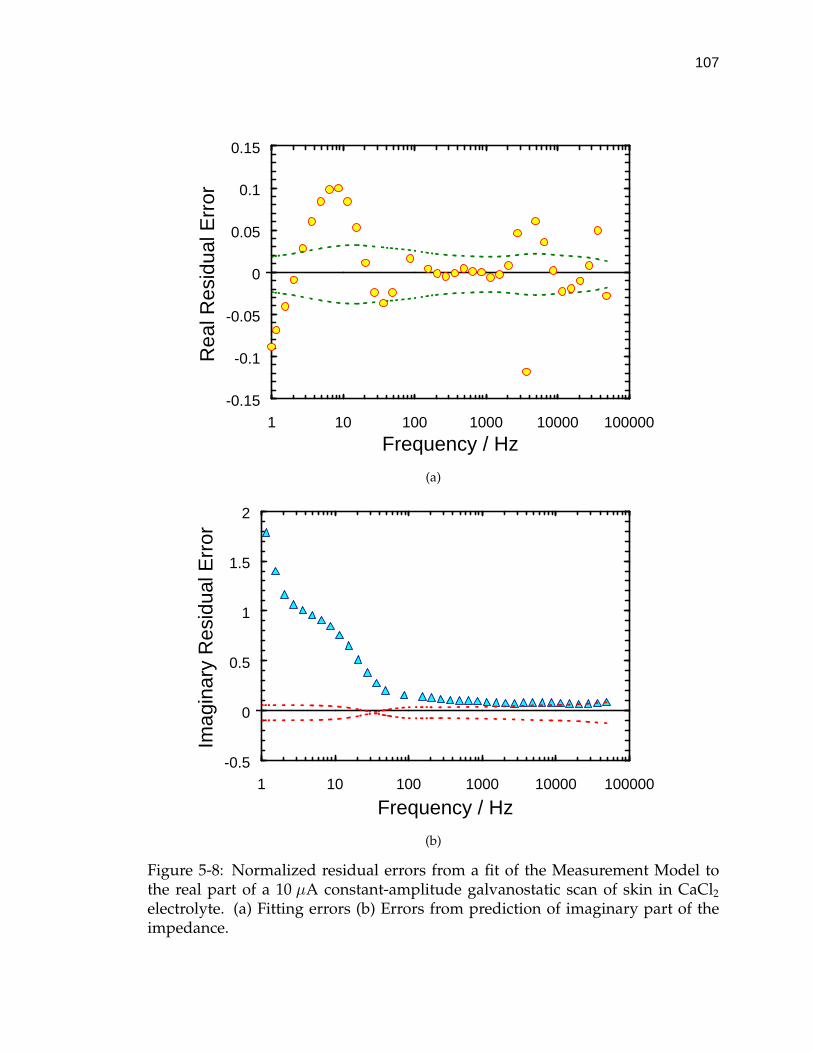
107
-0.15
-0.1
-0.05
0
0.05
0.1
0.15
1 10 100 1000 10000 100000
Frequency / Hz
Rea
l Res
idua
l Err
or
(a)
-0.5
0
0.5
1
1.5
2
1 10 100 1000 10000 100000
Frequency / Hz
Imag
inar
y R
esid
ual E
rror
(b)
Figure 5-8: Normalized residual errors from a fit of the Measurement Model tothe real part of a 10 µA constant-amplitude galvanostatic scan of skin in CaCl2
electrolyte. (a) Fitting errors (b) Errors from prediction of imaginary part of theimpedance.
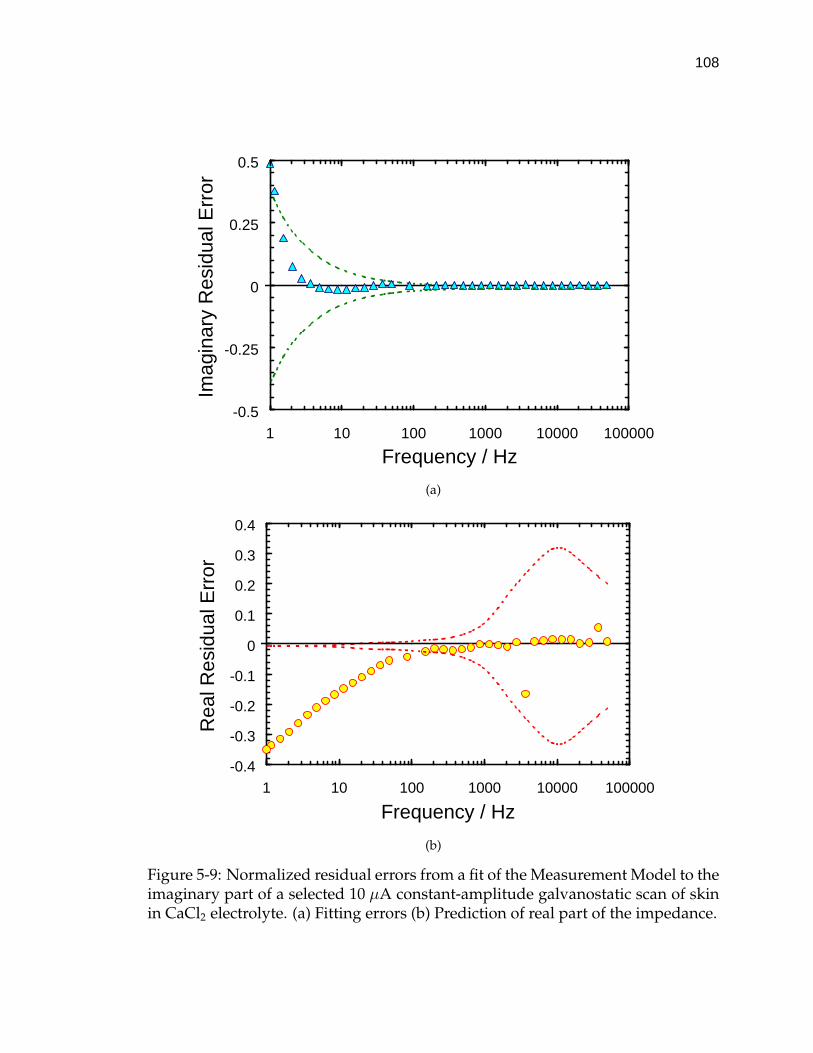
108
-0.5
-0.25
0
0.25
0.5
1 10 100 1000 10000 100000
Frequency / Hz
Imag
inar
y R
esid
ual E
rror
(a)
-0.4
-0.3
-0.2
-0.1
0
0.1
0.2
0.3
0.4
1 10 100 1000 10000 100000
Frequency / Hz
Rea
l Res
idua
l Err
or
(b)
Figure 5-9: Normalized residual errors from a fit of the Measurement Model to theimaginary part of a selected 10 µA constant-amplitude galvanostatic scan of skinin CaCl2 electrolyte. (a) Fitting errors (b) Prediction of real part of the impedance.
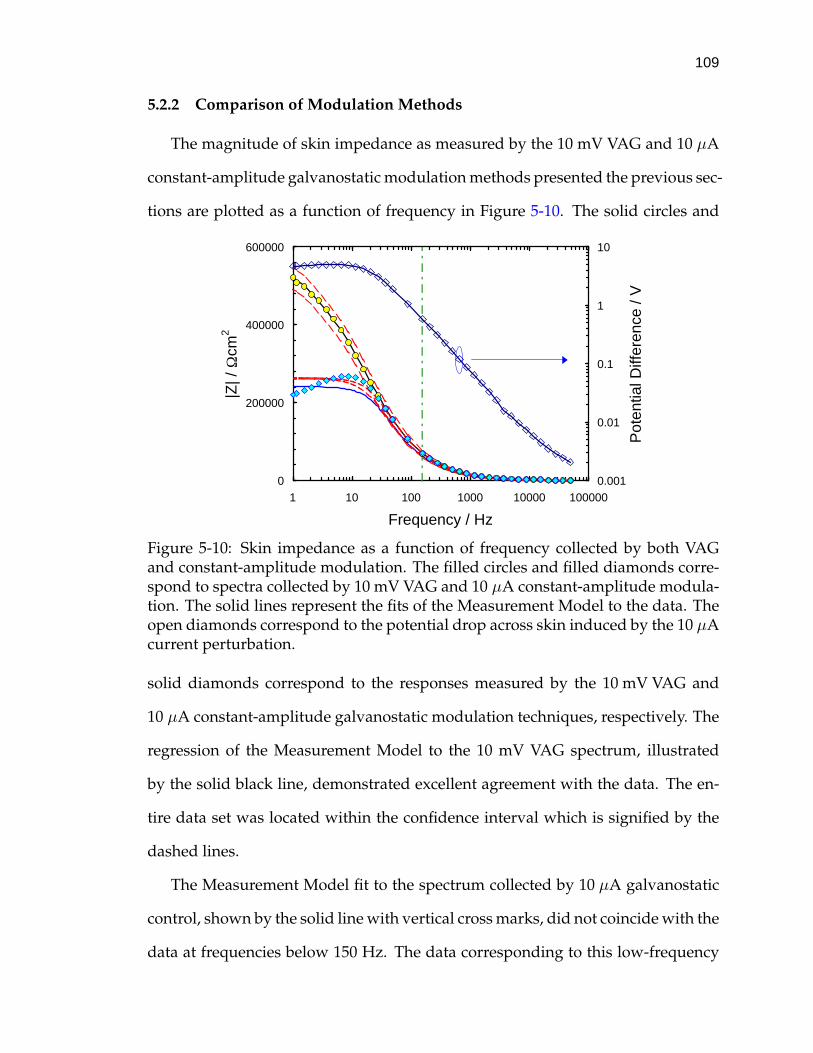
109
5.2.2 Comparison of Modulation Methods
The magnitude of skin impedance as measured by the 10 mV VAG and 10 µA
constant-amplitude galvanostatic modulation methods presented the previous sec-
tions are plotted as a function of frequency in Figure 5-10. The solid circles and
0
200000
400000
600000
1 10 100 1000 10000 100000
Frequency / Hz
|Z| /
Ωcm
2
0.001
0.01
0.1
1
10
Pot
entia
l Diff
eren
ce /
V
Figure 5-10: Skin impedance as a function of frequency collected by both VAGand constant-amplitude modulation. The filled circles and filled diamonds corre-spond to spectra collected by 10 mV VAG and 10 µA constant-amplitude modula-tion. The solid lines represent the fits of the Measurement Model to the data. Theopen diamonds correspond to the potential drop across skin induced by the 10 µAcurrent perturbation.
solid diamonds correspond to the responses measured by the 10 mV VAG and
10 µA constant-amplitude galvanostatic modulation techniques, respectively. The
regression of the Measurement Model to the 10 mV VAG spectrum, illustrated
by the solid black line, demonstrated excellent agreement with the data. The en-
tire data set was located within the confidence interval which is signified by the
dashed lines.
The Measurement Model fit to the spectrum collected by 10 µA galvanostatic
control, shown by the solid line with vertical cross marks, did not coincide with the
data at frequencies below 150 Hz. The data corresponding to this low-frequency
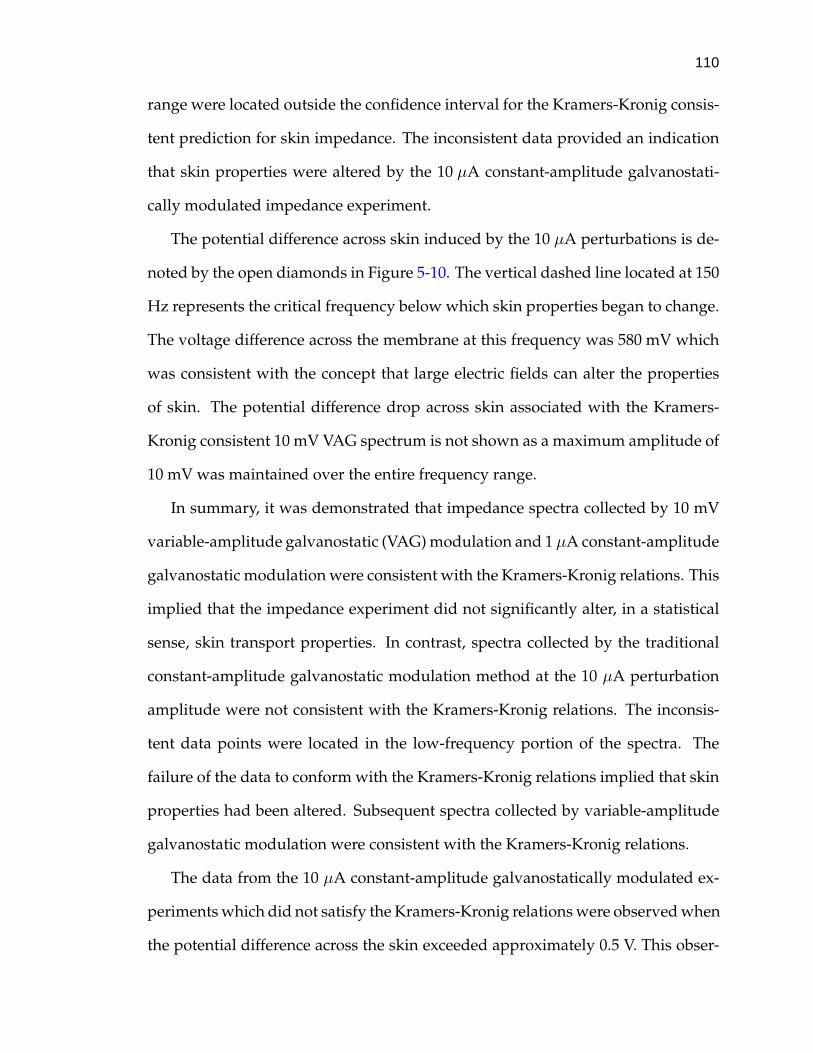
110
range were located outside the confidence interval for the Kramers-Kronig consis-
tent prediction for skin impedance. The inconsistent data provided an indication
that skin properties were altered by the 10 µA constant-amplitude galvanostati-
cally modulated impedance experiment.
The potential difference across skin induced by the 10 µA perturbations is de-
noted by the open diamonds in Figure 5-10. The vertical dashed line located at 150
Hz represents the critical frequency below which skin properties began to change.
The voltage difference across the membrane at this frequency was 580 mV which
was consistent with the concept that large electric fields can alter the properties
of skin. The potential difference drop across skin associated with the Kramers-
Kronig consistent 10 mV VAG spectrum is not shown as a maximum amplitude of
10 mV was maintained over the entire frequency range.
In summary, it was demonstrated that impedance spectra collected by 10 mV
variable-amplitude galvanostatic (VAG) modulation and 1 µA constant-amplitude
galvanostatic modulation were consistent with the Kramers-Kronig relations. This
implied that the impedance experiment did not significantly alter, in a statistical
sense, skin transport properties. In contrast, spectra collected by the traditional
constant-amplitude galvanostatic modulation method at the 10 µA perturbation
amplitude were not consistent with the Kramers-Kronig relations. The inconsis-
tent data points were located in the low-frequency portion of the spectra. The
failure of the data to conform with the Kramers-Kronig relations implied that skin
properties had been altered. Subsequent spectra collected by variable-amplitude
galvanostatic modulation were consistent with the Kramers-Kronig relations.
The data from the 10 µA constant-amplitude galvanostatically modulated ex-
periments which did not satisfy the Kramers-Kronig relations were observed when
the potential difference across the skin exceeded approximately 0.5 V. This obser-

111
vation was consistent with the concept that the properties of skin begin to change
above a critical potential. The range of potential for which skin changes were de-
tected in this study was in agreement with the potential and current step-change
experiments discussed in Section 8.1 of this report.
Although the impedance spectra from the 10 µA constant-amplitude galvano-
static scans did not conform to the Kramers-Kronig relations for the skin samples
immersed in NaCl and CaCl2 electrolytes, differences were noted in the recovery
of epidermal properties following the large current perturbation experiments. For
example, impedance spectra collected by 10 mV variable-amplitude galvanostatic
modulation following the 10 µA experiments indicated that the skin impedance
recovered ∼ 66% in NaCl electrolyte and ∼ 80% in CaCl2 electrolyte. The differ-
ence in the recovery of skin impedance to the 10 µA perturbations suggested that
divalent cations can reduce the effect of large electric fields on epidermal transport
properties. The improved recovery of skin in CaCl2 electrolyte as opposed to NaCl
electrolyte has also been reported in the literature.152
5.3 Comparison of Experiments with Literature Results
The majority of skin impedance spectra described in the literature were col-
lected by either constant-amplitude potentiostatic133, 205, 211 or constant-amplitude
galvanostatic modulation.150, 152, 151, 207 Impedance data obtained with these modu-
lation methods may be corrupted by nonlinear or nonstationary phenomena. For
example, transient processes, such as skin hydration (see, for example, Section
6.2), can cause the open-circuit potential across the membrane to change. In gen-
eral, potentiostatic impedance experiments are conducted by modulating a sinu-
soidal constant-amplitude voltage perturbation about the open-circuit potential
measured at the beginning of the experiment. Therefore, changes in the open-
112
circuit potential that occur within the time required to complete a perturbation
cycle can introduce artifacts in the impedance measurements.
Many researchers have adopted the constant-amplitude galvanostatic modu-
lation technique to mitigate the influence of changes in the open-circuit potential
on skin impedance measurements.151, 152 Theoretically, the net current across a sys-
tem will be zero at the open-circuit condition. By modulating the sinusoidal cur-
rent perturbation about a 0 µA/cm2 DC current bias, the open-circuit potential is
maintained over the course of the impedance experiment. Despite this attractive
feature, the regulation of skin impedance experiments by the constant-amplitude
galvanostatic method can be problematic. For example, the constant-amplitude
current perturbation can cause the voltage difference across skin to surpass 1 V.
The literature indicates that skin properties begin to change when the potential
across the membrane exceeds 0.1-2 V.3
Kalia et al. developed a modulation technique to reduce the impact of the
impedance experiment on skin transport properties.152 A 2 MΩ resistor was placed
in series with the skin. In this configuration, the 1 V sinusoidal potential per-
turbation used to probe the system produced a 0.25 µA (80 nA/cm2) constant-
amplitude current signal. The approach had the advantage that the critical poten-
tial for membrane alterations could be avoided when the skin polarization resist-
ance was less than 1 MΩ/cm2. The efficacy of the impedance regulation method
for preventing changes to skin transport properties was demonstrated for in vivo
experiments.152
The development of the novel variable-amplitude galvanostatic (VAG) mod-
ulation method for skin impedance experiments was described in this chapter.
The regulation technique provided spectra that were not subjected to large poten-
tial swings across the membrane. Skin impedance spectra were collected in this
113
work by (VAG) regulation and by the traditional constant-amplitude galvanos-
tatic modulation strategy. The results were compared to assess the influence of
each modulation technique on skin properties.
The Voigt circuit measurement model was regressed to each type of spectra.
As the model was consistent with the Kramers-Kronig relations, data corrupted
by nonlinear or nonstationary behavior could be identified. Spectra collected with
the constant-amplitude galvanostatic technique did not conform to the Kramers-
Kronig relations. In contrast, spectra obtained by variable-amplitude galvano-
static modulation were consistent with the Kramers-Kronig relations which im-
plied that the skin was not altered by the experiment. By preventing large poten-
tial differences across skin, the electrical and transport properties of the membrane
were measured in a noninvasive manner.
Electrical circuit models have been used extensively in the literature to analyze
skin impedance data.133, 211−213 As described in Section 3.6.1, the general procedure
is to assign system physical properties to the individual elements of the circuit.
There are several flaws in this approach. For example, electric circuit analogs are
not unique, which can lead to multiple interpretations of skin impedance spectra.
Furthermore, the circuit elements are assumed to react linearly independent of
time and applied potential. These conditions cannot be guaranteed a priori for
human skin impedance data.
The work presented here marked the first application of electric circuit models
for determining the measurement characteristics of skin impedance data. Portions
of the spectra that were free of instrumental artifact and nonstationary behavior
were identified. The results indicated that the modulation of skin impedance ex-
periments by the novel variable-amplitude galvanostatic methodology provides
for more accurate assessment of the electrical and transport properties of skin.
CHAPTER 6RESULTS AND DISCUSSION OF SKIN IMPEDANCE STUDIES
The development of the variable-amplitude galvanostatic modulation tech-
nique for electrochemical impedance spectroscopy was described in Chapter 5.
It was demonstrated that skin impedance spectra collected by the adaptive modu-
lation strategy were consistent with the Kramers-Kronig relations. This indicated
that the macroscopic electrical and transport properties of the membrane were not
altered by the experiment. Therefore, the variable-amplitude galvanostatic mod-
ulation strategy was applied extensively in the studies discussed here.
As stated earlier, an objective of the impedance studies was to characterize in-
fluence of current and potential on skin properties. The experiments presented
here were designed to identify the impedance response of skin under open-circuit
and applied-current conditions. The open-circuit impedance studies provided in-
formation on the dynamics of skin hydration and the recovery of the skin prop-
erties after the applied current was terminated. The impedance spectra collected
under iontophoretic conditions revealed the influence of applied current on skin
properties. The results from the applied-current study are presented in Section 6.5.
Many of the impedance spectra collected in the initial studies had negative
values for the real part of the impedance at high frequencies. The high-frequency
asymptote of the real part of the impedance corresponds to the solution resistance.
The negative solution resistance measurements were thought to be an instrumen-
tal artifact. The work performed to determine the source of the high-frequency
artifact is described in Section 6.1.
114

115
The impedance experiments aimed at identifying the influence of prolonged
electrolyte exposure on skin transport properties are presented in Section 6.2. The
objective was to characterize the dynamics of skin hydration. The study provided
a baseline for evaluating changes in skin properties caused by the addition of wa-
ter into the membrane.
It has been proposed that the recovery of skin properties after large electrical
perturbations is more rapid in divalent cation solutions than in monovalent cation
solutions.152 The influence of solution composition on skin properties is described
in Section 6.3.
It was shown in Chapter 5 that large potential swings can alter skin electrical
and transport properties. The large potential drops across the skin were induced
by the constant amplitude-galvanostatic modulation technique. A supplemen-
tal impedance study using variable-amplitude galvanostatic modulation was per-
formed to confirm that skin can be altered by large potential signals. The results
from the investigation are presented in Section 6.4.
Transdermal iontophoresis was simulated during the impedance studies by
modulating the sinusoidal current perturbation about a DC current bias. The
amplitude of the direct current signals were consistent with clinical iontophoresis
systems.177, 201, 236 A discussion of this work is provided in Section 6.5.
The final study described in this chapter was designed to identify the regional
variation in the impedance response of heat-separated excised human skin. For
most of the experiments performed in this work, pieces of skin were extracted
from adjacent locations of a given donor sample. The experiments described in
Section 6.6 provide an estimate of the variation in skin properties associated with
the membranes used for this work.
116
6.1 Influence of Reference Electrode on High-Frequency Impedance Response
As mentioned earlier, the majority of skin impedance spectra collected in this
work were obtained by Variable-Amplitude Galvanostatic (VAG) modulation con-
trol. For these studies, Ag/AgCl micro-reference electrodes were used. For many
of the spectra, the real component of the impedance at high frequencies was nega-
tive. For a typical four-electrode measurement of membrane impedance, the high-
frequency asymptote of the real part of the impedance should be equal to the elec-
trolyte solution resistance.
It was hypothesized that the nonideal behavior at high-frequency was caused
by the micro-reference electrodes. For example, the small surface area of the micro-
reference electrodes may restrict the range of applied potential for which either the
ideally nonpolarizable electrode assumption or the reversible equilibrium state is
valid.137 An alternative explanation is that the negative electrolyte solution resist-
ance values were an artifact of the potentiostat or the Frequency Response An-
alyzer. Measurement or bias errors from the impedance equipment are usually
caused by limitations of the internal circuitry and are commonly observed at high
frequencies for low impedance systems.
During iontophoresis the electrical and transport properties of skin will be in-
fluenced by an applied DC current bias. Changes in skin properties will most
likely appear in the low-frequency portion of the impedance spectra. Therefore,
impedance spectra with negative high-frequency asymptotes for the real compo-
nent of the complex impedance should still contain the essential information on
skin transport properties. The main limitation posed by the apparent negative so-
lution resistance was that only one or two line shapes could be obtained from the
regression of the Measurement Model to the impedance data (see, for example,
Section 4.1.4). The small number of line shapes often resulted in large fitting er-

117
rors. The poor fitting behavior made it difficult to determine whether a particular
impedance spectra was consistent with the Kramers-Kronig relations. This lim-
ited the interpretive power of the Measurement Model technique for assessing the
influence of a given set of experimental control variables on skin properties.
The object of this study was to determine the influence of reference electrodes
on the high-frequency impedance response of skin. The approach was to collect
replicate impedance spectra under similar experimental conditions using both
Ag/AgCl micro-reference electrodes and calomel reference electrodes. Spectra
collected with the calomel electrodes were compared to the data collected with the
Ag/AgCl micro-reference electrodes. Calomel reference electrodes were selected
for the comparison as they are commonly used for electrochemical measurements
and are stable over a wide range of potentials.136
The impedance experiments were conducted under constant-amplitude gal-
vanostatic control. Perturbation amplitudes of 100 µA and 10 µA were superim-
posed about a 0 µA DC current bias to produce four sets of seven replicate scans.
The skin was soaked for 48 hours in 50 mM CaCl2 buffered electrolyte prior to
the study to allow the membrane to become fully hydrated. The same piece of
skin and same electrolytic solution were used for all experiments. A custom, two-
compartment diffusion cell was constructed from polycarbonate sheeting to ac-
commodate the larger dimensions of the calomel reference electrodes. All of the
impedance experiments were performed with the custom cell. The results from
the 10 µA experiments are not presented, as the trends were similar to the 100 µA
studies discussed below.
Selected impedance spectra collected with each type of reference electrode were
then assessed with the Kramers-Kronig relations according to methodology de-
scribed in Section 4.1.4. The entire frequency range of the spectra were checked for
118
consistency with the Kramers-Kronig relations. Inconsistency with the Kramers-
Kronig relations was assumed to be caused by instrumental artifacts.
6.1.1 Results
The impedance response of skin to the 100 µA perturbations measured by
the calomel and Ag/AgCl micro-reference electrodes are presented in impedance-
plane form by Figures 6.1(b) and 6.1(a), respectively. The high-frequency asymp-
totes of the real part of the impedance are located near the origin of the figures.
The spectra collected by the calomel reference electrodes, shown in Figure 6.1(b),
displayed positive impedance values in the high-frequency region. In contrast, the
high-frequency asymptotes of the impedance spectra collected with the Ag/AgCl
micro-reference electrodes, displayed in Figure 6.1(a), were negative.
The low-frequency impedance of this piece of skin was approximately 5 kΩcm2
regardless of the reference electrode type. The low polarization resistance values
were probably caused by prolonged exposure to water. Since the focus of the
study was to analyze the high-frequency response of the reference electrodes, the
low polarization resistance values were not considered to be prohibitive.
6.1.2 K-K Consistency Check for Calomel Electrode Data
Complex fits of the Measurement Model were performed for all of the imped-
ance spectra collected by the 100 µA galvanostatic modulation. Modulus weight-
ing was applied for the regressions. Seven line shapes were obtained for all of the
impedance spectra. In general, the line shape model showed good agreement with
the data obtained with the calomel reference electrodes. The error structure for the
measurements, as defined by Equation (4-15), was calculated. The parameters α
and δ were included in the model and were equal to 4.17x10⁻⁴ and 7.63x10⁻², re-
spectively.

119
-3000
-2000
-1000
00 2000 4000 6000
Zr / Ωcm2
Zj /
Ωcm
2
Scan 1 Scan 2 Scan 3 Scan 4 Scan 5 Scan 6 Scan 7
(a)
-3000
-2000
-1000
00 2000 4000 6000
Zr / Ωcm2
Zj /
Ωcm
2
Scan 1 Scan 2 Scan 3 Scan 4 Scan 5 Scan 6 Scan 7
(b)
Figure 6-1: Impedance-plane plots of successive 100 µA impedance scans of fullyhydrated skin. (a) Measured with Ag/AgCl micro-reference electrodes. (b) Mea-sured with calomel reference electrodes.
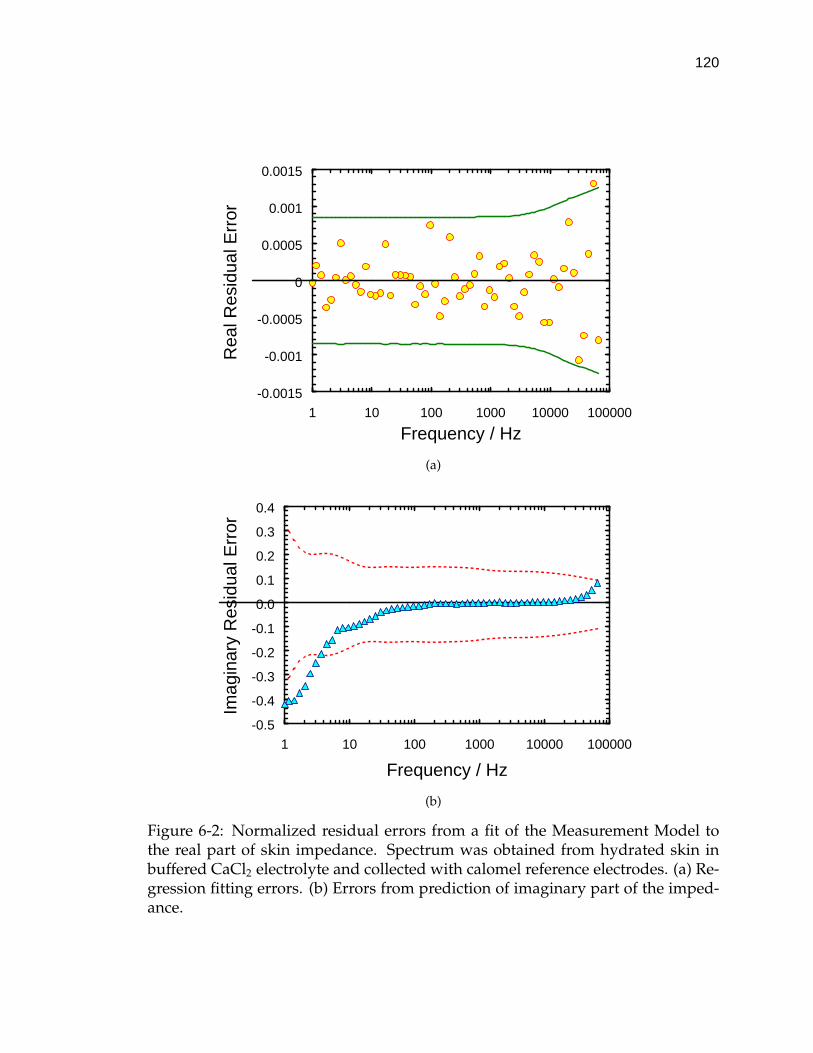
120
-0.0015
-0.001
-0.0005
0
0.0005
0.001
0.0015
1 10 100 1000 10000 100000
Frequency / Hz
Rea
l Res
idua
l Err
or
(a)
-0.5
-0.4
-0.3
-0.2
-0.1
0.0
0.1
0.2
0.3
0.4
1 10 100 1000 10000 100000
Frequency / Hz
Imag
inar
y R
esid
ual E
rror
(b)
Figure 6-2: Normalized residual errors from a fit of the Measurement Model tothe real part of skin impedance. Spectrum was obtained from hydrated skin inbuffered CaCl2 electrolyte and collected with calomel reference electrodes. (a) Re-gression fitting errors. (b) Errors from prediction of imaginary part of the imped-ance.
121
The fourth spectrum collected with the calomel reference electrodes was as-
sessed for consistency with Kramers-Kronig relations. The regressions of the Mea-
surement Model to the data were weighted by the error structure. The fit to the
real part of the complex impedance yielded 8 line shapes. The normalized residual
fitting errors from the regression are displayed in Figure 6.2(a). The solid circles
and solid lines correspond to the fitting errors and the noise level of the measure-
ment, respectively. The residual errors were generally less than 1% of the real part
of the impedance and fell within the noise level of the measurement. In addition,
the residual errors were normally distributed about the x-axis. The relatively small
magnitude and normal distribution of the residual errors indicated a good fit of
the model to the data.
The residual errors for the prediction of the imaginary component of the imped-
ance are presented in Figure 6.2(b). The residual errors correspond to the solid
triangles and the 95.4% confidence interval is shown by the dashed lines. The er-
rors were on the order of 10% of the measured impedance for frequencies above
10 Hz. The normalized residual errors for frequencies above 5 Hz were within
the confidence interval indicating that the high-frequency data conformed to the
Kramers-Kronig relations.
The Measurement Model was regressed to the imaginary component of the
impedance. The objective was to determine whether the low-frequency portion of
the spectrum also satisfied the Kramers-Kronig relations. Eight line shapes were
obtained from the imaginary fit. The normalized fitting errors are presented in
Figure 6.3(a). The noise level for the measurement is indicated by the solid line and
the residual errors are shown by the solid triangles. The fitting errors were all less
than five percent of the imaginary component of the impedance. The noise level
for the imaginary fit was approximately 40% of the impedance at 1 Hz. The noise
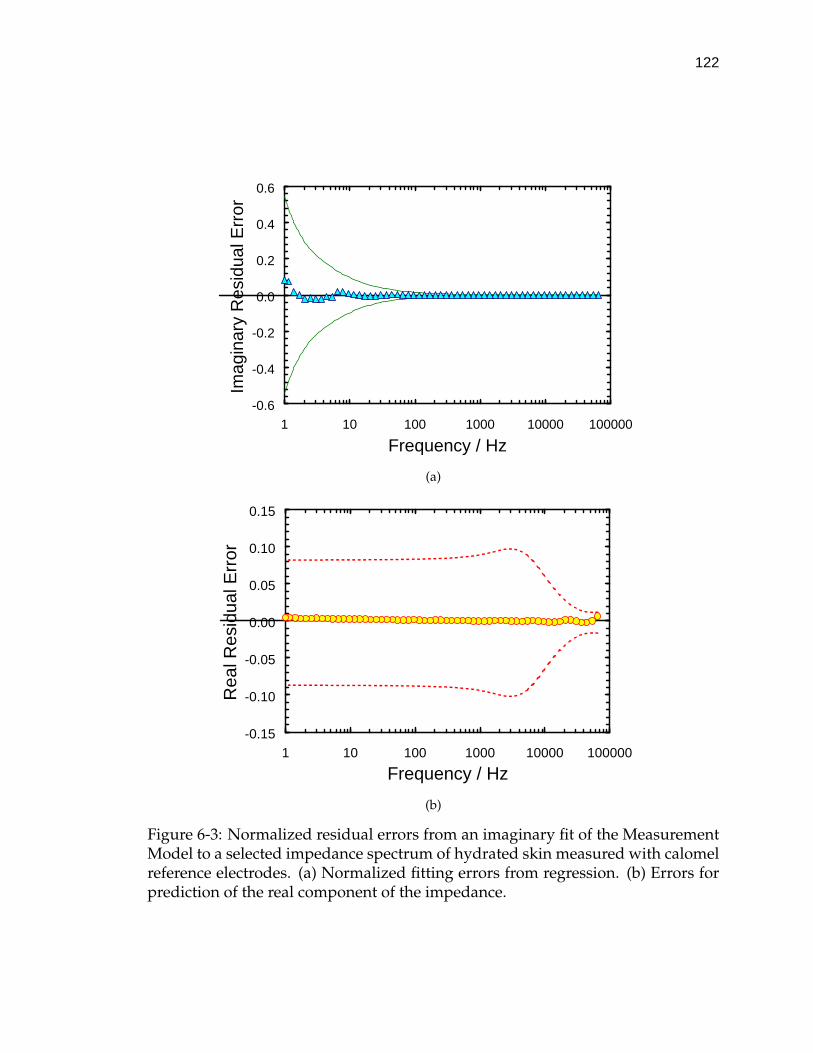
122
-0.6
-0.4
-0.2
0.0
0.2
0.4
0.6
1 10 100 1000 10000 100000
Frequency / Hz
Imag
inar
y R
esid
ual E
rror
(a)
-0.15
-0.10
-0.05
0.00
0.05
0.10
0.15
1 10 100 1000 10000 100000
Frequency / Hz
Rea
l Res
idua
l Err
or
(b)
Figure 6-3: Normalized residual errors from an imaginary fit of the MeasurementModel to a selected impedance spectrum of hydrated skin measured with calomelreference electrodes. (a) Normalized fitting errors from regression. (b) Errors forprediction of the real component of the impedance.

123
level gradually decreased with increasing frequency, reaching an asymptotic value
of 5% of the impedance for frequencies greater than 100 Hz. All of the residual
errors were located within the noise level of the measurement which implied that
a statistically valid fit had been obtained.
The relative residual errors from the prediction of the real part of the imped-
ance are presented in Figure 6.3(b). The normalized residuals are indicated by the
solid triangles and the 95.4% confidence interval is shown by the dashed red lines.
The residual errors were all less than 2% of the measurement and fell within the
95.4% confidence interval. This indicated that the impedance spectrum collected
with the calomel reference electrodes was consistent with the Kramers-Kronig re-
lations. Therefore, it was concluded that the electrical and transport properties of
skin were not altered by the low-frequency perturbations.
6.1.3 K-K Consistency Check for Micro-Reference Electrode Data
Regression of the Measurement Model to impedance spectra collected with
the Ag/AgCl micro-reference electrodes proved to be problematic. For example,
complex fits weighted by the modulus of impedance yielded only one line shape.
The frequency-dependent error structure model presented by Equation (4-15) was
regressed to the residual errors from the complex fits. The appropriate error struc-
ture for the measurements included the model parameters α and δ which were
equal to 2.35x10⁻³ and 4.73, respectively. The fourth impedance spectrum was
then assessed for consistency with the Kramers-Kronig relations. The regressions
of the Measurement Model were weighted by the error structure.
A real fit to the data yielded three line shapes. The normalized fitting errors
are presented in Figure 6.4(a). The residual errors exhibited significant trending
and fell outside the noise level at high frequencies. The magnitude of the fitting
errors were as large as 75% of the real part of the impedance at high frequencies.

124
The large fitting errors at high frequencies were probably caused by the negative
values of the real part of the impedance.
The residual errors for the prediction of the imaginary part of the impedance,
shown in Figure 6.4(b), also demonstrated significant trending. Many of the resid-
ual errors were located outside the confidence interval. The three data points out-
side the confidence interval at high-frequency were considered inconsistent with
the Kramers-Kronig relations. The inconsistent data points were not included for
the fit of the Measurement Model to the imaginary part of the impedance.
Nine line shapes were obtained from the imaginary fit to a skin impedance
spectrum collected with the Ag/AgCl micro-reference electrodes. The residual
fitting errors are presented as a function of frequency in Figure 6.5(a). The er-
rors were normally distributed and were less than 5% of the imaginary part of the
impedance. The normalized errors from the prediction of the real impedance are
presented in Figure 6.5(b). The residual errors were between 2% and 10% for fre-
quencies above 5 kHz. The remainder of the errors were all on the order of 1%.
Since all of the data fell within the confidence interval, this portion of spectrum
was considered to be consistent with the Kramers-Kronig relations.
6.1.4 Comparison of Calomel and Micro-Reference Electrodes
The low-frequency portions of the spectra collected with the calomel and the
Ag/AgCl micro-reference electrodes satisfied the Kramers-Kronig relations. How-
ever, only the data collected with the calomel electrodes conformed to the Kramers-
Kronig relations at high-frequency. It is emphasized that all of the spectra were
collected under identical conditions with the exception of the reference electrode
type. Therefore, the inconsistent data in the high-frequency portions of the spectra
collected with the micro-reference electrodes was assumed to be caused by instru-
mental artifact.
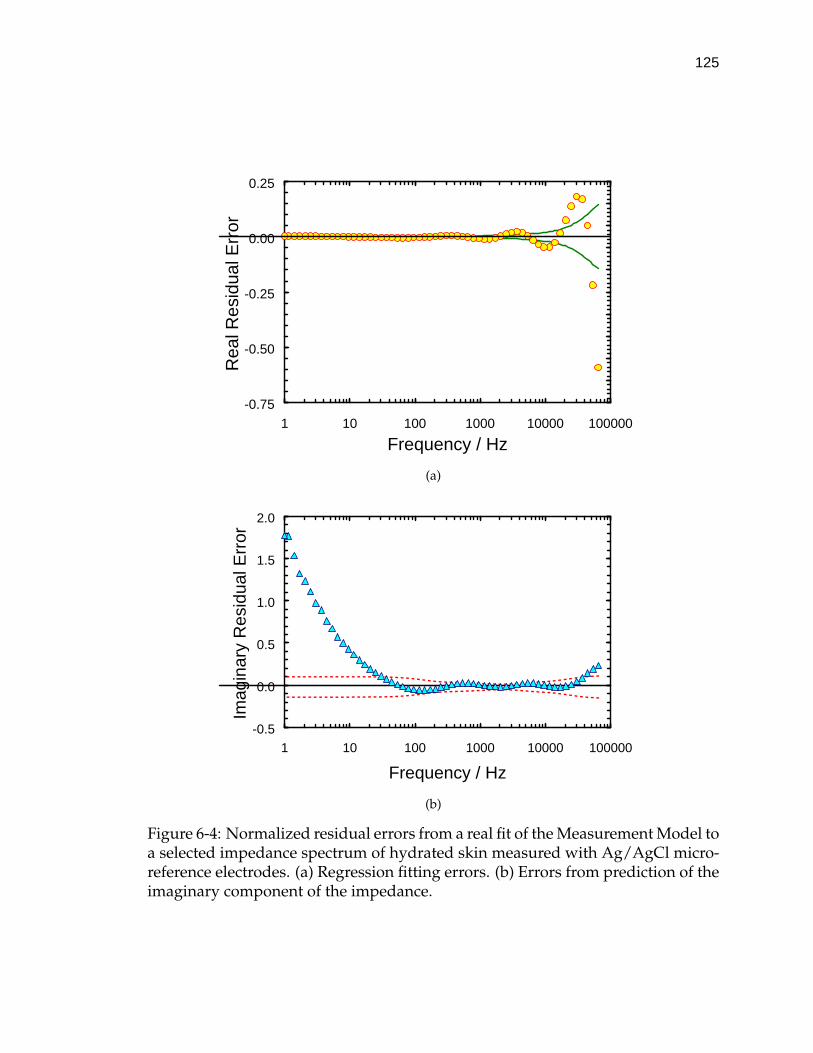
125
-0.75
-0.50
-0.25
0.00
0.25
1 10 100 1000 10000 100000
Frequency / Hz
Rea
l Res
idua
l Err
or
(a)
-0.5
0.0
0.5
1.0
1.5
2.0
1 10 100 1000 10000 100000
Frequency / Hz
Imag
inar
y R
esid
ual E
rror
(b)
Figure 6-4: Normalized residual errors from a real fit of the Measurement Model toa selected impedance spectrum of hydrated skin measured with Ag/AgCl micro-reference electrodes. (a) Regression fitting errors. (b) Errors from prediction of theimaginary component of the impedance.
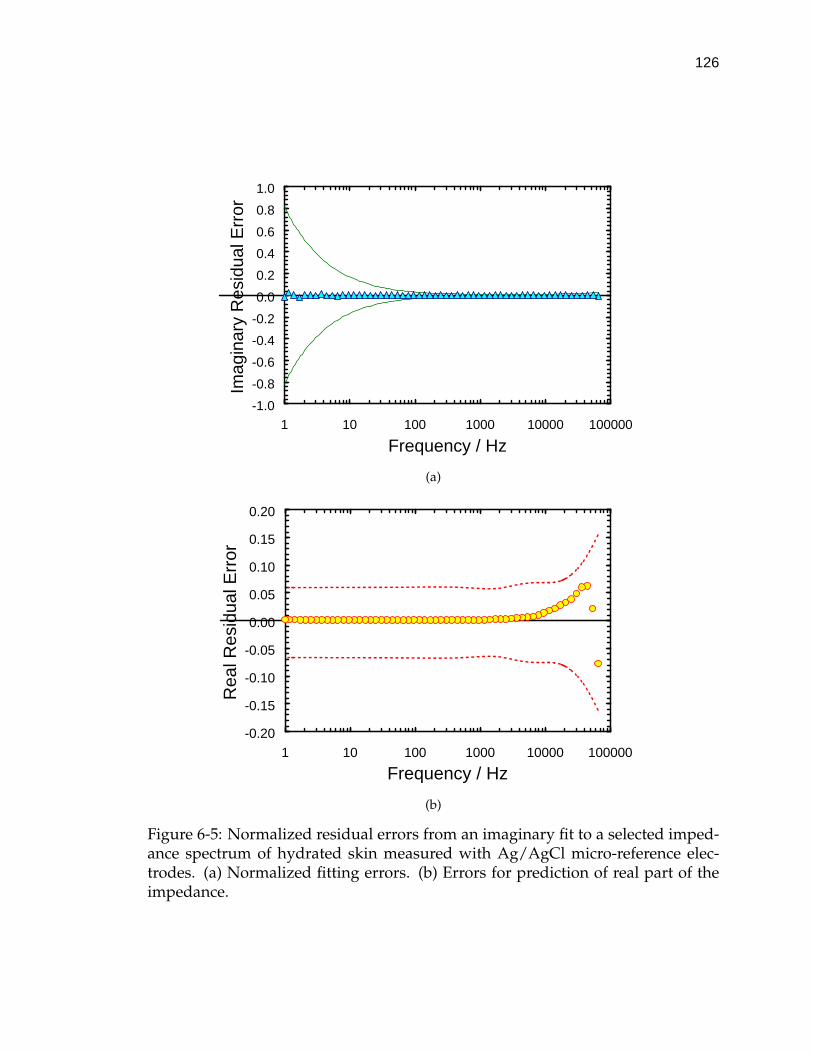
126
-1.0
-0.8
-0.6
-0.4
-0.2
0.0
0.2
0.4
0.6
0.8
1.0
1 10 100 1000 10000 100000
Frequency / Hz
Imag
inar
y R
esid
ual E
rror
(a)
-0.20
-0.15
-0.10
-0.05
0.00
0.05
0.10
0.15
0.20
1 10 100 1000 10000 100000
Frequency / Hz
Rea
l Res
idua
l Err
or
(b)
Figure 6-5: Normalized residual errors from an imaginary fit to a selected imped-ance spectrum of hydrated skin measured with Ag/AgCl micro-reference elec-trodes. (a) Normalized fitting errors. (b) Errors for prediction of real part of theimpedance.

127
The difficulty in measuring the high-frequency response of skin with Ag/AgCl
micro-reference electrodes may be associated with the low impedance of the sys-
tem. For example, most electrochemical systems, including skin, display the low-
est values of impedance at high-frequency. Therefore, the voltage drop induced
by the high-frequency current perturbation was also small. It is likely, that the
relatively small magnitude of the voltage response was partly responsible for the
high-frequency artifact. For example, the smaller dimensions of Ag/AgCl micro-
reference electrodes may not have been adequate to sense the high-frequency re-
sponse of the system.
The potential difference across the skin induced by the current perturbation
was approximately equal for the experiments conducted with both types of elec-
trodes. However, the larger dimensions of the calomel electrodes may have been
sufficient to overcome the hypothesized signal-to-noise difficulties. The study de-
scribed here identified, at least in part, the source of the high-frequency artifact
observed in skin impedance measurements. An important outcome of this study
was that the high-frequency artifact associated with the Ag/AgCl micro-reference
electrodes did not effect the quality of the low-frequency skin impedance data.
Therefore, the majority of relevant information on skin transport properties was
included in the impedance spectra collected with Ag/AgCl micro-reference elec-
trodes.
6.2 Influence of Hydration on Skin Impedance
The local environment of the heat-separated skin changed significantly when
the samples were placed in the diffusion cell. For example, the slightly moistened
epidermis was stored in between two sheets of polymer film in the refrigerator. At
the start of a typical experiment the skin was removed from the refrigerator and
was immersed in a warm (32C) salt solution with approximately the same pH
128
and ionic strength as the electrolytic fluid within the body.246 The goal of this study
was to characterize the transient response of skin to the change of environment. In
accordance with this objective, the time required for the system to achieve steady-
state was identified.
Replicate electrochemical impedance spectra were collected periodically by
Variable-Amplitude Galvanostatic (VAG) modulation to track the changes. The
sinusoidal current perturbation was superimposed about a 0 µA DC current bias
and the amplitude of the voltage response across the skin was maintained at±10 mV.
The open-circuit potential across the membrane was measured before and after
each impedance scan. Upon completion of an impedance scan the skin was al-
lowed to relax for three minutes before the next spectrum was collected.
Separate studies were performed on two pieces of skin extracted from the same
donor sample. One piece was immersed in 50 mM CaCl2 electrolyte and the other
in 150 mM NaCl electrolyte. The skin impedance spectra were collected periodi-
cally for 24 hours. The control parameters were uniform for all of the experiments.
The first part of this study involved the collection of 40 impedance spectra over
five and a half hours. The skin was left in solution overnight and 15 additional
scans were collected on the following day. All of the spectra were checked for
consistency with the Kramers-Kronig relations. The selected condition for steady-
state required that the low-frequency portions of 2 consecutive impedance spectra
conform to the Kramers-Kronig relations. A complete description of the results
for the piece of skin in the 50 mM CaCl2 electrolyte solution is provided. Selected
results for the study of the skin in 150 mM NaCl are also described.
6.2.1 Direct Analysis of Hydration Data
Selected impedance spectra corresponding to every fifth impedance scan from
the experiments of skin in CaCl2 are presented in Figure 6.6(a). The impedance

129
response demonstrated a gradual and continuous decrease throughout the en-
tire observation period. The spectra corresponding to every fifth impedance scan
collected after the skin was soaked overnight are presented in Figure 6.6(b). The
axis limits on Figure 6.6(b) are the same as for Figure 6.6(a) to provide for direct
comparison with the spectra collected at beginning of the experiment. The low-
frequency asymptotes of the last spectrum collected in first 5.5 hours of the study
and the first spectrum obtained after the skin was left in solution overnight were
compared. The results indicated the polarization resistance of the membrane had
recovered to approximately 85% of the value measured at the start of the experi-
ment. The partial recovery suggested that the impedance experiment had a small
effect on skin properties. Subsequent spectra collected on the second day exhib-
ited a continuous decrease in skin impedance.
The open-circuit potential measurements are presented as a function of time in
Figure 6-7. The open-circuit potential at the start of the experiments was 120.1 mV.
The potential difference across the membrane increased to a maximum of 151.9
mV during the first half hour of this study. The open-circuit potential asymptot-
ically decreased to 1 mV over the course of the next hour. The 1 mV potential
difference was approximately equal to the potential drop measured by a multime-
ter in an identical electrolyte solution in the absence of skin. It is likely that the
dramatic changes in open-circuit potential were caused by the formation of aque-
ous ionic channels in the stratum corneum. As the conductivity of the electrolyte
solutions was on the order of 0.01 S/cm, a well hydrated ion-exchange membrane,
such as skin, will not likely exhibit a significant open-circuit potential.
Although the open-circuit potential across the skin remained constant after 1.5
hours, the impedance response continued to change over the entire course of the
investigation (see, for example, Figures 6.6(b) and 6.6(a)). Therefore, the polariza-

130
-20000
-10000
00 10000 20000 30000 40000 50000 60000
Zr / Ωcm2
Zj /
Ωcm
2
0.0 h 0.6 h 1.3 h 1.9 h 2.5 h 3.1 h 3.9 h 4.5 h 5.1 h
(a)
-20000
-10000
00 10000 20000 30000 40000 50000 60000
Zr / Ωcm2
Zj /
Ωcm
2
21.6 h 22.1 h 22.7 h 23.3 h
(b)
Figure 6-6: Selected sequential impedance scans of skin hydration in bufferedCaCl2 electrolyte. (a) Response during the initial 5.5 hours of hydration. (b) Re-sponse after skin was soaked overnight.
-10
10
30
50
70
90
110
130
150
0 1 2 3 4 5 6
Time / h
Ope
n C
ircui
t Pot
entia
l / m
V
Pre-ScanPost-Scan
Figure 6-7: Open-circuit potential across skin during the hydration study.
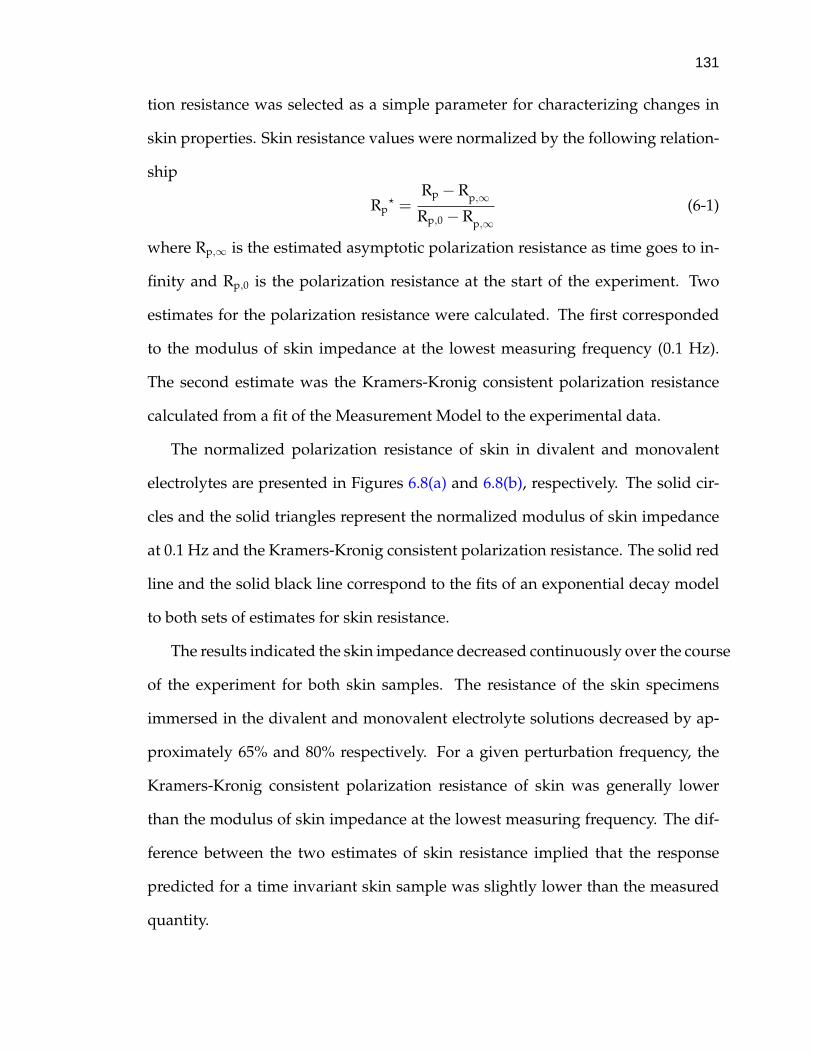
131
tion resistance was selected as a simple parameter for characterizing changes in
skin properties. Skin resistance values were normalized by the following relation-
ship
Rp? =
Rp −Rp,∞
Rp,0 −Rp,∞(6-1)
where Rp,∞ is the estimated asymptotic polarization resistance as time goes to in-
finity and Rp,0 is the polarization resistance at the start of the experiment. Two
estimates for the polarization resistance were calculated. The first corresponded
to the modulus of skin impedance at the lowest measuring frequency (0.1 Hz).
The second estimate was the Kramers-Kronig consistent polarization resistance
calculated from a fit of the Measurement Model to the experimental data.
The normalized polarization resistance of skin in divalent and monovalent
electrolytes are presented in Figures 6.8(a) and 6.8(b), respectively. The solid cir-
cles and the solid triangles represent the normalized modulus of skin impedance
at 0.1 Hz and the Kramers-Kronig consistent polarization resistance. The solid red
line and the solid black line correspond to the fits of an exponential decay model
to both sets of estimates for skin resistance.
The results indicated the skin impedance decreased continuously over the course
of the experiment for both skin samples. The resistance of the skin specimens
immersed in the divalent and monovalent electrolyte solutions decreased by ap-
proximately 65% and 80% respectively. For a given perturbation frequency, the
Kramers-Kronig consistent polarization resistance of skin was generally lower
than the modulus of skin impedance at the lowest measuring frequency. The dif-
ference between the two estimates of skin resistance implied that the response
predicted for a time invariant skin sample was slightly lower than the measured
quantity.
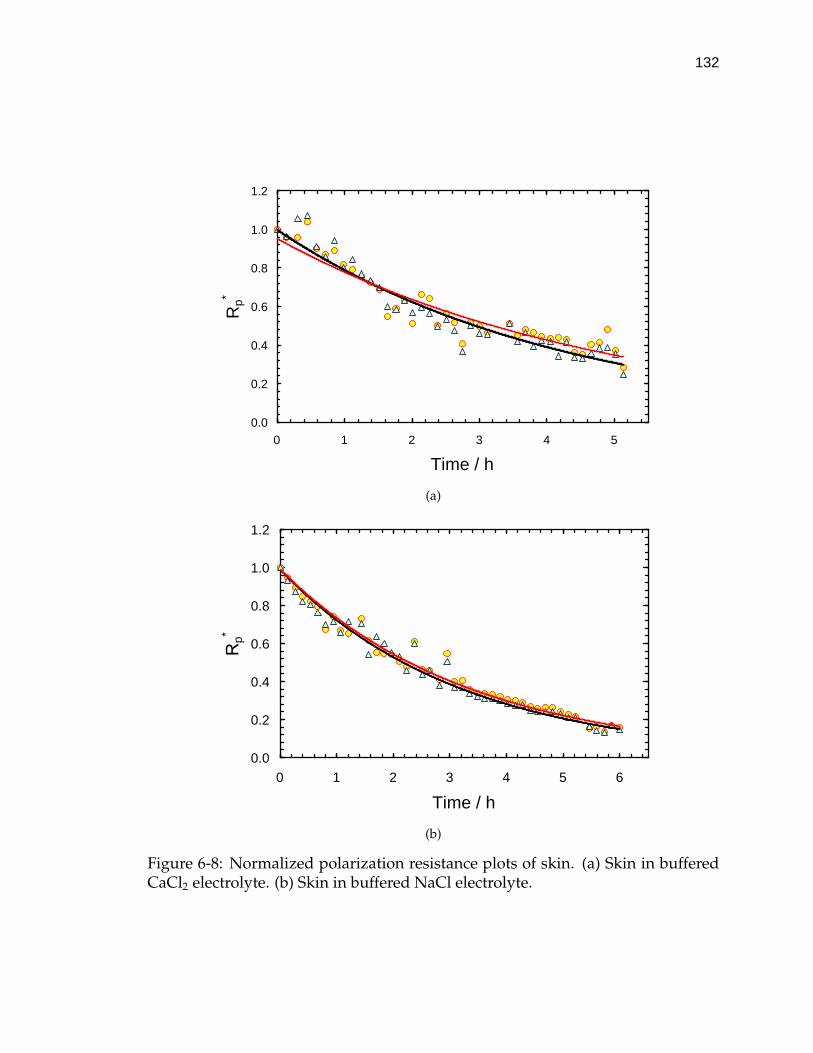
132
0.0
0.2
0.4
0.6
0.8
1.0
1.2
0 1 2 3 4 5
Time / h
Rp*
(a)
0.0
0.2
0.4
0.6
0.8
1.0
1.2
0 1 2 3 4 5 6
Time / h
p*
(b)
Figure 6-8: Normalized polarization resistance plots of skin. (a) Skin in bufferedCaCl2 electrolyte. (b) Skin in buffered NaCl electrolyte.
133
6.2.2 Influence of Cation Charge on Skin Hydration
The Measurement Model approach developed by Agarwal et al.238, 239 was
applied to assess selected impedance spectra for consistency with the Kramers-
Kronig relations. As stated earlier, the assessment procedure was used to iden-
tify when the properties of skin achieved steady-state. The methodology for the
assessment procedure is described in Section 4.1.4. The piece of skin immersed
in CaCl2 solution did not achieve steady-state until after the skin was soaked
overnight. In contrast, the properties of skin in NaCl electrolyte changed continu-
ously over the course of the experiment. As proposed in Section 5.2.2, it is possi-
ble that the charge of the electrolyte cations influenced the hydration dynamics of
skin.
It is unlikely that the impedance experiments were responsible for the slow ap-
proach toward steady-state, since the potential differences across the membrane
induced by the current perturbations were on the order of 10 mV. Despite the
continuous changes in the skin samples studied here, the majority of skin speci-
mens studied by electrochemical impedance spectroscopy in this work displayed
a stationary response within the first hour of being immersed in electrolyte (see,
for example, Section 5.2.1).
6.3 Influence of Electrolyte Cation Charge on Skin Impedance
The literature suggests that the charge of electrolyte cations influences the ef-
ficiency of iontophoretic transport.20, 131, 133, 247 For example, the transport numbers
corresponding to a series of different inorganic univalent cations were found to
be approximately 0.6. In contrast, the transport numbers of various inorganic di-
valent cations were in the range of 0.2-0.4. The results suggested that specific
interactions, such as electrostatic binding, occur between divalent cations and the
negative background charge sites of the stratum corneum. Additional iontophor-
134
etic studies indicated that the recovery of skin impedance to electric current is en-
hanced in the presence of divalent cations in comparison to monovalent cations.152
The results described in Sections 5.2.2 and 6.2.2 are consistent with these observa-
tions.
A possible mechanistic explanation for the enhancement of skin recovery rates
by divalent cations is derived from electrostatic theory. For example, the force
between a negative charge and a divalent cation is twice that of monovalent cation.
The enhanced driving force associated with the divalent cations could provide for
preferential adsorption on the negatively charged regions of the stratum corneum.
The larger electrostatic interactions in the interior of stratum corneum may reduce
the impact of large electric fields on skin properties.
The object of this study was to investigate the effect of electrolyte cation charge
on the recovery of skin to large electric fields. An additional goal of the investiga-
tion was to confirm that skin transport properties can be monitored nonnivasively
by variable-amplitude galvanostatic modulated impedance spectroscopy. The ob-
jectives were accomplished by subjecting 2 pieces of skin, one immersed mono-
valent cation electrolyte and the other in divalent electrolyte, to a similar series of
impedance experiments.
The approach was to collect 10 mV VAG modulated impedance spectra inter-
mittently over the course of three hours to monitor skin hydration. Large electric
fields were induced across the skin by the subsequent collection of four 10 µA
constant-amplitude galvanostatically modulated impedance spectra. The recov-
ery of skin properties to the large perturbations was monitored through the col-
lection of four 10 mV VAG modulated impedance spectra. The DC current bias
was 0 µA/cm2 for all of the experiments. The Measurement Model, described in
Section 4.1.4, was regressed to the data to identify portions of the spectra of that
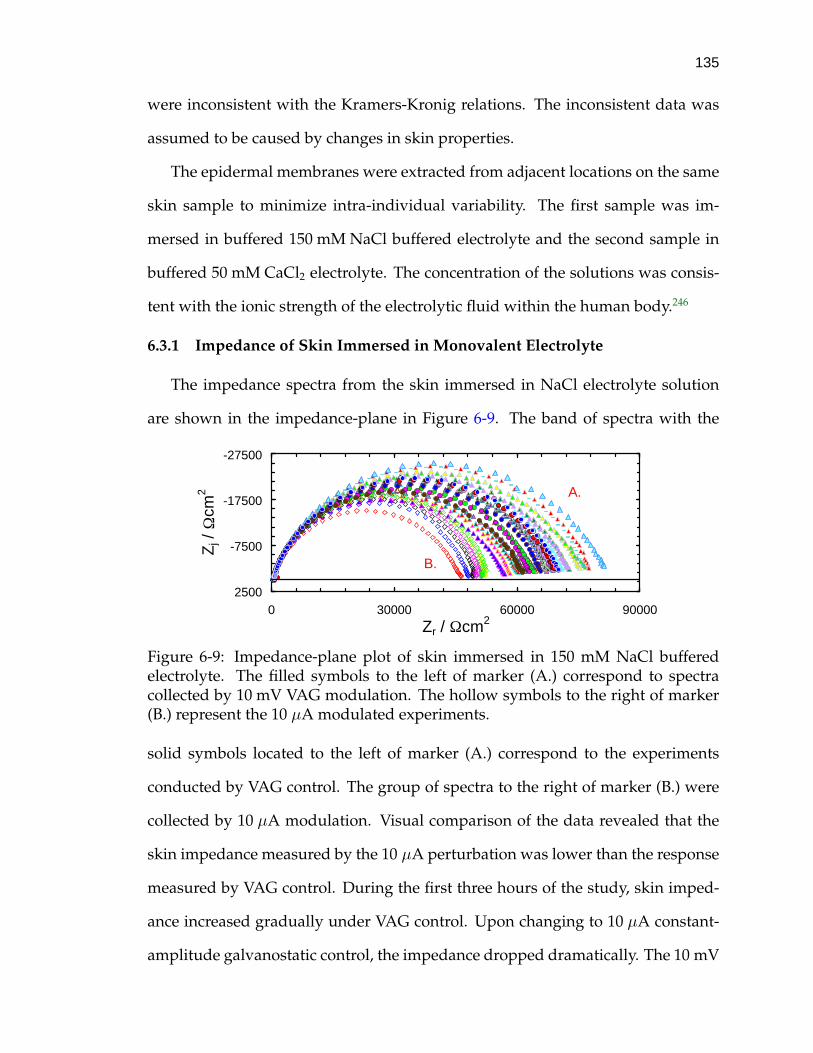
135
were inconsistent with the Kramers-Kronig relations. The inconsistent data was
assumed to be caused by changes in skin properties.
The epidermal membranes were extracted from adjacent locations on the same
skin sample to minimize intra-individual variability. The first sample was im-
mersed in buffered 150 mM NaCl buffered electrolyte and the second sample in
buffered 50 mM CaCl2 electrolyte. The concentration of the solutions was consis-
tent with the ionic strength of the electrolytic fluid within the human body.246
6.3.1 Impedance of Skin Immersed in Monovalent Electrolyte
The impedance spectra from the skin immersed in NaCl electrolyte solution
are shown in the impedance-plane in Figure 6-9. The band of spectra with the
-27500
-17500
-7500
25000 30000 60000 90000
Zr / Ωcm2
Zj /
Ωcm
2 A.
B.
Figure 6-9: Impedance-plane plot of skin immersed in 150 mM NaCl bufferedelectrolyte. The filled symbols to the left of marker (A.) correspond to spectracollected by 10 mV VAG modulation. The hollow symbols to the right of marker(B.) represent the 10 µA modulated experiments.
solid symbols located to the left of marker (A.) correspond to the experiments
conducted by VAG control. The group of spectra to the right of marker (B.) were
collected by 10 µA modulation. Visual comparison of the data revealed that the
skin impedance measured by the 10 µA perturbation was lower than the response
measured by VAG control. During the first three hours of the study, skin imped-
ance increased gradually under VAG control. Upon changing to 10 µA constant-
amplitude galvanostatic control, the impedance dropped dramatically. The 10 mV

136
VAG modulated impedance spectra collected during the hour after the constant-
amplitude experiments revealed a partial recovery of the skin impedance response.
Since more than 30 impedance spectra were collected in this investigation, it
was difficult to evaluate the temporal evolution of the system directly from the
impedance-plane plot. The Kramers-Kronig consistent polarization resistance of
skin was once again selected as a simple parameter to represent membrane prop-
erties. The results from the assessment procedure are described in Section 6.3.3.
Skin polarization resistance is plotted as a function of time in Figure 6-10. The
solid circles and solid triangles represent the data collected by 10 mV VAG mod-
ulation and 10 µA constant-amplitude galvanostatic control, respectively. The po-
tential difference across the skin at the minimum measuring frequency is shown
by the open symbols of Figure 6-10.
0
20000
40000
60000
80000
100000
0 1 2 3 4 5
Time / h
Rp
ol /
Ωcm
2
0.001
0.01
0.1
1
∆V
max
/ V
rms
Figure 6-10: Polarization impedance and potential difference across skin im-mersed in buffered 150 mM NaCl electrolyte. The solid circles and solid trian-gles correspond to the polarization resistance of skin is measured by VAG andconstant-amplitude galvanostatic modulation, respectively. Similarly, the opencircles and open triangles refer to the membrane potential difference at the low-est perturbation frequency for the VAG and constant-amplitude galvanostaticallymodulated experiments.
The polarization resistance of the skin approached an asymptote of 75 kΩcm2
during the first three hours of this study. In accordance with the VAG modu-
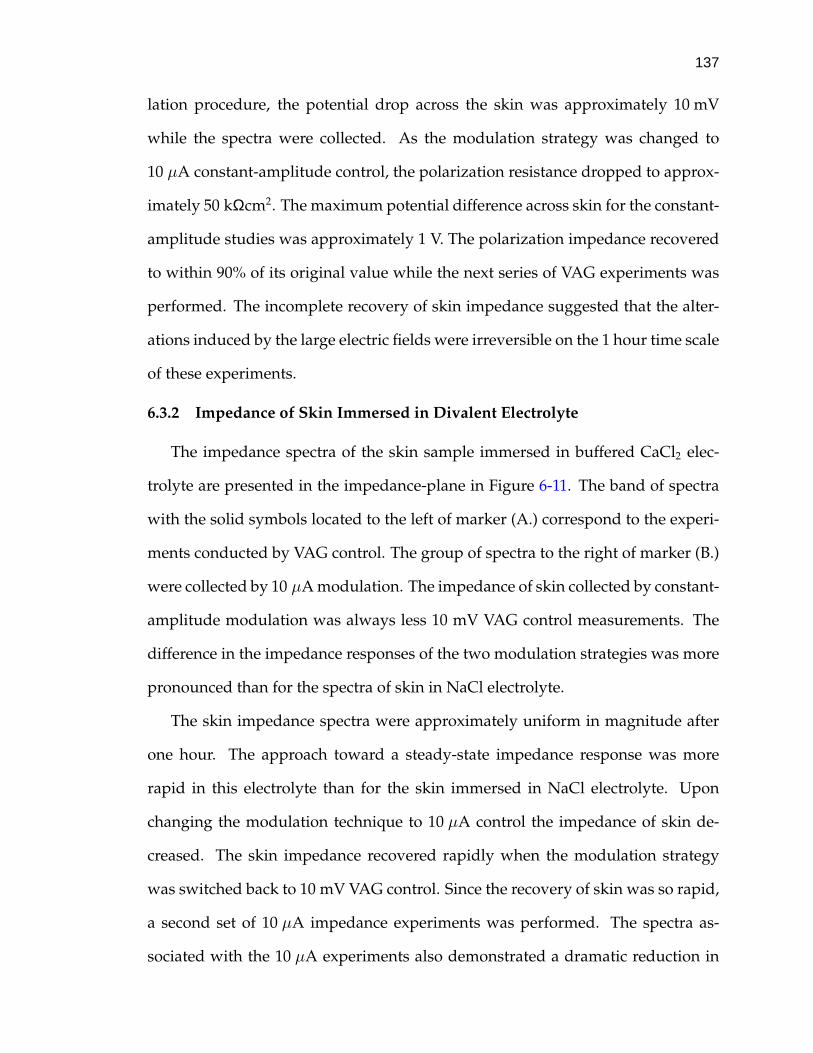
137
lation procedure, the potential drop across the skin was approximately 10 mV
while the spectra were collected. As the modulation strategy was changed to
10 µA constant-amplitude control, the polarization resistance dropped to approx-
imately 50 kΩcm2. The maximum potential difference across skin for the constant-
amplitude studies was approximately 1 V. The polarization impedance recovered
to within 90% of its original value while the next series of VAG experiments was
performed. The incomplete recovery of skin impedance suggested that the alter-
ations induced by the large electric fields were irreversible on the 1 hour time scale
of these experiments.
6.3.2 Impedance of Skin Immersed in Divalent Electrolyte
The impedance spectra of the skin sample immersed in buffered CaCl2 elec-
trolyte are presented in the impedance-plane in Figure 6-11. The band of spectra
with the solid symbols located to the left of marker (A.) correspond to the experi-
ments conducted by VAG control. The group of spectra to the right of marker (B.)
were collected by 10 µA modulation. The impedance of skin collected by constant-
amplitude modulation was always less 10 mV VAG control measurements. The
difference in the impedance responses of the two modulation strategies was more
pronounced than for the spectra of skin in NaCl electrolyte.
The skin impedance spectra were approximately uniform in magnitude after
one hour. The approach toward a steady-state impedance response was more
rapid in this electrolyte than for the skin immersed in NaCl electrolyte. Upon
changing the modulation technique to 10 µA control the impedance of skin de-
creased. The skin impedance recovered rapidly when the modulation strategy
was switched back to 10 mV VAG control. Since the recovery of skin was so rapid,
a second set of 10 µA impedance experiments was performed. The spectra as-
sociated with the 10 µA experiments also demonstrated a dramatic reduction in
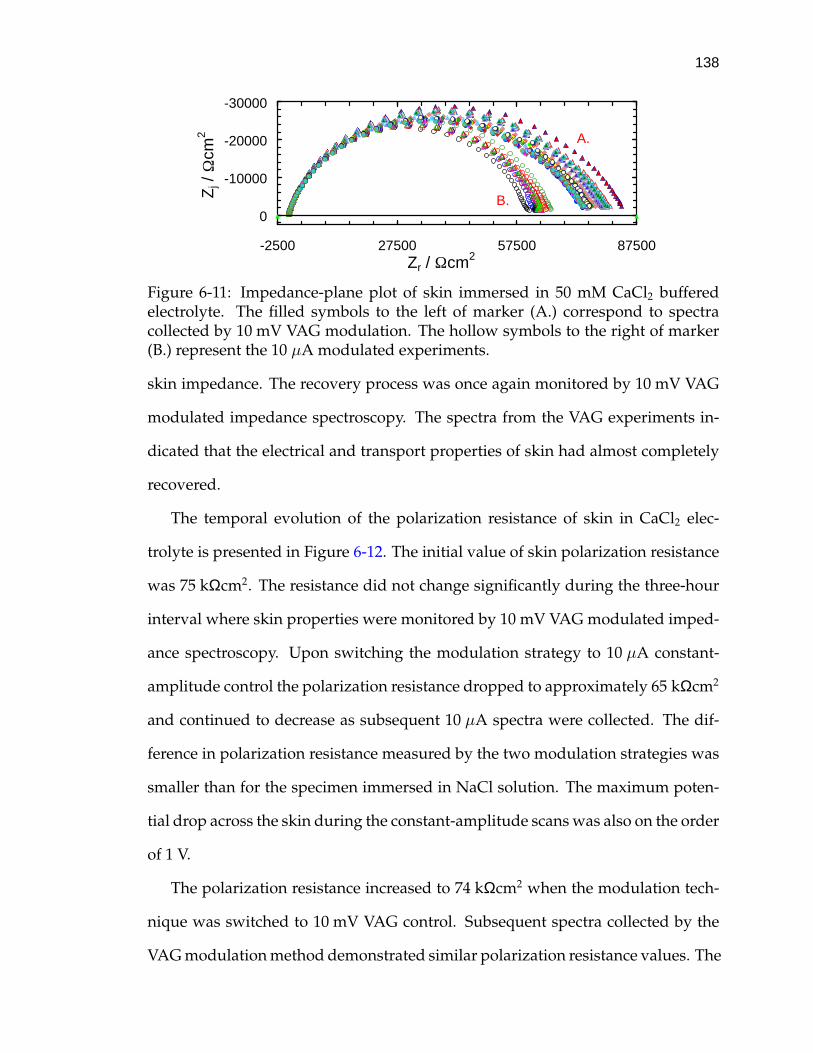
138
-30000
-20000
-10000
0
-2500 27500 57500 87500Zr / Ωcm2
Zj /
Ωcm
2 A.
B.
Figure 6-11: Impedance-plane plot of skin immersed in 50 mM CaCl2 bufferedelectrolyte. The filled symbols to the left of marker (A.) correspond to spectracollected by 10 mV VAG modulation. The hollow symbols to the right of marker(B.) represent the 10 µA modulated experiments.
skin impedance. The recovery process was once again monitored by 10 mV VAG
modulated impedance spectroscopy. The spectra from the VAG experiments in-
dicated that the electrical and transport properties of skin had almost completely
recovered.
The temporal evolution of the polarization resistance of skin in CaCl2 elec-
trolyte is presented in Figure 6-12. The initial value of skin polarization resistance
was 75 kΩcm2. The resistance did not change significantly during the three-hour
interval where skin properties were monitored by 10 mV VAG modulated imped-
ance spectroscopy. Upon switching the modulation strategy to 10 µA constant-
amplitude control the polarization resistance dropped to approximately 65 kΩcm2
and continued to decrease as subsequent 10 µA spectra were collected. The dif-
ference in polarization resistance measured by the two modulation strategies was
smaller than for the specimen immersed in NaCl solution. The maximum poten-
tial drop across the skin during the constant-amplitude scans was also on the order
of 1 V.
The polarization resistance increased to 74 kΩcm2 when the modulation tech-
nique was switched to 10 mV VAG control. Subsequent spectra collected by the
VAG modulation method demonstrated similar polarization resistance values. The
139
0
20000
40000
60000
80000
100000
0 2 4 6
Time / h
Rp
ol /
Ωcm
2
0.001
0.01
0.1
1
∆Vm
ax /
Vrm
s
Figure 6-12: Polarization impedance and potential difference across skin im-mersed in buffered 50 mM CaCl2 electrolyte. The solid circles and solid trian-gles correspond to the polarization resistance of skin as measured by VAG andconstant-amplitude galvanostatic modulation, respectively. Similarly, the opencircles and open triangles refer to the membrane potential difference at the low-est perturbation frequency for the VAG and constant-amplitude galvanostaticallymodulated experiments.
uniform magnitude of the low-frequency response associated with these imped-
ance spectra were consistent with a complete recovery of skin properties.
6.3.3 Kramers-Kronig Consistency Assessment
In Sections 6.3.1 and 6.3.2 it was demonstrated that the impedance responses of
skin measured by 10 mV VAG and 10 µA constant-amplitude galvanostatic mod-
ulation were different. The potential difference across skin in the low-frequency
portions of the impedance spectra collected by 10 µA constant-amplitude galvano-
static modulation were on the order of 1 V, whereas, the VAG modulation stud-
ies maintained the potential drop at a magnitude of 10 mV. The influence of the
large potential perturbations induced by the 10 µA constant-amplitude galvanos-
tatic control technique on skin properties was assessed by checking the impedance
spectra for consistency with the Kramers-Kronig relations. In addition, the spec-

140
tra obtained under 10 mV VAG control were evaluated for compliance with the
Kramers-Kronig relations.
The results from the assessment procedure are summarized here. The low-
frequency portions of the VAG spectra of skin in monovalent and divalent so-
lutions satisfied the Kramers-Kronig relations within one hour after being im-
mersed in electrolyte. In contrast, the spectra of skin in 150 mM NaCl collected by
10 µA constant-amplitude galvanostatic modulation were inconsistent with the
Kramers-Kronig relations at frequencies below 25 Hz. Similarly, the spectra of
skin in CaCl2 electrolyte were inconsistent at frequencies below 100 Hz. The re-
sults from the 10 µA constant-amplitude studies implied that skin properties were
altered. The alterations were associated with potential swings on the order of 1 V.
The greatest influence of cation charge on the impedance response of skin was
observed for the spectra collected after the 10 µA constant-amplitude galvano-
static modulated scans. For example, the impedance spectra of skin in CaCl2
electrolyte were consistent with the Kramers-Kronig relations whereas the spec-
tra associated with the skin in NaCl electrolyte were not. The Kramers-Kronig
consistent spectra collected from the specimen in CaCl2 electrolyte were compati-
ble with the hypothesis that skin properties recover more rapidly and completely
in the presence of divalent cations (see, for example, Section 5.2.2).
6.4 Influence of Large-Amplitude AC Potential Swings on Skin
It was demonstrated in Sections 5.1.1, 5.2.1, and 6.3.3 that skin impedance data
collected by constant-amplitude galvanostatic modulation was inconsistent with
the Kramers-Kronig relations. The inconsistent data points were generally located
in the low-frequency portions of the spectra where skin exhibits its largest imped-
ance. For skin samples with a polarization resistance on the order of 100 kΩcm2,
the constant-amplitude modulation technique can induce potential swings which
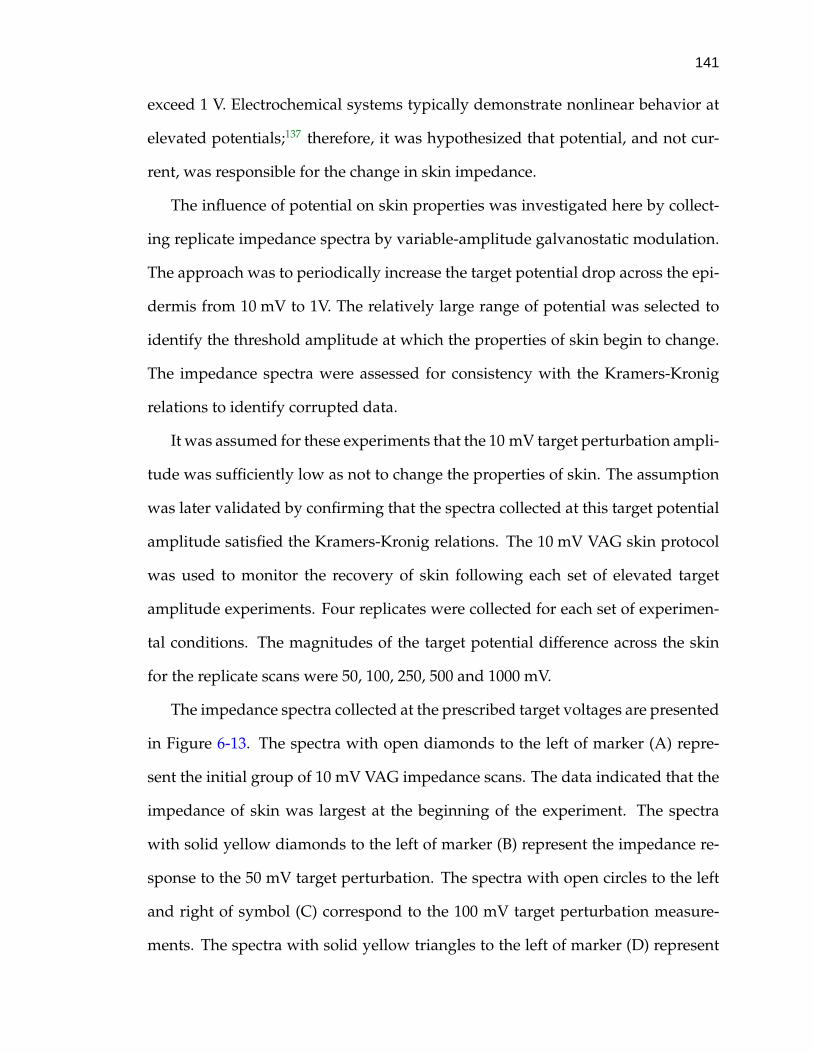
141
exceed 1 V. Electrochemical systems typically demonstrate nonlinear behavior at
elevated potentials;137 therefore, it was hypothesized that potential, and not cur-
rent, was responsible for the change in skin impedance.
The influence of potential on skin properties was investigated here by collect-
ing replicate impedance spectra by variable-amplitude galvanostatic modulation.
The approach was to periodically increase the target potential drop across the epi-
dermis from 10 mV to 1V. The relatively large range of potential was selected to
identify the threshold amplitude at which the properties of skin begin to change.
The impedance spectra were assessed for consistency with the Kramers-Kronig
relations to identify corrupted data.
It was assumed for these experiments that the 10 mV target perturbation ampli-
tude was sufficiently low as not to change the properties of skin. The assumption
was later validated by confirming that the spectra collected at this target potential
amplitude satisfied the Kramers-Kronig relations. The 10 mV VAG skin protocol
was used to monitor the recovery of skin following each set of elevated target
amplitude experiments. Four replicates were collected for each set of experimen-
tal conditions. The magnitudes of the target potential difference across the skin
for the replicate scans were 50, 100, 250, 500 and 1000 mV.
The impedance spectra collected at the prescribed target voltages are presented
in Figure 6-13. The spectra with open diamonds to the left of marker (A) repre-
sent the initial group of 10 mV VAG impedance scans. The data indicated that the
impedance of skin was largest at the beginning of the experiment. The spectra
with solid yellow diamonds to the left of marker (B) represent the impedance re-
sponse to the 50 mV target perturbation. The spectra with open circles to the left
and right of symbol (C) correspond to the 100 mV target perturbation measure-
ments. The spectra with solid yellow triangles to the left of marker (D) represent
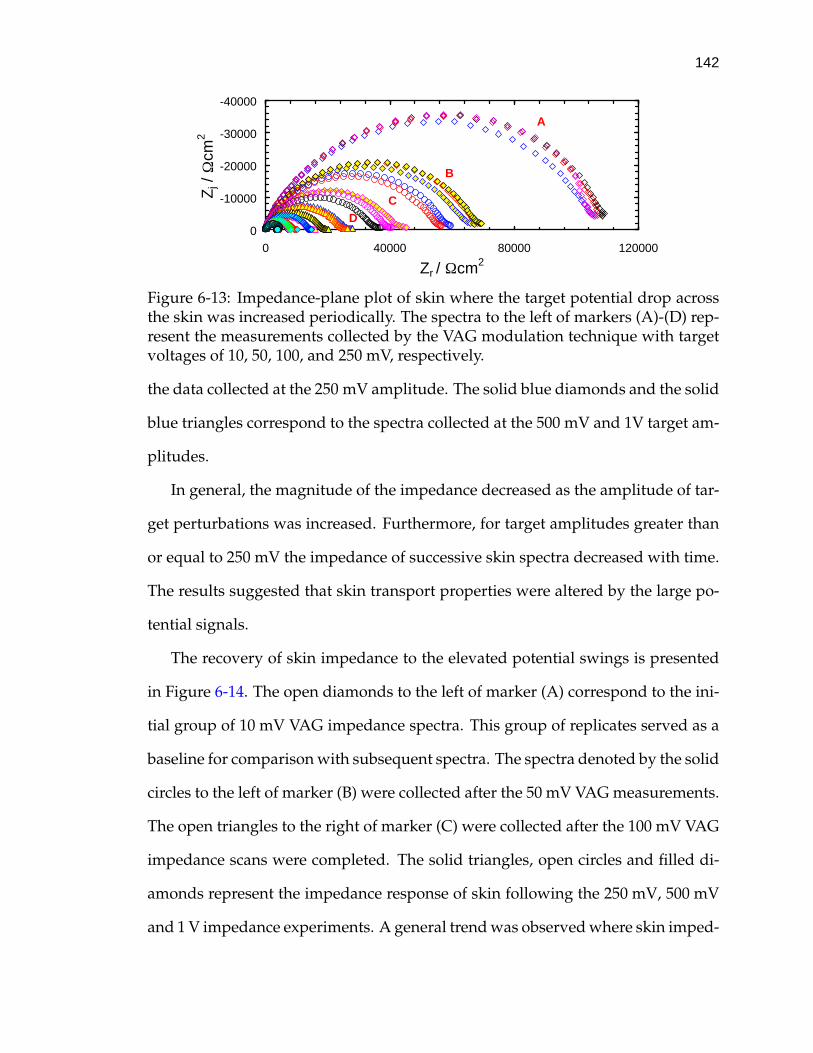
142
-40000
-30000
-20000
-10000
00 40000 80000 120000
Zr / Ωcm2
Zj /
Ωcm
2
A
C
B
D
Figure 6-13: Impedance-plane plot of skin where the target potential drop acrossthe skin was increased periodically. The spectra to the left of markers (A)-(D) rep-resent the measurements collected by the VAG modulation technique with targetvoltages of 10, 50, 100, and 250 mV, respectively.
the data collected at the 250 mV amplitude. The solid blue diamonds and the solid
blue triangles correspond to the spectra collected at the 500 mV and 1V target am-
plitudes.
In general, the magnitude of the impedance decreased as the amplitude of tar-
get perturbations was increased. Furthermore, for target amplitudes greater than
or equal to 250 mV the impedance of successive skin spectra decreased with time.
The results suggested that skin transport properties were altered by the large po-
tential signals.
The recovery of skin impedance to the elevated potential swings is presented
in Figure 6-14. The open diamonds to the left of marker (A) correspond to the ini-
tial group of 10 mV VAG impedance spectra. This group of replicates served as a
baseline for comparison with subsequent spectra. The spectra denoted by the solid
circles to the left of marker (B) were collected after the 50 mV VAG measurements.
The open triangles to the right of marker (C) were collected after the 100 mV VAG
impedance scans were completed. The solid triangles, open circles and filled di-
amonds represent the impedance response of skin following the 250 mV, 500 mV
and 1 V impedance experiments. A general trend was observed where skin imped-

143
ance increased as the target potential of the VAG impedance scans was switched to
10 mV after the application of the higher amplitude signals. The impedance con-
tinued to increase as successive 10 mV VAG spectra were collected which implied
that the changes induced by the large potential swings were partly reversible.
-40000
-30000
-20000
-10000
00 40000 80000 120000
Zr / Ωcm2
Zj /
Ωcm
2
A
B
C
Figure 6-14: Skin polarization resistance upon completion of the elevated targetpotential impedance scans. The spectra to the left of markers (A) and (B) corre-spond to the 10 mV VAG scans collected at the start of the experiment and afterthe 50 mV VAG experiments, respectively. The band of spectra to the right of (C)correspond to the 10 mV VAG experiments conducted after the 100 mV VAG scans.
Selected spectra from each set of experimental conditions were assessed with
the Kramers-Kronig relations. Impedance data collected at measuring frequen-
cies below 5 Hz at the 10 mV target perturbation level were generally inconsistent
with the Kramers-Kronig relations. The inconsistent behavior was likely caused
by nonstationary effects; e.g. hydration of the membrane or the recovery of skin
properties to the high amplitude potential swings.
A larger portion of the low-frequency data collected at the higher target per-
turbation amplitudes was inconsistent with the Kramers-Kronig relations. For ex-
ample, the spectra collected with a target perturbation of 1 V were inconsistent
at frequencies below 200 Hz. The results are in agreement with the proposal that
skin properties begin to change at a critical potential. The magnitude of the volt-
age across skin where the properties began to change in this work was 250 mV.

144
The data presented in Figures 6-13 and 6-14 clearly indicated that there was
a strong effect of potential on skin properties. However, it was difficult to assess
from the impedance-plane plots the magnitude and character of the changes in
skin properties induced by the 500 mV and 1 V potential swings. As the influ-
ence of potential perturbations on skin is greatest at low-frequencies, the polar-
ization resistance was selected as a simple parameter for evaluating alterations to
the membrane. The polarization resistance and potential difference across the skin
are displayed as a function of time in Figure 6-15. The filled diamonds correspond
to skin polarization resistance and the filled circles represent the potential drop
across the membrane.
1000
10000
100000
1000000
0 1 2 3 4 5 6
Time / h
Rpo
l / Ω
cm2
1
10
100
1000
10000
∆V
skin /
mV
Figure 6-15: Polarization resistance (solid blue diamonds) and voltage drop acrossthe skin (solid yellow circles) for the elevated target potential impedance scans.
The polarization resistance of skin decreased as the potential difference across
the membrane increased. The greatest changes in skin polarization resistance were
observed when the target potential was set to 500 mV and 1 V. The polarization
resistance associated with these spectra was an order of magnitude lower than the
resistance measured after 10 mV VAG scans at the start of the experiment. Skin
145
polarization resistance, measured by the 10 mV VAG modulation technique, in-
creased pseudoexponentially with time following the experiments collected with
target voltages greater than 50 mV. The 10 mV VAG results indicated that the
changes in membrane properties induced by the large potential swings were par-
tially reversible. Presentation of the impedance data in this fashion allowed for
easier interpretation of the influence of potential on skin properties.
6.5 Influence of DC Current Bias on Skin Impedance
During transdermal iontophoresis DC current is applied to provide an ad-
ditional driving force to enhance the delivery rates of therapeutic compounds
across the skin. The objective of this study was to determine the effect of DC cur-
rent on skin transport properties. The response of the membrane under applied-
current conditions and the recovery of skin properties were studied by impedance
spectroscopy. Six amplitudes of applied DC current in the range of 0 µA/cm2 to
855 µA/cm2 were studied. The current range used for the study was consistent
with the currents applied by clinical iontophoretic transdermal devices. A mini-
mum of four impedance scans were collected under constant-amplitude galvano-
static control for each applied-current magnitude. The sinusoidal current pertur-
bation was equal to 7.5% of the DC bias amplitude to optimize the signal-to-noise
ratio of the potential response.
At the start of the experiment, four VAG modulated impedance scans with
a target potential difference of 10 mV were collected. The spectra provided a
baseline of skin properties and the initial hydration state of the membrane. The
skin was allowed to relax at the open-circuit condition for a minimum of six min-
utes before collecting subsequent spectra. After skin hydration was studied, four
impedance spectra were collected at the 71 µA/cm2 applied bias condition. The
recovery of skin to DC current was monitored through the collection of four 10 mV
146
VAG spectra. The procedure of alternating the modulation method for successive
impedance scans was repeated as the DC current bias amplitude was increased
incrementally.
6.5.1 Comparison of Skin Impedance Spectra
The impedance-plane plot corresponding to impedance response of skin im-
mersed in buffered 50 mM CaCl2 solution under applied-current conditions is pre-
sented in Figure 6.16(a). The solid blue symbols correspond to the spectra col-
lected at the beginning of the experiment at an applied bias of 0 µA/cm2. The
solid yellow symbols and solid red symbols correspond to the measurements ob-
tained at applied bias amplitudes of 71 µA/cm2 and 140 µA/cm2. The solid pur-
ple symbols are spectra collected under the 285 µA/cm2 applied bias. The open
red diamonds and solid green diamonds are the measurements collected with bias
amplitudes of 570 µA/cm2 and 855 µA/cm2.
All of the skin spectra exhibited a depressed semicircular shape in the impedance-
plane. As the current was increased, the polarization resistance and the charac-
teristic time constant for the system decreased. A secondary process in the low-
frequency region of the spectra was observed for the experiments conducted with
applied-current densities greater than 71 µA/cm2.
The variable-amplitude galvanostatic modulated spectra collected as the skin
recovered from the applied currents are presented in Figure 6.16(b). The symbols
for the spectra are coded in the same manner as the applied-current bias scans
presented in Figure 6.16(a). With the exception of the hydration spectra, skin
impedance increased as successive replicates were collected at the 10 mV target
perturbation amplitude. This trend indicated that skin properties were recovering
from the applied-currents. The recovery of skin impedance was incomplete over
the 4 hours of this study.

147
-10000
-7500
-5000
-2500
00 10000 20000
Zr / Ωcm2
Zj /
Ωcm
2
0 uA/cm^2 71 uA/cm^2 142 uA/cm^2255 uA/cm^2 570 uA/cm^2 855 uA/cm^2
(a)
-10000
-7500
-5000
-2500
00 10000 20000
Zr / Ωcm2
Zj /
Ωcm
2
0 uA/cm2 71 uA/cm^2 142 uA/cm^2255 uA/cm^2 570 uA/cm^2 855 uA/cm^2
(b)
Figure 6-16: Impedance spectra collected to determine the influence of DC currenton skin properties. The current bias amplitudes are indicated by the legends. (a)Skin impedance under applied-current conditions. (b) Recovery of skin imped-ance to applied current bias.

148
6.5.2 Identification of Corrupted Data
Selected impedance spectra for each set of experimental conditions were as-
sessed for consistency with the Kramers-Kronig relations according to the method-
ology described in Section 4.1.4. For example, the Measurement Model was fit to
the four spectra collected under the 255 µ/cm2 DC bias condition. The error struc-
ture associated with this set of data was determined. The error structure was used
to weight subsequent regressions to identify portions of the impedance spectra
that were inconsistent with the Kramers-Kronig relations. As mentioned earlier,
this process was repeated for the spectra collected under each set of experimental
conditions.
In general, the spectra were consistent with the Kramers-Kronig relations over
the entire frequency range. This behavior was observed regardless of the applied
current. The general form of the skin impedance response was correlated to the
experimental methodology i.e., whether the system was probed under an applied-
current bias or at the open-circuit condition. For example, a secondary process, in
the form of a small capacitive loop, was observed in the low-frequency portions
of the applied-current spectra. The attribute became more prominent as the cur-
rent amplitude was intensified. In contrast, the secondary peak was absent in the
majority of spectra collected at the 0 µ/cm2 bias amplitude.
The data associated with the secondary peak were consistent with the Kramers-
Kronig relations; however, a complete mechanistic explanation for the feature is
not known. Since the response was observed exclusively in the spectra collected
under a DC current bias, it is likely that the large stationary electric fields induced
by the applied current interacted with the skin differently than the significantly
smaller fields during the 10 mV VAG experiments.
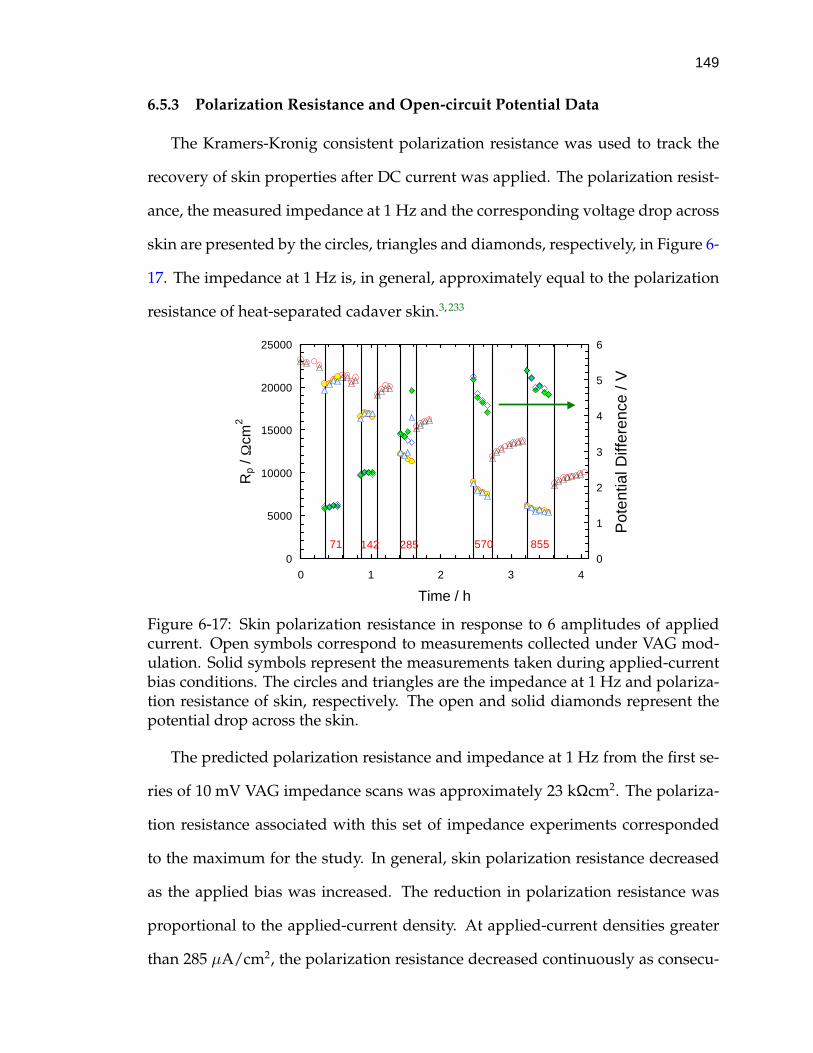
149
6.5.3 Polarization Resistance and Open-circuit Potential Data
The Kramers-Kronig consistent polarization resistance was used to track the
recovery of skin properties after DC current was applied. The polarization resist-
ance, the measured impedance at 1 Hz and the corresponding voltage drop across
skin are presented by the circles, triangles and diamonds, respectively, in Figure 6-
17. The impedance at 1 Hz is, in general, approximately equal to the polarization
resistance of heat-separated cadaver skin.3, 233
0
5000
10000
15000
20000
25000
0 1 2 3 4
Time / h
Rp
/ Ωcm
2
0
1
2
3
4
5
6
Pot
entia
l Diff
eren
ce /
V
71 142 285 570 855
Figure 6-17: Skin polarization resistance in response to 6 amplitudes of appliedcurrent. Open symbols correspond to measurements collected under VAG mod-ulation. Solid symbols represent the measurements taken during applied-currentbias conditions. The circles and triangles are the impedance at 1 Hz and polariza-tion resistance of skin, respectively. The open and solid diamonds represent thepotential drop across the skin.
The predicted polarization resistance and impedance at 1 Hz from the first se-
ries of 10 mV VAG impedance scans was approximately 23 kΩcm2. The polariza-
tion resistance associated with this set of impedance experiments corresponded
to the maximum for the study. In general, skin polarization resistance decreased
as the applied bias was increased. The reduction in polarization resistance was
proportional to the applied-current density. At applied-current densities greater
than 285 µA/cm2, the polarization resistance decreased continuously as consecu-

150
tive impedance scans were collected. The reduction in skin resistance indicated
that the membrane had been altered.
The polarization resistance of skin associated with the 10 mV VAG impedance
experiments demonstrated slightly more complex behavior. For example, after
the spectra were collected at the 71 µA/cm2 bias current, skin resistance was ap-
proximately 21 kΩcm2. This quantity was approximately equal to the polarization
resistance associated with the 71 µA/cm2 bias spectra. As the polarization resist-
ance was identical for the two experimental conditions, the result strongly sug-
gested that the 71 µA/cm2 current bias had not significantly altered skin proper-
ties. Spectra collected by variable-amplitude galvanostatic modulation after skin
was subjected to the larger DC current bias signals demonstrated an increase in
polarization resistance with time. The trend indicated that the alterations induced
by the elevated currents were partially reversible.
The open-circuit potential across the skin was measured before and after each
impedance experiment. The open-circuit measurements are presented as a func-
tion of time in Figure 6-18. In general, the open-circuit potential prior to the 10 mV
VAG modulated impedance scans was greater than the value measured after the
spectra were collected. The opposite trend was observed for all of the impedance
spectra collected under applied bias conditions. The reduction in the open-circuit
potential associated with the 10 mV VAG was likely caused by the introduction of
electrolyte solution into the membrane.
The increase in potential difference across the skin for the applied bias studies
was greatest for the first group of spectra collected after completion of the 10 mV
VAG modulated experiments. For example, the open-circuit potential increased
by 131 mV during the first impedance scan with the 71 µA/cm2. The difference
in open-circuit potentials measured before and after the collection of subsequent
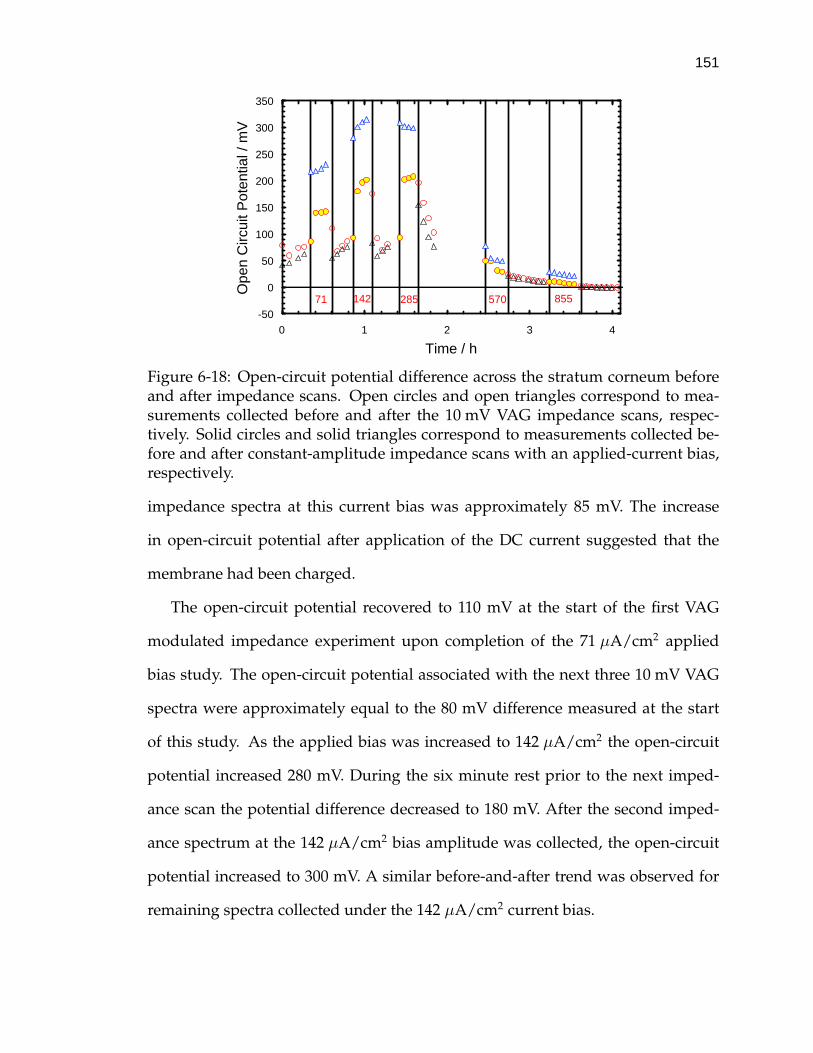
151
-50
0
50
100
150
200
250
300
350
0 1 2 3 4
Time / h
Ope
n C
ircui
t Pot
entia
l / m
V
71 142 285 570 855
Figure 6-18: Open-circuit potential difference across the stratum corneum beforeand after impedance scans. Open circles and open triangles correspond to mea-surements collected before and after the 10 mV VAG impedance scans, respec-tively. Solid circles and solid triangles correspond to measurements collected be-fore and after constant-amplitude impedance scans with an applied-current bias,respectively.
impedance spectra at this current bias was approximately 85 mV. The increase
in open-circuit potential after application of the DC current suggested that the
membrane had been charged.
The open-circuit potential recovered to 110 mV at the start of the first VAG
modulated impedance experiment upon completion of the 71 µA/cm2 applied
bias study. The open-circuit potential associated with the next three 10 mV VAG
spectra were approximately equal to the 80 mV difference measured at the start
of this study. As the applied bias was increased to 142 µA/cm2 the open-circuit
potential increased 280 mV. During the six minute rest prior to the next imped-
ance scan the potential difference decreased to 180 mV. After the second imped-
ance spectrum at the 142 µA/cm2 bias amplitude was collected, the open-circuit
potential increased to 300 mV. A similar before-and-after trend was observed for
remaining spectra collected under the 142 µA/cm2 current bias.
152
The open-circuit potential measurements corresponding to the impedance spec-
tra collected with 10 mV VAG modulation were approximately equal to 80 mV. Af-
ter the first impedance spectrum at the 285 µA/cm2 bias amplitude was obtained,
the open-circuit potential increased to 310 mV. As the skin was allowed to relax
after this scan, the open-circuit potential decreased to 190 mV. Upon completion of
the next spectrum at the 285 µA/cm2 current condition, the open-circuit potential
increased to 300 mV. The same behavior was observed for the remaining spectra
collected with the 285 µA/cm2 current bias.
The open-circuit potential measurements associated with the 10 mV VAG imped-
ance spectra collected after the 285 µA/cm2 bias experiments decreased steadily
with time. The measurements collected with the fourth 10 mV VAG spectrum
were approximately equal to 80 mV. This magnitude was approximately equal
to the open-circuit potential measured at the beginning of this study. It should
be noted that the potential difference induced by the 285 µA/cm2 current bias
was greater than 3 V. The open-circuit potential difference measured with the
570 µA/cm2 and 855 µA/cm2 bias spectra were all less than 80 mV. Furthermore,
the magnitude of the measurements decreased with time. Under these applied-
current conditions, the potential difference across the skin was greater than 4-5 V
at the lowest perturbation frequencies of the impedance scan.
The relatively small open-circuit potentials associated with the impedance spec-
tra collected at bias amplitudes greater than or equal to 285 µA/cm2 suggested
that the internal structure of the skin had been altered by the large electric field.
Modifications to the internal structure of the skin could provide for easier access
of the electrolyte solution into the interior of the membrane. The integration of
electrolyte would cause the conductivity of skin to increase and the open-circuit
potential to decrease. The low open-circuit potentials and the relatively small po-
153
larization resistance of skin associated with these high current bias experiments
were consistent with the proposed structural modifications.
In summary, it was shown that there was a significant effect of current on the
transport properties of skin. The impedance studies indicated that the polarization
resistance of skin decreased in response to an increase in current. A comparison of
the open-circuit potential across skin before and after impedance spectra were col-
lected strongly suggested that the epidermis became charged when the DC current
bias was between 71 µA/cm2 and 285 µA/cm2.
The experiments described here provided an estimate of the polarization be-
havior of skin under applied-current conditions. For these studies, the current
bias was applied for approximately 3 to 4 minutes, which corresponded to the
time required to collect an complete impedance spectrum. As the permeability of
skin to most therapeutic compounds is typically small, clinical protocols for trans-
dermal iontophoresis will likely require that current be applied for much longer
periods of time. The response of cadaver skin to the prolonged application of DC
current is discussed in Chapter 8.
6.6 Variation of Properties with Location
The literature indicates that skin properties vary with body location.14, 15, 16, 17, 18
The experiments described here provided an initial estimate of the variation in the
transport properties of the skin samples used for this body of work. Four pieces
of skin were extracted from adjacent locations of the same donor sample. The skin
was inspected with a magnifying glass to confirm that macroscopic holes were not
present. The sample was essentially free of hair follicles and the surface texture
was relatively uniform.
The impedance response of each piece of skin was measured. The imped-
ance spectra were collected by VAG modulation control where the target poten-

154
tial across the membrane was set to 25 mV. Four impedance spectra were col-
lected for each piece of skin studied. The skin samples were immersed in buffered
50 mM CaCl2. The impedance-plane plot for a single spectrum for each piece of
skin is presented in Figure 6.19(a). A schematic of the relative spatial locations
where the pieces of skin were extracted is shown in Figure 6.19(b).
The polarization resistance values for the specimens listed according to extrac-
tion site were approximately 180, 10, 20 and 120 kΩcm2. The distribution of imped-
ance values clearly demonstrated that skin properties did not track continuously
with the spatial origin of the samples. Large variability in skin impedance was
also observed for pieces of the heat-separated cadaver skin obtained from differ-
ent donors. Since a large database of impedance measurements was collected in
this work, a statistical analysis of variance was performed to estimate the con-
tributions from each source to the total variation in skin properties. A detailed
discussion of the statistical analysis is provided in Chapter 7.
6.7 Comparison of Impedance Data with Literature Results
The work presented in Section 6.2 described the detailed analysis of the influ-
ence of membrane hydration on skin transport properties. Open-circuit poten-
tial measurements and skin impedance spectra were collected to infer when the
system had achieved steady-state. The open-circuit potential across the skin de-
creased from ∼ 120 mV to a uniform reading of ∼ 1 mV within the first 1.5 hours
of the experiment. The impedance spectra indicated that skin polarization resist-
ance decreased continuously over the 5 hour time-frame of the experiment. The
spectra did not conform to the Kramers-Kronig relations at low frequencies which
indicated that the system was still evolving. Impedance spectra collected on the
next day satisfied the Kramers-Kronig relations; therefore, the skin was assumed
to be completely hydrated.

155
-60000
-40000
-20000
0
0 50000 100000 150000
Zr / Ωcm2
Zj /
Ωcm
2
III
IV
I
II
(a)
(b)
Figure 6-19: Impedance spectra and the relative location for skin sample extractionof four pieces of skin. (a) Impedance response of 4 pieces of heat-separated skintaken from adjacent locations of the same donor sample. (b) Schematic of therelative location for skin sample extraction.

156
An important implication of the study was that the electrochemical impedance
spectroscopy technique is more sensitive to changes in skin hydration than open-
circuit potential measurements. Although approximately 24 hours were required
for the skin used in these experiments to achieve steady-state, the majority of other
skin samples presented in the remainder of this work demonstrated a uniform
response within one hour of being immersed in electrolyte.
A limited number of reports which describe the influence of hydration on skin
impedance are available in the literature.152, 206 The continuous decrease in imped-
ance as a function of immersion time observed in this work is consistent with
the reported results.152, 206 Successive skin impedance collected in those investi-
gations were compared visually to identify when the skin hydration process was
complete. A unique feature of the work presented here was that skin spectra were
tested for consistency with Kramers-Kronig relations to determine the steady-state
condition. The advantage of this approach is that data must be stationary in order
to satisfy the Kramers-Kronig relations. The assessment procedure described in
this work provides for more accurate identification of the steady-state condition.
The influence of large sinusoidal voltage swings on skin impedance was de-
scribed in Section 6.4. Variable-amplitude galvanostatic (VAG) modulation was
applied to maintain the amplitude of the potential perturbations at prescribed lev-
els. Skin polarization resistance was found to be inversely proportional to the po-
tential perturbation amplitude. Impedance spectra collected by 10 mV VAG mod-
ulation following the large perturbation amplitude experiments demonstrated an
increase in skin polarization resistance with time. The impedance recovery rate
was not correlated to the voltage perturbation amplitude.
The trends suggest that the relatively large electric fields caused the inter-
nal structure of the epidermis to become more porous. The more open arrange-
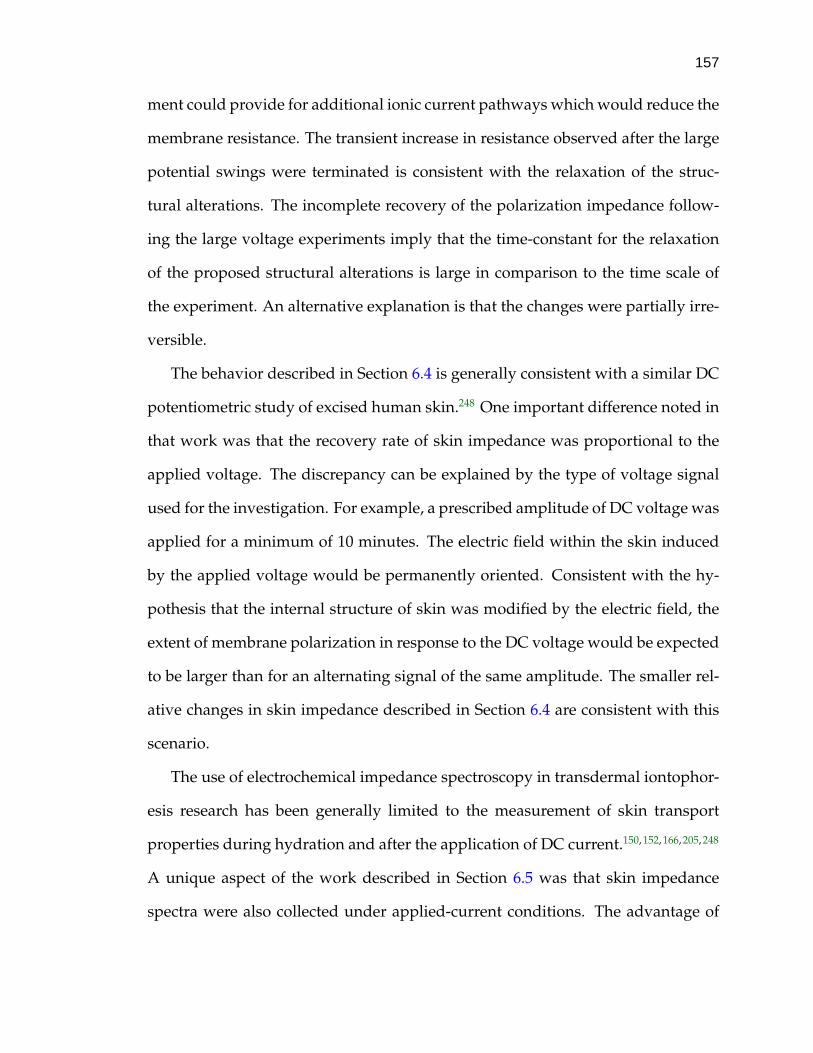
157
ment could provide for additional ionic current pathways which would reduce the
membrane resistance. The transient increase in resistance observed after the large
potential swings were terminated is consistent with the relaxation of the struc-
tural alterations. The incomplete recovery of the polarization impedance follow-
ing the large voltage experiments imply that the time-constant for the relaxation
of the proposed structural alterations is large in comparison to the time scale of
the experiment. An alternative explanation is that the changes were partially irre-
versible.
The behavior described in Section 6.4 is generally consistent with a similar DC
potentiometric study of excised human skin.248 One important difference noted in
that work was that the recovery rate of skin impedance was proportional to the
applied voltage. The discrepancy can be explained by the type of voltage signal
used for the investigation. For example, a prescribed amplitude of DC voltage was
applied for a minimum of 10 minutes. The electric field within the skin induced
by the applied voltage would be permanently oriented. Consistent with the hy-
pothesis that the internal structure of skin was modified by the electric field, the
extent of membrane polarization in response to the DC voltage would be expected
to be larger than for an alternating signal of the same amplitude. The smaller rel-
ative changes in skin impedance described in Section 6.4 are consistent with this
scenario.
The use of electrochemical impedance spectroscopy in transdermal iontophor-
esis research has been generally limited to the measurement of skin transport
properties during hydration and after the application of DC current.150, 152, 166, 205, 248
A unique aspect of the work described in Section 6.5 was that skin impedance
spectra were also collected under applied-current conditions. The advantage of
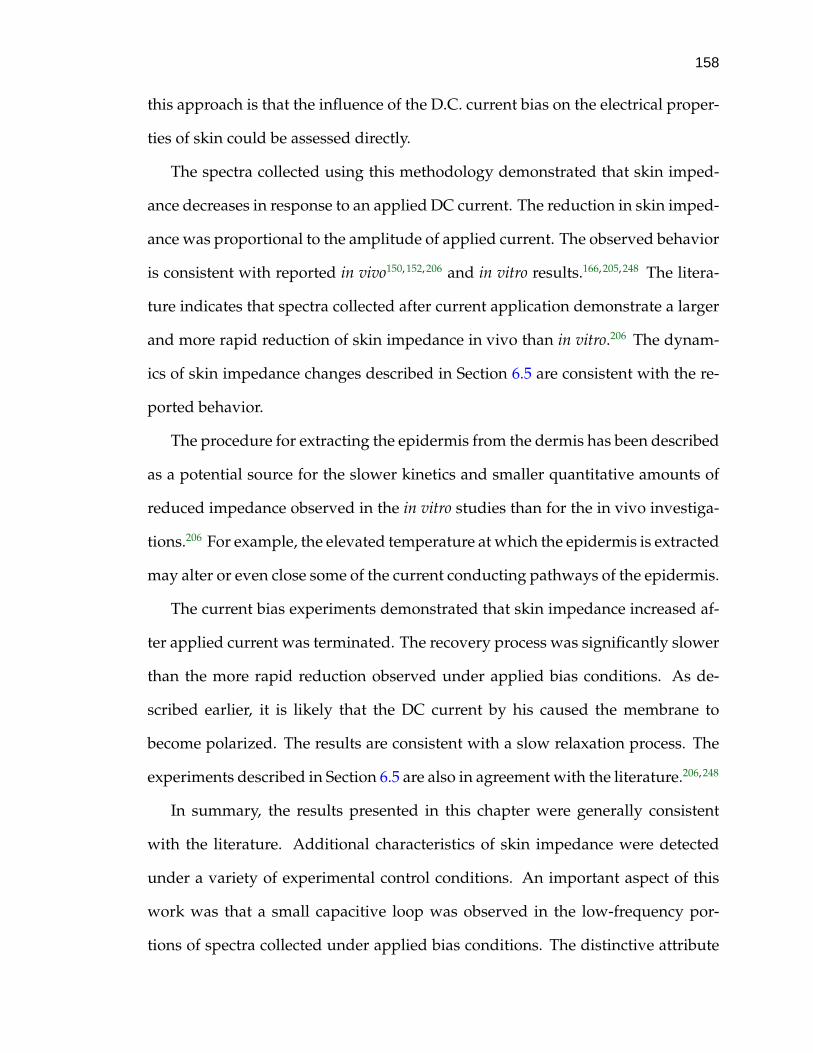
158
this approach is that the influence of the D.C. current bias on the electrical proper-
ties of skin could be assessed directly.
The spectra collected using this methodology demonstrated that skin imped-
ance decreases in response to an applied DC current. The reduction in skin imped-
ance was proportional to the amplitude of applied current. The observed behavior
is consistent with reported in vivo150, 152, 206 and in vitro results.166, 205, 248 The litera-
ture indicates that spectra collected after current application demonstrate a larger
and more rapid reduction of skin impedance in vivo than in vitro.206 The dynam-
ics of skin impedance changes described in Section 6.5 are consistent with the re-
ported behavior.
The procedure for extracting the epidermis from the dermis has been described
as a potential source for the slower kinetics and smaller quantitative amounts of
reduced impedance observed in the in vitro studies than for the in vivo investiga-
tions.206 For example, the elevated temperature at which the epidermis is extracted
may alter or even close some of the current conducting pathways of the epidermis.
The current bias experiments demonstrated that skin impedance increased af-
ter applied current was terminated. The recovery process was significantly slower
than the more rapid reduction observed under applied bias conditions. As de-
scribed earlier, it is likely that the DC current by his caused the membrane to
become polarized. The results are consistent with a slow relaxation process. The
experiments described in Section 6.5 are also in agreement with the literature.206, 248
In summary, the results presented in this chapter were generally consistent
with the literature. Additional characteristics of skin impedance were detected
under a variety of experimental control conditions. An important aspect of this
work was that a small capacitive loop was observed in the low-frequency por-
tions of spectra collected under applied bias conditions. The distinctive attribute

159
was absent in spectra collected at the open-circuit condition. The secondary peak
is not mentioned in the literature. The feature could not be detected in those ex-
periments because impedance spectra were not collected while an applied current
bias was active. It would be interesting to repeat the current bias experiments in
vivo to determine if the low-frequency feature is also present. The absence of a
low-frequency capacitive loop would imply the epidermal extraction procedure
alters skin.
CHAPTER 7STATISTICAL ANALYSIS OF VARIATION IN SKIN IMPEDANCE
A large database of impedance spectra was assembled during the course of this
work. The measurements were collected from pieces of heat-separated cadaver
skin from a variety of different donors. For a given donor sample, the imped-
ance responses from multiple pieces of skin were measured. As demonstrated in
Section 6.6, skin properties from the same donor displayed a wide distribution of
impedance values. A similar variability was also noted when the impedance re-
sponse of skin from different donors was compared. The objective of this analysis
was to apply standard statistical methods to compare the sample-to-sample vari-
ation in skin impedance with the variation of pieces taken from the same donor
sample. A discussion of the analysis of variance in skin impedance data is pro-
vided in Section 7.1. In addition, the effect of electrolyte cation charge on skin
impedance was assessed in a separate analysis. The work for the influence of
cation charge is described in Section 7.5.
The impedance spectra analyzed here were collected by variable-amplitude
galvanostatic (VAG) modulation. The target potential drop across the skin was set
to 25 mV or less and the DC current bias was fixed at 0 µA/cm2. It was demon-
strated earlier in this work (please refer to Sections 5.2 and 6.3) that VAG modu-
lation of skin impedance measurements can be noninvasive, especially when the
target voltage response is kept below 250 mV. The spectra were assessed for con-
sistency with the Kramers-Kronig relations to estimate the polarization resistance
of skin with constant properties. Therefore, it was assumed that the observed dis-
160
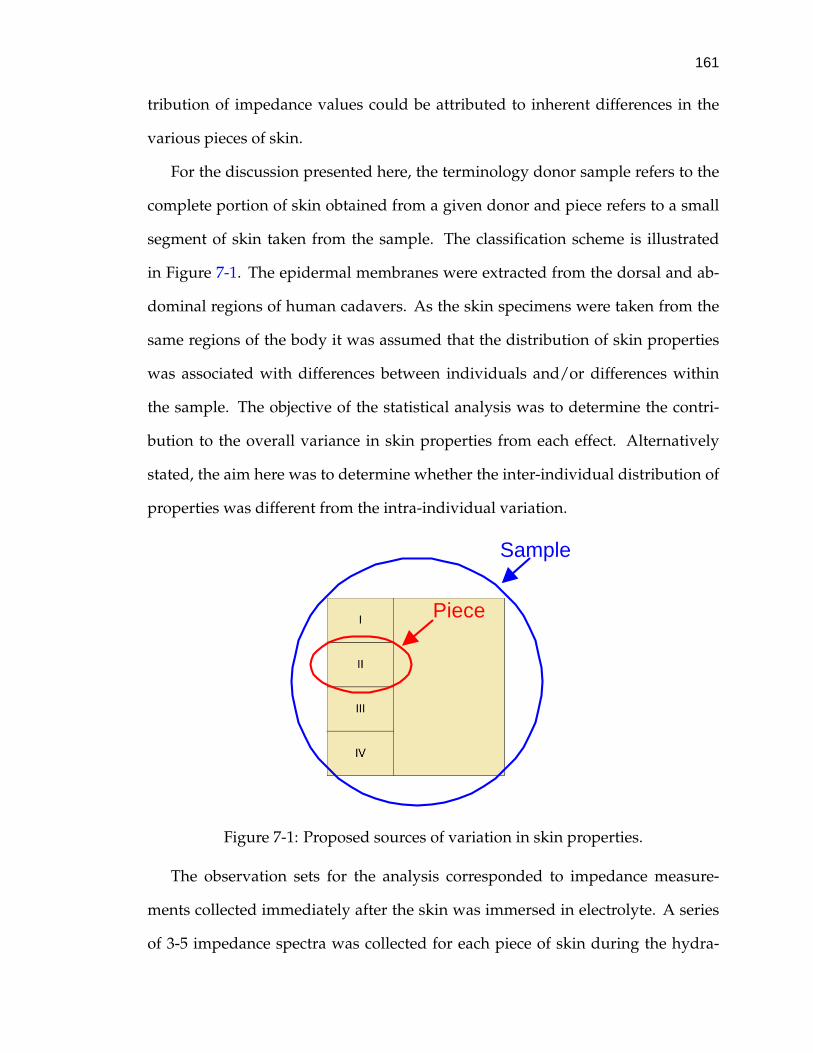
161
tribution of impedance values could be attributed to inherent differences in the
various pieces of skin.
For the discussion presented here, the terminology donor sample refers to the
complete portion of skin obtained from a given donor and piece refers to a small
segment of skin taken from the sample. The classification scheme is illustrated
in Figure 7-1. The epidermal membranes were extracted from the dorsal and ab-
dominal regions of human cadavers. As the skin specimens were taken from the
same regions of the body it was assumed that the distribution of skin properties
was associated with differences between individuals and/or differences within
the sample. The objective of the statistical analysis was to determine the contri-
bution to the overall variance in skin properties from each effect. Alternatively
stated, the aim here was to determine whether the inter-individual distribution of
properties was different from the intra-individual variation.
Sample
Piece
Figure 7-1: Proposed sources of variation in skin properties.
The observation sets for the analysis corresponded to impedance measure-
ments collected immediately after the skin was immersed in electrolyte. A series
of 3-5 impedance spectra was collected for each piece of skin during the hydra-
162
tion period. The skin samples were provided by 18 different donors from which
127 pieces were extracted to perform the experiments. A total of 32 pieces were
immersed in divalent cation electrolyte solutions and 95 in monovalent cation so-
lutions. The entire observation set consisted of 508 impedance spectra. A sample
of skin was considered in the analysis only if studies were conducted on pieces
of skin that were immersed in both monovalent and divalent electrolytes. As the
ionic strength of the monovalent and divalent electrolyte solutions was uniform,
the effect of cation charge on skin impedance was assessed by performing Stu-
dent’s t-tests and F-tests. Further discussion of the respective test procedures is
provided in Section 7.5.
7.1 Statistical Model for Skin Impedance Data
The Generalized Linear Model (GLM) was used to represent the experimental
data because a deterministic process model of skin impedance is not yet available.
The GLM model is a statistical model that describes populations which are nor-
mally distributed about a mean value. The selection of the GLM model was based
on the assumption that donor samples were chosen at random from the general
population. Furthermore, it was also assumed that pieces of skin cut from a given
donor sample were randomly selected. Under these assumptions, deviations from
the mean value are caused by either donor-to-donor variations, site-to-site varia-
tions within a sample, or randomly distributed measurement errors.
The location from which a piece of skin was selected was a subset of the donor
sample; therefore, the nested form of the Generalized Linear Model249 was ap-
plied. The nested form of the Generalized Linear Model is represented by
yi jk = µ + αi + βi j + εi jk (7-1)
where µ is the mean value for the population, αi(i = 1,2 . . . a) are the contributions
to the observations due the donor sample and βi j(k = 1,2 . . . b) are the contribu-
163
tions from the locations on a given donor sample. The term, εi jk(k = 1,2 . . . n),
represents the measurement error. It is assumed that the parameters, αi, βi j and
εi jk are normally distributed with mean values of 0 and respective variances of
σ2(α), σ2(β(α)) and σ2(ε).
The total variance in the impedance data for the Generalized Linear Model can
be decoupled according to
σ2(Total) = σ2(Donor) + σ2(Location(Donor)) + σ2(Residual) (7-2)
where σ2(Total) is the total variance of the population. The term, σ2(Donor) cor-
responds to the contribution to the variance in skin properties from the different
donor samples. Similarly, σ2(Location(Donor)) is the variance in skin properties
within same donor sample. The final term, σ2(Residual), is the variance of the
residual errors. The variance model was applied to the polarization resistance and
critical frequency data sets for each electrolyte type. The relative magnitude of
the donor-to-donor and site-to-site variations were then compared to the variance
in the residual error. The approach made it possible to determine whether the
variance in skin properties among the donor samples and the variance for pieces
of skin from the same sample were significantly larger than the variance in the
residual error.
The relative contributions to the total variance from the various terms of the
Generalized Linear Model were assessed through SAS c© v8.0 software. Separate
analyses were performed where the polarization resistance and the critical fre-
quency were selected chosen as the dependent variables. Type III statistical anal-
ysis was implemented since the data set was unbalanced, i.e., more skin samples
were tested in monovalent electrolyte than in divalent electrolyte.250 The output
from the SAS procedure was presented in standard ANOVA tabular format. The
table columns correspond to the independent variable name, degrees of freedom,
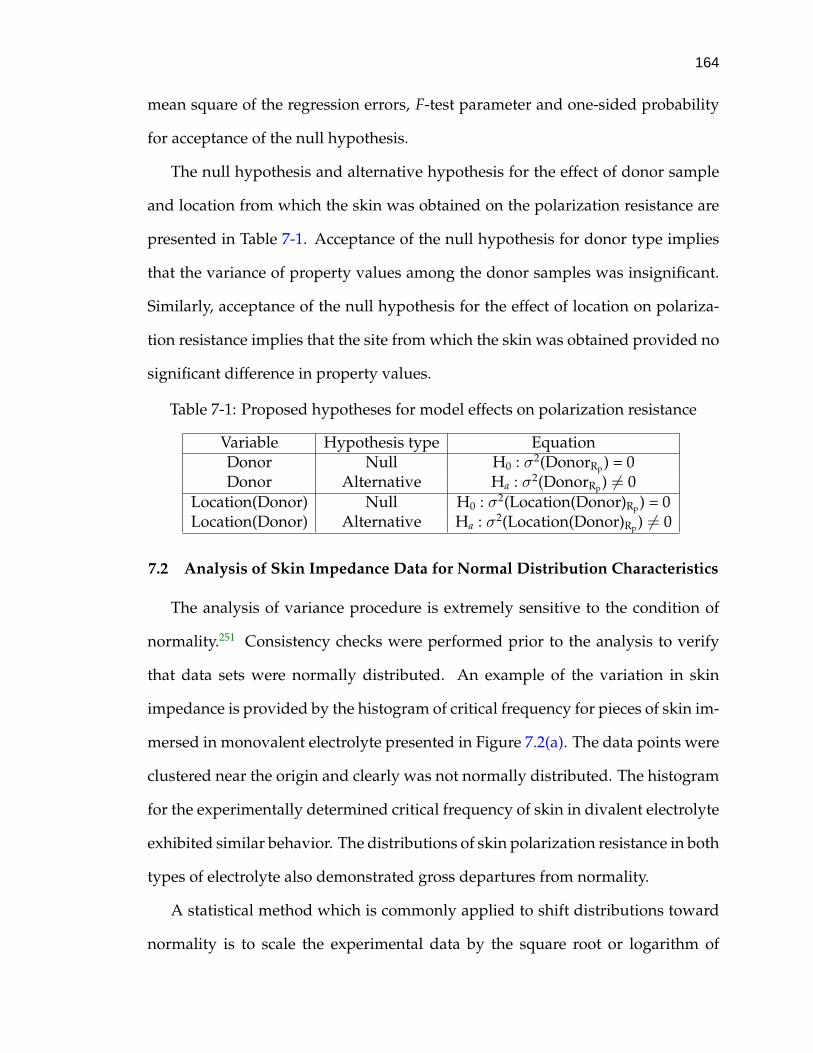
164
mean square of the regression errors, F-test parameter and one-sided probability
for acceptance of the null hypothesis.
The null hypothesis and alternative hypothesis for the effect of donor sample
and location from which the skin was obtained on the polarization resistance are
presented in Table 7-1. Acceptance of the null hypothesis for donor type implies
that the variance of property values among the donor samples was insignificant.
Similarly, acceptance of the null hypothesis for the effect of location on polariza-
tion resistance implies that the site from which the skin was obtained provided no
significant difference in property values.
Table 7-1: Proposed hypotheses for model effects on polarization resistance
Variable Hypothesis type EquationDonor Null H0 : σ2(DonorRp) = 0Donor Alternative Ha : σ2(DonorRp) 6= 0
Location(Donor) Null H0 : σ2(Location(Donor)Rp) = 0Location(Donor) Alternative Ha : σ2(Location(Donor)Rp) 6= 0
7.2 Analysis of Skin Impedance Data for Normal Distribution Characteristics
The analysis of variance procedure is extremely sensitive to the condition of
normality.251 Consistency checks were performed prior to the analysis to verify
that data sets were normally distributed. An example of the variation in skin
impedance is provided by the histogram of critical frequency for pieces of skin im-
mersed in monovalent electrolyte presented in Figure 7.2(a). The data points were
clustered near the origin and clearly was not normally distributed. The histogram
for the experimentally determined critical frequency of skin in divalent electrolyte
exhibited similar behavior. The distributions of skin polarization resistance in both
types of electrolyte also demonstrated gross departures from normality.
A statistical method which is commonly applied to shift distributions toward
normality is to scale the experimental data by the square root or logarithm of
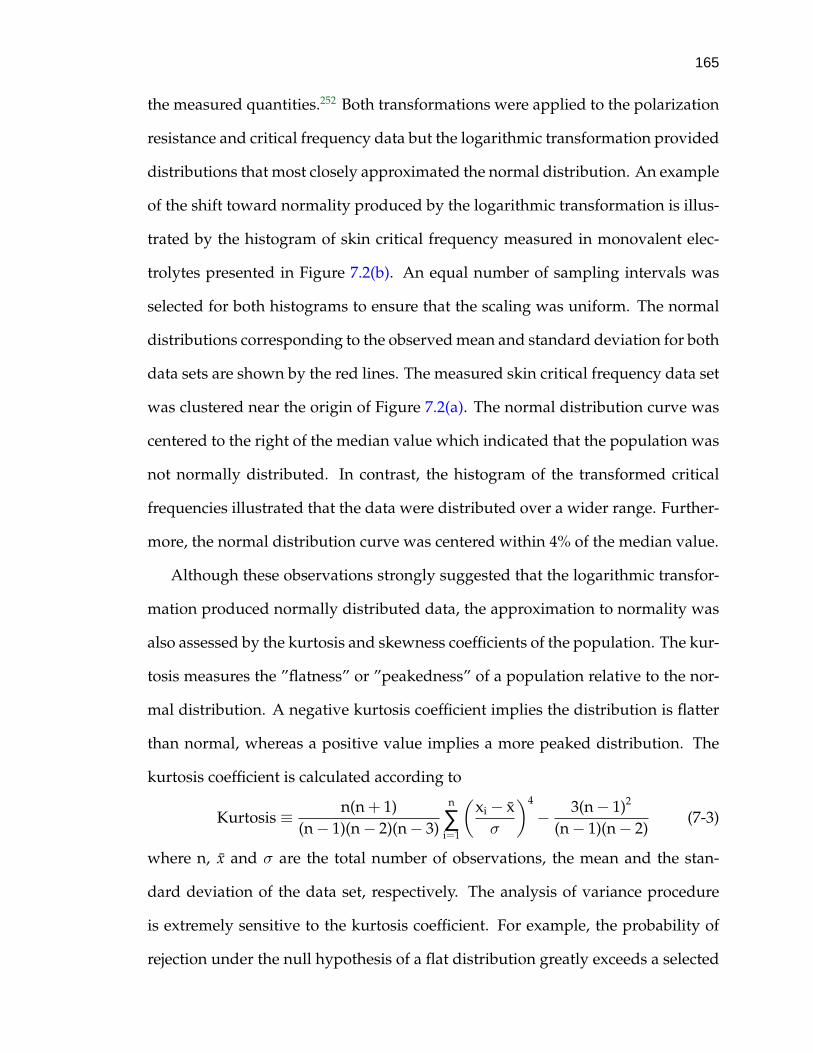
165
the measured quantities.252 Both transformations were applied to the polarization
resistance and critical frequency data but the logarithmic transformation provided
distributions that most closely approximated the normal distribution. An example
of the shift toward normality produced by the logarithmic transformation is illus-
trated by the histogram of skin critical frequency measured in monovalent elec-
trolytes presented in Figure 7.2(b). An equal number of sampling intervals was
selected for both histograms to ensure that the scaling was uniform. The normal
distributions corresponding to the observed mean and standard deviation for both
data sets are shown by the red lines. The measured skin critical frequency data set
was clustered near the origin of Figure 7.2(a). The normal distribution curve was
centered to the right of the median value which indicated that the population was
not normally distributed. In contrast, the histogram of the transformed critical
frequencies illustrated that the data were distributed over a wider range. Further-
more, the normal distribution curve was centered within 4% of the median value.
Although these observations strongly suggested that the logarithmic transfor-
mation produced normally distributed data, the approximation to normality was
also assessed by the kurtosis and skewness coefficients of the population. The kur-
tosis measures the ”flatness” or ”peakedness” of a population relative to the nor-
mal distribution. A negative kurtosis coefficient implies the distribution is flatter
than normal, whereas a positive value implies a more peaked distribution. The
kurtosis coefficient is calculated according to
Kurtosis ≡ n(n + 1)(n− 1)(n− 2)(n− 3)
n
∑i=1
(xi − x
σ
)4
− 3(n− 1)2
(n− 1)(n− 2)(7-3)
where n, x and σ are the total number of observations, the mean and the stan-
dard deviation of the data set, respectively. The analysis of variance procedure
is extremely sensitive to the kurtosis coefficient. For example, the probability of
rejection under the null hypothesis of a flat distribution greatly exceeds a selected

166
0
50
100
150
200
0 2000 4000 6000 8000 10000
fc / Hz
Obs
erva
tion
Fre
quen
cy
(a)
0
5
10
15
20
25
30
0.5 1.1 1.7 2.3 2.9 3.5 4.1
Obs
erva
tion
Fre
quen
cy
log10(fc / Hz)
(b)
Figure 7-2: Histograms of the critical frequency of heat-separated epidermis. (a)Distribution of measured critical frequency values. (b) Data transformed by thebase 10 logarithm.

167
significance level, α, and for a peaked distribution the probability is considerably
less than α.251
The skewness represents the asymmetry of the data relative to the normal dis-
tribution. The effect of skewness on the significance levels of variance tests is much
less extreme than the effect of the kurtosis coefficient.251 Positive skewness indi-
cates an asymmetric distribution where the tail is stretched toward more positive
values, i.e., to the right side of the mean. Alternatively, a negative skewness coeffi-
cient corresponds to a distribution that extends toward more negative values, i.e.,
to the left side of the mean. The skewness is defined by
Skewness ≡ n(n− 1)(n− 2)
n
∑i=1
(xi − x
σ
)3
(7-4)
where n, x and σ are defined in the same manner as for the kurtosis coefficient.
The skewness and kurtosis coefficients for the measured and logrithmically trans-
formed critical frequency data from impedance experiments of skin immersed in
monovalent and divalent electrolyte are presented in Tables 7-2 and 7-3, respec-
tively. Similar distribution statistic tables for the measured and logarithmic trans-
formed polarization resistance data sets are presented in Appendix C. Also, in-
cluded in Appendix C are the square root transformed distribution statistics.
The skewness and kurtosis coefficients describing the distribution of experi-
mentally determined critical frequencies of skin immersed in monovalent elec-
trolyte were 20.79 and 4.35, respectively. The relatively large magnitude of the
distribution parameters indicated that the population was peaked and severely
skewed toward more positive values in comparison to the normal distribution.
The histogram corresponding to the transformed values illustrated that the data
sets was approximately normally distributed. The skewness and kurtosis coeffi-
cients were -6.13x10⁻³ and -4.82x10⁻¹, respectively. The distribution parameters
indicated that the transformed data set was essentially centered about the mean

168
Table 7-2: Distribution statistics for critical frequency as a function of electrolytetype
Variable Divalent MonovalentMean 435.33 715.66
Standard Error 93.54 77.57Median 78.75 169.66Mode 53.65 954.10
Standard Deviation 1020.44 1547.50Sample Variance 1.04x10⁶ 2.39x10⁶
Kurtosis 14.04 20.79Skewness 3.67 4.35Minimum 11.56 3.66Maximum 5.37x10³ 1.16x10⁴
Sum 5.18x10⁴ 2.85x10⁵
Degrees of Freedom 119 398Confidence Level(95.0%) 185.24 152.50
and slightly depressed relative to the normal distribution. The transformed polar-
ization resistance data sets displayed similar trends for measurements collected
with monovalent and divalent electrolytes. In summary, the logarithmic transfor-
mation of the experimental data produced distributions that were approximately
normal and thus satisfied the required conditions for proper interpretation of the
ANOVA investigations.
7.3 Variance Components of Polarization Resistance
The variance components of the log10 transformed skin polarization imped-
ance data for samples immersed in monovalent and divalent electrolyte solutions
are presented in Table 7-4. The results for the monovalent and divalent skin pop-
ulations were very similar. For example, the sample-to-sample contributions to
the overall variance for the monovalent and divalent data sets were 20% and 17%,
respectively. The within-sample variance provided the largest contribution to the
total variance of skin polarization resistance. The relative contributions for the
monovalent and divalent data were 76% and 82%, respectively. The variance in
the residual errors for both electrolyte types provided less than 4% of the total.
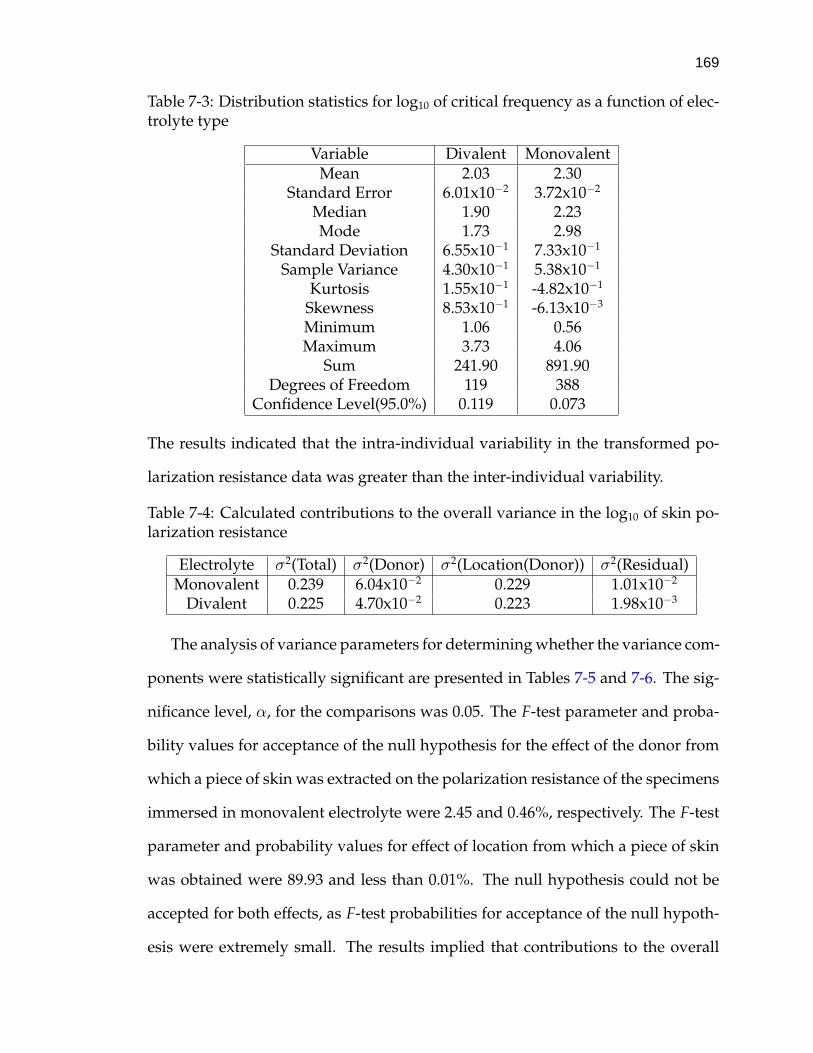
169
Table 7-3: Distribution statistics for log10 of critical frequency as a function of elec-trolyte type
Variable Divalent MonovalentMean 2.03 2.30
Standard Error 6.01x10⁻² 3.72x10⁻²
Median 1.90 2.23Mode 1.73 2.98
Standard Deviation 6.55x10⁻¹ 7.33x10⁻¹
Sample Variance 4.30x10⁻¹ 5.38x10⁻¹
Kurtosis 1.55x10⁻¹ -4.82x10⁻¹
Skewness 8.53x10⁻¹ -6.13x10⁻³
Minimum 1.06 0.56Maximum 3.73 4.06
Sum 241.90 891.90Degrees of Freedom 119 388
Confidence Level(95.0%) 0.119 0.073
The results indicated that the intra-individual variability in the transformed po-
larization resistance data was greater than the inter-individual variability.
Table 7-4: Calculated contributions to the overall variance in the log10 of skin po-larization resistance
Electrolyte σ2(Total) σ2(Donor) σ2(Location(Donor)) σ2(Residual)Monovalent 0.239 6.04x10⁻² 0.229 1.01x10⁻²
Divalent 0.225 4.70x10⁻² 0.223 1.98x10⁻³
The analysis of variance parameters for determining whether the variance com-
ponents were statistically significant are presented in Tables 7-5 and 7-6. The sig-
nificance level, α, for the comparisons was 0.05. The F-test parameter and proba-
bility values for acceptance of the null hypothesis for the effect of the donor from
which a piece of skin was extracted on the polarization resistance of the specimens
immersed in monovalent electrolyte were 2.45 and 0.46%, respectively. The F-test
parameter and probability values for effect of location from which a piece of skin
was obtained were 89.93 and less than 0.01%. The null hypothesis could not be
accepted for both effects, as F-test probabilities for acceptance of the null hypoth-
esis were extremely small. The results implied that contributions to the overall
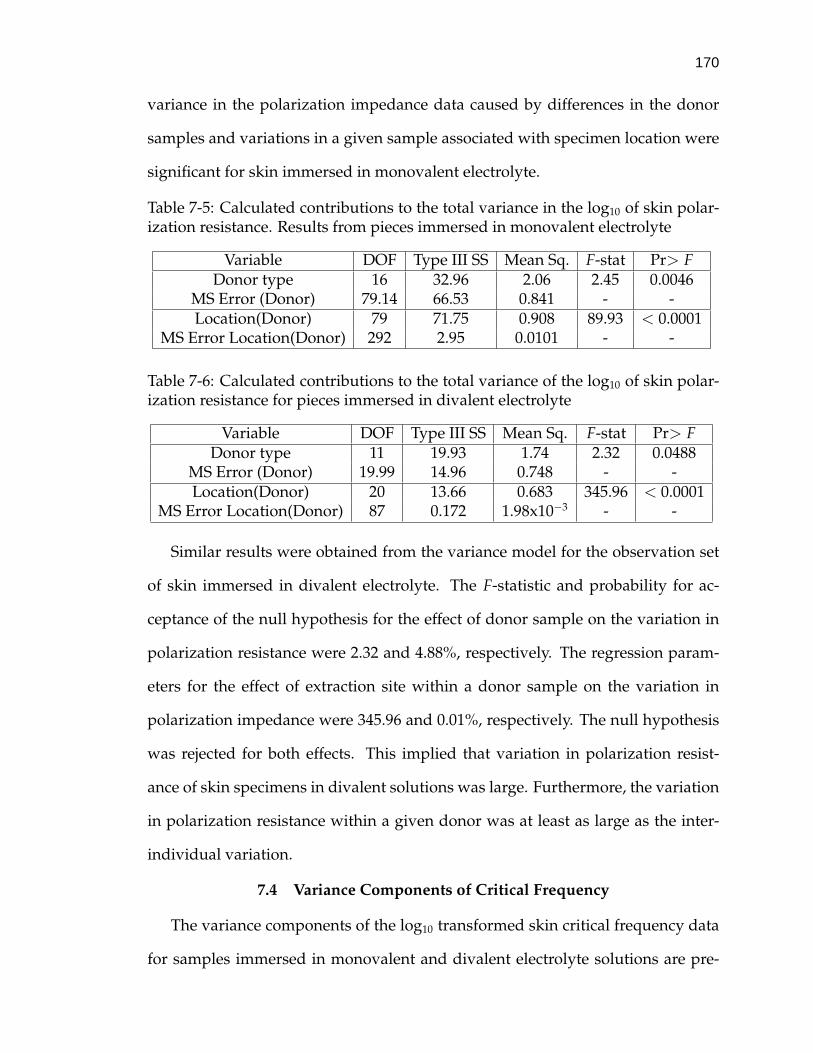
170
variance in the polarization impedance data caused by differences in the donor
samples and variations in a given sample associated with specimen location were
significant for skin immersed in monovalent electrolyte.
Table 7-5: Calculated contributions to the total variance in the log10 of skin polar-ization resistance. Results from pieces immersed in monovalent electrolyte
Variable DOF Type III SS Mean Sq. F-stat Pr> FDonor type 16 32.96 2.06 2.45 0.0046
MS Error (Donor) 79.14 66.53 0.841 - -Location(Donor) 79 71.75 0.908 89.93 < 0.0001
MS Error Location(Donor) 292 2.95 0.0101 - -
Table 7-6: Calculated contributions to the total variance of the log10 of skin polar-ization resistance for pieces immersed in divalent electrolyte
Variable DOF Type III SS Mean Sq. F-stat Pr> FDonor type 11 19.93 1.74 2.32 0.0488
MS Error (Donor) 19.99 14.96 0.748 - -Location(Donor) 20 13.66 0.683 345.96 < 0.0001
MS Error Location(Donor) 87 0.172 1.98x10⁻³ - -
Similar results were obtained from the variance model for the observation set
of skin immersed in divalent electrolyte. The F-statistic and probability for ac-
ceptance of the null hypothesis for the effect of donor sample on the variation in
polarization resistance were 2.32 and 4.88%, respectively. The regression param-
eters for the effect of extraction site within a donor sample on the variation in
polarization impedance were 345.96 and 0.01%, respectively. The null hypothesis
was rejected for both effects. This implied that variation in polarization resist-
ance of skin specimens in divalent solutions was large. Furthermore, the variation
in polarization resistance within a given donor was at least as large as the inter-
individual variation.
7.4 Variance Components of Critical Frequency
The variance components of the log10 transformed skin critical frequency data
for samples immersed in monovalent and divalent electrolyte solutions are pre-
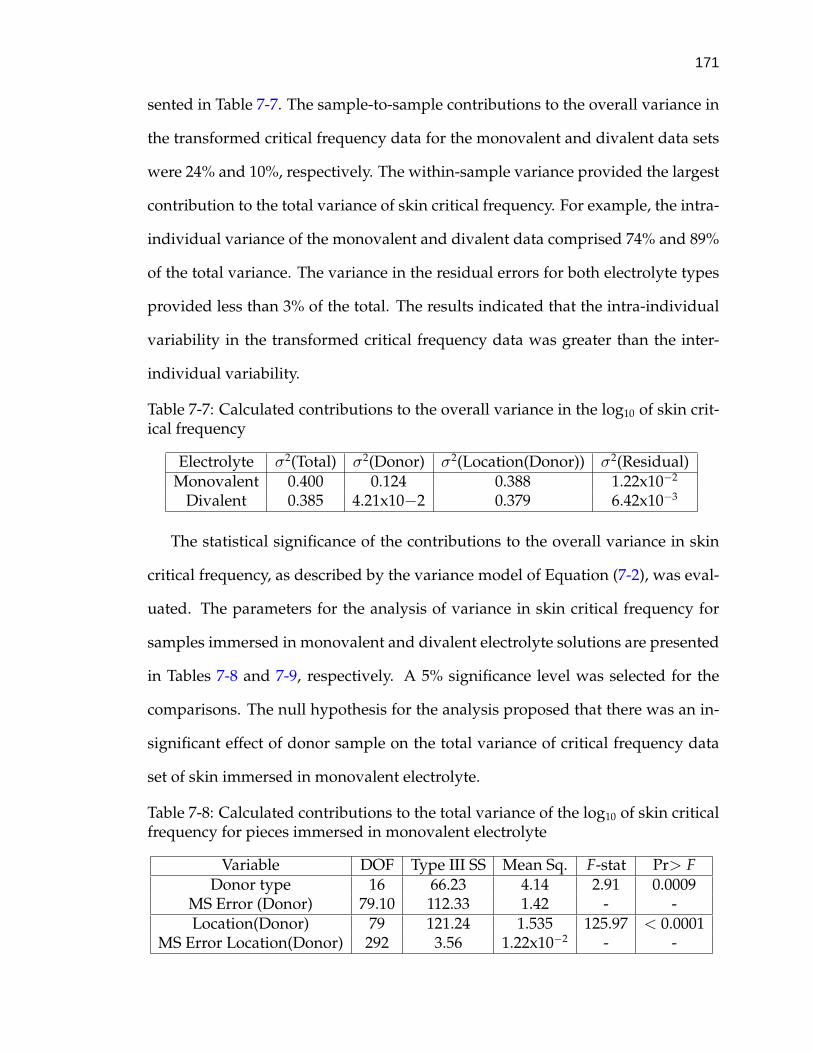
171
sented in Table 7-7. The sample-to-sample contributions to the overall variance in
the transformed critical frequency data for the monovalent and divalent data sets
were 24% and 10%, respectively. The within-sample variance provided the largest
contribution to the total variance of skin critical frequency. For example, the intra-
individual variance of the monovalent and divalent data comprised 74% and 89%
of the total variance. The variance in the residual errors for both electrolyte types
provided less than 3% of the total. The results indicated that the intra-individual
variability in the transformed critical frequency data was greater than the inter-
individual variability.
Table 7-7: Calculated contributions to the overall variance in the log10 of skin crit-ical frequency
Electrolyte σ2(Total) σ2(Donor) σ2(Location(Donor)) σ2(Residual)Monovalent 0.400 0.124 0.388 1.22x10⁻²
Divalent 0.385 4.21x10⁻² 0.379 6.42x10⁻³
The statistical significance of the contributions to the overall variance in skin
critical frequency, as described by the variance model of Equation (7-2), was eval-
uated. The parameters for the analysis of variance in skin critical frequency for
samples immersed in monovalent and divalent electrolyte solutions are presented
in Tables 7-8 and 7-9, respectively. A 5% significance level was selected for the
comparisons. The null hypothesis for the analysis proposed that there was an in-
significant effect of donor sample on the total variance of critical frequency data
set of skin immersed in monovalent electrolyte.
Table 7-8: Calculated contributions to the total variance of the log10 of skin criticalfrequency for pieces immersed in monovalent electrolyte
Variable DOF Type III SS Mean Sq. F-stat Pr> FDonor type 16 66.23 4.14 2.91 0.0009
MS Error (Donor) 79.10 112.33 1.42 - -Location(Donor) 79 121.24 1.535 125.97 < 0.0001
MS Error Location(Donor) 292 3.56 1.22x10⁻² - -

172
Table 7-9: Calculated contributions to the total variance of the log10 of skin criticalfrequency for pieces immersed in divalent electrolyte
Variable DOF Type III SS Mean Sq. F-stat Pr> FDonor type 11 25.61 2.33 1.72 0.14
MS Error (Donor) 19.98 27.00 1.351 - -Location(Donor) 20 24.68 1.234 192.21 < 0.0001
MS Error Location(Donor) 87 0.558 6.42x10⁻³ - -
The F-test parameter and probability values for acceptance of the null hypoth-
esis were 2.91 and 0.09%, respectively. Similarly, the F-test parameter and prob-
ability values for effect of location from which a piece of skin was obtained were
192.21 and less than 0.01%. The null hypothesis for the effect of donor sample on
the critical frequency for skin immersed in monovalent electrolyte was rejected, as
there was only a 0.09% chance of selecting two pieces of skin from different donors
with similar critical frequencies. Alternatively stated, the variation in critical fre-
quency attributed to differences in skin from the donor population was significant.
The F-parameter and probability value for the effect of donor sample of skin
immersed in divalent electrolyte were 1.72 and 14.0%, respectively. Therefore, the
null hypothesis could not be rejected unconditionally. The F-statistic and probabil-
ity value for the site-to-site variation of critical frequency were 192.21 and less than
0.01%, respectively; hence, the null hypothesis was rejected. This implied the vari-
ation in critical frequency of skin immersed in divalent electrolyte associated with
site-to-site differences was greater than variation caused by sample-to-sample dif-
ferences.
In summary, the analysis of variance study indicated that there was a signifi-
cant variation in the log10 polarization impedance and critical frequency of skin for
pieces obtained from the same donor sample and for pieces taken from different
donors. The variation in properties was similar irrespective of the cation charge
in the electrolyte. In other words, the intra-individual variation of skin properties

173
was as great or greater than the inter-individual variation. The results indicated
that pieces of skin taken from the same donor cannot be considered as identical
specimens. Furthermore, the variability in the properties of excised skin extracted
from different donors was also large enough to restrict direct comparison of any
two randomly selected samples. The characteristics of the variation in skin prop-
erties described above are compared with the literature in Section 7.7.
7.5 Effect of Electrolyte on Skin Properties
The results described in Sections 5.2.2, 6.2.2 and 6.3 indicated that the charge of
the cation in the ionic solutions used for an experiment can influence the imped-
ance response of the skin. The mean values and variances of the polarization
resistance and critical frequency data corresponding to skin specimens immersed
in monovalent and divalent solutions were compared to assess the statistical sig-
nificance of the effect of electrolyte composition on skin impedance. The data sets
were classified according to electrolyte type. Student’s t-tests and F-tests were
applied to each class of measurements. As these tests require the observation set
to be normally distributed, the base 10 logarithmic transformed data sets were
selected for analysis.
The null hypotheses for the Student’s t-test and the F-test were that the respec-
tive means and variances of the monovalent and divalent data sets were equal.
Acceptance of the null hypothesis would imply that there was no effect of cation
charge on the impedance response of skin. The null and alternative hypotheses
for the Student’s t-test and F-test are presented in Tables 7-10 and 7-11.
Table 7-10: Proposed hypotheses for comparison of means
Variable Hypothesis type EquationRp or fc Null H0 : µ1 = µ2
Rp or fc Alternative Ha : µ1 6= µ2

174
Table 7-11: Proposed hypotheses for comparison of variance
Variable Hypothesis type EquationRp or fc Null H0 : σ1
2 = σ22
Rp or fc Ha : σ12 > σ2
2
The subscript 1 corresponds to skin transport properties in monovalent elec-
trolyte and, similarly, subscript 2 corresponds to similar skin parameter values
in divalent electrolyte. There was no a priori justification for assuming an equal-
ity of variances, therefore the F-test was applied first. The information obtained
from the F-test guided the selection of an appropriate t-test since it can be applied
under the assumption of equal or unequal variances. The input parameters for
the F-tests were the degree of freedom for each class of measurements and the F-
statistic which is defined by the ratio of variance in data set 1 to variance in data
set 2.
The F-test parameters for comparison of the transformed polarization resist-
ance and critical frequency variances are presented in Tables 7-12 and 7-13, respec-
tively. As the calculated F-statistic was less than the critical F-value for the 95%
significance level in both cases the null hypothesis could not be rejected. There
was a 31.8% chance that the calculated F-statistic for the polarization resistance
was less than the critical F-value and there was a 7.32% chance that the critical
frequency F-statistic was less than the critical F-value. Although the F-tests sug-
gested that there was a small possibility that the variances in skin properties for
each type of electrolyte were equal, the Student’s t-test was applied assuming un-
equal variances.
The input parameters for the Student’s t-test were the adjusted degree of free-
dom and the t-statistic which is the difference between the two means divided by
the weighted standard deviation of the entire sample population. The parameters
for the t-tests of polarization resistance means and critical frequency means for

175
Table 7-12: F-test statistics for comparison of variances in the log10 of polarizationresistance for each electrolyte type
Statistic Monovalent DivalentMean 4.46 4.73
Sample Variance 3.02x10⁻¹ 2.80x10⁻¹
Observations 388 119Degrees of Freedom 387 118
F-statistic 1.08Pr(F < Fcritical) 3.18x10⁻¹
Fcritical 1.29Table 7-13: F-test parameters for comparison of variances in the log10 of criticalfrequency for each electrolyte type
Statistic Monovalent DivalentMean 2.30 2.03
Sample Variance 5.38x10⁻¹ 4.30x10⁻¹
Observations 388 119Degrees of Freedom 387 118
F-statistic 1.25Pr(F < Fcritical) 7.32x10⁻²
Fcritical 1.29
the two electrolytes are listed in Tables 7-14 and 7-15, respectively. As the absolute
value of the calculated t-statistic exceeded the critical t-value for both compar-
isons means the null hypothesis was rejected for each population. The rejection
of the null hypothesis implied that the mean values of skin properties in each
electrolyte were different. Alternatively stated, the impedance response of skin in
divalent electrolyte was different from that of monovalent electrolyte. The result
is in agreement with the hypothesis that divalent cations interact with the stratum
corneum in a manner differently than monovalent cations.
7.6 Correlation Between Critical Frequency and Polarization Resistance
The contributions to the overall variance in the critical frequency and polar-
ization resistance of excised stratum corneum showed a similar dependence on
donor sample and location within a sample. This result suggested that the prop-
erties were correlated. The strength of the correlation between critical frequency

176
Table 7-14: Student’s t-test output statistics for comparison of means in the log10
of polarization resistance for each electrolyte type
Statistic Monovalent DivalentMean 4.46 4.73
Sample Variance 3.02x10⁻¹ 2.80x10⁻¹
Observations 388 119Hypothesized Mean Difference 0
Degrees of Freedom 202t-value (two-tailed) 4.84
Pr(t < tcritical) 2.60x10⁻⁶
tcritical (two-tailed) 1.97Table 7-15: Student’s t-test output statistics for comparison of means in the log10
of critical frequency for each electrolyte type
Statistic Monovalent DivalentMean 2.30 2.03
Sample Variance 5.38x10⁻¹ 4.30x10⁻¹
Observations 388 119Hypothesized Mean Difference 0
Degrees of Freedom 216t-value (two-tailed) -3.76
Pr(t < tcritical) 2.17x10⁻⁴
tcritical (two-tailed) 1.97
and polarization resistance of skin was assessed by linear regression. The log10
transformed critical frequency and polarization resistance were selected as the de-
pendent and independent variables, respectively. Separate regressions were per-
formed on the monovalent and divalent observation sets.
The relationship between the critical frequency and polarization resistance is
presented in graphical form by Figure 7-3. The open circles represent the data set
for skin in monovalent electrolyte and the open diamonds represent the data set
of skin in divalent electrolyte. The solid line represents the relationship between
the critical frequency and polarization resistance obtained by a regression of a
linear model to the entire data set. The estimated linear expression relating the
two quantities is presented by
log10(fc) = −1.218xlog10(Rp) + 7.743 (7-5)
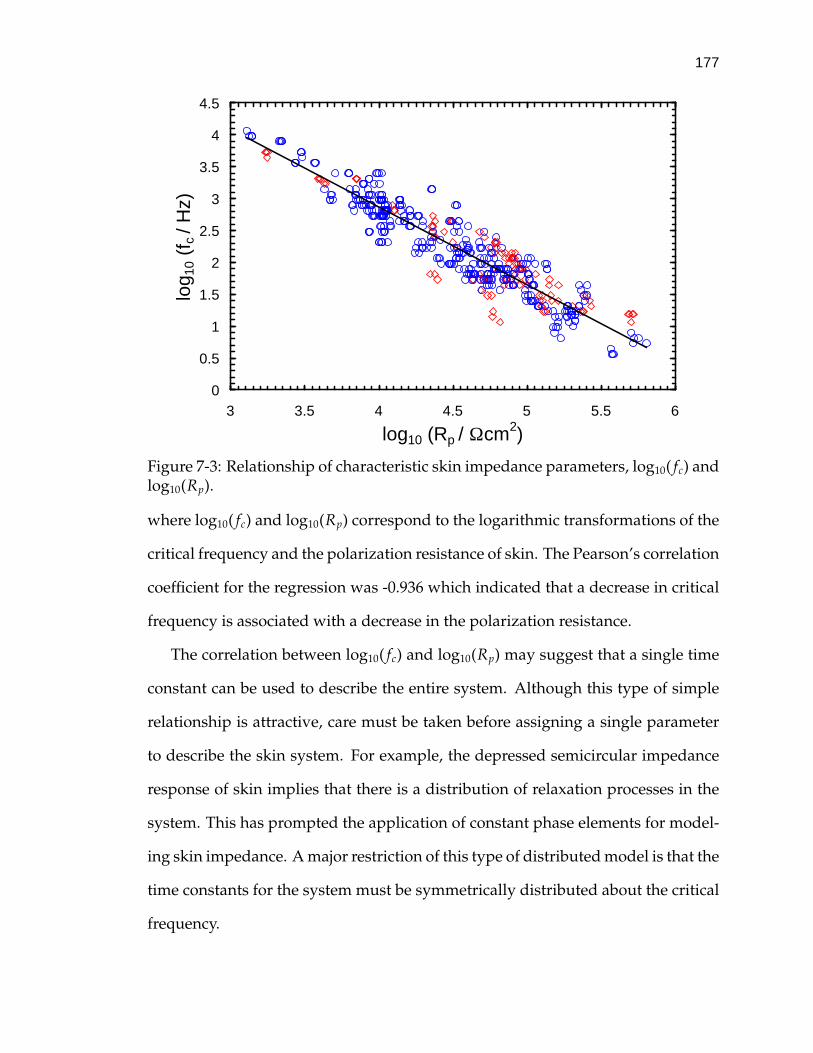
177
0
0.5
1
1.5
2
2.5
3
3.5
4
4.5
3 3.5 4 4.5 5 5.5 6
log10 (Rp / Ωcm2)
log 1
0 (f
c / H
z)
Figure 7-3: Relationship of characteristic skin impedance parameters, log10( fc) andlog10(Rp).
where log10( fc) and log10(Rp) correspond to the logarithmic transformations of the
critical frequency and the polarization resistance of skin. The Pearson’s correlation
coefficient for the regression was -0.936 which indicated that a decrease in critical
frequency is associated with a decrease in the polarization resistance.
The correlation between log10( fc) and log10(Rp) may suggest that a single time
constant can be used to describe the entire system. Although this type of simple
relationship is attractive, care must be taken before assigning a single parameter
to describe the skin system. For example, the depressed semicircular impedance
response of skin implies that there is a distribution of relaxation processes in the
system. This has prompted the application of constant phase elements for model-
ing skin impedance. A major restriction of this type of distributed model is that the
time constants for the system must be symmetrically distributed about the critical
frequency.

178
7.7 Comparison of Variation in Skin Impedance with Literature Results
The literature indicates that stratum corneum properties, such as thickness and
lipid composition, display considerable variation with location on the body (inter-
individual variation).13, 14, 16, 17, 253 and between individuals for a given anatomi-
cal region (inter-individual variation).16 There is a general consensus that differ-
ences in the composition and structure of stratum corneum lipids are responsible
for variations in the permeability and impedance in skin.13, 24, 35, 46, 67 Despite this
consensus, the relationship between the state of stratum corneum lipids and the
macroscopic transport properties of the membrane has not been completely char-
acterized.16
Statistical analysis was applied to in vivo skin data to determine that the inter-
individual variability of stratum corneum lipid components was significantly larger
than the intra-individual variability.16 The regional variation in skin impedance
was also found to be significant; however, the variation between individuals was
not assessed. In the work described in this chapter, the nested form of the Gen-
eralized Linear Model249 was applied to evaluate similar sources of variation in
impedance data from the hydration of heat-separated cadaver skin. The results
indicated that the intra-individual variability in skin impedance was greater than
the person-to-person variability.
The large variability in skin impedance could have significant impact on the
design and placement of transdermal iontophoresis devices if similar results are
found for in vivo human skin. For example, low skin impedance has been associ-
ated with relatively high membrane permeability.112, 131, 163 Identification of these
low impedance sites could guide the placement of transdermal delivery devices
on the body. This type of placement strategy has other advantages. It was demon-
strated earlier in this text (see, for example, Section 5.2) that large potential dif-
179
ferences can alter skin properties. Topical irritation during clinical transdermal
iontophoresis studies has been associated with high impedance skin.254 Therefore,
placement of the iontophoretic transdermal patch over low impedance skin may
prevent patient discomfort.
Statistical analysis techniques, such as Student’s t-tests and F-tests, were im-
plemented in this work to identify the influence of electrolyte cation charge on
the impedance of heat-separated cadaver skin. The evaluations revealed that the
impedance response of skin in monovalent cation solutions was different from
the response in divalent cation electrolyte. The result that cation type influences
skin impedance is in agreement152 and in conflict207 with reported findings. The
inconsistent literature results were obtained by the same research group using a
similar methodology. For example, electric circuit models were regressed to the
impedance spectra to obtain representative quantities for skin resistance and ca-
pacitance. The effect of cation type on the recovery of skin to iontophoresis was
assessed using circuit parameters.
Despite the similar of the experimental approach, important differences were
present in the two investigations. For example, a different circuit network was
regressed to each set of skin impedance data. The standard deviations of the re-
gressed circuit elements were approximately 10-20% of the parameter values. In
addition, the number of skin samples probed in the studies were 2 and 5, respec-
tively. There is a strong possibility that the relatively large uncertainty in the cir-
cuit parameters coupled with the small sample sizes led to erroneous conclusions
for the effect of cation type on skin impedance. The work presented in this chap-
ter was much less susceptible to these type of errors because the number of skin
samples investigated was at an order of magnitude larger. The larger sample size
would improve the confidence of the statistical of regressions.
CHAPTER 8POTENTIAL AND CURRENT STEP-CHANGE STUDIES
The influence of alternating current and potential on the properties of skin was
demonstrated in Chapters 5 and 6. The results indicated that skin properties begin
to change at a critical potential. The majority of the impedance studies were con-
ducted with a zero DC current bias, i.e., at the open-circuit condition. Under such
conditions the skin was allowed to partially depolarize during each complete per-
turbation cycle of the impedance scan. Since a nonzero current bias is applied dur-
ing transdermal iontophoresis to enhance drug delivery rates, it is likely that the
skin will become polarized. The influence of a nonzero current bias on skin prop-
erties was investigated by impedance spectroscopy (see, for example Section 6.5),
however, the current was only applied for approximately five minutes.
Transdermal iontophoretic delivery rates are typically small;133, 255 therefore,
protocols for commercial iontophoretic devices will likely require current to be
applied for much longer periods of time. The purpose of this work was to deter-
mine the response of skin to elevated DC current and potential signals. The major
difference of this study from the previous work described in this text is that the
DC bias signals were applied for longer time intervals. The general approach was
to perturb the skin from the open-circuit condition with a step-change in DC cur-
rent or potential. The system response was monitored at the elevated condition
for a minimum of 20 minutes. The skin was then allowed to relax at the open-
circuit condition. The results for the potential and current step-change studies are
presented in Sections 8.1 and 8.2, respectively.
180
181
8.1 Potential Step-Change Results
The experimental data presented here were obtained according to the method-
ology described in Section 4.2. Impedance spectra were not collected for these
studies. Electrical properties, such as the polarization impedance, were estimated
by regressing a linear model to the current-potential data collected at potentials
between 10 and 100 mV. It was assumed that skin properties were not altered at
these relatively low perturbation amplitudes. Microsoft Excel c© was used for the
regressions where current was selected as the independent variable and potential
as the dependent variable. A fit of the linear model to the data yielded estimates
for the DC electrical properties of skin. For example, the slope of the linear model
represents the polarization resistance and the intercept is the open-circuit poten-
tial. Confidence in the linear model was provided by the r2 correlation parameter
for each regression.
8.1.1 Model Predictions of Skin Polarization Resistance
The linear model was regressed to the low-amplitude potential bias data for
all four sets of experiments. A sample plot of the current-potential data with
the regression line is provided by Figure 8-1. The polarization resistance, open-
circuit potential and r2 coefficients for the four sets of experiments are presented
in Table 8-1.
The linear model provided excellent fits to the data sets, as the r2 coefficients
were all greater than 0.997. The estimated values of the polarization impedance
ranged from 14.6 kΩcm2 to 25.1 kΩcm2. The open-circuit potentials obtained from
the fits were between 12.7 mV and 25.3 mV. The polarization impedance and
open-circuit potential values from the regressions were comparable to the mea-
surements obtained in impedance spectroscopy studies.
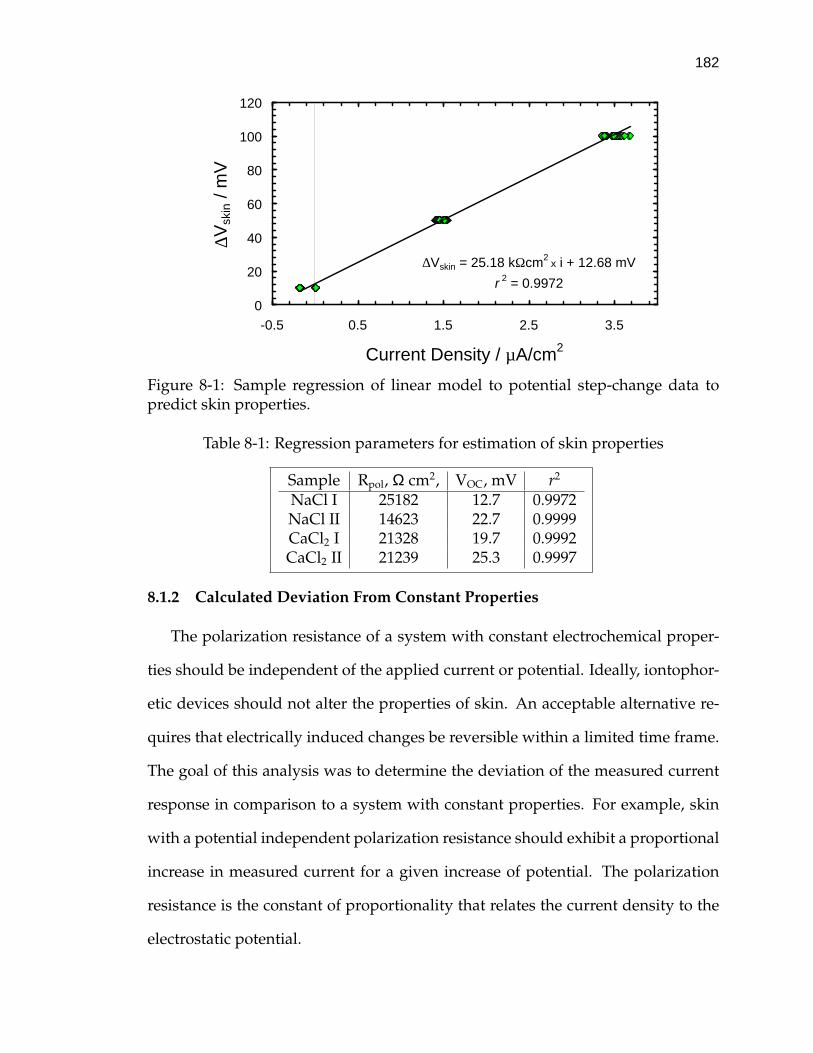
182
∆Vskin = 25.18 kΩcm2 x i + 12.68 mV
r 2 = 0.9972
0
20
40
60
80
100
120
-0.5 0.5 1.5 2.5 3.5
Current Density / µA/cm2
∆Vsk
in /
mV
Figure 8-1: Sample regression of linear model to potential step-change data topredict skin properties.
Table 8-1: Regression parameters for estimation of skin properties
Sample Rpol, Ω cm2, VOC, mV r2
NaCl I 25182 12.7 0.9972NaCl II 14623 22.7 0.9999CaCl2 I 21328 19.7 0.9992CaCl2 II 21239 25.3 0.9997
8.1.2 Calculated Deviation From Constant Properties
The polarization resistance of a system with constant electrochemical proper-
ties should be independent of the applied current or potential. Ideally, iontophor-
etic devices should not alter the properties of skin. An acceptable alternative re-
quires that electrically induced changes be reversible within a limited time frame.
The goal of this analysis was to determine the deviation of the measured current
response in comparison to a system with constant properties. For example, skin
with a potential independent polarization resistance should exhibit a proportional
increase in measured current for a given increase of potential. The polarization
resistance is the constant of proportionality that relates the current density to the
electrostatic potential.

183
The deviation from constant properties was assessed by comparing the mea-
sured current to the response expected from skin with a potential independent
polarization resistance. The approach here was to predict the current response to
potential step-changes greater than 100 mV from the polarization resistance calcu-
lated by the regression procedure described in Section 8.1. The predicted current
for skin with constant properties was calculated according to
Ipredict,linear =(Vapplied −VOC)
Rpol(8-1)
where Vapplied is the applied potential in volts, VOC is the open-circuit potential
in volts and Rpol is the polarization resistance in units of ohm-square centimeters.
The difference between the predicted current and the measured current was cal-
culated for all of the step-change studies. This difference provided a measure of
the departure from a linear response in skin properties induced by the potential
step-change. The average difference in current over the potential bias interval was
also calculated. The standard deviation of the difference provided a measure of
the nonlinear and nonstationary condition of the current response.
The deviation in the measured current response from skin with a constant po-
larization resistance is presented as a function of time and potential in Figure 8-2.
The deviation in current is plotted on the left ordinate and the applied potential
is plotted on the right ordinate. For potential step-changes lower than 250 mV,
the observed deviation in the measured current response was generally less than
100 nA/cm2. As the applied potential was increased to 250 mV, the deviations in
the current response increased to approximately 1 µA/cm2. For the 500 mV ex-
periments the current deviation was, in general, smallest immediately after the
step-change was applied and increased continuously for approximately 10 min-
utes. For the remainder of the 500 mV bias interval the deviation in current ranged
from 2-6 µA/cm2. At the 500 mV bias level the deviations in current response from
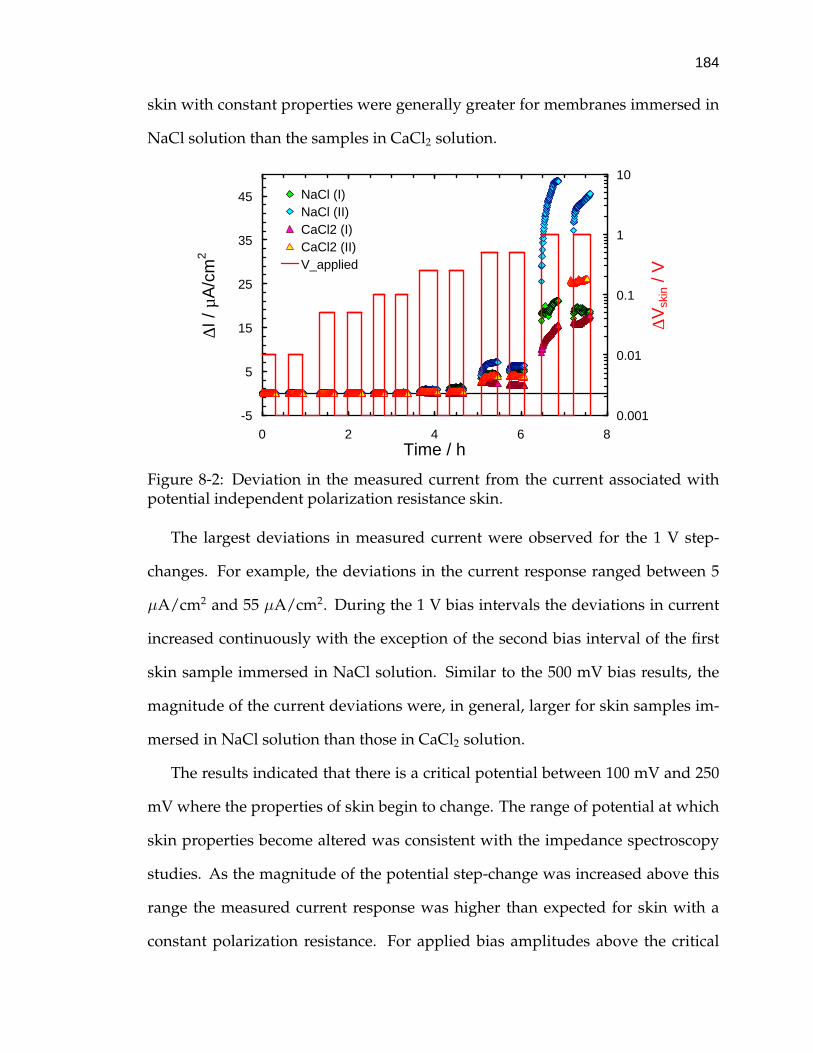
184
skin with constant properties were generally greater for membranes immersed in
NaCl solution than the samples in CaCl2 solution.
-5
5
15
25
35
45
0 2 4 6 8Time / h
∆I /
µA/c
m2
0.001
0.01
0.1
1
10
∆Vsk
in /
V
NaCl (I)NaCl (II)CaCl2 (I)CaCl2 (II)V_applied
Figure 8-2: Deviation in the measured current from the current associated withpotential independent polarization resistance skin.
The largest deviations in measured current were observed for the 1 V step-
changes. For example, the deviations in the current response ranged between 5
µA/cm2 and 55 µA/cm2. During the 1 V bias intervals the deviations in current
increased continuously with the exception of the second bias interval of the first
skin sample immersed in NaCl solution. Similar to the 500 mV bias results, the
magnitude of the current deviations were, in general, larger for skin samples im-
mersed in NaCl solution than those in CaCl2 solution.
The results indicated that there is a critical potential between 100 mV and 250
mV where the properties of skin begin to change. The range of potential at which
skin properties become altered was consistent with the impedance spectroscopy
studies. As the magnitude of the potential step-change was increased above this
range the measured current response was higher than expected for skin with a
constant polarization resistance. For applied bias amplitudes above the critical

185
potential, the magnitude of the deviation in current increased nonlinearly with
increasing values of potential bias. In general, the relative deviation in measured
current response from a constant property system was greater for skin immersed
in NaCl electrolyte than in CaCl2 electrolyte. The larger deviations observed for
the monovalent electrolyte solutions was also consistent with the electrochemical
impedance spectroscopy studies presented in Sections 5.2.2, 6.2.2 and 6.3.
8.2 Current Step-Change Results
The electrochemical impedance studies and the potential step-change experi-
ments described in Sections 5.2 and 8.1, respectively, indicated that skin properties
become altered above a critical potential. The objective of this study was to deter-
mine whether skin properties change above a critical current. The approach here
was to subject skin to a series of step-changes in current and monitor the potential
response. The amplitudes of the current step signals were 1.4 µA/cm2, 14 µA/cm2
and 140 µA/cm2. In general, the current step-change was held at the elevated con-
dition for 40 minutes. The experimental protocol of the studies presented here was
analogous to the methodology described in Section 8.1. However, in this case, a
current step-change was applied across the skin and the potential response was
measured.
Two pieces of skin were extracted from the same donor sample and subjected
to the same series of current step-changes. The amplitude and sequence of the
applied-current signals were identical. The skin specimens were immersed in
buffered 150 mM NaCl electrolyte. A series of four 10 mV VAG impedance spectra
were collected at the open-circuit condition i.e., iDC,applied = 0, before and after the
applied DC current steps. The spectra provided information on the recovery of
skin properties to the elevated current signals. The results from the studies with
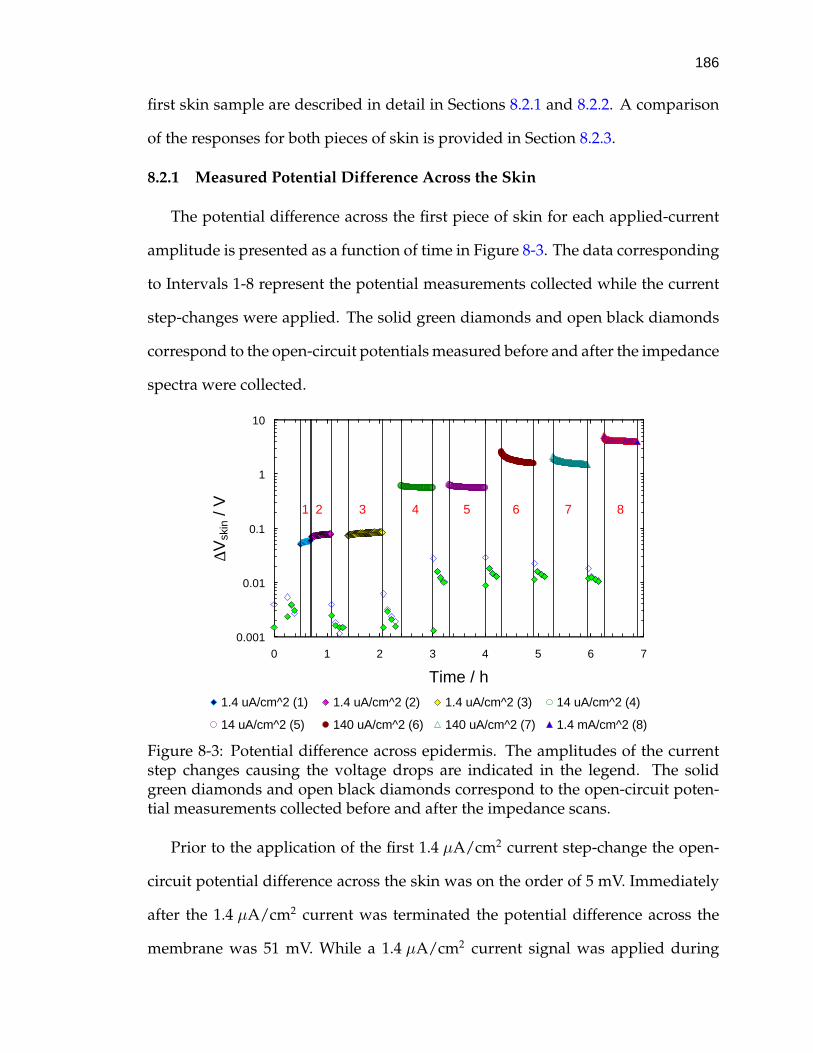
186
first skin sample are described in detail in Sections 8.2.1 and 8.2.2. A comparison
of the responses for both pieces of skin is provided in Section 8.2.3.
8.2.1 Measured Potential Difference Across the Skin
The potential difference across the first piece of skin for each applied-current
amplitude is presented as a function of time in Figure 8-3. The data corresponding
to Intervals 1-8 represent the potential measurements collected while the current
step-changes were applied. The solid green diamonds and open black diamonds
correspond to the open-circuit potentials measured before and after the impedance
spectra were collected.
0.001
0.01
0.1
1
10
0 1 2 3 4 5 6 7
Time / h
∆Vsk
in /
V
1.4 uA/cm^2 (1) 1.4 uA/cm^2 (2) 1.4 uA/cm^2 (3) 14 uA/cm^2 (4)
14 uA/cm^2 (5) 140 uA/cm^2 (6) 140 uA/cm^2 (7) 1.4 mA/cm^2 (8)
2 3 4 51 876
Figure 8-3: Potential difference across epidermis. The amplitudes of the currentstep changes causing the voltage drops are indicated in the legend. The solidgreen diamonds and open black diamonds correspond to the open-circuit poten-tial measurements collected before and after the impedance scans.
Prior to the application of the first 1.4 µA/cm2 current step-change the open-
circuit potential difference across the skin was on the order of 5 mV. Immediately
after the 1.4 µA/cm2 current was terminated the potential difference across the
membrane was 51 mV. While a 1.4 µA/cm2 current signal was applied during

187
Intervals 2 and 3 the potential difference across the skin gradually increased to
86 mV. The increase in the potential difference was consistent with an increase
in the polarization resistance of skin. The open-circuit potential measurements
collected after the applied current was terminated were approximately 5 mV. The
open-circuit potential decreased with time during all of the recovery periods fol-
lowing the current step-changes. The relaxation of open-circuit potential sug-
gested that the skin had become slightly charged while the step-change was ap-
plied.
Intervals 4 and 5 correspond to the voltage responses to the 14 µA/cm2 per-
turbations. The membrane potential difference was 627 mV immediately after the
current step-change was applied. The potential difference across the membrane
decreased continuously while the current was applied. The potential drop at the
end of step-change Interval 4 was 569 mV. A gradual decrease in the potential dif-
ference across the skin was also observed during Interval 5. For example, the volt-
age difference across the epidermis was 638 mV immediately after the 14 µA/cm2
signal was applied and 567 mV just before the current was terminated. The grad-
ual decrease in the potential difference across skin indicated that the membrane
polarization resistance had decreased. The results were consistent with the hy-
pothesis that skin properties begin to change as the potential difference across the
membrane exceeds 250 mV.
The open-circuit potentials measured immediately after the 14 µA/cm2 cur-
rent was terminated were on the order of 20 mV. During a given recovery period,
the open-circuit potential decreased over time. The decay in the open-circuit po-
tential response suggested that the state and/or distribution of charge within the
skin changed during the application of the 14 µA/cm2 current signal. For exam-
ple, it is possible that the passage of current modified the internal structure of
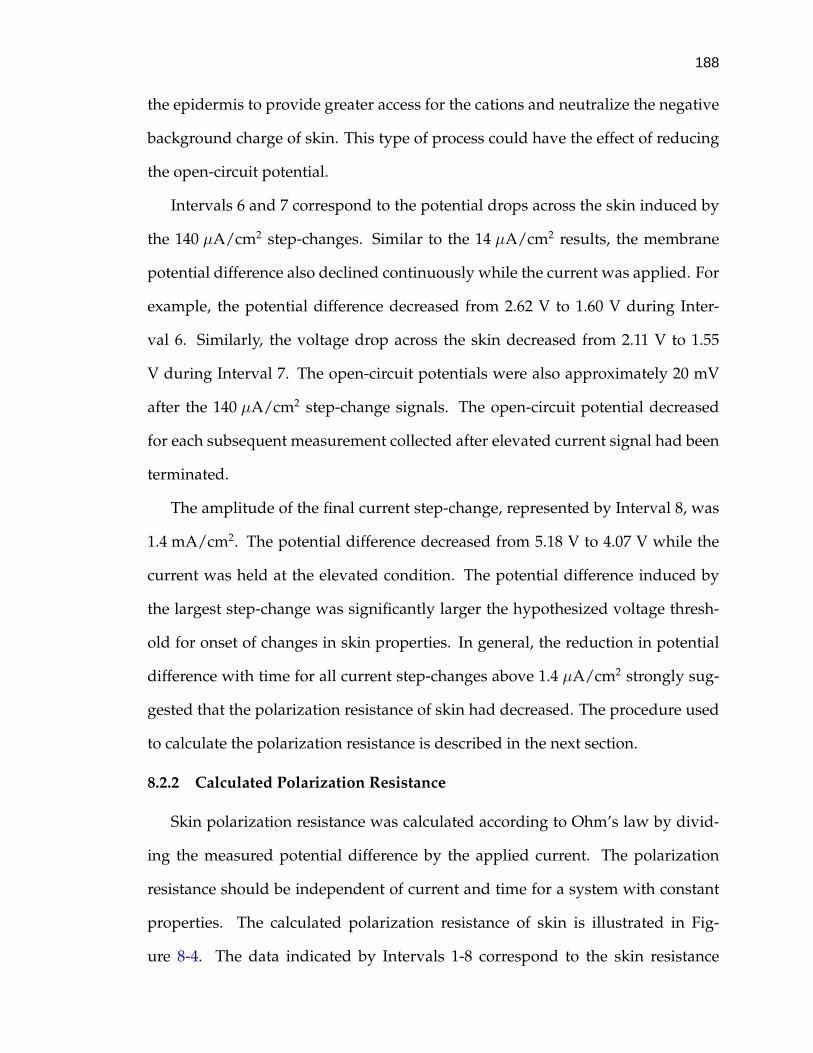
188
the epidermis to provide greater access for the cations and neutralize the negative
background charge of skin. This type of process could have the effect of reducing
the open-circuit potential.
Intervals 6 and 7 correspond to the potential drops across the skin induced by
the 140 µA/cm2 step-changes. Similar to the 14 µA/cm2 results, the membrane
potential difference also declined continuously while the current was applied. For
example, the potential difference decreased from 2.62 V to 1.60 V during Inter-
val 6. Similarly, the voltage drop across the skin decreased from 2.11 V to 1.55
V during Interval 7. The open-circuit potentials were also approximately 20 mV
after the 140 µA/cm2 step-change signals. The open-circuit potential decreased
for each subsequent measurement collected after elevated current signal had been
terminated.
The amplitude of the final current step-change, represented by Interval 8, was
1.4 mA/cm2. The potential difference decreased from 5.18 V to 4.07 V while the
current was held at the elevated condition. The potential difference induced by
the largest step-change was significantly larger the hypothesized voltage thresh-
old for onset of changes in skin properties. In general, the reduction in potential
difference with time for all current step-changes above 1.4 µA/cm2 strongly sug-
gested that the polarization resistance of skin had decreased. The procedure used
to calculate the polarization resistance is described in the next section.
8.2.2 Calculated Polarization Resistance
Skin polarization resistance was calculated according to Ohm’s law by divid-
ing the measured potential difference by the applied current. The polarization
resistance should be independent of current and time for a system with constant
properties. The calculated polarization resistance of skin is illustrated in Fig-
ure 8-4. The data indicated by Intervals 1-8 correspond to the skin resistance
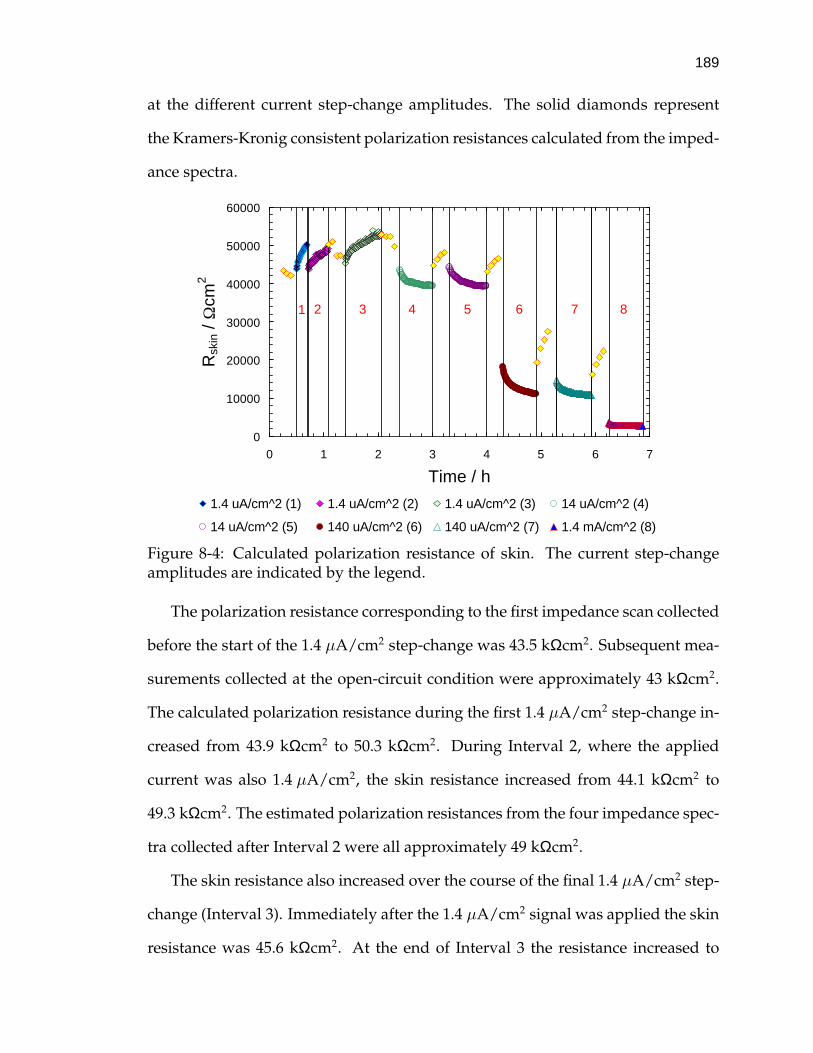
189
at the different current step-change amplitudes. The solid diamonds represent
the Kramers-Kronig consistent polarization resistances calculated from the imped-
ance spectra.
0
10000
20000
30000
40000
50000
60000
0 1 2 3 4 5 6 7
Time / h
Rsk
in /
Ωcm
2
1.4 uA/cm^2 (1) 1.4 uA/cm^2 (2) 1.4 uA/cm^2 (3) 14 uA/cm^2 (4)
14 uA/cm^2 (5) 140 uA/cm^2 (6) 140 uA/cm^2 (7) 1.4 mA/cm^2 (8)
2 3 4 51 876
Figure 8-4: Calculated polarization resistance of skin. The current step-changeamplitudes are indicated by the legend.
The polarization resistance corresponding to the first impedance scan collected
before the start of the 1.4 µA/cm2 step-change was 43.5 kΩcm2. Subsequent mea-
surements collected at the open-circuit condition were approximately 43 kΩcm2.
The calculated polarization resistance during the first 1.4 µA/cm2 step-change in-
creased from 43.9 kΩcm2 to 50.3 kΩcm2. During Interval 2, where the applied
current was also 1.4 µA/cm2, the skin resistance increased from 44.1 kΩcm2 to
49.3 kΩcm2. The estimated polarization resistances from the four impedance spec-
tra collected after Interval 2 were all approximately 49 kΩcm2.
The skin resistance also increased over the course of the final 1.4 µA/cm2 step-
change (Interval 3). Immediately after the 1.4 µA/cm2 signal was applied the skin
resistance was 45.6 kΩcm2. At the end of Interval 3 the resistance increased to
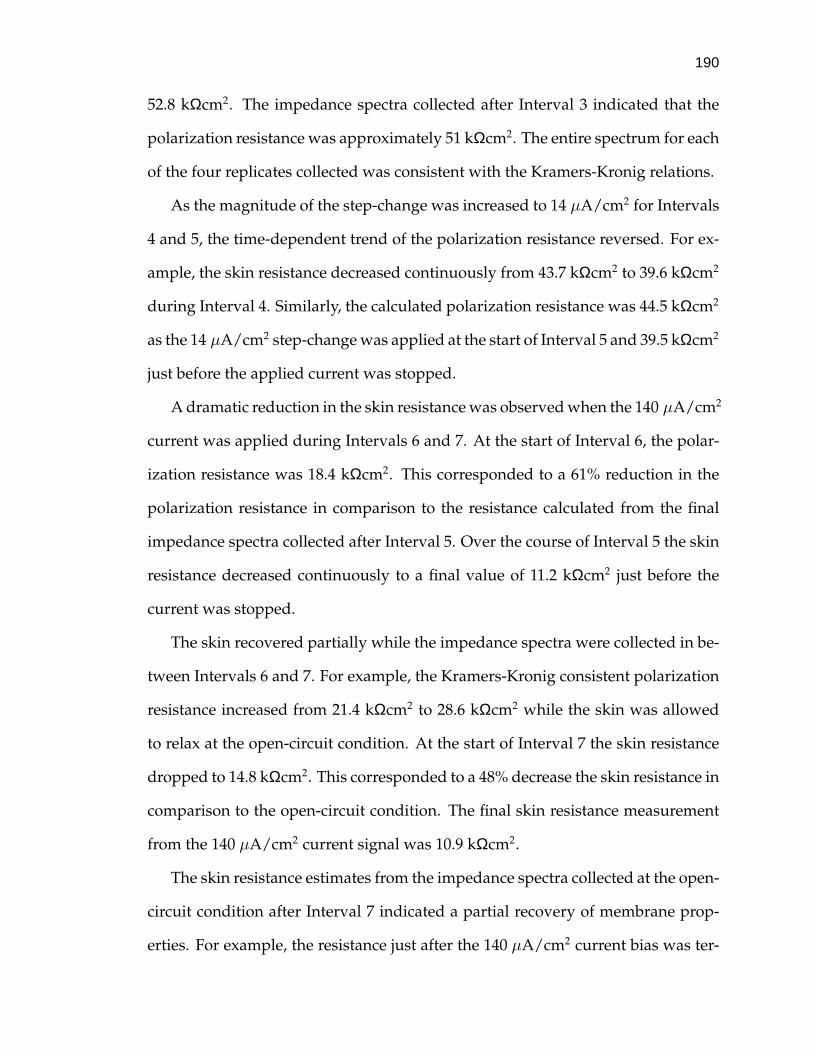
190
52.8 kΩcm2. The impedance spectra collected after Interval 3 indicated that the
polarization resistance was approximately 51 kΩcm2. The entire spectrum for each
of the four replicates collected was consistent with the Kramers-Kronig relations.
As the magnitude of the step-change was increased to 14 µA/cm2 for Intervals
4 and 5, the time-dependent trend of the polarization resistance reversed. For ex-
ample, the skin resistance decreased continuously from 43.7 kΩcm2 to 39.6 kΩcm2
during Interval 4. Similarly, the calculated polarization resistance was 44.5 kΩcm2
as the 14 µA/cm2 step-change was applied at the start of Interval 5 and 39.5 kΩcm2
just before the applied current was stopped.
A dramatic reduction in the skin resistance was observed when the 140 µA/cm2
current was applied during Intervals 6 and 7. At the start of Interval 6, the polar-
ization resistance was 18.4 kΩcm2. This corresponded to a 61% reduction in the
polarization resistance in comparison to the resistance calculated from the final
impedance spectra collected after Interval 5. Over the course of Interval 5 the skin
resistance decreased continuously to a final value of 11.2 kΩcm2 just before the
current was stopped.
The skin recovered partially while the impedance spectra were collected in be-
tween Intervals 6 and 7. For example, the Kramers-Kronig consistent polarization
resistance increased from 21.4 kΩcm2 to 28.6 kΩcm2 while the skin was allowed
to relax at the open-circuit condition. At the start of Interval 7 the skin resistance
dropped to 14.8 kΩcm2. This corresponded to a 48% decrease the skin resistance in
comparison to the open-circuit condition. The final skin resistance measurement
from the 140 µA/cm2 current signal was 10.9 kΩcm2.
The skin resistance estimates from the impedance spectra collected at the open-
circuit condition after Interval 7 indicated a partial recovery of membrane prop-
erties. For example, the resistance just after the 140 µA/cm2 current bias was ter-

191
minated was 17.8 kΩcm2. The resistance estimated from the last impedance scan
measured at the open-circuit condition was 23.2 kΩcm2.
As the 1.4 mA/cm2 step-change was applied during Interval 8, the polarization
resistance dropped to 3.6 kΩcm2. While the skin was held at the elevated current
the resistance continued to decrease to 2.8 kΩcm2. The results indicated that the
polarization resistance was an order of magnitude lower than the resistance mea-
sured in the absence of current.
The calculated polarization resistance data demonstrated that skin behaves
nonlinearly in response to current step-changes. The character of the response
is related to the magnitude of the applied current. For example, the skin resist-
ance increased while the 1.4 µA/cm2 step-changes were applied. The potential
difference across the skin at this current was always less than 90 mV. This poten-
tial difference was less than the proposed threshold for the onset of changes to
skin properties.
The skin resistance decreased with time for step-changes larger than 1.4 µA/cm2.
The magnitude and relative degree of the change in resistance was proportional
to the applied current. The potential drop across the skin induced by the applied
current at amplitudes greater than 1.4 µA/cm2 was at least 0.55 V. This magni-
tude of potential difference was above the proposed threshold for the alteration
of skin properties. Simply stated, the departure from the linear response was pro-
portional to the amplitude of the current step-change. Where large changes to skin
properties were observed, the potential difference across the skin was greater than
250 mV.
8.2.3 Comparison of Responses for Skin Samples 1 and 2.
The response of Skin Samples 1 and 2 to the 14 µA/cm2 and 140 µA/cm2 cur-
rent step-changes were compared. The objective was to determine whether the

192
amplitude of the applied current was a determinant for the onset of skin property
changes. It should be noted that the skin specimens were subjected to 1.4 µA/cm2
step-changes prior to the collection of the data presented here. The responses of
both pieces of skin to the 1.4 µA/cm2 signals remained constant while current was
applied. The impedance spectra collected after the 1.4 µA/cm2 current step were
consistent with the Kramers-Kronig relations which implied that skin properties
had not been altered.
The measured potential differences across both skin samples during the appli-
cation of the first 14 µA/cm2 step-changes are shown in Figure 8.5(a). The solid
red line and dashed blue line correspond to the potential differences across Skin
Samples 1 and 2, respectively. The potential responses of Sample 1 decayed in a
pseudoexponential manner, whereas the potential remained essentially constant
for Skin Sample 2. The magnitude of the potential difference across Skin Sample
2 was less than 100 mV over the course of the entire step-change. In contrast, po-
tential difference across Skin Sample 1 measured during the application of current
was greater than 500 mV.
The effect of the current step-changes on each piece of skin was assessed by
examining the time dependence of the polarization resistance. The calculated po-
larization resistance for each piece of skin during the 14 µA/cm2 step-changes are
presented in Figure 8.5(b). The solid triangles and solid diamonds correspond to
the resistances calculated from the impedance spectra. As stated earlier, the spec-
tra collected prior to the application of current were consistent with the Kramers-
Kronig relations.
The polarization resistance of Skin Sample 1 estimated from the impedance
spectrum collected prior to the application of current was 49.9 kΩcm2. Immedi-
ately after the step-change was applied the resistance dropped to 43.7 kΩcm2 and

193
decreased exponentially while current amplitude was held at 14 µA/cm2. The re-
duction in skin resistance indicated that the epidermis had been altered. These
results are consistent with the hypothesis that skin properties begin to change as
the membrane potential difference exceeds approximately 250 mV.
The resistance of Sample 2 remained constant at approximately 2.9 kΩcm2
throughout the entire step-change Interval. The skin resistance calculated from
the impedance spectra collected prior to the current step-change was also equal to
2.9 kΩcm2. The constant resistance observed for Skin Sample 2 implied that the
14 µA/cm2 current had not altered the macroscopic transport properties of the
membrane.
The membrane potential difference of Skin Samples 1 and 2 in response to the
140 µA/cm2 step-changes is presented by Figure 8.6(a). Similar to the 14 µA/cm2
results, the potential response of Skin Sample 1 decreased exponentially with time.
Although not visible at this scale, the potential across Skin Sample 2 also decayed
with time. The magnitude of the membrane potential difference was approxi-
mately 300 mV. The variation of resistance with time suggested that the properties
of Skin Sample 2 had been altered.
The influence of the applied current on the polarization resistance is shown in
8.6(b). The resistance of Skin Sample 1 dropped from 46.7 kΩcm2 to 18.4 kΩcm2
as the 140 µA/cm2 step-change was applied. The resistance continued to decrease
while the skin was subjected to the current. Although not visible at this scale, the
resistance of Skin Sample 2 also decayed with time. The resistance changes in both
samples occurred while the potential difference across the membrane was greater
than 250 mV.
The low-frequency portions of impedance spectra collected after the 140 µA/cm2
step-changes were not consistent with the Kramers-Kronig relations. The incon-

194
sistent impedance data indicated that skin properties had been changed. The com-
bination of the impedance and step-change results were consistent with the pro-
posed 250 mV threshold for potential induced property changes. In summary, the
properties of heat-separated skin could be altered by the application of current.
However, changes were not observed until the potential across the skin exceeded
250 mV.
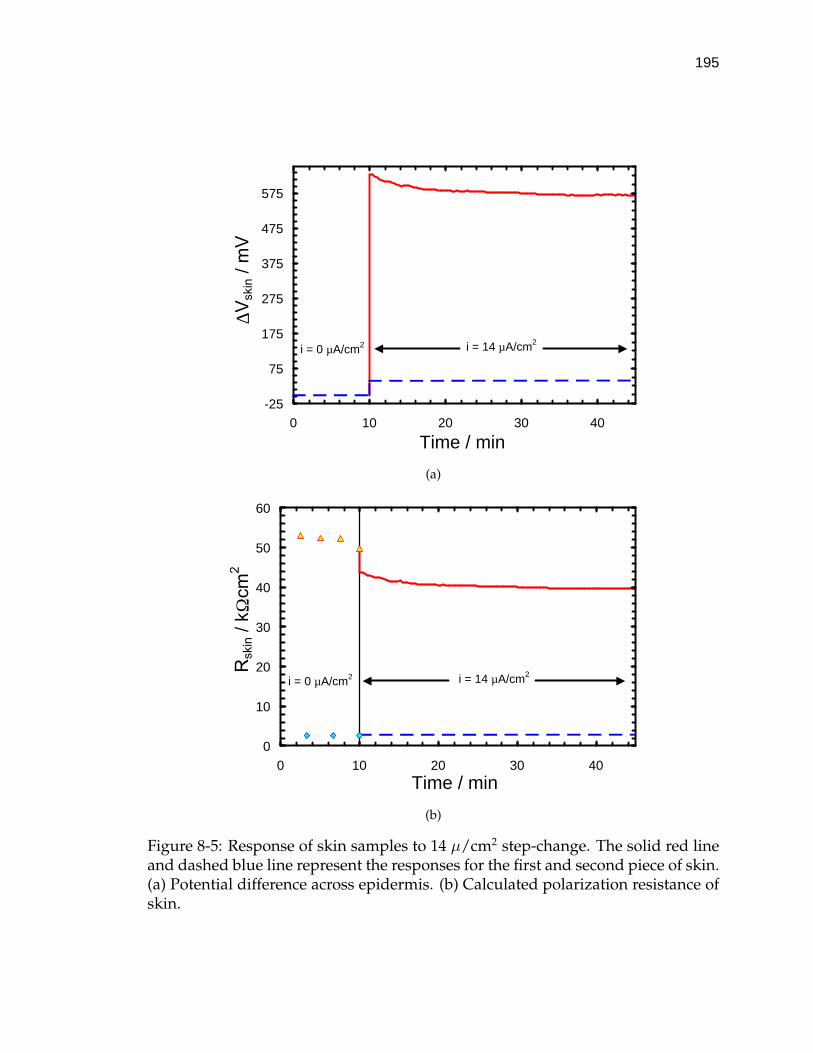
195
-25
75
175
275
375
475
575
0 10 20 30 40
Time / min
∆
i = 14 µA/cm2i = 0 µA/cm2
(a)
0
10
20
30
40
50
60
0 10 20 30 40Time / min
Ω
i = 14 µA/cm2i = 0 µA/cm2
(b)
Figure 8-5: Response of skin samples to 14 µ/cm2 step-change. The solid red lineand dashed blue line represent the responses for the first and second piece of skin.(a) Potential difference across epidermis. (b) Calculated polarization resistance ofskin.

196
0
0.5
1
1.5
2
2.5
3
0 10 20 30 40Time / min
∆
i = 140 µA/cm2i = 0 µA/cm2
(a)
0
10
20
30
40
50
0 10 20 30 40Time / min
Rsk
in /
k Ωcm
2
i = 140 µA/cm2i = 0 µA/cm2
(b)
Figure 8-6: Response of skin samples to a 140 µ/cm2 step-change. The solid redline and dashed blue line represent the responses for the first and second piece ofskin. (a) Potential difference across epidermis. (b) Calculated polarization resist-ance of skin.

CHAPTER 9TRANSDERMAL LIDOCAINE FLUX MEASUREMENTS
Prior to the investigation of transdermal lidocaine delivery rates under applied-
current conditions, the stability of the dual-beam UV-vis absorption spectroscopy
system was characterized. The first part of the study identified the drift in slave
and master channels of the dual-beam spectroscopy system (for a more detailed
description of the experimental apparatus, please refer to Section 4.4.1). The time
dependent behavior of the spectrometers was determined and a strategy was de-
veloped to account for the natural drift of the UV-vis apparatus in the light ab-
sorbance calculations. Once the temporal characteristics of the measurement sys-
tem were identified, a calibration curve was developed to relate lidocaine con-
centration with the absorbance response. Absorbance spectra from a series of li-
docaine solutions with concentrations in the range of 0 µM to 1.8 mM were col-
lected. Linear regressions were performed on the absorbance data at selected
wavelengths to obtain a family of lidocaine extinction coefficients. The range of
concentrations for which the absorbance response obeyed Beer-Lambert theory
was determined (for additional discussion, please refer to Section 4.4).
9.1 Spectroscopy System Stability
A series of 51 spectra were collected at three minute intervals over 2.4 hours to
identify the stability of the UV-vis light source and the 2 spectrometer channels.
For the study, the 2 output fibers of the 100 µm bifurcated cable were connected to
the inlet reference and receptor ports of the optically coupled spectroscopy cell. A
200 µm fiber optic cable was connected from the light-path outlets of the optically
197

198
coupled spectroscopy cell to the entrance ports of the spectrometer. The master
and slave channels measured the light intensity through the reference and recep-
tor compartments, respectively. A schematic of the experimental configuration is
provided by Figure 4-5. The integration time required for collection of the spectra
was 300 ms.
At the beginning of the experiment three spectra were collected with the light
source blocked to determine the baseline response of the spectrometers. The av-
erage intensity of the dark spectra was subtracted from the measured intensity of
the remaining spectra to calculated the light throughput at each wavelength. For
example, the dark-corrected intensity was calculated according to
I∗i = Ii − Ii,dark (9-1)
where Ii and Ii,dark are the measured intensity and the average intensity with the
light source blocked at each wavelength.
Mean values of the adjusted intensity were calculated as a function of wave-
length from the 51 spectra collected with each spectrometer. The average adjusted
intensities for the slave channel and master channel are presented by the filled
triangles and filled circles in Figure 9-1. The average intensity for both channels
was negligible at wavelengths below 180 nm. The signal response increased from
approximately 250 intensity units to 3800 intensity units for wavelengths ranging
from 215 nm to 255 nm. The intensity of both spectrometer channels gradually
decreased to 1000 intensity units for wavelengths between 255 nm and 475 nm.
The intensity of the spectra from both spectrometers displayed similar shape and
magnitude over the range of wavelengths studied. The consistency between the
two signals suggested that one of spectrometer channels could serve as a reference
for system drift.
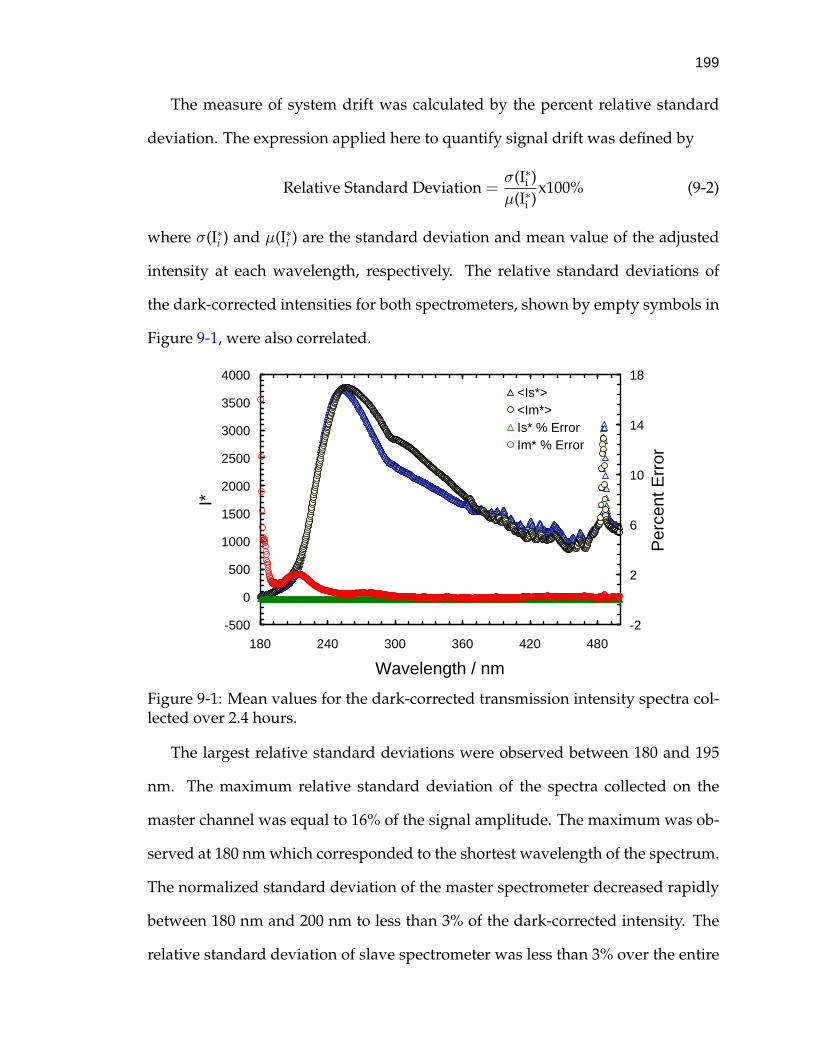
199
The measure of system drift was calculated by the percent relative standard
deviation. The expression applied here to quantify signal drift was defined by
Relative Standard Deviation =σ(I∗i )µ(I∗i )
x100% (9-2)
where σ(I∗i ) and µ(I∗i ) are the standard deviation and mean value of the adjusted
intensity at each wavelength, respectively. The relative standard deviations of
the dark-corrected intensities for both spectrometers, shown by empty symbols in
Figure 9-1, were also correlated.
-500
0
500
1000
1500
2000
2500
3000
3500
4000
180 240 300 360 420 480
Wavelength / nm
I*
-2
2
6
10
14
18
Per
cent
Err
or
<Is*><Im*>Is* % ErrorIm* % Error
Figure 9-1: Mean values for the dark-corrected transmission intensity spectra col-lected over 2.4 hours.
The largest relative standard deviations were observed between 180 and 195
nm. The maximum relative standard deviation of the spectra collected on the
master channel was equal to 16% of the signal amplitude. The maximum was ob-
served at 180 nm which corresponded to the shortest wavelength of the spectrum.
The normalized standard deviation of the master spectrometer decreased rapidly
between 180 nm and 200 nm to less than 3% of the dark-corrected intensity. The
relative standard deviation of slave spectrometer was less than 3% over the entire

200
range of wavelengths. The lower relative standard deviations associated with the
slave spectrometer indicated that this channel was more stable than the master
channel.
Although the stability of the slave spectrometer was greater than the master
spectrometer, the error analysis indicated that both light signals through the spec-
troscopy system were, to a good approximation, stationary over the 2.4 hour col-
lection interval. Since the magnitude and standard deviation of both spectrome-
ters were correlated, the ratio of slave spectrometer and master spectrometer in-
tensities was used to assess reduction in signal intensity during the transdermal
iontophoresis experiments. The approach was to monitor the receptor chamber of
the diffusion cell with the slave spectrometer. The master spectrometer measured
the signal response of UV-vis light through a cuvette of deionized water.
During a typical transdermal iontophoresis study lidocaine is transported from
the donor chamber into the receptor compartment of the optically coupled spec-
troscopy cell. As lidocaine accumulates in the receptor compartment, the intensity
of the slave channel will decrease in response to the addition of the chromophore.
In contrast, deionized water does not absorb light in the UV-vis portion of the
electromagnetic spectrum. Therefore, changes in signal intensity measured by the
master spectrometer were caused by random fluctuations or by a shift in the base-
line response of this channel. The ratio of the two signals acted as a filter for the
nonstationary component of the measurement.
The ratios of the dark-corrected intensity signals from each spectrometer were
calculated for all of the spectra collected in the study. The relative standard devi-
ation and mean values from the adjusted intensity are presented as a function of
wavelength in Figure 9-2. The standard deviation of the intensity ratio exhibited a
maximum value of at 180 nm which corresponded to 10% of the signal magnitude.
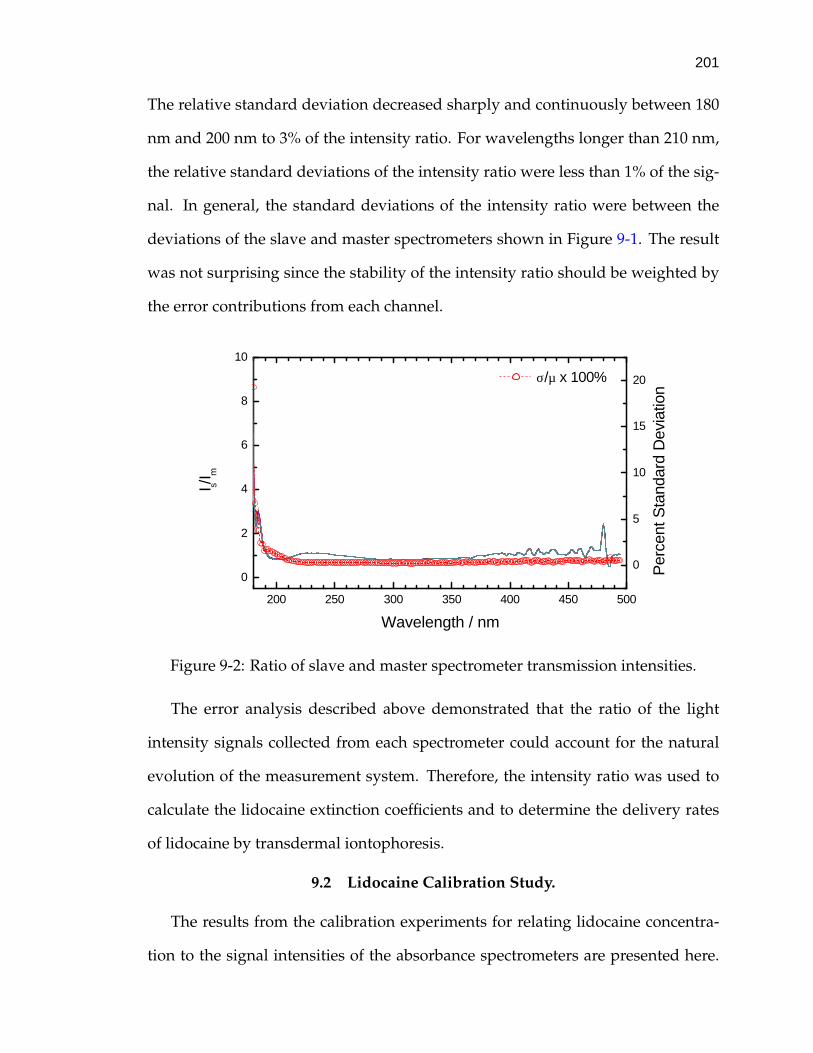
201
The relative standard deviation decreased sharply and continuously between 180
nm and 200 nm to 3% of the intensity ratio. For wavelengths longer than 210 nm,
the relative standard deviations of the intensity ratio were less than 1% of the sig-
nal. In general, the standard deviations of the intensity ratio were between the
deviations of the slave and master spectrometers shown in Figure 9-1. The result
was not surprising since the stability of the intensity ratio should be weighted by
the error contributions from each channel.
200 250 300 350 400 450 500
0
2
4
6
8
10
0
5
10
15
20
I s/Im
Wavelength / nm
σ/µ x 100%
Per
cent
Sta
ndar
d D
evia
tion
Figure 9-2: Ratio of slave and master spectrometer transmission intensities.
The error analysis described above demonstrated that the ratio of the light
intensity signals collected from each spectrometer could account for the natural
evolution of the measurement system. Therefore, the intensity ratio was used to
calculate the lidocaine extinction coefficients and to determine the delivery rates
of lidocaine by transdermal iontophoresis.
9.2 Lidocaine Calibration Study.
The results from the calibration experiments for relating lidocaine concentra-
tion to the signal intensities of the absorbance spectrometers are presented here.
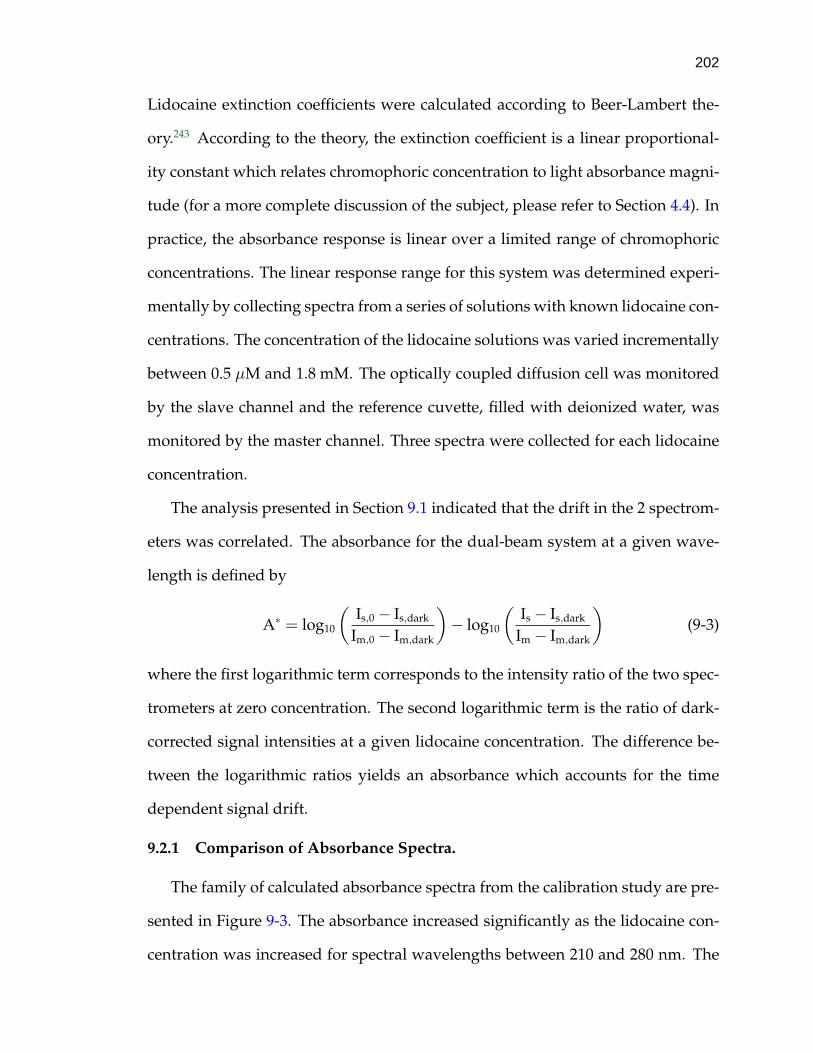
202
Lidocaine extinction coefficients were calculated according to Beer-Lambert the-
ory.243 According to the theory, the extinction coefficient is a linear proportional-
ity constant which relates chromophoric concentration to light absorbance magni-
tude (for a more complete discussion of the subject, please refer to Section 4.4). In
practice, the absorbance response is linear over a limited range of chromophoric
concentrations. The linear response range for this system was determined experi-
mentally by collecting spectra from a series of solutions with known lidocaine con-
centrations. The concentration of the lidocaine solutions was varied incrementally
between 0.5 µM and 1.8 mM. The optically coupled diffusion cell was monitored
by the slave channel and the reference cuvette, filled with deionized water, was
monitored by the master channel. Three spectra were collected for each lidocaine
concentration.
The analysis presented in Section 9.1 indicated that the drift in the 2 spectrom-
eters was correlated. The absorbance for the dual-beam system at a given wave-
length is defined by
A∗ = log10
(Is,0 − Is,dark
Im,0 − Im,dark
)− log10
(Is − Is,dark
Im − Im,dark
)(9-3)
where the first logarithmic term corresponds to the intensity ratio of the two spec-
trometers at zero concentration. The second logarithmic term is the ratio of dark-
corrected signal intensities at a given lidocaine concentration. The difference be-
tween the logarithmic ratios yields an absorbance which accounts for the time
dependent signal drift.
9.2.1 Comparison of Absorbance Spectra.
The family of calculated absorbance spectra from the calibration study are pre-
sented in Figure 9-3. The absorbance increased significantly as the lidocaine con-
centration was increased for spectral wavelengths between 210 and 280 nm. The

203
change in absorbance at low lidocaine concentrations was greatest in the 215-230
nm portion of the spectra. For lidocaine concentrations greater than 200 µM a
broad, secondary absorbance peak developed in the 240-275 nm region of the ab-
sorbance spectra.
180 200 220 240 260 280 300
0.0
0.4
0.8
1.2
1.6
2.0
2.4
2.8
Time
Abs
orba
nce
Wavelength / nm
Figure 9-3: Normalized absorbance spectra for calibration of lidocaine concentra-tion.
As the concentration of lidocaine was increased, the absorbance measurements
became scattered near the maximum absorbance of a given wavelength. The ran-
domly distributed data points were located at wavelengths between 180 and 240
nm. The scattered absorbance values were first observed at the shortest wave-
lengths when the lidocaine concentration was below 25 µM. Randomly distributed
absorbance values appeared at longer wavelengths as the chromophoric concen-
tration was increased.
The scattered absorbance data was caused by the reduction of the light through-
put intensity of the receptor chamber to the dark signal amplitude. As the effective
signal intensity was equal to zero, the addition of more chromophore to the sys-
tem could not change the absorbance response. Variations in the absorbance after
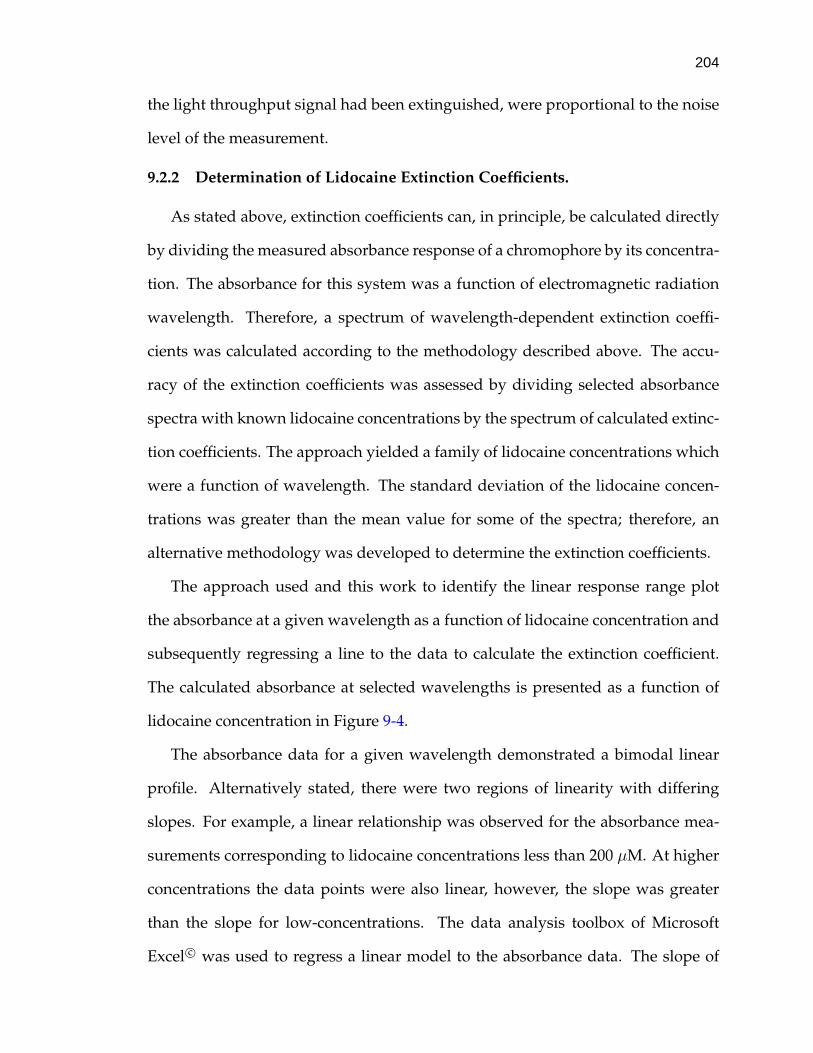
204
the light throughput signal had been extinguished, were proportional to the noise
level of the measurement.
9.2.2 Determination of Lidocaine Extinction Coefficients.
As stated above, extinction coefficients can, in principle, be calculated directly
by dividing the measured absorbance response of a chromophore by its concentra-
tion. The absorbance for this system was a function of electromagnetic radiation
wavelength. Therefore, a spectrum of wavelength-dependent extinction coeffi-
cients was calculated according to the methodology described above. The accu-
racy of the extinction coefficients was assessed by dividing selected absorbance
spectra with known lidocaine concentrations by the spectrum of calculated extinc-
tion coefficients. The approach yielded a family of lidocaine concentrations which
were a function of wavelength. The standard deviation of the lidocaine concen-
trations was greater than the mean value for some of the spectra; therefore, an
alternative methodology was developed to determine the extinction coefficients.
The approach used and this work to identify the linear response range plot
the absorbance at a given wavelength as a function of lidocaine concentration and
subsequently regressing a line to the data to calculate the extinction coefficient.
The calculated absorbance at selected wavelengths is presented as a function of
lidocaine concentration in Figure 9-4.
The absorbance data for a given wavelength demonstrated a bimodal linear
profile. Alternatively stated, there were two regions of linearity with differing
slopes. For example, a linear relationship was observed for the absorbance mea-
surements corresponding to lidocaine concentrations less than 200 µM. At higher
concentrations the data points were also linear, however, the slope was greater
than the slope for low-concentrations. The data analysis toolbox of Microsoft
Excel c© was used to regress a linear model to the absorbance data. The slope of

205
0
0.5
1
1.5
2
2.5
3
0 500 1000 1500 2000
Concentration / µM
Abs
orba
nce
210.0215.0220.3225.2230.2235.1240.0245.3250.1255.0260.3265.2270.0275.2280.1
Figure 9-4: Absorbance as a function of lidocaine concentration at selected wave-lengths.
the line drawn through the absorbance response for a given wavelength corre-
sponded to the extinction coefficient. Since the absorbance should be zero in the
absence of a chromophore, the x-intercept of the line should be zero for a properly
calibrated system.
Regression of a linear model to the entire collection of absorbance-concentration
data was intractable because of the bimodal structure described above. The alter-
native regression strategy implemented here, involved dividing the absorbance-
concentration data set into two portions. For example, separate regressions were
performed on the absorbance measurements corresponding to lidocaine concen-
trations up to 200 µM and for the data set associated with concentrations greater
than 200 µM. The concentration ranges associated with the truncated data sets
roughly corresponded to the two regions of linearity observed in the complete
collection of absorbance-concentration data.
The regression parameters corresponding to absorbance data corresponding to
lidocaine solutions with concentrations greater than 200 µM are shown in Table 9-1.
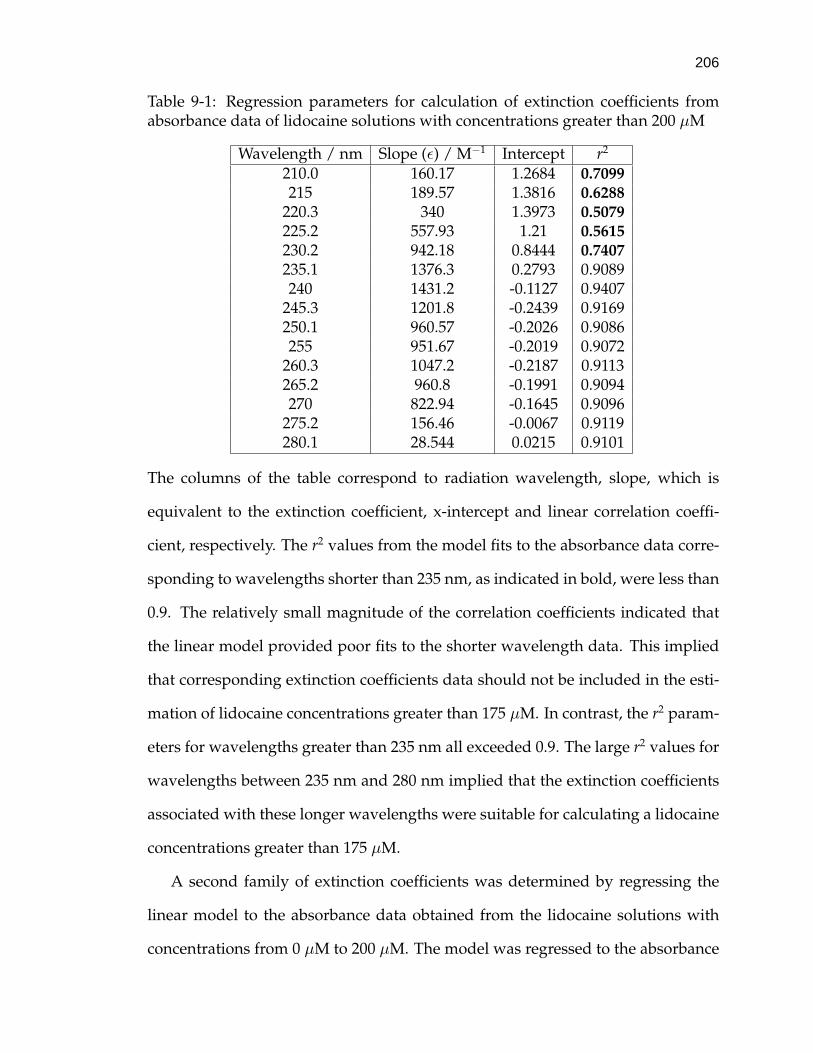
206
Table 9-1: Regression parameters for calculation of extinction coefficients fromabsorbance data of lidocaine solutions with concentrations greater than 200 µM
Wavelength / nm Slope (ε) / M−1 Intercept r2
210.0 160.17 1.2684 0.7099215 189.57 1.3816 0.6288
220.3 340 1.3973 0.5079225.2 557.93 1.21 0.5615230.2 942.18 0.8444 0.7407235.1 1376.3 0.2793 0.9089240 1431.2 -0.1127 0.9407
245.3 1201.8 -0.2439 0.9169250.1 960.57 -0.2026 0.9086255 951.67 -0.2019 0.9072
260.3 1047.2 -0.2187 0.9113265.2 960.8 -0.1991 0.9094270 822.94 -0.1645 0.9096
275.2 156.46 -0.0067 0.9119280.1 28.544 0.0215 0.9101
The columns of the table correspond to radiation wavelength, slope, which is
equivalent to the extinction coefficient, x-intercept and linear correlation coeffi-
cient, respectively. The r2 values from the model fits to the absorbance data corre-
sponding to wavelengths shorter than 235 nm, as indicated in bold, were less than
0.9. The relatively small magnitude of the correlation coefficients indicated that
the linear model provided poor fits to the shorter wavelength data. This implied
that corresponding extinction coefficients data should not be included in the esti-
mation of lidocaine concentrations greater than 175 µM. In contrast, the r2 param-
eters for wavelengths greater than 235 nm all exceeded 0.9. The large r2 values for
wavelengths between 235 nm and 280 nm implied that the extinction coefficients
associated with these longer wavelengths were suitable for calculating a lidocaine
concentrations greater than 175 µM.
A second family of extinction coefficients was determined by regressing the
linear model to the absorbance data obtained from the lidocaine solutions with
concentrations from 0 µM to 200 µM. The model was regressed to the absorbance
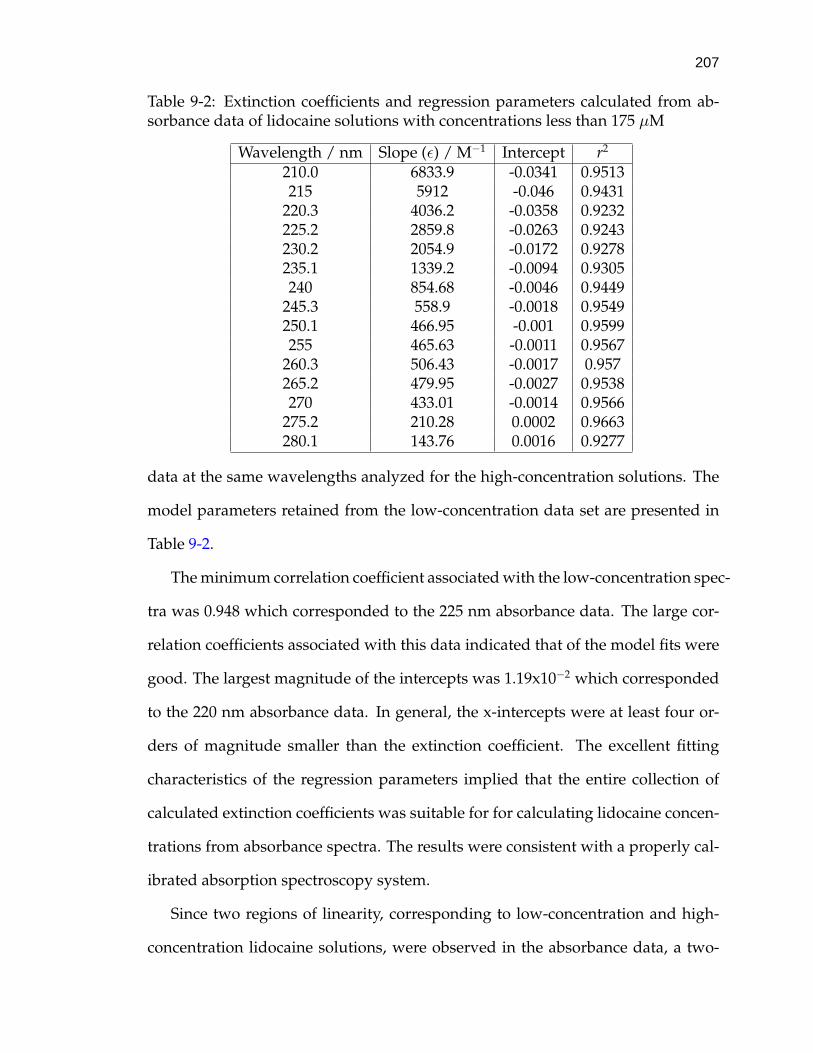
207
Table 9-2: Extinction coefficients and regression parameters calculated from ab-sorbance data of lidocaine solutions with concentrations less than 175 µM
Wavelength / nm Slope (ε) / M−1 Intercept r2
210.0 6833.9 -0.0341 0.9513215 5912 -0.046 0.9431
220.3 4036.2 -0.0358 0.9232225.2 2859.8 -0.0263 0.9243230.2 2054.9 -0.0172 0.9278235.1 1339.2 -0.0094 0.9305240 854.68 -0.0046 0.9449
245.3 558.9 -0.0018 0.9549250.1 466.95 -0.001 0.9599255 465.63 -0.0011 0.9567
260.3 506.43 -0.0017 0.957265.2 479.95 -0.0027 0.9538270 433.01 -0.0014 0.9566
275.2 210.28 0.0002 0.9663280.1 143.76 0.0016 0.9277
data at the same wavelengths analyzed for the high-concentration solutions. The
model parameters retained from the low-concentration data set are presented in
Table 9-2.
The minimum correlation coefficient associated with the low-concentration spec-
tra was 0.948 which corresponded to the 225 nm absorbance data. The large cor-
relation coefficients associated with this data indicated that of the model fits were
good. The largest magnitude of the intercepts was 1.19x10⁻² which corresponded
to the 220 nm absorbance data. In general, the x-intercepts were at least four or-
ders of magnitude smaller than the extinction coefficient. The excellent fitting
characteristics of the regression parameters implied that the entire collection of
calculated extinction coefficients was suitable for for calculating lidocaine concen-
trations from absorbance spectra. The results were consistent with a properly cal-
ibrated absorption spectroscopy system.
Since two regions of linearity, corresponding to low-concentration and high-
concentration lidocaine solutions, were observed in the absorbance data, a two-

208
step procedure was developed for calculating lidocaine concentrations from the
coupled spectroscopy transdermal delivery studies. While the predicted lidocaine
concentrations were less than 200 µM the family of extinction coefficients listed in
Table 9-2 were used. Once the concentration exceeded 200 µM the extinction co-
efficients in Table 9-1 were selected for calculating lidocaine concentrations. The
strategy provided for the determination of receptor compartment lidocaine con-
centrations in the range of 0.5 µM to 1.8 mM.
An alternative presentation of the extinction coefficients obtained from the
two-step regression procedure is shown in Figure 9-5. The extinction coefficients
associated with the low-concentration and high-concentration data sets are indi-
cated by the filled triangles and open circles, respectively. The plot was intended
to provide a graphical illustration of the distribution of lidocaine extinction coeffi-
cients. The general structure of the two groups was similar for wavelengths longer
than 235 nm.
In the shorter wavelength regions of Figure 9-5 the extinction coefficients from
the to data sets diverged. For example, the low-concentration data trended down-
wards with increasing wavelengths, whereas, the high-concentration values in-
creased. The detailed analysis of the regression parameters described above made
it possible to determine that the short wavelength extinction coefficients associ-
ated with the high-concentration measurements were not appropriate for calcu-
lating lidocaine concentrations.
The calibration procedure described here increased the range of lidocaine con-
centrations for which the absorbance response obeyed Beer-Lambert theory by a
factor of 7 in comparison to earlier work.164 The expanded concentration range
for the linear absorbance response suggested that the addition of the secondary
reference cell had properly accounted for system drift.

209
10
100
1000
10000
200 220 240 260 280 300
Wavelength / nm
Ext
inct
ion
coef
ficie
nt /
M - 1 Low C data
High C data
Figure 9-5: Dependence of calculated extinction coefficient on light wavelength.The solid triangles and open circles correspond to the calculated extinction coeffi-cients
9.3 Absorbance Changes from Skin Species
The methodology described in Section 4.4.3 was applied for the experiments
presented here. In previous optically coupled transdermal flux experiments a
broad secondary absorbance peak was observed at wavelengths between 240 nm
and 300 nm.164 The secondary peak was not observed in the lidocaine calibra-
tion studies for that work. Therefore, it was concluded that chromophoric species
were emanating from the skin. The object of this work was to determine the time
dependent absorbance response of excised human epidermis in the absence of
electrical current. The idea was to extract the contribution of skin chromophores
to the overall absorbance response of the transdermal iontophoresis experiments.
The methodology used here made it possible to determine whether the broad
secondary peak observed at longer wavelengths in the earlier work was a repro-
ducible phenomena.
The skin absorbance spectra from the hydration study are presented in Figure 9-6.
The largest absorbance response occurred at wavelengths below 220 nm. The
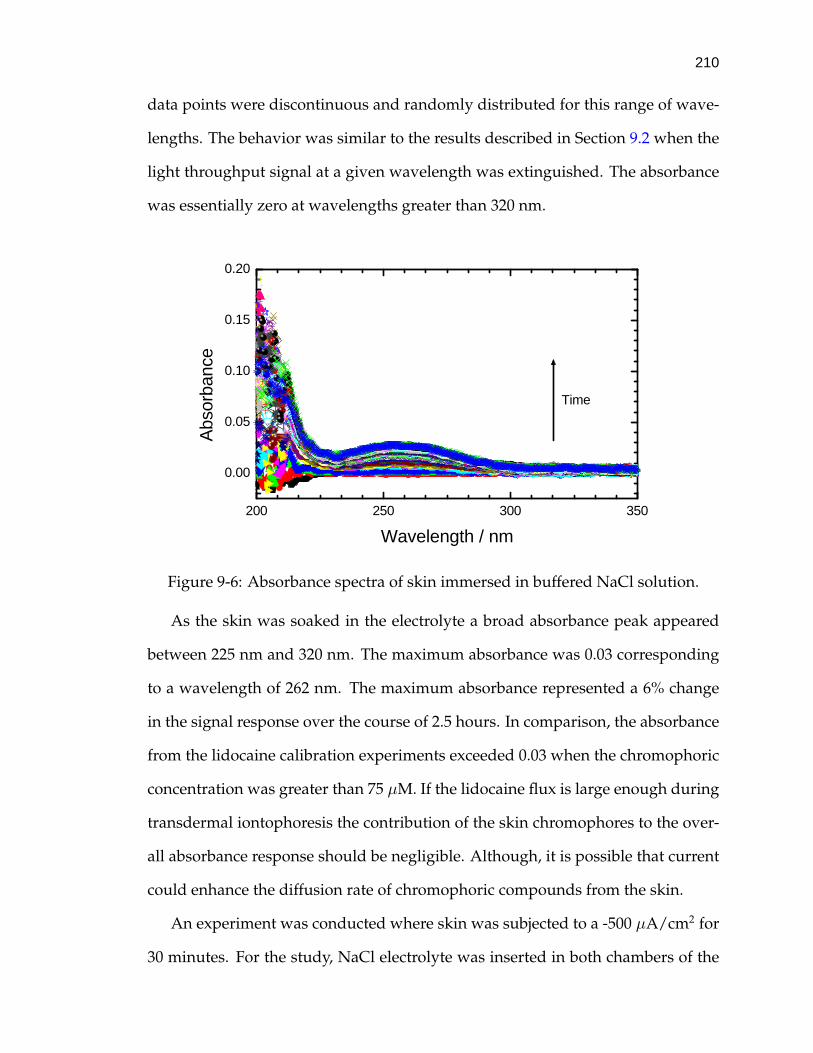
210
data points were discontinuous and randomly distributed for this range of wave-
lengths. The behavior was similar to the results described in Section 9.2 when the
light throughput signal at a given wavelength was extinguished. The absorbance
was essentially zero at wavelengths greater than 320 nm.
200 250 300 350
0.00
0.05
0.10
0.15
0.20
456
7
89
10
111213141516171819202122
232425262728
29303132333435
36373839404142434445464748495051525354555657585960616263646566676869707172737475767778798081828384858687888990919293949596979899100101102103104105106107108109110111112113114115116117118119120121122123124125126127128129130131132133134135136137138139140141142143144145146147148149150151152153154155156157158159160161162163164165166167168169170171172173174175176177178179180181182183184185186187188189190191192193194195196197198199200201202203204205206207208209210211212213214215216217218219220221222223224225226227228229230231232233234235236237238239240241242243244245246247248249250251252253254255256257258259260261262263264265266267268269270271272273274275276277278279280281282283284285286287288289290291292293294295296297298299300301302303304305306307308309310311312313314315316317318319320321322323324325326327328329330331332333334335336337338339340341342343344345346347348349350351352353354355356357358359360361362363364365366367368369370371372373374375376377378379380381382383384385386387388389390391392393394395396397398399400401402403404405
DE
FGHIJKL
MNO
PQRS
TUV
W
XYZAAABACAD
AEAFAGAHAIAJAKALAMANAOAPAQARASATAUAVAWAXAYAZBABBBCBDBEBFBGBHBIBJBKBLBMBNBOBPBQBRBSBTBUBVBWBXBYBZCACBCCCDCECFCGCHCICJCKCLCMCNCOCPCQCRCSCTCUCVCWCXCYCZDADBDCDDDEDFDGDHDIDJDKDLDMDNDODPDQDRDSDTDUDVDWDXDYDZEAEBECEDEEEFEGEHEIEJEKELEMENEOEPEQERESETEUEVEWEXEYEZFAFBFCFDFEFFFGFHFIFJFKFLFMFNFOFPFQFRFSFTFUFVFWFXFYFZGAGBGCGDGEGFGGGHGIGJGKGLGMGNGOGPGQGRGSGTGUGVGWGXGYGZHAHBHCHDHEHFHGHHHIHJHKHLHMHNHOHPHQHRHSHTHUHVHWHXHYHZIAIBICIDIEIFIGIHIIIJIKILIMINIOIPIQIRISITIUIVIWIXIYIZJAJBJCJDJEJFJGJHJIJJJKJLJMJNJOJPJQJRJSJTJUJVJWJXJYJZKAKBKCKDKEKFKGKHKIKJKKKLKMKNKOKPKQKRKSKTKUKVKWKXKYKZLALBLCLDLELFLGLHLILJLKLLLMLNLOLPLQLRLSLTLULVLWLXLYLZMAMBMCMDMEMFMGMHMIMJMKMLMMMNMOMPMQMRMSMTMUMVMWMXMYMZNANBNCNDNENFNGNHNINJNKNLNMNNNONPNQNRNSNTNUNVNWNXNYNZOAOBOCODOEOFOGOHOIOJOKOLOMONOO
defghi
j
klmnopqr
stuvwxyzaa
ab
ac
adaeafagahaiajakal
amanaoapaqarasatauavawaxayazbabbbcbdbebfbgbhbibjbkblbmbnbobpbqbrbsbtbubvbwbxbybzcacbcccdcecfcgchcicjckclcmcncocpcqcrcsctcucvcwcxcyczdadbdcdddedfdgdhdidjdkdldmdndodpdqdrdsdtdudvdwdxdydzeaebecedeeefegeheiejekelemeneoepeqereseteuevewexeyezfafbfcfdfefffgfhfifjfkflfmfnfofpfqfrfsftfufvfwfxfyfzgagbgcgdgegfggghgigjgkglgmgngogpgqgrgsgtgugvgwgxgygzhahbhchdhehfhghhhihjhkhlhmhnhohphqhrhshthuhvhwhxhyhziaibicidieifigihiiijikiliminioipiqirisitiuiviwixiyizjajbjcjdjejfjgjhjijjjkjljmjnjojpjqjrjsjtjujvjwjxjyjzkakbkckdkekfkgkhkikjkkklkmknkokpkqkrksktkukvkwkxkykzlalblcldlelflglhliljlklllmlnlolplqlrlsltlulvlwlxlylzmambmcmdmemfmgmhmimjmkmlmmmnmompmqmrmsmtmumvmwmxmymznanbncndnenfngnhninjnknlnmnnnonpnqnrnsntnunvnwnxnynzoaobocodoeofogohoiojokolomonoo
45678
91011
1213141516
1718
19
20
212223
24
25262728293031323334
3536373839
404142434445464748495051525354555657585960616263646566676869707172737475767778798081828384858687888990919293949596979899100101102103104105106107108109110111112113114115116117118119120121122123124125126127128129130131132133134135136137138139140141142143144145146147148149150151152153154155156157158159160161162163164165166167168169170171172173174175176177178179180181182183184185186187188189190191192193194195196197198199200201202203204205206207208209210211212213214215216217218219220221222223224225226227228229230231232233234235236237238239240241242243244245246247248249250251252253254255256257258259260261262263264265266267268269270271272273274275276277278279280281282283284285286287288289290291292293294295296297298299300301302303304305306307308309310311312313314315316317318319320321322323324325326327328329330331332333334335336337338339340341342343344345346347348349350351352353354355356357358359360361362363364365366367368369370371372373374375376377378379380381382383384385386387388389390391392393394395396397398399400401402403404405
DE
FG
HIJKL
MNOPQRSTUVWXYZ
AA
ABACADAEAFAG
AHAIAJAKALAMANAOAPAQARASATAUAVAWAXAYAZBABBBCBDBEBFBGBHBIBJBKBLBMBNBOBPBQBRBSBTBUBVBWBXBYBZCACBCCCDCECFCGCHCICJCKCLCMCNCOCPCQCRCSCTCUCVCWCXCYCZDADBDCDDDEDFDGDHDIDJDKDLDMDNDODPDQDRDSDTDUDVDWDXDYDZEAEBECEDEEEFEGEHEIEJEKELEMENEOEPEQERESETEUEVEWEXEYEZFAFBFCFDFEFFFGFHFIFJFKFLFMFNFOFPFQFRFSFTFUFVFWFXFYFZGAGBGCGDGEGFGGGHGIGJGKGLGMGNGOGPGQGRGSGTGUGVGWGXGYGZHAHBHCHDHEHFHGHHHIHJHKHLHMHNHOHPHQHRHSHTHUHVHWHXHYHZIAIBICIDIEIFIGIHIIIJIKILIMINIOIPIQIRISITIUIVIWIXIYIZJAJBJCJDJEJFJGJHJIJJJKJLJMJNJOJPJQJRJSJTJUJVJWJXJYJZKAKBKCKDKEKFKGKHKIKJKKKLKMKNKOKPKQKRKSKTKUKVKWKXKYKZLALBLCLDLELFLGLHLILJLKLLLMLNLOLPLQLRLSLTLULVLWLXLYLZMAMBMCMDMEMFMGMHMIMJMKMLMMMNMOMPMQMRMSMTMUMVMWMXMYMZNANBNCNDNENFNGNHNINJNKNLNMNNNONPNQNRNSNTNUNVNWNXNYNZOAOBOCODOEOFOGOHOIOJOKOLOMONOO
defghi
jkl
m
n
opqrstuvwxy
zaaabacadaeafagahaiaj
akalamanaoapaqarasatauavawaxayazbabbbcbdbebfbgbhbibjbkblbmbnbobpbqbrbsbtbubvbwbxbybzcacbcccdcecfcgchcicjckclcmcncocpcqcrcsctcucvcwcxcyczdadbdcdddedfdgdhdidjdkdldmdndodpdqdrdsdtdudvdwdxdydzeaebecedeeefegeheiejekelemeneoepeqereseteuevewexeyezfafbfcfdfefffgfhfifjfkflfmfnfofpfqfrfsftfufvfwfxfyfzgagbgcgdgegfggghgigjgkglgmgngogpgqgrgsgtgugvgwgxgygzhahbhchdhehfhghhhihjhkhlhmhnhohphqhrhshthuhvhwhxhyhziaibicidieifigihiiijikiliminioipiqirisitiuiviwixiyizjajbjcjdjejfjgjhjijjjkjljmjnjojpjqjrjsjtjujvjwjxjyjzkakbkckdkekfkgkhkikjkkklkmknkokpkqkrksktkukvkwkxkykzlalblcldlelflglhliljlklllmlnlolplqlrlsltlulvlwlxlylzmambmcmdmemfmgmhmimjmkmlmmmnmompmqmrmsmtmumvmwmxmymznanbncndnenfngnhninjnknlnmnnnonpnqnrnsntnunvnwnxnynzoaobocodoeofogohoiojokolomonoo
Time
Abs
orba
nce
Wavelength / nm
Figure 9-6: Absorbance spectra of skin immersed in buffered NaCl solution.
As the skin was soaked in the electrolyte a broad absorbance peak appeared
between 225 nm and 320 nm. The maximum absorbance was 0.03 corresponding
to a wavelength of 262 nm. The maximum absorbance represented a 6% change
in the signal response over the course of 2.5 hours. In comparison, the absorbance
from the lidocaine calibration experiments exceeded 0.03 when the chromophoric
concentration was greater than 75 µM. If the lidocaine flux is large enough during
transdermal iontophoresis the contribution of the skin chromophores to the over-
all absorbance response should be negligible. Although, it is possible that current
could enhance the diffusion rate of chromophoric compounds from the skin.
An experiment was conducted where skin was subjected to a -500 µA/cm2 for
30 minutes. For the study, NaCl electrolyte was inserted in both chambers of the
211
diffusion cell. The skin sample was soaked in the electrolyte for 30 minutes before
current was applied. Although not presented here, the maximum absorbance at
wavelengths between 225 nm and 320 nm was approximately 0.02. The rate of ab-
sorbance change in this portion of the spectra was uniform regardless of whether
current was applied.
A 50% increase in absorbance was observed in the spectra collected after cur-
rent was terminated. The results suggest that the chromophoric skin species were
diffusing back into the donor chamber by either migration or electroosmosis in re-
sponse to the electric field. As the potential difference across the skin was greater
than 5 V it is quite likely that the skin had been altered by the applied DC current.
Upon termination of the current, the electric field began to relax and skin chro-
mophores were free to diffuse into the receptor chamber. Despite the increase in
absorbance associated with the application of current, the relative magnitude was
negligible in comparison to the absorbance response observed in the calibration
studies when the lidocaine concentration exceeded 100 µM.
9.4 Transdermal Delivery of Lidocaine by Iontophoresis
A preliminary experiment was performed to verify the efficacy of the coupled
spectroscopy approach for measuring transdermal delivery rates of lidocaine un-
der iontophoretic conditions. The methodology described in Section 9.4 was ap-
plied for this work. The temporal sequence of the applied currents for the investi-
gation is listed in Table 9-3.
The 60 absorbance spectra obtained from the transdermal iontophoresis study
are illustrated in Figure 9-7. The absorbance response between 200 and 280 nm is
presented because significant differences in signal intensity were not detected at
other wavelengths. In general, the absorbance increased with time where the rate
of change depended on wavelength and magnitude of applied current. The trends

212
Table 9-3: Optically coupled spectroscopy experiment settings
Time / min Current / mA/cm2 Comments0-9 0 Skin Hydration
10-35 0 Lidocaine Added35-67 0.71 Current On67-86 0 Current Off86-111 1.4 Current On
111-134 2.8 ”134-181 5.6 ”
observed in the data were consistent with transport of the lidocaine chromophore
across skin.
200 220 240 260 280
0.0
0.5
1.0
1.5
2.0
2.5
Time
Abs
orba
nce
Wavelength / nm
Figure 9-7: Evolution of the absorbance response during the transdermal ionto-phoresis experiment.
A specific feature of the spectral data set was that the absorbance response
remained constant over the first 50 minutes of the experiment. After the initial
stationary period, the signal intensity began to increase with time at wavelengths
between 200 and 220 nm. The change in absorbance response corresponded to
a 15 minute delay between the application of the 0.71 µA/cm2 current bias and
the detection of lidocaine. The results suggest that the skin had not become fully
saturated with the lidocaine chromophore during the passive (iapplied=0 µA/cm2)
segment of the experiment.
213
The evolution of the absorbance spectra associated with remainder of the ex-
periment is not described because specific trends are difficult to identify at the
scale presented in Figure 9-7. Instead, macroscopic transport quantities, such
as lidocaine concentration and transdermal flux, were calculated using Microsoft
Excel c© spreadsheet software. For example, the absorbance at selected wavelengths
of each spectra were divided by the extinction coefficients calculated in Section
9.2.2 to determine lidocaine concentration. The procedure was repeated for each
spectra to produce a family of 60 chromophore concentrations which were a func-
tion of time. The calculated lidocaine concentration profile is presented by the
open circles in Figure 9-8. The red line corresponds to a combination of linear and
parabolic fits to the data. A general trend of increasing concentration with time
was observed. The relative degree of change was proportional to the amplitude of
applied current. The trends indicated that lidocaine was being transported across
the skin by the current.
The concentrations calculated according to Beer-Lambert theory were subse-
quently used to estimate lidocaine flux. For example, the average lidocaine flux
over the time interval required to collect two spectra was calculated by
Ni(t) =∆ci
∆tVA
(9-4)
where V is the receptor cell volume, A is the cross-sectional area of skin available
for transport, and ∆ci is the change in chromophore concentration over the time
interval, ∆t. Lidocaine fluxes were calculated for all successive pairs of absorbance
spectra.
Some of the estimated fluxes were found to be negative, especially during the
first 85 minutes of the study. This time period corresponded to the skin hydration,
the first iontophoretic (iapp = 0.71 µA/cm2) and the subsequent passive diffusion
portions of the investigation. The relatively small changes in the absorbance spec-

214
0
0.1
0.2
0.3
0.4
0.5
0.6
0.7
0.8
0 50 100 150 200
Time / min
Con
cent
ratio
n / m
M
0.01
0.1
1
10
Flu
x / m
mol
/cm
2 /min
Concentration Best fit Flux
0.71 2
1.4 2
2.8 2
5.6 2
0 0 0
Figure 9-8: Temporal evolution of the calculated lidocaine concentration and fluxin the receptor cell.
tra were in agreement with the small driving forces for transdermal transport.
As transport was unfavorable at these experimental conditions, it is reasonable
to assume that changes in the absorbance signal were primarily caused by ran-
dom fluctuations in the spectrometer. The stochastic errors associated with these
spectra would then propagate through to the concentration and flux calculations.
The negative fluxes observed at the start of the experiment are consistent with this
assumption.
Although negative fluxes were calculated from the low-current iontophoretic
spectra, lidocaine concentration generally increased over the entire interval; there-
fore, the average flux over the entire observational period was calculated rather
than over the shorter time intervals corresponding to the collection of successive
spectra. During the latter portions of the experiment when the iontophoretic cur-
rent amplitude was greater than or equal to 1.4 µA/cm2 the absorbance increased

215
more rapidly from spectrum-to-spectrum which was consistent with increased
transdermal lidocaine transport. Furthermore, the large relative changes in ab-
sorbance associated with these experiments helped to improve the signal-to-noise
ratio of the measurement.
The flux profiles, as calculated by Equation (9-4) are presented by the solid
lines with vertical cross marks in Figure 9-8. The magnitude of lidocaine flux is
denoted by the right-hand ordinate of the plot. The flux was approximately 30-
40 µmol/cm2/min during the passive portion of the experiment when the ionto-
phoretic current was 0 mA/cm2. As the current was increased to 0.71 mA/cm2,
the flux increased instantaneously to approximately 55 µmol/cm2/min. The flux
then decreased to 30 µmol/cm2/min during the recovery period after the first in-
terval of iontophoretic transport. The slight increase in delivery rate during the
0.71 mA/cm2 current application cycle suggested that the iontophoresis protocol
had enhanced the transport of lidocaine.
The transdermal lidocaine flux increased significantly during the 1.4 mA/cm2
iontophoresis treatment interval. For example, a uniform delivery rate of ap-
proximately 150 µmol/cm2/min was observed for the first twelve minutes of 1.4
mA/cm2 applied current. The flux over the remainder of this treatment cycle in-
creased continuously to a final amplitude of 340 µmol/cm2/min. The fluxes asso-
ciated with this portion of the experiment were, at a minimum, three times larger
than the lidocaine delivery rates measured during the 0.71 mA/cm2 iontophoretic
segment of the study. Alternatively stated, the magnitude of lidocaine flux had
tripled by doubling the current.
The transdermal delivery rate of lidocaine also increased continuously from
340 µmol/cm2/min to 1.3 mmol/cm2/min over the course of the 2.8 and 5.6 mA/cm2
current treatments. The flux measurements indicated that the application of cur-

216
rent increased the transdermal flux of lidocaine; however, the delivery rates were
not controlled at a constant level.
Skin polarization resistance was selected as a simple parameter to evaluate the
influence of the applied currents on membrane transport properties. The profiles
corresponding to skin polarization resistance and transdermal lidocaine flux are
presented in Figure 9-9. The solid yellow circles and the solid lines correspond
to the polarization impedance measured by impedance spectroscopy and by the
Solartron 1286 potentiostat, respectively. The blue lines with vertical hash marks
signify the transdermal delivery rates of lidocaine.
0
0.1
0.2
0.3
0.4
0.5
0.6
0.7
0.8
0 50 100 150 200
Time / min
Con
cent
ratio
n / m
M
0.01
0.1
1
10
Flu
x / m
mol
/cm
2 /min
Concentration Best fit Flux
0.71 2
1.4 2
2.8 2
5.6 2
0 0 0
Figure 9-9: Temporal evolution of skin polarization resistance and transdermallidocaine flux.
The polarization resistance of skin was approximately 400 kΩ/cm2 at the start
of the experiment. As the 0.71 mA/cm2 iontophoretic current was applied, the
resistance decreased by over an order of magnitude to approximately 20 kΩ/cm2.
Over the course of this transdermal iontophoresis treatment cycle, skin resistance
217
dropped to 15 kΩ/cm2. The transdermal voltage difference associated with the
0.71 mA/cm2 current also decreased from 14 V to approximately 12 V. It is likely
that the large potential differences induced by the current altered the properties
of the skin. The transdermal voltage differences measured in this work were well
above the threshold for potentially induced changes in skin properties observed
in Sections 5.2 and 8.1 of this work and reported in the literature.3
The impedance spectra collected after the 0.71 mA/cm2 current bias was ter-
minated, indicated that skin polarization resistance increased from 60 kΩ/cm2 to
100 kΩ/cm2. The resistance associated with the third impedance spectrum was
approximately one-fourth of the magnitude measured at the beginning of the ex-
periment. The slow and incomplete recovery suggested that the changes in skin
properties were not completely reversible over the time scale of over this portion
of the experiment.
The application of the 1.4 mA/cm2, 2.8 mA/cm2, and 5.6 mA/cm2 iontophor-
etic currents caused the polarization resistance of skin to decrease to approxi-
mately 10, 5, and 2 kΩ/cm2, respectively. The trend represented a simple linear
relationship between current amplitude and skin polarization resistance. The rel-
ative reductions in skin resistance were approximately a factor of 5 smaller than
decrease associated with the 0.71 mA/cm2 and 1.4 mA/cm2 currents. The com-
bined results suggest that there is an asymptotic limit for the reduction of skin
polarization resistance under the influence of applied current.
The lidocaine fluxes observed in this work were approximately an order of
magnitude smaller than the delivery rates reported in the literature under sim-
ilar experimental conditions.143 The discrepancy in the results can be partially
explained by the higher lidocaine concentration (10 mM) and lower pH (4.5) of
the donor compartment solution used for that study. For example, the lower
218
pH would increase the concentration of ionic lidocaine which would improve the
transport efficiency of the iontophoretic current.
The transdermal delivery rates of lidocaine reported by Philbrick were several
orders of magnitude lower than the fluxes measured in this work.164 The range of
applied-current biases for this investigation was in agreement with clinical ther-
apeutic protocols; however, the iontophoretic currents were approximately two
orders of magnitude larger than for the study described above. In addition, the
potential difference across the skin for the experiments was at least 14 V which
was well above the threshold for changes to the membrane transport properties.3
Therefore, the enhanced iontophoretic delivery of lidocaine observed here was
probably caused by a coupling of these two effects.
In summary, the work presented here indicates that the coupling of UV-vis
absorption spectroscopy with electrochemical impedance spectroscopy can be a
potentially useful methodology for studying transdermal iontophoresis. Electro-
chemical impedance spectroscopy provided for the measurement of skin electri-
cal and transport properties and UV-vis absorbance spectroscopy provided for the
measurement of transdermal lidocaine flux. In the previous chapters it was shown
that electrochemical impedance spectroscopy is a robust technique for monitor-
ing skin properties. The first three sections of this chapter demonstrated that the
dual-beam UV-vis spectroscopy system developed for this work was properly cal-
ibrated.
The transdermal iontophoresis experiments presented above are preliminary
results which clearly demonstrate that the application of electrical current increases
transdermal lidocaine flux. The difficulty in obtaining constant transdermal deliv-
ery rates during iontophoresis may have been associated with the limitations in
the potentiostat for driving controlled currents at large potentials. For example,

219
the voltage difference across the skin induced by the iontophoretic current was
between 12 and 14 volts. This corresponds to the upper stability limit of the 1286
potentiostat. Although the potentiostat reported current was being delivered at
the prescribed level, it is likely that the signal-to-noise ratio of the current signal
was not optimal. Recommendations are provided in Chapter 13 to improve the
accuracy of the optically coupled spectroscopic measurements.
CHAPTER 10MATHEMATICAL MODEL OF TRANSDERMAL IONTOPHORESIS
A mathematical model was developed to simulate steady-state transdermal
iontophoresis. Under the assumption that the stratum corneum is the dominant
barrier to transdermal drug delivery, only the macroscopic transport properties of
this section of the epidermis were considered. For example, the low permeability,
high electrical resistance and negative background charge of the stratum corneum
were explicitly incorporated into the model. The system geometry was designed
to mimic iontophoretic transport within the experimental diffusion cell. A nice
feature of the model presented here is that it can be adapted to simulate clinical
iontophoretic systems by adjusting the input parameters.
The objective of this work was to calculate the influence of controlled vari-
ables on the concentration, flux and potential profiles within the skin. This work
was intended to provide insight into the influence of skin properties, such as back-
ground charge, on the transport process. Results from the model simulations were
also compared with the fluxes obtained from UV-vis absorption spectroscopy ex-
periments.164 The transdermal iontophoresis simulation results are presented in
Chapter 11.
10.1 System Description
The simulated transdermal iontophoresis system consisted of three distinct re-
gions: a donor solution, the skin and a receptor solution. The dimensions of the
simulated system were consistent with the experimental apparatus. For example,
the receptor and donor compartments were 2 cm long and the skin was mod-
220

221
eled as being 20 µm thick. A schematic of the simulated system is provided by
Figure 10-1.
DonorSolution Skin Receptor
Solution
Ag/AgClElectrode
Ag/AgClElectrode
20 µm 2 cm2 cm
Figure 10-1: Dimensions of the simulated system for transdermal iontophoresis.Figure not to scale.
The governing equations for each region were formulated to reflect the phys-
ical characteristics of the system. For example, the skin was assumed to consist
of a uniformly charged barrier. The diffusion path length through the skin was
assumed to be longer than the thickness of the membrane due to the highly com-
plex structure of the membrane.256, 257 A tortuosity factor was introduced into the
governing equations to account for the extended path length.258 The diffusion co-
efficients of all ionic species were reduced by the tortuosity.
The ionic selective character of the skin was therefore associated solely with the
tendency for exclusion of ionic species of like charge. Under conditions of ionto-
phoretic operation, therapeutic agents are driven from the donor solution to the
receptor solution. The boundaries of the system represent the Ag/AgCl working
electrodes that drive current through the system. The total current throughout the
system was assumed to be uniform.
The governing equations for the model were derived from macroscopic trans-
port theory for dilute solutions.136 These equations are discussed in more detail
in the Governing Equations section of this chapter. The flux of ionic species ac-
counted for transport by migration and diffusion. The model is general in the
222
sense that it can account for any number of ionic species. Partial dissociation of
ionic species was described by equilibrated homogeneous reactions. In this way,
dissociation of water and buffers was treated explicitly.
The species present in the simulated system were Ca2+, Na+, Cl−, H+, OH−,
lidocaine cation, dissociated HEPES buffer anion, undissociated HEPES buffer and
the fixed negative charge sites within the skin. The inorganic species correspond to
the major ionic components present in the human body.246 In addition, the charge
of the skin was treated to be an immobile ionic species. Local electroneutrality was
assumed to apply. The list of dependent variables included the concentration of
each species and the electrical potential. Thus, for n independent species, a set of
n+1 nonlinear ordinary differential equations and algebraic equations were solved
using a Newton-Raphson iterative scheme.
10.2 Boundary Conditions
The boundary conditions in the donor and receptor phases required that the
concentrations of the species approached the bulk values. Continuity of concen-
tration and flux was assumed to apply at the boundaries between regions. Poten-
tial was specified at the donor boundary. The boundary conditions correspond to
the location of the electrodes. The electrodes used to drive current through the
skin were assumed to be Ag/AgCl, which is reversible to the chloride ions. Since
chloride ions were the only species reacting at the electrodes, chloride was the
only species with a nonzero flux at the electrode. The heterogeneous reaction at
the anode was
Ag + Cl−→ AgCl + e− (10-1)
where silver was oxidized. The boundary condition at the cathode corresponded
to the reduction of the silver ion. The cathodic reaction is described by
AgCl + e−→ Ag + Cl− (10-2)

223
The relationship describing the flux of chloride ions at the electrode surface is
presented by
NCl− =itotal
FzCl−(10-3)
where itotal is the applied-current density. The boundary condition states that all
of the current was carried by the flux of chloride ions at the electrode.
10.3 Bulk Solution Compositions
The composition of the donor solution can have a significant influence on the
transport rates of the therapeutic agent.148, 81, 170, 259 In this region there are rela-
tively high concentrations of the active agents. This allows for flexibility in evalu-
ating the transport rates of a variety of different active species. Therapeutic com-
pounds will often have molecular weights that are orders of magnitude larger than
the ions used included in this model. To compensate for the disparity in molecular
weights a model drug species was selected with a diffusion coefficient an order of
magnitude lower than the remaining species.
The bulk concentrations of ionic species present in the donor solution and the
receptor solution were selected to be consistent with the ionic content of the body
and drug formulations, respectively.246 The ideal solution diffusion coefficients
corresponding to each of these species are presented in Table 10-1. The diffu-
sion coefficients of the lidocaine ion, the HEPES buffer ion and the undissociated
HEPES species were calculated using the Wilke-Chang correlation.260 Evaluation
of the diffusion coefficient by this method requires the molal volume of the solute
at the normal boiling point as an input parameter. The molal volume was esti-
mated using Schroeder’s Additive Method.260 This method provides estimates for
molal volumes, which are accurate to within three percent.
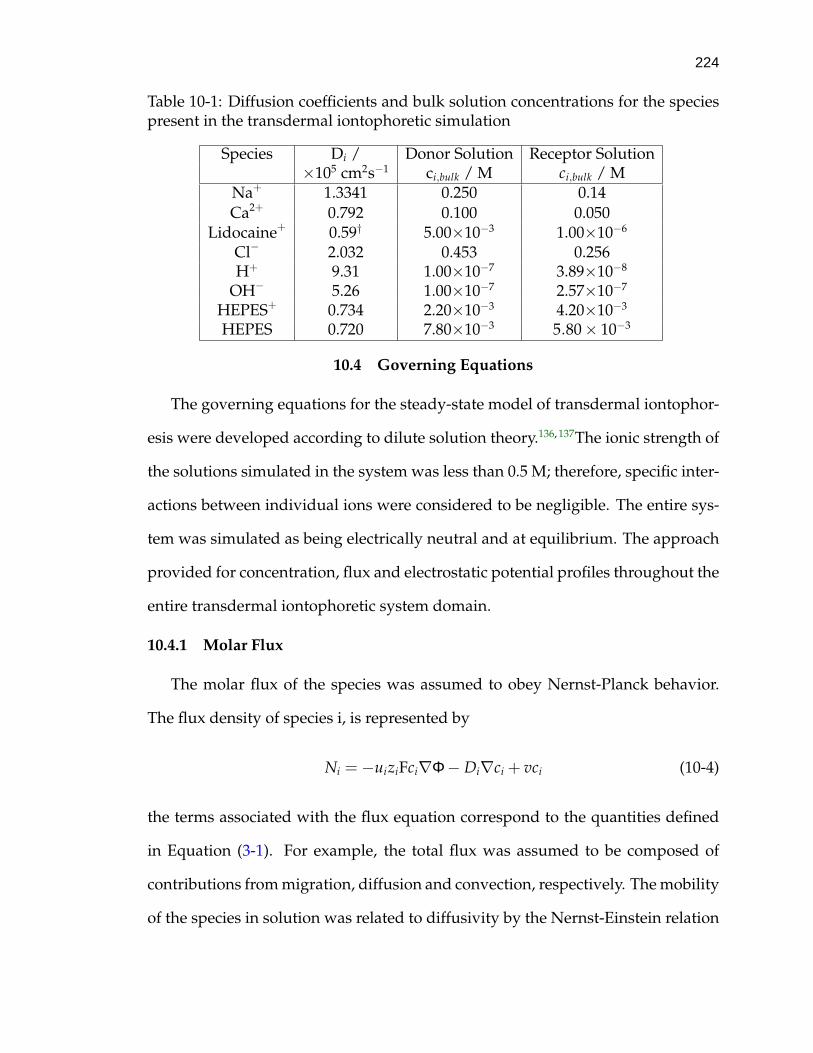
224
Table 10-1: Diffusion coefficients and bulk solution concentrations for the speciespresent in the transdermal iontophoretic simulation
Species Di / Donor Solution Receptor Solution×105 cm2s−1 ci,bulk / M ci,bulk / M
Na+ 1.3341 0.250 0.14Ca2+ 0.792 0.100 0.050
Lidocaine+ 0.59† 5.00×10⁻³ 1.00×10⁻⁶
Cl− 2.032 0.453 0.256H+ 9.31 1.00×10⁻⁷ 3.89×10⁻⁸
OH− 5.26 1.00×10⁻⁷ 2.57×10⁻⁷
HEPES+ 0.734 2.20×10⁻³ 4.20×10⁻³
HEPES 0.720 7.80×10⁻³ 5.80× 10⁻³
10.4 Governing Equations
The governing equations for the steady-state model of transdermal iontophor-
esis were developed according to dilute solution theory.136, 137The ionic strength of
the solutions simulated in the system was less than 0.5 M; therefore, specific inter-
actions between individual ions were considered to be negligible. The entire sys-
tem was simulated as being electrically neutral and at equilibrium. The approach
provided for concentration, flux and electrostatic potential profiles throughout the
entire transdermal iontophoretic system domain.
10.4.1 Molar Flux
The molar flux of the species was assumed to obey Nernst-Planck behavior.
The flux density of species i, is represented by
Ni = −uiziFci∇Φ− Di∇ci + vci (10-4)
the terms associated with the flux equation correspond to the quantities defined
in Equation (3-1). For example, the total flux was assumed to be composed of
contributions from migration, diffusion and convection, respectively. The mobility
of the species in solution was related to diffusivity by the Nernst-Einstein relation
225
Di = uiRT (10-5)
where ui is the mobility of species, i, R, is the universal gas constant and T is the
absolute temperature.
The fluxes determined by experiment correspond to surface averaged quanti-
ties, therefore, the design equations for the model were cast in one-dimensional
form. The one-dimensional formulation led to a model appropriate for probing
variations in potential, flux, pH and concentration in the direction of iontophor-
etic transport. Migration, diffusion and convection terms were included in the
flux. An assumption was made in this work that the contribution from convection
to the total flux was negligible in comparison to the contributions from migration
and diffusion. The complete expression for flux density in the direction of trans-
port is described by
Ni(x) = −uiziFcidΦdx
− Didci
dx(10-6)
where, as stated earlier, convection in the direction of transport was assumed to
be negligible.
10.4.2 Material Balance Expressions
The general expression for the conservation of mass for the components in the
system is described by∂ci
∂t= −∇ · Ni + Ri (10-7)
where −∇ · Ni is the volume averaged accumulation rate. Since the system was
at steady-state the first term in the conservation equation was zero. The term
corresponding to Ri represents the production rate from homogeneous reactions
involving species i. Homogeneous reactions considered in this system are the dis-
sociation of water and moderation of pH by the HEPES buffer.

226
A detailed description of the treatment of the homogeneous reactions is pro-
vided below. Provision was made in the donor solution for replenishment of
species and in the receptor for clearance of the transported species. The appro-
priate expression for the divergence flux of the iontophoretic system considered
here is presented by
−∇ · Ni = −dNix
dx−
dNiy
dy(10-8)
Contributions to the total divergence are divided into two components. The first
term corresponds to transport in the direction of iontophoresis. The second term,
in the y-direction, corresponds to convective flux in the direction perpendicular to
current flow. The y-component of the flux allowed for the addition of material to
the donor solution and the removal of material from the receptor solution.
Conservation of mass was obeyed because the total amount of material enter-
ing the donor solution was equal to the amount of material leaving the receptor
solution. The flow of species through the system is illustrated in Figure 10-2. The
vertical arrows correspond to the species flux in the direction normal to iontophor-
etic transport. The horizontal arrows represent the iontophoretic flow of material
through the solution chambers and the skin.
DonorSolution Skin Receptor
Solution
Ag/AgClElectrode
Ag/AgClElectrode
Figure 10-2: Flow pattern of dissolved species through the system domain. Figurenot to scale.

227
The y-component of the divergence was calculated by adding a term to the flux
expression which was proportional to the difference in the local and bulk solution
concentrations. The divergence of flux in the y-direction is given by
−dNiy
dy= −vy
dci
dy(10-9)
where vy is the bulk solution velocity in the direction normal to iontophoretic
transport. Numerical evaluation of the flux derivative in the y-direction proceeded
according to
−dNiy
dy= −vy
ci − ci,bulk
∆y(10-10)
where ci,bulk is the bulk concentration of the species of interest, ∆y represents the
linear distance required for ci to equal ci,bulk and vy is the y-component velocity. For
the simulations presented here the ratio of velocity and characteristic distance, ∆y,
was considered to be constant. This term provided a driving force for transport in
the direction normal to the iontophoretic flux.
10.4.3 Homogeneous Reactions
The electrolytic solutions associated with the iontophoretic system contained
buffers to moderate changes in pH. In addition, the dissociation of water was in-
cluded in the model. The reactions were considered to be in equilibrium. The ho-
mogeneous reactions were not explicitly evaluated with the flux divergence terms
in the conservation equations. Instead, algebraic manipulations were performed
to eliminate the reaction terms. The manipulations allowed for the flux divergence
terms and the reaction terms to be evaluated separately. A detailed account of this
procedure is provided below.
The general stoichiometric expression for the dissociation of a 1:1 buffer salt is
described according to
HBuff H+ + Buff− (10-11)

228
where HBuff represents the undissociated buffer, H+ is the dissolved hydrogen
ion and Buff− represents the base of the dissociated buffer.
The equilibrium relationship for the buffer reaction is
cH+cBuff−
cHBuff= KBuffer (10-12)
The other homogeneous reaction corresponds to the dissociation of water which
proceeds according to
H2O H+ + OH− (10-13)
Similar to the buffer reaction, the equilibrium relationship for the water dissocia-
tion reaction is
cH+cOH− = Kw (10-14)
Since the reactions for the dissociation of water and dissociation of buffer were
assumed to be equilibrated, Equations (10-14) and (10-12) must be satisfied simul-
taneously.
For a system at steady-state the material balance equations for the species in-
volved in the homogeneous reactions are presented by
−∇ · NH+ + RH+ = 0 (10-15)
−∇ · NOH− + ROH− = 0 (10-16)
−∇ · NBuff− + RBuff− = 0 (10-17)
−∇ · NHBuff + RHBuff = 0 (10-18)
Since the buffer dissociation reaction was assumed to be at equilibrium, the
consumption rate of the undissociated buffer was equal to the production rate of
229
dissociated buffer ion. This relationship is described by
RHBuff = −RBuff− (10-19)
where RHBuff and RHBuff− are the production rates of the undissociated buffer molecules
and buffer ions, respectively.
The homogeneous production rate in the material balance expression for the
undissociated buffer, Equation (10-18), can be replaced by Equation (10-19). The
equivalent form of the undissociated buffer mass conservation equation can be
added to material balance expression for the buffer ion, Equation (10-17), to yield
−∇ · NHBuff −∇ · NBuff− = 0 (10-20)
The manipulations described above combined the mass conservation equations
for the undissociated buffer and buffer ions into a single expression.
Algebraic elimination of the remaining reaction rate terms from the material
balance expressions was performed by equating the hydronium ion production
rate to the production rates of hydroxide ions plus buffer anions. For example, the
production rate of hydronium ions is described according to
RH+ = ROH− + RBuff− (10-21)
which implies that the dissociation of water molecules and buffer salts contribute
to the formation of hydronium ions.
The net production rate of hydronium ions, described by Equation (10-21), was
used to eliminate the homogeneous reaction terms in material balance equations
for the hydronium, hydroxide and buffer ions. The approach was to subtract
Equations (10-16) and (10-17) from Equation (10-15). The expression obtained
from the manipulation consisted of the flux divergences for the H+, OH− and
230
Buff− ions. The combination of the material balance equations is described by
−∇ · NH+ +∇ · NOH− +∇ · NBuff− = 0 (10-22)
which states that the accumulation rate of the hydrogen ions was equal to the
production rates of hydronium ions plus buffer ions.
The algebraic elimination strategy presented here reduced the number of in-
dependent relationships from four to two. The final two relationships required
for solution of the system of equations were the equilibrium reaction expressions
presented in Equations (10-12) and (10-14).
10.4.4 Electroneutrality
The entire domain of this system was considered to be electrically neutral. The
expression for electroneutrality is
∑i
zici (10-23)
which states that the sum of the ionic concentrations multiplied by the respective
ionic charge numbers is equal to zero. Electroneutrality is a valid approximation
for moderately dilute systems. The electroneutrality condition is generally satis-
fied in the bulk phases of electrochemical systems because of the large electrical
forces required to separate charge.
10.4.5 Numerical Method
The system of differential equations was cast in finite-difference form and was
solved numerically using the BAND routine developed by Newman.261 The BAND
algorithm was implemented because it reduces the computational effort required
to solve systems with tridiagonal coefficient matrices. In order to account for dif-
ferences in scale between the skin, which has a thickness on the order of 10-20
microns, and the donor and receptor chambers, the mesh size was expanded in

231
the donor and receptor chambers. All equations were written to be of the order of
the square of the mesh size, and convergence was quadratic.
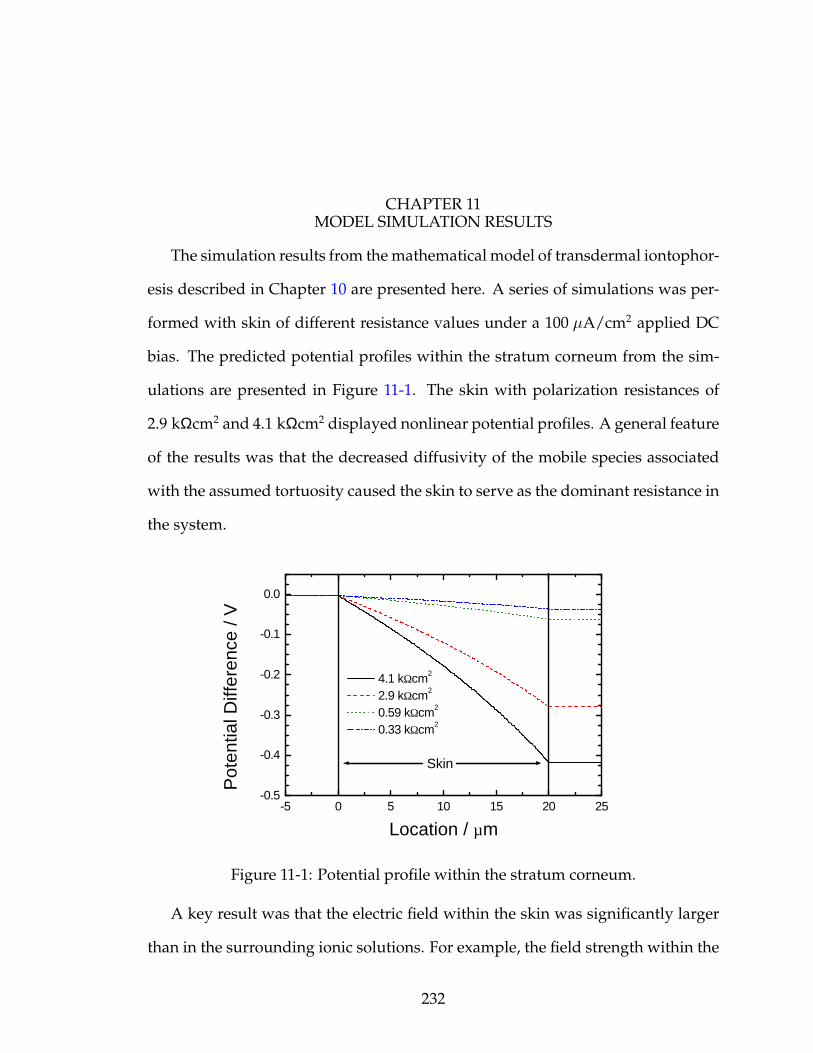
CHAPTER 11MODEL SIMULATION RESULTS
The simulation results from the mathematical model of transdermal iontophor-
esis described in Chapter 10 are presented here. A series of simulations was per-
formed with skin of different resistance values under a 100 µA/cm2 applied DC
bias. The predicted potential profiles within the stratum corneum from the sim-
ulations are presented in Figure 11-1. The skin with polarization resistances of
2.9 kΩcm2 and 4.1 kΩcm2 displayed nonlinear potential profiles. A general feature
of the results was that the decreased diffusivity of the mobile species associated
with the assumed tortuosity caused the skin to serve as the dominant resistance in
the system.
-5 0 5 10 15 20 25-0.5
-0.4
-0.3
-0.2
-0.1
0.0
Skin
Pot
entia
l Diff
eren
ce /
V
Location / µm
4.1 kΩcm2
2.9 kΩcm2
0.59 kΩcm2
0.33 kΩcm2
Figure 11-1: Potential profile within the stratum corneum.
A key result was that the electric field within the skin was significantly larger
than in the surrounding ionic solutions. For example, the field strength within the
232
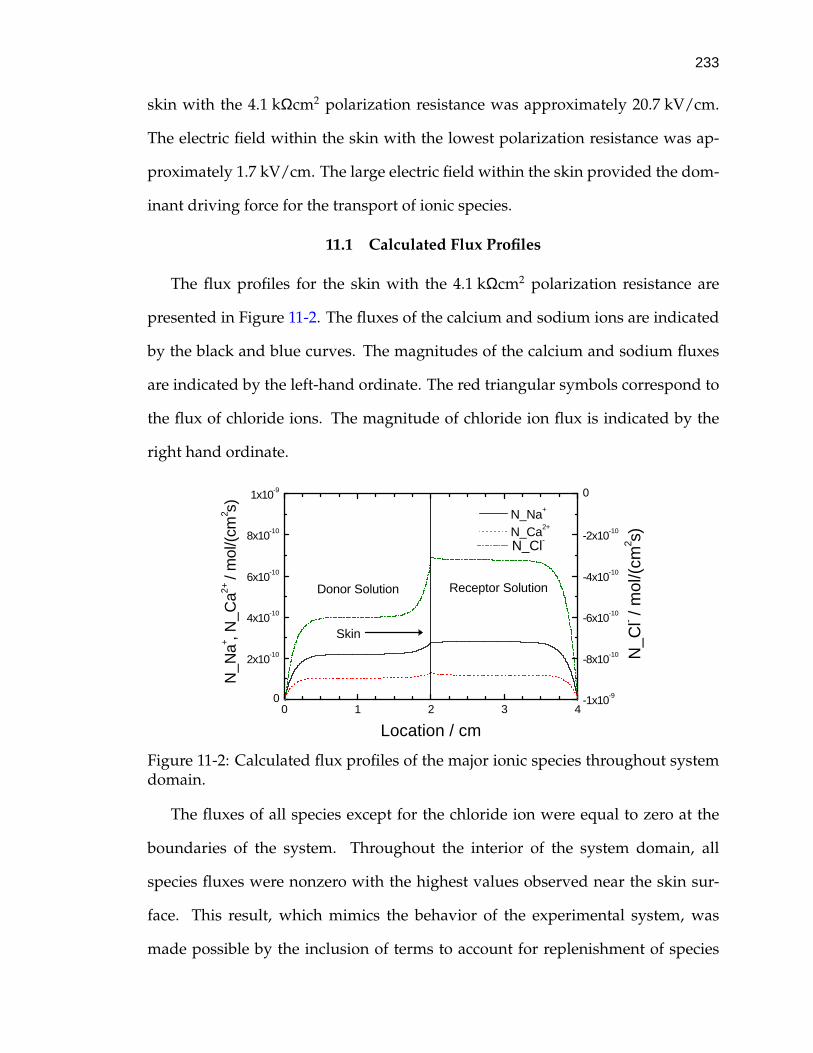
233
skin with the 4.1 kΩcm2 polarization resistance was approximately 20.7 kV/cm.
The electric field within the skin with the lowest polarization resistance was ap-
proximately 1.7 kV/cm. The large electric field within the skin provided the dom-
inant driving force for the transport of ionic species.
11.1 Calculated Flux Profiles
The flux profiles for the skin with the 4.1 kΩcm2 polarization resistance are
presented in Figure 11-2. The fluxes of the calcium and sodium ions are indicated
by the black and blue curves. The magnitudes of the calcium and sodium fluxes
are indicated by the left-hand ordinate. The red triangular symbols correspond to
the flux of chloride ions. The magnitude of chloride ion flux is indicated by the
right hand ordinate.
0 1 2 3 40
2x10⁻¹⁰
4x10⁻¹⁰
6x10⁻¹⁰
8x10⁻¹⁰
1x10⁻⁹
-1x10⁻⁹
-8x10⁻¹⁰
-6x10⁻¹⁰
-4x10⁻¹⁰
-2x10⁻¹⁰
0
N_N
a+ , N_C
a2+ /
mol
/(cm
2 s)
Location / cm
N_Na+
N_Ca2+
N_Cl-
Skin
Donor Solution Receptor Solution
N_C
l- / m
ol/(
cm2 s)
Figure 11-2: Calculated flux profiles of the major ionic species throughout systemdomain.
The fluxes of all species except for the chloride ion were equal to zero at the
boundaries of the system. Throughout the interior of the system domain, all
species fluxes were nonzero with the highest values observed near the skin sur-
face. This result, which mimics the behavior of the experimental system, was
made possible by the inclusion of terms to account for replenishment of species
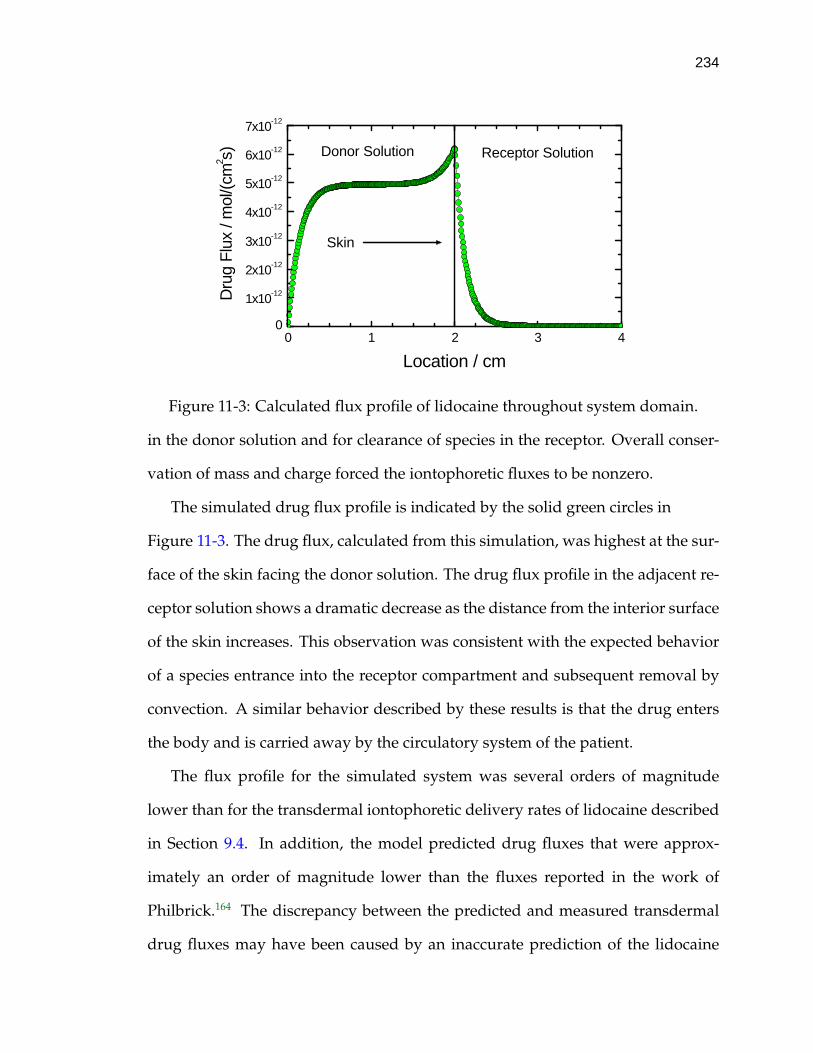
234
0 1 2 3 40
1x10-12
2x10-12
3x10-12
4x10-12
5x10-12
6x10-12
7x10-12
Skin
Receptor SolutionDonor Solution
Dru
g Fl
ux /
mol
/(cm
2 s)
Location / cm
Figure 11-3: Calculated flux profile of lidocaine throughout system domain.
in the donor solution and for clearance of species in the receptor. Overall conser-
vation of mass and charge forced the iontophoretic fluxes to be nonzero.
The simulated drug flux profile is indicated by the solid green circles in
Figure 11-3. The drug flux, calculated from this simulation, was highest at the sur-
face of the skin facing the donor solution. The drug flux profile in the adjacent re-
ceptor solution shows a dramatic decrease as the distance from the interior surface
of the skin increases. This observation was consistent with the expected behavior
of a species entrance into the receptor compartment and subsequent removal by
convection. A similar behavior described by these results is that the drug enters
the body and is carried away by the circulatory system of the patient.
The flux profile for the simulated system was several orders of magnitude
lower than for the transdermal iontophoretic delivery rates of lidocaine described
in Section 9.4. In addition, the model predicted drug fluxes that were approx-
imately an order of magnitude lower than the fluxes reported in the work of
Philbrick.164 The discrepancy between the predicted and measured transdermal
drug fluxes may have been caused by an inaccurate prediction of the lidocaine
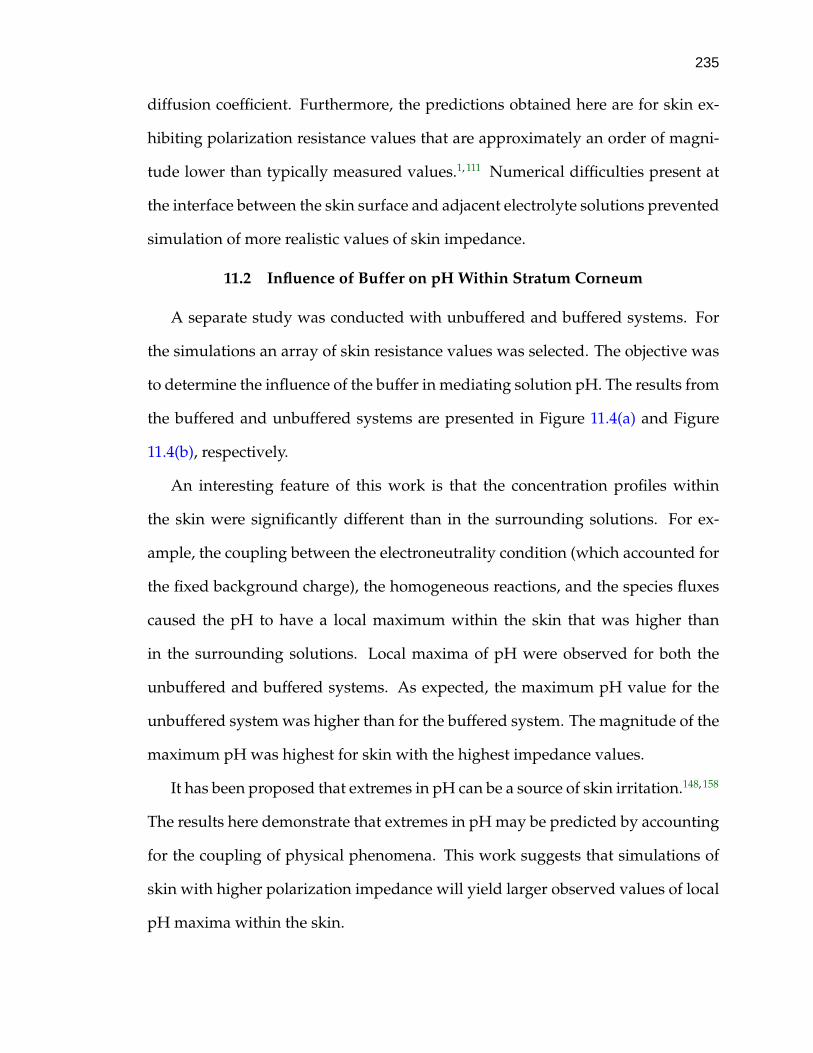
235
diffusion coefficient. Furthermore, the predictions obtained here are for skin ex-
hibiting polarization resistance values that are approximately an order of magni-
tude lower than typically measured values.1, 111 Numerical difficulties present at
the interface between the skin surface and adjacent electrolyte solutions prevented
simulation of more realistic values of skin impedance.
11.2 Influence of Buffer on pH Within Stratum Corneum
A separate study was conducted with unbuffered and buffered systems. For
the simulations an array of skin resistance values was selected. The objective was
to determine the influence of the buffer in mediating solution pH. The results from
the buffered and unbuffered systems are presented in Figure 11.4(a) and Figure
11.4(b), respectively.
An interesting feature of this work is that the concentration profiles within
the skin were significantly different than in the surrounding solutions. For ex-
ample, the coupling between the electroneutrality condition (which accounted for
the fixed background charge), the homogeneous reactions, and the species fluxes
caused the pH to have a local maximum within the skin that was higher than
in the surrounding solutions. Local maxima of pH were observed for both the
unbuffered and buffered systems. As expected, the maximum pH value for the
unbuffered system was higher than for the buffered system. The magnitude of the
maximum pH was highest for skin with the highest impedance values.
It has been proposed that extremes in pH can be a source of skin irritation.148, 158
The results here demonstrate that extremes in pH may be predicted by accounting
for the coupling of physical phenomena. This work suggests that simulations of
skin with higher polarization impedance will yield larger observed values of local
pH maxima within the skin.
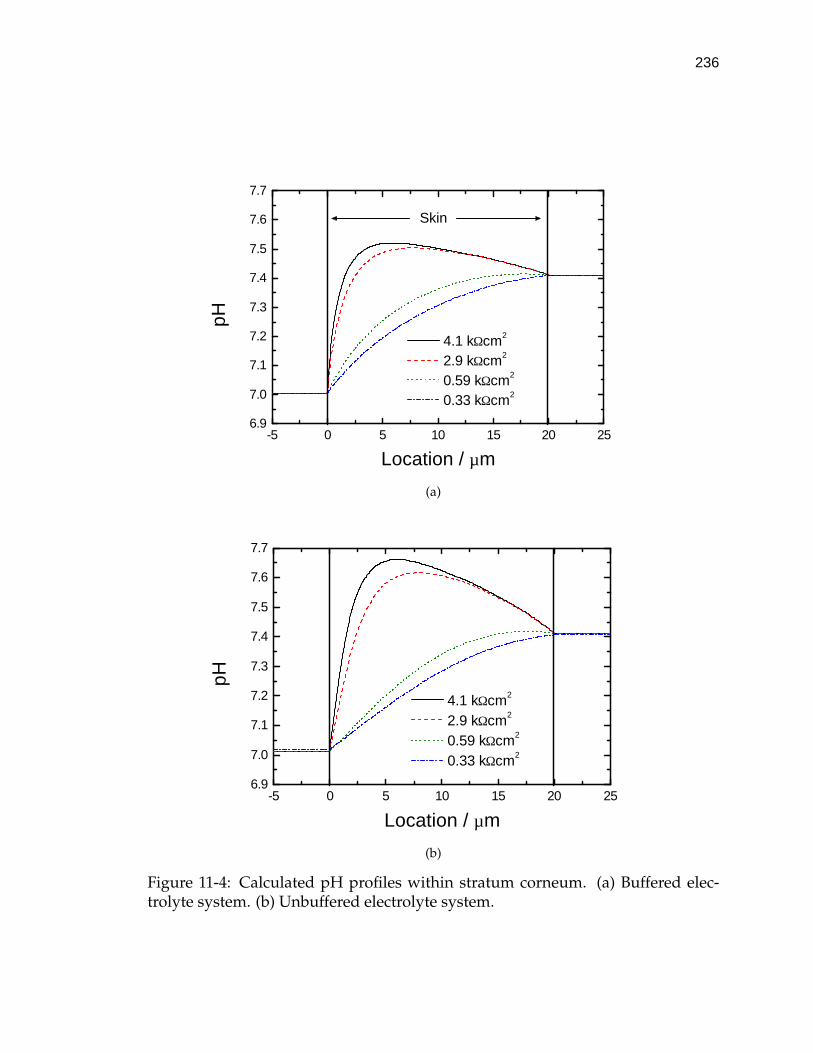
236
-5 0 5 10 15 20 256.9
7.0
7.1
7.2
7.3
7.4
7.5
7.6
7.7
7.3
7.4
7.5
7.6
7.7
Skin
pH
Skin
pH
Location / µm
4.1 kΩcm2
2.9 kΩcm2
0.59 kΩcm2
0.33 kΩcm2
(a)
-5 0 5 10 15 20 256.9
7.0
7.1
7.2
7.3
7.4
7.5
7.6
7.7
pH
Location / µm
4.1 kΩcm2
2.9 kΩcm2
0.59 kΩcm2
0.33 kΩcm2
(b)
Figure 11-4: Calculated pH profiles within stratum corneum. (a) Buffered elec-trolyte system. (b) Unbuffered electrolyte system.
CHAPTER 12CONCLUSIONS
An object of this work was to determine the influence of applied electrical sig-
nals on skin transport properties. The work was designed to support the develop-
ment of devices for transdermal delivery of therapeutic compounds by iontophor-
esis. In accordance with this goal, electrochemical impedance spectroscopy was
implemented to monitor the electrical and transport properties of heat-separated
cadaver skin under a variety of conditions. For example, experiments were con-
ducted where a nonzero DC current bias was applied across heat-separated hu-
man cadaver skin to simulate in vivo transdermal iontophoresis. Recovery of skin
properties to applied current was monitored by impedance spectroscopy at open-
circuit conditions corresponding to the application of a 0 µA/cm2 DC bias.
Two modulation strategies were implemented for the electrochemical imped-
ance spectroscopy studies of human skin: (1) constant-amplitude galvanostatic
modulation and (2) variable-amplitude galvanostatic modulation. Constant-am-
plitude galvanostatic modulation is the traditional control method used for skin
impedance experiments. For a typical experiment, a constant-amplitude sinu-
soidal current perturbation is applied and the potential response is measured over
a wide range of frequencies. Skin exhibits a characteristically high impedance in
the low-frequency portions of the impedance spectra. Therefore, at low frequen-
cies the constant-amplitude sinusoidal current perturbation can induce potential
swings across the membrane which often exceed 1 V. Statistical error analysis of
skin impedance spectra obtained by this methodology proved to be inconsistent
237

238
with the Kramers-Kronig relations. The inconsistent data points were located in
the low-frequency portions of the spectra. The results implied that skin properties
had been altered.
Variable-amplitude galvanostatic modulation was implemented as the second
control strategy for the skin impedance experiments. The approach was to predic-
tively adjust the amplitude of the current perturbation to prevent large potential
swings across the membrane. Impedance spectra collected by the adaptive mod-
ulation strategy were shown to be consistent with the Kramers-Kronig relations
which indicated that skin properties were not modified by the experiment. The
work strongly suggests that potential perturbations on the order 1 V can alter skin
properties. As the variable-amplitude galvanostatic control strategy avoids large
potential fluctuations, the methodology should be applied for monitoring skin
transport properties by electrochemical impedance spectroscopy.
The work described up to this point established that variable-amplitude gal-
vanostatic modulation of impedance spectroscopy provides for noninvasive mea-
surement of skin transport properties at the open-circuit condition. The method-
ology was applied for subsequent electrochemical impedance spectroscopy and
step-change experiments designed to identify the influence of an applied DC elec-
trical bias on skin. For the step-change studies both applied-current and potential
signals were applied across the epidermis for at least 20 minutes. The amplitude
of the DC bias was increased periodically to determine the potential or current at
which skin properties begin to change. The results indicated that alterations oc-
curred when the potential difference across the membrane exceeded 100-250 mV.
The deviation in the response signal from a membrane with constant electrical
properties was proportional to the magnitude of the potential difference across
skin.
239
The influence of solution composition on the recovery of skin properties to
large electrical signals was assessed. Impedance spectroscopy experiments were
conducted on skin specimens immersed in electrolyte solutions with monovalent
and divalent cations. An identical methodology was used to study the skin in each
type of electrolyte. The recovery of skin properties to large electrical perturbations
was found to be more complete and more rapid for the sample immersed in the so-
lution with divalent cations. This observation could have important implications
for the development of iontophoretic drug formulations. For example, if the same
behavior is identified in vivo divalent cation salts could be added as supporting
electrolyte to the therapeutic mixtures of iontophoretic systems.
Another important aspect of this work identified the sources of variation in the
electrical and transport properties of heat-separated cadaver skin. A large body
of impedance data was collected in this work. For example, 127 pieces of heat-
separated human epidermis from 18 cadavers were studied by electrochemical
impedance spectroscopy. The samples displayed a wide distribution of imped-
ance responses. Statistical analysis was performed to determine the contributions
to the overall variation in properties. The impedance data included in the analysis
was obtained from the skin hydration studies which were conducted under iden-
tical experimental conditions. Therefore, the sources contributing to the variation
were assumed to be caused by differences between the cadavers and by variations
within a given skin sample.
A generalized linear model was used to extract the contributions to the over-
all variation of skin properties. The variation of skin impedance within a given
sample was found to be larger than the variation associated with differences be-
tween the cadavers. The analysis suggests that caution should be exercised when
comparing the impedance results from two pieces of skin.

240
A mathematical model was developed to simulate transdermal iontophoresis.
The object of this work was to calculate the influence of controlled variables on
the concentration and flux profiles within the skin. The flux of ionic species was
assumed to be driven by both migration and diffusion. A unique feature of this
work was that the potential profile within the skin was calculated explicitly. Equi-
librated homogeneous reactions were included to account for partial dissociation
of water and buffers. The species present in the simulated system were assumed
to be Ca2+, Na+, Cl−, H+, OH−, drug cation, drug counter anion, and dissociated
and undissociated buffer species. In addition, the charge of the skin was treated
to be an immobile ionic species.
An interesting feature of this work is that the concentration profiles within
the skin were significantly different than in the surrounding solutions. For ex-
ample, the coupling between the electroneutrality condition (which accounted for
the fixed background charge), the homogeneous reactions, and the species fluxes
caused the pH to have a local maximum within the skin that was higher than ei-
ther of the surrounding solutions. The largest local pH maxima were observed in
the simulations of skin with the largest polarization resistances.
Transdermal delivery rates of the model drug lidocaine were measured by UV-
vis spectroscopy. A custom dual-channel spectrometer apparatus was developed
to provide for the simultaneous measurement of transdermal lidocaine flux and
skin transport properties under iontophoretic conditions. The absorption spec-
troscopy system was shown to be properly calibrated. The calibration procedure
provide for the calculation of lidocaine delivery rates across the skin. It was
demonstrated in this work that the transdermal flux of lidocaine was increased
by over an order of magnitude when current was applied. The largest transder-
mal delivery rates were observed at the largest amplitudes of applied current. The
241
results indicate that iontophoresis can improve the delivery efficiency of charged
therapeutic compounds across skin.
In summary, the experimental work described in this text identified the in-
fluence of controlled variables such as current, potential and solution composi-
tion on the electrical and transport properties of heat-separated human skin. The
delivery rates of lidocaine across the skin were measured by UV-vis absorption
spectroscopy. The results indicated that the applied electrical current enhanced
the transdermal flux of lidocaine. The mathematical model of transdermal ionto-
phoresis provided information on the effect of coupled phenomena, such as equi-
librated dissociation reactions and electroneutrality, on the concentration and flux
profiles within a homogeneous membrane with properties similar to human stra-
tum corneum.

CHAPTER 13SUGGESTED RESEARCH
A large database of impedance spectra was collected in this work to determine
the effect of applied electrical signals on skin transport properties. The spectra
were regressed to the Voigt circuit model to identify data that was inconsistent
with the Kramers-Kronig relations. Identification of the inconsistent data pro-
vided a means for determining changes in skin properties. In this manner, the
influence of a given set of experimental parameters on membrane properties could
be determined.
Although this approach is robust, additional information could be extracted by
regressing a process model to the impedance spectra collected in this work. The
process model would likely include terms associated with the mass transfer resist-
ance of ions entering and exiting the stratum corneum. In addition, the adsorption
of electrolyte cations to the negative background charge of skin could provide a
mechanism for the observed capacitance of the membrane. The model parameters
associated with this type of formulation would directly correspond to the physical
properties of the skin. Regression of the model to the impedance spectra collected
in this work would provide for direct calculation of the influence of electrical sig-
nals on the physical properties of the skin.
Heat-separated human cadaver skin was used as the model membrane for this
study. The primary transport barrier for the delivery of therapeutic compounds
is the stratum corneum. The entire stratum corneum was contained in the epider-
mal membranes used for this study. The work presented in this report addressed
242
243
and identified many of the important factors affecting drug transport across intact
human skin during iontophoresis. However, there are differences between heat-
separated human cadaver skin and intact human skin.97, 152, 148, 206, 207 For example,
the polarization impedance of human cadaver skin was found to be approximately
an order of magnitude lower than for human skin in vivo.152 These differences sug-
gest that the experimental methods presented in this work should be applied for
in vivo transdermal iontophoresis investigations to identify the influence of con-
trolled variables on the efficiency of drug transport.
It was demonstrated in Chapter 9 that the coupling of UV-vis absorption spec-
troscopy with electrochemical impedance spectroscopy represents a promising
methodology for monitoring transdermal iontophoresis. The UV-vis absorption
spectroscopy system was shown to be properly calibrated. Preliminary trans-
dermal iontophoresis experiments indicated that electrical current enhanced li-
docaine flux.
Despite the successful application of UV-vis absorption spectroscopy for the
measurement of the lidocaine delivery rates across skin, there remain unresolved
issues. For example, some of the absorption measurements that indicated lido-
caine concentration decreased for short intervals during the transdermal flux ex-
periments. As passive diffusion was small and positive across the skin, the un-
usual result was probably caused by measurement error. Hence, it is recom-
mended that additional transdermal iontophoresis experiments be performed to
determine the source of the anomalous behavior. In addition, UV-vis absorp-
tion spectroscopy is an inferential technique, therefore, supplemental experimen-
tal methods, such as mass spectroscopy or high-performance liquid chromatogra-
phy, should be implemented to directly measure lidocaine concentrations in the
receptor chamber of the diffusion cell. This approach could be used to validate
244
the accuracy and precision of the UV-vis absorption spectroscopy measurements
under iontophoretic conditions.
The influence of controlled variables such as solution composition and applied
current on the delivery of a model drug across the stratum corneum was assessed
by the steady-state model of the transdermal iontophoresis. The stratum corneum
was simulated as a homogeneous membrane with uniform properties. The ac-
tual structure and composition of human stratum corneum is much more complex
than for the transdermal system simulated here. Despite this limitation, the im-
portant factors affecting transdermal delivery of ionic drug compounds by ionto-
phoresis, such as the negative background charge and low permeability of stratum
corneum, were considered.
Interactions with the negative background charge of the stratum corneum were
coupled through the electroneutrality condition. Specific interactions, such as the
binding of solution cations with the negative background charge of skin, were not
considered. A mechanism for binding could be included in the model by intro-
ducing a Gibbs adsorption isotherm at the interface between the negative charge
sites of the skin and the electrolyte solution. The driving force for the adsorption
reactions should be proportional to the electrostatic potential difference at the in-
terface. The model could also be refined to account for additional equilibrated
homogeneous reactions such as the dissociation of stratum corneum fatty acids.
These types of refinements would provide for an improved model of transdermal
iontophoresis.
APPENDIX APREPARATION OF EPIDERMIS
Heat separated human cadaver skin was used for all of the experimental stud-
ies. The thickness of the skin samples was on the order of 100 µm which corre-
sponded to the uppermost layers of the epidermis. The stratum corneum com-
posed the top 20 µm of the membranes. The skin samples were extracted from the
cadavers at ALZA Corporation and were shipped by over-night express mail in
insulated containers. The procedure for separating the epidermis from the dermis
is described here.262
1. If frozen skin was used, it was allowed to partially thaw. The partially
thawed skin was cut into 10 cm x 15 cm pieces. Half of the underlying tis-
sue and fat were trimmed with a scalpel or scissors such that the dermis and
epidermis remained intact.
2. The full-thickness skin was rinsed in a pan of room-temperature deionized
water for several minutes.
3. The full-thickness skin was then rinsed in a pan of 32 C deionized water
and allowed to soak for several minutes.
4. The full-thickness skin was transferred to a large beaker or pan of deionized
water with an initial temperature of 62.0 C. The skin was submerged with a
glass stirring rod for one minute. The time and temperature were measured
by a stopwatch and digital thermometer, respectively.
245

246
5. The warm skin was transferred onto plastic sheeting or a piece of lab-bench
liner for separation of the epidermis. At the start of the separation proce-
dure the edge of the dermis was held with tweezers and the epidermis with
lightly impacted with the edge of a round-tipped spatula. After approxi-
mately 4 cm2 of the epidermis was separated, the dermis was held down
with a gloved hand and the epidermis pushed away with the spatula or
gloved finger.
6. The epidermis was placed a pan of deionized water, floating the epidermis
with the dermal side facing the water to rinse the epidermis. This step was
repeated several times to remove excess fat from the skin. The epidermis
was shipped for use or was stored for later use.
7. The epidermis was prepared for storage by floating it in a pan of water and
placing a piece of release liner (polymer sheeting) under the epidermis. The
release liner was used to pick up the epidermis and wrinkles in the mem-
brane removed. The epidermis was placed between a second piece of release
liner and gently agitated to remove excess water. The epidermis was pack-
aged in plastic bag, sealed, and stored at 4 C for a period not longer than 3
weeks.

APPENDIX BVAG MODULATION FOR IMPEDANCE SPECTROSCOPY
In order to maintain linearity in an electrochemical system, the potential must
be kept below a critical value which is characteristic to the system under study.
A typical impedance scan starts at high frequency and the frequency is decreased
incrementally until the minimum measuring frequency is attained. Electrochem-
ical systems frequently exhibit a three order of magnitude increase in impedance
as the frequency is swept from high to low. For a constant-amplitude galvanostat-
ically modulated experiment, the potential difference will reach its greatest value
where the impedance exhibits its greatest value. Wojcik et al.235 developed an
algorithm to adjust the current perturbation at each measuring frequency to pre-
vent large potential differences during the course of an electrochemical impedance
spectroscopy experiment.
B.1 Design Equations
The first set of operations performed in the predictive algorithm estimate the
impedance value at the next measuring frequency in the scan. For all but the
first 3 measuring frequencies, the predicted impedance is obtained from a second
order accuracy linear extrapolation of the previously measured impedance values.
Throughout the course of an experiment, the predicted impedance value is used
with a set value for the desired potential difference in the system to calculate the
current perturbation at the next measuring frequency according to
∆ I(ω) =∆Vtarget
|Z(ω)|estimated(B-1)
247

248
where ∆Vtarget is the desired potential response and |Z(ω)|estimated is the guess value
for the first impedance measurement. A good estimate for the first value of the
impedance is the electrolytic solution resistance. The impedance value measured
at the first frequency is then used to predict the appearance at the second fre-
quency according to
Z(ωk) = Z(ωk−1) + O(
log(
ωk
ωk−1
))2
(B-2)
For the third measuring frequency, the impedance is predicted by the two point
formula
Z(ωk) = 2Z(ωk−1)− Z(ωk−2) + O(
log(
ωk
ωk−1
))2
(B-3)
For the remainder of the impedance scan, the impedance is predicted by
Z(ωk) = 3Z(ωk−1)− 3Z(ωk−2) + Z(ωk−3) + O(
log(
ωk
ωk−1
))2
(B-4)
An essential feature of the variable amplitude modulation technique is that dy-
namic adjustment of the current measuring resistor is required to achieve accept-
able signal-to-noise ratios. Appropriate measuring resistor selection was achieved
in this work using a custom software control interface written in LabVIEW Gr
for Windows. The application of variable-amplitude galvanostatic modulation
was shown to be less invasive than traditional constant amplitude galvanostatic
control.263 The variable amplitude galvanostatic modulation technique has been
applied to corrosion studies of copper and steel.264
B.2 Error Analysis of VAG Modulation Scheme
A study was performed in this work to assess the accuracy of the predictive
algorithm for the skin system. A typical skin impedance spectrum was used to
compare the algorithm predictions for impedance to the measured values at at
249
each frequency. The percent relative error was calculated according to
Erelative =|Z(ω)|estimated − |Z(ω)|data
|Z(ω)|data× 100% (B-5)
where |Z(ω)|estimated and |Z(ω)|data are the impedance quantities from the algorithm
and measurement, respectively. The percent relative error as a function of fre-
quency is presented in Figure B-1. Predictions based on the impedance data are
shown by the filled triangles. The errors appear to be randomly distributed with
a mean of 3.03x10⁻²% and standard deviation of 1.18%. The errors contain contri-
butions from the predictive algorithm and the experimental apparatus according
to
Etotal = Ealgorithm − Einstrument (B-6)
where Ealgorithm represents the error associated with Taylor series prediction of the
impedance and Einstrument is the error contribution from the experimental appara-
tus.
Although the relative error for the prediction of the impedance was as large as
2.2% the influence of the error on the experiment is expected to be minimal. As
long as the instrument provides an acceptable signal-to-noise ratio and linearity is
maintained in the system, accurate impedance measurements should be obtained.
The numerical accuracy of the predictive algorithm was estimated from sim-
ulations of an ideal circuit network consisting of a resistor in series with a RC
element (see, for example Figure, 3-3) and a second circuit network consisting of
a resistor in series with a parallel combination of a resistor and a constant phase
element (see, for example, Figure 3-6). The constant phase element network was
included in the simulations because it provides an impedance response which is
similar to that of skin. For both networks the polarization impedance and charac-
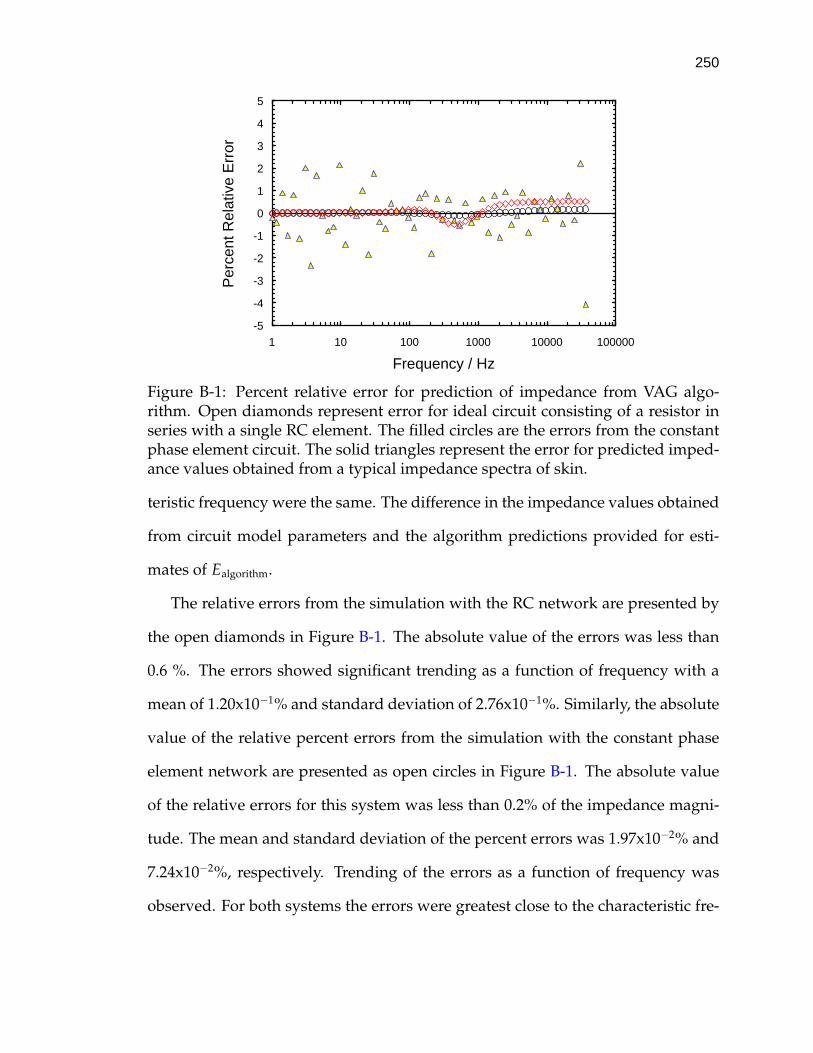
250
-5
-4
-3
-2
-1
0
1
2
3
4
5
1 10 100 1000 10000 100000
Frequency / Hz
Per
cent
Rel
ativ
e E
rror
Figure B-1: Percent relative error for prediction of impedance from VAG algo-rithm. Open diamonds represent error for ideal circuit consisting of a resistor inseries with a single RC element. The filled circles are the errors from the constantphase element circuit. The solid triangles represent the error for predicted imped-ance values obtained from a typical impedance spectra of skin.
teristic frequency were the same. The difference in the impedance values obtained
from circuit model parameters and the algorithm predictions provided for esti-
mates of Ealgorithm.
The relative errors from the simulation with the RC network are presented by
the open diamonds in Figure B-1. The absolute value of the errors was less than
0.6 %. The errors showed significant trending as a function of frequency with a
mean of 1.20x10⁻¹% and standard deviation of 2.76x10⁻¹%. Similarly, the absolute
value of the relative percent errors from the simulation with the constant phase
element network are presented as open circles in Figure B-1. The absolute value
of the relative errors for this system was less than 0.2% of the impedance magni-
tude. The mean and standard deviation of the percent errors was 1.97x10⁻²% and
7.24x10⁻²%, respectively. Trending of the errors as a function of frequency was
observed. For both systems the errors were greatest close to the characteristic fre-
251
quency, although the spread of the data was significantly smaller for the constant
phase element network.
The larger prediction errors associated with the RC element network were
likely coupled to the relatively larger slope of the impedance as a function of fre-
quency. The equations for the predictive algorithm are derived from a first-order
Taylor’s series expansion of the impedance. The expansion provides estimates
for the impedance at the next measuring frequency by multiplying the slope of
the impedance by the frequency interval. Since the slope of the RC element net-
work is greater than the constant phase element network, especially at frequencies
near the characteristic frequency, errors in the prediction of the impedance will be
greater. In general, the predictive algorithm will be more accurate for systems such
as skin where the impedance changes less dramatically as a function of frequency
as compared to a RC element network with the same polarization impedance and
characteristic frequency.
APPENDIX CSTATISTICAL OUTPUT
The results presented in this appendix were generated in the preliminary anal-
ysis of variance in the skin impedance data sets. Statistical parameters describing
the distribution characteristics of the impedance data are presented in the first sec-
tion. Skin polarization resistance and critical frequency were selected as charac-
teristic parameters for the impedance spectra. The data were grouped according
to electrolyte type to evaluate the influence of cation charge on the variation in
skin impedance. The results from regressions of the Generalized Linear Model to
various transformations of the skin impedance data are presented in Section C.2
and histograms of the skin data are presented in Section C.3.
C.1 Distribution Statistics from EIS Measurements of Skin Hydration
At the start of all experiments described in this text multiple electrochemical
impedance spectra were collected to monitor skin hydration. The heat-separated
epidermal membranes were immersed in inorganic chloride salt solutions of mono-
valent or divalent cations. As a large database of measurements was collected the
polarization resistance and critical frequency were selected as representative pa-
rameters for skin transport properties. The polarization resistance and critical fre-
quency associated with the impedance spectra of skin hydration were separated
according to electrolyte type.
Student’s t−tests and F-tests were performed on the data sets to determine
whether the population means and population variances were equal for the exper-
iments conducted in monovalent and divalent cations. Furthermore, the grouping
252
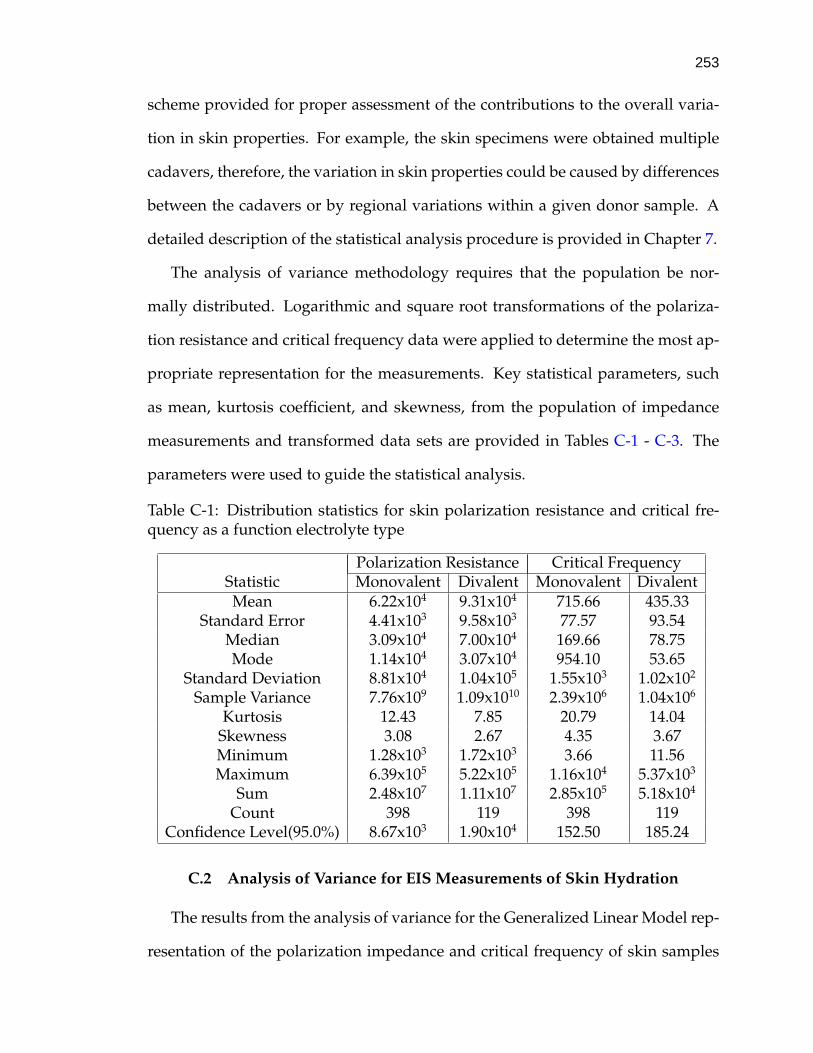
253
scheme provided for proper assessment of the contributions to the overall varia-
tion in skin properties. For example, the skin specimens were obtained multiple
cadavers, therefore, the variation in skin properties could be caused by differences
between the cadavers or by regional variations within a given donor sample. A
detailed description of the statistical analysis procedure is provided in Chapter 7.
The analysis of variance methodology requires that the population be nor-
mally distributed. Logarithmic and square root transformations of the polariza-
tion resistance and critical frequency data were applied to determine the most ap-
propriate representation for the measurements. Key statistical parameters, such
as mean, kurtosis coefficient, and skewness, from the population of impedance
measurements and transformed data sets are provided in Tables C-1 - C-3. The
parameters were used to guide the statistical analysis.
Table C-1: Distribution statistics for skin polarization resistance and critical fre-quency as a function electrolyte type
Polarization Resistance Critical FrequencyStatistic Monovalent Divalent Monovalent DivalentMean 6.22x10⁴ 9.31x10⁴ 715.66 435.33
Standard Error 4.41x10³ 9.58x10³ 77.57 93.54Median 3.09x10⁴ 7.00x10⁴ 169.66 78.75Mode 1.14x10⁴ 3.07x10⁴ 954.10 53.65
Standard Deviation 8.81x10⁴ 1.04x10⁵ 1.55x10³ 1.02x10²
Sample Variance 7.76x10⁹ 1.09x10¹⁰ 2.39x10⁶ 1.04x10⁶
Kurtosis 12.43 7.85 20.79 14.04Skewness 3.08 2.67 4.35 3.67Minimum 1.28x10³ 1.72x10³ 3.66 11.56Maximum 6.39x10⁵ 5.22x10⁵ 1.16x10⁴ 5.37x10³
Sum 2.48x10⁷ 1.11x10⁷ 2.85x10⁵ 5.18x10⁴
Count 398 119 398 119Confidence Level(95.0%) 8.67x10³ 1.90x10⁴ 152.50 185.24
C.2 Analysis of Variance for EIS Measurements of Skin Hydration
The results from the analysis of variance for the Generalized Linear Model rep-
resentation of the polarization impedance and critical frequency of skin samples
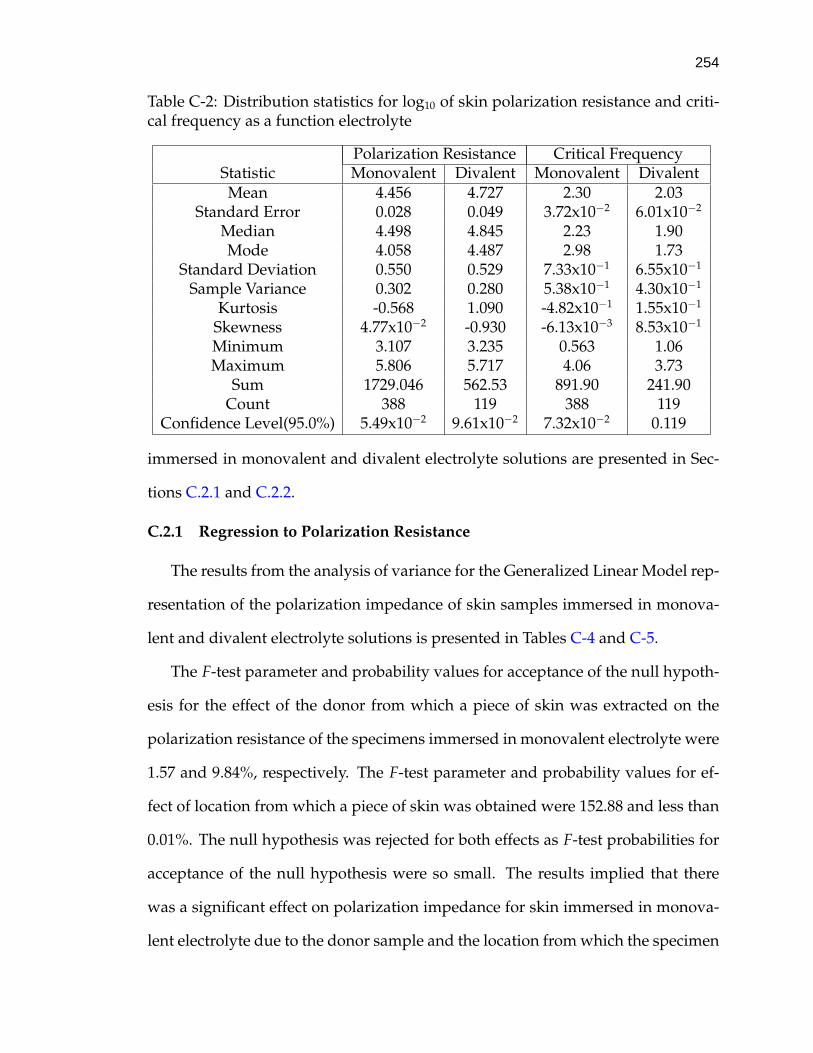
254
Table C-2: Distribution statistics for log10 of skin polarization resistance and criti-cal frequency as a function electrolyte
Polarization Resistance Critical FrequencyStatistic Monovalent Divalent Monovalent DivalentMean 4.456 4.727 2.30 2.03
Standard Error 0.028 0.049 3.72x10⁻² 6.01x10⁻²
Median 4.498 4.845 2.23 1.90Mode 4.058 4.487 2.98 1.73
Standard Deviation 0.550 0.529 7.33x10⁻¹ 6.55x10⁻¹
Sample Variance 0.302 0.280 5.38x10⁻¹ 4.30x10⁻¹
Kurtosis -0.568 1.090 -4.82x10⁻¹ 1.55x10⁻¹
Skewness 4.77x10⁻² -0.930 -6.13x10⁻³ 8.53x10⁻¹
Minimum 3.107 3.235 0.563 1.06Maximum 5.806 5.717 4.06 3.73
Sum 1729.046 562.53 891.90 241.90Count 388 119 388 119
Confidence Level(95.0%) 5.49x10⁻² 9.61x10⁻² 7.32x10⁻² 0.119
immersed in monovalent and divalent electrolyte solutions are presented in Sec-
tions C.2.1 and C.2.2.
C.2.1 Regression to Polarization Resistance
The results from the analysis of variance for the Generalized Linear Model rep-
resentation of the polarization impedance of skin samples immersed in monova-
lent and divalent electrolyte solutions is presented in Tables C-4 and C-5.
The F-test parameter and probability values for acceptance of the null hypoth-
esis for the effect of the donor from which a piece of skin was extracted on the
polarization resistance of the specimens immersed in monovalent electrolyte were
1.57 and 9.84%, respectively. The F-test parameter and probability values for ef-
fect of location from which a piece of skin was obtained were 152.88 and less than
0.01%. The null hypothesis was rejected for both effects as F-test probabilities for
acceptance of the null hypothesis were so small. The results implied that there
was a significant effect on polarization impedance for skin immersed in monova-
lent electrolyte due to the donor sample and the location from which the specimen

255
Table C-3: Distribution statistics for square root of skin polarization resistance andcritical frequency as a function electrolyte
Polarization Resistance Critical FrequencyStatistic Monovalent Divalent Monovalent DivalentMean 206.06 270.01 19.93 14.52
Standard Error 6.89 13.07 0.92 1.38Median 177.53 264.51 13.03 8.87Mode 106.94 175.14 30.89 7.32
Standard Deviation 135.76 142.62 18.20 15.04Sample Variance 1.84x10⁴ 2.03x10⁴ 331.28 226.27
Kurtosis 2.38 2.01 6.02 5.77Skewness 1.43 1.10 2.21 2.42Minimum 35.79 41.43 1.91 3.40Maximum 799.65 722.22 107.51 73.25
Sum 8.00x10⁴ 3.21x10⁴ 7733.55 1728.41Count 388 119 388 119
Confidence Level(95.0%) 13.55 25.89 1.82 2.73Table C-4: Calculated contributions to variance from regression of GLM model toskin polarization resistance data for pieces immersed in monovalent electrolyte
Variable DOF Mean Sq. F value ProbabilityDonor type 16 3.72x10¹⁰ 1.57 0.0984
Location(Donor) 79 2.57x10¹⁰ 152.88 < 0.0001
was extracted. Similar results were obtained from the regression of the statistical
model to the data set for skin immersed in divalent electrolyte, however, the effect
of donor sample on the polarization impedance was even greater as both proba-
bilities for acceptance of the null hypothesis were less than 0.01%.
C.2.2 Regression to Critical Frequency
The results from the analysis of variance for error terms for the Generalized
Linear Model to the critical frequencies of skin samples immersed in monovalent
and divalent electrolyte solutions is presented in Tables C-6 and C-7. The F-test
Table C-5: Calculated contributions to variance from regression of GLM model toskin polarization resistance data for pieces immersed in divalent electrolyte
Variable DOF Mean Sq. F value ProbabilityDonor type 11 1.03x10¹¹ 12.07 < 0.0001
Location(Donor) 20 7.77x10⁹ 87.32 < 0.0001

256
Table C-6: Calculated contributions to the total variance from regression of GLMmodel to the critical frequency of skin immersed in monovalent electrolyte
Variable DOF Mean Sq. F value ProbabilityDonor type 16 9.84x10⁶ 1.14 0.332
Location(Donor) 79 9.31x10⁶ 294.96 < 0.0001Table C-7: Calculated contributions to the total variance from regression of GLMmodel to the critical frequency of skin immersed in divalent electrolyte
Variable DOF Mean Sq. F value ProbabilityDonor type 11 3.75x10⁶ 0.85 0.6005
Location(Donor) 20 4.05x10⁶ 396.28 < 0.0001
parameter and probability values for acceptance of the null hypothesis (i.e., that
there was no significant variance in critical frequency for skin immersed in mono-
valent electrolyte due to the donor sample from which the piece was obtained)
were 1.14 and 33.2%. Similarly, the F-test parameter and probability values for
effect of location from which a piece of skin was obtained were 396.28 and 60.05%.
The null hypothesis for the effect of donor sample on the critical frequency
for skin immersed in monovalent electrolyte could not be rejected, as there was a
33.2% chance of selecting two pieces of skin with similar critical frequencies from
different donors. Alternatively stated, there was a small variation in critical fre-
quency due to differences in skin from the donor population. Since the F-test prob-
ability value for the effect of extraction site of skin immersed in divalent electrolyte
was 60.05%, the null hypothesis was not rejected. The relatively high F-test value
indicated the site-to-site variation of critical frequency was insignificant. This im-
plied the effect of extraction location on critical frequency for skin immersed in
divalent electrolyte was not as pronounced as for the skin samples immersed in
monovalent electrolyte.
The analysis of variance study indicated that the polarization impedances and
critical frequencies for pieces of skin obtained from the same donor sample were
not correlated. In other words, the intra-individual variation of skin properties
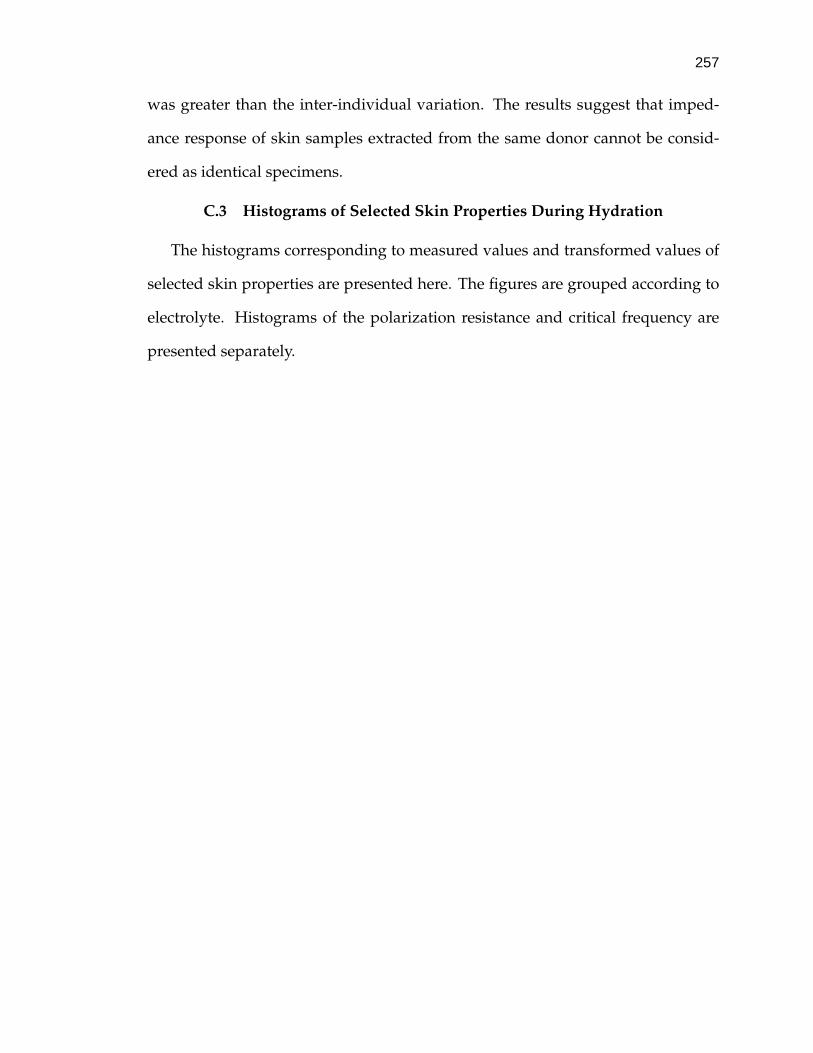
257
was greater than the inter-individual variation. The results suggest that imped-
ance response of skin samples extracted from the same donor cannot be consid-
ered as identical specimens.
C.3 Histograms of Selected Skin Properties During Hydration
The histograms corresponding to measured values and transformed values of
selected skin properties are presented here. The figures are grouped according to
electrolyte. Histograms of the polarization resistance and critical frequency are
presented separately.
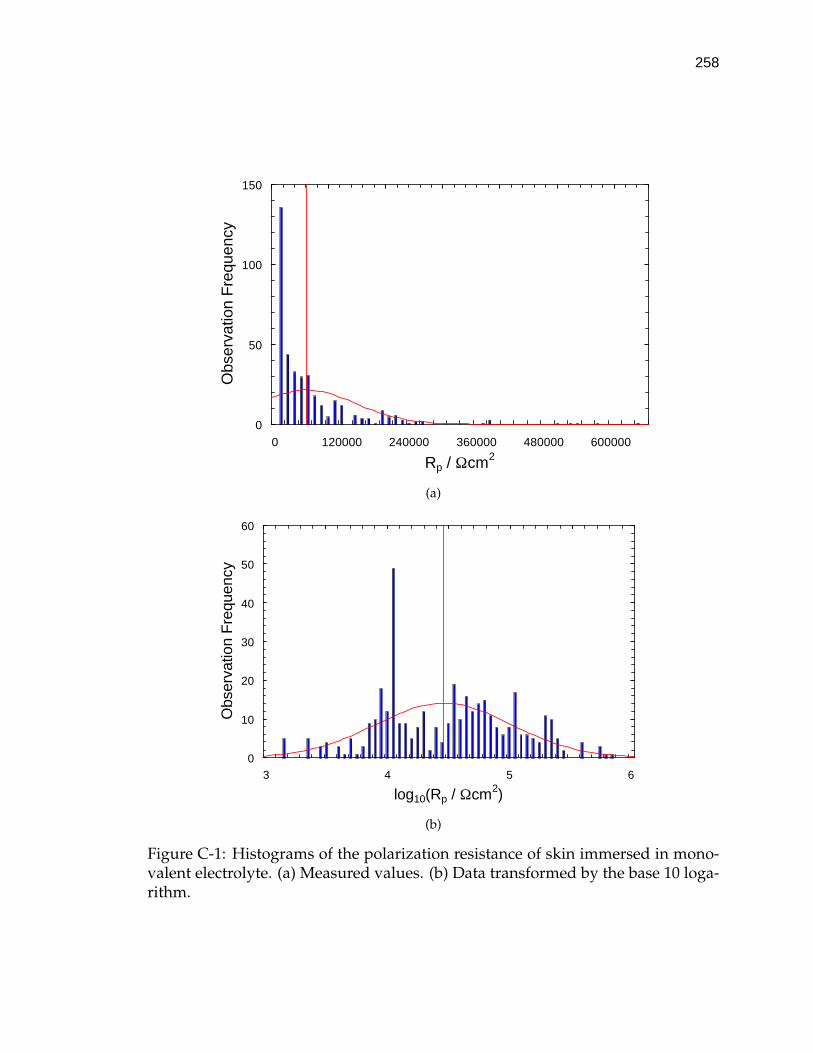
258
0
50
100
150
0 120000 240000 360000 480000 600000
Rp / Ωcm2
Obs
erva
tion
Fre
quen
cy
(a)
0
10
20
30
40
50
60
3 4 5 6
log10(Rp / Ωcm2)
Obs
erva
tion
Fre
quen
cy
(b)
Figure C-1: Histograms of the polarization resistance of skin immersed in mono-valent electrolyte. (a) Measured values. (b) Data transformed by the base 10 loga-rithm.

259
0
5
10
15
20
0 120000 240000 360000 480000 600000
Rp / Ωcm2
Obs
erva
tion
Fre
quen
cy
(a)
0
5
10
15
3 4 5 6
log10(Rp / Ωcm2)
Obs
erva
tion
Fre
quen
cy
(b)
Figure C-2: Histograms of polarization resistance of skin immersed in divalentelectrolyte. (a) Distribution of measured values. (b) Data transformed by the base10 logarithm.
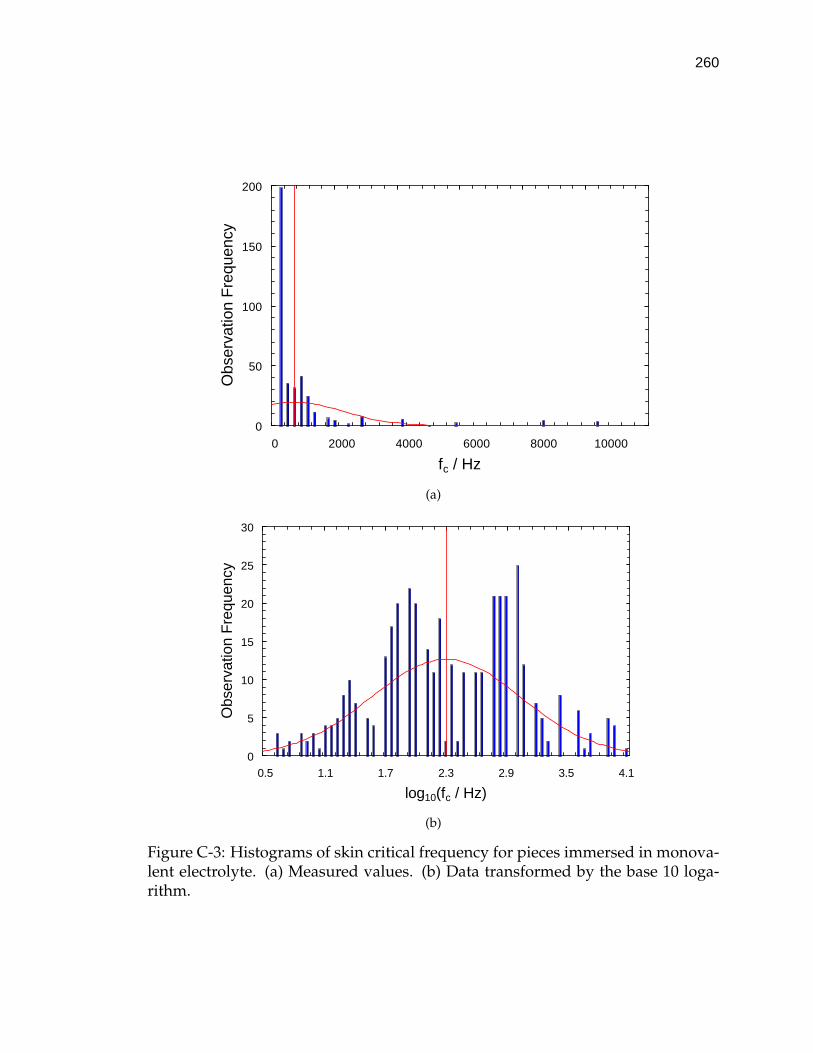
260
0
50
100
150
200
0 2000 4000 6000 8000 10000
fc / Hz
Obs
erva
tion
Fre
quen
cy
(a)
0
5
10
15
20
25
30
0.5 1.1 1.7 2.3 2.9 3.5 4.1
Obs
erva
tion
Fre
quen
cy
log10(fc / Hz)
(b)
Figure C-3: Histograms of skin critical frequency for pieces immersed in monova-lent electrolyte. (a) Measured values. (b) Data transformed by the base 10 loga-rithm.
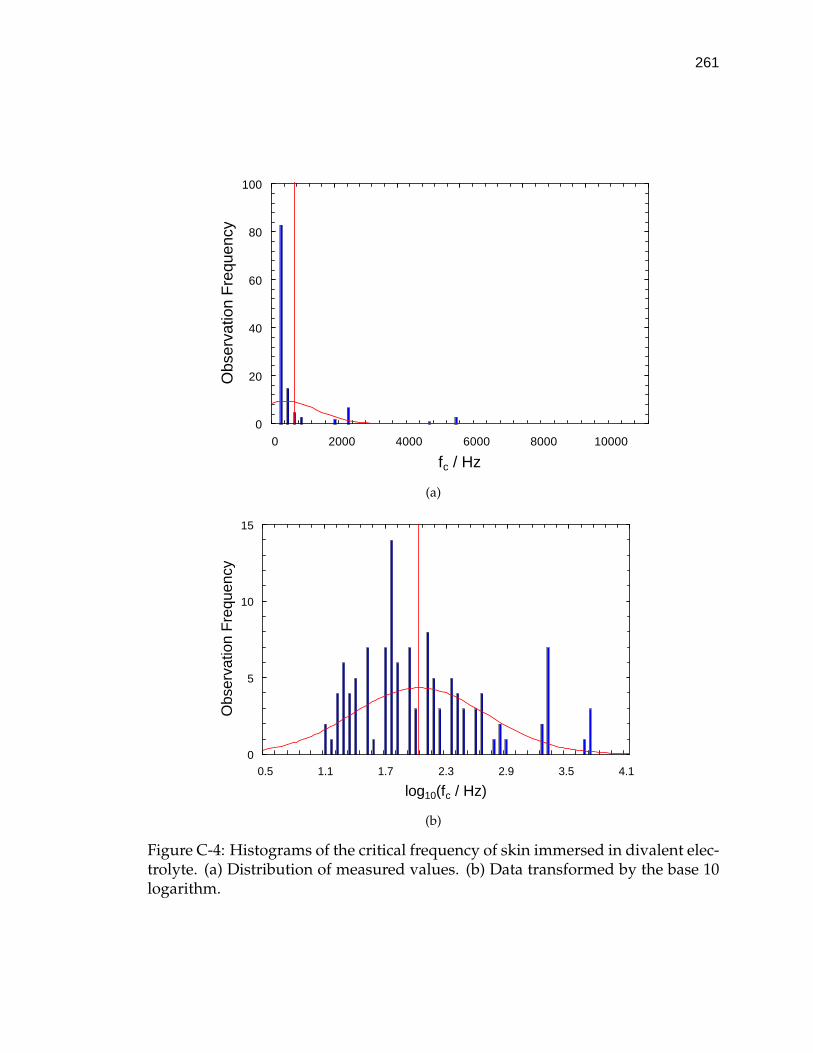
261
0
20
40
60
80
100
0 2000 4000 6000 8000 10000
fc / Hz
Obs
erva
tion
Fre
quen
cy
(a)
0
5
10
15
0.5 1.1 1.7 2.3 2.9 3.5 4.1
log10(fc / Hz)
Obs
erva
tion
Fre
quen
cy
(b)
Figure C-4: Histograms of the critical frequency of skin immersed in divalent elec-trolyte. (a) Distribution of measured values. (b) Data transformed by the base 10logarithm.

REFERENCES
1. G. B. Kasting and L. A. Bowman, “DC Electrical Properties of Frozen, ExcisedHuman Skin,” Pharmaceurlcal Research, 7 (1990) 134–143.
2. D. Panescu, K. P. Cohen, J. G. Webster, and R. A. Stratbucker, “The MosaicElectrical Characteristics of the Skin,” IEEE Transactions on Biomedical Engi-neering, 40 (1993) 434–439.
3. M. R. Prausnitz, “The Effects of Electric Current Applied to Skin: A Reviewfor Transdermal Drug Delivery,” Advanced Drug Delivery Reviews, 18 (1996)395–425.
4. H. Schaefer and T. E. Redelmeier, Skin Barrier: Principles of Percutaneous Ab-sorption (New York: Karger, 1996).
5. M. Orkin, H. I. Maibach, and M. V. Dahl, editors, Dermatology, 1st edition(Norwalk, Connecticut: Appleton and Lange, 1991).
6. A. F. Kydonieus and B. Berner, Transdermal Delivery of Drugs, Volume I (BocaRaton, FL: CRC Press, 1987).
7. L. A. Goldsmith, editor, Biochemistry and Molecular Biology of the Skin (NewYork: Oxford University Press, 1991).
8. S. L. Moschella and H. J. Hurley, editors, Dermatology, 3rd edition (Philadel-phia: W.B. Saunders and Company, 1992).
9. I. M. Leigh, E. B. Lane, and F. M. Watt, editors, The Keratinocyte Handbook(Cambridge, Great Britain: Cambridge University Press, 1994).
10. A. K. Banga, Electrically Assisted Transdermal and Topical Drug Delivery (Bristol,PA: Taylor and Francis, Inc., 1998).
11. K. A. Holbrook, Ultrastructure of the Epidermis: Chapter 1 of the KeratinocyteHandbook, edited by Leigh, I. M. and Lane, E. B. and Watt, F. M. (Cambridge,Great Britain: Cambridge University Press, 1994) 3–39.
12. T. M. Suhonen, J. A. Bouwstra, and A. Urtti, “Chemical Enhancement ofPercutaneous Absorption in Relation to Stratum Corneum Structural Alter-ations,” Journal of Controlled Release, 59 (1999) 149–161.
13. R. J. Scheuplein and I. H. Blank, “Permeability of the Skin,” Physiological Re-views, 51 (1971) 702–747.
262

263
14. M. A. Lampe, A. L. Burlingame, J. Whitney, M. L. Williams, B. E. Brown,E. Roitman, and P. M. Elias, “Human Stratum Corneum Lipids: Characteri-zation and Regional Variations,” Journal of Lipid Research, 24 (1983) 120–129.
15. H. Wakita, K. Nishimura, and M. Takigawa, “Composition of Free Long-Chain(Sphingoid) Bases in Stratum Corneum of Normal and Pathologic Hu-man Skin Conditions,” The Journal of Investigative Dermatology, 99 (1992) 617–622.
16. L. Norlen, I. Nicander, B. Rozell, S. Ollmar, and B. Forslind, “Inter- and Intra-Individual Differences in Human Stratum Corneum Lipid Content Related toPhysical Parameters of Skin Barrier Function in vivo,” Journal of InvestigativeDermatology, 112 (1999) 72–77.
17. N. Y. Schurer, G. Plewig, and P. M. Elias, “Stratum Corneum Lipid Function,”Dermatologica, 183 (1991) 77–94.
18. N. Farinelli and E. Berardesca, The Skin Integument: Variation Relative to Sex,Age, Race, and Body Region: Chapter 2.2 of Handbook of Non-Invasive Methodsand the Skin, edited by Serup, J. and Jemec, J. B. E. (Boca Raton, Florida: CRCPress, 1995) 23–27.
19. F. Parker, Structure and Function of the Skin: Chapter 1 in Dermatology edited byOrkin, M. and Maibach, H. I. and Dahl, M. V., 1st edition (Norwalk, Connecti-cut: Appleton and Lange, 1991).
20. J. B. Phipps, R. V. Padmanabhan, and G. A. Lattin, “Transport of Ionic SpeciesThrough Skin,” Solid State Ionics, 28 (1988) 1778–1783.
21. G. F. Odland, Structure of the Skin: Chapter 1 of Biochemistry and Physiology ofthe Skin, edited by Goldsmith, L. A. (New York: Oxford University Press, 1991)3–62.
22. D. T. Downing, “Lipid and Protein Structures in the Permeability Barrier ofMammalian Epidermis,” Journal of Lipid Research, 33 (1992) 301–313.
23. J. E. Riviere and M. C. Heit, “Electrically-Assisted Transdermal Drug Deliv-ery,” Pharmaceutical Research, 14 (1997) 687–697.
24. B. Forslind, “A Domain Mosaic Model of the Skin Barrier,” Acta Dermato-Venereologica, 74 (1994) 1–6.
25. R. F. Rushmer, K. J. K. Buettner, J. M. Short, and G. F. Odland, “The Skin,”Science, 154 (1966) 343–348.
26. R. J. Scheuplein and R. L. Bronaugh, Percutaneous Absorption: Chapter 58 inBiochemistry and Physiology of the Skin, edited by Goldsmith, L. A. (New York:Oxford University Press, 1983) 1255–1295.
27. K. Tojo, “Mathematical Model of Iontophoretic Transdermal Drug Delivery,”Journal of Chemical Engineering of Japan, 22 (1989) 512–518.
264
28. W. H. M. Craane-van Hinsberg, J. C. Verhoef, L. J. Bax, H. E. Junginger,and H. E. Bodde, “Role of Appendages in Skin Resistance and IontophoreticPeptide Flux: Human Versus Snake Skin,” Pharmaceutical Research, 12 (1995)1506–1512.
29. S. Grimnes, “Pathways of Ionic Flow Through Human Skin in vivo,” ActaDermato-Venereologica, 64 (1984) 93–98.
30. C. Cullander and R. H. Guy, “Sites of Iontophoretic Current Flow Into theSkin: Identification and Characterization with the Vibrating Probe Elec-trode,” Journal of Investigative Dermatology, 97 (1991) 55–64.
31. S. T. Kinsey, T. S. Moerland, L. McFadden, and B. R. Locke, “Spatial Res-olution of Transdermal Water Mobility Using NMR Microscopy,” MagneticResonance Imaging, 15 (1997) 939–947.
32. J. Hadgraft, “Structure Activity Relationships and Percutaneous Absorp-tion,” Journal of Controlled Release, 15 (1991) 221–226.
33. P. E. Bowden, Keratins and Other Epidermal Proteins: Chapter 2 of MolecularAspects of Dermatology, edited by Priestley, G. C. (New York: John Wiley andSons, 1993) 19–54.
34. J. E. Shaw, M. Prevo, R. Gale, and S. I. Yum, Percutaneous Absorption: Chapter55 of Physiology, Biochemistry and Molecular Biology of the Skin edited by Gold-smith, L. A. (New York: Oxford University Press, 1991) 1255–1295.
35. P. W. Wertz and B. van den Bergh, “The Physical, Chemical and FunctionalProperties of Lipids in the Skin and Other Biological Barriers,” Chemistry andPhysics of Lipids, 91 (1998) 85–96.
36. L. Landmann, “Epidermal Permeability Barrier: Transformation of Lamel-lar Granule-Disks into Intercellular Sheets by a Membrane-Fusion Process, aFreeze-Fracture Study,” Journal of Investigative Dermatology, 87 (1986) 202–209.
37. K. C. Madison, D. C. Swartzendruber, P. W. Wertz, and D. T. Downing, “Pres-ence of Intact Intercellular Lipid Lamellae in the Upper Layers of the StratumCorneum,” Journal of Investigative Dermatology, 88 (1987) 714–718.
38. D. C. Swartzendruber, P. W. Wertz, D. J. Kitko, K. C. Madison, and D. T.Downing, “Molecular Models of the Intercellular Lipid Lamellae in Mam-malian Stratum Corneum,” The Journal of Investigative Dermatology, 92 (1989)251–257.
39. H. J. Yardley and R. Summerly, “Lipid Composition and Metabolism in Nor-mal and Diseased Epidermis,” Pharmacology and Therapeutics, 13 (1981) 357–383.
40. R. J. Scheuplein, “Mechanism of Percutaneous Adsorption. I. Routes of Pen-etration and the Influence of Solubility,” The Journal of Investigative Dermatol-ogy, 45 (1965) 334–346.
265
41. A. G. Matoltsy, A. M. Downes, and T. M. Sweeney, “Studies of the Epider-mal Water Barrier Part II. Investigation of the Chemical Nature of the WaterBarrier,” Journal of Investigative Dermatology, 50 (1968) 19–26.
42. R. O. Potts, G. M. Guia, M. L. Francoeur, V. H. M. Mak, and R. H. Guy, “Mech-anism and Enhancement of Solute Transport Across the Stratum Corneum,”Journal of Controlled Release, 15 (1991) 249–260.
43. D. J. Bibel, R. Aly, S. Shah, and H. R. Shinefield, “Sphingosines: AntimicrobialBarriers of the Skin,” Acta Dermato-Venereologica, 73 (1993) 407–411.
44. S. Ollmar, A. Eek, F. Sundstrom, and L. Emtestam, “Electrical Impedance forEstimation of Irritation in Oral Mucosa and Skin,” Medical Progress throughTechnology, 21 (1995) 29–37.
45. A. S. Michaels, S. K. Chandrasekaran, and J. E. Shaw, “Drug PermeationThrough Human Skin: Theory and in in vitro Experimental Measurement,”AIChE Journal, 21 (1975) 985–996.
46. P. M. Elias, “Epidermal Lipids, Barrier Function, and Desquamation,” Journalof Investigative Dermatology, 80 (1983) 44s–49s.
47. I. H. Blank, “Further Observations on Factors Which Influence the WaterContent of the Stratum Corneum,” Journal of Investigative Dermatology, 21(1953) 259–271.
48. S. Monash, “Location of the Superficial Epithelial Barrier to Skin Penetra-tion,” Journal of Investigative Dermatology, 29 (1957) 367–376.
49. S. Monash and H. Blank, “Location and Re-formation of the Epithelial Barrierto Water Vapor,” Journal of Investigative Dermatology, 78 (1958) 710–714.
50. T. Yamamoto and Y. Yamamoto, “Electrical Properties of the Epidermal Stra-tum Corneum,” Medical and Biological Engineering, 14 (1976) 151–158.
51. K. Tojo, Y. W. Chien, C. C. Chiang, and P. R. Keshary, “Effect of StratumCorneum Stripping on Skin Penetration of Drug,” Journal of Chemical Engi-neering of Japan, 21 (1988) 544–546.
52. Y. N. Kalia, F. Pirot, R. O. Potts, and R. H. Guy, “Ion Mobility Across HumanStratum in vivo,” Journal of Parmaceutical Sciences, 87 (1998) 1508–1511.
53. R. T. Tregear, “Interpretation of Skin Impedence Measurement,” Nature, 205(1965) 600–601.
54. R. O. Potts and M. L. Francoeur, “Lipid Biophysics of Water Loss Throughthe Skin,” Proceedings of the National Academy of Sciences of the United States ofAmerica, 87 (1990) 3871–3873.
55. S. A. Long, P. W. Wertz, J. S. Strauss, and D. T. Downing, “Human Stra-tum Corneum Polar Lipids and Desquamation,” Archives of DermatologicalResearch, 277 (1985) 284–287.
266
56. P. M. Elias, “Epidermal Barrier Function: Intercellular Lamellar Lipid Struc-tures, Origin, Composition and Metabolism,” Journal of Controlled Release, 15(1991) 199–208.
57. S. Naito, M. Hoshi, and S. Yagihara, “Microwave Dielectric Analysis of Hu-man Stratum Corneum in vivo,” Biochimica et Biophsica Acta, 1381 (1998) 293–304.
58. E. R. Scott and H. S. White, “Direct Imaging of Ionic Pathways in StratumCorneum Using Scanning Electrochemical Microscopy,” Solid State Ionics, 53-6 (1992) 176–183.
59. D. A. van Hal, E. Jeremiasse, H. E. Junginger, F. Spies, and J. A. Bouw-stra, “Structure of Fully Hydrated Human Stratum Corneum: A Freeze-Fracture Electron Microscopy Study,” The Journal of Investigative Dermatology,106 (1996) 89–95.
60. Y. A. Chizmadzhev, A. V. Indenbom, P. I. Kuzmin, S. V. Galichenko, J. C.Weaver, and R. O. Potts, “Electrical Properties of Skin at Moderate Voltages:Contribution of Appendageal Macropores,” Biophysical Journal, 74 (1998) 843–856.
61. P. W. Wertz, K. C. Madison, and D. T. Downing, “Covalently Bound Lipids ofHuman Corneum Stratum,” The Journal of Investagative Dermatology, 92 (1989)109–111.
62. H. E. Bodde, I. van den Brink, H. K. Koerten, and F. H. N. de Hann, “Visual-ization of in vitro Percutaneous Penetration of Mercuric Chloride; TransportThrough Intercellular Space Versus Cellular Uptake Through Desmosomes,”Journal of Controlled Release, 15 (1991) 227–236.
63. S. Motta, M. Monti, S. Sesana, R. Caputo, S. Carelli, and R. Ghidoni, “Ce-ramide Composition of the Psoriatic Scale,” Biochimica et Biophysica Acta, 1182(1993) 147–151.
64. N. Kitson, J. Thewalt, M. Lafleur, and M. Bloom, “A Model Membrane Ap-proach to the Epidermal Permeability Barrier,” Biochemistry, 33 (1994) 6707–6715.
65. G. Grubauer, K. R. Feingold, R. M. Harris, and P. M. Elias, “Lipid Content andLipid Type as Determinants of the Epidermal Permeability Barrier,” Journalof Lipid Research, 30 (1989) 89–96.
66. S. Zellmer and J. Lasch, “Individual Variation of Human Plantar StratumCorneum Lipids, Determined By Automated Multiple Development of High-Performance Thin-Layer Chromatography Plates,” Journal of ChromatographyB, 691 (1997) 321–329.
67. P. W. Wertz, “The Nature of the Epidermal Barrier: Biochemical Aspects,”Advanced Drug Delivery Reviews, 18 (1996) 283–294.
267
68. J. P. Vietzke, M. Strassner, and U. Hintze, “Separation and Identificationof Ceramides in the Human Stratum Corneum by High-Performance Liq-uid Chromatography coupled with Electrosprary Ionization Mass Sepec-trometry and Electrospray Multiple-stage Mass Spectromety Profiling,” Chro-matographia, 50 (1999) 15–20.
69. J. A. Bouwstra, F. E. R. Dubbelaar, G. S. Gooris, A. M. Weerheim, andM. Ponec, “The Role of Ceramide Composition in the Lipid Organisation ofthe Skin Barrier,” Biochimica et Biophysica Acta, 1419 (1999) 127–136.
70. M. Lafleur, “Phase Behavior of Model Stratum Corneum Lipid Mixtures: anInfrared Spectroscopy Investigation,” Canadian Journal of Chemistry, 76 (1998)1501–1511.
71. W. Abraham and D. T. Downing, “Deuterium NMR Investigation of Poly-morphism in Stratum Corneum Lipids,” Biochimica et Biophysica Acta, 1068(1991) 189–194.
72. J. B. Finean and R. H. Michell, Isolation, Composition and General Structure ofMembranes: Chapter 1 of Membrane Structure, edited by Finean, J. B. and Michell,R. H. (Amsterdam, Netherlands: Elsevier: North-Holland Biomedical Press,1981) 1–36.
73. R. B. Gennis, Biomembranes: Molecular Structure and Function (New York, NY:Springer-Verlag, 1989).
74. J. F. Tocanne and J. Teissie, “Ionization of Phospholipids and Phospholipid-Supported Interfacial Lateral Diffusion of Protons in Membrane Model Sys-tems,” Biochimica et Biophysica Acta, 1031 (1990) 111–142.
75. R. Lange-Lieckfieldt and G. Lee, “Use of a Model Lipid Matrix to Demon-strate the Dependence of the Stratum Corneum’s Barrier Properties on ItsInternal Geometry,” Journal of Controlled Release, 20 (1992) 183–194.
76. L. Stryer, Biochemistry, 3rd edition (New York: W. H. Freeman and Company,1988).
77. M. Edidin, Molecular Motion and Membrane Organization and Function: Chapter2 of Membrane Structure, edited by Finean, J. B. and Michell, R. H. (Amsterdam,Netherlands: Elsevier: North-Holland Biomedical Press, 1981) 37–82.
78. P. R. Cullis and M. J. Hope, Chapter 1: Physical Properties and Functional Roles ofLipids in Membranes in Biochemistry of Lipids, Lipoproteins and Membranes, editedby Vance, D. E. and Vance, J. E. (Amsterdam, Netherlands: Elsevier, 1991) 1–41.
79. P. W. Wertz, M. C. Miethke, S. A. Long, J. S. Strauss, and D. T. Downing,“The Composition of the Ceramides from Human Stratum Corneum andfrom Comedones,” The Journal of Investigative Dermatology, 84 (1985) 410–412.

268
80. T. Gildenast and J. Lasch, “Isolation of Ceramide Fractions from HumanStratum Corneum Lipid Extracts by High-Performance Liquid Chromatog-raphy,” Biochimica et Biophysica Acta, 1346 (1997) 69–74.
81. R. H. Guy and J. Hadgraft, “Physicochemical Aspects of Percutaneous Pene-tration and Its Enhancement,” Pharmaceutical Research, 5 (1988) 753–758.
82. C. A. Squier, P. Cox, and P. W. Wertz, “Lipid Content and Water Permeabilityof Skin and Oral Mucosa,” Journal of Investigative Dermatology, 96 (1991) 123–126.
83. M. E. DeVries, H. E. Bodde, J. C. Verhoef, M. Ponec, W. H. M. Craane-vanHinsberg, and H. E. Junginger, “Localization of the Permeability Barrier In-side Porcine Buccal Mucosa: A Combined in vitro Study of Drug Perme-ability, Electrical Resistance and TIssue Morphology,” International Journal ofPharmaceutics, 76 (1991) 25–35.
84. J. A. Bouwstra, G. S. Gooris, F. E. R. Dubbelaar, A. M. Weerheim, A. M. Ijer-man, and M. Ponec, “The Role of Ceramide 1 in the Molecular Organisationof Stratum Corneum Lipids,” Journal of Lipid Research, 39 (1998) 186–196.
85. D. Chapman, Lipid Dynamics of Cell Membranes : Chapter 2 of Cell Membranes :Biochemistry, Cell Biology, and Pathology, edited by Weissmann, Gerald and Clai-borne, Robert (New York: HP Publishing Company, Inc., 1975) 13–23.
86. K. Matsuzaki, T. Imaoka, M. Asano, and K. Miyajima, “Development of aModel Membrane System Using Stratum Corneum Lipids for Estimation ofDrug Skin Permeability,” Chemical and Pharmaceutical Bulletin, 41 (1993) 575–579.
87. G. S. K. Pilgram, A. M. Engelsma-van Pelt, G. T. Oostergetel, H. K. Koerten,and J. A. Bouwstra, “Study on the Lipid Organization of Stratum CorneumLipid Models by (Cryo-) Electron Diffraction,” Journal of Lipid Research, 39(1998) 1669–1676.
88. R. Neubert, W. Rettig, S. Wartewig, M. Wegener, and A. Wienhold, “Structureof Stratum Corneum Lipids Characterized By FT-Raman Spectroscopy andDSC. II. Mixtures of Ceramides and Saturated Fatty Acids,” Chemistry andPhysics of Lipids, 89 (1997) 3–14.
89. S. Zellmer, I. Zimmermann, C. Selle, B. Sternberg, W. Pohle, and J. Lasch,“Physicochemical Characterisation of Human Stratum Corneum Lipid Lipo-somes,” Chemistry and Physics of Lipids, 94 (1998) 97–108.
90. D. Bangham, Alec, Models of Cell Membranes : Chapter 3 of Cell Membranes : Bio-chemistry, Cell Biology, and Pathology, edited by Weissmann, Gerald and Claiborne,Robert (New York: HP Publishing Company, Inc., 1975) 24–34.
91. S. Y. E. Hou, A. K. Mitra, S. H. White, G. K. Menon, R. Ghadially, and P. M.Elias, “Membrane Structures in Normal and Essential Fatty Acid - Deficient
269
Stratum Corneum: Characterization by Ruthenium Tetroxide Staining andX-Ray Diffraction,” The Journal of Investigative Dermatology, 96 (1991) 215–223.
92. M. Fartasch, I. D. Bassukas, and T. L. Diepgen, “Structural Relationship Be-tween Epidermal Lipid Lamellae, Lamellar Bodies and Desmosomes in Hu-man Epidermis: An Ultrastructural Study,” British Journal of Dermatology, 128(1993) 1–9.
93. B. A. I. van den Bergh, D. C. Swartzendruber, A. Bos-Van Der Geest, J. J.Hoogstraate, A. H. G. J. Schrijvers, H. E. Bodde, H. E. Junginger, and J. A.Bouwstra, “Development of an Optimal Protocol for the UltrastructuralExamination of Skin by Transmission Electron Microscopy,” Journal of Mi-croscopy, 187 (1997) 125–133.
94. S. H. White, D. Mirejovsky, and G. I. King, “Structure of Lamellar Lipid Do-mains and Corneocyte Envelopes of Murine Stratum Corneum,” Biochem-istry, 27 (1988) 3725–3732.
95. J. A. Bouwstra, G. S. Gooris, J. A. van der Spek, and W. Bras, “Structural In-vestigations of Human Stratum Corneum by Small-Angle X-Ray Scattering,”Journal of Investigative Dermatology, 97 (1991) 1005–1012.
96. J. A. Bouwstra, G. S. Gooris, M. A. Salomons-de Vries, J. A. van der Spek, andW. Bras, “Structure of Human Stratum Corneum as a Function of Temper-ature and Hydration: A Wide-Angle-X-Ray Diffraction Study,” InternationalJournal of Pharmaceutics, 84 (1992) 205–216.
97. P. J. Caspers, G. W. Lucassen, R. Wolthuis, H. A. Bruining, and G. J. Puppels,“In vitro and in vivo Raman Spectroscopy of Human Skin,” Biospectroscopy, 4(1998) S31–S39.
98. D. L. A. de Faria and M. A. de Souza, “Raman Spectra of Human Skin andNail Excited in the Visible Region,” Journal of Raman Spectroscopy, 30 (1999)169–171.
99. G. M. Golden, D. B. Guzek, R. R. Harris, J. E. McKie, and R. O. Potts, “LipidThermotropic Transitions in Human Stratum Corneum,” Journal of Investiga-tive Dermatology, 86 (1986) 255–259.
100. B. Ongpipattanakul, M. L. Francoeur, and R. O. Potts, “Polymorphism inStratum Corneum Lipids,” Biochimica et Biophysica Acta, 1190 (1994) 115–122.
101. F. Pirot, Y. N. Kalia, A. l. Stinchcomb, G. Keating, A. Bunge, and R. H. Guy,“Characterization of the Permeability Barrier of Human Skin in vivo,” Pro-ceedings of the National Academy of Sciences of the United States of America, 94(1997) 1562–1567.
102. H. Tanojo, H. E. Junginger, and H. E. Bodde, “In vivo Human Skin Perme-ability Enhancement by Oleic Acid; Transepidermal Water Loss and Fourier-Transform Infrared Spectroscopy Studies,” Journal of Controlled Release, 47(1997) 31–39.
270
103. M. J. Clancy, J. Corish, and O. I. Corrigan, “A Comparison of the Effects ofElectrical Current and Penetration Enhancers on the Properties of HumanSkin Using Spectroscopic (FTIR) and Calorimetric (DSC) Methods,” Interna-tional Journal of Pharmaceutics, 105 (1994) 47–56.
104. E. Dreassi, G. Ceramelli, L. Fabbri, F. Vocioni, P. Bartalini, and P. Corti, “Ap-plication of Near-infrared Reflectance Spectrometry in the Study of Atopy,”The Analyst, 122 (1997) 767–770.
105. B. W. Barry, “Lipid-Protein-Partitioning Theory of Skin Penetration Enhance-ment,” Journal of Controlled Release,, 15 (1991) 237–248.
106. T. Inoue, K. Tsujii, K. Okamoto, and K. Toda, “Differential Scanning Calori-metric Studies on the Melting Behavior of Water in Stratum Corneum,” Jour-nal of Investigative Dermatology, 86 (1986) 689–693.
107. B. W. Barry, “Mode of Action of Penetration Enhancers In Human Skin,” Jour-nal of Controlled Release, 6 (1987) 85–97.
108. J. A. Bouwstra, G. S. Gooris, J. A. van der Spek, S. Lavrijsen, and W. Bras,“The Lipid and Protein Structure of Mouse Stratum Corneum: A Wide andSmall Angle Diffraction Study,” Biochimica et Biophysica Acta: Lipids and LipidMetabolism, 1212 (1994) 183–192.
109. J. A. Bouwstra, G. S. Gooris, W. Bras, and D. T. Downing, “Lipid Organizationin Pig Stratum Corneum,” Journal of Lipid Research, 36 (1995) 685–695.
110. S. M. Gruner, P. R. Cullis, M. J. Hope, and C. P. S. Tilcock, “Lipid Polymor-phism : The Molecular Basis of Nonbilayer Phases,” Annual Reviews of Bio-physics and Biophysical Chemistry, 14 (1985) 211–238.
111. Y. W. Chien, O. Siddiqui, W. M. Shi, and J. C. Liu, “Transdermal IontophoreticDelivery of Therapeutic Peptides/Proteins 1. Insulin,” Annals of the New YorkAcademy of Sciences, 507 (1987) 32–51.
112. A. K. Banga and Y. W. Chien, “Iontophoretic Delivery of Drugs: Fundamen-tals, Developments and Biomedical Applicatons,” Journal of Controlled Release,7 (1988) 1–24.
113. R. R. Warner, M. C. Myers, and D. A. Taylor, “Electron Probe Analysis ofHuman Skin: Determination of the Water Concentration Profile,” The Journalof Investigative Dermatology, 90 (1988) 78–85.
114. V. Aguilella, M. Belaya, and V. Levadny, “Passive Transport of Small IonsThrough Human Stratum Corneum,” Journal of Controlled Release, 44 (1997)11–18.
115. V. H. W. Mak, R. O. Potts, and R. H. Guy, “Does Hydration Affect Intercell-ular Lipid Organization in the Stratum Comeum?” Pharmaceutical Research,,8 (1991) 1064–1065.
271
116. L. A. R. M. Pechtold, W. Abraham, and R. O. Potts, “The Influence of an Elec-tric Field on Ion and Water Accessibility to Stratum Cornenm Lipid Lamel-lae,” Pharmaceutical Research, 13 (1996) 1168–1173.
117. S. J. Singer and G. L. Nicolson, “The Fluid Mosaic Model of the Structure ofCell Membranes,” Science, 175 (1972) 720–731.
118. J. B. Caban, T. S. Moerland, S. J. Gibbs, L. McFadden, and B. R. Locke, “Trans-dermal Water Mobility in the Presence of Electrical Fields Using MR Mi-croscopy,” Magnetic Resonance Imaging, 17 (1999) 1183–1191.
119. M. E. Johnson, D. Blankschtein, and R. Langer, “Evaluation of Solute Per-meation Through the Stratum Corneum: Lateral Bilayer Diffusion as thePrimary Transport Mechanism,” Journal of Pharmaceutical Sciences, 86 (1997)1162–1172.
120. N. H. Yoshida and M. S. Roberts, “Solute Molecular Size and TransdermalIontophoresis Across Excised Human Skin,” Journal of Controlled Release, 25(1993) 177–195.
121. W. I. Higuchi, S. K. Li, A. H. Ghanem, H. G. Zhu, and Y. Song, “MechanisticAspects of Iontophoresis in Human Epidermal Membrane,” Journal of Con-trolled Release, 62 (1999) 13–23.
122. K. S. Li, A. H. Ghanem, K. D. Peck, and W. I. Higuchi, “Characterization of theTransport Pathways Induced During Low to Moderate Voltage Iontophoresisin Human Epidermal Membrane,” Journal of Pharmaceutical Sciences, 87 (1998)40–48.
123. K. D. Peck, A. H. Ghanem, and W. I. Higuchi, “Hindered Diffusion of PolarMolecules Through and Effective Pore Radii Estimates of Intact and EthanolTreated Human Epidermal Membrane,” Pharmaceutical Research, 11 (1994)1306–1314.
124. M. S. Roberts, P. M. Lai, and Y. G. Anissimov, “Epidermal Iontophoresis: I.Development of the Ionic Mobility-Pore Model,” Pharmaceutical Research, 15(1998) 1569–1578.
125. R. Elderberg, Electrical Properties of the Skin, Chapter 15 of Biophysical Propertiesof the Skin, Edited by Elden, H. R. (New York: Wiley-Interscience, 1971) 513–541.
126. Y. W. Chien, O. Siddiqui, W. Shi, P. Lelawongs, and J. C. Liu, “Direct Currentlontophoretic Transdermal Delivery of Peptide and Protein Drugs,” Journal ofPharmaceutical Sciences, 78 (1989) 376–383.
127. H. M. Sheu, S. C. Chao, T. W. Wong, J. Y. Y. Lee, and J. C. Tsai, “HumanSkin Surface Lipid Film: An Ultrastructural Study and Interaction with Cor-neocytes and Intercellular Lipid Lamellae of the Stratum Corneum,” BritishJournal of Dermatology, 140 (1999) 385–391.
272
128. A. Zlotogorski, “Distribution of Skin Surface pH on the Forehead and Cheekof Adults,” Archives of Dermatological Research, 279 (1987) 398–401.
129. A. Raza, Cutaneous Microbiology: Chapter 4 in Dermatology edited by Orkin, M.and Maibach, H. I. and Dahl, M. V., 1st edition (Norwalk, Connecticut: Apple-ton and Lange, 1991) 22–25.
130. K. Sato, K. H. Kang, and F. Sato, Eccrine Sweat Glands: Chapter 26 of Biochem-istry and Physiology of the Skin, edited by Goldsmith, L. A. (New York: OxfordUniversity Press, 1991) 741–762.
131. R. R. Burnette and B. Ongpipattanakul, “Characterization of the Permselec-tive Properties of Excised Human Skin During Iontophoresis,” Journal of Phar-maceutical Sciences, 76 (1987) 765–773.
132. G. B. Kasting and J. C. Keister, “Application of Electrodiffusion Theory for aHomogeneous Membrane to Iontophoretic Transport Through Skin,” Journalof Controlled Release, 8 (1989) 195–210.
133. J. D. DeNuzzio and B. Berner, “Electrochemical and Iontophoretic Studies ofHuman Skin,” Journal of Controlled Release, 11 (1990) 105–112.
134. Y. W. Chien, P. Lelawongs, O. Siddiqui, Y. Sun, and W. M. Shi, “FacilitatedTransdermal Delivery of Therapeutic Peptides and Proteins by IontophoreticDelivery Devices,” Journal of Controlled Release, 13 (1990) 263–278.
135. J. Hirvonen and R. H. Guy, “Transdermal Iontophoresis: Modulation of Elec-troosmosis by Polypeptides,” Journal of Controlled Release, 50 (1998) 283–289.
136. J. S. Newman, Electrochemical Systems, Second Edition (Inglewood Cliffs, NJ:Prentice Hall, 1991).
137. A. J. Bard and L. R. Faulkner, Electrochemical Methods: Fundamentals and Ap-plications (New York: John Wiley and Sons, 1980).
138. S. Grimnes, “Skin Impedance and Electro-Osmosis in the Human Epider-mis,” Medical and Biological Engineering and Computing, 21 (1983) 739–749.
139. S. Del Terzo, C. R. Behl, and R. A. Nash, “Iontophoretic Transport of a Ho-mologous Series of Ionized and Nonionized Model Compounds: Influenceof Hydrophobicity and Mechanistic Interpretation,” Pharmaceutical Research,6 (1989) 85–90.
140. S. Sims, W. I. Higuchi, and V. Srivasan, “Skin Alteration and Convective Sol-vent Flow Effects During Iontophoresis II. Monovalent Anion and CationTransport Across Human Skin,” Pharmaceutical Research, 9 (1992) 1402–1409.
141. M. B. Delgado-Charro and R. H. Guy, “Characterization of Convective Sol-vent Flow During Iontophoresis,” Pharmaceutical Research, 11 (1994) 929–935.
273
142. R. van der Geest, F. Hueber, F. C. Szoka, and R. H. Guy, “Iontophoresis ofBases, Nucleosides, and Nucleotides,” Pharmaceutical Research, 13 (1996) 553–558.
143. P. M. Lai and M. S. Roberts, “Epidermal Iontophoresis: II. Application of theIonic Mobility-Pore Model to the Transport of Local Anesthetics,” Pharmaceu-tical Research, 15 (1998) 1579–1588.
144. J. Hirvonen, L. Murtomaki, and K. Kontturi, “Effect of Diffusion Potential,Osmosis and Ion-exchange on Transdermal Drug Delivery: Theory and Ex-periments,” Journal of Controlled Release, 56 (1998) 33–39.
145. J. Hirvonen, L. Murtomaki, and K. Kontturi, “Experimental Verification ofthe Mechanistic Model for Transdermal Transport Including Iontophoresis,”Journal of Controlled Release, 56 (1998) 169–174.
146. A. Luzardo-Alvarez, M. Rodriguez-Fernandez, J. Blanco-Mendez, R. H. Guy,and M. B. Delgado-Charro, “Iontophoretic Permselectivity of MammalianSkin: Characterization of Hairless Mouse and Porcine Membrane Models,”Pharmaceutical Research, 15 (1998) 984–987.
147. C. T. Costello and A. H. Jeske, “Iontophoresis: Applications in TransdermalMedication Delivery,” Physical Therapy (Pharmacology Series), 75 (1995) 554–563.
148. J. B. Phipps and J. R. Gyory, “Transdermal Ion Migration,” Advanced DrugDelivery Reviews, 9 (1992) 137–176.
149. T. Yamamoto and Y. Yamamoto, “Dielectric Constant and Resistivity of Epi-dermal Stratum Corneum,” Medical and Biological Engineering, 14 (1976) 494–500.
150. Y. N. Kalia, L. B. Nonato, and R. H. Guy, “The Effect of Iontophoresis on SkinBarrier Integrity: Non-invasive Evaluation by Impedance Spectroscopy andTransepidermal Water Loss,” Pharmaceutical Research, 13 (1996) 957–960.
151. A. D. Woolfson, G. P. Moss, D. F. McCafferty, A. Lackermeier, and E. T.McAdams, “Changes in Skin A.C. Impedance Parameters in vivo During thePercutaneous Absorption of Local Anesthetics,” Pharmaceutical Research, 16(1999) 459–462.
152. Y. N. Kalia and R. H. Guy, “The Electrical Characteristics of Human Skin invivo,” Pharmaceutical Research, 12 (1995) 1605–1613.
153. T. Yamamoto and Y. Yamamoto, “Non-Linear Electrical Properties of Skin inthe Low Frequency Range,” Medical and Biological Engineering and Computing,19 (1981) 302–310.
154. G. B. Kasting, “Theoretical Models for Iontophoretic Delivery,” AdvancedDrug Delivery Reviews, 9 (1992) 177–199.

274
155. S. Y. Oh, L. Lyung, D. Bommannan, R. H. Guy, and R. O. Potts, “Effect ofCurrent, Ionic Strength and Temperature on the Electrical Properties of Skin,”Journal of Controlled Release, 27 (1993) 115–125.
156. M. H. Friedman, Principles and Models of Biological Transport (New York:Springer-Verlag, 1986).
157. A. Y. Kabakov, “The Nature of Pacemaker Activity,” Biophysics, 36 (1991) 628–636.
158. S. Kulkarni, A. K. Banga, and G. Betageri, “Transdermal Iontophoretic Deliv-ery Colchicine Encapsulated in Liposomes,” Drug Delivery, 3 (1996) 245–250.
159. M. Kirjavainen, J. Monkkonen, M. Saukkosaari, R. Valjakka-Koskela, J. Kies-vaara, and A. Urtti, “Phospholipids Affect Stratum Corneum Lipid BilayerFluidity and Drug Partitioning into the Bilayers,” Journal of Controlled Release,58 (1999) 207–214.
160. J. C. Weaver, “Electroporation: A General Phenomenon for ManipulationCells and Tissues,” Journal of Cellular Biochemistry, 51 (1992) 426–435.
161. C. Featherstone, “Electroporation - An Effective Technique for Drug-Deliveryand Gene-Therapy,” American Biotechnology Laboratory, 11 (1993) 16.
162. R. Heller, M. Jaroszeski, A. Atkin, D. Moradpour, R. Gilbert, J. Wands, andC. Nicolau, “In vivo Gene Electroinjection and Expression in Rat Liver,” FEBSLetters, 389 (1996) 225–228.
163. R. R. Burnette and T. M. Bagniefski, “Influence of Constant Current Ionto-phoresis on the Impedance and Passive Na+ Permeability of Excised NudeMouse Skin,” Journal of Pharmaceutical Sciences, 77 (1988) 492–497.
164. S. S. Philbrick, Characterization of Transdermal Delivery in vitro Using Optical andElectrochemical Impedance Spectroscopy, Master’s thesis, University of Florida(1998).
165. N. Monteiro-Riviere, A. Inman, and J. Riviere, “Identification of the Path-way of Iontophoretic Drug Delivery: Light and Ultrastructural Studies UsingMercuric Chloride in Pigs,” Pharmaceutical Research,, 11 (1994) 251–256.
166. R. R. Burnette and B. Ongpipattanakul, “Characterization of the Pore Trans-port Properties and Tissue Alteration of Excised Human Skin During Ionto-phoresis,” Journal of Pharmaceutical Sciences, 77 (1988) 132–137.
167. E. R. Scott, H. S. White, and J. B. Phipps, “Iontophoretic Transport ThroughPorous Membranes Using Scanning Electrochemical Microscopy: Applica-tion to in in vitro Studies of Ion Fluxes through Skin,” Analytical Chemistry,65 (1993) 1537–1545.

275
168. N. G. Turner and R. H. Guy, “Visualization and Quantitation of IontophoreticPathways Using Confocal Microscopy,” Journal of Investigative DermatologySymposium, 3 (1998) 136–142.
169. K. Tojo, C. C. Chiang, and Y. W. Chien, “Drug Permeation Across the Skin: Ef-fect of Penetrant Hydrophilicity,” Journal of Pharmaceutical Sciences, 76 (1987)123–126.
170. P. M. Lai and M. S. Roberts, “An Analysis of Solute Structure-Human Epi-dermal Transport Relationships in Epidermal Iontophoresis Using the IonicMobility-Pore Model,” Journal of Controlled Release, 58 (1999) 323–333.
171. A. K. Banga, M. Katakam, and R. Mitra, “Transdermal Iontophoretic Deliveryand Degradation of Vasopressin Across Human Cadaver Skin,” InternationalJournal of Pharmaceutics, 116 (1995) 211–216.
172. N. H. Bellantone, S. Rim, M. L. Francoeur, and B. Rasadi, “Enhanced Per-cutaneous Absorption Via Iontophoresis I. Evaluation of an in vitro Systemand Transport of Model Compounds,” International Journal of Pharmaceutics,30 (1986) 63.
173. R. M. Brand and R. H. Guy, “Iontophoresis of Nicotine in vitro: PulsatileDrug Delivery Across the Skin?” Journal of Controlled Release, 33 (1995) 285–292.
174. R. Brand, A. Wahl, and P. Iversen, “Effects of Size and Sequence on the Ion-topheretic Delivery of Oligonucleotides,” Journal of Pharmaceutical Science, 87(1998) 49–52.
175. R. R. Burnette and D. Marrero, “Comparison Between the Iontophoretic andPassive Transport of Thyrotropin Releasing Hormone Across Nude MouseSkin,” Journal of Pharmaceutical Science, 75 (1986) 738.
176. L. L. Wearley, J.-C. Liu, and C. Y. W., “Iontophoresis-Facilitated TransdermalDelivery of Verapamil. I. In vitro Evaluation and Mechanistic Studies,” Jour-nal of Controlled Release, 8 (1989) 237–250.
177. E. Varghese and R. K. Khar, “Enhanced Skin Permeation of Diclofenac byIontophoresis: in vitro and in vivo Studies,” Journal of Controlled Release, 38(1996) 21–27.
178. E. Manabe, S. Numajiri, K. Sugibayashi, and Y. Morimoto, “Analysis of SkinPermeation-Enhancing Mechanism of Iontophoresis Using HydrodynamicPore Theory,” Journal of Controlled Release, 66 (2000) 149–158.
179. M. Heit, N. Monteiro-Riviere, F. Jayes, and J. Riviere, “Transdermal Ionto-phoretic Delivery of Luteinizing Hormone Releasing Hormone (LHRH): Ef-fect of Repeated Administration,” Pharmaceutical Research, 11 (1994) 1000–1003.

276
180. D. E. Goldman, “Potential, Impedance, and Rectification in Membranes,”Journal of General Physiology, (1943) 37–60.
181. V. Srinivasan and W. I. Higuchi, “A Model for Iontophoresis Incorporatingthe Effect of Convective Solvent Flow,” International Journal of Pharmaceutics,60 (1990) 133–138.
182. K. Kontturi and L. Murtomaki, “Mechanistic Model for Transdermal Trans-port Including Iontophoresis,” Journal of Controlled Release, 41 (1996) 177–185.
183. J. C. Keister and G. B. Kasting, “Ionic Mass Transport Through a Homoge-neous Membrane in the Presence of a Uniform Electric Field,” Journal of Mem-brane Science, 29 (1986) 155–167.
184. K. Tojo, C. C. Chiang, U. Doshi, and Y. W. Chien, “Stratum Corneum Reser-voir Capacity Affecting Dynamics of Transdermal Drug Delivery,” Drug De-velopment and Industrial Pharmacy, 14 (1998) 561–572.
185. J. L. Anderson and J. A. Quinn, “Restricted Transport in Small Pores: AModel for Steric Exclusion and Hindered Particle Motion,” Biophysical Jour-nal, 14 (1974) 130–150.
186. W. D. Munch, L. P. Zester, and J. A. Anderson, “Rejection of Polyelectrolytesfrom Microporous Membranes,” Journal of Membrane Science, 5 (1979) 77–102.
187. W. M. Deen, “Hindered Transport of Large Molecules in Liquid-Filled Pores,”AIChE Journal, 33 (1987) 1409–1425.
188. M. Davidson and W. M. Deen, “Hydrodynamic Theory for the HinderedTransport of Flexible Macromolecules In Porous Membranes.” Journal ofMembrane Science, 35 (1988) 167–192.
189. B. C. Robertson and A. L. Zydney, “Hindered Protein Diffusion in Asym-metric Ultrafiltration Membranes with Highly Constricted Pores,” Journal ofMembrane Science, 49 (1990) 287–303.
190. G. A. Gerencser and B. R. Stevens, “Thermodynamics of Symport and An-tiport Catalyzed by Cloned or Native Transporters,” Journal of ExperimentalBiology, (1994) 1–17.
191. R. R. Burnette, Iontophoresis. Chapter 11 of Transdermal Drug Delivery: Develop-mental Issues and Research Initiatives edited by J. Hadgraft and R. H. Guy (NewYork: Marcel Dekker, 1989) 247–289.
192. T. Masada, W. I. Higuchi, V. Srinivasan, U. Rohr, J. Fox, C. R. Behl, andS. Pons, “Examination of Iontophoretic Transport of Ionic Drugs Across Skin:Baseline Studies with the Four-Electrode System,” International Journal ofPharmaceutics, 49 (1989) 57–62.
277
193. V. Aguilella, K. Kontturi, L. Murtomaki, and P. Ramırez, “Estimation of thePore Size and Charge Density in Human Cadaver Skin,” Journal of ControlledRelease, 32 (1994) 249–254.
194. O. Kedem and A. Katchalsky, “Thermodynamic Analysis of the Permeabilityof Biological Membranes to Non-Electrolyes,” Biochimica et Biophysica Acta,27 (1958) 229–246.
195. O. Kedem and A. Katchalsky, “Physical Interpretation of Phenomenologi-cal Coefficients of Membrane Permeability,” Journal of General Physiology, 45(1961) 143–179.
196. O. Kedem and A. Katchalsky, “Permeability of Composite Membranes 1.Electric Current, Volume Flow and Flow of Solute Through Membranes,”Transactions of the Faraday Society, 59 (1963) 1918–1930.
197. M. J. Pikal, “Transport Mechanisms in Iontophoresis. I. A Theoretical modelfor the Effect of Electroosmotic Flow on Flux Enhancement in TransdermalIontophoresis,” Pharmaceutical Research, 7 (1990) 118–126.
198. N. A. Peppas and N. Sundaram, “An Analysis of Drug and Solute Trans-port Through Membranes Based on Potential Barriers,” Journal of ControlledRelease, 34 (1995) 37–42.
199. B. Hille, Ionic Channels of Excitable Membranes, 2nd edition (Sunderland, Mas-sachusetts: Sinauer Associates, Inc., 1992).
200. Y. N. Kalia, F. Pirot, and R. H. Guy, “Homogeneous Transport in a Hetero-geneous Membrane: Water Diffusion Across Human Stratum Corneum invivo,” Biophysical Journal, 71 (1996) 2692–2700.
201. R. van der Geest, D. A. R. Elshove, M. Danhof, A. P. M. Lavrijsen, and H. E.Bodde, “Non-Invasive Assessment of Skin Barrier Integrity and Skin Irri-tation Following Iontophoretic Current Application In Humans,” Journal ofControlled Release, 41 (1996) 205–213.
202. R. Brand, P. Singh, E. Aspe-Carranza, H. I. Maibach, and R. H. Guy, “AcuteEffects of Iontophoresis on Human Skin in vivo: Cutaneous Blood,” EuropeanJournal of Pharmaceutics and Biopharmaceutics, 43 (1997) 133–138.
203. Y. N. Kalia and R. H. Guy, “Interaction Between Penetration Enhancers andIontophoresis: Effect on Human Skin Impedance in vivo,” Journal of Con-trolled Release, 44 (1997) 33–42.
204. D. Foley, J. Corish, and O. I. Corrigan, “Iontophoretic Delivery of DrugsThrough Membranes Including Human Stratum-Corneum,” Solid State Ion-ics, 55-6 (1992) 184–196.
205. S. M. Dinh, L. Luo, Ching-Wang, and B. Berner, “Upper and Lower Limits onHuman Skin Electrical Resistance in Ionophoresis,” AIChE Journal, 39 (1993)2011–2018.

278
206. S. Y. Oh and R. H. Guy, “Effects of Iontophoresis on the Electrical Propertiesof Human Skin in vivo,” International Journal of Pharmaceutics, 124 (1995) 137–142.
207. C. Curdy, Y. N. Kalia, F. Falson-Rieg, and R. H. Guy, “Recovery of HumanSkin Impedance in vivo After Iontophoresis: Effect of Metal Ions,” AAPSPharmsci 2000, 2 (2000) 1–7.
208. T. Yamamoto and Y. Yamamoto, “Analysis for the Change of Skin Imped-ance,” Medical and Biological Engineering and Computing, 15 (1977) 219–227.
209. Y. Yamamoto, T. Yamamoto, S. Ohta, T. Uehara, S. Tahara, and Y. Ishizuka,“The Measurement Principle for Evaluating the Performance of Drugs andCosmetics by Skin Impedance,” Medical and Biological Engineering and Com-puting, 16 (1978) 623–632.
210. A. V. Rawlings, A. Davies, M. Carlomusto, S. Pillai, K. Zhang, R. Kosturko,P. Verdejo, and C. Feinberg, “Effect of Lactic Acid Isomers on KeratinocyteCeramide Synthesis, Stratum Corneum Lipid Levels and Stratum CorneumBarrier Function,” Archives for Dermatological research, 288 (1996) 383–390.
211. K. Kontturi, L. Murtomaki, J. Hirvonen, P. Paronen, and A. Urtti, “Electro-chemical Characterization of Human Skin by Impedance Spectroscopy: TheEffect of Penetration Enhancers,” Pharmaceutical Research, 10 (1993) 381–385.
212. K. Kontturi and L. Murtomaki, “Impedance Spectroscopy in Human Skin. ARefined Model,” Pharmaceutical Research, 11 (1994) 1355–1357.
213. D. Foley, J. Corish, and O. I. Corrigan, “The Use of Complex Impedance toExamine the Effect of Passive and Iontophoretic Transdermal Drug TransportThrough Excised Human Epidermal Tissue,” in Proceedings of the InternationalSymposium for the Controlled Release of Bioactive Materials, volume 17 (1990)427–428.
214. Z. Lukacs, “The Numerical Evaluation of the Distortion of EIS Data due to theDistribution of Parameters,” Journal of Electroanalytical Chemistry, 432 (1997)79–83.
215. P. Z. Peebles, Jr. and T. A. Giuma, Principles of Electrical Engineering (McGraw-Hill, 1994).
216. G. R. T. Schueller and S. R. Taylor, “The Nondestructive Evaluation of Adhe-sively Bonded Aluminum Using Electrochemical Impedance Spectroscopy,”Journal of the Electrochemical Society, 139 (1992) 3120–3129.
217. R. P. Buck and M. C., “Origins of Finite Transmission Lines for Exact Rep-resentations of Transport By The Nernst-Planck Equations for Each ChargeCarrier,” Electrochimica Acta, 44 (1999) 1999–2018.
218. D. E. Johnson, J. R. Johnson, and J. L. Hilburn, Electric Circuit Analysis, 2ndedition (Prentice Hall, 1992).
279
219. J. R. Macdonald, editor, Impedance Spectroscopy : Emphasizing Solid Materialsand Analysis (New York: John Wiley and Sons, 1987).
220. C. Gabrielli, Identification of Electrochemical Processes by Frequency ResponseAnalysis, Solartron Instrumentation Group Monograph 004-83, The SolartronElectronic group Ltd., Farnborough, England (1984).
221. A Tutorial on Impedance Spectroscopy, volume 98-302 (Houston, TX: NationalAssociation of Corrosion Engineers, 1998).
222. C. Deslouis, M. M. Musiani, B. Tribollet, and M. A. Vorotyntsev, “Compari-son of the AC Impedance of Conducting Polymer Films Studied as Electrode-Supported and Freestanding Membranes,” Journal of the Electrochemical Soci-ety, 142 (1995) 1902–1908.
223. A. Lasia, “Porous Eelectrodes in the Presence of a Concentration Gradient,”Journal of Electroanalytical Chemistry, 428 (1997) 155–164.
224. T. Ichino, Y. Takeshita, S. Nishi, M. Matsumoto, and K. Naoi, “AC Imped-ance Analysis on Dual-Phase Polymer Electrolytes Prepared from SBR/NBRMixed Latices,” Solid State Ionics, 80 (1995) 119–127.
225. U. Balachandran, B. Ma, P. S. Maiya, R. L. Mieville, J. T. Dusek, J. J. Picciolo,J. Guan, S. E. Dorris, and M. Liu, “Development of Mixed-Conducting Oxidesfor Gas Separation,” Solid State Ionics, 108 (1998) 363–370.
226. K. D. Schulze and H. Herrnberger, “Kinetic Analysis of the Transfer ofTetraphenylborate Ions Across Artificial Lipid Membranes,” Zeitschrift furPhysikalische Chemie, 192 (1995) 33–46.
227. K. D. Schulze and H. Herrnberger, “Impedance Spectroscopic Investigationof Ion Channel Formation in Lipid Membranes,” Zeitschrift fur PhysikalischeChemie, 194 (1996) 243–254.
228. M. I. N. Zhang and J. H. M. Willison, “Electrical Impedance Analysis inPlant Tissues: The Effect of Freeze-Thaw Injury on the Electrical Propertiesof Potato Tuber and Carrot Root Tissues,” Canadian Journal of Plant Science, 72(1992) 545–553.
229. T. J. Vander Noot and M. Levinkind, “AC Impedance Characteristics of Hu-man Dental Enamel and Dentine,” Journal of Electroanalytical Chemistry, 300(1991) 191–198.
230. F. X. Hart and W. H. Cole, “Dielectric Properties of Apples in the Range 0.1-100 kHz,” Journal of Materials Science, 28 (1993) 621–631.
231. T. Repo and M. I. N. Zhang, “Modeling Woody Plant Tissues Using a Dis-tributed Electrical Circuit,” Journal of Experimental Botany, 44 (1993) 977–982.
280
232. J. J. Ackmann and M. A. Seitz, “Methods of Complex Impedance Measure-ments in Biologic Tissue,” Critical Reviews in Biomedical Engineering, 11 (1984)281–311.
233. W. Archer, R. Kohli, J. M. C. Roberts, and T. S. Spencer, Skin Impedance Mea-surement. Chapter 7 of Methods for Cutaneous Investigation edited by Robert L.Rietschel and Thomas S. Spencer (New York: Marcel-Dekker, 1990) 121–142.
234. M. E. Orazem, P. Agarwal, and L. H. Garcıa-Rubio, “Critical Issues Asso-ciated with Interpretation of Impedance Spectra,” Journal of ElectroanalyticalChemistry, 378 (1994) 51–62.
235. P. T. Wojcik, P. Agarwal, and M. E. Orazem, “A Method for Maintaininga Constant Potential Variation During Galvanostatic Regulation of Electro-chemical Impedance Measurements,” Electrochimica Acta, 41 (1996) 977–983.
236. K. I. Reid, R. A. Dionne, L. Sicard-Rosenbaum, D. Lord, and R. A. Dubner,“Evaluation of Iontophoretically Applied Dexamethasone for Painful Patho-logic Temporomandibular Joints,” Oral Surgery Oral Medicine Oral Pathology,77 (1994) 605–609.
237. P. Agarwal, M. E. Orazem, and L. H. Garcıa-Rubio, “Measurement Models forElectrochemical Impedance Spectroscopy I. Demonstration of Applicability,”Journal of the Electrochemical Society, 139 (1992) 1917–1927.
238. P. Agarwal, O. D. Crisalle, M. E. Orazem, and L. H. Garcıa-Rubio, “Applica-tion Measurement Models to Impedance Spectroscopy. II. Determination ofthe Stochastic Contribution to the Error Structure,” Journal of the Electrochem-ical Society, 139 (1995) 4149–4158.
239. P. Agarwal, M. E. Orazem, and L. H. Garcıa-Rubio, “Measurement Modelsfor Electrochemical Impedance Spectroscopy. III. Evaluation of Consistencywith the Kramers-Kronig Relations,” Journal of the Electrochemical Society, 142(1995) 4159–4168.
240. M. E. Orazem, User Manual for the Measurement Model Toolbox for ImpedanceSpectroscopy, University of Florida, Gainesville, Florida (2001).
241. M. Durbha, M. E. Orazem, and L. H. Garcıa-Rubio, “Spectroscopy Applica-tions of the Kramers-Kronig Transforms: Implications for the Error StructureIdentification,” Journal of the Electrochemical Society, 144 (1997) 48–55.
242. M. Kendig, “Protocol for Removal of Epidermis from Cadavers,” (1999). Per-sonal Communication.
243. D. A. Skoog, F. J. Holler, and T. A. Nieman, Principles of Instrumental Analysis,5th edition, Saunders Golden Sunburst Series (Philadelphia, PA: HarcourtBrace College Publishers, 1998).
244. D. A. Skoog and D. M. West, Analytical Chemistry: an Introduction, 4th edition(Philadelpia, PA: Saunders College Publishing, 1986).
281
245. L. E. Schoeff and R. H. Williams, Principles of Laboratory Instruments (St. Louis,MO: Mosby Publishers, 1993) 92–123.
246. L. L. Langley, I. R. Telford, and J. B. Christensen, Dynamic Anatomy and Phys-iology, 4th edition (New York: McGraw-Hill Book Company, 1974).
247. J. B. Phipps, R. V. Padmanabhan, and G. A. Lattin, “Iontophoretic Delivery ofModel Inorganic and Drug Ions,” Journal of Pharmaceutical Sciences, 78 (1989)365–369.
248. H. Inada, A. Ghanem, and W. I. Higuchi, “Studies on the Effects of AppliedVoltage and Duration on Human Epidermal Membrane Alteration/Recoveryand the Resultant Effects upon Iontophresis,” Pharmaceutical Research, 11(1994) 687–697.
249. D. C. Montgomery, Design and Analysis of Experiments, 3rd edition (New York:John Wiley and Sons, Inc., 1991).
250. G. A. Milliken and D. E. Johnson, Analysis of Messy Data. Volume 1 : DesignedExperiments, 1st edition (Chapman and Hall, 1992).
251. R. G. J. Miller, Beyond ANOVA, Basics of Applied Statistics (New York: JohnWiley and Sons, 1986).
252. R. L. Ott, An Introduction to Statistical Methods and Data Analysis (Belmont,California: Wadsworth Publishing Company, 1993) 769–798.
253. P. M. Elias, E. R. Cooper, A. Korc, and B. E. Brown, “Percutaneous Trans-port in Relation to the Stratum Corneum Structure and Lipid composition,”Journal of Investigative Dermatology, 76 (1981) 297–301.
254. M. Cormier and B. Johnson, “Skin Reactions Associated with Electrotrans-port,” in Transdermal Administration, a Case Study, Iontophoresis, P. Couvreur,D. Duchene, P. Green, and H. E. Junginger, editors, European Symposium,Controlled Release Society (Paris, France: Editions de Sante, 1997) 50–57.
255. R. H. Guy, “Current Status and Future Prospects of Transdermal Drug Deliv-ery,” Pharmaceutical Research, 13 (1996) 1765–1769.
256. A. L. Bunge, R. H. Guy, and J. Hadgraft, “The Determination of a DiffusionalPathlength Through the Stratum Corneum,” International Journal of Pharma-ceutics, 188 (1999) 121–124.
257. Y. N. Kalia and R. H. Guy, “Modeling Transdermal Drug Release,” AdvancedDrug Delivery Reviews, 48 (2001) 159–172.
258. E. L. Cussler, Diffusion: Mass Transfer In Fluid Systems (Cambridge UniversityPress, 1984).
259. R. O. Potts and R. H. Guy, “Predicting Skin Permeability,” Pharmaceutical Re-search, 9 (1992) 663–669.

282
260. R. Reid, J. Prausnitz, and T. Sherwood, The Properties of Gases and Liquids(McGraw-Hill Book Company, 1977).
261. J. S. Newman, “Numerical Solution of Coupled, Ordinary Differential Equa-tions,” Industrial and Engineering Chemistry Fundamentals, 7 (1968) 517–517.
262. R. L. Bronaugh, Skin permeation: In vitro techniques, Methods for CutaneousInvestigation. Edited by Robert L. Rietschel and Thomas S. Spencer (New York:Marcel-Dekker, 1990) 171–183.
263. P. T. Wojcik, The Electrochemical Behavior of Copper and Copper Nickel Alloys inSynthetic Sea Water, Ph.D. thesis, University of Florida (1997).
264. K. E. Jeffers, Electrochemical Impedance Spectroscopy for the Characterization ofCorrosion and Cathodic Protection of Buried Pipelines, Master’s thesis, Universityof Florida (1999).
BIOGRAPHICAL SKETCH
Michael A. Membrino received a bachelor of science degree in chemical en-
gineering from Worcester Polytechnic Institute in May 1992. He then accepted a
National Science Foundation MEDI fellowship and began his graduate studies at
the University of Florida in January 1993. After his arrival in Florida he joined
Professor Mark Orazem’s electrochemical engineering research group to pursue
a doctorate of philosophy degree. Upon completion of degree requirements in
May 2002, Mike plans to secure a position for the application of electrochemical
engineering principles to industrial research and development.
283
Related Documents