ORIGINAL PAPER Transcriptome analysis of resistant and susceptible genotypes of Glycine tomentella during Phakopsora pachyrhizi infection reveals novel rust resistance genes Ruth Elena Soria-Guerra • Sergio Rosales-Mendoza • Sungyul Chang • James S. Haudenshield • Annamalai Padmanaban • Sandra Rodriguez-Zas • Glen L. Hartman • Said A. Ghabrial • Schuyler S. Korban Received: 6 July 2009 / Accepted: 22 December 2009 / Published online: 8 January 2010 Ó Springer-Verlag 2010 Abstract Soybean rust, caused by Phakopsora pachyrhizi, is a destructive foliar disease in nearly all soybean-producing countries. To identify genes controlling resistance to soy- bean rust, transcriptome profiling was conducted in resistant and susceptible Glycine tomentella genotypes triggered by P. pachyrhizi infection. Among 38,400 genes monitored using a soybean microarray, at 5% false discovery rate, 1,342 genes were identified exhibiting significant differential expression between uninfected and P. pachyrhizi-infected leaves at 12, 24, 48, and 72 h post-inoculation (hpi) in both rust-susceptible and rust-resistant genotypes. Differentially expressed genes were grouped into 12 functional categories, and among those, large numbers relate to basic plant metabolism. Transcripts for genes involved in the phenyl- propanoid pathway were up-regulated early during rust infection. Similarly, genes coding for proteins related to stress and defense responses such as glutathione-S-trans- ferases, peroxidases, heat shock proteins, and lipoxygenases were consistently up-regulated following infection at all four time points. Whereas, subsets of genes involved in cellular transport, cellular communication, cell cycle, and DNA processing were down-regulated. Quantitative real-time reverse-transcription polymerase chain reaction (qRT-PCR) on randomly selected genes from the different categories confirmed these findings. Of differentially expressed genes, those associated with the flavonoid biosynthesis pathway as well as those coding for peroxidases and lipoxygenases were likely to be involved in rust resistance in soybean, and would serve as good candidates for functional studies. These findings provided insights into mechanisms underlying resistance and general activation of plant defense pathways in response to rust infection. Communicated by D. Lightfoot. R. E. Soria-Guerra and S. Rosales-Mendoza contributed equally to this work. Electronic supplementary material The online version of this article (doi:10.1007/s00122-009-1258-0) contains supplementary material, which is available to authorized users. R. E. Soria-Guerra S. Rosales-Mendoza S. Chang G. L. Hartman S. S. Korban Department of Natural Resources and Environmental Sciences, University of Illinois, Urbana, IL 61821, USA Present Address: S. Rosales-Mendoza Facultad de Ciencias Quı ´micas, Universidad Auto ´noma de San Luis Potosı ´, Av. Dr. Manuel Nava 6, SLP 78210, Me ´xico J. S. Haudenshield Department of Crop Sciences, University of Illinois, Urbana, IL 61801, USA A. Padmanaban S. A. Ghabrial Department of Plant Pathology, University of Kentucky, Lexington, KY 40546-0312, USA S. Rodriguez-Zas Department of Animal Sciences, University of Illinois, Urbana, IL 61801, USA G. L. Hartman USDA Agricultural Research Service, Urbana, IL 61821, USA S. S. Korban (&) University of Illinois at Urbana-Champaign, Urbana, IL 61801, USA e-mail: [email protected] 123 Theor Appl Genet (2010) 120:1315–1333 DOI 10.1007/s00122-009-1258-0

Welcome message from author
This document is posted to help you gain knowledge. Please leave a comment to let me know what you think about it! Share it to your friends and learn new things together.
Transcript
ORIGINAL PAPER
Transcriptome analysis of resistant and susceptible genotypesof Glycine tomentella during Phakopsora pachyrhizi infectionreveals novel rust resistance genes
Ruth Elena Soria-Guerra • Sergio Rosales-Mendoza • Sungyul Chang •
James S. Haudenshield • Annamalai Padmanaban • Sandra Rodriguez-Zas •
Glen L. Hartman • Said A. Ghabrial • Schuyler S. Korban
Received: 6 July 2009 / Accepted: 22 December 2009 / Published online: 8 January 2010
� Springer-Verlag 2010
Abstract Soybean rust, caused by Phakopsora pachyrhizi,
is a destructive foliar disease in nearly all soybean-producing
countries. To identify genes controlling resistance to soy-
bean rust, transcriptome profiling was conducted in resistant
and susceptible Glycine tomentella genotypes triggered by
P. pachyrhizi infection. Among 38,400 genes monitored
using a soybean microarray, at 5% false discovery rate, 1,342
genes were identified exhibiting significant differential
expression between uninfected and P. pachyrhizi-infected
leaves at 12, 24, 48, and 72 h post-inoculation (hpi) in both
rust-susceptible and rust-resistant genotypes. Differentially
expressed genes were grouped into 12 functional categories,
and among those, large numbers relate to basic plant
metabolism. Transcripts for genes involved in the phenyl-
propanoid pathway were up-regulated early during rust
infection. Similarly, genes coding for proteins related to
stress and defense responses such as glutathione-S-trans-
ferases, peroxidases, heat shock proteins, and lipoxygenases
were consistently up-regulated following infection at all four
time points. Whereas, subsets of genes involved in cellular
transport, cellular communication, cell cycle, and DNA
processing were down-regulated. Quantitative real-time
reverse-transcription polymerase chain reaction (qRT-PCR)
on randomly selected genes from the different categories
confirmed these findings. Of differentially expressed genes,
those associated with the flavonoid biosynthesis pathway as
well as those coding for peroxidases and lipoxygenases
were likely to be involved in rust resistance in soybean, and
would serve as good candidates for functional studies. These
findings provided insights into mechanisms underlying
resistance and general activation of plant defense pathways
in response to rust infection.
Communicated by D. Lightfoot.
R. E. Soria-Guerra and S. Rosales-Mendoza contributed equally to
this work.
Electronic supplementary material The online version of thisarticle (doi:10.1007/s00122-009-1258-0) contains supplementarymaterial, which is available to authorized users.
R. E. Soria-Guerra � S. Rosales-Mendoza � S. Chang �G. L. Hartman � S. S. Korban
Department of Natural Resources and Environmental Sciences,
University of Illinois, Urbana, IL 61821, USA
Present Address:S. Rosales-Mendoza
Facultad de Ciencias Quımicas, Universidad Autonoma de San
Luis Potosı, Av. Dr. Manuel Nava 6, SLP 78210, Mexico
J. S. Haudenshield
Department of Crop Sciences, University of Illinois,
Urbana, IL 61801, USA
A. Padmanaban � S. A. Ghabrial
Department of Plant Pathology, University of Kentucky,
Lexington, KY 40546-0312, USA
S. Rodriguez-Zas
Department of Animal Sciences, University of Illinois,
Urbana, IL 61801, USA
G. L. Hartman
USDA Agricultural Research Service, Urbana, IL 61821, USA
S. S. Korban (&)
University of Illinois at Urbana-Champaign,
Urbana, IL 61801, USA
e-mail: [email protected]
123
Theor Appl Genet (2010) 120:1315–1333
DOI 10.1007/s00122-009-1258-0
Introduction
Soybean (Glycine max L.) is a major economic crop that is
a valuable source of protein, oil, and various nutrients,
including antioxidants and isoflavones. Moreover, soybean
is an excellent source of nutrients in the animal feed
market. The United States is the world’s leading soybean
producer and exporter.
Soybean rust (SBR), a serious foliar disease incited by
the fungal pathogen Phakopsora pachyrhizi, has the
potential of causing significant yield loss (over 50%) in
soybean (Hartman et al. 2004; Hartman et al. 2005).
Although SBR has been identified on soybean plants in
Hawaii in 1994 (Killgore and Heu 1994), the disease has
not been reported in the continental United States until
2004 (Schneider et al. 2005) when it was first reported in
Louisiana, and the occurrence of the disease has now
been racked throughout the year (USDA 2009). Presence
of SBR in the continental US has become a major focus
of soybean growers and the soybean industry, as it can
have a major impact on both total soybean production
and production costs. Conservative predictions have
indicated potential yield losses of over 10% in nearly all
US soybean growing areas with potential losses of up to
50% in the Mississippi delta and southeastern coastal
states (Yang 1995). In 2008, SBR has been detected in
392 counties representing 16 states in the United States
(USDA 2009).
Host plant resistance to P. pachyrhizi has been first
reported in the 1960s based on field evaluations in
Taiwan. Since then, resistance to P. pachyrhizi has been
investigated in controlled genetic studies, and five single
dominant genes conditioning resistance to a limited
number of rust isolates, Rpp 1, Rpp 2, Rpp 3, Rpp 4, and
Rpp5, have been identified (Hartwig 1995; Garcia et al.
2008). It has become apparent that none of the five rust
resistance genes nor any of the soybean cultivars grown
today provide strong and durable resistance to SBR
(Bonde et al. 2006; Patzoldt et al. 2007). Recently, Meyer
et al. (2009) have reported that Rpp4-C4 is a single
candidate gene for resistance to SBR. Nevertheless, it is
clear that other sources of durable genetic resistance,
particularly those found in Glycine germplasm accessions,
must be identified and exploited. Several wild perennial
soybean species, including Glycine tomentella, G. taba-
cina, and G. argyrea, have been reported as resistant to
SBR (Hartman et al. 1992). Single resistance genes of at
least four distinct loci have been detected in lines of
G. canescen (Burdon 1988), and a single major gene
for resistance to P. pachyrhizi has been identified in
G. argyrea (Jarosz and Burdon 1990). Therefore, elucidating
the mechanism of active defense response against SBR in
these species may identify novel genes for rust resistance
that can be transferred to G. max using the tools of genetic
engineering.
Many plants, including soybean, accumulate isoflavo-
noid phytoalexins as part of their defense response to
pathogen attack (Dixon 1986, 1999; Lozovaya et al. 2004;
Liu et al. 2006). Some plant defense-response genes are
activated either as a result of plant–pathogen interaction or
upon treatment of plant tissues with either pathogen- or
plant-derived elicitors (Dixon 1986; Ebel and Grisebach
1988; Baldridge et al. 1998).
Previous reports have noted an increase in phenylalanine
ammonia-lyase (PAL), a key enzyme of general phenyl-
propanoid metabolism, upon fungal infection in plants,
such as wheat, barley, potato, and parsley (Fritzemeier
et al. 1987; Jahnen and Hahlbrock 1988; Zierold et al.
2005; Bhuiyan et al. 2009). Concomitant with PAL,
4-coumarate-CoA ligase is quickly induced and accumulates
in small confined areas around fungal penetration sites in
infected parsley and potato leaves (Fritzemeier et al. 1987;
Schmelzer et al. 1989). In sorghum and in legumes, chal-
cone synthase gene transcripts/proteins are localized within
areas of inoculation along with accumulation of defense-
related phytoalexins (Dixon et al. 1983; Hahlbrock and
Scheel 1989; Lo et al. 1999).
The overall goal of this study was to identify key rust
resistance genes in G. tomentella by investigating global
gene expression profiles of P. pachyrhizi-infected leaves of
susceptible (PI441101) and resistant (PI509501) genotypes
at different time points, including 12, 24, 48, and 72 h post-
inoculation (hpi). Selected groups of genes were then
subjected to quantitative real-time reverse-transcription
polymerase chain reaction (qRT-PCR).
Materials and methods
Plant material
An SBR-resistant Glycine tomentella genotype (PI509501)
(R) and an SBR-susceptible G. tomentella genotype
(PI441101) (S) were selected based on previous green-
house inoculation studies and detached leaf assays (G. L.
Hartman, unpublished). Seeds of these two genotypes (gift
from T. Hymowitz, University of Illinois) were scarified,
and germinated on moist filter paper. After 3 days, 21
seedlings of each genotype were transplanted to plastic
pots (2–3 seedlings per 15 cm diameter pot) containing
LC-1 potting mix (Sungro Horticulture, Bellevue, WA),
and fertilized with N–P–K Osmocote (Scott Miracle
Company, Marysville, OH). All seedlings were maintained
in a growth chamber (Controlled Environments, Winnipeg,
Canada) under a 14 h photoperiod (100 lmol m-2 s-1)
and 26�C day/22�C night temperature regime.
1316 Theor Appl Genet (2010) 120:1315–1333
123
Inoculum preparation
Soybean rust spores, originally collected from a soybean
field in 2007 at Quincy, FL (designated FL07-1), were
purified, and proliferated on detached leaves of soybean
cv. Williams 82 in water agar supplemented with 2 mg/L
6-benzyladenine (BA) (Sigma, St. Louis, MO) in 100 mm
diameter Petri plates.
Spores were collected from infected detached leaves
using a custom-made mini-cyclone vacuum spore collector
(Barnant Company, Barrington, IL). Dry spores were sus-
pended in 0.01% Tween-20 (Sigma), vortexed for 30 s, and
the spore concentration was estimated by microscopic
observation using a hemacytometer (Hausser Scientific,
Horsham, PA). The spore suspension was diluted to 35
spores per microliter prior to inoculation, and 10 lL
droplets of the suspension were spotted on water agar to
assess spore germination.
Inoculation of leaf tissues, sampling, and RNA isolation
When young immature plants were 5 weeks old, 240 single
leaflets from randomly selected trifoliates of each genotype
were excised using a razor blade. Ten leaflets per genotype
were placed in 90 mm Petri dishes containing 20 mL of
1.5% water-agar medium supplemented with 2 mg/L BA.
For each genotype, 120 leaflets (12 Petri dishes) were
either mock-inoculated or inoculated with P. pachyrhizi.
Leaflets were individually sprayed with a urediniospore
suspension amended with a 0.01% (v/v) Tween-20 solution
using an air paint-brush (Paashe Airbrush Co, Lindenhurst,
IL) driven by a small compressor (Badger Co., Franklin
Park, IL) at 20 psi, at a rate of *1 mL per three leaflets.
For mock inoculations, sterile water with a 0.01% (v/v)
Tween-20 solution was sprayed. Following inoculation,
leaflets were incubated in a controlled environment
chamber (Percival Scientific, Perry, IA) at 14/10 h of day/
night photoperiod (36 lmol m-2 s-1) at 22�C. After 12,
24, 48, and 72 hpi, 10 randomly selected leaflets per
genotype were collected from inoculated and mock-inoc-
ulated treatments within each genotype, and immediately
frozen in liquid nitrogen. Total RNA was extracted as
previously described (Gasic et al. 2004). All remaining
leaflets that were not sampled were incubated as previously
described and scored for rust symptoms at 12 days post-
inoculation (dpi).
Microarray hybridization
Isolated total RNA (15 lg) from R and S genotypes at
each time point was reverse-transcribed, and then labeled
with Cy3/Cy5 dyes using the Alexa Fluor Reactive Dye
Decapacks for Microarrays Applications, as previously
described (Soria-Guerra et al. unpublished). cDNA from
mock-inoculated S or R genotypes was used as a refer-
ence in the assay. Each of the microarray experiments
was performed in duplicate (with different RNA samples)
using a 70-mer long-oligo soybean microarray represent-
ing *38,400 genes covering wide developmental stages
and physiological conditions (Gonzalez and Vodkin
2007), along with a dye-swap. Two biological replicates
along with three technical replicates at each time point
were used.
Slides were prehybridized in a solution containing 20%
formamide, 69 SSC, 0.1% SDS, and 59 Denhardt’s
solution, with 25 lg mL-1 tRNA (Sigma, St. Louis, MO)
for 45 min at 42�C. These were then washed five times in
sterilized distilled water and once in isopropanol, and
dried by centrifugation at 400g for 3 min. cDNA probes
were dissolved in 42 lL of 19 hybridization solution
(Ambion, Austin, TX), denatured for 1 min in boiling
water, and cooled to 42�C. Hybridizations were done at
42�C for 16 h using the Maui chamber system (BioMicro
Systems, Salt Lake City, UT). Post-hybridization washes
were done by placing slides into Coplin jars with gentle
agitation. Washes were done once in 19 SSC and 0.2%
SDS at 42�C for 5 min, 0.19 SSC, 0.2% SDS at 25�C for
5 min, and twice in 0.19 SSC for 5 min. Finally, slides
were dipped in 0.019 SSC, and dried by centrifugation at
400g for 3 min.
Slides were scanned using a Genepix 4000 B fluores-
cence reader (Axon Instruments, Concord, ON) using
Genepix 3.0 image acquisition software adjusted for Cy3
and for Cy5.
Data analysis
Data processing included removal of spots flagged by the
scanning software GeneSpring and log2 transformation of
intensities after subtracting the background. Log-trans-
formed values were normalized using a global LOWESS
transformation (Cui et al. 2003; Smith et al. 2007) to
remove dye bias within the microarray. A two-stage
approach was used to adjust for technical sources of vari-
ation (Wolfinger et al. 2001; Smith et al. 2007). At first,
global dye and microarray effects were removed across all
microarray elements or transcripts. Then, each transcript
within each microarray was described using a model
including fixed effects of dye, genotype, infection status,
time point, along with two- and three-way interactions
among genotypes, infection status, and time point. The
microarray slide was a random effect assumed to be iden-
tical and independently distributed (iid) having a normal
distribution with a mean of zero and variance of a2. Genes
were regarded as significantly differentially expressed if
P B 0.05.
Theor Appl Genet (2010) 120:1315–1333 1317
123
Functional categories of identified genes were assigned
based on the database of the Munich Information Center
from Protein Sequence (MIPS) (http://mips.gsf.de/proj/
plant/jsf/athal/index.jsp).
Verification of changes in gene expression
using qRT-PCR
To validate microarray results, 21 genes that were either
up- or down-regulated were verified by qRT-PCR. Gene-
specific oligonucleotide primers were designed against
genes that were selected from the microarray analysis
based on their functional identities and expression profiles
using a Fast PCR program (http://www.biocenter.helsinki.
fi/bi/Programs/download.htm).
RNA samples from susceptible and resistant geno-
types, initially isolated for microarray analysis, were
used. Prior to synthesis of cDNA, any residual genomic
DNA was removed by treating samples with DNase I
(Invitrogen, Carlsbad, CA) according to the manufac-
turer’s instructions. First-strand cDNA was synthesized
with Oligo (dT) primer using SuperScript III RT
(Invitrogen).
Polymerase chain reactions were carried out in 96-well
in a 7300 Real Time PCR System (Applied Biosystems,
Foster City, CA) using SYBR Green PCR Master Mix
(Applied Biosystems). Each 25 lL real time PCR reaction
mixture contained 10.5 lL dd2 water, 0.5 lL 200 nM each
of forward and reverse primers, 12.5 lL of 2 9 SYBR
Green I Master, and 100 ng of cDNA. PCR reaction con-
ditions were as follows: 95�C for 10 min, and followed by
40 cycles of 95�C for 15 s and 60�C for 1 min. Following
amplification, a melting curve analysis was run using the
program for one cycle at 95�C for 5 s, 65�C for 1 min, and
95�C with 0 s hold in the step acquisition mode, and fol-
lowed by cooling at 40�C for 10 s.
A negative control without a cDNA template was run
with each analysis to evaluate the overall specificity. For
each gene, three technical replicates and two biological
replicates were used at each sampling time point. A total of
21 primers were designed for amplicons between 150 and
220 bp for each gene. A list of primers used for real-time
RT-PCR is listed in Supplemental Table 1. A soybean
tubulin gene (Shen et al. 2006) was used as an internal
control to normalize the total amount of cDNA in each
reaction. The quantification of gene expression was per-
formed using the relative quantification (DDCT) method
and comparing data with internal controls.
Each sample was replicated three times, and the resul-
tant data were analyzed, using the mock inoculation con-
ditions at each time point as calibrators, with the aid of
SDS software from 7300 Real Time PCR System (Applied
Biosystems).
Results
Symptoms of infection assays
Leaflets of G. tomentella genotype PI441101 (S) exhibited
typical rust lesion development with sporulating uredinia;
while, G. tomentella genotype PI509501 (R) had no lesions
or uredinia and produced no spores.
Differentially expressed genes
To identify genes associated with resistance response to
SBR, the differential gene expression between uninfected
and P. pachyrhizi-infected leaves during the course
of infection in susceptible and resistant genotypes of
G. tomentella were compared using a soybean microarray.
Data from infected leaflets from each genotype were
compared to their corresponding mock-inoculated leaflets
over four time points (12, 24, 48, and 72 hpi), and repre-
senting different stages of infection in G. tomentella. A
total of 1,342 genes were found to be differentially
expressed over the four time points in R and S genotypes at
P B 0.05 (Supplemental Table 2). Of these, *70% were
up-regulated and *30% were down-regulated at all time
points (Supplemental Table 2). Most of the up-regulated
genes belonged to those with metabolic and defense-related
functions.
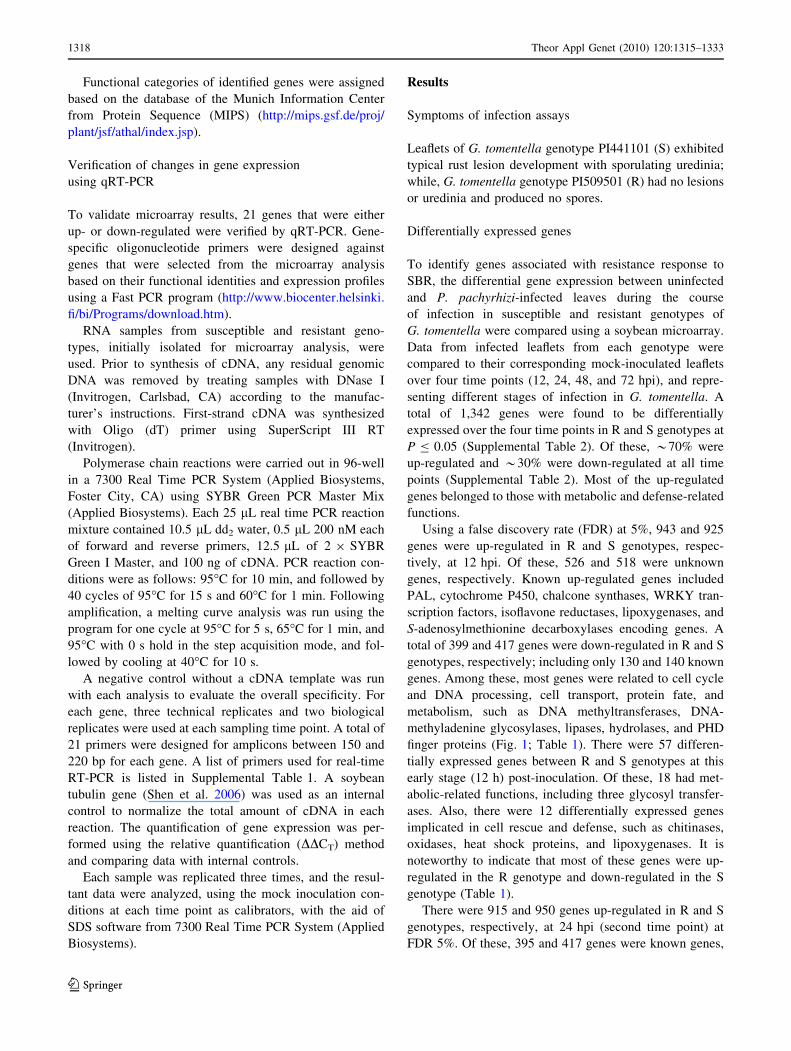
Using a false discovery rate (FDR) at 5%, 943 and 925
genes were up-regulated in R and S genotypes, respec-
tively, at 12 hpi. Of these, 526 and 518 were unknown
genes, respectively. Known up-regulated genes included
PAL, cytochrome P450, chalcone synthases, WRKY tran-
scription factors, isoflavone reductases, lipoxygenases, and
S-adenosylmethionine decarboxylases encoding genes. A
total of 399 and 417 genes were down-regulated in R and S
genotypes, respectively; including only 130 and 140 known
genes. Among these, most genes were related to cell cycle
and DNA processing, cell transport, protein fate, and
metabolism, such as DNA methyltransferases, DNA-
methyladenine glycosylases, lipases, hydrolases, and PHD
finger proteins (Fig. 1; Table 1). There were 57 differen-
tially expressed genes between R and S genotypes at this
early stage (12 h) post-inoculation. Of these, 18 had met-
abolic-related functions, including three glycosyl transfer-
ases. Also, there were 12 differentially expressed genes
implicated in cell rescue and defense, such as chitinases,
oxidases, heat shock proteins, and lipoxygenases. It is
noteworthy to indicate that most of these genes were up-
regulated in the R genotype and down-regulated in the S
genotype (Table 1).
There were 915 and 950 genes up-regulated in R and S
genotypes, respectively, at 24 hpi (second time point) at
FDR 5%. Of these, 395 and 417 genes were known genes,
1318 Theor Appl Genet (2010) 120:1315–1333
123
respectively. Among the up-regulated genes, transcripts of
PAL, cytochrome P450, disease-resistance protein (TIR-
NBS-LRR class), isoflavone reductases, lipoxygenases,
chalcone synthases, cinnamoyl CoA dehydrogenases,
WRKY family transcription factors, and dihydroflavonol
4-reductase family were found in both genotypes. Examples
of down-regulated genes included Myb family transcription
factors, hydrolases, heat shock transcription factors,
ferredoxin-related, and anexins (Fig. 1 and Supplemental
Table 2). In summary, there were 54 significantly differ-
entially expressed genes between the two genotypes at
24 hpi. Most of these genes were the same as those
detected at 12 hpi. However, there were also unique dif-
ferentially expressed genes at this time point, including
three genes involved in cell cycle and DNA processing,
two genes related to energy, and three genes implicated in
regulation of metabolism. All of these genes were down-
regulated in the R genotype and up-regulated in the S
genotype (Table 1).
At 48 hpi (third time point), 988 and 912 genes were up-
regulated in R and S genotypes, respectively (Supplemental
Table 2). Of these, 432 and 391 were known genes,
respectively, using FDR at 5%. Moreover, there were 354
and 430 genes down-regulated in R and S genotypes,
respectively. Overall, genes detected at this time point
(48 hpi) in both genotypes were the same as those identi-
fied in the previous two time points (12 and 24 hpi). Fur-
thermore, those 53 differentially expressed genes identified
between R and S genotypes at 48 hpi were almost the same
as those detected at 24 hpi (54 genes), except for a single
change in a gene involved in the regulation of metabolism
(details of such comparisons are presented in Table 1).
At 72 hpi, at FDR of 5%, 904 and 910 genes were up-
regulated and 438 and 432 were down-regulated in R and S
genotypes, respectively. Of these, 392 and 390 genes were
known up-regulated genes, and 155 and 157 were known
down-regulated genes in R and S genotypes, respectively
(Fig. 1; Supplementary Table 2). Although the numbers of
up- and down- regulated genes were very similar between
the two genotypes, higher numbers of genes (98 genes)
were differentially expressed at this time point, almost
twofold than at all other previous time points. Moreover,
unlike all other post-inoculation stages, there was an
increase in genes associated with transcription, regulation
of metabolism, protein with binding function, metabolism,
and cellular communication. Among differentially expres-
sed genes, six transcripts related to kinases were down-
regulated in the R genotype and up-regulated in the S
genotype. In contrast, cinnamoyl CoA dehydrogenase was
represented by three transcripts up-regulated in the R
genotype and down-regulated in the S genotype (Table 1).
Functional annotation of regulated genes
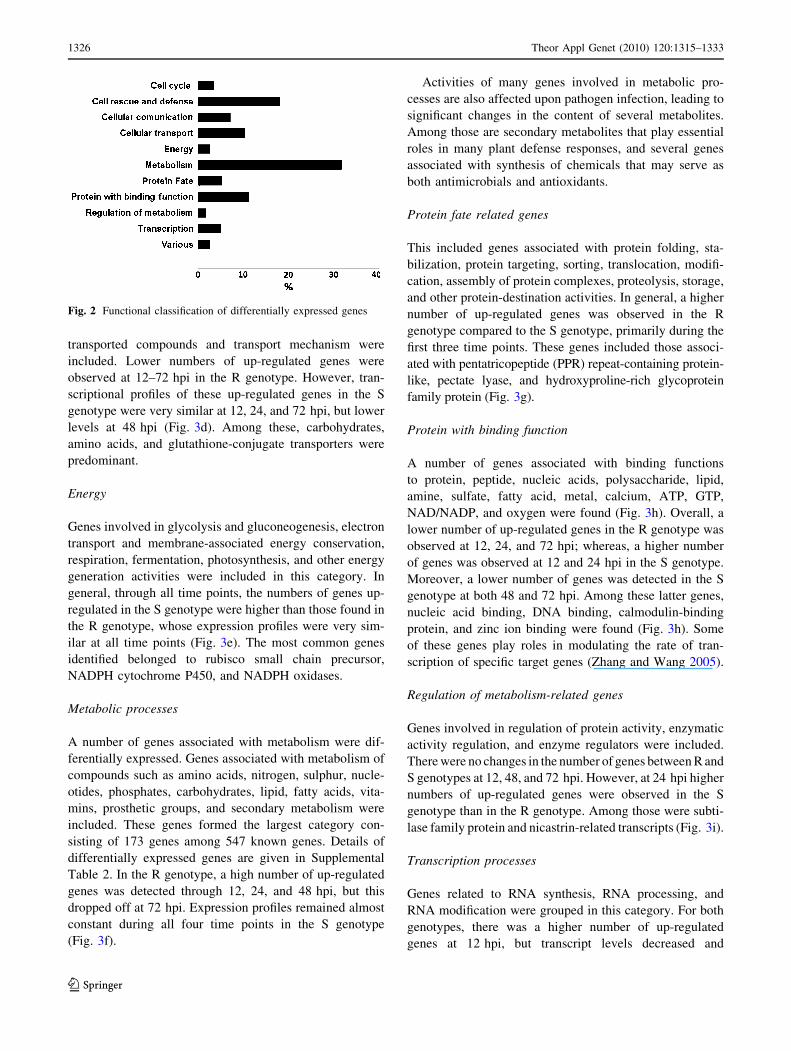
All 1,342 genes, from S and R genotypes, found to be
differentially expressed at P B0.05, were assigned into
12 functional categories by searching the MIPS data-
base (http://mips.gsf.de/proj/plant/jsf/athal/index.jsp). This
revealed that in both genotypes, classes of metabolism, cell
rescue and defense, protein with binding function, and
cellular transport were overrepresented (Fig. 2). Details of
differentially expressed genes with respect to time and
genotype are given in Supplemental Table 2.
Responses in resistant versus susceptible genotypes
to P. pachyrhizi
Cell cycle and DNA processing related genes
Genes involved in mitotic cell cycle, cell cycle control, and
DNA synthesis and replication were grouped in this cate-
gory. Overall, an increase in up-regulated genes was
observed in this category at both 24 and 48 hpi compared
with genes expressed at 12 and 72 hpi. At 24 hpi, higher
numbers of genes were up-regulated in the S genotype in
comparison with the R genotype, and among those inclu-
ded DNA polymerases alpha catalytic subunit, DNA-
binding proteins, and lipases class 3 family proteins
(Fig. 3a).
Defense-related genes
On the basis of MIPS Functional Catalogue, genes asso-
ciated with stress response, DNA repair, resistance pro-
teins, defense-related proteins, detoxification, cell death,
degradation of exogenous proteins, and other cell rescue
activities were grouped under the defense category, which
formed the second largest group. Over all time points,
larger numbers of these genes were up-regulated in R
genotype compared with the S genotype (Fig. 3b).
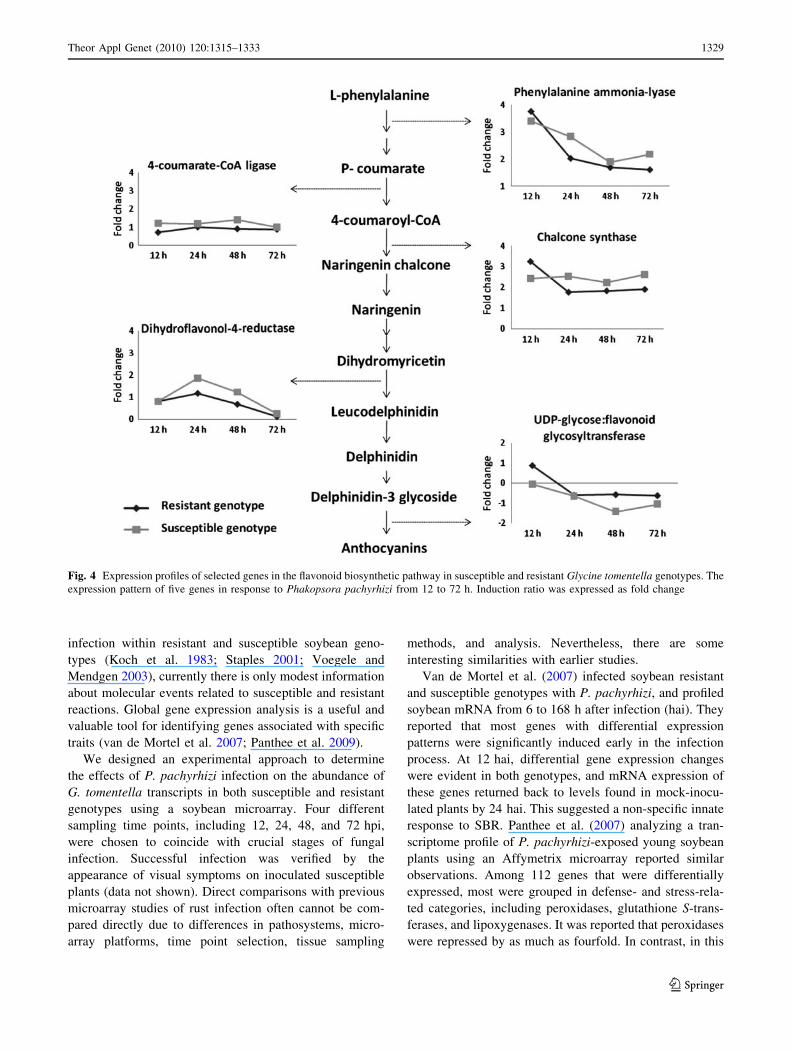
As shown in Fig. 4, expression of genes, such as
PAL, chalcone synthases, and UDP-glycose—flavonoid
Fig. 1 Distribution of up- and down-regulated genes at 12, 24, 48,
and 72 h in response to Phakopsora pachyrhizi infection in resistant
and susceptible Glycine tomentella genotypes
Theor Appl Genet (2010) 120:1315–1333 1319
123
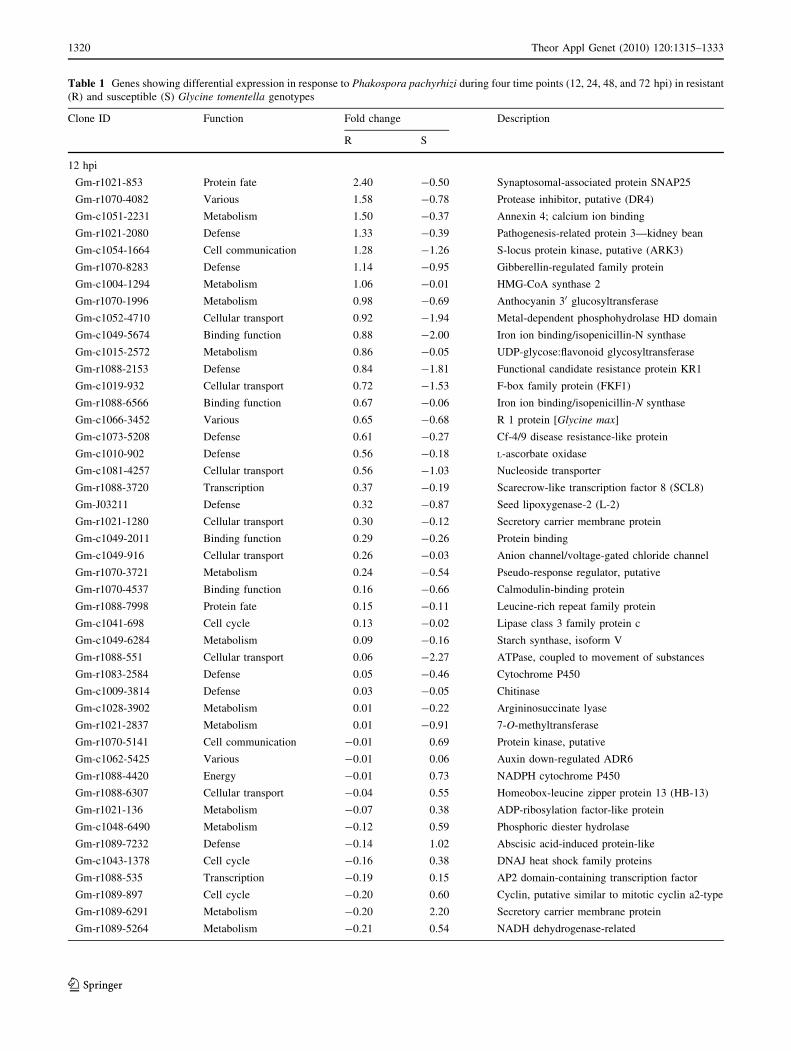
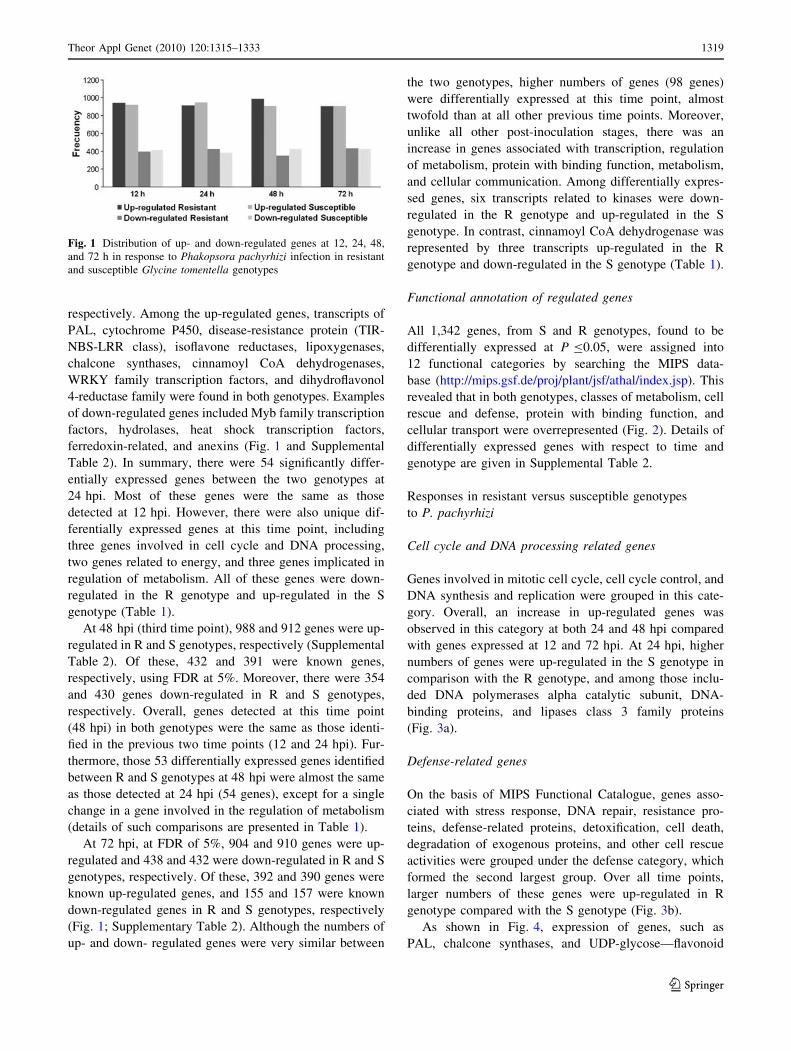
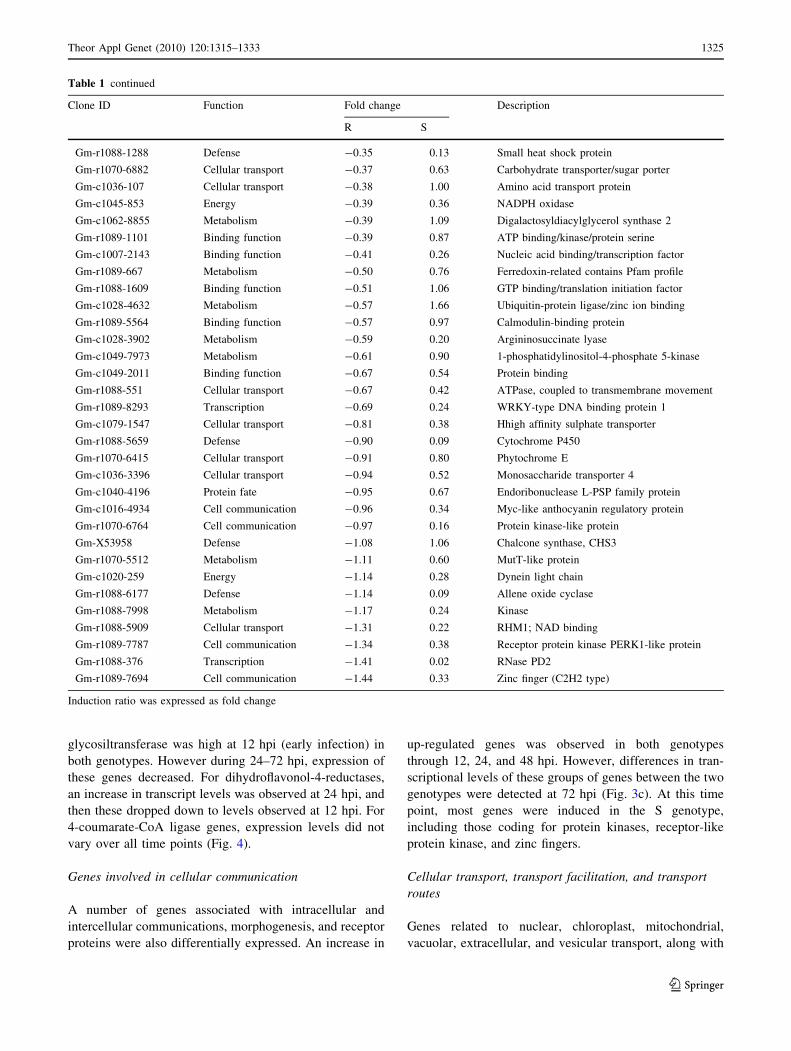
Table 1 Genes showing differential expression in response to Phakospora pachyrhizi during four time points (12, 24, 48, and 72 hpi) in resistant
(R) and susceptible (S) Glycine tomentella genotypes
Clone ID Function Fold change Description
R S
12 hpi
Gm-r1021-853 Protein fate 2.40 -0.50 Synaptosomal-associated protein SNAP25
Gm-r1070-4082 Various 1.58 -0.78 Protease inhibitor, putative (DR4)
Gm-c1051-2231 Metabolism 1.50 -0.37 Annexin 4; calcium ion binding
Gm-r1021-2080 Defense 1.33 -0.39 Pathogenesis-related protein 3—kidney bean
Gm-c1054-1664 Cell communication 1.28 -1.26 S-locus protein kinase, putative (ARK3)
Gm-r1070-8283 Defense 1.14 -0.95 Gibberellin-regulated family protein
Gm-c1004-1294 Metabolism 1.06 -0.01 HMG-CoA synthase 2
Gm-r1070-1996 Metabolism 0.98 -0.69 Anthocyanin 30 glucosyltransferase
Gm-c1052-4710 Cellular transport 0.92 -1.94 Metal-dependent phosphohydrolase HD domain
Gm-c1049-5674 Binding function 0.88 -2.00 Iron ion binding/isopenicillin-N synthase
Gm-c1015-2572 Metabolism 0.86 -0.05 UDP-glycose:flavonoid glycosyltransferase
Gm-r1088-2153 Defense 0.84 -1.81 Functional candidate resistance protein KR1
Gm-c1019-932 Cellular transport 0.72 -1.53 F-box family protein (FKF1)
Gm-r1088-6566 Binding function 0.67 -0.06 Iron ion binding/isopenicillin-N synthase
Gm-c1066-3452 Various 0.65 -0.68 R 1 protein [Glycine max]
Gm-c1073-5208 Defense 0.61 -0.27 Cf-4/9 disease resistance-like protein
Gm-c1010-902 Defense 0.56 -0.18 L-ascorbate oxidase
Gm-c1081-4257 Cellular transport 0.56 -1.03 Nucleoside transporter
Gm-r1088-3720 Transcription 0.37 -0.19 Scarecrow-like transcription factor 8 (SCL8)
Gm-J03211 Defense 0.32 -0.87 Seed lipoxygenase-2 (L-2)
Gm-r1021-1280 Cellular transport 0.30 -0.12 Secretory carrier membrane protein
Gm-c1049-2011 Binding function 0.29 -0.26 Protein binding
Gm-c1049-916 Cellular transport 0.26 -0.03 Anion channel/voltage-gated chloride channel
Gm-r1070-3721 Metabolism 0.24 -0.54 Pseudo-response regulator, putative
Gm-r1070-4537 Binding function 0.16 -0.66 Calmodulin-binding protein
Gm-r1088-7998 Protein fate 0.15 -0.11 Leucine-rich repeat family protein
Gm-c1041-698 Cell cycle 0.13 -0.02 Lipase class 3 family protein c
Gm-c1049-6284 Metabolism 0.09 -0.16 Starch synthase, isoform V
Gm-r1088-551 Cellular transport 0.06 -2.27 ATPase, coupled to movement of substances
Gm-r1083-2584 Defense 0.05 -0.46 Cytochrome P450
Gm-c1009-3814 Defense 0.03 -0.05 Chitinase
Gm-c1028-3902 Metabolism 0.01 -0.22 Argininosuccinate lyase
Gm-r1021-2837 Metabolism 0.01 -0.91 7-O-methyltransferase
Gm-r1070-5141 Cell communication -0.01 0.69 Protein kinase, putative
Gm-c1062-5425 Various -0.01 0.06 Auxin down-regulated ADR6
Gm-r1088-4420 Energy -0.01 0.73 NADPH cytochrome P450
Gm-r1088-6307 Cellular transport -0.04 0.55 Homeobox-leucine zipper protein 13 (HB-13)
Gm-r1021-136 Metabolism -0.07 0.38 ADP-ribosylation factor-like protein
Gm-c1048-6490 Metabolism -0.12 0.59 Phosphoric diester hydrolase
Gm-r1089-7232 Defense -0.14 1.02 Abscisic acid-induced protein-like
Gm-c1043-1378 Cell cycle -0.16 0.38 DNAJ heat shock family proteins
Gm-r1088-535 Transcription -0.19 0.15 AP2 domain-containing transcription factor
Gm-r1089-897 Cell cycle -0.20 0.60 Cyclin, putative similar to mitotic cyclin a2-type
Gm-r1089-6291 Metabolism -0.20 2.20 Secretory carrier membrane protein
Gm-r1089-5264 Metabolism -0.21 0.54 NADH dehydrogenase-related
1320 Theor Appl Genet (2010) 120:1315–1333
123
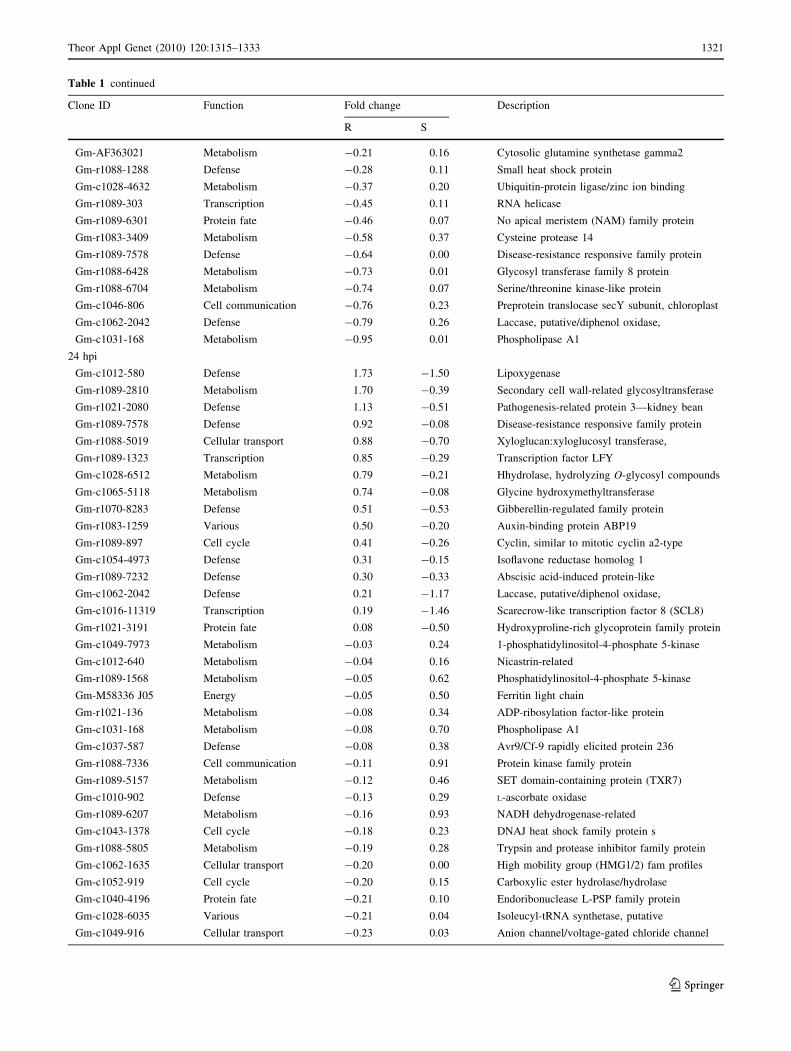
Table 1 continued
Clone ID Function Fold change Description
R S
Gm-AF363021 Metabolism -0.21 0.16 Cytosolic glutamine synthetase gamma2
Gm-r1088-1288 Defense -0.28 0.11 Small heat shock protein
Gm-c1028-4632 Metabolism -0.37 0.20 Ubiquitin-protein ligase/zinc ion binding
Gm-r1089-303 Transcription -0.45 0.11 RNA helicase
Gm-r1089-6301 Protein fate -0.46 0.07 No apical meristem (NAM) family protein
Gm-r1083-3409 Metabolism -0.58 0.37 Cysteine protease 14
Gm-r1089-7578 Defense -0.64 0.00 Disease-resistance responsive family protein
Gm-r1088-6428 Metabolism -0.73 0.01 Glycosyl transferase family 8 protein
Gm-r1088-6704 Metabolism -0.74 0.07 Serine/threonine kinase-like protein
Gm-c1046-806 Cell communication -0.76 0.23 Preprotein translocase secY subunit, chloroplast
Gm-c1062-2042 Defense -0.79 0.26 Laccase, putative/diphenol oxidase,
Gm-c1031-168 Metabolism -0.95 0.01 Phospholipase A1
24 hpi
Gm-c1012-580 Defense 1.73 -1.50 Lipoxygenase
Gm-r1089-2810 Metabolism 1.70 -0.39 Secondary cell wall-related glycosyltransferase
Gm-r1021-2080 Defense 1.13 -0.51 Pathogenesis-related protein 3—kidney bean
Gm-r1089-7578 Defense 0.92 -0.08 Disease-resistance responsive family protein
Gm-r1088-5019 Cellular transport 0.88 -0.70 Xyloglucan:xyloglucosyl transferase,
Gm-r1089-1323 Transcription 0.85 -0.29 Transcription factor LFY
Gm-c1028-6512 Metabolism 0.79 -0.21 Hhydrolase, hydrolyzing O-glycosyl compounds
Gm-c1065-5118 Metabolism 0.74 -0.08 Glycine hydroxymethyltransferase
Gm-r1070-8283 Defense 0.51 -0.53 Gibberellin-regulated family protein
Gm-r1083-1259 Various 0.50 -0.20 Auxin-binding protein ABP19
Gm-r1089-897 Cell cycle 0.41 -0.26 Cyclin, similar to mitotic cyclin a2-type
Gm-c1054-4973 Defense 0.31 -0.15 Isoflavone reductase homolog 1
Gm-r1089-7232 Defense 0.30 -0.33 Abscisic acid-induced protein-like
Gm-c1062-2042 Defense 0.21 -1.17 Laccase, putative/diphenol oxidase,
Gm-c1016-11319 Transcription 0.19 -1.46 Scarecrow-like transcription factor 8 (SCL8)
Gm-r1021-3191 Protein fate 0.08 -0.50 Hydroxyproline-rich glycoprotein family protein
Gm-c1049-7973 Metabolism -0.03 0.24 1-phosphatidylinositol-4-phosphate 5-kinase
Gm-c1012-640 Metabolism -0.04 0.16 Nicastrin-related
Gm-r1089-1568 Metabolism -0.05 0.62 Phosphatidylinositol-4-phosphate 5-kinase
Gm-M58336 J05 Energy -0.05 0.50 Ferritin light chain
Gm-r1021-136 Metabolism -0.08 0.34 ADP-ribosylation factor-like protein
Gm-c1031-168 Metabolism -0.08 0.70 Phospholipase A1
Gm-c1037-587 Defense -0.08 0.38 Avr9/Cf-9 rapidly elicited protein 236
Gm-r1088-7336 Cell communication -0.11 0.91 Protein kinase family protein
Gm-r1089-5157 Metabolism -0.12 0.46 SET domain-containing protein (TXR7)
Gm-c1010-902 Defense -0.13 0.29 L-ascorbate oxidase
Gm-r1089-6207 Metabolism -0.16 0.93 NADH dehydrogenase-related
Gm-c1043-1378 Cell cycle -0.18 0.23 DNAJ heat shock family protein s
Gm-r1088-5805 Metabolism -0.19 0.28 Trypsin and protease inhibitor family protein
Gm-c1062-1635 Cellular transport -0.20 0.00 High mobility group (HMG1/2) fam profiles
Gm-c1052-919 Cell cycle -0.20 0.15 Carboxylic ester hydrolase/hydrolase
Gm-c1040-4196 Protein fate -0.21 0.10 Endoribonuclease L-PSP family protein
Gm-c1028-6035 Various -0.21 0.04 Isoleucyl-tRNA synthetase, putative
Gm-c1049-916 Cellular transport -0.23 0.03 Anion channel/voltage-gated chloride channel
Theor Appl Genet (2010) 120:1315–1333 1321
123
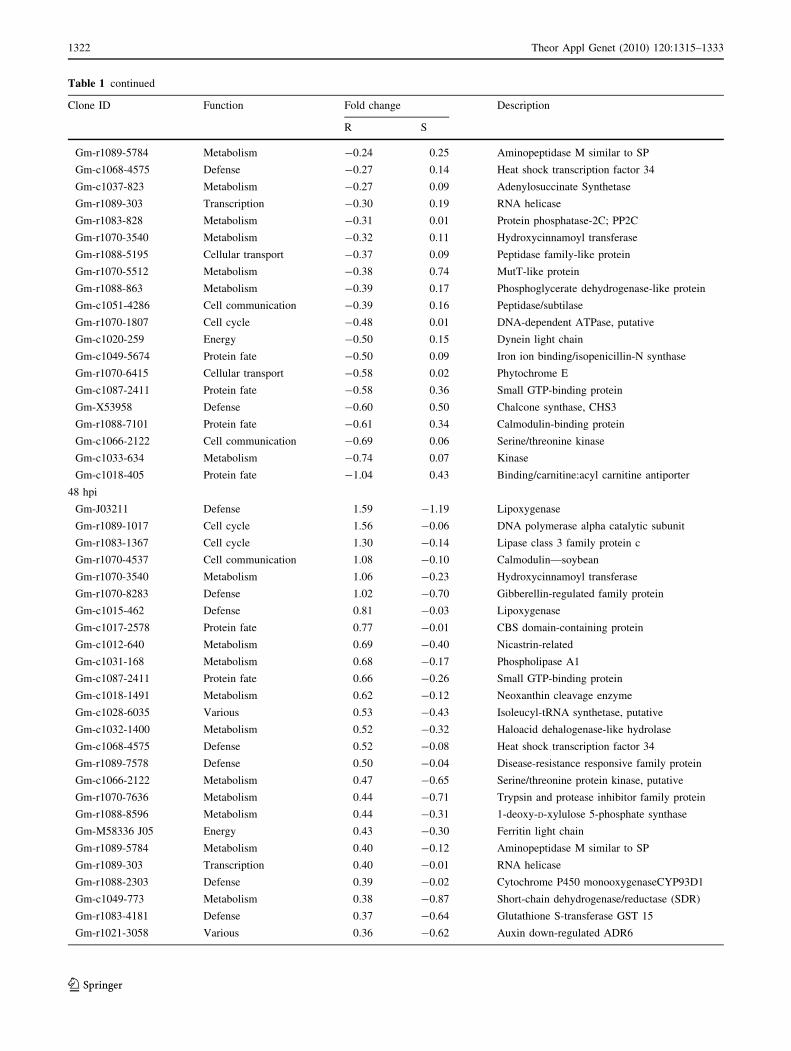
Table 1 continued
Clone ID Function Fold change Description
R S
Gm-r1089-5784 Metabolism -0.24 0.25 Aminopeptidase M similar to SP
Gm-c1068-4575 Defense -0.27 0.14 Heat shock transcription factor 34
Gm-c1037-823 Metabolism -0.27 0.09 Adenylosuccinate Synthetase
Gm-r1089-303 Transcription -0.30 0.19 RNA helicase
Gm-r1083-828 Metabolism -0.31 0.01 Protein phosphatase-2C; PP2C
Gm-r1070-3540 Metabolism -0.32 0.11 Hydroxycinnamoyl transferase
Gm-r1088-5195 Cellular transport -0.37 0.09 Peptidase family-like protein
Gm-r1070-5512 Metabolism -0.38 0.74 MutT-like protein
Gm-r1088-863 Metabolism -0.39 0.17 Phosphoglycerate dehydrogenase-like protein
Gm-c1051-4286 Cell communication -0.39 0.16 Peptidase/subtilase
Gm-r1070-1807 Cell cycle -0.48 0.01 DNA-dependent ATPase, putative
Gm-c1020-259 Energy -0.50 0.15 Dynein light chain
Gm-c1049-5674 Protein fate -0.50 0.09 Iron ion binding/isopenicillin-N synthase
Gm-r1070-6415 Cellular transport -0.58 0.02 Phytochrome E
Gm-c1087-2411 Protein fate -0.58 0.36 Small GTP-binding protein
Gm-X53958 Defense -0.60 0.50 Chalcone synthase, CHS3
Gm-r1088-7101 Protein fate -0.61 0.34 Calmodulin-binding protein
Gm-c1066-2122 Cell communication -0.69 0.06 Serine/threonine kinase
Gm-c1033-634 Metabolism -0.74 0.07 Kinase
Gm-c1018-405 Protein fate -1.04 0.43 Binding/carnitine:acyl carnitine antiporter
48 hpi
Gm-J03211 Defense 1.59 -1.19 Lipoxygenase
Gm-r1089-1017 Cell cycle 1.56 -0.06 DNA polymerase alpha catalytic subunit
Gm-r1083-1367 Cell cycle 1.30 -0.14 Lipase class 3 family protein c
Gm-r1070-4537 Cell communication 1.08 -0.10 Calmodulin—soybean
Gm-r1070-3540 Metabolism 1.06 -0.23 Hydroxycinnamoyl transferase
Gm-r1070-8283 Defense 1.02 -0.70 Gibberellin-regulated family protein
Gm-c1015-462 Defense 0.81 -0.03 Lipoxygenase
Gm-c1017-2578 Protein fate 0.77 -0.01 CBS domain-containing protein
Gm-c1012-640 Metabolism 0.69 -0.40 Nicastrin-related
Gm-c1031-168 Metabolism 0.68 -0.17 Phospholipase A1
Gm-c1087-2411 Protein fate 0.66 -0.26 Small GTP-binding protein
Gm-c1018-1491 Metabolism 0.62 -0.12 Neoxanthin cleavage enzyme
Gm-c1028-6035 Various 0.53 -0.43 Isoleucyl-tRNA synthetase, putative
Gm-c1032-1400 Metabolism 0.52 -0.32 Haloacid dehalogenase-like hydrolase
Gm-c1068-4575 Defense 0.52 -0.08 Heat shock transcription factor 34
Gm-r1089-7578 Defense 0.50 -0.04 Disease-resistance responsive family protein
Gm-c1066-2122 Metabolism 0.47 -0.65 Serine/threonine protein kinase, putative
Gm-r1070-7636 Metabolism 0.44 -0.71 Trypsin and protease inhibitor family protein
Gm-r1088-8596 Metabolism 0.44 -0.31 1-deoxy-D-xylulose 5-phosphate synthase
Gm-M58336 J05 Energy 0.43 -0.30 Ferritin light chain
Gm-r1089-5784 Metabolism 0.40 -0.12 Aminopeptidase M similar to SP
Gm-r1089-303 Transcription 0.40 -0.01 RNA helicase
Gm-r1088-2303 Defense 0.39 -0.02 Cytochrome P450 monooxygenaseCYP93D1
Gm-c1049-773 Metabolism 0.38 -0.87 Short-chain dehydrogenase/reductase (SDR)
Gm-r1083-4181 Defense 0.37 -0.64 Glutathione S-transferase GST 15
Gm-r1021-3058 Various 0.36 -0.62 Auxin down-regulated ADR6
1322 Theor Appl Genet (2010) 120:1315–1333
123
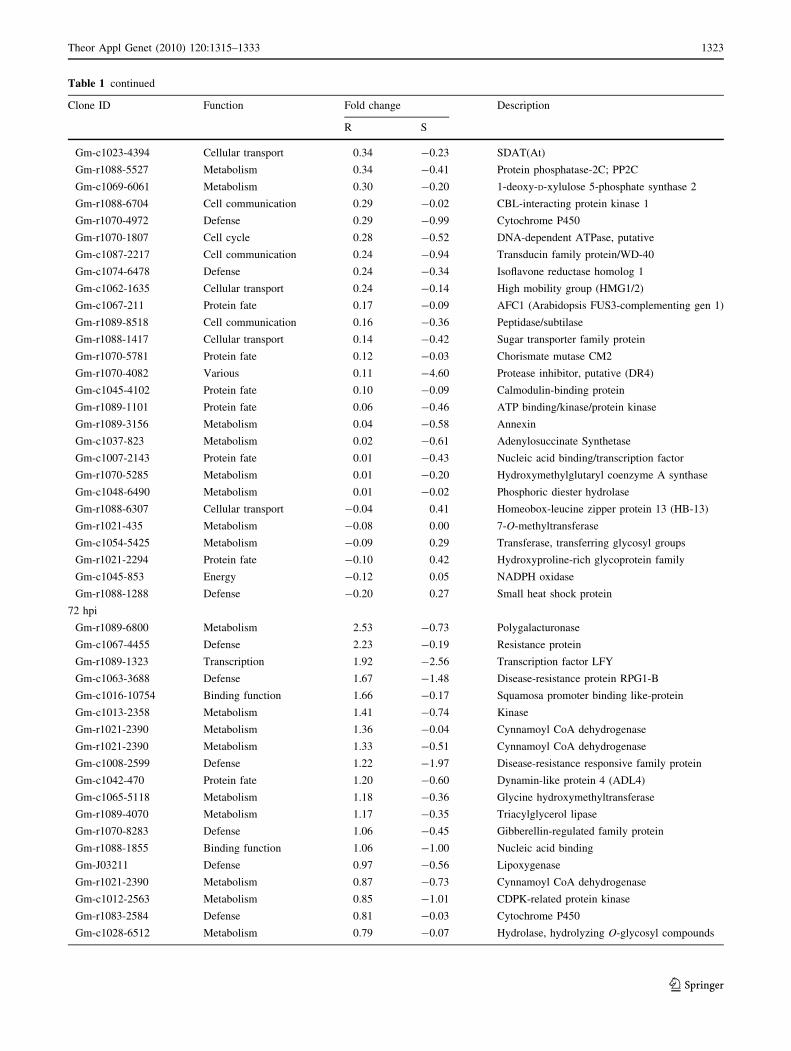
Table 1 continued
Clone ID Function Fold change Description
R S
Gm-c1023-4394 Cellular transport 0.34 -0.23 SDAT(At)
Gm-r1088-5527 Metabolism 0.34 -0.41 Protein phosphatase-2C; PP2C
Gm-c1069-6061 Metabolism 0.30 -0.20 1-deoxy-D-xylulose 5-phosphate synthase 2
Gm-r1088-6704 Cell communication 0.29 -0.02 CBL-interacting protein kinase 1
Gm-r1070-4972 Defense 0.29 -0.99 Cytochrome P450
Gm-r1070-1807 Cell cycle 0.28 -0.52 DNA-dependent ATPase, putative
Gm-c1087-2217 Cell communication 0.24 -0.94 Transducin family protein/WD-40
Gm-c1074-6478 Defense 0.24 -0.34 Isoflavone reductase homolog 1
Gm-c1062-1635 Cellular transport 0.24 -0.14 High mobility group (HMG1/2)
Gm-c1067-211 Protein fate 0.17 -0.09 AFC1 (Arabidopsis FUS3-complementing gen 1)
Gm-r1089-8518 Cell communication 0.16 -0.36 Peptidase/subtilase
Gm-r1088-1417 Cellular transport 0.14 -0.42 Sugar transporter family protein
Gm-r1070-5781 Protein fate 0.12 -0.03 Chorismate mutase CM2
Gm-r1070-4082 Various 0.11 -4.60 Protease inhibitor, putative (DR4)
Gm-c1045-4102 Protein fate 0.10 -0.09 Calmodulin-binding protein
Gm-r1089-1101 Protein fate 0.06 -0.46 ATP binding/kinase/protein kinase
Gm-r1089-3156 Metabolism 0.04 -0.58 Annexin
Gm-c1037-823 Metabolism 0.02 -0.61 Adenylosuccinate Synthetase
Gm-c1007-2143 Protein fate 0.01 -0.43 Nucleic acid binding/transcription factor
Gm-r1070-5285 Metabolism 0.01 -0.20 Hydroxymethylglutaryl coenzyme A synthase
Gm-c1048-6490 Metabolism 0.01 -0.02 Phosphoric diester hydrolase
Gm-r1088-6307 Cellular transport -0.04 0.41 Homeobox-leucine zipper protein 13 (HB-13)
Gm-r1021-435 Metabolism -0.08 0.00 7-O-methyltransferase
Gm-c1054-5425 Metabolism -0.09 0.29 Transferase, transferring glycosyl groups
Gm-r1021-2294 Protein fate -0.10 0.42 Hydroxyproline-rich glycoprotein family
Gm-c1045-853 Energy -0.12 0.05 NADPH oxidase
Gm-r1088-1288 Defense -0.20 0.27 Small heat shock protein
72 hpi
Gm-r1089-6800 Metabolism 2.53 -0.73 Polygalacturonase
Gm-c1067-4455 Defense 2.23 -0.19 Resistance protein
Gm-r1089-1323 Transcription 1.92 -2.56 Transcription factor LFY
Gm-c1063-3688 Defense 1.67 -1.48 Disease-resistance protein RPG1-B
Gm-c1016-10754 Binding function 1.66 -0.17 Squamosa promoter binding like-protein
Gm-c1013-2358 Metabolism 1.41 -0.74 Kinase
Gm-r1021-2390 Metabolism 1.36 -0.04 Cynnamoyl CoA dehydrogenase
Gm-r1021-2390 Metabolism 1.33 -0.51 Cynnamoyl CoA dehydrogenase
Gm-c1008-2599 Defense 1.22 -1.97 Disease-resistance responsive family protein
Gm-c1042-470 Protein fate 1.20 -0.60 Dynamin-like protein 4 (ADL4)
Gm-c1065-5118 Metabolism 1.18 -0.36 Glycine hydroxymethyltransferase
Gm-r1089-4070 Metabolism 1.17 -0.35 Triacylglycerol lipase
Gm-r1070-8283 Defense 1.06 -0.45 Gibberellin-regulated family protein
Gm-r1088-1855 Binding function 1.06 -1.00 Nucleic acid binding
Gm-J03211 Defense 0.97 -0.56 Lipoxygenase
Gm-r1021-2390 Metabolism 0.87 -0.73 Cynnamoyl CoA dehydrogenase
Gm-c1012-2563 Metabolism 0.85 -1.01 CDPK-related protein kinase
Gm-r1083-2584 Defense 0.81 -0.03 Cytochrome P450
Gm-c1028-6512 Metabolism 0.79 -0.07 Hydrolase, hydrolyzing O-glycosyl compounds
Theor Appl Genet (2010) 120:1315–1333 1323
123
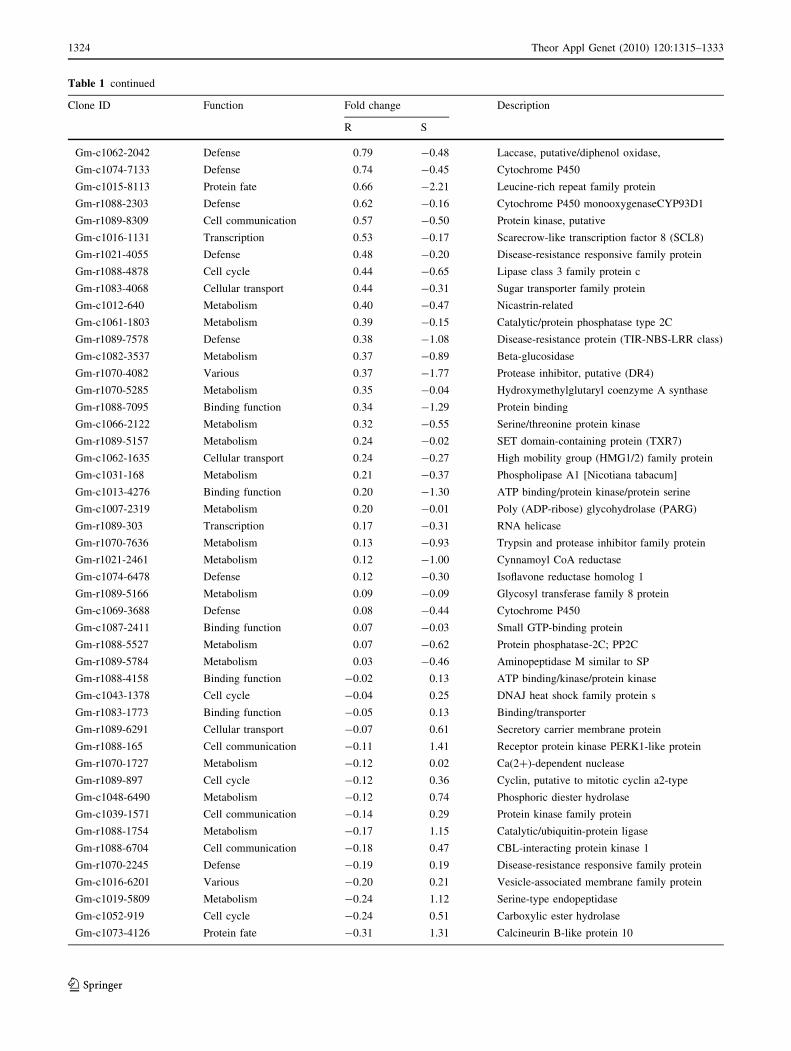
Table 1 continued
Clone ID Function Fold change Description
R S
Gm-c1062-2042 Defense 0.79 -0.48 Laccase, putative/diphenol oxidase,
Gm-c1074-7133 Defense 0.74 -0.45 Cytochrome P450
Gm-c1015-8113 Protein fate 0.66 -2.21 Leucine-rich repeat family protein
Gm-r1088-2303 Defense 0.62 -0.16 Cytochrome P450 monooxygenaseCYP93D1
Gm-r1089-8309 Cell communication 0.57 -0.50 Protein kinase, putative
Gm-c1016-1131 Transcription 0.53 -0.17 Scarecrow-like transcription factor 8 (SCL8)
Gm-r1021-4055 Defense 0.48 -0.20 Disease-resistance responsive family protein
Gm-r1088-4878 Cell cycle 0.44 -0.65 Lipase class 3 family protein c
Gm-r1083-4068 Cellular transport 0.44 -0.31 Sugar transporter family protein
Gm-c1012-640 Metabolism 0.40 -0.47 Nicastrin-related
Gm-c1061-1803 Metabolism 0.39 -0.15 Catalytic/protein phosphatase type 2C
Gm-r1089-7578 Defense 0.38 -1.08 Disease-resistance protein (TIR-NBS-LRR class)
Gm-c1082-3537 Metabolism 0.37 -0.89 Beta-glucosidase
Gm-r1070-4082 Various 0.37 -1.77 Protease inhibitor, putative (DR4)
Gm-r1070-5285 Metabolism 0.35 -0.04 Hydroxymethylglutaryl coenzyme A synthase
Gm-r1088-7095 Binding function 0.34 -1.29 Protein binding
Gm-c1066-2122 Metabolism 0.32 -0.55 Serine/threonine protein kinase
Gm-r1089-5157 Metabolism 0.24 -0.02 SET domain-containing protein (TXR7)
Gm-c1062-1635 Cellular transport 0.24 -0.27 High mobility group (HMG1/2) family protein
Gm-c1031-168 Metabolism 0.21 -0.37 Phospholipase A1 [Nicotiana tabacum]
Gm-c1013-4276 Binding function 0.20 -1.30 ATP binding/protein kinase/protein serine
Gm-c1007-2319 Metabolism 0.20 -0.01 Poly (ADP-ribose) glycohydrolase (PARG)
Gm-r1089-303 Transcription 0.17 -0.31 RNA helicase
Gm-r1070-7636 Metabolism 0.13 -0.93 Trypsin and protease inhibitor family protein
Gm-r1021-2461 Metabolism 0.12 -1.00 Cynnamoyl CoA reductase
Gm-c1074-6478 Defense 0.12 -0.30 Isoflavone reductase homolog 1
Gm-r1089-5166 Metabolism 0.09 -0.09 Glycosyl transferase family 8 protein
Gm-c1069-3688 Defense 0.08 -0.44 Cytochrome P450
Gm-c1087-2411 Binding function 0.07 -0.03 Small GTP-binding protein
Gm-r1088-5527 Metabolism 0.07 -0.62 Protein phosphatase-2C; PP2C
Gm-r1089-5784 Metabolism 0.03 -0.46 Aminopeptidase M similar to SP
Gm-r1088-4158 Binding function -0.02 0.13 ATP binding/kinase/protein kinase
Gm-c1043-1378 Cell cycle -0.04 0.25 DNAJ heat shock family protein s
Gm-r1083-1773 Binding function -0.05 0.13 Binding/transporter
Gm-r1089-6291 Cellular transport -0.07 0.61 Secretory carrier membrane protein
Gm-r1088-165 Cell communication -0.11 1.41 Receptor protein kinase PERK1-like protein
Gm-r1070-1727 Metabolism -0.12 0.02 Ca(2?)-dependent nuclease
Gm-r1089-897 Cell cycle -0.12 0.36 Cyclin, putative to mitotic cyclin a2-type
Gm-c1048-6490 Metabolism -0.12 0.74 Phosphoric diester hydrolase
Gm-c1039-1571 Cell communication -0.14 0.29 Protein kinase family protein
Gm-r1088-1754 Metabolism -0.17 1.15 Catalytic/ubiquitin-protein ligase
Gm-r1088-6704 Cell communication -0.18 0.47 CBL-interacting protein kinase 1
Gm-r1070-2245 Defense -0.19 0.19 Disease-resistance responsive family protein
Gm-c1016-6201 Various -0.20 0.21 Vesicle-associated membrane family protein
Gm-c1019-5809 Metabolism -0.24 1.12 Serine-type endopeptidase
Gm-c1052-919 Cell cycle -0.24 0.51 Carboxylic ester hydrolase
Gm-c1073-4126 Protein fate -0.31 1.31 Calcineurin B-like protein 10
1324 Theor Appl Genet (2010) 120:1315–1333
123
glycosiltransferase was high at 12 hpi (early infection) in
both genotypes. However during 24–72 hpi, expression of
these genes decreased. For dihydroflavonol-4-reductases,
an increase in transcript levels was observed at 24 hpi, and
then these dropped down to levels observed at 12 hpi. For
4-coumarate-CoA ligase genes, expression levels did not
vary over all time points (Fig. 4).
Genes involved in cellular communication
A number of genes associated with intracellular and
intercellular communications, morphogenesis, and receptor
proteins were also differentially expressed. An increase in
up-regulated genes was observed in both genotypes
through 12, 24, and 48 hpi. However, differences in tran-
scriptional levels of these groups of genes between the two
genotypes were detected at 72 hpi (Fig. 3c). At this time
point, most genes were induced in the S genotype,
including those coding for protein kinases, receptor-like
protein kinase, and zinc fingers.
Cellular transport, transport facilitation, and transport
routes
Genes related to nuclear, chloroplast, mitochondrial,
vacuolar, extracellular, and vesicular transport, along with
Table 1 continued
Clone ID Function Fold change Description
R S
Gm-r1088-1288 Defense -0.35 0.13 Small heat shock protein
Gm-r1070-6882 Cellular transport -0.37 0.63 Carbohydrate transporter/sugar porter
Gm-c1036-107 Cellular transport -0.38 1.00 Amino acid transport protein
Gm-c1045-853 Energy -0.39 0.36 NADPH oxidase
Gm-c1062-8855 Metabolism -0.39 1.09 Digalactosyldiacylglycerol synthase 2
Gm-r1089-1101 Binding function -0.39 0.87 ATP binding/kinase/protein serine
Gm-c1007-2143 Binding function -0.41 0.26 Nucleic acid binding/transcription factor
Gm-r1089-667 Metabolism -0.50 0.76 Ferredoxin-related contains Pfam profile
Gm-r1088-1609 Binding function -0.51 1.06 GTP binding/translation initiation factor
Gm-c1028-4632 Metabolism -0.57 1.66 Ubiquitin-protein ligase/zinc ion binding
Gm-r1089-5564 Binding function -0.57 0.97 Calmodulin-binding protein
Gm-c1028-3902 Metabolism -0.59 0.20 Argininosuccinate lyase
Gm-c1049-7973 Metabolism -0.61 0.90 1-phosphatidylinositol-4-phosphate 5-kinase
Gm-c1049-2011 Binding function -0.67 0.54 Protein binding
Gm-r1088-551 Cellular transport -0.67 0.42 ATPase, coupled to transmembrane movement
Gm-r1089-8293 Transcription -0.69 0.24 WRKY-type DNA binding protein 1
Gm-c1079-1547 Cellular transport -0.81 0.38 Hhigh affinity sulphate transporter
Gm-r1088-5659 Defense -0.90 0.09 Cytochrome P450
Gm-r1070-6415 Cellular transport -0.91 0.80 Phytochrome E
Gm-c1036-3396 Cellular transport -0.94 0.52 Monosaccharide transporter 4
Gm-c1040-4196 Protein fate -0.95 0.67 Endoribonuclease L-PSP family protein
Gm-c1016-4934 Cell communication -0.96 0.34 Myc-like anthocyanin regulatory protein
Gm-r1070-6764 Cell communication -0.97 0.16 Protein kinase-like protein
Gm-X53958 Defense -1.08 1.06 Chalcone synthase, CHS3
Gm-r1070-5512 Metabolism -1.11 0.60 MutT-like protein
Gm-c1020-259 Energy -1.14 0.28 Dynein light chain
Gm-r1088-6177 Defense -1.14 0.09 Allene oxide cyclase
Gm-r1088-7998 Metabolism -1.17 0.24 Kinase
Gm-r1088-5909 Cellular transport -1.31 0.22 RHM1; NAD binding
Gm-r1089-7787 Cell communication -1.34 0.38 Receptor protein kinase PERK1-like protein
Gm-r1088-376 Transcription -1.41 0.02 RNase PD2
Gm-r1089-7694 Cell communication -1.44 0.33 Zinc finger (C2H2 type)
Induction ratio was expressed as fold change
Theor Appl Genet (2010) 120:1315–1333 1325
123
transported compounds and transport mechanism were
included. Lower numbers of up-regulated genes were
observed at 12–72 hpi in the R genotype. However, tran-
scriptional profiles of these up-regulated genes in the S
genotype were very similar at 12, 24, and 72 hpi, but lower
levels at 48 hpi (Fig. 3d). Among these, carbohydrates,
amino acids, and glutathione-conjugate transporters were
predominant.
Energy
Genes involved in glycolysis and gluconeogenesis, electron
transport and membrane-associated energy conservation,
respiration, fermentation, photosynthesis, and other energy
generation activities were included in this category. In
general, through all time points, the numbers of genes up-
regulated in the S genotype were higher than those found in
the R genotype, whose expression profiles were very sim-
ilar at all time points (Fig. 3e). The most common genes
identified belonged to rubisco small chain precursor,
NADPH cytochrome P450, and NADPH oxidases.
Metabolic processes
A number of genes associated with metabolism were dif-
ferentially expressed. Genes associated with metabolism of
compounds such as amino acids, nitrogen, sulphur, nucle-
otides, phosphates, carbohydrates, lipid, fatty acids, vita-
mins, prosthetic groups, and secondary metabolism were
included. These genes formed the largest category con-
sisting of 173 genes among 547 known genes. Details of
differentially expressed genes are given in Supplemental
Table 2. In the R genotype, a high number of up-regulated
genes was detected through 12, 24, and 48 hpi, but this
dropped off at 72 hpi. Expression profiles remained almost
constant during all four time points in the S genotype
(Fig. 3f).
Activities of many genes involved in metabolic pro-
cesses are also affected upon pathogen infection, leading to
significant changes in the content of several metabolites.
Among those are secondary metabolites that play essential
roles in many plant defense responses, and several genes
associated with synthesis of chemicals that may serve as
both antimicrobials and antioxidants.
Protein fate related genes
This included genes associated with protein folding, sta-
bilization, protein targeting, sorting, translocation, modifi-
cation, assembly of protein complexes, proteolysis, storage,
and other protein-destination activities. In general, a higher
number of up-regulated genes was observed in the R
genotype compared to the S genotype, primarily during the
first three time points. These genes included those associ-
ated with pentatricopeptide (PPR) repeat-containing protein-
like, pectate lyase, and hydroxyproline-rich glycoprotein
family protein (Fig. 3g).
Protein with binding function
A number of genes associated with binding functions
to protein, peptide, nucleic acids, polysaccharide, lipid,
amine, sulfate, fatty acid, metal, calcium, ATP, GTP,
NAD/NADP, and oxygen were found (Fig. 3h). Overall, a
lower number of up-regulated genes in the R genotype was
observed at 12, 24, and 72 hpi; whereas, a higher number
of genes was observed at 12 and 24 hpi in the S genotype.
Moreover, a lower number of genes was detected in the S
genotype at both 48 and 72 hpi. Among these latter genes,
nucleic acid binding, DNA binding, calmodulin-binding
protein, and zinc ion binding were found (Fig. 3h). Some
of these genes play roles in modulating the rate of tran-
scription of specific target genes (Zhang and Wang 2005).
Regulation of metabolism-related genes
Genes involved in regulation of protein activity, enzymatic
activity regulation, and enzyme regulators were included.
There were no changes in the number of genes between R and
S genotypes at 12, 48, and 72 hpi. However, at 24 hpi higher
numbers of up-regulated genes were observed in the S
genotype than in the R genotype. Among those were subti-
lase family protein and nicastrin-related transcripts (Fig. 3i).
Transcription processes
Genes related to RNA synthesis, RNA processing, and
RNA modification were grouped in this category. For both
genotypes, there was a higher number of up-regulated
genes at 12 hpi, but transcript levels decreased and
Fig. 2 Functional classification of differentially expressed genes
1326 Theor Appl Genet (2010) 120:1315–1333
123
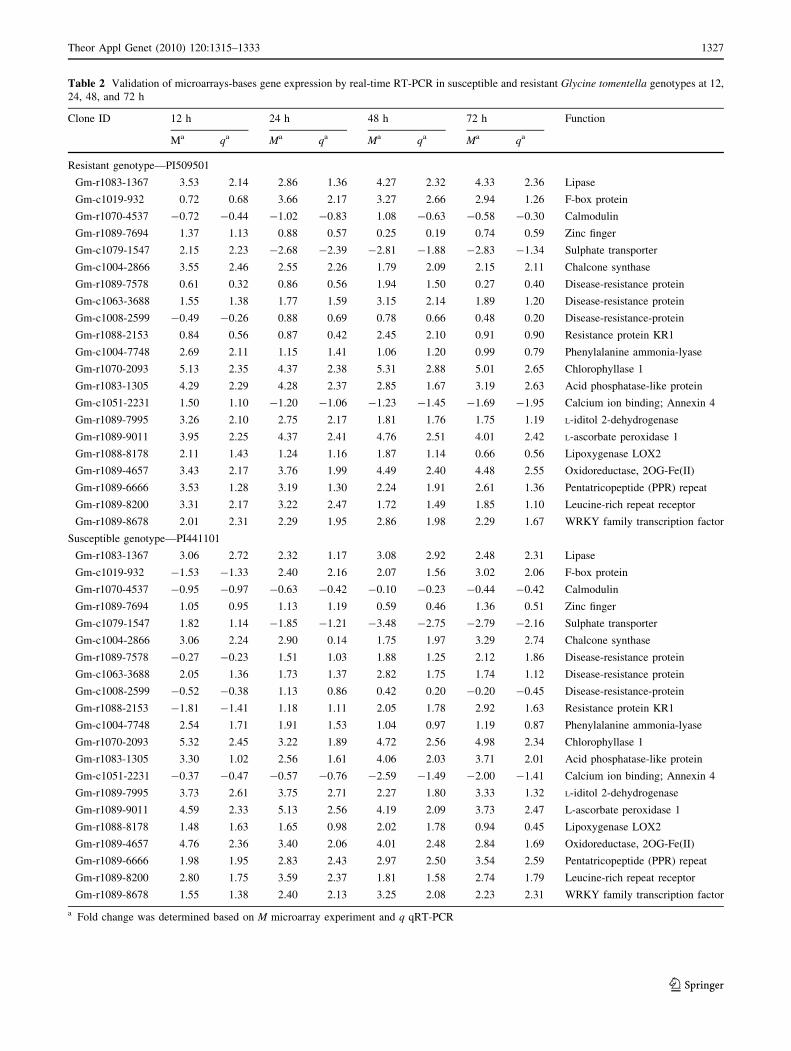
Table 2 Validation of microarrays-bases gene expression by real-time RT-PCR in susceptible and resistant Glycine tomentella genotypes at 12,
24, 48, and 72 h
Clone ID 12 h 24 h 48 h 72 h Function
Ma qa Ma qa Ma qa Ma qa
Resistant genotype—PI509501
Gm-r1083-1367 3.53 2.14 2.86 1.36 4.27 2.32 4.33 2.36 Lipase
Gm-c1019-932 0.72 0.68 3.66 2.17 3.27 2.66 2.94 1.26 F-box protein
Gm-r1070-4537 -0.72 -0.44 -1.02 -0.83 1.08 -0.63 -0.58 -0.30 Calmodulin
Gm-r1089-7694 1.37 1.13 0.88 0.57 0.25 0.19 0.74 0.59 Zinc finger
Gm-c1079-1547 2.15 2.23 -2.68 -2.39 -2.81 -1.88 -2.83 -1.34 Sulphate transporter
Gm-c1004-2866 3.55 2.46 2.55 2.26 1.79 2.09 2.15 2.11 Chalcone synthase
Gm-r1089-7578 0.61 0.32 0.86 0.56 1.94 1.50 0.27 0.40 Disease-resistance protein
Gm-c1063-3688 1.55 1.38 1.77 1.59 3.15 2.14 1.89 1.20 Disease-resistance protein
Gm-c1008-2599 -0.49 -0.26 0.88 0.69 0.78 0.66 0.48 0.20 Disease-resistance-protein
Gm-r1088-2153 0.84 0.56 0.87 0.42 2.45 2.10 0.91 0.90 Resistance protein KR1
Gm-c1004-7748 2.69 2.11 1.15 1.41 1.06 1.20 0.99 0.79 Phenylalanine ammonia-lyase
Gm-r1070-2093 5.13 2.35 4.37 2.38 5.31 2.88 5.01 2.65 Chlorophyllase 1
Gm-r1083-1305 4.29 2.29 4.28 2.37 2.85 1.67 3.19 2.63 Acid phosphatase-like protein
Gm-c1051-2231 1.50 1.10 -1.20 -1.06 -1.23 -1.45 -1.69 -1.95 Calcium ion binding; Annexin 4
Gm-r1089-7995 3.26 2.10 2.75 2.17 1.81 1.76 1.75 1.19 L-iditol 2-dehydrogenase
Gm-r1089-9011 3.95 2.25 4.37 2.41 4.76 2.51 4.01 2.42 L-ascorbate peroxidase 1
Gm-r1088-8178 2.11 1.43 1.24 1.16 1.87 1.14 0.66 0.56 Lipoxygenase LOX2
Gm-r1089-4657 3.43 2.17 3.76 1.99 4.49 2.40 4.48 2.55 Oxidoreductase, 2OG-Fe(II)
Gm-r1089-6666 3.53 1.28 3.19 1.30 2.24 1.91 2.61 1.36 Pentatricopeptide (PPR) repeat
Gm-r1089-8200 3.31 2.17 3.22 2.47 1.72 1.49 1.85 1.10 Leucine-rich repeat receptor
Gm-r1089-8678 2.01 2.31 2.29 1.95 2.86 1.98 2.29 1.67 WRKY family transcription factor
Susceptible genotype—PI441101
Gm-r1083-1367 3.06 2.72 2.32 1.17 3.08 2.92 2.48 2.31 Lipase
Gm-c1019-932 -1.53 -1.33 2.40 2.16 2.07 1.56 3.02 2.06 F-box protein
Gm-r1070-4537 -0.95 -0.97 -0.63 -0.42 -0.10 -0.23 -0.44 -0.42 Calmodulin
Gm-r1089-7694 1.05 0.95 1.13 1.19 0.59 0.46 1.36 0.51 Zinc finger
Gm-c1079-1547 1.82 1.14 -1.85 -1.21 -3.48 -2.75 -2.79 -2.16 Sulphate transporter
Gm-c1004-2866 3.06 2.24 2.90 0.14 1.75 1.97 3.29 2.74 Chalcone synthase
Gm-r1089-7578 -0.27 -0.23 1.51 1.03 1.88 1.25 2.12 1.86 Disease-resistance protein
Gm-c1063-3688 2.05 1.36 1.73 1.37 2.82 1.75 1.74 1.12 Disease-resistance protein
Gm-c1008-2599 -0.52 -0.38 1.13 0.86 0.42 0.20 -0.20 -0.45 Disease-resistance-protein
Gm-r1088-2153 -1.81 -1.41 1.18 1.11 2.05 1.78 2.92 1.63 Resistance protein KR1
Gm-c1004-7748 2.54 1.71 1.91 1.53 1.04 0.97 1.19 0.87 Phenylalanine ammonia-lyase
Gm-r1070-2093 5.32 2.45 3.22 1.89 4.72 2.56 4.98 2.34 Chlorophyllase 1
Gm-r1083-1305 3.30 1.02 2.56 1.61 4.06 2.03 3.71 2.01 Acid phosphatase-like protein
Gm-c1051-2231 -0.37 -0.47 -0.57 -0.76 -2.59 -1.49 -2.00 -1.41 Calcium ion binding; Annexin 4
Gm-r1089-7995 3.73 2.61 3.75 2.71 2.27 1.80 3.33 1.32 L-iditol 2-dehydrogenase
Gm-r1089-9011 4.59 2.33 5.13 2.56 4.19 2.09 3.73 2.47 L-ascorbate peroxidase 1
Gm-r1088-8178 1.48 1.63 1.65 0.98 2.02 1.78 0.94 0.45 Lipoxygenase LOX2
Gm-r1089-4657 4.76 2.36 3.40 2.06 4.01 2.48 2.84 1.69 Oxidoreductase, 2OG-Fe(II)
Gm-r1089-6666 1.98 1.95 2.83 2.43 2.97 2.50 3.54 2.59 Pentatricopeptide (PPR) repeat
Gm-r1089-8200 2.80 1.75 3.59 2.37 1.81 1.58 2.74 1.79 Leucine-rich repeat receptor
Gm-r1089-8678 1.55 1.38 2.40 2.13 3.25 2.08 2.23 2.31 WRKY family transcription factor
a Fold change was determined based on M microarray experiment and q qRT-PCR
Theor Appl Genet (2010) 120:1315–1333 1327
123
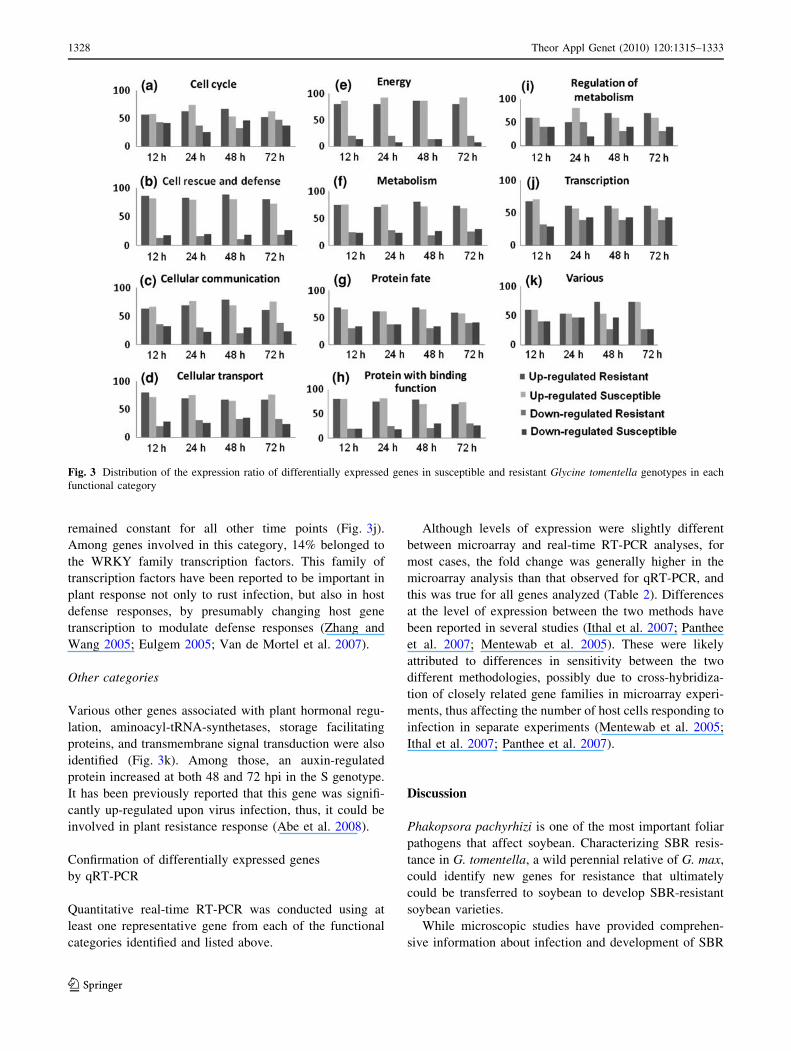
remained constant for all other time points (Fig. 3j).
Among genes involved in this category, 14% belonged to
the WRKY family transcription factors. This family of
transcription factors have been reported to be important in
plant response not only to rust infection, but also in host
defense responses, by presumably changing host gene
transcription to modulate defense responses (Zhang and
Wang 2005; Eulgem 2005; Van de Mortel et al. 2007).
Other categories
Various other genes associated with plant hormonal regu-
lation, aminoacyl-tRNA-synthetases, storage facilitating
proteins, and transmembrane signal transduction were also
identified (Fig. 3k). Among those, an auxin-regulated
protein increased at both 48 and 72 hpi in the S genotype.
It has been previously reported that this gene was signifi-
cantly up-regulated upon virus infection, thus, it could be
involved in plant resistance response (Abe et al. 2008).
Confirmation of differentially expressed genes
by qRT-PCR
Quantitative real-time RT-PCR was conducted using at
least one representative gene from each of the functional
categories identified and listed above.
Although levels of expression were slightly different
between microarray and real-time RT-PCR analyses, for
most cases, the fold change was generally higher in the
microarray analysis than that observed for qRT-PCR, and
this was true for all genes analyzed (Table 2). Differences
at the level of expression between the two methods have
been reported in several studies (Ithal et al. 2007; Panthee
et al. 2007; Mentewab et al. 2005). These were likely
attributed to differences in sensitivity between the two
different methodologies, possibly due to cross-hybridiza-
tion of closely related gene families in microarray experi-
ments, thus affecting the number of host cells responding to
infection in separate experiments (Mentewab et al. 2005;
Ithal et al. 2007; Panthee et al. 2007).
Discussion
Phakopsora pachyrhizi is one of the most important foliar
pathogens that affect soybean. Characterizing SBR resis-
tance in G. tomentella, a wild perennial relative of G. max,
could identify new genes for resistance that ultimately
could be transferred to soybean to develop SBR-resistant
soybean varieties.
While microscopic studies have provided comprehen-
sive information about infection and development of SBR
Fig. 3 Distribution of the expression ratio of differentially expressed genes in susceptible and resistant Glycine tomentella genotypes in each
functional category
1328 Theor Appl Genet (2010) 120:1315–1333
123
infection within resistant and susceptible soybean geno-
types (Koch et al. 1983; Staples 2001; Voegele and
Mendgen 2003), currently there is only modest information
about molecular events related to susceptible and resistant
reactions. Global gene expression analysis is a useful and
valuable tool for identifying genes associated with specific
traits (van de Mortel et al. 2007; Panthee et al. 2009).
We designed an experimental approach to determine
the effects of P. pachyrhizi infection on the abundance of
G. tomentella transcripts in both susceptible and resistant
genotypes using a soybean microarray. Four different
sampling time points, including 12, 24, 48, and 72 hpi,
were chosen to coincide with crucial stages of fungal
infection. Successful infection was verified by the
appearance of visual symptoms on inoculated susceptible
plants (data not shown). Direct comparisons with previous
microarray studies of rust infection often cannot be com-
pared directly due to differences in pathosystems, micro-
array platforms, time point selection, tissue sampling
methods, and analysis. Nevertheless, there are some
interesting similarities with earlier studies.
Van de Mortel et al. (2007) infected soybean resistant
and susceptible genotypes with P. pachyrhizi, and profiled
soybean mRNA from 6 to 168 h after infection (hai). They
reported that most genes with differential expression
patterns were significantly induced early in the infection
process. At 12 hai, differential gene expression changes
were evident in both genotypes, and mRNA expression of
these genes returned back to levels found in mock-inocu-
lated plants by 24 hai. This suggested a non-specific innate
response to SBR. Panthee et al. (2007) analyzing a tran-
scriptome profile of P. pachyrhizi-exposed young soybean
plants using an Affymetrix microarray reported similar
observations. Among 112 genes that were differentially
expressed, most were grouped in defense- and stress-rela-
ted categories, including peroxidases, glutathione S-trans-
ferases, and lipoxygenases. It was reported that peroxidases
were repressed by as much as fourfold. In contrast, in this
Fig. 4 Expression profiles of selected genes in the flavonoid biosynthetic pathway in susceptible and resistant Glycine tomentella genotypes. The
expression pattern of five genes in response to Phakopsora pachyrhizi from 12 to 72 h. Induction ratio was expressed as fold change
Theor Appl Genet (2010) 120:1315–1333 1329
123
study, peroxidases were induced by more than threefold in
the R genotype. This finding suggested these genes played
important roles in the antioxidant defense of plant cells
(Tripathi et al. 2009). Recently, Panthee et al. (2009) using
an Affymetrix GeneChip array investigated susceptible and
resistant soybean genotypes, and reported up-regulation of
lipoxygenase genes. Likewise, Choi et al. (2008) reported
on the up-regulation of 300 genes and down-regulation of
258 genes over 6–48 hai in P. pachyrhizi-infected leaves of
soybean using a cDNA array with approximately 7,883
probes, and concurred on the importance of peroxidases
and lipoxygenases.
In this study, several differentially expressed genes are
associated with the flavonoid biosynthetic pathway
reported to be involved in plant defense response through
production of various defense-related secondary metabo-
lites including phytoalexins and anti-microbial com-
pounds, such as diadzein, glyceollin, and tannins, among
others (Hahlbrock and Scheel 1989; Chang et al. 1995;
Abbasi et al. 2001; La Camera et al. 2004). Choi et al.
(2008) have reported high levels of expression of iso-
flavone reductase at 24 and 48 hai. In this study,
expression of this gene increased at 12 hpi in the R
genotype, but this increase was delayed until 24 hpi in the
S genotype. It has been widely reported that genes in the
phenylpropanoid synthesis pathway are among the most
powerful antioxidants in plant cells, and they are notably
up-regulated in soybean in response to challenge by
P. syringae (Zou et al. 2005; Zabala et al. 2006). Similarly,
van de Mortel et al. (2007) have reported that there are at
least ten genes involved in the phenylpropanoid synthesis
in R and S genotypes. Moreover, Panthee et al. (2009) have
indicated that there are four enzymes involved in this
pathway. In this study, five genes involved in phenyl-
propanoid synthesis are differentially expressed, including
PAL and chalcone synthases, both have been reported to be
consistently induced in plants in response to pathogen
infection (Dhawale et al. 1989; La Camera et al. 2004;
Zou et al. 2005; Zabala et al. 2006). Up-regulation of
genes in the multibranched phenylpropanoid pathway
leads to accumulation of toxic metabolites such as
phytoalexins and anti-microbial compounds including
pathogenesis-related proteins and cell wall components
such as hydroxyproline-rich glycoproteins and lignin and
its precursors (Schmelzer et al. 1984; Winkel-Shirley
2001; Zabala et al. 2006).
In this study, the enzyme 4-coumarate-CoA ligase,
another enzyme involved in the phenylpropanoid synthesis,
is up-regulated in both R and S genotypes at all time points,
with higher levels of expression in R compared to S
genotype. This is similar to findings reported by Panthee
et al. (2009). This enzyme has been reported to play a role
in the biosynthesis of jasmonic acid, which is effective in
defensive processes (Fritzemeier et al. 1987; Howe 2004;
Schilmiller et al. 2007).
Among those abundant genes whose expression change
in infected plants are those pathogenesis-related (PR) genes
associated with the development of systemic acquired
resistance and encode anti-microbial proteins. In this study,
these genes were up-regulated in the R genotype during the
first three time points, and as expected, these were down-
regulated in the S genotype. PR proteins have deleterious
activities toward structural components of pathogens; for
example, both b-1,3-glucanases and chitinases attack fun-
gal cell walls (Fritig et al. 1998). In this study, the level of
expression of the b-1,3-glucanase gene in the R genotype
was more than double that of the S genotype at 12 hpi;
whereas, the chitinase gene was up-regulated in the R
genotype and down-regulated in the S genotype. Recently,
Panthee et al. (2009) indicated that transcript responses
were largely dependent on the specific soybean growth
stage and their interactions with P. pachyrhizi, and a larger
number of genes were differentially expressed at V4
(approximately 2 weeks before bloom). These findings
were similar to those observed in this study whereby most
of the up-regulated genes belonged to those involved in the
general defense-related response.
In this study, genes encoding glutathione S-transferase, a
detoxification enzyme that plays an important role in
pathogen-resistance in plants mainly via peroxide and
xenobiotic detoxification (Sugiyama and Sekiya 2005; Luo
et al. 2005; Rouhier et al. 2008) have been found to be up-
regulated in the R genotype. This is similar to findings
reported previously by Choi et al. (2008) and Panthee et al.
(2007).
Phyto-oxylipins are assumed to play critical roles in
plant defense response as they act as signaling molecules
and/or protective compounds such as antibacterial and
wound-healing agents. Evidence for accumulation of fatty
acid derivatives in plant–microbe interactions has been
widely reported (Blee 2002; La Camera et al. 2004). Phyto-
oxylipins are produced during the metabolism of unsatu-
rated fatty acids through their oxidation catalyzed by
cytochrome P450, lipoxygenase, and a-dioxygenase
(Rance et al. 1998; Sanz et al. 1998; Tijet et al. 1998). In
this study, cytochrome P450 monooxygenase is up-regu-
lated to a higher level in R than in S genotypes. Moreover,
lipoxygenase is also differentially expressed, and that
a-dioxygenase transcriptional activity is higher in R than
in S genotypes as early as 12 hpi. It is reported that
these three enzymes, cytochrome P450 monooxygenase,
lipoxygenase, and a-dioxygenase, play important roles in
preventing the potentially harmful effects of free fatty acid
accumulation that could be induced by lipases in the early
responses of plants against stress and pathogens (Croft
et al. 1993; Blee 2002).
1330 Theor Appl Genet (2010) 120:1315–1333
123

For genes involved in cellular communication, an
increase in transcripts at all first three time points in R and
S genotypes has been observed in this study. Among these
are genes encoding for protein kinases, receptor-like pro-
tein kinase, serine/threonine kinases, and zinc fingers.
Garcia-Brugger et al. (2006) has reported that genes
encoding for kinases and MAPKS cascades as well as
oxidative stress-associated genes are all related with the
establishment of innate immune responses at particular
stages during early pathogen infection processes.
Many WRKY proteins are involved in defense against
pathogenic bacteria, fungi, viruses, and oomycetes (Yang
et al. 1999; Beyer et al. 2001; Chen et al. 2002; Deslandes
et al. 2002). Choi et al. (2008) have demonstrated that
MYB transcription factors are up-regulated at 12 and
24 hai, and down-regulated at 48 hai; whereas, WRKY
transcription factors are up-regulated at 12 hai and down-
regulated at both 24 and 48 hai. Similar findings have been
observed in this study whereby up-regulation of WRKY
transcription factors is noted at 12 hpi in the R genotype,
but only increased at 24 and 48 hpi in the S genotype,
while, MYB transcription factors genes are down-regulated
in both genotypes at all time points. This is also similar to
findings reported by Van de Mortel et al. (2007) and
Panthee et al. (2009). Previously, it has been reported that
WRKY genes may be activated by the same physiological
or environmental stimulus, such as pathogen attack,
wounding or senescence, and that these are possibly
involved in multiple pathways leading to an array of
physiological responses (Cheong et al. 2002; Deslandes
et al. 2002; Zhang and Wang 2005). All of these findings
suggest that transcription factors have both positive and
negative regulatory functions that control expression of
additional genes involved in defense pathways to prevent
infection.
Based on the above findings, genes associated with the
flavonoid biosynthesis pathway as well as those coding
for peroxidases and lipoxygenases are likely to be
involved in rust resistance in soybean, and serve as good
candidates for functional studies. Among genes involved
in the flavonoid biosynthetic pathway, those coding for
PAL and chalcone synthases are differentially expressed
in G. tomentella genotypes tested in this study, with
higher levels of expression detected in the R genotype.
Although 4-coumarate-CoA ligase is up-regulated in both
R and S genotypes at all time points, the observed higher
levels of expression in R compared to S genotypes, also
support the likelihood of its involvement in rust resis-
tance. Moreover, peroxidases are induced by more than
threefold in the R genotype, while, lipoxygenases are
notably up-regulated in the R genotype 24 and 48 hpi,
thereby highly involved in rust resistance responses. All
of the above-listed genes are undergoing functional
studies in our laboratory. However, it is also important to
point out that the majority of differentially expressed
genes identified in this study have unknown functions.
Therefore, this large pool of genes should be investigated
further as they may also play specific roles in rust resis-
tance in soybean.
In conclusion, in this study, we have identified a com-
prehensive list of transcripts regulated in R and S
G. tomentella genotypes at four time points following
P. pachyrhizi infection. These findings provide new
insights into the complex changes in plant gene expression
occurring globally in response to SBR. Some of these
genes can serve as potential targets for genetic improve-
ment of soybean plants for enhanced rust resistance.
Acknowledgments This study was supported by a grant received
from the United Soybean Board project no. 7262. Funds were also
received from the Illinois Council for Food and Agricultural Research
(C-FAR) project no. IDA CF07I-016-3-SEN. Partial funding was also
received from CONACYT (Mexico) to support scholarship no.
81276.
References
Abbasi PA, Graham MY, Graham TL (2001) Effects of soybean
genotype on the glyceollin elicitation competency of cotyledon
tissues to Phytophthora sojae glucan elicitors. Physiol Mol Plant
Pathol 59:95–105
Abe M, Hayashi T, Hada K, Kimura M (2008) Identification of
cDNAs encoding the WD repeat protein and auxin—regulated
protein in Nicotiana glutinosa leaves induced in response to
Tobacco Mosaic Virus infection at 25�C. J Fac Agric Kyushu
Univ 53:459–465
Baldridge GD, O’Neill NR, Samac DA (1998) Alfalfa (Medicagosativa L.) resistance to the root-lesion nematode, Pratylenchuspenetrans: defense-response gene mRNA and isoflavonoid
phytoalexin levels in roots. Plant Mol Biol 38:999–1010
Beyer K, Binder A, Boller T, Collinge M (2001) Identification of
potato genes induced during colonization by Phytophthorainfestans. Mol Plant Pathol 2:125–134
Bhuiyan NH, Selvaraj G, Wei Y, King J (2009) Gene expression
profiling and silencing reveal that monolignol biosynthesis plays
a critical role in penetration defence in wheat against powdery
mildew invasion. J Exp Bot 60:509–521
Blee E (2002) Impact of phyto-oxylipins in plant defense. Trends
Plant Sci 7:315–322
Bonde MR, Nester SE, Hartman GL, Miles MR, Austin CN, Stone
CL, Frederick RD (2006) Evaluation of virulence of Phakopsorapachyrhizi and P. meibomiae isolates. Plant Dis 90:708–716
Burdon JJ (1988) Major gene resistance to Phakopsora pachyrhizi in
Glycine canescens, a wild relative of soybean. Theor Appl Genet
75:923–928
Chang YC, Nair MG, Nitiss JL (1995) Metabolites of diadzein and
genistein and their biological activities. J Nat Prod 58:1901–
1905
Chen W, Provart NJ, Glazebrook J, Katagiri F, Chang HS, Eulgem T,
Mauch F, Luan S, Zou G, Whitham SA, Budworth PR, Tao Y,
Xie Z, Chen X, Lam S, Kreps JA, Harper JF, Si-Ammour A,
Mauch-Mani B, Heinlein M, Kobayashi K, Hohn T, Dangl JL,
Theor Appl Genet (2010) 120:1315–1333 1331
123
Wang X, Zhu T (2002) Expression profile matrix of Arabidopsis
transcription factor genes suggests their putative functions in
response to environmental stresses. Plant Cell 14:559–574
Cheong YH, Chang HS, Gupta R, Wang X, Zhu T, Luan S (2002)
Transcriptional profiling reveals novel interactions between
wounding, pathogen, abiotic stress, and hormonal responses in
Arabidopsis. Plant Physiol 129:661–677
Choi JJ, Alkharouf NW, Schneider KT, Matthews BF, Frederick RD
(2008) Expression patterns in soybean resistant to Phakopsorapachyrhizi reveal the importance of peroxidases and lipoxygen-
ases. Funct Integr Genomics 8:341–359
Croft K, Juttner F, Slusarenko AJ (1993) Volatile products of the
lipoxygenase pathway evolved from Phaseolus vulgaris (L.)
leaves inoculated with Pseudomonas syringae pv phaseolicola.
Plant Physiol 101:13–24
Cui X, Kerr MK, Churchill GA (2003) Transformations for cDNA
microarray data. Stat Appl Genet Mol Biol 2:Article 4
Deslandes L, Olivier J, Theulieres F, Hirsch J, Feng DX, Bittner-Eddy
P, Beynon J, Marco Y (2002) Resistance to Ralstonia solana-cearum in Arabidopsis thaliana is conferred by the recessive
RRS1-R gene, a member of a novel family of resistance genes.
PNAS 99:2404–2409
Dhawale S, Souciet G, Kuhn DN (1989) Increase of chalcone
synthase mRNA in pathogen-inoculated soybeans with race-
specific resistance is different in leaves and roots. Plant Physiol
91:911–916
Dixon RA (1986) The phytoalexin response: elicitation, signaling and
control of host gene expression. Biol Rev 61:239–291
Dixon RA (1999) Isoflavonoids: biochemistry, molecular biology and
biological functions. In: Sankawa U (ed) Comprehensive natural
products chemistry. Elsevier, Amsterdam, pp 773–823
Dixon RA, Dey PM, Lawton MA, Lamb CJ (1983) Phytoalexin
induction in French bean. Intercellular transmission of elicitation
in cell suspension cultures and hypocotyl sections of Phaseolusvulgaris. Plant Physiol 71:251–256
Ebel J, Grisebach H (1988) Defense strategies of soybean against the
fungus Phytophthora megasperma f. sp. glycinea: a molecular
analysis. Trends Biochem Sci 13:23–27
Eulgem T (2005) Regulation of the Arabidopsis defense transcrip-
tome. Trends Plant Sci 10:71–78
Fritig B, Heitz T, Legrand M (1998) Antimicrobial proteins in
induced plant defense. Curr Opin Immunol 10:16–22
Fritzemeier KH, Cretin C, Kombrink E, Rohwer F, Taylor J, Scheel
D, Hahlbrock K (1987) Transient induction of phenylalanine
ammonia-lyase and 4-coumarate: CoA ligase mRNAs in potato
leaves infected with virulent or avirulent races of Phytophthorainfestans. Plant Physiol 85:34–41
Garcia A, Calvo ES, Kiihl RAD, Harada A, Hiromoto DM, Vieira
LGE (2008) Molecular mapping of soybean rust (Phakopsorapachyrhizi) resistance genes: discovery of a novel locus and
alleles. Theor Appl Genet 117:545–553
Garcia-Brugger A, Lamotte O, Vandelle E, Bourque S, Lecourieux D,
Poinssot B, Wendehenne D, Pugin A (2006) Early signaling
events induced by elicitors of plant defenses. Mol Plant Microbe
Interact 19:711–724
Gasic K, Hernandez A, Korban SS (2004) RNA extraction from
different apple tissues rich in polyphenols and polysaccharides
for cDNA library construction. Plant Mol Biol Rep 22:437a–
437g
Gonzalez DO, Vodkin LO (2007) Specific elements of the glyoxylate
pathway play a significant role in the functional transition of the
soybean cotyledon during seedling development. BMC Genom-
ics 8:468
Hahlbrock K, Scheel D (1989) Physiology and molecular biology of
phenylpropanoid metabolism. Annu Rev Plant Physiol Plant Mol
Biol 40:347–349
Hartman GL, Wang TC, Hymowitz T (1992) Sources of resistance to
soybean rust in perennial Glycine species. Plant Dis 76:396–399
Hartman GL, Bonde MR, Miles MR, Frederick RD (2004) Variation of
Phakopsora pachyrhizi isolates on soybean, pp 440–446 In:
Moscardi F, Hoffman-Campo CB, Ferreira Saraiva O, Galerani
PR, Kryzanowski FC, Carrao-Panizza MC (eds) Proceedings of VII
World Soybean Research Conference, IV International Soybean
Processing and Utilization Conference, III Congresso Mundial de
Soja (Brazilian Soybean Conference). Emprapa Soybean, Londrina
Hartman GL, Miles MR, Frederick RD (2005) Breeding for resistance
to soybean rust. Plant Dis 89:664–666
Hartwig EE (1995) Resistance to soybean rust. In: Sinclair JB, Hartman
GL (eds) Proceedings of the Soybean Rust Workshop, 9–11 August
1995. College of Agricultural, Consumer and Environmental
Sciences. National Soybean Research Laboratory, Urbana
Howe GA (2004) Jasmonates as signals in the wound response.
J Plant Growth Regul 23:223–237
Ithal N, Recknor J, Nettleton D, Hearne L, Maier T, Baum TJ,
Mitchum MG (2007) Parallel genome-wide expression profiling
of host and pathogen during soybean cyst nematode infection of
soybean. Mol Plant Microbe Interact 20:293–305
Jahnen W, Hahlbrock K (1988) Cellular localization of nonhost
resistance reactions of parsley (Petroselinum crispum) to fungal
infection. Planta 173:197–204
Jarosz AM, Burdon JJ (1990) Predominance of a single major gene
for resistance to Phakopsora pachyrhizi in a population of
Glycine argyrea. Heredity 64:347–353
Killgore E, Heu R (1994) First report of soybean rust in Hawaii. Plant
Dis 78:1216
Koch E, Ebrahim-Nesbat F, Hoppe HH (1983) Light and electron-
microscopic studies on the development of soybean rust
(Phakopsora pachyrhizi Syd) in susceptible soybean leaves.
Phytopathol Z 106:302–320
La Camera S, Gouzerh G, Dhondt S, Hoffmann L, Fritig B, Legrand
M, Heitz T (2004) Metabolic reprogramming in plant innate
immunity—the contributions of phenylpropanoid and oxylipin
pathways. Immunol Rev 198:267–284
Liu CJ, Deavours BE, Richard SB, Ferrer JL, Blount JW, Huhman D,
Dixon RA, Noel JP (2006) Structural basis for dual functionality
of isoflavonoid O-methyltransferases in the evolution of plant
defense responses. Plant Cell 18:3656–3669
Lo SC, Hipskind JD, Nicholson RL (1999) cDNA cloning of a
sorghum pathogenesis-related protein (PR-10) and differential
expression of defense-related genes following inoculation with
Cochliobolus heterostrophus or Colletotrichum sublineolum.
Mol Plant Microbe Interact 12:479–489
Lozovaya VV, Lygin AV, Zernova OV, Li S, Hartman GL, Widholm
JM (2004) Isoflavonoid accumulation in soybean hairy roots
upon treatment with Fusarium solani. Plant Physiol Biochem
42:671–679
Luo M, Liang XQ, Dang P, Holbrook CC, Bausher MG, Lee RD, Guo
BZ (2005) Microarray-based screening of differentially
expressed genes in peanut in response to Aspergillus parasiticusinfection and drought stress. Plant Sci 169:695–703
Mentewab A, Cardoza V, Stewart CNJ (2005) Genomic analysis of
the response of Arabidopsis thaliana to trinitrotoluene as
revealed by cDNA microarrays. Plant Sci 168:1409–1424
Meyer JD, Silva DC, Yang C, Pedley KF, Zhang C, van de Mortel M,
Hill JH, Shoemaker RC, Abdelnoor RV, Whitham SA, Graham
MA (2009) Identification and analyses of candidate genes for
Rpp4-mediated resistance to asian soybean rust in soybean
(Glycine max (L.) Merr.). doi:10.1104/pp.108.134551
Panthee DR, Yuan JS, Wright DL, Marois JJ, Mailhot D, Stewart CN Jr
(2007) Gene expression analysis in soybean in response to the
causal agent of Asian soybean rust (Phakopsora pachyrhizi Sydow)
in an early growth stage. Funct Integr Genomics 7:291–301
1332 Theor Appl Genet (2010) 120:1315–1333
123
Panthee DR, Marois JJ, Wright DL, Narvaez D, Yuan JS, Stewart CN
Jr (2009) Differential expression of genes in soybean in response
to the causal agent of Asian soybean rust (Phakopsora pachy-rhizi Sydow) is soybean growth stage-specific. Theor Appl Genet
118:359–370
Patzoldt ME, Tyagi RK, Hymowitz T, Miles MR, Hartman GL,
Frederick RD (2007) Soybean rust resistance derived from Glycinetomentella in amphiploid hybrid lines. Crop Sci 47:158–161
Rance I, Fournier J, Esquerre-Tugaye MT (1998) The incompatible
interaction between Phytophtora parasitica var. nicotianae race
0 and tobacco is suppressed in transgenic plants expressing
antisense lipoxygenase sequences. PNAS 95:6554–6559
Rouhier N, Lemaire SD, Jacquot JP (2008) The role of glutathione in
photosynthetic organisms: emerging functions for glutaredoxins
and glutathionylation. Annu Rev Plant Biol 59:143–166
Sanz A, Moreno JI, Castresana C (1998) PIOX, a new pathogenin-
duced oxygenase with homology to animal cyclooxygenase.
Plant Cell 10:1523–1537
Schilmiller AL, Koo AJK, Howe GA (2007) Functional diversifica-
tion of acyl-coenzyme A oxidases in jasmonic acid biosynthesis
and action. Plant Physiol 143:812–824
Schmelzer E, Borner H, Grisebach H, Ebel J, Hahlbrock K (1984)
Phytoalexin synthesis in soybean (Glycine max): similar time
courses of mRNA induction in hypocotyls infected with a fungal
pathogen and in cell cultures treated with fungal elicitor. FEBS
Lett 172:59–63
Schmelzer E, Kruger-Lebus S, Hahlbrock K (1989) Temporal and
spatial patterns of gene expression around sites of attempted
fungal infection in parsley leaves. Plant Cell 1:993–1001
Schneider RW, Hollier CA, Whitman HK, Palm ME, McKemy JM,
Hernandez JR, Levy L, DeVries-Paterson R (2005) First report
of soybean rust caused by Phakopsora pachyrhizi in the
continental United States. Plant Dis 89:774
Shen H, Chen J, Wang Z, Yang C, Sasaki T, Yamamoto Y,
Matsumoto H, Yan X (2006) Root plasma membrane H?-
ATPase is involved in the adaptation of soybean to phosphorus
starvation. J Exp Bot 57:1353–1362
Smith BJ, Ko Y, Southey BR, Rodriguez-Zas SL (2007) BEEHIVE—a
suite of tools to manage, analyze and interpret honey bee
microarray experiments. Workshop on honey bee genomics &
biology. Cold Spring Harbor Laboratory, Cold Spring Harbor,
May 6–8
Staples RC (2001) Nutrients for a rust fungus—the role of haustoria.
Trends Plant Sci 6:496–498
Sugiyama A, Sekiya J (2005) Homoglutathione confers tolerance to
acifluorfen in transgenic tobacco plants expressing soybean
homoglutathione synthetase. Plant Cell Physiol 46:1428–1432
Tijet N, Helvig C, Pinot F, Le Bouquin R, Lesot A, Durst F, Salaun
JP, Benveniste I (1998) Functional expression in yeast and
characterization of a chlofibrateinducible plant cytochrome-P450
(CYP94A1) involved in cutin monomers biosynthesis. Biochem
J 332:583–589
Tripathi BN, Bhatt I, Dietz KJ (2009) Peroxiredoxins: a less studied
component of hydrogen peroxide detoxification in photosyn-
thetic organisms. Protoplasma. doi:10.1007/s00709-009-0032-0
USDA (2009) Pest Information Platform for Extension and Educa-
tion. (Online) Available at http://www.sbrusa.net
van de Mortel M, Recknor JC, Graham MA, Nettleton D, Dittman JD,
Nelson RT, Godoy CV, Abdelnoor RV, Almeida AM, Baum TJ,
Whitham SA (2007) Distinct biphasic mRNA changes in
response to Asian soybean rust infection. Mol Plant Microbe
Interact 20:887–899
Voegele RT, Mendgen K (2003) Rust haustoria: nutrient uptake and
beyond. New Phytol 159:93–100
Winkel-Shirley B (2001) Flavonoid biosynthesis. A colorful model
for genetics, biochemistry, cell biology, and biotechnology. Plant
Physiol 126:485–493
Wolfinger RD, Gibson G, Wolfinger ED, Bennett L, Hamadeh H,
Bushel P, Afshari C, Paules RS (2001) Assessing gene signif-
icance from cDNA microarray expression data via mixed
models. J Comput Biol 8:625–637
Yang XB (1995) Assessment and management of the risk of soybean
rust. In: Sinclair JB, Hartman GL (eds) Proceedings of the
soybean rust workshop, 9–11 August 1995. National Soybean
Research Laboratory, Urbana
Yang PZ, Chen CH, Wang ZP, Fan BF, Chen ZX (1999) A pathogen-
and salicylic acid-induced WRKY DNA-binding activity recog-
nizes the elicitor response element of the tobacco class I
chitinase gene promoter. Plant J 18:141–149
Zabala G, Zou J, Tuteja J, Gonzalez DO, Clough SJ, Vodkin LO
(2006) Transcriptome changes in the phenylpropanoid pathway
of Glycine max in response to Pseudomonas syringae infection.
BMC Plant Biol 6:26
Zhang Y, Wang L (2005) The WRKY transcription factor superfam-
ily—its origin in eukaryotes and expansion in plants. BMC Evol
Biol 5:1
Zierold U, Scholz U, Schweizer P (2005) Transcriptome analysis of
mlo-mediated resistance in the epidermis of barley. Mol Plant
Pathol 6:139–151
Zou J, Rodriguez-Zas S, Aldea M, Li M, Zhu J, Gonzalez DO, Vodkin
LO, DeLucia E, Clough SJ (2005) Expression profiling soybean
response to Pseudomonas syringae reveals new defense-related
genes and rapid HR-specific downregulation of photosynthesis.
Mol Plant Microb Interact 18:1161–1174
Theor Appl Genet (2010) 120:1315–1333 1333
123
Related Documents