International Journal of Molecular Sciences Article Transcriptome Analyses of Myometrium from Fibroid Patients Reveals Phenotypic Differences Compared to Non-Diseased Myometrium Emmanuel N. Paul, Gregory W. Burns , Tyler J. Carpenter, Joshua A. Grey, Asgerally T. Fazleabas and Jose M. Teixeira * Citation: Paul, E.N.; Burns, G.W.; Carpenter, T.J.; Grey, J.A.; Fazleabas, A.T.; Teixeira, J.M. Transcriptome Analyses of Myometrium from Fibroid Patients Reveals Phenotypic Differences Compared to Non-Diseased Myometrium. Int. J. Mol. Sci. 2021, 22, 3618. https://doi.org/10.3390/ijms22073618 Academic Editor: Andrea Tinelli Received: 8 March 2021 Accepted: 28 March 2021 Published: 31 March 2021 Publisher’s Note: MDPI stays neutral with regard to jurisdictional claims in published maps and institutional affil- iations. Copyright: © 2021 by the authors. Licensee MDPI, Basel, Switzerland. This article is an open access article distributed under the terms and conditions of the Creative Commons Attribution (CC BY) license (https:// creativecommons.org/licenses/by/ 4.0/). Department of Obstetrics, Gynecology and Reproductive Biology, Michigan State University College of Human Medicine, Grand Rapids, MI 49503, USA; [email protected] (E.N.P.); [email protected] (G.W.B.); [email protected] (T.J.C.); [email protected] (J.A.G.); [email protected] (A.T.F.) * Correspondence: [email protected] Abstract: Uterine fibroid tissues are often compared to their matched myometrium in an effort to understand their pathophysiology, but it is not clear whether the myometria of uterine fibroid patients represent truly non-disease control tissues. We analyzed the transcriptomes of myometrial samples from non-fibroid patients (M) and compared them with fibroid (F) and matched myometrial (MF) samples to determine whether there is a phenotypic difference between fibroid and non-fibroid myometria. Multidimensional scaling plots revealed that M samples clustered separately from both MF and F samples. A total of 1169 differentially expressed genes (DEGs) (false discovery rate < 0.05) were observed in the MF comparison with M. Overrepresented Gene Ontology terms showed a high concordance of upregulated gene sets in MF compared to M, particularly extracellular matrix and structure organization. Gene set enrichment analyses showed that the leading-edge genes from the TGFβ signaling and inflammatory response gene sets were significantly enriched in MF. Overall comparison of the three tissues by three-dimensional principal component analyses showed that M, MF, and F samples clustered separately from each other and that a total of 732 DEGs from F vs. M were not found in the F vs. MF, which are likely understudied in the pathogenesis of uterine fibroids and could be key genes for future investigation. These results suggest that the transcriptome of fibroid-associated myometrium is different from that of non-diseased myometrium and that fibroid studies should consider using both matched myometrium and non-diseased myometrium as controls. Keywords: uterine fibroids; myometrium; field effect; CCND1; SERPINE1 1. Introduction Uterine fibroids, also known as uterine leiomyomas, are benign monoclonal steroid- dependent tumors of the smooth muscle compartment (myometrium) of the uterus [1,2]. Although benign, uterine fibroids are the most common reproductive tract tumors in repro- ductive age women, with an incidence up to 80% [3,4], depending on race and ethnicity [5]. The most common reasons women with symptomatic fibroids seek medical attention are heavy and prolonged menstrual bleeding, anemia, fatigue, pelvic pain, obstruction of the surrounding pelvic structures induced by large fibroids, dysmenorrhea, urinary incontinence, constipation, lower back pain, sexual dysfunction, infertility and recurrent pregnancy loss [6]. Hysterectomy, the most common and effective treatment for uterine fibroids, results in permanent infertility. Despite the significant healthcare burden posed by uterine fibroids and their negative impact on the quality of life of many women, the etiology and pathogenesis of the disease are not well understood. This gap in knowledge has likely been the major reason that effective, long-term and fertility-sparing clinical management of the disease has been elusive. Int. J. Mol. Sci. 2021, 22, 3618. https://doi.org/10.3390/ijms22073618 https://www.mdpi.com/journal/ijms

Welcome message from author
This document is posted to help you gain knowledge. Please leave a comment to let me know what you think about it! Share it to your friends and learn new things together.
Transcript
International Journal of
Molecular Sciences
Article
Transcriptome Analyses of Myometrium from FibroidPatients Reveals Phenotypic Differences Comparedto Non-Diseased Myometrium
Emmanuel N. Paul, Gregory W. Burns , Tyler J. Carpenter, Joshua A. Grey, Asgerally T. Fazleabasand Jose M. Teixeira *
�����������������
Citation: Paul, E.N.; Burns, G.W.;
Carpenter, T.J.; Grey, J.A.; Fazleabas,
A.T.; Teixeira, J.M. Transcriptome
Analyses of Myometrium from
Fibroid Patients Reveals Phenotypic
Differences Compared to
Non-Diseased Myometrium. Int. J.
Mol. Sci. 2021, 22, 3618.
https://doi.org/10.3390/ijms22073618
Academic Editor: Andrea Tinelli
Received: 8 March 2021
Accepted: 28 March 2021
Published: 31 March 2021
Publisher’s Note: MDPI stays neutral
with regard to jurisdictional claims in
published maps and institutional affil-
iations.
Copyright: © 2021 by the authors.
Licensee MDPI, Basel, Switzerland.
This article is an open access article
distributed under the terms and
conditions of the Creative Commons
Attribution (CC BY) license (https://
creativecommons.org/licenses/by/
4.0/).
Department of Obstetrics, Gynecology and Reproductive Biology, Michigan State University College of HumanMedicine, Grand Rapids, MI 49503, USA; [email protected] (E.N.P.); [email protected] (G.W.B.);[email protected] (T.J.C.); [email protected] (J.A.G.); [email protected] (A.T.F.)* Correspondence: [email protected]
Abstract: Uterine fibroid tissues are often compared to their matched myometrium in an effortto understand their pathophysiology, but it is not clear whether the myometria of uterine fibroidpatients represent truly non-disease control tissues. We analyzed the transcriptomes of myometrialsamples from non-fibroid patients (M) and compared them with fibroid (F) and matched myometrial(MF) samples to determine whether there is a phenotypic difference between fibroid and non-fibroidmyometria. Multidimensional scaling plots revealed that M samples clustered separately from bothMF and F samples. A total of 1169 differentially expressed genes (DEGs) (false discovery rate < 0.05)were observed in the MF comparison with M. Overrepresented Gene Ontology terms showed a highconcordance of upregulated gene sets in MF compared to M, particularly extracellular matrix andstructure organization. Gene set enrichment analyses showed that the leading-edge genes from theTGFβ signaling and inflammatory response gene sets were significantly enriched in MF. Overallcomparison of the three tissues by three-dimensional principal component analyses showed that M,MF, and F samples clustered separately from each other and that a total of 732 DEGs from F vs. Mwere not found in the F vs. MF, which are likely understudied in the pathogenesis of uterine fibroidsand could be key genes for future investigation. These results suggest that the transcriptome offibroid-associated myometrium is different from that of non-diseased myometrium and that fibroidstudies should consider using both matched myometrium and non-diseased myometrium as controls.
Keywords: uterine fibroids; myometrium; field effect; CCND1; SERPINE1
1. Introduction
Uterine fibroids, also known as uterine leiomyomas, are benign monoclonal steroid-dependent tumors of the smooth muscle compartment (myometrium) of the uterus [1,2].Although benign, uterine fibroids are the most common reproductive tract tumors in repro-ductive age women, with an incidence up to 80% [3,4], depending on race and ethnicity [5].The most common reasons women with symptomatic fibroids seek medical attentionare heavy and prolonged menstrual bleeding, anemia, fatigue, pelvic pain, obstructionof the surrounding pelvic structures induced by large fibroids, dysmenorrhea, urinaryincontinence, constipation, lower back pain, sexual dysfunction, infertility and recurrentpregnancy loss [6]. Hysterectomy, the most common and effective treatment for uterinefibroids, results in permanent infertility. Despite the significant healthcare burden posedby uterine fibroids and their negative impact on the quality of life of many women, theetiology and pathogenesis of the disease are not well understood. This gap in knowledgehas likely been the major reason that effective, long-term and fertility-sparing clinicalmanagement of the disease has been elusive.
Int. J. Mol. Sci. 2021, 22, 3618. https://doi.org/10.3390/ijms22073618 https://www.mdpi.com/journal/ijms
Int. J. Mol. Sci. 2021, 22, 3618 2 of 16
Uterine fibroids can be divided into two major subtypes based on genetic alterations.Genome wide exome sequencing showed that between 50–70% of fibroids, dependingon patient ethnicity and fibroid number, contained mutations primarily in the secondexon of the Mediator Complex subunit 12 (MED12) gene [7]. These are the MED12mtfibroid subtype. Chromosomal rearrangements at 12q14–15 near the HMGA2 gene, whichresult in HMGA2 overexpression, have been observed in 8–35% of fibroids and representthe HMGA2hi subtype [8,9]. HMGA2 is thought to be an oncogene that is not normallyexpressed in differentiated adult tissues [10]. Together, the MED12mt and HMGA2hi fibroidsubtypes represent the genetic alterations found in the vast majority of fibroids.
Transcriptomic analysis of fibroids has been used to understand their pathogenesisand has helped with the discovery of several dysregulated genes in the tissue [11,12].However, to our knowledge most fibroid studies have compared fibroid tissues with thematched ‘normal’ myometrial tissues from the same hysterectomy, and little is known aboutthe transcriptomic profile of adjacent myometrium and how it is influenced by the fibroid–the so-called field effect [13]. Myometrial tissue collected from the same resected uterusas fibroids has been considered healthy tissue since its histology appears normal, underthe assumption that histological normalcy implies biological normalcy [14]. Althoughthe pairwise study design of fibroids versus matched myometrium has proven valuableto detect differences between the tumor and the adjacent tissue [15], we hypothesizethat, even if myometrial tissues from fibroid patients appear histologically normal, thetranscriptomic profile or phenotype of the tissue is different from non-fibroid/non-diseasedmyometrium. If indeed the matched myometrium is likely not entirely normal, comparingthese matched tissues could miss important genes involved in the pathogenesis or earlyetiology of the disease. For example, gene expression differences have been observed inhistologically normal breast epithelium of breast cancer patients when compared to that ofcancer-free patients [16]. Moreover, the adjacent tissue of different cancer tumors presenteda unique intermediate state between healthy and tumor [14]. To test our hypothesis,we compared the transcriptome of myometrial samples from non-fibroid patients, withsamples from fibroids with the most common fibroid subtype, MED12mt [17], and theirmatching “normal” myometrium and showed that, although the two tissues are clearlymore alike than not when compared to fibroid tissues, there is a distinct phenotype for each.
2. Results2.1. Myometrial Samples from Fibroid Patients Differentially Express Fibroid-Associated Genes
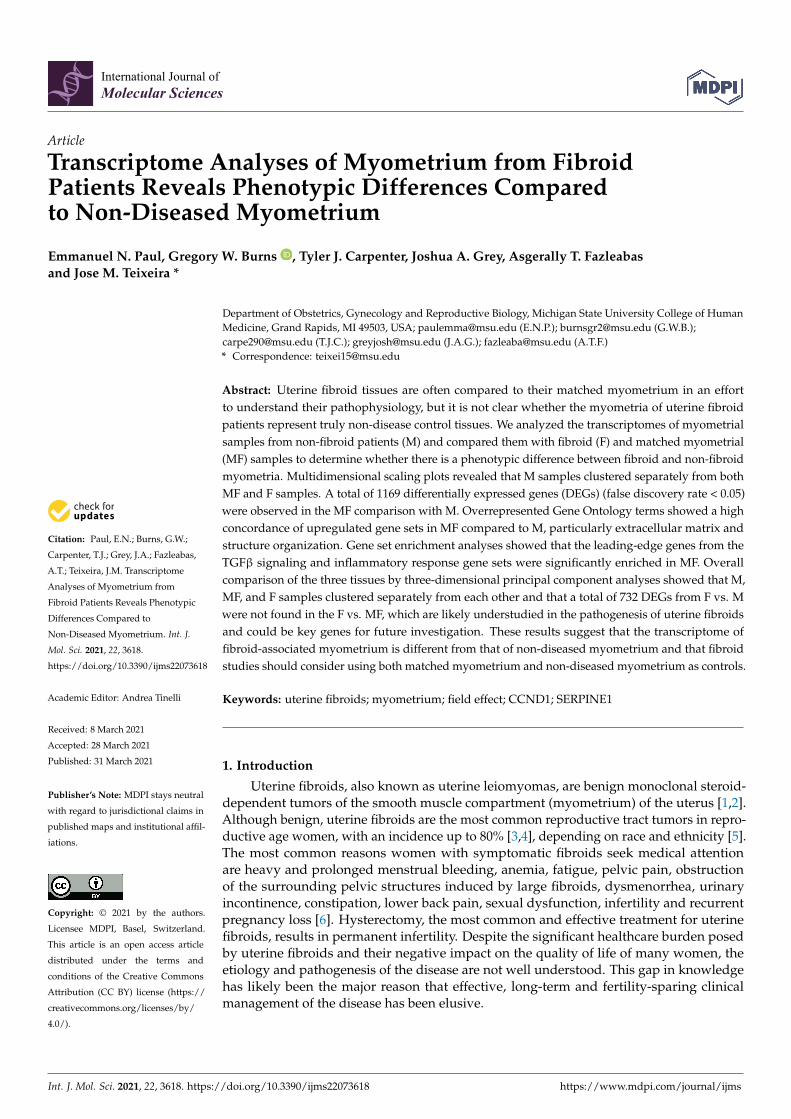
To determine whether the transcriptomic profiles of tissue samples from myometriaof non-fibroid patients (M) and from myometria of MED12mt fibroid patients (MF), arecomparable and/or distinct from each other and uterine fibroids, we performed RNA-seqanalysis of tissue samples from M (n = 6), MF (n = 6) and MED12-mutant fibroids (F)(n = 6). Multidimensional scaling (MDS) plots were generated to visualize the pairwisedifferences between samples of MF vs. M (Figure 1A). The MDS plot of MF vs. M showedthat the MF samples were separated from the M samples by principal component (PC)1, indicating gene expression differences between the MF and M groups. A total of 1169genes were differentially expressed (DE) with a false discovery rate (FDR) < 0.05, including464 decreased and 705 increased, in the MF comparison with M (Supplementary file 1).A heatmap, performed by unsupervised hierarchical clustering of the top 500 DE genes(DEGs) between the samples, confirmed that samples grouped by tissue type (Figure 1B). Avolcano plot was used to visualize the distribution of DEGs (Figure 1C). Genes of interestinvolved in tumor progression or uterine fibroids, from previous studies, FGFR1 [18],CCND1 [19], PCDH11X [20], VDR [21], NDRG2 [22] and INPP4B [23], are indicated in thevolcano plot. NDRG2 and INPP4B are significantly downregulated in MF compared to Mwith a log2 fold change (FC) of −0.5 and −0.6, respectively. FGFR1, CCND1, PCDH11X,and VDR are significantly upregulated in MF compared to M, with a log2FC of 0.7, 1.4, 1.7and 1.4, respectively. These results support downregulation of tumor suppressor genes and
Int. J. Mol. Sci. 2021, 22, 3618 3 of 16
upregulation of pro-tumoral genes within the myometria of MED12mt fibroids, comparedto non-fibroid myometria.
Int. J. Mol. Sci. 2021, 22, x FOR PEER REVIEW 3 of 17
with a log2 fold change (FC) of −0.5 and −0.6, respectively. FGFR1, CCND1, PCDH11X, and VDR are significantly upregulated in MF compared to M, with a log2FC of 0.7, 1.4, 1.7 and 1.4, respectively. These results support downregulation of tumor suppressor genes and upregulation of pro-tumoral genes within the myometria of MED12mt fibroids, compared to non-fibroid myometria.
Figure 1. Comparison of transcriptome profiles of myometrial samples from non-fibroid patients (M) with myometrial (MF) and fibroid (F) samples from fibroid patients. (A) Multidimension scaling (MDS) plot of RNA-seq results from non-fibroid myometrial samples compared with samples from fibroid-bearing myometria. Each label represents one sample. Myometrial samples from non-fibroid patients (M) are shown with black letters (n = 6) and myometrial samples from fibroid patients (MF) are shown with red letters (n = 6). (B) Heatmap of the top 500 differentially expressed genes (DEGs)
Figure 1. Comparison of transcriptome profiles of myometrial samples from non-fibroid patients (M) with myometrial(MF) and fibroid (F) samples from fibroid patients. (A) Multidimension scaling (MDS) plot of RNA-seq results fromnon-fibroid myometrial samples compared with samples from fibroid-bearing myometria. Each label represents one sample.Myometrial samples from non-fibroid patients (M) are shown with black letters (n = 6) and myometrial samples from fibroidpatients (MF) are shown with red letters (n = 6). (B) Heatmap of the top 500 differentially expressed genes (DEGs) fromthe MF vs. M comparison with unsupervised hierarchical clustering of genes and samples (n = 6/group). (C) Volcanoplot showing up (n= 705) and downregulated genes (n = 464) with a false discovery rate (FDR) p-value < 0.05 in MF vs.M depicted as red dots. (D) MDS plot of RNA-seq results from non-fibroid myometrial samples compared with fibroidsamples. Each label represents one sample. Myometrial samples from non-fibroid patients (M) are shown with black letters(n = 6) and fibroid samples (F) are shown with red letters (n = 6). (E) Heatmap of the top 500 DEGs from the M vs. Fcomparison with unsupervised hierarchical clustering of genes and samples (n = 6/group). (F) Volcano plot showing up(n = 1736) and downregulated genes (n = 1323) with FDR p-value < 0.05 in M vs. F depicted as red dots. Color gradientrepresents gene expression as log2(CPM + 1) in B and E.
We also compared transcriptomic profiles of F vs. M. The MDS plot shows distinctgrouping by tissue type (Figure 1D), with M samples being more separate from the Fsamples by PC 1 compared to the MF samples (Figure 1A), as indicated by the X axis.This relationship was confirmed by a larger difference in gene expression between F andM compared to MF and M tissue types. Overall, 3059 DEGs were found between F vs.M, with 1323 downregulated genes and 1736 upregulated genes (Supplementary File 2).A heatmap showing unsupervised hierarchical clustering of the top 500 DEGs showed
Int. J. Mol. Sci. 2021, 22, 3618 4 of 16
greater gene expression fold changes in F vs. M (Figure 1E) when compared to the MF vs.M heatmap (Figure 1B). A higher number of DEGs with a fold change >2 (1613 total genes)was observed in the F vs. M comparison (Figure 1F) compared to the MF vs. M comparison(494 total genes, Figure 1C) as illustrated by the volcano plots. Additionally, the log2FCof the DEGs of interest described above were greater in the F comparison. NDRG2 andINPP4B were downregulated with a log2FC of−1.3 and−1.2, respectively. FGFR1, CCND1,PCDH11X, and VDR were upregulated with a log2FC of 1.2, 2.9, 5.4 and 2.7, respectively.
2.2. Myometrial Samples from Fibroid Patients Are Enriched for Multiple Gene Sets That May BeInvolved in the Development of the Disease
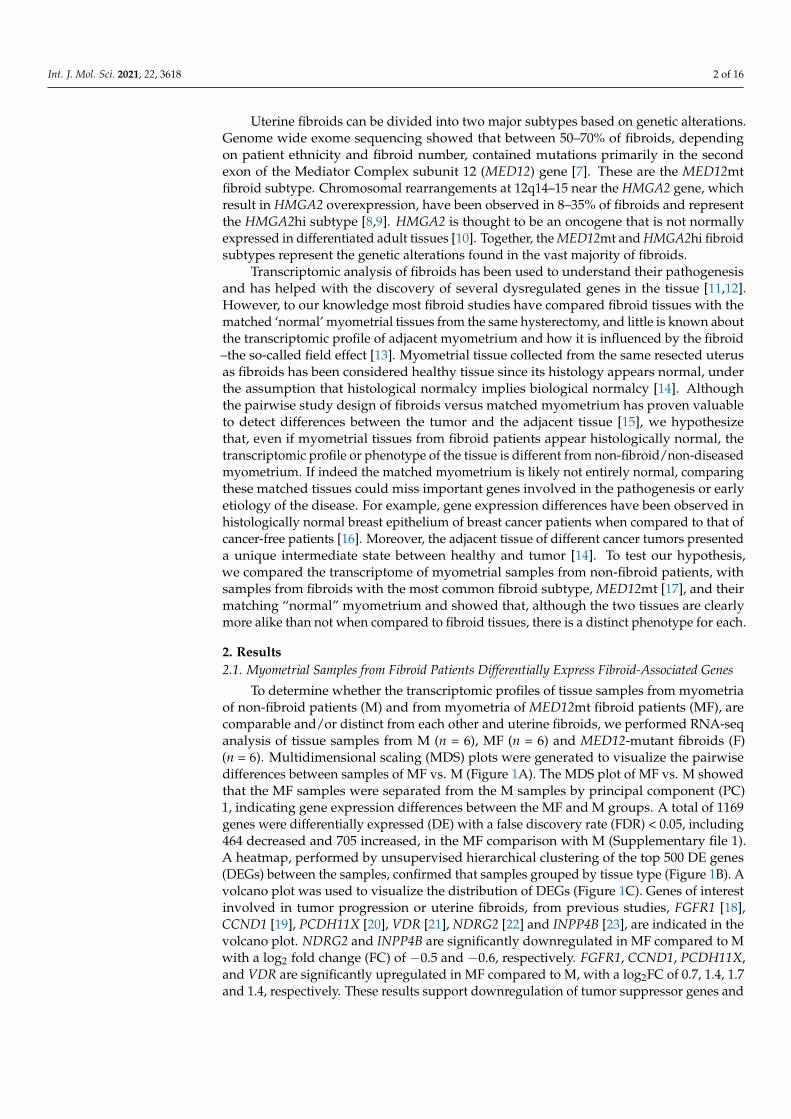
To determine whether the DEGs discovered above affect the myometrial phenotype,we analyzed the top enriched Hallmark-curated gene sets [24] when comparing MF vs.M and F vs. M by gene set enrichment analysis (GSEA). A total of 20 gene sets with asignificant adjusted p-value < 0.05 were enriched and activated in MF vs. M (Figure 2A).Notably, these included TGFβ signaling and multiple inflammatory Hallmark gene setsassociated with tumorigenesis. In addition, when plotting the leading-edge genes fromthe TGFβ signaling and inflammatory response gene sets, a network plot [25] showedSERPINE1, which was highly upregulated in MF compared to M (Figure 1E), connectedboth of the Hallmark gene sets (Figure 2B). There were 13 significantly enriched Hallmarkgene sets by GSEA when F was compared to M (Figure 2C), which is fewer than the 20observed when comparing MF vs. M.
Int. J. Mol. Sci. 2021, 22, x FOR PEER REVIEW 5 of 17
Figure 2. Gene set enrichment analysis (GSEA) of myometrial samples from non-fibroid patients (M) compared with my-ometrial samples from fibroid patients (MF) and with fibroids (F). (A) Top significantly enriched gene sets from the MF vs. M by GSEA using Hallmark biological processes in MSigDB. (B) Cnetplot of TGFβ signaling and inflammatory re-sponse processes enriched gene sets in MF vs. M. SERPINE1 was in each set and is shown here connecting the two nodes. Fold change and number of genes in each node are indicated by the color gradient and circle size, respectively. (C) Signif-icantly enriched gene sets (F vs. M) from GSEA using Hallmark biological processes in MSigDB. Gene count and signifi-cance level are shown by the size and color of each circle, respectively, in A and C.
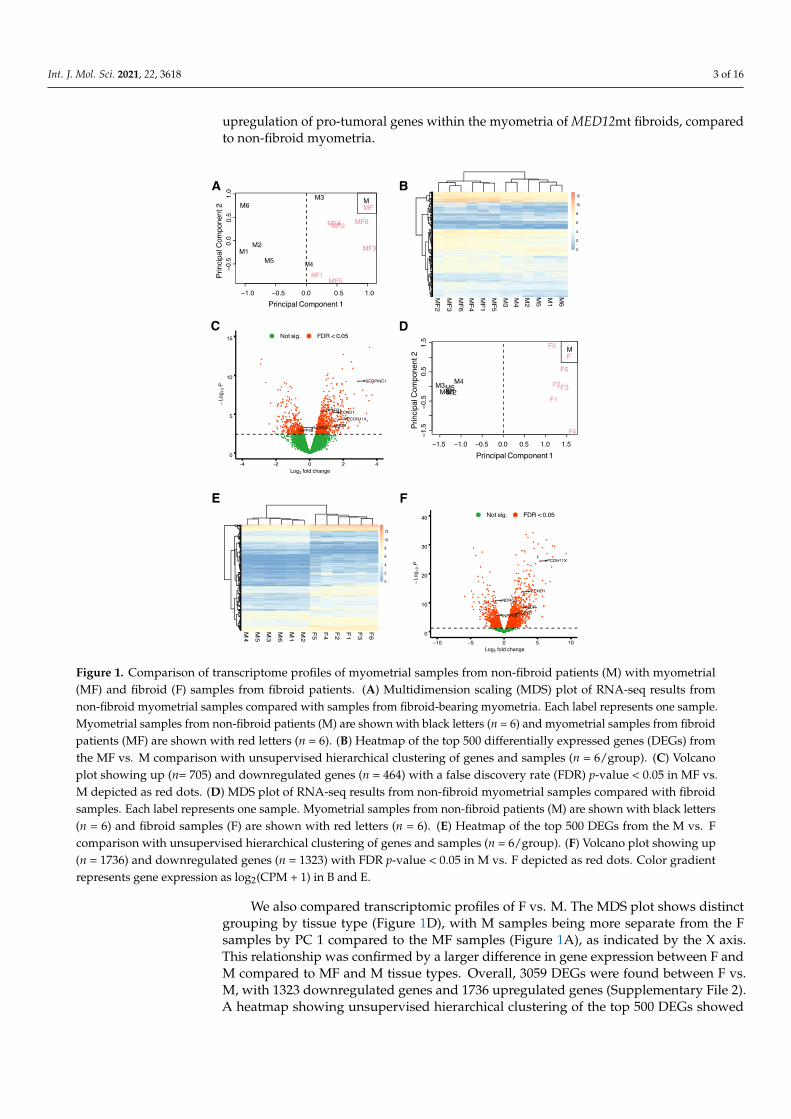
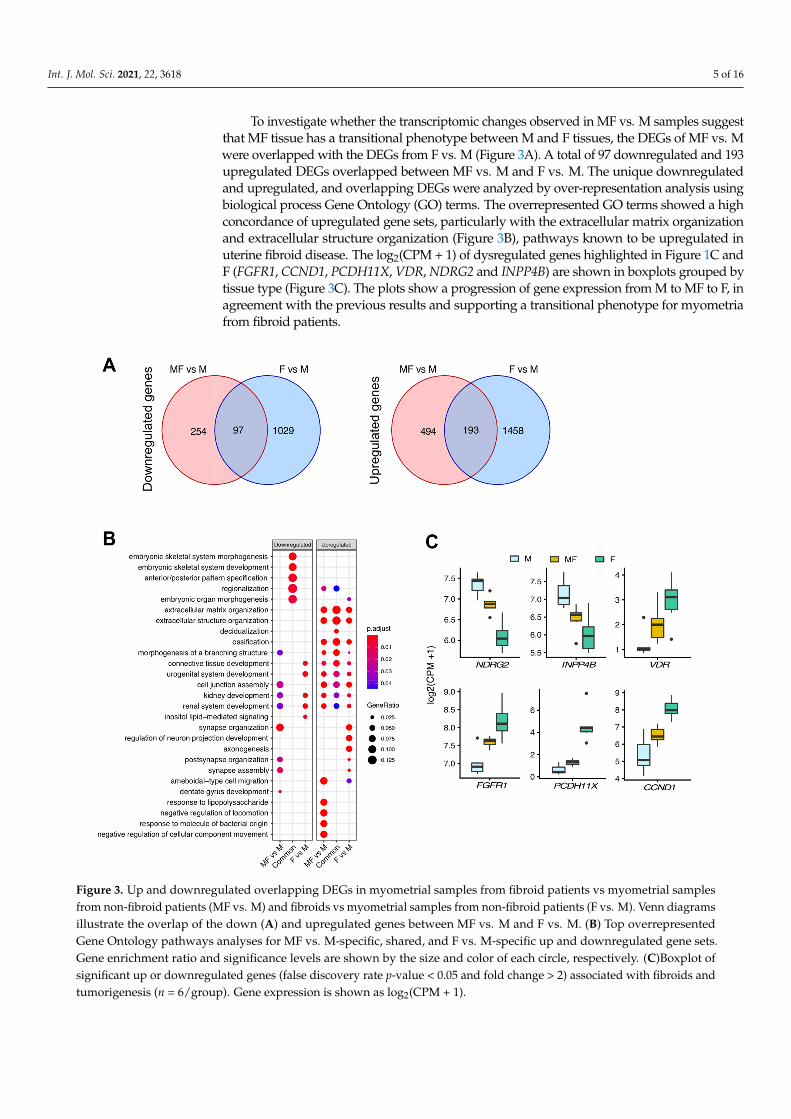
To investigate whether the transcriptomic changes observed in MF vs. M samples suggest that MF tissue has a transitional phenotype between M and F tissues, the DEGs of MF vs. M were overlapped with the DEGs from F vs. M (Figure 3A). A total of 97 down-regulated and 193 upregulated DEGs overlapped between MF vs. M and F vs. M. The unique downregulated and upregulated, and overlapping DEGs were analyzed by over-representation analysis using biological process Gene Ontology (GO) terms. The overrepresented GO terms showed a high concordance of upregulated gene sets, particu-larly with the extracellular matrix organization and extracellular structure organization (Figure 3B), pathways known to be upregulated in uterine fibroid disease. The log2(CPM + 1) of dysregulated genes highlighted in Figure 1C and F (FGFR1, CCND1, PCDH11X, VDR, NDRG2 and INPP4B) are shown in boxplots grouped by tissue type (Figure 3C). The plots show a progression of gene expression from M to MF to F, in agreement with the previous results and supporting a transitional phenotype for myometria from fibroid pa-tients.
Figure 2. Gene set enrichment analysis (GSEA) of myometrial samples from non-fibroid patients (M) compared withmyometrial samples from fibroid patients (MF) and with fibroids (F). (A) Top significantly enriched gene sets from the MFvs. M by GSEA using Hallmark biological processes in MSigDB. (B) Cnetplot of TGFβ signaling and inflammatory responseprocesses enriched gene sets in MF vs. M. SERPINE1 was in each set and is shown here connecting the two nodes. Foldchange and number of genes in each node are indicated by the color gradient and circle size, respectively. (C) Significantlyenriched gene sets (F vs. M) from GSEA using Hallmark biological processes in MSigDB. Gene count and significance levelare shown by the size and color of each circle, respectively, in A and C.
Int. J. Mol. Sci. 2021, 22, 3618 5 of 16
To investigate whether the transcriptomic changes observed in MF vs. M samples suggestthat MF tissue has a transitional phenotype between M and F tissues, the DEGs of MF vs. Mwere overlapped with the DEGs from F vs. M (Figure 3A). A total of 97 downregulated and 193upregulated DEGs overlapped between MF vs. M and F vs. M. The unique downregulatedand upregulated, and overlapping DEGs were analyzed by over-representation analysis usingbiological process Gene Ontology (GO) terms. The overrepresented GO terms showed a highconcordance of upregulated gene sets, particularly with the extracellular matrix organizationand extracellular structure organization (Figure 3B), pathways known to be upregulated inuterine fibroid disease. The log2(CPM + 1) of dysregulated genes highlighted in Figure 1C andF (FGFR1, CCND1, PCDH11X, VDR, NDRG2 and INPP4B) are shown in boxplots grouped bytissue type (Figure 3C). The plots show a progression of gene expression from M to MF to F, inagreement with the previous results and supporting a transitional phenotype for myometriafrom fibroid patients.
Int. J. Mol. Sci. 2021, 22, x FOR PEER REVIEW 6 of 17
Figure 3. Up and downregulated overlapping DEGs in myometrial samples from fibroid patients vs myometrial samples from non-fibroid patients (MF vs. M) and fibroids vs myometrial samples from non-fibroid patients (F vs. M). Venn dia-grams illustrate the overlap of the down (A) and upregulated genes between MF vs. M and F vs. M. (B) Top overrepre-sented Gene Ontology pathways analyses for MF vs. M-specific, shared, and F vs. M-specific up and downregulated gene sets. Gene enrichment ratio and significance levels are shown by the size and color of each circle, respectively. (C)Boxplot of significant up or downregulated genes (false discovery rate p-value < 0.05 and fold change > 2) associated with fibroids and tumorigenesis (n = 6/group). Gene expression is shown as log2(CPM + 1).
2.3. Overall Comparison of Myometrial Samples from Non-Fibroid Patients (M), Myometrial Samples from Fibroid Patients (MF), and Fibroids Samples (F).
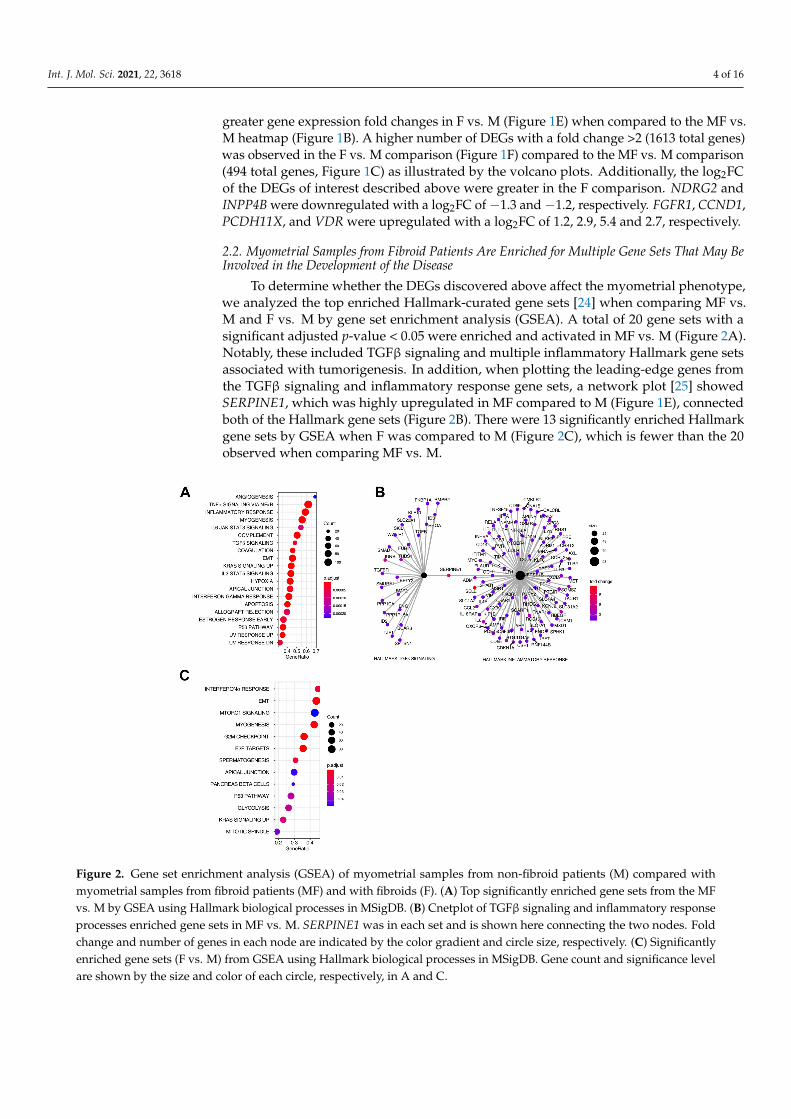
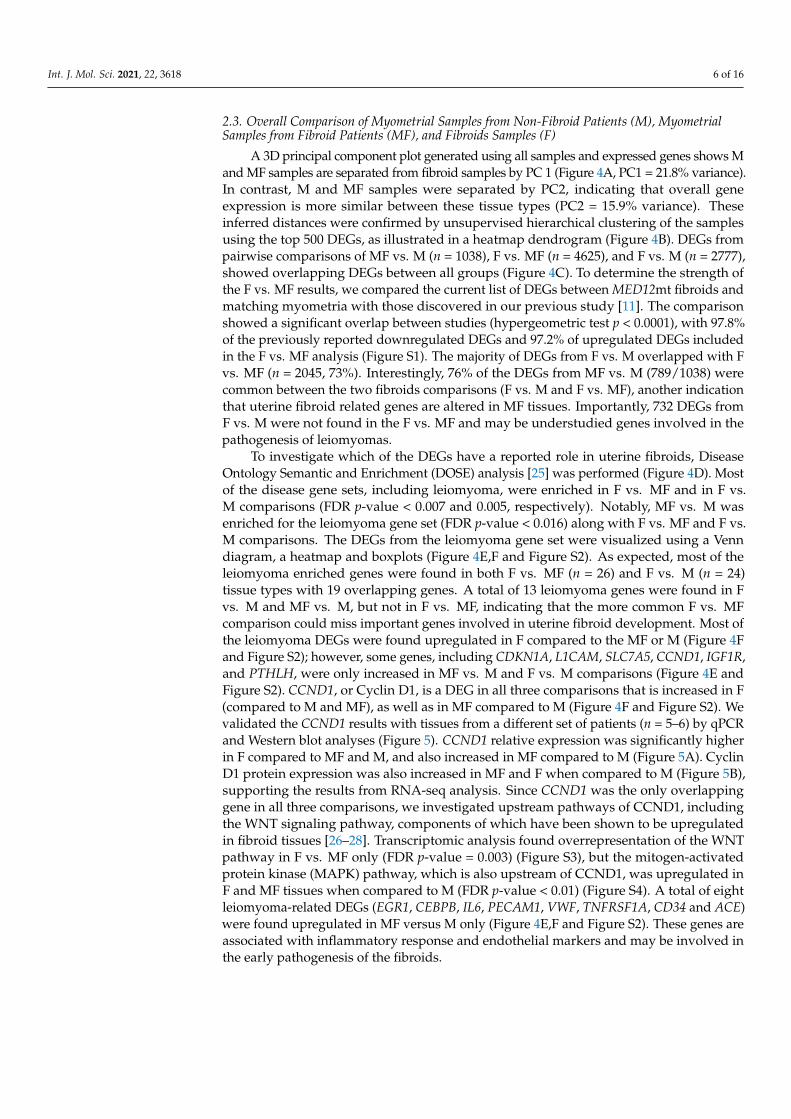
A 3D principal component plot generated using all samples and expressed genes shows M and MF samples are separated from fibroid samples by PC 1 (Figure 4A, PC1 = 21.8% variance). In contrast, M and MF samples were separated by PC2, indicating that overall gene expression is more similar between these tissue types (PC2 = 15.9% variance). These inferred distances were confirmed by unsupervised hierarchical clustering of the samples using the top 500 DEGs, as illustrated in a heatmap dendrogram (Figure 4B). DEGs from pairwise comparisons of MF vs. M (n = 1038), F vs. MF (n = 4625), and F vs. M (n = 2777), showed overlapping DEGs between all groups (Figure 4C). To determine the strength of the F vs. MF results, we compared the current list of DEGs between MED12mt fibroids and matching myometria with those discovered in our previous study [11]. The comparison showed a significant overlap between studies (hypergeometric test p <
Figure 3. Up and downregulated overlapping DEGs in myometrial samples from fibroid patients vs myometrial samplesfrom non-fibroid patients (MF vs. M) and fibroids vs myometrial samples from non-fibroid patients (F vs. M). Venn diagramsillustrate the overlap of the down (A) and upregulated genes between MF vs. M and F vs. M. (B) Top overrepresentedGene Ontology pathways analyses for MF vs. M-specific, shared, and F vs. M-specific up and downregulated gene sets.Gene enrichment ratio and significance levels are shown by the size and color of each circle, respectively. (C)Boxplot ofsignificant up or downregulated genes (false discovery rate p-value < 0.05 and fold change > 2) associated with fibroids andtumorigenesis (n = 6/group). Gene expression is shown as log2(CPM + 1).
Int. J. Mol. Sci. 2021, 22, 3618 6 of 16
2.3. Overall Comparison of Myometrial Samples from Non-Fibroid Patients (M), MyometrialSamples from Fibroid Patients (MF), and Fibroids Samples (F)
A 3D principal component plot generated using all samples and expressed genes shows Mand MF samples are separated from fibroid samples by PC 1 (Figure 4A, PC1 = 21.8% variance).In contrast, M and MF samples were separated by PC2, indicating that overall geneexpression is more similar between these tissue types (PC2 = 15.9% variance). Theseinferred distances were confirmed by unsupervised hierarchical clustering of the samplesusing the top 500 DEGs, as illustrated in a heatmap dendrogram (Figure 4B). DEGs frompairwise comparisons of MF vs. M (n = 1038), F vs. MF (n = 4625), and F vs. M (n = 2777),showed overlapping DEGs between all groups (Figure 4C). To determine the strength ofthe F vs. MF results, we compared the current list of DEGs between MED12mt fibroids andmatching myometria with those discovered in our previous study [11]. The comparisonshowed a significant overlap between studies (hypergeometric test p < 0.0001), with 97.8%of the previously reported downregulated DEGs and 97.2% of upregulated DEGs includedin the F vs. MF analysis (Figure S1). The majority of DEGs from F vs. M overlapped with Fvs. MF (n = 2045, 73%). Interestingly, 76% of the DEGs from MF vs. M (789/1038) werecommon between the two fibroids comparisons (F vs. M and F vs. MF), another indicationthat uterine fibroid related genes are altered in MF tissues. Importantly, 732 DEGs fromF vs. M were not found in the F vs. MF and may be understudied genes involved in thepathogenesis of leiomyomas.
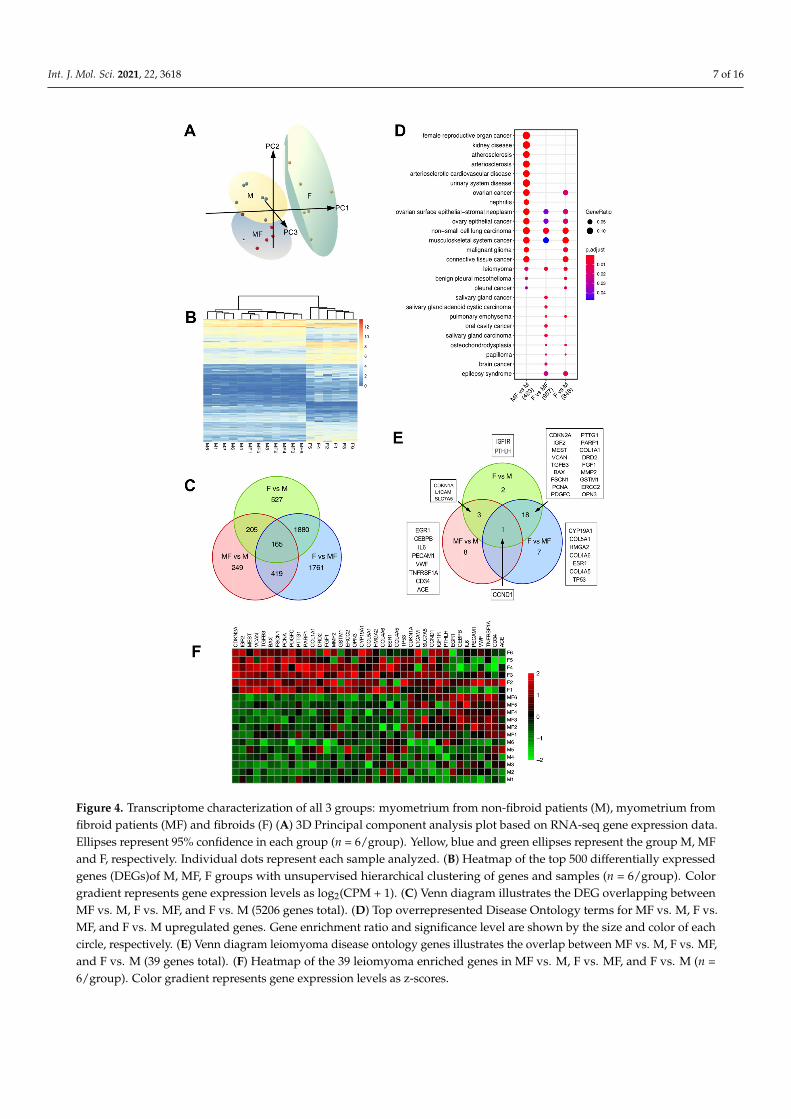
To investigate which of the DEGs have a reported role in uterine fibroids, DiseaseOntology Semantic and Enrichment (DOSE) analysis [25] was performed (Figure 4D). Mostof the disease gene sets, including leiomyoma, were enriched in F vs. MF and in F vs.M comparisons (FDR p-value < 0.007 and 0.005, respectively). Notably, MF vs. M wasenriched for the leiomyoma gene set (FDR p-value < 0.016) along with F vs. MF and F vs.M comparisons. The DEGs from the leiomyoma gene set were visualized using a Venndiagram, a heatmap and boxplots (Figure 4E,F and Figure S2). As expected, most of theleiomyoma enriched genes were found in both F vs. MF (n = 26) and F vs. M (n = 24)tissue types with 19 overlapping genes. A total of 13 leiomyoma genes were found in Fvs. M and MF vs. M, but not in F vs. MF, indicating that the more common F vs. MFcomparison could miss important genes involved in uterine fibroid development. Most ofthe leiomyoma DEGs were found upregulated in F compared to the MF or M (Figure 4Fand Figure S2); however, some genes, including CDKN1A, L1CAM, SLC7A5, CCND1, IGF1R,and PTHLH, were only increased in MF vs. M and F vs. M comparisons (Figure 4E andFigure S2). CCND1, or Cyclin D1, is a DEG in all three comparisons that is increased in F(compared to M and MF), as well as in MF compared to M (Figure 4F and Figure S2). Wevalidated the CCND1 results with tissues from a different set of patients (n = 5–6) by qPCRand Western blot analyses (Figure 5). CCND1 relative expression was significantly higherin F compared to MF and M, and also increased in MF compared to M (Figure 5A). CyclinD1 protein expression was also increased in MF and F when compared to M (Figure 5B),supporting the results from RNA-seq analysis. Since CCND1 was the only overlappinggene in all three comparisons, we investigated upstream pathways of CCND1, includingthe WNT signaling pathway, components of which have been shown to be upregulatedin fibroid tissues [26–28]. Transcriptomic analysis found overrepresentation of the WNTpathway in F vs. MF only (FDR p-value = 0.003) (Figure S3), but the mitogen-activatedprotein kinase (MAPK) pathway, which is also upstream of CCND1, was upregulated inF and MF tissues when compared to M (FDR p-value < 0.01) (Figure S4). A total of eightleiomyoma-related DEGs (EGR1, CEBPB, IL6, PECAM1, VWF, TNFRSF1A, CD34 and ACE)were found upregulated in MF versus M only (Figure 4E,F and Figure S2). These genes areassociated with inflammatory response and endothelial markers and may be involved inthe early pathogenesis of the fibroids.
Int. J. Mol. Sci. 2021, 22, 3618 7 of 16Int. J. Mol. Sci. 2021, 22, x FOR PEER REVIEW 8 of 17
Figure 4. Transcriptome characterization of all 3 groups: myometrium from non-fibroid patients (M), myometrium from fi-broid patients (MF) and fibroids (F) (A) 3D Principal component analysis plot based on RNA-seq gene expression data. Ellip-ses represent 95% confidence in each group (n = 6/group). Yellow, blue and green ellipses represent the group M, MF and F, respectively. Individual dots represent each sample analyzed. (B) Heatmap of the top 500 differentially expressed genes (DEGs)of M, MF, F groups with unsupervised hierarchical clustering of genes and samples (n = 6/group). Color gradient rep-resents gene expression levels as log2(CPM + 1). (C) Venn diagram illustrates the DEG overlapping between MF vs. M, F vs. MF, and F vs. M (5206 genes total). (D) Top overrepresented Disease Ontology terms for MF vs. M, F vs. MF, and F vs. M up-regulated genes. Gene enrichment ratio and significance level are shown by the size and color of each circle, respectively. (E) Venn diagram leiomyoma disease ontology genes illustrates the overlap between MF vs. M, F vs. MF, and F vs. M (39 genes total). (F) Heatmap of the 39 leiomyoma enriched genes in MF vs. M, F vs. MF, and F vs. M (n = 6/group). Color gradient rep-resents gene expression levels as z-scores.
Figure 4. Transcriptome characterization of all 3 groups: myometrium from non-fibroid patients (M), myometrium fromfibroid patients (MF) and fibroids (F) (A) 3D Principal component analysis plot based on RNA-seq gene expression data.Ellipses represent 95% confidence in each group (n = 6/group). Yellow, blue and green ellipses represent the group M, MFand F, respectively. Individual dots represent each sample analyzed. (B) Heatmap of the top 500 differentially expressedgenes (DEGs)of M, MF, F groups with unsupervised hierarchical clustering of genes and samples (n = 6/group). Colorgradient represents gene expression levels as log2(CPM + 1). (C) Venn diagram illustrates the DEG overlapping betweenMF vs. M, F vs. MF, and F vs. M (5206 genes total). (D) Top overrepresented Disease Ontology terms for MF vs. M, F vs.MF, and F vs. M upregulated genes. Gene enrichment ratio and significance level are shown by the size and color of eachcircle, respectively. (E) Venn diagram leiomyoma disease ontology genes illustrates the overlap between MF vs. M, F vs. MF,and F vs. M (39 genes total). (F) Heatmap of the 39 leiomyoma enriched genes in MF vs. M, F vs. MF, and F vs. M (n =6/group). Color gradient represents gene expression levels as z-scores.
Int. J. Mol. Sci. 2021, 22, 3618 8 of 16Int. J. Mol. Sci. 2021, 22, x FOR PEER REVIEW 9 of 17
Figure 5. CCND1 gene and protein expression in myometria from non-fibroid patient (M), fibroid (F) and matching myome-tria (MF). (A) Relative expression of CCND1 by qRT-PCR compared with the RPL17 housekeeping gene in M, MF and F (n = 5–6/group), * p-value = 0.01. (B) Representative western blot and quantification of the relative protein expression of CCND1 normalized to TUBB in M, MF and F tissues (n = 6/group), * p-value = 0.01.
2.4. Leiomyoma Gene List Involved in Early Pathogenesis and Establish Disease Fibroid studies are commonly designed to compare fibroids to matching patient my-
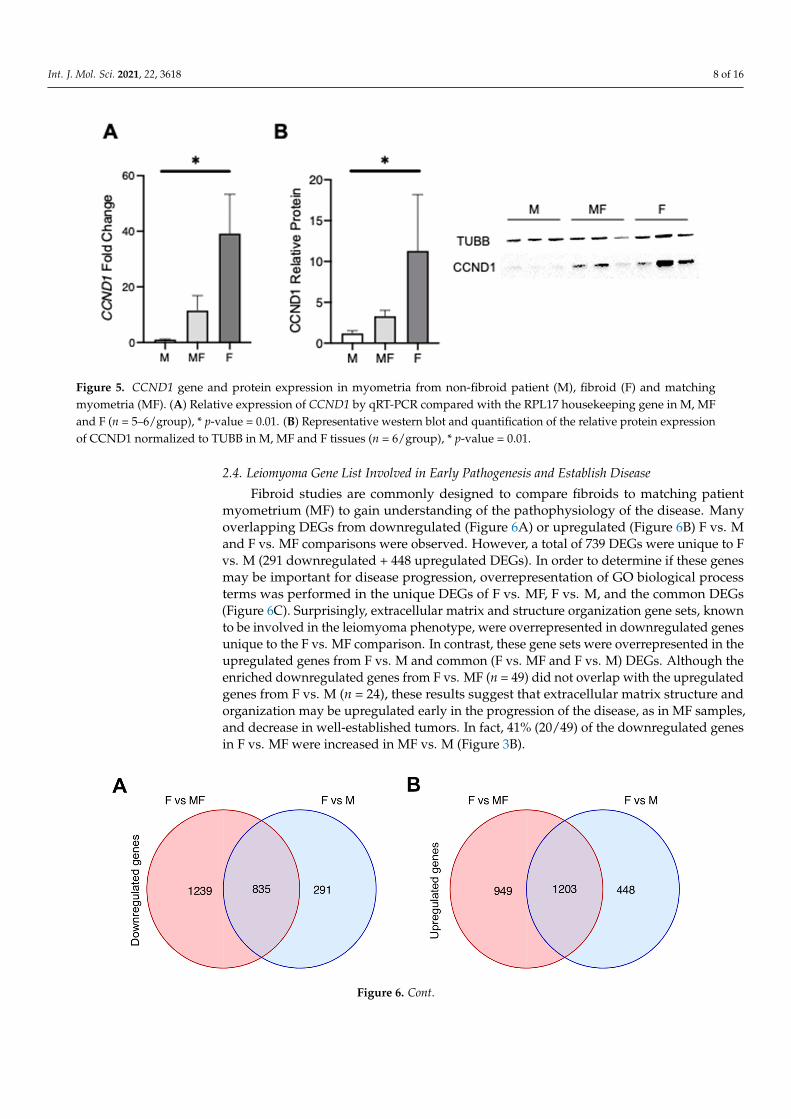
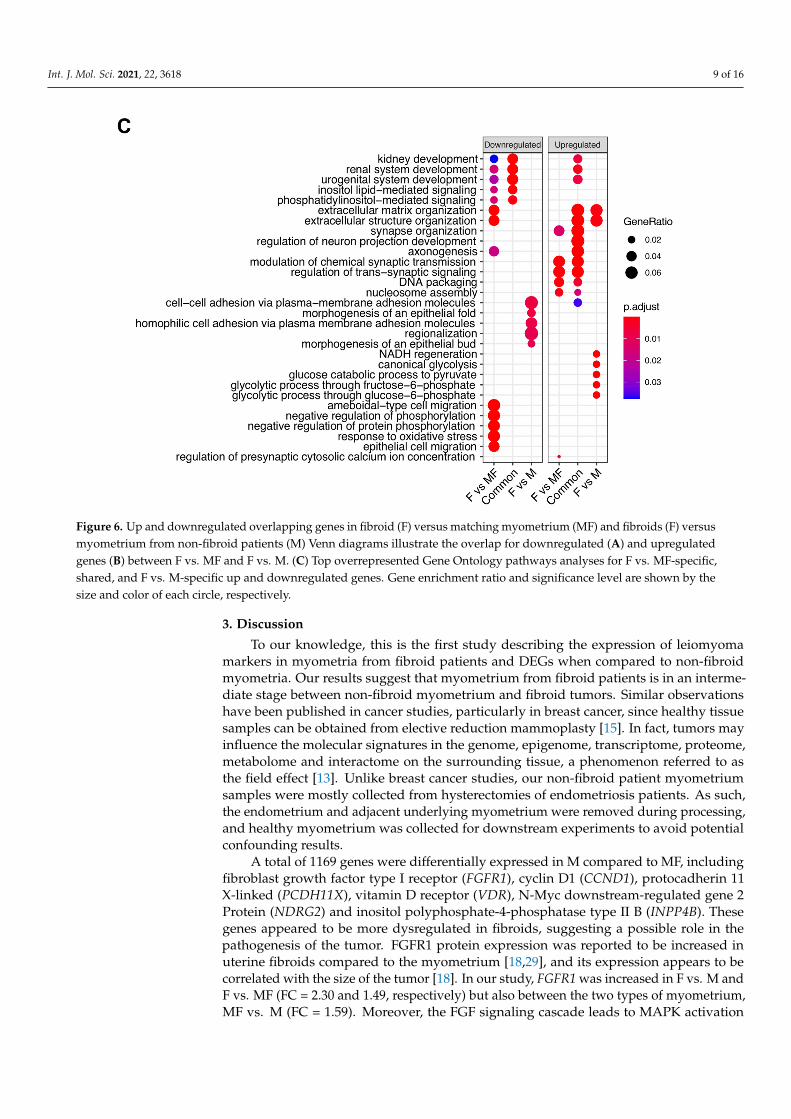
ometrium (MF) to gain understanding of the pathophysiology of the disease. Many over-lapping DEGs from downregulated (Figure 6A) or upregulated (Figure 6B) F vs. M and F vs. MF comparisons were observed. However, a total of 739 DEGs were unique to F vs. M (291 downregulated + 448 upregulated DEGs). In order to determine if these genes may be important for disease progression, overrepresentation of GO biological process terms was performed in the unique DEGs of F vs. MF, F vs. M, and the common DEGs (Figure 6C). Surprisingly, extracellular matrix and structure organization gene sets, known to be involved in the leiomyoma phenotype, were overrepresented in downregulated genes unique to the F vs. MF comparison. In contrast, these gene sets were overrepresented in the upregulated genes from F vs. M and common (F vs. MF and F vs. M) DEGs. Although the enriched downregulated genes from F vs. MF (n = 49) did not overlap with the upreg-ulated genes from F vs. M (n = 24), these results suggest that extracellular matrix structure and organization may be upregulated early in the progression of the disease, as in MF samples, and decrease in well-established tumors. In fact, 41% (20/49) of the downregu-lated genes in F vs. MF were increased in MF vs. M (Figure 3B).
Figure 5. CCND1 gene and protein expression in myometria from non-fibroid patient (M), fibroid (F) and matchingmyometria (MF). (A) Relative expression of CCND1 by qRT-PCR compared with the RPL17 housekeeping gene in M, MFand F (n = 5–6/group), * p-value = 0.01. (B) Representative western blot and quantification of the relative protein expressionof CCND1 normalized to TUBB in M, MF and F tissues (n = 6/group), * p-value = 0.01.
2.4. Leiomyoma Gene List Involved in Early Pathogenesis and Establish Disease
Fibroid studies are commonly designed to compare fibroids to matching patientmyometrium (MF) to gain understanding of the pathophysiology of the disease. Manyoverlapping DEGs from downregulated (Figure 6A) or upregulated (Figure 6B) F vs. Mand F vs. MF comparisons were observed. However, a total of 739 DEGs were unique to Fvs. M (291 downregulated + 448 upregulated DEGs). In order to determine if these genesmay be important for disease progression, overrepresentation of GO biological processterms was performed in the unique DEGs of F vs. MF, F vs. M, and the common DEGs(Figure 6C). Surprisingly, extracellular matrix and structure organization gene sets, knownto be involved in the leiomyoma phenotype, were overrepresented in downregulated genesunique to the F vs. MF comparison. In contrast, these gene sets were overrepresented in theupregulated genes from F vs. M and common (F vs. MF and F vs. M) DEGs. Although theenriched downregulated genes from F vs. MF (n = 49) did not overlap with the upregulatedgenes from F vs. M (n = 24), these results suggest that extracellular matrix structure andorganization may be upregulated early in the progression of the disease, as in MF samples,and decrease in well-established tumors. In fact, 41% (20/49) of the downregulated genesin F vs. MF were increased in MF vs. M (Figure 3B).
Int. J. Mol. Sci. 2021, 22, x FOR PEER REVIEW 10 of 17
Figure 6. Up and downregulated overlapping genes in fibroid (F) versus matching myometrium (MF) and fibroids (F) versus myometrium from non-fibroid patients (M) Venn diagrams illustrate the overlap for downregulated (A) and up-regulated genes (B) between F vs. MF and F vs. M. (C) Top overrepresented Gene Ontology pathways analyses for F vs. MF-specific, shared, and F vs. M-specific up and downregulated genes. Gene enrichment ratio and significance level are shown by the size and color of each circle, respectively.
3. Discussion To our knowledge, this is the first study describing the expression of leiomyoma
markers in myometria from fibroid patients and DEGs when compared to non-fibroid myometria. Our results suggest that myometrium from fibroid patients is in an interme-diate stage between non-fibroid myometrium and fibroid tumors. Similar observations have been published in cancer studies, particularly in breast cancer, since healthy tissue samples can be obtained from elective reduction mammoplasty [15]. In fact, tumors may influence the molecular signatures in the genome, epigenome, transcriptome, proteome, metabolome and interactome on the surrounding tissue, a phenomenon referred to as the field effect [13]. Unlike breast cancer studies, our non-fibroid patient myometrium sam-ples were mostly collected from hysterectomies of endometriosis patients. As such, the
Figure 6. Cont.
Int. J. Mol. Sci. 2021, 22, 3618 9 of 16
Int. J. Mol. Sci. 2021, 22, x FOR PEER REVIEW 10 of 17
Figure 6. Up and downregulated overlapping genes in fibroid (F) versus matching myometrium (MF) and fibroids (F) versus myometrium from non-fibroid patients (M) Venn diagrams illustrate the overlap for downregulated (A) and up-regulated genes (B) between F vs. MF and F vs. M. (C) Top overrepresented Gene Ontology pathways analyses for F vs. MF-specific, shared, and F vs. M-specific up and downregulated genes. Gene enrichment ratio and significance level are shown by the size and color of each circle, respectively.
3. Discussion To our knowledge, this is the first study describing the expression of leiomyoma
markers in myometria from fibroid patients and DEGs when compared to non-fibroid myometria. Our results suggest that myometrium from fibroid patients is in an interme-diate stage between non-fibroid myometrium and fibroid tumors. Similar observations have been published in cancer studies, particularly in breast cancer, since healthy tissue samples can be obtained from elective reduction mammoplasty [15]. In fact, tumors may influence the molecular signatures in the genome, epigenome, transcriptome, proteome, metabolome and interactome on the surrounding tissue, a phenomenon referred to as the field effect [13]. Unlike breast cancer studies, our non-fibroid patient myometrium sam-ples were mostly collected from hysterectomies of endometriosis patients. As such, the
Figure 6. Up and downregulated overlapping genes in fibroid (F) versus matching myometrium (MF) and fibroids (F) versusmyometrium from non-fibroid patients (M) Venn diagrams illustrate the overlap for downregulated (A) and upregulatedgenes (B) between F vs. MF and F vs. M. (C) Top overrepresented Gene Ontology pathways analyses for F vs. MF-specific,shared, and F vs. M-specific up and downregulated genes. Gene enrichment ratio and significance level are shown by thesize and color of each circle, respectively.
3. Discussion
To our knowledge, this is the first study describing the expression of leiomyomamarkers in myometria from fibroid patients and DEGs when compared to non-fibroidmyometria. Our results suggest that myometrium from fibroid patients is in an interme-diate stage between non-fibroid myometrium and fibroid tumors. Similar observationshave been published in cancer studies, particularly in breast cancer, since healthy tissuesamples can be obtained from elective reduction mammoplasty [15]. In fact, tumors mayinfluence the molecular signatures in the genome, epigenome, transcriptome, proteome,metabolome and interactome on the surrounding tissue, a phenomenon referred to asthe field effect [13]. Unlike breast cancer studies, our non-fibroid patient myometriumsamples were mostly collected from hysterectomies of endometriosis patients. As such,the endometrium and adjacent underlying myometrium were removed during processing,and healthy myometrium was collected for downstream experiments to avoid potentialconfounding results.
A total of 1169 genes were differentially expressed in M compared to MF, includingfibroblast growth factor type I receptor (FGFR1), cyclin D1 (CCND1), protocadherin 11X-linked (PCDH11X), vitamin D receptor (VDR), N-Myc downstream-regulated gene 2Protein (NDRG2) and inositol polyphosphate-4-phosphatase type II B (INPP4B). Thesegenes appeared to be more dysregulated in fibroids, suggesting a possible role in thepathogenesis of the tumor. FGFR1 protein expression was reported to be increased inuterine fibroids compared to the myometrium [18,29], and its expression appears to becorrelated with the size of the tumor [18]. In our study, FGFR1 was increased in F vs. M andF vs. MF (FC = 2.30 and 1.49, respectively) but also between the two types of myometrium,MF vs. M (FC = 1.59). Moreover, the FGF signaling cascade leads to MAPK activation
Int. J. Mol. Sci. 2021, 22, 3618 10 of 16
and increased extracellular matrix organization, pathways enriched in the fibroids andmyometrium from fibroid patients in our GO analysis. This gene could be involved inthe pathogenesis of the leiomyoma disease. Indeed, the FGF family, including FGFR1,are known to be involved in tumorigenesis [18,30]. Moreover, FGFR1 upregulation hasbeen associated with overexpression of CCND1 [31]. CCND1, an important regulator ofcell cycle progression and proliferation, is known to drive tumorigenesis [32] and wasalso found upregulated in uterine fibroids [33,34]. We believe that CCND1 plays a centralrole in disease progression since it was the only overlapping DEG found increased inall three comparisons (MF vs. M, F vs. M, and F vs. MF). CCDN1 is also a β-catenintarget gene, a transcriptional factor whose expression has been shown to be upregulatedin fibroids [26–28], and constitutive expression of an active form of β-catenin in mouseMullerian duct mesenchyme induces fibroid-like fibrosis as the mice age [35]. Our pathwayanalysis showed an overrepresentation of WNT pathway in F vs. MF only, suggesting thatthis pathway may be dysregulated during late stages of the disease and does not likelyplay a role in CCND1 over-expression of MF tissues. The MAPK pathway, also upstreamof CCND1, was up regulated in MF and F, indicating a possible role in CCND1 mRNAexpression. The MAPK pathway has been previously reported to play a role in the growthof uterine fibroids [29] and should be investigated further to improve our understandingthe pathogenesis of the disease. Even though, mRNA expression by qPCR or Western blotonly showed an increase in F compared to M but not in MF vs. M or F vs. MF, targetingCCND1 in early disease may offer a useful avenue for therapeutic treatments. Indeed,it has been recently found that microRNA 93 (miR-93) blocks cell cycle progression andpromotes apoptosis in uterine fibroid cells by targeting CCND1 mRNA [36].
PCDH11X, an X-linked protocadherin gene involved in segmental development, wasfound upregulated in F vs. M and MF vs. M. The role of PCDH11X in leiomyomas isunclear, but hypomethylation of this gene has been reported in fibroids compared to theadjacent myometrium [20], which could lead to its overexpression. Surprisingly, VDRwas found upregulated in F, and also in MF compared to M in our study. Since AfricanAmerican women are at higher risk for both developing symptomatic uterine fibroids andvitamin D deficiency, several studies have focused on the role of vitamin D in fibroidsand have noted that vitamin D deficiency could be an important risk factor for uterinefibroids [37–42]. A recent report showed that combination therapy of Relugolix and vitaminD improves outcomes for women with uterine fibroid symptoms, which could lead to fewerhysterectomies for women with clinically significant fibroids [43]. Many of these studiesshowed that expression of VDR is lower in fibroids. In agreement with our results, VDRwas upregulated in the center of the fibroids [21] and also found upregulated in MED12mtfibroids in our previous study [11]. Clearly, the roles of VDR and vitamin D, itself, in fibroidbiology need further investigation to account for these discrepancies. Furthermore, onecannot rule out posttranslational mechanisms for VDR activation and response to vitaminD [42]. NDRG2 and INPP4B are tumor suppressor genes that were downregulated in MFvs. M and lower in F vs. MF. Their role in uterine fibroids is currently unknown, but maybe relevant since they were both differentially expressed in MF compare to M. Furtherinvestigation is needed to determine a role for tumor suppressors in the transformation ofnormal myometrium into fibroids.
Several gene sets, including TGF-β and inflammatory response, known to be upregu-lated in fibroids, were found enriched in MF compared to M, suggesting that MF presentssome fibroid-like transcriptomic signatures [44,45]. Network pathway analysis identifiedSERPINE1, which is highly upregulated in MF compared to M (fold change 7.26, FDR = 6× 10⁻⁷), as a leading-edge gene involved in both pathways. Conversely, SERPINE1 wasdownregulated in F vs. MF (fold change −3.75, FDR = 5 × 10⁻⁸), in agreement with aprevious study comparing fibroids to matching myometrium [46]. SERPINE1 may have arole in the establishment of the disease. Indeed, SERPINE1 has been reported to be involvedin angiogenesis, observed as enriched in MF tissues compared to M, and tumorigenesis [47].Based on this, SERPINE1 expression in the myometrium could be used for early diagnosis
Int. J. Mol. Sci. 2021, 22, 3618 11 of 16
of the disease and as a therapeutic target. Surprisingly, few classically associated fibroidpathways were enriched in the F vs. M comparison. The GSEA method relies on generank; thus, the lack of enrichment may be due to dysregulation of the fibroid transcriptome.Alternatively, this suggests that MF samples may not be the most appropriate controlto identify dysregulated pathways in uterine fibroids. A list of 739 genes that were notincluded in the F vs. MF DEGs, but found in the F vs. M comparison (Figure 6), maycontain key genes for future investigations.
As expected, F and MF tissues were enriched for fibroid gene sets. Indeed, therewere 12 genes from the Disease Ontology Leiomyoma gene set that were increased in MFsamples compared to M. This result is in agreement with the analysis indicating that MFsamples differentially expressed some fibroid-like genes and could, therefore, representa transition between M and F. We also noted that the list of dysregulated genes from theLeiomyoma gene set was incomplete when comparing fibroids to matching myometrium.In fact, 13 genes were not identified in the F vs. MF comparison, but were found in F vs. Mand MF vs. M. Eight genes were found only in MF vs. M, suggesting that these gene maycontribute to the disease establishment. Cancer studies have reported that tumor-adjacenttissue is not ‘normal’ tissue and, instead, represented a unique intermediate betweenhealthy and tumor states [14]. One limitation of our study is the possible effect of patientsomatic mutations on the gene expression. In cancer, most somatic mutations are likely tobe passenger mutations; however, some mutations were found to be correlated with geneexpression changes and operative in human cancer [48]. We have previously reported thatthe exomic mutational landscape of fibroids is relatively low compared to cancer [11], butfurther investigation will have to be done to determine if somatic mutations outside theexome could be correlated with the gene expression changes found in our study.
Another limitation of our study could involve variation in hormonal response of the fe-male reproductive tract leading to a shift in RNA expression. The endometrium, in particu-lar, is dynamically responsive to ovarian steroid hormones [49]. However, the myometriumis considered a mostly quiescent tissue, except during pregnancy, and transcriptome re-sponses to steroid hormones during the menstrual cycle may be low. Epidermal growthfactor receptor mRNA was shown to be upregulated in proliferative phase myometrium,suggesting some transcriptional response during the menstrual cycle [50]. Overall, thetranscriptional response of the myometrium to cycling ovarian steroid hormones remainslargely unknown. The present study used samples from both proliferative and secretoryphases, as determined by a pathologist, and are randomly distributed in the tissue groups.Although this design should prevent an effect of cycle on the results, phase-matched tissuesshould be considered for future studies.
In conclusion, the present study demonstrates that the transcriptome of the my-ometrium from fibroid patients differs from non-fibroid myometrium and expresses fibroid-associated markers, suggesting that the myometrium from fibroid patients may be a tran-sition state between the non-fibroid myometrium and the fibroid tumors. These resultsalso support the hypothesis that myometrium from fibroid patients expresses early signsof fibroid disease that may be useful as therapeutic and diagnostic targets.
4. Materials and Methods4.1. Sample Collection
The use of human tissue specimens was approved by the Spectrum Health SystemsInstitutional Review Board (MSU IRB Study ID: STUDY00002244, SR IRB #2017-198) assecondary use of biobank materials. Myometrial samples from non-fibroid patients (M),and samples from fibroids (F) and matched myometria (MF) were obtained following totalhysterectomy from pre-menopausal (aged 34–50), self-identified Caucasian and AfricanAmerican women. No fibroids were detected by ultrasound prior to surgery in the non-fibroid patients. All patients who participated to the study gave consent to donate tissue forthis study through the Spectrum Health Biorepository. Tissues were washed with phosphate-buffered saline, dissected, and chopped into smaller pieces (4–9 mm2), some of which were
Int. J. Mol. Sci. 2021, 22, 3618 12 of 16
immersed in RNAlater (Sigma, Saint Louis, MO) and stored at 4 ◦C for qPCR and RNA-seqanalyses. For long-term storage, samples were placed at −20 ◦C after an overnight incuba-tion in RNAlater. The remaining tissue pieces were immediately flash frozen and storedat −80 ◦C for subsequent protein isolation or other experiments. MED12 mutation in thefibroids was determined by PCR amplification followed by Sanger sequencing using primers5′-CTTCGGGATCTTGAGCTACG-3′ and 5′-GGAGGGTTCCGTGTAGAACA-3′ for Exon1,primers 5′-GCTGGGAATCCTAGTGACCA-3′ and 5′-GGCAAACTCAGCCACTTAGG-3′ tar-geting Exon 2. MED12 cDNA was amplified using primers 5′-CTTCGGGATCTTGAGCTACG-3′ and 5′-AAGCTGACGTTCTTGGCACT-3′ spanning Exon 1 and Exon 2.
4.2. RNA Isolation
Total RNA was isolated from frozen tissues stored in RNAlater. Tissues were ho-mogenized in TRIzol reagent (Thermo Fisher Scientific, Fairlawn, NJ, USA) and RNA wasisolated following the manufacturer’s instructions. Isolated RNA was stored at −80 ◦Cin nuclease-free water. Nanodrop 1000 spectrophotometer (Thermo Fisher Scientific, Fair-lawn, NJ, USA) and Agilent 2100 Bioanalyzer (Agilent Technologies, Santa Clara, CA,USA) instruments were used to measure RNA concentration and quality, according tothe manufacturers’ protocols. RNA integrity values of ≥7.5 were required for furtherprocessing.
4.3. Library Preparation and Sequencing
High quality RNA samples (n = 6/group) were submitted to the Van Andel ResearchInstitute (VARI) Genomics Core for library preparation and paired-end (2 × 75 bp) RNA-sequencing on an Illumina NextSeq 500 instrument (Illumina Inc., San Diego, CA, USA).Libraries were prepared using a Kapa RNA HyperPrep kit with ribosomal reduction,pooled, and sequenced on flowcells to yield approximately 50–60 million reads/sample.Reads were trimmed for quality and adapters using TrimGalore (version 0.6.5) [51] andquality trimmed reads were assessed with FastQC (version 0.11.7). Trimmed reads weremapped to Homo sapiens (human) genome assembly GRCh38 (hg38) using STAR (ver-sion 2.6.1c) [52]. Reads overlapping Ensembl annotations (version 99) were quantifiedwith STAR prior to model-based differential expression (DE) analysis using the edgeR-robust method [52]. Genes with low counts per million (CPM) were removed using thefilterByExpr function from edgeR.
4.4. RNA-Seq Analyses
A scatterplot of the first two principal components was constructed with the plotMDSfunction of edgeR to verify sample separation prior to statistical testing. A 3D principalcomponent plot was generated for all three groups using the pca3D package (version0.10.2). Genes were considered differentially expressed if their respective edgeR-robustfalse discovery rates (FDR) corrected p-values were less than 0.05. Differential expressionwas calculated by comparing MF versus M, F versus M, or F versus MF. Differentiallyexpressed genes (DEGs) were visualized with volcano plots and heatmaps generatedusing the EnhancedVolcano (version 1.8.0) and pheatmap (version 1.0.12) packages in R.Raw FASTQ files were deposited in the NCBI Gene Expression Omnibus (GSE169255).Downstream analyses of RNA-seq results were completed using the clusterProfiler (version3.16.1) [53] package in R with an FDR p-value cutoff of 0.05. Gene set enrichment analyseswere conducted with all expressed genes using the 50 Hallmark gene sets collection (H) [24]downloaded from the Molecular Signatures Database (MSigDB) [54,55]. Disease Ontology(DO) gene sets were used to identify over-represented diseases from DEGs with the DOSE Rpackage (version 2.3.5) [25]. Kyoto Encyclopedia of Genes and Genomes (KEGG) pathwayof WNT (hsa04310) and MAPK pathways (hsa04010) were generated using pathview(version 1.28.1). Gene Ontology (GO) GSEA was used to find biological process (BP) downor upregulated between comparisons. The top enriched GSEA terms were shown in thefigures. Venn diagrams were constructed to visualize overlapping genes between groups
Int. J. Mol. Sci. 2021, 22, 3618 13 of 16
or gene sets using the venn package (version 1.9). The function category netplot function(cnetplot) from ClusterProiler was used to associate identified GO BPs with genes that maybelong to multiple annotation categories.
4.5. Quantitative Real Time PCR
cDNA was synthesized using the SuperScript IV Reverse Transcriptase kit (Invitrogen,Carlsbad, CA, USA) with 1 µg of the total RNA input for confirmation of the RNA-seqresults. Quantitative Real time PCR (qRT-PCR) analysis using SYBRGreen (BioRad, Her-cules, CA, USA) was performed to determine relative gene expression using the ViiA7 qRT-PCR System (Applied Biosystems, Foster City, CA, USA). RPL17 was used as areference gene for data normalization. Primer sequences used for qRT-PCR (5′-3′) wereas follows; RPL17 forward (ACGAAAAGCCACGAAGTATCTG), RPL17 reverse (GAC-CTTGTGTCCAGCCCCAT), CCND1 forward (AGCTCCTGTGCTGCGAAGTGGAAAC),CCND1 reverse (AGTGTTCAATGAAATCGTGCGGGGT).
4.6. Western Blot
Proteins were extracted from flash frozen tissues, using RIPA lysis buffer containing aprotease inhibitor cocktail (0.1 ug/mL each pepstatin A, chymostatin, antipain A, leupeptin,1 ug/mL, aprotinin, and 0.1 mM phenylmethylsulfonyl fluoride). Equal amounts oftotal protein (25 µg) were resolved via 4–12% (wt/vol) polyacrylamide, Bis-Tris gradientgels (Thermo Fisher Scientific, Fairlawn, NJ, USA) and transferred onto nitrocellulosemembranes. Membranes were blocked with 5% (wt/vol) nonfat dry milk for 1 h at roomtemperature (RT) and incubated overnight at 4 ◦C with 0.2 µg/mL anti-CCND1 (RB-9041-P1; Thermo Scientific, Fairlawn, NJ, USA) in 5% BSA. Immunoreactive proteins werevisualized on ChemiDoc (Bio-Rad, Hercules, CA, USA) following incubation with pre-adsorbed Fab fragments of horseradish peroxidase-linked antirabbit secondary antibodies(1:10,000; Jackson Immunoresearch, West Grove, PA, USA) for 1 h at RT, developed withECL reagent (Cytiva, Marlborough, MA, USA). β-tubulin (TUBB, 1:5000 in 5% nonfat drymilk for 1 h at RT; T5201; Sigma, Saint Louis, MO, USA) was used as a loading control. Theband intensity was quantified using Image lab (Version 5.1, Bio-Rad), and normalized tocorresponding β- tubulin bands.
4.7. Statistical Analyses
Bioinformatic statistics were performed using the listed packages in R (version 4.0.4).Differentially expressed genes were identified as those having an FDR corrected p-value <0.05. Data with unequal variances were log transformed, and homogeneity of variancesverified before completion of analyses. The Benjamini–Hochberg procedure was used tocontrol FDR for gene ontology (GO) enrichment analyses. Gene expression was measuredin triplicate by qRT-PCR, fold-changes were calculated by the ∆∆Ct method, and analyzedwith Prism (version 9.0.2, GraphPad, San Diego, CA, USA).
Supplementary Materials: The following are available online at https://www.mdpi.com/article/10.3390/ijms22073618/s1, Figure S1: Comparison with JW George et al. 2019 DEGs, Figure S2:Boxplots of genes overlapping with the leiomyoma disease ontology shown in Figure 4E, Figure S3:Visualization of KEGG WNT Signaling Pathway, Figure S4: Visualization of KEGG MAPK Pathway,Supplementary File 1: Differentially Expressed Genes of Myometrial Samples from Fibroid Patients vsMyometrial Samples from Non-Fibroid Patients and Supplementary File 2: Differentially ExpressedGenes of Fibroid Samples vs Myometrial Samples from Non-Fibroid Patients.
Author Contributions: Conceptualization, E.N.P. and J.M.T.; methodology, E.N.P. and J.M.T.; val-idation, E.N.P., T.J.C., and J.A.G.; formal analysis, E.N.P., J.M.T., G.W.B., and A.T.F.; investigation,E.N.P. and J.M.T.; writing—original draft preparation, E.N.P. and J.M.T.; writing—review and editing,E.N.P., G.W.B., T.J.C., J.A.G., A.T.F., and J.M.T.; funding acquisition, J.M.T. All authors have read andagreed to the published version of the manuscript.
Int. J. Mol. Sci. 2021, 22, 3618 14 of 16
Funding: This research was funded by Eunice Kennedy Shriver National Institute of Child Healthand Human Development (NIH R01HD096259) to J.M.T. G.W.B was supported by NIH T32HD087166and F32HD104478.
Institutional Review Board Statement: The study was conducted according to the guidelines of theDeclaration of Helsinki, and approved by the Spectrum Health Systems Institutional Review Board(MSU IRB Study ID: STUDY00002244, SR IRB #2017-198) as secondary use of biobank materials.
Informed Consent Statement: Informed consent was obtained from all subjects involved in the study.
Data Availability Statement: Raw FASTQ files were deposited in the NCBI Gene Expression Om-nibus (GSE169255).
Acknowledgments: We would like to thank the patients who consented for the study, the SpectrumHealth Systems Universal Biorepository staff, and the Van Andel Research Institute Genomics Corefor their help with the study.
Conflicts of Interest: The authors declare no conflict of interest.
References1. Moravek, M.B.; Bulun, S.E. Endocrinology of uterine fibroids: Steroid hormones, stem cells, and genetic contribution. Curr. Opin.
Obstet. Gynecol. 2015, 27, 276–283. [CrossRef]2. Commandeur, A.E.; Styer, A.K.; Teixeira, J.M. Epidemiological and genetic clues for molecular mechanisms involved in uterine
leiomyoma development and growth. Hum. Reprod. Update 2015, 21, 593–615. [CrossRef] [PubMed]3. McWilliams, M.M.; Chennathukuzhi, V.M. Recent Advances in Uterine Fibroid Etiology. Semin. Reprod. Med. 2017, 35, 181–189.
[CrossRef] [PubMed]4. De La Cruz, M.S.; Buchanan, E.M. Uterine Fibroids: Diagnosis and Treatment. Am. Fam. Physician 2017, 95, 100–107. [PubMed]5. Marsh, E.E.; Ekpo, G.E.; Cardozo, E.R.; Brocks, M.; Dune, T.; Cohen, L.S. Racial differences in fibroid prevalence and ultrasound
findings in asymptomatic young women (18–30 years old): A pilot study. Fertil. Steril. 2013, 99, 1951–1957. [CrossRef]6. Sohn, G.S.; Cho, S.; Kim, Y.M.; Cho, C.H.; Kim, M.R.; Lee, S.R.; Working Group of Society of Uterine Leiomyoma. Current medical
treatment of uterine fibroids. Obstet. Gynecol. Sci. 2018, 61, 192–201. [CrossRef]7. Makinen, N.; Mehine, M.; Tolvanen, J.; Kaasinen, E.; Li, Y.; Lehtonen, H.J.; Gentile, M.; Yan, J.; Enge, M.; Taipale, M.; et al. MED12,
the mediator complex subunit 12 gene, is mutated at high frequency in uterine leiomyomas. Science 2011, 334, 252–255. [CrossRef]8. Markowski, D.N.; Helmke, B.M.; Bartnitzke, S.; Loning, T.; Bullerdiek, J. Uterine fibroids: Do we deal with more than one disease?
Int. J. Gynecol. Pathol. 2014, 33, 568–572. [CrossRef] [PubMed]9. Mehine, M.; Makinen, N.; Heinonen, H.R.; Aaltonen, L.A.; Vahteristo, P. Genomics of uterine leiomyomas: Insights from
high-throughput sequencing. Fertil. Steril. 2014, 102, 621–629. [CrossRef]10. Lee, Y.S.; Dutta, A. The tumor suppressor microRNA let-7 represses the HMGA2 oncogene. Genes Dev. 2007, 21, 1025–1030.
[CrossRef]11. George, J.W.; Fan, H.; Johnson, B.; Carpenter, T.J.; Foy, K.K.; Chatterjee, A.; Patterson, A.L.; Koeman, J.; Adams, M.; Madaj, Z.B.;
et al. Integrated Epigenome, Exome, and Transcriptome Analyses Reveal Molecular Subtypes and Homeotic Transformation inUterine Fibroids. Cell Rep. 2019, 29, 4069–4085.e4066. [CrossRef]
12. Cirilo, P.D.; Marchi, F.A.; Barros Filho Mde, C.; Rocha, R.M.; Domingues, M.A.; Jurisica, I.; Pontes, A.; Rogatto, S.R. An integrativegenomic and transcriptomic analysis reveals potential targets associated with cell proliferation in uterine leiomyomas. PLoS ONE2013, 8, e57901. [CrossRef]
13. Lochhead, P.; Chan, A.T.; Nishihara, R.; Fuchs, C.S.; Beck, A.H.; Giovannucci, E.; Ogino, S. Etiologic field effect: Reappraisal ofthe field effect concept in cancer predisposition and progression. Mod. Pathol. 2015, 28, 14–29. [CrossRef]
14. Aran, D.; Camarda, R.; Odegaard, J.; Paik, H.; Oskotsky, B.; Krings, G.; Goga, A.; Sirota, M.; Butte, A.J. Comprehensive analysis ofnormal adjacent to tumor transcriptomes. Nat. Commun. 2017, 8, 1077. [CrossRef]
15. Graham, K.; de las Morenas, A.; Tripathi, A.; King, C.; Kavanah, M.; Mendez, J.; Stone, M.; Slama, J.; Miller, M.; Antoine, G.; et al.Gene expression in histologically normal epithelium from breast cancer patients and from cancer-free prophylactic mastectomypatients shares a similar profile. Br. J. Cancer 2010, 102, 1284–1293. [CrossRef]
16. Tripathi, A.; King, C.; de la Morenas, A.; Perry, V.K.; Burke, B.; Antoine, G.A.; Hirsch, E.F.; Kavanah, M.; Mendez, J.; Stone, M.;et al. Gene expression abnormalities in histologically normal breast epithelium of breast cancer patients. Int. J. Cancer 2008, 122,1557–1566. [CrossRef]
17. Lee, M.; Cheon, K.; Chae, B.; Hwang, H.; Kim, H.K.; Chung, Y.J.; Song, J.Y.; Cho, H.H.; Kim, J.H.; Kim, M.R. Analysis of MED12Mutation in Multiple Uterine Leiomyomas in South Korean patients. Int. J. Med. Sci. 2018, 15, 124–128. [CrossRef] [PubMed]
18. Wolanska, M.; Bankowski, E. Fibroblast growth factors (FGF) in human myometrium and uterine leiomyomas in various stagesof tumour growth. Biochimie 2006, 88, 141–146. [CrossRef] [PubMed]
19. Musgrove, E.A.; Caldon, C.E.; Barraclough, J.; Stone, A.; Sutherland, R.L. Cyclin D as a therapeutic target in cancer. Nat. Rev.Cancer 2011, 11, 558–572. [CrossRef] [PubMed]
Int. J. Mol. Sci. 2021, 22, 3618 15 of 16
20. Maekawa, R.; Yagi, S.; Ohgane, J.; Yamagata, Y.; Asada, H.; Tamura, I.; Sugino, N.; Shiota, K. Disease-dependent differentlymethylated regions (D-DMRs) of DNA are enriched on the X chromosome in uterine leiomyoma. J. Reprod. Dev. 2011, 57, 604–612.[CrossRef] [PubMed]
21. Feng, L.; Jayes, F.L.; Jung, S.H.; Leppert, P.C. Vitamin D receptor (VDR) is over-expressed in the center of uterine fibroids. Fertil.Steril. 2010, 94, S75. [CrossRef]
22. Hu, W.; Fan, C.; Jiang, P.; Ma, Z.; Yan, X.; Di, S.; Jiang, S.; Li, T.; Cheng, Y.; Yang, Y. Emerging role of N-myc downstream-regulatedgene 2 (NDRG2) in cancer. Oncotarget 2016, 7, 209–223. [CrossRef] [PubMed]
23. Gewinner, C.; Wang, Z.C.; Richardson, A.; Teruya-Feldstein, J.; Etemadmoghadam, D.; Bowtell, D.; Barretina, J.; Lin, W.M.;Rameh, L.; Salmena, L.; et al. Evidence that inositol polyphosphate 4-phosphatase type II is a tumor suppressor that inhibits PI3Ksignaling. Cancer Cell 2009, 16, 115–125. [CrossRef] [PubMed]
24. Liberzon, A.; Birger, C.; Thorvaldsdottir, H.; Ghandi, M.; Mesirov, J.P.; Tamayo, P. The Molecular Signatures Database (MSigDB)hallmark gene set collection. Cell Syst. 2015, 1, 417–425. [CrossRef] [PubMed]
25. Yu, G.; Wang, L.G.; Yan, G.R.; He, Q.Y. DOSE: An R/Bioconductor package for disease ontology semantic and enrichmentanalysis. Bioinformatics 2015, 31, 608–609. [CrossRef] [PubMed]
26. Tinelli, A.; Kosmas, I.P.; Mynbaev, O.A.; Malvasi, A.; Sparic, R.; Vergara, D. The Biological Impact of Ulipristal Acetate on CellularNetworks Regulating Uterine Leiomyoma Growth. Curr. Pharm. Des. 2020, 26, 310–317. [CrossRef]
27. Ono, M.; Yin, P.; Navarro, A.; Moravek, M.B.; Coon, J.S.T.; Druschitz, S.A.; Serna, V.A.; Qiang, W.; Brooks, D.C.; Malpani, S.S.;et al. Paracrine activation of WNT/beta-catenin pathway in uterine leiomyoma stem cells promotes tumor growth. Proc. Natl.Acad. Sci. USA 2013, 110, 17053–17058. [CrossRef]
28. Ko, Y.A.; Jamaluddin, M.F.B.; Adebayo, M.; Bajwa, P.; Scott, R.J.; Dharmarajan, A.M.; Nahar, P.; Tanwar, P.S. Extracellular matrix(ECM) activates beta-catenin signaling in uterine fibroids. Reproduction 2018, 155, 61–71. [CrossRef]
29. Yu, L.; Saile, K.; Swartz, C.D.; He, H.; Zheng, X.; Kissling, G.E.; Di, X.; Lucas, S.; Robboy, S.J.; Dixon, D. Differential expressionof receptor tyrosine kinases (RTKs) and IGF-I pathway activation in human uterine leiomyomas. Mol. Med. 2008, 14, 264–275.[CrossRef]
30. Acevedo, V.D.; Ittmann, M.; Spencer, D.M. Paths of FGFR-driven tumorigenesis. Cell Cycle 2009, 8, 580–588. [CrossRef]31. Tashiro, E.; Maruki, H.; Minato, Y.; Doki, Y.; Weinstein, I.B.; Imoto, M. Overexpression of cyclin D1 contributes to malignancy by
up-regulation of fibroblast growth factor receptor 1 via the pRB/E2F pathway. Cancer Res. 2003, 63, 424–431.32. Fu, M.; Wang, C.; Li, Z.; Sakamaki, T.; Pestell, R.G. Minireview: Cyclin D1: Normal and abnormal functions. Endocrinology 2004,
145, 5439–5447. [CrossRef] [PubMed]33. Kovacs, K.A.; Oszter, A.; Gocze, P.M.; Kornyei, J.L.; Szabo, I. Comparative analysis of cyclin D1 and oestrogen receptor (alpha
and beta) levels in human leiomyoma and adjacent myometrium. Mol. Hum. Reprod. 2001, 7, 1085–1091. [CrossRef] [PubMed]34. Wu, J.; Wang, Y.; Liu, J.; Chen, Q.; Pang, D.; Jiang, Y. Effects of FGFR1 Gene Polymorphisms on the Risk of Breast Cancer and
FGFR1 Protein Expression. Cell. Physiol. Biochem. 2018, 47, 2569–2578. [CrossRef]35. Tanwar, P.S.; Lee, H.J.; Zhang, L.; Zukerberg, L.R.; Taketo, M.M.; Rueda, B.R.; Teixeira, J.M. Constitutive activation of Beta-catenin
in uterine stroma and smooth muscle leads to the development of mesenchymal tumors in mice. Biol. Reprod. 2009, 81, 545–552.[CrossRef]
36. Zhang, D.; Liu, E.; Tian, W.; Zhang, Z.; Wang, L.; Li, J. MiR-93 blocks cell cycle progression and promotes apoptosis in uterineleiomyoma cells by targeting CCND1. Anat. Rec. 2020, 303, 2372–2381. [CrossRef]
37. Xu, F.; Li, F.; Li, L.; Lin, D.; Hu, H.; Shi, Q. Vitamin D as a risk factor for the presence of asymptomatic uterine fibroids inpremenopausal Han Chinese women. Fertil. Steril. 2021. [CrossRef]
38. Ciebiera, M.; Ali, M.; Zgliczynska, M.; Skrzypczak, M.; Al-Hendy, A. Vitamins and Uterine Fibroids: Current Data on Pathophysi-ology and Possible Clinical Relevance. Int. J. Mol. Sci. 2020, 21, 5528. [CrossRef]
39. Ali, M.; Shahin, S.M.; Sabri, N.A.; Al-Hendy, A.; Yang, Q. 1,25 Dihydroxyvitamin D3 Enhances the Antifibroid Effects of UlipristalAcetate in Human Uterine Fibroids. Reprod. Sci. 2019, 26, 812–828. [CrossRef]
40. Halder, S.; Al-Hendy, A. Hypovitaminosis D and high serum transforming growth factor beta-3: Important biomarkers for uterinefibroids risk. Fertil. Steril. 2016, 106, 1648–1649. [CrossRef] [PubMed]
41. Halder, S.K.; Osteen, K.G.; Al-Hendy, A. 1,25-dihydroxyvitamin d3 reduces extracellular matrix-associated protein expression inhuman uterine fibroid cells. Biol. Reprod. 2013, 89, 150. [CrossRef] [PubMed]
42. Vergara, D.; Catherino, W.H.; Trojano, G.; Tinelli, A. Vitamin D: Mechanism of Action and Biological Effects in Uterine Fibroids.Nutrients 2021, 13, 597. [CrossRef] [PubMed]
43. Al-Hendy, A.; Lukes, A.S.; Poindexter, A.N., 3rd; Venturella, R.; Villarroel, C.; Critchley, H.O.D.; Li, Y.; McKain, L.; Arjona Ferreira,J.C.; Langenberg, A.G.M.; et al. Treatment of Uterine Fibroid Symptoms with Relugolix Combination Therapy. N. Engl. J. Med.2021, 384, 630–642. [CrossRef]
44. Lee, B.S.; Nowak, R.A. Human leiomyoma smooth muscle cells show increased expression of transforming growth factor-beta3 (TGF beta 3) and altered responses to the antiproliferative effects of TGF beta. J. Clin. Endocrinol. Metab. 2001, 86, 913–920.[CrossRef]
45. Islam, M.S.; Akhtar, M.M.; Ciavattini, A.; Giannubilo, S.R.; Protic, O.; Janjusevic, M.; Procopio, A.D.; Segars, J.H.; Castellucci, M.;Ciarmela, P. Use of dietary phytochemicals to target inflammation, fibrosis, proliferation, and angiogenesis in uterine tissues:Promising options for prevention and treatment of uterine fibroids? Mol. Nutr. Food Res. 2014, 58, 1667–1684. [CrossRef]
Int. J. Mol. Sci. 2021, 22, 3618 16 of 16
46. Hoffman, P.J.; Milliken, D.B.; Gregg, L.C.; Davis, R.R.; Gregg, J.P. Molecular characterization of uterine fibroids and its implicationfor underlying mechanisms of pathogenesis. Fertil. Steril. 2004, 82, 639–649. [CrossRef]
47. Zhang, Q.; Lei, L.; Jing, D. Knockdown of SERPINE1 reverses resistance of triplenegative breast cancer to paclitaxel viasuppression of VEGFA. Oncol. Rep. 2020, 44, 1875–1884. [CrossRef]
48. Greenman, C.; Stephens, P.; Smith, R.; Dalgliesh, G.L.; Hunter, C.; Bignell, G.; Davies, H.; Teague, J.; Butler, A.; Stevens, C.; et al.Patterns of somatic mutation in human cancer genomes. Nature 2007, 446, 153–158. [CrossRef]
49. Sigurgeirsson, B.; Amark, H.; Jemt, A.; Ujvari, D.; Westgren, M.; Lundeberg, J.; Gidlof, S. Comprehensive RNA sequencing ofhealthy human endometrium at two time points of the menstrual cycle. Biol. Reprod. 2017, 96, 24–33. [CrossRef] [PubMed]
50. Heiner, J.S.; Cai, L.; Ding, H.; Rutgers, J.K. Myometrial expression of mRNA encoding epidermal growth factor receptor (EGFR)throughout the menstrual cycle. Am. J. Reprod. Immunol. 1994, 32, 152–156. [CrossRef] [PubMed]
51. Martin, M. Cutadapt removes adapter sequences from high-throughput sequencing reads. EMBnet J. 2011, 17, 10. [CrossRef]52. Zhou, X.; Lindsay, H.; Robinson, M.D. Robustly detecting differential expression in RNA sequencing data using observation
weights. Nucleic Acids Res. 2014, 42, e91. [CrossRef] [PubMed]53. Yu, G.; Wang, L.G.; Han, Y.; He, Q.Y. clusterProfiler: An R package for comparing biological themes among gene clusters. OMICS
2012, 16, 284–287. [CrossRef] [PubMed]54. Subramanian, A.; Tamayo, P.; Mootha, V.K.; Mukherjee, S.; Ebert, B.L.; Gillette, M.A.; Paulovich, A.; Pomeroy, S.L.; Golub, T.R.;
Lander, E.S.; et al. Gene set enrichment analysis: A knowledge-based approach for interpreting genome-wide expression profiles.Proc. Natl. Acad. Sci. USA 2005, 102, 15545–15550. [CrossRef] [PubMed]
55. Mootha, V.K.; Lindgren, C.M.; Eriksson, K.F.; Subramanian, A.; Sihag, S.; Lehar, J.; Puigserver, P.; Carlsson, E.; Ridderstrale, M.;Laurila, E.; et al. PGC-1alpha-responsive genes involved in oxidative phosphorylation are coordinately downregulated in humandiabetes. Nat. Genet. 2003, 34, 267–273. [CrossRef]
Related Documents