Trans-Pacific Partnership Agreement: Likely Impact on the U.S. Economy and on Specific Industry Sectors May 2016 Publication Number: 4607 Investigation Number: TPA-105-001

Welcome message from author
This document is posted to help you gain knowledge. Please leave a comment to let me know what you think about it! Share it to your friends and learn new things together.
Transcript
Trans-Pacific Partnership Agreement: Likely Impact on the U.S. Economy and on Specific Industry Sectors
May 2016
Publication Number: 4607
Investigation Number: TPA-105-001
Plan for the presentation
• Brief overview of the Agreement and the analytical framework
• Presentation of economic model results
• Highlights of TPP effects by industry
– Food and agricultural industries
– Manufacturing, natural resources and energy
– Services
2

Overview of TPP and the analysis
• Largest U.S. trade agreement: 12 countries accounting for 36% of global GDP
• Comprehensive agreement covering trade in goods and services, rules of origin, trade remedies, customs facilitation, SPS, TBTs, FDI, IP, government procurement, competition policy, and labor and environmental standards, and more
• The USITC report reviews and assesses all 30 chapters of the agreement
• The CGE analysis is limited to certain aspects of the agreement– Tariffs, TRQs, and NTMs on goods trade
– NTMs on cross-border services trade
– FDI provisions affecting investment in goods and services
• Other provisions are often cited by industry as delivering important benefits (e.g., IP, SOEs, gov’t procurement). Many of these are difficult to quantify
3
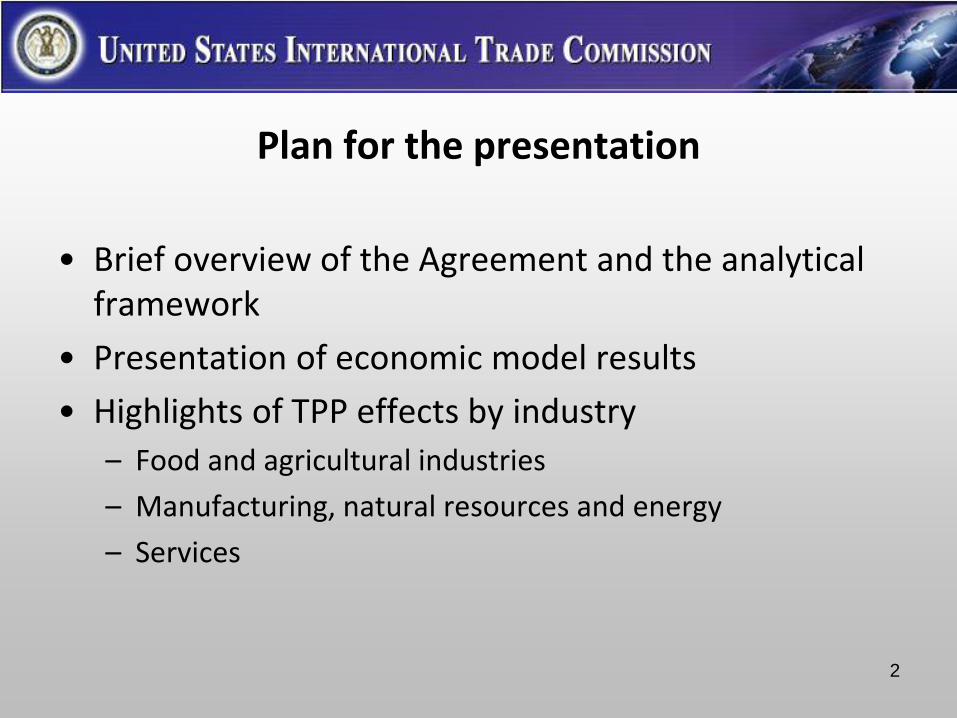
Areas quantified in the CGE analysis
4
Source: Compiled by USITC

Existing FTAs
Americas Asia/Oceania
U.S. Canada Mexico Chile Peru Australia Brunei Japan Malaysia N. Z. Singapore
Canada 1989
Mexico 1994 1994
Chile 2004 1997 1999
Peru 2009 2009 2012 2009
Australia 2005 2009
Brunei 2006 2010
Japan 2005 2007 2012 2015 2008
Malaysia 2012 2010 1992 2006
New Zealand 2006 1983 2010 2010
Singapore 2004 2006 2009 2010 1992 2002 1992 2001
Vietnam 2014 2010 1995 2008 1995 2010 1995
5Source: WTO, RTA-IS database; World Bank, Global PTAs Library
42 of 66 bilateral pairs are already covered by FTAs
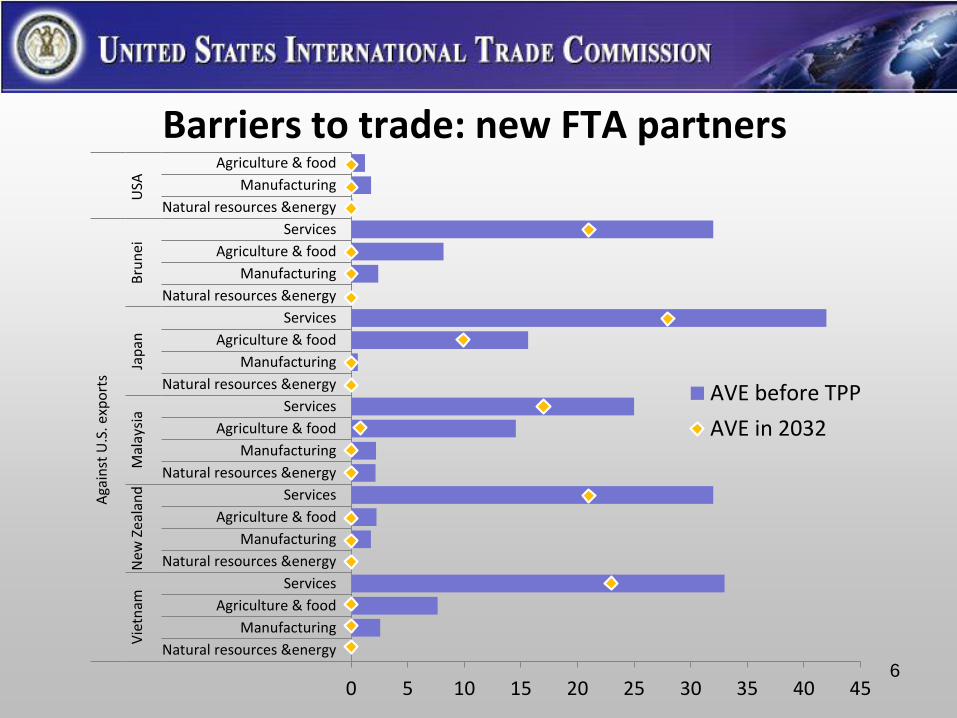
Barriers to trade: new FTA partners
60 5 10 15 20 25 30 35 40 45
Agriculture & food
Manufacturing
Natural resources &energy
Services
Agriculture & food
Manufacturing
Natural resources &energy
Services
Agriculture & food
Manufacturing
Natural resources &energy
Services
Agriculture & food
Manufacturing
Natural resources &energy
Services
Agriculture & food
Manufacturing
Natural resources &energy
Services
Agriculture & food
Manufacturing
Natural resources &energy
USA
Bru
nei
Jap
anM
alay
sia
New
Ze
alan
dV
ietn
am
Aga
inst
U.S
. exp
ort
s
AVE before TPP
AVE in 2032

Barriers to trade: existing FTA partners
70 10 20 30 40 50 60 70
Services
Agriculture and food
Manufacturing
Natural resources and energy
Services
Agriculture and food
Manufacturing
Natural resources and energy
Services
Agriculture and food
Manufacturing
Natural resources and energy
Services
Agriculture and food
Manufacturing
Natural resources and energy
Services
Agriculture and food
Manufacturing
Natural resources and energy
Services
Agriculture and food
Manufacturing
Natural resources and energy
Au
stra
liaC
anad
aC
hile
Mex
ico
Per
uSi
nga
po
re
Aga
inst
U.S
. exp
ort
s
AVE before TPP
AVE in 2032
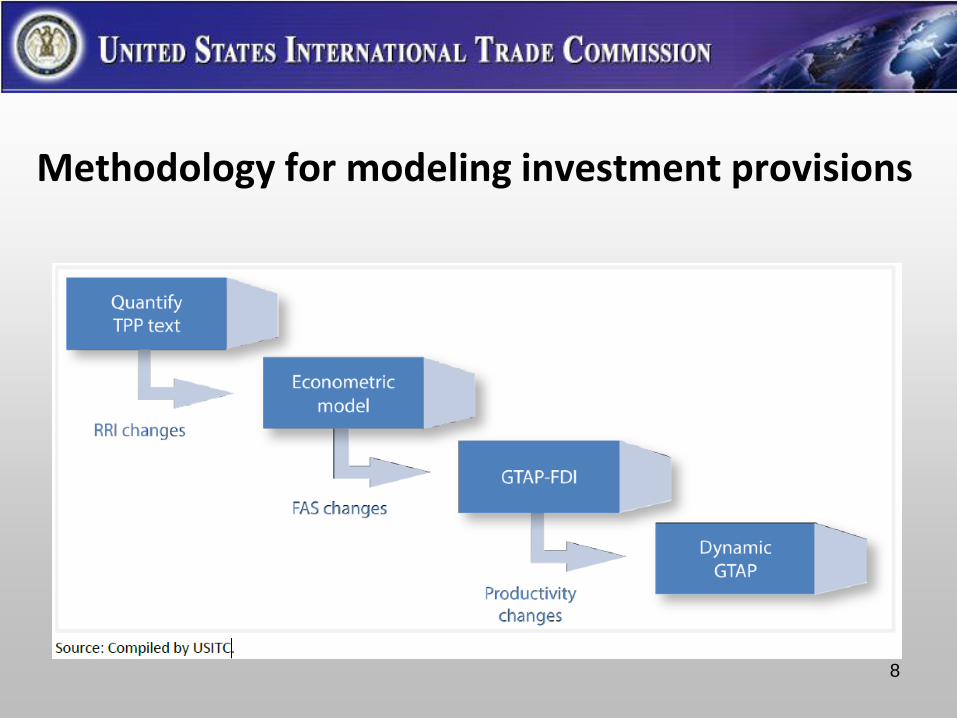
Methodology for modeling investment provisions
8
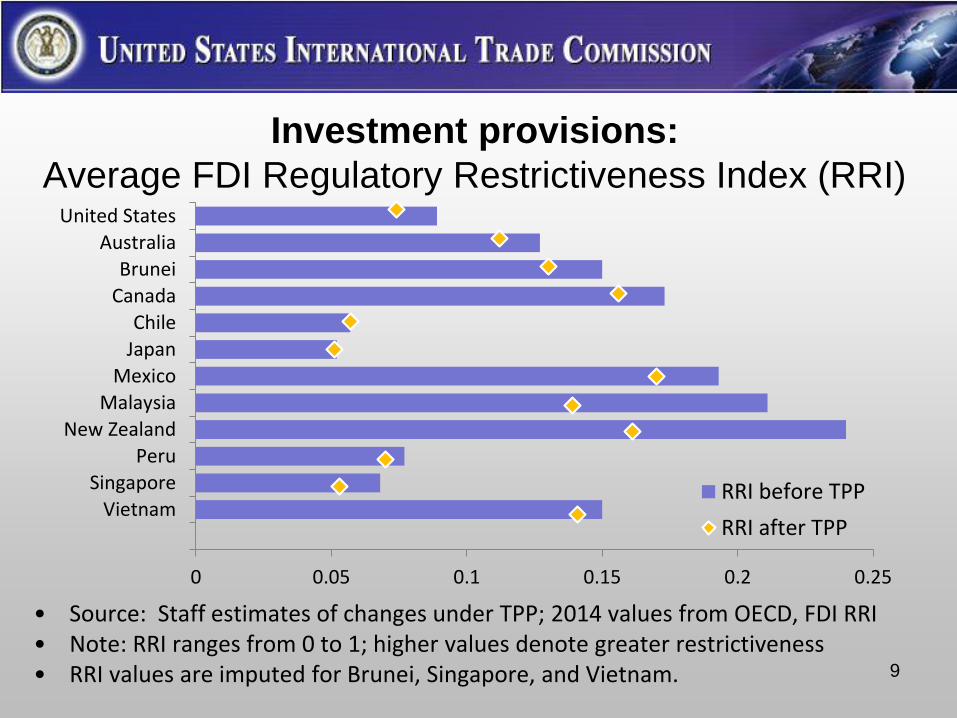
Investment provisions:
Average FDI Regulatory Restrictiveness Index (RRI)
9
• Source: Staff estimates of changes under TPP; 2014 values from OECD, FDI RRI• Note: RRI ranges from 0 to 1; higher values denote greater restrictiveness• RRI values are imputed for Brunei, Singapore, and Vietnam.
0 0.05 0.1 0.15 0.2 0.25
United States
Australia
Brunei
Canada
Chile
Japan
Mexico
Malaysia
New Zealand
Peru
Singapore
VietnamRRI before TPP
RRI after TPP

10
Reduced investment barriers raise productivityHost country productivity gain from TPP’s reduction
in host country RRI, percentage
Note: Economy-wide productivity gains are calculated as share-weighted averages of
sector gains using sales shares
0 0.5 1 1.5 2
United States
Australia
Brunei
Canada
Chile
Japan
Mexico
Malaysia
New Zealand
Peru
Singapore
Vietnam

AGGREGATE MODEL RESULTS
11

Interpreting the modeling results
12Source: USITC estimates

Annual Economy-wide Effects of TPPChanges Relative to Baseline in 2032 and 2047
13
2032 2047
Billion $ Percent Billion $ Percent
Real income 57.3 0.23 82.5 0.28
Real GDP 42.7 0.15 67.0 0.18
Employment (FTEs, thousands) 128.2 0.07 174.3 0.09
Capital stock 171.5 0.18 343.5 0.24
Source: USITC estimates.Note: Dollar values are in 2017 prices.

Broad Sector-level Effects of TPPChanges Relative to Baseline in 2032
14
Exports Imports Output Employment
Billion $ Percent Billion $ Percent Billion $ Percent Percent
Agriculture and food 7.2 2.6 2.7 1.5 10.0 0.5 0.5
Manufacturing, natural resources, and energy
15.2 0.9 39.2 1.1 -10.8 -0.1 -0.2
Services 4.8 0.6 7.0 1.2 42.3 0.1 0.1
Source: USITC estimates.Note: Dollar values are in 2017 prices.

Effects of TPP on U.S. Trade by PartnerChanges Relative to Baseline in 2032
15
Exports Imports
Billion $ Percent Billion $ Percent
Trade with TPP partners 57.2 5.6 47.5 3.5
New FTA partners 34.6 18.7 23.4 10.4
Existing FTA partners 22.6 2.7 24.2 2.1
Trade with the world 27.2 1.0 48.9 1.1
Source: USITC estimates.Note: Dollar values are in 2017 prices.

FOOD AND AGRICULTURE
16

Exports Imports Output Employ-
ment
Million $ % Million $ % Million $ % %
Agriculture and food (total) 7,227 2.6 2,734 1.5 10,015 0.5 0.5
Selected industry sectors:
Sugar, sweeteners and SCP 130 4.3 132 2.4 518 0.4 0.4
Dairy products 1,846 18.0 349 10.3 1,839 1.3 1.1
Beef meat 876 8.4 419 5.7 615 0.5 0.4
Pork meat products 219 1.9 94 4 180 0.3 0.3
Poultry meat products 174 1.3 -17 -3.6 266 0.6 0.6
Rice -13 -0.3 15 1.6 -18 -0.1 0.0
Wheat -2 0.0 18 1.5 -8 0.0 -0.7
Corn grain -31 -0.1 3 1.3 207 0.3 0.4
Processed foods 1,540 3.8 427 1.1 2,397 0.8 0.7
Fresh fruit and vegetables 575 2.0 119 0.5 172 0.2 0.3
Seafood 74 2.2 232 0.9 -52 -0.2 -0.2
17
Effects of TPP on U.S. food and agriculture(Changes relative to baseline in 2032)
The biggest driver of change is increased export opportunities in Japan and Vietnam
• New TPP partners are expected to account for over 70% of the additional food/ag exports
• Greater access to Japan’s high-priced market which demands goods the U.S. can competitively supply
• Vietnam reducing very high tariffs on food/ag products; incomes rising rapidly
Biggest change with existing FTA partners is in dairy
• Additional $1.2 billion in dairy exports to Canada due to additional TRQ access (though market would remain highly managed) and close proximity
18

MANUFACTURING, NATURAL RESOURCES AND ENERGY (MNRE)
19

Exports Imports Output Employ-ment
Million $ % Million $ % Million $ % %Manufacturing, natural resources, and energy (total) 15,188 0.9 39,245 1.1 -10,843 -0.1 -0.2
Manufacturing 12,874 0.8 36,841 1.1 -11,185 -0.1 -0.2Natural resources and energy 2,314 3 2,405 0.7 342 0.0 -0.2Selected industry sectors
Chemicals 1,944 0.7 5,283 1.3 -2,855 -0.3 -0.3Textiles 257 1.3 869 1.6 -329 -0.4 -0.4
Wearing apparel 10 0.3 1,891 1.4 425 1.0 0.9Footwear 138 12.2 1,104 2.7 30 0.5 0.8
Titanium products -34 -1.1 115 14.2 -202 -1.2 -1.3Passenger vehicles 1,954 1.9 2,372 0.8 1,628 0.3 0.3
Auto parts and trailers 1,220 1.2 3,039 1.6 -1,366 -0.3 -0.320
Effects of TPP on U.S. manufacturing, natural resources, and energy(Changes relative to baseline in 2032)
MNRE Products
• U.S. production in all sectors modeled
would increase over time in baseline
• Direct impact of TPP relative to baseline is
likely to be limited
• Only a relatively small value of U.S. MNRE
trade with TPP partners is currently dutiable
– Some individual industries (e.g., titanium metal)
may experience more adverse impacts from TPP,
while others (e.g., passenger vehicles) may
benefit from TPP 21

Passenger vehicles and parts—Provisions
• Tariff reductions– U.S. tariffs on Japanese imports not reduced at all until year 15,
eliminated by year 30
– Vietnam and Malaysia tariffs on U.S. exports eliminated by year 13
• Rules of origin– Lower RVC relative to NAFTA could negatively affect U.S. parts
production
• Side letters– Japan—details specific NTM reductions, and trade remedies
– Malaysia—removes local content requirements and preferential taxes
by 2021, promise to consider U.S. safety and emissions standards
22

Passenger vehicles and parts—Effects
23
• Vehicles – Increased U.S. demand leads to more vehicles produced,
imported, and exported– Vehicle exports increase to Japan, Vietnam, and Malaysia– Canada and Mexico supply most new imports through
2032; in later years Japan accounts for a significant share of the increase
• Parts – Predicted increase in U.S. vehicle production drives
increased imports of parts. Import increase comes primarily from North America and Japan (somewhat)
– Parts exports also increase; most growth to Canada and Mexico, as part of North American supply chains
SERVICES
24

Services Trade is Liberalized in TPP
Services trade is liberalized by provisions in 5+ chapters:
• Investment—mode 3 commercial presence
• Cross-border Trade in Services—mode 1 cross-border trade is free, except for specific NCMs taken
• E-commerce—dataflow provisions for all sectors except financial services
• Financial Services—banking, insurance, electronic payment services, etc.
• Telecommunications services—Dataflow, FDI and standards
• IP, SOEs, Government Procurement, Regulatory Coherence…
25
Liberalization would lower costs for cross-border services trade
• For sectors with a high level of product innovation, such as digital sectors, where the negative list approach is most helpful
• For those sectors that would benefit most from the dataflow provisions such as communications and business services
• For sectors where a TPP partner improved its commitments by reducing NCMs, such as professional services (Brunei, Malaysia, Chile, Japan, and New Zealand)
26

27
Estimated effects of TPP on U.S. services (Changes relative to baseline in 2032)

E-Commerce Provisions Could Increase Competitiveness of U.S. firms
• Cross-border data and information flows ensured: except for legitimate public policy reason (not trade advantage)
• Forced localization measures prohibited: cannot require data servers to be located in-country
• Other key provisions:– Customs duties on digital products prohibited
– Personal privacy and online consumer protection
– Electronic customs forms, signatures, and paperless trading
– Software code does not have to be disclosed
– Cooperation on cybersecurity and SME e-commerce
28
CROSS-CUTTING AND PROCEDURAL PROVISIONS AND OTHER PROVISIONS ADDRESSING RULES AND NON-TARIFF MEASURES
29
Overview• These chapters are often cited by industry as containing important
interlocking benefits that reduce overall trade costs (Investment, IP, SOEs, TBT, Customs Admin, Government Procurement)
• Broad range of topics, mostly qualitative analysis
• Seven chapters not included in existing U.S. FTAs:
– Temporary Entry for Business Persons
– State-owned Enterprises
– Cooperation & Capacity Building
– Competitiveness & Business Facilitation
– Development
– Small and Medium-sized Enterprises
– Regulatory Coherence
30
Sanitary and Phytosanitary (SPS) Measures
• Likely to significantly benefit U.S. firms investing in and exporting to the region
• Would require modern, science-based food safety regulations
• Most provisions subject to dispute resolution
• “WTO-Plus”: clarifies and significantly builds on provisions of the WTO SPS Agreement, and includes provisions that are entirely new for U.S. trade agreements
• Letter exchanges between the United States and other TPP parties have already resolved specific outstanding SPS market access issues for U.S. beef and other products
31

Technical Barriers to Trade (TBT)
• Significant benefits for U.S. firms investing in and exporting to TPP parties
• Cross-cutting provisions applicable to all goods sectors, would require open, transparent systems of standards and regulatory-setting in TPP countries
• Seven sector-specific annexes detailing particular standards, regulatory, and conformity assessment provisions• Wine/Distilled Spirits; ICT Products; Pharmaceuticals; Cosmetics;
Medical Devices; Proprietary Formulas for Prepackaged Foods and Food Additives; Organic Products
• WTO-Plus: clarifies and significantly builds on provisions of the WTO TBT Agreement and existing U.S. FTAs
• Many TBT provisions are entirely new for all TPP parties
Thank You
33
Related Documents