8399 WORLD BANK I COMPARATIVE STUDIES I F !ILE CO>Y The Political Economy of Agricultural Pricing Policy Trade, Exchange Rate, and Agricultural Pricing Policies in Ghana J. Dirck Stryker with the assistance of Emmanuel Dumeau, Jennifer Wohl, Peter Haymond, Andrew Cook, and Katherine Coon A - _ :_ i1:it rOF Public Disclosure Authorized Public Disclosure Authorized Public Disclosure Authorized Public Disclosure Authorized

Welcome message from author
This document is posted to help you gain knowledge. Please leave a comment to let me know what you think about it! Share it to your friends and learn new things together.
Transcript

8399WORLD BANK I
COMPARATIVE STUDIES IF !ILE CO>Y
The Political Economy of Agricultural Pricing Policy
Trade, Exchange Rate,and Agricultural Pricing Policiesin Ghana
J. Dirck Strykerwith the assistance ofEmmanuel Dumeau,Jennifer Wohl,Peter Haymond,Andrew Cook, andKatherine Coon
A - _ :_
i1:it rOF
Pub
lic D
iscl
osur
e A
utho
rized
Pub
lic D
iscl
osur
e A
utho
rized
Pub
lic D
iscl
osur
e A
utho
rized
Pub
lic D
iscl
osur
e A
utho
rized


The Political Economy of Agricultural Pricing Policy
Trade, Exchange Rate,and Agricultural Pricing Policies
in Ghana
J. Dirck Strykerwith the assistance ofEmmanuel Dumeau,
Jennifer Wohl,Peter Haymond,
Andrew Cook, andKatherine Coon
WORLD BANKCOMPARATIVE STUDIES
The World BankWashington, D.C.

Copyright © 1990The International Bank for Reconstructionand Development/THE WORLD UANK
1818 H Street, N.W.Washington, D.C. 20433
All rights reservedManufactured in the United States of AmericaFirst printing February 1990
World Bank Comparative Studies are undertaken to increase the Bank's capacity to offer soundand relevant policy recommendations to its member countries. Each series of studies, of which ThePolitical Economy of Agricultural Pricing Policy is one, comprises several empirical, multicountryreviews of key economic policies and their effects on the development of the countries in which theywere implemented. A synthesis report on each series will compare the findings of the studies ofindividual countries to identify common patterns in the relation between policy and outcome-thusto increase understanding of development and economic policy
The series The Political Economy of Agricultural Pricing Policy, under the direction of Anne0. Krueger, Maurice Schiff, and Alberto Valdes, was undertaken to examine the reasons underlyingpricing policy, to quantify the systematic and extensive intervention of developing countries in thepricing of agricultural commodities during 1960-85, and to understand the effects of suchintervention over time. Each of the eighteen country studies uses a common methodology tomeasure the effect of sectoral and economywide price intervention on agricultural incentives andfood prices, as well as their effects on output, consumption, trade, intersectoral transfers,government budgets, and income distribution. The political and economic forces behind priceintervention are analyzed, as are the efforts at reform of pricing policy and their consequences.
The findings, interpretations, and conclusions in this series are entirely those of the authors andshould not be attributed in any manner to the World Bank, to its affiliated organizations, or tomembers of its Board of Executive Directors or the countries they represent.
The material in this publication is copyrighted. Requests for permission to reproduce portions of itshould be sent to Director, Publications Department, at the address shown in the copyright noticeabove. The World Bank encourages dissemination of its work and will normally give permissionpromptly and, when the reproduction is for noncommercial purposes, without asking a fee.Permission to photocopy portions for classroom use is not required, though notification of such usehaving been made will be appreciated.
The complete backlist of World Bank publications is shown in the annual Index of Publications,which contains an alphabetical title list and indexes of subjects, authors, and countries and regions;it is of value principally to libraries and institutional purchasers. The latest edition is available freeof charge fiom Publications Sales Unit, Department F, The World Bank, 1818 H Street, N.W.,Washington, D.C. 20433, U.S.A., or from Publications, The World Bank, 66, avenue d'Iena, 75116Paris, France.
J. Dirck Stryker, an economist with Associates for International Resources & Development, is aconsultant to the World Bank.
Library of Congress Cataloging-in-Publication Data
Stryker, J. Dirck.Trade, exchange rate, and agricultural pricing policies in Ghana !
J. Dirck Stryker ; with the assistance of Emmanuel Dumeau [et al.].
P. cm.
ISBN 0-8213-1443-21. Agricultural prices--Government policy--Ghana. 2. Coco.a trade-
-Government policy--Ghana. 3. Ghana--Commercial policy. I. Title.HD2146.Z775S76 1990338.1'8--dc2O 89-77546
CIP

Abstract
At the time it achieved independence in 1957, the West Africancountry of Ghana was the world's leading producer of cocoa and the mostprosperous nation in Sub-Saharan Africa other than South Africa. By 1984,however, per capita gross domestic product (GDP) measured in constantprices had fallen 30 percent below its level in 1950.
Ghana's economic decline during the period covered by this studyof agricultural prices obviously cannot be attributed solely to governmentprice intervention. But intervention in the workings of the cocoa sector,this study shows, contributed heavily to the country's inability to achieveprosperity and stability after 1957. More than half of Ghana's populationwas still employed in agriculture in 1984, and the sector provided abouttwo-thirds of the country's export earnings, with cocoa by far thecountry's major export. Other important factors in Ghana's difficultiesincluded a succession of military coups between the late 1960s and theearly 1980s that were ordinarily followed by repression and coercion of thegeneral population, and deterioration of the country's road system.
During the decades since independence, direct intervention inGhana's all-important cocoa sector has been in the hands of a CocoaMarketing Board (CMB), which sets annual producer prices, purchases thecrop from domestic producers, and markets it to foreign buyers. (Theimportance of cocoa to Ghana's economy during the study period wasconsiderable in most years, with the product frequently accounting for 20percent or more of the government's annual revenues, and in some years morethan 50 percent.) Although the chief reason for creating the CMB was toassure Ghana's cocoa farmers a stable and decent income, the agency'sdirect intervention helped to keep producer prices lower than they mighthave been otherwise. The problems of cocoa farmers in earning income werecompounded during much of the study period by export taxes on cocoa andovervaluation of the domestic currency, both of which also tended todepress Ghana's earnings of foreign exchange.
The government's direct and indirect intervention in the cocoamarket, according to the study, far outweighed its incentives to cocoaproducers, including free entry of imported inputs like fertilizer andpesticides, subsidized tractor services, and cheap credit. Moreover, mostof the benefits of these incentives went to large producers rather than thefar more numerous smallholders.
Another important finding of this study (which also surveys theeffects of intervention on two principal imports, rice and maize, and onthe nontraded products cassava, yams, and sorghum/millet) is thatgovernment regulation of the cocoa sector had the serious negative long-term effect of deferring the replacement of old coffee trees with new ones.

iv
By 1982, the CMB and its subsidiaries had 109,000 employees in acountry with a population of approximately 12 million, and low producerprices were encouraging the smuggling of large amounts of cocoa toneighboring Cote d'Ivoire. Large segments of the population had abandonedproductive economic activities in favor of cultivating influential patrons(e.g., those who had licenses to import goods in a country where importshad been sharply restricted), and the government was hard at work seekingemergency assistance from the International Monetary Fund (IMF). With thisassistance in hand, Ghana then began to dismantle its administrativecontrols over the price of cocoa, rice, and maize.

v
Table of Comtents
Pa-ne
FRRT CNE: EIINIMIC POLICY AND AGRICLLURE
I. CWPTER I: INTRODUCTION 1
II. O-PTER II: AIQULTFE IN FELATICN TO tHAN'S EIXN2Y 6
Background 6Agricultural Resatr-ce Endrbawnent 6Regional Cropping Patterns 7Pbpulation 9Overall Econsmic Perfor-mance 13The Balance of Payments and Exchange Rate Disequilibrium 17
The Agricultural Sector 21Importance of Agriculture in the Economy 21Production of Specific Crops 23Food Cmsumptimn 30
II. CFRPTER III: THE EVOLVING PCLITICPL ECONOMY - THE PLAYERS 32
Interest Groups 32Sole of the State 35Patrmns 3B
IV. CHAPTER IV: THE EVOLVING POLITICAL ECUONOY - THE PERIOD6 39
Liberal Regime, 1950-60 39Imposition of Cbntrols, 1961-63 43Breakdown of the System, 1964-66 48Austerity, 1966-67 50Devaluatimn and Import Liberalization, 1967-70 53Collapse of Import Liberalizatim, 1971-72 56Early Years of the NRC, 1972-75 59Ecoromic Disintegratimn, 1976-78 65Struggle for Reform, 1978-81 69PNDC and the Ecrnomic Recovery Program, 1982 - Present 76
V. CHPTER V: OEKbR%NMENT PCLICIES TOWP1DS AGRICL*TURE 86
Cocoa Pblicies 87Tradable Foxds 103Transportation and Nbntradable Foods 111Policies Related to Agricultural Inputs 112
Input Subsidies 113Fertilizer 113Machinery Services 116Improved Seeds 117Other Inputs 118
Credit 120Research and Extension 121

vi
Page
State Prnidctian 124Cbnclusions 126
FPAT W i EFFt TB OF PRICE INTERON0TIME 129
VI. OHPPTER VI: MEASURES OF INTERVENTION 129
Direct Effects 129Producer, Consumler, and Border Prices 129Relative Prices 136Measurement of Direct Price Interventions 142
Indirect Effects 150
VII. CHWPTER VII: EFFECTS ON OLTRJT, COELUFPrTI(N,PM FCEIGNJ EXWY*3E 156
Effects on Agricultural Production 156Supply Functicns 157
Cocoa 156Food Crops 164Price Elasticities of Supply 166
EquilibriLmn Levels of Output 167Effect on Consumption 179Effect on Net Foreign Exchange Earnings 184
VIII. CHAPTER VIII: GiNVEFIIENT LEUGET AND OTH}ER FE9URCE TFW1SFERS 200
Effects of Price Policy cn the Eovermnent BEdget 200Transfers of Resources Between Agriculture and the Restof the Ecconwoy 204
Estimates of Resource Transfers 204Gbvernment Investment and Expenditure Bias 217
IX. CHAPTER IX: OTHER FRICE INTEF&ENTIONI EFFECTS 219
Farm Income Effects 219Variability Effects 230
PART THRE: THE FAILLUE CF THE POLITICPL SYSTEM 248
X. CHFrMR X: HYPOTHEEES PAD CONCLULIONS 24B
The HypDtheses 248Importance of Macroeconomic Disequilibrium 248Loss of Real Incone 248Failure of the Political System 249Rise of Rent-Seeking Activity 249Neglect of Price Policy 250Failure to Achieve National Objectives 250
The Phases 250Colonial Period 251Nkrumah 251

vi i
Paqe
National Liberation Ccucil (NLC) and Busia 252Natianal Redemption Cox,cil (NFC), Sepme Military Caoncil
(SM), ard Limam2Prfvisicmal National Defence cxuricil (PNDC) 252Smnmary 253
Testing of the Hypotheses 255Macraeccxnic Disequilibriun 255Loss of Real Inccwme 257Failure of the Political System 256Rent-Seeking Activity 258Neglect of Price Policy 260Failure to Achieve National Objectives 261
Canc lusions 263
ANNEXES
AMEX 1: AmIOrC T FFXCDIWI 265System for Data Collection 265
Cocoa ~~~~~~~~~~~~~265Other Crops 269
Agricultural Production Data 270
ANNEX 2: ERWILIBRIUM EXCHANGE RATE 276Purchasing Power Parity Approach 276The Real Exchange Rate 276The Equilibrium Exchange Rate 282
Elasticities Approach 287Equilibrium Exchaige Rate Mbdel 294
Import Demand Function 294Export Supply Functions 295Adjustment for Mbnopoly Power 296The Exchange Rate Model 298
PPRENDIX TO INNEX 2: DERIVATION OF A FCRULLA FUR ESTIPFTING THEEaJILIBRIUM EXCOM RATE USING THE EATICITY PPRAH301
ANNEX 3: DERIVATION CF PRICES PAD RRICE IMDICES 305
ANNEX 4: COMA SUPLFY FUNCTICN 316
ANNEX 5: :FEMTS OF INDIFECT AND NNARICULTLUR DIFECTRICE INTEVENTIO6 329
ANNEX 6: NEr AVAILABILITY OF RICE AM M%iIZE 334
ANNEX 7: TONERS AM 9USLIDIES 335
ANNEX 8: REAL ELJILIRIUM INME 346

viii
List of Tables
Panie
Table 1 Population 10Table 2 Gross Domestic Product, 1950 - 1984 14Table 3 Economic Indicators Related to Inflation 16Table 4 Current ARccount Balance, Actual and
Equilibrium Exchange Rates 18Table 5 Agricultural Sector 22Table 6(1) Prouction Indices 24Table 6(2) Productian Indices 25Table 6(3) Production Indices 26Table 7 Food Production and Consumption Indices 31Table 8 Cocoa Sales, Marketing Costs, and Public Revenue 89Table 9 Real Producer Price of Cocoa 101Table 10 Domestic Producer Prices 133Table 11 Domestic Consumer Prices 134Table 12 Border Price Equivalents 135Table 13(l) Prevailing Relative Price Indices 137Table 13(2) Prevailing Relative Price Indices 138Table 13(3) Prevailing Relative Price Indices 139Table 13(4) Prevailing Relative Price Indices 140Table 14 Producer Price Ratios 143Table 15 Consumer Price Ratios 144Table 16 Effect of Direct Price Interventions en
Relative Producer Price Differences 146Table 17 Effect of direct Price Interventicons on
Relative Consufer Price Differences 147Table 18 Effect of Direct and Indirect Price Interventions
on Relative Prices 152Table 19 Effect of Direct and Indirect Price Interventions
on Relative Price Differences 153Table 20 Direct Effect en (btput, Short-fRn 170Table 21 Direct Effect en Ohtput, Long-Fiun 171Table 22 Direct Effect en Output, Very Long-fRn 172Table 23 Total Effect en Output, Short-Run 173Table 24 Total Effect an Output, Long-Run 174Table 25 Total Effect en Output, Very Long-fhn 175Table 26 Direct Effect on Consumption 182Table 27 Total Effect en Consumption 183Table 2B Direct, Short-fun Effect of Price Interventions
on Foreign Exchange Earnings 116Table 29 Direct, Lcng-Rufn Effect of Price Interventions
an Foreign Exchange Earnings 188Table 30 Direct, Very Long-Run Effect of Price Interventions
on Foreign Exchange Earnings 190Table 31 Total, Short-Rkn Effect of Price Interventicns
on Foreign Exchange Earnings 192

ix
Paae
Table 32 Total, Long-fin Effect of Price Interventionson Foreign Exchange Earnings 194
Table 33 Total, Very Long-Run Effect of Price Interventionson Foreign Exchange Earnings 196
Table 34 Effect of the Pricing Policy an the Budget 202Table 35 Tax on Cocoa 203Table 36 Direct and Total Nominal Short-fin Transfers Due to
Ckitput Price Interventions Into (+)/ Out of(-) Agriculture 209
Table 37 Direct and Total Nominal Long-Rhn Transfer-s Due toGOitput Price Interventions Into (+)/ Out of(-) Agriculture 210-
Table 38 Direct and Total Nominal Very Long-Run Transfers Dueto Output Price Interventions Into (+)/ Ouit of(-) Agriculture 211
Table 39 Short-Run Transfers Into (+)/ Out of (-) Agriculture 212Table 40 Long-fin Transfers Into (+)/ Out of C-) Agriculture 213Table 41 Very Long-fun Transfers Into (+)/ Ouit of (-) Agriculture 214Table 42 Gbvernmnt Investment (GIB) and Total Expenditure
(GEB) Bias 218Table 43 Real Instantaneous Income Effect of Direct Interventinu 2 721Table 44 Real Short-Run Income Effect of Direct Intervention 222Table 45 Real Long-fRun Income Effect of Direct Intervention 223Table 46 Real Very Long-Run Income Effect of Direct Intervention 224Table 47 Real Instantaneous Income Effect of Total Intervention 225Table 48 Real Short-Rfn Income Effect of Total Intervention 726Table 49 Real Long-Run Income Effect of Total Interventian 227Table 50 Real Very Long-Run Income Effect of Total Intervention 22BTable 51 Domestic Maize Prices Under Alternative Price Scenarios 232Table 52 Domestic Rice Prices Under Alternative Price Scenarios 236Table 53 Domestic Cocoa Prices Ukhder Alterative Price Srenarios 240Table 54 Per Capita Production and Consumption 244Table 55 Relative Weight of Agricultural Price Policy Objectives 254
fnnex Tables
Table 1-1 Cocoa Production and Smuggling 1960-1962 1.2Table 1-2(1) Agricultural Production 1.8Table 1-2(2) Agricultural Production 1.9Table 1-2(3) Agricultural Production 1.10Table 2-1 Exchange Rates, 1956-85 2.4Table 2-2 Balance of Payments Current Account 2.8Table 2-3 Nominal Exchange Rates and Nominal Purchasing Power 2.13
Parity Equilibrium RatesTable 2-4 Estimation of the Equilibrium Exchange Rate Using 2.18
the Elasticities ApproachTable 2-5 Norninal Exchange Rate and Alternaltive Nominal 2.25
Equilibrium Exchange RatesTable 3-1 Wholesale Market Prices 3.2Table 3-2 Official Producer Prices 3.4Table 3-3(1) Structure of Domestic Prices 3.5

x
Table 3-3(2) Structure of Domestic Prices 3.6Table 3-4(1) Stucture of Rice Border Price Equivalents 3.8Table 3-4(2) Structure of Maize Border Price Equivalents 3.10Table 3-4(3) Structure of Border Price Equivalent for Cocoa 3.12Table 3-5(1) National Consuimer Price Indices 3.13Table 4-1 Estimation of Cocoa Planting, Traditional Varieties 4.6Table 4-2 Estimation of bormal Cocoa Production 4.8Table 4-3 Regression Results for the Cocoa Supply Equation 4.11Table 5-1 Effect of Indirect and Nonagricultural Direct Price 5.3
Interventions an Relative PricesTable 5-2 Effect of Indirect and Nonagricultural Direct Price 5.5
Interventions on Relative PricesTable 6-1 Net Availability of Rice and Maize 6.1Table 7-1(1) Short-Rgn Producer Price Transfer to and from 7.1
Maize ProductionTable 7-1(2) Long-fu-i Producer Price Transfer to and from 7.2
Maize ProductionTable 7-2(1) Short-Rn Producer Price Transfer to and fromn 7.3
Rice Pr-oductionTable 7-2(2) Lanx-flun Producer Price Transfer to and fron 7.4
Rice ProducticnTable 7-3(1) Short-FRn Producer Price Transfer from Cocoa Production 7.5Table 7-3(2) Long--Run Producer Price Transfer from Cocoa Production 7.6Table 7-3(3) Very Long-Run Producer Price Transfer from Ccxoa 7.7
ProductionTable 7-4 Indirect Input Subsidies to Agriculture 7.8Table 7-5 Government Expenditure Transfers to Agriculture 7.9Table 7-6 Total, Very Long-fRn Estimation of Agricultural GDP 7.10
in the Absence of Price InterventionsTable 7-7 Ciovernment Expenditures 7.11Table 8-1(1) Large Cocoa Farmers, Direct Real Equilibrium Income 8.1Table 8-1(2) Large Conoa Farmers, Total Real Equilibrium Income 8.3Table B-2(1) Large Rice Farmers, Direct Real Equilibrium Inca.r 8.5Table 8-2(2) Large Rice Farmers, Total Real Equilibrium Income 8.7Table 8-3(1) Large Maize Farmers, Direct Real Equilibrium Income 8.9Table E-3(2) Large Maize Farmers, Total Real Equilibrium Income 8.11Table 8-4(1) Expenditure Shares and Dircet Equilibrium Price Indices 8.13Table 8-4(2) Expenditure Shares and Total Equilibrium Price Indices 8.14

xi
List of Fioures
PaFe
Figure 1 Domestic Prmducer Prices of Maize 234Figure 2 Domestic ronsumer Prices of Maize 235Figure 3 Domestic Prcducer Prices of Rice 23BFigure 4 Domestic Consumer Prices of Rice 239Figure 5 Domestic Producer Prices of Cocoa 242Figure 6 Domestic Consumer Prices of Cocoa 243Figure 7 Maize Producticn and Availability 246Figure 8 Cbnsumer Price of Maize 246Figure 9 Rice Productim and Availability 247Figure 10 Consumer Price of Rice 247
Annex Figures
Figure 11 Log Normal and Log Actual Production 4.9


PART OlE: ECONOMIC POLICY AND AGRICLLTIFE
CHPTER I: INTFUJCITIEN
At the time of independence in 1957, Ghana was perhaps the mDst
developed country in black Africa. It was the world's mDst important
producer of cocoa, which permitted the accumulatian of substantial foreign
exchange reserves, and it also exported timber, gold, bauxite, and other
products. Its physical infrastructure and educaticnal establishment were
relatively well developed, and its per capita incaume was the highest outside
of South Africa.
Two and cne-half decades later, the Ghanaian eccnrmy was in ruins.
Cocoa exports were less than half their level of the mid-1960s, the black
market exchange rate was many times the official rate, graft and corruptimn
were rampant, and real per capita incamne had fallen by 30 percent. Only in
1963 did the Ghanaian government at last begin to undertake the extensive
eco-nomic reforms required to rise out of this abyss. The succeeding four
years witnessed a slcw but steady pracess of price and exchange rate
realignment and a dismantling of many of the extensive administrative
c.ntrols that had been utilized to allocate an ever decreasing supply of
available resources.
Funtdamental to the dissolution of the Ghanaian eccwmy during this
period was agricultural price policy. To some extent this policy was the
result of deliberate decisimns regarding producer and ccnsumer prices. This
was true of cocoa, for example, as well as other export and industrial
crops. Official price policy regarding foodgrains, an the other hand, was
unimportant in relation to trade policy, especially restrictions mn imports
of cereals.

The most important influence on agricultural prices, however, was
not agricultural price and trade policy per se, but the overall
macrouconaomic situation in which these policiles were fornmuilated and
implemented. Of special importance were periodic bouts of inflation and
overvaluatimn of the exchange rate.' These were especially severe during
the last half of the 1970s and the early 1960s before the recent reforms
un-dertaken by the Rawlings government.
This study analyzes the past three decades of Ghanaian economic
history in light of the impact that agricultural price distortions have had
an the allocation of resources and the welfare of producers and consumers.
The analysis is concerned not only with the magnitude of these effects but
also with how the resulting gains and losses of different graups in Ghanaian
soriety have fed back into the political process to shape agricultural price
policy. A major ccnclusion of the analysis is that these feedback effects
did not work very well because the political system increasingly prevented
the voices of special interest groups from being heard. Instead of
resources being allocated through policy decisions influenced by these
groups, access to goods and services came to depend on a vast network of
patrcn-client relations, which depended on favoritism, personal
connections, and outright bribery. So much time and energy was devoted to
enhancing these relationships that there was little left over for productive
endeavor. As a result, the total supply of resources available for
allocation continued to dwindle until the rewards no longer justified the
effort, and people simply withdrew from the formal sector of the ecanomy.
± The use of the term overvaluation in this report with reference bothto the exchange rate and to local currency (the cedi) implies N' 1$ rate islow in relation to its equilibrium level.
2

Finally Jerry Rawlings cmsted the civilian regime in power and, after an
initial period of varillatimn and hesitancy, embarked on a process of
fundamental ecorinnic reform that is yet to be concluded.
This study is divided into three parts. The first discusses the
economic policies that have affected agriculture. Chapter II describes the
agricultural sector in relation to the rest of the eccnomy. It provides
some general background on Ghana's agricultural resource endcwrient,
regional cropping patterns, population, cverall economic performance, and
balance of payments. Included in the last section is a discussion of the
exchange rate disequilibrium that existed in Ghana during most of the past
three decades and the methods that were used to estimate the free trade
equilibrium exchange rate. These methods, including an econometric model of
the demand for and supply of foreign exchange, are described in detail in
Aninex 2. The rest of Chapter II looks quantitatively over 30 years at the
relative importance of agriculture in the Ghanaian economy, the production
of specific crops, and food consumption.
Chapters III and IV discuss the evolving political economy of
Ghana. The first of these chapters describes the major players in this
evolution, including interest groups, the state, and the patrons. Chapter
IV examines each of the periods through which the political economy has
evolved from 1950 to the mid-1980s. In particular, it analyzes
qualitatively the ways in which the policies and instituticns created during
the early years of independence created allocative and distribution
mechanisms that inhibited the exertion of influence by interest groups on
the formulation of policy in ways that would have directly increased their
inCome and wealth. Later the dependence of successive governnents on
3

patronage networks and their inability to draw upon interest grmups for
political support reduced their capacity to unrdertake fundamental reform.
Chapter V describes the government policies that have affected
agriculture, especially those related directly or indirectly to relative
prices. Emphasis is placed on price distortions introdcijed by trade and
exchange rate policies, which have often run couinter to policies designed to
influence agricultural incentives directly. Attention is also paid to the
use of administrative decisions in place of price incentives as a
mechanism for allocating resources and the rent-seeking activity that has
resulted. Policies are examined as these have affected the prices of cocoa,
tradable foods, transportation and nontradable foods, and agricultural
inputs. There is also some discussion of non-price policies regarding
credit, research and extension, and state production.
Part Two asse quantitatively the effects of price
interventions for three major crops: cocoa, rice, and maize. Chapter VI
discusses the measurement of these interventions, including both the direct
effects of trade and price policy and the indirect effects resulting frc
distortions in the exchange rate. The methods used to obtain these
measurements are described, and the results are discussed.
Chapter VII looks at the direct and indirect effects of price
interventions on output, consumption, and net earnings of foreign exchange.
The effects on output and cotsumption are measurned using economictrically
estimated supply and demand functicns for cocoa, rice, and maize. The
estimation proceduwres are described summarily in this chapter and in more
detail for cocoa in Ainex 4. Changes in output and consuimption resulting
frcom price interventions are then used together w:ith border prices in U.S.
4

dollars to estimate the effects of the interventions an net foreign
exchange earnings.
Chapter VIII examines the effects of price interventicns an the
government budget and an the welfare of producers and consmiers. Net
transfers into and out of agriculture are estimated as these result from
price distortians and government expenditures. The bias of government
investment and total expenditures an agriculture in relation to the whole
ecacnwy is also assessed.
Chapter IX estimates the impact of agricultural price
interventicns an the real income of several representative types of farmers.
It also examines the effects an urban consumers and other interest groups
but concludes that these effects were dwarfed during most of the period
studied by large distortions in real wages that were anly to a very minor
extent the result of changes in the relative prices of the crops under
ccnsideratimn. The last part of this chapter looks at the effect of price
interventions an the variability of domestic prices and quantities.
Part Thr-ee of the study integrates the qualitative discussion in
Part One with the quantitative analyses of Part Two by elaborating several
major hypotheses that may be drawn from the study. These hypotheses are
first described and then analyzed over six major historical phases, each of
which is defined by the relative priorities-given by successive governments
to various naticnal objectives. In the end, it is argued, the instruments
employed to attain these objectives were inadequate in the face of much more
powerful political and economic pressures that resulted in the demise of
each of these regimes until the present ane. Whether this pattern has now
beEn changed remains to be seen.
5

CHETER II: AGRICLLLUE IN FELATION TO G~V S EEXU'W
This chapter describes the agricultural sector in relation to
Ghana s overall econouy. The first sectim provides backgrmund on the
agricultural resource endowhent, regional cropping patterns, population
characteristics, and overall economic performance. The seccand section
examines the relative importance of agriculture in the econcomy, the
productin of specific crops, and levels of food consumption.
Backqround
APricultural Resource Endowment'
Ghana is located on the coast of West Africa, bordered in the east
by Togo, in the West by Ivory Coast, and in the north by Burkina Fasso. The
ccintry s total area is roughly 92,100 square miles, with elevaticns
generally ranging between sea level and 1000 feet. The ccxntry is divided
administratively into ten regions - Greater Accra, Eastern, Western,
Central, Brung Ahafo, Ashanti, Vol1ta, Upper East, UJpper West, and Northern
(see Map 1).
Generally, the resource endaowent ccnsists of a forest zone in the
south, occupying roughly me-third of the country, and a wooded savanna in
the norrth. The forest zone receives much nmre rainfall than the savanna.
The highest rainfall area in the southwest averages 1950-2125 mm per year.
X MDre extensive discussions of the agricultural resource endowment inGhana are cantained in Area Handbook for Ghana, prepared by Foreign AreaStudies of the American LUniversity, 1971 and World Bank, Ghana: AqriculturalSector Review, April 12, 1978, Arnex I.
6

In contrast, the northern savanna averages 800-1200 mm per year and scme
areas of the southern coast average only 625-1000 mm per year.
The principal features of rainfall in Ghana are its seasDnality
and its interannual variability. The distribution during the year varies
considerably from region to region. Two principal types may be recognized,
though adjacent types grade into one another. The first is characterized in
the scuth by relatively heavy rains in May and June and a lesser rainy
season around October; the second is a single rainy season in the north,
principally from June through September. Large variations exist between
successive rainy seasons in time of onset, duration, and amounts
received. In snme seasons, individual rains are numerous and well
distributed and in other years they are scattered and infrequent. The
result is high variability of crop production.
Soils in Ghana are of generally pmor quality and easily become
exhausted. The maintenance of the topsoil organic matter is of prime
importance in cultivating these soils. This is largely achieved through
traditional arable farming techniques involving extensive periods of
fallow. In some areas, howEver, growing population density necessitates
shortening of fallow, leading to a loss of nutrients and the possibility of
erosion.
Reqional Croopinq Patterns
There are five major geographic regions: the coastal plains in the
south, the forest uplands further north, the high plains of the far north
and northwest, the basin area surrounding Lake Volta and its assoriated
rivers, and the rugged, mountainous region of the Akwapim-Togo ranges.
7

The coastal savanna area along the ocean receives little rainfall
compared to the rest of the country but contains alluvial soils of good
fertility. Mbst of the region is characterized by subsistence farming of
maize, cassava, and grcaxuinuts. Sugar cane is grawin under irrigation. The
section of the Arccra Plains near the coast is nearly free of the tsetse fly
and has therefore become a popular area for livestock breeding. Market
gardening has also been increasing near Accra. The coastal plain to the
west of Accra is unsafe for cattle, but a number of commercial centers and
fishing villages are found in the region. Cocanut palms are also
maintained. The Volta Delta area is characterized by flat la-nd cavered with
grass and fan palms. Coconuts, oil palm, cassava, corn, and a variety of
vegetables are grown. Near Keta there is intensive cultivation of shallots.
Fishing is also important. The Densu River basin in the eastern section of
the lowlands area is a rich cocoa and food producing region.
The forested uplands of the Eastern, Western, Central, Brong
Ahafo, and Ashanti Regicns receive substantial amouts of rainfall and have
beccne Ghana s most important area for cocoa prcouction. Traditicnal oil
palm production is also faund extensively in the higher rainfall areas in
the southwesterm part of this zone. Subsistence crops include maize,
cassava, plantains, cocaiyams, and yams. The western part of the region is
least densely populated, and forestry is an important activity. The
potential for rubber production here is also caosiderable.
The high plains of the north and northwest average between 500
and 100 feet in elevation. Soils are generally more fertile than in the
Volta Basin, and population density is accordingly higher. Food crops
include yams, maize, sorghum, millet, and grounchnuts. Cash crops are
H

cottan, tobacco, and kenaf, with rice being proKuced for sale in the river
valley bottomlands. Largely because of the virtual absence of the tsetse
fly, this regimn is the cauntry s primary area for livestock producticm.
The Volta Basin regimD occupies the central part of the ccuntry
and is characterized by poor soil ccnditimns and low annual rainfall.
Pbpulatian density is quite low, and the terrain is subject to drying and
erosim. Fishing is an important activity in the volta Lake regim.
Finally, the AkwapimrTago ranges in the eastern part of the
country cansist mainly of rugged complexes of folded strata and volcanic
rocks. The area is covered with deciduous forest, and temperatures tend to
be a bit cooler than in other parts of the country. tost farming activity
is subsistence-oriented, though some cocoa and coffee are growh along with
staple craps.
Ptclatim
As Table 1 illustrates, populatimn in Ghana has been growing
rapidly. A high crude birth rate of 49 per thousand and a comparatively low
crude death rate of 13 per thousand, estimated in 1982, imply a natural rate
of increase in that year of 3.6 percent per annum. Overall growth was aily
2.9 percent, however, because of substantial cutmigration.m
The ccuntry as a whole in 1970 had an average populatimn density
of about 36 persons per square kilometer.: Outside of Accra, the highest
densities were 91 persmns in the Central Regian and 62 persons in the
Wobrld Bank, Ghana: Pblicies and Program for Adjustment, Washingtm,D.C., 1984, p. 2 6 .
~ Ghana, Central Bureau of Statistics, Statistical Yearbook 1969-70,p.7.
9

Table I
Population
Arabil LandLabor Force Adult per Agri
Total (a) Urban lb) Concentra- Rural Id) Urban as I Part Rate (f) Literacy Worker (h)Year (000) (000) tion (c) (000) Total (e) II) Rate (g) (ha)
1948 4118 326 3 3793 7.9 NIA N/A NIA1950 4368 N/A N/A N/A N/A N/A N/A N/A1960 6804 1585 39 5219 23.3 42.9 27 7.91970 8559 2507 46 6107 29.1 39.7 30 7.51980 11100 4129 N/A 7372 35.9 37.1 30 6.51984 12206 3825 N/A 8380 31.3 N/A N/A N/A
Notes to Table 1:(a) 1949 population obtained from Ghana, Central Bureau of Statistics, Statistical Yearbook, 1969-1970.
1950-1969 populations obtained from World Bank, World Tables, 1983, Vol. 1.1970-1985 population figures are from Ghana: Policies i Issues of StructuralAdjustment, March 30, 1974. Missing data are interpolated using a growthrate of 2.661. Population data for 1948 and 1960 are based on censusesconducted in those years.
(bI 1948 urban population is from Statistical Yearbook, 1969-1970, and includes all people in cities andtowns with a population of at least 5000.1960-1984 figures are derived from data in World Tables, 1983, Vol. 2.
(c) Source: Statistical Yearbook, 1969-1970. The concentration of the urban population is measured bythe number of cities in which the most concentrated 75I of the urban population lives.
(d) Same sources as (a) and (b).le) Derived from same sources as (b).(If) Source: World Tables, 1983, Vol. 2.(q) Source: World Tables, 1983, Vol. 2, for 1960 and 1970; World Banit, Ghana: Policies and Proqraes for
Adjustment, 1984, p. 28, for 1980.(h) Arable land of 14.8 million ha is defined as current cultivation plus fallow from FAD, Perspective
Study of Agriculture and Development for Ghana, 1976.
10

Eastern and Ashanti Regimns. By 1962, average population density overall
was about 50 persons per square kilometer. The highest growth rate during
this period was in the NDrth-ern Regicn at 3.4 percent per year; the Vbota
Region had the lcwest growth rate at 1.7 percent per annum.
The rate of growth in urban areas has in most years exceeded that
in rural areas, with the percentage of total population residing in urban
areas rising from, 7.9 percent in 1948 to 35.9 percent in 1980.4 This is a
higher level of urbanization than is fcaind in most middle-incame ccuntries
in Africa south of the Sahara. With the growth in urban population, there
has been increasing demand for urban services, including the marketing of
food. The rise in the number of cities making up 75 percent of the urban
population also attests to the fact that the increase in urbanization is not
restricted to Accra and a few other larger cities, hut is well distributed
througqhut the country.
The labor force participation rate has declined steadily since
1960. In part this reflects the changing age/sex stricture of the
population resulting from a high birth rate and a relatively low mortality
rate amoig ycLing children. It also undoubtedly is the result of econcmic
stagnation and a falling rate of investment, one effect of which has been to
encourage emigration of persons of working age. In 1980, about 53 percent
of the total labor force was in agriculture and 10 percent was employed in
the formal wage sector, mostly in urban areas.' With 18 percent of the
The apparent decline in urban population from 1990 to 1984, shown inTable 1, may reflect a movement back to the land resulting from the collapseof the economy, as discussed elsewhere in this report, or it may simplyindicate that growth rates extrapolated from the 1960s overestimated urbangrowth during the 1l70s.
W Wbrld Bank, Ghana: Policies and Prouram for Adjustment, p. 26 .
11

labor force officially counted as "unemployed", 19 percent of all workers
were in the informal sector. In fact, the number was much larger than this
since many agricultural, formal sector, and "unemplayed" workers also were
involved with informal sector activities.
The effect of a deteriorating eccromy is also reflected in a
number of social indicators, of which the literacy rate shcown in Table 1 is
ane example. Whereas most middle-income African cauntries made significant
progress in educating their populations during the first two decades
following independence, Ghana, which had ane of the highest literacy rates
in Africa in 1960, has achieved little since then. This situatim is
likely to be aggravated in the future, moreover, because of the lack of
recent investment in social infrastructure to keep up with expanding
population.- Equally important is the loss of Itunan resources associated
with substantial outmigratimn over the past 15 years.
The last indicator shown in Table :L is the average amount of
arable land per person emplcyed in agriculture. While this average does not
indicate any strring pressure m land resourrces, the fact that it is falling
under the influence of growing population implies that more intensive
techniques must be employed if land and labor productively are to be
increased, or at least maintained. Otherwise the reductimn of fallow will
lead to a decline in yields and eventually to degradation of the land.
Given spacial variaticns in population density, moreover, this problem is
much more acute in some areas than in others. This has obvious
implicaticns concerning the need for systems to distribute improved seeds,
fertilizers, and other inputs.
IWorld Bank, Ghana: Policies and Procram for Adjustment, p. 2 7 .
12

Overall Economic Performance
The overall economic performance of Ghana from 1950 to 1984, shown
in Table 2, was very poor. Pbr capita (MP in constant prices during the
entire period declined by 30 percent. Frnm 1950 to 1964, despite some
fluctuations, per capita GDP remained relatively constant at about N* 600
per head. Thereafter there was a reduction, which reached N 559 in 1968,
fol lowed by an increase to NW 640 in 1971. By 1975, a much sharper and more
sustained decrease occurred in per capita GDP that reached a trough of N
396 in 1983.
This poor overall performance was echoed by the behavior of
investment and savings. As a proportion of LIP, gross investment rose f ran
13 percent in 1950 to 21 percent in 1960. The absolute value of investment
continued to rise in constant prices until 1964, when it attained a peak to
which it has never returned. EBth in absolute terms and as a percentage of
GDP, investment fell during the late 1960s, peaked again in 1971, and began
a decline that became especially severe after 1977. By 1982, gross
investment was only 7 percent of GlP and net investment was probably
negative.'
The performance of savings was even worse. In 1950, gross savings
are estimated to have equaled 19 percent of GDP. This figure fluctuated
from year to year, but reached a trough of 4 percent in 1967. It recovered
and attained a maximum of 20 percent in 1972, but thereafter it declined
sharply to only 5 percent in 1980. It later increased scmewhat during the
early 19EKs.
7 WDrld Bank, Ghana: Policies and Program for Adjustment, p.4.
13

Table 2
Gross Domestic Product, 1950-84 (a)(Million New Cedis, 1975 Prices)
lP per Invt.l Savings Savings/ Imports/ Exports/Year GDP capita Invt. GDP (Z) (b) 6DP (2) Imports GDP (2) Exports GDP (2)
__ -- -- -- -- -- -- -- - - --- -- -------_ - -- - - -- -- - --- -- --------_ _ _
1950 2631 602 355 13 488 19 584 22 716 211955 2975 547 462 16 755 25 687 23 979 331959 3680 568 771 21 627 17 1067 29 923 251960 3986 586 836 21 450 11 1370 34 984 251961 4123 592 693 17 308 7 1490 36 1105 271962 4292 602 663 15 655 15 1305 30 1297 301963 4481 613 803 19 590 13 1444 32 1231 271964 4580 612 954 21 777 17 1261 28 1084 241965 4643 606 932 20 593 13 1738 37 1399 301966 4445 567 667 15 638 14 1279 29 1249 281967 4582 570 471 10 201 4 1336 29 1066 231968 4599 559 505 11 474 10 1115 24 1084 241969 4975 579 582 12 402 8 1206 25 1026 211970 5349 625 757 14 804 15 1181 22 1228 231971 5628 640 793 14 976 17 966 17 1149 201972 5488 609 418 8 1084 20 668 12 1334 241973 5646 610 544 10 904 16 968 17 1328 241974 6033 635 789 13 686 11 1146 19 1042 171975 5293 541 673 13 722 14 974 18 1023 191976 5097 509 530 10 678 13 926 18 1074 211977 5212 507 772 15 595 11 994 19 806 151978 5654 536 605 11 465 8 911 16 771 141979 5512 509 537 10 525 10 770 14 758 141980 5538 499 490 9 303 5 842 15 655 121981 5344 469 447 8 317 6 727 14 597 111982 4974 425 344 7 583 12 449 9 688 141983 4747 396 343 7 360 9 469 10 486 101984 5158 423 392 8 276 5 526 10 410 81995 5420 429 N/A N/A N/A N/A N/A N/A N/A N/A
Notes to Table 2:(a) Source: Economic Analysis and Projections Department, World Bank, except where otherwise noted.
Source for 1959a D. Walters, The National Accounts of Ghana, 1955-1961, U.N. Report I TAO/6HA/8,February 4, 1965.
(b) 6ross Domestic Savings, derived as a residual by subtracting Private Consueption and General GverneentqConsumption from Gross Domestic Product.
14

Imports and exports tell a similar story. During the early 1950s,
exports of goods and nonfactor services exceeded imports try a ccmifortable
margin. This was a period during which foreign exchange reserves were being
substantially increased. By 1957, however, the current acccwnt was in
deficit, requiring a drawing dcw of these reserves. Despite this, imports
continued to rise both in absolute ternms (in constant prices) and as a
proportion of GDP. In 1965 imports attained a peak, equal to 37 percent of
GDP, despite the fact that exports were mnly 30 percent of GDP and foreign
exchange reserves were nearly exhausted.3 From this peak, Ghana experienced
an almost continuruis decline in imports, both in absolute terms and as a
share of GAP, until they accounted for mnly 9 percent of GDP in 1982.
Exports behaved similarly and reached a low of 8 percent of GOe in 19B4.
One reason for this dismal ec:onomic performance was inflation
engendered by large government budget deficits, as shown in Table 3. The
budget was in surplus in most years until the 1960s, when rising deficits
under Nkrumah led to double digit inflation from 1964 to 1966. A
considerable effort was made to bring the budget under control during the
ensuing years, which resulted in the rate of inflation dropping to a low of
3.7 percent (0PI) in 1970. With the coming to power of the NRC, however,
the size of the budget deficit in relation to total revenuies increased
steadily until it reached a maximum of 127 percent in 1978. The inflation
rate by this time had reached triple digits. Again there was an effort to
tighten the fiscal situation after the NRC was deposed, but a massive
8 At the end of 1956, Ghana's foreign exchange reserves totaled N*366.5 million; by the end of 1964, these had declined to Nt 83.8 million,or 21 percent of the total value of imports in 1965. J. Clark Leith, ForeiqnTrade Regimes and Economic Development: Ghana, New York: Columbia UhiversityPress, 1974, p.22.
15

Table 3
Econoeic Indicators Relited to Inflation(millions NC)
I Share of SurplusBudget (Deficit) in Consumer AnnualSurplus -------------------- Nominal Price Index Ic) Rate of
Year Govt Rev (a) Govt Exp (a) (Deficit) Govt Rev GDP GDP (bl (1972lOOl Inflation (1)
1950 36 27 9 25.9 2.4 3B8 I/A NIA1951 42 34 7 17.7 1.6 473 32.2 N/A1952 78 46 32 41.0 6.8 469 37.7 17.01953 96 75 11 12.4 2.1 505 38.4 1.91954 101 96 5 5.1 .7 696 36.5 -4.81955 161 91 70 43.5 10.5 668 37.3 2.01956 106 96 10 9.0 1.4 690 38.0 2.01957 99 111 -11 -11.3 -1.5 726 39.4 3.B1958 120 106 15 12.1 1.9 766 39.8 .91959 134 124 10 7.3 1.1 1170 39.8 .01960 140 156 -16 -11.5 -1.9 869 40.9 2.61961 167 216 -49 -29.7 -5.3 730 41.4 1.31962 150 229 -79 -52.5 -9.0 997 43.7 5.71963 165 266 -101 -61.0 -9.2 1100 47.9 9.51964 245 289 -43 -17.7 -3.5 1236 53.0 10.61965 284 371 -87 -30.7 -5.9 1466 66.9 26.41966 231 273 -42 -18.2 -2.8 1519 75.9 13.31967 254 321 -67 -26.4 -4.5 1504 69.5 -9.41968 298 400 -102 -34.3 -6.0 1700 75.1 9.11969 332 395 -63 -19.1 -3.2 2001 80.4 7.11970 437 46B -31 -7.0 -1.4 2259 93.4 3.71971 451 524 -73 -16.2 -2.9 2501 91.2 9.3i972 419 543 -124 -29.7 -4.4 215 100.0 9.71973 391 549 -157 -40.2 -4.5 3501 117.9 17.91974 579 754 -175 -30.3 -3.8 4660 139.5 19.41975 910 1146 -337 -41.6 -6.4 5293 180.9 29.71976 870 1483 -613 -70.5 -9.4 6526 282.9 56.31977 1141 2137 -996 -97.3 -8.9 11163 611.7 116.31978 1392 3165 -1773 -127.3 -8.4 20996 1058.9 73.11979 2600 4296 -1696 -65.2 -6.0 28231 1635.1 54.41980 2950 4668 -1718 -58.2 -4.0 421353 2454.2 50.11991 3234 7719 -4495 -139.7 -6.2 72626 5313.4 116.51982 4903 9530 -4726 -99.4 -5.5 86151 6499.0 22.31993 10195 14755 -4570 -44.9 -2.5 194038 14482.0 122.81994 21728 26694 -4966 -22.9 -1.9 270561 20212.6 39.61985 38691 45763 -7072 -18.3 -1.9 372982 22310.9 10.4
Notes to Table 3:(a) 1950-1964 data on government revenue and expenditures are from O8G Statistical Yearbooks through 19691
1965-1995 data on governeent revenue and expenditures are from INF International Financial Statistics.(b) Source: Economic Analysis and Projections Departeent, borld Bank.(c) Coobined National Consueer Price Index from Table 3-5(1) Annex 3.
16

deficit in 1981 led ance more -to triple digit inflation. Since 1982, the
buiget has been progressively decreased, and, with the exception of the
severe drought year in 1983, inflatimn has been steadily reduced until it
was only 10.4 percent in 1985.
The Balance of Payments and Exchange Rate Disequilibrium
The inflatimnary situation in Ghana has had important consequences
for the balance of payments. As seen in Table 4, the current account has
been in deficit more years than in surplus, reflecting for the most part
inflows of capital and foreign aid. What has characterized the balance of
payments most, however, has been a persistent, and in most years growing,
overvaluatimn of the exchange rate resulting from import and exchange
controls.
This can be seen by caciparing the official exchange rate in Table
4, in either nominal or real terms, with any of several indicators of the
scarcity value of foreign exchange: the black market exchange rate, the
equilibrium exchange rate estimated using the purchasing power parity (PPP)
approach, and the equilibrium exchange rate estimated using a simulation
model based on econometrically derived demand and supply functicns for
foreign exchange. The methods used to estimate the equilibrium exchange
rates and to adjust nominal to real rates are discussed in detail in Annex
2. A brief summary of that discussion is presented in what follows.
The purchasing power parity approach to estimating the equilibrium
exchange rate perceives that rate as reflecting the ratio of the prices of
nontradable to the prices of tradable goods and services. Starting with a
situation of balance of payments equilibrium in the absence of major
17

Table 4
Current Account Dalance, Actual and Equilibriue Exchange Rates (ml
Nominal Exchange Rates (NCIIUSI Real Exchange Rates (MCK/US) (Ib
Current Actual Equilibrium Actual EquilibriusAccount -------------------- --------------------- ------------------- ---------------------
Balante (cl Official Black Model Official Black ModelYear (hillions SU9I (di Market (dl PPP (el If) 1g9 Market (1g PPP 11g lhi
19S8 41.2 .71 .71 .80 .88 .71 .71 .80 .891959 -19.4 .71 .71 .81 .99 .70 .70 .80 .901960 -94.9 .71 .71 .82 1.15 .70 .70 .80 1.131961 -135.1 .71 .71 .81 1.30 .70 .70 .80 1.201962 -62.7 .71 .71 .85 1.17 .67 .67 .90 1.111963 -107.9 .71 .56 .94 1.17 .61 .48 .80 1.001964 -74.9 .71 .59 1.02 1.30 .56 .46 .80 1.031965 -212.1 .71 .65 1.29 2.05 .44 .40 .90 1.271966 -117.5 .71 2.13 1.43- 1.58 .40 1.20 .80 .891967 -69.3 .84 1.67 1.26 1.24 .53 1.06 .J0 .791968 -42.9 1.02 1.75 1.37 1.51 .60 1.03 .80 .991969 -48.6 1.02 1.75 1.39 1.46 .59 1.01 .80 .941970 -66.0 1.02 1.64 1.36 1.57 .60 .97 .80 .921971 -146.1 1.03 1.75 1.42 1.55 .58 .99 .80 .871972 94.9 1.15 1.64 1.45 1.43 .64 .91 .80 .791973 114.2 1.15 1.49 1.47 1.35 .63 .81 .90 .741974 -285.6 1.15 1.73 1.42 1.47 .65 .98 .80 .831975 -26.9 1.IS 1.99 1.66 1.66 .56 .96 .80 .901976 -100.9 1.15 2.91 2.59 2.06 .36 .90 .90 .641977 -138.2 1.15 9.20 5.34 4.17 .17 1.38 .80 .631978 -104.2 1.51 0.76 7.76 6.29 .16 .93 .80 .651979 43.2 2.75 15.56 10.74 9.31 .21 1.16 .90 .621980 -50.4 2.75 15.87 14.95 13.71 .15 .86 .90 .741981 -503.7 2.75 26.25 30.93 36.45 .07 .69 .90 .951982 -191.1 2.75 61.67 39.74 42.41 .06 1.25 .90 .961983 -246.5 3.45 76.58 94.38 81.79 .03 .65 .90 .701994 -201.1 35.34 135.00 123.49 107.47 .23 .89 .80 .701985 -276.3 54.05 160.00 129.32 NIA .34 1.00 .80 N/A
Notes to Table 4:(a) All figures are taken or derived from data in Annex 2.(b) Real exchange rates are calculated from nominal rates by deflating by the ratio of
Ghanas nontradable CPI (inclusive of agriculturel to the Manufacturing Unit Value(MUVI index of exports by industrial earket economies to 4e turping countries,given in Table 2-1.
(ci Table 2-2.(dl Table 2-1.(el Table 2-5, column 1I1.(f1 Table 2-5, column (41.(g1 The nominal equilibrium exchange rate from Table 2-5, coluen (1), deflated as described
In note (bi of this table.(hl Nominal equilibrium exchange rate from Table 2-59 column (41, deflated as described
in note (bh of this table.
18

distortions in 1957-59, the equilibrium rate was estimated by multiplying
the actual rate by the ratio of Ghana's nantradable consumer price index
(CPI) to the manufacturing unit value (MIN) index of industrial ccountries'
exports to the developing natiuiss.9
The simulation model involves an import demand function, a cDcoa
supply function, and a noncocoa export supply function. Each of these was
estimated using annual data for at least twenty years. For the import
demanid function, the domestic price of importables relative to the price of
nontradables was estimated as a function of the level of imports determined
exogenously by government, GDP deflated by the price of nontradables, and an
index of food production. Cocoa supply was estimated as a functim of the
current official producer price of cocoa, the previous year's market price
for maize, the quantity produced of cocoa in the previcnis year, and the
"normal" level of prnduction given the existing stock of cocoa trees. The
last variable was estimated using the "vintage-matrix" model described in
Prnex 4, which takes into accaunt the number of cocoa trees of different
ages, their yields over time, and the rate of new planting, which is partly
a function of price. Finally, a supply function for an index of timber,
gold, and other exports was estimated using as independent variables the
domestic prices of these exportables and GDP, each deflated by the price of
nontradables.
In Annex 2, calculaticns were also made using a weighted average ofthe whDIlesale price index of Ghana's principal trading partners. Theresults were essentially the same as with the MIV index, which is morecomprehensive given the multiplicity of these partners. The MNV indexleaves out petroleum imports, which accounted for 10 to 15 percent of thetotal value of imports in most years since 1972. The greater rise inpetroleum prices is partially compensated, however, by a decline in therelative prices of primary foods, which are also omitted from the MUV index.
19

It was assumned in the model that Ghana would have exploited its
mmonpoly power in the cocoa market by applying an optimal export tax to
equate marginal revenue and marginal cost. This tax rate was related to
the world's elasticity of demand for cocoa, the lamg run supply elasticity
of Ghana s competitors, and Ghana's share of the wDrld market.L° The first
twD parameters were based an independent estimates and were assumed to be
canstant aver time. Ghana s market share was allowed to vary with its level
of cocoa expDrts.
The demand and supply funrctimns were then incorporated into the
model, and the exchange rate was calculated that equates the quantities
demanded and supplied of foreign exchange, assuming no capital flows for
reasmns discussed in Arinex 2. The free trade equilibrium rate was
determined by remraving all distorticns, except for the optimal tax an cocoa
expDrts, a,nd by allowing domestic prices to equal world prices times the
exchange rate.
It is obvious from Table 4 that Ghana's exchange rate has been
substantially avervalued for most of the period studied. This was first
evident at the end of the Nkrumah era in 1965 and 1966. With the
devaluation of the cedi and the partial liberalizatim that followed, the
degree of overvaluatimn decreased somewhat for a few years. All indicators
suggest, however, that it resumed its upward course by 1975 or 1976. In
1983, the equilibrium exchange rate was at least 20 times the official
rate. Oily in 1964 did the degree of overvaluation decline.
10 The long run elasticity was used rather than the shDrt runelasticity because it is assumed that a raticnal geverTiment would want toavoid undercutting its longer term position in the world market to gainshort-term profits.
20

Thus the disequilibrium that occurred in the balance of payments
was expressed not primarily in terms of a current acccunt deficit but by
the degree of exchange rate overvaluatimn in the face of import and exchange
restrictics. The price distortions introcduced had profound implications
for the allocatim of resources that were highly detrimental to economic
growth. Furthermore, the replarement of a market rate of exchange with the
controls necessary to maintain the official exchange rate meant that
substantial quantities of resources were allocated by administrative
decisions rather than by market price signals. This contributed to the
corruption of the public sector and created opportuinities for rent-seeking
behavior that wasted resources and discouraged political action aimed at
seeking policy change.
The Aciricultural Sector
Importance of APriculture in the Ecoraw
Agriculture is the most important sector of the Ghanaian ecocWXmy.
Over ne half of the available wDrk force is engaged in agricultural
production, and arcud 50 percent of total GOP is contributed by the
agricultural sector in a good crop year. Agricultural prckucts make up only
about one-fifth of the total value of imports, but the sector accounts for
approximately two thirds of total export earnings.
As Table 5 illustrates, the share of agriculture in real GDP
fluctuated scmiewhat from year to year but on average remained arLund 50
percent from 1955 through 1983. The share of agricultural workers in the
total labor force declined, however, from 67 percent in 1955 to about 53
percent in 1980. Preliminary results from the 1984 centsus also indicate
21

Table 5
Agricultural Sector (a)
Share AgriShare Agri Share Agri Exports in
Share Agri Share Agri Share Agri Imports Exports Total NoeIn NoM in Real In Labor Agri in Total Agri in Total Value Agri
BP (bl GDP (b) Force (c) leports (d) laports (d) Exports Id) Exports (dl Prod le)Year (1) ) 2 (Million NC) 1) (Hillion NC) 1) 12)
1955 57 50 67 36 20 134 70 381956 55 52 66 37 21 107 62 311957 52 51 66 43 22 104 57 301958 55 51 65 38 22 129 61 331959 56 53 65 47 21 144 63 331960 41 N/A 64 50 19 140 60 391961 35 N/A 63 62 22 146 64 441962 38 N/A 63 51 22 147 64 391963 36 N/A 62 42 16 147 68 371964 35 N/A 62 46 19 149 65 341963 41 47 61 43 13 151 67 251966 43 49 60 46 18 121 63 181967 40 50 60 52 20 161 66 271968 42 50 59 65 21 220 65 311969 46 50 59 66 19 191 57 211970 47 51 58 95 23 338 72 321971 44 50 59 82 19 230 64 211972 47 54 57 85 22 336 60 261973 49 51 57 142 27 407 56 241974 51 52 56 186 20 548 65 231975 48 48 56 122 13 645 70 261976 51 49 55 166 17 608 64 191977 56 45 55 149 12 817 70 131979 61 49 54 225 13 1127 71 91979 60 52 54 229 10 2056 75 121990 58 53 53 313 10 2030 64 81981 53 54 N/A 307 9 1196 44 31982 57 55 N/A 303 11 N/A N/A N/A1983 60 53 N/A N/A N/A N/A N/A N/A1994 49 54 N/A N/A N/A N/A N/A N/A1985 41 52 N/A N/A N/A N/A N/A N/A
Notes to Table 5:1a) Includes forestry and fishing.(bl 1955-1959 data from D. Walters, The National Accounts of Ghana, U.N. Report ITA0/GHA/t,
February 4, 1965. 1960-1978 data based on World Bank, World Tables, various issues.1979-1995 data froe Norld Dank, Ghana: Policies and Issues of StructuralAdjustment, March 30, 1987.
Ic) Data for 1960, 1965, 1970, and 1975-1981 from World Dank, World Tables, 1993, Vol. 2;estimates for all other data interpolated or extrapolated from these years usinglinear trends.
Cd) Ghana, External Trade Statistics, various years. Data for agricultural imports and exportsfor 197S, 1979-e1 frog World Dank, Ghana: Towards Structural Adjustment, Volume 11.Data for total exports for 1972, 1975, and 1979-91; and data for total imports for 1975and 1979-81 froa World Dank, Ghana: Towards Structural Adjustment, Volume 11.
Ce) Agricultural exports divided by the vale of agricultural sector 6DP obtained fromsources listed in Note (b), except for the years 1975 and 1979-91, which come fromWorld Dank, Ghanai Towards Structural Adjustment, Volume II.
22

that the Greater Accra Region grew more rapidly than the rest of the
country from 1970 to 1964,11 though the figures presented earlier in Table 1
suggest that the pace of urbanization has at least slackened, and may have
even reversed itself during the early 19EKs.
Agricultural imports consist principally of cereals, meat, fish,
sugar, oils, and fats. These imports maintained a fairly constant share of
the total value of imports until 1975, when their share began to decline.
Agricultural exports, consisting overwhelmingly of cocoa (96 percent of
the total in 1960), have fluctuated as a proportion of total expDrts because
of variations in local supply ccnditions (principally rainfall) and world
market prices. 2 There has been no consistent trend. Agricultural exports
as a share of total agricultural production, on the other hand, fell sharply
from an average of 36 percent in 1955-64 to less than 10 percent by 1978.
Productimn of Specific Crops
iMre detailed time series data on production of specific crops are
shown in Tables 6(1) thrcugh 6(3). The tables are drawn from Annex 1, which
discusses in detail the sairces of the data and assesses their reliability.
Two major issues energe from this discussion. The first is the extent to
tL' Wbrld Bank, Ghana: Towards Structural Adjustment, October 7, 1965,Vol. 2, p-3 .
M Ghana is a sufficiently large exporter of cocoa to the world marketthat these two influences are not independent. Uhtil the 1970s, theshort-run elasticity of demand abroad for Ghanaian cocoa was estimated to besomewhat less (absolutely) than -1 (Leith, Foreian Trade ReFimes andEconomic Development: Ghana, p.44). Consequently, a shortfall inproduction, for example, wculd force world prices up to the point thatexport earnings would actually increase in comparison with years of averageyield. This situation has changed considerably in the last 15 years as aresult of the erosion that has taken place in Ghana s share of the world market.
23

Table 6(1)
Production Indices (a)(1972:100)
Cereals Staples
Year Maize Rice Sarghus Millet Cassava Yai Cacoyam Plantain
1950 N/A N/A NIA N/A N/A NIA NIA N/A1951 N/A N/A NIA N/A N/A N/A N/A N/A1952 N/A N/A N/A N/A N/A NIA N/A N/A1953 N/A N/A N/A N/A N/A N/A N/A NIA1954 N/A N/A 52 100 18 71 N/A NIA1955 42 33 52 100 18 71 N/A N/A1956 42 33 52 100 18 71 N/A N/A1957 42 33 59 114 29 71 NIA N/A1958 45 43 H/A N/A 38 N/A N/A N/A1959 N/A N/A N/A N/A N/A N/A N/A N/A1960 N/A 46 N/A N/A N/A N/A N/A N/A1961 N/A 43 66 81 N/A N/A N/A N/A1962 42 44 69 66 28 147 N/A N/A1963 45 47 72 69 42 162 N/A N/A1964 42 60. 74 71 43 170 N/A N/A1965 51 46 58 58 39 155 N/A N/A1966 88 41 70 67 41 172 N/A N/A1967 69 60 54 79 41 1B0 N/A N/A1968 63 60 47 58 37 204 N/A N/A1969 75 86 63 91 48 295 N/A 421970 120 70 122 143 84 134 120 981971 116 78 113 132 84 134 120 981972 100 100 100 100 100 100 100 1001973 106 88 109 110 101 89 140 1241974 121 104 116 157 127 125 160 1211975 85 101 121 124 84 104 116 751976 71 100 124 146 64 85 82 751977 69 155 119 127 64 79 76 561978 54 154 79 99 67 80 77 561979 94 133 104 151 62 89 79 491990 95 111 87 83 82 96 69 441981 94 138 86 121 73 87 67 501982 86 51 56 77 87 87 66 451983 43 57 37 41 61 128 76 201984 143 94 N/A N/A 144 N/A N/A N/A1985 102 .128 41 55 108 71 61 40
Notes to Table 6(1):(a) Calculated from data found in Annex 1, Table 1-2(1).

Table 6(2)
Production Indices (a)(1972:100)
Edible Oil Nuts & Seeds
ground- Coco- DilpalsYear nuts nuts bunches Cowpeas Sugar Cane1950 N/A N/A N/A N__ ----------
1950 N/A N/A N/A N/A N/A1951 N/A N/A N/A N/A N/A1952 N/A N/A N/A N/A N/A1953 N/A N/A N/A N/A N/A1954 NA N/A N/A N/A N/A1955 49 N/A N/A N/A N/A1956 49 N/A NR/A N/A N/A1957 46 N/A N/A N/A N/A1959 46 N/A N/A NIA NIA1959 N5 N/A N/A N/A N/A1960 N/A N/A N/A N/A N4A1961 NIA NIA NIA NIA 491962 N/A NIA N/A N/A N/A1963 53 N/A N/A N/A 2701964 56 N/A N/A NIA 2761965 30 NIA N/A N/A 691966 43 NIA N/A N/A 1011967 44 NIA N/A N/A 2031968 69 N/A N/A N/A 1651969 68 N/A N/A NIA 2061970 114 102 99 116 771971 114 102 98 116 771972 100 100 100 100 1001973 142 103 110 81 1111974 175 104 129 119 1181975 124 105 127 119 1411976 126 77 39 133 1311977 91 51 104 121 1781978 93 54 131 B8 1871979 120 54 142 99 1311980 103 N/A N/A N/A 1321981 112 N/A N/A N/A 1311982 123 N/A N/A N/A 761993 79 N/A N/A N/A 691934 N/A N/A N/A N/A N/A1965 N/A N/A N/A N/A N/A
Notes to Table 6(2):(a) Calculated froe data found in Annex 1, Table 1-2(2).
25

Table 6131
Production Indices (a)(1972100)
SeedYear Cocoa lb) Cocoa (c) Cotton Rubber Tobacco
1950 64 61 N/A N/A N/A1951 52 49 N/A N/A N/A1952 61 58 N/A N/A N/A1953 52 49 N/A N/A 61954 54 52 N/A 25 &1955 56 54 NIA 25 61956 65 62 N/A 25 61957 51 48 N/A 25 61958 63 60 N/A 33 181959 78 74 N/A 50 N/A1960 106 101 N/A 50 N/A1961 100 96 N/A 67 NIA1962 101 97 N/A 25 411963 105 100 N/A 25 471964 132 126 N/A 25 531965 99 94 N/A 11 591966 90 87 NIA N/A 591967 102 99 N/A N/A 711968 79 78 N/A N/A 651969 99 98 NIA N/A 651970 101 102 15 5t 531971 112 112 31 83 821972 100 100 100 100 1001973 84 84 146 108 1531974 92 93 192 150 1941975 97 97 231 175 1351976 79 79 692 225 1241977 67 68 877 225 471978 65 67 346 275 471979 73 76 400 275 471990 63 67 231 142 241991 55 58 54 56 291982 44 46 38 59 351983 39 41 38 42 291994 42 44 N/A N/A N/A1985 53 53 N/A NIA N/A
Notes to Table 613):(a) Calculated from data found in Annex 1, Table 1-2(3).(b) Based on official earketing data.(c) Corrected for estimates of sauggling, as
described in Annex 1.
26

which figures on cocoa production in Ghana are underestimated because they
are based an official marketings and do not include the effects of
snuggling. Analysis of alternative estimates of cocoa smuggling suggest
that it may in recent years have amounted to as much as 20 percent of
producktian. This is probably an overestimate, hcwever, since it does not
adequately take into account the deterioration of the transportation system
or the efforts of the government to suppress smuggling. Consequently, the
Cocoa Marketing Board data on official purchases were adjusted more modestly
to show same increase in smuggling during the late 1960s, and again during
the late 1970s, to obtain a maximum of 10 percent of official marketings by
1990. L
The second issue relates to the quality of the production
statistics after the early 1970s. With the general breakdown in the
transport system and the deteriorating situation regarding the governrent
budget, it became increasingly difficult to gather accurate data on area
cultivated, yields, and production through agricultural censuses and sample
surveys. Informed judgements concerning movements in these variables
therefore played a greater role in the collection of data, with all the
possibilities that this implies for error and bias. Nevertheless, the
trends in production that occurred were so significant and were corroborated
by other information to such an extent that the orders of magnitude, at
least, appear to be correct. In addition, efforts to estimate supply
functions for maize and rice, which are described in Chapter 7 of this
report, were quite successful despite the poor quality of data.
-' The alternative indices of cocoa production in Table 6(3) are eachbased on 1972--100, when it is estimated (Annex 1) that actual productionexceeded reported production by about 5 percent.
7

Perhaps the most significant trends shown in Tables 6(1)-6(3) are
a general increase in food procduction until the early 1970s, followed by a
steep decrline during the ensuing years. The only exceptions to this are
rice and sugar cane, both crops that are irrigated. As examples of this
trend, between 1972-74 and 1981-B3, the following production decreases were
recorded: maize 33 percent, sorghum 45 percent, cassava 33 percent, and
plantain bananas 67 percent. Production of yams did less poorly, declining
by only 4 percent.
Production of rice and sugar reached a peak in 1977 and 1978, with
production falling off thereafter. For sugar, this peak was well below the
levels of production that had been attained in the 1960s. Rice production,
on the other hand, grew fairly steadily from the mid-1950s until the late
1970s. Thereafter it experienced a sharp, though somewhat erratic, decline.
Production of the cash crops - seed cotton, rubber, and
tobacco - tells a similar story. Cotton and rubber production peaked
about 1977, tobacco a few years earlier. Each of these crops suffered a
precipitous decline in output during the late 1970s and early 1900s.
Ohe reasnm for the decrease in production of tobacco and food
crops that occurred after 1974 was severe drought from 1975 to 1979, and
then again in 1982 and 1983. The last two years of drought also had a
significant effect on output of rice and sugar because of lack of water for
irrigatimn. Cbtton prcduction appears to have been less affected during the
first period of drought, perhaps because a major program was being
introduced to encourage its cultivation in the north. With improved weather
in 1984 and 1985, production of most crops revived somewhat, though it is
still unclear whether this revival will be sustainRed.
2E3

By the middle to late 1970s, crop production wa5 also influenced
by the disintegration of the system of transportatimn. Shortages of fuel,
tires, and spare parts, plus the deterioration of the road network, raised
transport costs and dramatically decreased the availability of vehicles. In
addition, the decline in the real value of producer prices, discussed later
in this report, contributed to the lack of incentives for cash crop
production.
With cocoa, by far the most important cash crop, the origins of
decline go further back in view of the long gestation period and productive
life of cocoa trees. L After having reached a level of production in excess
of 400,000 tons in 1960, and despite some fairly substantial fluctuations
due chiefly to weather, Ghana maintained output near this level for the next
12 years. Starting in 1973, however, cocoa production began a steep decline
that resulted in a level of production in 1982-64 that was less than half
that achieved earlier. Given the fact that yields of cocoa trees, with
proper maintenance, do not seriously start to decline until at least 25
years after they are planted, much of the decrease after 1972 appears to
have been due to a failure after the early 1950s to replant at a rate
sufficient to maintain prcduction. In addition, declining producer
incentives and the deterioration of the transport system led to decreased
tree maintenance, infestation by insects and disease, lower yields, and
reduced harvests. These issues are explored further in Chapter VII and in
Pnnex 4.
1 Rubber has an even longer gestation period and productive life, butthe dramatic decrease in production after 1979 appears to have bEen due moreto an inability to cover variable costs than to a decrease in the capitalstock invested in trees.
29

Food Constmntian
Indices of total and per capita food production and consumption,
from FAD Producction Yearbooks and Food Balance Sheets, are presented in
Table 7, alcng with data on the average number of calories consunmed per day
per capita. Although incomplete, the data suggest that per capita food
availability, which grew steadily during the 19605 and early 1970s, later
declined to alarming levels. In part this was because of the failure of
food production after 1972 to keep up with population growth. It was also
because the Ghanaian economy during this period was unable to increase food
imports to fill this gap.
Per capita consumption of 1769 calories per day in 1980 must be
considered very low, even if food was spread uniformly across the
population. When one considers differential access to food resulting from
variations in family income and from intrahousehold distribution, the
evidence points strcngly to a problem of severe malnutrition. ND direct
data are available from household consumption and nutrition surveys,
(mweyer, to verify this. There is, in addition, the possibility that the
data on agricultural production are sufficiently imprecise that they do not
serve as a reliable guide to the extent of the nutritional problem that
existed at this time. The food availability situation appears to have
improved after 1983, with the return of good harvests, but the problem of
lack of direct household consumption and nutrition data remains.
30

Table 7
Food Production and Consumption Indices(19722100)
Agricultural Food Agricultural FoodProduction (a) Consumption (b)
Year Total Per Capita Total Per Capita Cal/Day
1961 68 89 N/A N/A N/A1962 68 87 73 93 20151963 71 89 N/A N/A N/A1964 86 105 77 94 20331965 73 87 79 94 20341966 74 86 83 96 20991967 83 94 87 99 21391968 77 86 91 101 21771969 82 89 95 103 22241970 91 97 98 103 22401971 101 104 101 104 22601972 100 100 100 100 21661973 101 99 106 103 22411974 104 99 111 105 22721975 104 96 104 96 20721976 95 85 103 92 19861977 89 77 106 92 19961978 88 74 N/A N/A N/A1979 93 76 N/A N/A N/A1980 90 72 102 82 17691981 91 71 N/A N/A N/A1982 98 69 N/A N/A N/A1983 85 64 NIA N/A N/A1984 100 75 N/A N/A N/A
Notes to Table 7i(a) Source for Food Production data is FAO Production Yearbooks.
For source for popualtion data used to calculate per capitafigures sit Table 1.
(b) Source for Food Consueption data is FAD Food Balance Sheets.For source for popualtian data used to calculate per capitafigures see Table 1.1962 Food Consumption figures represent an average of 1961-1963 totals;19M Food Consuaption figures represent an average of 1979-1981 totals.
31

CHWTER III: TIE EVOLVING PCLITICPL EQMNY-THE RPAYERS
Phy analysis of the political econcmy of price policy in Ghana
must begin by ccotsidering the varicus players involved in its determination.
At one level, these can be described as prcxucers and consumers of different
agricultural products and the government that receives revenue frnm and
contributes resources to the farm sector. The impact of price policy an
these groups is estimated in Part II. This is insufficient to suggest,
however, why certain policies have existed and what has caused them to be
altered over time.
The history of Ghana during the past three decades has been
characterized by frequent changes of govermment and, until recently, by a
generally deteriorating economy. The reasons for this are deeply imbedded
in the sociopolitical fabric of Ghanaian scniety, and any explanatim of
policy change must take into account the role of interest grcups not only as
producers and consumers but also as political actors. It must also
investigate the role of the state as well as that of the brokers, who have
acted as political intermediaries.
Interest Groups
The best articulated interest groups are based cn residence and
occupation. The major residential distincticn is urban and rural. Among
the occupational groups in the cities, sone of the most politically vocal
are teachers and professicnals organized into variaus formal groups such as
the Ghana Associatian of Llniversity Lecturers and the Ghana Bar Associatim.
In the ccuntryside, there are large farmers, who frequently are
absentee and employ sharecroppers or wage laborers to maintain and harvest
32

cocoa trees, to extend and replant cocoa fanrs, and to cultivate food
crops. There are also smaller farmers who live on their farms and under-take
these activities themselves, though they may employ snme outside laborers or
work off their own farms during part of the year. A third group is ccarosed
of sharecroppers who are engaged by larger farmers as caretakers to tend
their cocoa farms once they are planted and to undertake some extension and
replanting. Finally, there are wage laborers hired by the day or task to
plant cocoa trees, harvest cocoa beans, weed and harvest food crops, and
undertake other agricultural tasks.
During the Nkrumah period, the United Ghana Farmers Cboperative
Counxvcil (UGFCC) was established to help organize farmers. Althcigh it was
supposed to be a nationwide organization, its activities were restricted to
the cocoa growing areas. Mbre importantly, it was an arm of the Convention
People's Party (C1P), that was designed to extend the authority of the state
into rural areas and was highly centralized and bureaucratic in its
structure. Although it co-opted a few larger farmers into its
organization, local agents were not elected and it only very imperfectly
represented farmers' interests.L The LEFOC was banned after the fall of
Nkrumah in 1966. More recently the Ghana Federation of Agricultural
Cooperatives has represented Ghanaian farmers in various discussions, such
as those involving the determination of the cocoa producer price, but,
though agricultural cooperatives achieved some importance during the
colonial period, their power was severely undermined by the LUGFCC and their
± Bjoro Eeckman, Organizing the Farmers: Cocoa Politics and NationalDevelopment in Ghana, Uppsala: Scandinavian Institute of African Studies,1976.
33

fnemtership has never included more than a small fractimn of all Ghanaian
farmers.
Aside from farmers, the most important occupational groups in
rural areas consist of traders, transporters, and shopkeepers. Sone of the
more important of these are also large farmers, who are relieved of the need
to remain on their farms by the caretakers they engage. In addition, there
are also vestiges of the urban elite, including civil servants and a few
professicnals.
During the late 1960s and the 1970s, a radical transformatim
occurred in the composition of groups within rural areas. Low cocoa prices
resulted in a marked decline in the number of wage laborers migrating into
the cocoa produring regicns from other areas, especially the north. These
workers instead emigrated to the Ivory Coast with its booming cncoa
industry, stayed in the north to work m ccumercial rice farms, or simply
remained an their subsistence food farms. Second, significant numtiers of
professionals, former politicians and civil servants, workers, and others
frustrated with ecmnomic depressim and low wages in the formal urban
ecanomy renewed their ties with or physically moved back to the
countryside. In the north, they purchased large tracts of uncultivated land
and began to grow commercial food crops, especially rice. Elsewhere, this
rural bourgeoisie invested in a variety of productive activities outside the
purview of the state.
Cutting across the urban and rural groups described here is the
binding tie of ethnicity and regimal affiliatim. Of particular
importance, in this respect, are the Ashanti in the central and west central
part of the country, the other Akan groups to the south of the Ashanti, the
34

Ewe of the vlulta Regian bordering Togo, and a number of other numerically
less important groups along the coast and in the north. Regicnal
identification is also especially strong in the Northern and Upper Regions,
which have lagged ecnonmically behind other areas of the country, and in the
Volta Region, where the Ewe span both sides of the border and are cut off
from the rest of Ghana by the Vol ta Lake. The Brong-Ahafo and Ashanti
Regions, with Kumzasi the Ashanti capital, have for years dominated the cocoa
industry and prcrvided the main resistance to the erosion of its wealth.
Role of the State
The role of the state in Ghana was greatly increased during the
early Nkrumah years as the CRP, with its socialist ideology and its
political base among the new elite of young and educkated, scught to increase
its power in every area of political and economic activity. With the
bankruptcy of this regime brcught on by its continuing efforts to mobilize
resources for its investment program in the face of depleted reserves and
the collapse of the cocoa economy, however, the government lost the
confidence and support of broad segments of the population. Efforts were
made following Nkrumah s overthrow to bolster its legitimacy by the National
Liberation Council, and particularly by the Ehsia governrent, but continued
economic difficulties and a growing lack of confidence resulted in a
narrowing of its constituency and increased centralization of
decisionm-aking in the hands of the Prime Minister.
This tred continued under the military government of Acheampong
and the National Redemption CcLricil (NRC), especially after the October 1975
purge and the creation of the Supreme Military Council (9MC), which became
35

the paramonmt decisicar-making body. By 1976, the NRC/613 had bercame highly
authoritarian and was cut off to a large extent not only from the mass of
the population but also frnm the urban elite of professicnals and civil
servants. Important segments of the populatim simply withdrew from areas
of state influence. The state, in turn, became increasingly coercive as its
power base dwindled.
AcheampoM was forced by the military to abdicate the chairmanship
of the SMC in July 1976, and General Akuffo was installed in his place.
Only minimal changes were introdurced, hnwever, in the centralized apparatus
of decisian-making. After a brief interlude of rule by the Armed Forces
Fevolutionary Counicil (AFRC), Hilla Linann assumed the presidency, but
overwhelming ecornomic difficulties and the lack of a strong political base
som led to a resumption of the centralized, personalized style of
decision-making which alienated practically the entire Ghanaian popilation.
One of the main characteristics of the state in Ghana has been the
institutionalizatimn since independence of judicial and administrative
structures inherited from the colonial regime at the expense of
representative mechanisms that would have allowed for more widespread
political participation. A major reasmn for this has been the monopoly that
these structures have held over the mobilization and distribution of scarce
resources. Furthermore, to the extent that representative structures have
existed, they have beei elitist in nature and have not had clear-cut links
to major portians of the population. Uhder Nkrumah, "the state grew at an
extremely high rate, but without developing an organized base capable of
supporting, financially and politically, its maintenance and
36

reproduction".- Sucrcessive goverrments cantinud "the separation of the
state apparatus frnm representational control that their predecessors had
set in motion."~
The administrative institutions of the state, in the meantime,
became increasingly amenable to social pressures in their control of scarce
resources. Continuation in office depended an the bureaucracy's ability to
placate powerful groups, and, in the absence of political representation for
broad segments of the population, this resulted not in policies to stimulate
growth and development but in increasing corruption and favoritism in the
distribution of the resources at the disposal of the state. This process
was exacerbated as the magnitude of those resources decreased. Eventually,
the capacity of the state to maintain power through the distribution of
resources was so eroded that it had to resort increasingly to the use of
force in place of administrative control.
As the power and influence of the state decreased, that of
alternative political institutions was strengthened. This occurred
particularly in local communities, which were well defined in terms of kin
groups, resident alien migrants, traders, and civil servants. Local
institutions were not dependent upon the distribution of rescurces by the
state at the national level but rather relied on crops grcwn on land held by
local chiefs, kin groups, and landbwiiers. This production was, in turn,
traded for the output of local industries, commercial concerns, and service
2 Beckman, Orcianizinm the Farmers..., p.239
Naomi Chazan, in Anatawv of Ghanaian Politics: Managing PoliticalRecession. 1969 - 1962, Hbulder, Colorado: Westview, 1983, p.24. Mi-ch ofthe discussion that follows is based on this work, which brings together theresults of much of the political research on Ghana during this period.
37

establisihments, through both market and collective forms of exchange. Local
institutions differ-ed froun the state apparatus most markedly with respect to
their representation, consensus, and legitimacy. They were primarily
political and not administrative in nature and were rooted in a common set
of values and guiding codes. Accountability was a key feature of leadership
status.
Patrons
As the power of the 5tate to guarantee physical security, status,
and wealth weakened, local patronage networks grew in importance. With
direct access to the state and its resources increasingly blocked, personal
ties with "big-men" assumed greater importance as a means of gaining entry
into the state orbit. Patrons whox took on the role of broker or
intermediary were at varicus times paramount chiefs, ethic leaders,
religious men, professionals, businessmen, former office holders, military
officers, union organizers, and others with access to decisicn-makers. They
played a key role in linking the top echelons of the state with specific
local constituencies.
Patron leaders arose to assist in the allocation of goods and
services when other channels for their distribution became increasingly
closed. In return, they were rewarded by deference, status aggrandizement,
gifts, favors, and outright bribery. Patron - client relations remained
voluntary, however, and patrons were expected to perform and to avoid
overstepping their boundaries. As the state became increasingly unable to
deliver rescurces through the patronage network, the patrons broke off their
relations with it and joined forces with local community leaders.
38

CHAPTER IV: THE EVOLVINE POLITICAL EOIX74W - THE PERIOD6
This section analyzes the periods thrcugh which the political
ecKormy of Ghana evolved fram 1950 to 1985. It contends that the policies
and instituticns created during the early years of independence not only
were directly inimical to growth and development but also led to the
creation of allocative and distribution mechanisms that inhibited the
exertion of influence by major segments of the populatimn on policy-making
in ways that wculd have contributed directly to their income and welfare.
Furthermore, as successive governments fcunud their resource base dwindling,
their dependence m patrmage networks and their inability to draw upm the
support of important sociopolitical groups resulted in an inability to
undertake the major reforms that would have been necKessary to strengthen the
ec-nomy and to set the stage for long run development.
Liberal Regime. 1950-60
A liberal ecKnomic regime characterized Ghana during its period of
decolonization from 1950 to 1960. The econroy at this time was centered an
the cocoa industry, which was the most important scurce of govermment
revenue and foreign exchange. High prices mn the world market, following a
decline in production capacity during the Depression and World War II,
provided a windfall of resaurces available to the Ghanaian economy.
The Nkrumah regime was strongly committed to enhancing the power
of the state and to mobilizing the resources necessary for its investment
program. To a very large extent, this meant capturing revenue from cocoa.
The regime was aided by the creation of the Cocoa Marketing Ebard (CMH)
under the colonial government during Warld War II, partly in response to
39

pressures exerted by cocoa farmers concerned over the market-sharing and
price-fixing arrangements of foreign firms buying cocoa in Ghana.9- The C(H
became the nmnoipoly buyer of cocoa at a fixed price paid to prnducers, even
though the foreign firms and a few local traders actually purchased and
marketed the cocoa as Licensed Buying Agents (LBA) of the CMP in return for
a fixed allowance per ton. The Board was not supposed to make a profit at
the expense of the producers, though surpluses were to be set aside for
purposes of price stabilization and for activities that wauld benefit the
industry such as research, disease control, credit prugrams, and
cooperatives.
The foreign firms, which were interested principally in
maintaining a steady supply of cocoa, agreed to this policy even though it
restricted their freedom of operation. With the sweeping victory of the CFP
in the election of 1951, the transitional governnient led by Nkrumah brought
the EBard increasingly under its control. The competition for cocoa
revenue was no longer between the foreign firms and the farmers, but
between the latter and the government run by the CRP. Che implication of
this was an increasing share of cocoa revenue appropriated directly by the
government. Prior to 1951, the bulk of cocoa profits had been absorbed by
the reserves of the Ebard. In 1950-51, tax rates were revised and the
government collected one-fifth of cocoa export earnings as duties. This
trend ccntinued under the CPP transition govemnment as cocoa profits were
increasingly diverted from the cocoa sector to general public investment
through a steeply graduated export tax.
a Beckman, OrnanizinQ the Farmers..., p.41. Mich of this section isdrawn from Beckman's work.
40

Duiring the next few years, the CPP struggled to maintain its place
as the party leading Ghana to independence. Che of its major political
opponents was the Naticnal Liberatimn Pbvement, established in Ashanti with
strucg support from cocoa farmers. This organization was never very
successful because of its failure to extend its regional and separatist
appeal to a naticnal constituency. Nevertheless, it served as an important
focal point for farmer discontent over the large share of cocoa revenues
being diverted from producers to the governnent and the compulsory
cutting-out of cocoa trees to control swollen shoot disease.
In an effort to extend its influence in the rural sector, the
t&zumah negime in 1953 founded the Uhited hanw Farnmer s CLoperative Cbunicil
(L1F0C). Although ostensibly supposed to cover the entire country, the
Cbunmicil s activities were confined almost entirely to the cocoa growing
areas. It was financed almost entirely from the commercial operations of
the Cocoa Purchasing Company (CPC), established by the CQB in 1952 to
purchase cocoa in competition with other licensed agents. The CPC had a
decided advantage over the LBA's, however, in that it was also responsible
for the distribution of interest-free advances and loans financed by the
Board to assist planters in redeeming farms pledged to money lenders. Many
of these loans were never repaid. In 1957, the CPC was liquidated as a
result of large-scale financial irregularities, and the UEFCC tmok over its
funicticns. Unlike the Ccmoa Purchasing Company, the L[FOC was not a
subsidiary of the E1ard and operated as any other LBA, except that it was
financed with public capital.
By 1957, the CFP had established its political preeminence in
three elections, and "state powers could now be more directly applied to the
41

largely unsolved problem of establishing an organized political base among
the agricultural producers.`"2 The 1GFCI was declared the only officially
recognized farmer organization in the cauntry. By 1959-'0, it was
purchasing 17 percent of the cocoa crop. Within two years it was granted a
mmnopoly am all purchases of cocoa from farmers within Ghana. The
extensive marketing network of private agents, traders, brokers, and other
middlemen was replaced by an urban-based parastatal organizatian of clerks
and bureaucrats. Since these private middlemen had been drawn principally
from the upper stratum of the farming cammunity, and were "...those most
likely to turn farmer organizaticns against the central government and its
heavy appropriation of cocoa incme`"3, the process of extending CPP control
into the countryside was complete.
The capture of the windfall from high cocoa prices had important
fiscal implicaticris. Government expenditures grew dramatically during these
years. In real terms, total cnnsolidated public expenditures increased by
almost six times over the decade.4 As a proportimn of GDP, government
expenditures rose from 7 tD 18 percent over the same period.' At the same
time, the share of extraordinary and development expenditures in the total
increased from 27 to 36 percent.- Mrbst of these expenditures were directed
2 Beckman, Orhanizina the Farmers*..., p. 7 2 .
B Heckman, OrCcanizinc the Far.ers...., p.107.
Stephen Htymer, "The Pblitical Ecanomy of the Gold Coast and Ghana,"in Gustav Ranis, ed., Government and Economic Development, New Haven: YaleUniversity Press, 1971, p.173. Coisolidated expenditures include those ofthe central government, Cocoa Marketing BDard, railways and harbors, andlocal government.
° See Table 3, Chapter II.
F tymer, "The Political Economy...," p.131.
42

tnwards improving the transport system, expanding health and educational
services, and providing agricultural research and extension.
Imposition of Controls, 1961-63
Cocoa prices began to slump seriously after 1957 as a result of
increases in world supply stimulated by the high prices of the post World
War II period.-- Despite substantial increases in producktion resulting from
new planting because of these earlier high prices, Ghana's export earnings
remained relatively constant. Since produiction and marketing costs
increased more or less proportionately with the expansion of output, profits
were squeezed. Public revenue from cocoa declined in nominal terms from W
67 millicn in 1957 to Nu 36 million in 1960 and NW 13 million in 196 5.a
The governnent, with its large-scale investment program in full
swing, was able to sustain its expenditures for a time by draw.ing down
reserves, but the financial base for its program was seriously eroded.
Government budget deficits accelerated sharply from 11.5 percent of total
government revenue in 1960 to 61 percent in 1963.7 As a ccrseqtence, the
government drew down heavily on CMB reserves and cut prices to prodLicers
from Nt 224/tan in 1961 to N! 167/ton in 1964.10 In this way it was able to
stabilize its cash flows for a time but at the cost of seriously depleting
the liquidity of the CMB.
' The FOB price of cocoa fell from a high of Nk 637/ton in 1954 to alow of W 262/ton in 1965. Annex 3, Table 3-4(3).
Table 34, Chapter VIII.
9 Table 3, Chapter II.
0 Table 10, Chapter VI.
43

To a ccnsiderable extent, the fall in cocoa prices was due to the
expansim of produictian in Ghana during the 1950s and early 1960s since
Ghana acccunted for about 40 percent of total world exports. Despite
Ministry of Finance fears cooncerning the wisdom of continuing to expand
output in the face of falling prices, however, the Ministry of Trade and the
Ministry of Agriculture supported measures to increase production, such as
the mass capsid spraying program of 1958 and the sustained efforts to
cmtrol swollen shoot disease.
In the meantime, public sector investment comtinued to expand as
resources were diverted from cocoa to general development. During the
1950s, emphasis had been placed m infrastructure and social services,
especially educatimn. Che consequence was an increase in requirements for
recurrent expenditures to maintain the roads and to staff the schools built
at this time. The CPP government was also strongly committed to
diversifying the economy and promoting industrialization. The Seccnd
Development plan, launched in 1959, envisaged a radical increase in public
development expenditures commnitted to this goal. Whereas the First and the
"Consolidated" Plans, covering the period 1951-59, had absorbed 118 million
(N 236 millim), the Secm d Plan called for 350 million to be spent in
five years."
Although private foreign investment was to finance a major portim
of this plan, public expenditures were also to be accelerated. By 1960-61,
government expenditures had been raised to a level that was twice that of
the mid-1950s.' Furthermore, when difficulties were experienced in finding
EB eckman, Organizing the Farmers..., p.201.
Table 3, Chapter II.
44

foreign private investment, the government remained deterTined to proceed
with its industrialization program. The problems in the wDrld cocoa market
mnly accentuated this desire because of the perceived need to diversify the
economy. "By 1961, much of the econc3mic philosophy which had marked the
'liberal' 1959 plan had been replaced by a professed belief in the
overriding importance of direct state participation in productimn and
comprehensive state planning."'l
Falling cocoa prices and a rising demand for imports by the
government, for its investment program, and by the private sector, because
of increased income coupled with a liberal trade regime, resulted in a sharp
increase in the current account deficit from $19.4 million in 1959 to $94.9
million in 1960 and $135.1 million in 1961.2o With foreign exch,ange
reserves declining sharply and its budget deficits rising rapidly, the
Nkrumah gcermnent in 1961 resorted to a series of strong measures. An
austerity budget was introduced and taxes were raised. Foreign exchange
controls were also extended, and conprehensive import licensing was
instituted later in the year as it became clear that high duties m imports
were insufficient to achieve a balanced current account. In additimn, there
was a significant reorientation of public investment away from the
infrastructure that had supported small-scale, export-oriented agriculture
during the 1950s and towards large-scale, state-owned agricultural and
industrial enterprises designed to substitute domestic productiom for
imports.
E- Eeckman, Orcanizinq the Farmers..., p.206.
§4 Table 4, Chapter I1.
45

The expansion of public sector agencies that was initiated during
this period resulted by March 1966 in 53 state enterprises, 12 joint
state/private enterprises, and 23 public boards.I5 These were involved in a
wide range of activities, such as brick and tile manufacturing, vegetable
oil milling, paper conversion, gold mining, and food marketing, to give just
a few examples. Although the state enterprises were supposed to be
profitable ventures that would contribute to public revenues, they were also
saddled with a number of political and social objectives, such as providing
jobs for party loyalists, reducing unemployment, and maintaining low
cmsumer prices. As a result of this and general managerial inefficiency,
out of 23 enterprises for which data were available on profits and losses in
1964-65, mnly 9 appeared to have been making any profits, and the net losses
of this sample of firms were in excess of YS 14 million despite the fact
that many operated as virtual monopolies in well protected markets.'6
ANnalysis of individual firms reveals, in fact, that profits were often
earned only because outputs were priced artificially high and inputs
artificially low in relation to world market prices valued in cedis at a
reasomable equilibrium rate of exchange.
The introduction of the 1961 budget and accompanying taxes and
quantitative restrictions was an important turning point in the fortuies of
the CPP goverrnent. Prior to this, Nkrumah had been supported by a fairly
broad segment of the population, especially in urban areas. The austerity
'° Killick, Dtevelopment Ecoanmics..., p.217.
6 Killick, Development Economics..., pp.219-21. Although there wassDme improvement in the profitability of these firms by the end of the1960s, partly because they had passed thrcugh their "infant" stage, netlosses were still close to Ni 10 million annually.
46

policies of 1961, however, alienated many grnups that had been close to the
party, including workers, junior civil servants, and small businessmen. In
addition, farmers were incensed by the continued decline in producer prices
in the face of rising costs of production and prices of consumer goods, as
well as by the imposed cocoa purchasing monopoly of the U1GFOC, which led to
cheating, extortimn, favoritism, misappropriatimn of funds, and other
abuses.'" This resentment was intensified in 1963, when the compulsory
savings scheme forced on cocoa farmers in 1961 was converted into an
explicit tax on cocoa, which was readily supported by the LEFCC as the
"representative of the farmers." The result was heavy criticism of the 1963
budget and of the UGFCC in the National Assembly by representatives fr-m the
cocoa growing areas, joined by backbenchers from the CRP.
Although import restrictions and exchange controls helped to
alleviate the deficit in the balance of payments, the decrease in imports
implied a decline in tax revenues from import duties, which in the
immediate pre-1961 period had replaced the tax on cocoa exports as the major
source of government revenue. This contributed further to the growth in
goverTwnEnt budget deficits, which increased from N% 49 million in 1961 to
N. 101 million in 1963.2- Despite its financial difficulties, however, the
government was determined to go ahead with its Seven-Year Development Plan
published in 1964.
' These are described in more detail in the next chapter.
@ Table 3, Chapter II.
47

Breakdcw of the System, 1964-66
With its foreign exchange reserves seriously depleted, the
governaent increased its borrowings abroad. By the time of the coup in
February 1966, the external debt totaled N 805.3 million, of which only 20
percent was in the form of long-term loans. The remainder was made up in
large part of suppliers' credits (57.9 percent), arrears of current payment
(10.6 percent), and bank loans (6.5 percent).'9 Aside frem the debt problem,
leakages in the trade licensing system resulted in imports not being
allocxated whkere they would have done the most good. Shortages of essential
intermediate inputs resulted in factory closings and underutilization of
productive capacity. Inadequate supplies at official prices of essential
foods contributed to urban unrest.
The development plan never had a chance. Despite a substantial
increase in tax revenue generated by the Nkrumah government in 1964 and
1965, rising government expenditures resulted in substantial deficits,
financed by an expansion in the money supply. World cocoa prices collapsed
in the second half of 1964 as it became apparent that West Africa had a
bumper crop. Farmers were paid a previously agreed price, how.ever, for the
largest crop in Ghana's history - 538,000 tons. After the purchasing and
marketing costs of the CQB and the UGFCC were covered, there was almost
nothing left over frem current income to be paid to the government and the
CM's liquid resources were exhausted. With the government printing money
to meet its expenses and with imports restricted and substantial purchasing
power in the hands of cocoa farmers, inflation increased to 35 percent
V9 Leith, Foreimn Trade Regimes...., p.2B.
48

annually between Orktober 1964 and July 1965. ° The external payments crises
became acute with short-term trade and suppliers credits falling due.
In the face of such pressure, the UGFOC agreed in July 1965 to
reduce the cocoa producer price by 26 percent to 40 shillings per headload,
its lowest level in years. It was also agreed that governnent subsidies an
insecticides and spraying machines would be eliminated and that farmers
would voluntarily reduce further cocoa planting. This agreement was
achieved, however, in meetings involving mnly the CMB, the Cabinet, the
Ministry of Finance, the Bank of Ghana, and other governmment bodies. The
sole voice of the farmers was through the LIFOC. --
In contrast to the situatimn in 1963, and because of the general
atmosphere of natimnal emergency, no protest was raised in the Natimnal
Assembly regarding this sharp reduction in the producer price despite clear
evidence that farmers understood that the setting aside of CM reserves was
supposed to cushimn them from such changes in world market prices.
'Instead, the debate developed into a general attack mn the Farmer's Council
as a monopoly buyer of Ghana's cocoa. Its vulnerable political basis in the
cocoa areas was highlighted by the collapse of market prices. It was
hardly a coincidence that it was the Minister of Finance who launrched the
belated attempt in early 1966 to reform the Farmer's Cbuxncil in a more
democratic and representative directimn. Eeing responsible for fiscal
policy, he had particular reason to be worried about the government's
B Beckman, Organizinci the Farmers ... , p. 21 6 .
Beckman, Orcianizinq the Farmers ... , pp.216-17.
49

political relations with the cocoa farmers and the fictitic.is nature of the
agreenents struck on their behalf by the Farmer' s Council.`2O
The impact of inflation, and especially the rise in food prices,
which increased ckring the first half of the 1960s almnst twice as fast as
those of other consumer goods,23 ccupled with the impossibility of raising
public sector wages because of the disastruLs budget situation, was the last
element in undermining political support for Nkrumah amcang the urban
population. His regime was overthrown by the military in February 1966 and
was replaced by the National Liberation Cbuncil.
Austerity. 1966-67
The officers who led the ccup had a mich clearer idea of what they
were against than what they were for. In particular, they were opposed to
loss of civil liberties, economic hardship, and widespread corruption. In
this they mirrored the bulk of the civilian populatin. They also resented
discriminatory treatment in favor of the President's Cwn Guard Regiment in
comparison with the regular army, which suffered a reduction in living
standards similar to the rest of the urban population. Abowe all, they
wanted "... to restore the political landscape which had existed at the time
of independence in 1957 and which they felt had been eroded..." by the
creation of a one-party state, concentration of power in the hands of an
2 Beckmnan, Organizing the Farmers ... , p.218.
2 Tables 13(1) and 13(2), Chapter VI.
50

executive president, erosion of the influence of the chieftaincy, and the
program of socialist development. 2 4
ohe consequence of this lack of clear focus was that the NLMC
reached out to various interest groups to help it determine what its
objectives should be and how these should be attained. A network of
advisory cOMMittees, commissions, and committees of inquiry was appointed
with representation from these groups. The traditional political structure
- the chieftaincy - was consulted, grievances were aired, and efforts were
made to correct the injuries of the CPP, including the restoration of
traditional authority (stools) and customary rules of land tenure. a In
addition, local private businesses were encouraged through abolition of the
property tax and reduction of sales taxes on local manufacturers, while
rates of taxation on imports competing with domestic production were
increased. There was also a reorientation in the pattern of investment.
The CFP had concentrated development along the coast, with emphasis on
capital-intensive, publically-owned enterprises, many of which were not
financially viable. The NLC favored profitable, labor-intensive projects
that would ease the unemployment problem and bolster the rural econouy.2
Most importantly, the NLC set about trying to stabilize the
econroy and getting inflation under control. This was, in fact, a
precondition for returning to civilian rule. Major responsibility for
economic stabilization was vested in a National Economic Cmnmittee, under
'4 FkRbert Pinkey, Ghana Uhder Military Rule. 1966-1969, Lnndon:Methuen, 1972, pp.1-3.
Pinkney, Ghana Lhder Military Rile ... , pp.21-28.
Pinkney, Ghana Lhder Military Rile ... , pp.30-31.
51

the chairmanship of E.N. Anaboe, the JOverNrent Statistician. There was a
major rescheduling of short-term external debt and the imposition of strict
controls cNer public expenditures and subsidies. The IMF agreed for the
first time to a standby arrangement and provided technical assistance to the
government.
The system for allocating import licenses was altered to try to
ensure efficient mobilization of domestic resources and adequate supplies of
essential commodities for consumers.27 Preference was given to larger
established firms with proven trade and financial contacts. In order to
avoid wasteful competition and underutilized capacity. Nevertheless,
although the corruption of the last years of the Nkrumah period was avoided,
there was still a substantial amount of arbitrariness and inefficiency in
the allocation procedure. 3
The results of this effort were enccuraging. The current accout
deficit was reduced from $212.1 million in 1965 to $42.9 million in 1966.9
Inflation was negative in 1967, principally because of a decrease in food
prices associated with good harvests, and only 8.1 percent in 1968.3° There
was an increase in unemplcyment as government workers were laid off, but
higher cocoa producer prices helped to ease the transition for workers who
returned to rural areas. Nevertheless, urban unrest increase because of
2 Leith, Foreign Trade Regimes..., pp.31-33.
a The operation of the import licensing system under Nkrumah isdescribed in more detail in the next chapter.
Table 4, Chapter II.
*° Table 3, Chapter II.
52

growing unemplcyment, reduced real incomes, and declining expenditures on
educational and health services.
Devaluation and Import Liberalization. 1967-70
The balance of payments situation remained precarious, and there
was considerable dissatisfaction with rigid controls and macroeconomic
austerity. There was also concern over the effect that the risk of changes
in the exchange rate was having on potential private foreign investment and
a realization that donor assistance was unlikely until Ghana corrected its
balance of payments. 9- Rescheduling of medium-term debt prcvided some
immediate relief but was not a long term solution.
In the meantime, civilians were gaining increased influence within
the NLC government as plans for a return to civilian rule were being made,
and many of these people were concerned about the lack of growth in the
economy and the need for liberalization. Ohe of the more influential of
these was Dr. K.A. Eiusia, long an outspoken opponent of Nkrumah's sncialist
ideology.
Busia and others who organized the Progress Party (PP), once party
activity became legal in 1969, provided the intellectual and ideological
underpinning that the NLC lacked. They saw traditional institutions as the
fcundation for continuity and viewed the state as a regulator of private
activity rather than as having an important, directly productive role. As a
national leader, Bhisia conderned the colonial presence, but he was also
steeped in the British heritage and bound to the preservation of colonial
values. He therefore had a high regard for civil liberties and
:3 Leith, Foreiqn Trade REciimes..., p.111.
53

opportu-ities for individual mDbility. He was less concerned over issues of
equality. Finally, Busia and the RP favored close relations with the West,
foreign business interests, aid private investment. 2
This philosophy was especially appealing to professionals,
businessmen, and traditional rulers because it reinforced their basic
position in society. On top of this political base, Busia built an Akan
party that was the successor to the National Liberation Movement, which had
battled the CPP on behalf of Ashanti cocoa farmers during the 1950s. The
Progress Party did not duplicate the forest-coast split of the 1950s upon
which Nkrumah had capitalized, however, but sought to unite all Akan under
one umbrella movement.32
In July 1967, the currency was devalued by about 43 percent, the
producer price of cocoa was raised by 30 percent, and wages and salaries
were increased by 5 to 8 percent.34 Import duties were lowered an some
essential commodities, and the government committed itself to liberalizing
imports over the next few years. As this occurred in the absence of
restrictive macroeconomic policies, h:ovEver, the trade balance began to
deteriorate. For the first few years, this was masked by high world cocoa
prices, substantial foreign aid inflows, and sane debt relief.
Nevertheless, cocoa production remained stagnant in the face of producer
prices that were still low in real terms compared with those that
characterized the 1950s, and non-cocoa exports were frustrated by excessive
s Chazan, An Anatomy of Ghanaian Politics ... , pp.124-25.
Chazan, An Anatomw of Ghanaian Politics .... p.772.
3' Leith, Foreign Trade Reuimes..., p. 1 1 1 .
54

regulations and inadequate incentives in the face of a still overvalued
exchange rate.'5
The Progress Party won the election in August 1969, and Busia' s
government of the Second Republic came to power. Since many members of this
gcvernment had played an important role during the last years of the NLC,
its economic policies were marked more by continuity than by change from
those of the previous regime. What did alter, however, was the economic
environment and the constraints which the government increasingly faced.
Confrcnted with a deteriorating economic situation, the Busia
government undertook a number of policy measures. Shortly after coming to
power, it attempted to alleviate unemployment by expelling all aliens from
the ccuntry thrcough passage of the Aliens Expulsion Act in rbvember 1969.
This antagonized neighboring ccuntries and deprived the economy of some of
its seasonal agricultural labor. The government also tried to accelerate
Ghanaization of small retail trade and other businesses thr-wngh passage of
the Ghana Business Bill, but lack of capital and expertise inhibited this
measure's success. Furthernmore, though the govemment was ostensibly
ccmmitted to improving incentives for farmers, the Cocoa Marketing Enard
retained its monopoly of the cocoa trade, buying from cooperatives and
indigenous Licensed Buying Agents after the LGFOC was discredited in 1966.
Mbst significantly, the goverrnment took advantage of windfall
cocoa profits resulting from high world market prices in 1970 to permit a
rapid expansion of imports and public expenditures. This increased the
balance of payments deficit and flooded markets with imports purchased
: Table 4, Chapter II suggests that the official exchange rate wasovervalued from 1967 to 1969 by 40 to 50 percent in comparison with theequilibrium rate.
55

primarily by the urban middle and upper classes. Food actually became
cheaper during this period in the cities than in rural areas because of
increased imports. As cocoa prices dropped in 1971, however, the balance of
payments deficit became acute.`:
Collapse of Import Liberalization. 1971-72
With accelerating inflation eating away at the devaluation of
1967, the real effective exchange rate on imports declined at the same time
that the import regime was being liberalized. Cocoa prices on the world
market were down and the ga%'ernment was reluctant to raise producer prices
because of its revenue needs. Despite various promoticnal schemes, non-
cocoa exports remained frustrated by neglect and unnecessary regulation.
Exports of timber and minor agricultural crops were controlled by marketing
boards of "dubious prcmoticnal value."`Y With a substantial government
deficit budgeted for 1971-72, upward pressure on prices seemed likely to
erode further import taxes and export subsidies.
In 1971, the trade accoumt surplus that GCana had rum since 1967
to cover its services and transfers deficit, as well as its debt service
payments, no longer existed. Foreign exchange reserves at the end of the
third quarter of 1971 were less than half the trade deficit over the first
three quarters of that year.3 On December 27, 1971, Prime Minister Ehsia
-~ Chazan, Anatomy of Ghanaian Politics ... , pp.159-61.
7 Leith, Foreign Trade Regimes ., p.150.
3X Leith, Foreign Trade Regimes..., p.l51.
56

announced a devaluation of the cedi frnm Ni 1.02/$tI to !K 1.82/$SE.z' At
the same time, import surcharges and taxes on current account payments were
abolished, making the net devaluation about 12 percentage points less than
the gross change in the exchange rate. The 25 percent export and tourist
bmurses were also abolished, thouxgh the affected items acccunted for less
than 10 percent of total current acccunt receipts. Although timber and
minerals received the full benefit of the devaluation, the cocoa producer
price was raised by cnly 25 percent, allowing the government to skim off a
substantial portion of the increased FOB price measured in domestic
currency.
Despite some wage increases, the devaluation implied a huge loss
of real income, especially for heavy users of importables. This was in
contrast to the 1967 devaluation, when suppression of demand and limitations
an imports over the previous 12 months lessened the real impact of the
change in the exchange rate. Instead, it resembled more the situation in
early 1966, when a tightening of import licensing resulted in a sharp fall
in the availability of external resources.° As in the earlier instance,
the result was a toppling of the government, with Eusia being replaced in a
coup in January 1972 by Colonial I.K. Acheampong and the National REdemption
Council (NRC).
In retrospect, it appears that the Busia regime was undermined as
much by its own political weaknesses as by the economic crisis. From the
day it took over the government, it faced strong opposition. First, in
5" Leith, Foreicn Trade Reaimes ... , p.152. Since the dollar haditself been devalued a few days earlier, the weighted (by trade shares)average depreciation against all currencies was 92 percent.
40 Leith, Foreign Trade Regimes ... , p.154.
57

ethnic terms, its Akan base assured the animosity of noncAkan whDo were
excluded from access to state power. Second, in urban areas it was an
elitist party without strong ties to workers and other lower income groups.
This strengthened patron-client relations as chief means by which the
nonelite could gain access to resources controlled by the sate. Third, it
made policy errors that alienated important grcups such as the muslim
community, trade unions, the civil service, students, and the military.
Mbst protests were designed, however, merely to encourage a
redistribution of state controlled resources rather than to change radically
the political system. Opposition was urban based, small in scope, and of
limited impact. Nevertheless, the Busia government s reaction was entirely
out of proportion to the severity of the threat. It broke up
demonstrations, quelled strikes, outlawed opposition newspapers, disbanded
the TUC, and detained political oppcnents. In this way the state became
increasingly isolated and ineffective, more because of its own actions than
because of the stridency of its opposition. The military takeover that
followed had been planned shortly after Busia's inauguration by a small
group of middle-level officers concerned by the erosion of the military's
status and by the decrease of their own material benefits. Its success was
made possible, however, more by the ineptitude of the government in
handling what could be considered reasonable opposition to policy measures
in time of economic difficulty than by the fundamental economic forces at
work.
58

Early Years of the NRC. 1972-75
When it first came to power by means of force, the NRC was
confronted with the problem of establishing some degree of legitimacy in its
right to rule. Demonstrations by the Trade Uhion Congress and the National
Uhion of Ghanaian Students in favor of the new regime indicated some
measure of popular support, but reacticns elsewhere were far more
ambivalent. Many people were of the opinion that the structures of the
Second Republic were fundamentally scund and that more time had been needed
to find workable solutions to the economic crisis.`'
The immediate response of the NRC was to slash prices, revalue the
currency, and reimpose strict import licensing. Debts incurred during
previous years in the form of medium-term suppliers' credits were
repudiated. Blame for the country's economic ills was cast on the
politicians, and depoliticization of the political network commEnced with
the detention and arrest of Progress Party leaders and over 1300
ex-politicians. Freedom of speech was limited, and attacks on government
action were specifically prohibited.
On the more pDsitive side, Acheampong scight to create an alliance
between the military and the civil service, arguing that what was needed was
a technocratic/administrative, rather than a political, approach to
development. He tried to suppress ethnic divisiveness, creating the most
ethnically balanced cabinet since independence, and to promote regional
balance and ties with traditional political units.
Economically, the Acheampong government emphasized self-reliance,
embodied first in the launching of Operation Feed Yourself, which was a
4 Chazan, An Anatomv of Ghanaian Politics..., p. 2 30.
59

program intended to achieve self-sufficiency in food production and to
reduce heavy expenditures of foreign exchange on essential ccmnodities. To
promote greater regional balance, Regional Development Corporations were
set up and charged with overseeing local development projects.4 This
became an important mechanism for channeling input subsidies to particular
groups of farmers, such as those growing rice in the north.
Although the NFC envisaged it role as regulatory and
incentive-oriented, its emphasis was on exhortaticm and moral incentives
rather than economic ones. Operation Feed Yourself, for example, depended
largely upon direct farmer response rather than price incentives. It was
followed in 1973 by Operation Feed Your Industries and Operation Haul the
Food to the Markets. Some success was achieved through backyard gardens and
other public efforts, but fluctuations in production during this period were
probably due more to variations in weather than to anything else.
Furthermore, despite these successes, shortages of food at official retail
prices abounded, and the governoent was compelled to subsidize food imports
and to request large amounts of food aid, especially during the period from
1972 to 1975 of very high world grain prices.
In the cocoa sector, the expensive mass spraying campaigns of the
Busia government were abandoned, and subsidies were instead offer ed for the
purchase of insecticides and sprayers. High prices on world markets also
meant that the government was able to increase producer prices
substantially without cutting into public revenues. This resulted in some
2 Chazan, An Anatomv of Ghanaian Politics .. , p.163.
60

continuation of the planting that had occurred under the NLC and Busia
following the disastrous years of the Nkrumah regime.43
On the industrial side, the government promoted self-sufficiency
by the naticnalization and indigenization of foreign owned or staffed
firms. At the same time, road maintenance all but ceased and import
restrictions severely limited the availability of spare parts.
Distributimn of petroleum products was also closely controlled. One result
was a marked rise in transport costs. The governmmnt, in addition,
attempted to curb smuggling and black marketeering, to control prices of
essential goods, and to divert retail trade from private markets to the
outlets of the Ghana National Trading Corporation.44 The widening gap
between official and parallel market prices, however,only offered an
increasingly strong incentive for rent-seeking activity. Other policies
consisted of tariff reform to increase collection of import duties,
nontraditional export incentives, interest rate ceilings, and investment
incentives.
More importantly, however, was the gcverrment s overall economic
policy between 1972 and 1975. The National F*demption Cbuncil cane to power
in 1972 committed to resuscitating the economy principally by decreasing its
dependence on imports. In addition to tightening import controls, it
attempted to decrease the demand for imports by promoting import
substitution activities, especially food producktion. In addition, efforts
were made to reduce the size of the budget deficit.
A3 Annex 4.
4 Chazan, An Anatonm of Ghanaian Pblitics ... , pp.165-66.
61

Considerable scrcess was at first achieved. In canstant dollars,
the value of imports declined from 1971 to 1972 by 43 percent.4* With
extremely favorable prices on the world market for cocoa, gold, and timber,
Ghana's traditicnal exports, the balance of payments situation improved
dramatically from a current account deficit of $146 million in 1971 to
surpluses of $95 million in 1972 and $114 million in 1973.46 Net foreign
exchange reserves increased to $210 millimn at the beginning of 1974.
Nevertheless, despite the fact that Ghana had repudiated much of its
mediue-term debt, there were still trade credit arrears of about $85
millimn, a backlog of applications to remit profits and dividends of about
$60 million, and government equity capital obligations of $50-70 million at
the end of March, 1974.-'
Furthermore, despite higher cocoa prices, there continued to be
substantial gDvernment deficits that rose from 1971 to 1975 both in absolute
terns and as a share of government revenue and GUP.48 The major causes of
these deficits were an ambitious government investment program and large
wzoe increases to public sector employees in October, 1973 and March, 1974.
The budget deficit, along with N 200 million in domestic debt which fell
due for repayment in 1973-74, was largely financed through central bank
borrowing, especially after March, 1973. Net credit to the government
Ik World Bank, Current Economic Position and Prospects of Ghana,October 18, 1974, Table 39, Statistical Appendix.
k6 Table 4, Chapter II.
4' World Bank, Current Economic..., 1974, p. 1.
1 Table 3, Chapter II.
62

during the following twelve months increased by 23 percent.49 In 1974,
credit to the central govemment rose by 53 percent and that to state
enterprises by 61 percent.
In March, 1974, Ghana and its Western creditors reached an
agreement m rescheduling of the payments dcue n Ghana s medium-term
external debt. Despite this, the balance of payments situation deteriorated
sharply in 1974 because of increased petroleum prices and because issuance
of import licenses far exceeded the import program. In September, 1974, the
value of all outstanding import licenses was reduced across the board by 50
percent and the Open General License system was terminated. Cnmmercial
banks were instructed not to increase credit to finance imports, and import
deposits were required.
As the balance of payments situatin wrsened, the governaient
tried to structure the import bill increasingly away from consumer goods and
toaards industrial raw materials and producers equipment. Restrictions on
food imports, especially rice and maize, resulted in increases in food
prices that were only partially dampened by shifts in production towards
these importables.'° Furthermore, industrial output continued to be
constrained by the lack of availability of imported inputs. All this
contributed to inflatian and undermined increases in wages, producer prices,
and other incentives.
Political support for the regime remained fairly strcrig for its
first two years. The ethnic issue was suppressed by lack of ethnically
inspired favoritism. Patrons associated with the PP who were of Ashanti and
9 World Bank, Current Economic...., 1974, pp. 3,4.
See Table 9, Chapter V.
63

Brcng-Ihafo origin were detained, but, at the same time, Acheampong himself
was Ashanti. There was a feeling of greater equaility of distribution by the
state and less dependence upon the elite-client relations of the Busia
period. There was also fairly widespread support ancig workers, farmers,
civil servants, and other state-based occupational groups. Even the
students were supportive.-L
Macroeconomic mismanagement, however, led to increasing unrest
after mid-1l74. Inflation, which was 9.7 percent per anutmj in 1972, rose
to 18.4 percent in 1974 and 29.7 percent in 1975.n= Formal sector wages,
despite the increases of 1973 and 1974, became progressively eroded in real
terms. A series of coup attempts emanated from vestiges of the CRP and PP
opposition or from the mne ethnic group that was in serious conflict with
the government - The Ewe along the border with Togo.
In Ortober 1975, Acheampong iridertook a purge of the NFC and
created the Supreme Military Council (SMC), made up entirely of military
conuanders. Decision-making was further concentrated in the hands of
Acheampong himself, and the regime, feeling itself increasingly isolated,
became more and more authoritarian. In effect, it retreated from the
broader, somewhat populist political base that it had forged when it first
came to power to its narrower original base of middle generation military
officers concerned principally with power and protection of their material
interest.
M. Chazan, An Anatowv of Ghanaian Politics ... , pp. 2 3 6- 3 7 .
am Table 3, Chapter II.
64

Economic Disintegration, 1976-78
The year 1975 was a critical turning point. Uhtil then, cocoa
prices were high an the wDrld market, food production supplementd by
commercial imports and fool aid was adequate to satisfy most consumption
needs, the macroeccnomic situation was WDrsening but still not out of
control, and state rulers retained a measure of political power.
Thereafter, however, production spiraled doKnwards, cocoa prices fell, the
transportation system deteriorated, food prices rose, and the macroeconomy
cDllapsed. The gDvernmEnt budget deficit rose to 127 percent of total
government revenue in 1976, inflation accelerated to 116 percent per annum
in 1977,53 and balance of payments deficits were held in check only by rigid
trade and exchange controls. Corruption and patronage were rampant, and
civil servants capable of advising on economic policy were without access to
decision-makers. ".w. By 1975 it was clear to even the mDst casual observers
that the state, far from commanding the heights of the economy, was rapidly
losing ccntrol of even the most rudimcntary aspects of econamic
supervision."'4 At the same time, there was widespread evidence that
mosebers of the military were benefitting enormously from the profitable
opportunities created by administrative controls and regulations.40
The economic reasons for this deterioration are apparent. Large
current account deficits, together with sharply rising capital expenditures,
53 Table 3 Chapter II.
'4 Chazan, An InataiW of Ghanaian Politics ... , p. 169.
35 Mike Oquaye, Politics in Ghana (1972-1979), Accra: Tornado, 1980.
65

forced the govermnment to borrow heavily from the Bank of Ghana.O& an the
revenue side, the tax system was heavily dePendent an proceeds frnm cocoa,
and as this sector declined because of lack of incentives, so did public
revenue. In addition, the increasing overvaluatian of the cedi (see Chapter
2) implied that there was less domestic currency to divide the FEB price
of cocoa between government and the farmer. FRvenue from cocoa in 1974, for
exanple, accounted for 46 percent of total governnent revenue; by 1979, it
was only 23 percent, and in 1930 and 1981 it was actually negative because
of the low FOB price for cocoa measured in local currency at the overvalued
exchange rate.-' Furthermore, rising costs of the Cocoa Marketing Ebard
reduced the profits that were available to contribute to government
revenue.A9 In additimn, the ad valorem equivalent of a number of indirect
taxes that were specific, or based on controlled prices, tended to be eroded
by inflation, and collection performance for statutory levies deteriorated.
From 1973-74 to 1977-78, tax revenue as a percentage of GDP declined from
15.1 to 7.8 percent.09
Equally important were such factors as the growth in gonerrnent
expenditures resulting from rising public sector employment, inadequate
administrative control procedures, and the high priority given to the
provision of health, education, and other social services. In addition,
capital expenditures constituted a growing share of the claim an government
-5I6i World Bank, Ghana: Economic Position and Prospects:- Prosperts forExports of Processed Products: Financial Structure - A Flaw of FundsApproach, June 29, 1977, p. 1 1 .
57 Table 8, Chapter V.
5a See Chapter V for further details.
I9 Wbrld Bank, Ghana: Economic Memorandum, April 24, 1979, p.15.
66

resources. Despite efforts to reduce expenditure an low priority
development projects, contracts were awarded or amended without reference to
the availability of funrds and in the absence of effective expenditure
controls.w°
Although scoe external financing was available after the debt
rescheduling agreement in March 1974, most of the deficit continued to be
financed by borrowing from the central bank. The result was a quadrupling
of credit to the government and a growth rate of the money supply (MI) that
averaged 34 percent per arnnum fram June 1973 through June 1976, and 45
percent per annum in the following year. The result was an increase in the
annual rate of inflation from 9.7 percent in 1972 to 116.3 percent in 1977.
This was the highest rate in West Africa and far exceeded increases in
public sector wage rates and in cocoa producer prices.
To check the rise in prices, the government relied mainly an its
prices and inctomes policy. Price controls were ineffective, however, except
in a few formal-sector establisthmEnts, where supplies at these prices were
very scarce. Furthernmore, despite official restraints, private sector wages
adjusted reasanably well to changes in the cost of living, resulting in
substantial disparities between public and private sector wage rates.
Traders, too, benefitted frnm inflation to the extent that they could get
access to goods at officially controlled prices. In any case, trading
margins increased drastically.,1
Low reserves and lack of access to external credit implied that
substantial balance of payments deficits were not possible during the mid
° World Bank, Ghana - Economic Memorandum, April 24, 1979, p. 1 4 .
6 World Bank, Ghana: Ecconmic Position...., 1977, pp.4-9.
67

and late 1970s and early 1980s. The level of imports thus followed the
vagaries of West African weather and the international cocoa market,
together with an overall reduc:tion in the quantities of cocoa produced and
exported because of the aging stock of trees.
By 1977, inflation in Ghana had reached triple-digit levels,
fueled by food shortages and an annual increase in the money supply of 50
percent. Corruption, shortages, and unemployment were rampant as exchange
controls were tightened, taxes on foreign travel were increased, and export
subsidies were raised to 30 percent (20 percent for traditional exports
other than cocoa).2 The smuggling of cocoa exports increased as the
disparity in producer prices for cocoa measured at the black market exchange
rate heightened between Ghana and its neighNDrs. Nevertheless, marketing
and trade of any sort was severely handicapped by the breakdown of the
transportation system due to shortages of fuel and spare parts, and lack of
road maintenance.
All of this served to alienate nearly every political pressure
group in Ghanaian society. The professicnals were at the forefront of the
opposition, and their associations flourished and became highly
politicized. They were soon joined by individual trade unions, teachers,
and students. Religious leaders and women, particularly traders, joined
those opposed to the ErC. Ethnic opposition proliferated as well, as the
Ewe were joined by the Ga, Fante, Ashanti, Brong, Akim, and some groups in
the north. Kumasi, the capital of Ashanti, became the hotbed of
World Bank, Ghana: Economic Pbmorandum, April 24, 1979 p. 18.
68

anti-governmEnt organization. Regional discontent, of ten overlapping with
ethnic dissatisfaction, was widespread.'6
In contrast to opposition during the fusia regime, which was
relatively narrow in focus, the NFC/SMC was faced with opponents from every
quarter. Although this opposition was somewhat elitist and lacked the
populist dimension that later characterized Jerry Rawlings' ascent to power,
it nevertheless was too formidable to permit continuation of the existing
regime. A series of strikes immobilized the country between May and June
1978. Food shortages became acute. Patrons withdrew from the state and
reestablished themselves in self-reliant localities. "In the waning days
of June 1978 the fragmentation was so complete that it became abundantly
clear the SMC was doomed. The only questions were whether the masses would
simply withhold all support for the regime, whether the electorate would
wait for the 1979 date for civilian rule, whether the military would itself
intervene, whether a civilian coup would take place, or whether an all-out
violent uprising would erupt."-', The next month, Acheampong was deposed by
his fellow officers and Lt. General Fred W. K. Akuffo became head of state.
Struggle for Reform. 197E-81
The Akuffo government set about putting the economy back on the
right track in preparation for the return to civilian rule in the summer of
1979. Under prompting from the IMF, the cedi was devalued in Pugust 1978 to
Ni 2.75/$U6, an Austerity budget was introduced, and interest rates were
increased. A currency reform was instituted in March 1979 to rid the
Chazan, An Anatoyw of Ghanaian Politics..., p.242.
4 Chazan, An Anatomv of Ghanaian Pblitics ... , p.269.
69

ecmnomy of some of its mniey in circulation and to sabotage smuggling and
the currency black market. The cocoa prorucer price was increased and
price controls on essential ccmnodities were strengthEned. As a result of
these policies, inflation was reduced to 54.4 percent in 1979.4°
The capacity of the Akuffo governnent to follow through on these
measures, however, was severely limited. It was never thought to be more
than a caretaker govermrnt commnitted to a return to civilian rule in
1979. As a result of heavy pressure, Akuffo decided to lift the ban on
political parties and to convene a constituent assembly. This failed to
reach the radicalized workers, who had beaome alienated from the entire
system, and those local collectivities that had disengaged themselves from
the state. Eighty strike actions were recorded between August and November
1978. Many of these were spontaneous, volatile, and intense. They
continued into 1979 and were met with raids, arrests, and harassmnmts.
Fueled by the austerity program and currency reform, urban unrest finally
resulted in early May in police firing on a group of student dem nstrators
in downtown Accra. The moment was ripe for another military takeover of the
government on June 4, 1979.4e
Unlike previous regimes, the Armed Forces Revolutionary Counlcil
(PFRC), headed by Jerry Rawlings, had strong populist roots. It was
composed of junior and non-ccmnissioned officers with a strong sense of
moral outrage at the crimes and corruption that had characterized the
6 Table 3, Chapter II.
Chazan, An Anatomy of Ghanaian Politics ..., pp. 27 6 - 6 0 .
70
previous military goverTnnent.-.' 5MC leaders, including Acheampcng and
Akuffo, were tried in special courts and executed. Sme bureaucrats were
dismissed; others were tried and convicted. The PFFC sweep was so extensive
that hardly any component of the state apparatus was left unscathed.
A major campaign was also directed against those thought to be
manipulating the economic situation to further their personal interests.
Smiggling, black marketeering, and hoarding were condemned. Market women
were harassed by soldiers and vigilantes, and the Makola market in Arcra
was razed. Controlled prices for basic commodities were closely supervised,
and the Prices and Incomes Board was reactivated to adninister price
controls. Above all, the idea was instilled that people dealing with the
public must abide by fundamental notions of probity and must put the good of
the community above their awn personal well-being.69
There were some adverse consequences of this moral and populist
outburst. Che was a withdrawal of traders from the urban economy, resulting
in high prices and lack of availability of food and other consumer goods.
Another was a fueling of class antagonism, with wtrkers and students
outraged over elite exploitation of the masses. Ethnic cleavages were also
accentuated. Rawlings, an Ewe, was perceived as heading an PFRC that was
dominated by Ga and Ewe. Reactions by Akan, and particularly by the
Ashanti, to OFRC actions were believed to be ethnically inspired. 9
6'- It was reported, for example, that "...66% of all licenses neededto deal in foreign exchange was negotiated through the central bank and thatthe Colonel took a kickback of 107.". Pick's Currency Yearbook, 1977-79,p.259.
dE Chazan, An Anatomy of Ghanaian Politics ... , p. 262.
9 Chazan, An Anatomw of Ghanaian Politics ... , pp. 2 8 2-8 3 .
71

Uhdoubtedly, the most significant outcome of the AFFC interventim
was the emergence of Jerry Rawlings as "...the embodiment of the reformist
and the true patriot. The FRC intercession fostered a peculiar distaste
for military intervention at the same time as it highlighted the Popularity
of its leader.-"7C` This image was strongly enhanced by the PFRC's rigid
adherence to the timetable for civilian electims.
The winner of that electim, which took place in early July, was
the People's Naticnal Party (PNP), constructed fron the remnants of the old
CPP organizatim by Imoru Egala, a northerner who had financed clandestine
cells of the CPP since 1966. Uhable to stand for public office himself,
Egala put forward his nephew, Dr. Hilla Limann, as the party's presidential
candidate. Supporting the party were wealthy patrons, trade-union leaders,
farmers, students, clerks, and the "urban dispossessed." The party was
ethnically heterogeneous, with strcng bases in the north and west. Party
activists had supported Acheampong, Akuffo, and even Rawlings, demmstrating
their opportunism and political survivability. The PNP's major ccmpetition
came frnm the Popular Front Party (PFP), successor to &ksia s Progress
Party, and the Lhited National Cmvention (LtC), which was similar to the
PFP socially but differed from it ethnically in that it constituted a Ga -
Ewe alliance with some Akan representation.'-
The major characteristic of these parties and the candidates they
offered was the reemergence of recognized politicians of the past. All of
these were patrons with strcng ethnic and local ties. There was little to
distinguish between party platforms, despite the ideological differences
Chazan, An Anatcmv of Ghanaian Politics -, p. 2 8 4 .
71 Chazan, An Anatomy of Ghanaian Politics .,.. pp.2Bt6-7.
72

that had characterized their predecessors. Above all the campaign failed to
reach out to the radicalized elements and local communities of Ghanaian
society and had little to do with the poverty and social tensions that
plagued it in 1979. Indeed, the small voter tumnout could be construed as a
rejection by many Ghanaian voters of the hegemony of the middle-class and
their disengagement from the political scene at the state level.-'
Dr. Hilla Limamn came to power in 1979 as the first president of
the Third Republic in a highly ambiguous situation. The econcmy was in a
state of near total collapse, with a budget deficit equal to about 65
percent of total revenue, inflation running at 54 percent annually, severe
shDrtages of all imported goods, and cocoa exports that were less than 75
percent of their level a few years earlier.-- The RNP had few political
resources and was confronted with a Ghanaian public that was cynical and
hostile vis-a-vis the state. Government institutions were in disarray
following the purges of the PfhL Finally, there was Rawlings in the wings:
"My colleagues and I on the PFRC yield the stage to you. You are at the
center of it and the world watches your performance."'4
Despite significant inprovements in the import licensing system,
good harvests, and some decrease in inflation, the government quickly fcund
itself in trouble. The announcement in the spring of 1980 of a bwo-year
agricultural program was unaccompanied by any indication as to how this
would be implemented. A major campaign for reviving the gold industry and
Chazan, An Pnatomy of Ghanaian Politics ... , p.299.
7' Table 3, Chapter II and Pnnex 1.
I Jerry Rawlings, "Address Before Parliament - Inauguration of ThirdRepublic: 24 September 1979."
73

local manufacturing ran up against the problem of how to mDbilize investment
rescurces. New taxes were introduced and tax col]ection was tightened, but
the tax base had been severely eroded When the government raised the
prices of such items as beer, cigarettes, gasoline, and water, consumers
complained that they had already suffered encugh. Efforts to reduce public
expenditures and balance the budget met resistance from workers, who induced
the government to raise the minimum wage, and f rom cocoa farmers, who wanted
higher producer prices. Improvements in the administration of the licensing
system were inadequate to control discretionary allocations and malpractice
induced by the increasing overvaluation of the cedi.
As a result the government was forced to seek larger amounts of
foreign aid. When this failed to yield sufficient revenue, a $1 billion
loan was requested from the IMF, which set as preconditions various
stabilization measures, an increased producer price for cocoa, and
devaluation. Limann balked particularly at the idea of devaluatimn,
protesting that this had led to the fall of Ghanaian governmEnts in the
past .7
Cocoa production declined steeply in 1980 and 1981. Output was at
its lowest level since 1958. At the same time, world prices plummeted.
Gbvernment revenues from cocoa were actually negative in 1980 and 1981
since the world price at the official exchange rate was less than the
producer price plus marketing costs.'* Total debt reached $1.4 billion in
1981 and the goverunnent was $400 million in arrears on short-term debt
repayments. Faced with a growing fiscal and debt crisis, the government
Chazan, An Anatomv of Ghanaian Politics ... , p.312.
' Table 8, Chapter V.
74

resorted to increased deficit spending, which equalled 139 percent of total
revenue in 1961. Inflation rose in the same year to an annual rate of 116
percent.'' The real value of public sector wages eroded despite a tripling
of the minimxm wage in November 1990. With short-term trade payment arrears
piling up, import flows were drastically reduced, resulting in more
shortages and higher prices.
Confronted with these difficulties, the Limann regime suffered
from its identification with the middle-class elite. It was also alienated
from grcnps in the core Akan regions and from the Ewe. The inadequacy of
its rescuirce base implied that the a patronage system was unable to reach
major segments of society. - -
Given the severity of the economic situation and the weakness of
its political position, the government's energies were directed principally
towards averting a further collapse of the formal economy. In its quest for
centralized control, however, the regime proved to be weak and often inept.
Its well-intentioned, but superficial, actions were completely inadequate to
deal with the overwhelming magnitude of the problems.
The failure of the govermment to handle the crisis effectively
provoked expressions of discontent from the organized opposition, which
refrained, however, from seeking immediate changes in the ruling coalition.
Urban gruaps tied to the AFRC and largely excluded from PNP
decision-making, mn the other hand, were mutch more vocal in their
opposition. Students demonstrated, iorkers struck, and farmers agitated.
The Limann government was unable to mollify these highly politicized
`' Table 3, Chapter II.
Chazan, ,n Anatowy of Ghanaian Politics ... , p.310.
75

groups. Heavy-handed tactics began to be emplioyed. Student demonstrations
were forcefully quelled, strikes were repressed, ex-members of the PFRC were
harassed, and Jerry Rawlings was disavowed. Finally, the PNP itself began
to disintegrate as it was increasingly clear that the center of the Ghanaian
state had collapsed. Early in the morning of December 31, 1981, Flight
Lieutenant Jerry Rawlings ance more assumed power and formed the Provisional
National Defense Council (PNDC) to run the government.7
PNDC and the Economic Recovery Program, 1982 - Present
The takeover by the PNDC in early 1962 was in marked contrast to
the intervention of the (FRC in 1979. Whereas the latter was accompanied by
violent bloodshed, the former was relatively quiescent. While the AFR2 was
exclusively military, the PNDC incorporated civilians. Finally, the (FRC
assumed control of the state for a delimited period of time, but the PNDC
was there to stay..°
The new government was faced immediately with a disastrcus
economic situation, includinrg massive budget deficits, spiraling inflation,
the lowest export earnings in years, no foreign exchange reserves, and a
huge foreign debt. To top it off, Nigeria had ,cut off fuel shipments for
lack of payment. The Rawliings government's immediate response was to
curtail current spending, halt the printing of money, demonetize much of
the currency in circulation, close land borders to stem smuggling, and
tighten foreign exchange controls.
79 Chazan, An Anatcov of Ghenaian Politics ... , pp. 314-21.
O Chazan, An Anatomy of Ghanaian Politics ... , p.321.
76

Nagotiations with the 1F, which had been going on under the
Limann govemmnent, were suspEnded until the new regime decided what economic
strategy to pursue. At first it appeared that the PNPC government was
determined to regulate market activity rather tightly since it began in
early 1982, as the AFRC had in 1979, to harass traders in an effort to free
up hoards of goods and to depress market prices. In addition, People' s
Defence Cbmmittees (PDC' s) were set up at plac es of work in towns and
villages to oversee management, with particular emphasis on rooting out
corruption and ensuring the people's participation. To link the PNDC and
the PDC s, an interim national coordinating committee was established with
representatives composed of students and members of the PDCs.
On the other hand, the PNDC also set up the Naticnal Economic
Review Committee (NERC), a high powered body open to varicus opinions, which
began to consider seriously the kinds of policies that would find a welcome
in the IMF and western creditor governments.9- The Committee was charged
with formulating short term policies to get economic recovery underway and
with establishing a medium term recovery program. The NERC completed its
work by May 1982, paving the way for the appointment of Kwesi Botchway,
formerly a law lecturer at the Uhiversity of Ghana and member of the NERC,
to the key post of Minister of Finance and Economic Planning.
The ccumittee' s report appeared at the end of May in the form of a
revised budget for the 1981-B2 fiscal year, which ended one month after the
report was issued. The budget statement listed in detail the failings of
the previous regime but argued that the data base for planning was so eroded
3> Economic Intelligence Unit, Quarterly Economic Review: Ghana,ND. 2, 1962.
77

that fundamental restructuring of the economy could not be undertaken as
rapidly as the situation debanded. The statement went on to list six broad,
but fairly innrcruius, ecanomic objectives. No mention was made of the
plight of the external economy or of the potential roles of either foreign
capital or the multilateral institutions, in particular the IMF. Any
immediate change in this direction was ruled out, in fact, by Rawlings
assertion in April that devaluation was not an option. Instead the policy
goals were more in line with Rawlings' views on the desirability of
self-reliance and self-sufficiency.O-
During the next few mnnths, officials in Ghana maintained contact
with the IMF and the major donors, but the price of needed aid was a change
in the exchange rate, and the government was mcre concemned with institution
building and participation by workers in decision-making than with
correcting the massive price distortions that existed in the economy.
Stronger links were also forged with the eastern block. The anly indication
of an emerging economic strategy was an outline of a three year program,
presented by Hbtchway, which lacked details but seemed to imply increased
self-reliance, self-sufficiency in cotton and major foods, increased use of
local raw materials in domestic industry, and a decrease in the consumption
of petroleum products. A greater role for state control over industry and
trade was envisaged as the primary means of accomplishing these
objectives.Os
am Economic Intelligence Uinit, Quarterly Economic Review: Ghana, Nb.3,1982.
3 Economic Intelligence Unit, Quarterly Economic Review: Ghana,Nb. 4, 1982.
78

By late 1982, the government still remained undecided as to
whether the costs of restructuring the econmWy would be sufficiently eased
by IMF lending to warrant accepting the canditions that would be imposed.
Botchway at this point appeared to favor a modest devaluation. The PNPC was
also torn between its pledge to help the overburdened cocoa farmer and the
dilemma created by converting the FOB price of cocoa into local currency at
the official exchange rate. If the existing rate were to be retained, the
CMB would have to borrow an estimated N 1.8 billion just to pay farmers the
difference between the producer price annouxced by Limann and the expected
FOB price. This would risk adding further to an already high rate of
inflation. Thus the govermeent delayed the start of the buying campaign
while it tried to reach a decision on whether to force farmers to accept a
price cut or to devalue the currency. -
During the closing weeks of 1982 and the first part of 1983,
pressures on the government tightened. Approximately one million Ghanaian
workers were forced to leave Nigeria and return to Ghana. This placed an
enormous burden on the econcmy and its food supplies, especially in view of
the maize shortfall estimated in early 1963 at 378,000 tons following the
poor rains of 1982.
As food prices rose in urban areas, BDtchway anncuriced a plan to
rehabilitate the econamy over the next four years. The emphasis was plared
on reducing foreign exchange leakages, improving tax collection, and
achieving moderate increases in production. Figures for the last quarter of
1982, however, showed that the goverrnent was operating at a large deficit,
04 Economic Intelligence Uhit, Quarterly Economic Review: Ghana,No.4, 1982.
79

with three quarters of its total spending on recurrent costs. In the
absence of capital inflows from abroad, it was unclear as to how any
substantial rehabilitation of the economy was to be achieved. Such inflows
appeared unlikely not only because of Ghana's refusal to devalue the cedi
but also because of the government' s continued emphasis on the need to
strengthEn state control over economic activity. The plan called, for
example, for expansion of the functions of the Ghana National Trading
Corporation in order to put an end to the corruption of officials involved
in import licensing and to insure that ccamissions and profits accrued to
the state. 5
In February 19E3, Rawlings put down the fourth coup attempt in
little more than a year. Negotiaticns with the IMF continued as the
government toyed with the possibility of a dual exchange rate, but it
instead opted for an intricate system of surcharges on imports and subsidies
on exports, amounting to de facto devaluation on current account. The new
1985-64 budget called for substantial increases in the official prices of
most domestically produced goDds, with rice and maize being notable
exceptions, but the T11C quickly expressed its concern about the disparity
between wage and price increases.c-
In June there was another coup attempt. Students protested the
austerity budget and lack of civil liberties, deiwanded a return to civilian
rule, and clashed with workers who supported Rawlings. The TIC continued to
back the government but pressed hard for a substantial wage increase.
E° Economic Intelligence Lhion, Quarterly Economic Review: Ghana,No.1, 1983.
a6 Economic Intelligence Unit, QuarterlY Economic Review: Ghana,Nob.2, 1983.
60

Finally, in August 1963, the IMF approved standby and compensatory
financing facility arrangements totalling $382 million. Once the Fund had
granted its seal of approval, other donors fell in line quickly with offers
of further grants and loans. This began a process of structural adjustment
embodied in the Ecanomic Recovery Program (ERP) amorunced by the government.
The main objectives of the ERP were:
1. to remove the distortions in the ecnanmy;
2. to rehabilitate the industrial, agricultural, and miningsectors;
3. to repair and restore the infrastructural base of theecanomy;
4. to use sound fiscal and monetary policies to achieve andsustain reasonable economic growth over the yearsthereafter.
Phase one of the ERP, termed the Stabilizatimn Phase, concentrated on
eliminating or reducing some of the distortimns in the ecncmry. During the
succeeding Rehabilitation Phase, capacity utilization of local industries
was to be improved by rehabilitation of existing assets. Finally, the
Liberalization Phase was supposed to diminish government interventimn in the
economy by relaxing trade restrictions, thus setting the economuy on a sounid
growth path.
On October 10, 1983, the multiple exchange rates that had been
established the previous April were unified at NW 30/$U6. Subsequently,
Ghana pursued a policy of periodic adjustment, with the rate rising to Nf
90/$4S by early 1966. In September, 1966, a second tier exchange market
was established for most transactions except those involving cocoa,
petroleum, and official debt service, with the rate determined at public
81

auction. On February 20, 1987, the official and auction exchange markets
were unified at the auction rate.
An effort was also made to establish prices, tariff rates, wages
and salaries, and interest rates at realistic levels. Cocoa prices were
raised by 67 percent in April, 1983, by 50 percent in May, 1984, and by 87
percent in May, 1985. Tariff rates for major utilities were adjusted upward
to reflect their cost structures at the new exchange rate. Importers and
domestic producers were also permitted to alter their prices periodically
to reflect the higher cost of imports and increases in wages and other
costs. In December 1983, price ceilings were renmoved an a nurtmer of
imported products, including maize, rice, and sugar, and these prices were
increased to equal the prices of domestically produced equivalents. Where
controls were maintained on 23 other items, prices were jointly determined
by the Prices and Incentives Board (PIB) and by prodxcers/traders under
guidelines established by a tripartite committee of government, employers,
and trade unions. This list was progressively reduced to 8 items by July,
1985. Prices of noncontrolled items allowed full--cost plus a profit margin
to be passed on to consumers but were subject to official surveill lance
under a "reference" price system.
With the depreciation of the cedi, the government was able to ease
restriction on imports. Almost all controls were lifted on imports of
consumer goods paid for with importers own foreign exchange under the
Special Import License scheme. In addition, restrictions on most produicer
goods were removed through access to the foreign exchange auction. In
addition to the easing of quantitative controls, import tariffs were
simplified and lowered.
E2

A number of wage increases were put into effect starting in May,
1983, to offset partially the effects of inflation. The gcvernment's policy
was to reduce the impact of the wage increases on the budget tyy reducing
levels of public sector employment. On October 10, 1983, all interest rates
were raised 3-5 percentage points. Real rates of interest became positive
in 1985 but declined slightly below zero again in 1966 as inflation
accelerated. Rates were raised again in March 1987, with the maximum
lending rate of 26 percent, about double its level fcur years earlier.°'
Fiscal discipline was a major component of the stabilization
program. This was to be achieved in the short run by curtailing the
govemrment's recciurse to the banking system and through large expenditure
cuts. Over the medium-term, fiscal policy objectives included increased
domestic resource mobilization to support larger outlays an operations and
maintenance and an increase in public investment to support the recovery
program. The government was also committed to a phased reduction of its
external payments arrears.
Rehabilitation reforms were drawn up for transport, energy, cocoa,
timber, and mining as part of the goverrnent's 1984-86 recovery program.
These reforms were designed to assure adequate incentives, to improve
management, and to provide inputs and replacement capital. The key export
sectors were allowed to retain part of their foreign exchange earmings to
inport essential raw materials, spare parts, and equipment.aO
°' World Bank, Ghana: Policies and Issues of Structural Adjustment,March 30, 1987, pp.2-3.
aI Wbrld Bank, Ghana: Managing the Transition, Nbvember 7, 1984,pp.5-7; Wbrld Bank, Ghana: Towards Structural Adjustment, October 7, 1985,pp.1-3.
E13

These policy reforms were seriously handicapped in 1913 by severe
drought and the related decrease in domestic energy production. In
addition, slow response on the part of donors greatly increased the problem
of managing Ghana's foreign exchange. Nevertheless, strict fiscal
discipline helped curb the growth of the money supply in 19B4 and 1965,
decreasing the rate of inflation, which was also aided by lower food prices
following good harvests. Furthermore, gross disbursements of medium- and
long-term loans and grants rose sharply in 1964 and 1965, resulting in
greater availability of consumer goods, spare parts, and petroleum
products. The fact that the rate of inflation fell -frcn 123 percent in 1963
to 40 percent in 1964 and 10 percent in 1965, despite substantial
devaluations, is strong evidence that prices prior to 1964 reflected
scarcity values rather than border prices at the official exchange rate.
The result was a significant revival of economic activity as real
GDP increased by 8.6 percent in 1964, 5.1 percent in 1985, and 5.3 percent
in 19B6. 9 Government revenues as a proportion olf GDP also rose from 5.5
percent in 1963 to 8.0 percent in 19B4, and 10.4 percent in 1985.5° The
budget deficit was substantially reduced and re]liance on bank financing
became almost insignificant at 0.9 percent of GDP in 19B4 and 0.8 percent in
1985. Food production decreased in 19E5 in response to the bumper harvests
and lower prices of 1964, but cocoa production rose fran 169,000 tons in
19B4-65 to 226,000 tons in 19E5-61-' as farmers responded to the sharp
W Wbrld Bank, Ghana: Pblicies and Issues..., pp.3-4.
90 Table 3, Chapter II.
9 See Pnnex 1, Table 1-2(3).
64

producrer price increase anncuinced in May 1985. This contributed to a 12
percent expansion of export earnings in 1985..2
Although the Economic Recowvery Program had been largely successful
in achieving most of its initial stabilization objectives by the end of
1986, the process of structural adjustment had just begun. The
rehabilitation of traditional export sectors, particularly cocoa, was seen
as critical to the likelihood of continued success of the ERP. This
included raising proiducer prices, increasing supplies of inputs and ccnsumer
goods as incentives to cocoa farmers, and reducing the operating costs of
the Cocoa Marketing Board. Similar programs were underway for timber and
mining. Equally important were the increased availability of tires,
batteries, and vehicle spare parts, along with the rebuilding of Ghana's
roads, railroads, and ports.
=World Bank, Ghana: Policies and Issues..., p.11.
85

CPd TrER V: G(NOE*EwW PCRLICIES TOWWFRS AGRICL1TURE
The system of government incentives affecting Ghanaian agriculture
consists of the tariffs, taxes, and quantitative restrictians an exports and
imports, as well as the officially regulated prices of outputs and inputs,
credit policies, research and extension services, and general infrastructure
established by the central government.1- The Cocoa Marketing Board has also
played an important role in the extension and marketing services it had
delivered, the input subsidies it has offered farmers, and the claims it has
made an the resources generated by the cocoa subsectar. In addition,
semi-autonomous agencies have administered specific projects and pragrams
aid in so doing have affected the prices and canditions of credit faced by
individual farmers for their autputs and inputs. Finally, there have been
the state farms and other publicly oweed agricultural enterprises.
The implementation of government policies towards agriculture has
been heavily influenced by the evolving political economy in Ghana described
in the previous chapter. Of particular importance have been the price
distortions introduced by policies regarding trade and foreign exchange,
which have often run counter to policies designed to directly influence
agricultural incentives. Equally crucial has been the relative importance
of administrative decisions versus price incentives as mechanisms for
influencing the allocation of resources. Where scarcities have developed
± Mhch of this discussion of government policies towards agricultureis taken from J. Dirck Stryker, "World Bank Western Africa RegionalProject: Ghana, Part II, Economic Incentives and Costs in Agriculture,"Nbvember 1964, which in turn is based on World Bank reports and aninterviews with Ghanaian officials and other experts in Ghana during 1974and 1975. Various Wbrld Bank reports and other studies have been used toexamine the changes that have taken place in these policies before and afterthis period.
86

because of price distortions, goods have tended to be allocated
administratively rather than in response to market signals, aid this has
given rise to bribery, extortion, and other kinds of rent-seeking behavior.
This has resulted in substantial losses in economic efficiency, a transfer
of income and wealth towards the powerful and influential, and an
undermining of the political mechanisms for influencing policy choices.
cocoa Pblicies
Producer prices and the purchasing and marketing of cocoa have
historically been controlled by the Coroa Board (designated the Ccxoa
Marketing Daard, or CMB, thrcughout most of its history), which has used its
surpluses both for stabilization purposes and as a source of government
revenue. Uhtil 1963, the Ibard limited its activities to cocoa, but in that
year it was also made responsible for palm produckts, copra and coconut oil,
shea nuts and butter, coffee, grouncdnuts, and bananas.
During Wbrld War II, the colonial government established a public
miopoly for cocoa exports, replacing the foreign firms that had previously
controlled the export trade. After the war, the export .nopoly was
retained as the Cocoa Marketing Board, while the foreign firms continued to
organize the local purchase and collection of cocoa as the Ebard's
"Licensed Biying Agents" (LBAs). Among the reasons for establishing the CMB
monopoly were:
(1) concern over market-sharing and price-fixing arrangements amongthe foreign trading firms, and
(2) a desire to stabilize domestic prices to producers in the face ofsharp fluctuations in world market prices.
87

Uhder the CMB arrangement, an official prcducer price was determined by the
gpvernnent and anuniciced before each buying seasm. The LAs received a
fixed allcwuance per ton, to cover all expenses of haidling cocoa from huying
point to the ports, plus a profit margin that varied with the price.
Surpluses generated during periods of high world prices were to be used to
finance CMB deficits when wDrld prices were low. In addition, these
surpluses could "... be used for other purposes of general benefit to the
cocoa producers and the industry', including research, cantrol of crop
diseases, credits, cooperatives, and the provision of other amenities and
facilities to the producers"'.2
From the begiming, the CQB accumulated large surpluses, mDst of
which were invested in British governnent securities in order to prevent
inflation in Ghana at a time of high world market prices. The surpluses
were also used for cocoa research and extension and to pay for the control
of swollen shoot disease, including coffpensation for the destructian of
diseased trees. Local expenditures, however, were quite small. Beginning
in 1950-51, the government increased substantially its export duties and
began, as shown in Table 8, to draw off a muich larger share of cocoa
revenue. This was partly because the specific duty previously in effect was
replaced with a graduated ad valorum tax in 1948-49, and the amount of
revenue received from this tax increased dramatically as the average
selling price per ton of Ghana' s cocoa rose by over two and ane-half times
from 1948-49 to 1953-54.3 It was also because of an upward revision in the
ad valor-un rates in 1951, which enabled the gavernment to claim almost one-
2 Beckman, Organizina the Farmers..., pp.40-42.
Eeckman, Organizing the Farmers..., pp.193-94, 279.

Table 8
CKOA Sales, narketing Costs, and Public Revenue
Share of Sales Mi)
Current Total ClPProducer Narketing Payeents Cne Public Current Total
Sales (a) Income (b) Costs to 6oYt (c) Surplus Revenue (d1 Producer Narketing Paysents CHO PublicYear lmill NC) loill NCI lmill NC) msill NC) lmill NC) (sill NC) Income (bJ Costs to Govt Surplus Revenue
1947148 93.0 30.2 3.9 .9 48.2 49.0 .36 .05 .01 .58 .591949149 75.0 65.2 6.6 3.4 -.2 3.2 .97 .09 .05 .00 .041949150 90.2 41.2 6.0 7.0 36.0 43.0 .46 .07 .08 .40 .481950151 140.6 66.2 7.4 26.8 40.2 67.0 .47 .05 .19 .29 .491951/52 103.2 60.0 6.8 29.4 7.0 36.4 .59 .07 .28 .07 .351952153 114.2 60.8 0.6 32.0 12.8 44.0 .53 .08 .28 .11 .391953154 149.4 52.0 7.2 69.0 22.2 90.2 .35 .05 .46 .15 .601954/55 155.0 54.4 7.6 76.0 16.2 93.0 .35 .05 .50 .10 .601955/56 104.6 64.8 9.0 29.2 1.6 30.8 .62 .09 .29 .02 .291956/57 101.4 77.4 10.4 24.0 -10.4 13.6 .76 .10 .24 -.10 .131957/58 125.9 52.0 9.2 52.6 13.0 65.6 .41 .07 .42 .10 .521958159 141.8 61.4 11.0 52.4 17.0 69.4 .43 .08 .37 .12 .491959/60 139.9 65.4 13.4 52.6 8.4 61.0 .47 .10 .39 .06 .441960161 143.2 83.8 21.9 49.4 -11.9 37.6 .59 .15 .34 -.08 .261961/62 138.0 83.6 20.0 54.8 -20.4 34.4 .61 .14 .40 -.15 .251962/63 139.2 81.4 20.6 55.2 -19.0 36.2 .59 .15 .40 -.14 .261963/64 153.9 91.6 22.4 43.6 6.2 49.9 .53 .15 .29 .04 .321964/65 142.4 115.0 37.6 35.6 -45.9 -10.2 .81 .26 .25 -.32 -.071965/66 105.1 75.0 17.2 N/A N/A 12.8 .71 .16 N/A N/A .121966/67 147.3 83.3 17.5 N/A N/A 46.5 .57 .12 N/A NIA .321967/68 237.7 107.4 19.5 N/A N/A 110.9 .45 .08 N/A NIA .471968/69 253.4 94.6 16.3 N/A N/A 142.5 .37 .06 N/A NIA .561969/70 342.7 122.8 19.9 N/A N/A 201.1 .36 .06 N/A N/A .591970/71 279.1 127.2 34.3 N/A N/A 117.6 .46 .12 NIA N/A .421971/72 329.2 139.9 42.0 N/A N/A 146.4 .43 .13 N/A N/A .451972173 351.8 156.3 62.3 N/A N/A 133.2 .44 .18 N/A N/A .391973/74 462.0 156.7 75.3 N/A N/A 229.9 .34 .16 N/A N/A .501974/75 666.0 193.2 124.0 NIA N/A 349.6 .29 .19 N/A N/A .521975/76 634.8 243.4 165.2 N/A N/A 226.3 .38 .26 N/A N/A .361976/77 980.0 248.1 113.9 N/A NIA 519.0 .28 .13 N/A N/A .591977/78 1,143.2 386.6 310.6 N/A N/A 446.0 .34 .27 N/A N/A .391978/79 2,973.3 762.9 426.7 N/A N/A 1,793.8 .26 .14 N/A N/A .601979/80 2,945.8 1,292.0 694.8 N/A N/A 969.0 .44 .23 N/A N/A .331990/81 1,799.2 1,136.0 1,014.7 N/A N/A, -361.5 .63 .57 NIA N/A -.201981/82 1,240.0 2,976.0 1,209.6 N/A N/A -3,025.6 2.40 1.04 N/A N/A -2.441982/83 6,050.5 2,376.0 2,178.0 N/A N/A 1,496.5 .39 .36 N/A N/A .251998314 10,380.0 3,460.0 4,671.0 N/A N/A 2,249.0 .33 .45 N/A N/A .221984/85 15,749.0 5,670.0 8,320.5 N/A N/A 1,757.5 .36 .53 N/A N/A .111995/86 27,342.2 12,791.6 12,524.0 N/A N/A 2,026.5 .47 .46 N/A N/A .07
89

Notes to Table St
Sources: 1947148 through 1964/65 froe Bjorn Becktan, Organizing the Farmers,Uppsilta Scandinavian Institute of African Studies, 1976, pp 279-80.Data are converted fron IC to L using the exchange rate .5NC/L.1965/66 through 1995/86 from Tables 3-312) and 3-413) multiplied bycocoa production adjusted for smuggling in Table 1-23).
Notes:(a) Measured as the FOB price converted to local currency at the official
exchange rate.(b1 1947/48 through 1964/65, Sales minus (Marketing Costs plus
Total Public Revenue); 1965/66 through 1985/8b, Producer Price fromTable 3-3(2) and 3-413) multiplied by cocoa production (adjusted forsmuggling) from Table 1-213).
kc) Export and local duty, voluntary contributions, compulsory savings/farsers' income tax. Loans and grants against reserves not included.
(d) 1947/48 through 1964/65, Current CNM Payments to 6overneent plusC.i Net Surplus; 1965/66 through 1985/86, Sales minus (Marketing Costsplus Producer Income).
90

half of the total sales value in 1953-54, at the same time that the
reserves of the CMB were increased. The farmers share in this year, on the
other hand, was only 32 percent (Table 8).
The cocoa export tax was further increased following the June 1954
elections, while the prcducer price was pegged to its existing level for
four years. Whereas farmers had been reasonably passive regarding the share
of the total value of cocoa sales being sipthed off by the g=vernmlent as
long as producer prices were increased in real terms by two or three times
during the years follcawing Wbrld War II, by 1951 they were pressing for an
increased share. The result was political agitation, expressed partially
through the Ghana Farmers' Congress, which the CPP at the time was trying to
mold into a reliable party organization but later abandoned in favor of the
IGFOC.4 The Coroa Ordinance of 1954 therefore provided a powerful platform
for the Ashanti and other opponents, who left the UGFOC and joined the
National Liberation Mbvement. The Ashanti, in particular, were incensed by
the fact that they shouldered a large part of the fiscal burden but
received little in return since most payments for rehabilitation and
compensation were collected by farmers outside the Ashanti region, and
public investment in general was concentrated in the south, and especially
in the capital of Qccra.
The Naticnal Liberation Mbvement used the cocoa price issue to
reduce the dcudnaince of the CPP by advocating the establishment of a federal
type of government that would redirect a greater portion of cocoa revenue to
the region of origin. This emphasis on changing the structure of government
rather than just its policies, however, enabled the UGFCC to take up the
Beckman, Organizing the Farmers ... , p.193.
91

issue of raising the producer price without being identified with the
opponents of the government. Anxics to dismiss this issue from the ensuing
political struggle, the gcpermwent abandcned its policy of price stability
and increased the producer price from 72 to 80 shillings per headlload.
Despite the decline in world cocoa prices taking place at the time, this
price was maintained thrciugh the 1956-57 season in an effort to demmstrate
that CMB reserves were being used to support the producer price. 5
The cost to the governsnent of depoliticizing the cocoa price issue
was high, as the govermment's share of cocoa sales, inclusive of the CM1
surplus, dropped from 60 percent in 1954-55 to 13 percent in 1956-57 (Table
6), but political victory in March 1957 greatly strengthened the capacity of
the CRP to tap the resources of the rural sector and to penetrate it
politically with the UGFOC. The first step was to restore the share of
cocoa revenue going to the public sector by reducing the producer price to
its 1954 level of 72 shillings per load. The secord step, which follo.wed
the introduction of the Second Development Plan in March 1959, was for the
LGhOC to aninunce on behalf of the cocoa farmers that they were prepared to
accept a reduction in the cocoa price from 72 to 60 shillings per load as
their "voluntary contribution" to the development effort. Shortly
thereafter, the Ccru.ncil was rewarded as the CMB withdrew cocoa-buying
licenses from all the foreign trading companies. Farmer opposition by this
time was fragmented and incapable of generating the political support
necessary to reverse these policies.^
- Beckman, Orcoanizina the Farmers ... , pp.1'96-98.
B Eeckman, Organizinq the Farmers ... , pp. 198-204.
92

The governnent was also subsidized at this time with soft loans
from the CM1, drastically decreasing the BDard's liquid reserves and its
ability to stabilize farmer income. This canfirmed the transformatim of
the Board into an instrument of public finance and ended the illusim that
it had an important independent role in fixing the producer price.
Partly as a result of the expansiam of Ghanaian production of
cocoa from about 220,000 tans in 1951-54 to over 400,000 tans in 1960-63
(Amnex Table 1-2(3)), world prices plummeted, creating severe financial
difficulties for the c(.2'V In an effort to restore falling public
revenues, a compulsory savings scheme was introduced in 1961. Cocoa farmers
were required to pay 10 percent of their gross earnings in exchange for
Naticnal Development Ebnds, redeemable after ten years. COtce again, the
Farmers' Council supposedly spoke for the farmers in agreeing to such a
scheme, as it also did six months later when the farmers purportedly agreed
to renounce their claims to their savings ten years hence. In 1963, the
compulsory savings scheme was replaced by a farmers' inccme tax charged at a
flat rate equal to the previous savings deduction. 0
Farmer hostility towards the L[FCC was not confined to its role in
mobilizing ccntributians from the cocoa sector. The monKopoly granted to the
LGFCC in 1961 created enormous opportunities for the Secretary-Receivers,
the clerks in charge of the local biying centers, to exploit their
7 Beckman, Oruanizina the Farmers ... , pp.204-06.
9 Beckman, Organizing the Farmers ... , pp. 2 0 7 - 1 1 .
93

positions. The list of farmer grievances was very long.9 They included
manipulation of scales and weights, imposition of unofficial levies,
misappropriation of funds, profiteering on the distributicn of farm inputs,
and extortion. Secretary-Receivers were, in turn, required to pay off their
superior officers, thus creating an pyramid of corruption. In addition,
farmers were frequently confronted with delays in selling because the
Secretary-Receivers were not at their posts. Payments were also
occasicnally made with promissory notes rather than with cash, and ultimate
payment was delayed at times up to four months.
Another problem created by the CMB, and the mcnopoly position of
the UGFCC, was the application of high quality standards without offering
farmers a corresponding price incentive. Secretary-Receivers would
sometimes refuse to accept cocoa even though the farmer cansidered it to be
perfectly good. Farmers did not know what to do with grade I! cocoa, which
was no longer accepted.
With respect to inputs such as spraying machines, the problem was
that effective demand was substantially greater than available supply at
subsidized prices. The Secretary-Receivers who handled most of these
inputs were clearly in a position to profit handsomely. After the LUGCC
took aver distribution of insecticides from the Ministry of Agriculture in
1963, mismanagement resulted in severe shortages in scme areas. Because of
considerable public pressure, responsibility for distribution wes handed
back to the Ministry of Agriculture, but the LUFCC continued to play a role
9 Many of these grievances were aired to the Committee of Enquiry onthe Local Purchasing of Cocoa, chaired by John Colemen de Graft-Johnson,which was established after the NLC came to power. The problems cited hereare taken from the discussion of the report of this committee in Beckman,Oroanizino the Farmers...
94

in identifying "legitimate farmers" to be allowed to purchase other inputs,
such as machetes, at subsidized prices through state-owned Ghana National
Trading Corporation stares." 0
Dedurtimn of local UGFCC al lowances and expenses was authorized by
the National Delegates Conference in 1962.11 Acccountability for these
funds was totally absent, however, and misappropriation was common. Delays
at the buying centers also offered abundant opportunities for extortion and
bribery, even though the reasons for the delays may have been beyond the
ccntrol of the local marketing staff. The same was true of shortages of
cash, though rn-the-side lending of these deposits also contributed to the
shortages. Extortion was also cammn as the price to be paid by
transporters in order to haul cocoa away.
With its share of sales revenue seriously reduced and its reserves
frozen in loans to the government, the CM had great difficulty in meeting
its payments during the early 1960s. With the collapse of cocoa prices in
the second half of 1964, after farmers had already been paid the agreed
producer price for a very large crop, there was nothing left to pay the
governnent its cocoa export duty after the purchasing and marketing costs of
the CM and the LUFCC had been covered. In July 1965, the Cocoa Marketing
Board requested, and the Farmers' Council agreed, that the producer price
should be reduced to 40 shillings per load, government subsidies on
insecticides and sprayers should be discontinued, and farmers should
±0 In 1965, and as a result of strong import controls, the freemarket price of machetes was quoted as being six times the official price(Beckman, OrCanizino the Farmers ... , p.1 1 7).
aJ Beckman, Organizina the Farmers ... , describes the veryutndemocratic process by which these delegates were chosen.
95

voluntarily restrict further cocoa planting. In return, farmers were to be
exempt from inccae tax, and local caoucils and other bodies were prohibited
from imposing levies an cocoa farmers without their approval.
Farmers were strcngly opposed to this agreement, but "No voice was
raised against the sharp reduction in the producer price in the Natimnal
Assembly debate on the motimn. Instead, the debate developed into a general
attack on the Farmers Crunrcil as a monopoly buyer of Gbana's cocoa."'-a As
had been true with the National Liberation Mbvement nine years earlier,
cocoa farmers were more concerned to change the structure of the system than
to influence producer prices. This illustrated the degree to which price
policy and its administration were linked with the issue of political
representatic. The vulnerability of the political base of the UGFCC in
the cocoa growing areas was highlighted by the collapse of world market
prices, and it was ultimately the Minister of Finance, worried about the
fiscal implicaticns of the governfent's relaticos with the cocoa farmers,
who belatedly tried in 1966 to push the CoLzlcil in the directimn of more
democratic representation.
The 26 percent decrease in the producer price of cocoa seriously
reduced incomes in the cocoa sectors, especially in view of the fact that
prices in late 1965 were rising at about 30 percent per year. With
production in 1965-66 returning to more normal levels following the bumper
harvest of 1964-65, producer income from cocoa decreased in real terms by
about 60 percent of its level in 1964-65. Yet salaries of UGFCC staff were
Be Eeckman, Orcanizina the Farmers ... , p.218.
96

increased in 1965, and CM employees were granted a cne mnnth salary
bEnus. 1
With the fall of Nkrumah and the coming to power of the NLC, the
LFGOC was dissolved and African individuals, partnerships, cooperatives, and
companies that could handle at least 5000 tons of the main cocoa crop were
licenced to purchase cocoa from the CMB. Because the number of buying
agents was judged insufficient to handle the crop, however, the Produce
Buying Company was established in 1966 as a subsidiary of the CMB to
participate in the purchase of cocoa. To further encourage cocoa harvesting
and marketing under the new system, the producer price was increased to 50
shillings (NX 5.00) per headload. In addition, farmers were paid a bonus
for Grade I cocoa in order to upgrade the quality being sold. Finally,
public sales of insecticides and sprayers at subsidized prices were resumed,
initially through the Ministry of Agriculture and later through the Cocoa
Marketing Board. 4
During the period from 1967 to 1977, the system for purchasing and
marketing cocoa progressively broke down as economic conditions in general
deteriorated and CMB costs became an ever greater proportion of total F(B
sales converted to local currency at the increasingly overvalued exchange
rate. As shown in Table 8, these costs in 1967-68 accounted for 8 percent
of the total value of sales, whereas by 1977 the CB s share had risen to
27 percent. Producers, on the other hand, received 45 percent of total
Bateman, Oroanizina Cocoa Farmers ... , pp.218-22.
P4Republic of Ghana, "Government Statement on the Report of theComnittee Appointed to Enquire into the Lncal Purchasing of Cocoa," W.P. ND.3/67.
97

sales in 1967-68 and 34 percent in 1977-71, while the government s share was
47 percent in 1967-68 and 39 percent in 1977-78.
The initial CMB ordinance of 1947 specified that surpluses of the
CMB should be retained as reserves to be used to stabilize producer prices,
to finance cocoa purchases, and to prmsvide assistance to farmers in all
aspects of production. New legislation enacted by the Nkrumah goverrnenet in
March 1965, however, required the CMB to transfer all operating surpluses to
the central governeent, including all reserves held at the time.-" Thus
the distinction between CMB payments to the gvernment and its net surpluses
was erased.
As the macroeconomic situatimn deteriorated during the 1970s, the
block allowance provided to the Licensed Buying Agents (LEs) became
increasingly inadequate to cover their costs. Further-more, the smaller
companies had difficulty in financing cocoa purchases following the
abolition of the chit system in 1973 and its replacement with the statutory
requirement that all purchases be paid for in cash. Censequently, the LBAs
began to withdraw from the cocoa buying campaign, and the Produce Buying
Agency (formerly the Produce Buying Company) increased its share of the
market. By 1975, the PEA was purchasing about twor-thirds of the crop, and
almost all the rest was being bought by the Ghana Cooperative Marketing
Associatimn Ltd. (GCMA) from farmer cooperatives acting as sub-agents."
This did not solve the problem, however, since lack of road maintenance and
Wbrld Bank, Eastern Region Cocoa Project - Ghana, Arnex 1, p. 3 .
IWorld Bank, ADmpraisal of Ashanti ReFion Cocoa Project - Ghana,Nbvember 18, 1975, p. 1 2 .
98

a shortage of spare parts caused transportation costs to rise more rapidly
than the share of cocoa sales allocated to the CMB.
In 1977, the PBA and the GEMQ were merged into the Produce Euying
Division of the CMB, which was granted a moiopoly on cocoa purchases,
ostensibly because of the inability of the LBQs to settle outstanding debts
totalling N65 million and because of favoritism and corruption associated
with their activities.." In practice, however, the PBD (later the Produce
Buying Ccmpany) became a very costly organization, which by 196l was
operating 4300 buying centers, each with four full-time, year-rcxund
employees.1-
The problem of burgeoning employment was not limited to the PHC.
At the time of its dissolution in 1966, the LUFCC was the largest commercial
establishment in Ghana, employing over 13,000 people. By 1982, the Cocoa
Marketing Ebard and its subsidiaries were paying the salaries of 105,000
workers, 20,000 of which were later determined to have died or to be no
longer working for the Ebard. The large fixed costs of the CMB implied
that, with declining production and an increasingly overvalued cedi, the
share of the Ebard in total sales continued to rise. In 1981-82, with the
equilibrium exchange rate equal to 15 times the official rate, CMB costs
exclusive of the price paid to the producer actually exceeded the value of
FOB sales at the official exchange rate. Even in 1985-86, after the cedi
1 Kwesi Ahwoi and Pn-andan Nar-ayanan, "Restructuring the CocoaMarketing System in Ghana - Some Application of the Malaysian Experience,"World Bank, July 1 - August 15, 19b6, p.5.
1E FAD, Ghana - Third Cocoa Project, Draft Report of the FAO/WorldBank Cooperative Programme, Investment Centre, 29 August 1986, p.15.
99

had moved frm Ng 2.75/$ to NW 90/$, CMB costs still accounted for 28
percent of the total value of sales.'
Although there are no detailed studies, such as the de Graft-
Joh-ism report cn the ULFCC, to document the administrative problems
involved in cocoa purchasing in recent years, there is evidence to suggest
that the PBC's oxnopoly m cocoa purchases has had similar problems. By the
1981-82 crop year, for example, there was a cumulative backlog of unshipped
cocoa equal to me-half the harvest of that year because of weak management
and inadequate transportation.7-0 Lack of credit, moreover, resulted in
delayed payment and farmers being issued ICUs in lieu of cash. Corruption,
embezzlement, and diversim of cash was so commnm that, in 1982-83, a system
was instituted in which farmers were paid by check. For this purpose, 14
banks were established in the cocoa growing areas. This posed severe
problems, however, for farmers who had to travel, in many cases, lang
distances to cash their checks.
As the costs of the CMB increased relative to total sales, the
share of farmer inccae declined. At first, however, there was a concerted
effort following Nkrumah's overthrow to raise produicer prices.21 As can be
seen from Table 9, the real prockacer price increased, as a result, by 35
percent frcxn 1965 to 1968. It then fell by 16 percent from 1968 to 1971
9 J. Dirck Stryker, "Determination of the Cocoa Producer Price: ATechnical Nbte," prepared for the Gcvernment of Ghana and the World Bank,October 22, 1986.
I? Eccnomic Intelligence Uhit, Quarterly Economic Review, 1982.
21 Following the initial price hike by the NLC to NV 5 per headloadin 1966, the producer price for cocoa was increased to NV 6.50 in 1967, NV7.00 in 1968, and NV 8.00 in 1969 (World Bank, Easter Reoion Cccoa....Annex 1, p.31.
100

Table 9
Real Producer Price of CocoaINC/at)
Nominal RealProducer Rural Producer
Price la) CPI lb) Price (c)INC/et) (1972=100) (in 1972 NC)
Year (1) (21 (3)
1953 269 39 6981954 287 37 7921955 299 37 7991956 280 38 7331957 269 40 6791958 239 40 5991959 224 40 5601960 224 41 5461961 224 42 5391962 220 44 5011963 202 48 4201964 197 53 3511965 187 67 2791966 224 76 2941967 254 70 3641968 284 76 3761969 293 81 3631970 293 84 3491971 293 92 3201972 366 100 3661973 439 117 3741974 499 138, 3541975 585 176 3331976 732 279 2631977 1333 606 2201978 2667 1058 2521979 4000 1685 2371980 4000 2714 1471981 12000 5683 2111982 12000 6962 1721983 20000 15985 1251984 30000 22119 1361985 56600 24064 235
Notes to Table 9:(a) From Table 3-3(2).(bi 1953-1966 figures are linked to the national combined UI
from Table 3-5(1).Source for 1967-1969 and 1971-1972 is lorld lank, Shana:
Economic Position and Prospects, vol. 1, June 29, 1977,Table 6.
Source for 1970 and 1973-1982 Is Shana Policies andProgram for Adjustment, World lank, June, 1913, Table 7.3.
Source for 1993-1994 Is Ghana Towards Structural Adjusteunt,World lank, vol. 11. October 7, 1995, p. 80.
Source for 1985 is Statistical News Letter, StatisticalService, August 18, 1996, vol. 11.
lc) Column 11) divided by coluen 12) multiplied by 100.101

under Bisia' s civilian regime, increased by 17 percent during the next two
years under the NRC, and began a prolonged plunge in 1974, which did not
bottcm out until 1983 when the real produkcer price was only 34 percent of
its level in 1972. Only in 19B5, after inflation had been seriously slowed,
was the increase in the nominal producer price sufficient to cause a
significant rise in the real price.
The share of farmer income in the total value of sales follced a
different course. Because of low world market prices, farmers earned 81
percent of sales in 1964-65 but only 36 percent in 1969-70 after world
prices had recovered. Their share subsequently increased to 44 percent in
1972-73 and then declined to 29 percent in 1974-75 as a result of the
international commodity boom. Thereafter the farmers share oscillated
between 26 and 47 percent except for 1980-81 and 1981-62, when world prices
was depressed and government revenue was actually negative.
As produicer prices declined in real terms, farmers and middlemen
were encouraged to smuggle cocoa across the frontiers with neighboring
comutries, particularly the Ivory Coast, where prices were quite favorable
at the black market rate of exchange. Estimates of the extent of this
smuggling are presented in Annex 1. They suggest that as much as 20 percent
of the crop may have been smuggled out of Ghana in recent years, though
because of poor transport conditions and periodic government crackdwnis a
more reasonable estimate is about 10 percent. The effort going into
smuggling and attempts at its control resulted in a substantial waste of
resources and contributed to the undermining of governmental authority
through bribery and other forms of corruption.
102

Tradable Foods
Imported agricultural products have over the years been subject to
a variety of controls and regulations that, in gener-al, have caused the
domestic price to consumners to exceed the CIF price plus relevant margins.
During the colonial period, food was imported into Ghana by a number of
general import/export houses with wholesale and buying branches throughaut
the country. The main depots in the regional capitals served as the
principal outlets for this food. Although these networks remained in place
after independence, the government reduced their market shares by
establishing public trading monopolies and import licensing policies that
favored small Ghanaian importers, exclusive government departmental trade,
and subsidization of nonccommercial distribution systems.~
During the Nkrumah era, the Ghana National Trading Corporation
(GNTC) was given a public ffonopoly on imports of "essential" food
commodities, such as wheat, rice, maize, sugar, and vegetable oils. These
were sold, in turn, to licensed wholesalers or thraugh the GNTC's own retail
outlets in urban areas. To the CIF price was added an import duty that
varied over time and across commodities, but averaged 10-25 percent, plus
the cost of handling, transport, and working capital. Retail prices of
these ccmmodities were supposed to be officially controlled. These controls
were generally respected in retail stores, but prices in the market were apt
to be higher.23 As inflationary pressures built up, nmreover, these
&'World Bank, "Marketing and Input Supply," Ghana: AgriculturalSector Review Background Paper 5, January 15, 1985, pp.151-2.
= R.N. Ghosh, "Price Build-ups of a Few Imported Food Commodities inGhana," Technical Publication Series No. 32, Institute of Statistical,Social and Econonic RPesearch, Legon, 1972.
103

differences were accentuated and cammodities became increasingly scarce in
the state-coned retail outlets, as well as in other stores that were
required to sell at controlled prices.
The gap between the free market price and the cost of acquiring
imports at the official exchange rate led, during the Nkrumah period, to
widespread rent-seeking behavior. ' In the granting of import licenses,
for example, bribes of 5 to 10 percent of the value of the license were the
norm unless importers had personal contact with the Ministers of Trade or
Industries. Cumbersome procedures were evolved to assure the issuance of
licenses for priority purposes, but these inevitably allciied a certain
amoumt of discretion to government officials in charge of implementation.
The result was not only a transfer of income to these officials but also
substantial inefficiencies. In some instances, for example, import licenses
were revoked after imported goods had already arrived and were awaiting
clearance at the port.
After goods were imported under official license, the government
had neither the administrative controls nor the data to influence their
allocation and to prevent profit-taking. Instead, a number of mechanisms
came into existence that bypassed any effort towards public regulation of
private sector marketing of imported goods, including food. Of particular
importance was the grcuth of sales by large distributor firms, including
the GNTC, to wholesalers rather than to ccnsumers directly through the
distributors' own retail outlets, which tended to be more tightly
controlled. Since large open sales to individual wholesalers would attract
attention, these were frequently disguised as retail sales, with people
2 WDrld Bank, "Marketing and Input Supply," p.156.
104

hired to stand in line for cash purchases. Q^Eues were also used by the
distributors as a means of discouraging retail sales at official prices
since very limited quantities of restricted items such as milk, sugar, and
rice wwld be sold at a time. Once the token public sales were made, the
rest of the goods wculd be clandestinely transferred to selected customers
at much higher prices.
Goods that were in scarce supply at visible retail outlets were
often sold in much larger quantities using the passbook system, which
originated in Ghana following the First Wbrld War. Under this system,
women would receive goods on credit from the large trading hauses and would
sell retail on commission within the informal sector. This proved to be an
excellent mechanism to subvert the price control system since passbook
holders generally sold only to clients that were well known to them
personally. Of the 20,000 or so passbook holders in 1964, very few used
shops or stores for their retail, or in sawe cases sub-wholesale, sales.
Since the passbook system was legal and yet the prices at which goods were
eventually sold to consumers were much higher then their actual cost,
district and sales managers of the distributors received substantial
kickbacks. In some cases they had passbooks operated on their cw4n behalf.
In addition, the "chits" issued by sales managers for the release of goods
were often sold separately.
Even where outright graft was not involved, scarce goods were
frequently allocated on the basis of family ties, friendships formed in
student days, and other types of favoritism. This often required repeated
visits to the person able to authorize the release of gccds, long waits
outside his office, and other wasted resources. In many cases, the goods
105

were never actually acquired by the individuals involved, but the chits were
sold to waiting dealers an leaving the office.
Although there was a major effort after Nkrumah tD clean up the
graft and corruption associated with import and exchange controls, official
price structures, and administrative allocaticn of resources, the impact of
this effort was short-lived as long as the incentives for rent-s eeking
activity existed. In the traded goods sector, these incentives are perhaps
best exemplified by the ratio of the black market to the official exchange
rate. In 1966, at the end of the Nkrtunah era, this ratio reached its first
peak of 3.0.A5 By 1969, the ratio had fallen to 1.7, and it remained at
approximately this level until 1975, when under the SMC the macroeconomic
situation began to deteriorate sharply. Thereafter, the incentives to
divert goods from the official distribution network to the private market
increased dramatically, with the ratio of the black market to the official
rate of exchange rising to a peak of 8.0 in 1977, then falling to 5.9 in
1978, and finally increasing to a new high of 22.2 in 1983 before a series
of devaluations and, ultimately, adjustment through public auctions reduced
the ratio to about 1.2 by late 19B6.
The consequences of these distortions relating to govermnEnt
policies regarding tradable foods were predictable. With increasing
differences between the CIF price in local currency and the domestic market
price of rice, maize, sugar, milk, and most other importable products, the
profits to be gained from access to scarce goods at official prices became
2 Table 4, Chapter II.
106

immense. This gave rise to rent-seeking behavior an a massive scale.2
Frequently involved were military officers, who obtained the necessary chits
that they then turned over to Ghmnaian women with access to the pr-ivate
marketing network. The right chits, especially if signed in green ink by
Colonel Acheampong, provided access to foreign exchange, import licenses,
bags of grain, or whatever else the bearer desired. By 1976, sugar, rice,
flour, and other coimmodities acquired in this way sold on the private market
for at least five times the controlled price. Less and less time was spent
in formal sector employment, including the gvernmnent, in which wage
increases did not match the rate of inflation, and an increasing amount of
effort was devoted to informal rent-seeking.
What was particularly disturbing about this system, as it
continued through successive gpvernnts into the 19EKs, was that people
who potentially had access to scarce goods through the system spent a great
deal of time and effort attempting to acquire the goods at the expense of
directly productive activity. Furthermore, periodic gcPvernment crackdowns
on smuggling and profiteering only increased the cost of rent-seeking
activity without substantially reducing its level.
As the economic situaticn continued to deteriorate, imported goods
became increasingly scarce, and time spent in rent-seeking activity became
less privately productive. It was at this point during the late 1970s and
early 1980s that a large number of Ehanaians dissociated themselves from the
kalabule system and committed themselves simply to informal sector
-6 The system of profiteering took on the name of "kalabule",probably from the Hausa expression "kere kabure", which means "keep itquiet". A detailed description of this system in contained in Mike Oquaye,Politics in Ghana (l972-1979), Accra - Tema: Tornado, 1980.
107

activities in the cities or, in many cases, in the coutryside. Imports of
tradable foods, such as rice and maize, had by this time fallen to less then
10,000 tons per year, except when food aid could be obtained, so that
domestic grain prices were largely divorced from those on the world market
and were determined instead principally by local demand and supply
conditicns.
This situaticn continued until very recently, when food imports
were increased ance more under the Economic Recovery Program. In additian,
the mnxropoly of the Ghana National Procurement Agency (GNPA) on imports of
essential foods, which had been initiated in 1976 to take advantage of bulk
buying opportunities, was broken as private traders were authorized as of
the end of 1985 to use their own foreign exchange to import fod. Despite a
35 percent margin on the CIF price, which was designed to cover
administrative overhead, working capital costs, a "ca..ission", and profit,
the GNPA was at this time in severe financial difficulties because of
mismanagement and inefficient purchasing from overseas suppliers.27
In an effort to substitute local production for food imports and
to stabilize prices for local produciers, the government for many years
tried to increase the share of oatput being handled by public trading
agencies. During the late 1960s and early 1970s, the Grains and Legumfes
Developnent Board (GDB) was responsible for buying and storing maize, rice,
and palm oil in an effort to stabilize prices. In 1975, the Marketing
Division of this agency was taken over by the Ghana Food Distribution
Corporation (GFDC), which had been established in 1971 to market perishable
foodstuffs on which it experienced substantial losses. At the same time,
IWobrld Bank, "Marketing and Input Supply", p.156.
106

the Rice Mills Uhit (FRIU), which had been part of the GDB, was made an
autciomxis body under the Ministry of Agriculture.
The grain marketing activities of the GDB/GFDC were chiefly
oriented towards implementing the minimum guaranteed price for maize.2
This price was established for foodcrops by a Committee an Agricultural
Conmmodity Prices, composed of Ministry of Agriculture and university-based
officials, on the basis of estimated costs of producticn.29 In most years
the minimum guaranteed price for maize was well belaw the market price, but
when the market price fell, neither the storage facilities nor the
financial resources of the GDBJGFDC were sufficient for the buying
activities to have a significant influence. The anuual purchases of the
GE1/GFDC, in fact, never exceeded 12 percent of estimated total
marketings. In 1974/75, for example, when there was a substantial surplus
of maize, shortages of storage facilities and lack of finance prevented the
GMB from supporting the floor price.30 The Rice Mills Uhit, in additian to
being unable to support the minimum guaranteed price for paddy for similar
reasms, also suffered from high milling costs that prevented it from
competing with private rice millers, resulting in substantial excess
capacity.
3 In 1984, maize accounted for 54 percent of total GFDC purchasesand imported rice for another 27 percent. Other purchases were dividedamong starchy staples, legumes, charcoal, and imported "rural trade" itemssuch as machetes. World Bank, "Marketing and Input Supply," pp.160-62.
-- Wbrld Bank, "Agricultural Pricing and Trade Policy Framework,"Draft Working Paper ND. 9 for the Ghana Agricultural Sector RehabilitatimProject, by Lynn Salinger, April 1986, p.22.
-C0 Whrld Bank, Ghana: Agricultural Sector Review, April 12, 1976,Vol.II, Annex 5, p.1 1 .
109

The influence of the state trading agencies on domestic marketing
of food was thus of little importance, though they occasionally had a
detrimental effect by obliging large producers and Agricultural Developnent
Bank borrowers to sell at official prices when market prices were in fact
higher. In addition, high operating costs coupled with low allowable
marketing margins resulted in severe financial difficulties and the need for
frequent government subsidies. As a result, buying of maize was reduced
franm about 30,000 tons in 1973 to a mere 6,000 tons in 1933.:3-
The GFDC was also allowed to purchase imported rice and other
foods from the GNPA and to sell these on the private market at substantial
markups in order to cover part of its losses on domestic purchases. - For a
time this created opportunities for bribery and favoritism, but the windfall
was reduced when devaluation brought border prices more in line with
domestic market prices.
In the face of fluctuating harvests, Ghana has procedures
designed to ensure adequate food security. Estimates of shortfalls made by
the Ministry of Agriculture are passed on to the Ministry of Finance, which
manages the foreign exchange budget and coordinates concessional food aid.
The Ministry of Finance is then supposed to inform the Ministry of Trade how
much food is to be imported. In reality, however, neither the governent
nor the international donors has a very clear idea of expected concessional
imports.:' As a result, there are years in which there are significant
surpluses or shortages, with corresponding price fluctuaticns that the
-' L Wbrld Bank, "Marketing and Input Supply," p.159.
32World Bank, "Marketing and Input Supply," p.161-62.
W obrld Bank, "Agricultural Pricing ... ," pp.2-29.
110

goernment is unable to control thrcugh either its domestic or its foreign
buying and selling operations.
Transnortation and Ncntradable Foods
Motre important than the activities of the grain marketing agencies
has been the effect of gavernment policy on the transportation system. From
1961 to 1966, during the Nkrumah gDvernment, the average age of trucks
increased markedly because of restrictions on imports, and the number in
operation declined because of shortages of tires and spare parts. RcNad
ccnditimis also deteriorated with inadequate maintenance. 4 Ccnditions
improved somewhat thereafter for a few years, but a survey of farmers and
traders in 1970 ftirid that road canditicns and the scarcity of vehicles were
major constraints on marketing and resulted in high transportation charges,
especially on feeder roads.~ It is estimated that the total capacity of
trucks declined from 8,271 tons in 1956 to 4,442 tons in 1968. In 1968
almost 38 percent of the trucks were more than six years old.2
By the mid-1970s the situatim had deteriorated even further.
Imports of vehicle spare parts declined by 40 percent in real terms from
1970 to 1975. Althtgh statistics on the total truck fleet were not
;54 World Bank, Current Ecnomic Position and Prospects of Dhana, Vol.V: Agriculture, C3ctober 26, 1970, p.8.
;so V.K. Nyanteng and G.J. van Apeldomrn, "Sane DevelopmentImplications of Farmers' Problems in Marketing Their Foodcrops," inI.M.Ufori (ed.), Factors of Paricultural Growth in West Africa, Institute ofStatistical, Social, and Economic Research, Iniversity of Ghana, Legon,1973, pp.26E,69.
Kadwo Ewusi, "The Rate of Inf lation, Variation in Local FoodPrices, and the Effect of Transport Facilities on Local Food Prices in Ghanain the Sixties," in Ofori (ed), Factors of Agricultural Growth ... , p.2B4.
111

maintained after 1970, figures on registration of new trucks suggest that
the total number of trucks fell 29 percent from 1960 to 1970 and 16 percent
fram 1971 to 1975.57 As a result, it was estimated in 1977 that 70 percent
of farmers had to headload crops to market.10 By 19Y83, approximately 70
percent of the road vehicle fleet was out of service because of lack of
tires and spare parts.39
The impact of the deterioration of the transportatimi system was
especially severe for the marketing of starchy staples, such as cassava and
yams, and of millet and sorghum, since these crops have relatively low value
in relation to weight. Since no government policies affected the prices of
these products directly, the most important influence that the public sector
has had has been through its policies concerning transportation.
Policies Related to Agricultural Inputs
In contrast to output price policy, which historically has tended
to discourage agriculture, the government has intervened, especially since
the early 1970s, to encourage production through the provision of subsidized
inputs and credit, through its research and extension services, and through
interventions by specialized agencies in specific areas and crops. In
addition, in contrast to other sectors of the economy, there are no direct
taxes in agriculture. Most of these interventions have favored larger, more
modern farmers.
-'7 Wbrld Bank, Ghana: APricultural Sector Review, April 12, 1978,Annex 5, p.15.
as Inception Report, Building and Road Research Institute, " HighwayResearch Programme", 1977.
W obrld Bank. Ghana: Policies and Program for Adjustment, 1984, p.63.
112

Input Subsidies.
There are no import tariffs mn fertilizers, insecticides, and
agricultural machinery and equipment, though some inputs not used solely in
agriculture, such as trucks, are subject to duty. Domestic prices of most
inputs, however, have been influenced less by trade taxes than by government
policy and practice in relation to input distribution. The overvaluation of
the cedi has had an especially important effect on the pricing of inputs -
favoring capital-intensive, mechanized techniques aver those that absorb
more labor.
Fertilizer. Numerous agricultural inputs have wver the years been
distributed at subsidized prices by the Ministry of Agriculture. The
subsidy for fertilizers, for example, was initiated in 1968 and has evolved
as shown in the following table,
Fertilizer Cost, Price, and Subsidy(Nf/mt) (a)
Ccwnxouid Ammoniumn Sulphate
Sales Sub- % Sub- Sales Sub- % SubYear Cost(b) Price(c) sidvyd) sidy(e) Cost(b) Price(c) sidy(d) sidy (e)
1970 110.6 56.0 54.6 49% 81.4 40.0 41.4 517.1971 122.3 56.0 66.3 547. 85.6 40.0 46.5 54%1972 163.9 56.0 107.9 667. 110.7 40.0 70.7 647.1973 183.2 56.0 127.2 697. 155.2 40.0 115.2 74%.1974 353.7 56.0 297.7 847. 293.1 40.0 253.1 867.1975 408.6 56.0 352.6 86. 275.6 40.0 235.6 85%1976 297.5 56.0 241.5 81% 227.5 40.0 187.5 E8Z.1977 306.0 130.0 176.0 567. 296.0 100.0 196.0 66%
N/A N/A N/A N/A N/A N/A N/A N/A1984 2E000.0 9000.0 19000.0 6EMX. 20,100.0 7000.0 13100.0 65%
113

NOTES:(a) Source is WDrld Bank, Ghana: Aciricultural Sector Feview, April 12,
1978, Vol. III, Annex 7, Appendix Table I, and calculaticns forWorld Ebank, Ghana: Agricultural Sector Review, Background PaperNb.l: Incentives and Comparative Advantage, January 15, 1985.
(b) Cost ex-warehouse Tamale, Upper Region.(c) W2.80 per bag of 50 kg for compound fertilizer and N&2.O0 per bag
of 50 kg for ammonium sulphate from 1970 to 1976.In 1977, the prices per bag were raised to NW6.50 and NW5.00respectively, By 1984 these prices had attained !S450 and N350.
(d) Cost minus Sales Price.(e) Subsidy as a percent of cost.
It is clear from the table that there was a tendency for the official price
of fertilizer to remain fixed for a number of years, during which time the
subsidy became increasingly important as a percentage of delivered cost.
Over the years for which we have data, the subsidy rate ranged from 49 to 86
percent. This does not include, of course, the additional indirect subsidy
resulting from overvaluation of the cedi.
A major problem was inadequate supplies of fertilizer, imported by
the Ghana Natimnal Procurement Agency (GNRA) and distributed by the Ministry
of Agriculture.4" During the 1960s and early 1970s the problem was largely
mne of the GNPA s inability to gain access to adequate foreign exchange. As
foreign aid was tied increasingly to fertilizer imports, however, those
imports rose from 9980 tons in 1971 to 69,630 tons in 1976.4- Utilization
increased less rapidly, however, and 17,900 tons were carried over from 1976
into 19/7. Small farmers, particularly, obtained timely access to
*° Prior to the end of 1976, the Ministry of Agriculture was alsoresponsible for importing fertilizer.
4L Fertilizer imports were only 2900 tons in 1962 and 6340 tons in1969, indicating the absence of any concerted effort to develop agricultureother than cocoa bef-re the 1970s. Wirld Bank, Ghana: Agricultural SectorReview, August 12, 1978, Vol.III, Amnex 7, Appendix Table 5.
114

fertilizer with difficulty because of late arrivals, complex administrative
procedures, and heavy competition from large farmers at the subsidized
prices. There was also some smuggling of fertilizer across the borders. As
a result, the village market price paid by small farmers for fertilizer in
March 1977 was NP9.00 per bag, while the official price was Ni2.00., 4
By 1984, the situation was no better, with shipments arriving too
late for planting because of the Ministry of Agriculture's inability to
finance the imports, slow mobilization of transport to inland distribution
points at least partly because of low official transport rates, and
indecision an pricing under the government's new desubsidization policy.43
As a result, fertilizer distribution was transferred to government-uwned
Farmers' Services CAmpanies (FPSCOM) in the Lpper East, Upper West, and
Volta Regions."4
Aside from inefficiency and inequity in allocatimn and delays in
distribution, the fertilizer subsidy grew to be an important public sector
expense. Government outlays increased from NW0.4 millimn in 1970 to W9.2
million in 1976. In 1976/77, the subsidy amounted to 25 percent of the
current budget for all agricultural development, excluding cocoa. '
Although the government was conunitted to phasing the subsidy out over the
period from 1976 to 1990, this still had not been accomplished by 1984.
42 World Bank, Ghana: Agricultural Sector Review, April 12, 1978,Vol.Il, Annex 5, p.21.
Wobrld Bank, Ghana: Auricultural Sector Review, BackgrouxJd Paper5: Marketing and Input Supply, January 15, 1985, p. 1 5 3 .
4 I World Bank, Ghana: Agricultural Sector Review, August 6, 1985,p. 4 2 .
0 Wobrld Bank, Ghana: Agricultural Sector Review, April 12, 1978,Vol.III, Amnex 7, pp.8-9.
115

Machirery Services. In order to encourage farm mechanization, all farm
machinery in Ghana is imported duty free. In addition, tractor services
were for imany years provided at subsidized rates by the Mechanization and
Transport Division of the Ministry of Agriculture (MEY). These services
included clearing, tillage, and harvesting, and the aouint of subsidy during
the early 1970s was about 50 percent of private sector costs. Again, it was
the large farmers who benefitted most from these services. The candition of
the equipment was so poor and the inefficiencies of the services were so
great, however, that the government rapidly declined in importance relative
to private tractor operators, who charged rates considerably in excess of
those of the governmeit. In 1969, for example, it was estimated that only
about 40 percent of the govermEnt's wheel tractors were serviceable and
each of these was annually able to prepare an area of land that averaged
only 12 to 18 hectares. Private tractor naiers, in contrast, were able to
prepare up to 240 hectares.46 As a result, by 1976 the goverrwnmt owied
only 3 percent of all wheel tractors and harvesters in Ghana.4`
Subsidies an mechanized land preparation and harvesting services
provided by the MtA varied in 1977 from 3 to 74 percent of estimated costs,
depending on the service rendered. Except for a -few favored farmers, these
subsidies were irrelevant because of the very limited extent to which the
services were available fram the M1O, though the govermEnt did operate
about 90 percent of the crawler tractors used for clearing at subsidy rates
6 k WDrld Bank, The Current Econcmic Position and Prospects of Ghana,October 26, 1970, Vol 5: Agriculture, pp.14-15.
4' Ghana Ministry of Agriculture, Economic Research and PlanningService, "Agricultural Price Policy in Ghana, " by Frederick D. Kerfker,April 1976, p. 9 .
116

of 0 to 17 percent.49 Far more important in determining the prices of
mechanized services, hwever-, was the influence of Ghana's overvalued
exchange rate an private operator costs.
Improved Seeds. The Ministry of Agriculture operated during the early
1970s a seed multiplication and import program, which primarily benefitted
producers of maize and rice. Farmers in 1974 paid ane-third of the cost of
maize seed and three-fourths of the cost of paddy, though only 10 to 20
percent of all farmers were reached.49 By 1976, the subsidy rate had been
reduced to nil for paddy and 50 percent for maize."Q
Seed price policy lacked adequate flexibility to cope with
varying grain prices. Paddy seed was sold by the Rice Mills Uhit in 1976,
for example, for mnly one-half the market price, resulting in many cases in
the seed being purchased for direct consumption rather than for planting.
Similarly, the MOh offered registered seed grawers N!55/bag of maize seed
while the market price for seed of lower quality was about N80, and the M0A
consequently was unable to buy any of the certified seed. 8 9
Because of the administrative difficulties of running a seed
program from the Ministry, the state-owned Ghana Seed Company (GSC) was
established in the mid-1970s to produce fou,dation seed from the breeder' s
4 World Bank, Ghana: Agricultural Sector Review, April 12, 1978,Vol.III, Amex 7, p.11.
World Bank, The Current Economic Position and Prospects of Ghana,October 18, 1974, p. 1 6 .
eC) Ghana, Ministry of Agriculture, "Agricultural Price Policy...,"p.9.
51 World Bank, Ghana: Agricultural Sector Review, April 12, 1976,Vol.III, Annex 7, p.7.
117

seed made available by the Crps Fsearch Institute. The fotundaticn seed
was then issued to registered private farmers to produce certified seed on
ccntract. This seed was in turn cleaned, processed, and sold by the GEE.
The G5C proved to be no more adept at seed pricing than the MEA, however,
and by 1984 it was in severe finamcial trouble, with large unsold seed
stocks. At the same time, there was a sharp decline in seed producticn
because of financial problems, unavailability of inputs and spare parts, and
a decline in the number and acreage of participating growers.3-
Other Inputs. The MOA also maintained subsidies cn insecticides and
hand tools, but quantities supplied were insufficient in relation to demand
at the subsidized price, as evidenced by market prices two or three times
official levels. Despite the establishment of two machete factories in
Ghana, farmers by the end of the 1970s were continuing to experience
difficulty purchasing this basic tool at the official price. Smuggling to
neighboring countries also appeared to be a major problem.53
Cocoa farmers benefitted fr-om a number of additional subsidies
provided by the Cocoa Marketing Board. These were temporarily suspended in
1965, as noted earlier, but were later resumed under the NLC. In 1974, the
CMB sold Gammalin, the main insecticide used on cocoa farms, at a price
equal to about one-quarter of its costs. Sprayers that cost the Board
V12B.00 were sold, in turn, for e3O.0O and were repaired free of charge.
Cocoa pods and seedlings were also sold at subsidized prices, estimated at
Om World Bank, Ghana: Aaricultural Sector Review, Background PaperNo.5: Marketing and Input Supply, January 15, 1965, p.167.
53 World Bank, Ghana: Restorina Economic Growth, October 22, 1981,pp.10E-09.
118

about 50 percent of cost. In addition, the CMB financed the constructian
and repair of feeder roads in cocoa growing areas. By 1977, in the face of
constant official input prices and rising inflation, subsidy rates at the
official exchange rate had increased to 81-95 percent.s4
Input supplies and local support services furnished by the CMB
were inadequate. Between 1970 and 1975, sufficient insecticides were
available to spray only 150,000 hectares, compared with the 1.2 to 1.8
million hectares in cocoa. Ghanaian seed multiplicatian farms had a total
annual production capacity of 1.65 million cocoa pods in 1976, which was
enough to replant only 20,000 ha per year.55
The major reason for these insufficient supplies of inputs was the
gcvernment subsidy, which posed financial problems for the CMB and led to
smuggl1ing. It was estimated that at 1976 import levels the subsidy annually
cost the government NV- 2.4 million for sprayers and W 15.9 million for
insecticides.-~ Despite the announ,ced intention to eliminate all input
subsidies as part of the Economic Recovery Program, the CMB in 1985 imported
sprayers at a landed cost of W14,000 apiece and resold them to farwers for
W3,400.-7 The reason for this ostensibly was to help offset low producer
prices, but the incentives for smuggling under this policy were enormous.
54 World Bank, Ghana: Agricultural Sector Review, April 12, 1978,Vol.III, Annex 7, p.9.
54 World Bank, Ghana: Agricultural Sector Review, April 12, 1978,Vol.Il, Amex 2, pp.9-
TM World Bank, Ghana: Agricultural Sector Review, April 12, 1976,Vol.Ill, Ann-ex 7, p.10.
M' World Bank, Ghana: Towards Structural Adjustment, October 7, 1985,Vol.1, p.48.
119

Credit.
In addition to the informal credit network, agricultural credit in
Ghana is formally provided by a number of institutions, including conmner-ial
banks, the Agricultural Developmnnt Bank (ADB), and the National Investment
Bank (NIB). In addition, the Bank of Ghana initiated a scheme in 1969
whereby it guaranteed twr-thirds of the value of loans granted by
commercial or development banks to small borrowers. Loans by commercial
banks and the NIB have gone primarily to larger farmers and agroindustrial
enterprises. Small farmers have been limited to the ADB, but most of its
loans have gone instead to middle-size farnms.0 Overall, less than 10
percent of farmers in Ghana receive institutional credit.>9
Conditions of credit have varied markedly. Most ccunercial bank
loans have been short- or medium- term, whereas the loans of the NIB have
been almDst exclusively for periods in excess of five years. The ADB in
1972 granted 70 percent of its credit as medium-term loans, 18 percent as
s-hort-term, and 12 percent as long-term. Commercial bank credit was
generally available to agriculture at this time at an interest rate of about
14 percent. Interest at 11 percent was charged on medium-term ccmmercial
bank loans guaranteed by the Bank of Ghana. The NIB and ADB, on the other
hand, provided subsidized credit to agriculture at 6 percent. Since
inflation at the time was ruming at about 10 percent per annum, real rates
of interest to agriculture were negative.
WE In 1968, the average loan of the ADB was for Ni 11,000.H. Mettrick, Policies and Institutions in Ghanaian Pariculture, LUiiversityof Reading, Department of Agricultural Economics and Management, June 1971,p.60.
- World Bank, Ghana: Aaricultural Sector Review, Val.III, Anmex 6,p.l.
120

Repayment rates have varied over time, but the ADB in particular
had problems recovering loans. As a result, the Bank initiated in 1969 a
Commcdity Credit Scheme in which a group of farmers would apply for a loan
in co,m,n in order to invest in the production of a particular commodity.
The loan was guaranteed by all members of the group. The scheme was
designed to reach the small farmer and to assist in the expansion of staple
food cultivation. By 1975, however, only 6.6 percent of all small farmers
in Ghana had been reached by the scheme. Loan recovery rates were about
K0-90 percent.4°
The major problem with rural credit in Ghana has been that high
rates of inflation lowered real rates of interest to negative levels,
especially after 1977 when inflation reached triple digits. This encouraged
misuse of credit and made it extremely difficult for credit institutions to
remain financially viable. The result was a virtual cessation of the flow
of credit resources out of national financial institutions and greater
reliance on rural banks established by the Bank of Ghana beginning in 1976
as private institutions dependent on local savings.62
Research and Extension.
Agricultural research has traditionally been the responsibility of
the Faculty of Agriculture and the Economics Department at the universities
and of several research institutions under the Council for S&ientific and
Industrial Research (ORIS). Research activities related to cocoa and cotton
Ib World Bank, Ghana: APricultural Sector Review, April 12, 1976,vol.III, Annex 6, p. 1 2 .
tb World Bank, Ghana: Agricultural Sector Review, April 12, 1978,vol.III, Annex 6, p.16.
121

come under the Cocoa Marketing Board and Cotton Development Bcard
respectively. In addition, the Crop Production Division of the Ministry of
Agriculture has certain responsibilities with respect to field trials.
Eecause of this fragmentation and lack of coordination of research activity,
thowever, the Ministry of Agriculture has tended to ignore the work of the
universities and research institutes as not being very relevant and has gone
to the other extreme "of relying very heavily on ad hoc introductions of
crop varieties without adequate attention to the need for local, adaptive
research.
The situation is exacerbated by lack of an effective extension
service. During the colonial period the British were primarily interested
in agricultural research and extension as these related to cocoa. By the
1950s, however, a national extension service concerned with a broader range
of crops had been developed within the Ministry of Agriculture. The Nkrimnah
gavernment uprooted this service in 1962 and transferred it to the Uhited
Ghana Farmers'Cooperative Cnoncil (1UGFC), the farmers' wing of the
Convention People' s Party that had previously only been concerned with the
marketing of cocoa. Other extension staff were transferred to state
farms. As Tony Killick has described it,
The results were disastrnLxs . The UIGFC lacked the expertise,administrative capabilities and motivation to operate an extensionservice. Its officials used their positions to cheat the farmers,who became increasingly hostile to the organization which wassupposed to help them. Extension work was further hamstrung bysericus shortages of imported supplies such as machetes,fertilizers and seed. The result was that such extension service
World Bank, The Current Economic Position and Prospnets of Ghana,(ktober 26, 1970, Vol.V: Agriculture, p.11.
122

as had existed at the beginning of the sixties deteriorateddrastically..3
After the Nkrumah era, respansibility for extension was
transferred back to the Crop Producrtian Divisimn of the Ministry of
Agriculture, which was also responsible for the distributicn of seeds and
fertilizers..4 This comnplicated considerably the work of extension agents
and took their attention away from advising farmers on agricultural
tech-iology. In addition, agents were handicapped by inadequate means of
transport and lack of a clear focus for their activities. To bridge the gap
between research and extension, the Grains and Legumes Development Board
embarked on a number of activities, such as demn:stration and foundaticn
seed prcduction, that partly cverlapped with those of the Ministry, creating
additional confusion.
During the late 1960s and early 1970s, an increasing amount of
research and extension took place within the context of particular project
organizations. In 1969, the FAO Fertilizer Program began fertilizer and
rotation trials and extension an maize, cotton, cassava, groundnuts, and
ccwpeas in the Ashanti, Central volta, and Erung Ahafo Regions, which led to
substantial increases in fertilizer utilization. The Ghanaian/German
Agricultural Development Project in the Nbrthern Region undertook research
on rice,-5 and the World Bank financed an important project in the Uipper
Region involving applied research and extension. While these and other
Killick, Development Economics ... , p. 191.
64 World Bank, The Current Economic Position and Prospects of Ghana,October 26, 1970, Vol, V: Agriculture, p. 1 2 .
is World Bank, Ghana: Agricultural Sector Review, April 12, 1978,Vb1.III, Annex1X, p.3.23
123

projects were more successful in instituting adaptive research and in
ccncentrating extension on particular goals, they were also plagued by
shortages and late delivery of inputs, high local currency costs,
insufficient farmer incentives, and rapid turnover of project personnel.
Since the mid-1970s, declining real income and research
facilities have induced a large exodus of trained research staff to other
countries. At the same time, there has been overstaffing at lower levels,
which has consumed budgetary funds at the expense of the money required to
operate research programs. This, coupled with the usual problems of
coordination and extension, has limited the impact of agricultural research
on Ghanaian farming techniques.4-
State Production
As part of its general orientation toaards public ownership and
industrialization, the Nkrumah government under-took a major effort to shift
Ghanaian agriculture away from its predcminant form - small-scale,
cwnaer-operated farms. The State Farms Corporation was created, which
rapidly increased the number of its farms and its total land holdings. By
1965 it was managing 105 farms, about half of which were new, the rest being
former demonstration and experiment stations marnaged by the Ministry of
Agriculture. In addition, the U[FCC was responsible for mechanized
co-operative farms, and the Workers' Brigade operated 10 mec-hanized
farms. ^' "These enterprises affected a very small proportion of the
,1 World Bank, Ghana: Agricultural Sector Review, August 6, 1985,pp.3 4-35.
e' Killick, Development Eccnomics...., p.19 2.
124

population engaged in agriculture and accounted for only about 1 percent of
total agricultural production during the period, but they absorbed large
anmunts of capital and diverted resources, manpower and facilities away from
the smalIholder sector of the economy".19
The state farms, for example, cost Ng 19.8 million in subsidies in
1963-65. Despite the fact that they had the services of many of the MIA s
agricultural officers and had much better access to capital and intermediate
inputs than did small farmers, both their yields and their labor
productivity were only about one-fifth as great. Partly as a result of
this, between 1966 and 1971 the number of state farms was cut to 33.
Nevertheless, the financial deficits of the Corporation still averaged NY
1.4 million in 1969 and 1970. 9 Since then, the State Farms Corporation
has continued in existence, along with other government parastatals involved
with agriculture, such as the Ghana Tobacco Cbmpany, Ghana Rubber Estates
Limited, Ghana Sugar Estates Limited, the State Fishing Corporation, and the
Volta River Authority. Although today they are not the major focus of
gavernment development efforts in agriculture, these enterprises
nevertheless constitute a continuing drain on the public treasury and absorb
a disproportionate share of management time.
tb World Bank, The Current Economic Position and Prospects of Ghana,October 26, 1970, Vol.V: Agriculture, p.13.
9 Killick, Development Economics..., p.1 93-9 4.
125

Conclusions
This discussimn of the history of policy interventions in Ghana
leads to a numrber of conclusions. First, and of greatest importance, the
general deterioration in the economy, accompanied until recently by rising
inflation and an increasingly overvalued currency, had a profound impact on
agricultural incentives. This became especially evident during the last
part of the 1970s and the early 19E0s, when the rate of inflation was in
triple digits and the exchange rate was overvalued by a factor of at least
twenty. Cne result was an increasingly hopeless struggle between
government, farmers, and the Cocoa BDard to extract revenue from the
plunging local currency value of cocoa exports.
On the import substitution side, agriculture benefitted from the
restrictions un grain and other food imports, which caused their domestic
prices to rise steeply in relation to CIF prices converted at the official
rate of exchange. Oh the other hand, this created abundant opportunities
for corruption and other rent-seeking behavior on the part of officials
responsible for food imports. In addition, the governent's frequent
efforts to control domestic prices and to intervene in the food
distribution system led to confusion and marketing disincentives.
Furthermore, the scarcity of foreign exchange that accompanied the
overvalued exchange rate led to a collapse of the transportation system,
which severely disrupted the transmission of higher prices to farmers for
both tradable and nontradable foods.
Second, the disenfranchisement of Ghana s cocoa farmers and the
penetration of the LEFOC into the cocoa growing areas urnder the Nkrumah
regime led to a system for allocating resources that depended on favoritism
126

and bribery rather than on the exertion of political pressure and influence.
Suaceeding regimes attempted at first to correct this, but their narrow
political basis and their macroeconomic managerial incompetence soon led to
a reversion to the old system under the auspices of the Produce Buying
Ccmpany's at first de facto, and later de jure, monopoly on cocoa purchases.
The main difference between the LUFOC mrnopoly and that of the PBC was that
the former had strong political overtones related to the desire of the CFP
to neutralize the cocoa farmers, whereas the latter was ideologically
neutral and was designed simply to keep the ever dwindling supplies of cocoa
moving as the government wrestled to maintain its share of sales revenue.
The end result, however, was the same - resource allocation based on
influence and corruption rather than an political process. As in the import
competing sector, the result was wasteful rent-seeking rather than
productive activity.
Third, the bias against tradable agriculture resulting from trade,
price, and exchange rate policies was only to a very minor extent offset by
input subsidies and cheap credit. These were often channeled through rural
development projects in which officials developed strong vested interests,
abetted in many cases by foreign donors. The projects were a weak base on
which to develop the agricultural sector, however, because they required
high levels of managerial skill and were vulnerable to the price distortions
that increased in intensity with the collapse of the macroeccnoimy. In the
end, input subsidies and cheap credit never effectively reached the smaller
farmers who were responsible for most of the nation s agricultural output.
The other alternative to small farmers - the state farms and
agricultural parastatals established under Nkrumah - proved to be a
127

disaster. Productivity was lower than on private farms, and yet these
public sector activities continued to exert a disproportionate claim on
managerial and financial resources even after Nkrumah.
With the advent of the Economic RecoverY Program, steps were taken
to improve the incentive structure. The cocoa pr-oducer price was increased
significantly in real terms for the first time in 1986. Efforts were made
to improve the transportation system and to alleviate some of the problems
of input supply. Nevertheless, years of neglect had exacted their toll, and
it was clear that considerable time would be necessary before the
agricultural sector could be fully revived.
128

PART 11T: EFFEC`TS OF PRIC INTERVENTIONS
OHPTER VI: fEfFES OF INTEFENTION
In order to quantitatively measure the effects on incentives of
governwent policy, a number of indicators have been calculated. These
pertain both to the direct effects an relative prices of trade and price
policy related to agricultural outputs and inputs and to the indirect
effects of distortions in the economy that result in a deviation of the
equilibrium from the official exchange rate. This chapter discusses the
methods used in calculating the indicators of price distortions and presents
the results. Subsequent chapters examine the effects of these distortions
an production, consumption, foreign exchange f low3s, gcverrnent revenue,
producer and consumer welfare, and producer incoom.
Direct Effects
The direct effect of policy occurs as a result of taxes and
subsidies on trade, quantitative import restrictions, and domestic price
policies. Import taxes and restrictions act to increase domestic prices in
relation to those an the wDrld market; export taxes and restrictions depress
domestic prices relative to thDse at the border. In addition, price policy
has also been important, especially for cocoa, in determining farmer
incentives.
Producer, Consumer, and Border Prices
To measure these incentives, data were gathered on the domestic
and border prices of six major agricultural ccomsodities. These data are
presented and the adjustments made to them are detailed in Annex 3. Of
129

these six crops, three are tradable and three are ncontradable. Of the
tradable crops, cocoa was chosen because it is by far the major export crap
and its fortunes are closely linked with the rest of the economy. Rice has
been the major imported food, with imports in many years exceeding local
production. Maize is also an imported food, but imports are smaller and
production and consumptim are much more important than for rice. In
additim to these tradable crops, three major nontradable foods are
included in the analysis of this chapter to see to what extent mEvements in
the domestic price of the tradable foods, rice and maize, have been
correlated with price movements for the nontradables. Since these
nontradables are not directly influenced by governoent policy, however, they
are not included in the analysis of subsequent chapters. Of the naitradable
crops, millet and sorghum, are the major foods produced and consumed in the
north. These two cereals are closely related in production and consumption,
and sorghum alcne is included here. In the south, the rot crops, cassava
and yams, are important nontradable food crops for which relatively long
price series exist. Since experience with these crops has differed
somewhat, both are retained in the analysis.
Domestic prices for most of the crops shown - maize, rice,
sorghum, cassava, and yams - are based m monthly surveys of wholesale
markets in Accra, Kumasi, and Tamale. The prices are those actually
observed rather than official minima or maxima. As such they fluctuate
relatively freely. Adjustments to arrive at producer prices were made on
the basis of detailed data obtained for 1975 on transport, storage,
handling, and other costs involved in moving aommodities from farm to
wholesale market. The 1975 figures were then adjusted to other years using
130

the overall CcLnumer Price Index- This matched fairly well with
fragmentary data on these costs in other years. L Retail prices were
estimated by adjusting wholesale prices for data cn average percentage
markups available for a few years.
For cocoa, the official producer price was used at the farm level.
To this were added puiblished Cocoa Marketing Board costs of collection and
delivery to the port of Tema in order to obtain the domestic price of cocoa
at the border. As discussed in the previous chapter, these costs increased
markedly over the years as a result of swelling employment within the CM.
In addition, the distinction between the cMB and the central government has
often been fairly arbitrary as input delivery, extension, and research
activities have been shifted back and forth between the ministries and the
Board. It is impossible, however, to dissociate over time purely marketing
costs from the other elements in the CMB's budget. Cbnsequently, the
domestic price of cocoa at the border in most years is overestimated in
comparison with what it wculd be if it included only actual marketing costs.
Border prices were estimated on the hasis of unit values
calculated from trade data, with some corrections, interpolations, and
extrapolations based on changes in world market prices where unit value data
are missing or clearly in error. Pbrt handling charges available for 1975
were adjusted to other years using the CPI in order to obtain the whDlesale
price equivalent of the border price. Retail margins similar to those used
± Although transpDrt costs tended to rise somewhat relative to theCPI, for reasons explained earlier in Chapter V, the cost of services,including those involved in marketing, had a tendency to fall. In addition,food purchased in urban areas is heavily weighted in the CPI, implying thatany increases in the cost of transport and marketing were largely reflertedin the CPI.
131

for domestic prices were applied to estimate retail price equivalents to
consumers. The same collection, procressing, and distribution costs used
for donestic prices were subtracted frcmN the wholesale price equivalents to
obtain producer price equivalents.
Tables 10 and 11, derived from PInnex 3, show the sharp increases
in food prices that have occurred in Ghana, especially since 1975.
Mbvements in relative prices are discussed later, but for now it is useful
to point to the growth in the margin between producer and ccrnsumer prices
that has occurred. The best example is cocoa, which was discussed in the
previcous chapter. Although increases in this margin were less important
for other crops because, unlike cocoa, they were subject to competitive
marketing, these increases were significant nonetheless. This especially
true of the starchy staples for which transpDrtaticn costs are important in
relation to the value of output. Yam producers, for example, rereived 70
percent of the price to consumers in 1953 but crly 56 percent in 1984.
Maize producers received 69 percent of the retail price in 1953 and 60
percent in 1984. One result of these rising costs is that producer price
equivalents of border prices for rice and maize, shown in Table 12, are
negative in the later years of the period studied as a result of
subtracting high marketing costs frnm low border prices measured at the
overvalued official exchange rate. This is also true of cocoa in 1981, when
CMB costs were in excess of the FEO price converted to cedis at the official
exchange rate.
132

Table 10
Domestic Producer PricesINC per Metric Ton)
Year Maize (a) Rice (a) Sorghum (a) Cassava (b) Yam (bl Cocoa Ib)
1953 46 130 61 N/A 54 2691954 37 118 72 N/A 49 2871955 34 99 48 N/4 52 2991956 44 100 49 N/A 56 2801957 25 101 59 N/A 52 2691958 39 100 70 N/A 58 2391959 29 86 70 N/A 54 2241960 28 69 38 NIA 54 2241961 47 63 55 N/A 53 2241962 44 54 79 N/A 57 2201963 50 137 85 15 50 2021964 66 97 99 14 52 1871965 86 135 114 29 63 1871966 85 128 113 23 70 2241967 37 125 83 15 60 2541968 73 116 83 14 63 2841969 119 160 134 22 71 2931970 87 185 133 20 72 2931971 87 186 138 31 89 2931972 137 275 159 38 95 3661973 142 332 235 34 117 4391974 151 355 243' 41 154 4891975 185 497 230 72 213 5851976 469 1109 659 181 302 7321977 970 1355 1477 486 622 13331978 834 1611 1430 319 1007 26671979 1134 1399 1558 261 1160 40001980 3261 5777 5654 848 1735 40001981 5845 6545 7035 2274 2791 120001982 5659 15530 10038 2423 4148 120001983 31537 45165 31239 10935 11436 200001984 16118 61571 37872 3721 11716 300001985 11819 28453 N/A 1742 62104 56600
…----Notes to Table 10:
(a) Data from Annex 3, Table 3-3(1).(b) Data froa Annex 3, Table 3-3(2).
133

Table 11
Domestic Consumer Prices(NC per Metric Ton)
Year Maize (a) Rice (a) Sorghum (a) Cassava (b) Ya (Ib) CNoa (bI
1953 67 190 09 N/A 77 3011954 57 176 102 N/A 70 3201955 54 155 74 N/A 75 3351956 66 158 77 N/A s0 3171957 44 159 89 N/A 75 3061958 61 158 101 N/A 82 2771959 49 143 101 N/A 77 2601960 49 124 65 N/A 78 2591961 71 121 86 N/A 78 2591962 70 115 115 N/A 83 2591963 77 211 124 34 76 2451964 98 174 143 35 80 2291965 126 233 169 58 97 2301966 129 236 172 53 109 2711967 71 224 134 41 95 3001968 115 221 136 42 101 3331969 170 278 198 53 112 3381970 135 310 198 52 114 3721971 138 320 209 67 137 2811972 199 433 238 79 147 5121973 212 519 334 90 190 6501974 231 571 356 95 231 6031975 287 782 t3 14 315 9821976 656 1604 912 311 456 10681977 1368 2269 2032 796 949 24041978 1396 3083 2223 733 1559 41591979 1979 3509 2685 854 1934 61201980 4763 9495 7842 1931 2895 75731981 8914 13701 10992 4489 5109 172001982 9190 25409 15092 5060 7131 230001983 42245 68767 43833 17920 18520 470001984 26885 94313 54600 11167 20761 740241985 22790 58617 N/A 9474 91908 112016
Notes to Table 11:(a) Data from Annex 3, Table 3-3(1).Ib) Data from Annex 3, Table 3-3(2).
134

Table 12
Border Price Equivalents(NC Per Metric Ton)
Rice (a) Maize (b) Cocoa (c)
Producer Retail Producer Retail Producer Retail
Price Price Price Price Price PriceYear Equivalent Equivalent Equivalent Equivalent Equivalent Equivalent
1954 131 191 67 92 604 6371955 106 164 103 133 400 4361956 94 151 97 127 354 3911957 101 160 114 146 595 6321959 100 159 90 119 512 5501959 85 143 66 92 403 4391960 76 133 93 123 307 3421961 70 128 103 135 293 3181962 63 125 80 111 298 3371963 67 132 24 47 314 3571964 47 116 69 102 236 2781965 59 146 29 61 219 2621966 62 159 24 59 349 3961967 90 184 29 62 516 5621968 153 264 113 161 712 7611969 140 255 115 166 773 8191970 112 225 18 55 598 6431971 88 206 50 95 600 6881972 111 244 367 463 678 8241973 218 388 42 97 1083 12941974 411 634 131 208 1374 168B1975 209 450 119 212 1129 15261976 237 600 104 236 2260 25961977 -118 575 234 521 2871 39421978 -305 890 384 879 8904 103961979 -475 1354 1014 1841 7000 91201980 -931 1781 312 1372 2727 63001981 -3488 2163 -321 1823 -200 50001982 -4762 2074 -881 1669 19558 305581983 -12081 2933 -2331 3296 33000 600001984 -3639 19322 4415 13427 39299 833231985 -749 25034 6266 16404 65567 120983
Notes to Table 12:(a) Data from Annex 3, Table 3-4(1).(b) Data from Annex 3, Table 3-4(2).(c) Data from Annex 3, Table 3-4(3).
Retail Price Equivalent is theFOB price for cocoa.
135

Relative Prices
Domestic price ratios of these crops were calculateJ at the
producer and conruiier levels fron the prices presented in Tables 10, 11, and
12. In addition to the ratios of agricultural prodcit prices, the ratios of
the price of each product to the nonagricultural consumer price index was
also calculated. The derivation of this index is explained in the footnotes
to Table 3-5(1) in Anex 3. It is the mDst relevant index to compare with
agricultural prices fron both the producer and consumer perspectives, in
comparison with the GDP deflator, which measures changes in value added
prices.
The price ratios are presented in Tables 13(1) - 13(4) in the form
of indices calculated with 1972 as a base yar. This facilitates the
comparison of trends between the various series. The indices are presented
at both producer and consumer levels.
It is evident from the tables that, relative to the price of
nonagricultural goods and services, foodcrop prices have fluctuated markedly
and have shown a tendency to increase somewhat over time, especial ly since
about 1974. Cocoa prices, an the other hand, fell markedly to farmers
during the late 1950s and early 1960s, when producer prices dropped by 56
percent of their average level in 1953-55. Following this there was a
modest improvement, followed by fluctuaticns arcound a level that was
approximately me-half that experienced during the early 1950s.
Looking at the price of rice, the principal tradable crop,
relative to the prices of ncntradable foods, there are marked changes from
year to year but no clear overall trend. This suggests that restricticns on
rice imports have been sufficiently important that the overvalued exchange
136

Table 13(l)
Prevailing Relative Price Indices (a)(1972 100)
Maize/Non-Ag Rice/Nan-Ag Sorghum/Non-Ag
Producer Retail Producer Retail Producer RetailDate Price Price Price Price Price Price
1953 81 81 114 106 93 901954 69 73 109 103 115 1091955 62 67 90 89 75 781956 79 81 89 89 75 791957 42 52 86 87 88 881958 67 71 84 85 102 991959 49 58 73 77 102 991960 47 56 57 65 54 621961 78 81 52 63 78 811962 69 74 42 56 105 1031963 68 72 92 91 99 961964 83 84 60 68 105 1021965 94 96 73 81 107 1061966 84 88 63 74 96 981967 36 48 60 69 70 751968 66 71 52 63 64 711969 101 100 68 75 98 971970 73 78 77 82 95 951971 69 75 74 80 94 951972 100 100 100 100 100 1001973 92 94 106 106 130 1241974 79 84 93 94 109 1071975 76 82 102 102 81 861976 143 137 168 154 172 1591977 203 197 141 150 264 2441978 97 112 93 114 143 1491979 87 105 54 85 103 1191990 172 173 152 158 256 2381981 140 147 78 104 145 1511982 119 133 162 169 181 1821983 338 312 240 233 287 2691984 96 111 183 178 194 1871985 55 73 65 86 N/A N/A
Notes to Table 13(1):(a) Based on crop prices from Tables 10 and 11 and the Non-Agricultural
Consuser Price Index from Annex 3, Table 3-S11).
137

Table 13(2)
Prevailing Relative Price Indices la)(1972 100)
Cassava/Non-Ag Yam/Non-Ag Cocoa/Non-Ag
Producer Retail iroducer Retail Producer Retail
Date Price Price Price Price Price Price
1953 N/A N/A 136 126 179 1421954 N/A N/A 131 121 199 159
1955 N/A N/A 137 126 203 163
1956 N/A N/A 144 132 187 151
1957 N/A N/A 129 119 173 141
1958 N/A N/A 142 130 152 126
1959 N/A N/A 132 122 143 119
1960 N/A N/A 129 120 139 115
1961 N/A N/A 1Z6 119 137 113
1962 N/A N/A 128 120 129 107
1963 73 79 98 95 102 89
1964 63 75 93 92 97 76
1965 115 109 99 99 77 67
1966 e1 90 99 100 83 72
1967 51 69 54 86 92 78
1968 46 66 53 85 96 s0
1969 66 78 88 89 93 77
1970 60 74 87 89 91 83
1971 89 92 102 101 87 60
1972 100 100 100 0oo 100 1oo1973 79 89 109 109 106 112
1974 76 86 116 112 96 112
1975 106 104 126 121 90 108
1976 196 163 132 129 83 87
1977 362 283 187 184 104 134
1978 133 148 169 169 116 130
1979 72 114 129 139 115 126
1990 160 167 132 142 79 107
1991 195 186 96 114 108 110
1982 182 184 126 139 94 1291913 419 331 176 184 80 134
1914 79 IS 101 115 67 1181 91 29 76 414 352 98 138
Notes to Table 13(2):(a) Based on crop prices from Tables 10 and 11 and the Non-Agricultural
Consumer Price Index from Annex 3, Table 3-5(l).
138

Table 13(3)
Prevailing Relative Price Indices (al(1972:100
Rice/Cassava Rice/Sorghum Rice/Yams
Producer Retail Producer Retail Producer RetailDate Price Price Price Price Price Price
1953 N/A N/A 123 128 83 911954 N/A N/A 95 100 83 901955 N/A N/A 120 115 66 711956 N/A N/A 119 112 62 671957 N/A N/A 99 98 67 721958 N/A N/A 93 56 59 651959 N/A N/A 71 73 55 591960 N/A N/A 105 91 44 471961 N/A N/A 66 64 41 431962 N/A N/A 40 41 33 351963 126 115 93 95 94 971964 95 91 57 59 65 651965 64 74 68 69 74 741966 79 82 66 65 64 631967 119 101 87 81 72 701968 114 96 81 74 63 611969 103 96 69 70 78 761970 129 110 91 81 89 871971 84 97 78 77 72 731972 100 100 100 100 100 1001973 134 119 82 86 98 991974 122 110 85 87 90 821975 9b 99 125 119 81 841976 85 94 98 105 127 1301977 39 53 53 59 75 761979 70 77 65 63 55 551979 75 75 52 45 42 391980 95 95 59 64 115 1071991 40 56 54 52 81 691992 89 92 90 89 129 1161983 58 70 84 89 136 1301984 230 155 94 98 181 1591985 227 113 N/A N/A 16 19
Notes to Table 13(3).(a) Based on crop prices tram Tables 10 and 11.
139

Table 13(4)
Prevailing Relative Price Indices (a)(1972=100)
Rice/Maize Rice/Cocoa (a) Yams/Cocoa (a)
Producer Retail Producer Retail Producer RetailDate Price Price Price Price Price Price
1953 140 131 64 75 77 891954 159 142 55 65 66 761955 145 133 44 55 67 771956 113 110 48 59 77 871957 204 167 50 62 74 851958 126 120 55 68 93 1031959 147 134 51 65 92 1031960 120 117 41 57 93 1041961 66 77 38 55 92 1051962 61 76 33 52 100 1121963 135 125 90 102 96 1071964 73 a1 69 90 107 1211965 78 84 96 120 129 1471966 75 84 76 103 120 1401967 167 144 65 88 91 1101968 79 88 54 79 86 1061969 67 75 73 97 94 1161970 105 105 84 98 95 1071971 106 106 84 135 117 1691972 100 100 100 100 100 1001973 116 112 101 94 103 961974 117 113 97 84 121 1001975 134 125 113 94 140 1121976 117 112 202 178 159 1491977 69 76 135 112 190 1371978 96 101 80 88 146 1311979 61 81 47 68 112 1101980 s8 91 192 148 167 1331981 56 70 73 94 90 1031982 136 127 172 131 133 1081983 71 75 301 173 221 1371914 190 161 273 151 151 981995 120 118 67 62 423 255
Notes to Table 13(4):(a) Based on crop prices fros Tables 10 and 11.
140

rate has not resulted in cheap food imports flooding the Ghanaian market
for any sustained periods of time. On the other hand, there have been
shorter periods during which the price of rice has been low in relation to
the prices of ncntradable foods. The first of these was fromu 1964 until
about 1967. The data an rice availability (Annex 6) do not indicate any
increase in dcmestic production or imports over previouis years, but the
price series in Tables 10 and 11 suggest that there was a fairly sharp rise
in sorghum and cassava prices, especially in 1965 and 1966, which may have
been at least partly due to a moderate decline in prockicticn of these crops
in 1965. This, of ccurse, was a critical period for the Nkrumah regime.
What is important is not that government policy regarding food imports
changed drastically at this time but that it did not change in response to
the domestic pressures created by inflation and poor harvests.
During the next few years, the price of rice rose quite sharply in
relation to the prices of nentradable foods. Again, this was not due to
production shortfalls or import ccnstraints since net availability of rice
increased fram an average of 56 tans per years in 1964-67 to 70 tons per
year in 1968-74. Rather these were years of relatively good harvests,
which caused the prices of nontradable foods to decline in real, if not
nominal, terms. They were also years during which the difference between
the black market or equilibrium exchange rate and the official rate
decreased, which tended to increase the price of tradables relative to that
of nontradables.
The succeeding decade was characterized by a reversal in these
price movements. With generally poor harvests and an increasingly
overvalued exchange rate, the domestic price of rice fell not mnly in
141

relatim to the prices of sorghum and cassava but also to that of maize.
In fact, niany of the movements in the price of rice relative to those of
millet and sarghum have been similar to muvements of the prices of rice and
maize. This is because maize was until recently traded internationally by
Ghana only in small quantities and had a relatively high cross-price
elasticity of demand with the other coarse grains. After 1981 maize
imports increased substantially and over the next four years equaled 20
percent or more of total availability (Annex 6).
The relationship between the price of rice relative to the price
of yams has been scnewhat different. Although there have been year to
fluctuations, the broader movements that have characterized the price of
rice relative to that of sorghtum, cassava, and maize have not been so
apparent with yams. If anything the price of rice might have risen in
recent years relative to that of yams. The reascns for this are not clear
since the productim data show no strcng increase in the output of yams.
What is clear is that the prices of rice and yams have risen stroigly
relative to the price of cocoa. This is especially evident after
1974. Since the prices of maize and the nmtradable foods have tended to
rise relative to those of rice and yams, cocoa prices have fallen to an even
greater extent in comparism with these crops.
Ptasurement of Direct Price Interventims.
Tables 14 and 15 present a series of ratios, measured at both the
producer and ccnsumer levels, for domestic and border prices. The dcnestic
price ratios, measured in cedis per metric ton, are essentially the same as
those used to construct the indexes of Table 13, and there is no need to
142

Table 14
Producer Price Ratios la)
RicelNon-Aq cKoa/Non-Ag Raise/Non-Ag Rice/Sorghum Rice/Yam Ricelmtaize Cocoa/Rite Cocoalflaize
Domestic (a) Border (lii Domestic (a) Border (bi DOmestic (a) Border (bi Domestic (c) Border (di Domestic (ci Border (di Domestic (ci Border (di Domestic (ci Border (di Domestic (ci Border (d)
1954 2.99 3.32 7.29 15.34 .93 1.71 1.63 1.91 2.42 2.69 3.20 1.94 2.44 4.62. 7.90 9.9
1955 2.46 2.64 7.45 9.96 .94 2.57 2.07 2.22 1.99 2.03 2.93 1.03 3.03 3.77 9.99 3.99
1956 2.44 2.29 6.94 9.64 1.07 2.36 2.02 1.90 1.79 1.67 2.29 .97 2.90 3.79 6.40 3.66
195 2.36 2.39 6.33 14.00 .59 2.67 1.69 1.71 1.94 1.95 4.10 .99 2.69 5.97 10.97 5.23
195 2.32 2.34 5.57 11.94 .91 2.09 1.43 1.44 1.72 1.73 2.54 1.12 2.40 5.10 6.10 5.71
1959 2.00 1.9 5.22 9.39 .67 1.55 1.23 1.23 1.60 1.59 2.97 1.29 2.61 4.72 7.75 6.06
MO6 1.56 1.73 5.09 6.99 .65 2.12 1.91 2.00 1.27 1.41 2.41 .91 3.27 4.04 7.99 3.29
196 1.42 1.57 5.02 6.35 1.06 2.31 1.14 1.26 1.19 1.31 1.34 .69 3.54 4.05 4.73 2.75
2962 1.15 1.34 4.67 6.32 .94 1.70 .69 .90 .95 1.11 1.22 .79 4.07 4.72 4.97 3.72
196 2.53 1.25 3.75 5.93 .93 .44 1.60 .79 2.73 1.35 2.71 2.95 1.49 4.65 4.01 13.29
196 1.66 .92 3.19 4.01 1.13 1.19 99 .40 1.99 .92 1.47 .69 1.92 4.IM 2.92 3.41
1965 2.02 .99 2.90 3.29 1.29 .44 1.19 .52 2.15 .94 1.57 2.03 1.39 3.70 2.19 7.51
1966 1.74 .93 3.03 4.72 1.25 .33 1.13 .55 1.94 .89 1.52 2.55 1.74 5.65 2.64 14.42
2967 1.66 1.20 3.39 6.97 .49 .39 1.50 1.09 2.09 1.50 3.36 3.14 2.04 5.75 6.95 19.04
1969 1.44 1.90 3.51 9.90 .90 1.40 1.40 1.95 1.93 2.42 1.60 1.35 7.45 4.64 3.99 6.29
1969 1.97 1.64 3.42 9.02 1.39 1.34 1.29 1.05 2.25 1.97 1.35 1.22 1.93 5.51 2.47 6.71
1970 2.12 1.29 3.35 6.93 1.00 .20 1.39 .84 2.57 1.55 2.12 6.35 1.59 5.34 3.36 33.93
1972 2.02 .95 3.19 6.53 .95 .54 1.34 .63 2.10 .99 2.14 1.75 2.59 6.95 3.37 12.03
1972 2.75 1.11 3.66 6.79 1.37 3.67 1.73 .69 2.90 1.17 2.01 .30 1.33 6.13 2.69 1.95
1973 2.92 1.92 3.87 9.54 1.25 .37 1.41 .93 2.93 1.96 2.33 5.20 1.32 4.97 3.09 25.93
1974 2.55 2.94 3.50 9.94 1.09 .94 1.46 1.69 2.31 2.67 2.35 3.13 1.39 3.35 3.23 10.47
1975 2.90 1.17 3.29 6.36 1.04 .67 2.16 .91 2.34 .99 2.69 1.75 1.19 5.43 3.16 .9.41
p. 1976 4.61 .9B 3.04 9.39 1.95 .43 1.69 .36 3.67 .79 2.37 2.29 .66 9.56 1.56 21.92
1977 3.97 -.34 3.90 9.19 2.77 .67 .92 -.09 2.19 -.19 1.40 -.50 .9 -24.33 1.37 12.29
1979 2.57 -.49 4.26 14.21 1.3.3 .61 1.13 -.21 1.60 -.30 1.93 -.79 1.66 -29.23 3.20 23.19
1979 1.47 -.50 4.21 7.37 1.19 1.07 .90 -.30 1.21 -.41 1.23 -.47 2.96 -24.74 3.53 6.90
19910 4.17 -.67 2.99 1.97 2.35 .23 1.02 -.16 3.33 -54 1.77 -2.99 .69 -2.93 1.23 9.74
1991 2.15 -1.14 3.94 -.07 1.9 -.11 .93 -. 50 2.35 -1.25 1.12 10.95 1.93 .06 2.05 .62
1992 4.46 -1.37 3.45 5.62 1.63 -.25 1.55 -. 47 3.74 -1.15 2.74 5.40 .77 -4.11 2.12 -22.20
1993 6.61 -1.77 2.93 4.93 4.62 -.34 1.45 -.39 3.95 -1.06 1.43 5.19 .44 -2.73 .63 -14.16
1994 5.03 -.30 2.45 3.21 1.32 .36 1.63 -. 10 5.26 -.31 3.92 -.92 .49 -10.90 1.96 9.90
1995 1.90 -.05 3.59 4.15 .75 .40 N/A N/A .46 -.01 2.41 -.12 1.99 -97.51 4.79 10.46
Notes to Table 14:(a) Domestic price lrom Annex 3, Table 3-3(11 for rice and maize and from Table 3-3i2i
for cocoa, deflated by the Nonagricultural Indexr from Table 3-5(1).(hi Producer Price Equivalent (DER) from Table 3-4(1) for rice, Table 3-4(2) for maize,
and Table 3-4(3) for cocoa, deflated by the Nonagricultural Index from Table 3-5M1.
(c) Ratio of producer prices from Table 3-3(1) and Table 3-3(21.(d) Ratio of Producer Price Equivalents from Table 3-4(2), Table 3-4(21, and Table 3-4(3),
except for sorghum and yams for which the producer prices from Table 3-3(1) andTable 3-3(2) are used.

Table 15
Consuwr Price Ratios
Rice/Non-Ag Cocoa/Non-Ag Naize/Non-Ag Rice/Sorqhus Rice/Yam Rice/Kaize Cocoa/Rice Cocoa/Naize
Dmestic (a) Border (bI Domestic (a) Border bI) Domestic la) Border (b) Domestic (c) Border id) Domestic (c) Border (d) Domestic (c) Border (d) Domestic (c) Border (dl Domestic (c) Border (dl
1954 4.47 4.05 9.13 16.19 1.44 2.33 1.73 1.87 2.52 2.73 3.10 2.09 1.82 3.33 5,63 6.941I55 3.87 4.07 8.34 10.86 1.33 3.32 2.09 2.20 2.09 2.19 2.90 1.23 2.16 2.67 6.26 3.271956 3.86 3.69 7.74 9.55 1.60 3.09 2.05 1.96 I.99 1.90 2.41 1.19 2.00 2.59 4.92 3.091957 3.75 3.77 7.20 14.87 1.03 3.44 1.79 1.90 2.13 2.15 3.64 1.10 1.92 3.95 7.00 4.32195 3.69 3.71 6.46 12.82 1.41 2.77 1.57 1.59 1.93 1.94 2.61 1.34 1.75 3.46 4.57 4.641959 3.34 3.33 6.06 10.23 1.15 2.15 1.42 1.41 1.96 1.85 2.92 1.55 1.91 3.07 5.29 4.751960 2.82 3.01 5.88 7.77 1.11 2.91 1.91 2.04 1.60 1.71 2.54 1.07 2.09 2.58 5.31 2.77Itl 2.71 2.89 5.81 7.13 1.60 3.04 1.40 1.49 1.55 1.65 1.69 .95 2.15 2.48 3.63 2.351962 2.43 2.65 5.50 7.15 1.49 2.35 .99 1.09 1.37 1.50 1.65 1.13 2.26 2.69 3.72 3.05196.3 3.92 2.45 4.55 6.62 1.43 .96 1.71 1.07 2.90 1.75 2.74 2.84 1.16 2.70 3.17 7.671964 2.95 1.99 3.B9 4.72 1.67 1.73 1.22 .82 2.19 1.46 1.77 1.15 1.32 2.39 2.33 2.741965 3.49 2.19 3.45 3.93 1.90 .92 1.39 .87 2.39 1.50 1.94 2.39 .n 1.79 1.82 4.28196 3.19 2.16 3.66 5.35 1.74 .80 1.38 .93 2.17 1.46 1.93 2.69 1.15 2.48 2.10 6.691967 2.99 2.45 3.99 7.49 .95 .82 1.68 1.39 2.37 1.94 3.14 2.9 1.34 3.05 4.20 9.111968 2.73 3.26 4.12 9.40 1.42 2.00 1.62 1.94 2.19 2.61 1.93 1.64 1.51 2.88 2.90 4.71
H 196 3.25 2.99 3.95 9.55 1.99 1.94 1.40 1.29 2.48 2.27 1.64 1.54 1.22 3.21 1.99 4.93Xs 1970 3.54 2.5B 4.25 7.35 1.54 .62 1.56 1.14 2.71 1.98 2.30 4.13 1.20 2.85 2.76 11.79
1971 3.48 2.25 4.14 7.48 1.50 1.03 1.53 .99 2.34 1.51 2.32 2.17 1.19 3.33 2.77 7.251972 4.33 2.44 5.12 8.24 1.98 4.63 1.82 1.02 2.94 1.66 2.18 .53 1.18 3.39 2.59 1.781973 4.57 3.42 5.73 11.40 1.87 .85 1.55 1.16 2.99 2.16 2.44 4.00 1.25 3.34 3.06 13.351974 4.09 4.54 5.75 12.09 1.66 1.49 1.60 1.78 2.47 2.75 2.47 3.04 1.41 2.66 3.47 8.101975 4.41 2.53 5.53 8.59 1.62 1.19 2.15 1.24 2.48 1.43 2.72 2.13 1.26 3.39 3.42 7.211976 6.67 2.50 4.44 10.79 2.73 .98 1.76 .66 3.52 1.32 2.45 2.55 .67 4.32 1.63 11.011977 6.47 1.64 6.86 11.25 3.90 1.49 1.12 .28 2.39 .61 1.66 1.10 1.06 6.95 1.76 7.561979 4.92 1.40 6.64 16.59 2.23 1.40 1.39 .40 1.98 .56 2.21 1.00 1.35 11.81 2.99 11.831979 3.70 1.43 6.45 9.61 2.08 1.94 1.31 .50 1t81 J7 1L77 .74 1.74 6.74 3.09 4.95IS90 6.86 1.29 5.47 4.55 3.44 .99 1.21 .23 3.28 .62 1.99 1.30 .80 3.54 1.5S 4.591981 4.49 .71 5.64 1.64 2.92 .60 1.25 .20 2.68 .42 1.54 1.19 1.26 2.31 1.93 2.741982 7.30 .60 6.61 8.78 2.64 .4B 1.68 .14 3.56 .29 2.76 1.24 .91 14.73 2.50 18.311983 10.07 .43 6.88 8.78 6.1B .48 1.57 .07 3.71 .16 1.63 .89 .68 20.46 1.11 18.201984 7.71 1.58 6.05 6.81 2.20 1.10 1.73 .35 4.54 .93 3.51 1.44 .78 4.31 2.75 6.211985 3.71 1.59 7.08 7.65 1.44 1.04 N/A N/A .72 .31 2.57 1.53 1.91 4.83 4.92 7.38
Notes to Table 15:(al Domstic price from Annex 3, Table 3-3(11 for rice and maize and the Rendered Port
Price from Table 3-3(21 for cocoa, deflated by the Nonagricultural Index fromfrom Table 3-5M11.
(bI Retail Price Equivalent (DER) from Table 3-4(11 for rice, Table 3-4(2) for maize,mad FOB price from Table 3-413) for cocoa deflated by the Nonagricultural Index fromTable 3-5(1M.
Cc) Ratio of retail prices from Table 3-3(1) and Table 3-3(2).(d) Ratio of Rttail Price Equivalents froo Table 3-4(11, Table 3-4(2). and Table 3-4(31,
except for sorghum and yams for which the retail prices from Table 3-3(1) andTable 3-3(2) are used.

discuss them further here. It is useful, however, to offer a few comments
concerning the bDrder price ratios.
First of all, it is very evident that the border prices of
tradable products have declined relative to the nonagricultural CPI and to
the domestic prices of nontradable foods. This is principally because of
the overvaluation of the exchange rate. Where producer bDrder price
equivalents from Table 12 are negative because high transport and marketing
costs are greater than prices at the border converted to local currency at
the official rate of exchange, the ratios are of course negative as well.
Looking at relative border prices of the tradable crops, it
appears that, despite year to year fluctuations, there is no clear trend in
the price of rice compared with that of maize. There is also no obviaus
trend in the terms of trade between cocoa and the traded cereals, thowgh any
such trend might be overwhelmed by wide price fluctuaticns, particularly in
recent years.
In Tables 16 and 17, the difference between the dcmestic price
ratio and the border price ratio, shown in Tables 14 and 15, is divided by
the border price ratio. This is equivalent to the ratio of the nominal
rates of protection (NRP) of the tWiD products or of the product and the
index as presented. Where the nonagricultural CPI is the denominator of the
price ratio, however, the figure shown is simply the NRP of the crop
indicated.
Table 16 suggests that direct price interventions, in this case
principally trade and exchange controls for rice and maize and the producer
price established for cocoa, have in most instances caused the domestic
price to the procnier to be less than its border price equivalent. While
145

Table 16
Effect of Direct Price Interventions onRelative Producer Price Differences (a)
…----- ----- ------ ----- ------ -----
Rice/Non-Ag Cocoa/Non-Ag Maize/Non-Ag Rice/Maize Cocoa/Rice Cocoa/Maize
1954 -.10 -.52 -.45 .65 -.47 -.131955 -.07 -.25 -.67 1.85 -.20 1.291956 .07 -.21 -.55 1.36 -.26 .751957 -.01 -.55 -.78 3.60 -.54 1.101958 -.01 -.53 -.56 1.27 -.53 .071959 .00 -.44 -.57 1.31 -.45 .281960 -.10 -.27 -.70 1.96 -.19 1.401961 -.09 -.21 -.54 .97 -.13 .721962 -.14 -.26 -.45 .55 -.14 .331963 1.02 -.36 1.13 -.05 -.68 -.701964 1.05 -.21 -.04 1.14 -.61 -.171965 1.28 -.15 1.94 -.23 -.62 -.711966 1.08 -.36 2.50 -.41 -.69 -.821967 .39 -.51 .30 .07 -.65 -.621968 -.24 -.60 -.36 .18 -.47 -.381969 .14 -.62 .03 .11 -.67 -.631970 .65 -. 51 3.95 -.67 -.70 -.901971 1.12 -.51 .74 .22 -.77 -.721972 1.48 -.46 -.63 5.68 -.78 .451973 .52 -.59 2.39 -.55 -.73 -.881974 -.13 -.64 .15 -.25 -.59 -.691975 1.39 -.48 .55 .54 -.78 -.671976 3.69 -.68 3.53 .04 -.93 -.931977 -12.48 -.54 3.15 -3.77 -1.04 -.891978 -6.29 -.70 1.17 -3.44 -1.06 -.861979 -3.95 -.43 .12 -3.64 -1.19 -.491980 -7.21 .47 9.45 -1.59 -1.24 -.861981 -2.88 -61.00 -19.19 -.90 30.97 2.301982 -4.26 -.39 -7.42 -.49 -1.19 -1.101983 -4.74 -.39 -14.53 -.72 -1.16 -1.041984 -17.92 -.24 2.65 -5.64 -1.05 -.791985 -38.97 -.14 .89 -21.13 -1.02 -.54
Notes to Table 16:(a) (Domestic Price Ratio - Border Price Ratio)/Border Price Ratio, froe Table 14.
146

Table 17
Effect of Direct Price Interventions onRelative Consumer Price Differences (a)
Rice/Non-Ag Cocoa/Non-Ag Naize/Non-Ag Rice/Maize Cocoa/Rice Cocoa/Maize
1954 -.08 -.50 -.38 .49 -.45 -.191955 -.05 -.23 -.60 1.37 -.19 .911956 .05 -.19 -.48 1.02 -.23 .561957 -.01 -.52 -.70 2.33 -.51 .621958 -.01 -. 50 -.4? .95 -.49 -.011959 .00 -.41 -.47 .88 -.41 .111960 -. 06 -. 24 -.60 1.37 -.19 .921961 -.06 -. 19 -.47 .78 -.13 .541962 -.08 -.23 -.37 .46 -.16 .221963 .60 -.31 .66 -.04 -.57 -.591964 .49 -.18 -.03 .54 -.45 -.151965 .59 -.12 1.06 -.23 -.45 -.571966 .48 -.32 1.17 -.32 -.54 -.691967 .22 -.47 .16 .05 -.56 -.541968 -.16 -.56 -.29 .18 -.48 -.381969 .09 -.59 .02 .06 -.62 -.601970 .37 -.42 1.47 -.44 -.58 -.771971 .55 -.45 .45 .07 -.64 -.621972 .77 -.38 -.57 3.14 -.65 .451973 .34 -.50 1.19 -.39 -.62 -.771974 -.10 -.52 .11 -.19 -.47 -.571975 .74 -.36 .36 .28 -.63 -.531976 1.67 -.59 1.78 -.04 -.85 -.851977 2.95 -.39 1.62 .50 -.85 -.771978 2.50 -.60 .59 1.21 -.89 -.751979 1.59 -.33 .07 1.41 -.74 -.381980 4.33 .20 2.47 .54 -.77 -.651981 5.33 2.44 3.89 .30 -.46 -.301982 11.25 -.25 4.51 1.22 -.94 -.861983 22.44 -.22 11.82 .83 -.97 -.941984 3.88 -.11 1.00 1.44 -.82 -.561985 1.34 -.07 .39 .69 -.60 -.33
Notes to Table 17:(a) (Doeestic Price Ratio - Border Price Ratio)/Border Price Ratio, from Table 15.
147

this has been true for cocoa, it has not generally been true for rice and
maize, which have been the subject of severe import restrictions. The
reason for the apparent paradox is that the estimation of a border price
equivalent for these crops at the producer leve-l yields negative signs
during the late 1970s and early 19EKs because of high transport costs and
especially because of the highly overvalued exchange rate. The results are
therefore misleading.
Turming to Table 17, a clearer picture emerges. During the 1950s
and early 1960s, the domestic consumer price of rice was just slightly lower
than its border price equivalent, reflecting largely free trade and perhaps
minor quality differences. By 1963, however, the impact of import
restrictions was being felt and the NRP had risen to 60 percent. These
restrictions were relaxed during the late 1960s and then tightened again
during the 1970s..2 In 1975, imports of rice were c{lose to zero. Protection
increased markedly fram 1974 to 1983 except when the cedi was devalued in
1979. Rice imports (see Anm-nex 6) were sporadic but generally very low
between 1975 and 1979, and then increased to an average of about 43,000 tons
from 1980 through 1985. This was low, however, in relation to pent-up
demand, given the rise in domestic food prices that occurred during this
period. Protection decreased substantially in 1984 and again in 1985 as the
exchange rate was successively devalued.
The overall pattern of maize protection has been similar to that
of rice, but the degree of protection has fluctuated to a muich greater
extent because the domestic market is less integrated with import trade and
I The apparent relaxation suggested by the figures in 1973 and 1974was due to very high prices on international markets rather than to anysignificant increase in imports during those years.
148

there are large supply, and therefore domestic price, fluctuatims due to
variations in rainfall. There are also longer term movements revealed by
the data that are important. During the late 1950s and early 1960s, nominal
protection for maize was negative, as it was for rice, but its absolute
magnitude was much greater for maize than for rice because imports of maize
equalled less then 1 percent of domestic production whereas for rice they
were in most years greater than local production (Aninex Table 6-1). Maize
was essentially a nantradable, and its price was influenced by domestic
demand and supply, which established a local price well below the CIF price
of imports. Over the next twenty years, imports of maize remained very low
in relatimn to local productiin, but domestic prices increased relative to
border prices so that protection in most years was positive and in many
years it was greater than that for rice. After 1979, maize imports
increased rapidly to almost 24 percent of domestic production in 1982 as
protecticn for maize decreased substantially relative to that for rice.
Rates of protection on cocoa, have bee negative in almost every
year but have varied substantially with fluctuaticns in world market prices
and with changes in the domestic prodcLcer rice. SevLral phases can be
identified. The first was one of heavy taxation of cocoa exports during the
1950s when world prices were relatively high. Following this, there was a
period of relatively low taxation during the early 1960s as world prices
plummeted and the Nkrumah regime adjusted the producer price duwnward to a
lesser extent. Thereafter, rates of taxation increased steadily upwards as
world prices increased but producer prices failed to keep up with
accelerating dcmestic inflation. In 1979, world prices once again fell
sharply, and in 1980 and 1981 the exchange rate was so overvalued and the
149

world price was so low that the government ended up by subsidizing cocoa
exports, though most of this subsidy was necessary only because of inflated
CM1 costs. The following year world prices recovered, and rates of
protection once again were negative. Successive devaluations thereafter
left room for increases in both producer prices and government revenue from
cocoa as the tax rate was once more increased.
Indirect Effects
The indirect effects of policy on the agricultural sector occur as
a result of its impact both in agriculture and elsewhere in the ecormWy on
the exchange rate. In most countries this takes the form of overvaluation
resulting from tariffs and quantitative restrictions on imports. In Ghana
the exchange rate has also been influenced by the taxation of cocoa exports.
This has tended to cause the cedi to be undervalued, but this effect has
been dwarfed by import restrictions, which have worked in the opposite
direction.
Indirect price interventions are measured by adjusting domestic
prices for exchange rate disequilibria. This adjustment is made for rice,
maize, and cocoa in An,nex 5, which also describes the methodology employed.
He-re the combined effect of direct and indirect price interventions an
relative prices is measured by multiplying border prices, rather than
domestic prices, by the ratio of the equilibrium to the official exchange
rate. The equilibrium exchange rate used in these calculations is that
obtained from the simulation model described in Chapter II, with the results
presented in Table 4.
150

These adjusted border prices for each crop are divided by the
nmagricultural CPI adjusted for direct distortions and for exchange rate
disequilibria. The details ccerning these adjustments are cotained in
Pninex 5 and in the footnotes to Table 18, which presents the resulting
ratio, P* / P*i NA
Large fluctuatims from year to year make it difficult to draw
many inferences from Table 18 regarding trends, but there is me tendency
that seems fairly pronounced. That is the decline in cocoa producer prices
that occurred because of the widening margin taken up by the Cocoa Marketing
Bard. From 195B to 1964, there was a severe decline in the relative price
of cocoa at both the border and the producer level because of the fall in
world market prices. When cocoa prices revived after 1972, hoever, the
producer did not share in this improvement. The same tendency is true to a
lesser extent for rice and maize because of the general deterioratim of the
transportation system, though costs of private agricultural marketing did
not rise to nearly the same extent as did those of the CM.
Table 19 shcw.s the relative price differences betwen the
distorted domestic price ratios in Tables 14 and 15 and the adjusted ratios
in Table 18:
P, P.,* P,*
Phw P* p w
For rice and maize the net effect of dirert price distorticns and indirect
exchange rate disequilibria varies cmsiderably from year to year, but there
are scane patterns that emerge. In most years, for exanple, the overall
effect for maize is negative. Durwing the early years of the period under
151

Table 18
Effect of Direct and Indirect PriceInterventions on Relative Prices
haize Rice Cocoa
Year Producer la) Consueer (b) Producer (a) Consuser (b) Producer la) Consumer (b)_-- -- - -- - - -- - -- - - -- - -- - - -- - -- - - ------------ _--_-_-_-_-_ -
1958 2.56 3.29 3.00 4.44 9.99 10.851959 2.10 2.76 2.92 4.34 8.54 9.321960 3.22 4.03 3.00 4.38 6.81 7.531961 3.83 4.74 3.14 4.54 6.47 7.151962 2.67 3.43 2.54 3.94 6.06 6.821963 .79 1.24 2.41 3.71 5.69 6.431164 2.17 2.84 2.05 3.34 3.51 4.171965 1.46 2.04 3.80 5.39 4.82 5.391966 .94 1.48 2.87 4.42 4.69 5.291967 .67 1.16 2.22 3.64 4.93 5.551968 2.18 2.90 3.25 4.82 5.55 6.161969 2.06 2.76 2.79 4.33 7.91 8.441970 .41 .85 2.39 3.82 5.00 5.501971 .92 1.47 1.90 3.33 3.58 4.531972 4.60 5.70 1.60 3.01 2.86 4.321973 .47 .97 2.41 3.97 6.15 8.001974 1.23 1.82 3.93 5.65 5.82 8.011975 1.06 1.64 2.11 3.61 3.24 5.471976 1.02 1.69 2.77 4.62 6.32 7.781977 3.27 4.44 2.98 5.36 4.35 7.261978 3.93 5.12 3.13 5.62 13.69 16.131979 4.02 5.34 1.81 4.09 9.39 11.641980 2.50 3.55 3.12 5.51 7.18 9.581981 3.05 4.17 4.70 7.26 5.74 7.311982 1.82 2.79 3.99 6.53 6.52 9.341983 2.33 3.48 3.47 6.24 7.70 11.321984 1.91 2.91 2.39 4.74 5.97 9.701985 N/A N/A N/A N/A N/A N/A
Notes to Table 18:(a) Calculated as the Producer Price Equivalent at the equilibrium exchange
rate (Table 3-4(1) for rice, Table 3-4(2) for maize, andTable 3-4(3) for cocoa), divided by the Nonagricultural CPI fromTable 3-5(1), adjusted as described in Annex 5.
(b) Calculated the same way as (a) using the Retail Price Equivalent fromTable 3-4(1 for rice, Table 3-4(2) for maize, and the Optimum DomesticPrice at the border, valued at the equilibrium exchange rate, fromTable 3-4(3) for cocoa.
1 52

Table 19
Effect of Direct and Indirect Price Interventionson Relative Price Differences
maize Rice Cocoa
Year Producer (a) Consuser (b) Producer (a) Consumer (b) Producer (a) Consumer lb)
1958 -.643 -.571 -.228 -.170 -.442 -.4051959 -.679 -.586 -.316 -.230 -.388 -.3501960 -.799 -.725 -.481 -.356 -.253 -.2191961 -.723 -.662 -.548 -.405 -.223 -.1881962 -.648 -.569 -.549 -.382 -.230 -.1941963 .189 .160 .051 .058 -.342 -.2931964 -.479 -.412 -.191 -.114 -.094 -.0681965 -.121 -.073 -.469 -.352 -.419 -.3601966 .212 .173 -.394 -.277 -.354 -.3071967 -.263 -.180 -.252 -.181 -.314 -.2811968 -.588 -.511 -.558 -.433 -.368 -.3321969 -.326 -.283 -.330 -.250 -.567 -.5331970 1.422 .800 -.114 -.074 -.331 -.2281971 .025 .020 .066 .045 -.110 -.0861972 -.703 -.652 .715 .440 .278 .1851973 1.664 .934 .213 .151 -.372 -.2841974 -.121 -.088 -.351 -.276 -.398 -.2821975 -.020 -.014 .326 .221 .016 .0111976 .901 .615 .662 .442 -.518 -.4291977 -.153 -.121 .297 .208 -.126 -.0551979 -.652 -.565 -.179 -.124 -.689 -.5891979 -.703 -.610 -.184 -.097 -.551 -.4461980 -.057 -.032 .335 .245 -.598 -.4291981 -.371 -.298 -.543 -.381 -.315 -.2281982 -.109 -.052 .118 .118 -.471 -.2931983 .964 .779 .907 .613 -.620 -.3921994 -.311 -.244 1.108 .627 -.589 -.3771985 N/A NIA NIA N/A N/A N/A
Notes to Table 19:(a) Producer Price from Table 3-3M1) for rice and maize and from Table 3-3(2)
for cocoa divided by the Nonagricultural CPI froe Table 3-5(1) sinus theeffect on producer prices from Table 19, all divided by the effecton producer prices from Table 18.
Ib) Retail Price from Table 3-311) for rice and maize and RenderedPart Price from Table 3-3(2) for cocoa divided by the NonagriculturalCPI minus the effect on consumer prices from Table 18, all divided by theeffect on consumer prices from Table 18.
1 53

consideration, this was because both the direcft and indirect distortions
operated in the same direction. After 1964, when trade restrictions in most
years caused the domestic price to exceed the border price, the twD
influences on relative prices worked in opposite directions, with the
exchange rate distortions generally being dominant. This is consistent with
the fact that, until recently, maize was imported by Giana in only small
quantities and trade restrictions had less of an influence an its dcmestic
price than did local demand and supply. During the early 19E)s, moreover,
substantial increases in maize imports kept domestic prices from rising very
much, except during the drought year of 1963.
Rice imports, on the other hand, were subject to much more
restrictive trade controls, especially after 1970. In only 4 out of the
following 14 years, for example, were import restrictions sufficiently lax
that the overall effect of trade and exchange rate policies on the domestic
price of rice was negative. This is confirmed by the data in Prnex 6, which
show that imports of rice were not allowed to rise nearly as much as those
of maize.
The combined influence of direct and indirect interventions is
even more striking in the case of cocoa. The prcokdcer price was depressed
below its optimal level at the equilibrium exchange rate in every year but
two over the period studied. During those two years - 1972 and 1975 - the
producer price was increased significantly, world cocoa prices were
relatively low, and the exchange rate was not highly overvalued. Even
though the producer price was below its border price equivalent in those
years, the difference was less than at the optimal rate of export taxation.
154

In every other year, the total impact of policy was to penalize, and in most
years very heavily, the cocoa sector.
It is interesting to note, as well, the changes in the degre of
price distortions over time. By and large, the adverse impact of policy an
cocoa prices decreased during the Nkrumah years because of falling world
market prices. In 1965, however, the year before Nkrumah fell, cocoa was
heavily penalized as a result of a sharp increase in the overvaluation of
the exchange rate without any corresponding increase in producer prices.
Despite the change in government in 1966, cocoa continued to be penalized
until 1971, when low world market prices lessened the impact of the failure
of the Busia regime in that year to increase the producer price. There thEn
followed a few years of fairly high producer prices under Acheampong, though
these are not evident in Table 19 because 1973 and 1974 were years of very
high prices on the world cocoa market. Finally, there ensued, from 1976 to
1984, a period during which the cocoa price was highly distorted in relation
to its optimal level.
155

CHlTER VII: EFFECT ON Oa RJT, IWNfPTION, i1n FOFEIGN EXCH*M
Trade, price, and exchange rate policies in Ghana have affected
not only relative prices, as shlwn in the previous chapter, but also the
al location of resources. In this chapter the impact of these relative price
changes is assessed as these have influenced output, consumption, and
foreign exchange flwas.
The effects of price interventions are examined in the short run,
the long run, and the very long run. This is particularly important for the
cocoa sector, in which capital investmLent has a long gestation period. In
Ghana the capital stock of cocoa trees has been declining for a lcng period
of time. INt only has production been falling, but the average age of trees
has been increasing, indicating that replanting has not been sufficient to
offset the depreciation of the capital stock. A major issue to be explored
in this study is the extent to which this has been due to price policy.
Effects on Aqricultural Production
This section examines the effects of policy influencing relative
prices on agricultural production. Only changes in output prices are
considered because of the lack of reliable census or survey data an use of
inputs. Except for mechanized rice cultivation, hoever, labor and capital
are by far the most important production inputs, and most of the capital
consists of labor embodied in cocoa farms. For traditional, manual
techniques of production, intermediate inputs used on the farm acccunt for
less than 10 percent of the value of cocoa output and less than 5 percent
of protection on these inputs was not very far from unity, the error
156

introduced by not al lowing for direct subsidies does not appear to be very
great.
Mbre important may have been the indirect subsidies resulting from
the overvalued cedi, which made the CIF price of imported fertilizer,
tractors, and other inputs artificially low when converted to local currency
at the official exchange rate. Imports of these inputs were severely
constrained because of foreign exchange shortages, however, so that only a
few producers had access to them at these artificially low prices. Instead,
middlemen captured the rents created by these shortages as seccndary markets
developed in which inputs were sold at prices nuch higher than those
officially authorized. Finally, delivery delays were cammnn, decreasing
considerably the effectiveness of the inputs.
In the absence of detailed time-series information on the relative
importance of these various factors, it is impossible to estimate their
overall impact on produjction. It is clear, hawever, that only a few larger
farmers benefitted from either direct or indirect government subsidies and
that the vast majority of cultivators used few, if any, nontraditional
intermediate inputs. Consequently, limitation of the analysis to
consideration of the effects of distortions in output prices does not
seriously bias the results.
Supply Funictions. The impact of policies affecting output prices on
agricultural production may be estimated using the relative producer price
distortions show.n in Tables 16 and 19 and the elasticity of supply for each
of the tradable crops included in that table. Although the method for
estimating supply elasticities is relatively straight-forward, for annual
157

crops, such as rice and maize, it is considerably more complicated in the
case of cocoa. These methods and their results are described below.
Cocoa A number of estimates exist of supply elasticities for cocoa.
Perhaps the best of these for many years were those of Bateman.1- These
suggested that short-run elasticities from 1949 to 1962 were in the range of
0.39 to 0.87, depending on region, and long-run elasticities were from 0.77
to 1.2B.- This was a period, however, during which cocoa production and
acreage increased in respanse to strong positive price incentives, in
contrast to later years of declining production. Subsequent analysis by
Bateman covered a longer period from 1932/33 to 1969/70.: Price elasticity
estimates for this period were generally much laher. Short-term
elasticities for different regions, for example, ranged from 0.14 to 0.21.
Long-term elasticities were not given.
Mbre recently, the Ccmmodity Studies and Projections Division of
the World Bank estimated supply elasticities for a number of producier
countries. 4 The production decision, in these analyses, was viewed as a
x Merrill J. Bateman, Cocoa in the Ghanaian Econcmwv: An EconometricModel, Amsterdam: NorthHbl land, 1968.
2 Hossein Askari and John Thomas Cummings, Aaricultural SuWplvRrssonse: A Survey of the Eccrometric Evidence, New York: Praeger, 1976,p.404.
M errill J. Bateman, "An Ecorxmetric Analysis of Ghanaian CocoaSupply," in R.A. Kotey, C. Okali, and B.E. Rburke, (eds.), Eccnomics ofCocoa Production and Marketincq, Institute of Statistical, Social andEconomic Research, Liniversity of Ghana, Legon, 1974, pp.28E&-326.
Takamara Akiyama and Ronald C. Duncan, Analysis of the World CocoaMarket, Wbrld Bank Staff Commodity Working Paper ND. 8, 1982; T. Akiyama andA. Bowers, SuPplY Response of Cocoa in Major Produking Coaxtries, DivisionWbrking Paper Nb. 1984-3, Commodity Studies and ProjectionsDivision,Economic Analysis and Projections Department, Wbrld Bank, April 19B4.
158

two-stage process involving (1) the stock of cocoa trees and (2) the level
of production given a particular stock. Time series data on initial area
planted, new area planted, and yields were used to estimate production
capacity, which was an input along with prices into the supply function.
Short-run elasticities in Brazil, Ivory Coast, and Malaysia ranged fron 0.21
to 0.30. Long-run, steady-state elasticities, including feedback fron
acreage response over a period of 10 years, were 0.8 for Brazil and 1.8 for
the Ivory Coast.
For Ghana, the most recent estimates of cocoa supply elasticities
are contained in a draft annex prepared by Akiyama for the World Bank
Commodity Studies and Projections Division.25 These estimates are consistent
with the findings of the Cocoa Land Intensive Survey carried out during the
1970s by the Ghana Cocoa Services Division and analyzed in a Wbrld Bank
background paper., The estimates are based on the vintage matrix approach
used by the International Coroa Organization (IC02). This approach
estimates "normal" cocoa production based on a matrix of estimated acreage
of trees classified by age and average yield. A regression equation is then
estimated in the Akiyama study to explain actual production fram 1968/69 to
1963/84 by variations in normal production and other variables affecting
short-term supply, such as the producer price.
The Akiyama analysis results in short-run elasticities of cocoa
production with respect to price of 0.24 and with respect to insecticide
0 Takamara Akiyama, "Cocoa Supply Projections" Prriex C draft, July 30,1985.
' World Bank, Ghana: The Cocoa Sector, Backgrcoind Paper Nb. 1 of 4prepared for the Ghana: Policies and Program for Adjustment Report, October14, 1983.
159

sales to farmers of 0.29. The price variable is a weighted average of
prices lagged two and three years. This does not allow for any immediate
impact of the producer price an harvesting but does show saoe effect on
production thrcugh improved maintenance. The insecticide sales variable is
an unweighted average of sales over the previous three years. Elasticities
of new plantings with respect to price are also estimated at 0.5 for the
short run and 1.5 for the lang run. New plantings are calculated, however,
an the basis of hybrid seed distribution by the government, which has been
constrained tyy the capacity of its seed gardens and does not take into
account farmers use of their own traditional plant: materials. Furthermore,
much of the planting at this time was undertaken within the context of two
large cocoa projects for which the producer price was not a major
determinant of the planting schedule. The elasticity of new plantings
estimates are therefore not very reliable.
The procedure used here, and explained in detail in Annex 4,
involves emplcyying the methodology and some of the parameters developed by
Bateman to estimate new planting of traditional varieties over the period
1945/46 to 1985/86.7 New planting of hybrid varieties, which began in
1968/69, is estimated mn the basis of seed garden deliveries and is not
directly related to price. Each year's new planting hectarage of bDth
varieties is carried through the vintage matrix model, where it is
multiplied by the profile of yields over the age distribution of the trees.
Production from traditional and hybrid trees planted since 1945/46 is added
to production of trees planted earlier than 1945/46, with an adjustment to
' Bateman s estimates are for the period 1932/33 to 1969/70, butplanting of traditional varieties decreased rapidly to zero after the 1960s,and his model, as modified here, predicts this quite well.
160

take into acccunt the rate at which these trees must have been going out of
productimn to reach the area planted in them revealed by the surveys of the
1970s.
The resulting time-series of "normal" production is then compared
with actual production as estimated by official marketings.3 Same
adjustments are made to Bateman's parameters, as described in Annex 4, until
normal production corresponds reasonably well with actual producticn, due
allowance being made for the short-term influence of weather and prices.
As a final step, actual production is estimated as a function of
normal production and of current and past prices, using the following
specification:
-~ 2 co co cof
lnQt = Bo + B 1 lnNt + BElnQ*-,L + B31r7Pt + B4 lnPe + et ... (1)
where QF° is actual production, N'° is normal production, P-- is the
producer price of cocoa, Fr is the producer price of food crops, and t is
the year in which production takes place. The lagged dependent variable in
this equation represents the effect on current production of previous years'
prices. In the usual Nerlavian formulation, these prices are determinants
of the price the farmer expects to receive in the current year. In the
cocoa sector, however, the producer price is annxouced well in advance of
the main harvest season so there is no unmcertainty for the farmer. Previous
E Actual production differs from official marketings by the quantityof cocoa smuggled to neighboring countries. This quantity is judged (seeAnnex 1) to have been about 10 percent of production in recent years, but itis impossible to estimate, with any degree of accuracy, the year to yearvariatimns in smuggling because of marked shifts in the degree to whichanti-smuggling laws have been enforced. Instead, the approach used here isto treat official marketings as production and to assume that smuggling isane aspect of producers' supply response to price incentives.
161

prices do influence current production, however, because of their effects cn
weeding, pruning, spraying, canopy repair, and other types of maintenance,
the full impact of which may not be felt for several years. Cbnsequently,
this term is included to distinguish the short run price elasticity BR from
the long run elasticity EB/(1-8a=), where B6 is the coefficient of
adjustment.
The price of food crops is represented here by that of maize,
which tends to be closely correlated, as noted earlier, with the prices of
the other major food staples. The current price is used rather than the
lagged price since farmers are able to predict focd crop prices sufficiently
in advance during the growing seasm to influence their decisions as to how
intensively to harvest cocoa. To the extent that past food crop prices also
influence cocoa production, this is captured in the autoregressive term,
with the long-run elasticity being given by BE/( 1-E6).
The parameters estimated for equation (1), using data for 1944/45-
1985/86, are given by:
1nQt = - 1.480 + .498 lnN4 + .643 lnQ]_ + .223 ln P* -. 143 lnP* ... (2)
(-1.344)(2.644) (5.123) (2.953) (1.787)
R = 0.824 H - 0.547
where the figures in parentheses are the t-statistics for the regression
coefficients. All slope coefficients have the expected signs and the first
three are significantly different from zero, using a two-tailed test, at the
.01 level of significance. The coefficient of the price of maize is
significantly different from zero at the .10 level. The short-run
elasticity of output with respect to the price of' cocoa is .22, which is
162

consistent with previous estimates for Ghana and other major producing
countries. The short-run elasticity with respect to the price of maize is
-. 14. The lngr-rum elasticity of cocoa output, given the stock of cOCoa
trees, is .62 with respect to the price of cocoa and -. 40 with respect to
the price of maize. This is different from the long-rrn, steady-state
elasticity assuming that the stock of trees changes in response to price.
The latter parameter is, in fact, quite difficult to calculate,
especially for large changes in price, for several reasons. Annex 4
describes in detail the factors influencing the rate at which new planting
takes place and the impact that this has on subsequent production. Briefly
summarized, new planting depends, in the Bateman fornmulation, on (1) the
difference between the real producer price and a threshold level below
which planting would be unprofitable, (2) a nonlinear planting effort
function, and (3) the absorptive capacity of the agricultural sector to
undertake new investment linked to the size of the populaticn, the supply of
capital, and other constraining variables. Even if the relationship between
the rate of planting and produrer price could be established, the relative
production response also depends on the time period over which that response
is measured, the size and age distribution of the existing tree stock, and
the yield profile of the trees. The vintage matrix model is able to
incorporate the complexity of this price response mechanism without having
to focus on a single parameter - the long-run elasticity of supply. This
is particularly important in Ghana, where the response in recent years to
changing producer prices has not been new planting but rather the failure to
replant as praductive capacity has decreased with aging of the existing
trees.
163

The pracedure for estimating the impact that price policy
distortions have had on cocoa prnduction in Ghana therefore involves several
steps. The first is to calculate the replanting of traditicnal trees that
would have taken place with unrdistorted equilibrium prices using the
procedure described in Anex 4. This planting series is then carried
thrcugh the vintage matrix model to derive normal production under
equilibrium conditions. The final step is to calculate Qt from equation (2)
using this series on normal production and data on undistorted prices.
Food Crops As discussed in Annex 1, the quality of the production
data for food crops is very poor. Nevertheless, the magnitude of
distortions is such that large variations in prices ever time could
compensate, to a considerable extent, for the errors in the data.
Consequently, supply functions were rxun using the existing data, and the
results were assessed for reasonableness in comparison with other estimates
that have been made outside of Ghana.
The following regression equation was estimated for maize:
m m m
lnt*, = 4.304 + .142 lnQD_± + .794 lnPt.m_ -.267 lnPt - .440 lnP-±L ... (3)(3.434)(2.535) (2.519) (1.771) (1.802)
-2R = .32 H = 0.981
where the superscripts designate maize (m), cocoa (co), and cassava (ca).
All coefficients have the predicted signs and those for the lagged values of
On and Pm are statistically significant at the .05 level. The estimators
for the cross-price elasticities for cocoa and cassava are significant at
the .10 level. The short-rmu price elasticity for maize of .79 seems
164

somewhat high in relatimn to most estimates for cereals outside of Africa,v
but it is within the range of elasticities estimated in Nigeria for cottan
and groauxnduts, annual crops that may be substitutes for maize. -
Furthermore, the coefficient of the autoregressive term is fairly low,
implying that the long-run elasticity of maize with respect to its own price
is mnly .93, which does not seem unreasonable given high substitutability
in production with cocoa and other food crops such as cassava, yams, millet,
and sor-ghum.
In cmntrast to maize, rice, which is grown principally in the
river valleys of the north, does not use land that is suitable for other
major crops. Nevertheless, there is some substitutability in production
with cocoa, which competes with rice for migrant labor during the harvest
period. With both rice and cocoa prices as explanatory variables, the
following regression equation was run,
a ,- r- co
lnQG = 3.006 + .242 1nQG.- + .427 lnP*-1 - .391 inP* ... (4)(2.424) (2.773) (2.273) (2.340)
-2R = .467 H = 2.644
Al1 coefficients have the expected signs and are significant at the .05
level.
This is misleading, however, since the H statistic suggests the
presence of positive serial correlation, implying that the standard errors
9 Askari and Cummings, Agricultural SuPPly Response ... , pp.390-96.
20 Marian E. Bond, "Agricultural Responses to Prices in Sub-SaharanAfrican Comtries," IMF Staff Papers, 30 (4), December 1963. pp. 710-11.There are no reliable existing estimates of food crop elasticities forneighboring countries in West Africa.
165

of the regression coefficients are uiderestimated. L An attempt was made to
redress this situation using the Cochrane-Orcutt procedure. This led to a
decrease in the short-run elasticity of rice with respect to its oaw price
from .43 to .17 and a decrease in the long-run elasticity from .56 to .33.
The coefficients of the price of rice and cocoa, however, were in this case
not statistically significant. This implies that the null hypothesis that
the prices of rice and cocoa have no influence on rice output cannot be
reliably rejected. Nevertheless, it does not mean that equation (4) cannot
be used to predict the output of rice under a regime of different prices as
long as the same omitted variables that resulted in serial correlation would
have continued to operate during the same period with the different price
regime. The implied owu-price elasticities in the short-run of .43 and in
the long-run of .56 do not appear to be unreasonable.
Price Elasticities of Supply As a way of verifying the reasonableness
of the estimates, it is useful to construct the following matrix of
short-run elasticities:
Short-Run Supply Elasticities
Output Price
Cocoa Maize Cassava Rice
Cocoa +.22 -. 14Maize -. 27 +.79 -. 44Rice -. 39 +.43
" The H statistic, which is more appropriate than the Durbin-Watsonstatistic in the presence of an auto-regressive term, is not significant for-either the cocoa or the maize supply equations.
166

Only those coefficients that are significant at the .10 level or greater are
show.
With the possible exceptim of the elasticity of maize output with
respect to its own price, discussed earlier, the results appear reasmable
and consistent with mne another. The cross elasticity of maize with
respect to the price of cocoa, for example, is about double the elasticity
of cocoa with respect to the price of maize, which is consistent with the
synmnetry conditim (dg(/dP- = dg=/dPm) and the relative importance of the
tWo crops in production. The fact that the elasticity of rice with respect
to the price of cocoa is statistically significant but that the elasticity
of cocoa with respect to the pr-ice of rice is not significant is not
surprising in view of the much greater relative importance of cocoa.
Finally, the greater substitutability in production of maize and cassava
than of maize and cocoa is cmsistent with the relative magnitude of these
two cross-elasticities.
Equilibrium Levels of Output
Equilibrium levels of output were calculated using equatic-s (2)
through (4) for the short run, lamg run, and very lang run. In the short
run, real equilibrium prices were substituted for real actual prices, where
the equilibrium prices were obtained from Tables 14 and 18 adjusted so that
the nmagricultural price deflator equals unity in 1963, the base year used
in estimating these equations. Actual lagged values of the dependent
variable were used in this calculation, and the residuals were added to the
167

predicted values assuming stochastic variation, largely due to fluctuations
in rainfall, to be the same in equilibrium as in the distorted situation.12
The equilibrium level of output in the long run is predicted in
the same way as in the short run except that the lagged value of the
dependent variable, after the first year, is its predicted rather than its
actual value. The deviation of equilibrium prices frcm distorted prices
influences output in twD ways. First, it affects output directly in the
current year. Second, it affects autput indirectly by influencing previous
levels of output, which in turn have an impact on current output.
Attempts to predict the long-rum equilibrium level of cocoa
production in this way result in output rising to very high levels because
of the influence of the autoregressive term. This implies that the ability
of farmers to increase production through improved tree maintenance is much
greater than it is kncwn in fact to be. The problem is at least partially
that the coefficient of the log of the autoregressive term is estimated
largely on the basis of a historical decline in output resulting from lack
of maintenance in the face of low producer prices. While some reversal of
this process can be anticipated, it would not be unlimited, and diminishing
returns must set in as the trees approach their maxinum yield.
In the very long run, cocoa output is influenced by the same
variables that affect output in the long run, but prices also have an impact
on production through their effect on planting. Whereas normal production
2t This deals with the problem raised in A.0. Krueger, M. & hiff, andA. Valdes, "Note 7. On Measure.ent of Quantitative Effects and RegressicnResiduals," Memo No. 27, July 11, 1986. Use of the original equations,rather than just estimated elasticities, to calculate equilibrium levels ofautput is very important for Ghana because of the large distorticnsinvolved. These can lead to very biased results if changes conforming tothe elasticities are calculated using a single base point.
168

in equation (2) is based on estimated actual planting for the short and Iong
runs, for the very icng run is derived, using the vintage matrix model, from
the plantings that would have occurred had prices been in equilibrium.
These plantings are estimated in the same way as actual plantings, with
equilibrium prices used in place of distorted prices. The equilibrium
output level for maize and rice is the same, of course, as in the long run.
The results of this exercise are shown in Tables 20-22 for the
direct effect of price distortions on output, and in Tables 23-25 for the
total effects. From Table 20 it appears that the effect of direct price
distortions on production of maize and rice in the short run has been almost
uniformly positive, since during the early years in which the effect on
maize appears to have been negative, maize imports were very low in relation
to production and domestic prices were scarcely influenced by the cost of
these imports. Even later, when the equilibrium level of maize production
was usually higher than its actual level, there were sharp variations from
year to year, which were less a result of changes in trade policy than of
fluctuations in domestic supply. Towards the end of the 1970s, the exchange
rate became so overvalued that the price of maize and rice to producers in
most areas of the country would have reached zero if these cereals had
continued to be marketed in the major urban centers, As noted earlier, this
was because of the low border prices at the official exchange rate and the
high cost of transport and marketing.5 This gives rise to very low levels
of output for these years in Tables 20-22. In fact, of course, farmers
would have ceased to sell to urban markets as producer prices fell, and
3 In estimating the output of maize and rice for Tables 20-22, thenegative prices for these later years shown in Table 14 were set equal tounity because of the logarithmic nature of the supply function.
169

Table 20
Direct Effect on Output, Short-Run(000 at)
maize Rice Cocoa
Year 0 la) 01 (b) A D/0 Ic) O (a) 01 (b) Q/0O tc) 0 (a) 0t lb) A 0/0 kc)
1955 169 N/A NIA 23 NIA N/A 229 221 .0351956 169 363 -.534 23 22 .033 264 259 .0181957 169 238 -.289 23 16 .396 205 211 -.0271958 183 475 -.615 30 23 .287 256 280 -.0951959 N/A 392 N/A N/A 32 N/A 317 340 -.0671960 N/A N/A N/A 32 N/A N/A 430 410 .0501961 N/A N/A N/A 30 29 .038 409 416 -.0161962 169 NIA N/A 31 28 .110 413 436 -.0521963 183 238 -.232 33 29 .141 428 563 -.2401964 170 82 1.076 42 28 .476 538 589 -.0871965 206 15B .306 32 20 .574 401 534 -.2501966 353 102 2.472 29 15 .883 372 545 -.3171967 278 72 2.861 42 23 .824 423 537 -.2131968 253 131 .934 42 25 .696 333 401 -.1691969 300 260 .154 60 47 .282 419 529 -.2081970 482 307 .570 49 35 .380 434 639 -.3211971 465 84 4.568 55 34 .633 477 608 -.2151972 402 166 1.416 70 40 .747 427 428 -.0011973 427 530 -.194 62 30 1.087 357 524 -.3181974 486 94 4.176 73 41 .783 395 511 -.2271975 343 162 1.116 71 59 .208 416 514 -. 1911976 286 83 2.432 70 31 1.242 339 539 -.3711977 274 31 7.863 109 42 1.598 290 413 -.2981978 218 17 12.059 108 9 10.693 286 408 -.3001979 380 45 7.423 93 12 6.836 323 357 -.0961980 382 83 3.595 78 19 3.128 284 341 -.1661981 378 36 9.390 97 B1 .199 248 137 .8051982 346 2 209.524 36 5 5.875 198 355 -.4421983 173 1 190.515 40 4 8.174 173 349 -.5051984 574 1 529.637 66 7 8.389 189 224 -.1571985 411 10 40.514 90 10 7.856 226 248 -.090
Notes to Table 20:(a) Actual output froe Anne% 1, Table 1-2(1) for maize and rice, and Table 1-2(31) or cocoa.(b) Short-Run Equilibrium outpt trom equations (2)-(41 as described in text.Ic) Relative change in outputX. 0/A obtained by dividing CO-OR) by 01.
170

Table 21
Direct Effect on Output, Long-Run(000 at)
Maize Rice Cocoa
Year a (a) 01 (b) '4 0/9 (c) 0 (a) Ot 1(b) A /0 (c) Q (a) 1 (b) A. 0/a (c)
1955 169 N/A N/A 23 N/A N/A 229 221 .0351956 169 363 -.534 23 22 .033 264 254 .0411957 169 265 -.362 23 16 .407 205 205 -.0021958 183 506 -.639 30 21 .397 256 279 -.0841959 N/A 453 N/A N/A 30 N/A 317 359 -.1181960 N/A 373 N/A 32 64 -.503 430 444 -.0321961 N/A 462 N/A 30 34 -.124 409 424 -.0361962 169 631 -.732 31 29 .075 413 446 -.0741963 183 287 -.363 33 28 .161 428 592 -.2771964 170 87 .947 42 27 .531 538 726 -.2581965 206 144 .435 32 18 .745 401 648 -.3811966 353 97 2.655 29 13 1.154 372 742 -.4981967 278 60 3.641 42 19 1.197 423 843 -.4901968 253 105 1.405 42 20 1.052 333 632 -.4731969 300 229 .307 60 39 .525 419 815 -.4061970 482 296 .631 49 32 .529 434 1006 -.5691971 465 78 4.968 55 30 .808 477 1077 -.5571972 402 129 2.113 70 35 1.015 427 745 -.4271973 427 451 -.053 62 25 1.474 357 772 -.5381974 486 95 4.136 73 33 1.220 395 866 -.5441975 343 129 1.669 71 48 .466 416 880 -.5271976 286 72 2.946 70 28 1.460 339 900 -.6231977 274 25 9.771 109 34 2.231 290 804 -.6391978 218 12 17.302 108 7 14.530 286 822 -.6521979 380 30 11.727 93 6 14.219 323 739 -.5631980 382 58 5.594 78 10 6.977 284 614 -.5371981 378 28 12.581 97 49 .982 248 240 .0341982 346 1 303.915 36 4 7.112 198 370 -.4651983 173 .4 430.476 40 3 14.225 173 553 -.6871984 574 .5 1,254.9178 66 4 17.147 189 504 -.6251985 411 4 113.352 90 5 16.859 226 496 -.544
Notes to Table 21:(a) Actual output froo Annex 1, Table 1-2(1) for maize and rice, and Table 1-2(3) for cocoa.(b) Long-Run Equilibrius output from equations (2)-(4) as described in text.(c) Relative change in output Ai Q/ obtained by dividing (Q-O1) by 01.
17 1

Table 22
Direct Effect on Output, Very Long-Run(000 It)
maize Rice Cocoa
Year Q (a) 0Q (b) AO /0 (c) 0 (a) f l(b) Q/Q Cc) 0 (a) 0Q (b) A Q/Q (c)
1955 169 N/A N/A 23 N/A N/A 229 221 .0361956 169 363 -.534 23 22 .033 264 253 .0421957 169 265 -.362 23 16 .407 205 205 -.0021958 183 506 -.639 30 21 .397 256 279 -.0841959 N/A 453 NIA N/A 30 N/A 317 360 -.1191?60 N/A 373 N/A 32 64 -.503 430 444 -.0321961 N/A 462 N/A 30 34 -.124 409 424 -.0361962 169 631 -.732 31 29 .075 413 446 -.0741?63 183 287 -.363 33 28 .161 428 592 -.2771964 170 67 .947 42 27 .531 538 726 -.2591965 206 144 .435 32 18 .745 401 648 -.3811966 353 97 2.655 29 13 1.154 372 742 -.4991967 278 60 3.641 42 19 1.197 423 845 -.5001968 253 105 1.405 42 20 1.052 333 637 -.4771969 300 229 .307 60 39 .525 419 828 -.4941970 482 296 .631 49 32 .529 434 1034 -.5801971 465 78 4.968 55 30 .808 477 1130 -.5781972 402 129 2.113 70 35 1.015 427 806 -.4701973 427 451 -.053 62 25 1.474 357 865 -.5871?74 486 95 4.136 73 33 1.220 395 1013 -.6101975 343 129 1.669 71 48 .466 416 1084 -.6161976 296 72 2.946 70 28 1.460 339 1179 -.7131977 274 25 9.771 109 34 2.231 290 1124 -.7421978 218 12 17.302 1o8 7 14.530 286 1227 -.7671979 380 30 11.727 93 6 14.219 323 1177 -.7261980 382 58 5.594 78 10 6.977 284 1037 -.7261981 378 28 12.581 97 49 .982 248 429 -.4211982 346 1 303.915 36 4 7.112 198 694 -.7151983 173 .40 430.476 40 3 14.225 173 1086 -.8411984 574 .46 1,254.918 66 4 17.147 189 1031 -.8171985 411 4 113.352 90 5 16.859 226 1055 -.786
Notes to Table 22:(a) Actual output from Annex 1, Table 1-2(1) for saize and rice, and Table 1-2(3) for cocoa.(b) Very Long-Run Equilibrium output from equations (2)-(4) as described in text.(c) Relative change in output A Q/Q obtained by dividing (0-02) by Ql.
172

Table 23
Total Effect on Output, Short-Run(000 It)
Maize Rice Cocoa
Year 0 (a) as (b) a 0/0 (c) 0 (a) 0 (b) A 0/0 (c) 0 (a) 01 (b) A Q/g Icl
1955 169 N/A N/A 23 N/A N/A 229 203 .1281956 169 406 -.584 23 26 -.124 264 235 .1241957 169 261 -.352 23 19 .219 205 194 .0541958 183 494 -.629 30 25 .215 256 262 -.0221959 N/A 476 N/A N/A 37 N/A 317 320 -.0091960 N/A N/A N/A 32 N/A N/A 430 387 .1101961 N/A N/A N/A 30 36 -.165 409 393 .0401962 169 N/A N/A 31 39 -.206 413 408 .0131963 183 363 -.496 33 39 -.149 428 519 -.1751964 170 141 .209 42 40 .053 538 526 .0221965 206 235 -.124 32 25 .261 401 498 -.1951966 353 292 .209 29 30 -.025 372 470 -.2091967 278 193 .442 42 46 -.084 423 450 -.0771968 253 229 .104 42 38 .093 333 338 -.0141969 300 384 -.218 60 62 -.038 419 482 -.1311970 482 457 .056 49 49 -.007 434 538 -.1931971 465 177 1.634 55 56 -.021 477 490 -.0271972 402 320 .255 70 75 -.072 427 339 .2611973 427 714 -.402 62 41 .503 357 406 -.1211974 486 131 2.718 73 55 .327 395 436 -.0941975 343 245 .400 71 87 -.187 416 412 .0101976 286 136 1.106 70 48 .462 339 432 -.2151977 274 69 2.958 109 80 .356 290 285 .0161978 218 62 2.499 108 63 .702 286 311 -.0801979 380 178 1.136 93 73 .278 323 312 .0341980 382 165 1.321 78 59 .324 284 329 -.1351981 378 66 4.747 97 74 .309 248 239 .0371982 346 55 5.260 36 39 -.079 198 214 -.0761983 173 18 8.565 40 27 .503 173 223 -.2231984 574 23 23.830 66 37 .763 189 203 -.0701985 411 N/A N/A 90 N/A N/A 226 N/A N/A
Notes to Table 23:(a) Actual output from Annex 1, Table 1-2(1) for maize and rice, and Table 1-2(3) for cecoa.(b) Short-Run Equilibrium output from equations (2)-(4) as described in text.(cl Relative chanqe in output.J9/0 obtained by dividing (0-0*) by 0*.
173

Table 24
Total Effect on Output, Long-Run(000 at)
Maize Rice Cocoa
Year 0 (a) Os (b) A i0/ (c) 9 (a) as (b) A 0/0 (c) 0 (a) 01 (b) A/0/3 (ci
1955 169 N/A N/A 23 N/A N/A 233 203 .1471956 169 406 -.584 23 26 -.124 264 217 .2141957 169 295 -.428 23 19 .181 205 172 .1941958 183 535 -.658 30 24 .265 256 233 .1001959 N/A 554 N/A N/A 35 N/A 317 301 .0541960 N/A 504 N/A 32 79 -.593 430 375 .1481961 N/A 697 N/A 30 45 -.328 409 360 .1371962 169 1100 -.846 31 43 -.279 413 376 .1001963 183 473 -.613 33 42 -.214 428 488 -.1231964 170 161 .057 42 42 -.006 538 573 -.0611965 206 233 -.117 32 25 .259 401 518 -.2261966 353 297 .188 29 28 .031 372 555 -.3291967 278 180 .478 42 46 -.078 423 596 -.2911968 253 217 .167 42 39 .072 333 427 -.2191969 300 375 -.201 60 61 -.022 419 576 -.2731970 482 471 .023 49 50 -.012 434 677 -.3591971 465 176 1.642 55 56 -.025 477 674 -.2921972 402 279 .441 70 76 -.078 427 453 -.0581973 427 678 -.370 62 42 .474 357 513 -.3041974 486 140 2.482 73 50 .457 395 606 -.3481975 343 205 .671 71 80 -.109 416 609 -.3171976 286 126 1.266 70 49 .422 339 631 -.4631977 274 62 3.445 109 74 .476 290 442 -.3441978 218 50 3.325 108 58 .871 286 426 -.3281979 380 144 1.630 93 63 .487 323 424 -.2381980 382 143 1.662 78 54 .458 284 414 -.3141981 378 57 5.604 97 68 .433 248 324 -.2341982 346 42 7.185 36 36 .004 198 271 -.2691983 173 13 11.893 40 27 .505 173 289 -.4011984 574 16 34.699 66 34 .946 189 301 N/A1985 411 N/A N/A 90 N/A N/A 226 N/A N/A
Notes to Table 24:(a) Actual output from Annex 1, Table 1-2(1) for maize and rice, and Table 1-213) for cocoa.(b) Lonq-Run Equilibrius output from equations (2)-(4) as described in text.(c) Relative change in output, il/9 obtained by dividing (0-01) by 01.
174

Table 25
Total Effect on Output, Very Long-Run(000 It)
maize Rice Cocoa
Year Q (a) t I(b) A 0/Q (c) Q (a) Ot (b) A 0/0 lc) 0 (a,) Of (b) 0/0 Cc)
1955 169 N/A N/A 23 N/A N/A 229 203 N/A1956 169 406 -.584 23 26 -.124 264 217 N/A1957 169 295 -.428 23 19 .181 205 172 N/A1958 183 535 -.658 30 24 .265 256 233 N/A1959 N/A 554 N/A N/A 35 N/A 317 301 -.0401960 N/A 504 N/A 32 79 -.593 430 375 .0701961 N/A 697 N/A 30 45 -.328 409 360 .1031962 169 1100 -.846 31 43 -.279 413 376 .0701963 £83 473 -.613 33 42 -.214 428 488 -.1431964 170 161 .057 42 42 -.006 538 573 -.0961965 206 233 -.117 32 25 .259 401 519 -.2401966 353 297 .188 29 28 .031 372 555 -.3321967 278 188 .478 42 46 -.078 423 598 -.3051968 253 217 .167 42 39 .072 333 430 -.2381969 300 375 -.201 60 61 -.022 419 587 -.2971970 482 471 .023 49 50 -.012 434 704 -.3791971 465 176 1.642 55 56 -.025 477 723 -.3401972 402 279 .441 70 76 -.078 427 491 -.1351973 427 678 -.370 62 42 .474 357 570 -.3811974 486 140 2.482 73 50 .457 395 693 -.4351975 343 205 .671 71 80 -.109 416 715 -.4261976 286 126 1.266 70 49 .422 339 761 -.5691977 274 62 3.445 109 74 .476 290 616 -.5561978 218 50 3.325 108 58 .871 286 666 -.5971979 380 144 1.630 93 63 .487 323 729 -.5841980 382 143 1.662 78 54 .458 284 769 -.6521981 378 57 5.604 97 68 .433 248 641 -.6351982 346 42 7.185 36 36 .004 198 563 -.6671983 173 13 11.893 40 27 .505 173 627 -.7441984 574 16 34.699 66 34 .946 189 680 -.7391985 411 N/A N/A 90 N/A N/A 226 N/A NIA
Notes to Table 25:(a) Actual output from Annex 1, Table 1-2(1) for maize and rice, and Table 1-2(3) for cocoa.(b) Very Long-Run Equilibrium output from equations (2)-(4) as described in text.(c) Relative change in outputAO 9/ obtained by dividing (0-02) by a1.
175

marketing costs wculd have been lowered, maintaining producer prices at
positive levels for sales within the local rural area.9*
The positive effect of price distortions on producition of maize
and rice occurred for two reasons. First, from 1963 cnwards, inflation and
restrictions on imports resulted in domestic producer prices exceeding
their border price equivalents in most years. Second, distortions in the
producer price of cocoa encouraged production of alternative crops such as
maize and rice.
The figures on cocoa production confirm this hypothesis regarding
the allocation of resources. During the period up to 1962, the domestic
price of cocoa was in some years substantially lower than its border price,
but this was offset in some cases by a domestic price of maize that was much
lower than its border price. As a result, the direction of the effect of
price distortions on cocoa output varied from year to year. After 1963, a
combination of inflation and import restrictions resulted in a domestic
price for maize that was higher in most years than its border price. This,
coupled with continued taxatimn of cocoa exports, led to a decline in cocoa
production below the equilibrium level in every year but one.-s'
Tables 21 and 22, which show the direct effect of distortions on
output in the long and very long run, confirm these tendencies in more
±4 Subtracting all transport and marketing costs from the CIF price ofcereals imports implicitly assumes that consumption takes place in Accra.In fact, most maize production and a substantial share of the output of riceare consumed in the interior so that transport costs would have to be addedto, rather than subtracted from, the border price in order to obtain itsproducer price equivalent. Existing data do not permit, however, estimationof the quantities involved.
Lf The only year in which there was an exception to this was 1981,when the wDrld price for cocoa was so low, at the official exchange rate,that the export tax was actually negative.
176

exaggerated form. They suggest that if free trade had bee permitted at the
official rate of exchange, prcducticn of rice and maize wold have virtually
ceased by the early 1980s, and that of cocoa wsuld have expanded, with new
plantings, to almost five times its actual level. These results are based,
hoever, on extrapolation well beyond the range over which equations (2)-
(4) were originally estimated. They must therefore be treated with a great
deal of caution. Expansion of cocoa production to over 1 million tons per
year, for example, would have encountered severe constraints in terms of
both the effect this would have had on wDrld market prices and the
availability of suitable land. Despite these caveats, however, it is clear
that the direct effect of distortions on output has been very considerable.
Table 23, shows the total effect of price distortions an output in
the short-run. Since the cedi in Ghana was always overvalued during the
period under consideratio, the equi l ibrium level of producer prices is
higher relative to the actual level than when this distortion is not taken
into accoLmt. The impact this has on production depends, however, on the
relative importance of the own-price and cross-price effects. For maize and
rice, a comparison of Table 23 with Table 20 suggests that these price
effects result in a consistently higher level of equilibrium output relative
to its actual level when all distortions are taken into accat. This is
because of the own-price effects, which tend to increase the equilibrium
level of cereals output compared with the situation in which the change in
the exchange rate is ignored. The cross-price effects resulting from the
difference between the actual and equilibrium price of cocoa, on the other
hand, are more complicated. While the impact of overvaluation of the
currency tends to raise the equilibrium producer price of cocoa in relation
177

to its actual level, the introduction of an optimun export tax for the
purpose of calculating the total effect, tends to lower the equilibrium
price. Mbving fron the direct to the total effect does not, therefore,
always result in an increase in the cocoa price distortion, and its effect
on output of cereals varies from year to year.
The same is of course also true of its influence on cocoa output.
Except for 1981, when cocoa exports were subsidized rather than taxed, the
equilibrium level of cocoa production, taking into acconmt both the
overvaluation of the exchange rate and the optimal export tax, was less than
its level would have been if producer prices had equalled their border
price equivalents. Not only would the equilibrium price of cocoa have been
lower because of the optimal export tax but also the exchange rate effects
would have increased the equilibrium producer price of maize, drawing
resources away from cocoa. As a result, there are a number of years in
which actual cocoa output was greater than equilibrium output in the short
run.
This pattern changes as allowance is made for the responsiveness
of tree maintenance (long run) and new planting (very long run) to prices,
as shown in Tables 24 and 25. After an initial period up until 1963, when
Ghana might have benefitted from restricting output so as to hold up wDrld
cocoa prices, the total effect of cocoa price policy was uniformly negative,
especially in the very long run because of the disastrous effect of policy
on planting. Even if Ghana had optimally restricted cocoa exports, the
level of production in the mid-19E8s would have been 3.5 times its actual
level. With rice and maize, the decreased level of equilibrium, in
178

cmnparison with actual, output in the long run is less a functian of cwn
price response than of farmers being influenced by higher cocoa prices.
Effect on Consumptimn
Goverrvint policy influencing relative prices also affects
consumption of tradable foods. This influence can be estimated by
incorporating the equilibrium consumer prices used in Tables 15 and 18 into
estimated demand functions to predict the levels of consumption that would
have existed in the absence of direct and total distortion. ND distinction
is made, however, between short- and long-rum elasticities since it is
assumed that the entire consumption response would occur within one year.
Estimates of own-and cross-prices elasticities of Ghanaian demand
are available for maize, sorghum/mi llet, cassava, cocyyams/yams, and rice
from Haessel. - Prior information on income elasticities was combined by
Haessel with annual net import, price, and production data from 1953 to
1970, using the Theil-Goldberger mixed estimation tecrhnique, and two-stage
least-squares regression analysis was performed. X The price elasticity for
rice of about -1.25, obtained by Haessel, was highly significant and robust
under alternative specifications. The elasticity for maize, on the other
hand, was very high, but statistically insignificant. This is partly
1 Walter Haessel, "The Demand for Agricultural Commodities inGhana: An Application of Nonlinear Two-Stage Least Squares with PriorInformation," American Journal of Agricultural Economics, 58(2), May 1976,pp. 341-45.
t' It is reasonable to base the estimated demand function on theperiod from 1953 to 1970, rather then the whole period under consideration,because by the mid-1970s the quantity consumed of rice and maize was highlyconstrained by quantative restrictions on imports, with price the endogenc/usdependent variable and quantity consumed the exogenous independent variable.
179

because maize and the other coarse grain cereals, millet and sorghum, are
substitutable for nme another so that their prices tend to move closely
together. This makes it difficult to distinguish the separate influence of
the maize price variable. When the coarse grain cereals were lumped
together, the resulting price elasticity of -2.323 was almost significant,
with a standard error of 1.58.
When the root crops, cassava and yams, were combined with the
coarse grain cereals, the best results were obtained as follows:
lnC* = 2.960 - 1.689 lnPf - 0.823 lnPt + 0.427 lnPr + 0.917 lnY*. ... (5)(.14) (0.99) (0.92) (0.59) (0.54)
. ~ ~~c t r
lnct = 1.90 - 0.362 ln Pf - 0.746 lnPt - 1.256 lnPr + 0.874 lnYt ... (6)(.933) (0.62) (0.58) (0.41) (0.49)
where C is consumption, P is price, Y is per capita income, and the
superscripts designate coarse grain cereals (c), roots and tubers (t), and
rice (r). Figures in parentheses are the standard errors of the
coefficients. None of the coefficients in equation (5) is statistically
significant at the 0.10 level, though the coefficients of the cereals price
and per capita income terms are almost so. The coefficient of the logarithm
of the price of rice is significant at the 0.01 level in equatim (6) and
that of the income term is significant at the 0.10 level. None of the
cross-price elasticities is significant in this equaticns.
In order to simulate levels of consumption under equilibrium
prices, the following elasticities were used from the original equation:
180

Demand Elasticities
Consumption Own-Price Per Capita Income
Maize -1.689 40.917
Rice -1.256 +0.874
The con-price and income elasticities of total coarse grain cereals
consumption were used in place of the elasticities estimated directly for
maize because of the high correlation between the pr-ices of different coarse
grains and the more reasonable results that were obtained with all these
cereals aggregated together. These elasticities were incorporated into the
following regression equation:
InC*. - ,.lnP,, - mlnY+. = 0o + u. ...-(7)
where is the estimated intercept coefficient and ut is the residual.
Equation (7) was estimated for each food over the entire period (1955-85)
for which there are data on consumption, estimated as net availability in
Annex Table 5-1. Equilibrium prices at the retain level from Amiex Tables
3-4(1) and 3-4(2) were then inserted into this equation to determine the
direct and total effects of distortions on consumption.
The results are shown in Tables 26 and 27. Equilibrium levels of
consumption fluctuate widely from year to year, partly because of the
relatively high price elasticities that have been estimated and partly
because the magnitude of distortions varies with local production conditions
and the world market. As explained earlier, this is particularly true of
maize, for which imports are a small share of total consumption.
In the absence of cross-price effects, which make the influence of
price distortions on production relatively complicated, their direct and
indirect effects on consumption are fairly clear. In most years, especially
181

Table 26
Direct Effect on Consumption(000 *t)
Maize Rice
Year C (a) Ct (b) I C/C (c) C (a) CS (b A C/C (d)
1955 144 31 3.69 17 16 .071956 145 48 2.04 21 22 -.041957 145 19 6.67 31 31 .011958 156 50 2.12 31 31 -.011959 N/A N/A N/A N/A N/A N/A1960 N/A N/A N/A 46 42 .101961 N/A N/A N/A 62 58 .081962 144 66 1.18 88 79 .111963 156 366 -. 57 45 81 -. 451964 148 140 .06 61 101 -. 391965 176 602 -. 71 47 84 -.441966 305 1133 -. 73 62 101 -.381967 244 313 -. 22 63 81 -.231968 215 121 .78 53 42 .261969 257 267 -. 04 61 68 -.111970 415 1909 -. 78 80 119 -.331971 399 749 -. 47 65 113 -.421972 342 81 3.20 63 130 -.521973 364 1370 -.73 87 126 -. 311974 413 494 -.16 78 68 .151975 292 490 -.41 40 80 -.511976 254 1432 -.82 43 134 -.681977 233 1186 -.80 69 386 -. 821978 185 405 -.54 105 507 -. 791979 323 364 -.11 52 172 -. 701980 337 2762 -.88 109 893 -. 881981 348 5061 -.93 85 862 -.901982 376 6701 -.94 36 837 -.961983 259 19251 -. 99 55 2897 -. 981984 617 1997 -.69 87 637 -.861985 449 781 -.43 110 321 -. 66
Notes to Table 26:(a) Actual consueption C estiaated as net availability from Annex 6, Table 6-1.(b) Equilibrium consueption CS obtained from equation (7) as described in text.(c) Relative change in consumption A C/C obtained by subtracting equilibrius
consumption from actual consumption and dividing by equilibrium consumption.
182

Table 27
Total Effect on Consumption(000 It)
Maize Rice
Year C (a) CS (b) A C/C (c) C (a) Ct (b) 6 C/C (c)1-14-- N/A 17 N/A _ /-
1955 145 N/A N/A 17 N/A N/A1956 145 N/A N/A 21 N/A N/A1957 145 N/4 N/A 31 N/A N/A1958 156 37 3.19 31 25 .241959 N/A N/A N/A N/A N/A N/A1960 N/A N/A N/A 46 26 .761961 N/A N/A N/A 62 32 .921962 144 35 3.14 88 48 .831963 156 200 -.22 45 48 -.091964 148 60 1.45 61 52 .171965 176 156 .13 47 27 .731966 305 399 -.24 62 41 .521967 244 175 .39 63 49 .271968 215 64 2.34 53 26 1.061969 257 146 .76 61 43 .431970 415 1122 -.63 B0 73 .101971 399 414 -.04 65 69 -.061972 342 57 4.97 63 100 -.371973 364 1109 -.67 87 104 -.161974 413 354 .17 78 52 .511975 292 285 .02 40 51 -.231976 254 572 -.56 43 62 -.311977 233 187 .25 69 87 -.211978 185 45 3.08 105 89 .181979 323 66 3.92 52 46 .131980 337 319 .06 109 144 -.241981 348 191 .83 95 46 .841982 376 343 .10 36 41 -.121983 259 685 -.62 55 100 -.451984 617 385 .60 87 160 -.461985 449 N/A N/A 110 N/A N/A
--- -- -- -- --- -- -- -- -- --- -- -- -- -- --- -- -- -- -- --- -- _ - --_ - -- -- -- --
Notes to Table 27:(a) Actual consueption C estimated as net availability from Annex 6, Table 6-1.(b) Equilibrius consumption Ct obtained from equation (7) as described in text.lc) Relative change in consumption A C/C obtained by subtracting equilibrium
consueption from actual consumption and dividing by equilibrium consumption.
183

after 1962, import restrictims resulted in consumption of maize and rice
that was substantially below the levels that would have occurred at the
overvalued exchange rate if imports of these foods had been freely admitted
(see Table 26). On the other hand, the considering impact of all
distortions, including the overvalued rate of exchange, the picture is
mixed (Table 27). In 7 out of the 24 years for which comparisons can be
made, the equilibrium level of maize consumption would have been greater
than its actual level. In other years, Ghana would have cansumed so little
maize that it would have bEen self-sufficient or would have had a surplus
for export. The situation regarding rice is somewhat different, especially
after 1970 when Ghana in equilibrium would have consumed more rice that it
actually did in 10 out of 14 years. Furthermore, the fact that in
equilibrium there would have been a substantial growth in consumption from
the early 1960s to the early 1980s is consistent with the general perception
that rice consumption has been growing in West Africa for structural reasonis
that are independent of economic policy. *
Effect on Net Foreign Exchanae Earninis
The effect of policy on net foreign exchange earnings is estimated
by multiplying the changes in output and consumption that result from price
distortions, as shown in Table 20-27, times the relevant FOB or CIF price.
An adjustment is also made for the impact of the change in Ghan' s output
(exports) of cocoa on its world market price by multiplying that change
times the existing world price and dividing by the price elasticity of world
93 Scott R. Pearson, J. Dirck Stryker, Charles P. Ftunphreys, et al,Rice in West Africa: Policy and Economics, Stanford: Stanford UniversityPress, 1961.
164

demand for cocoa times total world consumption (see notes to Tables 2B-33).
In addition, there may be an effect on net foreign exchange earnings that
occurs because of changes in imports of intermediate inputs induced by the
changes in output. As discussed earlier, however, intermediate inputs are
unimportant for the crops considered here except for mechanized rice
cultivation. Even in this instance, the value of these inputs is only about
10 percent of the value of rice output measured in domestic prices. The
tradable component of these inputs, nmreaver, accounts for only perhaps
one-half of their total value, so that the adjustment necessary to take into
account changes in imported inputs would have a minimal influence on flows
of foreign exchange.
The results are presented in Tables 26-33 for direct and total
effects in the short, long, and very long runs. In general the net effects
of price interventions on foreign exchange earnings are positive in the
short run when only direct effects are considered and become increasingly
negative as the length of run increases and as indirect, as well as direct,
effects are taken into acccunt. For cocoa the effects of distortions on
foreign excnange earnings due to changes in output are usually negative, but
these effects tend to be at least partially offset by the positive effects
that lower Ghanaian cocoa exports would have had on world prices. On
balance, however, and especially after the mid-1970s, the net effect on
earnings from cocoa is negative..
As expected, this effect on cocoa earmings increases the longer
the period of supply response. Somewhat surprisingly, however, the direct
effect is greater than the total effect despite the fact that both direct
and indirect effects, in the case of cocoa, operate in the same direction.
185

Table 28
Direct, Short-Run Effect of Price Interventions on Foreign Exchange Earnings
Effect an Export Crop Revenue Due to: Prop of Total------------------------------------- Incremental Increaental Incremental Incremental Prop of Effect Effect on ForeignChange in Change in Prop of Effect Change in Change in Change in Change in Effect on on Food Crop in Exchange EarningsQuantity World Total on Export Crop maize Maize Rice Rice Imported Value of Total in Value of Total
Exported (a) Prices (b) Change (c) in Value of Tot Prod (e) Cons (f) Prod (g) Cons (h) Food Crops (i) Exports (I) Exports (ZI(bill USS1) (ill US$) (sill USS) Exports (%I (d) (000 at) (000 at) (000 at) (000 at) (sill US) li) (kI)
Year (11) (2) (3) (4) (5) (6) (7) (B) (9) . (10) (11)
1955 N/A N/A N/A N/A N/A 113 N/A 1 N/A N/A N/A1956 N/A N/A N/A N/A -194 97 0 -1 N/A N/A N/A1957 N/A N/A N/A N/A -69 126 4 0 N/A N/A N/A1958 -18 20 2 1 -292 106 4 0 -54 -18 -171959 -14 16 2 1 N/A N/A N/A N/A N/A N/A N/A1960 10 -13 -4 -1 N/A N/A N/A 4 N/A N/A N/A1961 -3 3 0 0 N/A N/A I 5 N/A N/A N/A1962 -11 13 2 1 N/A 78 2 9 N/A N/A N/A1963 -68 83 15 5 -55 -210 3 -37 14 4 9
00 1964 -20 29 9 3 8B 8 9 -40 16 5 81965 -49 44 -5 -2 48 -425 8 -37 37 12 101966 -96 99 2 1 251 -828 9 -39 71 25 261967 -76 81 4 1 206 -69 12 -18 20 7 91968 -51 42 -9 -3 122 94 11 11 4 1 -21969 -89 101 12 3 40 -10 9 -7 10 3 61970 -129 132 2 1 175 -1495 9 -39 68 16 161971 -87 94 6 2 381 -350 14 -48 60 19 201972 0 0 0 0 236 260 19 -67 7 2 21973 -187 161 -26 -4 -103 -1005 21 -39 70 12 81974 -171 157 -14 -2 392 -81 21 10 72 11 B1975 -131 117 -14 -2 18 -199 8 -41 69 9 71976 -451 340 -111 -14 203 -1179 25 -91 250 32 181977 -423 303 -120 -13 243 -953 44 -317 529 59 461978 -843 534 -309 -35 201 -219 64 -401 398 43 91979 -113 82 -32 -3 335 -41 53 -121 256 24 211980 -130 75 -54 -5 299 -2424 38 -784 1264 115 1101981 201 -105 96 14 342 -4713 10 -777 2012 283 2971982 -1745 705 -1040 -171 344 -6325 20 -800 1764 291 1191983 -3069 1228 -1841 -418 172 -18992 23 -2842 6204 1410 9921904 -83 35 -47 -8 573 -1380 38 -550 750 133 1241985 -50 20 -30 -5 431 -332 52 -211 257 41 36

Notes to Table 28:(a) Difference between actual output and equilibrius output of cocoa
(from Table 20) eultiplied by the FOB price of cocoa (from Table 3-4(3)),divided by the official exchange rate (from Table 4).
(b) Actual output of cocoa (from Table 20) *ultiplied by the change in its
in its FOB price, expressed in US$ at the official exchange rate. This priceprice change equals coluen (1) divided by 0.3 tiees total world exports of cocoa(froa Sill & Duffus, Cocoa Statistics, April 1981).
(c) Column (1) plus column (21.(d) Coluen (31 divided by Exports FOB (from Table 2-2).(el Difference between actual output and equilibrium output of maize (from Table 20).
(f) Difference between actual consumption and equilibrium consumption of maize (from Table 26).
lg) Difference between actual output and equilibrium output of rice (from Table 20) multiplied
by .65 to convert paddy into rice.(hI Difference between actual consumption and equilibrium consueption of rice (from Table 26).Ii) Column (5) - column (6) times CIF saize lconverted to USH using the OER)
plus coluen (7) - column (1) times CIF rice (converted to US, using the OER).(jI Column (9) divided by Exports FOB (from Table 2-2).Ik) The sue of coluens (4) and (10).
187

Table 29
Direct, Long-Run Effect of Price Interventions on Foreign Exchange Earnings
Effect on Export Crop Revenue Due to: Prop of Total--------------------------------- Incremental Incremental Incremental Incresental Prop of Effect Eftect on Foreign
Change in Change in Prop of Effect Change in Change in Change in Change in Effect on on Food Crop in Exchange EarningsQuantity World Total on Export Crop Haile Naize Rice Rice Imported Value of Total in Value of Total
Exported (a) Prices (b) Change (c) in Value of Tot Prod (e) Cons (f) Prod (g) Cons (h) Food Crops (i) Exports (Z) Exports (2)(till UBS) (sill US$) (mill US$) Exports (%) (d) (000 Mt) (000 at) (000 at) (000 Mt) (mill USS) (i (k)
Year (1) (2) (3) (4) (5) (6) (7) (9) (9 (10) (11)
1955 N/A N/A N/A N/A N/A 113 NIA I N/A N/A N/A1956 N/A N/A N/A N/A -194 97 .5 -1 NIA N/A N/A1957 N/A N/A N/A N/A -96 126 4 .2 N/A N/A N/A1959 -19 20 2 1 -323 106 6 -.3 -59 -19 -191959 -26 30 4 1 N/A N/A N/A N/A N/A NIA N/A1960 -7 9 3 1 N/A N/A -21 4 NIA N/A N/A1961 -7 9 I 0 N/A N/A -3 5 N/A N/A NIA1962 -J 6 19 3 1 -462 79 1 9 -70 -22 -211963 -92 101 19 6 -104 -210 3 -37 11 4 10
OD 1964 -73 109 34 11 93 9 9 -40 15 5 1500 1965 -91 91 -10 -3 62 -425 9 -37 38 12 9
1966 -206 211 4 2 256 -928 10 -39 72 26 271967 -201 296 15 5 219 -69 15 -19 21 7 131969 -223 195 -39 -13 149 94 14 It 9 2 -101969 -319 361 43 12 71 -10 13 -7 15 4 17-1970 -360 367 7 2 186 -1495 11 -39 69 16 191971 -401 430 29 9 387 -350 16 -49 61 19 271972 -228 207 -21 -5 2173 260 23 -67 20 5 01973 -469 402 -66 -11. -24 -1005 24 -39 76 13 21974 -692 635 -57 -9 391 -81 26 10 74 11 31975 -616 550 -65 -9 214 -199 Is -41, 75 9 11976 -1267 954 -312) -40 214 -1179 27 -91 253 32 -e1977 -1761 1262 -499 -56 249 -953 49 -317 533 60 41979 -3699 2335 -1353 -152 206 -219 66 -401 391 44 -1091979 -1381 994 -397 -36 350 -41 56 -121 265 25 -111990 -755 438 -317 -29 324 -2424 44 -794 1275 116 971991 15 -9 7 1 350 -4713 31 -777 2026 295 2961992 -1910 772 -1139 -195 345 -6325 21 -900 1764 291 1031 993V -6615- 2647 -3969 -902 173 -19992 24 -2842 6204 1410 5081994 -742 317 -425 -75 574 -1390 41 -550 751 133 591985 -604 243 -361 -57 437 -332 55 -211 260 41 -16

Notes to Table 29:(a) Difference between actual output and equilibrium output of cocoa
(froe Table 21) eultiplied by the FOR price of cocoa (from Table 3-4(3)),divided by the official exchange rate (froe Table 4).
(b) Actual output of cocoa (froe Table 21) multiplied by the change in itsin its FOB price, expressed in US$ at the official exchange rate. This priceprice change equals column (1) divided by 0.3 times total world exports of cocoaffrom Bill & Duffus, Cocoa Statistics, April 1981).
(c) Column (1) plus column (2).(d) Column (3) divided by Exports FOB (from Table 2-2).(e) Difference between actual output and equilibrium output of maize (from Table 21).(f) Difference between actual consumption and equilibrium consumption of maize (from Table 26).(g) Difference between actual output and equilibrium output of rice (from Table 21) multiplied
by .65 to convert paddy into rice.(h) Difference between actual consumption and equilibrium consumption of rice (from Table 26).li) Coluen (5) - coluen (6) times CIF maize (converted to US$ using the OER)
plus column (7) - coluen (8) times CIF rice (converted to USS using the OER).(j) Column (9) divided by Exports FOB (from Table 2-2).(k) The sum of columns (4) and (10).
189

Table 30
Direct, Very Long-Run Effect of Price Interventions on Foreign Exchange Earnings
Effect on Export Crop Revenue Due to: Prop of Total--------------------------------- Incremental Incremental Incremental Incremental Prop of Effect Effect on Foreign
Change in Change in Prop of Effect Change in Change in Change in Change in Effect on on Food Crop in Exchange EarningsQuantity World Total on Export Crop flaize Naize Rice Rice Imported Value of Total in Value of Total
Exported (a) Prices (b) Change (c) in Value of Tot Prod (e) Cons (f) Prod (g) Cons (h) Food Crops (i) Exports (Z) Exports (ii(mill USS) (sill US$) (sill US$) Exports CX) (d) (000 Mt) (000 at) (000 Mt) (000 it) (mill US$1 (i (k)
Year (1) (2) (3) (4) (5) (6) (7) (B) (9) (10) (11)
1955 N/A N/A N/A N/A N/A 113 N/A I */A N/A N/A1956 N/A N/A N/A NIA -194 97 .5 -1 NIA N/A N/A1957 N/A N/A N/A N/A -96 126 4 .2 N/A N/A N/A1959 -19 20 2 1 -323 106 6 -.3 -59 -19 -191959 -26 31 4 1 N/A NIA N/A N/A N/A N/A N/A1960 -7 9 3 1 N/A N/A -21 4 N/A NIA N/A
1961 ~~-7 9 I 0 N/A N/A -3 5 N/A N/A N/A1962 -16 19 3 1 -462 78 1 9 -70 -22 -21
J 1963 -82 101 19 6 -104 -210 3 -37 it 4 10CD1964 -73 109 34 11 93 9 9 -40 1s 5 15
1965 -91 82 -10 -3 62 -425 9 -37 39 12 91966 -206 211 4 2 256 -028 10 -39 72 26 271967 -292 298 15 5 219 -69 15 -19 21 7 131968 -227 189 -39 -13 149 94 14 11 9 2 -101969 -329 373 44 13 71 -10 13 -7 15 4 171970 -378 395 7 2 196 -1495 11 -39 69 16 le1971 -436 469 31 9 387 -350 lb -49 61 19 27197 -271 24 6 -25 -6 273 260 23 -67 20 5 -11973 -572 492 -90 -14 -24 -1005 24 -39 76 13 -11974 -909 833 -74 -11 391 -91 26 10 74 11 01975 -997 793 -94 -12 214 -199 15 -41 75 9 -21976 -1997 1429 -468 -60 214 -1179 27 -91 253 32 -291977 -2960 2049 -910 -91 249 -953 49 -317 533 60 -31197 -6490 4102 -2378 -266 206 -219 66 -401 391 44 -2231979 -2932 2039 -794 -74 350 -41 56 -121 265 25 -501990 -1726 1001 -725 -66 324 -2424 44 -794 1275 116 501991 -328 171 -157 -22 350 -4713 31 -777 2026 295 2631982 -5513 2227 -3296 -541 345 -6325 21 -900 1764 291 -2511993 -15979 6355 -1525 -2165 173 -18992 24 -2942 6204 1410 -7551984 -1996 949 -1139 -201 574 -1390 41 -550 751 133 -691995 -1956 747 -1109 -175 437 -332 55 -211 260 41 -134

Notes to Table 30:(a) Difference between actual output and equilibrium output of cocoa
(from Table 22) eultiplied by the FOB price of cocoa (froe Table 3-4(3)),
divided by the official exchange rate (from Table 4).
(b) ctual output of cocoa (from Table 22) multiplied by the change in itsin its FOB price, expressed in USf at the official exchange rate. This price
price change equals column (1) divided by 0.3 times total world exports of cocoa
(from Sill I Duffus, Cocoa Statistics, April 1991).
kc1 Column (1) plus column (2).
(d) Coluen (3) divided by Exports FOB (from Table 2-2).
(e) Difference between actual output and equilibrium output of maize (from Table 22).(f) Difference between actual consumption and equilibrium consumption of maize (from Table 26).(I) Difference between actual output and equilibrius output of rice (fros Table 22) multiplied
by .65 to convert paddy to rice.(h) Difference between actual consueption and equilibriua consumption of rice (from Table 26).(i) Column (5) - coluen (6) times CIF maize (converted to USH using the OER)
plus column (7) - coluen (8) times CIF rice (converted to USS usinq the OER).(j) Coluen (1) divided by Exports FOB (from Table 2-2).(k) The sum of columns (4) and (10).
191

Table 31
Total, Short-Run Effect of Price Interventions on Foreign Exchange Earnings
Effect on Export Crop Revenue Due to: Prop of Total------------------------------------- . Incremntal Incremental Increwntal Incremental Prop of Effect Effect on ForeignChange in Change in Prop of Effect Change in Change in Change in Change in Effect on on Food Crop in Exchange EarningsQuantity World Total on Export Crop Naize Ibize Rice Rice lported Value of Total in Yalue of Total
Exported (a) Prices (bi Change (c) in Value of Tot Prod (e) Cons (fI Prod (gi Cons (hi Food Crops lil Exports (1i Exports (X)(mill USS) Imill USS) (mill USSI Exports (XI (di (000 Mt) 1000 at) (000 at) (000 *tl (mill US$) (ij (kI
Year (1) (2) (3) (4) (5) (6) (7) (9) (9) (10) (11)
1955 NIA N/A N/A N/A N/A N/A N/A N/A NIA N/A NIA1956 NIA N/A N/A N/A -237 N/A -2 N/A NIA N/A N/A1957 N/A N/A NIA N/A -92 N/A 3 N/A N/A N/A N/A1958 -4 5 0 0 -311 11S 3 6 -60 -20 -201959 -2 2 0 0 NIA N/A N/A N/A N/A N/A N/A1960 21 -28 -8 -2 N/A N/A N/A 20 N/A N/A N/A1961 7 -8 -1 0 N/A N/A -4 30 N/A N/A N/A1962 2 -3 -1 0 N/A 109 -5 40 N/A N/A N/A
vo 1963 -46 56 10 3 -180 -44 -4 -4 -7 -2 11964 5 -7 -2 -1 29 87 1 9 -8 -2 -31965 -36 32 -4 -1 -29 21 4 20 -6 -2 -31966 -55 56 1 0 61 -94 0 21 5 2 21967 -23 25 1 0 85 69 -3 13 -2 -1 01968 -4 3 -1 0 24 151 2 27 -22 -7 -71969 -51 57 7 2 -84 111 -2 19 -30 -9 -71970 -66 67 1 0 25 -707 0 7 24 6 61971 -9 9 1 0 288 -15 -1 -4 21 6 71972 63 -57 6 2 82 294 -4 -37 -63 -i6 -i51973 -55 47 -8 -1 -297 -745 13 -17 36 6 51974 -60 55 -5 -1 355 59 12 26 35 5 41975 6 -5 1 0 98 6 -11 -12 13 2 21976 -210 159 -52 -7 150 -319 14 -19 82 11 41977 15 -11 4 0 205 46 19 -19 66 7 9.1978 -171 108 -63 -7 156 140 29 16 12 1 -61979 35 -25 10 1 202 257 13 6 -25 -2 -1
-1980 -102 59 -43 -4 217 19 12 -35 86 8 41981 16 -e 9 1 312 157 15 39 34 5 61982 -190 73 -107 -19 291 33 -2 -5 54 9 -91983 -866 347 -519 -118 155 -426 9 -46 172 39 -79I984 -34 14 -19 -3 551 231 19 -73 121 21 1l1985 N/A N/A N/A NIA N/A N/A N/A N/A N/A N/A N/A

Notes to Tible 31:(a) Difference between actual output and equilibrium output of cocoa
(from Table 23) sultiplied by the FOB price of cocoa (from Table 3-4(3)),
divided by the official exchange rate (from Table 4).(bl ctual output of cocoa (from Table 23) multiplied by the change in its
in its FOI price, expressed in US5 at the official exchange rate. This priceprice change equals column (1) divided by 0.3 tiees total world exports of(from Sill I Duffus, Cocoa Statistics, April 1981).
Ic) Coluen (1) plus column (2).(d) Coluen (3) divided by Exports FOB (from Table 2-2).(el Difference between actual output and equilibrium output of maize (from Table 23).(ft Difference between actual consumption and equilibrium consumption of maize (from Table 27).(g) Difference between actual output and equilibrium output of rice (from Table 231 *ultiplied
by b5 to convert padddy to rice.(h) Difference between actual consumption and equilibrium consueption of rice (from Table 27).(it Coluen (5) - coluen (6) times CIF maize (converted to US$ using the GER)
plus column (7) - column (8) times CIF rice (converted to USS using the OER).(jt Column (9) divided by Exports FOB (from Table 2-2).(k) The sum of columns (4) and (10).
193

Table 32
Total, Log-Run Effect af Price Interventions an Foreign Exchange Earnings
Effect on Export Crop Revenue Due to: Prop of Total--------------------------------- Incrementil Incre,ental Incremental Incremental Prop of Effect Effect on Foreign
Change in Change in Prop of Effect Change in Change in Change in Change in Effect on on Food Crop in Exchange Earningsguantity World Total on Export Crop Maize maize Rice Rice Imported Value of Total in Value of Total
Exported (a) Prices (b) Change (c) in Yalue of Tot Prod (e) Cons (fi Prod (gI Cons (h) Food Crops (i) Exports (Z) Exports (ZI(mill US$1 (mill US$) (mill US1) Exports (ZI (d) (000 St) (000 at) (000 at) (000 at) (gill US$) (il (k)
Year (1) (2) (3) (4) (5) (6) (7) (B) (9) (10) (11)…-- - - - - - - - - - - - - - - - - - - - - - - - - - - - - - - - - - - - - - - - - - - - - - - - - - - - - - - - - - - - - - - - - - -
1955 N/A N/A N/A N/A N/A N/A N/A N/A N/A N/A N/A1956 N/A N/A N/A N/A -237 N/A -2 N/A N/A N/A N/A1957 N/A N/A N/A N/A -126 N/A 2 N/A N/A N/A N/A1958 19 -20 -2 -1 -352 119 4 6 -65 -22 -221959 10 -12 -2 0 N/A N/A N/A N/A N/A N/A NIA1960 27 -37 -10 -3 N/A N/A -30 20 N/A N/A N/A1961 22 -26 -3 -1 N/A N/A -10 30 N/A N/A NIA1962 le -22 -4 -1 -931 109 -B 40 -139 -43 -451963 -30 37 7 2 -290 -44 -6 -4 -12 -4 -2
~* 1964 -14 20 6 2 9 97 0 9 -10 -3 -11965 -43 39 -5 -1 -27 21 4 20 -6 -2 -31966 -102 104 2 1 56 -94 1 21 5 2 21967 -116 122 6 2 90 69 -2 13 -2 -1 219b9 -70 59 -12 -4 36 151 2 27 -20 -7 -111969 -126 143 17 5 -75 III -1 1e -21 -9 -31970 -153 156 3 1 11 -707 0 7 24 6 61971 -131 141 9 3 259 -15 -1 -4 21 6 91972 -19 17 -2 0 123 254 -4 -37 -49 -13 -131973 -175 151 -25 -4 -251 -745 13 -17 39 6 21974 -310 284 -25 -4 346 59 15 26 35 5 11975 -256 229 -27 -3 139 6 -6 -12 20 3 -11976 -659 497 -163 -21 -160 -319 14 -19 93 11 -101977 -520 373 -147 -17 212 46 23 -19 70 9 -91979 -961 609 -353 -40 169 140 33 16 19 2 -371979 -334 240 -94 -9 236 257 20 6 -5 -1 -91990 -297 172 -125 -11 239 19 16 -35 94 9 -31991 -139 72 -66 -9 321 157 19 39 39 6 -41982 -909 327 -482 -79 304 33 0 -5 57 9 -701913 -2011 905 -1206 -274 160 -426 9 -46 174 39 -2351994 -264 113 -151 -27 556 231 21 -73 124 22 -51995 N/A N/A N/A N/A N/A N/A N/A N/A N/A N/A N/A
…-- - - - - - - - - - - - - - - - - - - - - - - - - - - - - - - - - - - - - - - - - - -- - - - - - - - - - - - - - - - - - - - - - - - - - - - - - - - - - - - - - - - - - - -

Notes to Table 32:(a) Difference between actual output and equilibrium output of cocoa
(froo Table 24) eultiplied by the FOB price of cocoa (from Table 3-4(3)),divided by the official exchange rate (from Table 4).
fb) Actual output of cocoa (from Table 24) multiplied by the change in itsin its FOB price, expressed in USS at the official exchange rate. This priceprice change equals column (1) divided by 0.3 times total world exports of cocoa(from Bill & Dulfus, Cocoa Statistics, April 19B1).
(c) Column (1 plus column (2).Cd) Coluen (3) divided by Exports FOB (from Table 2-2).le) Difference between actual output and equilibrium output of maize (frog Table 24).(f) Difference between actual consueption and equilibrium consumption of maize (from Table 27).(g) Difference between actual output and equilibrium output of rice (from Table 24) multiplied
by .65 to convert paddy to rice.(h) Difference between actual consumption and equilibrium consumption of rice (from Table 27).ti) Coluen (5) - column (6) times CIF maize (converted to US$ using the OER)
plus coluen (7) - column (8) times CIF rice (converted to USt using the OER).
1;) Column (9) divided by Exports FOB (from Table 2-2).
(k) The sum of columns (4) and (10).
195

Table 33
Total, Very Long-Run Effect of Price Interventionts on Foreign Exchange Earnings
Effect on Export Crop Revenue Due to: Prop of Total--------------------------------- Incremental Incremental Incremental Incremental Prop of Effect Effect on Foreign
Change in Change in Prop of Effect Change ini Change in Change in Change in Effect on on Food Crap in Exchange Earningsguantity World Total on Export Crop Maize Maize Rice Rice Imported Value of Total in Value of Total
Exported (a) Prices (b) Change (c) in Value of Tot Prod (e) Cons (f) Prod (g) Cons (h) Food Crops (i) Exports (Z) Exports (2)(mill US$1 (mill US$1 (mill USf) Exports (21 (d) (000 at) (000 at) (000 St) (000 at) (mill US$1 (i)(
Year (1) (2) (3) (4) (5) (6) (7) (B) (9) (10) (1
1955 -------- N/A---- ------- --------- N/A---- N---- A- N---- A- N/A---- N/A----- ------- A-- ---- ------1955 N/A N/A N/A N/A -237 N/A -2A N/A N/A N/A N/A1957 N/A N/A N/A N/A -1267 N/A -2 N/A NIA N/A N/A
1959 19 ~ 20 -2 -I -352 119 4 6 -65 -22 -221959 10 -11 -2 0 N/A N/A N/A N/A N/A N/A N/A1960 27 -37 -10 -3 N/A N/A -30 20 N/A NIA N/A1961 22 -26 -3 -1 N/A N/A -10 30 N/A N/A N/A1962 19 -22 -4 -1 -931 109 -9 40 -139 -43 -451963 -30 37 7 2 -290 -44 -6 -4 -12 -4 -2
a' 164 -14 20 6 2 9 87 -.2 9 -10 -3 -11965 -43 39 -5 -1 -27 21 4 20 -6 -2 -31966 -102 104 2 1 56 -94 1 21 5 2 21967 -117 123 6 2 90 *69 -2 13 -2 -1 21969 -72 60 -12 -4 36 151 2 27 -20 -7 -111969 -135 153 19 5 -75 III -1 18 -29 -9 -31970 -170 173 3 1 11 -707 -.4 7 24 6 61971 -164 176 12 4 289 -15 -1 -4 21 6 101972 -46 42 -4 -i 123 294 -4 -37 -49 -13 -141973 -240 206 -34 -6 -251 -745 13 -17 39 6 11974 -437 401 -36 -5 346 59 15 26 35 5 01975 -397 355 -42 -5 138 6 -6 -12 20 3 -31976 -953 718 -235 -30 160 -319 14 -19 93 11 -191977 -1117 800 -317 -36 212 46 23 -19 70 9 -291979 -2617 1657 -960 -108 168 140 33 16 19 2 -1051979 -1345 968 -377 -35 236 257 20 6 -s -1 -361980 -1111 644 -467 -42 239 18 16 -35 94 9 -341991 -715 372 -342 -49 321 157 19 39 39 6 -431992 -4057 1639 -2418 -399 304 33 .1 -5 57 9 -38919B3 -7999 3157 -4732 -1075 160 -426 9 -46 174 39 -10361994 -1157 494 -663 -117 559 231 21 -73 124 22 -951995 N/A N/A N/A N/A N/A N/A N/A N/A N/A N/A N/A

Motes to Table 33:(a) Difference between actual output and equilibrium output of cocoa
(from Table 25) multiplied by the FOB price of cocoa (from Table 3-4(3)),
divided by the official exchange rate (from Table 4).(b) Actual output of cocoa (from Table 25) *ultiplied by the change in its
in its FOB price, expressed in USS at the official exchange rate. This priceprice change equals column (1) divided by 0.3 times total world exports of cocoa(from Bill i Duffus, Cocoa Statistics, April 1981).
(cl Column (1) plus column (2).ld) Column (3) divided by Exports FOB (from Table 2-2).(e) Difference between actual output and equilibrium output of maize (from Table 25).(t) Difference between actual consumption and equilibrium consumption of maize (from Table 27).19) Difference between actual output and equilibrium output of rice (from Table 25) multiplied
by .65 to convert paddy to rice.(h) Difference between actual consumption and equilibrium consumption of rice (from Table 27).lil Column (5) - column (6) times CIF maize (converted to USH using the OER)
plus column (7) - column (8) times CIF rice (converted to US$ using the OER).Ii) Column (9) divided by Exports FOB (from Table 2-2).lk) The sum of columns (4) and (10).
197

That is, both export taxation and overvaluation of the exchange rate tended
to rechce foreign exchange earnings frtm cot:oa.. The reascn for this
apparent ananly is that the equilibrium level olf cocoa output that takes
into account distortions in the exchange rate also assumes that cocoa
exports are being taxed at the optimal rate. When the direct effect of
price interventicons alone is calculated, on the other hand, distortions are
measured with respect to the border price at the official exchange rate in
the absence of any export tax.19
The impact of policy intervention on net foreign exchange earnings
from food crops is also somewhat complicated. The direct effect of import
restrictions, coupled with the overvalued exchange rate, has generally been
to raise domestic prices, increase production ard reduce consumption. This
had tended to save foreign exchange, especially in later years. When the
total effect is considered, hc3wever, the direct ard indirect effects work in
opposite directions, resulting in an impact on foreign exchange earnings
that varies in direction from year to year, thouqh it becomes increasingly
positive tcwards the end of the period, and is on balance relatively smal 1
in magnitude.
This implies that the overall impact of interventions on net
foreign exchange earnings is dominated by food crops when only direct
effects are ccnsidered. It thus tends to be positive in the short rmun but
becomes increasingly negative as the length of rixi increases and the effects
on cocoa productions assume greater importance. The total effects, on the
'-' This is because the notion of optimality implies equating socialmarginal revenue and social marginal cost to detLermine the optimum exporttax rate. Eht this equaticn is only meaningful, in the first-best worldconsidered here, at the equilibrium exchange rate.
198

other hand, are more quickly dominated by cocoa as the supply respmse
lengthens, and the detrimental impact of policy on foreign exchange earnings
becomes more immediately obvious.
199

CHAPTER VIII: GIER%JE T ELDGET PM OTHER FESORE TRASERS
In addition to affecting production, cansumption, and net eamnings
of foreign exchange, price policy interventions have also resulted in
transfers of rescurces and welfare between the grvernmnmt, producers, and
ccnsumers. The next sectimn deals with the budgetary consequences of
agricultural price policies in Ghana. This is followed by an analysis of
the impact of these and other policies on transfers of rescurces between
agriculture and the rest of the ecaomwny.
Effects of Price Policy cn the GEbverrnoent azdcqet
The major effect of price policy in Ghana an the goverTnent
budget is the revenue that is earned an cocoa exports through the operations
of the Coroa Marketing Board. Although data on actual fiscal receipts are
unavailable, there is informatimn on CMB costs, and net revenu.e can be
estimated by subtracting these costs plus income to producers from the FoB
value of marketed cocoa. As discussed earlier-, CMB costs have varied aver
time as the responsibilities of the Board have changed. In addition to
marketing and quality control, these responsibilities have at various times
included research, extension, plantatimn management, and processing. At
other times these functions have been performed by the Ministry of
Agriculture or other public agencies, in which case CMB costs were lower and
revenue to the government was higher than when the CMB was directly
respcnsible for these activities.
Data on taxes and marketing profits for rice and maize imports are
unavailable. The schedule of custcms and excise tariffs published for 1973
lists a 50 percent ad valorum duty an imports of maize and a Nf 0.025/lb
200

specific tax on rice imports. - These taxes do not apply to food aid, nor
is there any sales tax on cereals imports. Actual tax receipts from maize
and rice imports in 1972 are estimated at Ni 1.18 million.2 This is less
than 1 percent of the revenue from cocoa exports. Given the low level of
maize imports and the fact that inflation rapidly decreased the real value
of the import tax on rice, these sources of government revenue appears to
have been of minor importance.
Agricultural inputs are exempt from tariffs. Subsidies exist, as
described earlier, but it is impossible to put together consistent time
series on their total amount. Nb effort has therefore been made to
separate them from other government transfers and expenditures.
As seen in Table 34, government revenue from cocoa has been an
important part of total public resource inflows. Its share of total revenue
has fluctuated, without any clear trend, between -63 percent and +69
percent, but in most years it has been between +20 and +50 percent. This is
a high export tax share by the standards of most African ccuintries. Cocoa
revenue as a proportion of the budget deficit has in many years exceeded 100
percent.
The per unit tax on cocoa, shown in Table 35, has increased in
nominal terms more rapidly than the total tax as a result of the decline in
exports. In 1983, the per unit tax was 129 times its nominal value in 1955,
whereas total tax revenue from cocoa was 98 times its value in 1955.
As a percentage of the FOB price, the per unit tax an cocoa has
fluctuated widely, but there are several movements of importance that
± Republic of Ghana, Customs and Excise Tariff. 1973
2 Data obtained frnm the Ministry of Finance.
201

Table 34
Effect of the Pricing Policy an the Budget(million NC)
Net Revenue as aProportion of (I)
Total (Net) Total BudgetRevenue (a) Budget (b) Deficit (c)
Year (1) (2) (3)
1955 23 22 -2311956 20 20 ;L781957 67 56 -4|461958 70 52 -6991959 57 40 3551960 36 21 731961 24 16 311962 32 20 321963 48 20 1111964 26 9 301965 13 6 311966 47 18 691967 111 37 1091968 143 43 2261969 201 46 6491970 118 26 1611971 146 35 1181972 133 34 851973 230 40 1311974 350 43 1041975 226 26 371976 518 45 521977 446 32 251978 1,784 69 1051979 969 33 561980 -362 -11 -81981 -3,026 -63 -641982 1,496 15 331983 2,249 10 4151984 1,758 5 251985 2,027 N/A N/A
Notes to Table 34:(a) FOB Price of Cocoa (from Table 3-4(3)) minus Rendered
Port Price of Cocoa (from Table 3-3(2)) multipliedby Official Cocoa Marketing Board production estieatesbased on sarketings (from Table 1-23)).
(b) Coluen (1) divided by 6overnment Revenue (from Table 3)in the succeeding year.
lc) Column i1) divided by I-) Budget Surplus (from Table 3)in the succeeding year.
202

Table 35
Tax on Cocoa
Per Unit Tax on Cocoa Total Tax- --------------------- on Cocoa
(NC/at) (a) I FOB (b) (mill NC) (c)Year (1) (2) (3)
1955 101 23 231956 74 19 201957 326 52 671958 273 50 701959 1.79 41 571960 83 24 361961 59 19 241962 78 23 321964 112 31 481963 49 18 261965 32 12 131966 125 32 471967 262 47 1111968 428 56 1431969 480 59 2011970 271 42 1181971 307 45 146I172 312 38 1331973 644 50 2701974 885 52 3501975 544 36 2261976 1528 59 5161977 1538 39 4461978 6237 60 17841979 3000 33 9691980 -1273 -20 -3621981 -12200 -244 -30261982 7558 25 14961983 13000 22 22491984 9299 11 17581985 8967 7 2027
Notes to Table 35:(a) FOB Price of Cocoa from Table 3-4(3) minus
Rendered Port Price of Cocoa fromTable 3-3(2).
(b) Coluen (1) divided by FOB Price of Cocoafrom Table 3-4(3).
(c1 FOB Price of Cocoa from Table 3-4(3) minusRendered Port Price of Cocoa fromTable 3-3(2) multiplied by official CocoaMarketing Board production estimates basedon marketings from Table 1-2(3).
203

should be noted in Table 35. First is the relatively low tax rate from
1960 to 1865, years in which Nkrumah is generally thought to have been
exploiting cocoa farmers. In fact this was a period when world market
prices were low, and the goverrwnent suffered alung with farmers. Following
this, the tax rate rose to a very high level, averaging 49 percent from 1967
to 1978.5 Thereafter, as the exchange rate became increasingly overvalued
lowering the real value of the FUH price for cocoa, the tax rate on cocoa
declined.
Transfers of Rescurces Between (Ariculture and the Rest of the Economy
There are a number of ways in which government policy has
transferred resources to and from Ghanaian agriculture. These include the
direct effects of export taxes and trade and exchange controls on output
prices and quantities, the indirect effects of the overvalued cedi on the
prices and quantities of outputs and inputs, and government recurrent and
investment expenditures.
Estimates of Rescuirce Transfers
The direct and indirect effects of trade and exchange taxes and
ccntrols are calculated in Annex 7. Separate estimates are made of changes
in producer surplus for maize (Tables 7-1(1) and 7-1(2)), rice (Tables
7-2(1) and 7-2(2)), and cocoa (Tables 7-3(1) thrnugh 7-3(3)) for the short,
long, and very long run. Using a simple, partial-equilibrium dema-id and
supply model, transfers to agriculture resulting frtm the direct effects of
distortions are given by
ULhweighted average of yearly rates.
204

(P - P ) Q + 1/2 (P - P ) (Q - Q) ...(a)
where P is the domestic price, P is the border price at the official
exchange rate, 0 is actual productim, and Q is production in the absence
of price and trade distortions at the official exchange rate. Transfers
from agriculture due to the indirect effects of the overvalued exchange
rate, are given by
(P* - P )Q* + 1/2 (P* - p )(Q* - Q*) (9)
where P* is the producer price equivalent of the border price adjusted by
multiplying the border price tby the ratio of the equilibrium exchange rate,
calculated from the simulation model described in Chapter II, to the
official exchange rate, and Q* is equilbrium production from Chapter VII.
For maize and rice, each of these two expressicns is generally
positive, especially when distorticns have been severe, and the direct and
indirect effects of these distortions tend to offset mne another. With
cocoa, an the other hand, the direct effect is in mo>st instances negative,
since the domestic price is generally less than the border price because of
the export tax. As a result, both effects tend to transfer rescuirces away
from the agricultural sector. The only exception to this is years in which
the introductian of an optimal export tax on cocoa offsets the overvaluation
of the exchange rate.
Direct and indirect producer price transfers also exist for
tradable products other than maize, rice, and cocoa. These, however, are
relatively unimportant. Production of the industrial crops - cottan,
rubber, and tobacco - has never equaled more than about 5 percent of that
of cocoa. Most production and processing of oilseeds is artisanal and
results in products that are not traded internaticnally. Domestic prices of
205

these products are influenced by gDvernnent pDlicies with respect to imports
of edible oils and tallow for the manufacture of soap, but the cross-price
elasticities of supply are unknown, and the intricacies of the input-output
relationships and uhbstitution effects involved are such that a detailed
study of this sector would be necessary in order to estimate the effects of
government policy on resource transfers.
Sugar is another industrial product for which price policy could
be important. It is an integrated industry, howdever, and price policy
applies to output of the sugar mills rather than to sugar cane. Without a
detailed study of the mills, therefore, it is impossible to assess the
transfer of resources to or frnom agriculture. This is not a critical
problem, however, since the total value of sugar cane production during
1965-1968 was never more than 4 percent of the value of cocoa production,
and output has subsequently been much lower.<
The rest of agricultural production is made up largely of
nontradable food crops. These are not directly subject to price policy.
They are influenced indirectly via substitution in production and
conssumption, though the supply and demand analysis preseted earlier
suggests that these effects are not very great.
Taxes and subsidies on agricultural inputs are also direct and
indirect. There are no import tariffs or other taxes on fertilizers,
insecticides, and agricultural machinery and equipment. There are explicit
subsidies on these inputs, but import restrictions prevent most producers
from having access to them at subsidized prices. As a result, the prices
4 M.S. Singal and J.D.N. Nartey, Sources and Metheds of Estimation ofNational Income at Current Prices in Ghana, Ghana Central. Bureau ofStatistics, 1971, pp.3-13.
206

for these inputs an the private market are quite high. Data an these
prices are extremely limited, and costructian of a time series is not
possible. In any event, the quantities involved are minimal since most
farmers do not use any of these inputs, and when they do, their value is
mnly a small part of the total cost of production.
Direct subsidies an agricultural inputs are included with other
government expenditures. An indirect subsidy also exists because of the
overvalued exchange rate. This is estimated in Table 7-4, Annex 7, by
multiplying the actual CIF value of imports of agricultural inputs times the
ratio of the equilibrium exchange rate to the official rate. The actual
value of imports is thEn subtracted fram the adjusted value to arrive at the
total value of the implicit subsidy on fertilizers, agricultural chemicals,
and agricultural machinery and equipment.
Gorvernment expenditure transfers are calculated in Table 7-5,
-nnex 7, for both recurrent and investment expenditures. These are derived
from separate budgets that are used to distinguish ongoing activities from
those that are developmental in nature. Included in the investment budget
are some current, in addition to capital, expenditures. Since these
normally are start-up costs, however, they may be cansidered as a form of
investment.
Transfers to agriculture include expenditures en roads and
waterways, in additicn to those en agriculture and non-mineral rescurces.
While not all of these transportatimn expenditures benefit agriculture, many
do, and it is impossible to isolate expenditures more closely associated
with agriculture, such as those en feeder roads. On the other hand, there
may be other government expenditures that are not included but that do
207

benefit agriculture. Examples are rail transport and storage. These are
less directly related to agriculture than roacds, however, and they have
therefore been excluded.
The results of this analysis are shown in Tables 36 through 41.
The first three tables, based an Annex 7, show the direct and total nominal
transfers out of and into agriculture because of distortions affecting
maize, rice, and cocoa in the short, long, and very lng runs. The last
three tables add to these transfers those that are not related to output
price.
Tables 36 thrcugh 38 show the magnitude of the net transfers out
of agriculture due principally to the export tax on, cocoa and the overvalued
exchange rate. Although both direct and total transfers have frequently
been positive for maize and rice because of the influence of trade controls,
these have been dominated in most years by the direct and total transfers
out of the cocoa sector. The major exception to this is the period during
the early 1980s when the extent of overvaluation was so great that it was
difficult for the governnent to extract a positive export tax from the cocoa
sector and the price of maize and rice farmers marketing their crops in
Accra would have been zero, as explained in the previous chapter, if they
had not received any trade proterticn. With the excepticn of these years,
there was always an overall price-related direct transfer out of
agriculture.
Even during these years, the direction of total transfer was out
of agriculture cnce the exchange rate effect is combined with the direct
effect. COn the other hand, there are a few years when total price-related
transfers into agriculture were positive (e.g., 1975 and 1977) . These are
20B

Table 36
Direct and Total Nosinal Short-Run Transfers Due to Output Price InterventionsInto (+) and Out of (-) Agriculture
(lillion NC)
Sum of Transfers asImportables Exportables All Products a Share of GDP (Z)
Maize Rice CocoaDirect Total Direct Total Direct Total Direct Total Direct Total
Year (1) (2) (3) (4) (5) (6) (7) (8) (9) (10)
1959 -16.61 -28.00 -.01 -.52 -73.1 -54.3 -89.8 -82.9 -11.7 -10.81959 N/A N/A N/A N/A -56.8 -54.6 NIA N/A N/A N/A1960 N/A NIA N/A N/A -34.8 -44.6 N/A N/A N/A N/A1961 N/A NIA -.13 -2.03 -24.3 -43.6 N/A N/A N/A N/A1962 NIA NIA -.17 -1.67 -33.1 -40.0 N/A N/A NIA N/A1963 5.63 -.99 1.39 -.21 -55.5 -64.6 -48.5 -65.9 -4.4 -6.01964 -.36 -7.84 1.14 -.66 -27.6 -19.2 -26.9 -27.7 -2.2 -2.21965 10.31 -6.01 1.28 -2.17 -15.0 -92.9 -3.4 -101.0 -.2 -6.91966 13.75 3.81 .96 -1.45 -57.3 -67.7 -42.6 -65.3 -2.9 -4.31967 1.49 -1.29 .74 -.93 -125.8 -50.6 -123.6 -52.8 -8.2 -3.51969 -7.80 -19.04 -.81 -3.03 -157.1 -59.1 -165.7 -81.2 -9.7 -4.81969 .98 -17.48 .69 -2.63 -227.6 -172.1 -225.9 -192.2 -11.3 -9.61970 27.48 20.07 2.01 -.83 -163.7 -76.6 -134.2 -57.4 -5.9 -2.51971 10.17 5.57 2.84 .27 -166.5 -18.7 -153.5 -12.9 -6.1 -.51972 -65.46 -88.50 5.88 4.00 -133.3 16.4 -192.9 -68.1 -6.9 -2.41973 48.03 40.68 3.40 2.07 -283.5 -107.0 -232.1 -64.3 -6.6 -1.81974 5.79 .72 -2.05 -6.76 -401.0 -144.7 -397.2 -150.9 -8.5 -3.21975 16.64 2.29 12.20 4.20 -253.1 2.0 -224.2 8.5 -4.2 .21976 67.42 53.03 28.70 18.43 -670.5 -276.6 -574.4 -205.1 -8.8 -3.11977 112.24 63.72 72.28 23.92 -540.9 -97.4 -356.4 -9.9 -3.2 -.11978 52.77 -24.51 72.97 20.56 -2165.6 -1971.8 -2039.9 -1975.7 -9.7 -9.41979 25.45 -284.52 63.88 3.92 -1020.2 -1643.0 -930.9 -1923.6 -3.3 -6.81980 685.75 264.13 211.23 70.15 397.5 -2264.6 1294.5 -1930.3 3.0 -4.51981 1277.54 744.26 580.11 -381.92 2350.9 -1276.5 4208.5 -914.2 5.8 -1.31982 1136.83 909.48 271.94 -20.91 -2090.0 -3757.5 -681.2 -2869.9 -.1 -.31993 2944.91 2757.94 825.33 443.34 -3396.2 -10397.8 374.1 -7196.5 .2 -3.91984 3364.99 3145.63 1547.71 1089.30 -1920.7 -9567.2 2992.0 -4333.3 1.1 -1.61985 1168.51 N/A 950.61 N/A -2127.1 N/A -7.9 N/A -.002 N/A
Notes to Table 36:Coluens are derived as follows:(1) Transfers to maize from Annex Table 7-1(1).(2) Transfers to maize minus transfers from maize from Annex Table 7-1(1).(3) Transfers to rice from Annex Table 7-2(l).(4) Transfers to rice minus transfers from rice from Annex Table 7-2(l).(5) Minus Direct Transfers from cocoa from Table 7-3t1).(6) Minus (Direct Transfers from cocoa plus Indirect Transfers from cocoa) from Annex Table 7-3(l).(7) Sue of coluens (1), (3), and (5).(8) Sue of coluens (2), (4), and (6).(9) Column (7) divided by Nominal 6DP from Table 3.(10) Column (8) divided by Nominal GDP from Table 3.
209

Table 37
Direct and Total Noeinal Long-Run Transfers Due to Output Price InterventionsInto (+1 and Out of (-) Agriculture
(million NC)
Sue of Transfers asIeportables Exportables All Products a Share of GDP (Z)
maize Rice CocoaDirect Total Direct Total Direct Total Direct Total Direct Total
Year (1) (2) (3) (4) (5) (6) (7) (8) (9) (10)
1958 -17.40 -29.64 -.01 -.49 -73.1 -55.2 -90.5 -85.4 -11.8 -11.11959 N/A N/A N/A NIA -60.5 -56.4 NIA N/A N/A N/A1960 N/A N/A -.23 -3.49 -36.3 -46.3 N/A N/A N/A N/A1961 N/A N/A -.14 - -2.46 -21.6 -43.3 N/A N/A N/A N/A1962 -14.29 -64.75 -.18 -1.78 -33.5 -40.2 -48.0 -106.7 -4.9 -10.81963 6.28 -2.09 1.38 -. 28 -57.1 -66.2 -49.4 -68.6 -4.5 -6.21964 -.36 -8.72 1.13 -. 72 -31.0 -21.1 -30.2 -30.6 -2.4 -2.51965 9.91 -5.74 1.23 -2.07 -16.8 -104.8 -5.6 -112.6 -.4 -7.71966 13.60 3.71 .92 -1.30 -69.6 -82.9 -55.1 -80.5 -3.6 -5.31967 1.43 -1.16 .69 -. 87 -165.9 -57.1 -163.7 -59.1 -10.9 -3.91968 -7.27 -17.33 -.76 -2.85 -206.6 -66.2 -214.6 -86.3 -12.6 -5.11969 .92 -16.42 .64 -2.42 -296.3 -219.9 -294.7 -238.8 -14.7 -11.91970 27.08 19.63 1.93 -.80 -219.6 -95.1 -190.6 -76.3 -8.4 -3.41971 10.06 5.58 2.73 .25 -238.6 -2.8 -225.8 3.0 -9.0 .11972 -61.16 -80.48 5.59 3.79 -182.9 51.2 -238.4 -25.5 -8.5 -.91973 44.07 37.39 3.22 1.97 -363.7 -119.7 -316.4 -80.3 -9.0 -2.31974 5.79 .52 -1.90 -5.98 -558.2 -159.9 -554.3 -165.3 -11.9 -3.51975 15.54 3.77 11.23 4.22 -352.5 57.5 -325.7 65.5 -6.2 1.21976 65.44 52.39 27.92 17.83 -946.7 -325.2 -853.3 -255.0 -13.1 -3.91977 110.23 68.04 68.34 25.83 -841.1 -50.7 -662.5 43.2 -5.9 .41978 51.69 -9.27 71.55 24.90 -3454.4 -3118.3 -3331.1 -3102.6 -15.9 -14.81979 24.54 -217.81 60.38 11.74 -1593.6 -2675.3 -1508.7 -2881.4 -5.3 -10.21980 648.60 305.81 191.35 76.58 571.3 -3516.0 1411.2 -3133.6 3.3 -7.31981 1251.19 807.10 475.90 -247.73 2975.6 -2455.9 4702.7 -1896.5 6.5 -2.61982 . 1135.16 961.76 266.67 .65 -2146.1 -4022.8 -744.3 -3060.3 -.1 -.41983 2936.40 2800.34 793.08 432.82 -4721.5 -15023.3 -992.0 -11790.1 -.5 -6.41984 3361.34 3211.44 1475.81 1087.86 -3221.1 -15731.9 1616.1 -11432.6 .6 -4.21985 1151.00 N/A 901.99 N/A -3236.1 N/A -1183.1 N/A -.3 N/A
--- --- --- --- -- --- --- --- --- -- --- --- --- --- -- --- --- --- _--- -_--- --- -- --- --- --- --- -- --- --- --- --
Notes to Table 37:Columns are derived as follows:(1) Transfers to maize from Annex Table 7-1(2).(2) Transfers to maize minus transfers from maize from Annex Table 7-1(2).(3) Transfers to rice from Annex Table 7-2(2).(4) Transfers to rice minus transfers from rice from Annex Table 7-2(2).(5) Minus Direct Transfers from cocoa from Table 7-3(2).(6) Minus (Direct Transfers from cocoa plus Indirect Transfers from cocoa) from Annex Table 7-3(2).(7) Sum of columns (1), (3), and (5).(8) Sum of columns (2), (4), and (6).(9) Column (7) divided by Nominal GDP from Table 3.(10) Column (8) divided by Nominal GDP from Table 3.
210

Table 38
Direct and Total Nominal Very Long-Run Transfers Due to Output Price InterventionsInto (t) and Out of 1-) Agriculture
(sillion NC)
Sum of Transfers aslmportables Exportables All Products a Share of GDP MU
"aize Rice CocoaDirect Total Direct Total Direct Total Direct Total Direct Total
Year (1) (2) (3) (4) (5) (6) (7) (8) (9) (10)
1958 -17.40 -29.64 -.01 -.49 -73.1 -55.2 -90.5 -85.4 -11.9 -11.11959 N/A N/A N/A N/A -60.6 -56.4 N/A N/A N/A N/A1960 N/A N/A -.23 -3.49 -36.3 -46.3 N/A N/A N/A N/A1961 N/A N/A -.14 -2.46 -24.6 -43.3 N/A N/A N/A N/A1962 -14.29 -64.75 -.18 -1.78 -33.5 -40.2 -49.0 -106.7 -4.9 -10.91963 6.28 -2.09 1.38 -.28 -57.1 -66.2 -49.4 -68.6 -4.5 -6.21964 -.36 -8.72 1.13 -.72 -31.0 -21.1 -30.2 -30.6 -2.4 -2.51965 9.91 -5.74 1.23 -2.07 -16.8 -104.9 -5.6 -112.7 -.4 -7.71966 13.60 3.71 .92 -1.30 -69.6 -93.0 -55.1 -90.5 -3.6 -5.31967 1.43 -1.16 .69 -.87 -166.1 -57.1 -164.0 -59.1 -10.9 -3.91968 -7.27 -17.33 -.76 -2.85 -207.6 -66.1 -215.7 -86.3 -12.7 -5.11969 .92 -16.42 .64 -2.42 -299.4 -221.7 -297.9 -240.5 -14.9 -12.01970 27.09 19.63 1.93 -.80 -223.9 -95.3 -194.9 -76.4 -9.6 -3.41971 10.06 5.58 2.73 .25 -246.7 2.8 -234.0 8.7 -9.4 .31972 -61.16 -80.48 5.59 3.79 -192.3 60.9 -247.9 -15.7 -8.8 -.61973 44.07 37.39 3.22 1.97 -393.6 -121.1 -346.3 -81.7 -9.9 -2.31974 5.79 .52 -1.90 -5.98 -623.2 -161.7 -619.3 -167.1 -13.3 -3.61975 15.54 3.77 11.23 4.22 -409.0 87.4 -381.3 95.4 -7.2 1.01976 65.44 52.39 27.92 17.93 -1159.9 -372.3 -1066.6 -302.1 -16.3 -4.61977 110.23 69.04 68.34 25.83 -1087.5 16.7 -909.0 110.6 -8.1 1.01978 51.69 -9.27 71.55 24.90 -4719.1 -4208.9 -4595.9 -4193.3 -21.9 -20.01979 24.54 -217.81 60.38 11.74 -2249.9 -4022.2 -2165.0 -4228.3 -7.7 -15.01980 648.60 305.81 191.35 76.58 841.0 -6345.2 1680.9 -5962.8 3.9 -13.91981 1251.19 807.10 475.90 -247.73 4127.3 -6178.3 5854.4 -5618.9 8.1 -7.71982 1135.16 961.76 266.67 .65 -3371.4 -7054.1 -1969.5 -6091.7 -.2 -.71983 2936.40 2800.34 793.09 432.92 -8184.0 -29137.7 -4454.5 -25904.6 -2.4 -14.11984 3361.34 3211.44 1475.81 1097.86 -5673.7 -32279.9 -836.5 -27980.5 -.31 -10.31985 1151.00 N/A 901.99 N/A -5743.3 N/A -3690.3 N/A -1.0 NIA
Notes to Table 38:Columns are derived as followut(1) Transfers to maize from Annex Table 7-1(2).(2) Transfers to saize minus transfers from maize from Annex Table 7-1(2).(3) Transfers to rice from Annex Table 7-2(2).(4) Transfers to rice minus transfers from rice from Annex Table 7-2(2).(5) Minus Direct Transfers from cocoa from Table 7-313).(6) Minus (Direct Transfers from cocoa plus Indirect Transfers from cocoa) from Annex Table 7-3(3).(7) Sum of columns (1), (3), and (5).(8) Sum of columns (2), (4), and (6).(9) Column (7) divided by Nominal GDP from Table 3.(10) Column (9) divided by Nosinal 6DP from Table 3.
2 11

table 39
Short-Run Transfers Into (+1/ Out of (-1 Agriculturt(Sillion NC)
Total of Price-RelatedTotal of Price-Related and Non-Price Transfers
Non-price Transfers Price-Related Transfers and Non-Price Transfers as a Share of GOP (11._- - - -- - - -__ -- - - -- - - -- - - - - -- -__ -- - - -- - - - -- - - -- - - -------------------_--- -__-_ __-__ _ ____ -_- _
Public Roads and Indirect InputInvestwnt Waterways Agriculture Subsidies Subtotal Direct Total Direct Total Direct Total
tear (1I (21 (31 (49 (51 (60 (7) (a) (9t (10) (fil
1955 N/A N/A N/A NIA N/A N/A N/A N/A N/A N/A NIA195 N/A N/A N/A N/A N/A N/A N/A N/A N/A N/A N/A1957 N/A N/A N/A N/A N/A N/A N/A N/A N/A N/A N/A1958 6.4 9.4 14.0 .59 29.4 -89.9 -92.8 -60.4 -53.4 -7.9 -7.0195 9.9 8.4 13.5 1.94 33.6 N/A N/A N/A N/A N/A N/A1960 10.7 9.2 14.0 3.73 36.6 N/1A N/A NIA N/A N/A N/A1961 8.9 9.1 23.3 3.32 44.6 N/A NVA N/A N/A N/A N/A1962 7.5 9.0 17.4 1.94 34.9 N/A N/A N/A N/A N/A N/A1963 13.2 12.0 14.8 5.79 45.8 -49.5 -65.8 -2.7 -20.0 -.2 -1.31964 20.1 9.2 15.3 3.26 46.9 -26.9 -27.7 20.0 19.2 1.6 1.61965 24.9 6.8 20.4 13.14 65.2 -3.4 -101.0 61.9 -35.8 4.2 -2.41966 10.4 4.3 19.8 4.19 39.2 -42.6 -65.3 -3.4 -26.1 -.2 -1.71967 11.8 2.4 19.3 1.45 34.9 -123.6 -52.9 -99.6 -17.9 -5.9 -1.21969 17.9 3.8 19.7 1.05 42.5 -165.7 -91.2 -123.2 -38.7 -7.2 -2.31969 22.2 5.5 23.4 3.20 54.3 -225.9 -192.2 -171.6 -137.9 -9.6 -6.91970 30.6 5.3 25.1 3.47 64.5 -134.2 -57.4 -69.7 7.1 -3.1 .3
H 1971 32.4 4.9 25.3 3.79 66.3 -153.5 -12.9 -97.2 53.4 -3.5 2.11972 27.7 6.2 31.5 2.02 67.4 -192.9 -69.1 -125.5 -. 7 -4.5 .01973 25.7 15.9 29.1 2.15 72.9 -232.1 -64.3 -159.3 8.6 -4.5 .21974 59.2 28.7 53.9 4.62 146.3 -397.2 -150.8 -250.9 - 4.4 -5.4 -.11975 111.4 36.8 70.1 10.07 228.4 -224.2 8S.5 4.1 236.8 .1 4.51976 196.6 19.5 125.7 16.91 359.6 -574.4 -205.1 -215.9 153.5 -3.3 2.41977 233.3 42.0 343.6 84.67 703.6 -356.4 -9.9 347.2 693.9 3.1 6.21978 256.0 78.5 342.9 101.30 779.7 -2039.9 -1975.7 -1261.2 -1197.0 -6.0 -5.71979 190.5 91.4 1497.0 1130.69 807.6 -930.9 -1923.6. -43.3 -1036.0 -. 2 -3.71990 464.3 135.8 721.4 254.92 1576.4 1294.5 -1930.3 2870.9 -353.9 6.7 -.81931 375.5 131.6 903.1 926.11 2236.3 4209.5 -914.2 6444.9 1322.1 9.9 1.81992 396.2 123.4 927.6 628.48 1975.7 -691.2 -2969.9 1294.5 -993.2 1.5 -1.01993 86.9 177.8 1399.6 N/A N/A 374.1 -7196.5 N/A N/A N/A N/A1994 1851.7 423.3 936.3 N/A N/A 2 .0 -4333.3 N/A N/A N/A N/A1995 N/A N/A N/A N/A N/A -7.9 N/A N/A N/A N/A N/A
IYh3 --. 12. ----- 5.7 -4-------------------- 8 -- 4B.5- -- 65.8--------------- -2. -2. -. --- 1.8---
Notes to Table 39:Colums are derive as follows:(1) AneNx table 7-5, column 6.(29 From Annex Table 7-5.(3) From Annex Table 7-5.(49 Indirect Input Subsidie-s from Annex Table 7-4.(5) Sum of column (19 through (41.(69 Fro Table 36.979 From Table 36.18) Suo of column (51 and (6).(9) Sum of, columns a5 nd (19.(101 Column (9) divided by 4ominal SOP from Table 3.(119 Column (99 divided by Nominal 6DP from Table- 3.

Table 40
Long-Ran Transfers Into (41/ Out o1 - Aqricltureloillion ICI
Total of Price-RelatedTotal of Price-Related and Non-Price Transfers
Non-price Transfers Price-Related Transfers and Non-Price Transfers as a Share of DP (121.
Public Roads and Indirect InputInvestnent Waterways Agriculture Subsidies Subtotal Direct Total Direct Total Direct Total
Year (1 (21 131 (44 (5) (61 (7) (I8 (9) (101 (11)
1955 N/A N/A N/A N/A N/A N/A N/A N/A N/A N/A N/AIV56 N/A N/A N/A N/A N/A N/A N/A N/A N/A NIA NIA1957 N/A N/A N/A N/A N/A N/A N/A N/A N/A N/A N/A1959 6.4 8.4 14.0 .59 29.4 -90.5 -85.4 -61.1 -56.0 -9.0 -7.31959 9.9 8.4 13.5 1.94 33.6 N/A N/A N/A N/A N/A N/A1960 10.7 B.2 14.0 3.73 36.6 N/A N/A N/A N/A N/A N/A1961 8.9 9.1 23.3 3.32 44.6 NIA N/l N/A N/A NiA N/A1962 7.5 8.0 17.4 1.94 34.8 -49.0 -106.7 -13.1 -71.9 -1.3 -7.31963 13.2 12.0 14.8 5.79 45.8 -49.4 -6S.6 -3.6 -22.8 -.3 -2.11964 20.1 0.2 15.3 3.26 46.9 -30.2 -30.6 16.7 16.3 1.3 1.31965 24.9 6.9 20.4 13.14 65.2 -5.6 -112.6 59.6 -47.4 4.1 -3.216 10.4 4.8 19.8 4.19 39.2 -55.1 -90.5 -15.9 -41.3 -1.0 -2.71967 11.8 2.4 19.3 1.45 34.9 -163.7 -59.1 -128.9 -24.2 -9.6 -1.69I68 17.9 3.9 19.7 1.05 42.5 -214.6 -86.3 -172.2 -43.9 -10.1 -2.6S1969 22.2 5.5 23.4 3.20 54.3 -294.7 -238.8 -240.4 -184.5 -12.0 -9.2
1970 30.6 5.3 25.1 3.47 64.5 -190.6 -76.3 -126.1 -11.9 -5.6 -.51971 32.4 4.9 25.3 3.79 66.3 -225.8 3.0 -159.5 69.3 -6.4 2.91972 27.7 6.2 31.5 2.02 67.4 -238.4 -25.5 -171.0 42.0 -6.1 1.51973 25.7 15.9 29.1 2.15 72.9 -316.4 -80.3 -243.5 -7.5 -7.0 -.21974 59.2 28.7 53.0 4.62 146.3 -554.3 -165.3 -401.0 -19.0 -8.8 -.41975 111.4 36.8 70.1 10.07 229.4 -325.7 65.5 -97.4 293.9 -1.8 5.61976 196.6 19.5 125.7 16.81 358.6 -853.3 -255.0 -494.7 103.7 -7.6 1.61977 233.3 42.0 343.6 84.67 703.6 -662.5 43.2 41.0 746.7 .4 6.71979 256.0 79.5 342.9 101.30 778.7 -3331.1 -3102.6 -2552.4 -2323.9 -12.2 -11.11979 188.5 91.4 497.0 130.69 887.6 -1508.7 -2981.4 -621.1 -1993.8 -2.2 -7.11980 44.3 135.8 721.4 254.92 1576.4 1411.2 -3133.6 2987.7 -1557.2 7.0 -3.61981 375.5 131.6 803.1 926.11 2236.3 4702.7 -1896.5 6939.0 339.8 9.6 .51992 396.2 123.4 827.6 628.48 1975.7 -744.3 -3060.3 1231.4 -1084.7 1.4 -1.31993 986.9 177.8 1389.6 N/A N/A -992.0 -11790.1 N/A N/A N/A N/A1984 1851.7 423.3 936.3 N/A N/A 1616.1 -11432.6 N/A N/A N/A N/A1985 N/A N/A N/A N/A N/A -1193.1 N/A N/A N/A N/A N/A
Notes to Table 40:Columns are derived as follows:(1) Annet Table 7-5, coluan 6.(2) Fro Annex Table 7-5.(31 From Annex Table 7-5.(41 Indirect Input Subsidies fra Annex Table 7-4.(51 Sum of columns 11( through (41.(6) Fro Table 37.(7) Froe Table 37.(8) Sue of columns (5) and (61.(9) Son of colvmns (5) and (7).(101 Coluan (9) divided by Noinal WP froe Table 3.(111 Column (9t divided by Nominal SP from Table 3.

Table 41- -- -- - -- - - - - - -- -- -- -- -- -- -- --- - -- -- - -- - -- -- -- -- -
Very Lng-Run Transfers Into 14)/ ht of (-3 Agricultureluillion ICI
Total of Price-RelatedTotal of Price-Related and Nln-Price transfers
Non-price Transfers Price-Related Transfers and Non-Price Transfers as a Share of SP (ZI.
Public Roads and Indirect InputInvestwnt WItervays Agriculture Subsidies Subtotal Direct Total Direct Total Direct Total
Year (13 (23 (3) (43 (51 (61 (7) (89 (93 (103 (11I
155 N/A N/A N/A N/A N/A N/A N/A N/A N/A NIA N/A1956 N/A N/A N/A N/A N/A N/A N/A N/A N/A N/A N/A1957 N/A N/A N/A W/A N/A N/A N/A N/A N/A N/A N/A1951 6.4 9.4 14.0 .59 29.4 -90.5 -85.4 -61.1 -56.0 -8.0 -7.31959 9.9 0.4 13.5 1.94 33.6 NI/A N/A N/A N/A N/A N/A1960 10.7 8.2 14.0 3.73 36.6 N/A N/A N/A N/A N/A N/A191 9.9 9.1 23.3 3.32 44.6 N/A N/A N/A N/A N/A N/A1962 7.5 9.0 17.4 1.94 34.9 -48.0 -106.7 -13.1 -71.9 -1.3 -7.31963 13.2 12.0 14.9 5.79 45.8 -49.4 -69.6 -3.6 -22.8 -. 3 -2.1I164 20.1 8.2 15.3 3.26 46.9 -30.2 -30.6 16.7 16.3 1.3 1.31965 24.9 6.8 20.4 13.14 65.2 -5.6 -112.7 59.6 -47.4 4.1 -3.21966 10.4 4.8 19.9 4.19 39.2 -55.1 -80.5 -15.9 -41.4 -1.0 -2.7197 11.9 2.4 19.3 1.45 34.9 -164.0 -59.1 -129.1 -24.2 -8.6 -1.6
196I 17.9 3.9 19.7 1.05 42.5 -215.7 -96.3 -173.2 -43.9 -10.2 -2.61969 22.2 5.5 23.4 3.20 54.3 -297.8 -240.5 -243.5 -106.2 -12.2 -9.31970 30.6 5.3 25.1 3.47 64.5 -194.9 -76.4 -130.3 -12.0 -5.8 -.51971 32.4 4.9 25.3 3.79 66.3 -234.0 9.7 -167.7 75.0 -6.7 3.01972 27.7 6.2 31.5 2.02 67.4 -247.9 -15.7 -100.4 51.7 -6.4 1.81973 25.7 15.9 29.1 2.15 72.9 -346.3 -91.7 -273.5 -8.9 -7.8 -. 31974 59.2 29.7 53.9 4.62 146.3 -619.3 -167.1 -473.0 -20.8 -10.2 -.41975 111.4 36.9 70.1 10.07 229.4 -381.3 95.4 -152.9 323.7 -2.9 6.11976 196.6 19.5 125.7 16.81 358.6 -1066.6 -302.1 -709.0 56.5 -10.3 .91977 233.3 42.0 343.6 84.67 703.6 -909.0 110.6 -205.4 914.1 -1.9 7.31979 256.0 79.5 342.9 101.30 770.7 -4595.9 -4193.3 -3817.2 -3414.6 -10.2 -16.31979 199.5 81.4 487.0 130.69 897.6 -2165.0 -4228.3 -1277.4 -3340.7 -4.5 -11.i
IS90 464.3 135.8 721.4 254.92 1576.4 I19O.9 -5962.0 3257.3 -4336.4 7.6 -10.2199 375.5 131.6 903.1 926.11 2236.3 5854.4 -5619.9 09S0.7 -3362.6 11.1 -4.71992 396.2 123.4 827.6 628.48 1975.7 -1969.5 -6091.7 6.1 -4116.0 .0 -4.8193 896.0 177.0 139.6 NI/A N/A -4454.5 -25904.6 N/A N/A N/A N/A
1994 1951.7 423.3 936.3 N/A N/A -936.5 -27990.5 N/A N/A N/A N/A(995 N/A N/A NIA N/A N/A -3690.3 N/A N/A N/A N/A N/A
Notes to Table 41:Coluns are derived as follons:(11 Annen Table 7-5, coluen 6.(2) From Annex Table 7-5.(31 Fre Annex Table 7-5.141 lireKt Input Subsidie from Annex Table 7-4.(51 So of coluns (13 through (511(6 Free Table 38.(71 From Table 36.(83 So of coluns (53 and (63.(9) So of colans 151 and (71.(103 ColI (8n divided by Nominal 6DP from Table 3.(111 Colmn (9I divided by Nominal GDP fro Table 3.

years in which the optimumn domestic price for coCOa at the borTder measured
at the equilibrium exchange rate was substantially less than the FEB price
measured at the official rate.. On the whole, however, net price-related
transfers have been away from agriculture, and the magnitude of these
transfers became very substantial after 1977, especially when a very-long-
run autput response is assumed.
As a percentage of GDP, the magnitude of net transfers out of
agriculture due to output price interventions has varied markedly from year
to year. In 1958 the transfer was quite large since domestic prices were
well below world market prices for both maize and cocoa. Thereafter the
share of total price-related short-run transfers decreased from 11 percent
in 1956 to an average of 5 percent during the final four years of the
Nkrumah regime. From 1967 to 1977, total price-related short-rumn transfers
out of agriculture averaged less than 3 percent of GDP. They increased to
9.4 percent in 197E and then dropped steadily to 0.3 percent in 1962 as
government taxation of the cocoa sector eroded in the face of a highly
overvalued exchange rate and accelerating inflation.
Moving to the Icng and the very Icng run, the same trends are
evident but in much more exaggerated form because the higher response of
output to price distortions increases the magnitude of the transfers
involved. In the very long run, for example, agricultural losses associated
with price interventions frequently exceeded 10 percent of GDP, especially
after 1977. This is especially important for cocoa because of the long
gestation periods involved. It also implies that, even under the reforms
5 See Phnex Table 7-3(1).
215

of the Rawlings regime, it will be years before the effects of past policies
are fully overcome.
Price-related transfers are combined with nm-price transfers in
Tables 39-41. The latter include public investment in agriculture and
recurrent government expenditures an roads, waterways, and agriculture,
inclusive of direct input subsidies, as well as the indirect subsidy on
inputs that results from the overvalued exchange rate. In most years net
transfers were aut of agriculture and tended to increase as the supply
response period lengthened. Exceptions to this occurred in 1964 and 1965,
when public expenditures were relatively large and incawe from cocoa was
reduced because of low world prices. Again during the period 1970-79,
total price related transfers were sometimes positive for reasons explained
earlier, and even when they were negative, their magnitude was fairly low in
relation to government expenditures. In 1990 total transfers were positive
in the short and long run, largely because the cocoa price to producers was
subsidized in that year. Thereafter, though data on indirect subsidies are
incomplete, total transfers were negative and very substantial.
The fact that government expenditures and the indirect input
subsidy have at times offset price related transfers does not necessarily
imply that agriculture was better off. In many cases, investments in
agriculture were relatively unproductive, and recurrent expenditures were
related more to public sector employment than to benefitting the farmer.
This was especially true during the twD periods mentioned above, which were
each characterized by the government s strong orientation towards direct
intervention in agriculture rather than the use of price policy to induce
increased production.
216

Government Investment and Expenditure Bias
In order to estimate the degree of bias that has existed towards
agriculture with respect to government investment and total expenditures, it
is useful to campare the share of agriculture in each of these with its
share in GDP. This GOP share may be estimated for either the distorted or
the undistorted situatimns. Here we are interested in the share that would
have prevailed if prices had been undistorted by trade policy and exchange
controls.
The value of agricultural GEP in the undistorted situation is
estimated for the very long run in Table 7-6. Aijustments are made in this
table for changes in prices and quantities produced of maize, rice, and
cocoa. The price changes include both the direct effects of trade policy
and the indirect effects of exchange rate adjustments. (iiantity changes are
those estimated earlier using equaticns (2)-(4).
Government Investment Bias (GIB), or the share of agriculture in
government investment expenditures divided by its share in GDP, is shown in
Table 42. It is clear from this table that public investment has bee
strogly biased away from agriculture. In many years the ratio was less
than 0.4, especially during the Nkrumah regime. During the period from 1968
to 1972, it averaged in excess of 0.55, but then slipped scoewhat until
1981-84, when the average was 0.75. The Government Expenditure Bias (GEB)
has been even more unfavorable for agriculture, with the ratio in most years
less than 0.3. Since 1977 it has been only slightly in excess of 0.2.
217

Table 42
Government Investment (6IB) and Total Expenditure (GEB) Bias
Ni6DP /GDP (a) 61 /61 lb) BE /BE Id)A A 61B (c) A 6EB (e)
Year (1) (21 (3) (4) (5)
1958 .62.3 .194 .311 .232 .3731959 N/A .178 N/A .203 N/A1960 N/A .130 N/A .146 N/A1961 N/A .098 N/A .177 N/A1962 .557 .074 .133 .133 .2381963 .440 .126 .286 .150 .3411964 .384 .157 .409 .132 .3441965 .495 .175 .354 .144 .2901966 .510 .160 .314 .130 .2551967 .477 .171 .359 .107 .2241968 .490 .267 .546 .113 .2301969 .610 .264 .433 .116 .1901970 .539 .283 .526 .130 .2411971 .471 .312 .661 .124 .2631972 .485 .289 .595 .122 .2521973 .550 .152 .276 .092 .1681974 .584 .207 .355 .125 .2141975 .503 .253 .502 .146 .2901976 .613 .309 .503 .171 .2791977 .593 .336 .566 .202 .3411978 .830 .337 .406 .181 .2181979 .786 .317 .403 .159 .2021980 .723 .334 .462 .166 .2301981 .642 .405 .631 .137 .2141982 .692 .485 .701 .152 .2201983 .740 .655 .885 .166 .2251984 .604 .464 .768 .120 .1991985 N/A N/A N/A N/A N/A
Notes to Table 42:(a) Non-intervention Agricultural GDP from Annex 7, Table 7-6 divided by
nominal GDP from Table 3.(bl Total Investment Boverneent Expenditure Transfers to Agriculture from
Annex 7, Table 7-5 divided by overall Investment Expenditures fromAnnex 7, Table 7-7.
(ci Column (2) divided by column (1).(d) Total Recurrent plus Total Investment Government Expenditure Transfer
to Agriculture from Annex 7, Table 7-5, divided by Total GovernmentExpenditures from Annex 7, Table 7-7.
(e1 Column (4) divided by column (1).
218

CFPPTER IX: OTH0ER PRICE INTERMENTION EFFECTS
There are a number of other effects of agricultural price
interventica s. Two of these are examined in this chapter. The first is the
impact on the inclme of different types of farmers. It w.uld also be
desirable to measure the effects of price policy mn other interest groups,
biut the data do not permit this, and these effects would be swamped by the
muich larger changes in real income that all groups have experienced and that
are only partially related to agricultural prices.1 The second effect of
price interventions analyzed here is related to the variability of prices
due to changes in domestic demand and supply and to price fluctuations on
the world market.
Farm Income Effects
The effects of price policy mn farm income were estimated for
three different types of farms. The first consists of large-scale cocoa
farmers, who in 1970 harvested approximately 200 headloads of cocoa
weighting 60 posunds each.2 This quantity was adjusted for other years by
multiplying it times the ratio of total natimnal production in that year to
total producrtion in 1970. The land-owner generally retains twoi-thirds of
the revenue received. He is usually absntee and received income from other
A According to a 1974-75 hausehDld budget survey, for example, riceand wheat accounted for mnly 3.2 percent of total household expenditures inurban areas. Ghana Central Bureau of Statistics, SLumnary Reiport inHbusehold Economics Survey. 1974-1975, Accra: July 1979.
2 C. Okali, M. Owusuansha, and B.E. Rourke, "The Development Patternof Large Cocoa HDidings in Ghana: Scme Case Studies," in R.A. Kotey, C.Okali, and B.E. Rourke, Eds., Economics of Cocoa Production and Marketina,Institute of Statistical, Social and Economic Research, Uhiversity of Ghana,1974.
219

sources, but there are no data on the amnuLnts involved. Nbminal income is
therefore estimated by multiplying twe-thirds of total cocoa production per
farm by the relevant producer price. This is converted to real income by
dividing by a weighted average of the overall c1nsumer price index and the
prices of rice and maize. The weights pertain to urban consumption patterns
obtained from the results of a survey canducted during the mid 1970s.3
A similar analysis was unidertaken for large-scale rice farmers
cultivating an average of 119.3 acres, each acre yielding 7.1 bags of 160
pounds per.' The base year in this case is 1973. Production was adjusted
for the costs of labor and other inputs used in cultivation. The same
expenditure coefficients were used as for cocoa farmers, and no adjustment
was possible for off-farm income because of lack of data.
The third type of farmer grwas maize and is assumed to cultivate
10 acres, with yields of 1300 poLinds per acre.5 Data are not available by
farm type on the mix of crops groAwn so no adjustment is possible for other
sources of income. Expenditure weights pertaining to rural csansumption
weights were obtained from the same scurce as for the other farmers.
The results of this analysis are contained in Tables 43-50 for
direct and total interventions in the instantaneous, short, long, and very
long runs. The instantanecous run assumes no ou-tput response, whereas the
other runs are calculated under the set of assuffptions used in Chapter VII.
Ghana, Central Bireau of Statistics, Summarv Report..., 1979.
Fred Everett Winch III, Costs and Returns of Alternative RiceProduction Systems in Nbrthern Ghana: Implications for Oitput. Employmnentand Income Distribution, Ph.D., Dissertation, Michigan State University,1976.
Ghana, Ministry of Agriculture, Economics and Marketing Division,Report on Ghana Sample Census of Agriculture 1970, Accra: March 1972.
220

Table 43
Real Instantaneous Income Effect of Direct Intervention (a)(NC)
Large Scale Large Scale Small ScaleYear Cocoa Farmers Rice Farners Maize Farmers
1953 N/A N/A N/A1954 -.519 N/A N/A1955 -.242 -.055 -.6691956 -.203 .076 -.5441957 -.541 .008 -.7811958 -.529 .001 -. 5591959 -. 440 N/A N/A1960 -. 262 -. 087 N/A1961 -. 203 -.088 N/A1962 -. 258 -. 139 -.4441963 -. 362 1.007 1.1131964 -.212 1.041 -.0471965 -. 155 1.252 1.9131966 -. 364 1.062 2.4691967 -. 508 .388 .2971968 -.598 -.238 -.3541969 -.622 .139 .0281970 -. 513 .643 3.9181971 -.515 1.110 .7311972 -.460 1.485 -.6281973 -.597 .513 2.3721974 -.642 -.129 .1601975 -.486 1.371 .5411976 -.683 3.583 3.4231977 -.546 -12.223 3.0541978 -. 704 -6.217 1.1421979 -.433 -3.923 .1091980 .433 -7.063 9.2071981 -59.837 -2.840 -18.8331982 -.401 -4.186 -7.2761983 -.417 -4.594 -14.0071994 -.251 -17.592 2.5791985 -. 144 -38.663 .871
Notes to Table 43:(a) Real Actual Income minus Real Equilibrium Instantaneous Income
divided by Real Instantaneous Equilibrium Income (from AnnexTable 8-1(1) for Cocoa, Table 8-2(1) for Rice, and Table 8-3(1)for Maize).
221

Table 44
Real Short-Run Income Effect of Direct Intervention (a)(NC)
Large Scale Large Scale Seall ScaleYear Cocoa Farners Rice Farmers Maize Farsers
1953 N/- N/A NIA1954 N/A N/A N/A1955 -. 242 N/A N/A1956 -.215 .076 -.5441957 -.568 .361 -.6661958 -.583 .247 -.6351959 -.495 N/A N/A1960 -.252 N/A N/A1961 -.242 -.084 N/A1962 -.320 -.076 N/A1963 -.531 1.216 2.4861964 -.305 1.916 3.2501965 -.387 2.430 7.1671966 -.580 2.757 24.8681967 -.625 1.451 9.7551968 -.678 .252 1.6841969 -.711 .413 1.5491970 -.681 1.186 15.5781971 -.632 2.329 19.7021972 -.479 3.207 .9311973 -.735 2.057 4.8341974 -.733 .507 11.8901975 -.599 1.775 6.0011976 -.807 8.942 31.5981977 -.692 -29.220 76.1611978 -.800 -60.029 59.069197? -.505 -23.165 19.058L980 .154 -25.219 99.7221981 -103.635 -3.135 -398.9061982 -.677 -22.200 -2838.2081983 -.721 -32.908 -5350.3301984 -.390 -151.762 4077.9511995 -.247 -323.781 165.772
Notes to Table 44:(a) Real Actual Income minus Real Equilibrium Short-Run Income
divided by Real Short-Run Equilibrium Income (from AnnexTable 8-1(1) for Cocoa, Table 8-2(1) for Rice, and Table 8-3(1)for Maize).
222

Table 45
Real Long-Run Income Effect of Direct Intervention (a)(NC)
Large Scale Large Scale Small ScaleYear Cocoa Farmers Rice Farmers Maize Farsers
1953 N/A N/A N/A1954 N/A N/A N/A1955 -.242 N/A N/A1956 -.198 .076 -.5441957 -.557 .372 -.7001958 -.583 .354 -.6571959 -.522 N/A N/A1960 -.310 -.561 N/A1961 -.258 -.227 N/A1962 -.336 -.105 -.6801963 -.554 1.255 1.8921964 -.436 2.023 2.9861965 -.495 2.802 7.9781966 -.692 3.299 26.2291967 -.761 1.951 11.9281968 -.7?6 .514 2.3381969 -.812 .682 1.8871970 -.797 1.421 16.2211971 -.792 2.686 21.1881972 -.701 3.853 1.4881973 -.820 2.623 5.8561974 -.842 .877 11.7891975 -.765 2.368 7.8311976 -.885 9.910 36.4811977 -.842 -36.088 92.7681978 -.901 -79.400 83.1831979 -.761 -44.046 29.3091980 -.359 -47.805 143.5431981 -59.800 -4.529 -521.1161982 -.690 -26.015 -4110.3031983 -.824 -53.956 -12052.8241984 -.729 -292.386 9653.1111995 -.623 -651.935 458.383
Notes to Table 45:(a) Real Actual Income minus Real Equilibrium Long-Run Income
divided by Real Long-Run Equilibrium Income (from AnnexTable 8-111) for Cocoa, Table 8-2(1) for Rice, and Table 8-3(1)for Maize).
223

Table 46
Real Very Long-Run Income Effect of Direct Intervention (a)(NC)
Large Scale Large Scale Small ScaleYear Cocoa Farsers Rice Farsers Maize Fareers
1953 NIA NIA N/A1954 N/A N/A NlA1955 -.242 N/A N/A1956 -. ?8 ,076 -.5441957 -.557 .372 -.7001958 -. 583 .354 -. 6571959 -.523 N/A N/A1960 -.310 -.561 NIA1961 -.258 -.227 NIA1962 -.337 -.105 -.6801963 -.554 1.255 1.8921964 -.436 2.023 2.9861965 -.495 2.802 7.9781966 -.692 3.299 26.2291967 -.762 1.951 11.9281968 -.797 .514 2.3381969 -.815 .682 1.8871970 -.803 1.421 16.2211971 -.802 2.686 21.1881972 -.724 3.853 1.4881973 -.840 2.623 5.8561974 -.865 .877 11.7891975 -.810 2.368 7.8311976 -.912 9.910 36.4811977 -.887 -36.088 92.7681978 -.933 -79.400 83.1831979 -.850 -44.046 29.3091980 -.621 -47.805 143.5431981 -33.875 -4.529 -521.1161982 -.835 -26.015 -4110.3051983 -.910 -53.956 -12052.8241994 -.868 -292.386 9653.1111995 -.823 -651.935 458.383
Notes to Table 46:(a) For Cocoa: Real Actual Income minus Real Equilibrium Very
Long-Run Income divided by Real Very Long-Run EquilibriumIncome tfrom Annex Table 9-111)).For Rice and Maize: Very Long-Run in considered to be theas Long-Run so values are from Table 45.
224

Table 47
Real Instantaneous Income Effect of Total Intervention (a)(NC)
Large Scale Large Scale Snall ScaleYear Cocoa Farmers Rice Farmers Maize Farmers
1953 NIA N/A N/A1954 N/A N/A N/A1955 N/A -.062 -.6711956 N/A .068 -.5471957 N/A .000 -.7831958 -.454 -.244 -.6501959 -.420 N/A N/A1960 -.312 -.521 N/A1961 -.312 -.597 N/A1962 -.292 -.584 -.6751963 -.391 -.027 .1021964 -.153 -.242 -.5121965 -.491 -.533 -.2261966 -.393 -.429 .1421967 -.302 -.237 -.2491968 -.357 -.550 -.5811969 -.558 -.314 -.3111970 -.351 -.140 1.3511971 -.117 .057 .0171972 .274 .710 -.7041973 -.380 .196 1.6271974 -.409 -.363 -.1361975 .006 .314 -.0301976 -.503 .716 .9641977 -.178 .226 -.1991978 -.682 -.155 -.6421979 -.549 -.176 -.7001990 -.629 .235 -.1281981 -.369 -.577 -.4181982 -.530 -.002 -.2041983 -.660 .713 .7821984 -.579 1.169 -.2911985 N/A N/A NIA
Notes to Table 47:(a) Real Actual Incose minus Real Equilibrium Instantaneous
Incose divided by Real Instantaneous Equilibrium Income(from Annex Table 8-1(2) for Cocoa, Table 8-2(2) for Rice,and Table 8-3(2) for Maize).
225

Table 48
Real Short-Run Income Effect of Total Intervention (a)(NC)
Large Scale Large Scale Small ScaleYear Cocoa Farsers Rice Farmers Naize Farmers
1953 N/A N/A N/A1954 N/A N/A N/A1955 N/A N/A N/A1956 N/A .068 -.5471957 N/A .392 -.6611958 -.527 .049 -.6881959 -.490 N/A N/A1960 -.323 N/A N/A1961 -.365 -.616 N/A1962 -.365 -.623 N/A1963 -.554 -.054 .3361964 -.232 -.08B .4191965 -.636 -.327 .6291966 -.574 -.365 2.3191967 -.428 -.203 1.6061968 -.438 -.438 .1121969 -.659 -.247 .2961970 -.536 -.029 4.9671971 -.238 .180 5.4411972 .424 .815 -.1071973 -.517 1.053 2.7791974 -.525 -.032 6.7231975 -.099 .222 2.2661976 -.654 1.865 8.9431977 -.259 .897 6.6201978 -.740 .642 2.0101979 -.587 .202 .5401980 -.716 .867 3.8661961 -.420 -.368 7.0481982 -.615 .049 10.9791983 -.766 1.941 39.9961984 -.653 3.365 41.3161985 N/A N/A N/A
Notes to Table 48:(a) Real Actual Income minus Real Equilibrium Short-Run
Income divided by Real Short-Run Equilibrium Incose(from Annex Table 8-1(2) for Cocoa, Table 8-2(2) for Rice,and Table 8-3(2) for Maize).
226

Table 49
Real Long-Run Incose Effect of Total Interyention (a)
(NC)
Large Scale Large Scale S uall ScaleYear Cocoa Farmers Rice Farmers Maize Farmers
1953 N/A N/A N/A1954 N/A N/A N/A1955 N/A N/A N/A1956 N/A .068 -.5471957 N/A .348 -.7011958 -.468 .092 -.7121959 -.458 N/A N/A1960 -.300 -.777 N/A1961 -.306 -.691 N/A1962 -.310 -.657 -.8801963 -.526 -.126 .0241964 -.294 -.140 .2401965 -.651 -.328 .6421966 -.639 -.329 2.2611967 -.561 -.197 1.6701968 -.555 -.449 .1761969 -.715 -.234 .3251970 -.631 -.034 4.7801971 -.446 .175 5.4611972 .064 .803 .0251973 -.618 1.014 2.9801974 -.658 .064 6.2331975 -.391 .339 2.8991976 -.763 1.787 9.6971977 -.521 1.066 7.5591978 -.810 .B05 2.7201979 -.695 .399 .8961980 -.774 1.056 4.5821981 -.572 -.308 8.2491982 -.695 .144 14.6611983 -.819 1.944 54.2571984 -.765 3.819 59.8381985 N/A N/A N/A
Notes to Table 49:(a) Real Actual Income minus Real Equilibrius Long-Run
Income divided by Real Long-Run Equilibrium Incone(from Annex Table 8-1(2) for Cocoa, Table 8-2(2) for Rice,and Table 8-3(2) for Maize).
227

Table 50
Real Very Long-Run Incoae Effect of Total Intervention (a)(NC)
Large Scale Large Scale Seall ScaleYear Cocoa Farmers Rice Farmers Naize Farmers1953 N/_ N/A N/A
1953 N/A N/A N/A1954 N/A N/A N/A1955 N/A MIA N/R1956 N/A .068 -. 5471957 N/A .348 -.7011958 -.468 .092 -.7121959 -.459 N/A N/A1960 -.301 -.777 N/A1961 -.307 -. 691 N/A1962 -.310 -.657 -.8801963 -.526 -.126 .0241964 -.295 -.140 .2401965 -.651 -.328 .6421966 -.639 -.329 2.2611967 -.562 -.197 1.6701968 -.558 -.449 .1761969 -.720 -.234 .3251970 -.645 -.034 4.7801971 -.484 .175 5.4611972 -.018 .803 .0251973 -.656 1.014 2.9801974 -.701 .064 6.2331975 -.481 .339 2.8991976 -.804 1.787 9.6971977 -.657 1.066 7.5591978 -.879 .805 2.7201979 -.823 .399 .8961980 -.879 1.056 4.5821981 -.784 -.308 8.2491982 -.854 .144 14.6611983 -.917 1.944 54.2571984 -.896 3.819 59.8381965 N/A N/A N/A
Notes to Table 50:(a) For Cocoa: Real Actual Income minus Real Equilibrium Very
Long-Run Incose divided by Real Very Long-Run EquilibriumIncome (from Annex Table 8-1(2)).For Rice and Maize: Very Lang-Run in considered to be theas Long-Run so values are from Table 49.
228

The tables present deviations of real actual from real equilibrium income
as a perc:entage of real equilibrium income. They are based an the detailed
tables of Arnex 8. All farms are assumed to have produced the same output
in the absence of direct or total price interventions as they actually
produuced in the first year for which such comparisons can be made.
The income effect for cocoa is negative for the entire period
between 1953 and 1985 due to increasingly distorted autput prices. The high
negative values for 1981 in Tables 43-46 are due to the fact that the world
price of cocoa was so low in that year that the equilibrium producer price
in the absence of direct intervention was actually negative. As is to be
expected, the magnitude of the inccme effect for cocoa increases
dramatically as the length of the run increases. This is due to the
accelerating magnitude of the price and output effects.-
The directicn of the income effect for both rice and maize varies
over the period between 1953 and 1985. The effect of direct intervention is
very large in absolute magnitude in later years because of the problems
noted earlier of negative producer prices calculated by subtracting
transport and marketing margins from the border price at the official rate
of exchange. The income effects of total interventions, which are more
meaningful, are negative in most years in the instantaneous run. They
became positive in the short and long run in most years, especially after
1l970, because production in equilibrium is less than actual production
despite the awl-price effect, which would tend to increase equilibrium
producticn. Instead, the strong cross-price effects of higher equilibrium
d Described in Chapters VI and VII.
229

cocoa prices offset the own-price effects and result in decreased
equilibrium production.
Overall, then, the effects of price interventions generally tended
to benefit rice and especially maize farmers, but resulted in severe income
losses to cocoa producers. These different tendencies became especially
prcxounced towards the end of the three decades considered.
Variability Effects
A frequent argument for governnent price interventions in
agriculture is that it reduces price variability resulting from fluc-tuations
in prices on the world market or changing demand and supply conditions at
home. To examine this issue calculations were made of the variances of
and P./P-, P-/P P./P .
where P1, is the actual producer price, Par is the producer price in the
absence of direct interventions, P*ro is the producer price in the absence of
direct and indirect interventions, P, is the actual consu-mer price, P'. is
the consumer price in the absence of direct interventions, P*, is the
consumer price in the absence of direct and indirect interventions, and P_
is an index of nanagricultural prices. Separate calculations were made by
crop and for both producers and consumers. The results are presented in
Tables 51-53 and in the graphs that accompany these tables.
The conclusions drawn from the tables are mixed. They indicate
that both direct and indirect price interventions have decreased the
230

variability of maize prices.7 On the other hawd, these interventicns appear
to have increased the variability of rice prices. For cocoa, which is
subject to wide price swings mn the world market, these interventicns have
clearly reducced the variability of prices.
In additim to reducing the variability of prices, policy
interventicns may also have an effect on the variability of per capita food
consumptim. Table 54 presents data an per capita productim and
consumptimn of rice and maize. It indicates that the availability of these
cereals actually varied more than did their domestic produckticm. The
correlatim between the quantities produced and those cansumaed are, of
course, much higher for maize than for rice given hana s higher degree of
self-sufficiency in maize.
' The results for maize and rice are probably more reliable forcmsumer than for producer prices because of the anomaly discussed earlierccnceming their negative values in later years.
231

Table 51
Domestic haize PricesUnder Alternative Price Scenarios
Producer Producer Consuser ConsumerPrice in the Price in the Price in the Price in the
Actual Absence of Absence of Actual Absence of Absence ofProducer Direct Indirect Consumer Direct IndirectPrice Intervention Intervention Price Intervention Intervention
(Pp/Pna) (P'p/Pna) (Ptp/Pna) (Pc/Pnal IP'c/Pna) IPlc/PnalYear (a) (b) (c) (d) (e) (f)
1953 110 N/A N/A 161 N/A N/A1954 93 171 171 144 233 2331955 84 257 257 133 332 3321956 107 236 236 160 309 3091957 58 267 267 103 344 3441958 91 209 264 141 277 3401959 67 155 224 115 215 2951960 65 212 356 111 281 4461961 106 231 440 160 304 5441962 94 170 294 148 235 3771963 93 44 85 143 86 1331964 113 118 232 167 173 3041965 129 44 168 190 92 2351966 115 33 101 174 80 1591967 49 38 66 95 82 1141968 90 140 217 142 200 2881969 139 134 201 198 194 2711970 100 20 42 154 62 981971 95 54 93 150 103 1471972 137 367 462 198 463 5721973 125 37 47 187 85 971974 109 94 126 166 149 1861975 104 67 107 162 119 1651976 195 43 98 273 98 1611977 277 67 343 390 149 4671978 133 61 374 223 140 4991979 119 107 400 208 194 5311980 235 23 269 344 99 3821981 192 -11 332 292 60 4541982 163 -25 204 264 49 3121983 462 -34 254 618 49 3801984 132 36 184 220 110 2801985 75 40 N/A 144 104 N/A
Variance 5740 9140 12921 9803 10381 19533
232

Notes to Table 51:(a) Actual Producer Price froo Table 3-3(1), deflated by the
Nonagricultural Price Index froe Table 3-511(bl Producer Price Equivalent (OER) froe Table 3-4(2), deflated
Nonagricultural Price Index from Table 3-511.(c) Producer Price Equivalent (EER) from Table 3-4(2), deflited
Nonagricultural Price Index froe Table 3-5(1).ld) Actual Consuser Price from Table 3-3(1), deflated by the
Nonagricultural Price Index from Table 3-51).(e) Retail Price Equivalent lOER) from Table 3-4(2), deflated
Nonagricultural Price Index from Table 3-5(1).lf) Retail Price Equivalent JEER) from Table 3-4(2), deflated
Nonagricultural Price Index from Table 3-51).
233

L *~ -s.L _ _ * _ _ _ _ L L _ _ X.- _ * .L L L - f
LC- LL LO f . '.: ;:r L-J :Z- . Ld 0 4L Lo LCJ Uzi ;:J- L. 1L -.JD -L Q if) ' ' l LIZ, LJ LpC DL -:.0 .Zr . W r i M -,j *-.j :j -.j -.j -j -. j --1 --j --1j gi -i la. i-_.. ._1! J.7 1 CrJ C Li L,_l D1 rn 01 r1 1 0n
-> S -S- ;- --- -- -- -- -- ----.* n fi W - rilz - -1-;:rn W -- r--------- --- 0g.-
! I I I I I I Ii I I I I I I I I I I I I I II IJ I I i i I l 0 0
r-i' UU E
t, U'.- Ud,, - ,di °
,J~~~~~~~~~~Jo f
cj, sLJd -I Ii - - -n
'--31 t | t'|1 1;-11 -~-'s----'1 !-1d j @ :t r-a ;si lj t3z@-*@ Il J f'fiFr <,, 1 @~-; II r\

-~ -~ -~ L * -~ -. -~ -~ _ '- * ._ ' L -J *4 .- -- L A
,; LL ro . 0 i J 0 LJ ;0 LZ Z .LO 0 tz J LO i to '-f J Zi 0S LO0 ; .- J i; Lo . i Lg ."- LgjW w , c (i, i.j r..j- ..J --Lj - - -.j -- .- J - c: 4.. q **a F. ..-.-, c, i r n r n r i rn r n rn
vn A hD-e.i t txl-.1_tJ C.,,n 4- ',> ec- CD --_J 1-. , - 1. ;v[- rL C --.J .;, L9 4- CA
ci
IN~~~ **f~ -A - Ut
(CllJ ~ ~ 1 d 1/'-$r lii '.I . oc
It~~~~~~~~~~~~~~~~~~~~~~~~~~~~~~~~~~~I
f CS U d '' |l '
s.',Dljd,y"Z:'9'3;i-~ 111 .i I rI|:!g
@ ! r:-i z 1 ; ;-J ,r=-,,, .,} !--t , -4 a l Ji rl s iz I: rD '.1 J A '-> a :> 5I!I ri.1~ ~ ': ci G L n*L -i'. ~I n i

Table 52
Domestic Rice PricesUnder Alternative Price Scenarios
Producer Producer Consumer ConsumerPrice in the Price in the Price in the Price in the
Actual Absence of Absence of Actual Absence of Absence ofProducer Direct Total Consumer Direct TotalPrice Intervention Intervention Price Intervention Intervention
(Pp/Pnal lP'p/Pnal (Ptp/Pna) (PclPna) (P'c/Pna) (PIc/Pna)Year (a) (b) (c) (d) (e) (f)
1953 315 N/A N/A 459 N/A NIA1954 299 332 332 447 485 4851955 246 264 264 387 407 4071956 244 229 229 386 369 3691957 236 238 238 375 377 3771958 232 234 310 369 371 4581959 200 199 311 334 333 4621960 156 173 332 282 301 4841961 142 157 360 271 288 5211962 115 134 280 243 265 4331963 253 125 260 392 245 4001964 166 81 219 295 198 3571965 202 89 437 349 219 6191966 174 83 305 319 216 4711967 166 120 218 299 245 3591968 144 190 323 273 326 4801969 187 164 273 325 298 4241970 212 128 246 354 258 393
1971 202 95 191 348 225 3341972 275 111 161 433 244 3021973 292 192 242 457 342 4001974 255 294 402 409 454 5791975 280 117 212 441 253 3621976 461 98 264 667 250 4411977 387 -34 313 647 164 5631978 257 -49 306 492 140 5481979 147 -50 180 370 143 4071980 417 -67 336 686 129 5921981 215 -114 512 449 71 7911982 446 -137 447 730 60 7311983 661 -177 379 1007 43 6821994 503 -30 230 771 158 4571985 180 -5 N/A 371 158 N/A
Variance 14167 15996 6473 28028 11676 13336
236

Notes to Table 52:(a) Actual Producer Price from Table 3-3(1l), deflated by the
Nonagricultural Price Index from Table 3-5(1).(b) Producer Price Equivalent (OER) froe Table 3-4(1), deflated
Nonagricultural Price Index from Table 3-5(1).(c) Producer Price Equivalent JEER) from Table 3-4(1), deflated
Nonagricultural Price Index froa Table 3-51).(d) Actual Consuser Price from Table 3-3(1), deflated by the
Nonagricultural Price Index froe Table 3-5(l).(e) Retail Price Equivalent IOER) from Table 3-4(1), deflated
Nonagricultural Price Index from Table 3-5(1).(f) Retail Price Equivalent (EER) froe Table 3-4(1), deflated
Nonagricultural Price Index from Table 3-5(1)
237

Fi qu re 35: 3 mE:-.elti s R cProdu-c-er Pr'ices of lF ;ie9(,;Ae _ § ~~~~~~~~~~~~(Pp/,Pna)
-9- (P'p/Pno)
(Pp,a/Pno)
%~~~~~~~~
0063000
- - - - - - - - - - - - - - - - - - - - - - - - - - - - ------ - --- - - - -- -
43'
-300LC et 0 1 C r---c cr mD or-4 I< rt -t. ; r- CO r,- ,~ c-4 r-ry - Lf.l -¢ r--Ir x, N cx -. - ,nIDDeLfi l 0 4 C iL: fLE. 0 z§t& ~0 S s r-- r-. r- .r-r-- r-.r .r- N r. n , m
~~~~~~~~~--- - - T- - T-
In, Ch .1-Ti -;n m m 4 m roll ae CIN ci rzh m m T". m m :T., C-) Ch Ch m m C.I. m m QllrU C) .72h 11-1h
Yea r~~~~~~

6EZ
1 9 53 }19541955-1956-1957 - I1958
1962196) -O - '
1962 - '
19713
1 97.3 -. 8+_
19674 -L +A-. '
1 975 -~(:
-( 1976 -~~
1 978 - 1*E ' 1-.. * .A Li -)
'I1972-
1972 -197J4 - :c
1 9 7 e.f \ ~-~- _
1 9 /3 - jo-1984
1985 +~~~~ .,6 t
1982~~~~~~~~~~~~~~~~. . .s . .
-6

Table 53
Doaestic Cocoa PricesUnder Alternative Price Scenarios
Producer Producer Consuser ConsumerPrice in the Price in the Price in the Price in the
Actual Absence of Absence of Actual Absence of Absence ofProducer Direct Total Consumer Direct Total
Price Intervention Intervention Price Intervention Intervention(Pp/Pna) (P'p/Pna) (Ptp/Pna) (Pc/Pna1 1P c/Pna) (PIciPna)
Year (a) (b) (cI (d) (e) (f)
1953 651 N/A N/A 728 N/A N/A1954 729 1534 N/A 813 1618 N/A1955 745 996 N/A 834 1086 N/A1956 684 864 N/A 774 955 N/A1957 633 1400 N/A 720 1487 N/A1958 557 1194 1031 646 1282 11201959 522 939 910 606 1023 9941960 509 698 753 588 777 8321961 502 635 742 581 713 8201962 467 632 667 550 715 7501963 375 583 614 455 662 6941964 318 401 375 389 472 4471965 280 328 555 345 393 6191966 303 472 500 366 535 5631967 338 687 486 399 748 5471968 351 890 552 412 940 6131969 342 902 774 395 955 8271970 335 683 514 425 735 5661971 319 653 360 414 748 4551972 366 679 287 512 824 4331973 387 954 619 573 1140 8051974 350 984 597 575 1209 8221975 329 636 326 553 859 5491976 304 939 602 444 1079 7421977 380 819 457 686 1125 7631978 426 1421 1335 664 1659 15731919 421 737 933 645 961 11571980 289 197 772 547 455 10301981 394 -7 626 564 164 7961982 345 562 730 661 878 104619n3 293 483 841 688 878 12361994 245 321 575 605 681 93519"5 358 415 N/A 708 765 N/A
Variance 18243 116222 51440 17713 108695 70045
240
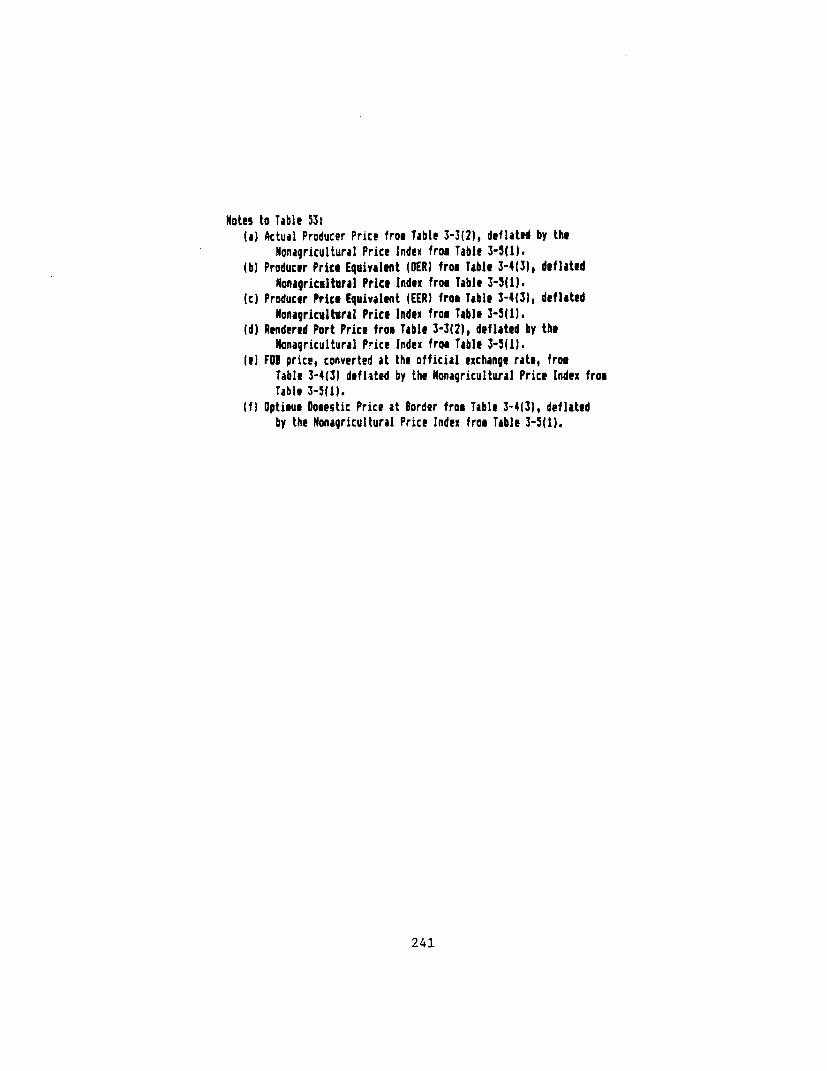
Notes to Table 53i(a) Actual Producer Price from Table 3-3(2), deflated by the
Nonagricultural Price Index from Table 3-5(1).(b) Producer Price Equivalent IOER) from Table 3-4(3), deflated
Nanagricultural Price Index from Table 3-511).(c) Producer Price Equivalent (EER) from Table 3-4(3), deflated
Nonagricultural Price Index from Table 3-51).(dl Rendered Port Price from Table 3-3(2), deflated by the
Nonagricultural Price Index froe Table 3-5(1).(eJ FOI price, converted at the official exchange rate, froo
Table 3-4(3) deflated by the Nonagricultural Price Index fromTable 3-5(1).
(f) Optieum Domestic Price at Border from Table 3-4(3), deflatedby the Nonagricultural Price Index from Table 3-5(1).
241

.~ a L -~ .... - * L L L -- A - J6 -A -L - L -A . -- I-. -_
co co O z z. {4 ;S LLL L O; ; 4D --Z (O L. O sL;NL 0 (o o ;D LI C.-tD iC. LO ss> Di 4;j 0 zW r m 1 m .al sJ -- ,- -, -j-, -j M m} 1. > lD lm. M -- -m .S 15) Ln rJ rn ;n ;n .
I 4- O- N) -, ' -'C -j , ,- ,-J .-Ai ,-J -, ,T co , , C, 4, ,, NaI i CT' ' ' '0'' I ul Q I Vi
P---- --------------------------------- <--D
~~~~~~~~~~~-k4~~~~~~~~~~~~~~~~~~~~~~~~~~~~~C
I,~~~~~~~~~~~~~~~~I
D Ud/-.'Jd) o C
I *d:/'S.j) I _('.'.if.71 I
D~~~~~~~~~~~ C.i: G~ ! -
' 2dJ@; - ! 1; r n@1r 1!

0 4; LO CO {D L : LO -L L -D -L L * * * -- LO LCD 'S -D * L CJ ** W L 1. t- i L .* _CO C ry m CO CO --i * _ -*i -_ J 4-- '- - j *.as CQ. u' crz C>m a/ ,c Cn -i n7 M rCTy rJi C. u n ry
ui 4. l * (a { 4- -- J { 1 t4 "J - .) - ) tP '-.J U(i 4- (A,J -D 0 D' X -.J a,) 4- t j, I , , I I I I I I I I I I I II O c
II4 + I
f: l-4d/;3,d.,' ~ ~ ~ "' O , *
f~~~~~~~~~1 ~ ~ 1
I,DLd ,"Q, d: El--
E ;) o'4C qs . ii j i _U n 3 L C<LI cU -9 nd]

Table 54
Per Capita Production and Consumption
Per/Capita Per/Capita-------------------------- Maize -------------------------- Rice
Maize Naize Consuser Rice Rice ConsuserProduction Availability Price Production iAvailability Price
tons) (ONd) lPc/Pna) (1Rs) IORd) (Pc/PnailYear (at) (a) (it) (b) (c) (at) (a) (at) (b) (d)
1955 31.1 26.5 133 2.7 3.1 3871956 29.7 25.5 160 2.6 3.8 3961957 28.5 24.4 103 2.5 5.2 3751958 29.5 25.1 141 3.1 4.9 3691959 N/A N/A 115 N/A N/A 3341960 N/A N/A 111 3.1 6.8 2821961 N/A N/A 160 2.8 9.0 2711962 23.7 20.2 148 2.8 12.3 2431963 25.1 21.3 143 2.9 6.1 3921964 22.7 19.8 167 3.6 8.2 2951965 26.9 23.0 190 2.7 6.2 3491966 45.0 38.9 174 2.4 8.0 3191967 34.6 30.3 95 3.4 7.8 2991968 30.8 26.2 142 3.3 6.5 2731969 35.6 30.5 198 4.6 7.2 3251970 56.3 48.5 154 3.7 9.3 3541971 52.9 45.4 150 4.1 7.4 3481972 44.6 37.9 199 5.0 6.9 4331973 46.1 39.4 187 4.4 9.4 4571974 51.1 43.5 166 5.0 8.2 4091975 35.1 29.9 162 4.7 4.1 4411976 20.5 25.3 273 4.5 4.3 6671977 26.7 22.7 390 6.9 6.7 6471978 20.7 17.6 223 6.7 10.0 4921979 35.1 29.9 209 5.6 4.8 3701980 34.4 30.4 344 4.6 9.8 6861981 33.2 30.6 292 5.5 7.5 4491982 29.6 32.1 264 2.0 3.1 7301983 14.4 21.6 618 2.2 4.6 10071984 47.0 50.5 220 3.5 7.1 7711985 32.6 35.6 144 4.6 8.7 371
Mean 34.0 30.4 199 3.9 6.9 436Variance 100.8 77.4 1.6 4.8
CORR between INd and ONs CORR between GRd and ORs
.94 .26
244
Notes to Table 54:(a) Production figures from Annex
population (for source of pActual production figures fto accout for conversion f
(b Availability figurn from Annpopulation.
(cl From Table 51.(d) Froa Table 52.
245

tA%,,'.m''rrt Per IJcipitcj Metric: Ton Per Cc3p.itr:* ' = ~~~~~~~~~~~~c- Lfl - M+r
1 ' Fa 7 A1 5N, ,
19- i - - 160I
1 959 t 1 9i 1 i1 -;
19 WI -- 1 960-
1 9 62 ;FO.:- 8,
1 M 4. 26+s.= - _ ,
1 gkl r, -- I .R-=- _ +F
1e O1967 E>-1--- 7
_:1969 \ z 15t'9'> --
1969 1 qt.l_
19707~P 5;6W+~_
17 -t 1971Z S&
1 97't 1 972 d= 1974 _ ^.1s9
1976-=_ 197. -a
1 9W§-a 197 -n__
9f 1 9N -1913,12,~~~~f D131 >~
M3~~ ~ 4, 1-'
1~~~~~~~~~~~~~. 934 g'A&,B

Flll.le e-i: F.lt:e ;l-;:Z;uc4rel-Xti At-.: A <jilclibillityl
-5- (CRd!
0 II~~~~~~~~~I0r i
*o -a. ixz) m, c- r4 i r = t-, . Lf, I4-> cc r> * tr t-. t-- a.% rb c% LOIn 'l UIn rJ 10 PtCAc V V W¢ !-,3 LP ;W~ t-- P-t--t- F- - 1-- , t- t,- tD:X| M M MMM l*n :n M ai ::$ LI C,t *n% M Cii *: th cJ 01c EIM at M. rn *::. Mo M lz M LT at M (M ai o
F=lg Lire -;1 0: n- '.-m r e r F;r-l l-e of R ',::: 1 I I I I I I I I I I III I' I I I I I IW; to t-- 0 - 0 - N tl> + 0 W t 11 I> M 1-- 1l / J I ,
In ,, M Mr>0wMMe V0I' - 1-t-t-., t..... , .- t-raMMI, M.. M
s~ ~~~ in MS a s X > Ma 0J Mr 13B1 J' rw n @ l:. OM IM M Z ) M an IT 'M M -M :D La M
_ _ _ _ ~~~~~~~~te _i r
247

PART THFEE: TK-E FAILLFE OF THE POLITICAL SYSTEM
CHWPTER X: HYFPEOTHESS ANM CONJLJISION
This chapter brings together Parts One and Two of the study to
suggest a number of hypotheses regarding the political economy of
agricultural price policy in Ghana. These hypotheses are examined over five
major phases of Ghana s historical development and conclusicns are dramn
with respect to their validity.
The Hypotheses
A number of significant hypotheses emerge from the study, which
are discussed briefly in this section.
Imoortance of Macroeconomic Diseouilibrium
The history of agricultural price policy in Ghana is a prime
example of the importance of macroeconomic forces in shaping macroeconcnic
incentives. The combination of inflation and a rigid exchange rate led to
massive price distortions, which in turn exacerbated imbalances in the
balance of payments and the goverment s budget. Efforts to increase
producer prices and to subsidize agricultural inputs were ineffective in the
face of such hugh distortions.
Loss of Real Income
There were no gainers in Ghana. Both agricultural produccers,
especially cocoa farmers, and urban consumers experienced large losses of
real income. Efforts to protect those incomes consumed increasing time and
248

energy, and in the end these effects were abandcned as people from virtually
every interest grcuip in Ghana withdrew from contact with the formal sector
and returned to food farming and other informal sector activities. Many
others emigrated outside the country.
Failure of the Pblitical System
The theory of political economy stresses the relationship that
exists between econanic policies, their impact on various groups in society,
and the influence that these groups have, in turn, on policy decisions. In
Ghana this feedback mechanism failed to operate as successive regimes
increasingly (1) made decisions within a political vacuum because of their
isolation from the Ghanaian populace and (2) fcund themselves confronted
with such binding macroeconomic constraints that there was virtually no
scope for independent decisions.
Rise of Rent-Seekinq Activity
Given the government's increasing inability to influence the
allocation of resources through price policy, its efforts went towards
economic management through extensive administrative controls. These took
the form of import licensing, exchange controls, marketing board operations,
input distribution, credit allocation, and other mechanisms. EnormoLus
possibilities were created for arbitrage between the informal market and
formal, government-controlled distribution channels. This led to rent-
seeking activity an a massive scale. Cbovernment regulations were subverted,
graft and corruption were rampant, and patron-client relations became
249

entrenched as the chief means by which most people could gain access to
scarce rescurces.
Neulect of Price Pblicy
In addition to the objective constraints imposed on output price
policy by macroeconomic disequilibrium, successive governments maintained a
strong bias towards intervening in agriculture through projects, public
investments, input subsidies, and cheap credit rather than by influencing
producer prices. Since rescurces were very limited and many investments
were unproductive, the result was very little increase in production and a
strong bias in favor of large farmers with contacts and influence.
Failure to Achieve National Objectives
During each of the phases described lbelow, the regime newly in
pow-er was fairly clear as to its national objectives and mDre or less how
these were weighted. Yet underlying macroeconomic constraints and the
entrenchment of rent-seeking activity within an elaborate network of patron-
client relationships soon dissipated any notions that much progress in
achieving these objectives was to be achieved. Instead, the regime found
itself increasingly embattled and unable to act decisively. As a result it
became politically isolated and was forced to rely on military weight as its
means of staying in power.
The Phases
The periods during which the political econcomy of Ghana evolved as
described in Chapter IV can be grouped together into five phases. During
250

each of these, the government in power could be characterized as having had
a distinc:t set of objectives and objective weights. Each regime, with the
exceptimn of the Rawlings gcvernment currently in power, found itself
frustrated in its attempts to achieve its objectives and was eventually
displaced.
Colonial Period
The colmnial government was essentially liberal and strongly
oriented towards export trade, and yet it created during this period the
cocoa export manopoly that was to dominate the industry. Oice the CRP came
to power, heavy emphasis was placed an extracting the resources from cocoa
that would finance its investment program and an penetrating politically the
rural sector.
Nkrumah
After inderendence in 1957, the Nkrumah government was intent an
industrialization and increased investment in urban services. It was also
highly sensitive to the welfare of its urban political base, and yet it
allowed inflation to eat away real incomes. Government revenue and foreign
exchange became increasingly important as objectives once exchange reserves
were exhausted and low world cocoa prices squeezed public revenues.
Finally, towards the end of this phase, there was heavy emphasis on large-
scale farms in the rural sector at the expense of small farmer development.
251

National Liberation CGuncil (NLC) and Busia
The National Liberation Council attached strong importance to
macroeconomic stability. Emphasis was also placed on stimulating cocoa
exports by increasing producer prices. There iwas a desire to liberalize
imports and to reduce the prevalence generally of quantitative controls.
The state was seen as a regulator of private activity rather than as having
an impor-tant directly productive role. Equality of income distribution was
given less weight, and the regime of Busia had a decided regional bias.
National Redemption Council (NRC). Supreme Military Council (SMC). andLimann
The NFR come to power committed to reversing the trend towards a
more liberal economy. Emphasis was placed on agriculture, but through
projects, public investments, and input subsidies rather than by raising
producer prices. Easing Ghana s dependence an foreign exchange was
perceived as an important objective but the mechanism to achieve it was to
tighten input restrictions and to increase self-sufficiency rather than to
increase exports. Mbre emphasis was placed on improving the distribution of
income and promoting regional equality than on maintaining macroeconomic
equilibrium.
Provisional National Defense Councril (PNDC)
After the brief interlude of the Limann government, which did
little more than attempt to cope with the disastrous economic situation, the
PNDC under Jerry Rawlings came to power with a strcng populist mandate.
Althtugh its initial views were strongly interventionist in nature, the
government fosund itself virtually obliged to adopt a more liberal framework
252

of objectives. Principal among these was macroecmnomic stability, but not
far behind were liberalization of imports and growth of exports as ways of
dealing with the foreign exchange crisis. Welfare of urban consumers was
not given high priority, nor was greater equality of regional and inccme
distributimn. Greater weight was placed mn agriculture thrnugh the
mechanism of output price policy, especially for cocoa and the industrial
crops. Less immediate attentimn was given to industry, though in the long
run its growth was perceived as essential.
Summary
Table 55 presents rough estimates of the weights attached to
various objectives during each of the phases described above. The weights
are assigned, to the extent possible, independently of the particular
cnmstraints with which each regime was faced. Thus they generally tend to
reflect relative priorities at the beginning of each phase, before the
econmic realities were fully felt.
Of particular importance in the table are the sharp shifts in
weights that occurred frum mne phase to another. Consumer welfare, for
example, was given high priority by Nkrumah, who depended on his urban base
of political power, but the military government after Busia gave this
objective much less weight. In contrast, farmer welfare was least
important to Nkrumah but gained in importance with succeeding governments as
they realized the importance of the rural sector to the econwom. Cbvernment
revenue was very important to Nkrumah as a means of enhancing the power of
the state and of financing his ambitious investment program; to other
253

gcverriments, it was required merely to keep up with the expansion of
recurr,ent expenditures in the face of rising public sector
Table 55
Relative Weight of Agricultural Price Policy Objectives
Phase(years)
Colonial Nkrumah NLC.Busia NRCISMC PNDC(1950-57) (1957-66) (1966-71) (1972-79) (1982-
Obiectives _ Present)
ConsumerWelfare .20 .25 .--) .10 .15
FarmerWelfare .05 .00 .15 .15 .20
GovernmentRevenue .25 .35 .15 .15 .15
PriceStability .20 .10 .25 .05 .270
ComparativeAdvantage .20 .0o .15 .00 .15
Food Self-Sufficiency .0o .05 .00 .20 .05
Industrial-ization .05 .25 .10 .10 .05
IncomeDistribution .00 .00 .00 .10 .05
RegionalBalance .05 .00 .00 .15 .05
Total 1.00 1.00 1.00 1.00 1.00
employment. The relative importance attached to price stability has varied
as perioids of rapid inflation have been succeeded by strong efforts to
restore macroecocrmic equilibrium.
254

Regimes have also differed markedly in the emphasis they have
placed on exploitation of Ghana' s comparative advantage versus food self-
sufficiency and import-competing industrialization. The colonial
government's emphasis on the export trade, for example, was followed by
Nkrumah's neglect of cocoa and concentration on industry. The NLC, on the
other hand, shifted back towards a more balanced view, whereas the NRC
strongly favored food self-sufficiency as the means to reduce depEndence on
foreign exchange. The present regime, in contrast, favors once more
exploitation of Ghana's comparative advantage.
Finally, equity of income distribution and regional balance have
never received very high priorities as objectives, except possibly under the
NRC. The Nkrumah and Busia governments were conspicunus in their regional
bias. The PNDC appears to be aware of distributional considerations but is
so intent on getting the economy moving again that it has not yet been able
to focus on these issues.
Testing of the Htvpotheses
The hypotheses presented earlier are tested here within the
context of the five phases just discussed.
Macroeconomic Disecnuilibrium
There is no question that until recently the effects of
macroeconomic disequilibrium overshadowed all other distortions in the
agricultural economy. Nkrumah s ambiticus investment program was severely
hampered by the decline in resources available from international trade when
would cocoa prices fell. As was shown in Chapter V, total public revenue
255

fron cocoa decreased dramatically during the period 1961-66 both in absolute
terms and as a share of the total value of sales. In real terms the loss
was even greater. Measured in 1972 constant prices, total revenue from
cocoa equalled NY 146 million in 1960 and NV 17 million in 1966. In 1965 it
was actually negative.
This decline in government revenue was not because farmers were
being let off easily. As shown in Table 9 of Chapter V, real producer
prices for cocoa decreased in real terms from S 546/mt in 1960 to N! 27B/mt
in 1965 (1972 constant prices). Yet this was a period, as demonstrated
thrcaughout Part Two, during which cocoa was relatively lightly taxed. The
unweighted average of nominal rates of protection for cocoa, with anly the
direct effects of price policy being taken into consideration, was -0.24 at
the producer level from 1960 to 1965. In five of the 32 years between 1954
and 1985 negative protection was at least 60 percent, and in 17 of the years
it was at least 40 percent.-
Despite its emphasis on price stability, the NLC/Busia regime was
never able to gain full control over the economy. Althouagh inflation was
slcwi.d, it still was close to double-digit figures by the time that the NFC
took over in 1971.2 Furthermore, the massive debt problem faced by Ghana
after Nkrumah was never resolved during this phase.
Uhder the NRC/SMC/Limann regime macroeconomic mismanagemnt proved
disastrous. Inflation reached triple-digit figures in 1977, and than again
in 1981. The real value of the exchange rate appreciated sharply with the
government s refusal to undertake any more than one nominal devaluation, and
± Table 16, Chapter VI.
2 Table 3, Chapter II.
256

as denEstrated in Part Two, this was the major cause of price distortions
during the late 1970s and early 19E0s.
The PDNC, in contrast, has mffved towards macroeconomic equilibrium
and, at the same time, institutionalized periodic adjustments in the
exchange rate. Thus even if the rate of inflation increases in the future,
the magnitude of distortions that characterized the recent past should not
be repeated.
Loss of Real Income
The losses of real income by cocoa farmers have been documented
in Chapters IV and IX. Rice and maize farmers, on the other hand,
experienced mixed effects, and in some years especially after 1972, they
gained appreciably from high rates of protection in the face of an
increasingly overvalued exchange rate and a lack of foreign exchange with
which to purchase imports.
Urban workers, on the other hand, were greatly injured by
inflation. An index of the average wage in manufacturing deflated by the
urban CPI fell from 100 in 1972 to 49 in 1976, 24 in 1979, and 11 and 1983.
Public sector real wages fell to approximately the same extent. Thus formal
sector employees were completely unable to protect themselves from real
inccmne losses. As a result, many were forced to devote an increasing amoit
of time to informal sector activities, including rent-seeking where
opportunities were available. Others simply abandoned the urban economy and
returned to the countryside, where food production offered a better hedge
against inflation.
257

Failure of the Political System
These losses in real income suggest that cocoa farmers and urban
workers had little influence on policy decisions affecting their welfare.
Yet they were much better able to organize than were most fcod farmers and
those in the informal sector. The conclusion that must be drawn, therefore,
is that the political system had broken duwn to such an extent that interest
graoups were no longer able to apply pressure effectively on those in power.
Looking at the cocoa farmers, it is clear that Nkrumah's
penetration of the Ashanti and other cocoa growing areas by the UGFOC had a
lasting political impact. His major opponent in this region was the
National Liberation Mavement (NLM), which was never very successful because
of its concentration en a regional constituency and separatist approach.
The LUFCC was therefore able to subvert the NLM s influence by focusing en
the cocoa producer price as the main issue.
Under aisia s Progress Party, cocoa farmers gained in power, but
this itself contributed to the demise of the regime. With the deterioration
of the economy that followed, there was no room for raising producer prices
further, given the increasingly overvalued exchange rate. Political
pressure, furthermore, was useless. Confronted by its own ineptitude and
corruption, the regime turned inward, relying more and more an muilitary
force.
Rent-Seeking Activity
The Nkrumah years saw the development of two major institutional
arrangements that provided abundant opportunities for rent-seeking. The
first was the Cocoa Marketing Board and the UGFCC. The first has survived
258

more or less intact; the second was dismantled in 1966 but was later
resurrected as the Produce Buying Company, albeit without the political
trappings of the UGFOC. The second arrangement was the system established
for allocating import licenses and access to foreign exchange. Each of
these is described in Chapter V, where the problems they presented are
spelled out in detail.
The introduction of these opportunities for rent-seeking behavior
into key areas of the econcomy provided an alternative to political influence
and power as a way to acquire scarce resources. Elaborate patrcn-client
relationships were established that enabled those without direct contact
with the state to nevertheless participate in the distribution of state-
controlled goods and services. Intermediaries, whether or not they were
part of the state, of course benefitted.
The growth of rent-seeking had two profound implications. First,
it drew resources away from productive activities that could have increased
the total quantity of goods and services available to society. This was
particularly true of urban areas, where the state's influence still reached.
Seccnd, it undermined the development of the political institutions and
processes at the state level that would have allowed interest groups to
influence policy-mnakers directly. Instead, political development occurred
on a mutch mDre decentralized and largely rural basis that ignored the state
and concentrated instead an local political systems. Only with the rise of
the populist leader, Jerry Rawlings, was there once more an increase in
state-level political activity. It is no accident that Rawlings and the
PNDC have loudly condemnried rent-seeking behavior.
259

Neglect of Price Policy
The combination of macroeccnomic constraints and the failure of
the political economy to operate effectively discouraged the use of output
price policy as the primary instrument for allocating resources and
transferring welfare. Instead governments relied on the mechanisms that
they could control - projects, public investments, input subsidies, and
cheap credit. Under Nkrumah this took the form primarily of the
establishment of state farms. Projects were later established to aid the
small private farmer, but these generally involved large public sector
bureaucracies, such as the central ministries or parastatals. The
NRC/SMC/Limann phase, particularly, was dominated by these plus input
subsidies and cheap credit.
The major problems with this approach were two-fold. First, the
state farms, projects, and parastatals required strang management skills,
which were and still are the scarcest resource in Ghana. Second, the
recurrent cost requirements of these institutions were enormous. Given the
severe budgetary constraints that existed in a rapidly deteriorating
economy, most financial resources were used to pay salaries and little was
left over for the operating expenses that would have enabled these
institutions to be effective.
As far as input subsidies and cheap credit are concerned,
shortages of management and operating funds implied that anly the largest,
most accessible farmers could be reached. Furthermore, these subsidies
undermined the development of private sector input marketing, which might
have gotten to the smaller farmer. This it was the NRC/SMC-gcvernment,
which originally placed greatest emphasis on more equal distributimn of
260

income, that probably contributed most to discrimination in favor of
wealthier farmers.
Failure to Achieve National Objectives
The intentions of governnents during the first four phases
described in this chapter were frustrated by the economic and political
realities of the time. The colonial regime was perhaps most successful
because of the cocoa boom of the 1950s. Yet Nkrumah's desire during this
period to mobilize resources for the state was soon confronted with the
ccnsequences of the collapse in world cocoa prices. Although some
industrialization was also achieved, it proved to be remarkably unproductive
and a severe drain on public resources. Finally, Nkrumah's emphasis on
consumer welfare, in the form of cheap food in urban areas and rising urban
wages, was undermined by the need to restrict access to foreign exchange and
the problems of balancing the budget. The nominal rate of protection on
rice and maize, for example, rose from -0.06 and -0.60 respectively in 1960
to 0.59 and 1.06 respectively in 1965.3 In the end, it was the loss of
confidence of the urban population that brought about Nkrumah's downfall.
The NLC and Bisia's government placed more emphasis on
agriculture, but it was during this period (1967-69) that negative
protection on cocoa, rice, and maize was greater than at almost any time
during the entire three decades, leading to large transfers out of
Z Table 17, Chapter VI. These are based on the effects of directprice interventions. Based on the effect of direct and indirect priceinterventions, from Table 19, the EWR was -0.36 for rice and -0.73 for maizein 1960 and -0.35 for rice and -0.07 for maize in 1965. Thus once theovervalued exchange rate is taken into account, consumers continued to besubsidized vis-a-vis world market prices in 1965, but to a lesser extentthan in 1960.
261

agriculture.4 Furthermore, confidence in the regime was eroded by declining
real urban incomes in 1969 and 1970, and rising inflation in 1971, despite
the governnent s ccnwmitment to increasing consumer welfare and maintaining
stable prices. Ohce again, it was a combination of macroeconomic crisis and
a weak political base, plus overreaction by the government to the situation,
that resulted in the take over by the NRC.
The NRC/SMC was committed to food self-sufficiency, improving
farmer welfare, and a better balance in the distribution of family and
regional income. The instruments used to achieve these objectives,
however, required intensive use of scarce management and financial
resources. As the economy deteriorated and these resourrce constraints
became more severe, the projects and programs of the government collapsed.
As output prices became increasingly distorted, moreover, cocoa farmer's
income and welfare declined.E To the extend that: greater regional balance
was achieved, this was more because of these losses than the gains achieved
by foodcrop farmers. Furthermore, food self-sufficiency was not attained
since Ghana became increasingly dependent until 1984 on food aid imports.
4 Tables 39-41, Chapter VIII.
s Tables 43-50, Chapter IX.
262

Conclusions
The hypotheses proposed here appear to be well supported by the
evidence presented in this study. It was the failure of politics to provide
an effective mechanism for influencing policy in the allocation of resources
that led ultimately to the collapse of the system. Rent-seeking took over
instead, but the diversion of resources to these activities and away from
those involving pr-oduction severely eroded the resource base. Marginal
retums to rent-seeking decreased dramatically and ultimately induced people
to minimize their contacts with the state. Decentralized political activity
in rural areas correspondingly flourished.
Rawlings came to power as a populist leader strongly committed to
the elimination of rent-seeking activities. The first attempts at doing
this by suppressing private trade were counter-productive. Cbce the
decision was made to liberalize the econaoy and to reduce price distortions,
hioever, the incentives for rent-seeking decreased. Once again resources
were allocated in accordance with relative prices rather than administrative
regulations and discretion. The process, however, is not yet complete.
NDr is it clear that institutions are being developed that will
enable Ghanaians to influence policy decisions in their favor through
political action. This will take time and the confidence of Ghanaians in
the current regime. Without this development, however, past history
suggests that the government can be expected to enccounter increasing
frustration and hostility to its actions.
263


ANNEX 1: AGRICLLTlUPL FiODUCTION
The purpose of this annex is to describe and evaluate the system
for collecting agricultural production data and to present the time series
of available data by crop. Comparisons are also made of alternative
estimates of cocoa sfftggling, and the cocoa production figures are adjusted
accordingly.
System for Data Collection
Cocoa
Llntil 1962, the Cocoa Division of the Ministry of AgricuiltLure
regularly prepared estimates of the area under and prodLuction of cocoa based
on sample measurements. ± The Cocoa Marketing Board (CMB) provided
information on the quantity and valute of cocoa purchases from producers,
marketings to foreign buyers and local grinding mills, and changes in
stocks. External Trade Statistics of Ghana, published from customs
information by the Central Eutreau of Statistics, provided data on the
quantity and valute of cocoa exports. Comparison of the data from different
sources permitted checks on the quality of the data.
After 1962, the quality of data on production deteriorated, and
better estimates of produtction were obtained by adjusting Cocoa Marketing
Board sales for changes in stocks. This ignored, however, the problem of
cocoa being smuggled across Ghana's borders. Table 1-1 presents data on
prodLction estimated by the Cccoa Marketing Board and two sets of estimates
X- This discussion is taken from M.S. Singal and J.D.N. Nartey,Sources and Methods of Estimation of National Income at Current Prices inGhana, Ghana Central ELUreau of Statistics, 1971, pp.3.-13.
265

Table 1-1
Cocoa Production and Smuggling 1960-19B2(000 At)
Smuggled Smuggled CocoaYear Production (a) Cocoa (b) Brong-Ahafo lc) Total (d)
1960 430 10 6.6 10.31961 409 8 5.9 9.41962 413 14 -1.9l -2.91963 428 11 -7.6 -12.01964 538 14 -6.1 -9.21965 401 17 .9 1.31966 368 17 37.13 57.11967 415 21 31.5 46.81968 323 17 19.2 26.51969 403 25 23.3 33.91970 413 31 17.9 34.31971 454 37 21.4 32.41972 407 42 13.8 21.91973 340 34 9.2 14.11974 376 30 15.9 26.61975 3-96 38 20.13 34.41976 320 40 21.4 35.01977 371 45 37.NA 64.31978 365 50 29.8 60.81979 296 N/A 31.8 56.01980 258 N/A 31.4 61.51981 225 N/A 24.1 46.31982 180 N/A 21.2 45.4
Notes to Table 1-1:(a) Cocoa production data are based on Cocoa Marketing Board estiaates,
the sources for which are given in Table 1-2.(b) Estioates of Ghanaian cocoa officials and international traders from
R.6. Franco, 'The Optiaal Producer Price oi Cocoa in Shana,mJournal of Developeent Economics, Vol. 8, 1981, pp.77-92.
(c) Econometric estimates from Ernesto May, Exchange Controls andParallel Market Econoeies in Sub-Saharan Africa--Focus on Shana,World Bank Staff Working Paper No.711, 1985, p.69.
(d) Derived by dividing Brong-Ahafo estisates by the share of the Brong-Ahaforegion in the production of all regions bordering neighboring countries.
266

of cocoa being siLtggled out of the country. The first consists of
guess-estimates of Ghanaian cocoa officials and international cocoa
traders. The second is derived from an econometric model developed by
Ernesto May that estimates smtuggled cocoa as a function of the price of
cocoa in the neighboring country converted to cedis at the black market
exchange rate, the official producer price of cocoa in Ghana, and cocoa
prodiuction capacity in Ghana. 2 Reasonable estimates were obtained only for
the Brong-Ahafo Regime, which borders the Ivory Coast and Luntil recently
produced almost twice as much cocoa as the other two regions bordering
neighboring coLuntries -- the Western and Volta Regions.3 Estimates for
total cocoa smuggled from Ghana were obtained by dividing May's Brong-fAhafo
figures by the share of that region in the production of all regions
bordering neighboring countries.
The two series on smuggled cocoa, while differing considerably
from year to year, do suggest that up to 5>-6O.-),CX tons of cocoa have been
smuggled ouLt of Ghana in some years. They also indicate that important
changes have taken place over time. During the period from 196:) to 1965,
for example, the quantity of cocoa being smuggled out of Ghana was always
less than 5 percent of total production. May's estimnates suggest, in fact,
that the direction of flow may have been the other way, that is that cocoa
may have been smutggled from the Ivory Coast into Ghana in some years during
this period.
2 Ernesto May, Exchanoe Controls and Parallel Market Economies inSub-Saharan Africa - Focus on Ghana, World Bank Staff Working FaperNo. 711, 1985.
3 Smuggling from regions in the interior is considered to be negligible.
267

In any event, the level of smuggling increased markedly after
1965. May' s work indicates that this took place very dramatically beginning
in 1966 because of a fall in the official producer price in Ghana and a
sharp depreciation of the cedi on the black mark:et. 4 Expert opinion seems
to be that the process was more gradual. The two sets of estimates also
differ somewhat with repect to the timing of other changes in the rate of
smiuggling between the mid-1%96s and the mid-197C)s, but they each suggest
that the average level was between 5 and 10 percen t of production. 5 They
also agree that the rate of smuggling increased again during the latter half
of the 197C)s. This was becatse increases in producer prices failed to keep
pace with inflation and the depreciation of the cedi on the black market.
By the early 198)s, smuggling may have accoLnted for close to 20 percent of
production.
It is possible that these figures are overestimated. As the
economic situation deteriorated dur-ing the 1970s, Ghana's transportation
system increasingly degenerated. In addition, the Brong-Ahafo Regicn
declined in importance as a source of supply relative to the Western Region,
which had poorer road linkages with the Ivory Coast. Finally, periodic
government crackdcons on cocoa smuggling undcoubtedly acted as a deterrent.
Experts close to the situation, in fact, have estimated smuggling during
" Until 1966, the NV/$LS rate on the black market was relatively closeto the official rate of .714 N&/$US. As a resLult of a strong tightening oftrade and exchange controls in that year, the black market rate moved to2.13 Nhl/U5. See May, Exchanae Controls..., p.129.
> One reason for the difference in timing may be learning effects andother forms of capital investment in smuggling that cause the long runresponse to variations in incentives to differ from the response in theshort run, which was estimated by May.
268

the early 199:s to be probably between 10,(X:} and 20,OCKx) tons per year.*
This woAuld amnount to approx>imately 1-0 percent of current production.
Cocoa Marketing Eoard estimates of production are adjusted for
smtggling here on the basis of this more conservative hypothesis regarding
its level during the early 1990s. As indicated in detail in the footnotes
to Table 1-2(3)! cocoa smutggling is assumed to have been nil until 1966,
when it beqan to increase as a result of substantial price incentives.
With increa,ses in producer prices in the late 1960:s and early 1970s,
smuggling is assL.uTed to have remained constant at 5 percent of official
purch-Ases from 1971 to 1975. Thereafter it rose again until it reached 10
percent of production in 193:.
Other Crop'
The Economics and Marketing Division of the Ministry of
Agriculture is responsible for estimating production of crops other than
cocoa. Beginning in the mid-1960s, the estimates were obtained by
multiplying the area Lunder cultivation by average yields for each crop under
consideration. Data on cultivated area were compiled from censuses for
large farms and from sample surveys for small farms. A broader sample
survey was Lndertaken in 1970 to measure area Lnder production of main crops
and livestock: numbers. FolloitAp surveys were then conduLcted in 1971 and
1972 to update the 1970 estimates and to obtain information on yields,
labor inputs, and farm machinery and equipment. Althcxtgh the usutal
6 World Bank, Ghana: The Cocoa Sector, Background Faper No. 1 of 4prepared for Ghana: Folicies and Proqram for Adiustment, October 14, 19E3,p.5.
269

difficulties were encountered with these surveys, the results are considered
to be reasonably reliable.
As foreign exchange constraints tightened after 1972. it became
increasingly difficult to maintain this system for data collection.
Shortages of fuel and spare parts limited the mobility required for valid
sampling. Instead, agricultural officers were obliged to report area and
production figures based on their informed opinions. There clearly, at this
point, was a deterioration in the quality of the data. Whether a bias was
introduced, however, is not so clear.
Aqricultural Froduction Data
Froduction data are contained in Tables 1-2(1) throrugh 1-2(3) for
17 crops from 193:) to 1985. Sources of data are given in the notes to the
table. The principal original sotrce is the Ministry of Agriculture, though
most of the data were obtained from World Bank Reports and the Central
Bureau of Statistics Economic Sulrvey 1969. The original source for the
cocoa statistics is the Cocoa Marketing EBard.
Except for cocoa, data on production prior to the micd-1'?96s are
taken from FPO Production Yearbooks. These data TLtst be treated with
caution since they are not based on the system of sample surveys described
above, but on cruder estimates of field personnel as corrected and inter-
polated by FAO. Nevertheless, they probably reflect reasonably well the
orders of magnitude involved.
The same may not be true of the figures on production after the
early 1970s. These show a sharp decline in food production that seems
inconsistent with the evidence presented elsewhere in this study that food
270

prices rose significantly in relation to prices of cash crops. There are at
least two possible explanations for this decline. The first is that Ghana
experienced very severe drought from 1975 to 1977. especially in the
northern area. The second reason, which has been more persistent, is the
almost total breakdown in the transport system due to lack of fuel and spare
parts and the inability of the government to maintain the road system. This
led to a strong decline in food marketings. which had been quite substantial
in earlier years. This decline was abetted by the decrease in per capita
in,comes that was occLurring across broad segments of the ulrban population.
271

Table 1-2(l)
Agricultural Production (a)(000 Its)
Cereals staples
Year maize Rice Sorghus Millet Cassava Yale Cocoyae Plantain1930 N/A -/A N/A N/A _ /A -/--N/A ---
1950 N/A N/A N/A N/A N/A N/A N/A N/A1951 N/A N/A N/A N/A N/A N/A N/A N/A1952 N/A N/A NIA N/A N/A N/A N/A N/A1953 NIA N/A NIA N/A N/A N/Ak NIA NIA1954 N/A N/A 79 99 512 481 NIA N/A1955 169 23 79 99 512 481 NIA N/A1956 169 23 79 99 512 481 N/A N/A1957 169 23 90 112 823 481 N/A N/A1958 183 30 N/A NIA 1092 N/A N/A N/A1959 NIA N/A N/A N/A N/A N/A N/A N/A1960 N/A 32 N/A N/A NIA N/A N/A N/A1961 N/A 30 100 80 N/A N/A N/A N/A1962 169 31 105 65 789 1001 N/A N/A1963 183 33 109 68 1194 1098 N/A N/A1964 170 42 113 70 1229 1153 N/A NIA1965 206 32 89 57 1100 1055 NIA N/A1966 353 29 107 66 1152 1170 NIA N/A1967 278 42 83 78 1156 1219? N/A NIA1968 253 42 72 57 1058 1382 NIA N/A1969 300 60 96 90 1350 2000 N/A 7001970 482 49 186 141 2388 909 1136 16411971 465 55 173 130 2388 909 1136 16411972 402 70 152 99 2840 679 945 16701973 427 62 167 109 2865 606 1325 20711974 486 73 177 154 3606 850 1510 20241975 343 71 185 122 2398 709 1099 12461976 286 70 189 144 1819 575 773 12561977 274 109 181 125 1811 535 722 9271978 218 108 121 98 1895 544 726 9401979 380 93 158 149 1759 602 749 8171980 382 78 132 82 2322 650 643 7341981 378 97 131 119 2063 591 631 8291982 346 36 85 76 2470 588 628 7451983 173 40 56 40 1729 866 720 3421984 574 66 NIA N/A 4083 N/A NIA N/A1985 411 90 62 54 3076 485 581 676
Notes to Table 1-2(1):(a) Data source for years prior to CBS Survey is FAO Yearbooks.
Data source for 1964-1969 (maize, rice, sorghum), 1966-1969 (millet, cassava, yam),and 1969 (plantain) is Central Bureau of Statistics, Econosic Survey 1964.
Data source for 1970-1983 is World Bank, Ghana Agricultural Sector Review,Annex 5, August 6, 1985.
Data source for 1984 and 1985 is the Ministry of Agriculture.
272

Table 1-2(2)
Agricultural Production (a)(000 its)
Edible Nuts & Seeds
Ground- Coco- OilpaleYear nuts nuts bunches Cowpeas Sugar Cane
1950 N/A N/A N/A N/A N/A1951 N/A N/A N/A N/A N/A1952 N/A N/A N/A N/A N/A1953 N/A N/A N/A N/A I/A1954 N/A N/A N/A N/A N/A1955 44 N/A N/A N/A N/A1956 44 N/A N/A N/A N/A1957 41 N/A N/A N/A N/A1958 41 N/A N/A N/A NIA1959 49 N/A N/A N/A N/A1960 N/A N/A N/A NIA N/A1961 N/A N/A N/A N/A 711962 N/A N/A N/A N/A N/A1963 47 N/A N/A N/A 3931964 50 N/A N/A N/A 4011965 27 N/A N/A N/A 1001966 38 N/A N/A N/A 1471967 39 N/A N/A N/A 2951968 62 N/A N/A N/A 2401969 61 N/A N/A N/A 3001970 102 302 696 11 1121971 102 302 696 11 1121972 89 296 711 9 1451973 127 306 782 7 1611974 157 307 917 11 1711975 111 311 901 11 2051976 113 229 281 12 1901977 8l 152 739 11 2581978 83 159 935 8 2721979 107 159 1012 9 1901980 92 H/A N/A N/A 1921981 100 N/A N/A N/A 1901982 110 N/A N/A N/A 1101983 70 N/A N/A N/A 1001984 N/A N/A N/A N/A N/A1985 N/A N/A N/A N/A N/A
Notes to Table 1-2(2):(a) Data source for 1950-1969 is FAG Production Yearbooks.
Data source for 1970-1979 (1970-1978 for sugar cane)is Norld Bank, Ghana Agricultural Sector Review,August 6, 1925, Annex 5, p. 63. Data source for
Data source for 1980-1983 (1979-1983 for sugar cane)is FAO,
273

Table 1-2(3)
Agricultural Production(000 its)
SeedYear Cocoa 'aj Cocoa (b) Cotton (c) Rubber (c) Tobacco (c)
1950 262 262 N/A N/A N/A1951 211 2-1 N/A N/A N/A1952 247 247 N/A N/A N/A1953 211 211 N/A N/A .101954 220 220 N/A .30 .101955 229 229 N/A .30 .101?56 264 264 N/A .30 .101957 206 206 N/A .30 .101958 256 256 N/A .40 .301959 317 317 N/A .60 N/A19?60 430 430 N/A .60 N/A1961 409 409 N/A .80 N/A1962 413 413 N/A .30 .701963 428 428 N/A .30 .801964 538 538 N/A .30 .901965 401 401 N/A .20 1.001966 368 372 NIA N/A 1.001967 415 423 N/A NiA 1.201968 323 333 N/A N:A 1.101969 403 419 N/A N/A 1.101970 413 434 .20 .70 .901971 454 477 .40 1.00 1.401972 407 427 1.30 1.20 1.701973 340 357 1.90 1.30 2.601974 376 395 2.50 1.80 3.301975 396 416 3.00 2.10 2.301976 320 339 9.00 2.70 2.101977 271 290 11.40 2.70 .801978 265 286 4.50 3.30 .801979 296 323 5.20 3.30 .801980 258 284 3.00 1.70 .401981 225 248 .70 .70 .501982 181 198 .50 .70 .601983 157 173 .50 .50 .501984 172 189 N/A N/A N/A1985 215 226 N/A N/A N/A
274

Notes to Table 1-2(3):(a) Source of cocoa production data is Cocoa Marketing Board, as
reported in the following: 1950-59, Merrill J. Batemn, 'An6ccnometric Analysis of Ghanaian Cocoa Supply,' in R. A. Kotey,C. Okali, and B. E. Rourke, Economics of Cocoa Production andMarketing, Institute of Statistical, Social, and EconomicResearch, University of 6hana, Legon, 1974, p.315; 1960-78,World Bank, 6hana: The Cocoa Sector, Background Paper No. I of 4prepared for the 6hana: Policies and Progras for AdjustsentReport, October 14, 1983, p.45; 1979-1984, World Bank, Ghana -Towards Structural Adjustment, Vol. 2: Statistical Appendix,October 7, 1985, p.57.
Ib1 Cocoa Marketing Board (ChB) estimates adjusted for smugglingunder the following assumptions:1950-65 negligible smuggling1966-70 smuggling increases from nil to 5 percent of CNB
estimates in equal annual increments1971-75 smuggling remains constant at 5 percent of CMB
estimates1976-80 smuggling increases from 5 to 10 percent of CMB
estimates is equal annual increments1981-85 smuggling remains constant at 10 percent of CHI
estimates(c) Source of data for 1950-69 is FAG Production Yearbooks; source
for 1970-83 is World Bank, 6hana Agricultural Sector Review,Annex 5, August 6, 1985, p.63.
275

INNEX 2: EQUILIERIUM EXCHANGE RkTE
This annex describes in detail the steps that were taken to
calculate the equilibriLun exchange rate (tt) for Ghana over the period
1953-84. The method consisted of estimating demand and sLtpply fLmncticns for
foreign exchange on current accoLnt and finding the exchange rate that would
have equilibrated the dollar value of imports with the value of exports in
the absence of taxes or quantitative restrictions on trade. ELefore
describing this methodology in detail, however, it is useful to consider two
alternative approaches to estimating the equilibrium exchange rate. These
are based on (1) the notion of purchasing power parity (FPF) and (2) the
elasticities of demand for imports and supply of exports, with adjLstment in
each case for chhanges in the terms of trade and the strcLture of capital
flows, debt service, and transfers.
Furchasina FPower Parity Aprroach
The Real Exchange Rate
This approach starts with the notion that it may be possible to
find a year in which the current account! eXclusive of unrequited transfers,
is more or less in balance, consistent with the structure of transfers and
capital flows, and to adiust the nominal exchange rate (NOR) for changes
from this base year in the absolute level of prices in the comntry being
studied compared with levels in its major trading partners. This "real"
exchange rate (RER) is the ratio of two sets of prices. The first is the
NOE, which is the price of one currency in terms of another; the second is
an indicator of the relative change between the two countries in the
purchasing power of each currency over goods and services priced in terms
276

of that currency. Miltiplying these two ratios together provides a measure
of the relative change in purchasing power over goods and services priced
in terms of a single currency.
The pu.rchasing power parity theory is derived essentially from a
monetary approach to balance of payments adiustment. To the extent, for
example, that monetary expansion generated a more rapid rate of inflation in
Ghana than existed in the rest of the world! and yet the exchange rate
remained fixed, the prices of nontradables in Ghana rose more rapidly than
the prices of tradables, causing consumers to shift towards the consumption
of tradables and producers to move in the direction of producing more
nontradables.1± The current account moved into deficit under these
circumstances, and since this could not be sustained over the long run
through capital flows or transfers, the existing exchange rate was not cne
of equilibrium.
In the absence of government price or trade policy, and assuming
no structLtrJl changes, equilibrium in the long rmn would have been achieved
throuLgh some crombination of a movement in the exchange rate and in the
absolute level of prices in Ghana, compared with its major trading partners,
that would have offset the original price changes caLsed by monetary
expansion and inflation. Regardless of whether it is the NER or prices
that woLld have adiusted, however, the RER would have remained the same.
I Nontradables are defined theoretically as goods and services forwhich, in the absence of government price or trade policy, prices indomestic currency are not the same as for their closest tradablesubstitutes. In practice, of course, most locally produced goods andservices are not perfect substitutes for tradable products so that thedistinction between tradables and nontradables becomes one of degree.
277

In Ghana's case, the major source of distortions was expansicnary
monetary and fiscal policy, accompanied by exchange and trade controls to
avoid balance of payments deficits. As discussed in the text, these
policies were unimportant until 1961, when declining reserves forced the
government to clamp dcwn on imports. Thereafter Ghana experienced
variations in the pace of expansionary pressutres and in the intensity of
controls, btLt the overall thru1st of these policies continued in the same
direction.
The base period chosen for application of the FFP approach is
1957-59, before these trade policies were imiplemented on a substantial
scale. The nominal exchange rate (NER) for the period from 19598 to 1985 was
adiLtsted for inflation in Ghana Lusing the nontradable consumer price index
(CPI) ,-4 and in its trading partners using two separate indexes. The first
was an index of NEs and wholesale prices in the United States and the
United f .ingdom, weighted by each country's share of the total value of
Ghana' s imports and exports in 1972. Since these two trading partners
account for only about one third of Ghana's total trade, however, a second
index employed was the Manufacturing Unit Value (MUV) index of exports by
induistrial market economies to developing countries.. 3
The resulting nominal and real exchange rates are presented in
Table 2-1 for both the official and black market rates. Comparing the two
nominal exchange rates suggests that overvaluation of the cedi became a
2 From Table 3-5(1). Annex 3. The nontradable CFPI in this tableincludes some tradable agricultural products. An alternative index was alsoused, therefore, which is restricted to nonagricultural nontradables. Sincethe prices of all locally produced food products increased quite rapidlyover the period studied, the two indices vary substantially.
: World Bank:, Economic Analysis and Projections Department.
278

Table 2-1
Exchange Rates, 1958-85(NC/$US) (a)
NomainalExchange Rate Real Exchange Rate (d) Real Exchange Rate (e) Price Indices (1958=100)
Black 6hana Non AgOfficial Market Official Black Market Official Black Market Non Trad Non Trad US/UK
Year (bl (c) (1) (2) (1) (2) (1) (2) (1) (2) CPI (f) CPI (9) WPI MUV (h)
1958 .71 .71 .71 .71 .71 .71 .71 .71 .71 .71 100 100 100 1001959 .71 .71 .72 .70 .72 .70 .72 .70 .72 .70 100 100 100 991960 .71 .71 .70 .70 .70 .70 .70 .70 .70 .70 103 103 101 1011961 .71 .71 .87 .70 .87 .70 .87 .70 .87 .70 104 104 127 1021962 .71 .71 .68 .68 .68 .68 .68 .68 .68 .68 110 110 104 1041963 .71 .56 .62 .61 .49 .48 .58 .57 .45 .44 120 129 105 1021964 .71 .58 .58 .56 .47 .46 .55 .54 .45 .44 132 138 107 1051965 .71 .65 .46 .44 .43 .41 .52 .50 .48 .46 170 150 110 1051966 .71 2.13 .42 .40 1.24 1.20 .47 .45 1.41 1.35 194 171 113 1091967 .84 1.67 .55 .53 1.09 1.06 .56 .55 1.11 1.08 173 170 113 1101068 1.02 1.75 .58 .60 1.01 1.03 .61 .62 1.05 1.07 186 179 107 1091969 1.02 1.75 .57 .59 .97 1.01 .60 .63 1.04 1.07 200 188 111 1151970 1.02 1.64 .58 .60 .92 .97 .61 .63 .97 1.02 208 197 117 1221971 1.03 1.75 .57 .58 .97 .99 .65 .66 1.11 1.12 229 202 127 1291972 1.15 1.64 .62 .64 .88 .91 .69 .72 .99 1.02 253 225 136 1401973 1.15 1.49 .56 .63 .73 .81 .65 .72 .84 .94 299 259 146 1631974 1.15 1.73 .56 .65 .85 .97 .62 .72 .93 1.07 352 319 173 1981975 1.15 1.99 .50 .56 .86 .96 .57 .64 .99 1.11 455 396 197 2201976 1.15 2.91 .31 .36 .78 .90 .43 .50 1.09 1.27 721 513 193 2241977 1.15 9.20 .14 .17 1.15 1.38 .32 .39 2.60 3.11 1634 726 205 2461978 1.51 8.96 .14 .16 .82 .93 .32 .36 1.90 2.15 2728 1179 250 2B21979 2.75 15.56 .19 .21 1.06 1.16 .43 .48 2.46 2.70 4279 1848 292 3201980 2.75 15.97 .15 .15 .89 .86 .37 .36 2.14 2.06 6491 2704 364 35i1981 2.75 26.25 .07 .07 .70 .68 .19 .18 1.79 1.74 13584 5307 361 3531982 2.75 61.67 .06 .06 1.24 1.25 .15 .15 3.36 3.38 17207 6349 346 3481983 3.45 76.58 .03 .03 .63 .65 .09 .09 2.03 2.10 39795 12339 327 3391984 35.34 135.00 .22 .23 .83 .88 .50 .53 1.92 2.02 51153 22246 316 3331985 54.05 160.00 .35 .34 1.03 1.00 .61 .60 1.82 1.77 53547 30224 343 335
27 9

Notes to Table 2-1:(a) Source is IMF, International Financial Statistics, except where otherwise noted.(b) The average official exchange rates in 1972 and 1973 were actually NC 1.32/US$ and NC
respectively, rather than the NC 1.151US5 indicated here, because of the dollar's devis-a-vis gold on February 13, 1973. During this period, however, the gold contentCedi was held constant.
(c) Source is Pick's Currency Yearbook, various issues, for 1958-83 and World Bank,6hana: Irrigation Sector Review, for 1984; Economist, 1985 Summary, for 1985.
(d) Nominal exchange rate divided by the 6hana nontradable CPI (1958=100) and multiplied b(1) a weighted average of the U.S. WPI index and the U.K. #PI index multiplied times
rate, with weights equal to the shares of the U.S. and the U.K. in total trade i(2) the Manufacturing Unit Value (MUYV index of exports by industrial market economi
developing countries.le) Nominal exchange rate divided by the 6hana nonagricultural, nontradable CPI (1958=100)
(1) a weighted average of the U.S. WPI index and the U.K. WP index multiplied tisesrate, with weights equal to the shares of the U.S. and the U.K. in total trade i
(2) the Manufacturing Unit Value (MUV) index of exports by industrial market economideveloping countries.
(f) CPI for nontradables (1958=100) from Annex 3, Table 3-5(1).(g) CPI for nonagricultural nontradables (1958=100) from Annex 3, Table 3-5(1)3.(h) Source is World Bank, Economic Analysis and Projection Departeent.
280

problem in Ghana for the first time at the end of the Nkrtuitah regime, when
exchange controls were for the first time strongly enforced. The black
market rate dropped somewhat after this, as the import program was expanded
and the official rate was increased. Nevertheless, even in 1973, when the
difference between the two rates was at a minimum, the black market rate
was almost ta) percent higher than the official rate. Afterwards the two
rates began to diverge sharply, despite repeated adjustments in the official
rate, as the black marhet rate rose very rapidly in the face of inflationary
pressures and quantitative trade and exchange controls. The distortion
finally reached a peak in 1982, when the black market rate was 22 times the
official rate. Thereafter, as the Economic Recovery Program was placed in
effect, several large devalutatlicris were announced and the pace of increase
in the black market rate slowed. Ey 1985 it was less than three times the
official exchange rate.
The importance of inflationary pressures in Ghana causing this
divergence in exchange rates appears to have been very strong. No matter
which index is used, deflating the exchange rate by relative price changes
in Ghana and its trading partners results in a drastic decline in the real
official exchange rate, at least up until 19B4. Cln the other hand, despite
some short-term fluctuations,the long-term trend in the real black market
rate is upwards, especially when deflated by the nonagricultural nontradable
CPI. This is consistent with the fact that the black market rate reflects
the rising scarcity value of foreign exchange, and perhaps also the risk
premium, in the face of increasing restrictions on imports, whereas the
increase in the price of nontradables relative to the price of tradables is
more of an indication of changes in the free trade eqLlilibriLun exchange
281

rate. It also suggests that the theory of purchasing power parity, coupled
with the maintenance of a relatively inflexible official exchange rate
through the use of direct trade and exchange controls, explains a great deal
of the distortions introduced into the Ghanaian economy.
The EquLilibrium ExchanQe Rate
The free trade equilibrium exchange rate is the exchange rate that
woxuld cause the demand for and sutpply of foreign exchange to be equal in the
absence of policy distortions such as trade taxes or subsidies, price
controls, and quantitative restrictions on imports and foreign exchange.
This does not necessarily imply that the current account would be balanced
since the foreign exchange market can include net flows of capital, debt
service, and unrequited transfers. For the exchange rate to be one of
equilibrium, however, these flows must be autonomous rather than
accorimodating and mLtst be sustainable and consistent with the country's
overall capital structLire.
To the extent that there are fundamental changes in capital flows,
debt service, and transfers, there must be corresponding adjustments in the
MR. The same is trtLe if there are structural changes in the domestic
economy, such as those associated with rising per capita income, or in the
terms of trade, since these can be expected to alter the exchange rate
necessary to achieve equLilibriLm in the absence of government price or trade
policy.
Over the period 1957-1959, as seen in Table 2-2, the average
current acconlt deficit was nil. In addition, there were virtually no
changes in foreign exchange reserves. This suiggests that the balance of
282

Table 2-2
Balance of Payments Current Account (a)
(millions 5US)
Current RealAccount Price of
Imports Other Total Exports Other Total Credit Cocoa Ce)FOB Debit (b) Debit (c) FOB Credit Credit Balance (d) ($/kg)
Year (1) (2) (3) (4) (5) (6) (7) (8)
1957 250 41 290 261 N/A N/A -29 2.391958 219 40 259 300 N/A N/A 41 3.081959 299 37 336 316 N/A N/A -19 2.701960 348 81 429 334 N/A N/A -95 2.131961 388 80 468 333 N/A N/A -135 1.741962 310 73 383 320 N/A N/A -63 1.691963 337 78 415 307 N/A N/A -108 2.011964 322 75 396 321 N/A N/A -75 1.791965 439 94 533 321 N/A N/A -212 1.301966 321 77 398 280 N/A N/A -118 1.741967 265 119 384 284 31 315 -69 1.961968 265 120 385 304 37 342 -43 2.541969 295 146 441 345 47 392 -49 3.151970 375 167 543 427 50 477 -66 2.141971 368 167 535 335 55 389 -146 1.561972 223 125 348 384 59 443 95 1.721973 372 168 540 585 69 654 114 2.511974 798 234 1,032 679 68 747 -286 2.781975 651 272 922 801 94 895 -27 1.941976 690 305 995 779 115 894 -101 3.131977 860 298 1,159 890) 131 1,020 -138 5.381978 780 321 1,102 893 105 997 -104 4.101979 803 318 1,121 1,066 99 1,165 43 3.581980 908 355 1,264 1,104 110 1,213 -50 2.601981 954 381 1,336 711 121 832 -504 2.071982 589 316 905 607 107 714 -191 1.761983 500 224 724 439 39 478 -247 2.201984 533 280 813 566 46 612 -201 2.531985 669 284 952 632 44 676 -276 2.36
Notes to Table 2-2:(a) Source is IMF, International Financial Statistics, except where otherwise noted.(b) 1957-66 Other Debit figures are actually net of Other Debit and Other Credit for that period.(c) Column (1) plus column (2).(d) For 1957 to 1966 credit balance is column (4) minus column (3).
For 1967 to 1985 credit balance is column (6) sinus column (3).(e) International Cocoa Organization average daily price in New York and London deflated by
Manufacturing Unit Value Index, (1980 constant $), froa World Bank, Commodity Trade andPrice Trends, 1985, Washington: 1985, p.44, and World Bank, Price Prospects for MajorPrimary Commodities, Vol. I: Summary and Implications, pp.31, 34.
283

payments was in eqLlilibriLVn at that time and that the NER was a reasonable
approximation for the EER except for the possible influence of policy
distortions.
Ghana's exports in 1957-1959 were subject to taxes equal to 25
percent of the average FOB value of exports. 4 Almost all these taxes were
on cocoa, the average tax rate on other exports being only 2 percent. The
tax on cocoa was not very bLurdensome, however, since world market prices at
the time were relatively highs especially in relation to those that
characterized the 1960s.6 In any case, prodLtcer prices at the time clearly
covered variable costs, and investment in cocoa trees that were producing in
1957-1959 had been made six or more years earlier when producer prices were
quite high. It is reasonable to argues therefore! that the export tax was
operating to stabilize producer prices aro.rnd a lang-run average world
market price for cocoa and was not adversely affecting production.
On the import side, the average tariff rate in 1957-1999 was 17
percent. This rate remained reasonably constant over the last half of the
i93:s and resulted in a lower level of imports than wculd have existed
withoLut the tariffs. The EER required to achieve balance of payments
' J. Clark Leith, Foreign Trade Recimes and Economic Development:Ghana, New York: Columbia University Press, 1974, p. 13.
As shown in Table 2-2w the world market price of cocoa in 1957-58averaged $2.72/kg in real terms (19W) prices); in 1960-69 it averaged$2.kY)/kg.
284

equilibrium in the long run, if these import tariffs were to have been
removed * can be estimated from'
E* ~~~~~~Eao + 4oQ
where E* is the equilibrium exchange rate
E is the nominal exchange r-ate;
t.. is the average rate of tariff, or tariff equivalents on
imports;
2', is Ghana's price elasticity of denand for foreign exchange;
C, is Ghana's price elasticity of sutpply of foreign exchange.
The demand elasticity ?, is assumed to equal 2.0:). The sLupply elasticity
£, is assumed to equal C.6, the long-run elasticity estimated for cocoa
exclusive of the effect of prices on new plantings, as described in Annex 4.
The resulting EER is .80 N2!/$US, compared with the official rate in 1957-59
of .71 Ne/$US. 7
, Derived from equation (A.1) in the Appendix assuming that there isno existing current account deficit and that the export tax does not haveany long run effect on the allocation of resources. Equation (1) doesassume, however, that exports are influ rnced in the long run by a change inthe exchange rate as long as this change is passed on to producers.
' These relatively crude estimates of the elasticities of demand forand supply of foreign exchange are used here for comparison sake only. Themore sophisticated'estimate of the equilibrium exchange rate, describedlater in this annex, takes into account new plantings and noncocoa exports,and is based on econometrically estimated demand and supply functions. TheEER for 1958 estimated with the more sophisticated model is .8B, comparedwith this cruder approximation of .90.
285

During the years since 1957-1999, the cLtrrent account balance has
fluctLuated greatly from year to year. In the early 1960s deficits were
financed by a decline in reserves and by increasing Ghana s foreign debt.
Neither of these practices was sustainable. Some foreign aid was received
to offset deficits during the late 196C0s and early 1970s, but this was
largely short-term program support aimed at helping Ghana to achieve
economic stabilization. In 1972 and 1973, Ghana enjoyed large surplUses as
a result of booming cocoa prices, but this period was short-lived as well.
Deficits were again the norm during the late 1970s and early 1980s, with
frequent sutrpluses cn trade account being more than offset by deficits
elsewhere. Again the situation was believed by both Ghanaians and its
creditors to be unsustainable, resulting in the launching of the Economic
Recovery Program in late 1962. This program called for significant foreign
aid inflows in return for policy reform, but disbursements were delayed and
would have had only a minor impact on the equilibrium exchange rate at the
end of the period under consideration. It is r-easonable to assume,
therefore, that the period from 1957-1959 to 1985 was one in which balance
of payments equilibrium was defined with the current account in balance.
The equilibrium exchange rate is also influenced by struLctural
changes in the terms of trade or in the domestic economy that are not the
result of policy induced distortions. In Ghana s case, the most obvious
example would be a long-term movement in the price of cocoa.. lthoLigh cocoa
is notoriously subject to long cyclical price changes, it is very difficult,
from the historical data shown in Table 2-2w to discern any significant
trend in its world price deflated by the Manufacturing Unit Value index of
the industrial countries.
286

Assiu1ing, for these reasons, that the EER was constant from
1957-1959 to 1985, its value of .9@3 NV/$US may be compared with the
estimates of the RER, both official and black market, shown in Table 2-1.
Alternatively, the EER can be adjusted by the same indexes used to adjust
the NER in Table 2-i to obtain a series of nominal equilibrium exchange
rates (NEER), estimated using the Fff approach, which can be compared
directly with the nominal official and black market rates, as shown in Table
2-3. It is clear from this table that the equilibrium rate over the longer
rn- increased less rapidly than the black market rate but at a mLuch greater
pace than the official rate.
Elasticities Approach
The purchasing power parity approach to estimating the equilibrium
exchange rate concentrates on the relationship between the prices of
tradable and nontradable goods and services as these change over time in
response to inflationary pressures. The elasticities approach, on the other
hand, focuses on the tradables sector. It estimates the change in the
exchange rate that wouLtd be necessary to equate the demand for and the
stpply of foreign exchange if unsLsstainable inbalances in the current
acccLunt and all distortions in the prices of tradable goods were to be
removed.
This definition of the equilibrium exchange rate implies that
equilibrium is maintained in the face of changing demand and supply
conditions by movements in the exchange rate alone and not by the government
allowing foreign exchange reserves to fluctuate or using commercial policy
to stabilize the foreign exchange market. This is especially important for
287

Table 2-3
Nominal Exchange Rates and Nosinal Purchasing Power ParityEquilibrium Rates
(NC/MUS)
Price Indices (1958100)
Nominal Exchange Rate Equilibrium lb) Equilibrium (c) Ghana--------------------- --------------- -------------- Ghana Non Ag
Black Non Trad Non Trad US/UKYear Official Market (1) (2) (1) (2) CPI (d) CPI (e) IPI HUV (f)1_56 .71 _7- -8- .80 -80 .8- 100 100 100 100
1958 .71 .71 .80 .80 .80 .80 100 100 100 1001959 .71 .71 .BO .81 .80 .81 100 100 100 991960 .71 .71 .81 .82 .81 .82 103 103 101 1011961 .71 .71 .66 .81 .66 .81 104 104 127 1021962 .71 .71 .84 .85 .84 .85 110 110 104 1041963 .71 .56 .92 .94 .99 1.01 120 129 105 1021964 .71 .58 .99 1.02 1.03 1.06 132 138 107 1051965 .71 .65 1.24 1.29 1.10 1.15 170 150 110 1051966 .71 2.13 1.37 1.43 1.21 1.26 194 171 113 1091967 .84 1.67 1.23 1.26 1.20 1.24 173 170 113 1101068 1.02 1.75 1.40 1.37 1.34 1.31 186 179 107 1091969 1.02 1.75 1.45 1.39 1.36 1.31 200 188 111 1151970 1.02 1.64 1.42 1.36 1.35 1.29 208 197 117 1221971 1.03 1.75 1.45 1.42 1.27 1.25 229 202 127 1291972 1.15 1.64 1.50 1.45 1.33 1.29 253 225 136 1401973 1.15 1.49 1.64 1.47 1.42 1.29 299 259 146 1631974 1.15 1.73 1.64 1.42 1.48 1.29 3.52 319 173 1981975 1.15 1.99 1.85 1.66 1.61 1.44 455 396 197 2201976 1.15 2.91 3.00 2.59 2.14 1.84 721 513 193 2241977 1.15 9.20 6.40 5.34 2.84 2.37 1634 726 205 2461978 1.51 8.96 8.75 7.76 3.78 3.35 2728 1179 250 2821979 2.75 15.56 11.78 10.74 5.09 4.64 4279 1848 292 3201980 2.75 15.87 14.30 14.85 5.96 6.19 6491 2704 364 3511981 2.75 26.25 30.17 30.93 11.79 12.08 13584 5307 361 3531992 2.75 61.67 39.94 39.74 14.74 14.66 17207 6349 346 3481983 3.45 76.58 97.76 94.38 30.31 29.26 39795 12339 327 3391984 35.34 135.00 130.16 123.49 56.61 53.70 51153 22246 316 3331985 54.05 160.00 125.19 128.32 70.66 72.43 53547 30224 343 335
Notes to Table 2-3i(a) From Table 2-1.(b) Equilibria exchange rate in 1958 of .803 multiplied by
(1) the ratio of the nontradable CPI for 6hana to the index ofwholesale prices for the US and UK derived in Table 2-1.
(2) the ratio of the nontradable CPI for 6hana to the MUV indexof industrial countries shown in Table 2-1.
(c) Equilibrium exchange rate in 1958 of .803 multiplied by(1) the ratio of the nonagricultural,nontradable CPI for Ghana to the index of
wholesale prices for the US and UK derived in Table 2-1.(2) the ratio of the nonagricultural, nontradable CPI for Ghana to the MUY index
of industrial countries shown in Table 2-1.(d) 6hana Non-Tradable CPI, from Table 3-5(1), Annex 3.(e) Ghana Non-Agricultural, Non-Tradable CPI, from Table 3-S(1), Annex 3.(f) Manufacturing Unit Value Index, (1958 constant S), from World Dank, Commodity Trade and
Price Trends, 1985, Washington: 1985, p.44, and World Dank, Price Prospects for MajorPrimary Commodities, Vol. I: Summary and lplications, pp.31, 34.
288

a country such as Ghana that is highly dependent upon an exported conmodity
subject to large variations in domestic supply and world market prices. The
Cocoa Marketing Eoard was established$ in fact, principally to stabilize
prices and incomes to producers so as to avoid resources being continually
reallocated on the basis of short-term market considerations. Similarly,
the Ghanaian government has over the years attempted to use its foreign
exchange reserves as a buffer against wildly fluctuating export revenues.
The problem, of course, is that it is very difficult to
distinguish between current accoLnt deficits/surpluses and conmercial
policies, such as the effective export tax on cocoa, that are maintained for
stabilization purposes and those that are not. The Cocoa Marketing Board's
stabilization function, for example, has for many years been overshadowed
by its role in raising government revenue. It is always possible, of
cutrse, to establish a range within which the current account balance or the
prices of tradable gcods might fluctuate withcLtt influencing the equilibrium
exchange rate, but this woltld be fairly arbitrary and the basis for
establishing the range would be disputable. It seems preferable, therefore,
to estimate the equilibriLm exchange rate by correcting the actual exchange
rate for all unisustainable current account imbalances and distortions in the
prices of tradable goods, but to avoid drawing policy concluLsions from year
to year changes in the equilibrium rate.
The foraLila for estimating the equilibrium exchange rate using the
elasticity approach, where these elasticities are defined with respect to
the distorted economy, is given by'
S See the Appendix to this annex for the derivation of this equation.
289

(M-X) + XE. +gE* )E* )
Xi, Mfl
1-t. l+tl.
where M is the demand for foreign exchange on current account;
X is the supply of foreign exchange on current accoLnt;
t. is the tax rate on exports.
The demand for and supply of foreign exchange M and X, are "total debits,"
and "total credits", respectively, of the current account from Table 2-2.
The elasticities E, and 7. retain the same values assLumed earlier.
The tax rate on imports, t,- is available from Leith for the
period from 1957 to 1971.9 With the imposition of import controls in 1961,
however, domestic prices of importables rose above the levels of the tax
adjuisted border prices becautse of the qutota premium created by import
scarcity. Direct com,parisons of domestic and border prices for manufactured
importables are available for 1972 and 1985 only.3 0 They sLugest that the
average nominal protection coefficient (domestic price/border price) for
agriculture and industry in 1972 was 1.60; in 1985, the comparable figure
9 Leith, Foreign Trade Reaimes ... , p. 1 1 .
° Scott R. Pearson, Gerald C. Nelson.! and J.Dirck Stryker,"Incentives and Comparative Advantage in Ghanaian Industry and Agriculture,"1979, and P-E International Operations Ltd in Association with ThomasW. Allen & Associates Ltd, Trade Liberalization and Incentives for IndLustrin Ghana, January 1966, Volume II, p. 109.
290

for a weighted average of industrial prodLucts was 1.53.1L In each case,
h-owever, these coefficients are based on a sample of price comparisons that
may not represent very well the entire range of traded goods.
In order to estimate the tax equivalent rate when import and
exchange controls were binding, therefore, the tariff rate of 17 percent for
1960 was extrapolated over time by mu(ltiplying by the ratio of two indexes,
each set to base year 1972: (1) a weighted average of Ghana' s Consumer Price
Index for tradable categories of goods (see Table 3-5(1)) in Annex 3) and
(2) the Manufacturing Unit Value (MUV) index of exports by industrial market
economies to developing coiuntries multiplied times the official exchange
rate. The tradable CPI for Ghana inclLtdes nontradable fcods, such as
cassava and yamns, but the prices of these have moved very closely with those
of tradable foods. The CPI is only available by category back to 1963, so
the overall index was used for 1956-62. The Manufacturing Uhit Value (MIJ)
index was used rather than the weighted average of wholesale price indexes
because, as noted above, the two give very similar results and the MUV index
covers a br-oader spectrum of Ghana's trading partners.
Leith' s import tax rates were used for the years 19586-6). After
this the tariff equivalent rates calculated as described above were Lised
since they r-ose to more than double the actual tax rates in 1965 and 1966,
after which the difference between the two narrowed considerably under the
'1 The figure for 1972 of 1.60 is the mean of the unweighted averageof 1.37 for agriculture and the weighted average of 1.51 for industry, withthe weights being the output of firms in the industrial sample, multipliedtimes the ratio of the exchange rate used to calculate this coefficient(NV 1 .2E/*US) to the 1972 exchange rate used here (N 1. 15/SUS). Theuinweighted average reflects quite well the relative proportions of thesesectors in total consumer goods imports in the early 1970s. Daring 1970-72,food products constituted 48 percent of total consumer goods imports. WorldBank, Ghana: Towards Structural Adjustment, October 7, 1985, Vol II, p.22.
291

new govemaent's liberalization policies. Beginning about 19764 however,
increasing overvaluation of the cedi resulted in a strong upward movement in
the tariff equivalent rate that was checked only by devaluaticn in 1984 and
1985. The. estimated value of the tariff equivalent rate in 1985 is 216
percent. Given the enormous distortions that have occurred over the past 25
years, it is encouraging that this is not too far from the observed tariff
equivalent rate in 1985 of 53 percent, which is not the result of a random
sample and may therefore be considerably in error.
The average tax rate on cocoa exports was calculated from Amnex 3
on the basis of producer prices, marketing board costs, and FOB prices.
Other exports were subject to a variety of taxes and subsidies, none of
which was ever greater than 2) percent. An assumed average tax rate of
zero on these exports is probably not too ffLch in error. The average tax
rate on total exports was estimated as a weighted average of the rates on
cocoa and other exports. This average rate was positive in all years but
two and normally fluctuation between 10 and 34 percent despite the
decreasing real value of the cedi.
Table 2-4 shows the estimation of the equilibrium exchange rate
using the elasticity approach. The results suggest a substantial
overvaluation of the exchange rate, especially after the mid-1970s, but the
degree of overvaluation is much less than that indicated using the FFP
approach. One reason for this is that equation (2) is valid only for small
movements away from the distorted sitLuation. DisequilibriLm in Ghana,
however, has been enormous and clearly violates this assumption.
One way of handling this problem is to estimate the equilibrium
exchange rate at the mid-point between the distorted and Lndistorted
292

Table 2-4
Estimation of the Equilibriue Exchange RateUsing the Elasticities Approach
Current Account Import Tax Export Tax Nominal Equilibrium Exchange Rate----------------------- Tradable "UV Equivalent Rate on Total Exports of Official ----------------------------Debit (a) Credit (a) CPI (b) Index(c) Rate (d) Cocoa (e) Exports (f) Cocoa (f) Export Tax Exchange Rate Distorted(i) Nid-pointli)
ueill tUS) (mill lSS) 11972=100) (1972 1001 3() (5) (mill NC) (sill NC) Rate (g) (NC/SUS) (hi (NC/$US) (NC/3USIYear (1) (2) (3) (4) (5I (6) (7) (8) (91 (10) (11) (12)
1958 259 300 39 44 le 50 209 125 30 .71 .67 .701959 336 316 39 44 15 41 226 138 25 .71 .75 .761960 429 334 40 45 17 24 232 133 14 .71 .85 .851961 408 333 40 45 19 19 230 139 11 .71 .89 .921962 383 320 43 46 23 230 134 13 .71 .86 .881903 415 307 46 45 35 31 218 136 19 .71 .94 .991964 396 321 51 46 47 18 229 136 11 .71 1.00 1.051965 533 321 67 47 8a 12 227 137 7 .71 1.35 1.451966 398 280 76 48 109 32 191 103 17 .71 1.31 1.441967 384 315 68 57 58 47 245 131 25 .84 1.17 1.261968 385 342 74 69 42 56 339 186 31 1.02 1.24 1.341969 441 392 80 73 45 59 333 221 39 1.02 1.19 1.321970 543 477 63 77 43 42 467 300 27 1.02 1.27 1.361971 535 389 91 82 48 45 496 204 19 1.03 1.48 1.561972 348 443 100 100 32 38 565 291 20 1.15 1.16 1.281973 540 654 120 116 36 SO 730 397 27 1.15 1.17 1.311974 1032 747 140 141 32 52 840 466 29 1.15 1.46 1.541975 922 895 184 157 55 36 928 551 21 1.15 1.48 1.601976 995 894 299 159 149 59 951 516 32 1.15 1.90 2.331977 1159 1020 686 175 419 39 1166 680 23 1.15 2.85 4.421978 1102 997 1206 265 502 60 1581 988 37 1.51 3.32 6.331979 1121 1165 1856 545 350 33 2737 1846 22 2.75 5.70 8.821980 1264 1213 2802 598 520 -20 3458 1942 -11 2.75 8.56 12.581981 1336 832 6199 601 1264 -244 2924 1091 -91 2.75 22.11 31.591982 905 714 7616 593 1599 25 2402 1053 11 2.75 11.37 31.901983 818 507 17406 724 3080 22 6999 3989 13 3.45 19.45 79.131984 N/A N/A 23085 7282 319 11 N/A N/A N/A 35.34 N/A N/A1985 N/A N/A 24117 NIA N/A 7 N/A N/A N/A 54.05 N/A N/A
Notes to Table 2-4:(a) Froe Table 2-2; credit figures for 1958-1966 are export earnings, FOB.(b) From Table 3-5(11.(c) Nanufacturing Unit Value Index multiplied by the Nominal Official Exchange Rate, from Table 2-1,
and set at base year 1972 100.(dl Source for 1958-1961 is J. Clark Leith, Foreign Trade Regises and Economic Development: Ghana, New York:
Columbia University Press, 1974, p1i. For other years, the rate for 1972 was adjusted by the ratio of coluen(3) to column (4). The rate for 1972 was taken froe Scott R. Pearson, Gerald C. Nelson, and J. Dirck Stryker,'Incentives and Comparative Advantage in Ghananian Industry and Agriculture', 1979.
(e) Calculated as I - (Rendered Port Price of Cocoa/FOB Price of Cocoa) times 100. The Rendered PortPrice of Cocoa is from Table 3-3(2), the FOB Price of Cocoa is from Table 3-4(3).
(f) International Monetary Fund, International Financial Statistics Yearbook 1985, pp.310-311.(g) A weighted average of the export tax rate on cocoa in column (6) and of zero for other exports, where
the weights are the value of cocoa and of other exports calculated from columns (7) and (8).lh) Fros Table 2-1.(xl Calculated from equation (9) using the following elasticities: demand 2.0, supply 0.6.(j) Calculated as described in the Annex 2.
293

situation assuming a constant arc elasticity. Solving for E*, in this
case, involves a very complex qLtadratic equation that requires the use of an
iterative process. The details of this calculation are explained in the
Appendix. The results, presented in Table 2-4, suggest that the equilibrium
exchange rate was sutbstantially higher towards the end of the period than
indicated by the EER calculated using the distorted situation as the base
period. The mid-point estimate is generally stbstantially less than the
black market r-ate.
EqUilibrium Exchange Rate MDdel
The elasticity approach suffers from the weakness of its empirical
base and from the fact that it does not capture the complexity of the demand
for and suLpply of foreign exchange in Ghana. Consequently, an alternative
approach used was to estimate these functions econometrically from
time-series data and to solve the resulting system of equations for the
exchange rate that wcould have prevailed if no distortions had existed and
the current account had been in balance each year.
Import Demand FLnction
The demand for imports in Ghana is related to the domestic price
of tradables relative to that of nontradablees and to real GDF. Since
imports have been highly controlled in Ghana, lowever, it has been the
domestic price of tradables relative to that of nontradables, rather than
the level of imports, that has varied in response to changing import
demand. In addition, the domestic production of foodstuffs, as influenced
294

by weather and other factors, has had an important influence an the demand
for imports.
The following import demand equation was estimated using annual
data from 1963 to 19873.
Pt M Yln 4.=23 - .6C4 In + 2.321 In - 2. 372 ln ... (3)
PF,, (1.845) (.211) P. (.26:)) PF^ ( 503)
R = .84 D.W. = 1.495
where P, is the domestic price of tradables (Table 3-5(1))
Pot is the domestic price of nontradables (Table 3-5(1))
M is the dollar value of cUrrent accoitnt debits (Table 2-2)
P. is the Manufacturing LUnit Value index (Table 2-1)
Y is GDP (Economic Pialysis and F'rojections Department, World Bank)
Q0, is -an index of food producticon (Table 7)
The coefficienits of this equation are all highly significant. The implicit
elasticity of demand for imports is 1.85, which is quite close to the
elasticity cf 2 assLuted earlier.
Exoort SLtpply Functions
Two export supply functions were estimated. That for cocoa is
presented and discussed in Annex 4. Independent variables in the equation
include the current official producer price of cocoa, the previouLs year's
market price for maize, the quantity produced of cocoa the previoLus year,
and the "normal" level of production given the existing stock of cocoa
trees. The last variable is estimated using a "vintage-matrix" model
described in the annex, which takes into acccLnt the number of cocoa trees
295

of different ages, their yields over time, and the rate of new planting,
which is partly a fLnction of price.
The second sutpply fLinction is for timber, gold and other
exports. Its estimation required the construction of an export quantity
index and a domestic price index for exports. The former uses world prices
in 1972 as weights, and the latter weights domestic prices by the 1972
export quantities. The domestic pr-ice index was derived by adjLsting timber
and other export prices for the tax. or sutbsidy on exports and by
incorporating the published domestic price of gold. It is deflated by the
price index for nontradables, as is the other independent variable! GDP.
The estimated equation is
PQ GDPIn XQ. = 7.716 + ..3-5) ln . .- .94C) ln
(.742) (.137) P^_ (.229) P., ... (4)
R = .466 D.W. = 1.73.9
where X. is the quantity index for noncocoa exports, and P. is the index of
domestic prices of these exports.
Adjustment for Monopoly Power
At the beginning of the period Lnder consideration, Ghana
accounted for abouLt 40 percent of the world's cocoa trade and thus was able
to influence world prices through its export tax policy. To maximize
national inccae, therefore! Ghana shotuld have applied an optimal export tax
on cocoa., and the model of the equilibriLum exchange rate should incorporate
this tax.
296

If it can reasonably be ass-mied that Ghana exports all of its
cocoak* so that domestic consLunption is Lunaffected by the export tax, Ghana
would optimize its position by setting marginal revenue on the world market
equal to marginal cost at home. Marginal revenue (OvfR) in turn! is given by
dTR X<, dF.MR = ~ = Pw + ... (5)
dX, dX,
where TR is total revenue, X. is Ghana's exports of cocoa, and P. is the
world price of cocoa. Assuming perfect competition among cocoa farmers,
marginal cost is equal to the domestic price (Pd) adjusted for the export
tax rate (t).,
Pd = P. (1-t) ... (6)
Dividing by P., yields
d F'/P,(1-t) = 1 + . .. (7)
(dXi - dX=)
X,s
where X. is total world exports and X. is exports of competing coLuntries.
Manipulation of equation (7) yields
(1-t) = 1 +
I ( 1-5) . .. (B)
s s
where e.. is the world's price elasticity of demand for cocoa, and E( is the
conpetitorss elasticity of supply.
It is assLuned that Ghana optimally chooses a tax rate that takes
into account competitors' long run supply responses over a period of about
10 years. These have been estimated for Brazil, the Ivory Coast, and
297

Malaysia at 0.5V6 1.15, and 3.0 respectively."' The Malaysian estimate is
high, however, due to low levels of production. Using the roughly equal
shares of the Ivory Coast and Brazil in the world cocoa mar.-et during the
early 1970s, the average long run sutpply elasticity of competitors may be
estimated at about 0.9. With the world's demand elasticity estimated at
approximately -:).3' and Ghana's share of the market at the beginning of the
period being about *:) percent, the optimal export tax derived u-sing equation
(8) would have been 47.6 percent. The optimal tax varies, however, as
Ghana's share in the world mark.:et changes.
The Exchanae Rate Model
The import demand function, cocoa sutpply fLunction, and noncocoa
export supply function were each incorporated into a simulation model that
calculates the exchange rate that equates the demand for and supply of
foreign exchange assLuming that the only trade distortion is the optimal
ex.port tax, which is calculated from equation (8) with Ghana's share of the
world market allowed to vary with the quantity of cocoa it exports.
Otherwise domestic prices equal world prices times the equilibrium exchange
rate.
Before looking at the results of this analysis it is useful to
recall scme of its limitations. First, the consequences of Ghana's actions
on the world market are modelled in a very simple way. A more comprehensive
X T. Akiyama and A. Etwers, SUDVplv Response of Cocoa in MajorFroducing Countries, Division Working Paper No. 1964-3. Ccmmcdity Studiesand Projections Division, World Bank, April 1984, p.25.
t Takamasa Akiyama and Ronald C. Duncan, kialvsis of the World CocoaMarket, World Bank Staff Commodity Working Faper No.8, 1982, p.13.
298

analysis might link Ghanaian policy with the World Bank's cocoa model.
Second! only the effects of changes in relative prices are taken into
accoLtnt. Maintenance of equilibriLn would also have had enormots
conseqLIences for GDP, and possibly also the production of food.
Despite the limitations, the results are interesting, especially
in comparison with the other exchange rates shown in Table 2-5. These
inclutde the official exchange rate, the black market rate, the equilibrium
rate calcLilated utsing the FPFf approach (with two different definitions of
the nontradable CPI), and the equilibrium exchange calculated using arc
elasticities. First, there is a fairly close correspondence in most years
between the equilibrium rates calculated from the model and uLsing the
elasticity approach. Second, both of these tended to be greater than the
black: market rate prior to 1966, but less than that rate thereafter. This
reflects the increasing importance of exchange controls during the early
196)s. Finally, these two eqLuilibrium rates were generally greater than the
PFP rates until 1972. at which point the diverging relative price trends
became increasingly important, and the FFF rates tended to bracket the other
two rates.
299

Table 2-5
Nominal Exchange Rate and AlternativeNominal Equilibrium Exchange Rates
(NC;USS)
Black Equilibrium (b)Official Market ------------------------------
Year (a) la) (1) (2) (3) (4)
1958 .71 .71 .80 .80 .70 .881959 .71 .71 81 .81 76 .991960 .71 .71 .82 .82 .85 1.151961 .71 .71 .81 .81 .92 1.301962 .71 .71 .85 85 .88 1.171963 .71 .56 .94 1.01 ,,99 1.171964 .71 .58 1.02 1.06 1.05 1.301965 .71 .65 1.29 1.15 1,45 2.051966 .71 2.13 1.43 1.26 1.44 1.581967 .84 1.67 1.26 1.24 1.26 1.241968 1.02 1.75 1.37 1.31 1.34 1.511969 1.02 1.75 1.39 1.31 1.32 1.46197¢0 1.02 1.64 1.36 1.29 1.36 1.571971 1.03 1.75 1.42 1.25 1.56 1.551972 1.15 1.64 1.45 1.29 1.28 1.431973 1.15 1.49 1.47 1.28 1.31 1.351974 1.15 1.73 1.42 1.29 1.54 1.471975 1.15 1.99 1.66 1.44 1.60 1.661976 1.15 2.91 2.59 1.84 2.33 2.061977 1.15 9.20 5.34 2.37 4.42 4.171978 1.51 8.96 7.76 3.35 6.33 6.291979 2.75 15.56 10.74 4.64 8.82 8.311980 2.75 15.87 14.85 6.19 12.58 13.711981 2.75 26.25 30.93 12.08 31.59 36.451982 2.75 61.67 39.74 14.66 31.90 42,411983 3.45 76.58 94.38 29.26 79.13 81.791984 35.34 135.00 123.49 53.70 N/A 107.471985 54.05 160.00 128.32 72.43 N/A N/A
Notes to table 2-5;(a) Official and black market nosinal rates from table 2-3.(bl Purchasing power parity equilibrium rates calculated in the
the following manner:(1) Equilibrium rate in 1958 of .803 tultiplied by the ratio
of the nontradable CPI for Ghana to the hUV index ofindustrial coutnries, from table 2-3.
(21 Equilibrium rate in 1958 of .803 multiplied by the ratioof the Non-Agricultural, Non-Tradable CPI for Ghana to theMUV index of industrial countries, from table 2-3.
(3) Mid-point elasticity equilibrium rate, from table 2-4.(4) Equilibrium exchange rate estimated by the simulation eodel.
300

AFENIX TO gNEX 2: DERIVATION OF A FCF'LJ FOR ESTIMTING THEECUILIERILM EXCF4GE RATE USING WhE ELAsTICIY AFfAcH
The general fornmtla for estimating the equilibrium exchange rate
using the elasticity approach is the followingA 4
(M-X) + X + ME* =( ) E ... (A.1)
Xe Mn
1-t. l+t,
where E* is the equilibrium exchange rate;
E is the actual exchange rate;
M is the actLtal level of imports;
X is the actual level of exports;
t., is the tax equivalent rate on imports;
t. is the tax equivalent rate on exports;
l is the elasticity of demand for imports;
E is the elasticity of stpply of exports.
This foramula is derived by considering the relative rates of
change in import and export prices that would occur if the economy moved
from a distorted situation to free trade equilibriLm.
'4 Maurice Schiff, "Note 1," January 23. 1986, p.16.
301

dPm d (1+tm) E= .... (A.2)
Pm ( l+tm) E
dP, d (1-t.) E
P. (1-tt) E
These relative prices changes can be substituted into an equation showing
the relationships between changes in exports, changes in imports, and the
initial trade balance as the economy moves towards eqLtilibrium.
dX -dM = M - X
d (l-t.) E d (1+tm ) EXF- M171=1M- X ...(A.4)
(1-t,) E (1+t.) E
For small changes, this formrulation can be represented by
E* - (1-t,) E E* - (l+tm) EXs - M=M -X ... (A.5)
(1-tw) E (1+t.) E
which can be solved for E* to obtain equation (A.1).
The only problem with equation (A.1) is that it expresses rates of
change at the quantities and prices that prevail in the distorted situation,
and it may not be very relevant over large changes. One alternative would
be to express all price and quantity changes with respect to the equilibriuM
situation in the absence of trade taxes and quantitative controls. In this
case equation (A.5) becomes
E- (1-t,)E E* - (t+tm)EX*S - -M *? = (M1- X) . (A.6)
ES E3
302

where X* is the equilibriLun level of exports and M* is the equilibrium level
of imports. Since X* and M* are not knawn, expressions for them mLtst be
introduced into eqLlation (A.6). These expressions are derived from
E* - (1- t) EX* - X = X*£.(A.7)
E*
E* - (i+t,) EM* - M = *77 ... (A.8)
E*
Solving for E* we obtain
?1(i+tm) X + E(1-t)ME= E ... (A.9)
(1+1) X - (1-.)M
where q=|q I
Table 2-5 in Annex 2 suqgests that the ratio E*/E is consistently
greater when the equilibrium situation is used as a base rather than the
distorted prices and quantities. A more appropriate procedure, however,
would be to choose values that lie between these two extremes. One
possibility would be to average the equilibrium exchange rates obtained from
equations (A.1) and (A.9). Another woLld be to use mid-point prices and
quantities calculated as linear averages. Equation (A.5) in this instance
becomes
E* - (1-t,) E E* - (1+t.)E(X+X*)f - (M + M*)I= (M - X) ... (A.10)
(1-t.)E + E* (1+tm)E + E*
Expressions for X* and M* must be derived in a manner similar to that used
when the equilibrium period was used as a base. Solving for E*, however,
303

involves a quadratic equation that is very complex. An alternative
procedure is to solve the following equation, derived from equation (A.10),
for E* using an iterative process:
(E*(l+E) + (1-t.)E(1-))X (E*(i+n)+(l+tm)E(1?1)) M= 0 ...(A.11)
E*tl-I)+tl-t.E(l+L) E*(l-I)+(l+t.,,)Et1+1)
By introducing different values of E* into the left hand side of this
equaticn! it is possible to arrive at that value which comes closest to
satisfying the eqLtation.
304

ANNEX 3: DERIVATION OF FRICES AMD FRICE INDICES
This annex contains the original wholesale prices (Table 3-1) and
official producer prices (Table 3-2) upon which the analysis is based.
These are adjusted to the producer and consuner levels in Tables 3-3(1) and
- (2). Border prices and their consLmer and prodLtcer price equivalents are
presented in Tables 3-4(i) through 3-4(3). Finally, Table 3-5(1) contains
the varioLus price indices used in the analysis. Notes to the tables give
details regarding sources and methods used in deriving the estimates.
305

Table 3-1
Wholesale Market Prices(NC Per Metric Ton)
(a) (b)
6round- Ground- Coconut PalsYear Maize Rice Sorghum Millet Cassava Yam Cocoyae Plantain nuts nut Oil Oil Oil Cowpea1950 N/A N/A N_A N/A N/A N/A N/A N/_ N/A N/_ N/A N/A N/A
1950 N/A N/A N/A N/A N/A N/A N/A N/A N/A N/A NIA N/A N/A1951 N/A N/A N/A N/A N/A N/A N/A N/A N/A N/A N/A N/A N/A1952 N/A NIA NIA NIA N/A NIA NIA NIA NIA N/A NIA NIA N/IA1953 58 165 77 N/A N/A 64 54 NIA N/A N/A N/A N/A N/A1954 49 153 89 N/A N/A 58 64 N/A N/A NIA N/A N/A N/A1955 47 135 65 N/A N/A 62 N/A N/A N/A N/A N/A N/A N/A1956 57 138 67 N/A N/A 66 49 N/A NIA N/A NIA N/A N/A1957 38 138 77 N/A N/A 62 N/A N/A NIA N/A N/A NIA N/A1958 53 137 88 N/A N/A 68 49 NIA N/A N/A N/A N/A N/A1959 43 125 88 N/A N/A 64 58 N/A N/A N/A N/A N/A N/A1960 42 106 56 N/A NIA 65 48 N/A NIA N/A N/A N/A N/A1961 62 105 75 N/A N/A 65 63 N/A N/A N/A N/A N/A N/A1962 61 100 100 N/A N/A 70 60 N/A N/A N/A N/A N/A NIA1963 67 184 108 110 28 63 58 N/A 166 N/A N/A N/A 1241964 86 151 124 124 29 66 58 N/A 202 N/A N/A N/A 1451965 110 203 146 148 48 81 95 N/A 289 N/A NIA NIA 2121966 112 205 149 159 44 91 99 N/A 233 N/A N/A N/A 2081967 62 195 116 124 34 79 84 N/A 195 N/A N/A N/A 1541968 100 192 119 117 35 84 95 N/A 253 N/A N/A N/A 1741969 148 242 172 175 44 94 97 N/A 274 N/A N/A N/A 2231970 117 269 172 174 43 95 68 N/A 288 855 598 505 2131971 120 278 182 187 56 114 84 82 283 773 630 571 2411972 173 376 207 213 66 123 93 75 313 826 723 754 2731973 185 451 291 274 67 150 117 111 435 1276 1061 1015 3241974 201 496 309 317 79 192 140 157 549 1533 1384 1174 5171975 250 680 316 313 122 263 144 145 656 1976 168B 1653 5361976 570 1395 793 779 259 380 224 295 1241 3392 2057 2422 8561977 1190 1973 1767 1292 655 791 932 880 2380 6723 5309 4251 17451978 1214 2681 1933 2008 611 1299 1120 1465 3932 11852 10254 9868 22081979 1720 3052 2335 2408 712 1612 1378 1462 5810 15232 13764 12179 42191980 4141 8257 6819 5357 1526 2412 2132 2145 8458 25852 19715 18779 73781981 7751 11914 9558 9494 3741 4257 4448 3318 18210 49503 32691 2935B 181241982 7991 22095 13123 13539 4217 5942 6234 4604 29059 75880 53783 52023 207431983 36734 59797 39116 34577 14933 15434 22927 15306 53141 185773 121827 97986 585571984 23378 82011 47478 47838 9306 17301 22421 19562 69927 N/A N/A N/A 677401985 19817 50971 N/A N/A 7895 68257 N/A N/A N/A N/A N/A N/A N/A
306

Notes to Table 3-1:(a) Source for 1963-1983 and 1985 is Economics and Marketing Division,
of Agriculture, 6hana. Wholesale Market Prices are unweighted 12-monthaverages of prices in Accra, Kumasi and Tamali.
Data for 1953-62 are kccra average prices adjusted by the ratio of Accra tonational average prices over 1963-65.
1984 data are froe Ibrld Bank, 6hana: Towards Structural Adjustment, October 7,1985, Vol. 11, p.87.
(b) 1963-69 data are from IRD, The Current Econosic Position and Prospectsof Ghana, Vol 11, Annexes to the Main Report, October 26, 1970, Table 16.
1970-83 data are from World Dank, Ghana Agricultural Sector Review, January 15,1985, Annex 2, p.60.
1984 data are from World Bank, Ghana: Towards Structural Adjustment, October 7,1985, Vol. 11, p.87.
Source for 1985 is Ministry of Agriculture, 6hana.
307

Table 3-2
Official Producer Prices(a)(NC Per Metric Ton)
Cocoa SeedYear Beans (a) Cotton (bh Tobacco (bl_ - -- - - - -- - -- -_-------_-__ -_
1953 269 N/A N/fl1954 287 N/A N/A1955 299 N/A N/A1956 280 N/A N/II1957 269 N/A N/A1958 239 N/A N/IA1959 224 N/A N/A1960 224 NIA N/A1961 224 N/A N/A1962 220 NIA N/A1963 202 N/A NI/f1964 187 N/A N/A1965 187 N/A N/A1966 224 N/A N/A1967 254 N/A N/A1968 284 N/A N/A1969 293 N/A N/A1970 293 10 8101971 293 180 9601972 366 180 11101973 439 180 11801974 489 220 11901975 585 220 17701976 732 770 1860i1977 1333 770 210C01978 2667 1320 35601979 4000 1320 58501980 4000 1320 107301981 12000 1320 250001982 12000 1320 250001983 20000 10710 800001984 30000 N/A N/A1985 56600 N/A N/A
Notes to Table 3-2:(a) Source is Cocoa Marketing Board,
Annual Reports, 1952-1968, andWorld B8nk, 6hana: TowardsStructural Adjustaent, October 7,1985, Vol. 11, p67.
(b) Source is World Bank, 6hana: AgriculturalSector Review, August 6, 1985, p60.
308

TABLE 3-3(1)
Structure of Dosestic PricesINK per Metric Too)
Maize Rice Sorghum
Collection, Collection, Collection,Producer Processing, Wholesale Retail Retail Producer Processing, Wholesale Retail Retail Producer Processing, Woblesale Retail RetailPrice (a) Ostrho. (bI Price (cl Margin (d) Price (e) Price (a) Ostrbn. (b) Price (c) Margin (d) Price (el Price (a) Dstrbn. (b) Price (c) Mlargin id) Price (e)
Date (1) (2) (3) (4) (5) (6) (7) (8) (9) (10) (ll) (12) (13) (14) 115)… - - - - - - - - - - - - - - - - - - - - - - - - - - - - - - - - - - - - - - -- - - - - - - - - - - - - - - - - - - - - - - - - - - - - - - - -
1953 46 12 58 9 67 130 35 165 25 190 61 16 77 12 Be1954 37 13 49 7 57 118 36 153 23 176 72 17 89 13 1021955 34 13 47 7 54 99 36 135 20 155 48 17 65 1o 741956 44 13 57 9 66 100 38 138 21 158 49 is 67 10 771957 25 13 38 6 44 101 39 138 21 159 59 18 77 12 891958 39 13 53 8 61 100 30 137 21 158 70 18 Be 13 1011959 29 14 43 6 49 86 39 125 19 143 70 18 Be 13 1011960 29 14 42 6 49 69 39 108 16 124 38 19 56 a 651961 47 15 62 9 71 63 42 105 16 121 55 20 75 it 861962 44 16 61 9 70 54 46 100 15 115 19 21 100 15 1151963 50 17 67 10 77 137 47 184 28 211 85 22 108 16 1241964 66 19 86 13 98 97 54 151 23 174 99 215 124 19 1431965 86 24 110 16 126 135 68 203 30 233 114 32 146 22 1691966 85 27 112 17 129 128 77 205 31 236 113 36 149 22 172
o ~~~~1967 37 25 62 9 71 125 70 195 29 224 83 33 116 17 1341968 73 27 10o 15 115 116 76 192 29 221 83 36 119 18 1361969 119 29 148 22 170 160 82 242 36 278 134 38 172 26 1981970 87 30 117 18 135 185 84 26 40 310 133 40 172 26 1981971 07 33 120 10 138 106 92 278 42 320 138 43 182 27 2091972 137 36 173 26 198 275 101 376 56 433 159 48 207 31 2381973 142 42 185 29 212 332 119 451 68 519 235 56 291 44 3341974 151 s0 201 30 231 355 141 496 74 571 243 66 309 46 3561975 185 65 250 37 287 497 183 680 102 782 230 86 316 47 3611916 469 101 570 86 656 1109 286 1395 209 1604 659 134 793 119 9121977 970 220 1190 178 1368 1355 618 1973 296 2269 1477 291 1767 265 20321978 834 380 1214 182 1396 1611 1070 2681 402 3083 1430 503 1933 290 22231979 1134 587 1720 259 1979 1399 1652 3052 458 350 1558 776 2335 350 2685(980 3261 B81 4141 621 4763 5777 2480 8257 1238 9495 5654 1165 6919 1023 78421981 5845 1907 7751 1163 8914 6545 5368 11914 1787 13701 7035 2523 9558 1434 109921982 5659 2332 7991 1199 9190 15530 6565 22095 3314 25409 10038 3085 13123 1968 150921983 31537 5197 36134 5510 42245 45165 14632 59797 8970 68767 31239 6876 38116 5717 438331984 16118 7260 23378 3507 26885 61571 20440 82011 12302 94313 37872 9606 47478 7122 546001985 11819 7998 19817 2973 22790 28453 22518 50971 7646 58617 NIA 10582 N/A N/A N/A
…-- - - - - - - - - - - - - - - - - - - - - - - - - - - - - - - - - - - - - - - - - - - - - - - - - - - - - - - - - - - - - - - - - - - - - - - - - - - - - - - - - - - - - - - - - - - - - - - - - - - - - - - - - -Notes to Table 3-3(1):
(a) Calculated by subtracting column 12) fros column (3).(bI Calculated for 1975 from worksheets for World Baok,
Western Africa Regional Project: 6hana, Part 11,November, 1984; adjusted by overall CPI (1975'100lfor other years.
(c) Fro& Table 3-1.Id) .15 times column 131. Based on comparison of actual
observations over years when Wholesale and RetailPrices were both available.
(el Column 13) plus column (4),

TALE 3-3(21
Structure Of Datic PricnIC per etric To&)
Cassava Ia. Cocoa
Clleluett, Collecti., Martetieg RetedeProducer PrICeu1i1, 11elesale Rettil Retail ProdKcer PrKesin , hoealn1 Rettil Retail Prodcer la" PertPrice (a) htrhe. (bh Price (cI Cargio (d) Price (4) Price (a) Ostrk. Ilb) Price lc) 9argia (d) Price (cI Price If) Case (b i Price Olb
Date (1) (2) 131 (4) (5) (I) 17) (S) (9) (101 (11) 112) (IT)
1953 CIA 10 RIO C/A 34 54 10 64 13 77 269 32 30t1954 C/A 10 CIA MIA 34 4 10 56 12 70 217 33 3201I,5 C/A 10 8/0 NCA 34 52 10 62 12 75 29 36 3339196 CIA 10 N/A C/A 34 S6 10 6 13 10 290 37 317
1957 N/A 10 N/A C/A 34 52 10 62 12 73 269 37 30l1958 CtA 10 C/A C/A 34 58 10 be 14 82 239 38 2771939 8/ 11 C/A C/A 34 34 11 64 13 77 224 36 2tO1940 M/A 11 N/A MIA 34 54 11 U3 13 71 224 33 2N1941 MIA 11 C/I XIA 34 53 11 65 13 78 224 35 29192 C/A 12 MIA C/A 34 57 12 70 14 83 220 39 2591943 15- 13 28 t 34 50 13 63 13 76 202 43 2451144 14 13 2it 35 52 1i 66 13 SO 197 42 2291963 29 19 48 10 so 63 19 el 16 97 IV7 43 2381966 23 21 44 9 53 70 21 91 if 109 224 47 2711967 Is 19 34 7 41 40 19 79 14 93 254 46 3s0191 14 21 35 7 42 43 21 84 17 101 284 49 333149 22 22 44 9 53 71 22 94 19 112 293 45 3361970 20 23 43 9 52 -72 23 95 19 114 293 79 3721971 31 23 56 1I 7 89 23 114 23 137 293 U 3811972 38 28 46 13 79 95 28 123 25 147 34 146 t1219n 34 33 67 13 SO 117 33 150 30 190 439 211 6501974 41 38 79 It 95 134 38 192 38 231 489 314 8831973 72 30 122 24 146 213 so 263 53 315 585 397 92m176 1lo 7S 259 52 311 302 78 380 76 4U 732 336 108
1977 484 149 655 131 786 22 169 791 18 9C4 1333 1071 2004176 319 292 611 122 733 1007 22 12 260 1559 2667 1492 4191979 261 451 712 142 854 1160 431 1412 322 1934 4000 2120 41201960 o4 678 152 305 1831 1733 47l 2412 412 2895 4000 3573 75731911 2274 1467 3741 741 4489 2791 1447 4237 831 5109 12000 5200 172001m 2423 1794 4217 843 5060 414 1794 5942 Ila 7131 12000 11000 230195 1093 399 14933 2917 17920 11436 399 15434 3067 18320 20000 27000 470001954 721 5583 9306 1061 11147 11716 3583 17301 3460 20761 30000 44024 74024191 1742 6133 709q 1379 9474 62104 4153 U6237 13631 81 3m00 33416 11201L
Notes to Table 3-3(2):(a) Calculated by subtracting column (2) from column (3) for cassava and
column (7) frou column (8) for yams.(b) Calculated for 1975 fros worksheets for World Bank, Westirn Africa
Africa Reqional Project Ghana, Part 11, November, 1994;adjustments by overall CPI (1975z100) for other years.
(c) From Table 3-1.(dl .20 times column (3) for cassava and times colusn (9) for yams.
Based on actual observations over years when Wholesale andRetail Prices were both available.
(e) Calculated by adding column (3) and column (4) for cassava andcolumn (8) and column (9) for yams.
(f) From Table 3-2.(g) Marketing Board costs are from Cocoa Marketing Board, Annual Reports,
1952-1968, and from World Bank, Ghana Towards Structural Adjustunt,October 7, 1985, Volume 11, p67.
(h) Calculated by adding coluens (11) and (12).
310

Tible 3-4111
Structure of Rice Border Price Epivaeentb(KC/ketric Ton)
(IEJI (EER) (EN) IEER) (OERt) (IE)(OER) (EER) Vhelnale wholesale (OER) (EER) Retail Retail Collection, Preodcer Pro*dcer
CIF CIF Port I Price Price Retail Retail Price Price Proceusinq, Price PricePrice(a) Pricelb Handling(c) Eqeival,t(d) Equivaleette) MargivI f) Nargin(g) EquivleentUh) Equivalet(i) Oistrihution(j) Equivalent(k) Equivalent(l)
Year (1) 12) (3) (4) (5) (6) (7) (3) S9 (101 (11) (12)- --- - -- -- - -- - -- -- - -- -- -- -- -- - -- -- -- -- -- -- - -- -- -- -- -- - - - -- -- -- - - .- _-- - -- -- - -- --------- ------ --- - - ------- ----
1954 164 164 2 166 166 25 25 191 191 3t 131 1311955 140 140 2 142 142 21 21 164 164 36 106 lo11936 129 129 2 131 131 28 20 151 151 38 94 91957 137 137 2 139 139 21 21 160 160 38 101 lOt1958 136 169 2 138 171 21 26 1S9 197 38 100 1331959 122 170 2 124 172 19 26 143 IS9 39 85 1341960 113 183 2 115 185 17 28 133 213 39 76 1461961 109 200 3 112 202 17 30 128 232 42 70 1601962 106 175 3 109 177 16 27 125 204 46 63 1321963 112 185 3 115 187 17 28 132 216 47 67 1401964 179 3 101 183 15 27 116 210 54 47 1291965 123 355 4 127 359 19 54 146 413 68 59 2911966 134 298 5 139 303 21 45 159 348 77 62 22t1967 156 230 4 160 235 24 35 184 270 70 90 1641968 225 333 5 230 338 34 51 24 30 76 153 2621969 217 311 5 222 316 33 47 255 343 82 140 2341970 191 294 5 196 2S99 9 45 225 344 84 112 2151971 174 262 6 18o 26? 27 40 206 307 92 88 1751972 206 256 6 212 262 32 39 244 302 101 11 1611973 330 387 7 337 395 51 59 38B 454 119 218 2751974 543 694 a 551 703 83 105 634 800 141 411 5621975 3s8 549 11 391 560 59 84 450 643 183 206 3771976 505 905 17 522 922 78 138 600 10O 284 237 6341977 463 1679 37 500 1716 75 257 575 1973 618 -118 1091978 701 2920 64 765 2984 115 448 so 3432 1070 -305 19141979 1078 3258 99 1177 3357 177 504 1354 3840 1652 -475 17051980 1400 690 149 1549 7129 232 1069 1781 8" 2480 -931 46491981 1558 20651 323 Ls8L 20973 282 3144 2163 24119 5368 -348 15605IS12 140 21729 395 1804 22124 271 3319 2074 25443 6565 -4762 15551983 1671 su9618 80 2551 40497 383 6075 2933 46572 14632 -12081 25845S194 15573 47359 1229 16802 48587 2520 7288 19322 55875 20440 -3639 28147
1985 20416 MIA 1354 21769 CIA 3265 8/1 25034 N/A 22518 -749 1II
Notes to table 3-4(1):(a) CIF Rice Prices are isport unit values froe External Trade Statistics Ghana. Prices for 1983-85 are
extrapolated on the basis of relative changes in uorld sarket prices.(b) CIF Rice Price (column (1)) times the ratio of the equilibrium exchange rate to the official exchange rate.(c) Calculated for 1975 from World Dank, Appraisal of Upper Region Agricultural Developeent Project: Shana,
June 1976; adjusted tor other years using the overall CPI (1975z100).Id) Column (1) plus column (3).Ce) Column (2) plus column (3).(f) .15 times column (4).(qI .15 times column (5).(h) Column (4) plus column (6).li) Column (5) plus column (7).Ci) From Table 3-3(1).(k) Coluen (4) minus column (10).(I) Column (5) sinus column (10).
3 11

Table 3 412)
Structure of Maize krder Price Equivalents(mC/Mtric Tw)
(KAI( (DER) (8) EERI 1o0 (1E3(01) (EEII Ibelosa lWllel (OE10) I EEll Retail Retail Callactim, Probtcr Pre
CIF CIF Poet & Price Price Retail Rettil Price Price Procesing, Price PrictPrice(&) Priceib) Hmdlinogc) Equivaleet(4) Equivaleetle) Narptefl Rargin(lq Equivalent(hi Eqeivaleet(il Oistributize(ji Equivaleetlk) Eqgivalmt(1i
Year II) (2) (3) t4) (5) (61 (7) 18) (9l (101 (11) (U1____ -- - -------- _____ - ------ _______-_----- - --- - --- - -- -_ -- -- -_ -_ _ _
1954 75 75 5 a0 so 12 12 92 92 1is 7 471955 111 111 5 116 11 11 17 133 133 13 103 tO11956 105 105 5 110 11o 17 17 127 127 13 97 97
1957 122 122 5 127 127 it 19 146 146 13 114 1141956 n8 122 103 127 15 19 lit 146 13 90 1.
195, 75 105 5 so 11o 12 16 92 124 14 64 t1960 102 16 5 0l7 171 16 26 123 196 14 93 1571961 112 205 6 Il 211 1l 32 135 242 1s 103 191962 90 148 6 96 155 14 23 1ll 171 1i lo 131963 34 4 t 40 62 & 9 47 72 17 24 44
1964 el 148 7 aa 15 13 23 102 179 19 69 1371965 44 127 9 53 136 8 20 61 157 24 29 112196 41 91 11 52 102 0 1i St 117 27 24 741967 44 65 10 54 75 8 11 62 a6 25 29 lo1966 1SO 192 10 140 203 21 so 141 233 27 113 1741969 133 I19 11 144 202 22 30 1I6 232 29 1US 171970 36 55 11 47 67 7 10 55 77 30 18 371971 70 loS 13 83 1l1 12 18 95 136 33 50 851972 319 484 14 403 49 60 7S 443 S72 34 347 4421973 6a 80 16 84 96 13 14 97 1li 42 42 541974 162 207 19 l18 226 27 34 204 260 56 131 1741975 159 230 25 104 255 28 36 212 293 65 119 19197 16 297 39 205 336 31 50 234 37 101 104 2351977 369 1338 84 453 1422 hi 213 521 1636 220 234 12031978 610 2574 144 764 2720 115 406 879 3129 390 3" 23401979 1375 4155 226 1601 4381 240 657 1841 5038 67 1014 37416 854 4256 339 1193 4596 179 U8 1372 526 a8U 312 37161981 052 11293 733 1565 12026 238 104 1823 13830 1907 -321 lo011962 554 8544 897 1451 9441 218 1416 1649 10657 2332 -81 71191963 847 20358 19 24a* 22557 430 3384 3294 25941 S191 -2331 173i 61984 6813 27013 2792 11675 29664 1751 4471 13427 34277 7246 4415 22s1965 Il118 6/a 3076 14265 66 2140 /6 16404 MIA 7996 6266 NA
Notes to table 3-4(2):(a) CIF Maize Prices are import unit values from External Trade Statistics Ghana. Prices for 1983-85 are
extrapolated an the basis af relative changes in morld sarket prices.(b) CIF Rice Price (column (1)) times the ratio of the equilibrius exchange rate to the official exchange rate.Ic) Calculated for 1975 from korld Bank, Appraisal of Upper Region Agricultural Developmmnt Project: 6hana,
June 1976; adjusted for other years using the overall CPI (1958z100).(dl Column (1) plus column (3).(e) Column (2) plus column (3).(f) .15 times column (4).(g) .15 times coluen (5).(h) Column (4) plus column (6).li) Column (5) plus column (7).Ij) From Table 3-3(1).(k) Column (4) minus column (10).(II Column (5) minus column (10).
3 12

Table 3-4(3)-------------------------------------
Structure of Border Price Equivalentfor Cocoa
(NC Per Metric Ton)
(EER)Optimua (OER) IEER)Dosestic Marketing Producer Producer
FOB Price Board Price PricePrice (a) at Border (b) Costs(c) Equivalent Id) Equivalent (e)
Year (1) (2) (3) (4) (5)
1954 637 N/A 33 604 N/A1955 436 N/A 36 400 N/A1956 391 N/A 37 354 N/A1957 632 N/A 37 595 N/A1958 550 480 38 512 4421959 439 426 36 403 3901960 342 366 35 307 3311961 318 466 35 283 3311962 337 353 39 298 3141963 357 374 43 314 3311964 278 263 42 236 2211963 262 413 43 21? 3701966 396 417 47 349 3701967 562 411 46 516 3651968 761 496 49 712 4471969 818 708 45 773 6631970 643 495 45 598 4501971 688 419 88 600 3311972 824 433 146 678 2871973 1294 914 211 1083 7031974 1688 1147 314 1374 8331975 1526 975 397 1129 5781976 2596 1784 336 2260 14481977 3942 2673 1071 2871 16021978 10396 9857 1492 8904 83651979 9120 10980 2120 7000 88601980 6300 14257 3573 2727 106841981 5000 24270 5200 -200 190701982 30558 36417 11000 19558 254171983 60000 8446? 27000 33000 574691984 83323 114423 44024 39299 703991965 120983 N/A 55416 65567 N/A
Notes to table 3-4(3):(a) FOB Cocoa Prices are export unit values from External Trade
Statistics of 6hana 1954-68, and from World Bank, Ghana:Towards Structural Adjustment, Voluse II, p.67, for 1969-85.
(b) Optimum border price, from equilibrium exchange rate modelmultiplied by the equilibrium exchange rate.
(c) Marketing Board costs are fros harketing Board, Annual Reports,1952-1968, and from World Bank, 6hana: Towards StructuralAdjustment, October 7, 1985, Volume lI,p.67.
Cd) Column (1) minus column (3).Ie) Column 12) minus column (3).
313

Table 3-5(1)
National Consumer Price Indices (a)(1972=100)
Non- Non-Non- Agricultural Agricultural Non-
Tradable Agricultural Tradable Nontradable TradableYear Combined Index (bi Index (c) Index (d) Index (e) Index (f)
1951 32 31 35 33 36 321952 38 37 41 39 42 371953 38 37 41 40 43 381954 37 36 39 38 41 361955 37 36 40 39 42 371956 78 37 41 39 43 381957 39 38 43 41 44 391958 40 39 43 41 45 401959 40 39 43 41 45 401960 41 40 44 42 46 411961 41 40 45 43 46 411962 44 43 47 45 49 431963 48 46 54 50 57 471964 53 51 59 56 61 521965 67 67 67 66 67 671966 76 76 74 71 76 771967 69 68 75 75 76 681968 75 74 81 82 8o 741969 s0 80 86 88 84 791970 83 83 88 89 88 821971 91 91 92 94 90 911972 100 100 100 100 100 1001973 118 120 114 114 115 1181974 140 140 140 140 142 1391975 181 184 178 184 176 1801976 283 299 241 264 228 2851977 612 686 350 395 323 6461978 1059 1206 627 760 525 10781979 1635 1856 949 1124 823 16911980 2454 2802 1385 1636 1204 25661981 5313 6199 3048 3894 2362 53701982 6499 7616 3482 4317 2826 68021983 14482 17406 6832 8525 5493 157311984 20213 23085 12237 15204 M993 202211985 22311 24117 15815 18979 13454 21167
314

Notes to Table 3-5(1):(a) Source for 1963-1966 is The Current Econoeic Position and Prospects ot Ghana, vol. Il,
World Bank, October 26, 1970, p.39.Source for 1967-1969 and 1971-1972 is World Bank, 6hana: Econosic Position and Prospects,vol. 1, June 29, 1977, Table 6.
Source for 1970 and 1973-1982 is Shana Policies and Program for Adjusteent, World Bank,June, 1983, Table 7.3.
Source for 1983-1984 is Ghana Towards Structural Adjustsent, World Bank, vol. II,October 7, 1995, p. 80.
Source for 1985 is Statistical News Letter, Statistical Service, Aug. 18, 1986, Accra.(b) Includes food (local and imported), beverages and tobacco, clothing and footware
furniture and furnishings, and durable goods. It is impossible to separate tradablefrom non-tradable food in this index, but Table 3-1 suggests that the prices of thesehave moved fairly closely together.
(c) Includes all items except food (local and isported), and beverages and tobacco.(d) Includes clothing and footware, furniture and fixtures, and durable goods.(e) Includes all items except the tradable products listed in note (b)(f) Includes all items except clothing and footware, furniture and fixtures, and durable goods.
315

AN1\EX 4: COCOA SUPPLY FUNJCTION
The supply function for cocoa was derived using a three-step
approach. First, new planting or replanting of c:ocoa trees was estimated as
a function of planting costs, the producer price, and the oLitput of the
government' s hybrid seed gardens. Second, these plantings were combined
with yield profiles for traditional and hybrid varieties of cocoa in a
"vintage matrix" model that yields time-series estimates of "normal"
productive capacity. Third, this capacity was ccrnbined with produtcer prices
and an autoregressive term to estimate short-term and long-term elasticities
of oLutpLlt with respect to cocoa and maize prices, given the stock of cocoa
trees.
The centerpiece of this approach is the vintage matrix model.
This carries the area planted in cocoa trees forward fran year to year and,
in any given year, muLltiplies this area times the yield to be expected from
each particu(lar vintage. Total production is obtained by summing production
in this year across all vintages. In matrix form,
Year Area Planted
t A+t+1 Aft_-. A t,
t+2 Af+1 .-
Vintage 1 2 3 ... n
Yield Y, Y ! Y5 ... .Y
The first column of the (n+l)x(n+1) area planted matrix shows the amouit of
land initially planted in each year. The entire matrix of area planted to
316

each tree vintage in each year is m-ultiplied times the yield vector to
obtain a production matrix. SLoming all the elements of any row in the
production matrix horizontally gives total production in the year to which
that row applies.
The methodology used to estimate planting was developed by Bateman
in his analysis of Ghana's cocoa sector.1 This methodology calculates
average capacity of cocoa trees as a function of past planting in response
to price, sales of insecticides, incidence of swollen shoot disease, and the
cutting out of trees infected with swollen shoot. The price effect on
production is related to the difference between the prodLucer price deflated
by the ConsLwmer Price Index and the estimated cost of planting - a
threshold that the data suggest must be at least equalled by the producer
price if planting is to take place.- A ceiling of NK 1Cx0/ton is placed on
this price difference in line with what the data suggest is the absorptive
capacity of the cocoa sector to Lundertake planting. When the price
± World Bank Cutrrent Economic Situation and Prosoects of Ghana,Volume IV: Cocoa, prepared by Merrill Baternan, March 9, 1972; MerrillJ. Bateman, "An Econometric Analysis of Ghanaian Cocoa Saipply," inR.A. Kotey, C. Okaki, and B.E. Rourke, (eds.), Economics of Cocoa Froductionand Marketing, Institute of Statistical, Social and Economic Research,University of Ghana, Legon, 1974, pp.26B&6-326.6
2 Bateman found this threshold historically to equal N¢ I:N/ton in1963 prices, but he believed that the threshold had increased by the 1960ssince planting was reported to have fallen off sharply despite a produtcerprice that was higher than NW 1XYton in most years. The cocoa tree surveyscarried out by the Cocoa Services Division of the Ministry of Agricultureduring the 1970s, however, reported over aX),(:x:x) acres of trees of age 8-15years, suggesting that planting during the 1960s was greater than previouslythotght (Wbrld Bank, Ghana: The Cocoa Sector, Background Paper ND. 1 of 4prepared for the Ghana: Policies and Program for Adjustment Report, October14, 1983, p.9). In addition, estimates of the cost of replantingtraditional varieties of cocoa in 1966 suggest that these were within about15 percent of NS 1X)/ton when expressed in 196.3 prices using the CFI as adeflator. Therefore, the real cost of Ne 17X:/ton was used in the presentanalysis.
317

difference is positives this difference is mailtiplied by a planting effort
coefficient equal to c*ex=p(-B/aPt-±), where B is a constant and & P is the
producer price difference referred to above. When P<1O, cCO) since planting
ceases if the producer price is no greater than the cost of planting. When
AP>0), ce moves nonlinearly along an "S" shaped Curve representing the
farmer's effort as influenced by the producer price and the rescLirces that
are available. As the maximam level of effort is neared, the value of c,
approaches Lnity.
In order to estimate production capacity, Bateman fmu.ltiplied this
product times a yield coefficient that varies with the age of the trees, and
he sunmed the resulting terms over the nLunber of years since the date of
first planting. A second term was also introduced, which multiplies each of
the products in the first term times a weighted average of insecticide sales
to account for increased sutrvival rates of young trees protected against
insect damage. The coefficient of this term could not be estimated
statistically because of multicollinearity, however, so alternative values
were tried and the one that gave the best fit was retained. Other terms in
the estimating equation included variables to take into account the current
effects of insecticides, the impact of swollen shoot disease, and the
effects of the swollen shoot control program.
In the adaptation of Bateman's model used here, only the price
differential and planting effort coefficients were used in the estimation of
new plantings of traditional varieties. The imipact of insecticide sales
enters later when deviations of actual production from normal production are
explained. The effect of swollen shoot disease is also partially taken
into account in the vintage matrix model by the progressive decline in
318

hectarage of tr-ees planted before 1945. Efforts at further refinement of
the potential prodLuction variable are Linwarranted, however, given the
weakness of the data on actual use of insecticides and the incidence of
swollen shoot.
The equaticn-, used to estimate new plantings is the following:
nt = YPtte ... (1)
where A is the area planted,
4F'_ is the difference between the real producer price of cocoa and
the cost of replanting (with a maximLm value of Nit 10x/ton), and
B is a constants set equal by Bateman to Nd 10/ton.
As in Bate-men, separate estimates were made for the Brong-Ahafa and Ashanti
Regions, on one harid, and the Central, Eastern, and Western Regions, on the
other. Alternative values of Y were tried to obt-ain a series on planting
that, when introduced into the vintage matrix model along with area planted
to traditional varieties before 1945/46 and to hybrid varieties since
1968/69, produced a normal prodLuction variable that approximates actual
production over time with due allowance for short-term variations due to
weather and movements in prices. The area planted to traditional varieties
prior- to 1945/46 and still in production each year was based on the World
Bank Conmmodity Studies and Projections Division assessment of the rate of
decline of these trees from 1968/69 to 1985/86, with extrapolation back to
1945/46 at a rate that is consistent with the level of cocoa production in
the mid-19-)s. Plantings of hybrid varieties were based an the output of
the govermemnt's seed gardens and the estimated density of planting.
319

The estimation of planting of traditional cocoa varieties from
1945/46 to 1985/86 is shcwn in Table 4-1. At the end of World War II,
planting was at a standstill because of the lack of an adequate price
incentive. Within a year, however, cocoa prices boomed, resilting in the
maximrr-un rate of planting until the 196&:s, when prices decreased sharply. By
1964/659 the price incentive was negative, and plantings probably ceased for
two or three years. This was followed by a modest improvement in incentives
from 1967/68 to 1975/76. After that, price incentives were inadequate to
stimulate planting for the next ten years.
These trends are also evidenced, with a lag, in Table 4-2, which
shows the estimation of normal cocoa production. Although trees planted
before 1945/46, and in most cases prior to the 19nX:Os, accoutnted for the
bullk of production up to 1956/57, new plantings resulting from high world
market prices following World War II and during the Korean War resulted in a
shar p increase in normal production Ltntil about 197C). At this point,
however, output began to fall off in response to the decline in plantings
that occurred during the 1960:s.
Planting of hybrid varieties began in 1968/69. DLtring the
following decade and a half, the area planted to hybrids each year averaged
aboutt 15- 2),Cx) hectares, much of it within the cocoa projects of the
Eastern and Ashanti Regions. Nevertheless, despite their higher yields, by
1985/86 hybrids still accounted for less than 18 percent of total
productian.
The relationship between normal and actual production is shown in
logarithmic form in Figure 11. atiring the late 194:)s and early 195Xs,
actual production in most years was substantially greater than normal
320

Table 4-1
Estimation of Cocoa Planting, Traditional Varieties(Hectares)
Real Prod Estimated Cost PricePrice (a) of Planting (b) Incentive (c) Plantinq Effort Brong-Ahafo Central, Eastern
Year (NC/ton) INC/ton) (NC/ton) Coefficient (d1 and Ashanti (el and Western (f) Total
1944/45 114.6 130 -15.40 0.0000 0.000 0.000 0.0001945/46 130.2 130 0.20 0.0000 0.000 0.000 0.0001946/47 230.6 130 100.00 0.9048 0.000 0.000 0,0001947/48 313.2 130 100.00 0.9048 42.581 31,935 74.5161948/49 474.8 130 100.00 0.9048 42.581 31.935 74.5161949/50 280.4 130 100.00 0.9048 42.581 31.935 74.5161950/51 373.4 130 100.00 0.9048 42.581 31.935 74.5161951/52 435.0 130 100.00 0.9048 42.581 31.935 74.5161952/53 383.2 130 100.00 0.9048 42.581 31.935 74.5161953/54 394.8 130 100.00 0.9048 42.581 31.935 74.5161954/55 368.4 130 100.00 0.9048 42.581 31.935 74.5161955(56 407.4 130 100.00 0.9048 42.581 31.935 74.5161956/57 404.8 130 100.00 0.9048 42.581 31.935 74.5161957/58 360.8 130 100.00 0.9048 42.581 31.935 74.5161958/59 344.8 130 100.00 0.9048 42.581 31.935 74.5161959/60 280.8 130 100.00 0.9048 42.581 31.935 74.5161960/61 260.2 130 100.00 0.9048 42.581 31.935 74.5161961/62 225.2 130 95.20 0.9003 42.581 31.935 74.5161962/63 201.6 130 71.60 0.8696 40.333 30.250 70.5821963/64 157.8 130 27.80 0.6979 29.302 21.977 51.2791964/65 119.4 130 -10.60 0.0000 9.130 6.847 15.9771965/66 ?7.4 130 -32.60 0.0000 0.000 0.000 0.0001966/67 118.2 130 -11.80 0.0000 0.000 0.000 0.0001967/68 155.2 130 25.20 0.6725 0.000 0.000 0.0001968/69 153.6 130 23.60 0.6546 7.974 5.981 13.9551969/70 169.0 130 39.00 0.7738 7.270 5.452 12.7221970/71 165.6 130 35.60 0.7551 14.202 10.651 24.8531971/72 154.5 130 24.55 0.6654 12.650 9.488 22.1381972/73 175.7 130 45.69 0.8034 7.687 5.766 13.4531973174 178.6 130 48.58 0.8139 17.270 12.953 30.2231974/75 167.7 130 37.66 0.7668 18.606 13.955 32.5611975/76 155.1 130 25.14 0.6718 13.588 10.191 23.7791976/77 124.2 130 -5.84 0.0000 7.947 5.960 13.9071977/78 104.5 130 -25.45 0.0000 0.000 0.000 0.0001978/79 120.9 130 -9.12 0.0000 0.000 0.000 0.0001979/80 117.4 130 -12.57 0.0000 0.000 0.000 0.0001980/81 78.2 130 -51.76 0.0000 0.000 0.000 0.00019B1/82 108.4 130 -21.59 0.0000 0.000 0.000 0.0001982/83 88.6 130 -41.37 0.0000 0.000 0.000 0.0001983/84 66.3 130 -63.71 0.0000 0.000 0.000 0.0001984185 71.2 130 -58.76 0.0000 0.000 0.000 0.0001985/86 121.8 130 -8.23 0.0000 0.000 0.000 0.000
321

Notes to Table 4-1:(a) Actual producer price deflated by the general CPI in Accra (1963=100)
from World Oank, Current Exanouic Situation and Prospects of Shana,Voluse IV: Cocoa, prepared by herill Bateman, harch 9, 1972, Appendix I,p. B.
For 1971/72 - 1984/85 actual producer price from Annex 3, Table 3-2is deflated by the overall CPI froe Annex 3, Table 3-5(1).
ib) See Annex 4 for a discussion of the adjusteent to Bateman's estimates.(c) Difference between the Real Producer Price and the Estimated Cost of
Planting, with 100 NC/ton as the upper lieit, as explained in Annex 4.(d! Equal to EXP(-5/ P(t)l, where P(t) is the Price [ncentive in the current
year.(el Hectarage planted calculated by multiplying Price Incentive times Planting
Effort Coefficient times an average coefficient [.94) estimated so thatthe resulting normal production fits time series data or actual productionwith allowance for hte influence of variations in price and rainfall
1f) Hectarage planted calculated by multiplying Price Incentive times PlantingEffort Coefficient times an average coefficient [.71) estimated so thatthe resulting normal production fits time series data or actual productionwith allowance for hte influence of variations in price and rainfall.
322

Table 4-2
Estieation of Normal Cocoa Production (a)(000 tons)
Traditional Production
Before 1945/461945/46- Area Yields Traditional Hybrid Total Total
Year 1985/86 (000 ha) (kg/ha) Production Total Total Normal ctual
1945/46 0.00 1400 150 210 210.00 0.00 210.0 2091946147 0.00 1354 150 203 203.13 0.00 203.1 1921947/48 0.00 1308 150 196 196.25 0.00 196.3 2081948/49 0.00 1263 150 189 189.38 0.00 189.4 2781949/50 0.00 1217 150 183 182.50 0.00 182.5 2481950/51 0.00 1171 150 176 175.63 0.00 175.6 2621951/52 3.73 1125 150 169 172.48 0.00 172.5 2111952/53 11.18 1079 150 162 173.06 0.00 173.1 2471953/54 22.35 1033 150 155 177.36 0.00 177.4 2111954/55 40.98 988 150 148 189.12 0.00 189.1 2201955/56 67.06 942 150 141 208.33 0.00 208.3 2291956/57 98.73 896 150 134 233.12 0.00 233.1 2641957/58 130.40 850 150 128 257.92 0.00 257.9 2061958/59 162.07 804 150 121 282.71 0.00 282.7 2561959/60 193.74 758 150 114 307.51 0.00 307.5 3171960/61 225.41 713 150 107 332.30 0.00 332.3 4301961/62 257.08 667 150 100 357.10 0.00 357.1 4091962/63 286.89 621 150 93 380.03 0.00 380.0 4131963/64 314.68 575 150 86 400.95 0.00 401.0 4281964/65 340.39 529 150 79 419.78 0.00 419.8 5381965/66 364.98 483 150 73 437.50 0.00 437.5 4011966/67 388.26 438 150 66 453.90 0.00 453.9 3681967/68 409.25 392 150 59 468.03 0.00 468.0 4151968/69 426.20 346 150 52 478.10 0.00 478.1 3231969/70 438.11 315 150 47 485.36 0.00 485.4 4031970/71 444.10 286 150 43 487.00 0.00 487.0 4131971/72 442.48 260 150 39 481.48 0.05 481.5 4541972/73 433.89 237 150 36 469.44 0.20 469.6 4071973/74 420.60 215 150 32 452.85 0.49 453.3 3401974/75 406.27 194 150 29 435.37 0.85 436.2 3761975/76 392.92 174 150 26 419.02 1.30 420.3 3961976/77 380.01 153 150 23 402.96 1.99 404.9 3201977/78 368.68 132 150 20 388.48 3.15 391.6 2711978/79 358.25 117 150 18 375.80 5.29 381.1 2651979/80 348.31 103 150 15 363.76 9.15 372.9 2961980/81 339.31 88 150 13 352.51 15.17 367.7 2581981/82 331.43 73 150 11 342.38 23.42 365.8 2251982/83 291.50 63 150 9 300.95 29.73 330.7 1811983184 283.06 53 150 8 291.01 38.94 330.0 1571984/85 273.38 42 150 6 279.68 48.41 328.1 1721985/86 263.32 32 150 5 268.12 57.43 325.5 215
Notes to Table 4-2:(a) Derived from the vintage matrix modes as described in Annex 4.
323

Figure 11
Log Normal and Log Actual Production1945-85 (a)
---------------------------------
RIN VALUE 5.0562 MAX VALUE &.2879 SPACING .25135E-01
1945: 1 4 AN + t
1946: 1 t A N t
1947: 1 + N A +1948: 1 + N A t
1949: 1+ N A t
1950: 1 t N A +1951: 1 t N A +1952: 1 t N A t
1953: 1 t N A t1954: 1 t N A +1955: 1 + N A +1956: 1 + N A t
1957: 1 + A N +1958: 1 4 A N t
1,S59: 1 NA 4
1960: 1 + N A t1961: 1 t N A t
1962: 1+ N A +1963: 14 N A t
1964: 1+ N A1965: 1 4 A N t1966: 1 4 A N t
1967: 1+ A N t
1968: 1 + A N t
1969: 1+ A N +1970: 1 4 A N t
1971: 1 4 A N 4
1972: 1 4 A N t
1973: 1 4 A N t
1974: 1+ A N t
1975: 1 4 AN t
1976: 1 4 A N t
1977: 1+ A N +1978: I A A N t
1979: 1+ A N t1980: 1 A N +1981: 1 4 A N t
1982: 1 4 A N t
1983: 1 A N t
1984: 1 4 A N t1985: 1t A N t
...... +.........+...+ ........... +... I.............
Notes to Figure 11:(a) Source is Table 4-2.
The following symbols are used:
N -- Log Normal ProductionA -- Log Actual Production
324

production because the response of farmers to the high producer price that
period led to good tree maintenance and careful harvesting. Later this
sitLuation was reversed as the real producer price decreased during the
first half of the 1960s, rose again somewhat during the second half of that
decade and the early 1970s, and then dropped sharply from 1974/75 to
1984/85.
To assess the impact of the producer price on production given
the stock of cocoa trees, the following equation was estimated using
ordinary least squares regression analysis:
Qe = f (Q0-., PF , P,t N, I) .. (2)
where Q- is the quantity actLually prodtced (marketed) of cocoa,
F'Q is the producer price of cocoa,
F- is the producer price of other related crops,
NCQ is "normal" production of cocoa,
I is a weighted average of insecticide sales over the past few years,
t is the time period.
Both linear and loglinear specifications were tested, and the loglinear
version generally gave the best results.
Table 4-3 presents these results for several different
specifications of equation (2). Regression (1), which is that chosen for
s-tbseqLent sinf.ilation, shows normal production, lagged actual production,
and current cocoa producer price each to have the anticipated sign and to be
significantly different from zero at the .C05 level. In addition, the sign
of the current maize producer price is negative and significant at the . lt)
level. Current prices are used in this equation rather than past prices
325

Table 4-3
Regression Results for the Cocoa Supply Equation (a)
Independent Variables
Equation co co 11 ca _2 HNusber Period Constant InN lng (t-1) InP (t) InP (t) InP (t) I R Statistic
I I t ts(11) 53/54-85/86 -1.480 0.498 0.643 0.223 -0.143 0.824 -0.547
(-1.344) (2.644) (5.123) (2.953) (-1.787)
(2) 63164-84/85 -0.503 0.252 0.739 0.192 -0.037 -0.120 0.831 -1.486(-0.207) (0.428) (4.333) (1.032) (-0.233) (-1.007)
t t(3) 63/64-84/85 -0.373 0-202 0.745 0.203 -0.142 0.840 -1.484
(-0.162) (0.379) (4.545) (1.161) (-2.015)
t 1 t t(4) 45146-85/86 -1.742 0.467 0.606 0.245 0.810 0.040
(-2.385) (3.695) (5.740) (3.924)
s t I t(5) 45/46-85/86 -1.760 0.452 0 605 0.263 (.000006) 0.805 .049
(-2.374) (3.301) (5.661) (3.150) (.330)
Notes to Table 4-3:(a) Figures in parentheses are t-statistics. Coefficients marked with a
single asterisk are signicantly different froe zero at the .05 level;those marked with a double asterisk are significant at the .10 level.
326

because the producer price of cocoa is announced in advance of the growing
seasoca, and decisions regarding the intensity of cocoa harvesting, the major
way in which cocoa outputt can vary in the short-run are made after the
maize price can be fairly accurately forecasted.
Regressions (2) and (3) add the price of cassava as an additional
explanatory variable. When this is done with the price of maize included,
rrLtticollinearity between these two variables restlts in neither being
significant. The coefficient of the cassava price alone is significant, bLtt
neither normal production nor the price of cocoa is significant in this
specificaticn. Part of the reason for this may be that the time series over
which cassava prices are available is shorter by iC) years than for the other
var-iables, making estimation of the equation more difficult. Since the
prices of maize and cassava are highly correlated (r.62) the maize price
ser-ies is longer- than that of cassava, maize is one of the principal crops
selected for analysis in this study, and the prices of other food crops are
not significant explantory variables, maize is the only food crop whose
price is included in the regression.
The last two equations of Table 4-3 exclude, for comparison sake,
the prices of all crops other than cocoa. This affects only slightly the
coefficient Rz of the log of the current price of cocoa, equal to the short
rutn elasticity of supply. On the other hand, it biases downward the
ciefficient B2 of the autoregressive ter-m lnO'-(t-1), implying a downward
bias in the long-run supply elasticity equal to B,/(1-B 2 ). Interestingly,
the coefficient of the insecticide sales term, included here as a variable
327

shifting the coefficient of normal productions is insignificant.- There
are several reasons for this. One is that capsid insects became resistant
to Gammelin, the principal insecticide used for many years. A second is
that farmers who buy insecticides are known to use these on crops other than
cocoa, and many of these crops became mtch more profitable as real cocoa
producer prices declined. A third reason is that a large price differential
at the black market ex:change rate has encot-raged the smuggling of
insecticides to the Ivory Coast. 4 Consequently, insecticide sales was not
included as a variable in the regression.
The insecticide variable was included in this way because in manyyears it takes on a zero value and its logarithm wozuld, in these years, beLundefined. Alternative specifications, however, yield the same resLult.
l In 1986, insecticides smuggled into the Ivory Coast from Ghana soldfor at least 10 times their official price in Ghana when currency wasconverted at the black market rate of exchange.
328

ANNEX 5: EFFECTS CF INDIRECT AMN0NA IClJLThLFPDIFRECT FfRICE INTERMENTIONS
In order to estimate the effect of indirect price interventions
influencing the exchange rate and of direct price interventions affecting
the nonagricultural sector, the following variable was calculated.
E**
EF* =o( _ + (1-4) FPNr .. 1*a (1+t-)
where E** is the equilibriLm exchange rate
E is the official exchange rate
P,,&-r is the nonagricultural tradable CPI
PNp"r is the nonagricultural nontradable CPI
tm is the tariff equivalent on nonagricultural tradables
C( is the weight of nonagricultural tradables in the totalnonagricultural CPI.
The exchange rates are taken from Table 4. Annex 2 describes the methodology
used to estimate the equilibrium exchange rate. The price indexes are from
Table .- 5(1) in Annex 3 and are derived from components of the consLmer
price index. The tariff equivalent on nonagricultural tradables tm is taken
from Leith for the period up to 1960.s Thereafter, it is calculated by
adjusting the average NfiF for manufacturing of 1.51, estimated by Pearson et
al for 1I72, for the ratio of the nonagricultural tradable CPI to the
u Leith, Foreign Trade Regimes .... p.11.
329

manufacturing unit value index of industrial country exports to the
developing nations. 2
The adjusted nonagricultural price index F*N was then combined
with the domestic price of agricultural goods adiusted for the exchange rate
disequilibrium to form the ratio
F*
which is presented in Table 5-1. As exchange rate adiLtstments are assLumed
to take place at the border, Pd±* is calculated by nLiltiplying the domestic
wholesale price by the ratio of the equilibrium exchange rate to the nominal
exchange and than making approporiate adjustments, as described in Annex 3,
Tables !-3(1) and 3-3(2), to obtain the domestic equilibrium rate to
producer and consLmers. The figLures in table 5r-1 cleary show a rise inthe
ratio over time for all tradable crops, especially towards the end of the
period. This reflects the fact that the exchange rate adjustment is made in
both numerator and denominators butt that the adjuLstment to border prices
applies only to tradable nonagricultutral products. Since the domestic price
of these products are much higher than their border prices because of import
restrictions, the results are as expected. On the other hand, the ratio's
drastic fall following the devaluation in 1984, also reflects the
significance of indirect price interventions.
2 Scott R. Pearson, Gerald C. Nelson, and J. Dirck Stryker,"Incentives and Comparative Advantage in Ghanaian Industry and AgricLlture,"1979, p. 43.
330

Table 5-1
Effect of Indirect and Nonagricultural DirectPrice Interventions on Relative Prices
Maize Rice Cocoa
Year Producer (a) Consumer (b) Producer (a) Consuser (b) Producer (a) Consumer (b)
1958 1.17 1.70 2.99 4.43 6.90 7.761959 1.00 1.50 2.95 4.37 7.14 7.931960 1.13 1.63 2.79 4.14 7.90 8.621961 1.93 2.56 2.94 4.32 8.59 9.271962 1.61 2.21 2.29 3.64 7.48 8.231963 1.62 2.19 4.40 5.99 6.21 6.941964 2.18 2.86 3.54 5.06 5.99 6.661?65 3.83 4.76 6.74 8.77 6.10 8.661966 2.82 3.64 4.82 6.67 7.06 7.651967 .90 1.42 2.94 4.47 5.36 5.981968 1.50 2.11 2.59 4.07 5.51 6.121969 2.17 2.90 3.15 4.74 5.23 5.771970 1.67 2.30 3.67 5.30 5.49 6.361971 1.59 2.24 3.53 5.21 5.25 6.201972 1.78 2.46 3.66 5.37 4.89 6.351973 1.53 2.18 3.59 5.33 4.83 6.681974 1.45 2.07 3.45 5.10 4.98 7.171975 1.66 2.33 4.48 6.33 5.72 7.951976 4.01 5.12 9.65 12.53 6.88 8.341977 11.12 13.47 17.76 22.35 20.77 23.681978 7.65 9.51 16,52 21.01 25.90 28.341979 4.89 6.34 8.02 11.24 17.36 19.611980 13.28 15.96 26.00 31.81 22.97 25.371981 30.37 35.59 45.94 54.69 67.10 68.661982 31.02 36.36 85.72 100.52 88.17 90.991983 116.00 134.20 187.99 218.45 145.68 149.301984 5.41 6.93 19.41 24.32 15.35 19.091985 N/A N/A N/A N/A N/A N/A
Notes to Table 5-1:(a) For 1958-1985 calculated as producer price equivalent adjusted as
as described in Annex 5.For all years producer price equivalent for rice and saize iswholesale price (from Table 3-3(1l) times the ratio ESE, minuscollection, processing and handling. The producer price equivalentfor cocoa is assumed to be the rendered port price (from Table 3-3(2))times the ratio EVE, minus marketing board costs.
(b) Calculated the same way as (a) using retail price equivalent. Retailprice equivalent for rice and maize is wholesale price timesEt/E plus retail margin, which is .15 times new wholesale price.The retail price for cocoa is assused to be the rendered portprice multiplied by El/E.
331

Table 5-2 presents the difference between the distorted domestic
price ratios in Tables 13(1) and 13(2) of Chapter VI in the text and the
adjusted ratios in Table 5-1q divided by the adjusted ratios.
Pdi* Pdi*( - ____ - ___ .. (z
* Pr
This indicator is always negative at least partly becaLse, once again, of
the adjustment of tradable nonagricultural prices to border prices. Since
the importance of this adjustment increases over time, the indicator also
becomes increasingly negative.
332

Table 5-2
Effect of Indirect and Nonagricultural DirectPrice Interventions on Relative Prices
maize Rice Cocoa
Year Producer (a) Consumer (b) Producer (a) Consumer (b) Producer (a) Consumer (b)
1958 -.220 -.168 -.225 -.168 -.664 -.1681959 -.327 -.235 -. 323 -.235 -.720 -.2351960 -.426 -.318 -.441 -.318 -.803 -.3181961 -.451 -.374 -.518 -.374 -.835 -.3741962 -.416 -.332 -.499 -.332 -.847 -.3321963 -.422 -.346 -.424 -.346 -.592 -.3461964 -.483 -.415 -.533 -.415 -.724 -.4151965 -.664 -.602 -.701 -.602 -.751 -.6021966 -.593 -.521 -.640 -.521 -.754 -.5211967 -.452 -.333 -.436 -.333 -.691 -.3331968 -.400 -.328 -.446 -.328 -.740 -.3281969 -.363 -.316 -.407 -.316 -.643 -.3161970 -.404 -.332 -.424 -.332 -.614 -.3321971 -.407 -.332 -.427 -.332 -.615 -.3321972 -.233 -.193 -.248 -.193 -.438 -.1931973 -.179 -.143 -.186 -.143 -.395 -.1431974 -.252 -.198 -.262 -.198 -.489 -.1981975 -.372 -.304 -.375 -.304 -.511 -.3041976 -.514 -.468 -.522 -. 468 -. 330 -. 4681977 -.751 -.710 -.782 -.710 -.814 -.7101978 -.826 -.766 -.844 -.766 -.901 -.7661979 -. 756 -.671 -.816 -. 671 -. 915 -. 6711980 -.823 -.784 -.840 -.784 -.818 -.7841981 -. 937 -. 918 -. 953 -.918 -. 968 -. 9181982 -.948 -.927 -.948 -.927 -.949 -.9271983 -.960 -.934 -.965 -.954 -.955 -.9541984 -.757 -.683 -.741 -.683 -.672 -.6831985 N/A N/A N/A N/A N/A N/A
Notes to Table 5-2:(a) Retail Price from Table 3-3(1) for rice and saize and from Table 3-3(2)
for cocoa divided the Nonagricultural index from Table 3-5(1) minus theetftt on producer prices from Table 5-1, all divided by the effecton producer prices from Table 5-1.
(b) Retail Price from Table 3-3(1) for rice and maize and renderedport price from Table 3-3(2) for cocoa divided by the Nonagriculturalindex minus the effect on consumer prices froe Table 5-1, all dividedby the effect on consumer prices from Table 5-1.
333

-0
0O~~~~~- - - - - - - - - - - -
- - - -- I aa4400.o.c =-.c-tin.-.-4t-- -0-c-e- -z-
- I I -,~~~~- --- ---
0~~~~ -a..--..-- n--.--- - -- --- -- -- -
an - -~ ~ - -1 ----------
a. -, a... a.-- I I-C'~~ . . .. ..
- - -. - -. n I -St~~~- -a' -----

Table 7-1(1)
ANNEX 7 Short-Run Producer Price Transfer to and from Maize Production
Production Border Price
EquilibriusActual (a) Direct ,b) Total (c) Actual (d) Adjusted (e) Domestic Price (f) Transfer to (g) Transfer from (h)
Year (000 st) (000 At) (000 *t) (NC/it) (NC/at) (NC/It) (uillion NC) (million NC)
1958 183 475 494 90 113 39.2 -16.61 11.391959 NiA 392 476 66 96 28.9 N/A 12.831960 NiA N/A N/A 93 157 28.4 NIA NiA1961 N/A N/A N/A 103 196 47.3 N/A N/A1962 169 N/A N/A 80 138 44.3 N/A N/A1963 183 238 363 24 46 50.4 5.63 6.621964 170) 82 141 69 137 66.4 -. 36 7.491965 206 158 235 29 112 85.8 10.31 16.321966 353 102 292 24 74 84.7 13.75 9.891967 278 72 193 29 50 37.1 1.49 2.771968 253 131 229 113 176 72.7 -7.80 11.241969 300 260 384 115 173 118.7 .98 18.461970 482 307 457 18 37 87.3 27.48 7.411971 465 84 177 50 85 87.0 10.17 4.601972 402 166 320 367 462 136.5 -65.46 23.051973 427 530 714 42 54 142.3 48.03 7.351974 486 94 131 131 176 151.2 5.79 5.061975 343 162 245 119 190 184.9 16.64 14.351976 296 83 136 104 235 468.7 67.42 14.391977 274 31 69 234 1203 970.1 112.24 48.521978 218 17 62 384 2340 833.8 52.77 77.271979 380 45 178 1014 3794 1133.6 25.45 309.971980 382 83 165 312 3716 3260.6 685.75 421.621981 378 36 66 -321 10119 5844.6 1277.54 533.281982 3,46 2 55 -881 7109 5659.2 1136.83 227.351983 173 1 18 -2331 17360 31537.2 2944.91 186.961984 574 1 23 4415 22545 16117.7 3364.99 219.361985 411 10 N/A 6266 N/A 11818.7 1168.51 N/A
Notes to Table 7-1(1:(a) From Table 1-2(1), Annex 1.(b) Short-Run Direct Equilibrium Production from Table 20.(c) Short-Run Total Equilibrium Production from Table 23.(d) Producer Price Equivalent at OER from Table 3-4(2), Annex 3.(e) Producer Price Equivalent at EER from Table 3-4(2), Annex 3.(f) Producer Price from Table 3-3(1), Annex 3.(g) (Domestic Price - Actual Border Price) I Direct Equilibrium Production
4 1/2(Domestic Price - Actual Border Price)I(Actual Production - Direct Equilibrium Production).(h) (Adjusted Border Price - Actual Border Price) I Direct Equilibrium Production
+ 1/2(Adjusted Border Price - Actual Border Price)I(Tatal Equilibrium Production- Direct Equilibrium Production).
335

Table 7-1(2)
Long-Run Producer Price Transfer to and from Maize Production
Production Border Price
EquilibriumActual (a) Direct (b Total (c) Actual (d) Adjusted (e) Domestic Price (f) Transfer to (g) Transfer from (h)
Year (000 mt) (000 at) (000 it) (NC/at) (NC/at) (NC/et) (eillion NC) (eillion NC)…--- … __ _ _ -__ _ ----------------
1958 183 506 535 90 113 39.2 -17.40 12.241959 N/A 453 554 66 96 20.9 N/A 14.891960 N/A 373 504 93 157 28.4 N/A 27.711961 N/A 462 697 103 196 47.3 N/A 53.951962 169 631 1100 80 138 44.3 -14.29 50.461963 183 287 473 24 46 50.4 6.28 8.381964 170 87 161 69 137 66.4 -.36 8.351965 206 144 233 29 112 85.8 9.91 15.651966 353 97 297 24 74 84.7 13.60 9.891967 278 60 188 29 50 37.1 1.43 2.601968 253 105 217 113 176 72.7 -7.27 10.061969 300 229 375 115 173 118.i .92 17.351970 482 296 471 18 37 87.3 27.08 7.441971 465 78 176 50 85 87.0 10.06 4.491972 402 129 279 367 462 136.5 -61.16 19.321973 427 451 678 42 54 142.3 44.07 6.671974 486 95 140 131 176 151.2 5.79 5.291975 343 129 205 119 190 184.9 15.54 11.771976 286 72 126 104 235 468.7 65.44 13.051977 274 25 62 234 1203 970.1 110.23 42.191978 218 12 50 384 2340 833.8 51.69 60.961979 380 30 144 1014 3794 1133.6 24.54 242.341980 382 58 143 312 3716 3260.6 648.60 342.791981 378 28 57 -321 10119 5844.6 1251.19 444.091?82 346 1 42 -881 7109 5659.2 1135.16 173.401983 173 .4 13 -2331 17360 31537.2 2936.40 136.061984 574 .5 16 4415 22545 16117.7 3361.34 149.901985 411 4 N/A 6266 N/A 11818.7 1151.00 N/A
…-- - - - - - - - - - - - - - - - - - - - - - --_-___- --_- - - --_-_- -_-_ ..- _ -_ -__-_
Notes to Table 7-1(2):(a) Froe Table 1-2(1), Annex 1.(b) Long-Run Direct Equilibrius Production from Table 21.(c) Long-Run Total Equilibrius Production froe Table 24.(d) Producer Price Equivalent at OER from Table 3-4(2), Annex 3.(e) Producer Price Equivalent at EER from Table 3-4(2), Annex 3.(f) Producer Price from Table 3-3(l), Annex 3.(g) (Domestic Price - Actual Border Price) I Direct Equilibrium Production
+ 1/2(Dosestic Price - Actual Border Price)l(Actual Production - Direct Equilibrium Production).(h) (Adjusted Border Price - Actual Border Price) I Direct Equilibriue Production
+ 1/2(Adjusted Border Price - Actual Border Price)I(Total Equilibrium Production- Direct Equilibrius Production).
336

Table 7-2(1)
Short-Run Producer Price Transfer to and from Rice Production
Production Border Price
EquilibriumActual (a) Direct (b) Total (c) Actual (d) Adjusted (e) Domestic Price lf) Transfer to (g) Transfer from (h)
Year (000 at) (000 at) (000 at) (NC/at) (NC/at) (NC/it) (aillion NC) (million NC)
1958 20 15 16 100 133 100 -.01 .511959 N/A 21 24 85 134 86 N/A 1.081960 21 N/A N/A 76 146 69 N/A N/A1961 20 19 23 70 160 63 -.13 1.911962 20 18 25 63 132 54 -.17 1.491963 21 19 25 67 140 137 1.39 1.601964 27 18 26 47 129 97 1.14 1.811965 21 13 16 59 291 135 1.28 3.451966 19 10 19 62 226 128 ?4 2.411967 27 15 30 90 164 125 .74 1.661968 27 16 25 153 262 116 -.81 ? 221969 39 30 41 140 234 160 .69 3.321970 32 23 32 112 215 185 2.01 2.841971 36 22 37 88 175 186 2.84 2.561972 46 26 49 111 161 275 5.88 1.881973 40 19 27 218 275 332 w 3.40 1.321974 47 27 36 411 562 355 -2.05 4.711975 46 38 57 2r808 377 497 12.20 8.001976 46 20 31 237 636 1109 28.70 10.271977 71 27 52 -118 1098 1355 72.28 48.351978 70 6 41 -305 1914 1611 72.97 52.411979 60 9 47 -475 1705 1399 63.88 59.961980 51 12 38 -931 4649 5777 211.23 141.081981 63 53 48 -3488 15605 6545 580.11 962.031982 23 3 25 -4762 15559 15530 271.94 292.841983 26 3 17 -12081 25865 45165 825.33 381.981984 43 5 24 -3639 28147 61571 1547.71 459.411985 59 7 N/A -749 N/A 28453 950.61 N/A
Notes to Table 7-2(1):(a) From Table 1-2(1), Annex 1, multiplied by .65 to convert paddy to rice.(b) Short-Run Direct Equilibrium Production from Table 20, multiplied by
.65 to convert paddy to rice.(c) Short-Run Total Equilibrium Production from Table 23, multiplied by
.65 to convert paddy to rice.(d) Producer Price Equivalent at OER from Table 3-4(1), Annex 3.(e) Producer Price Equivalent at EER from Table 3-4(1), Annex 3.(f) Producer Price from Table 3-3(1), Annex 3.(g) (Domestic Price - Actual Border Price) t Direct Equilibrius Production
+ 1/2(Dosestic Price - Actual Border Price)(Actual Production - Direct Equilibrium Production).lh) (Adjusted Border Price - Actual Border Price) I Direct Equilibrium Production
+ 1/2(Adjusted Border Price - Actual Border Price)I(Total Equilibrium Production- Direct Equilibrium Production).
337

Table 7-2(2)
Long-Run Producer Price Transfer to and from Rice Production
Production Border Price
EquilibriumActual (a) Direct (b) Total (c) Actual (d) Adjusted (e) Domestic Price (f) Transfer to (g) Transfer from (h)
Year (000 at) (000 at) (000 *t) (NC/it) (NC/at) (NC/it) (eillion NC) (million NC)…--- … . _ _ _ _
1958 20 14 15 100 133 100 -.01 .481959 N/A 19 23 85 134 86 N/A 1.011960 21 42 51 76 146 69 -.23 3.261961 20 22 29 70 160 63 -.14 2.321962 20 19 28 63 172 54 -.16 1.601963 21 18 27 67 140 137 1.38 1.661964 27 18 27 47 19 97 1.13 1.851965 21 12 17 59 291 135 1.23 3.301966 19 9 18 62 226 128 .92 2.221967 27 12 30 90 164 125 .69 1.561968 27 13 25 153 262 116 -.76 2.101969 39 26 40 140 234 160 .64 3.061970 32 21 32 112 215 185 1.93 2.731971 36 20 37 88 175 186 2.73 2.481972 46 23 49 111 161 275 5.59 1.801973 40 16 27 218 275 332 3.22 1.251974 47 21 33 411 562 355 -1.90 4.071975 46 31 52 208 377 497 11.23 7.021976 46 18 32 237 636 1109 27.92 10.091977 71 22 48 -118 1098 1355 68.34 42.511978 70 5 38 -305 1914 1611 71.55 46.651979 60 4 41 -475 1705 1399 60.38 48.631980 51 6 35 -931 4649 5777 191.35 114.771981 63 32 44 -3488 15605 6545 475.90 723.631982 23 3 23 -4762 15559 15530 266.67 266.021983 26 2 17 -12081 25865 45165 793.08 360.261984 43 2 22 -3639 28147 61571 1475.81 387.951985 59 3 N/A -749 N/A 28453 901.99 N/A
Notes to Table 7-2(2):(a) From Table 1-2(1), Annex 1, multiplied by .65 to convert paddy to rice.(b) Long-Run Direct Equilibrium Production from Table 21, multiplied by
.65 to convert paddy to rice.(c) Long-Run Total Equilibrium Production froe Table 24, multiplied by
.65 to convert paddy to rice.(d) Producer Price Equivalent at OER from Table 3-4(11, Annex 3.(e) Producer Price Equivalent at EER from Table 3-4(1), Annex 3.(f) Producer Price from Table 3-3(1), Annex 3.(g) (Domestic Price - Actual Border Price) I Direct Equilibrium Production
+ 1/2(Domestic Price - Actual Border Price)lSActual Production - Direct Equilibriumi Production).(h) (Adjusted Border Price - Actual Border Price) t Direct Equilibrium Production
+ 1/2(Adjusted Border Price - Actual Border Price)l$Total Equilibrium Production- Direct Equilibrium Production).
338

Table 7-3(1)
Short-Run Producer Price Transfer from Cocoa Production
Production Border Price
EquilibriumActual (a) Direct (b) Total (c) Actual (d) Adjusted (e) Domestic Price (f) Direct (g) Indirect (h)
Year (000 It) (000 It) (000 at) (NC/et) (NC/et) (NC/et) (million NC) (million NC)
1958 256 280 262 512 442 239 73 -191959 317 340 320 403 390 224 59 -41960 430 410 387 307 331 224 35 101961 409 416 393 283 331 224 24 191962 413 436 408 298 314 220 33 71963 428 563 519 314 331 202 55 91964 538 589 526 236 221 187 28 -81965 401 534 498 219 370 187 15 781966 372 545 470 349 370 224 57 101967 423 537 458 516 365 254 126 -751968 333 401 338 712 447 284 157 -981969 419 529 482 773 663 293 228 -551970 434 639 538 598 450 293 164 -871971 477 608 490 600 331 293 167 -1481972 427 428 339 678 287 366 133 -1501973 357 524 406 1083 703 439 284 -1761974 395 511 436 1374 833 489 401 -2561975 41b 514 412 1129 578 585 253 -2551976 339 539 432 2260 1448 732 671 -3941977 290 413 285 2871 1602 1333 541 -4431978 286 408 311 8904 8365 2667 2166 -1941979 323 357 312 7000 8860 4000 1020 6231980 284 341 329 2727 10684 4000 -398 26621981 24B 137 239 -200 19070 12000 -2351 36271982 198 355 214 19558 25417 12000 2090 16671983 173 349 223 33000 57469 20000 3396 70021984 189 224 203 39299 70399 30000 1921 66461985 226 248 N/A 65567 N/A 56600 2127 N/A
…-- - - - - - - - - - - - - - - - - - - - - - - - - - - - - - - - -
Notes to Table 7-3(1):(a) 'Cocoa (b) column from Table 1-2(3), Annex 1.lb) Short-Run Direct Equilibrium Production from Table 20.(c) Short-Run Total Equilibrium Production from Table 23.(d) Producer Price Equivalent at DER from Table 3-4(3) Annex 3.(e) Producer Price Equivalent at EER from Table 3-4(3) Annex 3.(f) Producer Price from Table 3-3(2), Annex 3.(g) (Actual Border Price - Domestic Price) I Actual Production
+ 1/2(Actual Border Price - Domestic Price)t(Direct Equilibrium Production - Actual Production)(h) (Adjusted Border Price - Actual Border Price) I Direct Equilibrium Production
+ 112(Adjusted Border Price - Actual Border Price)l(Total Equilibrium Production- Direct Equilibrium Production).
339

Table 7-3(2)
Long-Run Producer Price Transfer from Cocoa Production
Production Border Price
EquilibriumActual (a) Direct (bI Total (c) Actual (d) Adjusted (e) Domestic Price tf) Direct (g) Indirect (h)
Year (000 It) (000 It) (000 at) (NC/et) (NC/at) (NC/et) (million NC) (sillion NC)
1958 256 279 233 512 442 239 73 -181959 317 359 301 403 390 224 61 -41960 430 444 375 307 331 224 36 101961 409 424 360 283 331 224 25 191962 413 446 376 298 314 220 34 71963 428 592 488 314 331 202 57 91964 538 726 573 236 221 187 31 -101965 401 648 518 219 370 187 17 881966 372 742 555 349 370 224 70 131967 423 843 596 516 365 254 166 -1091968 333 632 427 712 447 284 207 -1401969 419 815 576 773 663 293 296 -761970 434 1006 677 598 450 293 220 -1241971 477 1077 674 600 331 293 239 -2361972 427 745 453 678 287 366 183 -2341973 357 772 513 1083 703 439 364 -2441974 395 866 606 1374 833 489 558 -3981975 416 880 609 1129 578 585 352 -4101976 339 900 631 2260 1448 732 947 -6211977 290 804 442 2871 1602 1333 841 -7901978 286 822 426 8904 8365 2667 3454 -3361979 323 739 424 7000 8860 4000 1594 10821980 284 614 414 2727 10684 4000 -571 40871981 248 240 324 -200 19070 12000 -2976 54321982 198 370 271 19558 25417 12000 2146 18771983 173 553 289 33000 57469 20000 4721 103021984 189 504 301 39299 70399 310000 3221 125111985 226 496 N/A 65567 N/A 56600 3236 N/A
Notes to Table 7-3(2):(a) 'Cocoa (b) column from Table 1-2(3), Annex 1.(b) Long-Run Direct Equilibrium Production froe Table 21.(c) Long-Run Total Equilibrium Production from Table 24.(d) Producer Price Equivalent at OER from Table 3-4(3) Annex 3.(e) Producer Price Equivalent at EER from Table 3-4(3) Annex 3.(f) Producer Price froe Table 3-3(2), Annex 3.(g) (Actual Border Price - Domestic Price) A ctual Production
+ 1/2(Actual Border Price - Doeestic Price)t(Direct Equilibrium Production - Actual Production)(h) (Adjusted Border Price - Actual Border Price) t Direct Equilibrium Production
+ 1/2(Adjusted Border Price - Actual Border Price)t(Total Equilibrius Production- Direct Equilibrium Production).
340

Table 7-3(3)
Very Long-Run Producer Price Transfer froe Cocoa Production
Production Border Price
EquilibriumActual (a) Direct (b) Total (c) Actual (d) Adjusted (e) Domestic Price (f) Direct (g) Indirect (h)
Year (000 at) (000 at) (000 it) (NC/it) (NC/et) (NC/at) (million NC) (million NC)
1958 256 279 233 512 442 239 73 -181959 317 360 301 403 390 224 61 -41960 430 444 375 307 331 224 36 101961 409 424 360 283 331 224 25 191962 413 446 376 298 314 220 34 71963 428 592 488 314 331 202 57 91964 538 726 573 236 221 187 31 -101965 401 648 519 219 370 187 17 881966 372 742 555 349 370 224 70 131967 423 845 598 516 365 254 166 -1091968 333 637 430 712 447 284 208 -1421969 419 828 587 773 663 293 299 -781970 434 1034 704 598 450 293 224 -1291971 477 1130 723 600 331 293 247 -2501972 427 806 491 678 287 366 192 -2531973 357 865 570 1083 703 439 394 -2731974 395 1013 693 1374 833 489 623 -4621975 416 1084 715 1129 578 585 408 -4951976 339 1179 761 2260 1448 732 1160 -7881977 290 1124 616 2871 1602 1333 1088 -11041978 286 1227 666 8904 8365 2667 4719 -5101979 323 1177 729 7000 8860 4000 2250 17721980 284 1037 769 2727 10684 4000 -841 71861981 248 429 641 -200 19070 12000 -4127 103061982 198 694 563 19558 25417 12000 3371 36831983 173 1086 627 33000 57469 20000 8184 209541984 189 1031 680 39299 70399 30000 5674 266061985 226 1055 N/A 65567 N/A 56600 5743 N/A
Notes to Table 7-3(3):(a) 'Cocoa (b) coluen from Table 1-2(3), Annex 1.Ib) Very Long-Run Direct Equilibrium Production from Table 22.(c) Very Long-Run Total Equilibrium Production from Table 25.(d) Producer Price Equivalent at OER from Table 3-4(3) Annex 3.(e) Producer Price Equivalent at EER from Table 3-4(3) Annex 3.(f) Producer Price from Table 3-3(2), Annex 3.Cg) (Actual Border Price - Domestic Price) t Actual Production
+ 1/2(Actual Border Price - Domestic Price)t(Direct Equilibrium Production - Actual Production)(h) (Adjusted Border Price - Actual Border Price) I Direct Equilibrium Production
+ 1/2(Adjusted Border Price - Actual Border PricelS(Total Equilibrium Production- Direct Equilibrium Production).
341

Table 7-4
Indirect Input Subsides to Agriculture(eillion NC)
Actual Value of Adjusted Value of IndirectYear lIported Inputs (a) Ieported Inputs (b) Subsidy (ct
(1) (2) (3)
1954 1.06 N/A N/A1955 1.47 N/A N/A1956 2.12 N/A N/A1957 2.58 N/A N/A1958 2.48 3.07 .591959 4.91 6.85 1.541960 6.02 9.75 3.731961 4.00 7.32 3.321962 3.00 4.94 1.941963 8.93 14.72 5.791964 3.92 7.18 3.261965 6.96 20.10 13.141966 3.41 7.59 4.181967 3.04 4.49 1.45196B 2.19 3.24 1.051969 7.42 10.62 3.201970 6.43 9.90 3.471971 7.51 11.30 3.791972 8.30 10.32 2.021973 12.38 14.53 2.151974 16.61 21.23 4.621975 15.43 22.27 6.841976 21.24 38.05 16.811977 32.24 116.91 84.671978 32.00 133.30 101.301979 64.64 195.33 130.691980 63.96 318.88 254.921981 75.57 1001.69 926.111982 43.58 672.06 628.48
Notes to Table 7-4:(al Shana, External Trade Statistics, various years. Data far
1972, 1975, and 1979-1981 are from World Bank, Ghana: TowardsStructural Adjustment, October 7, 1985, vol. 11, pp. 22,23,adjusted to reflect coverage in other years.
(bt Value of Iaported Inputs multiplied by the ratio of theEquilibrius Exchange Rate, derived using the simulation eodel,to the Official Exhcange Rate, froa Table 4 in the text.
kc) Coluen (2) minus column I1).
342

Table 7-5
Government Expenditure Transfers to Agriculture (a)(million NC)
Recurrent Investeent (b)
Roads and Roads andWaterways Agriculture Total Naterways Agriculture Total
Year (1) (2) (3) (4) (5) (6)
1953 N/A N/A N/A N/A N/A N/A1954 N/A N/A N/A N/A N/A N/A1955 N/A N/A N/A N/A NIA N/A1956 N/A N/A N/A N/A N/A N/A1957 N/A N/A N/A N/A N/A N/A1958 8.4 14.0 22.4 4.7 1.7 6.41959 8.4 13.5 21.9 6.0 3.8 9.81960 8.2 14.0 22. 2 6.1 4.6 10.71961 9.1 23.3 32.4 4.5 4.4 8.91962 8.0 17.4 25.4 4.0 3.5 7.51963 12.0 14.8 26.8 3.3 9.9 13.21964 8.2 15.3 23.5 8.8 11.3 20.11965 6.8 20.4 27.2 6.1 18.8 24.91966 4.8 19.8 24.6 3.0 7.4 10.41967 2.4 19.3 21.7 5.8 6.0 11.81968 3.8 19.7 23.5 11.4 6.5 17.91969 5.5 23.4 28.9 17.1 5.1 22.21970 5.3 25.1 30.4 25.3 5.3 30.61971 4.8 25.3 30.1 24.2 8.2 32.41972 6.2 31.5 37.7 20.0 7.7 27.71973 15.9 29.1 45.0 13.2 12.5 25.71974 29.7 53.8 82.5 36.8 22.4 59.21975 36.8 70.1 106.9 74.6 36.8 111.41976 19.5 125.7 145.2 130.1 66.5 196.61977 42.0 343.6 385.6 150.5 82.8 233.31979 78.5 342.9 421.4 123.0 133.0 256.01979 81.4 487.0 568.4 104.4 84.1 188.51980 135.8 721.4 857.2 244.1 220.2 464.31981 131.6 803.1 934.7 209.1 166.4 375.51982 123.4 827.6 951.0 261.3 134.9 396.21983 177.8 1,389.6 1,567.4 739.5 147.3 886.91984 423.3 936.3 1,359.6 1,467.4 384.3 1,851.7
Notes to Table 7-5:(a) Prior to 1983, the fiscal year was July 1 - June 30; since
1983, the fiscal year has been January 1 - December 31; Sourcesare: Ghana, Office of the Government Statistics, QuarterlyDigest of Statistics, various issues for 1958-1964; Irving Kaplan, et al,Area Handbook for Ghana, Nashington: U.S. Government PrintingOffice, 1971, pp.336,337 for 1965-1968; Warld Bank, 6hana:Towards Structural Adjustment, vol II, pp. 37 and 39 for 1969-1982;World Bank, Ghana: Policies and Issues of Structural Adjustment, March 1987,pp. 123 and 125, for 1983-84.
(bl In addition to expenditures on goods and services, includes interest,grants, loans and advances, etc.
343

r34le 7-4
datai. Yt/, Loeq-ue Estisittio of l Aqricavitural W tir ttt Abuce ,f Price Int,rvnet&t0s. __.. _________,............................______. _._. ___...................... _.............
iutPVtn LA 4b4rtc of Do3 ntac Pricn esto 44s4rc
Actual Price Dhstor'tlot4 Actual bast.u ricr 1 1 of MicI Iistartaoes :1ArIbCUultural kctual Otpu8t (040 It) (It (9C/8tl (IElet) No I. ttrmto"
SDt (t -------------------------------------------------- ------------------- - .............................. 49Ct upi I
flilliO Mi 9ai. lb) Rice lb) Cocoa (c) maize RiCe CKio° %aiIV Rice Cocoa "Alm: Rice Cocoa (edlia. C)'mar 1L) (2, [1 ' 4) (5) i1) 17 (8) 11) 101 ill) (12) 1153 (141
.. . . . . . - - - - -- - - - - - - -- . ... -- . - --. .. -- - . ... .... ----- ... .
I9?S 352 19 2: Zq It/ i/O 0 34 9C l 21 ll tO /4 4(4954 350 149 : 2$ co 2t 237 44 3O0 244 97 94 "I/
1757 3I4 119 2' D!5 25 1 172 25 101 .it 114 101 itl A/0
1548 302 183 30 254 535 24 33 39 t0 2Z9 113 133 442 4771959 440 N/4 4/4 317 554 15 301 29 84 :24 00 134 3991390 355 VIA 32 430 504 79 75 At 224 W17 144 Zl 311941 3:9 4(4 30 409 447 45 340 47 43 224 194 104 331 "1Q42 .74 149 "1 413 lno *3 3t 44 54 220 131 132 *14 So
1943 395 143 23 428 473 42 * 4U 50 137 202 4U 14 331 443044 437 170 42 538 316 42 573 44 97 Is? 137 129 221 4753Q43 594 206 32 401 : .S 519 44 13U 147 33 21t 370 727
1744 57 5t 29 372 2C7 28 555 45 124 224 74 224 370 7741947 405 27t 42 423 14e 44 59 37 125 254 50 144 345 71I1964 710 253 42 333 237 39 430 73 314 214 174 242 447 u3s1949 li9 300 40 41t *75 43 57 119t 14 295 173 234 043 32241970 3751 442 49 434 471 50 304 Ii 1 293 37 215 450 12181971 1104 4b5 55 477 14 54 723 S7 11i 2t 175 531 117i
192 1311 402 7 4*7 "'t 76 491 137 275 34 442 1U1 :7 135197 '7135 427 42 357 t74 42 570 142 312 439 54 275 703 19281974 2385 44 713 35 140 5 493 151 355 48r 176 542 833 27201975 2514 343 71 414 o5 So 71S 185 497 55 199 377 574 2o5017" 330I 2 70 339 12: 49 71 449 IOt9 732 235 434 144i 41131977 6274 274 300 2"i 42 74 414 970 1355 1133 1203 1094 1t42 41i4I97S 1.742 :18 108 2gb 50 St 444 804 1411 2447 2344 1914 4345 174241Q79 14924 140 9 323 144 43 729 3L34 139f 44 3794 1705 iU° 221711Q40 24021 382 74 24 143 54 740 3241 5777 44tO 571 4449 10t4 341983 :9553 378 07 244 57 48 441 5845 6545 12804 10119 15t0S 3t97o 4t 921982 49572 U44 34 198 42 4 5i5 St59 15580 12000 719 IS559 25417 39443Q83 10997 173 40 173 13 27 .27 31537 45145 2004o 17U3t 25US5 57449 1341341944 1M232 574 u4 I"4 16 34 480 3110l 41171 30000 22545 28147 1039 li34141985 351371 43L 90 224 tl4 r4. 4It 11819 29451 54404 4/4 414 914 414
votes to Table 7-0:(al For sourcn, 4 rttt (4) Oable 5.
(bi Fro. 4Amns Table 1-211.Icl Fror 4aw. tdl41 1-22).Idl Totol, Very Loan-Rua Egoilibrive Output fror Tbit4 5.(e( From Thole 10.'f) or8durcr Price Equivalentt (EEO) Iron 7.Tl4 3-4(3) for ricp,
TabIe 3-4(2) for a4e, and table 3-4() for cocoa.
(r) 0ie-r o by tb* formula (iI coluw.ar t,res):
((11- ((2t01 * 3(209 * '4813)/ltoWI * (3i3til * (41t2) * 01713mimll0/
344

Table 7-7
Government Expenditures (a)(million NC)
Year Recurrent Investment Total
1958 91 33 1241959 101 55 1561960 144 82 2261961 142 91 2331962 147 101 2481763 162 105 2671?64 202 128 3301965 220 142 3621966 204 65 2691967 245 69 3141?68 300 67 3671969 357 84 4411970 362 108 4701971 400 104 5041972 439 96 5351973 597 169 7661974 849 286 11351975 1056 441 14971976 1361 637 19981977 2364 695 30591978 2978 760 37381979 4172 595 47671980 6564 1390 79541981 8603 927 95301982 8029 817 88461983 13401 1354 147551984 22700 3994 26694
Notes to Table 7-7:(a) Figures for Recurrent and investeent
Expenditures for 1958-1964 are from:Foreign Trade Regiees & EconomicDevelopment: 6hana, by J. Clark Leith,Vol. II. Recurrent Expendituresrepresents Total Current Expenditure,and Investment represents CapitalExpenditures plus Transfer Payments.
For 1965-1984 see notes of Table 7-5,Annex 7.
345

ANNEX 8: REAL EQUILIBRIUM INCOKE
rs . . E ' _ E _ .aG
r- - -----. -;E°S_sgto5s8i-.::r 5r a
gm= As Z2 A to AR Z&A I__M=°m:_ ;;Z §--Mss~~~~~~~~~~~ --
At
I~~~~~~~~~~~~~~~~~~~~~~~~I
I: S
|, :~ I _,
PA=I -
. A_-. °_ -- ' _ _f,- __5_ , S
K v_N_--rw^o-Ei_-2°
- ii3f
.'
*1 X GiGo!_oi.
-_I tp_§Eis-__-S#=aS
ZA i
_ _. , .i _s Os e ~_ 8 s= sS * 8346t

Notes to Table 8-I1):(a) Actual Fars Income (12) divided by the sum of the expenditure shares for
rice, maize, and other (from Annex Table 8-4(1)), sultiplied by their respectiveprice indices (from Annex Table 8-4(1).
(b) Instantaneous Farm Income (13) divided by the sum of the expenditure sharesfor rice, saize, and other (from Annex Table 8-4(1)), multiplied by their respectiveprice indices (from Annex Table 8-4(1)).
(c) Short-Run Fare Income (14) divided by the sum of the expenditure shares forrice, maize, and other (from Annex Table 8-4(1)), oultiplied by their respectiveprice indices (from Annex Table 8-4(1)).
(d) Long-Run Farm Income (151 divided by the sum of the expenditure shares forrice, maize, and other (from Annex Table 8-4(1)), multiplied by their respectiveprice indices (from Annex Table 8-4(1)).
(el Very Long-Run Farm Income (16) divided by the sum of the expenditure sharesfor rice, maize, and other (from Annex Table 8-4(1)), multiplied by their respectiveprice indices (from Annex Table 8-4(1)).
(f) Actual Cocoa Producer Price from Annex Table 3-3(2).(g) Producer Price Equivalent of Cocoa from Annex Table 3-4(3).(h1 Actual Cocoa Production from Annex Table 1-2(3).(l Short-Run Direct Equilibrium Cocoa Production from Table 20.Ij) Long-Run Direct Equilibrium Cocoa Production from Table 21.(k) Very Long-Run Direct Equilibriue Cocoa Production from Table 22.(1) Farm Income is 1.92 multiplied by the ratio of Actual Production in
the given year to Actual Production in 1955 and by the Actual Producer Price (6).1.92 at is obtained by multiplying 3.697 at produced on a typical fare ir, 1970 bythe ratio of actual production in 1955 to actual production in 1970.
(m) Farm Income is 1.92 multiplied by the ratio of Actual Production in the given yearto Actual Production in 1955 and by the Direct Equilibrium Producer Price (7).
(n) Farm Income is 1.92 multiplied by the ratio of Short-Run Equilibrium Production (91) in the givenyear (from Table 20) to Short-Run Equilibrium Production in 1955 and by the Direct EquilibriumProducer Price (7).
(a) Farm Income is 1.92 multiplied by the ratio of Long-Run Equilibrium Production (10) in the givenyear (from Table 21) to Long-Run Equilibrium Production in 1955 and by the Direct EquilibriumProducer Price (7).
(p1 Farm Income is 1.92 multiplied by the ratio of Very Long-Run Equilibrium Production (11) in the givenyear (from Table 22) to Very Long-Run Equilibrium Production in 1955 and by the Direct EquilibriumProducer Price (7).
347

----------- - -- -- a-- ---- -- --- ,- '
_- - - .
- - - -w-5o YS44 §- - - - *X - ---
------
a a-a-.-. n-
~~~~~~~~~~~~~~~~~~~~~~~~~~~~~~~~~~~ Pa -oi
-a _ _ _ -- __O_S~X____ .................................................... ___.... . ..

Notes to Table 8:1(2):(a) Actual Fare Incoae (12) divided by the sus of the expenditure shares for
rice, maize, and other (from Annex Table 8-4(2)), *ultiplied by their respectiveprice indices (from Annex Table 8-4(2)).
(b) Instantaneous Farm Income (13) divided by the sue of the expenditure sharesfor rice, maize, and other (from Annex Table 9-4(2)), multiplied by their respectiveprice indices Ifrom Annex Table 8-4(2)).
(c) Short-Run Farm Income (14) divided by the sue of the expenditure shares forrice, maize, and other (from Annex Table 8-4(2)), multiplied by their respectiveprice indices (from Annex Table 8-4(2)).
(d) Long-Run Fare Income (15) divided by the sum of the expenditure shares forrice, maize, and other (from Annex Table 8-4(2)), multiplied by their respectiveprice indices (from Annex Table 8-4(2)).
(e) Very Long-Run Farm Income (16) divided by the sue of the expenditure sharesfor rice, maize, and other (from Annex Table 8-4(2)), multiplied by their respectiveprice indices (from Annex Table B-4(2)).
(f) Actual Cocoa Producer Price from Annex Table 3-3(2).(g) Producer Price Equivalent of Cocoa (EER) from Annex Table 3-4(3).(h) Actual Cocoa Production from Annex Table 1-213).(i} Short-Run Total Equilibrium Cocoa Production from Table 23.(j) Long-Run Total Equilibrius Cocoa Production from Table 24.(k) Very Long-Run Total Equilibrium Cocoa Production from Table 25.(1) Fare Income is 1,92 multiplied by the ratio of Actual Production in the given
year to Actual Production in 1955 and by the Actual Producer Price (6). 1.92 atis obtained by multiplying 3.697 at produced on a typical farm in 1970 by theratio of actual production in 1955 to actual production in 1970.
(In) Farm Income is 1.92 multiplied by the ratio of Actual Production in the givenyear to Actual Production in 1955 and by the Total Equilibrium Producer Price (7).
(n) Farm Income is 1.92 multiplied by the ratio of Short-Run Equilibrium Production (9)in the given year (froe Table 23) to Short-Run Equilibrium Production in 1955 andby the Total Equilibrium Producer Price (7).
(o) Farm Income is 1.92 multiplied by the ratio of Long-Run Equilibrium Production (10)in the given year (from Table 24) to Long-Run Equilibrium Production in 1955 andby the Total Equilibriua Producer Price (7).
(p) Farm Income is 1.92 multiplied by the ratio of Very Long-Run Equilibrium Production (11)in the given year (from Table 251 to Very Long-Run Equilibrium Production in 1955 andby the Total Equilibrium Producer Price (7).
349

i viN cr E-9 .C.: I ' i.S0 .. ~rn 00 ~ CC.0 ~ t
.0 0 - i
is i , 4
= 0c .04S°* m " 0 H 0.~Ot~. kfr.0 0.J. f m- 7 ,
j 40 _ 000 oom<XvaSv 7_o2 ><>m_S;Sm
- 4 fl _ r500
i=o __Z=- r lE FmSa.I-4 0 .= 0~
_ _U 000.00C_= _C*s 00,.,0.,OINSe.4. m jU4j_ ° j
U ~~~~~~~~~~~~~~~~~~~~~~~~~~~~~~~~~~~~~~~~~~~~~~~~~~~~~~~~~~~~~~~~~~~~~~~~~~~~~~~~~~~~~~~~~~~~~~~~~~~~~~~~~~~~~~~~_____w
40 l.J ,4. -0n 0 t.I,00 . r. ~ ,t c r -0C~.
a 400 ~~~~~~~~00000 fl0. or..r.o~~~~~~~~~~~~~~~~~~~~~~~~ac-0.C Nfl 0.0 0t~~~~~~~~~~~~~~~~~~~~~~~~tN~~
i ~ ~ O 0r.rC 0 i0 *" i0f00
i WXj_<>l e e= a s.S onga 2 ino
Z~ ~ jn S. 0n0..O,I C0. 0 I 5o 4 I.....0 .000000000 ..- 0 .000 .... 0 ... 0

Notes to Table S-2(11(a) Actual Fare Income (10) divided by the sue of the caettr itents for
rice, maize, and other (from Table 8-4(1)), multiplied by their respectiveprice indices (from Table 8-4(1)).
(bl Instantaneous Fare Incoee (11) divided by the sue of the coefticients forrice, maize, and other (from Table 8-4(1)), multiplied by their respectiveprice indices (from Table 8-41)).
(c) Short-Run Fare Income (121 divided by the sue of the coefficients forrice, maize, and other (from Table 8-411)), multiplied by their respectiveprice indices (from Table 8-4(1)).
Id) Long-Run Farm Income 113) divided by the sue of the coefficients forrice, maize, and other (from Table 8-4(1)) multiplied by their respectiveprice indices (from Table 8-41)).
(e) Actual Rice Producer Price from Annex Table 3-3(1).(f) Producer Price Equivalent of Rice from Annex Table 3-4(1).(g) Actual Rice Production from Annex Table 1-2(1), multiplied by .65 to convert paddy to rice.(h) Short-Run Direct Equilibrium Rice Production from Table 20, multiplied by .65 to convert
paddy to rice.(i) Long-Run Direct Equilibrium Rice Production from Table 21, multiplied by .65 to convert
paddy to rice.(Ij Fare Income is 6.11 multiplied by the ratio of Actual Production in the given
year to Actual Production in 1956 and by the Actual Producer Price (5). 6.11 at isobtained by multiplying 25.358 at produced on a typical farm in 1973 times the ratio ofActual Production in 1956 to Actual Production in 1973, and by .65 to covnertpaddy to rice.
(k) Farm Income is 6.11 multiplied by the ratio of Actual Production in the givenyear to Actual Production in 1956 and by the Direct Equilibrium Producer Price (6).
(1) Fare Income is 6.11 multiplied by the ratio of Short-Run Equilibrium Production (a) in the given year(Table 20) to Short-Run Equilibrium Production in 1956 and by the Direct Equilibrium Producer Price (6).
(a) Farm Income is 6.11 multiplied by the ratio of Long-Run Equilibrium Production (9) in the given year(Table 21) to Long-Run Equilibrium Production in 1956 and by the Direct Equilibrium Producer Price (6).
351

i -- - -- -
_ Z ,
------------------ ----- ------- ~
i; t- i. Z__nr Gut tiaN t! tt
I S -- - - - - - 1 -
*~~~~~; -- Z = a -- Es _ 2 = a m 2w !! _- _ g: j e t
--- ----- ---- - --. --o - --- a !_
---- >a --* -- s--"- - ...- - =
3- ~ ~ ~
* ~~~~~~~~~~~~~~~~~~~~~~~~~~~~~~~~~~~~ = :. a u' a~~~~~~~~~~~~~~~~~~~~~~~~~~~~~~~~~~~~~~~~~~~~~~~~~~~~~~~~~~~~~~~~~~~~~~~~~~~~~~~~~~~~~~~~~~~~~~~~~~~~~~~~~~~~~~~~~~~~~~~~~~~~~~~~~~~~~~~ , ~~~~~___ ! .°- !^~~~~~~~~~~~~~~
:_ss_ w 0 S w = _ w w~ _ _ _ _ _ _ _ _ ___ _ _ _ e .2
, 3 *_ .. 4 =.__ JaL. Naaiow-.a... :ag -a !
I
_ I _
*~~~~~~~~~~~~~~~~~~~~ o I
! cc ! e.o
, ~_,,_ W m~9 ~_w t~o _~_ o_w _>D - I--a

Notes to Table 8-2(2):(a) Actual Fare Income (10) divided by the sum of the coefficients for
rice, maize, and other (from Table 8-41)), multiplied by their respectiveprice indices (froe Table 8-4(1)).
(b) Instantaneous Fare Income (11) divided by the sum of the coefficients forrice, uize, and other (from Table 8-4(11), multiplied by their respective
price indicn (from Table 8-4(1)).(c) Short-Run Fare Income (12) divided by the sum of the coefficients for
rice, uize, and other tfrom Table 8-4(1M), multiplied by their respectiveprice indices Ifroe Table 8-4(1)).
(d) Long-Run Farm Income (13) divided by the sum of the coefficients forrice, maize, and other (from Table 8-4(l)) multiplied by their respectiveprice indices (from Table 8-4(1)).
(e} Actual Rice Producer Price from Annex Table 3-3(1).(fJ Producer Price Equivalent of Rice IEER) from Annex Table 3-4(1).Ig) Actual Rice Production from Annex Table 1-2(1), multiplied by .65 to convert paddy to rice.(h) Short-Run Total Equilibrium Rice Production from Table 23, multiplied by .65 to convert
paddy to rice.(i) Long-Run Total Equilibrium Rice Production from Table 24, multiplied by .65 to convert
paddy to rice.(0) Fare Incose is 6.11 multiplied by the ratio of Actual Production in the given
year to Actual Production in 1956 and by the Actual Producer Price (5). 9.4 at isobtained by multiplying 25.358 et produced on a typical farm in 1973 times theratio of Actual Production in 1956 to Actual Production in 1973, and by .65 toconvert paddy to rice.
(k) Fare Income is 6.11 multiplied by the ratio of Actual Production in the givenyear to Actual Production in 1956 and by the Total Equilibrium Producer Price (6).
(1) Fare Income is 6.11 multiplied by the ratio of Short-Run Equilibrium Production (9) in the given year(Table 20) to Short-Run Equilibrium Production in 1956 and by the Total Equilibrium Producer Price (6).
(s) Farm Income is 6.11 multiplied by the ratio of Long-Run Equilibrium Production (9) in the given year(Table 21) to Long-Run Equilibrium Production in 1956 and by the Total Equilibrium Producer Price (6).
353

i t
!9 Z Z Z Z 9 - - - - - - - - - Z Z:T~~~~~~~~~~~~~~~~~~~~~~~~~~~~~~~i -
: - - - - - -i- --
a s55u..C 0.0- _s
='~~~~!t Z ~ ~ ~---- ----- -- - ------
w 0 o - - °i 5i - w Ca 505* jj
,~~~~~~~~~~~~~~ i_ i
i~~~~~~~~~~~~~~I
veve Cwo r oww*50 5.C s 3 , j
: --
i i~~~~~~~~~~~~~~~~~~~~~~ _*. i:
w g w O w tw _ _ _ w _ _ _ _ _ g i _ ii _ i _~~~~~~~3
- - - -- o m a m ~-om viwo-ws.,- ss,-:-i:
I - _is--N3JSS
i :- II M 40 N j_0 --

Notes to Table U-3(1)i(a) Actual Fare Incom (101 divided by the sum of the coefficients for
rice, maize, and other ffrom Table 9-4(1)), multiplied by their respectiveprice indices (froe Table 9-4(1)).
(bl Instantaneous Fare Income (11) divided by the sus of the coefficients forrice, maize, and other (from Table 9-4(1)), multiplied by their respectiveprice indices (from Table 6-4(111.
(c) Short-Run Farm Income (12) divided by the sum of the coefficients forrice, uize, and other (from Table 9-4(1)), multiplied by their respectiveprice indices (from Table 8-4(1)).
(d) Long-Run Farm Income (13) divided by the sum of the coefficients forrice, maize, and other (from Table 9-4(l)) multiplied by their respectiveprice indices (from Table 9-4(1)).
(e) Actual Maize Producer Price from Annex Table 3-3(1).(f) Producer Price Equivalent of Maize from Annex Table 3-4(2).(g) Actual Maize Production from Annex Table 1-2(1).(h) Short-Run Direct Equilibrius Maize Production fro& Table 20.
li) Long-Run Direct Equilibrium Maize Production from Table 21.ti) Fare Incose is 2.37 multiplied by the ratio of Actual Production in the given
year to Actual Production in 1956 and by the Actual Producer Price (5). 2.37 at isobtained by multiplying 6 at produced on a typical farm in 1973 ties the ratio ofActual Production in 1956 to Actual Production in 1973.
(k) Fare Incose is 2.37 multiplied by the ratio of Actual Production in the givenyear to Actual Production in 1956 and by the Direct Equilibrium Producer Price (6).
(I) Fare Incoee is 2.37 multiplied by the ratio of Short-Run Equilibrium Production (8) in the given year(Table 20) to Short-Run Equilibrium Production in 1956 and by the Direct Equilibrium Producer Price (61.
(s) Fare Income is 2.37 multiplied by the ratio of Long-Run Equilibrium Production (91) in the given year(Table 21) to Long-Run Equilibrium Production in 1956 and by the Direct Equilibrium Producer Price (6).
355

CC CO __ _ _ _ _ _ rC.4_ *- I "C' ~°~ s ._fln_ 3 __
SCOW
j,f __ 0_ ___on gg -- is °
* Ca t w D naC._ _ _ _, @5 ..- _ _o I_ j - C
i Io ~ C C C C.al p
jc_ - g < i na Cz .- fC,i fl tt0O 0 - --- °-o xsr n____
_ CO 5 C = l = 0 _ I.~ tJ ~ -t
: a :~
_l i
_ I e I O0'~
C - I i0.
ii i
¶ iC ~ tC Cll- S~ * C C if
i -io
3 .
i I
- eeC pCCC.-01.g.-C.C r--0t..0e5~~~~~~~~~~~~~~~~~~~~~~~~~~~~~~~~~~~~~~~~~~~~~~~~~~~~~~~~i C f ~ 05 C
- ___,, CCf.cCC _C e -CS t o_n~ai ;ri )¢
_ ~ ~ 5C i _'
~~~~~i ,.05 . - 5a j0=-~*0 _ i-0000..00-0

Notes to Table 8-3(2):
(a) Actual Farm Income 110) divided by the sum of the coefficients forrice, maize, and other (from Table 8-4)1)), multiplied by their respectiveprice indices (from Table 8-4(1)).
(b) Instantaneous Farm Income (l1) divided by the sum of the coefficients forricg, maize, and other (from Table 8-4(1)), multiplied by their respectiveprice indices (from Table 8-4(l)).
(c) Short-Run Farm Incoew (12) divided by the sue of the coefficients forrice, maize, and other (from Table 8-4(1)), multiplied by their respectiveprice indices (from Table 8-4(1)).
(d) Long-Run Farm Income (13) divided by the sum of the coefficients forrice, maize, and other (from Table 8-4(l)) multiplied by their respectiveprice indices (from Table 6-4(l1).
(e3 Actual Maize Producer Price from Annex Table 3-3(1).(f) Producer Price Equivalent of Maize (EER) from Annex Table 3-4(2).(g) Actual Maize Production from Annex Table 1-2(l).(h) Short-Run Total Equilibrium Maize Production from Table 23.(i) Long-Run Total Equilibrium Maize Production from Table 24.(j) Fare Income is 2.37 multiplied by the ratio of Actual Production in the given
year to Actual Production in 1956 and by the Actual Producer Price (5). 2.37 et isobtained by multiplying 6 at produced on a typical fare in 1973 times the ratio ofActual Production in 1956 to Actual Production in 1q73.
(k) Farm Incose is 2,37 multiplied by the ratio of Actual Production in the givenyear to Actual Production in 1956 and by the Total Equilibrium Producer Price (6).
(1) Farm Income is 2.37 multiplied by the ratio of Short-Run Equilibrium Production (8) in the given year(Table 20) to Short-Run Equilibrium Production in 1956 and by the Total Equilibrium Producer Price (6).
(a) Farm Income is 2,37 multiplied by the ratio of Long-Run Equilibrium Production (9) in the given year(Table 21) to Long-Run Equilibrium Production in 1956 and by the Total Equilibrium Producer Price (6).
3 57

Table 8-4(11
Expenditure Shares and DirKet Equilibrius Price Indices
(NC per it) (NC per st) Rice Price Maize PriceConsumer Price of Rice Consumer Price ot Maize Index Index---------------------- ---------------------- (1972=100) (1972:100)
Expenditure Shares (a) Overall Direct Direct --------------- -------------------------------------- CPI (b) Actual (c) Equil (d) Actual (e) Equil (f) Actual Equil Actual Equil
Year Rice Maize Other (1972:100) (21) (22) (23) (24) (25) (261 (27) (28)
1953 .016 .016 .968 38 190 N/A 67 N/A 44 N/A 34 N/A1954 .016 .016 .968 37 176 191 57 92 41 79 29 201955 .016 .016 .968 37 155 164 54 133 36 67 27 291956 .016 .016 .968 38 158 151 66 127 37 62 33 271957 .016 .016 .968 39 159 160 44 146 37 66 22 321958 .016 .016 .968 40 158 159 61 119 37 65 31 261959 .016 .016 .968 40 143 143 49 92 33 59 25 201960 .016 .016 .968 41 124 133 49 123 29 54 25 271961 .016 .016 .968 41 121 128 71 135 28 53 36 291962 .016 .016 .968 44 115 125 70 111 26 51 35 241963 .016 .016 .968 48 211 132 77 47 49 54 39 t01964 .016 .016 .968 53 174 116 98 102 40 48 50 221965 .016 .016 .968 67 233 146 126 61 54 60 64 131966 .016 .016 .968 76 236 159 129 59 55 65 65 131967 .016 .016 .968 69 224 184 71 62 52 76 36 131968 .016 .016 .968 75 221 264 115 161 51 108 58 351969 .016 .016 .968 90 278 255 170 166 64 105 86 361970 .016 .016 .968 83 310 225 135 55 72 92 6e 121971 .016 .016 .968 91 320 206 138 95 74 85 69 201972 .016 .016 .968 100 433 244 198 463 100 100 100 1001973 .016 .016 .968 119 519 388 212 97 120 159 107 211974 .016 .016 .968 140 571 634 231 208 132 260 117 451975 .016 .016 .968 181 792 450 287 212 181 184 145 46I976 .016 .016 .968 283 1604 600 656 236 371 246 330 511977 .016 .016 .968 612 2269 575 1368 521 524 236 689 1131978 .016 .016 .968 1059 3083 880 1396 879 712 361 703 1901979 .016 .016 .968 1690 3509 1354 1979 1841 811 555 997 3971980 .016 .016 .968 2454 9495 1781 4763 1372 2193 730 2400 2961981 .016 .016 .968 5313 13701 2163 8914 1823 3165 887 4492 3941982 .016 .016 .968 6499 25409 2074 9190 1669 5870 850 4631 3601983 .016 .016 .968 14482 68767 2933 42245 3296 15885 1203 21289 7111984 .016 .016 .968 20213 94313 19322 26885 13427 21787 7922 13549 28"1985 .016 .016 .968 22311 58617 25034 22790 16404 13541 10264 11485 3541
Notes to Table 8-4(1):(a) Derived froe The Summry Report on Household Economic Survey, 1974-1975.(b) Combined Consumer Price Index from Annex Table 3-5(1).(c) Retail Price of Riee fros nnex Table 3-3(1).(d) Retail Price Equivalent (OER) of Rice from Annex Table 3-4(1).te) Retail Price of Maize trom Annex Table 3-3(1).(f) Retail Price Equivalent (DER) of Maize from Annex Table 3-4(2).
358

Table 8-4(2)
Expenditure Shares and Total Equilibrium Price Indices
(NC per at) (NC per et) Rice Price Maizt PriceConsumer Price of Rice Consumer Price of Maize Index Index---------------------- ---------------------- (1972:100) (11972x1O0)
Expenditure Shares (a) Overall Totil Total ---)----- ---------------------------- CPI lb) Actual (c) Equil (d) Actual (e) Equil lf) Actual Equil Actual Equil
Year Rice Maize Other (1972:100) (21) (22) (23) (24) (25) (26) (27) (28)
1953 .016 .016 .968 38 190 N/A 67 N/A 44 N/A 34 N/A1954 .016 .016 .968 37 176 191 57 92 41 63 29 201955 .016 .016 .968 37 155 164 54 133 36 54 27 291956 .016 .016 .968 38 158 151 66 127 37 50 33 271957 .016 .016 .968 39 159 160 44 146 37 53 22 321958 .016 .016 .968 40 158 197 61 119 37 65 31 261959 .016 .016 .968 40 143 198 49 92 33 66 25 201960 .016 .016 .968 41 124 213 49 123 29 71 25 271961 .016 .016 .968 41 121 232 71 135 28 77 36 291962 .016 .016 .968 44 115 204 70 111 26 68 35 241963 .016 .016 .968 48 211 216 77 47 49 71 39 101964 .016 .016 .968 53 174 210 98 102 40 70 50 221965 .016 .016 .968 67 233 413 126 61 54 137 64 131966 .016 .016 .968 76 236 348 129 59 55 115 65 131967 .016 .016 .968 69 224 270 71 62 52 89 36 131968 .016 .016 .968 75 221 388 115 161 51 129 58 351969 .016 .016 .968 80 278 363 170 16 64 120 86 361970 .016 .016 .968 83 310 344 135 55 72 114 68 121971 .016 .016 .968 91 320 307 138 95 74 102 69 201972 .016 .016 .968 100 433 302 198 463 100 100 100 1001973 .016 .016 .968 118 519 454 212 97 120 150 107 211974 .016 .016 .968 140 571 808 231 208 132 268 117 451975 .016 .016 .968 181 782 643 287 212 181 213 145 461976 .016 .016 .968 283 1604 1060 656 236 371 351 330 511977 .016 .016 .968 612 2269 1973 1368 521 524 654 689 1131978 .016 .016 .968 1059 3083 3432 1396 879 712 1138 703 1901979 .016 .016 .968 1690 3509 3860 1979 1841 811 1280 997 3971980 .016 .016 .968 2454 9495 8198 4763 1372 2193 2718 2400 2961981 .016 .016 .968 5313 13701 24119 8914 1823 3165 7997 4492 3941982 .016 .016 .968 6499 25409 25443 9190 1669 5870 8436 4631 3601983 .016 .016 .968 14482 68767 46572 42245 3296 15885 15442 21289 7111984 .016 .016 .968 20213 94313 55875 26885 13427 21787 18527 13549 28981985 .016 .016 .968 22311 58617 N/A 22790 16404 13541 N/A 11485 3541
Notes to Table 8-4(2):(a) Derived from The Su"ary Report on Household Economic Survey, 1974-1975.(bl Combined Consuser Price Index from Annex Table 3-5(1).(c) Retail Price of Rice from Annex Table 3-3(1).(d) Retail Price Equivalent (EER) of Rice from Annex Table 3-4(1).(e) Retail Price of Maize froe Annex Table 3-3(1).(f) Retail Price Equivalent (EER) of Maize froe Annex Table 3-4(2).
359


References
Ahwoi, Kwesi, and Anandan Narayanan. "Restructuring the Cocoa MarketingSystem in Ghana -- Some Application of the Malaysian Experience."Washington D.C., World Bank, July 1-August 15, 1986.
Askari, Hossein, and John Thomas Cummings. Agricultural Supply Response: ASurvey of the Econometric Evidence. New York: Praeger, 1976.
Beckman, Bjorn. Organizing the Farmers: Cocoa Politics and NationalDevelopment in Ghana. Uppsala: Scandinavian Institute of AfricanStudies, 1976.
Bond, Marian E. Agricultural Responses to Prices in Sub-Saharan AfricanCountries. IMF Staff Papers, 30(4), December, 1983.
Building and Road Research Institute. "Highway Research Programme."Inception Report, 1977.
Chazen, Naomi. An Anatomy of Ghanaian Politics: Managing PoliticalRecession, 1969-1982. Boulder, Colo: Westview, 1983.
Economic Intelligence Unit. Quarterly Economic Review: Ghana, No. 2(1982).
Ewusi, Kodwo. "The Rate of Inflation, Variation in Local Food Prices, andthe Effect of Transport Facilities on Local Food Prices in Ghanain the Sixties." In Factors of Agricultural Growth in WestAfrica, ed. I. M. Ofori. Legon: Institute of Statistical, Social,and Economic Research, University of Ghana, 1973.
Food and Agriculture Organization (FAO). Ghana -- Third Cocoa Project.Draft Report of the FAO/World Bank Cooperative Programme.Investment Centre, August 29, 1986.
Ghana. "Government Statement on the Report of the Committee Appointed toEnquire into the Local Purchasing of Cocoa." Accra, W.P. No. 3,1967.
Central Bureau of Statistics. Statistical Yearbook, 1969-70.
_ Central Bureau of Statistics. Summary Report of HouseholdEconomics Survey, 1974-1975. Accra: July, 1979.
Ghosh, R.N. "Price Build-Ups of a Few Imported Food Commodities in Ghana."Technical Publication Series 32. Legon: Institute of Statistical,Social and Economic Research, 1972.
Haessel, Walter. "The Demand for Agricultural Commodities in Ghana: AnApplication of Nonlinear Two-State Least Squares with PriorInformation." American Journal of Agricultural Economics, Vol.58,No. 2 (May 1976).
361

Hymer, Stephen. "The Political Economy of the Gold Coast and Ghana", inGustav Ranis, ed., Government and Economic Development. NewHaven: Yale University Press, 1971.
Kerfkes, Frederick D. "Agricultural Price Policy in Ghana." GhanaMinistry of Agriculture, April 1976.
Killick, Tony. Development Economics in Action: A Study of EconomicPolicies in Ghana. New York: St. Martin's Press, 1978.
Leith, J. Clark. Foreign Trade Regimes and Economic Development: Ghana.New York: Columbia University Press, 1974.
Merrill, J. Bateman. "An Econometric Analysis of Ghanaian Cocoa Supply,"in R.A. Kotey, C. Okali, and B.E. Rourke, eds., Economics of CocoaProduction and Marketing, Legon: University of Ghana, 1974.
__ _ Cocoa in the Ghanaian Economy: An Econometric Model.Amsterdam: North-Holland, 1968.
Mettrick, H. Policies and Institutions in Ghanaian Agriculture.University of Reading, June 1971.
Nyanteng, V.K., and G. J. van Apeldoorn. "Some Development Implications ofFarmers' Problems in Marketing Their Foodcrops." In Factors ofAgricultural Growth in West Africa, ed. I. M. Ofori. Legon:Institute of Statistical, Social, and Economic Research,University of Ghana, 1973.
Oquaye, Mike. Politics in Ghana (1972-1979). Accra: Tornado, 1980.
Pearson, Scott R., J. Dirck Stryker, Charles P. Humphreys, et al. Rice inWest Africa: Policy and Economics. Stanford, Calif: StanfordUniversity Press, 1981.
Pinkey, Robert. Ghana under Military Rule, 1966-1969. London: Methuen,1972.
Singal, M.S., and J.D.N. Nartey, Sources and Methods of Estimation ofNational Income at Current Prices in Ghana. Ghana Central Bureauof Statistics, 1971.
Stryker, J. Dirck. "Determination of the Cocoa Producer Price: ATechnical Note." Prepared for the Government of Ghana and theWorld Bank, October 22, 1986.
362

World Bank. Current Economic Position and Prospects of Ghana. Washington,October 1974.
___ _ Appraisal of Ashanti Region Cocoa Project. Washington,November 1975.
_ Ghana: Agricultural Sector Review. Washington, April 1978.
_ Ghana: Economic Memorandum. Washington, April 1979.
_ Ghana: Restoring Economic Growth. Washington, October 1981.
_ Ghana: Policies and Programs for Adjustment. Washington, 1984.
Ghana: Managing the Transition. Washington, November 1984.
_ Ghana: Towards Structural Adjustment. Washington, October1985.
_____ . Ghana: Policies and Issues of Structural Adjustment.Washington, March 1987.
363

Distributors of World Bank PublicationsARGENTINA FINLAND MEXIOD SPAIN
Carlo lHscl SRL A u Kl mp INPOTEC Mundi-Preas Ubras, S
GaleeiaGuoxem P.O. BoM 130 oApned Poata 22-M Cmbelic,37
1l3ida 165,4th Her-Ofk 453/465 SF4fRICl I4060Tl1p MemrcoD.F. 222J1 Madrid
1335 BkareneAlres Halalnl 10MOROCCO Ulralalnb-1r-aonal AEDO
AUSTRALIA. PAUA NEW GUINEA FRANCE Socieft d'E de, MarrdAing Marocaine CaseS de Crl., 391
FIJI.SOLOMON ISLAND5, WcvAdEankFuMlmcaima I2 nseMeaaeBcEdArdAa 08"Beretum.t
VANUATU, AND WESTERN SAMOA 65, aernm d'Iha Camblance
DA. Bod1. &jomals 751161aris SRI LANKA AND THE MALDIVES
11-13 SLaiara B NETHERLANDS Lak HeuBo Sekahrp
Mu 3132 GERMANY, FEDERAL REPUBLIC OF In ruMjlrsNb.v. P.O. Box 244
Vicmeda UNO-V-og P.O. Bx 14 10D, Sir Cl0tamplam, A. Gardiree
Poppeladurxfr AmIr 3 72240 BA Lacber M-tah.
AUSTRIA D-5351 1 BaBn 1 Calrrbao 2
Geaeld and Co. NEW ZEAI.AND
Graban3i GREECE H1 iubry adInfdrdration S.-ce SWEDEN
A-10l1 Wien RIME PrivairEag Fai.8klWas,
24, EppoAetb euSe li.H. laUra New Mrket Feitze. Fmckbokfitget
B DAHEAIN Atheara-116 Auddand Regenpgatn 12, lo 16356
Babrrats Research nd Cenau&any S-103 27 Stc&holcu
Aaaoda , lid. GUATEMALA NIGERIA
P.O. Bo, 221053 lilvelin Piedra Santa rv Ft Jte
Mana Town 317 CL9Culh Pidr. Snta re PumDced Waerp-Williuo s AB
11 caSe 6-5%cma 1 Private Mail Ea SINS SBa 3D1534
BANGLADESH Gualunal City Ibadm S-104 20SSiodhohm
Miron eduDevdav rnartCAsor Sodety (MIDAS) HONG KONG, MACAO NORWAY SWITZERLAND
HeuseS. Readi16 Asia 2D lid. Norvaeau, rhaoraxtion Center Formi.8k W=
2Canmedi R/Ar 6 RI 146P1rnce Edward Road,W. Be.OrmdN0veaan251i2 Lieie PayeG
tlrak. 120 Kowloon P.O. Box 6125 Eiirmt.i 6, ruenGuz
H-g KYg N-0602 OIo 6 C Ae pdtl 381
Beae.keeffo CHi 1211 Genrva 11
156 Nur Anmed Swak HUNGARY OMAN
Cittua 5 ag K4l sK MEMRB lfrmation Sevice Formea opiic,rde
P.O. Box 139 P.O. Box, 16l34 SeekAirport lIlr-rie Payoi
BELGIUM 139 Budapest 62 MiO.act Serviced-Abonneuent
P.bElattiona desNettenatUnles Caeapopsto 3312
A,. du Rd 202 INDIA PAKISTAN CH 1112 Lau1anne
1060 Brunel Allied PublEla Private Ltd. li.TA Book A1-y
751 Mount Road 65, Sh hraeJeQuid-Au TANZANIA
BRAZIL Madra s 6D0 Om2 P.O. Box No. 729 Ocfd Universty Peas
PubLhs-oTemBicasInternadcauh, Lahore3 P.O. eBe 5299
lid. SBriochgioac D. ce .Ealee
Ru PeicotoGr.oid49 1lSNHerediaMarg PERU
01409 SaoPuloa,SP B alard Ecte EdairalDesaroflSA TIAILAND
C Ambay .40D0315 Apamade 3324 CGnrrl D)epnrt t Stme
CANADA Lim. 3D6 lOSe Road
IA Diffumeur 13/14Aas lAeRoad B1Sakok
CFP.85,135rreAmpAre New Delhi- 11010G2 PINLIUTINES
Bisdr4I QOetec Nardel Book St.. TRINDAD & TOBAGO, ANTIGUA
J4B 556 17 ChftranjanAvenue 7MiRPizaiAvmeu BARBUDABARBADOS,
Cakuttb 70D - 72 P.O. Bmo 1934 DOMINICA, GRENADA, GUYANA.
CHINA MetroMenIa JAMAICA. MONTSERRAT, ST.
Cde. eanwdal & bEacanric, P'ubliableg layadrr. Hos"e ruilding KITTI' & NEVIS, ST. LUCIA,
House Ith Maie Read Gandlregar POLAND ST. VINCENT & GEENAD INE S
a, Da Fe SLiDagjie Bangalere.56003 ORP'AN 9Sputkrarr Studiea Unit
E..nBr Peta Krdtrry i Narak #lWahsSkree
3-5-1129 Kocgurd Crs d ass R.Ld (0 1 Wrazrawa Cunpe
COLOMBIA HydbW -500D 27 Trinidad, West India
Enl- Ltda. ~~~~~~~~~~~PORTUGALApabdoAee 34270 PrartbaRm Flat. 2nd Fleor L i Ph TURKEY
Bogota Ds. NemrThakrxeBmu& NxvrarTar Ruta Do Cmoe 70-74 Haset Ktiarl A.S.
AlCmRdabad -380 39 l2COLieba roiiklalCadde No. 469
COSTA RICA Exyogh.
iberinTr 4 oa PaltFla House SAUDIAARABL, QATAR Isarnbul
Caell 11-13 16-AAalhokMarg JadrBokStare
Av. Parnand" GueU Lutaduw -226 a1 P.O. Bo 3196 UGANDA
SenJe RLONESA jyadhIl471 Ugndad Boakahp
INDONESIA ~~~~~~~~~~~~~~~~~~~~~~P.O. E.n 7145
COTE D'IVOEIRE Pt L i LiitedIE MEMRB Infr-tion Services K-p74
CeamedEBditrmet ide Diffusira JL Sam Rstulaugi 37 Breed agi=o
A0tBaPn51 (CEDA P.O. Box 181 A Ae Stre UNr1ED ARAB EMIRATES
0i4 F. 541 JakartPlua Al Dn Centr MEMR Gulf Co.
A1ridjm04 Plateau BFirt Floor P.O. Boo 6097
IRtELAND P.O. Boo,718 Shariah.
CYPRUS TDC Fublishr r. Y7di
MIMES InforB ation Serv. 12 NorR Predehdck Stree Ry UNITED KiNGDOM
P.O. Box DubRinII 1 HajiAbduDlah Alr-a Building M udoinf.LAd.
qinowa hog Khralad Street P.O. Box 3
ITALY P.O. BD 396 Alton, Hampsire GU34 2PG
DENMARK liors Cwmninlaiarla Sanael SPA Dawi England
Safrudslslteralur Via B Iedeto Forni, 120/10
Roa97raeausAll11 Caenr F SDi25Pl 52 33, Mared H- Awed Street URUGUAY
DIC-1970 Frederlrebeg C 5)12S Florence P.O. Box 59 Insiotuto Nadcmal dei ibro
DOMINICAN REPUBUC JAPAN SaS nJosel1116
Editor: oTaller, C . Ao Ea74 seek 3 BnkSvi1 SINGAPORE, TAIWAN. MYANMAR,
Resivuad erreTabdla Ceiadixa 309 374% Heago3.Chmeartslkyo-lku 113 BRUNEI VENEZUELAApaSrado Faa 2150 Taipe Infen" Pubbc lbredi del loSe
Santo D-irgogePdvit Ltd. Aptdo. 60.337
EL SALVADOR Alric BookSrdKENYA 02-06 lt Fl,Pd-Pu lndustrial Crac 1060-A
EL SALVADOR ~~~~~~Africa Book Swrvim (EA-) lAd. 111,18
Fuade F.O. Bc45245 24NNew t ldugrialRead YUGOSLAVIA
Avenida Mctnuei akle Araujo 03530 Nairab Stag.Irore 195 Jirgosloetr. lIeu1 .
EdiEldoSISA, le.Pa YU-II0e05grdTrg Republik,
San Salvador KOREA.REPUBLICOF SOUTHAPRICA,BOTSWANAFon Ilerea Book Cosp=rtLa Perosisseirwer
EGYPT, ARAB REUBLIC OF P.O. Box 101, Kwargwhmns Wmn Univet Pra Southern
Al Airace_ Seaul Ah-
Al XUWAi P.O. Box 1141
Cdair KUIWAIT CpTwKMIEMRB loton..tiorSerice pes KO
TheMiddleflest0bIrereoP.P0 Box: 546 Fwekahatl,s adar
SChawarbiStreet PO SDXSI65 So mtServi
Cairo MALAYSIA .o. Box 41095
Univaily of Malay& Coopwatirve rsaBoollehop, Lmited Jdraen 2D24
P.O. Box 1127, Ja.n ffaiaBaru X-. luMper


The World Bank
Headquarters European Office Tokyo Office1818 H Street, N.W. 66 avenue d'Iena Kokusai BuildingWashington, D.C. 20433, U.S.A. 75116 Paris, France 1-1 Marunouchi 3-chome
Telephone: (202) 477-1234 Telephone: (1) 40.69.30.00 Chiyoda-ku, Tokyo 100, JapanFacsimile: (202) 477-6391 Facsimile: (1) 47.20,19.66 Telephone: (3) 214-5001Telex: WUI 64145 WORLDBANK Telex: 842-620628 Facsimile: (3) 214-3657
RCA 248423 WORLDBK Telex: 781-26838Cable Address: INTBAFRAD
WASHINGTONDC
0-8213-1443-2
Related Documents