Tracing and modeling preferential flow in a forest soil — Potential impact on nutrient leaching Gregory van der Heijden a, ⁎, Arnaud Legout a , Benoît Pollier a , Claude Bréchet b , Jacques Ranger a , Etienne Dambrine c a Unité Biogéochimie des Ecosystèmes Forestiers, INRA de Nancy, Route d'Amance, 54 280 Champenoux, France b UMR INRA-UHP Ecologie et Ecophysiologie Forestière, INRA de Nancy, Route d'Amance, 54 280 Champenoux, France c INRA-Université de Savoie, UMR CARRTEL, 73376 Le Bourget du Lac, France abstract article info Article history: Received 15 March 2012 Received in revised form 25 October 2012 Accepted 11 November 2012 Available online xxxx Keywords: Forest Hydrology Nutrient leaching Preferential flow Modeling Tracer Accurate nutrient budgets in forest ecosystems are needed in order to plan sustainable forest management on poor soils. Such budgets require precise measurements of water and nutrient leaching through the soil. This study aims to characterize the hydrological processes and compute hydrological budgets occurring in a very poor and acidic soil under a 30-year-old beech stand in the Morvan Mountains (France). A forest plot was set up with rain collectors, lysimeters and TDR probes, and we used a deuterated water tracing experiment and two hydrological models (BILJOU and HYDRUS-1D) to estimate the proportion of preferential and slow con- vective water flow, and to compute the influence of preferential flow paths on nutrient leaching. Preferential flow paths were evidenced by the deuterium tracing experiment. Tracer dynamic through the soil and soil water content variations were successively modeled. This approach enabled us to define the main condition leading to preferential flow generation (rainfall above 3.5 mm/h) and quantify the proportion of preferential flow (54%). Finally, the computed nutrient leaching fluxes of major elements Ca, Mg, NO 3 and Al were strongly increased when considering preferential flow paths. The experimental and modeling ap- proach proved to be complementary and we recommend the use of tracing experiments for better model cal- ibration, especially when their outputs are used to compute nutrient leaching fluxes. © 2012 Elsevier B.V. All rights reserved. 1. Introduction Input–output nutrient budgets are valuable diagnostic tools to de- termine the sustainability of forest soil fertility. Change in soil nutrient pools is computed as a mass balance of nutrient inputs (atmospheric deposition and mineral weathering flux) and outputs (net immobiliza- tion in forest biomass and leaching). As direct measurement of loss of water and nutrients by drainage is almost impossible (Bormann and Likens, 1967), nutrient leaching is often estimated by coupling the water fluxes from a deterministic flow model to nutrient concentrations in soil water. Water flow modeling has been extensively studied and there are many water flow models available (Granier et al., 1999; Kohne et al., 2009; Simunek et al., 2003; Starr, 1999) covering a wide range of complexity from whole soil profile models to finely discretisized profiles, and of two different types: pool and flux models and mechanistic models generally based on Richards' equation. Nutri- ent leaching is particularly sensitive to water flow. Modeling water flow is thus essential to compute precise input–output nutrient budgets (Ranger and Turpault, 1999). When using hydrological models to pre- dict water flow at the soil profile scale, calibration and validation are generally carried out using TDR, tensiometer or moisture measure- ments on soil samples data sets. However, to our knowledge few forest soil hydrology studies have validated model calibrations with addition- al water tracing experiments. Environmental isotopes ( 18 O and 2 H) through their natural isoto- pic fractionation have been widely used to trace water fluxes in eco- systems (Becker and Coplen, 2001; Ellsworth and Williams, 2007; Koeniger et al., 2010; Kulmatiski et al., 2010; Mali et al., 2007; Marc and Robinson, 2004; Meinzer et al., 2006), notably in catchment hy- drology (Maloszewski and Zuber, 1982; Maloszewski et al., 1992; McDonnell et al., 1999; Viville et al., 2005). An artificially deuterated solution may also be used to trace water flow in soils. This technique allows the collection of information such as the flow velocity or the porosity involved in transfer. This step is crucial for the precise cali- bration and setting-up of deterministic flow or transport models (Ptak et al., 2004). Forest soils require particular attention (Sidle et al., 2000; Uchida et al., 2001) mainly because their structure is rarely disturbed, hence the presence of well developed aggregates and pore systems, which are known to influence flow variability (Jarvis, 2007). Water transfer Geoderma 195–196 (2013) 12–22 ⁎ Corresponding author. Tel.: +338 83 39 73 27; fax: +338 83 39 40 76. E-mail addresses: [email protected] (G. van der Heijden), [email protected] (A. Legout), [email protected] (B. Pollier), [email protected] (C. Bréchet), [email protected] (J. Ranger), [email protected] (E. Dambrine). 0016-7061/$ – see front matter © 2012 Elsevier B.V. All rights reserved. http://dx.doi.org/10.1016/j.geoderma.2012.11.004 Contents lists available at SciVerse ScienceDirect Geoderma journal homepage: www.elsevier.com/locate/geoderma

Welcome message from author
This document is posted to help you gain knowledge. Please leave a comment to let me know what you think about it! Share it to your friends and learn new things together.
Transcript
Geoderma 195–196 (2013) 12–22
Contents lists available at SciVerse ScienceDirect
Geoderma
j ourna l homepage: www.e lsev ie r .com/ locate /geoderma
Tracing and modeling preferential flow in a forest soil — Potential impact onnutrient leaching
Gregory van der Heijden a,⁎, Arnaud Legout a, Benoît Pollier a, Claude Bréchet b,Jacques Ranger a, Etienne Dambrine c
a Unité Biogéochimie des Ecosystèmes Forestiers, INRA de Nancy, Route d'Amance, 54 280 Champenoux, Franceb UMR INRA-UHP Ecologie et Ecophysiologie Forestière, INRA de Nancy, Route d'Amance, 54 280 Champenoux, Francec INRA-Université de Savoie, UMR CARRTEL, 73376 Le Bourget du Lac, France
⁎ Corresponding author. Tel.: +338 83 39 73 27; fax:E-mail addresses: [email protected]
[email protected] (A. Legout), [email protected] ([email protected] (C. Bréchet), [email protected]@nancy.inra.fr (E. Dambrine).
0016-7061/$ – see front matter © 2012 Elsevier B.V. Allhttp://dx.doi.org/10.1016/j.geoderma.2012.11.004
a b s t r a c t
a r t i c l e i n f oArticle history:Received 15 March 2012Received in revised form 25 October 2012Accepted 11 November 2012Available online xxxx
Keywords:ForestHydrologyNutrient leachingPreferential flowModelingTracer
Accurate nutrient budgets in forest ecosystems are needed in order to plan sustainable forest management onpoor soils. Such budgets require precise measurements of water and nutrient leaching through the soil. Thisstudy aims to characterize the hydrological processes and compute hydrological budgets occurring in a verypoor and acidic soil under a 30-year-old beech stand in the Morvan Mountains (France). A forest plot was setup with rain collectors, lysimeters and TDR probes, and we used a deuterated water tracing experiment andtwo hydrological models (BILJOU and HYDRUS-1D) to estimate the proportion of preferential and slow con-vective water flow, and to compute the influence of preferential flow paths on nutrient leaching.Preferential flow paths were evidenced by the deuterium tracing experiment. Tracer dynamic through thesoil and soil water content variations were successively modeled. This approach enabled us to define themain condition leading to preferential flow generation (rainfall above 3.5 mm/h) and quantify the proportionof preferential flow (54%). Finally, the computed nutrient leaching fluxes of major elements Ca, Mg, NO3 andAl were strongly increased when considering preferential flow paths. The experimental and modeling ap-proach proved to be complementary and we recommend the use of tracing experiments for better model cal-ibration, especially when their outputs are used to compute nutrient leaching fluxes.
© 2012 Elsevier B.V. All rights reserved.
1. Introduction
Input–output nutrient budgets are valuable diagnostic tools to de-termine the sustainability of forest soil fertility. Change in soil nutrientpools is computed as a mass balance of nutrient inputs (atmosphericdeposition and mineral weathering flux) and outputs (net immobiliza-tion in forest biomass and leaching). As direct measurement of loss ofwater and nutrients by drainage is almost impossible (Bormann andLikens, 1967), nutrient leaching is often estimated by coupling thewaterfluxes froma deterministicflowmodel to nutrient concentrationsin soil water. Water flow modeling has been extensively studied andthere are many water flow models available (Granier et al., 1999;Kohne et al., 2009; Simunek et al., 2003; Starr, 1999) covering a widerange of complexity from whole soil profile models to finelydiscretisized profiles, and of two different types: pool and flux modelsand mechanistic models generally based on Richards' equation. Nutri-ent leaching is particularly sensitive to water flow. Modeling water
+338 83 39 40 76.a.fr (G. van der Heijden),B. Pollier),r (J. Ranger),
rights reserved.
flow is thus essential to compute precise input–output nutrient budgets(Ranger and Turpault, 1999). When using hydrological models to pre-dict water flow at the soil profile scale, calibration and validation aregenerally carried out using TDR, tensiometer or moisture measure-ments on soil samples data sets. However, to our knowledge few forestsoil hydrology studies have validatedmodel calibrations with addition-al water tracing experiments.
Environmental isotopes (18O and 2H) through their natural isoto-pic fractionation have been widely used to trace water fluxes in eco-systems (Becker and Coplen, 2001; Ellsworth and Williams, 2007;Koeniger et al., 2010; Kulmatiski et al., 2010; Mali et al., 2007; Marcand Robinson, 2004; Meinzer et al., 2006), notably in catchment hy-drology (Maloszewski and Zuber, 1982; Maloszewski et al., 1992;McDonnell et al., 1999; Viville et al., 2005). An artificially deuteratedsolution may also be used to trace water flow in soils. This techniqueallows the collection of information such as the flow velocity or theporosity involved in transfer. This step is crucial for the precise cali-bration and setting-up of deterministic flow or transport models(Ptak et al., 2004).
Forest soils require particular attention (Sidle et al., 2000; Uchidaet al., 2001) mainly because their structure is rarely disturbed, hencethe presence of well developed aggregates and pore systems, whichare known to influence flow variability (Jarvis, 2007). Water transfer
13G. van der Heijden et al. / Geoderma 195–196 (2013) 12–22
in soils is split into two types of transfer: a slow convective flow (matrixflow) resulting from a piston-like flow (Jardine et al., 1990; McDonnell,1990; Rawlins et al., 1997; Sidle et al., 2000; Waddington et al., 1993)and a rapid (or preferential) flow which bypasses a large proportionof the soil (Jardine et al., 1989; Kohne et al., 2009; Kung, 1990; Legoutet al., 2009; Tsuboyama et al., 1994). Occurrence of preferential flow(PF) depends mainly on boundary and initial conditions, for instancerainfall intensity and initial soil humidity (Ghodrati et al., 1999;Jardine et al., 1990; Jarvis, 2007; Langner et al., 1999; Lennartz andKamra, 1998; Seyfried and Rao, 1987; Williams et al., 2003).
Quantification of preferential flow is of importance when estimat-ing the nutrient leaching flux as its chemical composition is known tovary quite widely from that of slow convective flow water (Legout etal., 2009; Marques et al., 1996). Further developments are still re-quired in this research field to provide accurate nutrient budgets; er-rors when estimating the nutrient leaching may have a large impacton budget results and may lead to wrong interpretations related tothe sustainability of forest soil fertility. Moreover, in the context of cli-mate change, with a possible increase in growing season duration(Kreuzwieser and Gessler, 2010; Schar et al., 2004), understandingand modeling water flow is essential for both plant available waterand nutrient fluxes.
The scope of the present study was to develop practical knowl-edge in forest soil hydrology on a 35-year-old beech stand using atracing experiment (2H), retrospective use of several datasets (soil,weather, TDR….) and hydrological modeling. The study aims to:
(i) characterize hydrological processes occurring in an acidicsoil under a 35-year-old beech stand in the Morvan Moun-tains (France) through an artificially deuterated water trac-ing experiment;
(ii) model water flow and non-reactive solute transport withtwo hydrological models (BILJOU and HYDRUS-1D) and esti-mate the proportion of preferential and matrix water flows;
(iii) compare the performances of BILJOU and HYDRUS-1D(iv) evaluate the potential influence of preferential flow paths on
the estimation of nutrient leaching.
The practical goal was to produce a data set of water fluxes on thissite, for future computing of nutrient input–output budgets.
2. Materials and methods
2.1. Study site
The experimental site of Breuil-Chenue forest (hereafter namedBreuil-Chenue site) is located in theMorvanMountains, Burgundy, France(latitude 47°18′10″, longitude 4°4′44″). The elevation is 640 m, the annu-al rainfall 1180 mm, the mean annual potential evapo-transpiration(PET) 750 mm and the mean annual temperature 9 °C (computed overthe period 2006–2010). The soil is an Alocrisol (Alumic Cambisol; WRBFAO) displaying micro-podzolization features in the upper mineralhorizon. The humus is a dysmoder with three layers (L, F and H)(Ranger et al., 2004). The native forest was an old coppicewith standards,a traditional European system of management where timber trees (stan-dards) are grown above a coppice. In 1975, part of the native forest
Table 1Description of the soil in the beech stand at the Breuil-Chenue experimental site. Values in
Horizon Depth cm Bulk density Calculated real density Calculated total
A1/E 0–5 0.75 (0.16) 2.38 68.4A1-A1/Bp 5–10 0.97 (0.17) 2.46 60.6Sal 1 10–15 1.07 (0.18) 2.49 57.0Sal 2 15–25 1.27 (0.13) 2.53 49.8Sal 2 25–40 1.21 (0.14) 2.56 52.6Sal 3 40–55 1.46 (0.15) 2.60 43.9II Sal 4 55–70 1.50 (0.08) 2.60 42.5
located on a homogeneous soil type was clear-cut. Plots covering1000 m2 were defined and each plot was planted with one species:beech (Fagus silvatica L.), oak, (Quercus sessiliflora Smith), Norway spruce(Picea abies Karst), Douglas fir (Pseudotsuga menziesii Franco), Corsicanpine (Pinus nigraArn. ssp. LaricioPoiret var. corsicanaHyl.) andNordmannfir (Abies Nordmanniana Spach). The present study focused on the beechplot.
2.2. Soil physical properties
The soil texture at the Breuil-Chenue site was measured in foursoil profiles (0 to 70 cm depth). A description of soil properties isgiven in Table 1. Bulk density (total soil dry mass per volume unit)was measured from 15 profiles sampled with a cylindrical corer.The mean values of the real density (density of soil particles) foreach soil level were calculated as follows:
Di ¼1
1−2�Ci2:6
� �þ 2�Ci
1:6
� � ð1Þ
where Di (g·cm−3) is the real density of level i and Ci (g·g−1) the rateof total organic carbon in level i, 2.6 (g·cm−3) the real mineral densi-ty and 1.6 (g·cm−3) the real organic density.
The mean values of the real and soil bulk density were then usedto compute the mean porosity of the soil levels as follows:
Porosityi ¼ 1−DbiDi
� �� 100 ð2Þ
where Porosityi (%) is the porosity of level i, Dbi (g·cm−3) the soilbulk density of level i, and DR the real density (g·cm−3) of level i.
2.3. Weather data
A weather station located on the Breuil-Chenue site monitored rain-fall (RF), wind speed, temperature, air humidity, solar radiation on adaily basis and bulk rainfall was also collected monthly in a clearing500 m from the Breuil-Chenue site with a PEHD bucket. The Penman–Monteith equation was used to compute potential eva-potranspiration(PET). Statistical models were fitted between nearby METEO FRANCE(Frenchnationalweather institute)weather stations (Quarré-les-tombesat 9 km from the Breuil-Chenue site for RF; Chateau-Chinon for PET at28 km) so as to predict themissing daily PET and rainfall records. Poten-tial errors in the RF and PET data basemeasured at the Breuil-Chenue sitewere tested by comparing monthly records with the nearby METEOFRANCE weather stations.
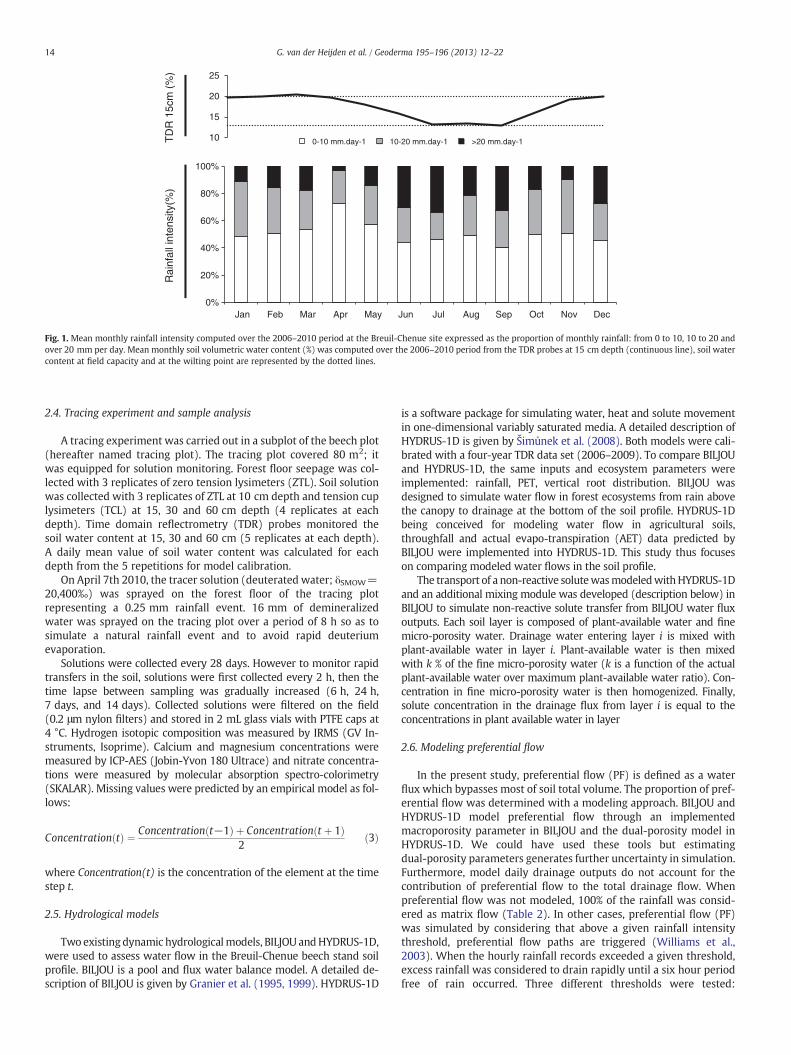
Rainfall intensity is known to be an important factor in preferen-tial flow generation and heavy RF events are frequent at theBreuil-Chenue site (Fig. 1). Indeed, over the 2006–2010 period, 56%of RF occurred at an intensity higher than 10 mm per day and 26%at an intensity higher than 20 mm per day. While these heavy RFevents occur frequently throughout the year, the proportion of rain-fall occurring at over 20 mm·day−1 is much higher during the sum-mer when the soil is dry (Fig. 1).
brackets represent standard deviations.
porosity % Total organic carbon g·g−1 Sand % Silt % Clay %
0.07 57.6 (2.7) 21.8 (2.3) 20.6 (0.6)0.05 60.2 (3.2) 21.5 (2.8) 18.3 (0.7)0.03 58.0 (3.6) 23.6 (2.8) 18.4 (1.0)0.02 60.0 (4.2) 24.1 (3.5) 16.0 (0.9)0.01 57.8 (3.1) 24.7 (2.7) 17.5 (1.2)
55.7 (5.0) 25.8 (3.3) 18.5 (1.9)57.3 (5.1) 25.3 (2.8) 17.5 (2.4)
TD
R 1
5cm
(%
)R
ainf
all i
nten
sity
(%)
0%
20%
40%
60%
80%
100%
Jan Feb Mar Apr May Jun Jul Aug Sep Oct Nov Dec
0-10 mm.day-1 10-20 mm.day-1 >20 mm.day-110
15
20
25
Fig. 1. Mean monthly rainfall intensity computed over the 2006–2010 period at the Breuil-Chenue site expressed as the proportion of monthly rainfall: from 0 to 10, 10 to 20 andover 20 mm per day. Mean monthly soil volumetric water content (%) was computed over the 2006–2010 period from the TDR probes at 15 cm depth (continuous line), soil watercontent at field capacity and at the wilting point are represented by the dotted lines.
14 G. van der Heijden et al. / Geoderma 195–196 (2013) 12–22
2.4. Tracing experiment and sample analysis
A tracing experiment was carried out in a subplot of the beech plot(hereafter named tracing plot). The tracing plot covered 80 m2; itwas equipped for solution monitoring. Forest floor seepage was col-lected with 3 replicates of zero tension lysimeters (ZTL). Soil solutionwas collected with 3 replicates of ZTL at 10 cm depth and tension cuplysimeters (TCL) at 15, 30 and 60 cm depth (4 replicates at eachdepth). Time domain reflectrometry (TDR) probes monitored thesoil water content at 15, 30 and 60 cm (5 replicates at each depth).A daily mean value of soil water content was calculated for eachdepth from the 5 repetitions for model calibration.
On April 7th 2010, the tracer solution (deuterated water; δSMOW=20,400‰) was sprayed on the forest floor of the tracing plotrepresenting a 0.25 mm rainfall event. 16 mm of demineralizedwater was sprayed on the tracing plot over a period of 8 h so as tosimulate a natural rainfall event and to avoid rapid deuteriumevaporation.
Solutions were collected every 28 days. However to monitor rapidtransfers in the soil, solutions were first collected every 2 h, then thetime lapse between sampling was gradually increased (6 h, 24 h,7 days, and 14 days). Collected solutions were filtered on the field(0.2 μm nylon filters) and stored in 2 mL glass vials with PTFE caps at4 °C. Hydrogen isotopic composition was measured by IRMS (GV In-struments, Isoprime). Calcium and magnesium concentrations weremeasured by ICP-AES (Jobin-Yvon 180 Ultrace) and nitrate concentra-tions were measured by molecular absorption spectro-colorimetry(SKALAR). Missing values were predicted by an empirical model as fol-lows:
Concentration tð Þ ¼ Concentration t−1ð Þ þ Concentration t þ 1ð Þ2
ð3Þ
where Concentration(t) is the concentration of the element at the timestep t.
2.5. Hydrological models
Two existing dynamic hydrologicalmodels, BILJOU andHYDRUS-1D,were used to assess water flow in the Breuil-Chenue beech stand soilprofile. BILJOU is a pool and flux water balance model. A detailed de-scription of BILJOU is given by Granier et al. (1995, 1999). HYDRUS-1D
is a software package for simulating water, heat and solute movementin one-dimensional variably saturated media. A detailed description ofHYDRUS-1D is given by Šimůnek et al. (2008). Both models were cali-brated with a four-year TDR data set (2006–2009). To compare BILJOUand HYDRUS-1D, the same inputs and ecosystem parameters wereimplemented: rainfall, PET, vertical root distribution. BILJOU wasdesigned to simulate water flow in forest ecosystems from rain abovethe canopy to drainage at the bottom of the soil profile. HYDRUS-1Dbeing conceived for modeling water flow in agricultural soils,throughfall and actual evapo-transpiration (AET) data predicted byBILJOU were implemented into HYDRUS-1D. This study thus focuseson comparing modeled water flows in the soil profile.
The transport of a non-reactive solutewasmodeledwithHYDRUS-1Dand an additional mixing module was developed (description below) inBILJOU to simulate non-reactive solute transfer from BILJOU water fluxoutputs. Each soil layer is composed of plant-available water and finemicro-porosity water. Drainage water entering layer i is mixed withplant-available water in layer i. Plant-available water is then mixedwith k % of the fine micro-porosity water (k is a function of the actualplant-available water over maximum plant-available water ratio). Con-centration in fine micro-porosity water is then homogenized. Finally,solute concentration in the drainage flux from layer i is equal to theconcentrations in plant available water in layer
2.6. Modeling preferential flow
In the present study, preferential flow (PF) is defined as a waterflux which bypasses most of soil total volume. The proportion of pref-erential flow was determined with a modeling approach. BILJOU andHYDRUS-1D model preferential flow through an implementedmacroporosity parameter in BILJOU and the dual-porosity model inHYDRUS-1D. We could have used these tools but estimatingdual-porosity parameters generates further uncertainty in simulation.Furthermore, model daily drainage outputs do not account for thecontribution of preferential flow to the total drainage flow. Whenpreferential flow was not modeled, 100% of the rainfall was consid-ered as matrix flow (Table 2). In other cases, preferential flow (PF)was simulated by considering that above a given rainfall intensitythreshold, preferential flow paths are triggered (Williams et al.,2003). When the hourly rainfall records exceeded a given threshold,excess rainfall was considered to drain rapidly until a six hour periodfree of rain occurred. Three different thresholds were tested:
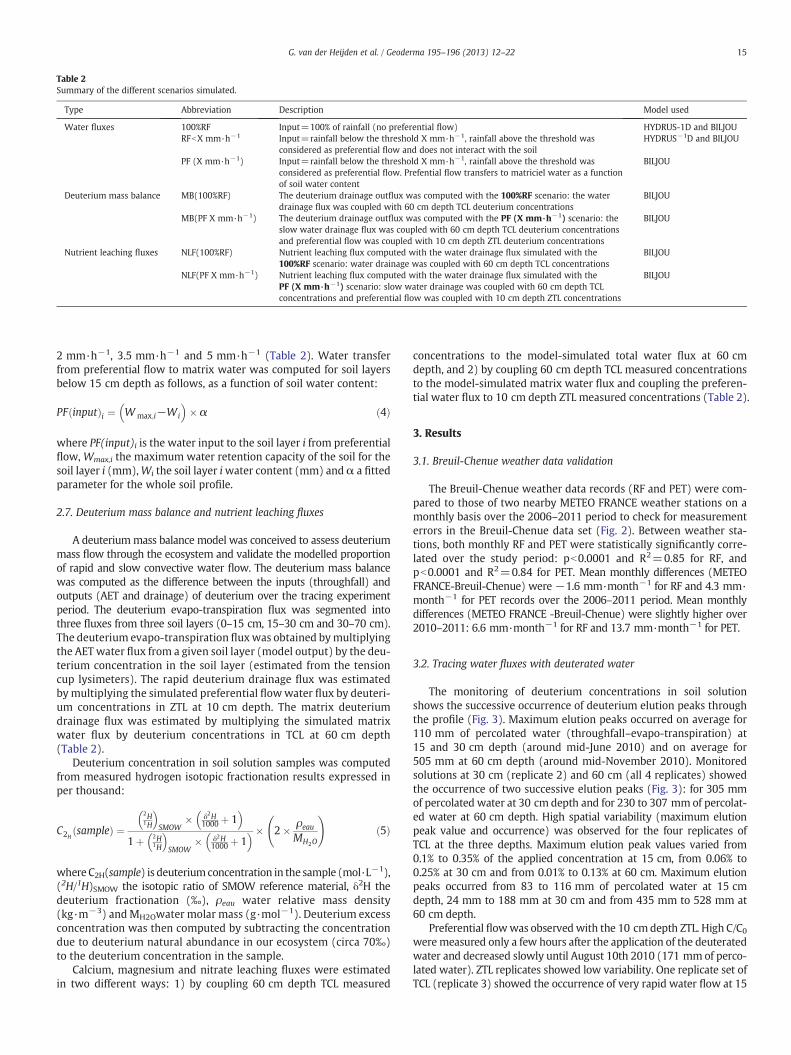
Table 2Summary of the different scenarios simulated.
Type Abbreviation Description Model used
Water fluxes 100%RF Input=100% of rainfall (no preferential flow) HYDRUS-1D and BILJOURFbX mm·h−1 Input=rainfall below the threshold X mm·h−1, rainfall above the threshold was
considered as preferential flow and does not interact with the soilHYDRUS−1D and BILJOU
PF (X mm·h−1) Input=rainfall below the threshold X mm·h−1, rainfall above the threshold wasconsidered as preferential flow. Prefential flow transfers to matriciel water as a functionof soil water content
BILJOU
Deuterium mass balance MB(100%RF) The deuterium drainage outflux was computed with the 100%RF scenario: the waterdrainage flux was coupled with 60 cm depth TCL deuterium concentrations
BILJOU
MB(PF X mm·h−1) The deuterium drainage outflux was computed with the PF (X mm·h−1) scenario: theslow water drainage flux was coupled with 60 cm depth TCL deuterium concentrationsand preferential flow was coupled with 10 cm depth ZTL deuterium concentrations
BILJOU
Nutrient leaching fluxes NLF(100%RF) Nutrient leaching flux computed with the water drainage flux simulated with the100%RF scenario: water drainage was coupled with 60 cm depth TCL concentrations
BILJOU
NLF(PF X mm·h−1) Nutrient leaching flux computed with the water drainage flux simulated with thePF (X mm·h−1) scenario: slow water drainage was coupled with 60 cm depth TCLconcentrations and preferential flow was coupled with 10 cm depth ZTL concentrations
BILJOU
15G. van der Heijden et al. / Geoderma 195–196 (2013) 12–22
2 mm·h−1, 3.5 mm·h−1 and 5 mm·h−1 (Table 2). Water transferfrom preferential flow to matrix water was computed for soil layersbelow 15 cm depth as follows, as a function of soil water content:
PF inputð Þi ¼ W max;i−Wi
� �� α ð4Þ
where PF(input)i is the water input to the soil layer i from preferentialflow, Wmax,i the maximum water retention capacity of the soil for thesoil layer i (mm),Wi the soil layer iwater content (mm) andα a fittedparameter for the whole soil profile.
2.7. Deuterium mass balance and nutrient leaching fluxes
A deuteriummass balance model was conceived to assess deuteriummass flow through the ecosystem and validate the modelled proportionof rapid and slow convective water flow. The deuterium mass balancewas computed as the difference between the inputs (throughfall) andoutputs (AET and drainage) of deuterium over the tracing experimentperiod. The deuterium evapo-transpiration flux was segmented intothree fluxes from three soil layers (0–15 cm, 15–30 cm and 30–70 cm).The deuterium evapo-transpiration fluxwas obtained bymultiplyingthe AET water flux from a given soil layer (model output) by the deu-terium concentration in the soil layer (estimated from the tensioncup lysimeters). The rapid deuterium drainage flux was estimatedby multiplying the simulated preferential flowwater flux by deuteri-um concentrations in ZTL at 10 cm depth. The matrix deuteriumdrainage flux was estimated by multiplying the simulated matrixwater flux by deuterium concentrations in TCL at 60 cm depth(Table 2).
Deuterium concentration in soil solution samples was computedfrom measured hydrogen isotopic fractionation results expressed inper thousand:
C2H sampleð Þ ¼2H1H
� �SMOW
� δ2H1000 þ 1� �
1þ 2H1H
� �SMOW
� δ2H1000 þ 1� �� 2� ρeau
MH2O
!ð5Þ
where C2H(sample) is deuteriumconcentration in the sample (mol·L−1),(2H/1H)SMOW the isotopic ratio of SMOW reference material, δ2H thedeuterium fractionation (‰), ρeau water relative mass density(kg·m−3) and MH2Owater molar mass (g·mol−1). Deuterium excessconcentration was then computed by subtracting the concentrationdue to deuterium natural abundance in our ecosystem (circa 70‰)to the deuterium concentration in the sample.
Calcium, magnesium and nitrate leaching fluxes were estimatedin two different ways: 1) by coupling 60 cm depth TCL measured
concentrations to the model-simulated total water flux at 60 cmdepth, and 2) by coupling 60 cm depth TCL measured concentrationsto the model-simulated matrix water flux and coupling the preferen-tial water flux to 10 cm depth ZTL measured concentrations (Table 2).
3. Results
3.1. Breuil-Chenue weather data validation
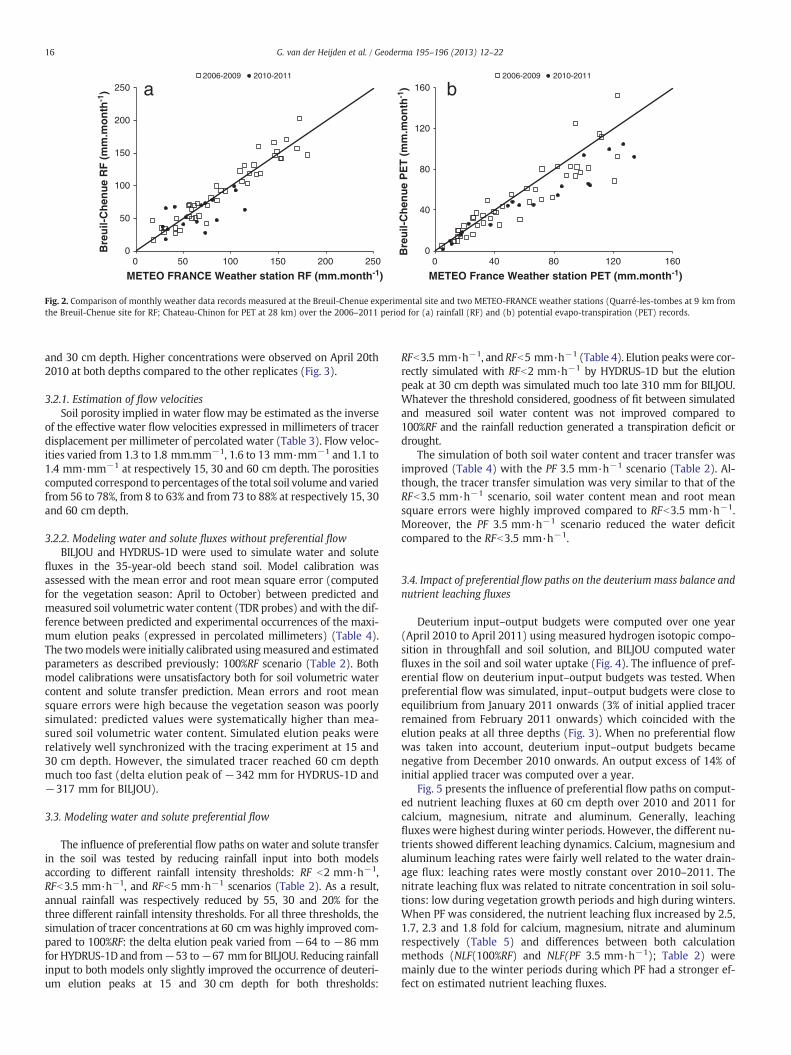
The Breuil-Chenue weather data records (RF and PET) were com-pared to those of two nearby METEO FRANCE weather stations on amonthly basis over the 2006–2011 period to check for measurementerrors in the Breuil-Chenue data set (Fig. 2). Between weather sta-tions, both monthly RF and PET were statistically significantly corre-lated over the study period: pb0.0001 and R2=0.85 for RF, andpb0.0001 and R2=0.84 for PET. Mean monthly differences (METEOFRANCE-Breuil-Chenue) were −1.6 mm·month−1 for RF and 4.3 mm·month−1 for PET records over the 2006–2011 period. Mean monthlydifferences (METEO FRANCE -Breuil-Chenue) were slightly higher over2010–2011: 6.6 mm·month−1 for RF and 13.7 mm·month−1 for PET.
3.2. Tracing water fluxes with deuterated water
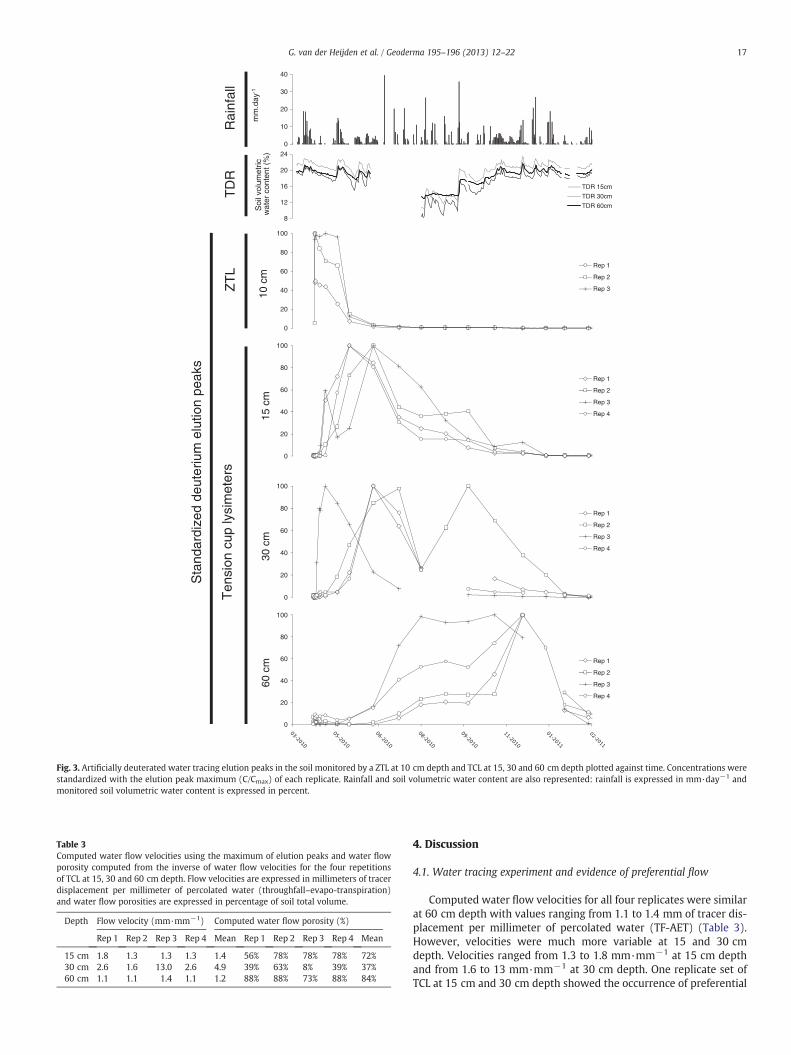
The monitoring of deuterium concentrations in soil solutionshows the successive occurrence of deuterium elution peaks throughthe profile (Fig. 3). Maximum elution peaks occurred on average for110 mm of percolated water (throughfall–evapo-transpiration) at15 and 30 cm depth (around mid-June 2010) and on average for505 mm at 60 cm depth (around mid-November 2010). Monitoredsolutions at 30 cm (replicate 2) and 60 cm (all 4 replicates) showedthe occurrence of two successive elution peaks (Fig. 3): for 305 mmof percolated water at 30 cm depth and for 230 to 307 mm of percolat-ed water at 60 cm depth. High spatial variability (maximum elutionpeak value and occurrence) was observed for the four replicates ofTCL at the three depths. Maximum elution peak values varied from0.1% to 0.35% of the applied concentration at 15 cm, from 0.06% to0.25% at 30 cm and from 0.01% to 0.13% at 60 cm. Maximum elutionpeaks occurred from 83 to 116 mm of percolated water at 15 cmdepth, 24 mm to 188 mm at 30 cm and from 435 mm to 528 mm at60 cm depth.
Preferential flowwas observed with the 10 cmdepth ZTL. High C/C0weremeasured only a few hours after the application of the deuteratedwater and decreased slowly until August 10th 2010 (171 mm of perco-lated water). ZTL replicates showed low variability. One replicate set ofTCL (replicate 3) showed the occurrence of very rapid water flow at 15
0
50
100
150
200
250
0 50 100 150 200 250
Bre
uil-
Ch
enu
e R
F (
mm
.mo
nth
-1)
METEO FRANCE Weather station RF (mm.month-1)
2006-2009 2010-2011
0
40
80
120
160
0 40 80 120 160
Bre
uil-
Ch
enu
e P
ET
(m
m.m
on
th-1
)
METEO France Weather station PET (mm.month-1)
2006-2009 2010-2011
a b
Fig. 2. Comparison of monthly weather data records measured at the Breuil-Chenue experimental site and two METEO-FRANCE weather stations (Quarré-les-tombes at 9 km fromthe Breuil-Chenue site for RF; Chateau-Chinon for PET at 28 km) over the 2006–2011 period for (a) rainfall (RF) and (b) potential evapo-transpiration (PET) records.
16 G. van der Heijden et al. / Geoderma 195–196 (2013) 12–22
and 30 cm depth. Higher concentrations were observed on April 20th2010 at both depths compared to the other replicates (Fig. 3).
3.2.1. Estimation of flow velocitiesSoil porosity implied in water flowmay be estimated as the inverse
of the effective water flow velocities expressed in millimeters of tracerdisplacement per millimeter of percolated water (Table 3). Flow veloc-ities varied from 1.3 to 1.8 mm.mm−1, 1.6 to 13 mm·mm−1 and 1.1 to1.4 mm·mm−1 at respectively 15, 30 and 60 cm depth. The porositiescomputed correspond to percentages of the total soil volume and variedfrom 56 to 78%, from 8 to 63% and from 73 to 88% at respectively 15, 30and 60 cm depth.
3.2.2. Modeling water and solute fluxes without preferential flowBILJOU and HYDRUS-1D were used to simulate water and solute
fluxes in the 35-year-old beech stand soil. Model calibration wasassessed with the mean error and root mean square error (computedfor the vegetation season: April to October) between predicted andmeasured soil volumetric water content (TDR probes) and with the dif-ference between predicted and experimental occurrences of the maxi-mum elution peaks (expressed in percolated millimeters) (Table 4).The twomodels were initially calibrated usingmeasured and estimatedparameters as described previously: 100%RF scenario (Table 2). Bothmodel calibrations were unsatisfactory both for soil volumetric watercontent and solute transfer prediction. Mean errors and root meansquare errors were high because the vegetation season was poorlysimulated: predicted values were systematically higher than mea-sured soil volumetric water content. Simulated elution peaks wererelatively well synchronized with the tracing experiment at 15 and30 cm depth. However, the simulated tracer reached 60 cm depthmuch too fast (delta elution peak of −342 mm for HYDRUS-1D and−317 mm for BILJOU).
3.3. Modeling water and solute preferential flow
The influence of preferential flow paths on water and solute transferin the soil was tested by reducing rainfall input into both modelsaccording to different rainfall intensity thresholds: RF b2 mm·h−1,RFb3.5 mm·h−1, and RFb5 mm·h−1 scenarios (Table 2). As a result,annual rainfall was respectively reduced by 55, 30 and 20% for thethree different rainfall intensity thresholds. For all three thresholds, thesimulation of tracer concentrations at 60 cmwas highly improved com-pared to 100%RF: the delta elution peak varied from −64 to −86 mmfor HYDRUS-1D and from−53 to−67 mm for BILJOU. Reducing rainfallinput to both models only slightly improved the occurrence of deuteri-um elution peaks at 15 and 30 cm depth for both thresholds:
RFb3.5 mm·h−1, and RFb5 mm·h−1 (Table 4). Elution peakswere cor-rectly simulated with RFb2 mm·h−1 by HYDRUS-1D but the elutionpeak at 30 cm depth was simulated much too late 310 mm for BILJOU.Whatever the threshold considered, goodness of fit between simulatedand measured soil water content was not improved compared to100%RF and the rainfall reduction generated a transpiration deficit ordrought.
The simulation of both soil water content and tracer transfer wasimproved (Table 4) with the PF 3.5 mm·h−1 scenario (Table 2). Al-though, the tracer transfer simulation was very similar to that of theRFb3.5 mm·h−1 scenario, soil water content mean and root meansquare errors were highly improved compared to RFb3.5 mm·h−1.Moreover, the PF 3.5 mm·h−1 scenario reduced the water deficitcompared to the RFb3.5 mm·h−1.
3.4. Impact of preferential flow paths on the deuterium mass balance andnutrient leaching fluxes
Deuterium input–output budgets were computed over one year(April 2010 to April 2011) using measured hydrogen isotopic compo-sition in throughfall and soil solution, and BILJOU computed waterfluxes in the soil and soil water uptake (Fig. 4). The influence of pref-erential flow on deuterium input–output budgets was tested. Whenpreferential flow was simulated, input–output budgets were close toequilibrium from January 2011 onwards (3% of initial applied tracerremained from February 2011 onwards) which coincided with theelution peaks at all three depths (Fig. 3). When no preferential flowwas taken into account, deuterium input–output budgets becamenegative from December 2010 onwards. An output excess of 14% ofinitial applied tracer was computed over a year.
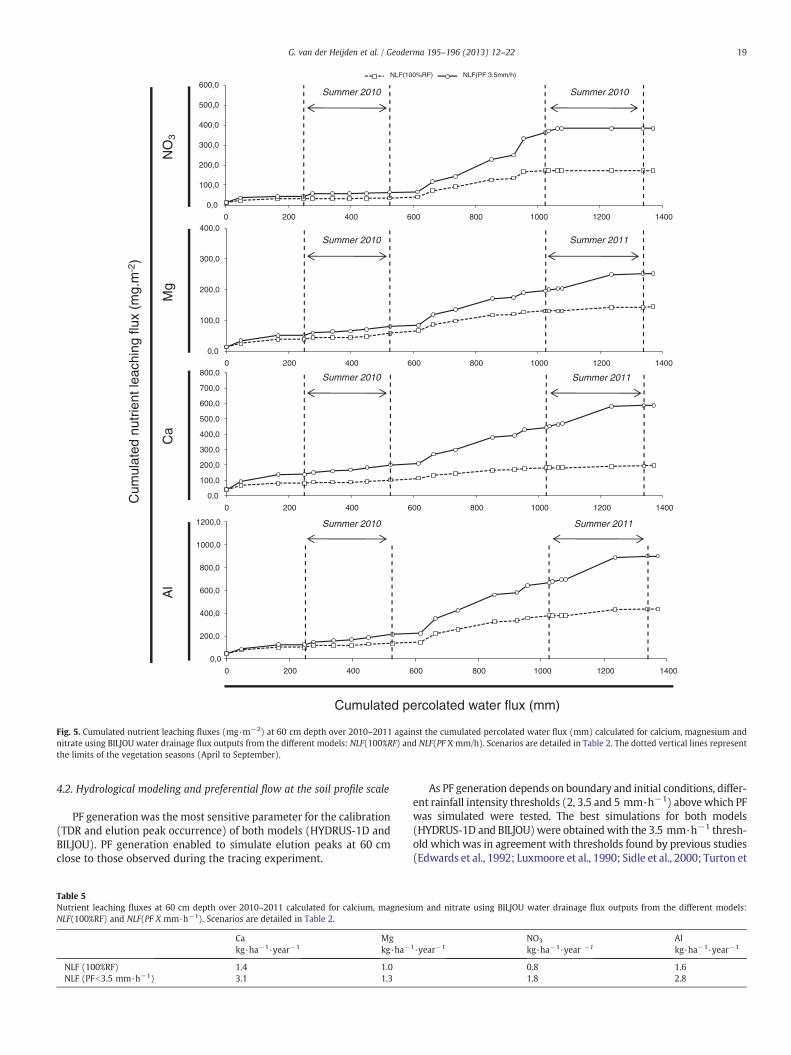
Fig. 5 presents the influence of preferential flow paths on comput-ed nutrient leaching fluxes at 60 cm depth over 2010 and 2011 forcalcium, magnesium, nitrate and aluminum. Generally, leachingfluxes were highest during winter periods. However, the different nu-trients showed different leaching dynamics. Calcium, magnesium andaluminum leaching rates were fairly well related to the water drain-age flux: leaching rates were mostly constant over 2010–2011. Thenitrate leaching flux was related to nitrate concentration in soil solu-tions: low during vegetation growth periods and high during winters.When PF was considered, the nutrient leaching flux increased by 2.5,1.7, 2.3 and 1.8 fold for calcium, magnesium, nitrate and aluminumrespectively (Table 5) and differences between both calculationmethods (NLF(100%RF) and NLF(PF 3.5 mm·h−1); Table 2) weremainly due to the winter periods during which PF had a stronger ef-fect on estimated nutrient leaching fluxes.
0
10
20
30
40
8
12
16
20
24
TDR 15cm
TDR 30cm
TDR 60cm
0
20
40
60
80
100
Rep 1
Rep 2
Rep 3
Rep 4
0
20
40
60
80
100
Rep 1
Rep 2
Rep 3
Rep 4
0
20
40
60
80
100
Rep 1
Rep 2
Rep 3
Rep 4
0
20
40
60
80
100
Rep 1
Rep 2
Rep 3
Ten
sion
cup
lysi
met
ers
60 c
m30
cm
15 c
m10
cm
ZT
LT
DR
Rai
nfal
l
Soi
l vol
umet
ricw
ater
con
tent
(%
)m
m.d
ay-1
Sta
ndar
dize
d de
uter
ium
elu
tion
peak
s
Fig. 3. Artificially deuterated water tracing elution peaks in the soil monitored by a ZTL at 10 cm depth and TCL at 15, 30 and 60 cm depth plotted against time. Concentrations werestandardized with the elution peak maximum (C/Cmax) of each replicate. Rainfall and soil volumetric water content are also represented: rainfall is expressed in mm·day−1 andmonitored soil volumetric water content is expressed in percent.
Table 3Computed water flow velocities using the maximum of elution peaks and water flowporosity computed from the inverse of water flow velocities for the four repetitionsof TCL at 15, 30 and 60 cm depth. Flow velocities are expressed in millimeters of tracerdisplacement per millimeter of percolated water (throughfall–evapo-transpiration)and water flow porosities are expressed in percentage of soil total volume.
Depth Flow velocity (mm·mm−1) Computed water flow porosity (%)
Rep 1 Rep 2 Rep 3 Rep 4 Mean Rep 1 Rep 2 Rep 3 Rep 4 Mean
15 cm 1.8 1.3 1.3 1.3 1.4 56% 78% 78% 78% 72%30 cm 2.6 1.6 13.0 2.6 4.9 39% 63% 8% 39% 37%60 cm 1.1 1.1 1.4 1.1 1.2 88% 88% 73% 88% 84%
17G. van der Heijden et al. / Geoderma 195–196 (2013) 12–22
4. Discussion
4.1. Water tracing experiment and evidence of preferential flow
Computed water flow velocities for all four replicates were similarat 60 cm depth with values ranging from 1.1 to 1.4 mm of tracer dis-placement per millimeter of percolated water (TF-AET) (Table 3).However, velocities were much more variable at 15 and 30 cmdepth. Velocities ranged from 1.3 to 1.8 mm·mm−1 at 15 cm depthand from 1.6 to 13 mm·mm−1 at 30 cm depth. One replicate set ofTCL at 15 cm and 30 cm depth showed the occurrence of preferential
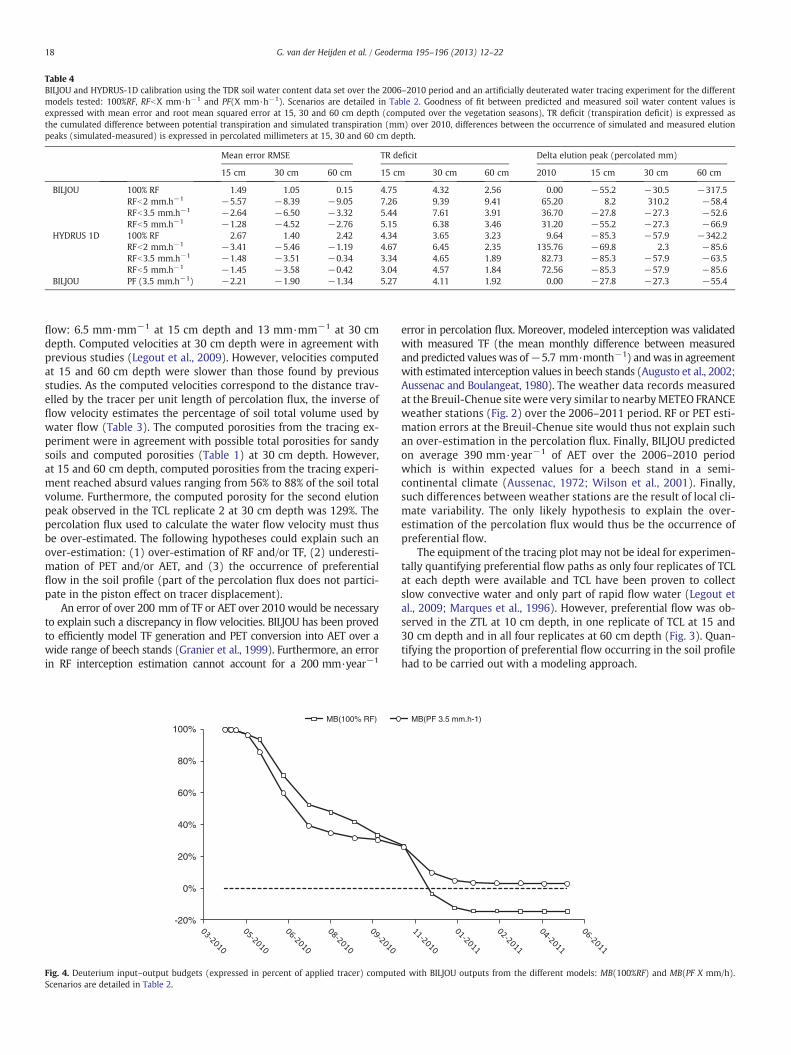
Table 4BILJOU and HYDRUS-1D calibration using the TDR soil water content data set over the 2006–2010 period and an artificially deuterated water tracing experiment for the differentmodels tested: 100%RF, RFbX mm·h−1 and PF(X mm·h−1). Scenarios are detailed in Table 2. Goodness of fit between predicted and measured soil water content values isexpressed with mean error and root mean squared error at 15, 30 and 60 cm depth (computed over the vegetation seasons), TR deficit (transpiration deficit) is expressed asthe cumulated difference between potential transpiration and simulated transpiration (mm) over 2010, differences between the occurrence of simulated and measured elutionpeaks (simulated-measured) is expressed in percolated millimeters at 15, 30 and 60 cm depth.
Mean error RMSE TR deficit Delta elution peak (percolated mm)
15 cm 30 cm 60 cm 15 cm 30 cm 60 cm 2010 15 cm 30 cm 60 cm
BILJOU 100% RF 1.49 1.05 0.15 4.75 4.32 2.56 0.00 −55.2 −30.5 −317.5RFb2 mm.h−1 −5.57 −8.39 −9.05 7.26 9.39 9.41 65.20 8.2 310.2 −58.4RFb3.5 mm.h−1 −2.64 −6.50 −3.32 5.44 7.61 3.91 36.70 −27.8 −27.3 −52.6RFb5 mm.h−1 −1.28 −4.52 −2.76 5.15 6.38 3.46 31.20 −55.2 −27.3 −66.9
HYDRUS 1D 100% RF 2.67 1.40 2.42 4.34 3.65 3.23 9.64 −85.3 −57.9 −342.2RFb2 mm.h−1 −3.41 −5.46 −1.19 4.67 6.45 2.35 135.76 −69.8 2.3 −85.6RFb3.5 mm.h−1 −1.48 −3.51 −0.34 3.34 4.65 1.89 82.73 −85.3 −57.9 −63.5RFb5 mm.h−1 −1.45 −3.58 −0.42 3.04 4.57 1.84 72.56 −85.3 −57.9 −85.6
BILJOU PF (3.5 mm.h−1) −2.21 −1.90 −1.34 5.27 4.11 1.92 0.00 −27.8 −27.3 −55.4
18 G. van der Heijden et al. / Geoderma 195–196 (2013) 12–22
flow: 6.5 mm·mm−1 at 15 cm depth and 13 mm·mm−1 at 30 cmdepth. Computed velocities at 30 cm depth were in agreement withprevious studies (Legout et al., 2009). However, velocities computedat 15 and 60 cm depth were slower than those found by previousstudies. As the computed velocities correspond to the distance trav-elled by the tracer per unit length of percolation flux, the inverse offlow velocity estimates the percentage of soil total volume used bywater flow (Table 3). The computed porosities from the tracing ex-periment were in agreement with possible total porosities for sandysoils and computed porosities (Table 1) at 30 cm depth. However,at 15 and 60 cm depth, computed porosities from the tracing experi-ment reached absurd values ranging from 56% to 88% of the soil totalvolume. Furthermore, the computed porosity for the second elutionpeak observed in the TCL replicate 2 at 30 cm depth was 129%. Thepercolation flux used to calculate the water flow velocity must thusbe over-estimated. The following hypotheses could explain such anover-estimation: (1) over-estimation of RF and/or TF, (2) underesti-mation of PET and/or AET, and (3) the occurrence of preferentialflow in the soil profile (part of the percolation flux does not partici-pate in the piston effect on tracer displacement).
An error of over 200 mm of TF or AET over 2010 would be necessaryto explain such a discrepancy in flow velocities. BILJOU has been provedto efficiently model TF generation and PET conversion into AET over awide range of beech stands (Granier et al., 1999). Furthermore, an errorin RF interception estimation cannot account for a 200 mm·year−1
-20%
0%
20%
40%
60%
80%
100%MB(100% RF)
Fig. 4. Deuterium input–output budgets (expressed in percent of applied tracer) computeScenarios are detailed in Table 2.
error in percolation flux. Moreover, modeled interception was validatedwith measured TF (the mean monthly difference between measuredand predicted values was of−5.7 mm·month−1) andwas in agreementwith estimated interception values in beech stands (Augusto et al., 2002;Aussenac and Boulangeat, 1980). The weather data records measuredat the Breuil-Chenue site were very similar to nearbyMETEO FRANCEweather stations (Fig. 2) over the 2006–2011 period. RF or PET esti-mation errors at the Breuil-Chenue site would thus not explain suchan over-estimation in the percolation flux. Finally, BILJOU predictedon average 390 mm·year−1 of AET over the 2006–2010 periodwhich is within expected values for a beech stand in a semi-continental climate (Aussenac, 1972; Wilson et al., 2001). Finally,such differences between weather stations are the result of local cli-mate variability. The only likely hypothesis to explain the over-estimation of the percolation flux would thus be the occurrence ofpreferential flow.
The equipment of the tracing plot may not be ideal for experimen-tally quantifying preferential flow paths as only four replicates of TCLat each depth were available and TCL have been proven to collectslow convective water and only part of rapid flow water (Legout etal., 2009; Marques et al., 1996). However, preferential flow was ob-served in the ZTL at 10 cm depth, in one replicate of TCL at 15 and30 cm depth and in all four replicates at 60 cm depth (Fig. 3). Quan-tifying the proportion of preferential flow occurring in the soil profilehad to be carried out with a modeling approach.
MB(PF 3.5 mm.h-1)
d with BILJOU outputs from the different models: MB(100%RF) and MB(PF X mm/h).
0,0
100,0
200,0
300,0
400,0
500,0
600,0
0 200 400 600 800 1000 1200 1400
NLF(100%RF) NLF(PF 3.5mm/h)
0,0
100,0
200,0
300,0
400,0
0 200 400 600 800 1000 1200 1400
0,0
100,0
200,0
300,0
400,0
500,0
600,0
700,0
800,0
0 200 400 600 800 1000 1200 1400
0,0
200,0
400,0
600,0
800,0
1000,0
1200,0
0 200 400 600 800 1000 1200 1400
NO
3M
gC
aA
l
Cumulated percolated water flux (mm)
Cum
ulat
ed n
utrie
nt le
achi
ng fl
ux (
mg.
m-2
)
Summer 2010
Summer 2010
Summer 2010
Summer 2010 Summer 2011
Summer 2011
Summer 2011
Summer 2010
Fig. 5. Cumulated nutrient leaching fluxes (mg·m−2) at 60 cm depth over 2010–2011 against the cumulated percolated water flux (mm) calculated for calcium, magnesium andnitrate using BILJOU water drainage flux outputs from the different models: NLF(100%RF) and NLF(PF X mm/h). Scenarios are detailed in Table 2. The dotted vertical lines representthe limits of the vegetation seasons (April to September).
19G. van der Heijden et al. / Geoderma 195–196 (2013) 12–22
4.2. Hydrological modeling and preferential flow at the soil profile scale
PF generation was the most sensitive parameter for the calibration(TDR and elution peak occurrence) of both models (HYDRUS-1D andBILJOU). PF generation enabled to simulate elution peaks at 60 cmclose to those observed during the tracing experiment.
Table 5Nutrient leaching fluxes at 60 cm depth over 2010–2011 calculated for calcium, magnesiNLF(100%RF) and NLF(PF X mm·h−1). Scenarios are detailed in Table 2.
Cakg·ha−1·year−1
Mgkg·ha−
NLF (100%RF) 1.4 1.0NLF (PFb3.5 mm·h−1) 3.1 1.3
As PF generation depends on boundary and initial conditions, differ-ent rainfall intensity thresholds (2, 3.5 and 5 mm·h−1) above which PFwas simulated were tested. The best simulations for both models(HYDRUS-1D and BILJOU)were obtained with the 3.5 mm·h−1 thresh-old which was in agreement with thresholds found by previous studies(Edwards et al., 1992; Luxmoore et al., 1990; Sidle et al., 2000; Turton et
um and nitrate using BILJOU water drainage flux outputs from the different models:
1·year−1NO3
kg·ha−1·year −1Alkg·ha−1·year−1
0.8 1.61.8 2.8
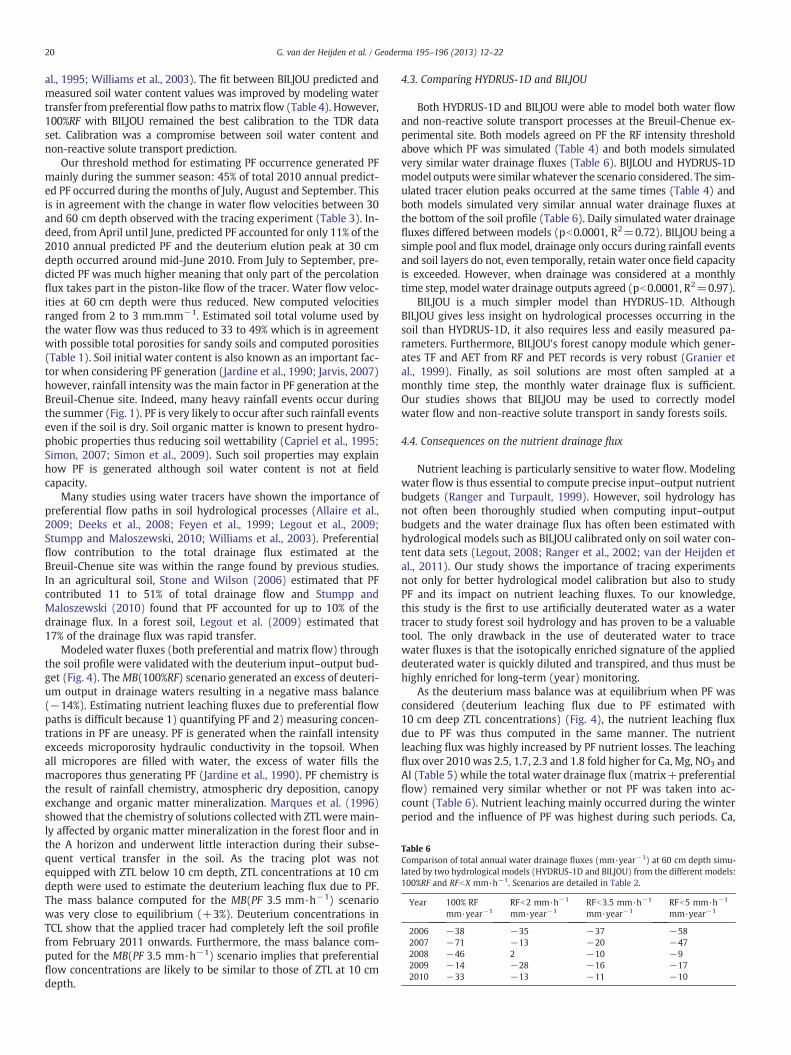
Table 6Comparison of total annual water drainage fluxes (mm·year−1) at 60 cm depth simu-lated by two hydrological models (HYDRUS-1D and BILJOU) from the different models:100%RF and RFbX mm·h−1. Scenarios are detailed in Table 2.
Year 100% RFmm·year−1
RFb2 mm·h−1
mm·year−1RFb3.5 mm·h−1
mm·year−1RFb5 mm·h−1
mm·year−1
2006 −38 −35 −37 −582007 −71 −13 −20 −472008 −46 2 −10 −92009 −14 −28 −16 −172010 −33 −13 −11 −10
20 G. van der Heijden et al. / Geoderma 195–196 (2013) 12–22
al., 1995; Williams et al., 2003). The fit between BILJOU predicted andmeasured soil water content values was improved by modeling watertransfer frompreferential flowpaths tomatrix flow (Table 4). However,100%RF with BILJOU remained the best calibration to the TDR dataset. Calibration was a compromise between soil water content andnon-reactive solute transport prediction.
Our threshold method for estimating PF occurrence generated PFmainly during the summer season: 45% of total 2010 annual predict-ed PF occurred during the months of July, August and September. Thisis in agreement with the change in water flow velocities between 30and 60 cm depth observed with the tracing experiment (Table 3). In-deed, from April until June, predicted PF accounted for only 11% of the2010 annual predicted PF and the deuterium elution peak at 30 cmdepth occurred around mid-June 2010. From July to September, pre-dicted PF was much higher meaning that only part of the percolationflux takes part in the piston-like flow of the tracer. Water flow veloc-ities at 60 cm depth were thus reduced. New computed velocitiesranged from 2 to 3 mm.mm−1. Estimated soil total volume used bythe water flow was thus reduced to 33 to 49% which is in agreementwith possible total porosities for sandy soils and computed porosities(Table 1). Soil initial water content is also known as an important fac-tor when considering PF generation (Jardine et al., 1990; Jarvis, 2007)however, rainfall intensity was the main factor in PF generation at theBreuil-Chenue site. Indeed, many heavy rainfall events occur duringthe summer (Fig. 1). PF is very likely to occur after such rainfall eventseven if the soil is dry. Soil organic matter is known to present hydro-phobic properties thus reducing soil wettability (Capriel et al., 1995;Simon, 2007; Simon et al., 2009). Such soil properties may explainhow PF is generated although soil water content is not at fieldcapacity.
Many studies using water tracers have shown the importance ofpreferential flow paths in soil hydrological processes (Allaire et al.,2009; Deeks et al., 2008; Feyen et al., 1999; Legout et al., 2009;Stumpp and Maloszewski, 2010; Williams et al., 2003). Preferentialflow contribution to the total drainage flux estimated at theBreuil-Chenue site was within the range found by previous studies.In an agricultural soil, Stone and Wilson (2006) estimated that PFcontributed 11 to 51% of total drainage flow and Stumpp andMaloszewski (2010) found that PF accounted for up to 10% of thedrainage flux. In a forest soil, Legout et al. (2009) estimated that17% of the drainage flux was rapid transfer.
Modeled water fluxes (both preferential and matrix flow) throughthe soil profile were validated with the deuterium input–output bud-get (Fig. 4). TheMB(100%RF) scenario generated an excess of deuteri-um output in drainage waters resulting in a negative mass balance(−14%). Estimating nutrient leaching fluxes due to preferential flowpaths is difficult because 1) quantifying PF and 2) measuring concen-trations in PF are uneasy. PF is generated when the rainfall intensityexceeds microporosity hydraulic conductivity in the topsoil. Whenall micropores are filled with water, the excess of water fills themacropores thus generating PF (Jardine et al., 1990). PF chemistry isthe result of rainfall chemistry, atmospheric dry deposition, canopyexchange and organic matter mineralization. Marques et al. (1996)showed that the chemistry of solutions collected with ZTL were main-ly affected by organic matter mineralization in the forest floor and inthe A horizon and underwent little interaction during their subse-quent vertical transfer in the soil. As the tracing plot was notequipped with ZTL below 10 cm depth, ZTL concentrations at 10 cmdepth were used to estimate the deuterium leaching flux due to PF.The mass balance computed for the MB(PF 3.5 mm·h−1) scenariowas very close to equilibrium (+3%). Deuterium concentrations inTCL show that the applied tracer had completely left the soil profilefrom February 2011 onwards. Furthermore, the mass balance com-puted for the MB(PF 3.5 mm·h−1) scenario implies that preferentialflow concentrations are likely to be similar to those of ZTL at 10 cmdepth.
4.3. Comparing HYDRUS-1D and BILJOU
Both HYDRUS-1D and BILJOU were able to model both water flowand non-reactive solute transport processes at the Breuil-Chenue ex-perimental site. Both models agreed on PF the RF intensity thresholdabove which PF was simulated (Table 4) and both models simulatedvery similar water drainage fluxes (Table 6). BIJLOU and HYDRUS-1Dmodel outputs were similarwhatever the scenario considered. The sim-ulated tracer elution peaks occurred at the same times (Table 4) andboth models simulated very similar annual water drainage fluxes atthe bottom of the soil profile (Table 6). Daily simulated water drainagefluxes differed between models (pb0.0001, R2=0.72). BILJOU being asimple pool and flux model, drainage only occurs during rainfall eventsand soil layers do not, even temporally, retain water once field capacityis exceeded. However, when drainage was considered at a monthlytime step, model water drainage outputs agreed (pb0.0001, R2=0.97).
BILJOU is a much simpler model than HYDRUS-1D. AlthoughBILJOU gives less insight on hydrological processes occurring in thesoil than HYDRUS-1D, it also requires less and easily measured pa-rameters. Furthermore, BILJOU's forest canopy module which gener-ates TF and AET from RF and PET records is very robust (Granier etal., 1999). Finally, as soil solutions are most often sampled at amonthly time step, the monthly water drainage flux is sufficient.Our studies shows that BILJOU may be used to correctly modelwater flow and non-reactive solute transport in sandy forests soils.
4.4. Consequences on the nutrient drainage flux
Nutrient leaching is particularly sensitive to water flow. Modelingwater flow is thus essential to compute precise input–output nutrientbudgets (Ranger and Turpault, 1999). However, soil hydrology hasnot often been thoroughly studied when computing input–outputbudgets and the water drainage flux has often been estimated withhydrological models such as BILJOU calibrated only on soil water con-tent data sets (Legout, 2008; Ranger et al., 2002; van der Heijden etal., 2011). Our study shows the importance of tracing experimentsnot only for better hydrological model calibration but also to studyPF and its impact on nutrient leaching fluxes. To our knowledge,this study is the first to use artificially deuterated water as a watertracer to study forest soil hydrology and has proven to be a valuabletool. The only drawback in the use of deuterated water to tracewater fluxes is that the isotopically enriched signature of the applieddeuterated water is quickly diluted and transpired, and thus must behighly enriched for long-term (year) monitoring.
As the deuterium mass balance was at equilibrium when PF wasconsidered (deuterium leaching flux due to PF estimated with10 cm deep ZTL concentrations) (Fig. 4), the nutrient leaching fluxdue to PF was thus computed in the same manner. The nutrientleaching flux was highly increased by PF nutrient losses. The leachingflux over 2010 was 2.5, 1.7, 2.3 and 1.8 fold higher for Ca, Mg, NO3 andAl (Table 5) while the total water drainage flux (matrix+preferentialflow) remained very similar whether or not PF was taken into ac-count (Table 6). Nutrient leaching mainly occurred during the winterperiod and the influence of PF was highest during such periods. Ca,
21G. van der Heijden et al. / Geoderma 195–196 (2013) 12–22
Mg and Al leaching fluxes were mainly driven by the water drainageflux (Fig. 5) while the NO3 leaching flux were more related to soilsolution concentration.
However, ZTL concentrations may decrease with depth (Legout,2008; Marques et al., 1996; Ranger et al., 2001) due to for examplenutrient uptake, in particular because part of PF may occur alongthe root system. By using 10 cm depth ZTL concentrations, the nutri-ent leaching flux may be slightly overestimated. Furthermore, rapidwater flow does not imply non-equilibrium flow. Rapid exchangesmay occur along preferential flow paths thus changing the chemicalcomposition of draining water. In base poor acidic soils, such as thesoil at the Breuil-Chenue site, aluminum is a predominant cationand calcium and magnesium are present in very small quantities onthe CEC. It is likely that part of the calcium and magnesium in rapidflow generated in the top soil (enriched due to litter decomposition)exchanges with aluminum on the CEC. If such exchanges occur alongpreferential flow paths, preferential flow could play an important rolein the spatial variability of soil nutrients.
Nevertheless, nutrient leaching is likely to fall between the bound-aries given by the two methods of nutrient leaching calculation. Partic-ular attention should be given to water drainage fluxes during thebeginning (March–April) and the end (September–October) of the veg-etation season, when soil temperature is still high enough to allow formicrobial activity, nutrient uptake by trees is reduced and soil watercontent increases to field capacity. Increased nutrient losses from thesoil profile are of great interest for studying the sustainability of forestsoil fertility and increased nitrate and aluminum out-fluxes are a threatto stream and river ecosystems (Dambrine et al., 1998; Guérold et al.,2000). ZTL concentrations are generally collected at a monthly timestep but PF concentrations are likely to vary widely depending on therainfall intensity generating them and need to be studied at the eventscale to better understand their chemistry.
5. Conclusion
Water flow in preferential pathways through the soil of a 30-yearold beech experimental site was evidenced and quantified throughtwo approaches: a water-tracing experiment using artificially deuter-ated water and two hydrological models (HYDRUS-1D and BILJOU).The two approaches proved to be complementary: preferential flowwas brought to light through the tracing experiment and the model-ing approach enabled to quantify preferential flow during the tracingexperiment and during a 4-year monitoring period of soil water con-tent. In this very acid soil, where nutrients are mostly concentratedclose to the soil surface, this study shows that computed nutrientleaching fluxes may be largely under-estimated (up to 2.5 fold)when preferential flow is not taken into account. However this pat-tern may be quite different in richer soils, where large nutrient fluxesmay be delivered by deep horizons. It is thus important when com-puting nutrient input–output budgets to properly calibrate hydrolog-ical models with both soil water content data sets and tracingexperiments. While, yearly leaching fluxes give insight on change insoil fertility, a small time-scale is necessary to be able to study pro-cesses and relations between nutrients which govern soil solutioncomposition in depth.
The simple pool and flux hydrological model BILJOUwas proven tobe as performing as the more sophisticated HYDRUS-1D for this sandysoils and a non-reactive solute transport module has been develop.However, BILJOU's ability to simulate solute transport would needto be validated on a variety of different soil types.
Acknowledgments
Wewould like to thank the following institutions: Région Lorraineand the European Fund for Regional Development (FEDER), GIPECOFORand the Zone Atelier Moselle (ZAM) for funding the present study.
We are also grateful to Dr Granier and Dr Šimůnek for making re-spectively BILJOU and HYDRUS-1D available. Finally, we thank thePTEF (Plateau Technique d'Ecologie Fonctionnelle) for the deuteriumisotope analysis.
References
Allaire, S.E., Roulier, S., Cessna, A.J., 2009. Quantifying preferential flow in soils: a re-view of different techniques. Journal of Hydrology 378, 179–204.
Augusto, L., Ranger, J., Binkley, D., Rothe, A., 2002. Impact of several common tree spe-cies of European temperate forests on soil fertility. Annals of Forest Science 59,233–253.
Aussenac, G., 1972. Etude de l'évapotranspiration réelle de quatre peuplementsforestiers dans l'est de la France. Annals of Forest Science 29, 369–389.
Aussenac, G., Boulangeat, C., 1980. Interception des précipitations et évapotranspira-tion réelle dans des peuplements de feuillu (Fagus silvatica L.) et de résineux(Pseudotsuga menziesii (Mirb) Franco). Annals of Forest Science 37, 91–107.
Becker, M.W., Coplen, T.B., 2001. Use of deuterated water as a conservative artificialgroundwater tracer. Hydrogeology Journal 9, 512–516.
Bormann, F.H., Likens, G.E., 1967. Nutrient cylcing. Science 155, 424–429.Capriel, P., Beck, T., Borchert, H., Gronholz, J., Zachmann, G., 1995. Hydrophobicity of
the organic matter in arable soils. Soil Biology and Biochemistry 27, 1453–1458.Dambrine, E., Thomas, A.L., Party, J.P., Probst, A., Boudot, J.P., Duc, M., Dupouey, J.L.,
Gégout, J.C., Guérold, F., King, D., Landmann, G., Maitat, O., Nicolai, M., Pollier, B.,Thimonier, A., 1998. Acidité des écosytèmes forestiers dans les Vosges gréseuses: dis-tribution, évolution, rôle des dépôts atmosphériques et conséquences biologiques.Compte rendu de l'Académie d'Agriculture Française 84, 75–94.
Deeks, L.K., Bengough, A.G., Stutter, M.I., Young, I.M., Zhang, X.X., 2008. Characterisa-tion of flow paths and saturated conductivity in a soil block in relation to chloridebreakthrough. Journal of Hydrology 348, 431–441.
Edwards, W.M., Shipitalo, M.J., Dick, W.A., Owens, L.B., 1992. Rainfall intensity affectstransport of water and chemicals through macropores in no-till soil. Soil ScienceSociety of America Journal 56, 52–58.
Ellsworth, P.Z., Williams, D.G., 2007. Hydrogen isotope fractionation during water up-take by woody xerophytes. Plant and Soil 291, 93–107.
Feyen, H., Wunderli, H., Wydler, H., Papritz, A., 1999. A tracer experiment to study flowpaths of water in a forest soil. Journal of Hydrology 225, 155–167.
Ghodrati, M., Chendorain, M., Chang, Y.J., 1999. Characterization of macropore flowmechanisms in soil by means of a split macropore column. Soil Science Society ofAmerica Journal 63, 1093–1101.
Granier, A., Badeau, V., Bréda, N., 1995. Modélisation du bilan hydrique des peuplementsforestiers. Revue Forestière Française XLVN Special issue, pp. 59–67.
Granier, A., Bréda, N., Biron, P., Villette, S., 1999. A lumped water balance model to eval-uate duration and intensity of drought constraints in forest stands. EcologicalModelling 116, 269–283.
Guérold, F., Boudot, J.-P., Jacquemin, G., Vein, D., Merlet, D., Rouiller, J., 2000.Macroinvertebrate community loss as a result of headwater stream acidification in theVosges Mountains (N-E France). Biodiversity & Conservation 9 (6), 767–783.
Jardine, P.M., Wilson, G.V., Luxmore, R.J., McCarthy, J.F., 1989. Transport of inorganicand natural organic tracers through an isolated pedon in a forest watershed. SoilScience Society of America Journal 53, 317–323.
Jardine, P.M., Wilson, G.V., Luxmore, R.J., 1990. Unsaturated solute transport through aforest soil during rain storm events. Geoderma 46, 103–118.
Jarvis, N.J., 2007. A review of non-equilibrium water flow and solute transport in soilmacropores: principles, controlling factors and consequences for water quality.European Journal of Soil Science 58, 523–546.
Koeniger, P., Leibundgut, C., Link, T., Marshall, J.D., 2010. Stable isotopes applied aswater tracers in column and field studies. Organic Geochemistry 41, 31–40.
Kohne, J.M., Kohne, S., Simunek, J., 2009. A review of model applications for structuredsoils: (a) water flow and tracer transport. Journal of Contaminant Hydrology 104,4–35.
Kreuzwieser, J., Gessler, A., 2010. Global climate change and tree nutrition: influence ofwater availability. Tree Physiology 30, 1221–1234.
Kulmatiski, A., Beard, K.H., Verweij, R.J.T., February, E.C., 2010. A depth-controlled trac-er technique measures vertical, horizontal and temporal patterns of water use bytrees and grasses in a subtropical savanna. New Phytologist 188, 199–209.
Kung, K.J.S., 1990. Preferential flow in a sandy vadose zone: 1. Field observation.Geoderma 46, 51–58.
Langner, H.W., Gaber, H.M., Wraith, J.M., Huwe, B., Inskeep, W.P., 1999. Preferential flowthrough intact soil cores: effects of matric head. Soil Science Society of America Journal63, 1591–1598.
Legout, A., 2008. Cycles Biogéochimiques et bilans de fertilité minérale en hêtraies deplaine. Agroparistech-Engref, Nancy, p. 281.
Legout, A., Legout, C., Nys, C., Dambrine, E., 2009. Preferential flow and slow convectivechloride transport through the soil of a forested landscape (Fougères, France).Geoderma 151, 179–190.
Lennartz, B., Kamra, S.K., 1998. Temporal variability of solute transport under vadosezone conditions. Hydrological Processes 12, 1939–1949.
Luxmoore, R.J., Jardine, P.M., Wilson, G.V., Jones, J.R., Zelazny, L.W., 1990. Physical andchemical controls of preferred path flow through a forested hillslope. Geoderma46, 139–154.
Mali, N., Urbanc, J., Leis, A., 2007. Tracing of water movement through the unsaturatedzone of a coarse gravel aquifer by means of dye and deuterated water. Environ-mental Geology 51, 1401–1412.
22 G. van der Heijden et al. / Geoderma 195–196 (2013) 12–22
Maloszewski, P., Zuber, A., 1982. Determining the turnover time of groundwater sys-tems with the aid of environmental tracers. Journal of Hydrology 57, 207–231.
Maloszewski, P., Rauert, W., Trimborn, P., Herrmann, A., Rau, R., 1992. Isotope hydro-logical study of mean transit times in an alpine basin (Wimbachtal, Germany).Journal of Hydrology 140, 343–360.
Marc, V., Robinson, M., 2004. Application of the deuterium tracing method for the esti-mation of tree sap flow and stand transpiration of a beech forest (Fagus silvatica L.)in a mountainous Mediterranean region. Journal of Hydrology 285, 248–259.
Marques, R., Ranger, J., Gelhaye, D., Pollier, B., Ponette, Q., Goedert, O., 1996. Compari-son of chemical composition of soil solutions collected by zero-tension plate lysim-eters with those from ceramic-cup lysimeters in a forest soil. European Journal ofSoil Science 47, 407–417.
McDonnell, J., 1990. A rationale for old water discharge through macropores in a steephumid catchment. Water Resources Research 26, 2821–2832.
McDonnell, J., Rowe, L., Stewart, M., 1999. A combined tracer-hydrometric approach toassess the effect of catchment scale on water flow path, source and age. Intergratedmethods in catchment hydrology-Tracer, remote sensing and new hydrometrictechniques (Proceedings of IUGG 99 symposium HS4), pp. 265–273 (IAHS Publ.no. 258, Birmingham).
Meinzer, F.C., Brooks, J.R., Domec, J.C., Gartner, B.L., Warren, J.M., Woodruff, D.R., Bible,K., Shaw, D.C., 2006. Dynamics of water transport and storage in conifers studiedwith deuterium and heat tracing techniques. Plant, Cell & Environment 29,105–114.
Ptak, T., Piepenbrink, M., Martac, E., 2004. Tracer tests for the investigation of heteroge-neous porous media flow and stochastic modelling of flow and transport — a re-view of some recent developments. Journal of Hydrology 294, 122–163.
Ranger, J., Turpault, M.-P., 1999. Input–output nutrient budgets as a diagnostic tool forsustainable forest management. Forest Ecology and Management 122, 139–154.
Ranger, J., Marques, R., Jussy, J.-H., 2001. Forest soil dynamics during stand develop-ment assessed by lysimeter and centrifuge solutions. Forest Ecology and Manage-ment 144, 129–145.
Ranger, J., Allie, S., Gelhaye, D., Pollier, B., Turpault, M.P., Granier, A., 2002. Nutrientbudgets for a rotation of a Douglas-fir plantation in the Beaujolais (France) basedon a chronosequence study. Forest Ecology and Management 171, 3–16.
Ranger, J., Andreux, F., Bienaimé, S., Berthelin, J., Bonnaud, P., Boudot, J.P., Bréchet, C.,Buée, M., Calmet, J., Chaussod, R., Gelhaye, D., Gelhaye, L., Gérard, F., Jaffrain, J.,Lejon, D., Le Tacon, F., Lévêque, J., Maurice, J., Merlet, D., Moukoumi, J., Munier-Lamy, C., Nourrisson, G., Pollier, B., Ranjard, L., Simonsson, M., Turpault, M.P.,Vairelles, D., Zeller, B., 2004. Effet des substitutions d'essence sur le fonctionnementorgano-minéral de l'écosystème forestier, sur les communautés microbiennes etsur la diversité des communautés fongiques mycorhiziennes et saprophytes (casdu dispositif de Breuil-Morvan), Rapport final contrat INRA-GIP Ecofor 2001–24,No. INRA 1502A. INRA Biogéochimie des Ecosystèmes Forestiers (UR 1138), 54280Champenoux.
Rawlins, B.G., Baird, A.J., Trudgill, S.T., Hornung, M., 1997. Absence of preferential flow inthe percolating waters of a coniferous forest soil. Hydrological Processes 11, 575–585.
Schar, C., Vidale, P.L., Luthi, D., Frei, C., Haberli, C., Liniger, M.A., Appenzeller, C., 2004.The role of increasing temperature variability in European summer heatwaves.Nature 427, 332–336.
Seyfried, M.S., Rao, P.S.C., 1987. Solute transport in undisturbed columns of an aggre-gated tropical soil: preferential flow effects. Soil Science Society of America Journal51, 1434–1444.
Sidle, R.C., Tsuboyama, Y., Noguchi, S., Hosoda, I., Fujieda, M., Shimizu, T., 2000. Strom-flow generation in steep forested headwaters: a linked hydrogeomorphic para-digm. Hydrological Processes 14, 369–385.
Simon, T., 2007. Characterisation of soil organic matter in long-term fallow experimentwith respect to the soil hydrophobicity and wettability. Soil and Water Research 2,96–103.
Simon, T., Javurek, M., Mikanova, O., Vach, M., 2009. The influence of tillage systemson soil organic matter and soil hydrophobicity. Soil and Tillage Research 105,44–48.
Simunek, J., Jarvis, N.J., van Genuchten, M.T., Gardenas, A., 2003. Review and compari-son of models for describing non-equilibrium and preferential flow and transportin the vadose zone. Journal of Hydrology 272, 14–35.
Šimůnek, J., Šejna, M., Saito, H., Sakai, M., van Genuchten, M.T., 2008. The Hydrus-1Dsoftware package for simulating the movement of water, heat, and multiple solutesin variably saturated media. Version 4.0, HYDRUS Software Series, 3. Departmentof Environmental Sciences, University of California Riverside, Riverside, California,USA, p. 315.
Starr, M., 1999. WATBAL: a model for estimating monthly water balance components, in-cluding soil water fluxes. In: Kleemola, S., Forsius, M. (Eds.), 8th Annual Report 1999.UN ECE ICP Integrated Monitoring: The Finnish Environment (pp. 325:321–325).
Stone, W.W., Wilson, J.T., 2006. Preferential flow estimates to an agricultural tile drainwith implications for glyphosate transport. Journal of Environmental Quality 35,1825–1835.
Stumpp, C., Maloszewski, P., 2010. Quantification of preferential flow and flow hetero-geneities in an unsaturated soil planted with different crops using the environ-mental isotope delta(18)O. Journal of Hydrology 394, 407–415.
Tsuboyama, Y., Sidle, R.C., Noguchi, S., Hosoda, I., 1994. Flow and solute transportthrough the soil matrix and macropores of a hillslope segment. Water ResourcesResearch 30, 879–890.
Turton, D.J., Barnes, D.R., Navar, J.D., 1995. Old and new water in subsurface flow from aforest soil block. Journal of Environmental Quality 24, 139–146.
Uchida, T., Kosugi, K., Mizuyama, T., 2001. Effects of pipeflow on hydrological processand its relation to landslide: a review of pipeflow studies in forested headwatercatchments. Hydrological Processes 15, 2151–2174.
van der Heijden, G., Legout, A., Nicolas, M., Ulrich, E., Johnson, D.W., Dambrine, E., 2011.Long-term sustainability of forest ecosystems on sandstone in the Vosges Moun-tains (France) facing atmospheric deposition and silvicultural change. Forest Ecol-ogy and Management 261, 730–740.
Viville, D., Ladouche, B., Bariac, T., 2005. Isotope hydrological study of mean transittime in the granitic Strengbach catchment (Vosges massif, France): applicationof the FlowPC model with modified input function. Hydrological Processes 20,1737–1751.
Waddington, J.M., Roulet, N.T., Hill, A.R., 1993. Runoff mechanisms in a forestedgroundwater dsicharge wetland. Journal of Hydrology 147, 37–60.
Williams, A.G., Dowd, J.F., Scholefield, D., Holden, N.M., Deeks, L.K., 2003. Preferentialflow variability in a well-structured soil. Soil Science Society of America Journal67, 1272–1281.
Wilson, K.B., Hanson, P.J., Mulholland, P.J., Baldocchi, D.D., Wullschleger, S.D., 2001. A com-parison of methods for determining forest evapotranspiration and its components:sap-flow, soil water budget, eddy covariance and catchment water balance. Agricul-tural and Forest Meteorology 106, 153–168.
Related Documents