I NTANGIBLES , INVESTMENT, AND EFFICIENCY Nicolas Crouzet 1 Janice Eberly 2 1 Kellogg School of Management, Northwestern University 2 Kellogg School of Management, Northwestern University & NBER TPRI competition conference July 2018

Welcome message from author
This document is posted to help you gain knowledge. Please leave a comment to let me know what you think about it! Share it to your friends and learn new things together.
Transcript

INTANGIBLES, INVESTMENT, AND EFFICIENCY
Nicolas Crouzet1 Janice Eberly2
1Kellogg School of Management, Northwestern University
2Kellogg School of Management, Northwestern University & NBER
TPRI competition conferenceJuly 2018

OVERVIEW
Two salient macro trends, since mid-1990’s
- Increasing business concentrationGutierrez and Philippon (2018) (”market power”); Autor et al. (2017)(”productivity gap”)
- Low (physical) investment, relative to QGutierrez and Philippon (2017), Alexander and Eberly (2017), Fernald et al.(2017)
This paper: explore a joint explanation for these two trends
- Productivity gains among industry leaders, associated with shift ininvestment toward non-physical (intangible) capital
- Illustration in the retail sector:1. stable markups2. growth in productivity, particularly among largest firms
Foster, Haltiwanger & Krizan (2006)
3. closely correlated growth in intangible capital
1 / 11

OVERVIEW
Two salient macro trends, since mid-1990’s
- Increasing business concentrationGutierrez and Philippon (2018) (”market power”); Autor et al. (2017)(”productivity gap”)
- Low (physical) investment, relative to QGutierrez and Philippon (2017), Alexander and Eberly (2017), Fernald et al.(2017)
This paper: explore a joint explanation for these two trends
- Productivity gains among industry leaders, associated with shift ininvestment toward non-physical (intangible) capital
- Illustration in the retail sector:
1. stable markups2. growth in productivity, particularly among largest firms
Foster, Haltiwanger & Krizan (2006)
3. closely correlated growth in intangible capital
1 / 11

OVERVIEW
Two salient macro trends, since mid-1990’s
- Increasing business concentrationGutierrez and Philippon (2018) (”market power”); Autor et al. (2017)(”productivity gap”)
- Low (physical) investment, relative to QGutierrez and Philippon (2017), Alexander and Eberly (2017), Fernald et al.(2017)
This paper: explore a joint explanation for these two trends
- Productivity gains among industry leaders, associated with shift ininvestment toward non-physical (intangible) capital
- Illustration in the retail sector:1. stable markups
2. growth in productivity, particularly among largest firmsFoster, Haltiwanger & Krizan (2006)
3. closely correlated growth in intangible capital
1 / 11

OVERVIEW
Two salient macro trends, since mid-1990’s
- Increasing business concentrationGutierrez and Philippon (2018) (”market power”); Autor et al. (2017)(”productivity gap”)
- Low (physical) investment, relative to QGutierrez and Philippon (2017), Alexander and Eberly (2017), Fernald et al.(2017)
This paper: explore a joint explanation for these two trends
- Productivity gains among industry leaders, associated with shift ininvestment toward non-physical (intangible) capital
- Illustration in the retail sector:1. stable markups2. growth in productivity, particularly among largest firms
Foster, Haltiwanger & Krizan (2006)
3. closely correlated growth in intangible capital
1 / 11

OVERVIEW
Two salient macro trends, since mid-1990’s
- Increasing business concentrationGutierrez and Philippon (2018) (”market power”); Autor et al. (2017)(”productivity gap”)
- Low (physical) investment, relative to QGutierrez and Philippon (2017), Alexander and Eberly (2017), Fernald et al.(2017)
This paper: explore a joint explanation for these two trends
- Productivity gains among industry leaders, associated with shift ininvestment toward non-physical (intangible) capital
- Illustration in the retail sector:1. stable markups2. growth in productivity, particularly among largest firms
Foster, Haltiwanger & Krizan (2006)
3. closely correlated growth in intangible capital
1 / 11

WHY RETAIL?HHI OF SALES, COMPUSTAT US FIRMS
.12
.14
.16
.18
1990 1995 2000 2005 2010 2015
All Excluding retail Excluding retail and oil & gas
Sales HHI in retail: .14 in 1990; .36 in 2015.Oil & gas
2 / 11

THE INVESTMENT GAP IN RETAIL
-.15
-.1
-.05
0
1990 1995 2000 2005 2010 2015year
point estimate +/- 2 s.e.
(I/K)i,t = αi + δt + X′i,tβ + εi,t
Xi,t ≡ ( Qi,t−1, (CF/K)i,t−1 )′
3 / 11

PROXIMATE CAUSES
4 / 11

PROXIMATE CAUSES
- Increasing market power of incumbents?
- Productivity gains, especially among industry leaders?
=⇒ rising concentration
4 / 11

PROXIMATE CAUSES
.1
.15
.2
.25
.3
.35
1.3
1.35
1.4
1.45
1.5
1990 1995 2000 2005 2010 2015
Markup (LHS) HHI (RHS)
Markup ≡ SalesCost of goods sold
4 / 11

PROXIMATE CAUSES
- Increasing market power of incumbents?
- Productivity gains, especially among industry leaders?
=⇒ rising concentration
4 / 11

PROXIMATE CAUSES
- Increasing market power of incumbents?
- Productivity gains, especially among industry leaders?
=⇒ rising concentration
4 / 11
PROXIMATE CAUSES
.1
.15
.2
.25
.3
.35
120
140
160
180
200
1990 1995 2000 2005 2010 2015
Revenue per employee (1990 $ '000)
.1
.15
.2
.25
.3
.35
100
110
120
130
140
150
1990 1995 2000 2005 2010 2015
Multi-factor productivity (base 1990 = 100)
HHI (RHS)
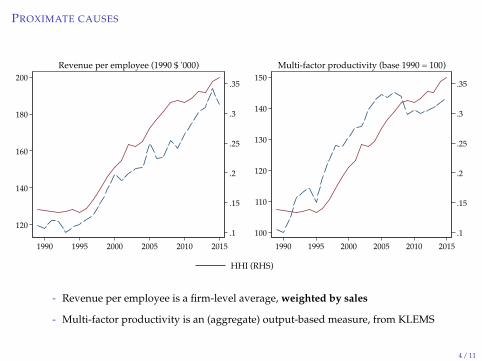
- Revenue per employee is a firm-level average, weighted by sales
- Multi-factor productivity is an (aggregate) output-based measure, from KLEMS
4 / 11

WHAT HAPPENED IN RETAIL?
.1
.15
.2
.25
.3
.35
1.3
1.4
1.5
1.6
1.7
1.8
1.9
1990 1995 2000 2005 2010 2015
Inventory coverage (months, LHS) HHI (RHS)
- 1990’s & early 2000’s: faster payment systems, more accurate pricing, betterinventory management (Walmart)
Foster, Haltiwanger and Krizan (2006)
- late 2000’s & early 2010’s: development of online retail platforms and distributedretail systems (Amazon)
- requires intangible “know-how”, not only investment in new physical capital
5 / 11

PRODUCTIVITY VS. MARKET POWER
Jeff Bezos (09/28/2011)
6 / 11

INTANGIBLES AND PRODUCTIVITYSECTOR-WIDE
5
10
15
20
120
140
160
180
200
1990 1995 2000 2005 2010 2015
Revenue per employee (1990 $ '000, LHS)Intangible share of total assets (%, RHS)
Acquisition flows
7 / 11
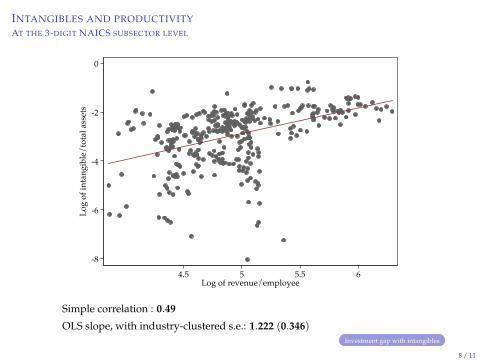
INTANGIBLES AND PRODUCTIVITYAT THE 3-DIGIT NAICS SUBSECTOR LEVEL
-8
-6
-4
-2
0
Log
of in
tang
ible
/tot
al a
sset
s
4.5 5 5.5 6Log of revenue/employee
Simple correlation : 0.49
OLS slope, with industry-clustered s.e.: 1.222 (0.346)Investment gap with intangibles
8 / 11

INTANGIBLES AND PRODUCTIVITYAT THE 3-DIGIT NAICS SUBSECTOR LEVEL — INCLUDING CAPITALIZED R&D
-8
-6
-4
-2
0
Log
of in
tang
ible
/tot
al a
sset
s
4.5 5 5.5 6Log of revenue/employee
Simple correlation : 0.57
OLS slope, with industry-clustered s.e.: 1.432 (0.320)Investment gap with intangibles
9 / 11
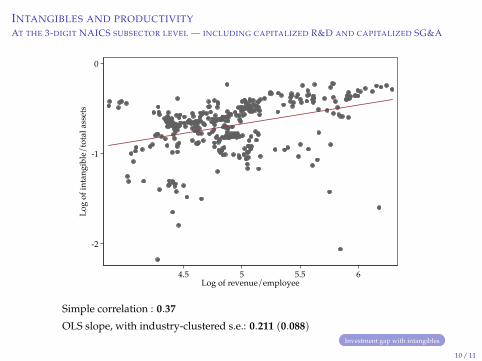
INTANGIBLES AND PRODUCTIVITYAT THE 3-DIGIT NAICS SUBSECTOR LEVEL — INCLUDING CAPITALIZED R&D AND CAPITALIZED SG&A
-2
-1
0
Log
of in
tang
ible
/tot
al a
sset
s
4.5 5 5.5 6Log of revenue/employee
Simple correlation : 0.37
OLS slope, with industry-clustered s.e.: 0.211 (0.088)Investment gap with intangibles
10 / 11

CONCLUSION
In the US retail sector
- Higher concentration
- Large productivity gains, esp. among industry leaders
- Despite this fact, physical investment remains low
- But higher productivity strongly correlated with intangible investment
Unanswered questions
- How widespread is this phenomenon, beyond retail?
- Does intangible investment only lead to productivity gains, or could itserve to increase market power?
brand value
11 / 11

PLAN
MORE

Alexander, L. and J. Eberly (2017). Investment hollowing out. IMF EconomicReview forthcoming.
Autor, D., D. Dorn, L. F. Katz, C. Patterson, and J. V. Reenen (2017).Concentrating on the fall of the labor share. American EconomicReview 107(5), 180–185.
Fernald, J. G., R. E. Hall, J. H. Stock, and M. W. Watson (2017). Thedisappointing recovery of output after 2009. Brookings Papers on EconomicActivity.
Gutierrez, G. and T. Philippon (2017). Investment-less growth: An empiricalinvestigation. Brookings Papers on Economic Activity forthcoming.
Gutierrez, G. and T. Philippon (2018). Declining competition and investmentin the us. Technical report, NBER working paper.

CONCENTRATION IN THE OIL & GAS SECTORHHI OF SALES, COMPUSTAT US FIRMS
.12
.14
.16
.18
1990 1995 2000 2005 2010 2015
All Excl. oil and gas Excl. retail and oil & gas
Concentration in retail
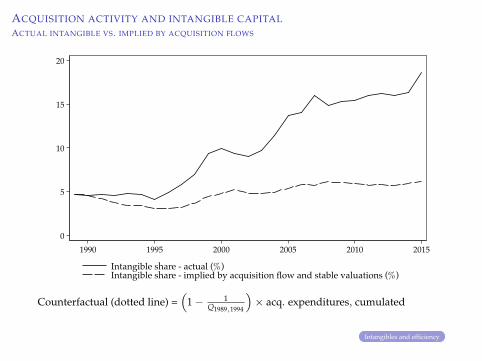
ACQUISITION ACTIVITY AND INTANGIBLE CAPITALACTUAL INTANGIBLE VS. IMPLIED BY ACQUISITION FLOWS
0
5
10
15
20
1990 1995 2000 2005 2010 2015
Intangible share - actual (%)Intangible share - implied by acquisition flow and stable valuations (%)
Counterfactual (dotted line) =(
1− 1Q1989,1994
)× acq. expenditures, cumulated
Intangibles and efficiency

INTANGIBLES AND THE INVESTMENT GAPTIME EFFECTS IN INVESTMENT/Q REGRESSION, INCLUDE INTANGIBLE INVESTMENT
-.15
-.1
-.05
0
1990 1995 2000 2005 2010 2015year
Physical investmentPhysical plus intangible investment, with +/- 2 s.e. band
Intangible investment = net change in balance sheet intangibles + R&D + advertising
Intangibles and productivity
Related Documents