TOWN OF TRUMBULL PENSION BOARD Meeting In accordance with Sec. 1-19 of the General Statutes Right-to-Know Law, the Pension Board will have a virtual meeting on Tuesday, October 26, 2021 at 7:00 P.M. via Zoom. Join the meeting online: https://us06web.zoom.us/j/83361327666?pwd=ZmRneU5lWWdnTjBhSTBBamZScFFXUT09 Webinar ID: 833 6132 7666 Password: 439910 Join by telephone: (301) 715-8592 or (877) 853-5257 (Toll Free) / Webinar ID: 833 6132 7666 A G E N D A Call to Order Investment Update – 3 rd Quarter – Beirne Wealth Consulting Approval of 2022 Pension Board Meeting Dates • January 25, 2022 • April 26, 2022 • July 26, 2022 • October 25, 2022 Approval of Pension Benefits Frank Bourquin 08/01/21 $ 1,564.14 Mary-Ellen Bykowski 08/01/21 425.83 Linda Dunn 09/01/21 1,923.95 Evelyn Feola 07/01/21 577.04 Approval of Contribution Returns David Grischuk (spouse) 08/12/21 $8,993.03 Rebecca Steinberg 8/14/2021 7,616.50 Approval of Minutes – July 27, 2021 Adjournment

Welcome message from author
This document is posted to help you gain knowledge. Please leave a comment to let me know what you think about it! Share it to your friends and learn new things together.
Transcript

TOWN OF TRUMBULL PENSION BOARD
Meeting
In accordance with Sec. 1-19 of the General Statutes Right-to-Know Law, the Pension Board will have a virtual meeting on Tuesday, October 26, 2021 at 7:00 P.M. via Zoom. Join the meeting online: https://us06web.zoom.us/j/83361327666?pwd=ZmRneU5lWWdnTjBhSTBBamZScFFXUT09 Webinar ID: 833 6132 7666 Password: 439910 Join by telephone: (301) 715-8592 or (877) 853-5257 (Toll Free) / Webinar ID: 833 6132 7666
A G E N D A
Call to Order Investment Update – 3rd Quarter – Beirne Wealth Consulting Approval of 2022 Pension Board Meeting Dates
• January 25, 2022 • April 26, 2022 • July 26, 2022 • October 25, 2022
Approval of Pension Benefits
Frank Bourquin 08/01/21 $ 1,564.14 Mary-Ellen Bykowski 08/01/21 425.83 Linda Dunn 09/01/21 1,923.95 Evelyn Feola 07/01/21 577.04
Approval of Contribution Returns
David Grischuk (spouse) 08/12/21 $8,993.03 Rebecca Steinberg 8/14/2021 7,616.50
Approval of Minutes – July 27, 2021 Adjournment

Your Strategic Partner for Defined Benefit Plans
CONNECTICUT ● PENNSLYVANIA
REPORT PREPARED FOR:
John-Oliver Beirne, CRPC®, MBAPartner & President
[email protected](203) 701-8976
Lindsey Allard, AWMA®, MBAManaging Director
[email protected](203) 951-0305
Quarter Ending 9/30/2021
@Beirne Wealth Consulting Services,LLC

Periods Ending 09/30/21
Name1
MonthLast 3 Months YTD
1Year
3Years
5Years
10Years
15Years
20Years
US Equity
Russell 3000 Index -4.5 -0.1 15.0 31.9 16.0 16.9 16.6 10.4 14.4
S&P 500 Index -4.7 0.6 15.9 30.0 16.0 16.9 16.6 10.4 15.0
Russell 1000 Index -4.6 0.2 15.2 31.0 16.4 17.1 16.8 10.5 14.7
Russell 1000 Growth Index -5.6 1.2 14.3 27.3 22.0 22.8 19.7 13.3 13.5
Russell 1000 Value Index -3.5 -0.8 16.1 35.0 10.1 10.9 13.5 7.5 15.4
Russell Midcap Index -4.1 -0.9 15.2 38.1 14.2 14.4 15.5 10.3 14.6
Russell 2000 Index -2.9 -4.4 12.4 47.7 10.5 13.5 14.6 9.2 11.4
Russell 2000 Growth Index -3.8 -5.7 2.8 33.3 11.7 15.3 15.7 10.6 8.0
Russell 2000 Value Index -2.0 -3.0 22.9 63.9 8.6 11.0 13.2 7.5 14.4
International Equity
MSCI AC World Index -4.1 -1.0 11.5 28.0 13.1 13.8 12.5 7.8 -
MSCI AC World ex USA -3.1 -2.9 6.3 24.4 8.5 9.4 8.0 4.9 -
MSCI EAFE Index -2.8 -0.4 8.8 26.3 8.1 9.3 8.6 4.6 11.7
MSCI Emerging Markets Index -3.9 -8.0 -1.0 18.6 9.0 9.6 6.5 6.0 -
Fixed Income
90 Day U.S. Treasury Bill 0.0 0.0 0.0 0.1 1.2 1.2 0.6 1.0 6.7
Blmbg. U.S. Aggregate -0.9 0.1 -1.6 -0.9 5.4 2.9 3.0 4.2 11.2
Blmbg. U.S. Gov't/Credit -1.1 0.0 -1.9 -1.1 5.9 3.2 3.2 4.3 11.0
Bloomberg U.S. Municipal Bond Index -0.7 -0.3 0.8 2.6 5.1 3.3 3.9 4.2 10.1
Blmbg. U.S. Corp: High Yield Index 0.0 0.9 4.5 11.3 6.9 6.5 7.4 7.3 -
Real Estate
FTSE NAREIT All REITs Index -5.7 0.2 21.4 32.5 11.2 8.3 11.9 6.7 10.8
NCREIF Property Index - - - - - - - - 8.1
Alternatives
HFRI Fund of Funds Composite Index 0.2 0.8 5.8 14.4 6.5 5.8 4.5 3.1 -
Inflation
CPI - All Urban Consumers (SA) 0.4 1.2 4.8 5.4 2.8 2.6 1.9 2.0 3.3
Page 2 of 17
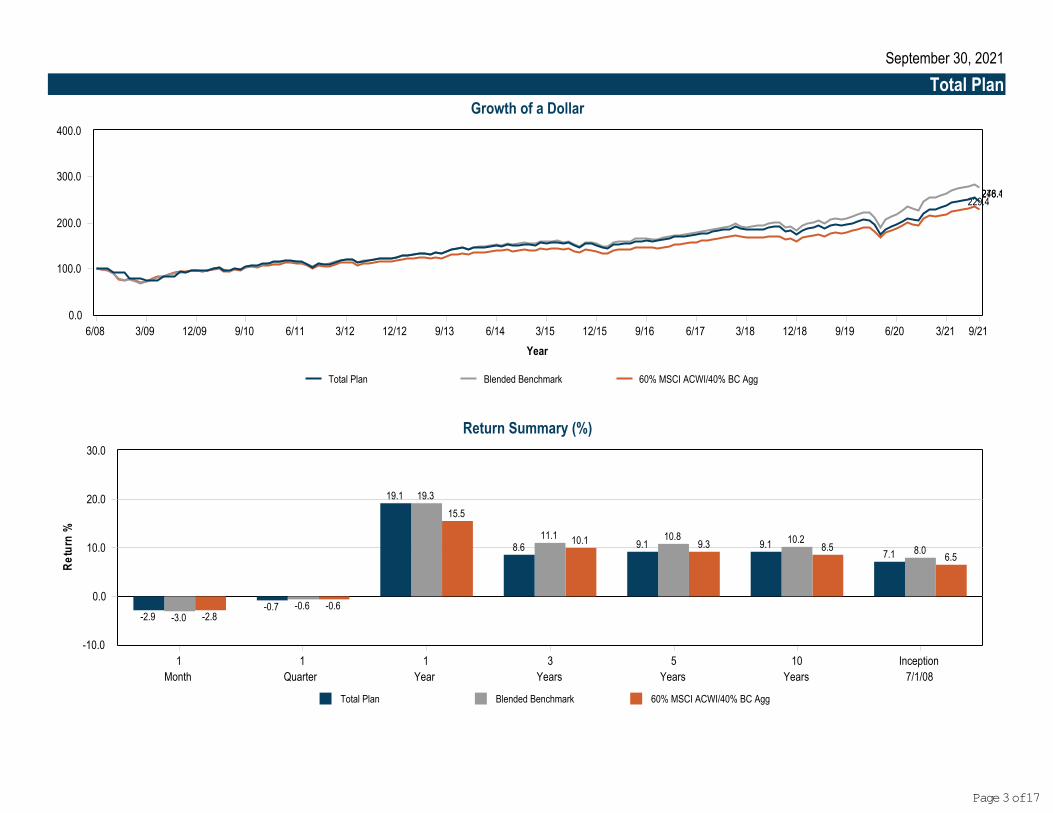
Growth of a Dollar
Total Plan Blended Benchmark 60% MSCI ACWI/40% BC Agg
0.0
100.0
200.0
300.0
400.0
6/08 3/09 12/09 9/10 6/11 3/12 12/12 9/13 6/14 3/15 12/15 9/16 6/17 3/18 12/18 9/19 6/20 3/21 9/21
Year
229.4276.4248.1
Return Summary (%)
Total Plan Blended Benchmark 60% MSCI ACWI/40% BC Agg
0.0
10.0
20.0
30.0
-10.0
Re
turn
%
1
Month
1
Quarter
1
Year
3
Years
5
Years
10
Years
Inception
7/1/08
-2.8-0.6
15.5
10.1 9.3 8.56.5
-3.0-0.6
19.3
11.1 10.8 10.28.0
-2.9-0.7
19.1
8.6 9.1 9.17.1
September 30, 2021
Total Plan
Page 3 of 17
■ ■ ■
September 30, 2021
Begin MarketValue
$
Net CashFlow
$
Market Value($)
% ofPortfolio
3 Mo(%)
YTD1 Yr(%)
3 Yrs(%)
5 Yrs(%)
10 Yrs(%)
Inception(%)
InceptionDate
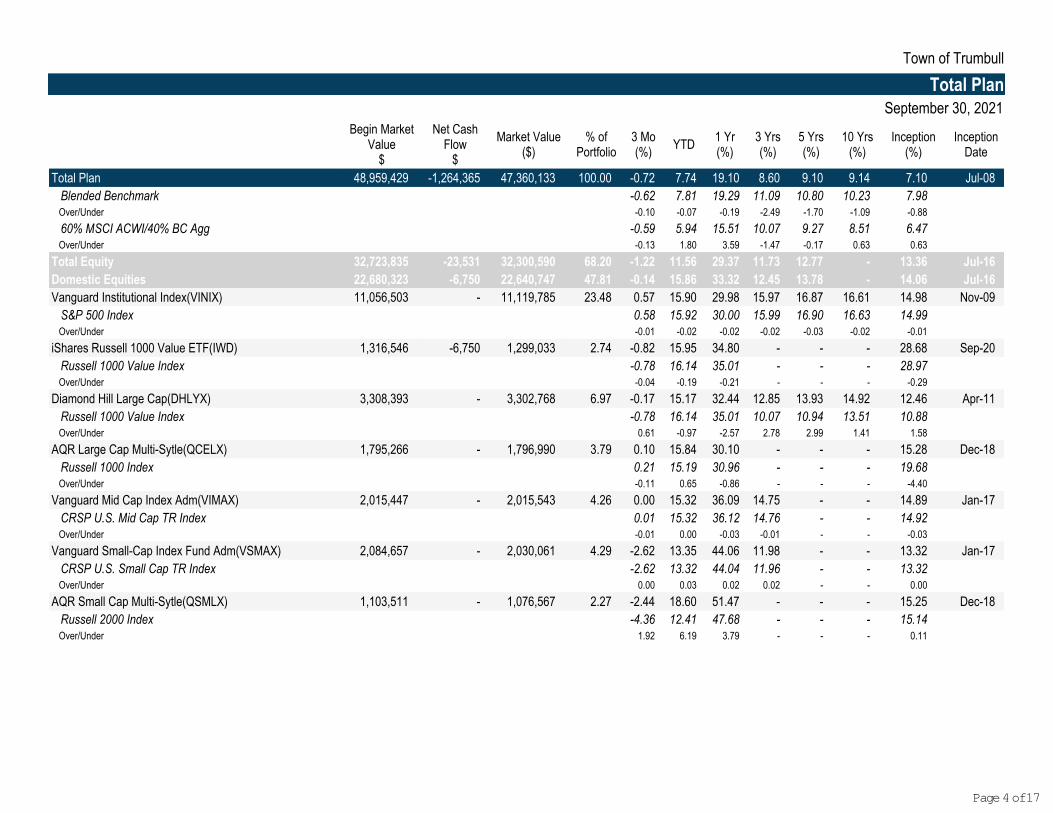
Total Plan 48,959,429 -1,264,365 47,360,133 100.00 -0.72 7.74 19.10 8.60 9.10 9.14 7.10 Jul-08
Blended Benchmark -0.62 7.81 19.29 11.09 10.80 10.23 7.98 Over/Under -0.10 -0.07 -0.19 -2.49 -1.70 -1.09 -0.88
60% MSCI ACWI/40% BC Agg -0.59 5.94 15.51 10.07 9.27 8.51 6.47 Over/Under -0.13 1.80 3.59 -1.47 -0.17 0.63 0.63
Total Equity 32,723,835 -23,531 32,300,590 68.20 -1.22 11.56 29.37 11.73 12.77 - 13.36 Jul-16
Domestic Equities 22,680,323 -6,750 22,640,747 47.81 -0.14 15.86 33.32 12.45 13.78 - 14.06 Jul-16
Vanguard Institutional Index(VINIX) 11,056,503 - 11,119,785 23.48 0.57 15.90 29.98 15.97 16.87 16.61 14.98 Nov-09
S&P 500 Index 0.58 15.92 30.00 15.99 16.90 16.63 14.99 Over/Under -0.01 -0.02 -0.02 -0.02 -0.03 -0.02 -0.01
iShares Russell 1000 Value ETF(IWD) 1,316,546 -6,750 1,299,033 2.74 -0.82 15.95 34.80 - - - 28.68 Sep-20
Russell 1000 Value Index -0.78 16.14 35.01 - - - 28.97 Over/Under -0.04 -0.19 -0.21 - - - -0.29
Diamond Hill Large Cap(DHLYX) 3,308,393 - 3,302,768 6.97 -0.17 15.17 32.44 12.85 13.93 14.92 12.46 Apr-11
Russell 1000 Value Index -0.78 16.14 35.01 10.07 10.94 13.51 10.88 Over/Under 0.61 -0.97 -2.57 2.78 2.99 1.41 1.58
AQR Large Cap Multi-Sytle(QCELX) 1,795,266 - 1,796,990 3.79 0.10 15.84 30.10 - - - 15.28 Dec-18
Russell 1000 Index 0.21 15.19 30.96 - - - 19.68 Over/Under -0.11 0.65 -0.86 - - - -4.40
Vanguard Mid Cap Index Adm(VIMAX) 2,015,447 - 2,015,543 4.26 0.00 15.32 36.09 14.75 - - 14.89 Jan-17
CRSP U.S. Mid Cap TR Index 0.01 15.32 36.12 14.76 - - 14.92 Over/Under -0.01 0.00 -0.03 -0.01 - - -0.03
Vanguard Small-Cap Index Fund Adm(VSMAX) 2,084,657 - 2,030,061 4.29 -2.62 13.35 44.06 11.98 - - 13.32 Jan-17
CRSP U.S. Small Cap TR Index -2.62 13.32 44.04 11.96 - - 13.32 Over/Under 0.00 0.03 0.02 0.02 - - 0.00
AQR Small Cap Multi-Sytle(QSMLX) 1,103,511 - 1,076,567 2.27 -2.44 18.60 51.47 - - - 15.25 Dec-18
Russell 2000 Index -4.36 12.41 47.68 - - - 15.14 Over/Under 1.92 6.19 3.79 - - - 0.11
Town of Trumbull
Total Plan
Page 4 of 17
Town of Trumbull
Total PlanBegin Market
Value$
Net CashFlow
$
Market Value($)
% ofPortfolio
3 Mo(%)
YTD1 Yr(%)
3 Yrs(%)
5 Yrs(%)
10 Yrs(%)
Inception(%)
InceptionDate
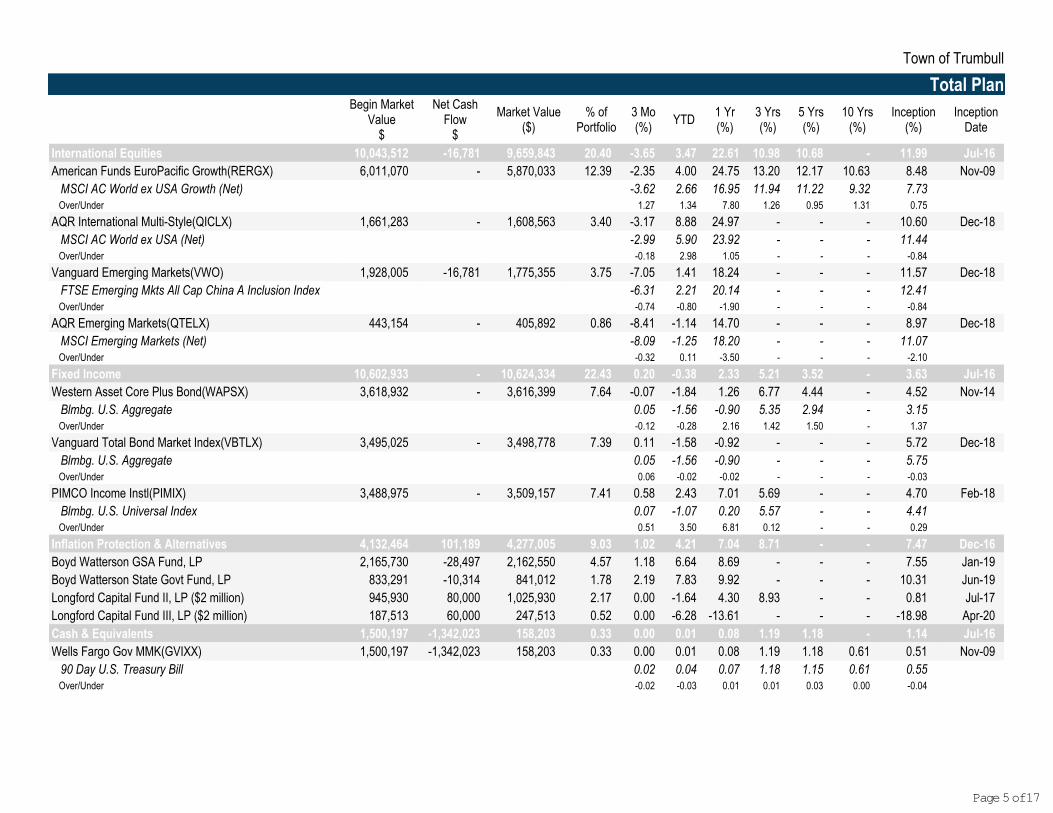
International Equities 10,043,512 -16,781 9,659,843 20.40 -3.65 3.47 22.61 10.98 10.68 - 11.99 Jul-16
American Funds EuroPacific Growth(RERGX) 6,011,070 - 5,870,033 12.39 -2.35 4.00 24.75 13.20 12.17 10.63 8.48 Nov-09
MSCI AC World ex USA Growth (Net) -3.62 2.66 16.95 11.94 11.22 9.32 7.73 Over/Under 1.27 1.34 7.80 1.26 0.95 1.31 0.75
AQR International Multi-Style(QICLX) 1,661,283 - 1,608,563 3.40 -3.17 8.88 24.97 - - - 10.60 Dec-18
MSCI AC World ex USA (Net) -2.99 5.90 23.92 - - - 11.44 Over/Under -0.18 2.98 1.05 - - - -0.84
Vanguard Emerging Markets(VWO) 1,928,005 -16,781 1,775,355 3.75 -7.05 1.41 18.24 - - - 11.57 Dec-18
FTSE Emerging Mkts All Cap China A Inclusion Index -6.31 2.21 20.14 - - - 12.41 Over/Under -0.74 -0.80 -1.90 - - - -0.84
AQR Emerging Markets(QTELX) 443,154 - 405,892 0.86 -8.41 -1.14 14.70 - - - 8.97 Dec-18
MSCI Emerging Markets (Net) -8.09 -1.25 18.20 - - - 11.07 Over/Under -0.32 0.11 -3.50 - - - -2.10
Fixed Income 10,602,933 - 10,624,334 22.43 0.20 -0.38 2.33 5.21 3.52 - 3.63 Jul-16
Western Asset Core Plus Bond(WAPSX) 3,618,932 - 3,616,399 7.64 -0.07 -1.84 1.26 6.77 4.44 - 4.52 Nov-14
Blmbg. U.S. Aggregate 0.05 -1.56 -0.90 5.35 2.94 - 3.15 Over/Under -0.12 -0.28 2.16 1.42 1.50 - 1.37
Vanguard Total Bond Market Index(VBTLX) 3,495,025 - 3,498,778 7.39 0.11 -1.58 -0.92 - - - 5.72 Dec-18
Blmbg. U.S. Aggregate 0.05 -1.56 -0.90 - - - 5.75 Over/Under 0.06 -0.02 -0.02 - - - -0.03
PIMCO Income Instl(PIMIX) 3,488,975 - 3,509,157 7.41 0.58 2.43 7.01 5.69 - - 4.70 Feb-18
Blmbg. U.S. Universal Index 0.07 -1.07 0.20 5.57 - - 4.41 Over/Under 0.51 3.50 6.81 0.12 - - 0.29
Inflation Protection & Alternatives 4,132,464 101,189 4,277,005 9.03 1.02 4.21 7.04 8.71 - - 7.47 Dec-16
Boyd Watterson GSA Fund, LP 2,165,730 -28,497 2,162,550 4.57 1.18 6.64 8.69 - - - 7.55 Jan-19
Boyd Watterson State Govt Fund, LP 833,291 -10,314 841,012 1.78 2.19 7.83 9.92 - - - 10.31 Jun-19
Longford Capital Fund II, LP ($2 million) 945,930 80,000 1,025,930 2.17 0.00 -1.64 4.30 8.93 - - 0.81 Jul-17
Longford Capital Fund III, LP ($2 million) 187,513 60,000 247,513 0.52 0.00 -6.28 -13.61 - - - -18.98 Apr-20
Cash & Equivalents 1,500,197 -1,342,023 158,203 0.33 0.00 0.01 0.08 1.19 1.18 - 1.14 Jul-16
Wells Fargo Gov MMK(GVIXX) 1,500,197 -1,342,023 158,203 0.33 0.00 0.01 0.08 1.19 1.18 0.61 0.51 Nov-09
90 Day U.S. Treasury Bill 0.02 0.04 0.07 1.18 1.15 0.61 0.55 Over/Under -0.02 -0.03 0.01 0.01 0.03 0.00 -0.04
Page 5 of 17

Town of Trumbull
Total Plan
Approx. 3% of portfolio is unvalued as of 9/30.
Blended Benchmark = BBgBarc US Aggregate TR 32.5% / S&P 500 25% / Russell 1000 Growth 8% / Russell 1000 Value 8% / Russell 2000 5.3% / MSCIACWI ex USA 21.3%.
Page 6 of 17
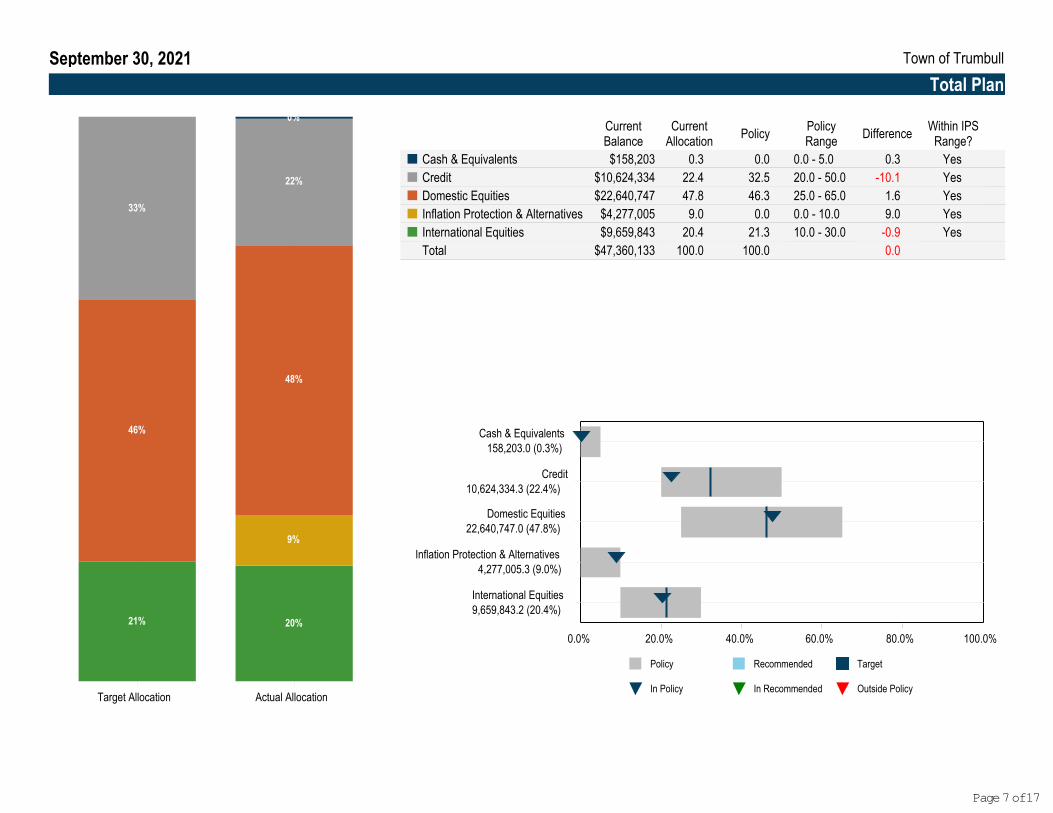
Target Allocation Actual Allocation
21% 20%
9%
46%
48%
33%
22%
0%CurrentBalance
CurrentAllocation
PolicyPolicyRange
DifferenceWithin IPS
Range?
Cash & Equivalents $158,203 0.3 0.0 0.0 - 5.0 0.3 Yes¢
Credit $10,624,334 22.4 32.5 20.0 - 50.0 -10.1 Yes¢
Domestic Equities $22,640,747 47.8 46.3 25.0 - 65.0 1.6 Yes¢
Inflation Protection & Alternatives $4,277,005 9.0 0.0 0.0 - 10.0 9.0 Yes¢
International Equities $9,659,843 20.4 21.3 10.0 - 30.0 -0.9 Yes¢
Total $47,360,133 100.0 100.0 0.0
Policy Recommended Target
In Policy In Recommended Outside Policy
0.0% 20.0% 40.0% 60.0% 80.0% 100.0%
International Equities9,659,843.2 (20.4%)
Inflation Protection & Alternatives4,277,005.3 (9.0%)
Domestic Equities22,640,747.0 (47.8%)
Credit10,624,334.3 (22.4%)
Cash & Equivalents158,203.0 (0.3%)
September 30, 2021 Town of Trumbull
Total Plan
Page 7 of 17
■ T
■ T
■ T

Asset Allocation History
Cash & Equivalents Credit Domestic Equities Inflation Protection & Alternatives International Equities
0.0
10.0
20.0
30.0
40.0
50.0
60.0
70.0
80.0
90.0
100.0
% A
lloca
tio
n (A
ctu
al)
9/17 12/17 3/18 6/18 9/18 12/18 3/19 6/19 9/19 12/19 3/20 6/20 9/20 12/20 3/21 6/21 9/21
September 30, 2021 Town of Trumbull
Total Plan
Page 8 of 17
■ ■ ■ ■ ■
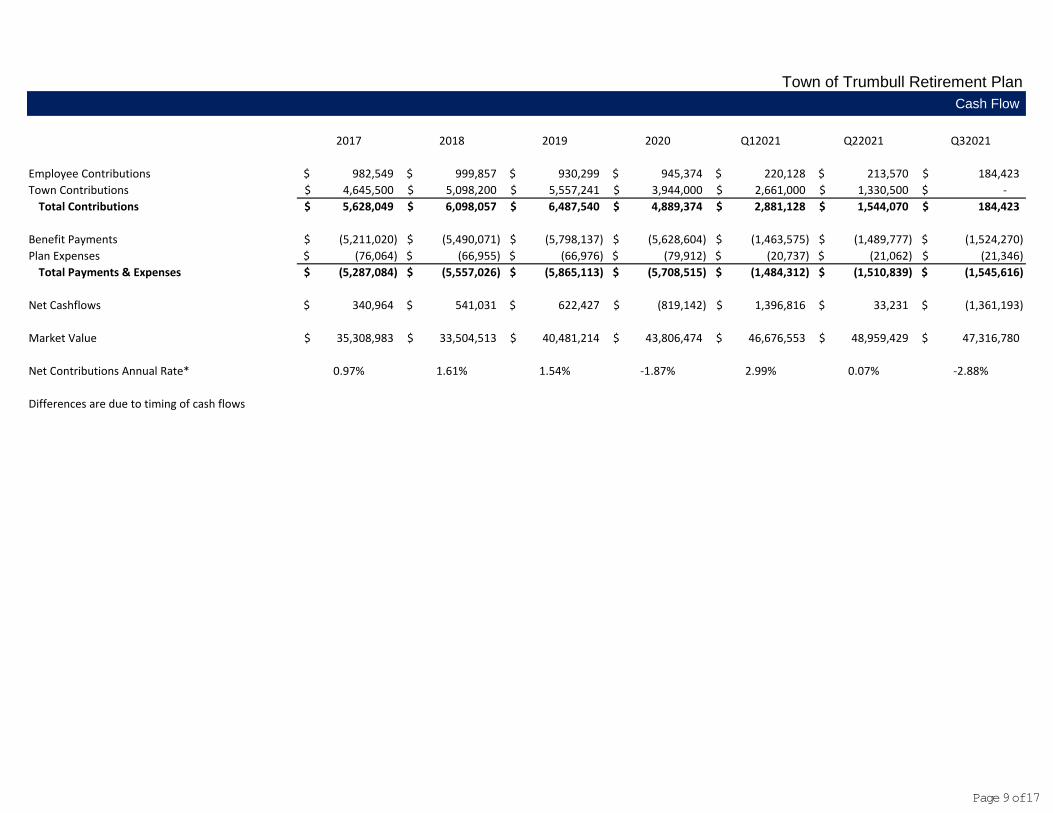
Town of Trumbull Retirement PlanCash Flow
2017 2018 2019 2020 Q12021 Q22021 Q32021
Employee Contributions 982,549$ 999,857$ 930,299$ 945,374$ 220,128$ 213,570$ 184,423$
Town Contributions 4,645,500$ 5,098,200$ 5,557,241$ 3,944,000$ 2,661,000$ 1,330,500$ -$
Total Contributions 5,628,049$ 6,098,057$ 6,487,540$ 4,889,374$ 2,881,128$ 1,544,070$ 184,423$
Benefit Payments (5,211,020)$ (5,490,071)$ (5,798,137)$ (5,628,604)$ (1,463,575)$ (1,489,777)$ (1,524,270)$
Plan Expenses (76,064)$ (66,955)$ (66,976)$ (79,912)$ (20,737)$ (21,062)$ (21,346)$
Total Payments & Expenses (5,287,084)$ (5,557,026)$ (5,865,113)$ (5,708,515)$ (1,484,312)$ (1,510,839)$ (1,545,616)$
Net Cashflows 340,964$ 541,031$ 622,427$ (819,142)$ 1,396,816$ 33,231$ (1,361,193)$
Market Value 35,308,983$ 33,504,513$ 40,481,214$ 43,806,474$ 46,676,553$ 48,959,429$ 47,316,780$
Net Contributions Annual Rate* 0.97% 1.61% 1.54% -1.87% 2.99% 0.07% -2.88%
Differences are due to timing of cash flows
Page 9 of 17
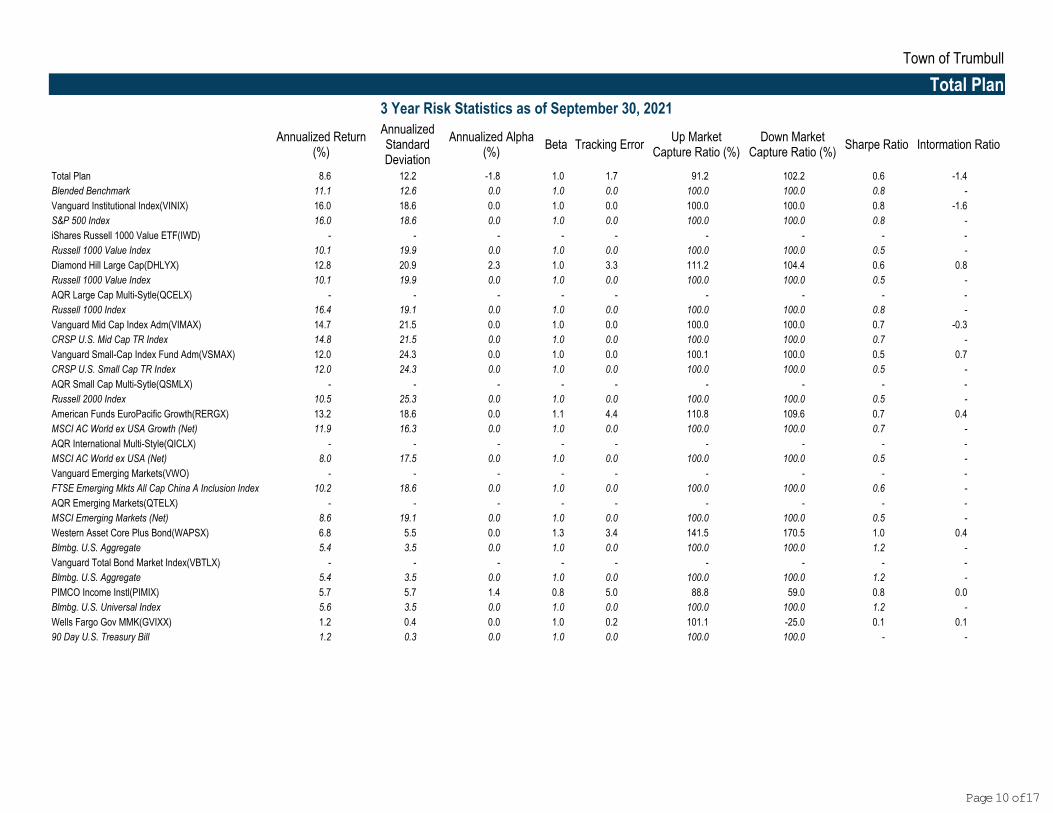
3 Year Risk Statistics as of September 30, 2021
Annualized Return(%)
AnnualizedStandardDeviation
Annualized Alpha(%)
Beta Tracking ErrorUp Market
Capture Ratio (%)Down Market
Capture Ratio (%)Sharpe Ratio Intormation Ratio
Total Plan 8.6 12.2 -1.8 1.0 1.7 91.2 102.2 0.6 -1.4
Blended Benchmark 11.1 12.6 0.0 1.0 0.0 100.0 100.0 0.8 -
Vanguard Institutional Index(VINIX) 16.0 18.6 0.0 1.0 0.0 100.0 100.0 0.8 -1.6
S&P 500 Index 16.0 18.6 0.0 1.0 0.0 100.0 100.0 0.8 -
iShares Russell 1000 Value ETF(IWD) - - - - - - - - -
Russell 1000 Value Index 10.1 19.9 0.0 1.0 0.0 100.0 100.0 0.5 -
Diamond Hill Large Cap(DHLYX) 12.8 20.9 2.3 1.0 3.3 111.2 104.4 0.6 0.8
Russell 1000 Value Index 10.1 19.9 0.0 1.0 0.0 100.0 100.0 0.5 -
AQR Large Cap Multi-Sytle(QCELX) - - - - - - - - -
Russell 1000 Index 16.4 19.1 0.0 1.0 0.0 100.0 100.0 0.8 -
Vanguard Mid Cap Index Adm(VIMAX) 14.7 21.5 0.0 1.0 0.0 100.0 100.0 0.7 -0.3
CRSP U.S. Mid Cap TR Index 14.8 21.5 0.0 1.0 0.0 100.0 100.0 0.7 -
Vanguard Small-Cap Index Fund Adm(VSMAX) 12.0 24.3 0.0 1.0 0.0 100.1 100.0 0.5 0.7
CRSP U.S. Small Cap TR Index 12.0 24.3 0.0 1.0 0.0 100.0 100.0 0.5 -
AQR Small Cap Multi-Sytle(QSMLX) - - - - - - - - -
Russell 2000 Index 10.5 25.3 0.0 1.0 0.0 100.0 100.0 0.5 -
American Funds EuroPacific Growth(RERGX) 13.2 18.6 0.0 1.1 4.4 110.8 109.6 0.7 0.4
MSCI AC World ex USA Growth (Net) 11.9 16.3 0.0 1.0 0.0 100.0 100.0 0.7 -
AQR International Multi-Style(QICLX) - - - - - - - - -
MSCI AC World ex USA (Net) 8.0 17.5 0.0 1.0 0.0 100.0 100.0 0.5 -
Vanguard Emerging Markets(VWO) - - - - - - - - -
FTSE Emerging Mkts All Cap China A Inclusion Index 10.2 18.6 0.0 1.0 0.0 100.0 100.0 0.6 -
AQR Emerging Markets(QTELX) - - - - - - - - -
MSCI Emerging Markets (Net) 8.6 19.1 0.0 1.0 0.0 100.0 100.0 0.5 -
Western Asset Core Plus Bond(WAPSX) 6.8 5.5 0.0 1.3 3.4 141.5 170.5 1.0 0.4
Blmbg. U.S. Aggregate 5.4 3.5 0.0 1.0 0.0 100.0 100.0 1.2 -
Vanguard Total Bond Market Index(VBTLX) - - - - - - - - -
Blmbg. U.S. Aggregate 5.4 3.5 0.0 1.0 0.0 100.0 100.0 1.2 -
PIMCO Income Instl(PIMIX) 5.7 5.7 1.4 0.8 5.0 88.8 59.0 0.8 0.0
Blmbg. U.S. Universal Index 5.6 3.5 0.0 1.0 0.0 100.0 100.0 1.2 -
Wells Fargo Gov MMK(GVIXX) 1.2 0.4 0.0 1.0 0.2 101.1 -25.0 0.1 0.1
90 Day U.S. Treasury Bill 1.2 0.3 0.0 1.0 0.0 100.0 100.0 - -
Town of Trumbull
Total Plan
Page 10 of 17
3rd Quarter Commentary
Total Fund
The Town of Trumbull Retirement Plan ended the 3rd quarter with $47.36 million in assets (including approx. $1.3 million in net distributions), down from $48.96 million in June.Relative to policy targets, the portfolio segments are within +/- 11% of policy. The Fund has an overweight to Inflation Protection & Alternatives. Conversely, The Fund has anunderweight to Credit. The Total Fund returned -0.7% for the quarter, 10 basis points below the policy and ranking in the bottom quartile (87th percentile) of the All Public PlansUniverse. For the YTD Period, The Fund trails the benchmark by 7 basis points and ranks below the median (58th percentile) of the same universe. International Equities’underperformance of their benchmark (MSCI ACWI ex USA) hindered performance during the quarter.
Watch List (due to underperformance for the past three consecutive quarters)
None
**Approximately 3% of portfolio is unvalued as of 9/30.
Town of Trumbull
Total Plan
Page 11 of 17

Last Calendar Quarter
Selection Effect Allocation Effect Interaction Effect Total Effects
0.0% 0.1% 0.2% 0.3% 0.4%-0.1 %-0.2 %-0.3 %-0.4 %
Cash & Equivalents
Inflation Protection & Alternatives
Fixed Income
International Equities
Domestic Equities
Total Plan
Last Calendar QuarterWtd. Actual
ReturnWtd. Index
ReturnExcessReturn
SelectionEffect
AllocationEffect
InteractionEffect
TotalEffect
Domestic Equities -0.1 -0.1 0.0 0.0 0.0 0.0 0.0
International Equities -3.7 -2.9 -0.8 -0.2 0.0 0.0 -0.1
Fixed Income 0.2 0.1 0.2 0.0 -0.1 0.0 0.0
Inflation Protection & Alternatives 1.0 1.2 -0.1 0.0 0.1 0.0 0.1
Cash & Equivalents 0.0 0.0 0.0 0.0 0.0 0.0 0.0
Total Plan -0.7 -0.6 -0.1 -0.1 0.0 0.0 -0.1
September 30, 2021 Town of Trumbull
Total Plan
Page 12 of 17
■ ■ ■ •

Total Plan vs. All Public Plans-Total Fund as of September 30, 2021
-12.0
-4.0
4.0
12.0
20.0
28.0
36.0
An
nu
ali
zed
Re
turn
%
Period
Quarter YTD 1 Year 3 Years 5 Years 10 YearsSince
Inception
Total Plan -0.7 (87) 7.7 (65) 19.1 (58) 8.6 (89) 9.1 (76) 9.1 (64) 7.1 (64)�
Blended Benchmark -0.6 (81) 7.8 (64) 19.3 (56) 11.1 (32) 10.8 (32) 10.2 (27) 8.0 (24)p
60% MSCI ACWI/40% BC Agg -0.6 (77) 5.9 (93) 15.5 (92) 10.1 (56) 9.3 (73) 8.5 (82) 6.5 (87)p
5th Percentile 0.5 11.0 24.1 12.3 12.0 11.2 8.8
1st Quartile 0.0 9.3 21.4 11.3 11.1 10.2 8.0
Median -0.3 8.3 19.7 10.3 10.1 9.6 7.4
3rd Quartile -0.6 7.4 17.6 9.3 9.2 8.8 6.8
95th Percentile -1.0 4.6 11.1 7.4 7.4 7.2 5.7
Population 302 299 298 286 272 224 201
Town of Trumbull
Total Plan
Parentheses contain percentile rankings.Calculation based on monthly periodicity.
Page 13 of 17

Annualized Return vs. Annualized Standard Deviation5 Years Ending September 30, 2021
Peergroup Total Plan
Blended Benchmark 60% MSCI ACWI/40% BC Agg
X Sigma Band Y Sigma Band
Sigma Cross Section
6.3
7.2
8.1
9.0
9.9
10.8
11.7
12.6
13.5
An
nu
ali
zed
Re
turn
6.0 7.0 8.0 9.0 10.0 11.0 12.0 13.0
Annualized Standard Deviation
Annualized Return vs. Annualized Standard DeviationSince Inception Ending September 30, 2021
Peergroup Total Plan
Blended Benchmark 60% MSCI ACWI/40% BC Agg
X Sigma Band Y Sigma Band
Sigma Cross Section
4.8
5.4
6.0
6.6
7.2
7.8
8.4
9.0
9.6
An
nu
ali
zed
Re
turn
6.0 7.0 8.0 9.0 10.0 11.0 12.0 13.0
Annualized Standard Deviation
September 30, 2021 Town of Trumbull
Total Plan
Page 14 of 17
■
■
■ ■ •■ ■
• ♦
■ ■ ■
Ill ■
■
■■
■■
-■ ..... ■ • b:■ •• ■ ■ ■ ■ ■
.. •11 I ■ ... ■ ■ f ■ •• ■ I ■ ■ I ■
■ ■ •■ p ■
■ ■■
• ♦
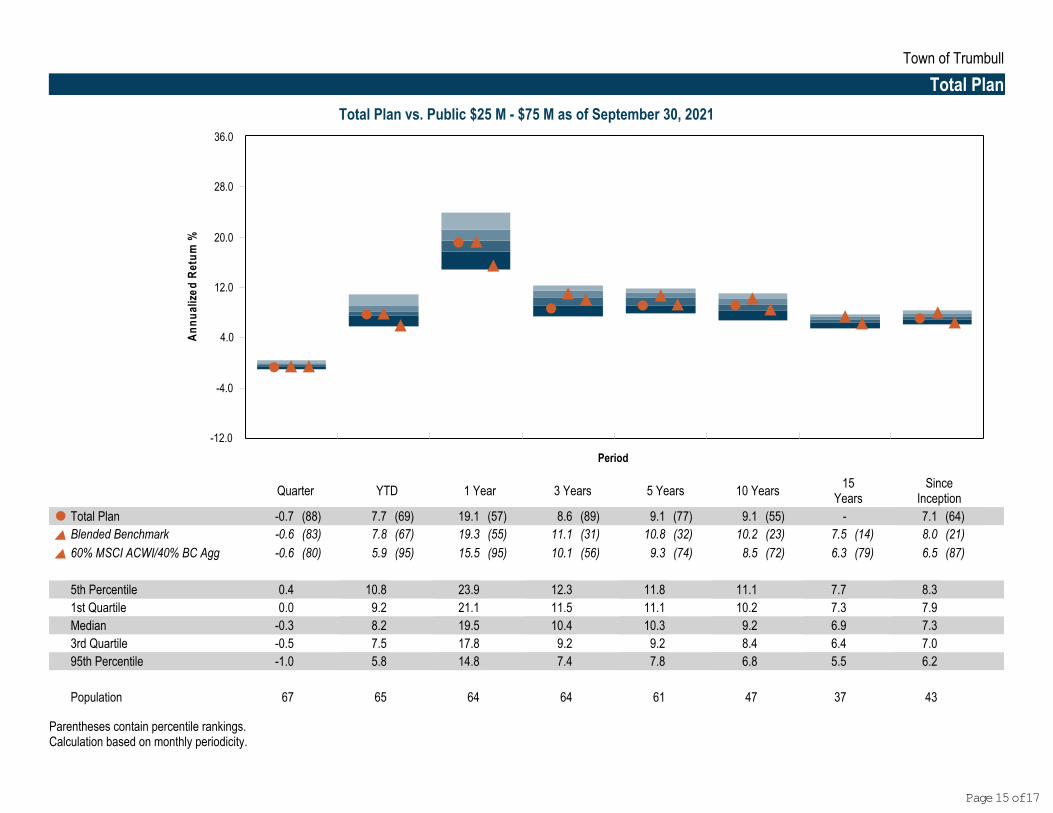
Total Plan vs. Public $25 M - $75 M as of September 30, 2021
-12.0
-4.0
4.0
12.0
20.0
28.0
36.0
An
nu
ali
zed
Re
turn
%
Period
Quarter YTD 1 Year 3 Years 5 Years 10 Years15
YearsSince
Inception
Total Plan -0.7 (88) 7.7 (69) 19.1 (57) 8.6 (89) 9.1 (77) 9.1 (55) - 7.1 (64)�
Blended Benchmark -0.6 (83) 7.8 (67) 19.3 (55) 11.1 (31) 10.8 (32) 10.2 (23) 7.5 (14) 8.0 (21)p
60% MSCI ACWI/40% BC Agg -0.6 (80) 5.9 (95) 15.5 (95) 10.1 (56) 9.3 (74) 8.5 (72) 6.3 (79) 6.5 (87)p
5th Percentile 0.4 10.8 23.9 12.3 11.8 11.1 7.7 8.3
1st Quartile 0.0 9.2 21.1 11.5 11.1 10.2 7.3 7.9
Median -0.3 8.2 19.5 10.4 10.3 9.2 6.9 7.3
3rd Quartile -0.5 7.5 17.8 9.2 9.2 8.4 6.4 7.0
95th Percentile -1.0 5.8 14.8 7.4 7.8 6.8 5.5 6.2
Population 67 65 64 64 61 47 37 43
Town of Trumbull
Total Plan
Parentheses contain percentile rankings.Calculation based on monthly periodicity.
Page 15 of 17

September 30, 2021Market Value
As of 09/30/2021% of Portfolio
Estimated AnnualFee ($)
Estimated AnnualFee (%)
Total Plan 47,360,133 100.00 178,650 0.38
Vanguard Institutional Index(VINIX) 11,119,785 23.48 4,448 0.04
iShares Russell 1000 Value ETF(IWD) 1,299,033 2.74 2,468 0.19
Diamond Hill Large Cap(DHLYX) 3,302,768 6.97 18,165 0.55
AQR Large Cap Multi-Sytle(QCELX) 1,796,990 3.79 7,008 0.39
Vanguard Mid Cap Index Adm(VIMAX) 2,015,543 4.26 806 0.04
Vanguard Small-Cap Index Fund Adm(VSMAX) 2,030,061 4.29 1,015 0.05
AQR Small Cap Multi-Sytle(QSMLX) 1,076,567 2.27 6,459 0.60
American Funds EuroPacific Growth(RERGX) 5,870,033 12.39 27,002 0.46
AQR International Multi-Style(QICLX) 1,608,563 3.40 8,847 0.55
Vanguard Emerging Markets(VWO) 1,775,355 3.75 1,775 0.10
AQR Emerging Markets(QTELX) 405,892 0.86 2,841 0.70
Western Asset Core Plus Bond(WAPSX) 3,616,399 7.64 15,189 0.42
Vanguard Total Bond Market Index(VBTLX) 3,498,778 7.39 1,749 0.05
PIMCO Income Instl(PIMIX) 3,509,157 7.41 17,546 0.50
Boyd Watterson GSA Fund, LP 2,162,550 4.57 27,032 1.25
Boyd Watterson State Govt Fund, LP 841,012 1.78 10,513 1.25
Longford Capital Fund II, LP ($2 million) 1,025,930 2.17 20,519 2.00
Longford Capital Fund III, LP ($2 million) 247,513 0.52 4,950 2.00
Wells Fargo Gov MMK(GVIXX) 158,203 0.33 316 0.20
Town of Trumbull
Total Plan
Page 16 of 17
© 2021 Beirne Wealth Consulting Services, LLC (BWC). All rights reserved.
For more information, please visit www.beirnewealth.com or call BWC at 888-231-6372. This contains confidential and proprietary information of BWC and is intended for the exclusive use of the parties to whom it was provided by BWC. Its content may not be modified, sold or otherwise provided, in whole or in part, to any other person or entity, without BWC’s prior written permission.
The findings, ratings and/or opinions expressed herein are the intellectual property of BWC and are subject to change without notice. They are not intended to convey any guarantees as to the future performance of the investment products, asset classes or capital markets discussed. Past performance does not guarantee future results. BWC’s ratings do not constitute individualized
investment advice.
Information contained herein has been obtained from a range of third party sources. While the information is believed to be reliable, BWC has not sought to verify it independently. As such, BWC makes no representations or warranties as to the accuracy of the information presented and takes no responsibility or liability (including for indirect, consequential or incidental damages) for any error, omission or inaccuracy in the data supplied by any third party.
This does not constitute an offer or a solicitation of an offer to buy or sell securities, commodities and/or any other financial instruments or products or constitute a solicitation on behalf of any of the investment managers, their affiliates, products or strategies that BWC may evaluate or recommend.
For the most recent approved ratings of an investment strategy, and a fuller explanation of their meanings, contact your BWC representative.
Page 17 of 17

Long 44377
Current Period YTD Since Inception Current Period YTD Since Inception Current Period YTD Since Inception
Beginning Balance 982,665 942,023 - 13,536,775 13,337,932 - 259,494,410 248,999,403 -
Contributions 80,000 160,000 1,360,000 10,000 30,000 290,000 19,904,000 39,904,000 339,071,806
Distributions (96,828) (138,661) (609,015) (24,207) (34,665) (152,735) (24,207,001) (34,665,169) (151,092,062)
Total Cash/Deemed Flows (16,828) 21,339 750,985 (14,207) (4,665) 137,265 (4,303,001) 5,238,831 187,979,744 Syndication Costs - - (850) - - (212) - - (212,472)
Net Operating Income (Expense):
Interest Income 9 12 372 2 3 93 2,150 3,070 93,042
Management Fees (6,910) (14,078) (177,039) - - - (1,582,737) (3,194,931) (43,407,128)
Partnership Expenses (602) (1,459) (23,828) (151) (365) (5,957) (150,524) (364,797) (5,956,891)
Other Income - - 50 - - 13 - - 12,500
Portfolio Income 1,866 1,866 1,866 467 467 467 466,501 466,501 466,501
Total Net Operating Income (Expense) (5,637) (13,659) (198,579) 318 105 (5,385) (1,264,609) (3,090,156) (48,791,975) Realized Gain/(Loss) 4,949 2,608 184,174 1,237 652 46,044 1,237,192 652,078 45,406,261 Unrealized Gain/(Loss) (24,195) (10,739) 258,935 (6,049) (2,685) 64,734 (6,048,636) (2,684,801) 64,733,797 Ending NAV 940,953 941,572 994,666 13,518,075 13,331,339 242,445 249,115,356 249,115,356 249,115,356
Accrued Potential Carried Interest Allocation 4,977 4,358 (48,736) (1,233,440) (1,046,704) 12,042,190 - - -
Ending NAV After Potential Carried Interest Allocation 945,930 945,930 945,930 12,284,635 12,284,635 12,284,635 249,115,356 249,115,356 249,115,356
Total Commitment 2,000,000 500,000 500,000,000 Beginning Unfunded Commitment 720,000 800,000 2,000,000 220,000 240,000 500,000 180,832,194 200,832,194 500,000,000 Less Contributions (80,000) (160,000) (1,360,000) (10,000) (30,000) (290,000) (19,904,000) (39,904,000) (339,071,806)
Ending Unfunded Commitment 640,000 640,000 640,000 210,000 210,000 210,000 160,928,194 160,928,194 160,928,194 Recallable Distributions 96,828 138,661 578,376 24,207 34,665 144,594 24,207,001 34,665,169 144,525,699
Longford Capital Management, LP
Longford Capital Fund II, LPStatement of Changes in Partner's Capital
For the Quarter Ended 06/30/2021
Town of Trumbull Pension Plan
(Unaudited)
Due to rounding, numbers presented in this statement may not sum precisely to the totals provided. For additional information or any inquiries, please contact us.
Limited Partner General Partner Total Fund
Joshua A. Leavitt Ultimus LeverPoint Private Fund Solutions, LLC
Ultimus LeverPoint Private Fund Solutions, LLC - 5 Maxwell Drive, Suite 135 - Clifton Park, New York 12065 - (847) 255-3500
Balances shown do not necessarily reflect the value that could be realized upon sale. Investors are encouraged to review the Fund's Offering Documents for information regarding the valuation of the Fund's investments. This information is being sent solely to investors of the Fund and is not to be construed to be an offering, solicitation, advertisement or marketing material to purchase interests in the Fund. Such an offer will only be made by means of the Fund's Offering Documents and only in those jurisdictions where permitted by law. This information is confidential and may not be reproduced or distributed or used by any person other than is reasonably necessary in connection with an investor's monitoring of its investment in the Fund. This statement is for informational purposes only and is not intended to be used by any investor or third party, and should not be relied upon in any way, to make or influence a decision with respect to an investment in the Fund. Past performance is not indicative of future performance.
Email: [email protected]
All investment valuations and the related realized and unrealized gain and loss totals are provided by the General Partner and/or other third parties. Ultimus LeverPoint Private Fund Solutions, LLC has not independently verified the accuracy of this information. It is possible that the asset values for these investments, and the carried interest, may differ significantly from the amounts that might ultimately be realized, and the differences could be material. If applicable, any commitment that has been transferred into or out of this account is reflected in this statement as if the transferred commitment has been in this account since inception. Thus, any historical P&L and capital activity that occurred prior to the date of transfer is reflected in every balance in the NAV and commitment reconciliations.
Managing Director and Chief Financial Officer
Phone: (312) 517-1360
Investor Services GroupPhone: (847) 255-3500Email: [email protected]
Ultimus LeverPoint Private Fund Solutions, LLC - 5 Maxwell Drive, Suite 135 - Clifton Park, New York 12065 - (847) 255-3500
~ LONGFORD CAPITAL®
08/19/2021 05:41:57
Statements independently prepared by
Ultimus LeverPoint Private Fund Solutions, LLC - 5 Maxwell Drive, Suite 135
Clifton Park, New York 12065 - (847) 255-3500
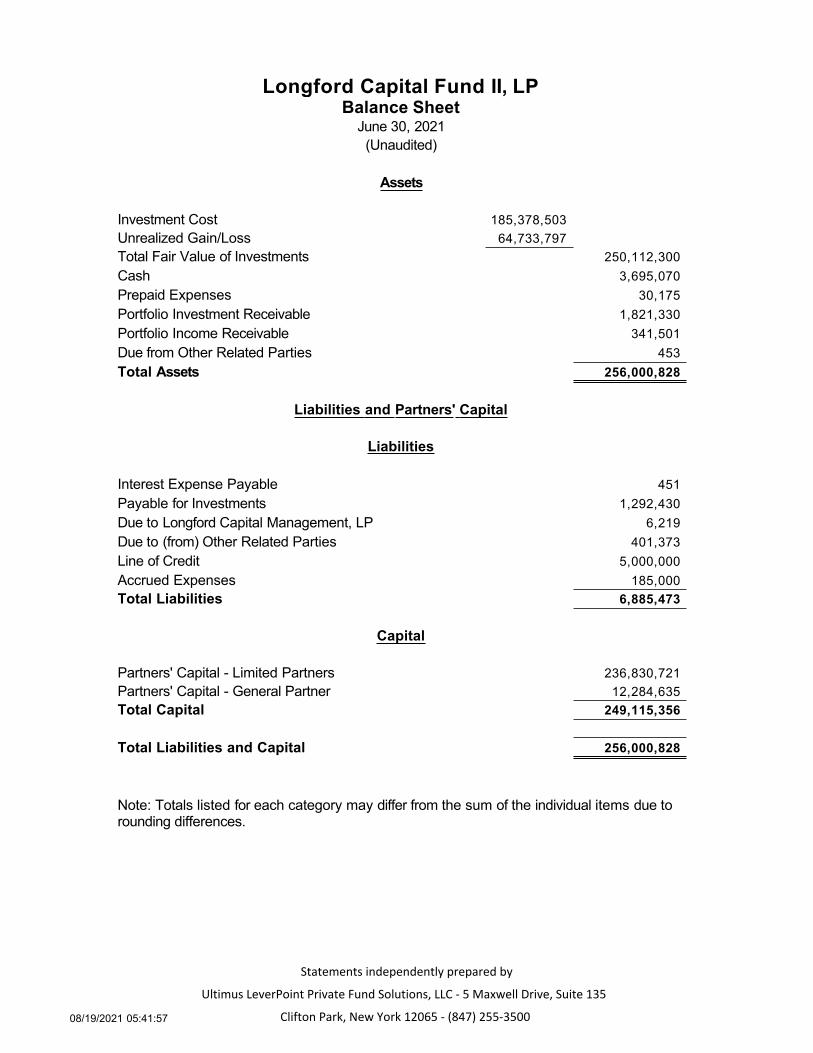
6,885,472.79185,378,503249,115,355.5264,733,797256,000,828.31Longford Capital Fund II, LPBalance Sheet
June 30, 2021(Unaudited)
Assets
Investment Cost 185,378,503Unrealized Gain/Loss 64,733,797Total Fair Value of Investments 250,112,300Cash 3,695,070Prepaid Expenses 30,175Portfolio Investment Receivable 1,821,330Portfolio Income Receivable 341,501Due from Other Related Parties 453Total Assets 256,000,828
Liabilities and Partners' Capital
Liabilities
Interest Expense Payable 451Payable for Investments 1,292,430Due to Longford Capital Management, LP 6,219Due to (from) Other Related Parties 401,373Line of Credit 5,000,000Accrued Expenses 185,000Total Liabilities 6,885,473
Capital
Partners' Capital - Limited Partners 236,830,721Partners' Capital - General Partner 12,284,635Total Capital 249,115,356
Total Liabilities and Capital 256,000,828
Note: Totals listed for each category may differ from the sum of the individual items due torounding differences.

June 30 2021
April 1, 2021Income June 30, 2021 Year-to-DateRealized Gain/Loss on Investments 1,237,192 652,078 Unrealized Gain/Loss on Investments (6,048,636) (2,684,801) Short-Term Investment Income 2,150 3,070 Portfolio Income 466,501 466,501 Total Gross Income (4,342,793) (1,563,151)
ExpensesAccounting and Reporting Expense 26,843 56,524 Insurance Expense 16,163 32,149 Interest Expense 3,927 28,031 Management Fee 1,582,737 3,194,931 Audit and Tax Expense 81,250 162,500 Professional Fees 13,803 64,789 Other Expenses 8,537 20,804 Total Gross Expenses 1,733,260 3,559,728
Net Gain/(Loss) (6,076,054) (5,122,879)
Statement of OperationsLongford Capital Fund II, LP
For the Quarter Ended 06/30/2021(Unaudited)
Note: Totals listed for each category may differ from the sum of the individual items due to rounding differences.
8/20/2021 10:46 AM
Statements independently prepared byUltimus LeverPoint Private Fund Solutions, LLC ‐ 5 Maxwell Drive, Suite 135
Clifton Park, New York 12065 ‐ (847) 255‐3500
08/19/2021 05:41:57
Statements independently prepared by
Ultimus LeverPoint Private Fund Solutions, LLC - 5 Maxwell Drive, Suite 135
Clifton Park, New York 12065 - (847) 255-3500
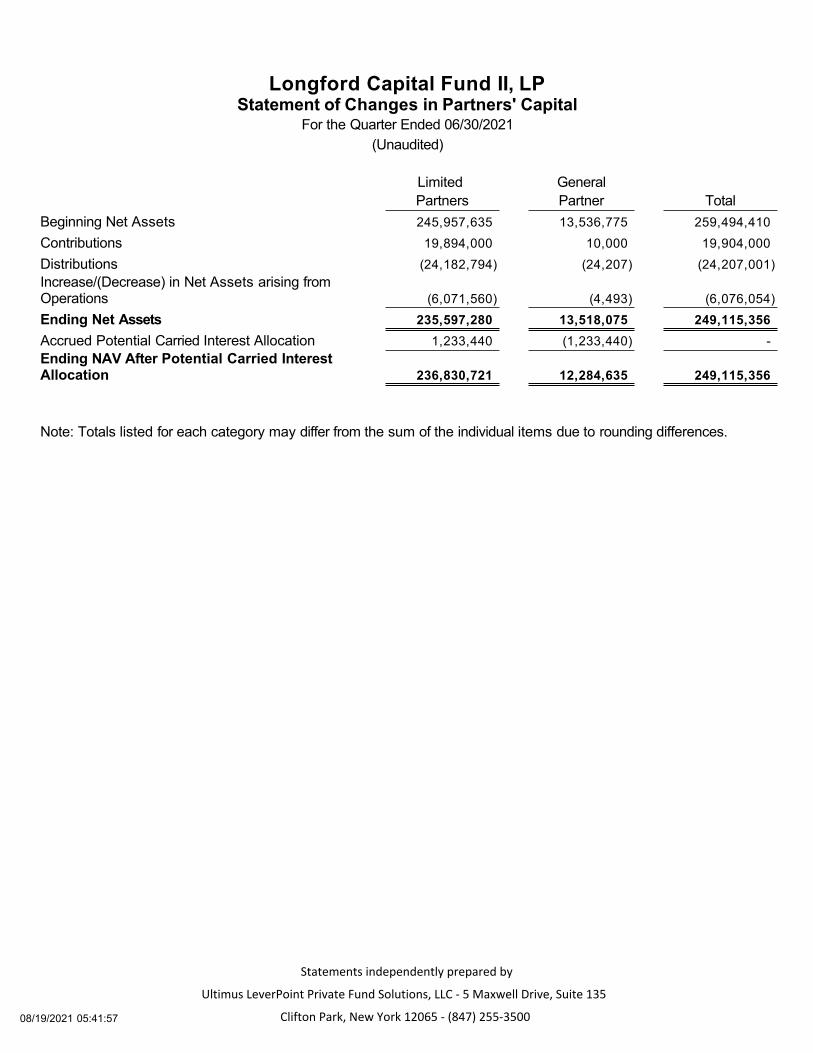
Longford Capital Fund II, LPStatement of Changes in Partners' Capital
For the Quarter Ended 06/30/2021(Unaudited)
June 30, 2021Limited GeneralPartners Partner Total
Beginning Net Assets 245,957,635 13,536,775 259,494,410Contributions 19,894,000 10,000 19,904,000Distributions (24,182,794) (24,207) (24,207,001)Increase/(Decrease) in Net Assets arising fromOperations (6,071,560) (4,493) (6,076,054)Ending Net Assets 235,597,280 13,518,075 249,115,356Accrued Potential Carried Interest Allocation 1,233,440 (1,233,440) -Ending NAV After Potential Carried InterestAllocation 236,830,721 12,284,635 249,115,356
Note: Totals listed for each category may differ from the sum of the individual items due to rounding differences.
08/19/2021 05:41:57
Statements independently prepared by
Ultimus LeverPoint Private Fund Solutions, LLC - 5 Maxwell Drive, Suite 135
Clifton Park, New York 12065 - (847) 255-3500
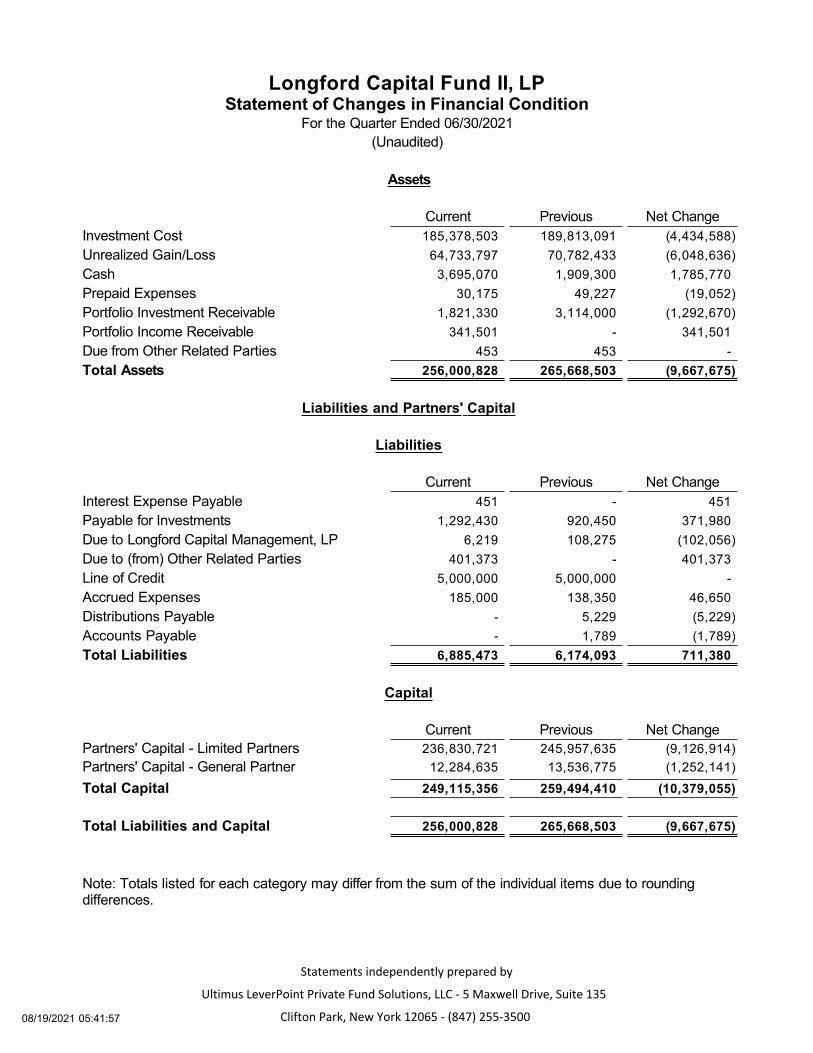
Longford Capital Fund II, LPStatement of Changes in Financial Condition
For the Quarter Ended 06/30/2021June 30, 2021 (Unaudited)
Assets
Current Previous Net ChangeInvestment Cost 185,378,503 189,813,091 (4,434,588)Unrealized Gain/Loss 64,733,797 70,782,433 (6,048,636)Cash 3,695,070 1,909,300 1,785,770Prepaid Expenses 30,175 49,227 (19,052)Portfolio Investment Receivable 1,821,330 3,114,000 (1,292,670)Portfolio Income Receivable 341,501 - 341,501Due from Other Related Parties 453 453 -Total Assets 256,000,828 265,668,503 (9,667,675)
Liabilities and Partners' Capital
Liabilities
Current Previous Net ChangeInterest Expense Payable 451 - 451Payable for Investments 1,292,430 920,450 371,980Due to Longford Capital Management, LP 6,219 108,275 (102,056)Due to (from) Other Related Parties 401,373 - 401,373Line of Credit 5,000,000 5,000,000 -Accrued Expenses 185,000 138,350 46,650Distributions Payable - 5,229 (5,229)Accounts Payable - 1,789 (1,789)Total Liabilities 6,885,473 6,174,093 711,380
Capital
Current Previous Net ChangePartners' Capital - Limited Partners 236,830,721 245,957,635 (9,126,914)Partners' Capital - General Partner 12,284,635 13,536,775 (1,252,141)
Total Capital 249,115,356 259,494,410 (10,379,055)
Total Liabilities and Capital 256,000,828 265,668,503 (9,667,675)
Note: Totals listed for each category may differ from the sum of the individual items due to roundingdifferences.

185,378,503 64,733,797
########
Investment Cost Fair ValueAmethyst 2,738,491 2,738,491 Appraisal 6,252,015 15,625,000 Audio 1,986,794 1,986,794 Babylon 13,944,329 32,000,000 Barrel 1,366,510 1,366,510 Bluewater 5,049,080 12,751,419 Chalk 11,295,237 11,295,237 Chess 1,233,728 1,233,728 Cobra 7,176,082 7,176,082 Creed 3,141,721 3,141,721 Cyborg 1,345,716 1,345,716 Dagger 4,956,263 4,956,263 Domino 842,676 842,676 Dragon 5,447,761 10,440,415 Eagle 4,512,782 4,512,782 Eureka 1,801,757 4,423,255 Fire 6,638,839 1,269,636 Fuel 4,912,364 2,784,887 Ganymede 1,435,092 1,435,092 Ice 8,784,010 8,784,010 Kayak 1,262,500 1,262,500 Magpie 1,760,000 1,265,254 Mesquite 10,731,842 15,024,489 Nexus 4,746,305 4,746,305 Nobel 10,710,445 26,215,086 Panther 6,488,944 8,859,011 Pegasus 2,370,914 2,370,914 Prism 1,294,092 733,521 Raptor 16,390,375 20,629,037 Seahawk 1,830,526 1,830,526 Shield 5,070,694 5,070,694 Stinger 4,785,301 8,919,929
Longford Capital Fund II, LPSchedule of Investments
June 30, 2021(Unaudited)
8/24/2021 10:12 AM
Statements independently prepared byUltimus LeverPoint Private Fund Solutions, LLC ‐ 5 Maxwell Drive, Suite 135
Clifton Park, New York 12065 ‐ (847) 255‐3500
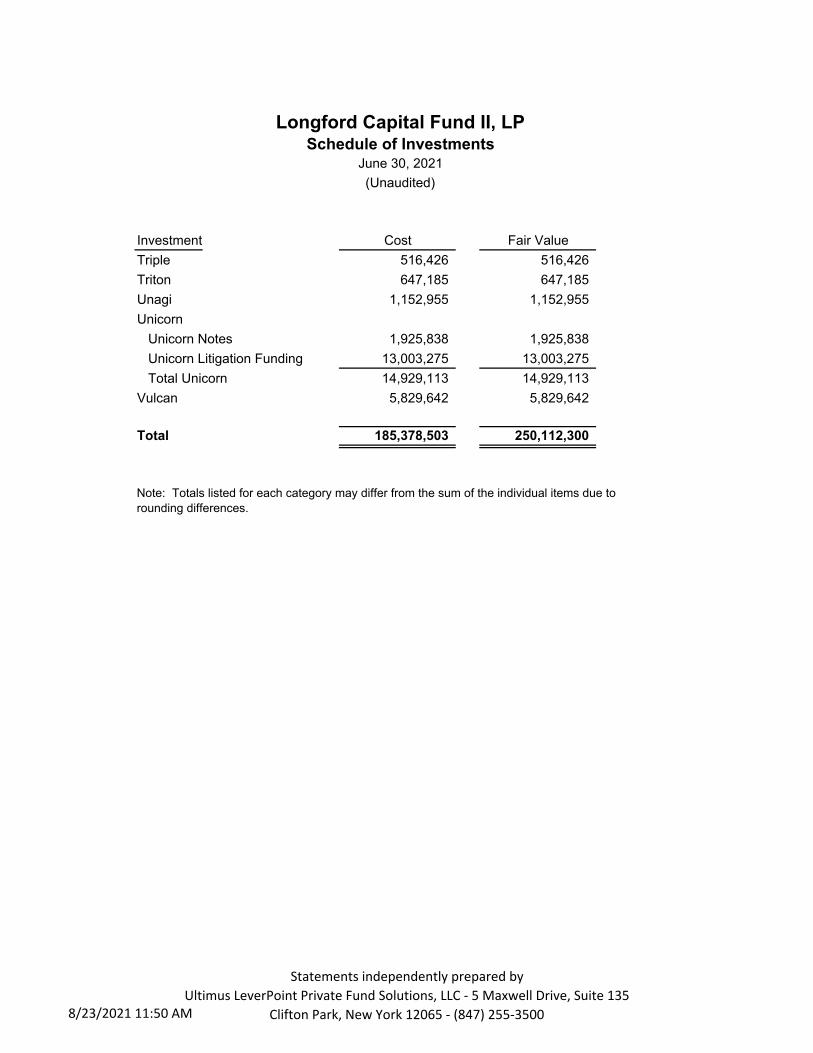
185,378,503 64,733,797
########
Investment Cost Fair ValueTriple 516,426 516,426 Triton 647,185 647,185 Unagi 1,152,955 1,152,955 Unicorn Unicorn Notes 1,925,838 1,925,838 Unicorn Litigation Funding 13,003,275 13,003,275 Total Unicorn 14,929,113 14,929,113 Vulcan 5,829,642 5,829,642
Total 185,378,503 250,112,300
Longford Capital Fund II, LPSchedule of Investments
June 30, 2021(Unaudited)
Note: Totals listed for each category may differ from the sum of the individual items due to rounding differences.
8/23/2021 11:50 AM
Statements independently prepared byUltimus LeverPoint Private Fund Solutions, LLC ‐ 5 Maxwell Drive, Suite 135
Clifton Park, New York 12065 ‐ (847) 255‐3500
© 2021 Longford Capital Management, LP. All Rights Reserved. Confidential. Not for Distribution.
Longford Capital Fund II, LP Performance
($ in millions) LatestCase Investment Resolution Funded Realized Unrealized Total Gross Gross*Name Date Date Commit. Amount Value Value Value MOIC IRR
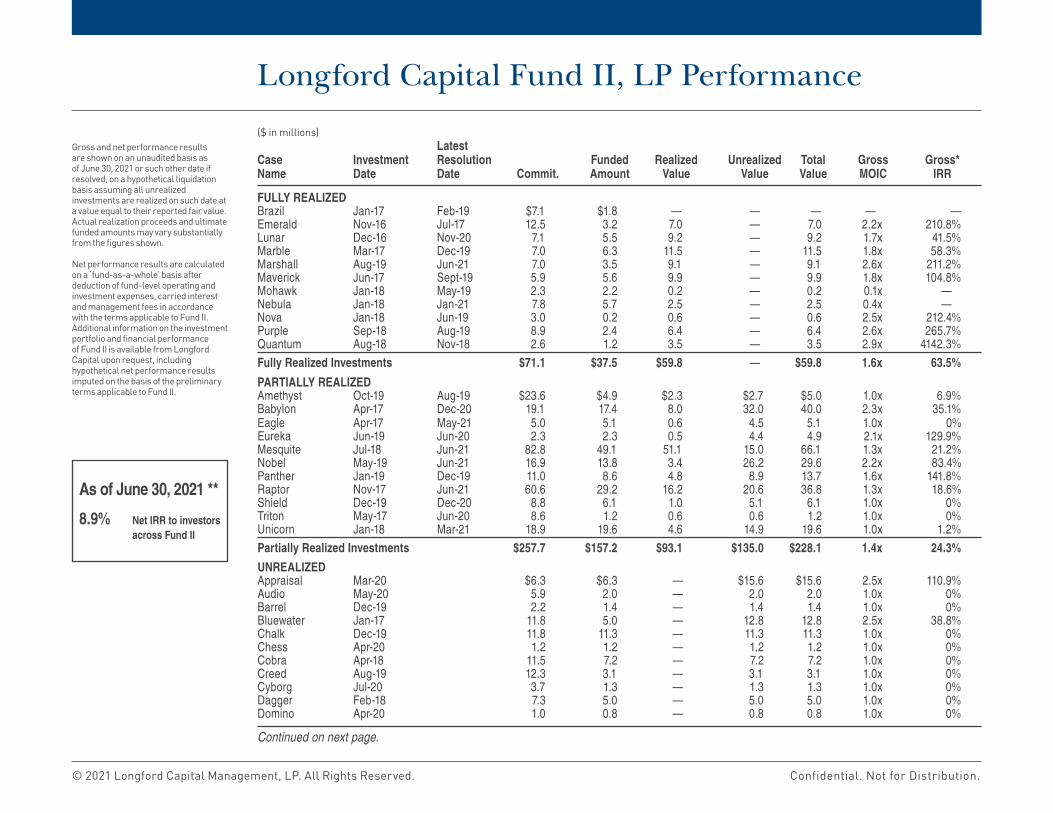
FULLY REALIZEDBrazil Jan-17 Feb-19 $7.1 $1.8 — — — — —Emerald Nov-16 Jul-17 12.5 3.2 7.0 — 7.0 2.2x 210.8%Lunar Dec-16 Nov-20 7.1 5.5 9.2 — 9.2 1.7x 41.5%Marble Mar-17 Dec-19 7.0 6.3 11.5 — 11.5 1.8x 58.3%Marshall Aug-19 Jun-21 7.0 3.5 9.1 — 9.1 2.6x 211.2%Maverick Jun-17 Sept-19 5.9 5.6 9.9 — 9.9 1.8x 104.8%Mohawk Jan-18 May-19 2.3 2.2 0.2 — 0.2 0.1x —Nebula Jan-18 Jan-21 7.8 5.7 2.5 — 2.5 0.4x —Nova Jan-18 Jun-19 3.0 0.2 0.6 — 0.6 2.5x 212.4%Purple Sep-18 Aug-19 8.9 2.4 6.4 — 6.4 2.6x 265.7%Quantum Aug-18 Nov-18 2.6 1.2 3.5 — 3.5 2.9x 4142.3%Fully Realized Investments $71.1 $37.5 $59.8 — $59.8 1.6x 63.5%PARTIALLY REALIZEDAmethyst Oct-19 Aug-19 $23.6 $4.9 $2.3 $2.7 $5.0 1.0x 6.9%Babylon Apr-17 Dec-20 19.1 17.4 8.0 32.0 40.0 2.3x 35.1%Eagle Apr-17 May-21 5.0 5.1 0.6 4.5 5.1 1.0x 0%Eureka Jun-19 Jun-20 2.3 2.3 0.5 4.4 4.9 2.1x 129.9%Mesquite Jul-18 Jun-21 82.8 49.1 51.1 15.0 66.1 1.3x 21.2%Nobel May-19 Jun-21 16.9 13.8 3.4 26.2 29.6 2.2x 83.4%Panther Jan-19 Dec-19 11.0 8.6 4.8 8.9 13.7 1.6x 141.8%Raptor Nov-17 Jun-21 60.6 29.2 16.2 20.6 36.8 1.3x 18.6%Shield Dec-19 Dec-20 8.8 6.1 1.0 5.1 6.1 1.0x 0%Triton May-17 Jun-20 8.6 1.2 0.6 0.6 1.2 1.0x 0%Unicorn Jan-18 Mar-21 18.9 19.6 4.6 14.9 19.6 1.0x 1.2%Partially Realized Investments $257.7 $157.2 $93.1 $135.0 $228.1 1.4x 24.3%UNREALIZEDAppraisal Mar-20 $6.3 $6.3 — $15.6 $15.6 2.5x 110.9%Audio May-20 5.9 2.0 — 2.0 2.0 1.0x 0%Barrel Dec-19 2.2 1.4 — 1.4 1.4 1.0x 0%Bluewater Jan-17 11.8 5.0 — 12.8 12.8 2.5x 38.8%Chalk Dec-19 11.8 11.3 — 11.3 11.3 1.0x 0%Chess Apr-20 1.2 1.2 — 1.2 1.2 1.0x 0%Cobra Apr-18 11.5 7.2 — 7.2 7.2 1.0x 0%Creed Aug-19 12.3 3.1 — 3.1 3.1 1.0x 0%Cyborg Jul-20 3.7 1.3 — 1.3 1.3 1.0x 0%Dagger Feb-18 7.3 5.0 — 5.0 5.0 1.0x 0%Domino Apr-20 1.0 0.8 — 0.8 0.8 1.0x 0%
Gross and net performance results are shown on an unaudited basis as of June 30, 2021 or such other date if resolved, on a hypothetical liquidation basis assuming all unrealized investments are realized on such date at a value equal to their reported fair value. Actual realization proceeds and ultimate funded amounts may vary substantially from the figures shown. Net performance results are calculated on a ‘fund-as-a-whole’ basis after deduction of fund-level operating and investment expenses, carried interest and management fees in accordance with the terms applicable to Fund II. Additional information on the investment portfolio and financial performance of Fund II is available from Longford Capital upon request, including hypothetical net performance results imputed on the basis of the preliminary terms applicable to Fund II.
As of June 30, 2021 **8.9% Net IRR to investors
across Fund II
Continued on next page.

© 2021 Longford Capital Management, LP. All Rights Reserved. Confidential. Not for Distribution.
Longford Capital Fund II, LP Performance con’t.
* “Gross IRR” shall mean an aggregate, annual, compound, gross internal rate of return on investments. Gross IRRs reflect capitalized investment costs and expenses, but do not reflect the Management Fees, Carried Interest Distributions, taxes, transactions costs in connection with the disposition of unrealized investments and other expenses to be borne by investors in the Fund, which will reduce returns and, in the aggregate, are expected to be substantial. Additional details and illustrative pro forma financial models are available from the Management Company upon request. All IRRs presented are annualized and calculated on the basis of monthly investment cash inflows and outflows.
** For unrealized investments, estimated value as of June 30, 2021.“Net IRR” shall have a correlative meaning but reflecting actual Management Fees, Carried Interest Distributions, and partnership expenses actually incurred.
($ in millions) LatestCase Investment Resolution Funded Realized Unrealized Total Gross Gross*Name Date Date Commit. Amount Value Value Value MOIC IRR
UNREALIZED CONT.Dragon Nov-17 $5.4 $5.4 — $10.4 $10.4 1.9x 42.2%Fire May-19 7.9 6.6 — 1.3 1.3 0.2x 0%Fuel Dec-18 10.8 4.9 — 2.8 2.8 0.6x —Ganymede Nov-19 4.9 1.4 — 1.4 1.4 1.0x 0%Ice Feb-18 13.1 8.8 — 8.8 8.8 1.0x 0%Kayak Aug-20 1.3 1.3 — 1.3 1.3 1.0x 0%Magpie Aug-20 1.7 1.8 — 1.3 1.3 0.7x —Nexus May-17 6.9 4.7 — 4.7 4.7 1.0x 0%Pegasus Oct-19 3.5 2.4 — 2.4 2.4 1.0x 0%Prism Dec-17 1.4 1.3 — 0.7 0.7 0.6x —Seahawk Aug-20 24.7 1.8 — 1.8 1.8 1.0x 0%Stinger Aug-19 6.3 4.8 — 8.9 8.9 1.9x 111.7%Triple Jan-20 5.8 0.5 — 0.5 0.5 1.0x 0%Unagi Oct-20 4.6 1.2 — 1.2 1.2 1.0x 0%Vulcan Mar-18 8.0 5.8 — 5.8 5.8 1.0x 0%Unrealized Investments $181.2 $97.4 — $115.1 $115.1 1.2x 11.7% TOTAL FUND II INVESTMENTS $510.0 $292.2 $152.8 $250.1 $402.9 1.4x 24.3%
Gross and net performance results are shown on an unaudited basis as of June 30, 2021 or such other date if resolved, on a hypothetical liquidation basis assuming all unrealized investments are realized on such date at a value equal to their reported fair value. Actual realization proceeds and ultimate funded amounts may vary substantially from the figures shown. Net performance results are calculated on a ‘fund-as-a-whole’ basis after deduction of fund-level operating and investment expenses, carried interest and management fees in accordance with the terms applicable to Fund II. Additional information on the investment portfolio and financial performance of Fund II is available from Longford Capital upon request, including hypothetical net performance results imputed on the basis of the preliminary terms applicable to Fund II.
As of June 30, 2021 **8.9% Net IRR to investors
across Fund II
© 2021 Longford Capital Management, LP. All Rights Reserved. Confidential. Not for Distribution.
Important Notice and Disclaimer
THIS INFORMATION IS CONFIDENTIAL AND IS INTENDED SOLELY FOR THE INFORMATION OF THE PERSON TO WHICH IT HAS BEEN DELIVERED. IT IS NOT TO BE REPRODUCED OR TRANSMIT-TED, IN WHOLE OR IN PART, BY ANY MEANS, TO THIRD PARTIES WITHOUT THE WRITTEN, PRIOR CONSENT OF LONGFORD CAPITAL MANAGEMENT, LP. (“LONGFORD”)
THESE ELECTRONIC DOCUMENTS ARE FOR INFORMATIONAL PURPOSES ONLY AND DO NOT CONTAIN ALL MATERIAL TERMS PERTINENT TO AN INVESTMENT DECISION, INCLUDING IMPORTANT DISCLOSURES OF CONFLICTS AND RISK FACTORS ASSOCIATED WITH AN INVEST-MENT IN LONGFORD CAPITAL FUND III, LP. THESE DOCUMENTS IN AND OF ITSELF SHOULD NOT FORM THE BASIS FOR ANY INVESTMENT DECISION. THESE DOCUMENTS ARE NOT INTENDED TO BE, NOR SHOULD IT BE CONSTRUED OR USED AS AN OFFER TO SELL, OR A SOLICITATION OF ANY OFFER TO BUY, INTERESTS IN LONGFORD CAPITAL FUND III, LP. NO OFFER OR SOLICITA-TION MAY BE MADE PRIOR TO THE DELIVERY OF A DEFINITIVE CONFIDENTIAL PRIVATE PLACE-MENT MEMORANDUM (THE “MEMORANDUM”). IN THE EVENT OF ANY CONFLICT BETWEEN INFORMATION CONTAINED HEREIN AND INFORMATION CONTAINED IN THE MEMORANDUM, THE INFORMATION IN THE MEMORANDUM WILL CONTROL AND SUPERSEDE THE INFORMATION CONTAINED HEREIN. YOU SHOULD MAKE AN INDEPENDENT INVESTIGATION OF THE MATTERS DESCRIBED HEREIN, INCLUDING CONSULTING YOUR TAX, LEGAL, ACCOUNTING OR OTHER ADVISORS ABOUT THE MATTERS DISCUSSED HEREIN.
UNLESS OTHERWISE INDICATED, THE INFORMATION CONTAINED HEREIN IS CURRENT AS OF THE DATE BELOW. SUCH INFORMATION IS BELIEVED TO BE RELIABLE AND HAS BEEN OBTAINED FROM SOURCES BELIEVED TO BE RELIABLE, BUT NO REPRESENTATION OR WAR-RANTY IS MADE, EXPRESSED OR IMPLIED, WITH RESPECT TO THE FAIRNESS, CORRECTNESS, ACCURACY, REASONABLENESS OR COMPLETENESS OF THE INFORMATION AND OPINIONS. ADDITIONALLY, THERE IS NO OBLIGATION TO UPDATE, MODIFY OR AMEND THIS DOCUMENT OR TO OTHERWISE NOTIFY A READER IN THE EVENT THAT ANY MATTER STATED HEREIN CHANGES OR SUBSEQUENTLY BECOMES INACCURATE.
CERTAIN INFORMATION CONTAINED HEREIN CONSTITUTES “FORWARD-LOOKING STATE-MENTS,” WHICH CAN BE IDENTIFIED BY THE USE OF FORWARD-LOOKING TERMINOLOGY SUCH AS “MAY”, “WILL”, “SHOULD”, “EXPECT”, “ANTICIPATE”, “TARGET”, “PROJECT”, “ESTIMATE”, “INTEND”, “CONTINUE” OR “BELIEVE” OR THE NEGATIVES THEREOF OR OTHER VARIATIONS THEREON OR COMPARABLE TERMINOLOGY. DUE TO VARIOUS RISKS AND UNCERTAINTIES, ACTUAL EVENTS OR RESULTS OR THE ACTUAL POLICIES, PROCEDURES AND PROCESSES OF THE LONGFORD AND THE PERFORMANCE OF FUND MANAGED BY LONGFORD MAY DIFFER MATERIALLY FROM THAT WHICH IS REFLECTED OR CONTEMPLATED IN SUCH FORWARD-LOOKING STATEMENTS AND NO UNDUE RELIANCE SHOULD BE PLACED ON THESE FORWARD-LOOKING STATEMENTS, NOR SHOULD THE INCLUSION OF THESE STATEMENTS BE REGARDED AS LONGFORD’S REPRESENTATION THAT LONGFORD CAPITAL FUND III, LP WILL ACHIEVE ANY STRATEGY, OBJECTIVES OR OTHER PLANS. PAST PERFORMANCE IS NOT INDICATIVE NOR A
GUARANTEE OF FUTURE RESULTS. NO ASSURANCE CAN BE MADE THAT PROFITS WILL BE ACHIEVED OR THAT SUBSTANTIAL LOSSES WILL NOT BE INCURRED.
THE OUTCOME OF LEGAL CLAIMS ENTAILS A LARGE DEGREE OF UNCERTAINTY, INCLUDING THE LEGAL LIABILITY OF THE DEFENDANT, THE AMOUNT OF DAMAGES ASSESSED BY THE TRIER OF FACT, THE ABILITY OF THE DEFENDANT AND THE DEFENDANT’S INSURANCE COMPANY TO PAY A SETTLEMENT OR JUDGMENT, THE ABILITIES OF THE PLAINTIFF’S COUNSEL, THE ASSESSMENT OF FAULT AND CAUSATION, THE LEGAL NATURE OF THE CLAIM AND THE AMOUNT OF MONE-TARY DAMAGES ULTIMATELY AWARDED. IT IS ALSO POSSIBLE THAT A CLAIMANT MAY ABANDON OR OTHERWISE COMPROMISE ITS CLAIMS. SUCH AN EVENT MAY PREVENT A LONGFORD FUND FROM REALIZING EXPECTED RETURNS OR CAUSE SUCH FUND TO SUSTAIN A COMPLETE LOSS.
THE UNCERTAINTIES OF LITIGATION MAY RESULT IN A JUDGMENT FOR AMOUNTS LESS THAN ANTICIPATED, A SETTLEMENT FOR AMOUNTS LOWER THAN PREDICTED, OR FAILURE TO REACH A SETTLEMENT. SUCH UNFAVORABLE OUTCOMES COULD REDUCE THE PROFITABILITY OF INVEST-MENTS AND ULTIMATELY CAUSE LOSSES. THE NATURE OF LITIGATION RECOVERIES, INCLUDING THE TIMING AND AMOUNTS RECOVERED, ARE OUTSIDE OF THE CONTROL OF LONGFORD ONCE THE INVESTMENT IS MADE, THERE IS NO ASSURANCE AS TO COLLECTION TIMES, AND THERE IS NO GUARANTEE THAT LONGFORD WILL BE ABLE TO PREDICT THE TIMING OF PAYMENT WITH ENOUGH ACCURACY TO ACHIEVE THE ANTICIPATED PROFITABILITY AND RATE OF RETURN IN ANY GIVEN PERIOD. SOME JURISDICTIONS MAY NOT PERMIT LONGFORD TO MAKE INVESTMENTS IN OR ENGAGE IN OTHER BUSINESS AND FINANCIAL TRANSACTIONS RELATING TO CERTAIN LITIGA-TION. THE LAW AND REGULATIONS IN SUCH JURISDICTIONS MAY BE UNCERTAIN, AND ACCORD-INGLY, LONGFORD MAY NOT HAVE THE ABILITY OR THE DESIRE TO MAKE SUCH INVESTMENTS IN THESE JURISDICTIONS, THEREBY LIMITING THE SIZE OF THE POTENTIAL MARKET. THERE IS ALSO THE RISK THAT LONGFORD MAY MAKE AN INVESTMENT DESPITE THE UNCERTAINTY AROUND A CERTAIN JURISDICTION, LEADING TO THE RISK THAT SUCH INVESTMENT AGREEMENT MAY NOT BE ENFORCED. CHANGES IN LAWS, REGULATIONS, OR ETHICAL RULES IN CERTAIN JURISDICTIONS COULD FURTHER REDUCE OR LIMIT INVESTMENT OPPORTUNITIES FOR LONGFORD OR COULD REDUCE THE VALUE OF LONGFORD’S PREEXISTING INVESTMENTS IN SUCH JURISDICTIONS. FUTURE INVESTMENT TRANSACTIONS IN WHICH LONGFORD PARTICIPATES MAY DIFFER FROM THE TRANSACTIONS DESCRIBED IN THE INVESTMENT SUMMARIES HEREIN, DUE TO, AMONG OTHER FACTORS, THE AVAILABILITY OF INVESTMENT OPPORTUNITIES, DIFFERENCES IN MARKET CONDITIONS, INDUSTRY-SPECIFIC CONDITIONS, REGULATORY DEVELOPMENTS AND OTHER REL-EVANT FACTORS, AND THERE IS NO GUARANTEE THAT INVESTMENT OPPORTUNITIES SIMILAR TO THE ONES DESCRIBED HEREIN WILL BE AVAILABLE TO LONGFORD IN THE FUTURE.
THE ABOVE SUMMARY IS NOT A COMPLETE LIST OF THE RISKS AND OTHER IMPORTANT DIS-CLOSURES INVOLVED IN INVESTING IN LONGFORD CAPITAL FUND III, LP AND IS SUBJECT TO THE MORE COMPLETE DISCLOSURES CONTAINED IN THE MEMORANDUM, WHICH MUST BE REVIEWED CAREFULLY.
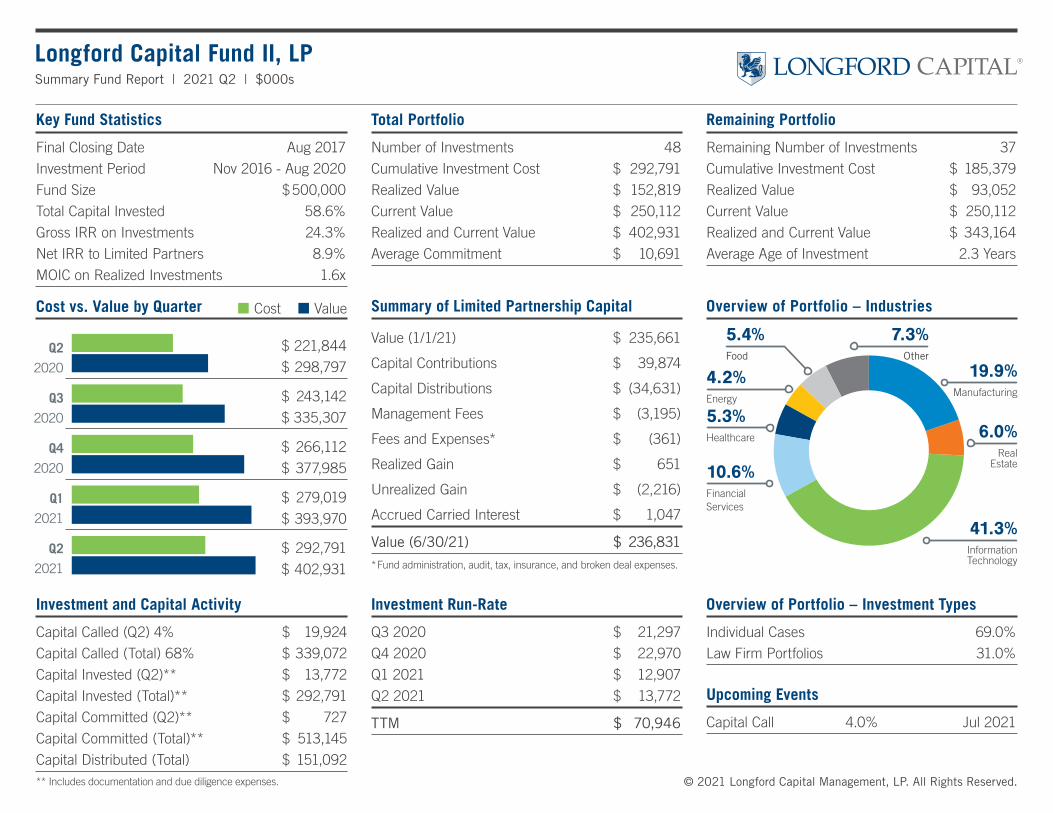
Longford Capital Fund II, LPSummary Fund Report | 2021 Q2 | $000s
Key Fund Statistics
Final Closing Date Aug 2017
Investment Period Nov 2016 - Aug 2020
Fund Size $ 500,000
Total Capital Invested 58.6%
Gross IRR on Investments 24.3%
Net IRR to Limited Partners 8.9%
MOIC on Realized Investments 1.6x
Total Portfolio
Number of Investments 48
Cumulative Investment Cost $ 292,791
Realized Value $ 152,819
Current Value $ 250,112
Realized and Current Value $ 402,931
Average Commitment $ 10,691
Remaining Portfolio
Remaining Number of Investments 37
Cumulative Investment Cost $ 185,379
Realized Value $ 93,052
Current Value $ 250,112
Realized and Current Value $ 343,164
Average Age of Investment 2.3 Years
Investment Run-Rate
Q3 2020 $ 21,297
Q4 2020 $ 22,970
Q1 2021 $ 12,907
Q2 2021 $ 13,772
TTM $ 70,946
Summary of Limited Partnership Capital
Value (1/1/21) $ 235,661
Capital Contributions $ 39,874
Capital Distributions $ (34,631)
Management Fees $ (3,195)
Fees and Expenses* $ (361)
Realized Gain $ 651
Unrealized Gain $ (2,216)
Accrued Carried Interest $ 1,047
Value (6/30/21) $ 236,831*Fund administration, audit, tax, insurance, and broken deal expenses.
10.6%Financial Services
Overview of Portfolio – Industries
19.9%Manufacturing
6.0%Real
Estate
5.4%Food
41.3%Information Technology
Investment and Capital Activity
Capital Called (Q2) 4% $ 19,924
Capital Called (Total) 68% $ 339,072
Capital Invested (Q2)** $ 13,772
Capital Invested (Total)** $ 292,791
Capital Committed (Q2)** $ 727
Capital Committed (Total)** $ 513,145
Capital Distributed (Total) $ 151,092** Includes documentation and due diligence expenses.
Q2
2020
Q3
2020
Q4
2020
Q1
2021
Q2
2021
$ 221,844
$ 298,797
$ 243,142
$ 335,307
$ 266,112
$ 377,985
$ 279,019
$ 393,970
$ 292,791
$ 402,931
4.2%Energy
Overview of Portfolio – Investment Types
Individual Cases 69.0%
Law Firm Portfolios 31.0%
Upcoming Events
Capital Call 4.0% Jul 2021
7.3%Other
5.3%Healthcare
© 2021 Longford Capital Management, LP. All Rights Reserved.
Cost vs. Value by Quarter ¢ Cost ¢ Value
I) LONGFORD CAPITAL®
o-
Long 44377
Current Period YTD Since Inception Current Period YTD Since Inception Current Period YTD Since Inception
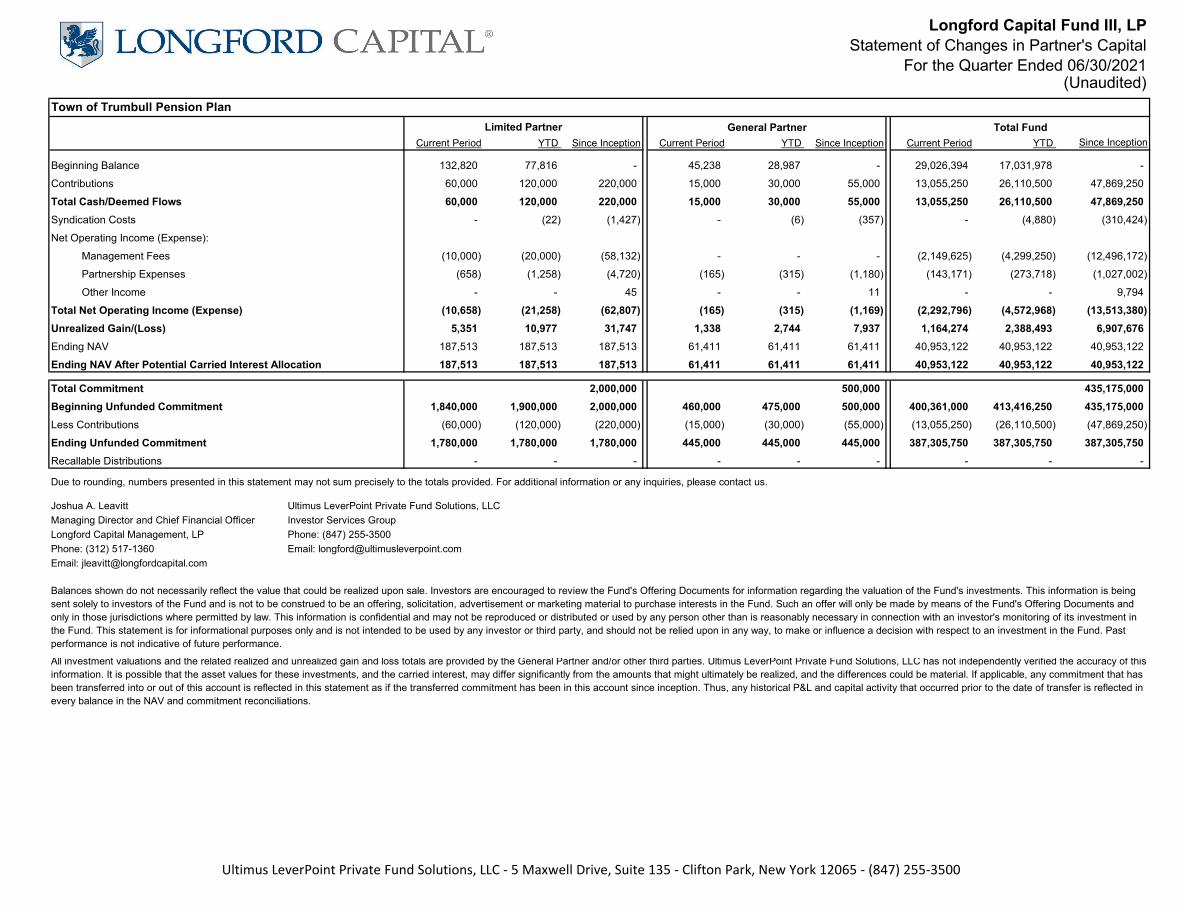
Beginning Balance 132,820 77,816 - 45,238 28,987 - 29,026,394 17,031,978 -
Contributions 60,000 120,000 220,000 15,000 30,000 55,000 13,055,250 26,110,500 47,869,250
Total Cash/Deemed Flows 60,000 120,000 220,000 15,000 30,000 55,000 13,055,250 26,110,500 47,869,250 Syndication Costs - (22) (1,427) - (6) (357) - (4,880) (310,424)
Net Operating Income (Expense):
Management Fees (10,000) (20,000) (58,132) - - - (2,149,625) (4,299,250) (12,496,172)
Partnership Expenses (658) (1,258) (4,720) (165) (315) (1,180) (143,171) (273,718) (1,027,002)
Other Income - - 45 - - 11 - - 9,794
Total Net Operating Income (Expense) (10,658) (21,258) (62,807) (165) (315) (1,169) (2,292,796) (4,572,968) (13,513,380) Unrealized Gain/(Loss) 5,351 10,977 31,747 1,338 2,744 7,937 1,164,274 2,388,493 6,907,676 Ending NAV 187,513 187,513 187,513 61,411 61,411 61,411 40,953,122 40,953,122 40,953,122
Ending NAV After Potential Carried Interest Allocation 187,513 187,513 187,513 61,411 61,411 61,411 40,953,122 40,953,122 40,953,122
Total Commitment 2,000,000 500,000 435,175,000 Beginning Unfunded Commitment 1,840,000 1,900,000 2,000,000 460,000 475,000 500,000 400,361,000 413,416,250 435,175,000 Less Contributions (60,000) (120,000) (220,000) (15,000) (30,000) (55,000) (13,055,250) (26,110,500) (47,869,250)
Ending Unfunded Commitment 1,780,000 1,780,000 1,780,000 445,000 445,000 445,000 387,305,750 387,305,750 387,305,750 Recallable Distributions - - - - - - - - -
Longford Capital Management, LP
Joshua A. Leavitt Ultimus LeverPoint Private Fund Solutions, LLC
Ultimus LeverPoint Private Fund Solutions, LLC - 5 Maxwell Drive, Suite 135 - Clifton Park, New York 12065 - (847) 255-3500
Balances shown do not necessarily reflect the value that could be realized upon sale. Investors are encouraged to review the Fund's Offering Documents for information regarding the valuation of the Fund's investments. This information is being sent solely to investors of the Fund and is not to be construed to be an offering, solicitation, advertisement or marketing material to purchase interests in the Fund. Such an offer will only be made by means of the Fund's Offering Documents and only in those jurisdictions where permitted by law. This information is confidential and may not be reproduced or distributed or used by any person other than is reasonably necessary in connection with an investor's monitoring of its investment in the Fund. This statement is for informational purposes only and is not intended to be used by any investor or third party, and should not be relied upon in any way, to make or influence a decision with respect to an investment in the Fund. Past performance is not indicative of future performance.
Email: [email protected]
All investment valuations and the related realized and unrealized gain and loss totals are provided by the General Partner and/or other third parties. Ultimus LeverPoint Private Fund Solutions, LLC has not independently verified the accuracy of this information. It is possible that the asset values for these investments, and the carried interest, may differ significantly from the amounts that might ultimately be realized, and the differences could be material. If applicable, any commitment that has been transferred into or out of this account is reflected in this statement as if the transferred commitment has been in this account since inception. Thus, any historical P&L and capital activity that occurred prior to the date of transfer is reflected in every balance in the NAV and commitment reconciliations.
Managing Director and Chief Financial Officer
Phone: (312) 517-1360
Investor Services GroupPhone: (847) 255-3500Email: [email protected]
Due to rounding, numbers presented in this statement may not sum precisely to the totals provided. For additional information or any inquiries, please contact us.
Limited Partner General Partner Total Fund
Longford Capital Fund III, LPStatement of Changes in Partner's Capital
For the Quarter Ended 06/30/2021
Town of Trumbull Pension Plan
(Unaudited)
Ultimus LeverPoint Private Fund Solutions, LLC - 5 Maxwell Drive, Suite 135 - Clifton Park, New York 12065 - (847) 255-3500
~ LONGFORD CAPITAL®

08/15/2021 10:15:12
Statements independently prepared by
Ultimus LeverPoint Private Fund Solutions, LLC - 5 Maxwell Drive, Suite 135
Clifton Park, New York 12065 - (847) 255-3500
1,187,609.7232,590,54540,953,122.066,907,67642,140,731.78Longford Capital Fund III, LPBalance Sheet
June 30, 2021(Unaudited)
Assets
Investment Cost 32,590,545Unrealized Gain/Loss 6,907,676Total Fair Value of Investments 39,498,221Cash 156,824Capital Call Receivable 790Prepaid Expenses 287,326Due from Other Related Parties 2,197,572Total Assets 42,140,732
Liabilities and Partners' Capital
Liabilities
Payable for Investments 1,019,168Due to Longford Capital Management, LP 16,635Due to (from) Other Related Parties 326Accrued Expenses 137,984Subsequent Close Interest Payable 13,496Total Liabilities 1,187,610
Capital
Partners' Capital - Limited Partners 40,891,711Partners' Capital - General Partner 61,411Total Capital 40,953,122
Total Liabilities and Capital 42,140,732
Note: Totals listed for each category may differ from the sum of the individual items due torounding differences.
08/15/2021 10:15:12
Statements independently prepared by
Ultimus LeverPoint Private Fund Solutions, LLC - 5 Maxwell Drive, Suite 135
Clifton Park, New York 12065 - (847) 255-3500
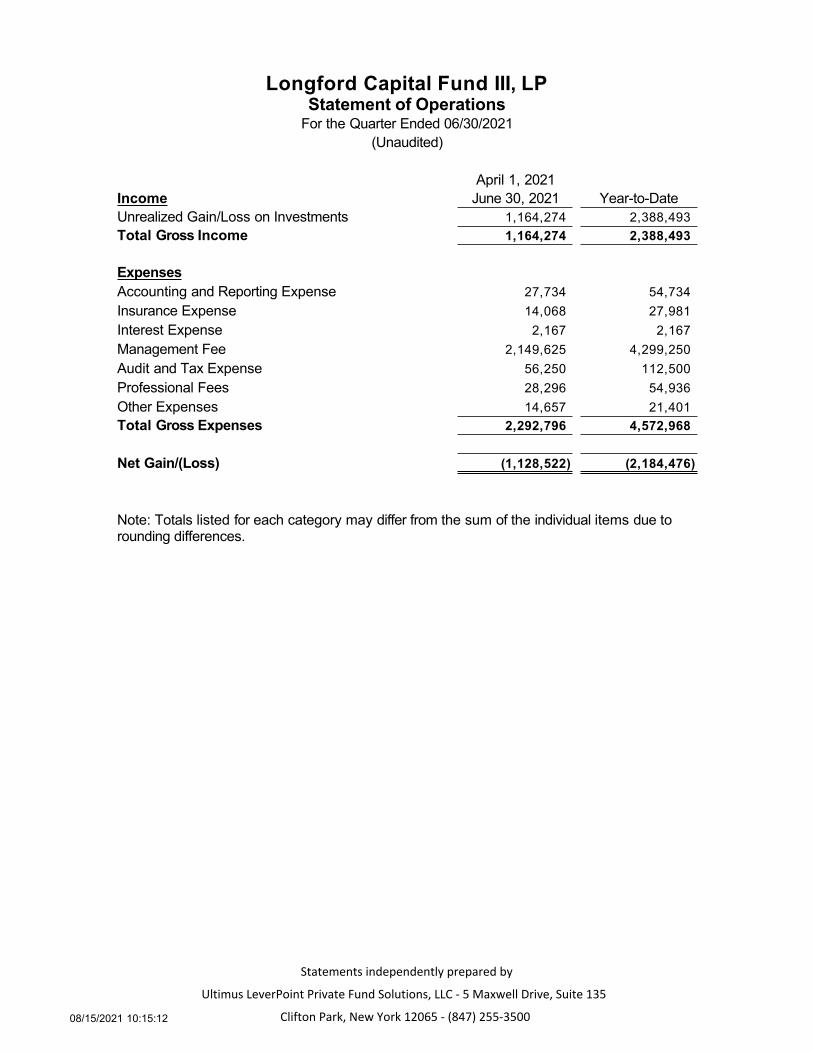
Longford Capital Fund III, LPStatement of Operations
For the Quarter Ended 06/30/2021June 30, 2021 (Unaudited)
April 1, 2021Income June 30, 2021 Year-to-DateUnrealized Gain/Loss on Investments 1,164,274 2,388,493Total Gross Income 1,164,274 2,388,493
ExpensesAccounting and Reporting Expense 27,734 54,734Insurance Expense 14,068 27,981Interest Expense 2,167 2,167Management Fee 2,149,625 4,299,250Audit and Tax Expense 56,250 112,500Professional Fees 28,296 54,936Other Expenses 14,657 21,401Total Gross Expenses 2,292,796 4,572,968
Net Gain/(Loss) (1,128,522) (2,184,476)
Note: Totals listed for each category may differ from the sum of the individual items due torounding differences.
08/15/2021 10:15:12
Statements independently prepared by
Ultimus LeverPoint Private Fund Solutions, LLC - 5 Maxwell Drive, Suite 135
Clifton Park, New York 12065 - (847) 255-3500
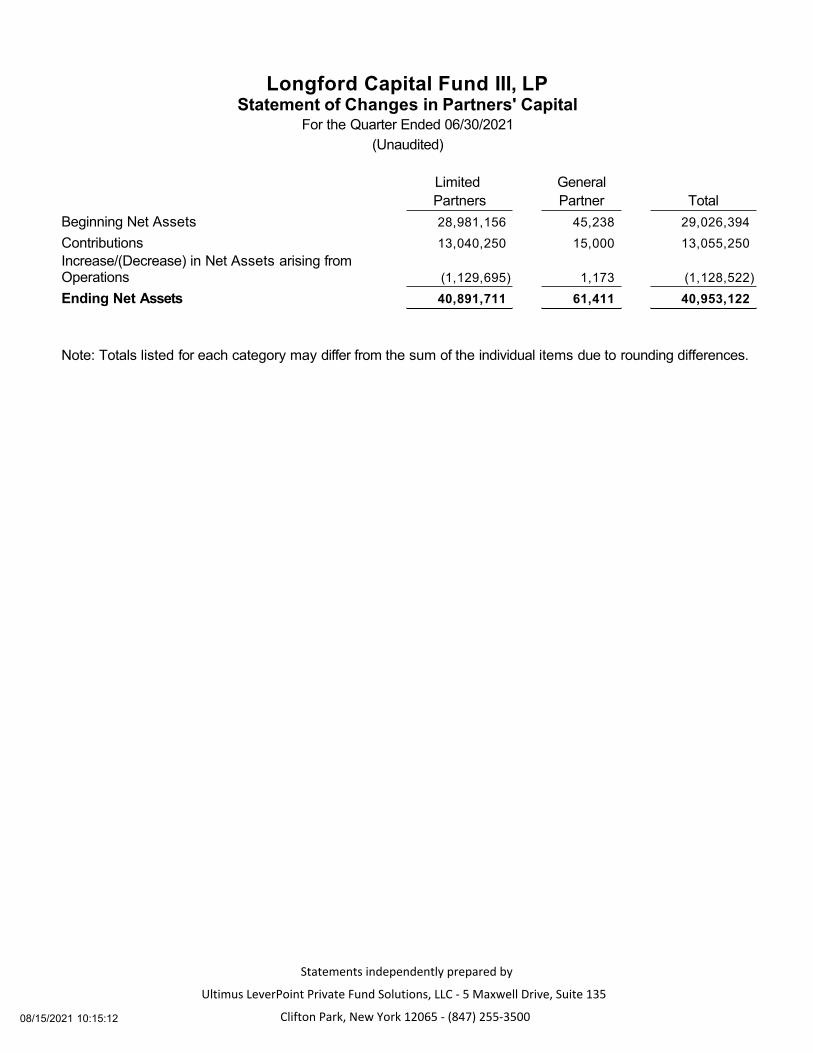
Longford Capital Fund III, LPStatement of Changes in Partners' Capital
For the Quarter Ended 06/30/2021(Unaudited)
June 30, 2021Limited GeneralPartners Partner Total
Beginning Net Assets 28,981,156 45,238 29,026,394Contributions 13,040,250 15,000 13,055,250Increase/(Decrease) in Net Assets arising fromOperations (1,129,695) 1,173 (1,128,522)Ending Net Assets 40,891,711 61,411 40,953,122
Note: Totals listed for each category may differ from the sum of the individual items due to rounding differences.

08/15/2021 10:15:12
Statements independently prepared by
Ultimus LeverPoint Private Fund Solutions, LLC - 5 Maxwell Drive, Suite 135
Clifton Park, New York 12065 - (847) 255-3500
Longford Capital Fund III, LPStatement of Changes in Financial Condition
For the Quarter Ended 06/30/2021June 30, 2021 (Unaudited)
Assets
Current Previous Net ChangeInvestment Cost 32,590,545 12,857,629 19,732,916Unrealized Gain/Loss 6,907,676 5,743,402 1,164,274Cash 156,824 10,887,398 (10,730,574)Capital Call Receivable 790 90 700Prepaid Expenses 287,326 259,102 28,223Due from Other Related Parties 2,197,572 8,660 2,188,912Total Assets 42,140,732 29,756,281 12,384,451
Liabilities and Partners' Capital
Liabilities
Current Previous Net ChangePayable for Investments 1,019,168 578,839 440,330Due to Longford Capital Management, LP 16,635 26,260 (9,625)Due to (from) Other Related Parties 326 - 326Accrued Expenses 137,984 110,750 27,234Accounts Payable - 542 (542)Subsequent Close Interest Payable 13,496 13,496 -Total Liabilities 1,187,610 729,887 457,723
Capital
Current Previous Net ChangePartners' Capital - Limited Partners 40,891,711 28,981,156 11,910,555Partners' Capital - General Partner 61,411 45,238 16,173
Total Capital 40,953,122 29,026,394 11,926,728
Total Liabilities and Capital 42,140,732 29,756,281 12,384,451
Note: Totals listed for each category may differ from the sum of the individual items due to roundingdifferences.
32,590,545 6,907,676
#########
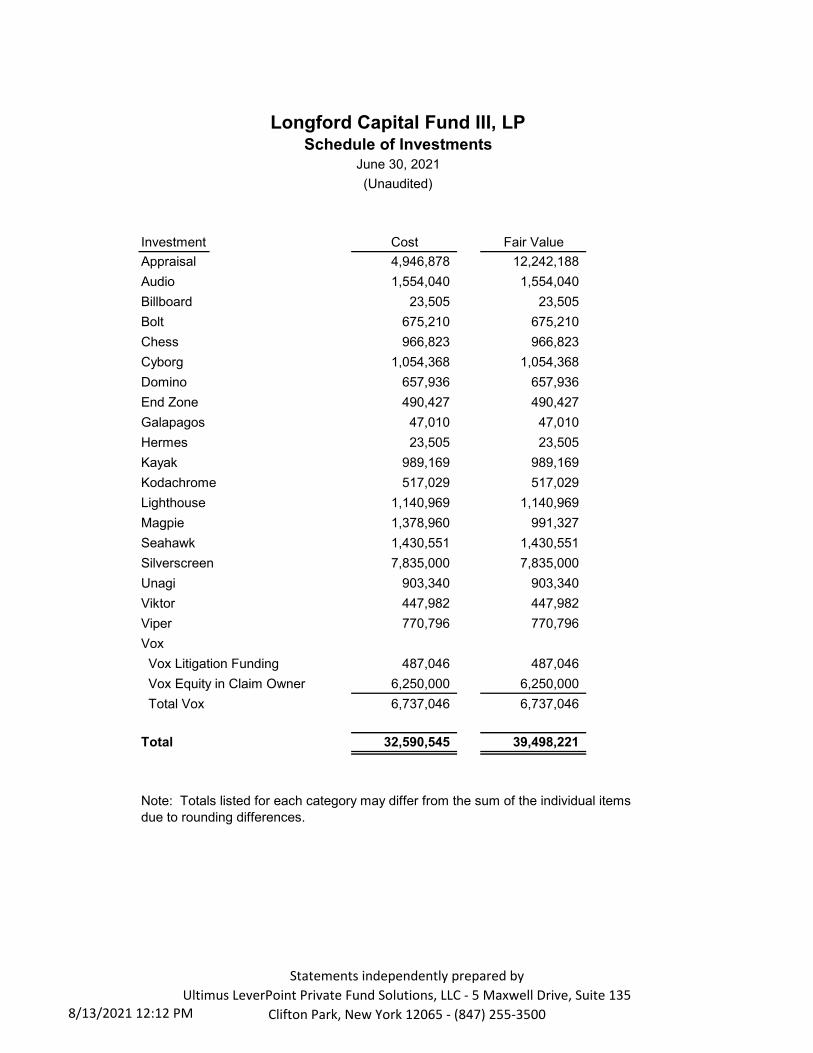
Investment Cost Fair ValueAppraisal 4,946,878 12,242,188 Audio 1,554,040 1,554,040 Billboard 23,505 23,505 Bolt 675,210 675,210 Chess 966,823 966,823 Cyborg 1,054,368 1,054,368 Domino 657,936 657,936 End Zone 490,427 490,427 Galapagos 47,010 47,010 Hermes 23,505 23,505 Kayak 989,169 989,169 Kodachrome 517,029 517,029 Lighthouse 1,140,969 1,140,969 Magpie 1,378,960 991,327 Seahawk 1,430,551 1,430,551 Silverscreen 7,835,000 7,835,000 Unagi 903,340 903,340 Viktor 447,982 447,982 Viper 770,796 770,796 Vox Vox Litigation Funding 487,046 487,046 Vox Equity in Claim Owner 6,250,000 6,250,000 Total Vox 6,737,046 6,737,046
Total 32,590,545 39,498,221
Longford Capital Fund III, LPSchedule of Investments
June 30, 2021(Unaudited)
Note: Totals listed for each category may differ from the sum of the individual items due to rounding differences.
8/13/2021 12:12 PM
Statements independently prepared byUltimus LeverPoint Private Fund Solutions, LLC - 5 Maxwell Drive, Suite 135
Clifton Park, New York 12065 - (847) 255-3500
© 2021 Longford Capital Management, LP. All Rights Reserved. Confidential. Not for Distribution.
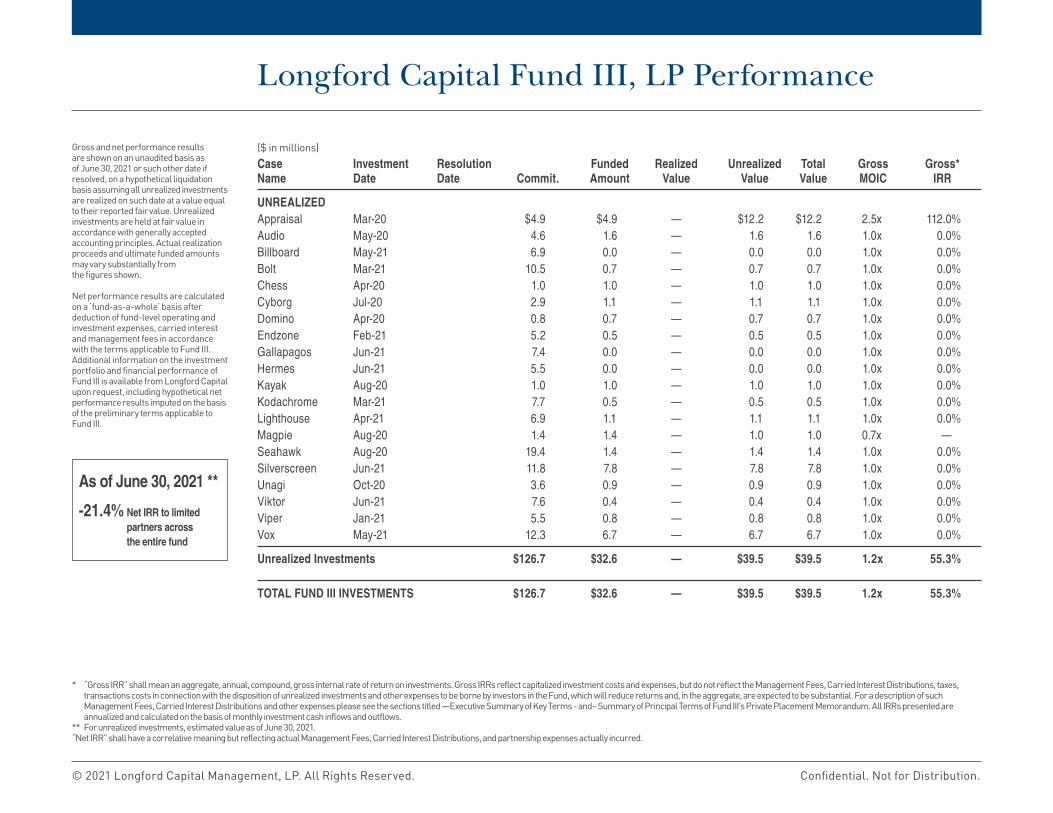
Longford Capital Fund III, LP Performance
($ in millions)
Case Investment Resolution Funded Realized Unrealized Total Gross Gross*Name Date Date Commit. Amount Value Value Value MOIC IRR
UNREALIZEDAppraisal Mar-20 $4.9 $4.9 — $12.2 $12.2 2.5x 112.0%Audio May-20 4.6 1.6 — 1.6 1.6 1.0x 0.0%Billboard May-21 6.9 0.0 — 0.0 0.0 1.0x 0.0%Bolt Mar-21 10.5 0.7 — 0.7 0.7 1.0x 0.0%Chess Apr-20 1.0 1.0 — 1.0 1.0 1.0x 0.0%Cyborg Jul-20 2.9 1.1 — 1.1 1.1 1.0x 0.0%Domino Apr-20 0.8 0.7 — 0.7 0.7 1.0x 0.0%Endzone Feb-21 5.2 0.5 — 0.5 0.5 1.0x 0.0%Gallapagos Jun-21 7.4 0.0 — 0.0 0.0 1.0x 0.0%Hermes Jun-21 5.5 0.0 — 0.0 0.0 1.0x 0.0%Kayak Aug-20 1.0 1.0 — 1.0 1.0 1.0x 0.0%Kodachrome Mar-21 7.7 0.5 — 0.5 0.5 1.0x 0.0%Lighthouse Apr-21 6.9 1.1 — 1.1 1.1 1.0x 0.0%Magpie Aug-20 1.4 1.4 — 1.0 1.0 0.7x —Seahawk Aug-20 19.4 1.4 — 1.4 1.4 1.0x 0.0%Silverscreen Jun-21 11.8 7.8 — 7.8 7.8 1.0x 0.0%Unagi Oct-20 3.6 0.9 — 0.9 0.9 1.0x 0.0%Viktor Jun-21 7.6 0.4 — 0.4 0.4 1.0x 0.0%Viper Jan-21 5.5 0.8 — 0.8 0.8 1.0x 0.0%Vox May-21 12.3 6.7 — 6.7 6.7 1.0x 0.0%
Unrealized Investments $126.7 $32.6 — $39.5 $39.5 1.2x 55.3%
TOTAL FUND III INVESTMENTS $126.7 $32.6 — $39.5 $39.5 1.2x 55.3%
Gross and net performance results are shown on an unaudited basis as of June 30, 2021 or such other date if resolved, on a hypothetical liquidation basis assuming all unrealized investments are realized on such date at a value equal to their reported fair value. Unrealized investments are held at fair value in accordance with generally accepted accounting principles. Actual realization proceeds and ultimate funded amounts may vary substantially from the figures shown. Net performance results are calculated on a ‘fund-as-a-whole’ basis after deduction of fund-level operating and investment expenses, carried interest and management fees in accordance with the terms applicable to Fund III. Additional information on the investment portfolio and financial performance of Fund III is available from Longford Capital upon request, including hypothetical net performance results imputed on the basis of the preliminary terms applicable to Fund III.
* “Gross IRR” shall mean an aggregate, annual, compound, gross internal rate of return on investments. Gross IRRs reflect capitalized investment costs and expenses, but do not reflect the Management Fees, Carried Interest Distributions, taxes, transactions costs in connection with the disposition of unrealized investments and other expenses to be borne by investors in the Fund, which will reduce returns and, in the aggregate, are expected to be substantial. For a description of such Management Fees, Carried Interest Distributions and other expenses please see the sections titled —Executive Summary of Key Terms - and– Summary of Principal Terms of Fund III’s Private Placement Memorandum. All IRRs presented are annualized and calculated on the basis of monthly investment cash inflows and outflows.
** For unrealized investments, estimated value as of June 30, 2021.“Net IRR” shall have a correlative meaning but reflecting actual Management Fees, Carried Interest Distributions, and partnership expenses actually incurred.
As of June 30, 2021 **-21.4% Net IRR to limited
partners across the entire fund

© 2021 Longford Capital Management, LP. All Rights Reserved. Confidential. Not for Distribution.
Important Notice and Disclaimer
THIS INFORMATION IS CONFIDENTIAL AND IS INTENDED SOLELY FOR THE INFORMATION OF THE PERSON TO WHICH IT HAS BEEN DELIVERED. IT IS NOT TO BE REPRODUCED OR TRANSMIT-TED, IN WHOLE OR IN PART, BY ANY MEANS, TO THIRD PARTIES WITHOUT THE WRITTEN, PRIOR CONSENT OF LONGFORD CAPITAL MANAGEMENT, LP. (“LONGFORD”)
THESE ELECTRONIC DOCUMENTS ARE FOR INFORMATIONAL PURPOSES ONLY AND DO NOT CONTAIN ALL MATERIAL TERMS PERTINENT TO AN INVESTMENT DECISION, INCLUDING IMPORTANT DISCLOSURES OF CONFLICTS AND RISK FACTORS ASSOCIATED WITH AN INVEST-MENT IN LONGFORD CAPITAL FUND III, LP. THESE DOCUMENTS IN AND OF ITSELF SHOULD NOT FORM THE BASIS FOR ANY INVESTMENT DECISION. THESE DOCUMENTS ARE NOT INTENDED TO BE, NOR SHOULD IT BE CONSTRUED OR USED AS AN OFFER TO SELL, OR A SOLICITATION OF ANY OFFER TO BUY, INTERESTS IN LONGFORD CAPITAL FUND III, LP. NO OFFER OR SOLICITA-TION MAY BE MADE PRIOR TO THE DELIVERY OF A DEFINITIVE CONFIDENTIAL PRIVATE PLACE-MENT MEMORANDUM (THE “MEMORANDUM”). IN THE EVENT OF ANY CONFLICT BETWEEN INFORMATION CONTAINED HEREIN AND INFORMATION CONTAINED IN THE MEMORANDUM, THE INFORMATION IN THE MEMORANDUM WILL CONTROL AND SUPERSEDE THE INFORMATION CONTAINED HEREIN. YOU SHOULD MAKE AN INDEPENDENT INVESTIGATION OF THE MATTERS DESCRIBED HEREIN, INCLUDING CONSULTING YOUR TAX, LEGAL, ACCOUNTING OR OTHER ADVISORS ABOUT THE MATTERS DISCUSSED HEREIN.
UNLESS OTHERWISE INDICATED, THE INFORMATION CONTAINED HEREIN IS CURRENT AS OF THE DATE BELOW. SUCH INFORMATION IS BELIEVED TO BE RELIABLE AND HAS BEEN OBTAINED FROM SOURCES BELIEVED TO BE RELIABLE, BUT NO REPRESENTATION OR WAR-RANTY IS MADE, EXPRESSED OR IMPLIED, WITH RESPECT TO THE FAIRNESS, CORRECTNESS, ACCURACY, REASONABLENESS OR COMPLETENESS OF THE INFORMATION AND OPINIONS. ADDITIONALLY, THERE IS NO OBLIGATION TO UPDATE, MODIFY OR AMEND THIS DOCUMENT OR TO OTHERWISE NOTIFY A READER IN THE EVENT THAT ANY MATTER STATED HEREIN CHANGES OR SUBSEQUENTLY BECOMES INACCURATE.
CERTAIN INFORMATION CONTAINED HEREIN CONSTITUTES “FORWARD-LOOKING STATE-MENTS,” WHICH CAN BE IDENTIFIED BY THE USE OF FORWARD-LOOKING TERMINOLOGY SUCH AS “MAY”, “WILL”, “SHOULD”, “EXPECT”, “ANTICIPATE”, “TARGET”, “PROJECT”, “ESTIMATE”, “INTEND”, “CONTINUE” OR “BELIEVE” OR THE NEGATIVES THEREOF OR OTHER VARIATIONS THEREON OR COMPARABLE TERMINOLOGY. DUE TO VARIOUS RISKS AND UNCERTAINTIES, ACTUAL EVENTS OR RESULTS OR THE ACTUAL POLICIES, PROCEDURES AND PROCESSES OF THE LONGFORD AND THE PERFORMANCE OF FUND MANAGED BY LONGFORD MAY DIFFER MATERIALLY FROM THAT WHICH IS REFLECTED OR CONTEMPLATED IN SUCH FORWARD-LOOKING STATEMENTS AND NO UNDUE RELIANCE SHOULD BE PLACED ON THESE FORWARD-LOOKING STATEMENTS, NOR SHOULD THE INCLUSION OF THESE STATEMENTS BE REGARDED AS LONGFORD’S REPRESENTATION THAT LONGFORD CAPITAL FUND III, LP WILL ACHIEVE ANY STRATEGY, OBJECTIVES OR OTHER PLANS. PAST PERFORMANCE IS NOT INDICATIVE NOR A
GUARANTEE OF FUTURE RESULTS. NO ASSURANCE CAN BE MADE THAT PROFITS WILL BE ACHIEVED OR THAT SUBSTANTIAL LOSSES WILL NOT BE INCURRED.
THE OUTCOME OF LEGAL CLAIMS ENTAILS A LARGE DEGREE OF UNCERTAINTY, INCLUDING THE LEGAL LIABILITY OF THE DEFENDANT, THE AMOUNT OF DAMAGES ASSESSED BY THE TRIER OF FACT, THE ABILITY OF THE DEFENDANT AND THE DEFENDANT’S INSURANCE COMPANY TO PAY A SETTLEMENT OR JUDGMENT, THE ABILITIES OF THE PLAINTIFF’S COUNSEL, THE ASSESSMENT OF FAULT AND CAUSATION, THE LEGAL NATURE OF THE CLAIM AND THE AMOUNT OF MONE-TARY DAMAGES ULTIMATELY AWARDED. IT IS ALSO POSSIBLE THAT A CLAIMANT MAY ABANDON OR OTHERWISE COMPROMISE ITS CLAIMS. SUCH AN EVENT MAY PREVENT A LONGFORD FUND FROM REALIZING EXPECTED RETURNS OR CAUSE SUCH FUND TO SUSTAIN A COMPLETE LOSS.
THE UNCERTAINTIES OF LITIGATION MAY RESULT IN A JUDGMENT FOR AMOUNTS LESS THAN ANTICIPATED, A SETTLEMENT FOR AMOUNTS LOWER THAN PREDICTED, OR FAILURE TO REACH A SETTLEMENT. SUCH UNFAVORABLE OUTCOMES COULD REDUCE THE PROFITABILITY OF INVEST-MENTS AND ULTIMATELY CAUSE LOSSES. THE NATURE OF LITIGATION RECOVERIES, INCLUDING THE TIMING AND AMOUNTS RECOVERED, ARE OUTSIDE OF THE CONTROL OF LONGFORD ONCE THE INVESTMENT IS MADE, THERE IS NO ASSURANCE AS TO COLLECTION TIMES, AND THERE IS NO GUARANTEE THAT LONGGORD WILL BE ABLE TO PREDICT THE TIMING OF PAYMENT WITH ENOUGH ACCURACY TO ACHIEVE THE ANTICIPATED PROFITABILITY AND RATE OF RETURN IN ANY GIVEN PERIOD. SOME JURISDICTIONS MAY NOT PERMIT LONGFORD TO MAKE INVESTMENTS IN OR ENGAGE IN OTHER BUSINESS AND FINANCIAL TRANSACTIONS RELATING TO CERTAIN LITIGA-TION. THE LAW AND REGULATIONS IN SUCH JURISDICTIONS MAY BE UNCERTAIN, AND ACCORD-INGLY, LONGFORD MAY NOT HAVE THE ABILITY OR THE DESIRE TO MAKE SUCH INVESTMENTS IN THESE JURISDICTIONS, THEREBY LIMITING THE SIZE OF THE POTENTIAL MARKET. THERE IS ALSO THE RISK THAT LONGFORD MAY MAKE AN INVESTMENT DESPITE THE UNCERTAINTY AROUND A CERTAIN JURISDICTION, LEADING TO THE RISK THAT SUCH INVESTMENT AGREEMENT MAY NOT BE ENFORCED. CHANGES IN LAWS, REGULATIONS, OR ETHICAL RULES IN CERTAIN JURISDICTIONS COULD FURTHER REDUCE OR LIMIT INVESTMENT OPPORTUNITIES FOR LONGFORD OR COULD REDUCE THE VALUE OF LONGFORD’S PREEXISTING INVESTMENTS IN SUCH JURISDICTIONS. FUTURE INVESTMENT TRANSACTIONS IN WHICH LONGFORD PARTICIPATES MAY DIFFER FROM THE TRANSACTIONS DESCRIBED IN THE INVESTMENT SUMMARIES HEREIN, DUE TO, AMONG OTHER FACTORS, THE AVAILABILITY OF INVESTMENT OPPORTUNITIES, DIFFERENCES IN MARKET CONDITIONS, INDUSTRY-SPECIFIC CONDITIONS, REGULATORY DEVELOPMENTS AND OTHER REL-EVANT FACTORS, AND THERE IS NO GUARANTEE THAT INVESTMENT OPPORTUNITIES SIMILAR TO THE ONES DESCRIBED HEREIN WILL BE AVAILABLE TO LONGFORD IN THE FUTURE.
THE ABOVE SUMMARY IS NOT A COMPLETE LIST OF THE RISKS AND OTHER IMPORTANT DIS-CLOSURES INVOLVED IN INVESTING IN LONGFORD CAPITAL FUND III, LP AND IS SUBJECT TO THE MORE COMPLETE DISCLOSURES CONTAINED IN THE MEMORANDUM, WHICH MUST BE REVIEWED CAREFULLY.
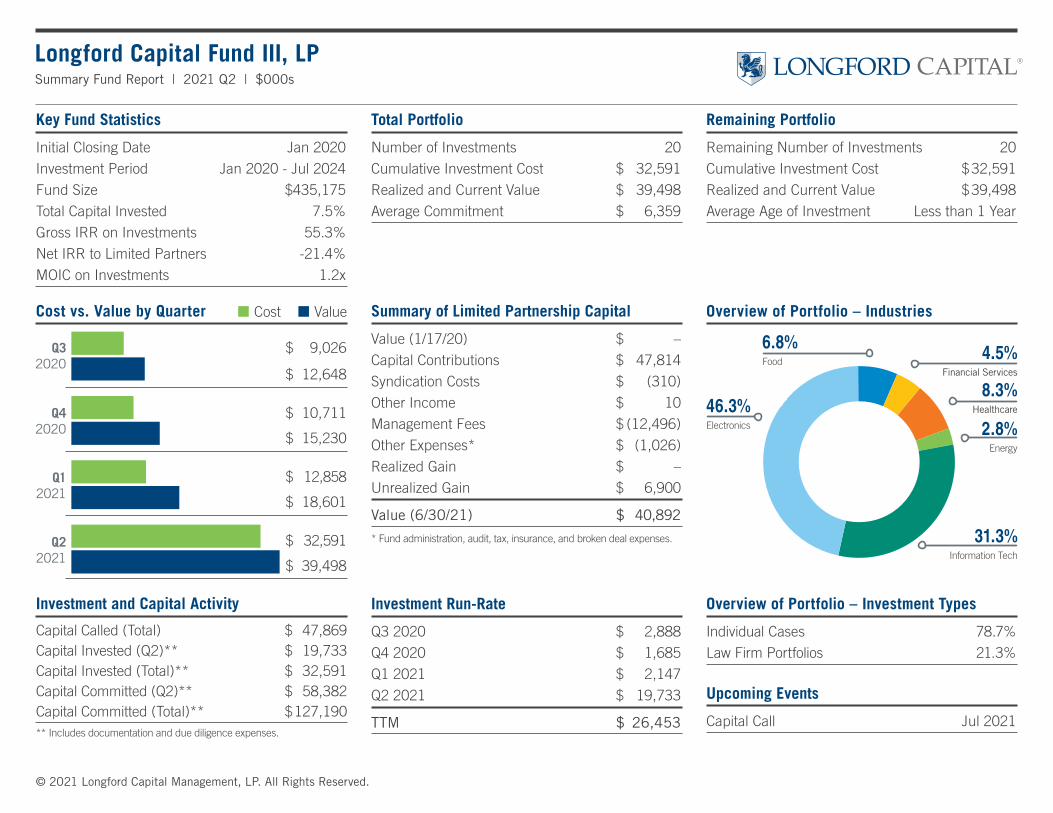
Cost vs. Value by Quarter ¢ Cost ¢ Value
Q32020
Q42020
Q12021
Q22021
$ 9,026
$ 12,648
$ 10,711
$ 15,230
$ 12,858
$ 18,601
$ 32,591
$ 39,498
Longford Capital Fund III, LP
© 2021 Longford Capital Management, LP. All Rights Reserved.
Summary Fund Report | 2021 Q2 | $000s
Key Fund Statistics
Initial Closing Date Jan 2020
Investment Period Jan 2020 - Jul 2024
Fund Size $435,175
Total Capital Invested 7.5%
Gross IRR on Investments 55.3%
Net IRR to Limited Partners -21.4%
MOIC on Investments 1.2x
Total Portfolio
Number of Investments 20
Cumulative Investment Cost $ 32,591
Realized and Current Value $ 39,498
Average Commitment $ 6,359
Remaining Portfolio
Remaining Number of Investments 20
Cumulative Investment Cost $ 32,591
Realized and Current Value $ 39,498
Average Age of Investment Less than 1 Year
Upcoming Events
Capital Call Jul 2021
Summary of Limited Partnership Capital
Value (1/17/20) $ –
Capital Contributions $ 47,814
Syndication Costs $ (310)
Other Income $ 10
Management Fees $ (12,496)
Other Expenses* $ (1,026)
Realized Gain $ –
Unrealized Gain $ 6,900
Value (6/30/21) $ 40,892
* Fund administration, audit, tax, insurance, and broken deal expenses.
Overview of Portfolio – Industries
4.5%Financial Services
8.3%Healthcare46.3%
Electronics
Investment and Capital Activity
Capital Called (Total) $ 47,869Capital Invested (Q2)** $ 19,733Capital Invested (Total)** $ 32,591Capital Committed (Q2)** $ 58,382Capital Committed (Total)** $ 127,190** Includes documentation and due diligence expenses.
2.8%Energy
Investment Run-Rate
Q3 2020 $ 2,888
Q4 2020 $ 1,685
Q1 2021 $ 2,147
Q2 2021 $ 19,733
TTM $ 26,453
31.3%Information Tech
Overview of Portfolio – Investment Types
Individual Cases 78.7%
Law Firm Portfolios 21.3%
6.8%Food
I) LONGFORD CAPITAL®
--- 0
0
-

PENSION BOARD
APPROVED MEETING DATES
The Pension Board Meetings will take place on the fourth Tuesday of the month
at 7:00 PM via Zoom, unless otherwise noted.
The following are the 2022 meeting dates:
January 25, 2022
April 26, 2022
July 26, 2022
October 25, 2022
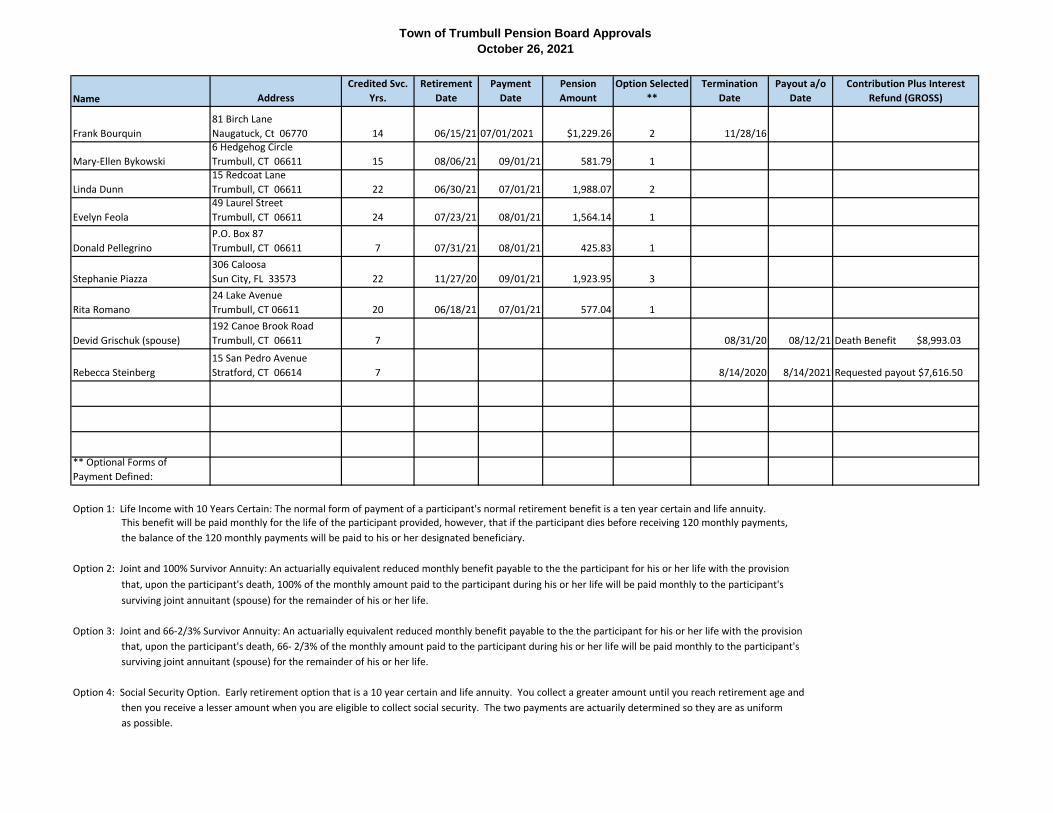
Town of Trumbull Pension Board Approvals October 26, 2021
Name AddressCredited Svc.
Yrs.Retirement
DatePayment
DatePension Amount
Option Selected **
Termination Date
Payout a/o Date
Contribution Plus Interest Refund (GROSS)
Frank Bourquin81 Birch Lane Naugatuck, Ct 06770 14 06/15/21 07/01/2021 $1,229.26 2 11/28/16
Mary-Ellen Bykowski6 Hedgehog Circle Trumbull, CT 06611 15 08/06/21 09/01/21 581.79 1
Linda Dunn15 Redcoat Lane Trumbull, CT 06611 22 06/30/21 07/01/21 1,988.07 2
Evelyn Feola49 Laurel Street Trumbull, CT 06611 24 07/23/21 08/01/21 1,564.14 1
Donald PellegrinoP.O. Box 87 Trumbull, CT 06611 7 07/31/21 08/01/21 425.83 1
Stephanie Piazza306 Caloosa Sun City, FL 33573 22 11/27/20 09/01/21 1,923.95 3
Rita Romano24 Lake Avenue Trumbull, CT 06611 20 06/18/21 07/01/21 577.04 1
Devid Grischuk (spouse)192 Canoe Brook Road Trumbull, CT 06611 7 08/31/20 08/12/21 Death Benefit $8,993.03
Rebecca Steinberg15 San Pedro Avenue Stratford, CT 06614 7 8/14/2020 8/14/2021 Requested payout $7,616.50
** Optional Forms of Payment Defined:
Option 1: Life Income with 10 Years Certain: The normal form of payment of a participant's normal retirement benefit is a ten year certain and life annuity. This benefit will be paid monthly for the life of the participant provided, however, that if the participant dies before receiving 120 monthly payments, the balance of the 120 monthly payments will be paid to his or her designated beneficiary.
Option 2: Joint and 100% Survivor Annuity: An actuarially equivalent reduced monthly benefit payable to the the participant for his or her life with the provision that, upon the participant's death, 100% of the monthly amount paid to the participant during his or her life will be paid monthly to the participant's surviving joint annuitant (spouse) for the remainder of his or her life.
Option 3: Joint and 66-2/3% Survivor Annuity: An actuarially equivalent reduced monthly benefit payable to the the participant for his or her life with the provision that, upon the participant's death, 66- 2/3% of the monthly amount paid to the participant during his or her life will be paid monthly to the participant's surviving joint annuitant (spouse) for the remainder of his or her life.
Option 4: Social Security Option. Early retirement option that is a 10 year certain and life annuity. You collect a greater amount until you reach retirement age and then you receive a lesser amount when you are eligible to collect social security. The two payments are actuarily determined so they are as uniform as possible.

SUBJECT TO MODIFICATION AND APPROVAL TOWN OF TRUMBULL
PENSION BOARD MEETING Minutes
July 27, 2021
Call to Order Chairman Lavin called the Pension Board meeting to order at 7:10 p.m. in the Town Hall, indicating that we have a quorum. PRESENT ABSENT James Lavin Donna Pellitteri James Meisner Maria Pires Patrick Clark
James Daly Anthony Musto Also present: John Oliver Beirne (remote-via phone) – Beirne Wealth Consulting; Lindsey Allard – Beirne Wealth Consulting Beirne Wealth Consulting Lindsay Allard gave the following Portfolio Performance Report: The total value of the Plan on 6/30/2021 was $48,924,643. For the 3- month time-period, for the 2nd quarter of 2021, the fund was up 5.11%; YTD the fund was up 8.5% and for the one year-certain time-period the fund was up 26.61%. The total value of the Equities on 6/30/2021 was $32,723,835. The percentage of the portfolio was 66.89%. For the 3- month time-period, for the 2nd quarter of 2021, the fund was up 6.70%; YTD the fund was up 12.94% and for the one year-certain time-period the fund was up 42.22% The total value of the Fixed Income on 6/30/2021 was $10,602,933. The percentage of the portfolio was 21.67%. For the 3- month time-period, for the 2nd quarter of 2021, the fund was up 2.34%; YTD the fund was down -.59% and for the one year-certain time-period the fund was up 4.01% The total value of the Alternatives on 6/30/2021 was $4,097,678. The percentage of the portfolio was 8.36%. For the 3- month time-period, for the 2nd quarter of 2021, the fund was up 1.81%; YTD the fund was up 3.79% and for the one year-certain time-period the fund was up 8.95%. The total value of the Cash on 6/30/2021 was $1,550,197. The percentage of the portfolio was 3.07%. For the 3- month time-period, for the 2nd quarter of 2021, the fund was up 0%; YTD the fund was up .01% and for the one year-certain time-period the fund was up .08%. John-Oliver Beirne discussed the current asset allocations indicating that each is within the Investment Policy ranges. He went on to add that the cash should be at 0%; however, this is not possible as the cash balance is fluid. In addition, we need to remember the Longford Capital II and III Funds are not subject to the volatility of the market, since they deal with lawsuits. The average duration cycle for the fund is 7 years. We are currently watching to see what will happen with interest rates, with China and the big tech companies, and the emerging markets, as well as the impact of government intervention.
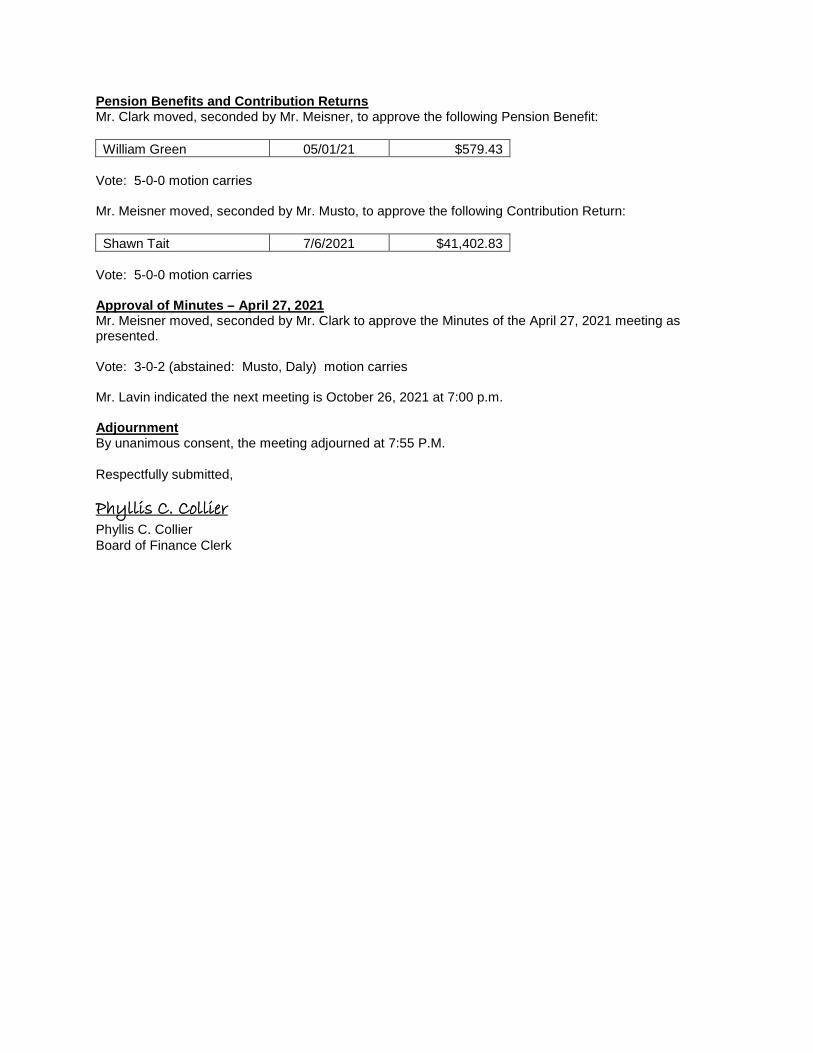
Pension Benefits and Contribution Returns Mr. Clark moved, seconded by Mr. Meisner, to approve the following Pension Benefit: William Green 05/01/21 $579.43
Vote: 5-0-0 motion carries Mr. Meisner moved, seconded by Mr. Musto, to approve the following Contribution Return: Shawn Tait 7/6/2021 $41,402.83
Vote: 5-0-0 motion carries Approval of Minutes – April 27, 2021 Mr. Meisner moved, seconded by Mr. Clark to approve the Minutes of the April 27, 2021 meeting as presented. Vote: 3-0-2 (abstained: Musto, Daly) motion carries Mr. Lavin indicated the next meeting is October 26, 2021 at 7:00 p.m. Adjournment By unanimous consent, the meeting adjourned at 7:55 P.M.
Respectfully submitted, Phyllis C. Collier Phyllis C. Collier Board of Finance Clerk
Related Documents