Received: 2013.08.23 Accepted: 2013.10.11 Published: 2014.01.13 4199 3 6 71 Towards neural correlates of auditory stimulus processing: A simultaneous auditory evoked potentials and functional magnetic resonance study using an odd-ball paradigm ABCDEF 1 Rafał Milner ABCDEF 1 Mateusz Rusiniak DEF 1 Monika Lewandowska ABCDE 1 Tomasz Wolak B 1 Małgorzata Ganc ACD 2 Ewa Piątkowska-Janko ACD 2 Piotr Bogorodzki G 1 Henryk Skarżyński Corresponding Author: Rafał Milner, e-mail: [email protected] Source of support: The study was supported by grant MSHE no N403 214939 Background: The neural underpinnings of auditory information processing have often been investigated using the odd-ball paradigm, in which infrequent sounds (deviants) are presented within a regular train of frequent stimuli (stan- dards). Traditionally, this paradigm has been applied using either high temporal resolution (EEG) or high spa- tial resolution (fMRI, PET). However, used separately, these techniques cannot provide information on both the location and time course of particular neural processes. The goal of this study was to investigate the neural correlates of auditory processes with a fine spatio-temporal resolution. A simultaneous auditory evoked po- tentials (AEP) and functional magnetic resonance imaging (fMRI) technique (AEP-fMRI), together with an odd- ball paradigm, were used. Material/Methods: Six healthy volunteers, aged 20–35 years, participated in an odd-ball simultaneous AEP-fMRI experiment. AEP in response to acoustic stimuli were used to model bioelectric intracerebral generators, and electrophysiolog- ical results were integrated with fMRI data. Results: fMRI activation evoked by standard stimuli was found to occur mainly in the primary auditory cortex. Activity in these regions overlapped with intracerebral bioelectric sources (dipoles) of the N1 component. Dipoles of the N1/P2 complex in response to standard stimuli were also found in the auditory pathway between the thal- amus and the auditory cortex. Deviant stimuli induced fMRI activity in the anterior cingulate gyrus, insula, and parietal lobes. Conclusions: The present study showed that neural processes evoked by standard stimuli occur predominantly in subcorti- cal and cortical structures of the auditory pathway. Deviants activate areas non-specific for auditory informa- tion processing. MeSH Keywords: auditory pathways • functional magnetic resonance imaging • central auditory system • auditory evoked potential Full-text PDF: http://www.medscimonit.com/download/index/idArt/889712 Authors’ Contribution: Study Design A Data Collection B Statistical Analysis C Data Interpretation D Manuscript Preparation E Literature Search F Funds Collection G 1 World Hearing Center, Institute of Physiology and Pathology of Hearing, Warsaw/Kajetany, Poland 2 Nuclear and Medical Electronics Division, Institute of Radioelectronics, Warsaw University of Technology, Warsaw, Poland e-ISSN 1643-3750 © Med Sci Monit, 2014; 20: 35-46 DOI: 10.12659/MSM.889712 35 Indexed in: [Current Contents/Clinical Medicine] [SCI Expanded] [ISI Alerting System] [ISI Journals Master List] [Index Medicus/MEDLINE] [EMBASE/Excerpta Medica] [Chemical Abstracts/CAS] [Index Copernicus] This work is licensed under a Creative Commons Attribution-NonCommercial-NoDerivs 3.0 Unported License PRELIMINARY REPORT

Welcome message from author
This document is posted to help you gain knowledge. Please leave a comment to let me know what you think about it! Share it to your friends and learn new things together.
Transcript
Received: 2013.08.23Accepted: 2013.10.11
Published: 2014.01.13
4199 3 6 71
Towards neural correlates of auditory stimulus processing: A simultaneous auditory evoked potentials and functional magnetic resonance study using an odd-ball paradigm
ABCDEF 1 Rafał Milner ABCDEF 1 Mateusz Rusiniak DEF 1 Monika Lewandowska ABCDE 1 Tomasz Wolak B 1 Małgorzata Ganc ACD 2 Ewa Piątkowska-Janko ACD 2 Piotr Bogorodzki G 1 Henryk Skarżyński
Corresponding Author: Rafał Milner, e-mail: [email protected] Source of support: The study was supported by grant MSHE no N403 214939
Background: The neural underpinnings of auditory information processing have often been investigated using the odd-ball paradigm, in which infrequent sounds (deviants) are presented within a regular train of frequent stimuli (stan-dards). Traditionally, this paradigm has been applied using either high temporal resolution (EEG) or high spa-tial resolution (fMRI, PET). However, used separately, these techniques cannot provide information on both the location and time course of particular neural processes. The goal of this study was to investigate the neural correlates of auditory processes with a fine spatio-temporal resolution. A simultaneous auditory evoked po-tentials (AEP) and functional magnetic resonance imaging (fMRI) technique (AEP-fMRI), together with an odd-ball paradigm, were used.
Material/Methods: Six healthy volunteers, aged 20–35 years, participated in an odd-ball simultaneous AEP-fMRI experiment. AEP in response to acoustic stimuli were used to model bioelectric intracerebral generators, and electrophysiolog-ical results were integrated with fMRI data.
Results: fMRI activation evoked by standard stimuli was found to occur mainly in the primary auditory cortex. Activity in these regions overlapped with intracerebral bioelectric sources (dipoles) of the N1 component. Dipoles of the N1/P2 complex in response to standard stimuli were also found in the auditory pathway between the thal-amus and the auditory cortex. Deviant stimuli induced fMRI activity in the anterior cingulate gyrus, insula, and parietal lobes.
Conclusions: The present study showed that neural processes evoked by standard stimuli occur predominantly in subcorti-cal and cortical structures of the auditory pathway. Deviants activate areas non-specific for auditory informa-tion processing.
MeSH Keywords: auditorypathways•functionalmagneticresonanceimaging•centralauditorysystem• auditory evoked potential
Full-text PDF: http://www.medscimonit.com/download/index/idArt/889712
Authors’ Contribution: Study Design A
Data Collection B Statistical Analysis CData Interpretation D
Manuscript Preparation E Literature Search FFunds Collection G
1 World Hearing Center, Institute of Physiology and Pathology of Hearing, Warsaw/Kajetany, Poland
2 Nuclear and Medical Electronics Division, Institute of Radioelectronics, Warsaw University of Technology, Warsaw, Poland
e-ISSN 1643-3750© Med Sci Monit, 2014; 20: 35-46
DOI: 10.12659/MSM.889712
35Indexed in: [Current Contents/Clinical Medicine] [SCI Expanded] [ISI Alerting System] [ISI Journals Master List] [Index Medicus/MEDLINE] [EMBASE/Excerpta Medica] [Chemical Abstracts/CAS] [Index Copernicus]
This work is licensed under a Creative CommonsAttribution-NonCommercial-NoDerivs 3.0 Unported License
PRELIMINARY REPORT
Background
An ability to select relevant auditory stimuli from our surround-ings is an important aspect of human behavior. One common-ly used experimental scheme for studying neural correlates of auditory processing is the odd-ball paradigm [1] in which a target acoustic stimulus (the deviant) is presented among fre-quent stimuli (the standard). The task is to respond (by press-ing a button or counting silently) to the deviants and ignore the standard sounds [2]. An odd-ball paradigm is designed to involve both perception and processing of auditory informa-tion at higher levels [2,3].
The neural basis of auditory information processing has been investigated using various methods [4–8]. One of these tech-niques is auditory evoked potentials (AEP), in which cortical responses to acoustic stimuli are registered [9–12]. It is well documented [10] that the morphology of AEP elicited by a stan-dard sound is different from the cortical response to a deviant. Accordingly, a standard stimulus (e.g. a pure tone) induces N1 and P2 components, which together constitute an N1/P2 com-plex. In response to deviants, N2 and P3 potentials are also observed, as well as N1 and P2 components [10,13]. Such dif-ferences in the morphology of AEP between deviant and stan-dard stimuli result from the involvement of different structures in the processing of each stimulus type [14].
Certain components of AEP are considered to be markers of sub-sequent processes engaged during the processing of a stimu-lus (see [2,15] for a review). Early components of AEP such as N1, P2, or N1/P2 complex are considered exogenous and reflect neural processes associated mainly with sensory and physical properties of the stimuli, or detection of nonspecific physical or semantic changes in the hearing environment [16]. In con-trast, later endogenous components are thought to be markers of cognitive processes allocated to the task [17]. According to recent theories, the P3 potential reflects attention and working memory-dependent processes of stimulus categorization [18–20], whereas the N2 component is related to the process of matching the incoming stimulus to its internally generated con-textual pattern, which occurs before the categorization [21,22]. In summary, odd-ball paradigms permit electrophysiological techniques to be used in a way that can separate the different neural processes associated with standard and deviant stimuli.
AEP can provide information about the timing of cortical acti-vations at different stages of auditory processing [13,17,18,22]. AEP allow insight into rapid neural processes because the tech-nique has high temporal resolution (in the range of millisec-onds) due to the way in which the electrical field changes are measured [13]. During recording of AEP, rapid changes in the electrical field, induced by neural activity, propagate immedi-ately from the involved brain area to the surface of the head.
Therefore, in an odd-ball paradigm the processing underlying each type of stimulus (standard or deviant) is immediately re-flected in the AEP [13,17].
Although EEG methods, including AEP, have high temporal res-olution, their spatial resolution is limited to a few centimeters [23]. This rather poor resolution comes from distortion of the electrical field while conducting through the skull and other brain tissues. So while AEP reflect the bioelectrical activity of particular brain structures, they are widely distributed on the surface of the head [24]. Consequently, EEG techniques can-not provide precise information on the location of particular stages of auditory processing.
To improve EEG spatial resolution it is necessary to sample the topographical distribution of particular AEP components at a sufficient density. For this purpose, a large number of elec-trodes – 32, 64, 128, or even 256 channels – have been used [25,26], enabling precise location of AEP bioelectrical sources. However, existence of an inverse problem makes the determi-nation of AEP generators difficult because a given surface map may have been produced by many possible source distributions. In other words, the inverse problem has no unique solution.
Intracerebral sources of particular AEP components can in the-ory be determined using various algorithms such as equivalent current dipoles (ECDs) or distributed source models [27,28]. A major limitation of the ECD technique is the requirement to make assumptions about the neural sources. ECDs usually assume that the underlying neuronal sources are focal. Such a supposition requires a thorough knowledge of neuroanat-omy and neurophysiology, and it is only reasonable for mo-tor or sensory processes that have a well-defined represen-tation in the brain. However, for widely distributed cognitive processes, source modeling becomes very complicated [13].
Distributed source models (e.g. LORETA and sLORETA) divide the source space into a grid containing many dipoles. The in-verse problem is to obtain the dipole moments for each grid node. As the number of unknown dipole moments is much greater than the number of electrodes, the inverse solution is highly underdetermined. In this technique, assumptions about the modeled EEG sources are not necessary [28,29], but the resulting distributions can be difficult to interpret because they only generate a blurred image of the neuronal source distribution. Neural sources modeling is constantly being de-veloped to provide more precise locations of the EEG genera-tors. However, all these techniques are very sensitive to signal distortion, and when the signal-to-noise ratio is low, source modeling is susceptible to errors [30].
In view of the limitations of EEG methods in determining the source of brain activity, functional magnetic resonance imaging
36Indexed in: [Current Contents/Clinical Medicine] [SCI Expanded] [ISI Alerting System] [ISI Journals Master List] [Index Medicus/MEDLINE] [EMBASE/Excerpta Medica] [Chemical Abstracts/CAS] [Index Copernicus]
Milner R. et al.: Simultaneous AEP-fMRI and auditory processing
© Med Sci Monit, 2014; 20: 35-46
This work is licensed under a Creative CommonsAttribution-NonCommercial-NoDerivs 3.0 Unported License
PRELIMINARY REPORT
(fMRI) has been used to study neural processes evoked by stan-dard and deviant acoustic stimuli (event-related fMRI) [31–36]. This technique is based on blood-oxygen level-dependent (BOLD) contrast, discovered by Ogawa [37], and is used to map neural activity in the brain with a high spatial resolution (a few millimeters). The technique relies on cerebral blood flow and neuronal activation being coupled. When a brain area is en-gaged in a task, blood flow to that region increases. Therefore, an fMRI study using an auditory odd-ball paradigm allows re-cording the BOLD signal from areas activated during the pro-cessing of standard and deviant stimuli. However, a limitation of the fMRI technique is its low temporal resolution. The re-sulting fMRI images show all brain structures activated during a whole cycle of hemodynamic response, which takes several seconds [37]. During this time many different neural process-es may occur and all of them are reflected in the fMRI images.
Taking all the above facts into consideration, investigation of rapid and complex neural processes is a methodological challenge. One approach to solving this problem is to com-bine 2 techniques, one with high spatial resolution and the other with high temporal resolution. For example, AEP re-cording can be performed simultaneously with MEG or PET [38,39], but most studies use a combination of AEP and fMRI methods. Combination of these techniques creates a power-ful tool for studying processing at different levels of the audi-tory pathway [40,41].
During the past several years, high spatio-temporal resolu-tion methods have been used to investigate the neural pro-cesses engaged in an auditory odd-ball task. However, most of these studies focus on the brain activities related to devi-ants [34,36,42,43]. Only a few authors have attempted to de-scribe processes and structures involved in both deviant and standard stimuli analysis [44,45], which appears to be a prom-ising approach to investigate the processes occurring at dif-ferent stages of the auditory system.
Here, we present the preliminary results of studies on neural correlates of stimulus processing in the auditory odd-ball par-adigm. Simultaneous AEP-fMRI technique was applied to mea-sure deviant and standard induced brain activity, with good spatial and temporal resolution. Both AEP-fMRI method and an experimental procedure may be used to investigate audi-tory information processing at different levels of the central nervous system in clinical samples.
Material and Methods
The AEP-fMRI study was conducted at the Bioimaging Research Center of the Institute of Physiology and Pathology of Hearing in Warsaw, Poland.
Subjects
Six young adults (5 male and 1 female), aged 22 to 35 years, participated in the study. All subjects had normal hearing lev-els in both ears (below 20 dB HL for 125, 250, 500, 750, 1000, 1500, 2000, 4000, and 8000 Hz), relatively good health, were right-handed (Edinburgh Handedness Inventory [46]) and re-ported no history of neuropsychiatric disorders.
General exclusion criteria for AEP-fMRI study are ferromag-netic objects in the body and claustrophobia. During simulta-neous registration of AEP and fMRI, signal subjects are asked to lie down in the same position in a limited space for about half an hour. For this reason, the AEP-fMRI procedure is not recommended for pregnant women, very young children, per-sons with hyperactivity, or those more prone to fatigue (e.g. elderly people and post-stroke patients).
Each subject provided written informed consent prior to the study. The study was performed in accordance with the Declaration of Helsinki and was approved by the local eth-ics committee.
Subject preparation and data acquisition procedure
The main AEP- fMRI study was preceded by certain prepara-tory activities such as the attachment of electrodes (mount-ed in a special cap) to the subject’s head, application of a gel to the electrodes to improve the conduction of electrical im-pulses, measurement of impedance of the electrodes, and, fi-nally, placing the subject in an MRI scanner. The preparation procedure took about 30 min.
The AEP-fMRI study consisted of 2 parts: acquisition of ana-tomical images of the whole brain and simultaneous registra-tion of AEP and fMRI signal in response to presented auditory stimuli. The entire AEP-fMRI study (including preparation proce-dure) lasted about 30 min. After completing the AEP-fMRI study, each subject had a short (15–20 min) time to rest. Then, AEP registration was performed outside an MR scanner room which took approximately 10 min. The entire procedure took 1.5 h.
Experimental paradigm
A modified auditory odd-ball paradigm was used to acquire AEP inside an MRI scanner (Figure 1). Pure sinusoidal 100-ms tones of different frequency (1 and 2 kHz) were delivered binaurally via electrostatic headphones at 80 dBA hearing level. The stimuli were presented in 2 alternating 30-s blocks: 1) a standard and 2) an odd-ball block. There were 10 repetitions of each block. The standard block consisted of ten 1-kHz tones, whereas the odd-ball block consisted of three 2-kHz tones (deviants) and sev-en 1-kHz tones (standards) presented in pseudo-random order.
37Indexed in: [Current Contents/Clinical Medicine] [SCI Expanded] [ISI Alerting System] [ISI Journals Master List] [Index Medicus/MEDLINE] [EMBASE/Excerpta Medica] [Chemical Abstracts/CAS] [Index Copernicus]
Milner R. et al.: Simultaneous AEP-fMRI and auditory processing© Med Sci Monit, 2014; 20: 35-46
This work is licensed under a Creative CommonsAttribution-NonCommercial-NoDerivs 3.0 Unported License
PRELIMINARY REPORT
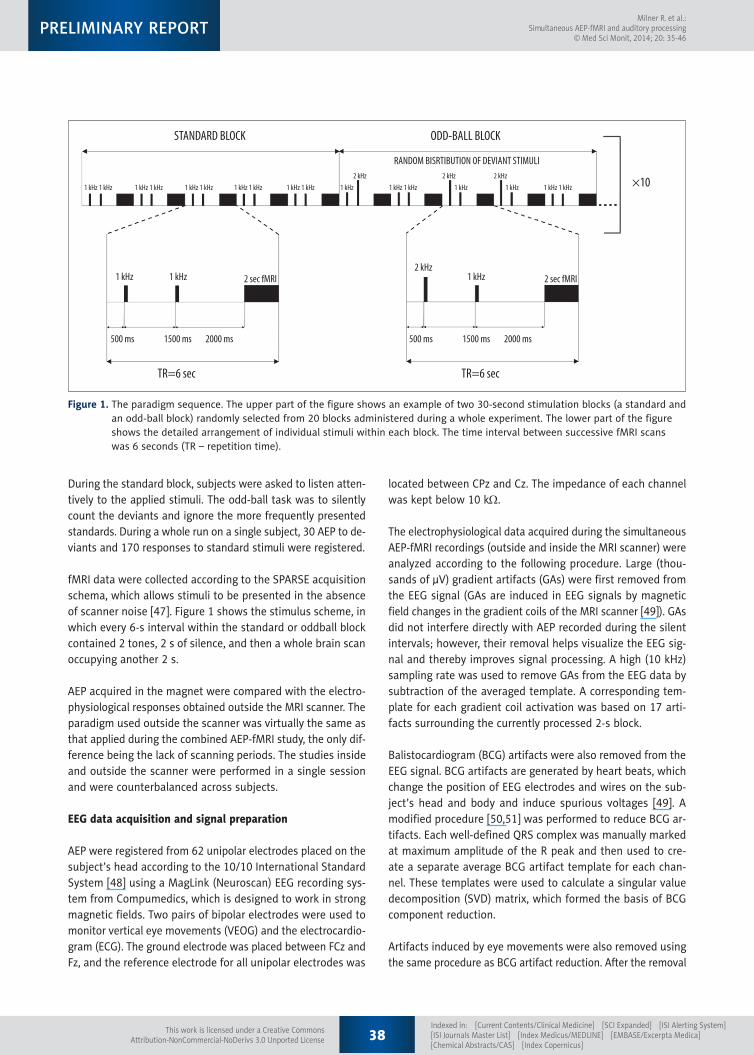
During the standard block, subjects were asked to listen atten-tively to the applied stimuli. The odd-ball task was to silently count the deviants and ignore the more frequently presented standards. During a whole run on a single subject, 30 AEP to de-viants and 170 responses to standard stimuli were registered.
fMRI data were collected according to the SPARSE acquisition schema, which allows stimuli to be presented in the absence of scanner noise [47]. Figure 1 shows the stimulus scheme, in which every 6-s interval within the standard or oddball block contained 2 tones, 2 s of silence, and then a whole brain scan occupying another 2 s.
AEP acquired in the magnet were compared with the electro-physiological responses obtained outside the MRI scanner. The paradigm used outside the scanner was virtually the same as that applied during the combined AEP-fMRI study, the only dif-ference being the lack of scanning periods. The studies inside and outside the scanner were performed in a single session and were counterbalanced across subjects.
EEG data acquisition and signal preparation
AEP were registered from 62 unipolar electrodes placed on the subject’s head according to the 10/10 International Standard System [48] using a MagLink (Neuroscan) EEG recording sys-tem from Compumedics, which is designed to work in strong magnetic fields. Two pairs of bipolar electrodes were used to monitor vertical eye movements (VEOG) and the electrocardio-gram (ECG). The ground electrode was placed between FCz and Fz, and the reference electrode for all unipolar electrodes was
located between CPz and Cz. The impedance of each channel was kept below 10 kΩ.
The electrophysiological data acquired during the simultaneous AEP-fMRI recordings (outside and inside the MRI scanner) were analyzed according to the following procedure. Large (thou-sands of µV) gradient artifacts (GAs) were first removed from the EEG signal (GAs are induced in EEG signals by magnetic field changes in the gradient coils of the MRI scanner [49]). GAs did not interfere directly with AEP recorded during the silent intervals; however, their removal helps visualize the EEG sig-nal and thereby improves signal processing. A high (10 kHz) sampling rate was used to remove GAs from the EEG data by subtraction of the averaged template. A corresponding tem-plate for each gradient coil activation was based on 17 arti-facts surrounding the currently processed 2-s block.
Balistocardiogram (BCG) artifacts were also removed from the EEG signal. BCG artifacts are generated by heart beats, which change the position of EEG electrodes and wires on the sub-ject’s head and body and induce spurious voltages [49]. A modified procedure [50,51] was performed to reduce BCG ar-tifacts. Each well-defined QRS complex was manually marked at maximum amplitude of the R peak and then used to cre-ate a separate average BCG artifact template for each chan-nel. These templates were used to calculate a singular value decomposition (SVD) matrix, which formed the basis of BCG component reduction.
Artifacts induced by eye movements were also removed using the same procedure as BCG artifact reduction. After the removal
Figure 1. The paradigm sequence. The upper part of the figure shows an example of two 30-second stimulation blocks (a standard and an odd-ball block) randomly selected from 20 blocks administered during a whole experiment. The lower part of the figure shows the detailed arrangement of individual stimuli within each block. The time interval between successive fMRI scans was 6 seconds (TR – repetition time).
STANDARD BLOCK
TR=6 sec TR=6 sec
ODD-BALL BLOCK
×10
1 kHz 1 kHz
500 ms 1500 ms 2000 ms 500 ms 1500 ms 2000 ms
2 sec fMRI 2 sec fMRI1 kHz2 kHz
1 kHz 1 kHz 1 kHz 1 kHz 1 kHz 1 kHz 1 kHz 1 kHz 1 kHz 1 kHz 1 kHz 1 kHz 1 kHz 1 kHz1 kHz 1 kHz1 kHz2 kHz 2 kHz 2 kHz
RANDOM BISRTIBUTION OF DEVIANT STIMULI
38Indexed in: [Current Contents/Clinical Medicine] [SCI Expanded] [ISI Alerting System] [ISI Journals Master List] [Index Medicus/MEDLINE] [EMBASE/Excerpta Medica] [Chemical Abstracts/CAS] [Index Copernicus]
Milner R. et al.: Simultaneous AEP-fMRI and auditory processing
© Med Sci Monit, 2014; 20: 35-46
This work is licensed under a Creative CommonsAttribution-NonCommercial-NoDerivs 3.0 Unported License
PRELIMINARY REPORT

of artifacts, standard AEP analysis was conducted. The record-ing window consisted of a 100-ms pre-stimulus period and a 750-ms post-stimulus time. Baseline correction and band-pass filtering (1–30 Hz, 12 dB/octave, no phase shift) of each epoch was performed and the signal was averaged.
Study design and fMRI data analysis
The fMRI study was performed using a high-field (3T) Siemens Magnetom Trio Tim MRI scanner. The scanning function had the following parameters: T2 single-shot echo-planar imag-ing, EPI sequence, voxel size =3×3×4 mm, 32 axial slices, rep-etition time (TR) =6000 ms, echo time (TE) =30 ms, acquisi-tion time (TA) =10 min.
For structural imaging, a T1 inversion recovery sequence with the following parameters was used: voxel size =0.9×0.9×0.9 mm, 208 sagittal slices, repetition time (TR)=1900 ms, echo time (TE)=2.21 ms, inversion time (TI)=900 ms, and acquisi-tion time (TA)=5 min.
fMRI data obtained during simultaneous fMRI-EEG signal recording was analyzed in the SPM8 toolbox for MATLAB. Preprocessing of the brain images included movement cor-rection (first volume was used as the reference image), co-registration with the subject’s structural brain image, and smoothing using a Gaussian spatial filter with voxel FWHM of 6 mm. A general linear model (GLM) and a high-pass fil-ter with a period of 128 s were used to analyze BOLD signal changes. Additionally, hemodynamic response function (HRF) modeling was applied.
For each subject, the standard vs. deviant and deviant vs. stan-dard contrasts were calculated (the first-level analysis). Then, a 1-sample t test (p-value threshold ≤0.01) was applied for group data analysis (the second-level analysis).
3D spatial current distribution modeling and intracerebral AEP source analysis
A brain-mapping technique was used to model the spatial distribution of AEP voltages [52]. Modeling was done on the bioelectric responses recorded from all electrodes during ses-sions outside and inside the MRI scanner. Three-dimensional distribution maps of particular AEP components were calcu-lated and projected onto virtual and real head models (the lat-ter created from MRI images of the subjects).
The 3D voltage distribution maps and AEP recorded from all 62 electrodes during the combined AEP-fMRI study were used to localize the intracerebral sources (dipoles) of evoked responses. Two different methods – rotating and moving di-poles – were used to calculate AEP generators [30]. Dipoles
of subsequent components visible in the AEP to standard and deviant stimuli were modeled separately. To specify the AEP generators, time intervals during which the mean global field power (MGFP) of the modeled components reached maximum values were used. To fix the number of sources to be mod-eled, independent component analysis (ICA) was applied to signals in each of the predefined time ranges. The number of ICA components that explained the majority of the AEP vari-ance was assumed to be the number of intracerebral sources for each modeled component.
Calculation of spatial distribution and intracerebral sourc-es (generators) of AEP was done using Curry 6.0 software (Compumedics Neuroscan, Charlotte, NC).
Combining AEP and fMRI results
The same Curry 6.0 software was also used to combine the electrophysiological and fMRI data. The dipoles of particular AEP components uncovered by the intracerebral source anal-ysis were combined with fMRI hemodynamic activation data.
Results
The results of AEP and fMRI analyses were integrated to pro-vide data with high spatial and temporal resolution.
Brain response to deviant stimuli
Figure 2 shows the average AEP to deviants averaged across all subjects. It presents electrode responses recorded during simultaneous AEP-fMRI (grey lines) compared to cortical re-sponses obtained outside the MRI scanner (black lines). Outside the scanner, N1, P2, and P3 (P300) components could be ob-served in all study subjects. However, inside the magnet these components had smaller amplitudes and, as Figure 2 shows, could be clearly distinguished, predominantly at central elec-trodes. Mean amplitudes and latencies of individual response components for deviant tones measured at C3 electrode are shown in Table 1.
Deviant stimuli activated bilateral insula and inferior parietal lobule as well as left anterior cingulate gyrus (Table 2).
Brain response to standard stimuli
AEP to standard stimuli inside and outside the MRI scanner had a similar morphology at all electrodes (Figure 3). Specifically, N1 and P2 components were observed in both conditions. Latencies of the components were comparable, but the am-plitudes were higher outside the magnet than inside (Table 3). Moreover, distribution of N1 and P2 amplitudes, acquired
39Indexed in: [Current Contents/Clinical Medicine] [SCI Expanded] [ISI Alerting System] [ISI Journals Master List] [Index Medicus/MEDLINE] [EMBASE/Excerpta Medica] [Chemical Abstracts/CAS] [Index Copernicus]
Milner R. et al.: Simultaneous AEP-fMRI and auditory processing© Med Sci Monit, 2014; 20: 35-46
This work is licensed under a Creative CommonsAttribution-NonCommercial-NoDerivs 3.0 Unported License
PRELIMINARY REPORT

during the simultaneous AEP-fMRI study, matched the topog-raphy of the corresponding components recorded outside the MRI scanner. Topographies of the N1 and P2 amplitudes reg-istered inside and outside the MRI scanner were similar to those observed outside the MRI scanner (Figure 4 shows the distribution of amplitudes laid out on the virtual head model).
The AEP of individual subjects recorded inside the MRI scan-ner in response to standard stimuli were used to model the dipoles (intracerebral sources of bioelectric activity) of the N1 component. The procedure began from an AEP amplitude dis-tribution plotted on the surface of a real head model created from an MRI image of the subject. Figure 5B presents an exam-ple of an N1 component amplitude distribution mapped onto a model of a subject’s head. The sources of the N1 component were calculated using the method of rotating dipoles [30]. This technique reduces the location of intracerebral sources to fixed points inside the brain space, but allows for changes in ori-entation and strength of the dipoles. Based on the results of ICA analysis, 2 symmetrical sources of N1 were modeled. The dipoles were calculated within the latency range in which the MGFP of the N1 component reaches its maximal value. Figure 5A shows the results of such analysis, revealing 2 separate N1 generators located near the primary auditory cortex.
The intracerebral sources of the N1/P2 complex evoked by standard stimuli were also modeled using the moving dipoles
Figure 2. Auditory evoked potentials to deviant stimuli (2000 Hz) recorded from 64 electrodes and averaged across all subjects. Grey lines show AEP recorded during the AEP-fMRI study inside the MRI scanner, with black lines showing AEP registered outside the scanner. The enlarged window shows detail of the N1, P2, and P3 components recorded at the C3 electrode.
12.5
10.0
7.5
5.0
2.5
0
–2.5
–5.0
–7.5
–10.0
–12.0–100.0 100.0 200.0 300.0
ms400.0 500.0 600.0 700.00
µV
FP2 FP2
AF8
AF4
F4F6
F8
F2
CZ
C3
P2181 ms
P3344 ms
N194 ms
C2 C4 C6 T8
TP7
CP5CP3 CPI CP2 CP4
CP6TP8
M1 P7
P5
PO7
PO5
PO3 POZ PO4
PO6
PO8O1 O2OZ
P3 P1 PZ P2 P4P6
P8 M2
FC2 FC4 FC6FT8
Auditory evoked potential
component
Mean value of AEP parameter obtained outside MRI scanner
Amplitude Latency
N1 –4.5 V (±1.5) 109.8 ms (±5.6)
P2 5.5 V (±1.2) 186.5 ms (±5.0)
P3 6.5 V (±2.8) 332.4 ms (±20.4)
Table 1. Mean amplitudes and latencies of AEP to 2000 Hz deviant stimuli recorded at the C3 electrode during measurements outside the MRI scanner.
40Indexed in: [Current Contents/Clinical Medicine] [SCI Expanded] [ISI Alerting System] [ISI Journals Master List] [Index Medicus/MEDLINE] [EMBASE/Excerpta Medica] [Chemical Abstracts/CAS] [Index Copernicus]
Milner R. et al.: Simultaneous AEP-fMRI and auditory processing
© Med Sci Monit, 2014; 20: 35-46
This work is licensed under a Creative CommonsAttribution-NonCommercial-NoDerivs 3.0 Unported License
PRELIMINARY REPORT
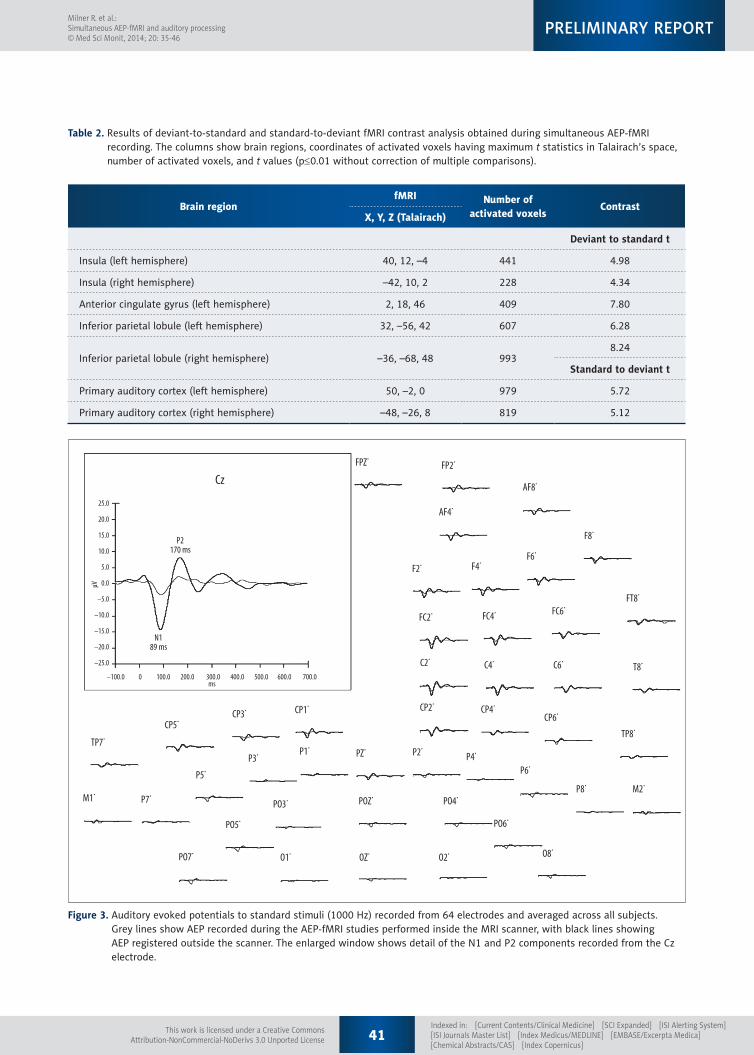
Figure 3. Auditory evoked potentials to standard stimuli (1000 Hz) recorded from 64 electrodes and averaged across all subjects. Grey lines show AEP recorded during the AEP-fMRI studies performed inside the MRI scanner, with black lines showing AEP registered outside the scanner. The enlarged window shows detail of the N1 and P2 components recorded from the Cz electrode.
25.0
20.0
15.0
10.0
5.0
0.0
–5.0
–10.0
–15.0
–20.0
–25.0
–100.0 100.0 200.0 300.0ms
400.0 500.0 600.0 700.00
µV
FPZ·FP2·
AF8·
AF4·
F8·
F6·F4·
F2·
FC2· FC4· FC6·FT8·
T8·C6·C4·C2·
CP2· CP4·CP6·
TP8·TP7·
CP5·CP3· CP1·
P7·PO3· POZ· PO4·
PO6·
O1· OZ· O2· O8·
PO5·
PO7·
P5·P3· P1· PZ· P2·
P4·
P6·
P8· M2·M1·
Cz
P2170 ms
N189 ms
Brain regionfMRI Number of
activated voxelsContrast
X, Y, Z (Talairach)
Deviant to standard t
Insula (left hemisphere) 40, 12, –4 441 4.98
Insula (right hemisphere) –42, 10, 2 228 4.34
Anterior cingulate gyrus (left hemisphere) 2, 18, 46 409 7.80
Inferior parietal lobule (left hemisphere) 32, –56, 42 607 6.28
Inferior parietal lobule (right hemisphere) –36, –68, 48 9938.24
Standard to deviant t
Primary auditory cortex (left hemisphere) 50, –2, 0 979 5.72
Primary auditory cortex (right hemisphere) –48, –26, 8 819 5.12
Table 2. Results of deviant-to-standard and standard-to-deviant fMRI contrast analysis obtained during simultaneous AEP-fMRI recording. The columns show brain regions, coordinates of activated voxels having maximum t statistics in Talairach’s space, number of activated voxels, and t values (p≤0.01 without correction of multiple comparisons).
41Indexed in: [Current Contents/Clinical Medicine] [SCI Expanded] [ISI Alerting System] [ISI Journals Master List] [Index Medicus/MEDLINE] [EMBASE/Excerpta Medica] [Chemical Abstracts/CAS] [Index Copernicus]
Milner R. et al.: Simultaneous AEP-fMRI and auditory processing© Med Sci Monit, 2014; 20: 35-46
This work is licensed under a Creative CommonsAttribution-NonCommercial-NoDerivs 3.0 Unported License
PRELIMINARY REPORT

technique. All parameters of the dipoles, including locations, were allowed to vary [30]. The moving dipoles method con-firmed the results of the rotating dipoles technique (ie, 2 sym-metrical dipoles of the N1/P2 complex were modeled). The N1/P2 generators (calculated at times within the N1/P2 latency of 50–120 ms) were located in brain regions where subsequent stages of information processing take place. These regions are part of the auditory pathway between the thalamus and au-ditory cortex (Figure 6A–6C). It is noteworthy that fMRI data also indicates activation of the primary auditory cortex in re-sponse to standard stimuli (Table 2).
To obtain data displaying both good temporal and spatial res-olution, results of the moving dipole analysis of the N1/P2 complex were integrated with the fMRI outcomes. The N1/P2 generators were superimposed on the MRI images and then compared with the fMRI activations in response to the same
Outside MRI scanner room
Inside MRI scanner room
Mean amplitude of AEP component
N1 –13.8 uV (±1.2) –7.3 uV (±2.1)
P2 6.07 uV (±1.0) 4.07 uV (±1.5)
Mean latency of AEP component
N1 85.90 ms (±5.1) 92.0 ms (±6.3)
P2 166.7 ms (±4.7) 167.2 ms (±5.1)
Table 3. Mean amplitudes and latencies of AEP generated in response to 1000 Hz standard stimuli and recorded at the Cz electrode while outside the MRI scanner (left column) and during simultaneous AEP-fMRI (right).
Figure 4. Scalp distributions of N1 and P2 amplitudes superimposed on a virtual head and calculated from signals recorded from all electrodes both outside (top) and inside (bottom) the MRI scanner. Images show the distributions of average AEP to standard stimuli calculated from data of all (6) subjects.
42Indexed in: [Current Contents/Clinical Medicine] [SCI Expanded] [ISI Alerting System] [ISI Journals Master List] [Index Medicus/MEDLINE] [EMBASE/Excerpta Medica] [Chemical Abstracts/CAS] [Index Copernicus]
Milner R. et al.: Simultaneous AEP-fMRI and auditory processing
© Med Sci Monit, 2014; 20: 35-46
This work is licensed under a Creative CommonsAttribution-NonCommercial-NoDerivs 3.0 Unported License
PRELIMINARY REPORT
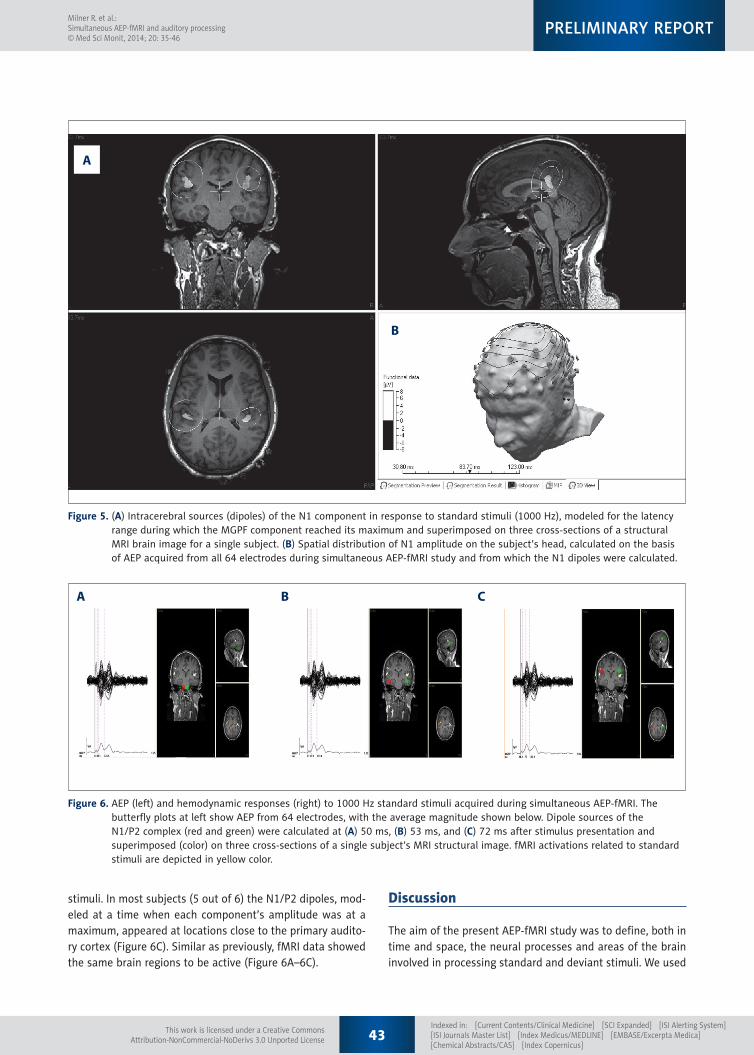
stimuli. In most subjects (5 out of 6) the N1/P2 dipoles, mod-eled at a time when each component’s amplitude was at a maximum, appeared at locations close to the primary audito-ry cortex (Figure 6C). Similar as previously, fMRI data showed the same brain regions to be active (Figure 6A–6C).
Discussion
The aim of the present AEP-fMRI study was to define, both in time and space, the neural processes and areas of the brain involved in processing standard and deviant stimuli. We used
A
B
Figure 5. (A) Intracerebral sources (dipoles) of the N1 component in response to standard stimuli (1000 Hz), modeled for the latency range during which the MGPF component reached its maximum and superimposed on three cross-sections of a structural MRI brain image for a single subject. (B) Spatial distribution of N1 amplitude on the subject’s head, calculated on the basis of AEP acquired from all 64 electrodes during simultaneous AEP-fMRI study and from which the N1 dipoles were calculated.
B CA
Figure 6. AEP (left) and hemodynamic responses (right) to 1000 Hz standard stimuli acquired during simultaneous AEP-fMRI. The butterfly plots at left show AEP from 64 electrodes, with the average magnitude shown below. Dipole sources of the N1/P2 complex (red and green) were calculated at (A) 50 ms, (B) 53 ms, and (C) 72 ms after stimulus presentation and superimposed (color) on three cross-sections of a single subject’s MRI structural image. fMRI activations related to standard stimuli are depicted in yellow color.
43Indexed in: [Current Contents/Clinical Medicine] [SCI Expanded] [ISI Alerting System] [ISI Journals Master List] [Index Medicus/MEDLINE] [EMBASE/Excerpta Medica] [Chemical Abstracts/CAS] [Index Copernicus]
Milner R. et al.: Simultaneous AEP-fMRI and auditory processing© Med Sci Monit, 2014; 20: 35-46
This work is licensed under a Creative CommonsAttribution-NonCommercial-NoDerivs 3.0 Unported License
PRELIMINARY REPORT
results should be <4 [68,69]. In our study, SNR for AEP to de-viants was below this value, so in this case we decided to not interpret the results of modeling of AEP generators. Low SNR in EEG signal recorded in the magnet in responses to deviants might be caused by specific experimental conditions during si-multaneous AEP and fMRI data registration; a high magnetic field induces specific artifacts in EEG signal leads to decreas-ing SNR ratio [70]. Moreover, the relatively small number of deviants (n=30) applied in our odd-ball paradigm most likely contributed to a low SNR value. Presentation of more deviant stimuli would, however, significantly extend the testing time inside an MRI scanner, leading to subject fatigue and decreas-ing motivation to perform the auditory task [71]. A number of infrequent stimuli used in our odd-ball paradigm theoretically should enable modeling AEP generators, but, unfortunately, it turned out to be insufficient. Therefore, we suggest an increased number of deviants and perhaps some modifications of an ex-perimental protocol in an AEP-fMRI procedure. Such improve-ments would allow for more pronounced brain (bioelectrical and hemodynamic) responses and a relatively short testing time. In this case, a paradigm could be suitable not only for young adults but also for children, elderly people, and clinical trials.
Conclusions
The presented AEP-fMRI odd-ball paradigm allows examina-tion of the neural processes related to analysis of deviant and standard stimuli, with high spatio-temporal resolution. In re-sponses to deviant stimuli, we found activations in the cortical regions not directly involved in the central auditory processes, whereas both low (subcortical) and high (cortical) levels of the auditory system were engaged in the standards processing.
A method of simultaneous AEP and fMRI signal registrations combines fMRI`s ability to precisely locate the blood dynam-ics in the whole brain with the electrophysiological ability to characterize rapid neural processes and to reveal pathological patterns. Therefore, our AEP-fMRI study might provide clini-cally useful information about the functioning of the central auditory system.
Because of the prolonged testing time inside an MRI scanner and the complexity of the procedure, we recommended the presented odd-ball paradigm for adult and relatively coopera-tive patients. However, this protocol, after small modifications, might also be adapted to investigate central auditory informa-tion processing in clinical trials.
Acknowledgments
The authors are grateful to Andrew Bell for valuable comments on the paper. We also would like to thank Wiktor Wiesław
an auditory odd-ball paradigm, and AEP evoked by 1000 Hz (standard) and 2000 Hz (deviant) tones were recorded simul-taneously with hemodynamic (fMRI) responses triggered by these 2 stimulus types.
We obtained bioelectrical (AEP) responses to standard and de-viant stimuli, and the morphology of individual AEP compo-nents and their parameters (amplitude and latency) to both these stimulus types were compared to AEP evoked by the same stimuli outside the MRI scanner (Figures 2, 3). AEP com-ponents induced inside the scanner had smaller amplitudes compared to those outside the scanner room. Others have also found similar reductions [53–55], and one possibility is that this might be due to constant activation of the auditory cor-tex from noise generated by the MRI gradient coils (approxi-mately 99 dB SPL) [53].
Our AEP-fMRI study showed that electroencephalographic re-sponses to standard stimuli were localized to the primary au-ditory cortex (Figures 5A, 6C and Table 2). These results are in accordance with reports on neural processes evoked by stan-dard stimuli using both fMRI [56,57] and simultaneous AEP-fMRI [44,45,51]. In our studies, the primary auditory cortex was stimulated by frequent acoustic stimuli presented in an odd-ball paradigm. In contrast to standard stimuli, deviants activated structures that are not part of the central auditory system (ie, the inferior parietal lobule, anterior cingulate gy-rus, and insula (Table 2). Similar brain activations have been found in previous studies using experimental paradigms that involved cognitive or emotional processes [58,59]. Such stud-ies used AEP, fMRI, and either simultaneous AEP-fMRI or VEP-fMRI to determine P3 generators [34,60–62]. Previous work has also indicated that the inferior parietal lobule is engaged in tasks requiring decision making [63] and has been consid-ered to play important role in visuo-motor integration and spa-tial perception [64], emotion recognition [65], language [66], and mathematical reasoning [67].
In response to standard stimuli, our study was able to locate the intracerebral bioelectrical generators of individual com-ponents of the AEP. We used the moving and rotating dipoles techniques, and both methods provide results corresponded with the fMRI findings. Obtained locations of the intracerebral bioelectrical generators were also congruent with the results reported by other authors [45,51]. However, the deviant tones work was a different matter – when we attempted to deter-mine the generators of the N1, P2 or N1/P2 complex, and P3 using such stimuli, and combine them with fMRI and MRI data, locations of the modeled dipoles did not completely overlap with fMRI activations. This effect might result from a low sig-nal-to-noise ratio in AEP in responses to deviants. A minimal signal-to-noise ratio (SNR) in the EEG signals used for model-ing the intracerebral bioelectrical generator to achieve reliable
44Indexed in: [Current Contents/Clinical Medicine] [SCI Expanded] [ISI Alerting System] [ISI Journals Master List] [Index Medicus/MEDLINE] [EMBASE/Excerpta Medica] [Chemical Abstracts/CAS] [Index Copernicus]
Milner R. et al.: Simultaneous AEP-fMRI and auditory processing
© Med Sci Monit, 2014; 20: 35-46
This work is licensed under a Creative CommonsAttribution-NonCommercial-NoDerivs 3.0 Unported License
PRELIMINARY REPORT
Jedrzejczak, Agnieszka Pluta, and Kinga Wolujewicz for review-ing this article and making helpful suggestions.
Declaration of interest
The authors report no conflicts of interest. The authors alone are responsible for the content and writing of the paper.
References:
1. Squires NK, Squires KC, Hillyard SA. Two varieties of long-latency positive waves evoked by unpredictable auditory stimuli in man. Electroencephalogr Clin Neurophysiol, 1975; 38: 387–401
2. Eichele T: Electrophysiological and Hemodynamic Correlates of Expectancy in Target Processing. 2007. PhD Thesis. The University of Bergen. Available from: http://hdl.handle.net/1956/2509
3. Mangalathu Arumana J: Integration of EEG-fMRI in an auditory oddball par-adigm using joint independent component analysis. 2012. Available from: http: //epublications.marquette.edu/cgi/viewcontent.cgi?article=1212&context=dissertations_mu
4. Lalaki P, Hatzopoulos S, Lorito G et al: A connection between the Efferent Auditory System and Noise-Induced Tinnitus Generation. Reduced contra-lateral suppression of TEOAEs in patients with noise-induced tinnitus. Med Sci Monit, 2011; 17(7): MT56–62
5. Bembich S, Demarini S, Clarici A et al: Non-invasive assessment of hemi-spheric language dominance by optical topography during a brief passive listening test: A pilot study. Med Sci Monit, 2011; 17(12): CR692–97
6. Allendorfer J, Kissela B, Holland S, Szaflarski J: Different patterns of language activation in post-stroke aphasia are detected by overt and covert versions of the verb generation fMRI task. Med Sci Monit, 2012; 18(3): CR135–47
7. Raumane D, Kise L, Logina I: Auditory Behavioural and Electrophysiological Responses in Adults: Evaluating Central Auditory Processing. Journal of Hearing Science, 2013; 3(1): 9–17
8. Skarżyński PH, Wolak T, Skarzyński H et al: Application of the function-al Magnetic Resonance Imaging (fMRI) for the Assessment of the Primary Auditory Cortex Function in Partial Deafness Patients – A preliminary study. Journal of International Advanced Otology, 2013; 9(2): 153–60
9. Segalowitz SJ, Barnes KL: The reliability of ERP components in the audito-ry odd-ball paradigm. Psychophysiology, 1993; 30: 451–59
10. McPherson DL, Ballachanda BB, Kaf W: Middle and long latency auditory evoked potentials. Audiology Diagnosis 2nd ed. New York: Thieme, 2007; 443–78
11. Hatzopoulos S, Petruccelli J, Śliwa L et al: Hearing threshold prediction with Auditory Steady State Responses and estimation of correction functions to compensate for differences with behavioral data, in adult subjects. Part 1: Audera and CHARTR EP devices. Med Sci Monit, 2012; 18(7): MT47–53
12. Trzaskowski B, Jedrzejczak WW, Pilka E et al: Automatic removal of sono-motor waves from auditory brainstem responses. Comput Biol Med, 2013; 43(5): 524–32
13. Luck SJ: An introduction to the event-related potential technique (cogni-tive neuroscience). 1st ed. Cambridge: The MIT Press, 2005
14. Wunderlich JL, Cone-Wesson BK: Maturation of CAEP in infants and chil-dren: a review. Hear Res, 2006; 212: 212–23
15. Kotchoubey B: Event-related potentials, cognition, and behavior: a biolog-ical approach. Neurosci Biobehav Rev, 2006; 30: 42–65
16. Näätänen R, Picton T: The N1 wave of the human electric and magnetic response to sound: a review and an analysis of the component structure. Psychophysiology, 1987; 24: 375–425
17. Fabiani M, Gratton G, Coles MGH: Event related brain potentials: meth-ods, theory and applications. In: Cacioppo J, Tassinary L, Berntson G (eds.), Handbook of Psychophysiology. 3rd ed. New York: Cambridge University Press, 2007; 53–84
18. Polich J: Theoretical overview of P3a and P3b. In: Polich J (ed.), Detection of Change: Event-Related Potential and fMRI findings. 1st ed. Massachusetts: Kluwer Academic Publishers, 2003; 83–98
19. Polich J: Updating P300: an integrative theory of P3a and P3b. Clin Neurophysiol Off J Int Fed Clin Neurophysiol, 2007; 118: 2128–48
20. Pąchalska M, Kropotov ID, Mańko G et al: Evaluation of a neurotherapy program for a child with ADHD with Benign Partial Epilepsy with Rolandic Spikes (BPERS) using event-related potentials. Med Sci Monit, 2012; 18(11): CS94–104
21. Näätänen R, Simpson M, Loveless NE: Stimulus deviance and evoked po-tentials. Biol Psychol, 1982; 14: 53–98
22. Näätänen R: Attention and brain function. 1st ed. Hillsdale (NJ): Lawrence Erlbaum, 1992
23. Freeman WJ, Holmes MD, Burke BC, Vanhatalo S: Spatial spectra of scalp EEG and EMG from awake humans. Clin Neurophysiol, 2003; 114(6): 1053–68
24. Nunez PL: Electric fields of the brain: the neurophysics of EEG. 2nd ed. Oxford: Oxford University Press, 2006
25. Michel CM, Lantz G, Spinelli L et al: 128-channel EEG source imaging in ep-ilepsy: clinical yield and localization precision. J Clin Neurophysiol, 2004; 21: 71–83
26. Slotnick SD: High Density Event-related Potential Data Acquisition in Cognitive Neuroscience. J Vis Exp, 2010; 38: 1945
27. Scherg M: Fundamentals of dipole source potential analysis. Audit Evoked Magn Fields Electr Potentials Adv Audiol, 1990; 6: 40–69
28. Pascual-Marqui RD, Michel CM, Lehmann D: Low resolution electromagnet-ic tomography: a new method for localizing electrical activity in the brain. Int J Psychophysiol, 1994; 18: 49–65
29. Pascual-Marqui RD: Standardized low-resolution brain electromagnetic to-mography (sLORETA): technical details. Methods Find Exp Clin Pharmacol, 2002; 24: 5–12
30. Pizzagalli DA: Electroencephalography and high-density electrophysiological source localization. In: Cacioppo J, Tassinary L, Berntson G (eds.), Handbook of Psychophysiology. 3rd ed.New York: Cambridge University Press, 2007; 56–84
31. Casey BJ, Forman SD, Franzen P et al: Sensitivity of prefrontal cortex to changes in target probability: a functional MRI study. Hum Brain Mapp, 2001; 13: 26–33
32. Clark VP, Fannon S, Lai S et al: Responses to rare visual target and distrac-tor stimuli using event-related fMRI. J Neurophysiol, 2000; 83: 3133–39
33. Kirino E, Belger A, Goldman-Rakic P, McCarthy G: Prefrontal activation evoked by infrequent target and novel stimuli in a visual target detec-tion task: an event-related functional magnetic resonance imaging study. J Neurosci, 2000; 20: 6612–18
34. Linden DE, Prvulovic D, Formisano E et al: The functional neuroanatomy of target detection: an fMRI study of visual and auditory odd-ball tasks. Cereb Cortex, 1999; 9: 815–23
35. Mccarthy G, Luby M, Gore J, Goldman-Rakic P: Infrequent events transient-ly activate human prefrontal and parietal cortex as measured by function-al MRI. J Neurophysiol, 1997; 77: 1630–34
36. Stevens AA, Skudlarski P, Gatenby JC, Gore JC: Event-related fMRI of audi-tory and visual odd-ball tasks. Magn Reson Imaging, 2000; 18: 495–502
37. Ogawa S, Lee T-M, Nayak AS, Glynn P: Oxygenation-sensitive contrast in magnetic resonance image of rodent brain at high magnetic fields. Magn Reson Med, 1990; 14: 68–78
38. Gamma A, Lehmann D, Frei E et al: Comparison of simultaneously record-ed H215O]-PET and LORETA during cognitive and pharmacological activa-tion. Hum Brain Mapp, 2004; 22: 83–96
39. Pantazis D, Simpson GV, Weber DL et al: A novel ANCOVA design for anal-ysis of MEG data with application to a visual attention study. NeuroImage, 2009; 44: 164–74
40. Goebel R, Esposito F: The added value of EEG-fMRI in imaging neurosci-ence. In: Mulert C, Lemieux L. EEG-fMRI: Physiological Basis, Technique, and Applications, 1st ed. Berlin Heidelberg: Springer, 2010; 97–112
41. Mulert C: What Can fMRI add to the ERP story? In: Mulert C, Lemieux L (eds.), EEG-fMRI Berlin Heidelberg: Springer, 2010; 83–95
42. Kiehl KA, Stevens MC, Laurens KR et al: An adaptive reflexive processing model of neurocognitive function: supporting evidence from a large scale (n=100) fMRI study of an auditory odd-ball task. Neuroimage, 2005; 25: 899–915
45Indexed in: [Current Contents/Clinical Medicine] [SCI Expanded] [ISI Alerting System] [ISI Journals Master List] [Index Medicus/MEDLINE] [EMBASE/Excerpta Medica] [Chemical Abstracts/CAS] [Index Copernicus]
Milner R. et al.: Simultaneous AEP-fMRI and auditory processing© Med Sci Monit, 2014; 20: 35-46
This work is licensed under a Creative CommonsAttribution-NonCommercial-NoDerivs 3.0 Unported License
PRELIMINARY REPORT
43. Friedman D, Goldman R, Stern Y, Brown TR: The brain’s orienting response: an event-related functional magnetic resonance imaging investigation. Hum Brain Mapp, 2009; 30: 1144–54
44. Liebenthal E, Ellingson ML, Spanaki MV et al: Simultaneous ERP and fMRI of the auditory cortex in a passive odd-ball paradigm. Neuroimage, 2003; 19: 1395–404
45. Mulert C, Seifert C, Leicht G et al: Single-trial coupling of EEG and fMRI re-veals the involvement of early anterior cingulate cortex activation in ef-fortful decision making. Neuroimage, 2008; 42: 158–68
46. Oldfield RC: The assessment and analysis of handedness: the Edinburgh inventory. Neuropsychologia, 1971; 9: 97–113
47. Bagshaw AP, Benar CG: Scanning strategies for simultaneous EEG-fMRI re-cordings. Simultaneous EEG fMRI Rec Anal Appl Rec Anal Appl, 2010; 85
48. Chatrian GE, Lettich E, Nelson PL: Modified Nomenclature for the“ 10%” Electrode System1. J Clin Neurophysiol, 1988; 5: 183–86
49. Herrmann CS, Debener S: Simultaneous recording of EEG and BOLD re-sponses: a historical perspective. Int J Psychophysiol, 2008; 67: 161–68
50. Ille N, Berg P, Scherg M: Artifact correction of the ongoing EEG using spatial filters based on artifact and brain signal topographies. J Clin Neurophysiol, 2002; 19: 113–24
51. Scarff CJ, Reynolds A, Goodyear BG et al: Simultaneous 3-T fMRI and high-density recording of human auditory evoked potentials. Neuroimage, 2004; 23: 1129–42
52. Nuwer MR: Quantitative EEG: I. Techniques and problems of frequency anal-ysis and topographic mapping. J Clin Neurophysiol, 1988; 5: 1–44
53. Novitski N, Alho K, Korzyukov O et al: Effects of acoustic gradient noise from functional magnetic resonance imaging on auditory processing as re-flected by event-related brain potentials. Neuroimage, 2001; 14(1): 244–51
54. Novitski N, Anourova I, Martinkauppi S et al: Effects of noise from func-tional magnetic resonance imaging on auditory event-related potentials in working memory task. NeuroImage, 2003; 20(2): 1320–28
55. Rusiniak M, Lewandowska M, Wolak T et al: A modified oddball paradigm for investigation of neural correlates of attention: a simultaneous ERP-fMRI study. MAGMA, 2013; 17: 1–16
56. Jäncke L, Gaab N, Wüstenberg T et al: Short-term functional plasticity in the human auditory cortex: an fMRI study. Cogn Brain Res, 2001; 12: 479–85
57. Pluta A, Kurkowski M, Rusiniak M et al: Neural deficits in children with au-ditory processing disorder. Evidence from functional MRI. Journal of Hearing Science, 2011; 1(2): 70–72
58. Bush G, Luu P, Posner MI: Cognitive and emotional influences in anterior cingulate cortex. Trends Cogn Sci, 2000; 4: 215–22
59. Hayter AL, Langdon DW, Ramnani N: Cerebellar contributions to working memory. Neuroimage, 2007; 36: 943–54
60. Soltani M, Knight RT: Neural origins of the P300. Crit Rev Neurobiol, 2000; 14(3-4): 199–224
61. Mulert C, Jäger L, Schmitt R et al: Integration of fMRI and simultaneous EEG: towards a comprehensive understanding of localization and time-course of brain activity in target detection. Neuroimage, 2004; 22: 83–94
62. Li Y, Wang L-Q, Hu Y: Localizing P300 generators in high-density event-re-lated potential with fMRI. Med Sci Monit, 2009; 15(3): MT47–53
63. Vickery TJ, Jiang YV: Inferior parietal lobule supports decision making un-der uncertainty in humans. Cereb Cortex, 2009; 19: 916–25
64. Andersen RA: Inferior parietal lobule function in spatial perception and vi-suomotor integration. Comprehensive Physiolgy, 2011; 483–518
65. Radua J, Phillips ML, Russell T et al: Neural response to specific components of fearful faces in healthy and schizophrenic adults. Neuroimage, 2010; 49: 939–46
66. Celsis P, Boulanouar K, Doyon B et al: Differential fMRI responses in the left posterior superior temporal gyrus and left supramarginal gyrus to ha-bituation and change detection in syllables and tones. Neuroimage, 1999; 9: 135–44
67. Chochon F, Cohen L, Van De Moortele PF, Dehaene S: Differential contribu-tions of the left and right inferior parietal lobules to number processing. J Cogn Neurosci, 1999; 11: 617–30
68. Whittingstall K, Stroink G, Gates L et al: Effects of dipole position, orien-tation and noise on the accuracy of EEG source localization. Biomed Eng Online, 2003; 2(1): 14–25
69. Fuchs M, Wagner M, Kastner J: Confidence limits of dipole source recon-struction results. Clin Neurophysiol, 2004; 115(6): 1442–51
70. Herrmann CS, Brechmann A, Scheich H: Simultaneous EEG and fMRI of the Human Auditory System In: Mulert C, Lemieux L (eds.), EEG-fMRI. Berlin Heidelberg: Springer, 2010; 385–99
71. Karakaş HM, Karakaş S, Özkan Ceylan A, Tali ET: Recording event-related activity under hostile magnetic resonance environment: Is multimodal EEG/ERP-MRI recording possible? Int J Psychophysiol, 2009; 73(2): 123–32
46Indexed in: [Current Contents/Clinical Medicine] [SCI Expanded] [ISI Alerting System] [ISI Journals Master List] [Index Medicus/MEDLINE] [EMBASE/Excerpta Medica] [Chemical Abstracts/CAS] [Index Copernicus]
Milner R. et al.: Simultaneous AEP-fMRI and auditory processing
© Med Sci Monit, 2014; 20: 35-46
This work is licensed under a Creative CommonsAttribution-NonCommercial-NoDerivs 3.0 Unported License
PRELIMINARY REPORT
Related Documents