Towards consistency, rigour and compatibility of risk assessments for ecosystems and ecological communities EMILY NICHOLSON, 1 * TRACEY J. REGAN, 1 TONY D. AULD, 2 EMMA L. BURNS, 3,4 LAURIE A. CHISHOLM, 5 VALERIE ENGLISH, 6 STEPHEN HARRIS, 7,8 PETER HARRISON, 9 RICHARD T. KINGSFORD, 10 MICHELLE R. LEISHMAN, 11 DANIEL J. METCALFE, 4,12 PHIL PISANU, 13 CHRISTOPHER J. WATSON, 14 MATTHEW WHITE, 15 MATT D. WHITE, 16 RICHARD J. WILLIAMS, 4,17 BRUCE WILSON 18,19 AND DAVID A. KEITH 2,4,10 1 School of Botany, The University of Melbourne, Melbourne, Vic. 3010, Australia (Email: [email protected]), 2 NSW Office of Environment and Heritage, 10 Centre for Ecosystem Science, School of Biological, Earth and Environmental Sciences, University of NSW, 11 Department of Biological Sciences, Macquarie University, 14 School of Environment, University of Technology, Sydney, 5 Institute for Conservation Biology and Environmental Management, School of Earth and Environmental Sciences, University ofWollongong, Wollongong, 9 Marine Ecology Research Centre, School of Environment, Science and Engineering, Southern Cross University, Lismore, New South Wales, 3 Fenner School of Environment and Society, The Australian National University, 15 Commonwealth Department of Environment, Canberra, ACT, 4 Long Term Ecological Research Network, Terrestrial Ecosystem Research Network, 8 School of Biological Sciences, University of Queensland, St Lucia, 12 CSIRO Ecosystem Sciences, Brisbane, 18 Queensland Herbarium, 19 Eco Logical Australia Pty Ltd, Brisbane, Queensland, 6 Western Australian Department of Parks andWildlife, Kensington, Western Australia, 7 Invasive Species Branch, Department of Primary Industries, Parks, Water and Environment, Hobart, Tasmania, 13 Department of Environment,Water and Natural Resources, Adelaide, South Australia, 16 Arthur Rylah Institute for Environmental Research, Victorian Department of Environment and Primary Industries, Melbourne, Victoria, and 17 CSIRO Ecosystem Sciences, Darwin, Northern Territory, Australia Abstract Ecosystem-level conservation is increasingly important at global, national and local levels. Many jurisdictions have developed and apply their own protocols for assessing the threat status of ecosystems, often independently, leading to inconsistencies between and within countries which are problematic for cross- jurisdictional environmental reporting. Australia is a good example of these historic legacies, with different risk assessment methods applied nationally and in most states. The newly developed criteria for the International Union for the Conservation of Nature (IUCN) Red List of Ecosystems (RLE) provide a framework to compare and contrast apparently divergent protocols.We critically reviewed the Australian protocols and compared them with the IUCN RLE, based on the following components of a risk assessment protocol: (i) categories of threat; (ii) assessment units; (iii) underlying concepts and definitions; (iv) assessment criteria; (v) uncertainty methods; and (vi) assessment outcomes. Despite some differences in specific objectives, criteria and their expression, the protocols were structurally similar, included broadly similar types of criteria, and produced assessment outcomes that were generally concordant. Alignment with the IUCN RLE would not require extensive changes to existing protocols, but would improve consistency, rigour and robustness in ecosystem risk assessment across jurisdictions. To achieve this, we recommend: (i) more quantitative assessments of functional change; (ii) separation of man- agement and policy considerations from risk assessment; and (iii) cross-referencing of assessment units in different jurisdictions. We argue that the focus on processes and ecological function, rather than only patterns, is key to robust risk assessment. Key words: conservation status, IUCN, Red List of Ecosystems, threatened ecological communities, threatened ecosystems. *Corresponding author. Accepted for publication April 2014. Austral Ecology (2014) ••, ••–•• © 2014 The Authors doi:10.1111/aec.12148 Austral Ecology © 2014 Ecological Society of Australia

Welcome message from author
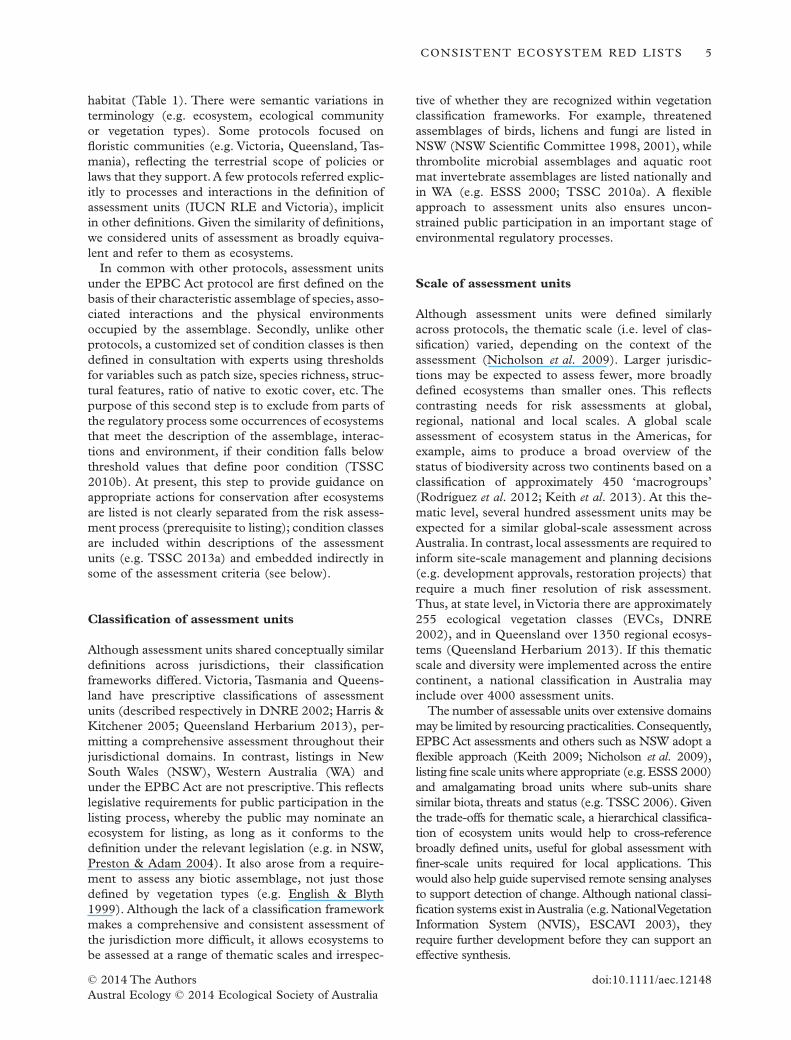
This document is posted to help you gain knowledge. Please leave a comment to let me know what you think about it! Share it to your friends and learn new things together.
Transcript
Towards consistency, rigour and compatibility of riskassessments for ecosystems and ecological communities
EMILY NICHOLSON,1* TRACEY J. REGAN,1 TONY D. AULD,2 EMMA L. BURNS,3,4
LAURIE A. CHISHOLM,5 VALERIE ENGLISH,6 STEPHEN HARRIS,7,8
PETER HARRISON,9 RICHARD T. KINGSFORD,10 MICHELLE R. LEISHMAN,11
DANIEL J. METCALFE,4,12 PHIL PISANU,13 CHRISTOPHER J. WATSON,14
MATTHEW WHITE,15 MATT D. WHITE,16 RICHARD J. WILLIAMS,4,17
BRUCE WILSON18,19 AND DAVID A. KEITH2,4,10
1School of Botany, The University of Melbourne, Melbourne, Vic. 3010, Australia (Email:[email protected]), 2NSW Office of Environment and Heritage, 10Centre for EcosystemScience, School of Biological, Earth and Environmental Sciences, University of NSW, 11Department ofBiological Sciences, Macquarie University, 14School of Environment, University of Technology, Sydney,5Institute for Conservation Biology and Environmental Management, School of Earth andEnvironmental Sciences, University ofWollongong, Wollongong, 9Marine Ecology Research Centre,School of Environment, Science and Engineering, Southern Cross University, Lismore, New SouthWales, 3Fenner School of Environment and Society, The Australian National University,15Commonwealth Department of Environment, Canberra, ACT, 4Long Term Ecological ResearchNetwork, Terrestrial Ecosystem Research Network, 8School of Biological Sciences, University ofQueensland, St Lucia, 12CSIRO Ecosystem Sciences, Brisbane, 18Queensland Herbarium, 19Eco LogicalAustralia Pty Ltd, Brisbane, Queensland, 6Western Australian Department of Parks andWildlife,Kensington, Western Australia, 7Invasive Species Branch, Department of Primary Industries, Parks,Water and Environment, Hobart, Tasmania, 13Department of Environment,Water and NaturalResources, Adelaide, South Australia, 16Arthur Rylah Institute for Environmental Research, VictorianDepartment of Environment and Primary Industries, Melbourne, Victoria, and 17CSIRO EcosystemSciences, Darwin, Northern Territory, Australia
Abstract Ecosystem-level conservation is increasingly important at global, national and local levels. Manyjurisdictions have developed and apply their own protocols for assessing the threat status of ecosystems, oftenindependently, leading to inconsistencies between and within countries which are problematic for cross-jurisdictional environmental reporting. Australia is a good example of these historic legacies, with different riskassessment methods applied nationally and in most states.The newly developed criteria for the International Unionfor the Conservation of Nature (IUCN) Red List of Ecosystems (RLE) provide a framework to compare andcontrast apparently divergent protocols. We critically reviewed the Australian protocols and compared them withthe IUCN RLE, based on the following components of a risk assessment protocol: (i) categories of threat; (ii)assessment units; (iii) underlying concepts and definitions; (iv) assessment criteria; (v) uncertainty methods; and(vi) assessment outcomes. Despite some differences in specific objectives, criteria and their expression, theprotocols were structurally similar, included broadly similar types of criteria, and produced assessment outcomesthat were generally concordant. Alignment with the IUCN RLE would not require extensive changes to existingprotocols, but would improve consistency, rigour and robustness in ecosystem risk assessment across jurisdictions.To achieve this, we recommend: (i) more quantitative assessments of functional change; (ii) separation of man-agement and policy considerations from risk assessment; and (iii) cross-referencing of assessment units in differentjurisdictions. We argue that the focus on processes and ecological function, rather than only patterns, is key torobust risk assessment.
Key words: conservation status, IUCN, Red List of Ecosystems, threatened ecological communities, threatenedecosystems.
*Corresponding author.Accepted for publication April 2014.
Austral Ecology (2014) ••, ••–••
bs_bs_banner
© 2014 The Authors doi:10.1111/aec.12148Austral Ecology © 2014 Ecological Society of Australia
INTRODUCTION
Conservation efforts are increasingly focussed at theecosystem level, in addition to individual threatenedspecies (Rodríguez et al. 2011; Holdaway et al. 2012).The Convention on Biological Diversity (CBD), withits associated Aichi Targets, to which the vast majoritycountries have committed, is one of many interna-tional agreements that require reporting on the chang-ing status of ecosystems (COP10 2010). Othersinclude the Ramsar Convention on Wetlands of Inter-national Importance,World Heritage Sites listed underthe UNESCOWorld Heritage Convention, and poten-tially the Intergovernmental Science Policy Platformon Biodiversity and Ecosystem Services (IPBES).These reporting frameworks require substantial syn-thesis of local data on risks to ecosystems.
Historically, many national and regional jurisdictionshave adopted legislative and regulatory frameworks thatrequire threatened ecosystems to be considered inapproval processes for developments and in targetinginvestments for biodiversity conservation (e.g. Councilof the European Communities 1992; Commonwealthof Australia 1999; Government of South Africa 2004).The methods for identifying threatened ecosystemshave evolved independently across these jurisdictionsand although these protocols share common elements,there are several conceptual uncertainties and meth-odological inconsistencies between them (Nicholsonet al. 2009).To resolve these challenges and promote aglobal synthesis for global reporting on ecosystemstatus, the International Union for the Conservation ofNature (IUCN) developed new criteria to support aRed List of Ecosystems (‘IUCN RLE’, Rodríguez et al.2011; Keith et al. 2013), analogous to criteria thatsupport the IUCN Red List of Threatened Species(IUCN 2001).
In Australia, as in other parts of the world, responsi-bilities for managing and reporting on biodiversity areshared among multiple governance structures, fromglobal to local jurisdictions.There is a need for consist-ency in assessment and listing processes betweenjurisdictions for effective communication, joint envi-ronmental decision-making, scaling up for reporting,and to reduce regulatory burden for cross-jurisdictionaldevelopment projects. Inconsistencies arise partly forhistorical reasons, as different jurisdictions designedtheir listing processes over time, and partly becausejurisdictional needs vary and a single generic assess-ment process may not be appropriate.
The development of Red List criteria for ecosystemsand their global adoption by IUCN (Rodríguez et al.2011) presents an opportunity for improved con-sistency at national and lower scales. Australia repre-sents a good case study because it comprises stateand territory jurisdictions within a federation, withresponsibilities for environmental and land manage-
ment divided among different levels of government,analogous to other regions such as Europe and theUnited States. Risk assessment protocols for ecosys-tems or ecological communities were developed semi-independently throughout Australia at state, nationaland global scales, representing a hierarchy. For wellover a decade, risk assessments have been linked toenvironmental planning laws, policies and regulations(Keith 2009; Nicholson et al. 2009). A recent enquiryinto federal environment legislation recommendedimproved alignment among state and federal listingprocesses for species and ecological communities(Hawke 2009).
We critically reviewed protocols for listing ecosys-tems in Australia, and compared them with eachother and the IUCN RLE protocols (Table 1). Wedeveloped a framework for this comparison focussingon threat categories, definitions of assessment units,criteria for risk assessment, and provisions for dealingwith scale and uncertainty. We illustrated the com-parisons and evaluated the listing consequences ofdifferences between protocols with case studies. Wefinish by discussing the implications of these differ-ences for environmental reporting, priority setting,policy and management, and by identifying opportu-nities for improved alignment of assessment pro-cesses across jurisdictions. Our approach andinterpretation of results provide guidance for resolv-ing similar challenges in other multi-jurisdictionalparts of the world.
RISK ASSESSMENT PROTOCOLSREVIEWED
We reviewed eight protocols for ecosystem risk assess-ment (Table 1): the IUCN RLE at the global level,the Australian national-level Environment Protectionand Biodiversity Conservation Act 1999 (EPBC Act,Commonwealth of Australia 1999) and six protocolsused in states and territories in Australia. South Aus-tralia (SA) and the Northern Territory do not cur-rently have any legislation or listing protocols forecological communities, although the IUCN RLE cri-teria have recently been trialled for state-level assess-ment in SA (Bonifacio & Pisanu 2012).
Listing protocols comprised a set of decision rules,where each ecosystem is assessed against multiple cri-teria and assigned to an ordinal risk category. An eco-system is assigned the highest threat category acrossall criteria assessed, following the IUCN Red List pro-tocols for both ecosystems and species. We character-ized the criteria and sub-criteria used in the protocolsusing three broad groupings: decline in distribution,restricted distribution and decline in function. Wecompared the interpretation of each group of criteria,
2 E. NICHOLSON ET AL.
© 2014 The Authorsdoi:10.1111/aec.12148Austral Ecology © 2014 Ecological Society of Australia

Table 1. Features of the ecosystem threat assessment protocols reviewed. Threat categories (CR = critically endangered,EN = endangered, VU = vulnerable, LC = least concern), with non-threatened categories in brackets; and criteria used forassessment: decline in distribution; restricted distribution; and decline in function. For each criterion, quantitative indicates thatthe criterion has quantitative thresholds, semi-quantitative indicates that the criterion combines some quantitative and somequalitative components, qualitative describes purely qualitative (i.e. descriptive) criteria (see Table 2 for more detail), while N/Aindicates that the criterion is not used; * indicates conditionality on demonstrated ongoing threat for the criterion to be applied;note that Queensland considers decline in function only within the Regional Ecosystem framework, not under the VegetationManagement Act. IUCN the International Union for the Conservation of Nature; RLE, Red List of Ecosystems
Protocol jurisdiction,abbreviation name& key references Unit of assessment Definition of endpoint
Threatcategories
Decline indistribution
Restricteddistribution
Decline infunction
Global: IUCN RLEIUCN Red list ofEcosystems (Keithet al. 2013)
Ecosystem: Complexes of organisms and theirassociated physical environment, within anarea (after Tansley 1935). They have fouressential elements: a biotic complex; anabiotic environment or complex; theinteractions within and between them; and aphysical space in which these operate.
Collapse: transition beyond a boundedthreshold in one or more variables thatdefine the identity of the ecosystem.Collapse is thus a transformation of identity,loss of defining features and replacement bya novel ecosystem. It occurs when alloccurrences lose defining biotic or abioticfeatures, and characteristic native biota areno longer sustained.
Collapsed,CR, EN,VU, (nearthreatened,LC, datadeficient,notevaluated)
Quantitative Quantitative* Quantitative
Commonwealth ofAustralia: EPBCActEnvironmentalProtection andBiodiversity Act 1999(Commonwealth ofAustralia 1999, 2000;TSSC 2004, 2010b,2013b)
Ecological Community: the extent in naturein the Australian jurisdiction of anassemblage of native species that: (i) inhabitsa particular area in nature; and (ii) meetsthe additional criteria specified in theregulations (if any) made for the purposes ofthis definition.
Extinction: Extinction (or collapse) of anecological community includes situationswhere remaining occurrences are sofunctionally degraded that they cannot berestored (e.g. to a benchmark state).Remnants can be threatened with‘functional’ extinction through on-goingmodifications that, whilst they may not leadto total destruction of all elements of thecommunity, are disrupting ecologicalprocesses that are critical to maintain andrecover the community. Functionaldegradation may be indicated by loss offunctional biotic components of theecological community or a breakdown ofabiotic processes (e.g. nutrient cycling), suchthat characteristic native biota are no longersustained within the ecological community’srange of natural variability. That is, whenre-establishment of biotic and abioticprocesses, species composition andcommunity structure is unlikely within theforeseeable future, even with positive humanintervention.
CR, EN, VU Quantitative Quantitative* Semi-quantitative
New South Wales(NSW)New South WalesThreatened SpeciesConservation Act1995 (New SouthWales Government1995, 2010; NSWScientific Committee2012)
Ecological community: an assemblage ofspecies occupying a particular area. Thisdefinition closely follows modern scientifictexts and embodies three requirements: (i)the constituents of a community must bespecies; (ii) the species need to be broughttogether into an assemblage; and (iii) theassemblage of species must occupy aparticular area.
Extinction: not formally defined. CR, EN, VU Quantitative Quantitative* Qualitative
Victoria (Vic)Native VegetationFramework underPlanning andEnvironment Act(DNRE 2002)
Ecological vegetation classes (EVC): a typeof native vegetation classification that isdescribed through a combination of itsfloristic, life form and ecologicalcharacteristics, and through an inferredfidelity to particular environmentalattributes. Each EVC includes a collectionof floristic communities (i.e. a lower level inthe classification that is based solely ongroups of the same species) that occuracross a biogeographic range, and althoughdiffering in species, have similar habitat andecological processes operating.
Extinction: probably no longer present in thebioregion.
Presumedextinct,EN, VU,depleted,rare, (LC)
Quantitative Quantitative Quantitative
Western Australia(WA)Western AustralianList of Definitions,Categories andCriteria forThreatened andPriority EcologicalCommunities (DEC2010)
Ecological community: a naturally occurringbiological assemblage that occurs in aparticular type of habitat.
Presumed totally destroyed: an ecologicalcommunity that has been adequatelysearched for but for which no representativeoccurrences have been located. Thecommunity has been found to be totallydestroyed or so extensively modifiedthroughout its range that no occurrence of itis likely to recover its species compositionand/or structure in the foreseeable future.
Presumedtotallydestroyed,CR, EN,VU
Quantitative* Quantitative* Quantitative*
CONSISTENT ECOSYSTEM RED LISTS 3
© 2014 The Authors doi:10.1111/aec.12148Austral Ecology © 2014 Ecological Society of Australia
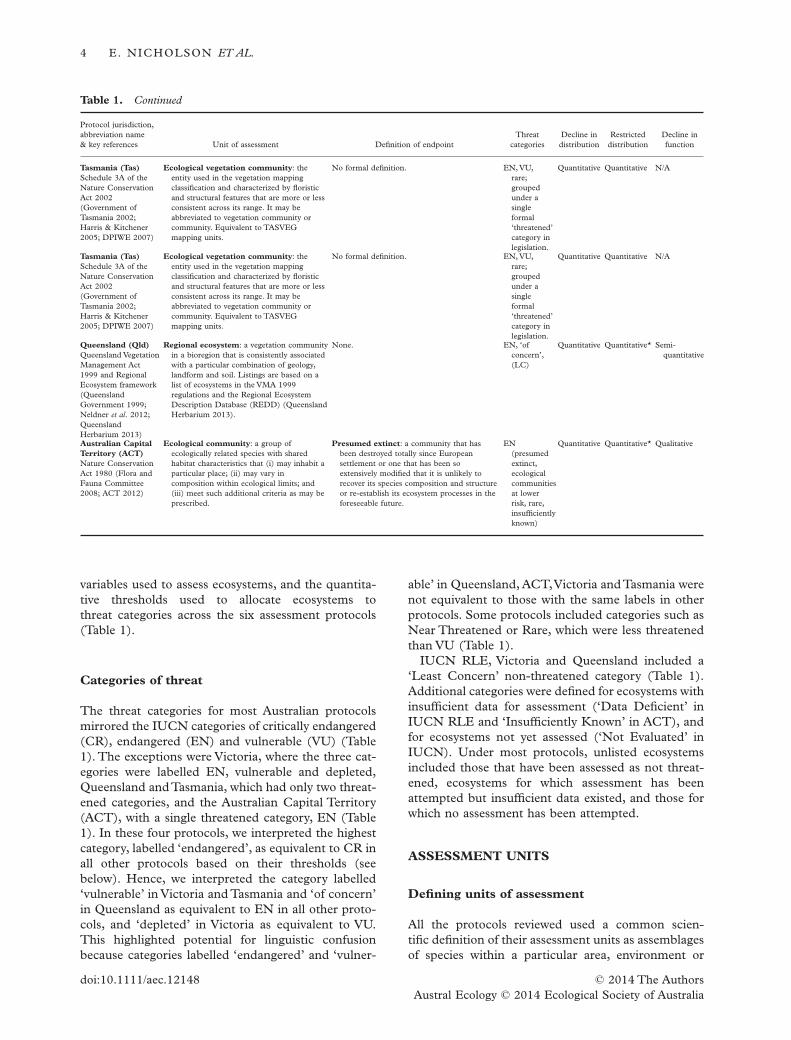
variables used to assess ecosystems, and the quantita-tive thresholds used to allocate ecosystems tothreat categories across the six assessment protocols(Table 1).
Categories of threat
The threat categories for most Australian protocolsmirrored the IUCN categories of critically endangered(CR), endangered (EN) and vulnerable (VU) (Table1). The exceptions were Victoria, where the three cat-egories were labelled EN, vulnerable and depleted,Queensland andTasmania, which had only two threat-ened categories, and the Australian Capital Territory(ACT), with a single threatened category, EN (Table1). In these four protocols, we interpreted the highestcategory, labelled ‘endangered’, as equivalent to CR inall other protocols based on their thresholds (seebelow). Hence, we interpreted the category labelled‘vulnerable’ in Victoria and Tasmania and ‘of concern’in Queensland as equivalent to EN in all other proto-cols, and ‘depleted’ in Victoria as equivalent to VU.This highlighted potential for linguistic confusionbecause categories labelled ‘endangered’ and ‘vulner-
able’ in Queensland, ACT,Victoria andTasmania werenot equivalent to those with the same labels in otherprotocols. Some protocols included categories such asNear Threatened or Rare, which were less threatenedthan VU (Table 1).
IUCN RLE, Victoria and Queensland included a‘Least Concern’ non-threatened category (Table 1).Additional categories were defined for ecosystems withinsufficient data for assessment (‘Data Deficient’ inIUCN RLE and ‘Insufficiently Known’ in ACT), andfor ecosystems not yet assessed (‘Not Evaluated’ inIUCN). Under most protocols, unlisted ecosystemsincluded those that have been assessed as not threat-ened, ecosystems for which assessment has beenattempted but insufficient data existed, and those forwhich no assessment has been attempted.
ASSESSMENT UNITS
Defining units of assessment
All the protocols reviewed used a common scien-tific definition of their assessment units as assemblagesof species within a particular area, environment or
Table 1. Continued
Protocol jurisdiction,abbreviation name& key references Unit of assessment Definition of endpoint
Threatcategories
Decline indistribution
Restricteddistribution
Decline infunction
Tasmania (Tas)Schedule 3A of theNature ConservationAct 2002(Government ofTasmania 2002;Harris & Kitchener2005; DPIWE 2007)
Ecological vegetation community: theentity used in the vegetation mappingclassification and characterized by floristicand structural features that are more or lessconsistent across its range. It may beabbreviated to vegetation community orcommunity. Equivalent to TASVEGmapping units.
No formal definition. EN, VU,rare;groupedunder asingleformal‘threatened’category inlegislation.
Quantitative Quantitative N/A
Queensland (Qld)Queensland VegetationManagement Act1999 and RegionalEcosystem framework(QueenslandGovernment 1999;Neldner et al. 2012;QueenslandHerbarium 2013)
Regional ecosystem: a vegetation communityin a bioregion that is consistently associatedwith a particular combination of geology,landform and soil. Listings are based on alist of ecosystems in the VMA 1999regulations and the Regional EcosystemDescription Database (REDD) (QueenslandHerbarium 2013).
None. EN, ‘ofconcern’,(LC)
Quantitative Quantitative* Semi-quantitative
Australian CapitalTerritory (ACT)Nature ConservationAct 1980 (Flora andFauna Committee2008; ACT 2012)
Ecological community: a group ofecologically related species with sharedhabitat characteristics that (i) may inhabit aparticular place; (ii) may vary incomposition within ecological limits; and(iii) meet such additional criteria as may beprescribed.
Presumed extinct: a community that hasbeen destroyed totally since Europeansettlement or one that has been soextensively modified that it is unlikely torecover its species composition and structureor re-establish its ecosystem processes in theforeseeable future.
EN(presumedextinct,ecologicalcommunitiesat lowerrisk, rare,insufficientlyknown)
Quantitative Quantitative* Qualitative
4 E. NICHOLSON ET AL.
© 2014 The Authorsdoi:10.1111/aec.12148Austral Ecology © 2014 Ecological Society of Australia
habitat (Table 1). There were semantic variations interminology (e.g. ecosystem, ecological communityor vegetation types). Some protocols focused onfloristic communities (e.g. Victoria, Queensland, Tas-mania), reflecting the terrestrial scope of policies orlaws that they support. A few protocols referred explic-itly to processes and interactions in the definition ofassessment units (IUCN RLE and Victoria), implicitin other definitions. Given the similarity of definitions,we considered units of assessment as broadly equiva-lent and refer to them as ecosystems.
In common with other protocols, assessment unitsunder the EPBC Act protocol are first defined on thebasis of their characteristic assemblage of species, asso-ciated interactions and the physical environmentsoccupied by the assemblage. Secondly, unlike otherprotocols, a customized set of condition classes is thendefined in consultation with experts using thresholdsfor variables such as patch size, species richness, struc-tural features, ratio of native to exotic cover, etc. Thepurpose of this second step is to exclude from parts ofthe regulatory process some occurrences of ecosystemsthat meet the description of the assemblage, interac-tions and environment, if their condition falls belowthreshold values that define poor condition (TSSC2010b). At present, this step to provide guidance onappropriate actions for conservation after ecosystemsare listed is not clearly separated from the risk assess-ment process (prerequisite to listing); condition classesare included within descriptions of the assessmentunits (e.g. TSSC 2013a) and embedded indirectly insome of the assessment criteria (see below).
Classification of assessment units
Although assessment units shared conceptually similardefinitions across jurisdictions, their classificationframeworks differed. Victoria, Tasmania and Queens-land have prescriptive classifications of assessmentunits (described respectively in DNRE 2002; Harris &Kitchener 2005; Queensland Herbarium 2013), per-mitting a comprehensive assessment throughout theirjurisdictional domains. In contrast, listings in NewSouth Wales (NSW), Western Australia (WA) andunder the EPBC Act are not prescriptive.This reflectslegislative requirements for public participation in thelisting process, whereby the public may nominate anecosystem for listing, as long as it conforms to thedefinition under the relevant legislation (e.g. in NSW,Preston & Adam 2004). It also arose from a require-ment to assess any biotic assemblage, not just thosedefined by vegetation types (e.g. English & Blyth1999). Although the lack of a classification frameworkmakes a comprehensive and consistent assessment ofthe jurisdiction more difficult, it allows ecosystems tobe assessed at a range of thematic scales and irrespec-
tive of whether they are recognized within vegetationclassification frameworks. For example, threatenedassemblages of birds, lichens and fungi are listed inNSW (NSW Scientific Committee 1998, 2001), whilethrombolite microbial assemblages and aquatic rootmat invertebrate assemblages are listed nationally andin WA (e.g. ESSS 2000; TSSC 2010a). A flexibleapproach to assessment units also ensures uncon-strained public participation in an important stage ofenvironmental regulatory processes.
Scale of assessment units
Although assessment units were defined similarlyacross protocols, the thematic scale (i.e. level of clas-sification) varied, depending on the context of theassessment (Nicholson et al. 2009). Larger jurisdic-tions may be expected to assess fewer, more broadlydefined ecosystems than smaller ones. This reflectscontrasting needs for risk assessments at global,regional, national and local scales. A global scaleassessment of ecosystem status in the Americas, forexample, aims to produce a broad overview of thestatus of biodiversity across two continents based on aclassification of approximately 450 ‘macrogroups’(Rodríguez et al. 2012; Keith et al. 2013). At this the-matic level, several hundred assessment units may beexpected for a similar global-scale assessment acrossAustralia. In contrast, local assessments are required toinform site-scale management and planning decisions(e.g. development approvals, restoration projects) thatrequire a much finer resolution of risk assessment.Thus, at state level, inVictoria there are approximately255 ecological vegetation classes (EVCs, DNRE2002), and in Queensland over 1350 regional ecosys-tems (Queensland Herbarium 2013). If this thematicscale and diversity were implemented across the entirecontinent, a national classification in Australia mayinclude over 4000 assessment units.
The number of assessable units over extensive domainsmay be limited by resourcing practicalities. Consequently,EPBC Act assessments and others such as NSW adopt aflexible approach (Keith 2009; Nicholson et al. 2009),listing fine scale units where appropriate (e.g. ESSS 2000)and amalgamating broad units where sub-units sharesimilar biota, threats and status (e.g. TSSC 2006). Giventhe trade-offs for thematic scale, a hierarchical classifica-tion of ecosystem units would help to cross-referencebroadly defined units, useful for global assessment withfiner-scale units required for local applications. Thiswould also help guide supervised remote sensing analysesto support detection of change. Although national classi-fication systems exist inAustralia (e.g.NationalVegetationInformation System (NVIS), ESCAVI 2003), theyrequire further development before they can support aneffective synthesis.
CONSISTENT ECOSYSTEM RED LISTS 5
© 2014 The Authors doi:10.1111/aec.12148Austral Ecology © 2014 Ecological Society of Australia

RISK ASSESSMENT
The endpoint of decline: collapse/extinction
Risk assessment of ecosystems requires a definedendpoint of ecosystem decline analogous to speciesextinction (Nicholson et al. 2009; Keith et al. 2013).An explicitly defined endpoint of ecosystem declineis needed to interpret each of the assessment criteriato estimate how far a declining ecosystem hasadvanced towards collapse. Although most Australianprotocols had a term for this endpoint (Table 1), itsdefinition was lacking, incomplete or vague, withlittle grounding in ecological theory (Table 1). TheEPBC Act had the most extensive discussion of theconcept of extinction. The concept was more explic-itly developed in the IUCN RLE, which also definedmajor sources of uncertainty (Keith et al. 2013).
Criteria for assessing decline in distribution
All protocols included decline in distribution as a riskassessment criterion with quantitative thresholds,except the ACT (Table 1, Fig. 1). The interpretationand application of this criterion was similar acrossprotocols. All protocols, except NSW, assesseddeclines in distribution since European settlement,consistent with the IUCN RLE historic timeframe(since 1750). NSW assessed declines over biologi-cally relevant timeframes, appropriate to the life cycleand habitat characteristics of component species,typically three generation lengths or 10 years, which-ever is the longer, similar to the IUCN species cri-teria (IUCN 2013). In most forests, woodlands andmany shrub-dominated communities, three genera-tions of the dominant species extended to Europeansettlement (NSW Scientific Committee 2012),making timeframes for assessing decline similar
Fig. 1. Decline thresholds used for decline in distribution across protocols; two thresholds apply under the International Unionfor the Conservation of Nature (IUCN) Red List of Ecosystems (RLE) (historic decline since 1750, and recent, current or futuredeclines over 50 years), the EPBC Act (long-term decline, typically since European settlement or ca. 1750 [1826 in WA], andrecent declines over 50 years) and NSW (dependant on whether threat has ceased); a third threshold is included for the EPBCAct (EPBC Act 1750 old), because communities assessed between 2000 and 2013 used more stringent long-term declinethresholds; *conditional on ongoing threat; ‘∧’ for Qld, Vic and Tas the endangered (EN) category is grouped with criticallyendangered (CR) thresholds in other protocols, ‘of concern’ and vulnerable (VU), respectively, are grouped with EN thresholds,‘depleted’ in Vic is grouped with VU thresholds, while for Qld and Tas there is no category equivalent to VU and for WA VU isqualitatively defined.
6 E. NICHOLSON ET AL.
© 2014 The Authorsdoi:10.1111/aec.12148Austral Ecology © 2014 Ecological Society of Australia

across protocols. In addition, the EPBC Act assessedrecent declines over shorter time scales of approxi-mately 50 years, while the IUCN RLE assessedrecent and projected future declines over the sametime scale (50 years). In NSW and WA, the interpre-tation of thresholds for decline was conditional oncontinuing threats. Either more stringent thresholds(i.e. requiring greater levels of decline for similarthreat categories) were applied (NSW) or the crite-rion was inapplicable (WA) if threats were under-stood and ceased.
The decline thresholds for allocating ecosystems tothreat categories were generally similar (Fig. 1), andshowed less variation than previous comparisons ofglobal protocols (Nicholson et al. 2009). The thresh-olds for Queensland andTasmania were more stringentthan those of the IUCN RLE. EPBC Act thresholdswere aligned with the IUCN RLE thresholds in 2013(TSSC 2013b), although communities assessedbetween 2000 and 2013 used more stringent long-termdecline thresholds only (TSSC 2010b), shown inFigure 1 as EPBC Act 1750 old, in addition to updatedlong-term and short-term thresholds, respectivelyEPBC Act 1750 and EPBC Act 50y. The reasons fordifferent threshold values were unclear, except wherethey aligned with IUCN thresholds for species decline(e.g. NSW), although stringent thresholds may havebeen seen as a way of limiting the number of listings.
Estimates of decline in distribution will be sensitiveto how the extant and past distributions are mapped,and how extant occurrences are delineated spatiallyfrom collapsed occurrences. This is an issue thatclearly affects the entire assessment. With the excep-tion of IUCN RLE, the lack of any requirement tospecify thresholds of collapse could exacerbate incon-sistencies in mapping of ecosystems across their rangeand/or at different times over which distributionalchange was assessed. The assessment of changes indistribution therefore needs an explicit definition oflocal collapse at a site or stand level as part of thedescription of the ecosystem under assessment. InQueensland, this is partly offset by application ofmapping standards that define and map remnantwoody vegetation consistently based on thresholds ofrelative cover, height and species composition of thecanopy layer (Neldner et al. 2012).
Criteria for assessing restricted distribution
All of the protocols included a criterion assessing risksrelated to restricted distribution. All used quantitativearea thresholds, except WA, which assessed distribu-tions qualitatively (Table 1).This reflected widespreadrecognition that many processes that threaten the per-sistence of ecosystems are spatially explicit. For mostprotocols, listing under restricted distribution was
conditional on qualitative evidence of ongoing threat(Table 1 and Fig. 2). This distinguished between eco-systems that were naturally restricted but stable, andthose at risk of collapse due to the impacts of threatson their restricted distribution. In Tasmania raritythresholds alone were used as one of the criteria todetermine eligibility for threatened status, irrespectiveof declines or threats. In Queensland and Victoriarestricted distribution was used only as a conditionalsub-criterion when assessing decline in distribution.
Four main metrics were used to measure restricteddistribution. All protocols except WA included area ofoccupancy (AOO, range or simply area), the area occu-pied by the ecosystem (Fig. 2a). IUCN RLE,the EPBC Act, NSW andVictoria used extent of occur-rence (EOO), a contiguous area enclosing all occur-rences within a minimum convex polygon, includingareas not occupied by the ecosystem (Fig. 2b). Thenumber of locations was applied only in the IUCNRLE, based on a similar metric in the IUCN speciescriteria, where a location was defined as a ‘geographi-cally or ecologically distinct area in which a singlethreatening event can rapidly affect the ecosystem’, andthe size of the location depended on the area covered bythe most serious plausible threat, rather than ecosystempatch size or distribution (Keith et al. 2013). Finally,the EPBC Act and Victoria used patch size as a metricof distribution, with ecosystems mostly in small patchesconsidered threatened.We discuss this metric further inthe next section in relation to fragmentation, one of theprocesses of functional decline.
The thresholds applied for measuring restricted dis-tribution varied greatly between protocols (Fig. 2).The reasons for particular threshold values wereundocumented, but may relate to attempts by protocoldesigners to control scale effects. AOO is highlysensitive to the scale (spatial and thematic) of mappingand measurement (Nicholson et al. 2009). To controlscale-related artefacts, two protocols, IUCN RLE andNSW, explicitly specified a standard scale at whichAOO should be measured for comparison with thethresholds. The NSW guidelines recommended 4 km2
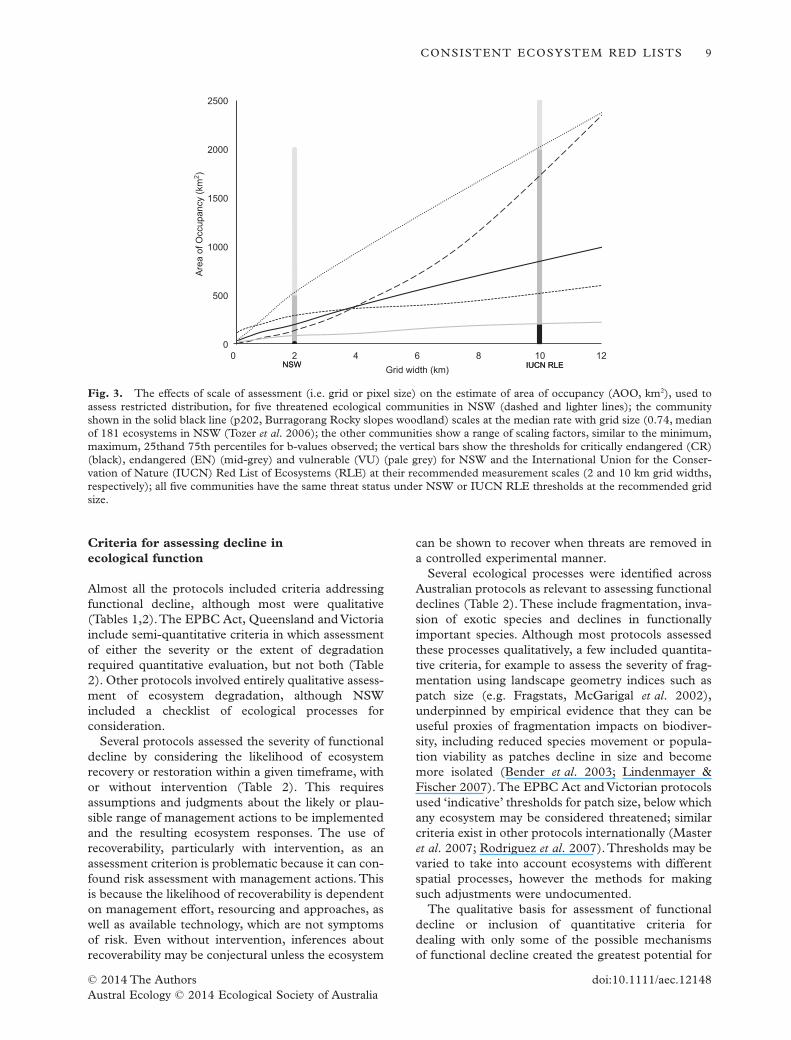
grids (following species recommendations in IUCN2013) while the IUCN RLE measured AOO using100 km2 grid cells, with commensurately larger thresh-olds (Fig. 3). For Queensland, Victoria and Tasmaniascaling was controlled implicitly because thresholdsapplied to specific classifications and associated mapswith fixed scales across the jurisdictions.
Scale and thresholds
To investigate sensitivities of AOO to spatial scale, weextended the analysis by Nicholson et al. (2009). Wecalculated AOO for 181 ecological communities fromNSW (Tozer et al. 2006), based on grids of varying
CONSISTENT ECOSYSTEM RED LISTS 7
© 2014 The Authors doi:10.1111/aec.12148Austral Ecology © 2014 Ecological Society of Australia

dimensions from 0.125 × 0.125 km to 16 × 16 km,encompassing the recommended range of scales andecosystem maps used by different protocols (e.g.Neldner et al. 2012; NSW Scientific Committee 2012;Keith et al. 2013). We then estimated a and b in themodel AOO = a × (grid)b, where b describes how AOOscales with grid size.
AOO was highly sensitive to scale, with b varyingbetween 0.32 and 1.75 (median 0.74). IUCN RLEand NSW produced similar threat status for mostecosystems analysed because different thresholds forAOO were scaled using grids of a standard size: only12% of ecosystems were assigned different threat cat-egories by these two protocols. In all cases, the dif-
ference was by one threat category (e.g. EN underone and VU under the other). Five representativeecosystems shown in Figure 3 had the same threatcategory under the two protocols with appropriatescaling, despite different scaling patterns. In contrast,the EPBC Act protocol had no recommended scaleof measurement of AOO. Without scaling, estimatesbased on fine scale maps could produce a small esti-mate of AOO and a high category of risk; converselyestimates based on coarse scale maps could underes-timate risk. Where distribution data are unavailable atthe standard scale required for comparison againstfixed thresholds, area estimates can be readily scaledusing GIS software.
Fig. 2. Restricted distribution thresholds for (a) area of occupancy (AOO) and (b) extent of occurrence (EOO); note that AOOunder the International Union for the Conservation of Nature (IUCN) Red List of Ecosystems (RLE) is measured not in km2
but in the number of 10 × 10 km grid cells in which the ecosystem occupies more than 1% of the area; *Conditional on ongoingthreat; ‘∧’ for Qld, Vic and Tas the endangered (EN) category is grouped with critically endangered (CR) thresholds in otherprotocols, ‘of concern’ and vulnerable (VU), respectively, are grouped with EN thresholds, ‘depleted’ in Vic is grouped with VUthresholds, while for Qld and Tas there is no category equivalent to VU and ACT only has EN; ‘+’ AOO threshold in Qld andVic used as a sub-criterion in conjunction with other thresholds such as % decline; Tas has a separate category, rare, based onarea thresholds, which can be combined with decline threshold-based categories (EN and VU).
8 E. NICHOLSON ET AL.
© 2014 The Authorsdoi:10.1111/aec.12148Austral Ecology © 2014 Ecological Society of Australia
Criteria for assessing decline inecological function
Almost all the protocols included criteria addressingfunctional decline, although most were qualitative(Tables 1,2).The EPBC Act, Queensland and Victoriainclude semi-quantitative criteria in which assessmentof either the severity or the extent of degradationrequired quantitative evaluation, but not both (Table2). Other protocols involved entirely qualitative assess-ment of ecosystem degradation, although NSWincluded a checklist of ecological processes forconsideration.
Several protocols assessed the severity of functionaldecline by considering the likelihood of ecosystemrecovery or restoration within a given timeframe, withor without intervention (Table 2). This requiresassumptions and judgments about the likely or plau-sible range of management actions to be implementedand the resulting ecosystem responses. The use ofrecoverability, particularly with intervention, as anassessment criterion is problematic because it can con-found risk assessment with management actions. Thisis because the likelihood of recoverability is dependenton management effort, resourcing and approaches, aswell as available technology, which are not symptomsof risk. Even without intervention, inferences aboutrecoverability may be conjectural unless the ecosystem
can be shown to recover when threats are removed ina controlled experimental manner.
Several ecological processes were identified acrossAustralian protocols as relevant to assessing functionaldeclines (Table 2).These include fragmentation, inva-sion of exotic species and declines in functionallyimportant species. Although most protocols assessedthese processes qualitatively, a few included quantita-tive criteria, for example to assess the severity of frag-mentation using landscape geometry indices such aspatch size (e.g. Fragstats, McGarigal et al. 2002),underpinned by empirical evidence that they can beuseful proxies of fragmentation impacts on biodiver-sity, including reduced species movement or popula-tion viability as patches decline in size and becomemore isolated (Bender et al. 2003; Lindenmayer &Fischer 2007).The EPBC Act and Victorian protocolsused ‘indicative’ thresholds for patch size, below whichany ecosystem may be considered threatened; similarcriteria exist in other protocols internationally (Masteret al. 2007; Rodriguez et al. 2007).Thresholds may bevaried to take into account ecosystems with differentspatial processes, however the methods for makingsuch adjustments were undocumented.
The qualitative basis for assessment of functionaldecline or inclusion of quantitative criteria fordealing with only some of the possible mechanismsof functional decline created the greatest potential for
0
500
1000
1500
2000
2500
0 2 4 6 8 10 12
Are
a of
Occ
upan
cy (k
m2 )
Grid width (km) IUCN RLE NSW IUCN RLE NSW
Fig. 3. The effects of scale of assessment (i.e. grid or pixel size) on the estimate of area of occupancy (AOO, km2), used toassess restricted distribution, for five threatened ecological communities in NSW (dashed and lighter lines); the communityshown in the solid black line (p202, Burragorang Rocky slopes woodland) scales at the median rate with grid size (0.74, medianof 181 ecosystems in NSW (Tozer et al. 2006); the other communities show a range of scaling factors, similar to the minimum,maximum, 25thand 75th percentiles for b-values observed; the vertical bars show the thresholds for critically endangered (CR)(black), endangered (EN) (mid-grey) and vulnerable (VU) (pale grey) for NSW and the International Union for the Conser-vation of Nature (IUCN) Red List of Ecosystems (RLE) at their recommended measurement scales (2 and 10 km grid widths,respectively); all five communities have the same threat status under NSW or IUCN RLE thresholds at the recommended gridsize.
CONSISTENT ECOSYSTEM RED LISTS 9
© 2014 The Authors doi:10.1111/aec.12148Austral Ecology © 2014 Ecological Society of Australia

Table 2. Protocols reviewed: ways of dealing with decline in function.Tasmania has no function-based criteria and is excluded;note that Queensland considers decline in function only within the Regional Ecosystem framework, not under the VegetationManagement Act. IUCN the International Union for the Conservation of Nature; RLE, Red List of Ecosystems
Protocol
Quantifiedextent ofdecline
Quantified severityof decline Qualitative criteria
Examples of measures ofdecline in function
(abiotic and biotic variables)
IUCN RLE % area affected Abiotic (Environmentaldegradation, Criterion C);and biotic (disruption ofbiotic processes &interactions, Criterion D).
Abiotic: desertification of rangelands,eutrophication, de-humidificationof cloud forests, changed waterregime or hydroperiod,salinization, structuralsimplification, sea level rise, retreatof ice masses
Biotic: species richness, speciescomposition and dominance,functional diversity, trophicdiversity, spatial flux of organisms,structural complexity.
EPBC Act Loss of decline of afunctionally importantspecies (Criterion 3.1,conditional on qualitativecriterion 3.2).
Rate of continuing decline ina population of functionallyimportant species(Criterion 5a).
Small geographic distributionmeasured by patch size(Criterion 2).
Restoration of structure andfunction unlikely within specifiedtimeframes (Criterion 3.2)
Reduction in integrity across mostof its geographic distribution[. . .] as indicated bydegradation of the communityor its habitat, or disruption ofimportant community processes(Criteria 4 and 5b).
Small distribution coupled withdemonstrable threat (Criterion2).
Abiotic: desiccation of humidcommunities, disruption of fireregimes, altered hydrology, salinity,increase in nutrients
Biotic: population decline infunctionally important specieschanges, in the identity andnumber of component species, therelative and absolute abundancesof those species, irretrievable lossof native species, invasion bynon-native species, loss ofrecruitment.
NSW Extent and severity of reduction inbiotic and abiotic ecologicalfunction:(i) Change in community
structure(ii) Change in species
composition(iii) Disruption of ecological
processes(iv) Invasion and establishment
of exotic species(v) Degradation of habitat(vi) Fragmentation of habitat
Abiotic: Reduced stream flow in ariparian system, rubbish dumping,physical disturbance, increasednutrients, reduction in median sizeof patches, construction of roadsand tracks.
Biotic: Reduction in cover ofstructurally dominant species,reduction in cover of obligateseeders due to increased firefrequency, increase in cover orabundance of exotic species,reduced recruitment of keyspecies.
Vic % areaaffected(in conjunctionwith % declinein distribution)
Severity of change in floristicand/or structural diversity.
Ability to recover naturally in time.Estimate of degradation can be
based on modelled data.
Abiotic: Change in fire regime,hydrological processes.
Biotic: grazing/browsing, invasion ofweeds & pest pathogens.
WA Change in abiotic processes andbiotic components, recoverability(with or without humanintervention).
Abiotic: hydrology, salinity, nutrientenrichment, pollution,inappropriate fire regimes.
Biotic: species composition,community structure, weedinvasion, disease.
Qld % area affected Degradation of abiotic and bioticcomponents, recoverability.
Abiotic: degradation of soil surface,salinity, surface compaction, loss oforganic matter, or sheet erosion,fragmentation, inappropriate fireregimes.
Biotic: floristic/faunal diversity,weedinvasion, grazing pressure.
ACT Disruption to abiotic and bioticcommunity processes.
Abiotic: fire, flooding, alteredhydrology, salinity, nutrientchange.
Biotic: pollination, seed dispersal, soildisturbance by vertebrates whichaffect plant germination.
10 E. NICHOLSON ET AL.
© 2014 The Authorsdoi:10.1111/aec.12148Austral Ecology © 2014 Ecological Society of Australia

divergence and inconsistency among the Australianprotocols. The IUCN RLE, in contrast, has a frame-work for quantifying both the severity and extent ofdecline for a wide range of degradation processes(Keith et al. 2013). It therefore provides a usefulmeans of harmonization by accommodating ecologi-cal processes relevant to ecosystem persistenceincluding those incorporated into the other protocols.Key elements of the IUCN RLE approach are to: (i)identify the salient process(es) driving functionaldecline; (ii) identify proximal and sensitive variablesthat represent the process; (iii) define a thresholdvalue of the variable that represents ecosystem col-lapse; and (iv) estimate any trend of the variabletowards the threshold of collapse (relative severity ofdegradation) (Keith et al. 2013). The EPBC Act andthe IUCN RLE also included a quantitative estimateof the risk of collapse as a criterion (Criterion 6 andE respectively), allowing for interactions among mul-tiple threats to be evaluated explicitly through eco-system simulation models.
The utility of the IUCN RLE approach can be illus-trated with the example of assessing functional declinecaused by fragmentation under Criterion D (disrup-tion to biotic processes). First, two pre-requisites areto (i) establish that fragmentation is a key mechanismof functional decline in the ecosystem under assess-ment and (ii) understand how it disrupts ecologicalprocesses. Second, this understanding must be appliedto select the most suitable variable for estimating theseverity of fragmentation effects and to define a thresh-old of collapse.This approach contrasts with using thesame generic measure with fixed thresholds acrossall ecosystems. Often, the most suitable, proximaland sensitive fragmentation variable may representbiological outcomes of fragmentation processes, suchas species movement, abundance of invasive species orchanges in species composition or abundance, ratherthan a measure of landscape geometry. If landscapegeometry is used to assess functional decline, somemetrics may be more reflective of biological responsesthan others. In Australian tropical lowland rainforest,for example, species richness of various taxa in frag-ments is inversely related to patch isolation, but unre-lated to patch size (D. Metcalfe, unpubl. data, 2014).
Third, the fragmentation estimates must be stand-ardized relative to an ecosystem-specific threshold ofcollapse (i.e. the level of fragmentation at which theecosystem is no longer able to sustain its definingfeatures), which can be estimated empirically at par-ticular sites (Keith et al. 2013). The fragmentationthresholds delineating each threat category are thenscaled mathematically to the collapse threshold. Thisallows the assessment to be scaled to accommodate thebiology of the ecosystem. For example, wetlandpatches may be connected by a mobile and functionalwaterbird fauna, compared with grassland fragments
in which the characteristic mammalian fauna isregionally extinct and no longer plays its crucial role inplant dispersal, top-down regulation of woody biomassand predator-prey dynamics.The two ecosystems havedifferent risks of collapse, even though their configu-ration of patch sizes may be similar. Although patchsize thresholds in Australian protocols are ‘indicative’and may be adjusted case by case, the protocols offerno guidance on when the default thresholds apply orhow they should be varied in magnitude or directionfor any given assessment, increasing the risk of incon-sistent interpretations.
Finally, the IUCN RLE focuses on fragmentation-related change rather than absolute values of indicesfor landscape pattern. For example for an assessmentbased on patch size, IUCN RLE evaluates how rapidlythe estimated patch size is declining towards the col-lapse threshold (expressed as a size distribution, per-centile or some other metric) over the specifiedassessment time scales, rather than whether patch sizewas smaller than an absolute threshold at the presenttime. These important characteristics of the IUCNRLE provide a useful framework for synthesis ofprocesses that other protocols intend to address,and therefore offer an opportunity to producemore accurate and consistent ecosystem-specific riskassessments.
UNCERTAINTY
Uncertainty is pervasive in ecosystem risk assessment(Regan et al. 2003; Nicholson et al. 2009; Keithet al. 2013). Key sources of uncertainty include: (i)incomplete knowledge, such as lack of data, poorunderstanding of key processes and model uncer-tainty; (ii) uncertain delineation of ecosystems in mapsand mapping error; (iii) natural variability; and (iv)linguistic uncertainty due to vagueness (Regan et al.2002). Two key sources of uncertainty specific to eco-system risk assessment lie in the definition of an eco-system, and uncertainty about when an ecosystem maybe considered collapsed (Nicholson et al. 2009; Keithet al. 2013). Only four of the protocols we reviewedacknowledged or dealt with these uncertainties (IUCNRLE, EPBC Act, NSW and ACT).
Two complementary methods for dealing withuncertainty were represented among the protocols.The first involved a designated category for data defi-cient ecosystems. This category is assigned if too fewdata exist to support an assessment of any of the cri-teria (i.e. threatened and non-threatened status areequally likely outcomes, given the available data). Onlythe IUCN RLE, the EPBC Act and ACT incorporatedthis feature. None of the other Australian protocolsformally distinguished data deficient ecosystems fromthose not evaluated or from those evaluated but failingto qualify for threatened status.
CONSISTENT ECOSYSTEM RED LISTS 11
© 2014 The Authors doi:10.1111/aec.12148Austral Ecology © 2014 Ecological Society of Australia
The second method estimates the magnitude ofuncertainty in each assessment variable (e.g. with con-fidence bounds), and propagates this through theassessment to obtain a plausible range of threat cat-egories for each ecosystem (Burgman et al. 1999;Akçakaya et al. 2000). This is especially useful for lesscertain variables, such as the historic declines in dis-tribution and function. The IUCN RLE and NSWprotocols incorporated methods and guidelines forsuch implementation, largely derived from methodsused in assessments of Red Listed species (IUCN2013). The EPBC Act guidelines also identifiedbounded best estimates as a means of representinguncertainty, but provided less detail on how theseshould be used in assessments (TSSC 2004).
COMPARISON OF THE OUTCOMESOF PROTOCOLS
To compare the assessment outcomes based on thedifferent protocols, we compiled 13 case studies ofecosystems listed nationally under the EPBC Actand/or at a state level within Australia (Table 3). Forthose not assessed with the IUCN RLE (Keith et al.2013, we applied the IUCN RLE criteria. We inter-preted equivalence of categories as described above(see ‘Categories of threat’; Figs 1, 2). There were onlythree discrepancies and four partial discrepancies(where plausible ranges of threat overlapped) betweenthreat categories assigned by different protocolsamong the 41 assessments of 13 ecosystems, althoughdifferent criteria were invoked across protocols. Thesediscrepancies are likely historical artefacts of the listingprocess, where ecosystems were originally listed as ENunder earlier Commonwealth and NSW listing regu-lations that did not include the CR category. Revisedassessments under the updated EPBC and NSW pro-tocols may yet produce a CR outcome, in agreementwith IUCN RLE.
These results suggest that closer alignment ofAustralian protocols with the IUCN RLE criteria isunlikely to result in radical change to current listings.A high level of concordance may be expected, despitethe differences in criteria described above, giventhat the overall symptoms of threat addressed bythe criteria and the intent of the protocols weresimilar.
DISCUSSION
There were strong overarching similarities amongAustralian risk assessment protocols for ecosystems.Key similarities included: the definition of assessmentunits; the rule-set structure of the protocols; the cat-egories of threat; and the main types and underlying
intent of assessment criteria for assessing distribu-tional decline, restricted size of distribution and func-tional decline. There were differences in how criteriawere expressed, whether criteria on ecosystem func-tion were quantitative or qualitative, the quantitativethresholds for decline and distribution size, and thescaling of measured spatial variables. Our systematiccomparison based on each component of risk assess-ment (structure, categories, definitions and support-ing concepts, criteria, thresholds and outcomes) alsoprovides a useful framework for identifying opportu-nities for harmonizing approaches within otherregions such as Europe and the Americas.
In general, the high level of concordance in assess-ment outcomes suggests that the differences amongAustralian protocols were subtle compared withthe overarching similarities. However, the fact thatthe same status was triggered by different criteriaacross different protocols suggests a compensatoryeffect of errors. Testing of a broader sample of eco-systems may therefore reveal a more conspicuouseffect of differences in listing criteria on assessmentoutcomes. Likely sources of any effect include diver-gence in qualitative assessments of functionaldeclines and differences in distribution thresholdsand scaling.
Although Hawke (2009) strongly recommendedgreater alignment of listing processes across Australianjurisdictions, little detail was provided on how thiscould be achieved. It is important to recognize thatdifferent jurisdictions have different responsibilitiesfor environmental management, and therefore havedifferent needs for risk assessment. For example,local regulatory responsibilities demand assessmentsof finer-scale assemblages than is required for globalenvironmental reporting against Aichi targets. Ratherthan seek identical listings across all jurisdictions, thegoals of harmonization should be to achieve consist-ency of approach and methods in risk assessment andto ensure transparent cross-reference between listedunits defined at different thematic scales in differentjurisdictions, for example through a hierarchicalclassification.
We suggest that significant progress could beachieved towards harmonization through greater con-gruence with the international standard establishedby the IUCN RLE (Keith et al. 2013). This providesa strong theoretical synthesis of all elements repre-sented across the other protocols and overcomessome significant methodological limitations related toquantification of change in ecosystem function, defi-nition of the endpoint of decline and spatial scalingof distribution data. The IUCN RLE criteria are sup-ported by a lucid and detailed exposition of under-lying theory, as well as guidelines and illustrativeexamples (Keith et al. 2013). In comparison, sup-porting documentation of the Australian protocols,
12 E. NICHOLSON ET AL.
© 2014 The Authorsdoi:10.1111/aec.12148Austral Ecology © 2014 Ecological Society of Australia

Table 3. Risk assessment outcomes for a representative sample of ecosystems assessed under global (IUCN RLE), national(EPBC) and various state listing protocols: threat status (CR = critically endangered, EN = endangered, VU = vulnerable);over-arching criterion/criteria under which the ecosystem is listed, with protocol specific criterion in parentheses; and majorthreats to the ecosystem (all links were accessed on 19 June 2014)
Ecosystem IUCN RLE status EPBC Act status State status Major threats
Coolibah – Black Boxwoodland
EN: Decline in function(abiotic environment,C1) (Supplementarymaterial, Keith et al.2013).
EN: Restricteddistribution (patchsize, 2c); reductionin integrity (4)(TSSC 2011).
Qld EN: EPBC unit included 5Regional ecosystems (11.3.3,11.3.15, 11.3.16, 11.3.28 and11.3.37) listed as Of Concern (cf.EN), mainly due to decline indistribution (since 1750), but alsodecline in function (QueenslandHerbarium 2013).
NSW EN: Reduction in distribution;decline in function1.
Land clearing,changedhydrologicalregime,grazing, weedinvasion.
Blue Gum High Forest CR: Decline indistribution (since1750, A3); restricteddistribution (AOO,B2).
CR: Decline indistribution (since1750, 1);Restricteddistribution (AOO,2a; patch size, 2c);decline in function(4) (TSSC 2005).
NSW CR: Decline in distribution;Restricted distribution (AOO);Decline in function2.
Land clearing,weed invasion.
Cumberland PlainWoodland
CR: Decline indistribution (since1750, A3) (Tozer et al.2014).
CR: Restricteddistribution (patchsize, 2c); decline infunction (4)(TSSC 2008a).
NSW CR: Decline in distribution;Decline in function3.
Land clearing,weed invasion.
Coastal sandstoneupland swamps4
EN (EN-CR): Declinein function (abioticenvironment, C2).
EN (Underconsideration forlisting): restricteddistribution (AOO2b, patch size 2c),continuingdetrimental change(5)5.
NSW EN: Projected decline indistribution, restricted distribution,projected decline in function6.
Climate change(moisture)subsidence dueto longwallmining, landclearing.
Semi-evergreen vinethicket (stateassessment)
EN: Decline indistribution (since1750, A3), restricteddistribution (AOO,B2).
EN: Restricteddistribution (2)7.
NSW EN: Decline in distribution,restricted distribution8.
Land clearing,grazing,changed fireregimes, weedinvasion.
Acacia loderi shrubland EN: Decline in function(biotic processes, D3).
NSW EN: Decline in function9. Overgrazing, lackof regenerationof key species.
Gnarled Mossy CloudForest, Lord HoweIsland
CR: Restricteddistribution (EOO, B1;AOO, B2) (Auld andLeishman 2014)
NSW CR: Restricted distribution,projected decline in function10.
Anthropogenicclimate change,predation byrats of keyspecies.
Eastern Stirling RangeMontane Heath andThicket
CR: restricteddistribution (EOO, B1;AOO, B2) (Barrettand Yates 2014).
EN: Restricteddistribution (2)11.
WA CR: Restricted distribution (EOO)and threats (Barrett 2000).
Root rot disease.
Shrublands onsouthern SwanCoastal Plainironstones(Busselton Ironstoneshrublands)
CR: Decline indistribution (past 50years, A1; since 1750,A3), Restricteddistribution (EOO,B1) (English andKeith 2014)
EN: Restricteddistribution (2)12.
WA CR: Restricted distribution (EOO)and ongoing threats (Meissner andEnglish 2005).
Root rot disease,hydrologicalchange, weedinvasion,altered fireregimes.
Broad leaf tea-tree(Melaleucaviridiflora)woodlands in highrainfall coastal northQueensland
EN: Decline indistribution (since1750, A3).
EN: Decline indistribution (since1750, 1); decline infunction (4)(TSSC 2012).
Qld CR-EN: EPBC unit includes 3Regional Ecosystems (7.3.8, 8.3.2and 8.5.2) listed as EN (cf. CR inIUCN RLE and EPBC) and 2 (7.5.4and 8.5.6) listed as Of Concern (EN),mainly due to decline in distribution(since 1750), but also decline infunction and restricted distribution(Queensland Herbarium 2013).
Land clearing soildegradation.
CONSISTENT ECOSYSTEM RED LISTS 13
© 2014 The Authors doi:10.1111/aec.12148Austral Ecology © 2014 Ecological Society of Australia

like others implemented elsewhere around the world(Nicholson et al. 2009), generally failed to articulatea clear or comprehensive justification for many oftheir structural features and sometimes failed toguide interpretation.
At a policy level, harmonization of local jurisdictionswith the IUCN RLE would position Australia and othercountries to implement their international responsibilitiesunder the CBD and to report on Aichi targets (COP102010) more efficiently and effectively than if encumberedwith different listing processes. Such alignment with an
international protocol is not unprecedented: most Aus-tralia jurisdictions applycriteria for assessing species threatthat are generally aligned with the IUCN Red List ofThreatened Species (Nicholson et al. 2009; IUCN 2013).The similarity of risk assessment outcomes from differentprotocols suggested that greater consistency of listingprocedures could be achieved without substantial changesin listing outcomes across Australian jurisdictions. Werecommend how Australian jurisdictions could moreclosely align with the new international standard inTable 4.
Table 3. Continued
Ecosystem IUCN RLE status EPBC Act status State status Major threats
Box-Gum GrassyWoodland andDerived GrasslandCommunities
CR: Decline indistribution (since1750, A3), Decline infunction (bioticprocesses, D3).
CR: Decline indistribution (since1750, 1); decline infunction (4)(TSSC 2006).
Qld CR-EN: EPBC unit includes mostor part of 6 Regional Ecosystems(13.3.1, 13.11.8, 13.12.8, 13.12.9,11.3.23, 13.3.4) listed as EN (cf. CRin IUCN RLE and EPBC) and 3regional ecosystems (12.8.16,13.11.3 and 13.11.4) listed as OfConcern (EN), mainly due to declinein distribution (since 1750), but alsodecline in function and restricteddistribution, with a further 3 of LeastConcern (LC) (QueenslandHerbarium 2013).
NSW EN: Decline in distribution,decline in function13.
Vic: Broader EPBC unit includes threecommunities listed locally as EN (cf.CR in IUCN RLE and EPBC) inmost bioregions (locally in some asVU, cf. EN in IUCN RLE andEPBC)14.
Land clearing,fragmentation,overgrazing,exotic species.
Weeping MyallWoodlands
EN: Decline indistribution (since1750, A3).
EN: Decline indistribution (since1750, 1); decline infunction (4)(TSSC 2008b).
Qld EN: Minor component of twomore broadly defined RegionalEcosystems (11.3.2 and 11.3.28)listed as Of Concern (EN) due todecline in distribution (since 1750)(Queensland Herbarium 2013).
NSW EN: Decline in distribution,decline in function15.
Land clearing,fragmentation,shrub decline,weed invasion.
Swamps of theFleurieu Peninsula16
CR: restricteddistribution (EOO, B1;AOO, B2).
CR: Decline indistribution (since1750, 1); decline infunction (4).
SA CR17: restricted distribution (B1,B2)
Land clearing,fragmentation,wetlanddegradation.
1NSW: http://www.environment.nsw.gov.au/threatenedSpeciesApp/profile.aspx?id=101752NSW: http://www.environment.nsw.gov.au/threatenedSpeciesApp/profile.aspx?id=100943NSW: http://www.environment.nsw.gov.au/threatenedSpeciesApp/profile.aspx?id=101914the threat status of the Coastal sandstone upland swamps and Acacia loderi shrubland is uncertain under the IUCN RLE, and therefore a
plausible range of threat categories is shown5EPBC Act: http://www.environment.gov.au/node/350856NSW: http://www.environment.nsw.gov.au/threatenedSpeciesApp/profile.aspx?id=202617EPBC Act: http://www.environment.gov.au/node/145528NSW: http://www.environment.nsw.gov.au/threatenedSpeciesApp/profile.aspx?id=107499NSW: http://www.environment.nsw.gov.au/threatenedSpeciesApp/profile.aspx?id=1001710NSW: http://www.environment.nsw.gov.au/threatenedSpeciesApp/profile.aspx?id=2026311EPBC Act: http://www.environment.gov.au/biodiversity/threatened/communities/east-stirling.html12EPBC Act: http://www.environment.gov.au/biodiversity/threatened/communities/swan-ironstone.html13NSW: http://www.environment.nsw.gov.au/threatenedSpeciesApp/profile.aspx?id=1083714Vic: http://www.dse.vic.gov.au/conservation-and-environment/ecological-vegetation-class-evc-benchmarks-by-bioregion15NSW: http://www.environment.nsw.gov.au/threatenedSpeciesApp/profile.aspx?id=2003016EPBC Act: http://www.environment.gov.au/node/1452117South Australia is currently trialling the IUCN RLE criteria for listing ecosystems.
14 E. NICHOLSON ET AL.
© 2014 The Authorsdoi:10.1111/aec.12148Austral Ecology © 2014 Ecological Society of Australia
One of the most significant advances in the IUCNRLE protocol is its methodological framework forquantitatively and transparently assessing decline inecological function for a wide range of degradationprocesses. The Australian protocols relied predomi-nantly on qualitative approaches to assess functionaldeclines (Table 2). This makes it very difficult toassess functional decline and degradation consistentlyacross different ecosystems with different assessors.The IUCN RLE approach (Table 4) is more trans-parent, conceptually comprehensive, strikes a balancebetween consistency and flexibility, and strongly jus-tifies assessments of declines in ecosystem function.Improved assessment of processes and ecologicalfunction, rather than only patterns, is key to robustrisk assessment.
A second important recommendation for harmoni-zation with the international standard is to avoid con-flating risk assessment with management and policyactions and priorities. The separation of these pro-cesses has been persuasively argued to ensure accurateenvironmental reporting (Possingham et al. 2002;Mace et al. 2008; Rodríguez et al. 2011). NSW pro-vides the best example of implementing this principal.Its listing criteria exclude management considerationsand uniquely, as far as we are aware, a scientific com-mittee has statutory responsibility for risk assessment,fully independent of environmental regulation andplanning activity. The conflation of risk assessmentwith management and policy, which occurs to varyingdegrees in other jurisdictions, is unsurprising giventhat one of the principal applications of risk assess-ment is to guide the implementation of statutoryresponsibilities for environmental regulation by gov-ernment agencies. Devices such as condition catego-
ries and recoverability criteria are a means of focussingregulatory and management priorities on the occur-rences thought to be most likely to persist and respondto management (TSSC 2013b). This of course is sen-sible, but has an opportunity cost if the prioritizationprocess is not separated from the listing process. Insuch cases, listings will reflect management issues tovarying degrees and may obscure underlying changesin status of biodiversity, reducing the value of threat-ened ecosystem lists as environmental reporting tools.Improved transparency and accuracy in environmentalreporting could be achieved by avoiding the use ofcondition classes in the definition of ecosystem typesand by excluding listing criteria that addressrestorability or recoverability of ecosystem degradation(Table 4).
Another important recommendation is to alignthe equivalent threat categories across the proto-cols and label them with the same names.This will resolvelinguistic confusion (Regan et al. 2002) and facilitate clearand accurate communication across jurisdictions.
Encouragingly, some progress has already beenmade towards alignment. The South Australian Gov-ernment, which previously lacked a risk assessmentprocess for ecosystems, has adopted the IUCN RLEas the basis for preparing a listing of threatened eco-systems within that state (Bonifacio & Pisanu 2012).The EPBC Threatened Species Scientific Committeehas amended its guidelines so that its thresholds forassessing decline in distribution are identical to thosein the IUCN RLE. We believe this progress illustrateshow scientists can interact productively with policymakers to achieve stronger, more effective evidence-based policy and management outcomes for biodiver-sity conservation.
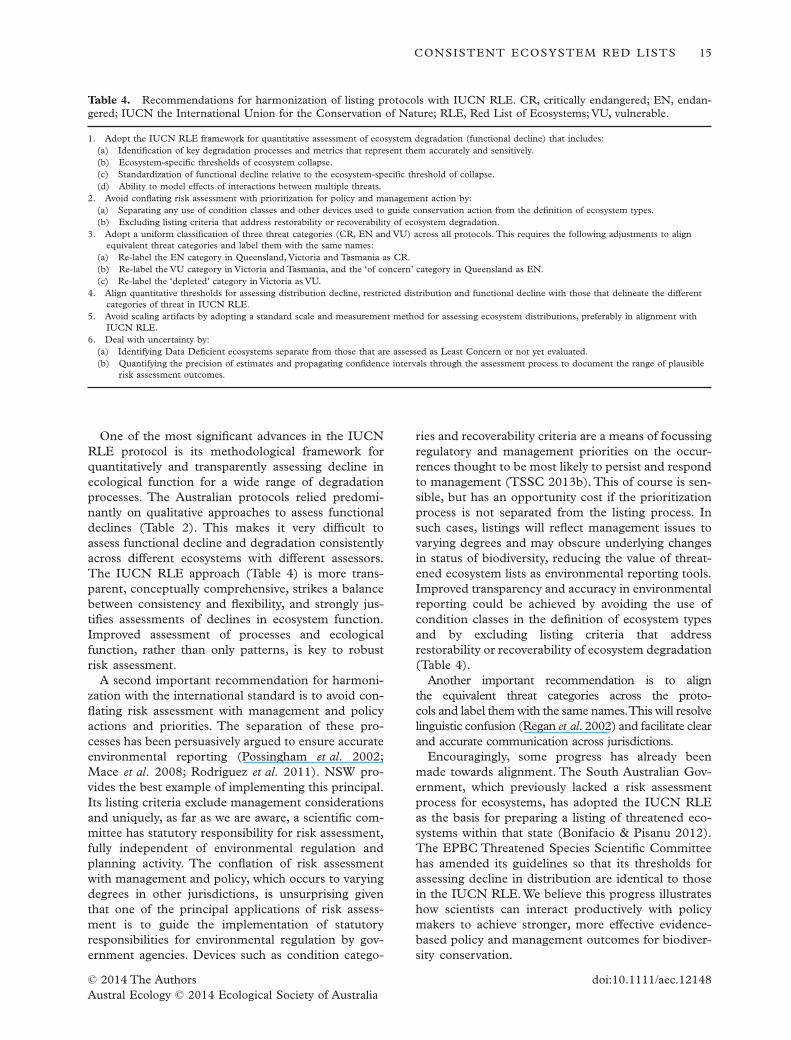
Table 4. Recommendations for harmonization of listing protocols with IUCN RLE. CR, critically endangered; EN, endan-gered; IUCN the International Union for the Conservation of Nature; RLE, Red List of Ecosystems; VU, vulnerable.
1. Adopt the IUCN RLE framework for quantitative assessment of ecosystem degradation (functional decline) that includes:(a) Identification of key degradation processes and metrics that represent them accurately and sensitively.(b) Ecosystem-specific thresholds of ecosystem collapse.(c) Standardization of functional decline relative to the ecosystem-specific threshold of collapse.(d) Ability to model effects of interactions between multiple threats.
2. Avoid conflating risk assessment with prioritization for policy and management action by:(a) Separating any use of condition classes and other devices used to guide conservation action from the definition of ecosystem types.(b) Excluding listing criteria that address restorability or recoverability of ecosystem degradation.
3. Adopt a uniform classification of three threat categories (CR, EN and VU) across all protocols. This requires the following adjustments to alignequivalent threat categories and label them with the same names:
(a) Re-label the EN category in Queensland, Victoria and Tasmania as CR.(b) Re-label the VU category in Victoria and Tasmania, and the ‘of concern’ category in Queensland as EN.(c) Re-label the ‘depleted’ category in Victoria as VU.
4. Align quantitative thresholds for assessing distribution decline, restricted distribution and functional decline with those that delineate the differentcategories of threat in IUCN RLE.
5. Avoid scaling artifacts by adopting a standard scale and measurement method for assessing ecosystem distributions, preferably in alignment withIUCN RLE.
6. Deal with uncertainty by:(a) Identifying Data Deficient ecosystems separate from those that are assessed as Least Concern or not yet evaluated.(b) Quantifying the precision of estimates and propagating confidence intervals through the assessment process to document the range of plausible
risk assessment outcomes.
CONSISTENT ECOSYSTEM RED LISTS 15
© 2014 The Authors doi:10.1111/aec.12148Austral Ecology © 2014 Ecological Society of Australia

ACKNOWLEDGEMENTS
This work stemmed from a workshop funded by theAustralian Centre for Ecological Analysis and Synthe-sis (ACEAS) and Australian Research CouncilLinkage Grant LP LP130100435 awarded to DAK,EN, TJR, RTK, TDA and PP. We thank R. Holdaway,E. Wright and S. Long for discussions and commentson the manuscript. EN was funded by a CentenaryResearch Fellowship from the Faculty of Science atThe University of Melbourne.
REFERENCES
ACT (2012) Nature Conservation Act 1980. Australian CapitalTerritory, Canberra.
Akçakaya H. R., Ferson S., Burgman M. A., Keith D. A., Mace G.M. & Todd C. R. (2000) Making consistent IUCN classifi-cations under uncertainty. Conserv. Biol. 14, 1001–13.
Auld T. & Leishman M. R. (2014) Ecosystem risk assessment forGnarled Mossy Cloud Forest, Lord Howe Island, Australia.Austral Ecol. in press (this issue).
Barrett S. & Yates C. (2014) An IUCN assessment of a montaneecosystem in Mediterranean climate Western Australia: thedecline of the Eastern Stirling Range Montane Heath andThicket. Austral Ecol. in press (this issue).
Bender D. J., Tischendorf L. & Fahrig L. (2003) Using patchisolation metrics to predict animal movement in binarylandscapes. Landsc. Ecol. 18, 17–39.
Bonifacio R. & Pisanu P. (2012) The Threatened EcologicalCommunities (TECs) Project, Progress Report January toJune 2012. Department of Environment and NaturalResources, South Australia, Adelaide.
Burgman M., Keith D. & Walshe T. (1999) Uncertainty incomparative risk analysis for threatened Australian plantspecies. Risk Anal. 19, 585–98.
Commonwealth of Australia (1999) Environment Protectionand Biodiversity Conservation Act, Act No. 91 (includingamendments to 2013). Commonwealth of Australia.
Commonwealth of Australia (2000) Environment Protectionand Biodiversity Conservation Regulation 7.02: Criteria forListing Threatened Ecological Communities, StatutoryRules 2000 No. 181 (including amendments to 2013).Commonwealth of Australia.
Council of the European Communities (1992) Council directive92/43/EEC of 21 May 1992 on the conservation of naturalhabitats and of wild fauna and flora. Official Journal of theEuropean Communities, Series L 206, 7–50.
COP10 (2010) Conference of the Parties to the Conventionon Biological Diversity. Decision X/2, Strategic Plan forBiodiversity 2011-2020. Convention On BiologicalDiversity.
DEC (2010) Definitions, Categories and Criteria forThreatenedand Priority Ecological Communities. Department of Con-servation and Environment, Perth, Western Australia.
DNRE (2002) Victoria’s Native Vegetation Management: AFramework For Action.Victorian Government Departmentof Natural Resources and Environment, Melbourne,Australia.
DPIWE (2007) Threatened Native Vegetation Communities:Process for Listing/delisting Communities. Department of
Primary Industries, Parks,Water and Environment, Hobart,Tasmania.
English V. & Blyth J. (1999) Development and application ofprocedures to identify and conserve threatened ecologicalcommunities in the South-west Botanical Province of WA.Pac. Conserv. Biol. 5, 124–38.
English V. & Keith D. A. (2014) Assessing risks to ecosystemswithin biodiversity hotspots: a case study from southwesternAustralia. Austral Ecol. in press (this issue).
ESCAVI (2003) Executive Steering Committee for AustralianVegetation Information, Australian Vegetation AttributeManual: National Vegetation Information System, Ver-sion 6.0. Department of the Environment & Heritage,Canberra.
ESSS (2000) Commonwealth Listing Advice on Aquaticroot mat communities 1, 2, 3 and 4 in caves of the LeeuwinNaturaliste Ridge: Advice to the Minister for the Environ-ment and Heritagefrom the Endangered Species ScientificSubcommittee (ESSS) on a Proposal to Add an EcologicalCommunity to Schedule 2 of the Endangered SpeciesProtection Act 1992 (ESP Act). Minister for the Environ-ment and Heritage, Commonwealth of Australia,Canberra.
Flora and Fauna Committee (2008) Nature Conservation(Criteria and Guidelines for Declaring Threatened Speciesand Communities) Determination, made under the NatureConservation Act 1980. Australian Capital Territory.
Government of South Africa (2004) National Environmen-tal Management: Biodiversity Act (Act 10 of 2004). Gov-ernment Gazette Vol. 467 No. 26436, Cape Town.
Government ofTasmania (2002) Nature Conservation Act 2002.Hobart, Tasmania.
Harris S. & Kitchener A. (2005) From Forest to Fjaeldmark.Descriptions of Tasmania’s Vegetation. Department ofPrimary Industries, Parks,Water and Environment, PrintingAuthority of Tasmania. Hobart.
Hawke A. (2009) The Australian Environment Act – Report ofthe Independent Review of the Environment Protection andBiodiversity Conservation Act 1999. Commonwealth ofAustralia, Canberra.
Holdaway R. J., Wiser S. K. & Williams P. A. (2012) Statusassessment of New Zealand’s naturally uncommonecosystems. Conserv. Biol. 26, 619–62.
IUCN (2001) IUCN Red List Categories and Criteria: Version3.1. IUCN Species Survival Commission, Gland,Switzerland.
IUCN (2013) Guidelines for Using the IUCN Red List Catego-ries and Criteria: Version 10.0. Standards and PetitionsWorking Group for the IUCN Species Survival Commis-sion, Biodiversity Assessments Sub-Committee, Gland,Switzerland.
Keith D. A. (2009) The interpretation, assessment and conser-vation of ecological communities. Ecol. Manage. Restor. 10,S3–15.
Keith D. A., Rodríguez J. P., Rodríguez-Clark K. M. et al. (2013)Scientific foundations for an IUCN Red List of Ecosystems.PLoS ONE 8, e62111.
Lindenmayer D. B. & Fischer J. (2007) Tackling the habitatfragmentation panchreston. Trends Ecol. Evol. 22, 127–32.
Mace G. M., Collar N. J., Gaston K. J. et al. (2008) Quantifica-tion of extinction risk: IUCN’s system for classifying threat-ened species. Conserv. Biol. 22, 1424–42.
McGarigal K., Cushman S. A., Neel M. C. & Ene E. (2002)FRAGSTATS: Spatial Pattern Analysis, Program for
16 E. NICHOLSON ET AL.
© 2014 The Authorsdoi:10.1111/aec.12148Austral Ecology © 2014 Ecological Society of Australia

Categorical Maps. Computer software program producedby the authors at the University of Massachusetts, Amherst.
Master L. L., Faber-Langendoen D., Bittman R. et al. (2007)NatureServe Conservation Status Factors. NatureServe,Arlington.
Neldner V. J., Wilson B. A., Thompson E. J. & Dillewaard H. A.(2012) Methodology for Survey and Mapping of RegionalEcosystems and Vegetation Communities in Queensland.Version 3.2. Updated August 2012. p. 124. QueenslandHerbarium, Queensland Department of Science, Informa-tion Technology, Innovation and the Arts, Brisbane.
New SouthWales Government (1995) Threatened Species Con-servation Act, No 101. New South Wales, Australia.
New SouthWales Government (2010) Threatened Species Con-servation Regulation 2010 under the Threatened SpeciesConservation Act 1995. NSW, Australia.
Nicholson E., Keith D. A. & Wilcove D. S. (2009) Assessing thethreat status of ecological communities. Conserv. Biol. 23,259–74.
NSW Scientific Committee (1998) The Shorebird CommunityOccurring on the Relict Tidal Delta Sands at Taren Point –Endangered Ecological Community Determination – FinalScientific Committee Determination. DEC (NSW), Sydney.
NSW Scientific Committee (2001) Mount CanobolasXanthoparmelia Lichen Community – Endangered Eco-logical Community Determination – Final. DEC (NSW),Sydney.
NSW Scientific Committee. (2012) Guidelines for InterpretingListing Criteria for Species, Populations and EcologicalCommunities under the NSW Threatened Species Conser-vation Act, Version 1.3. January 2012. Office of Environ-ment and Heritage, Sydney NSW.
Possingham H. P., Andelman S. J., Burgman M. A., Medellín R.A., Master L. L. & Keith D. A. (2002) Limits to the use ofthreatened species lists. Trends Ecol. Evol. 17, 503–7.
Preston B. J. & Adam P. (2004) Describing and listing threatenedecological communities under the Threatened Species Con-servation Act 1995 (NSW): part 2 – the role of supplemen-tary descriptors and the listing process. Environ. Plann. LawJ. 21, 372–90.
Queensland Government (1999) Vegetation Management Act.Queensland Government, Brisbane, Australia.
Queensland Herbarium (2013) Regional Ecosystem DescriptionDatabase (REDD).Version 6.1 (February 2013). [Cited 19June 2014.] Available from URL: http://www.ehp.qld.gov.au/ecosystems/biodiversity/regional-ecosystems/
Regan H. M., Akçakaya H. R., Ferson S., Root K. V., Carroll S.& Ginzburg L. R. (2003) Treatments of uncertainty andvariability in ecological risk assessment of single-speciespopulations. Human Ecol. Risk Assess. 9, 889–906.
Regan H. M., Colyvan M. & Burgman M. A. (2002) A taxonomyand treatment of uncertainty for ecology and conservationbiology. Ecol. Appl. 12, 618–28.
Rodríguez J. P., Rodríguez-Clark K. M., Baillie J. E. M. et al.(2011) Establishing IUCN Red List Criteria for threatenedecosystems. Conserv. Biol. 25, 21–9.
Rodríguez J. P., Rodríguez-Clark K. M., Keith D. A. et al. (2012)The IUCN Red List of Ecosystems. SAPIENS 5. [Cited 19June 2014.] Available from URL: http://sapiens.revues.org/1286
Rodriguez J. P., Balch J. K. & Rodriguez-Clark K. M. (2007)Assessing extinction risk in the absence of species-level data:quantitative criteria for terrestrial ecosystems. Biodivers.Cons. 16, 183–209.
Tansley A. G. (1935) The use and abuse of vegetational conceptsand terms. Ecology 16, 284–307.
Tozer M. G., Leishman M. R. & Auld T. D. (2014) Ecosystemrisk assessment for Cumberland Plain Woodland, NewSouth Wales, Australia. Austral Ecol. in press (this issue).
Tozer M. G., Turner K., Simpson C. et al. (2006) Native Veg-etation of Southeast NSW: A Revised Classification andMap for the Coast and Eastern Tablelands. Version 1.0.NSW Department of Environment and Conservation, NSWDepartment of Natural Resources, Sydney.
TSSC (2004) Ecological Communities: A Way Forward.Threat-ened Species Scientific Committee, Commonwealth of Aus-tralia, Canberra, Australia.
TSSC (2006) Commonwealth Listing and Conservation AdviceonWhite Box-Yellow Box-Blakely’s Red Gum GrassyWood-land and Derived Native Grassland from the ThreatenedSpecies Scientific Committee (TSSC) under the Environ-ment Protection and Biodiversity Conservation Act 1999(EPBC Act). Minister for the Environment and Heritage,Commonwealth of Australia, Canberra.
TSSC (2010a) Commonwealth Listing Advice on Thrombolite(microbialite) Community of a Coastal Brackish Lake (LakeClifton) from the Threatened Species Scientific Committee(TSSC) under the Environment Protection and BiodiversityConservation Act 1999 (EPBC Act). Minister for the Envi-ronment and Heritage, Commonwealth of Australia,Canberra.
TSSC (2010b) Guidelines for Nominating and Assessing theEligibility for Listing of Ecological Communities as Threat-ened according to the Environment Protection and Biodi-versity Conservation Act 1999 (EPBC Act) and the EPBCRegulations 2000. Threatened Species Scientific Commit-tee, Commonwealth of Australia, Canberra.
TSSC (2013a) Commonwealth Listing and ConservationAdvice for Lowland Grassy Woodland in the South EastCorner Bioregion from the Threatened Species ScientificCommittee (TSSC) under the Environment Protection andBiodiversity Conservation Act 1999 (EPBC Act). Ministerfor the Environment and Heritage, Commonwealth of Aus-tralia, Canberra.
TSSC (2013b) Guidelines for Nominating and Assessing theEligibility for Listing of Ecological Communities as Threat-ened according to the Environment Protection and Biodi-versity Conservation Act 1999 (EPBC Act) and the EPBCRegulations 2000 (EPBC Regulations).Threatened SpeciesScientific Committee, Commonwealth of Australia,Canberra.
CONSISTENT ECOSYSTEM RED LISTS 17
© 2014 The Authors doi:10.1111/aec.12148Austral Ecology © 2014 Ecological Society of Australia
Related Documents