Towards a taxonomy of innovation systems Manuel Mira Godinho (ISEG/UTLisbon and CISEP, [email protected] ) Sandro F. Mendonça (ISCTE and SPRU, [email protected] ) Tiago Santos Pereira (CES and CISEP, [email protected] ) Preliminary draft: please do not quote Abstract: The concept of National Innovation System (NIS) has been recently applied in the context of developing nations even tough it was originally developed in relation to the more developed economies (Japan, Scandinavian countries, US etc.). This raises the methodological problem of knowing whether what was learnt in the study of more advanced NISs is relevant for all sorts of economies regardless the maturity of their actual innovation systems. With this question in mind an exploratory exercise is implemented. First a technique for mapping different NIS is put forward and next based on such mapping a taxonomy of NISs is proposed. The technique although simple in the steps it requires shows analytical potential. The cartography it generates allows one to compare directly different countries, by visualizing in bi-dimensional space the graphic pattern of the relevant dimensions of their respective NISs. This technique is applied to 69 countries (87.4% of the world population) and a set of 29 indicators is used to examine these NISs along eight major dimensions. With the resulting data, and with the help of cluster analysis, a taxonomy of innovation systems is proposed. That taxonomy which contains 6 major types of NISs indicates that what differentiates most the individual systems is their performance in three critical dimensions: innovation, diffusion and basic and applied knowledge. Country size and the natural resources endowment of the economies also emerge as important contingency factors underlying the overall dynamics of different NISs. Key Words: innovation, national innovation systems, economic development

Welcome message from author
This document is posted to help you gain knowledge. Please leave a comment to let me know what you think about it! Share it to your friends and learn new things together.
Transcript
Towards a taxonomy of innovation systems
Manuel Mira Godinho
(ISEG/UTLisbon and CISEP, [email protected])
Sandro F. Mendonça (ISCTE and SPRU, [email protected])
Tiago Santos Pereira
(CES and CISEP, [email protected])
Preliminary draft: please do not quote
Abstract: The concept of National Innovation System (NIS) has been recently applied in the context of developing nations even tough it was originally developed in relation to the more developed economies (Japan, Scandinavian countries, US etc.). This raises the methodological problem of knowing whether what was learnt in the study of more advanced NISs is relevant for all sorts of economies regardless the maturity of their actual innovation systems. With this question in mind an exploratory exercise is implemented. First a technique for mapping different NIS is put forward and next based on such mapping a taxonomy of NISs is proposed. The technique although simple in the steps it requires shows analytical potential. The cartography it generates allows one to compare directly different countries, by visualizing in bi-dimensional space the graphic pattern of the relevant dimensions of their respective NISs. This technique is applied to 69 countries (87.4% of the world population) and a set of 29 indicators is used to examine these NISs along eight major dimensions. With the resulting data, and with the help of cluster analysis, a taxonomy of innovation systems is proposed. That taxonomy which contains 6 major types of NISs indicates that what differentiates most the individual systems is their performance in three critical dimensions: innovation, diffusion and basic and applied knowledge. Country size and the natural resources endowment of the economies also emerge as important contingency factors underlying the overall dynamics of different NISs.
Key Words: innovation, national innovation systems, economic development

1. Introduction
The aim of this paper is to put forward a taxonomy of national innovation systems
(NISs). With that purpose in mind we will first implement a technique for mapping
innovation systems that was developed by Godinho et al. (2003). Such mapping allows
one to compare directly different NISs, by visualizing in bi-dimensional space the
graphic pattern of the relevant dimensions of each innovation system. Next the
quantitative output of this NISs mapping will be used as the basis for performing a
cluster analysis in a second step. The resulting country groupings will be analysed for
identifying the major factors separating different NISs types. This will be the basis for a
definition of a possible NISs taxonomy.
In the paper eight major dimensions along which innovation systems develop are
highlighted. These dimensions include market conditions; institutional conditions;
intangible and tangible investments; basic and applied knowledge; external
communication; diffusion; and innovation. For materialising such eight NIS dimensions
29 individual indicators were selected for a total of 69 countries. These countries range
from the most developed and largest economies in the world, through the emerging
economies, to the less advanced developing countries. For each of the 8 relevant NIS
dimensions between 2 and 6 of these 29 indicators were allocated. The definition of the
NIS dimensions and the selection of indicators tried to respect theoretical and logic
criteria of organization of the data.
Overall the data basis that was developed and the methodological steps that were taken
represent a unique attempt to cover such a large and diverse number of countries with
the aim of analysing their behaviour in terms of creating, consolidating and advancing
their national innovation systems. As it will be shown, the resulting outcomes of this
paper have empirical, theoretical and normative potential.
Following this introduction the paper is divided into five main sections. Section 2
presents the conceptual context of the mapping and taxonomisation exercise that will be
carried out. In section 3 the method followed is described, with information about the
observed NIS dimensions, about the variables aggregated into each of those dimensions
and about the economies that were selected as well. Next section 4 presents the results
1
of the empirical analysis, by concentrating first on the mapping of the individual NISs
and then on the structure that stems from a cluster analysis. The clusters that emerged
are observed thoroughly in section 5, providing an interpretation for the contrasting
positions of the different countries involved in this exercise. Finally, the concluding
section attempts at a generalization based on the analyses of the previous sections,
suggesting a possible taxonomy of national innovation systems.
2. The NIS perspective
The NIS concept has been used as a “focusing device” in bringing forward the
interdependent and distributed features of innovation. The concept was developed in the
1980s and has since had a very significant impact, both in innovation studies and in
policy arenas.
This section explores the NIS concept by analysing its evolution since the 1980s. The
understanding that emerged in the innovation literature is discussed, and the barriers
that still restrain its translation into quantitative analyses are considered. Finally, the
adequacy of using it in the context of less developed economies is discussed, namely
taking into consideration the profusion of recent work in this perspective in many
developing countries.
2.1 The qualitative dimensions of innovation
In the economics of technical change the acknowledgement of the systemic nature of
the innovation process represents a key claim in favour of considering the interactive
and historical nature of the innovation phenomenon. Such claim however embodies a
methodological option. The systems approach assumes that the appreciation of the
evolution of countries’ technological capabilities and performances makes these quite
complex objects of analysis, one cannot understand the picture without the detail.
Consequently, this stands in contrast with traditional growth accounts, which take
statistical aggregates as the privileged source of empirical information. The NIS
2
approach follows an alternative path, the awareness of concrete institutions and varieties
in macroeconomic environments are at the centre stage.
This NIS concept was initially put forward as a qualitative concept for describing the
technological, economic, social and institutional dimensions of innovation in advanced
economies. Freeman (1987) deployed it in his discussion of the Japanese innovation
system, while Lundvall (1985, 1992) and others firstly applied it in connection to the
empirical observation of the interactions and institutional framework that support
innovative activities in the Scandinavian economies. From these initial applications, the
concept was rapidly generalised to all the most advanced economies, being Nelson’s
1993 book a good example of this.
In spite of a relative variation in the definition of NIS (see Niosi, 2002) the major
contributions are convergent in highlighting the interactions between firms and
institutions as well as noting the path-dependent character of those relations. Further,
that variation can even be justified for ontological reasons: the historic nature of the
object does not allow for a single definition of innovation system. As claimed by
Lundvall (2004) “to develop ‘a general theory’ of innovation systems that abstracts
from time and space would therefore undermine the utility of the concept both as an
analytical tool and as a policy tool”.
Assuming that variation on the understanding of ‘innovation system’, the approach has
developed significantly since its inception, and several associated concepts have
emerged stressing different aspects of the innovation systems dynamics. Some of these
derived concepts refer to sub-national realities, such as in the work of Saxenian (1994)
that dealt with the local conditions in Massachusetts’ Route 128 or in Silicon Valley, or
in the work of Cooke (1998), Braczyk (1998), Landabaso (1995) or Asheim and Gertler
(2004) that refer to “regional innovation systems” in the European context. In contrast,
other approaches that derive from the initial NIS concept refer to realities which are
supra-national or that simply are not geographical in their nature. That is the case of the
“sectoral systems of innovation” approach (Breschi and Malerba 1997, Malerba 2004),
that stresses the opportunity and appropriability conditions in different sectors as key
factors in determining specific cumulativeness paths, or also the case of the
3

“technological innovation systems” approach (Carlsson et al. 1995 and 1997) that
focuses on generic technologies with general application over many industries.
All these developments of the original concept can be seen as evidence that research on
innovation has tried to capture the manifold dimensions of innovative phenomena.
However, in this paper our interest is not on how each of those derived concepts
developed and acquired its own place in the innovation literature. Rather we are interest
in the original concept and our analysis is centred on the national level, with the
objective of promoting a cartography of NISs development and characteristics.
In doing this we have to pay attention to the fact that the NIS concept was initially put
forward as a qualitative construction. It came somewhat before in time than many of the
most recent technological developments, but it is clear that it was already put forward in
connection to the central characteristics of the present competitive regime. It was not by
chance that the concept emerged in the late 1980s when the signs of a new techno-
economic paradigm were already clear, with a set of radically new technologies starting
to diffuse economy-wide (Freeman and Perez 1988, Freeman and Soete 1997). A key
feature that has differentiated the new paradigm from the previous ones is precisely the
permanence and ubiquity of innovation, which evolved from a relatively discrete and
limited occurrence to a much more pervasive aspect of economic life. In the new
paradigm firms must be involved, more than ever, in continuous innovation to remain
competitive. In this process firms allocate a greater share of their resources to the
internal production and combination of knowledge and to the external tapping of other
sources, including the research organizations and their competitors (Autio et al. 1995).
National governments have also been part of this process, by strengthening the S&T
infrastructure (Teubal et al. 1996, Rush et al. 1996) and by trying to improve the
regulatory framework and more generally the institutional conditions affecting
innovation. These developments have led to what many have classified as the
“knowledge based economy” (OECD 2000) or, in a relatively more dynamic
interpretation, to the “learning economy” (Lundvall and Borràs 1999, Gregersen and
Johnson 2001).
Summing up, innovation is central to understanding the competitive dynamics in
contemporary economies. It emerges from new combinations of knowledge and
4

depends on the institutional arrangements prevailing in each society, making it an
essentially qualitative process.
2.2 How far can we go in the quantitative analyses of NISs?
It is that qualitative nature of innovation that defies quantification. At least two recent
developments can be considered as weakening the barriers to a possible quantification.
Firstly, we might refer to the emergence and wide use of several new innovation
indicators and sources. As it is known significant advancements have been made in the
field of innovation measurement recently, through the implementation of a variety of
new indicators. This has happened since the early 1990s when a new generation of
innovation indicators has been established, adding to the classical “input” and “output”
indicators. A significant part of this new generation of indicators stems from the process
associated with the publication of the “Oslo Manual” (OECD 1992, Smith 1992) and to
the subsequent setting up of several innovation surveys, being the most prominent the
three CIS inquiries implemented by EUROSTAT in collaboration with several national
statistical offices. From the studies that have been produced with these CIS-based
indicators, it is clear that several dimensions of the innovation process which could not
be previously studied can now be approached and understood by using quantitative data
and analysis (Smith 2004, Evangelista et al. 1998). Another component of this new
generation of indicators is more recent yet, and relates to the establishing by the OECD,
the EU and other international organizations of statistics trying to reflect the diffusion of
ICTs and other related technologies. Besides this new generation the most recent period
has also witnessed to the creation and intense use, by both the academic and the policy-
making communities, of several other indicators built up from the more “classic”
bibliometric, patent, trademark and R&D statistics (Mendonça, Pereira and Godinho
2004).
The second recent development that can be seen as favouring the type of exercise we
will be undertaking in the following sections relates to a demand-side effect. Policy-
makers have been asking their advisers and researchers too for supplying them with
summary measures of their countries’ and regions’ relative innovation status. This is
part of a more general benchmarking movement, and in the area of innovation the most
5

notable result has been the production of “innovation scoreboards”.1 This type of
exercise has been criticized for tending to reduce the multidimensionality of innovation
processes to just one simple summary measure. Such scoreboards «can provide useful
information for macro level policies […], but a scoreboard is of less value as one moves
to the meso and micro level, where firms are active and where most policy actions
occur» (Arundel 2001). From this and other similar criticisms that have been put
forward we can conclude that while the summarizing need remains, excessive
simplification shall be avoided in the finding of solutions.
2.3. The NIS concept within the developing countries context
As pointed out above, the NIS concept emerged in the late 1980s and in the 1990s in the
context of research focusing on more advanced economies. More recently however this
concept has been applied more widely to the developing and intermediate economies
with several studies emerging focusing on different countries in Asia (China, e.g. Gu,
1997; India, e.g. Krishnan, 2003; Thailand, e.g. Intarakumnerd, 2004; or Vietnam, e.g.
Sinh, 2004) and Latin America (Brazil, e.g. Cassiolato et al., 2003; Mexico, e.g. Cimoli,
2003).
In a sense this new trend may be interpreted as a return to the origins. In the light of
pioneering material by Chris Freeman (2004) originally written in the early eighties but
only recently made available, the concept of national innovation system arose from the
analysis of the historical factors behind the stunning economic development of countries
like Germany and Japan that were well behind the technological frontier in the late 19th
and early 20th centuries. As Lundvall (2004) notes in his introduction to Freeman’s
paper, the Listian emphasis on governmental initiatives to build a technological
infrastructure as well as the importance attributed to the coupling between knowledge
institutions and firms represents the hallmark of modern research on innovation
systems,
1 In 2000 the EU Lisbon summit decided to develop a European Innovation Scoreboard, which is an example of this approach.
6
This recent recovery of the NIS concept in the context of the analysis of economic
development raises however the methodological problem of knowing whether what was
learnt in the study of more advanced NISs is relevant for all sorts of economies
regardless the maturity of their actual innovation systems. Such question is particularly
relevant for countries in lower and intermediate levels of development seeking to
progress to more advanced stages of economic development based upon the promotion
of endogenous innovation. Through the technique that will be presented in the next
section, we can experimentally test the validity of applying the NIS concept to those
economies.
3. The method
The technique we will deploy now is partially based on previous work of Godinho et al.
(2003). In that paper an exploratory exercise aiming at mapping different NISs was put
forward. Although simple in the steps it required to generate graphical representations
and quantitative indicators for each NIS that exercise showed that the method proposed
offered some interesting possibilities. The cartography generated by it allowed the direct
comparison of countries by visualizing in bi-dimensional space the graphic pattern of
the relevant dimensions of their respective NISs. In this way a comparative analysis of
weaker and stronger dimensions of each NIS was made possible. Further, as it was
shown this analysis could fruitfully be applied to both the more and the less advanced
economies. Now we will extend that approach to a much larger number of countries, 69
on the total, and in connection with this a set of 29 indicators will be processed. The
objective is moving on from an initial essentially exploratory stage to a more robust
work in terms of data collection, processing and analysis. This analytical quest has
practical importance for drawing normative implications, namely by illuminating the
cognitive and institutional factors that are more relevant for the economies aiming at
catching up. As stated above, the purpose of the analysis now is to identify what are the
common and differentiating factors of different types of NISs in order to propose a
taxonomy of innovation systems.
Next we will briefly describe in 3.1 the proposed technique and how it is based on the
decomposition of an innovation system in terms of a set of major dimensions. In sub-
7

section 3.2 we will present the indicators that were selected to represent each of those
major dimensions.
3.1. The NIS “dimensions” and the variables involved in the exercise
The “National Innovation System” concept is a complex model that grew out of the
1970s and 1980s innovation theory advancements that occurred as a reaction to the
archaic “linear model”. This means that many of the analytical perspectives stemming
from previous models of innovation, from the interactive vision of S&T-push and
demand-pull factors (Freeman 1979) to the chain-link perspective of innovation (Kline
and Rosenberg 1986) are now in practice part of the broader NIS theoretical framework.
However, the NIS model goes much further than these previous approaches, since it
concentrates not just on a few actors and local processes that lead to the emergence of
single innovations, but it proposes a much wider view of a system with a large diversity
actors, institutions and interactive arrangements that push forward structural change in
the economies and societies.
This complex perspective enclosed in the NIS concept is at odds with many simplifying
graphical representations of the national innovation system that have emerged. Those
representations, by focusing just on the different types of actors and the possible
connections between them, overlook a multiplicity of other aspects that are enclosed in
the NIS theorisation.
The technique we are now employing will also generate a graphical representation of
NISs, but of a different sort. We will focus on four groups of aspects in the way to
mapping and measuring the overall performance of NISs. Those groups are as follows:
(i) preconditions for innovation;
(ii) inputs into the system;
(iii) structural organization;
(iv) system outputs.
In what follows we will elaborate on each of these groups, discussing the NIS
dimensions associated with each of them and presenting (in small boxes) the indicators
8

we consider most appropriate to stand for each dimension. In reading what comes below
one must be aware that these NIS dimensions necessarily emerge, in practice, as a
compromise between innovation systems theory and the indicators which may be
gathered to stand for the different dimensions that underlie the concept of “innovation
system”.
(i) Preconditions for innovation
We will consider two sorts of innovation preconditions: first market conditions and next
institutional conditions.
In principle, for producers of tradable goods the global market represents their potential
demand. But one knows that transaction costs and innumerable other frictions, related to
geographical distance, transport costs or the availability of adequate distribution
channels, limit a perfect access to global markets. So, and given the national logic of
transportation networks, the easiness of business contacts in national language, etc., the
national market still remains in many cases as the most important stimulus for
individual firms. One can therefore admit that the larger this national market is, in terms
of overall extension, affluence and sophistication, the greater will be the market
opportunities for firms to produce and innovate. This is certainly valid mostly for non-
tradable products firms, as it is the case of many service industries, but also for many of
those firms producing tradable products.
Also important in this view of market and demand conditions is the way consumers are
spread in the national space. A territory with low population density will be much more
difficult to serve than one where the population is more densely distributed.
Dimension 1 - “Market conditions”
- Income per capita
- Overall GDP size
- Population density
A second group of preconditions relates to “institutions”. As stressed above, this is a
fundamental insight of innovation systems theory: the historic evolution of social and
9
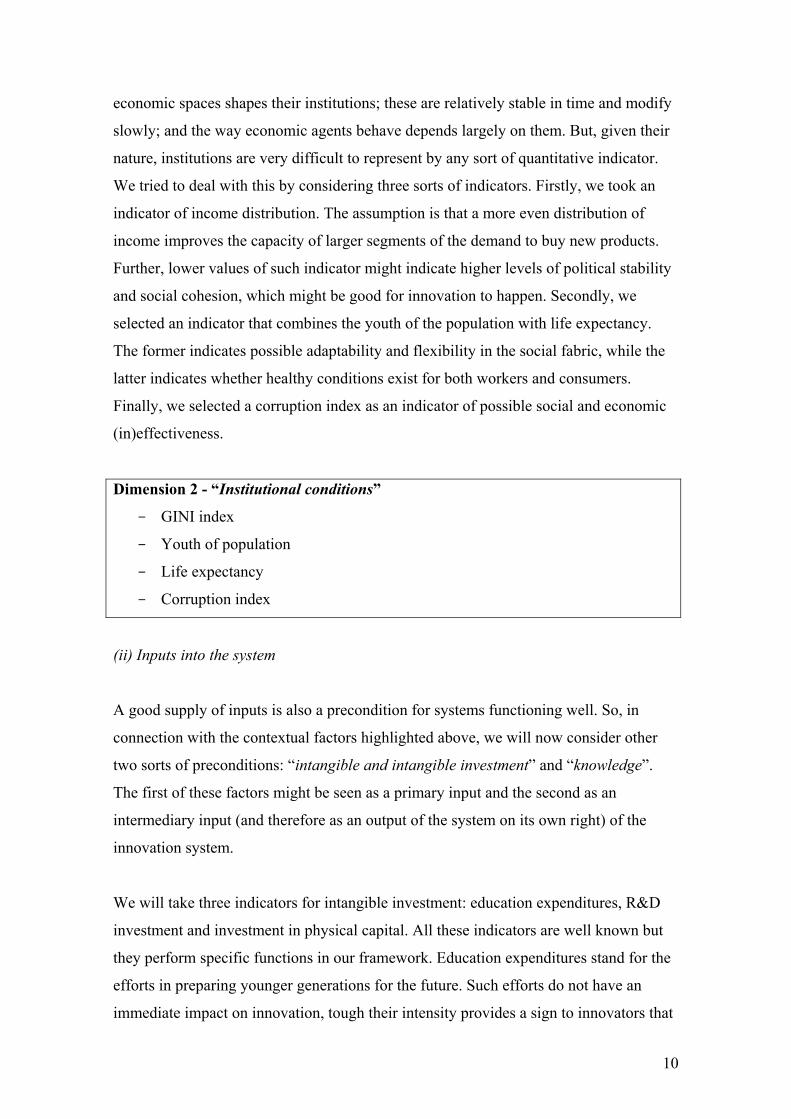
economic spaces shapes their institutions; these are relatively stable in time and modify
slowly; and the way economic agents behave depends largely on them. But, given their
nature, institutions are very difficult to represent by any sort of quantitative indicator.
We tried to deal with this by considering three sorts of indicators. Firstly, we took an
indicator of income distribution. The assumption is that a more even distribution of
income improves the capacity of larger segments of the demand to buy new products.
Further, lower values of such indicator might indicate higher levels of political stability
and social cohesion, which might be good for innovation to happen. Secondly, we
selected an indicator that combines the youth of the population with life expectancy.
The former indicates possible adaptability and flexibility in the social fabric, while the
latter indicates whether healthy conditions exist for both workers and consumers.
Finally, we selected a corruption index as an indicator of possible social and economic
(in)effectiveness.
Dimension 2 - “Institutional conditions”
- GINI index
- Youth of population
- Life expectancy
- Corruption index
(ii) Inputs into the system
A good supply of inputs is also a precondition for systems functioning well. So, in
connection with the contextual factors highlighted above, we will now consider other
two sorts of preconditions: “intangible and intangible investment” and “knowledge”.
The first of these factors might be seen as a primary input and the second as an
intermediary input (and therefore as an output of the system on its own right) of the
innovation system.
We will take three indicators for intangible investment: education expenditures, R&D
investment and investment in physical capital. All these indicators are well known but
they perform specific functions in our framework. Education expenditures stand for the
efforts in preparing younger generations for the future. Such efforts do not have an
immediate impact on innovation, tough their intensity provides a sign to innovators that
10

society has a more or less strong commitment in relation to basic knowledge
accumulation. The same happens with GERD, even tough in relation to this indicator
the impacts on innovation clearly happen in a more short-medium-term horizon. In the
sense they help promoting general and basic knowledge, both education and R&D
investments have a direct impact on the dimension we will be discussing next
(knowledge). Finally, the overall investment rate in physical capital has yet a more short
term impact, facilitating the penetration of innovation through the acquisition of capital
goods embodying new technology. This last aspect relates yet with another dimension
we will be discussing below (innovation diffusion).
Dimension 3 - “Intangible and tangible investment”
- Education expenditures as a percentage of GDP
- Education expenditures per capita
- GERD as a percentage of GDP
- GERD per capita
- Investment rate (GFCF as a percentage of GDP)
“Knowledge”, like “institutions”, is another dimension that resists to quantification.
However it is such a critical dimension of a NIS that we can not avoid dealing with it.
Three knowledge levels might be considered: general knowledge, of the type that is
acquired through participation in the education system; scientific knowledge; and
technologic knowledge. For the first level an indicator of educational attainment was
selected. For the other two levels, three indicators were envisaged: scientific
publication; number of researchers in the labour force; and tertiary enrolments in S&T
subjects. The first indicates the country’s scientific output and provides information of a
possible longer term innovation potential. The second, the number of personnel
involved in research activities, is correlated to a previous indicator (GERD/GDP), but it
is used here in connection with both scientific and technologic knowledge. The last
indicator was selected given the difficulty found in identifying an appropriate measure
for technologic knowledge. But, in line with what is argued in Fagerberg & Godinho
(2004), we admit that the higher the proportion of tertiary students enrolled in technical
subjects the stronger the society orientation towards values and behaviours that favour a
dynamic technology base.
11
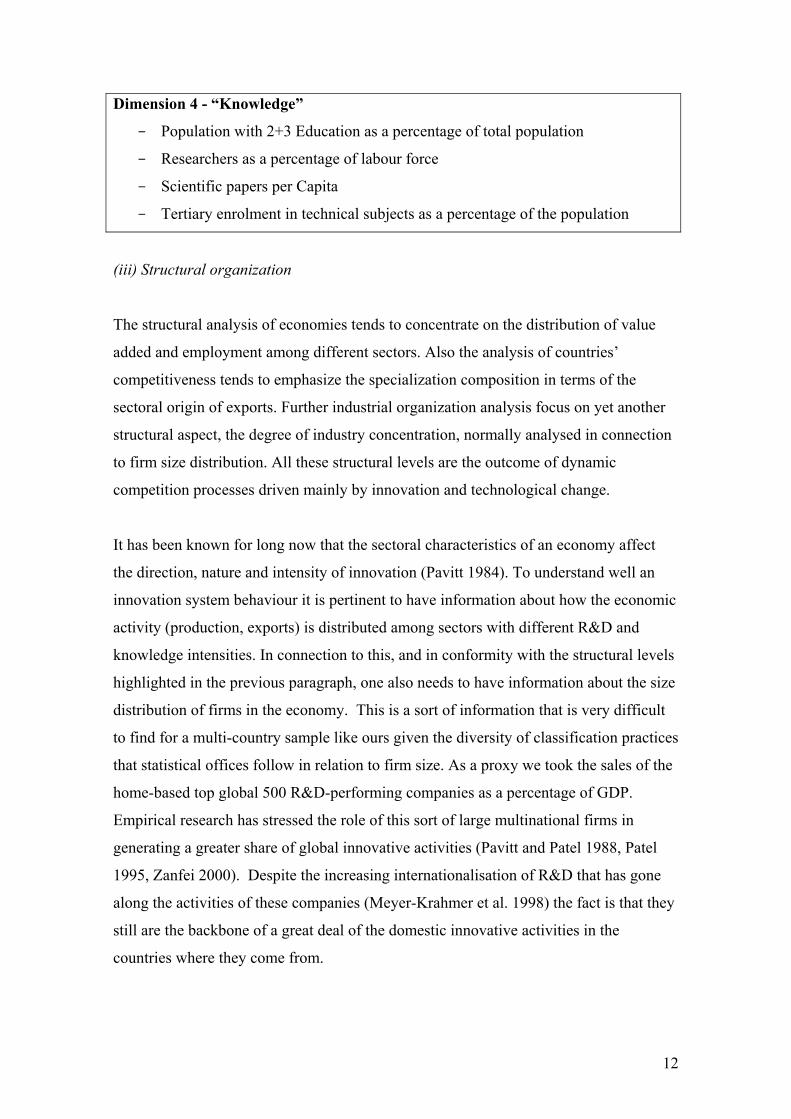
Dimension 4 - “Knowledge”
- Population with 2+3 Education as a percentage of total population
- Researchers as a percentage of labour force
- Scientific papers per Capita
- Tertiary enrolment in technical subjects as a percentage of the population
(iii) Structural organization
The structural analysis of economies tends to concentrate on the distribution of value
added and employment among different sectors. Also the analysis of countries’
competitiveness tends to emphasize the specialization composition in terms of the
sectoral origin of exports. Further industrial organization analysis focus on yet another
structural aspect, the degree of industry concentration, normally analysed in connection
to firm size distribution. All these structural levels are the outcome of dynamic
competition processes driven mainly by innovation and technological change.
It has been known for long now that the sectoral characteristics of an economy affect
the direction, nature and intensity of innovation (Pavitt 1984). To understand well an
innovation system behaviour it is pertinent to have information about how the economic
activity (production, exports) is distributed among sectors with different R&D and
knowledge intensities. In connection to this, and in conformity with the structural levels
highlighted in the previous paragraph, one also needs to have information about the size
distribution of firms in the economy. This is a sort of information that is very difficult
to find for a multi-country sample like ours given the diversity of classification practices
that statistical offices follow in relation to firm size. As a proxy we took the sales of the
home-based top global 500 R&D-performing companies as a percentage of GDP.
Empirical research has stressed the role of this sort of large multinational firms in
generating a greater share of global innovative activities (Pavitt and Patel 1988, Patel
1995, Zanfei 2000). Despite the increasing internationalisation of R&D that has gone
along the activities of these companies (Meyer-Krahmer et al. 1998) the fact is that they
still are the backbone of a great deal of the domestic innovative activities in the
countries where they come from.
12
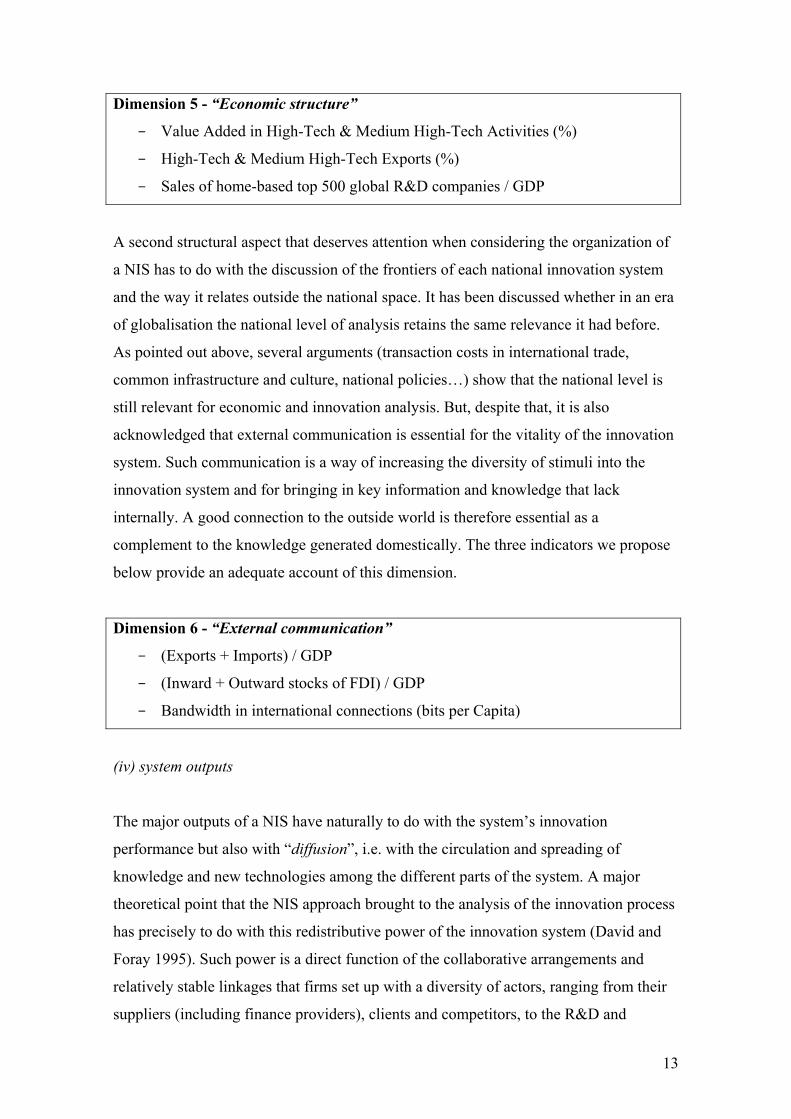
Dimension 5 - “Economic structure”
- Value Added in High-Tech & Medium High-Tech Activities (%)
- High-Tech & Medium High-Tech Exports (%)
- Sales of home-based top 500 global R&D companies / GDP
A second structural aspect that deserves attention when considering the organization of
a NIS has to do with the discussion of the frontiers of each national innovation system
and the way it relates outside the national space. It has been discussed whether in an era
of globalisation the national level of analysis retains the same relevance it had before.
As pointed out above, several arguments (transaction costs in international trade,
common infrastructure and culture, national policies…) show that the national level is
still relevant for economic and innovation analysis. But, despite that, it is also
acknowledged that external communication is essential for the vitality of the innovation
system. Such communication is a way of increasing the diversity of stimuli into the
innovation system and for bringing in key information and knowledge that lack
internally. A good connection to the outside world is therefore essential as a
complement to the knowledge generated domestically. The three indicators we propose
below provide an adequate account of this dimension.
Dimension 6 - “External communication”
- (Exports + Imports) / GDP
- (Inward + Outward stocks of FDI) / GDP
- Bandwidth in international connections (bits per Capita)
(iv) system outputs
The major outputs of a NIS have naturally to do with the system’s innovation
performance but also with “diffusion”, i.e. with the circulation and spreading of
knowledge and new technologies among the different parts of the system. A major
theoretical point that the NIS approach brought to the analysis of the innovation process
has precisely to do with this redistributive power of the innovation system (David and
Foray 1995). Such power is a direct function of the collaborative arrangements and
relatively stable linkages that firms set up with a diversity of actors, ranging from their
suppliers (including finance providers), clients and competitors, to the R&D and
13

intermediate organizations that produce and transfer S&T knowledge to the economy. In
the absence of indicators that might provide an account of these interactive patterns in
the NIS, we have to rely on more classic indicators of the diffusion of specific
innovations. These indicators have however their own merits. The first three are
combined into an aggregate indicator of ICT diffusion. The fourth refers to a consumer
product technology. The fifth has not been much used, but it seems pertinent since
indicates the diffusion of a specific type of innovative practice within the different
economies.
Dimension 7 - “Diffusion”
- Personal Computers per capita
- Internet Hosts per capita
- Internet Users per capita
- Cellular Phones per capita
- ISO 9000 + ISO 14000 Certificates per capita
Finally, we focus on the eight critical dimension to account for NISs dynamics:
“innovation”. The behaviour on this dimension results from the contextual conditions,
the resources mobilized and the overall organization of the system. We take here two
different indicators for innovation: patenting and trademark activity. The first is a well
established innovation indicator. It provides information about the sort of innovation
that derives and relates basically to technologic knowledge. The advantages and
disadvantages of this indicator are well known. We can admit that the total number of
patents granted to each country is a good indicator of innovation propensity and
potential performance.
The second indicator, trademark activity, has been recently argued for as an innovation
indicator (Mendonça et al. 2004). The idea is that this indicator provides information on
the marketing efforts that firms carry out to establish new and differentiated products in
the marketplace. The flow of new trademarks (as the flow of new patents) might
therefore be understood as an indicator of innovative efforts, in connection to the
approach of firms to the demand they are facing.
14

Dimension 8 - “Innovation”
- US Patents per Capita
- Trademarks per Capita
3.2. Data sources and the process for estimating the basic NIS dimensions
Having defined the eight basic dimensions of the national innovation system, we will
now describe briefly the data sources, clarify the construction of the indicators and how
they are aggregated into the different dimensions.
Table 1 below identifies the indicators that were kept as representing better each of
those dimensions and provides information about the sources and other details related to
each indicator. The sources of the data we are using are in almost all cases national and
international statistical and regulatory agencies. We sought to retain a diversity of
indicators, based on different types of variables (stock and flows, monetary and
physical) in order to provide appropriate information about the eight NIS dimensions.
We are aware that many of the selected indicators do not constitute optimal solutions
for portraying the different dimensions of a NIS. As stated above the selected indicators
are a compromise between innovation systems theory and available statistical data.
Thus we had to act pragmatically, choosing the indicators according to their
accessibility, reliability and adequate coverage of the period to be observed. Fortunately
the quantity of data we have now available has no comparison to what existed only 10
or 15 years ago. The Internet has played a fundamental role, making many international
statistics readily available on-line. Moreover, some large databases have also been made
accessible through other electronic supports such as CD-ROMs.
All together we are using 29 variables for 69 countries.2 The period to which the data
refers to is normally the years after 2000, with many variables referring to 2002 or
2003, even tough a few exceptions exist (for details see table below).
2 Amable et al. (1997) proposed an exercise with some aspects in common with the one we are undertaking now. Their analysis involved a larger number of indicators, even tough for a much smaller sample (only 12 countries, all of them belonging to the OECD).
15
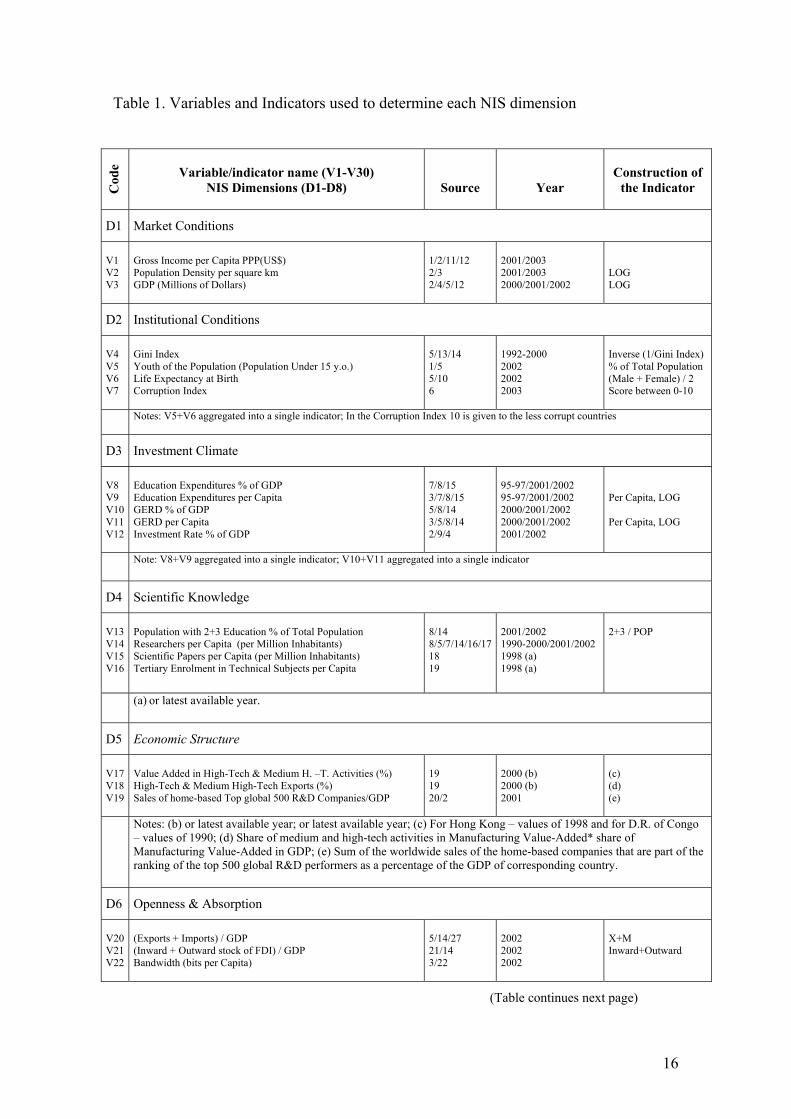
Table 1. Variables and Indicators used to determine each NIS dimension
C
ode
Variable/indicator name (V1-V30)
NIS Dimensions (D1-D8)
Source
Year
Construction of
the Indicator
D1 Market Conditions V1 V2 V3
Gross Income per Capita PPP(US$) Population Density per square km GDP (Millions of Dollars)
1/2/11/12 2/3 2/4/5/12
2001/2003 2001/2003 2000/2001/2002
LOG LOG
D2 Institutional Conditions V4 V5 V6 V7
Gini Index Youth of the Population (Population Under 15 y.o.) Life Expectancy at Birth Corruption Index
5/13/14 1/5 5/10 6
1992-2000 2002 2002 2003
Inverse (1/Gini Index) % of Total Population (Male + Female) / 2 Score between 0-10
Notes: V5+V6 aggregated into a single indicator; In the Corruption Index 10 is given to the less corrupt countries
D3 Investment Climate
V8 V9 V10 V11 V12
Education Expenditures % of GDP Education Expenditures per Capita GERD % of GDP GERD per Capita Investment Rate % of GDP
7/8/15 3/7/8/15 5/8/14 3/5/8/14 2/9/4
95-97/2001/2002 95-97/2001/2002 2000/2001/2002 2000/2001/2002 2001/2002
Per Capita, LOG Per Capita, LOG
Note: V8+V9 aggregated into a single indicator; V10+V11 aggregated into a single indicator
D4 Scientific Knowledge
V13 V14 V15 V16
Population with 2+3 Education % of Total Population Researchers per Capita (per Million Inhabitants) Scientific Papers per Capita (per Million Inhabitants) Tertiary Enrolment in Technical Subjects per Capita
8/14 8/5/7/14/16/1718 19
2001/2002 1990-2000/2001/2002 1998 (a) 1998 (a)
2+3 / POP
(a) or latest available year.
D5 Economic Structure
V17 V18 V19
Value Added in High-Tech & Medium H. –T. Activities (%) High-Tech & Medium High-Tech Exports (%) Sales of home-based Top global 500 R&D Companies/GDP
19 19 20/2
2000 (b) 2000 (b) 2001
(c) (d) (e)
Notes: (b) or latest available year; or latest available year; (c) For Hong Kong – values of 1998 and for D.R. of Congo – values of 1990; (d) Share of medium and high-tech activities in Manufacturing Value-Added* share of Manufacturing Value-Added in GDP; (e) Sum of the worldwide sales of the home-based companies that are part of the ranking of the top 500 global R&D performers as a percentage of the GDP of corresponding country.
D6 Openness & Absorption
V20 V21 V22
(Exports + Imports) / GDP (Inward + Outward stock of FDI) / GDP Bandwidth (bits per Capita)
5/14/27 21/14 3/22
2002 2002 2002
X+M Inward+Outward
(Table continues next page)
16
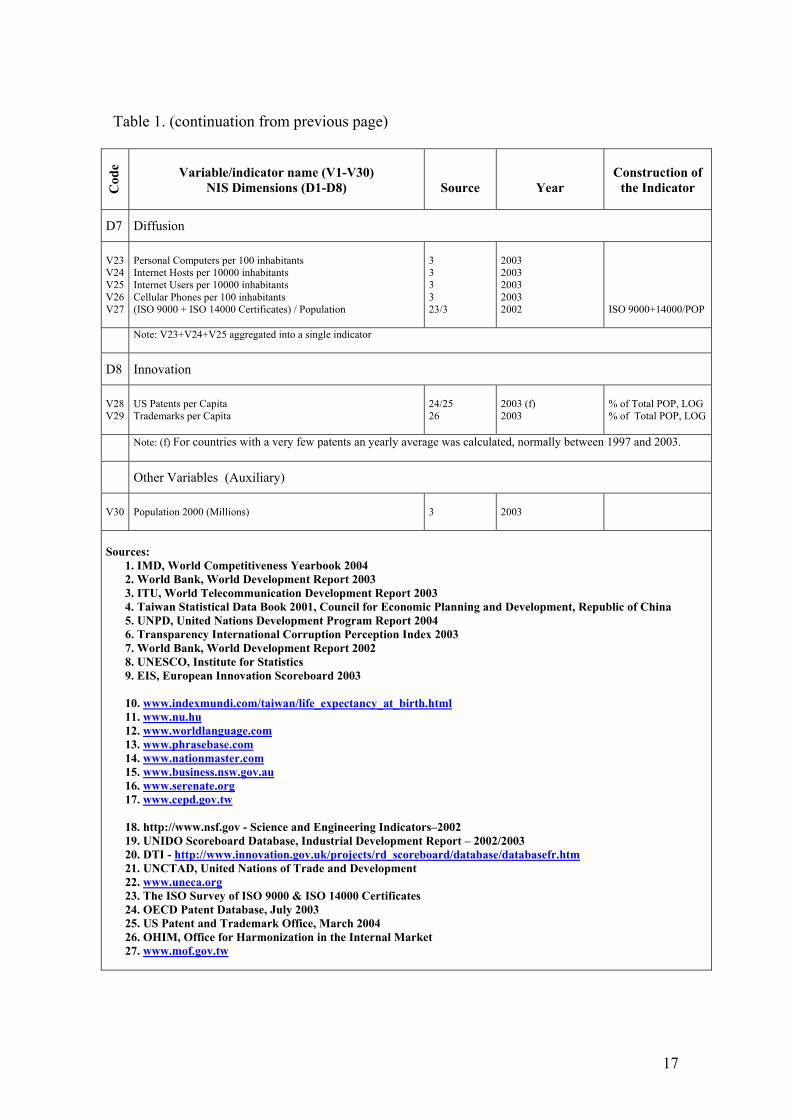
Table 1. (continuation from previous page)
Cod
e
Variable/indicator name (V1-V30)
NIS Dimensions (D1-D8)
Source
Year
Construction of
the Indicator
D7 Diffusion
V23 V24 V25 V26 V27
Personal Computers per 100 inhabitants Internet Hosts per 10000 inhabitants Internet Users per 10000 inhabitants Cellular Phones per 100 inhabitants (ISO 9000 + ISO 14000 Certificates) / Population
3 3 3 3 23/3
2003 2003 2003 2003 2002
ISO 9000+14000/POP
Note: V23+V24+V25 aggregated into a single indicator
D8 Innovation
V28 V29
US Patents per Capita Trademarks per Capita
24/25 26
2003 (f) 2003
% of Total POP, LOG % of Total POP, LOG
Note: (f) For countries with a very few patents an yearly average was calculated, normally between 1997 and 2003.
Other Variables (Auxiliary) V30
Population 2000 (Millions)
3
2003
Sources:
1. IMD, World Competitiveness Yearbook 2004 2. World Bank, World Development Report 2003 3. ITU, World Telecommunication Development Report 2003 4. Taiwan Statistical Data Book 2001, Council for Economic Planning and Development, Republic of China 5. UNPD, United Nations Development Program Report 2004 6. Transparency International Corruption Perception Index 2003 7. World Bank, World Development Report 2002 8. UNESCO, Institute for Statistics 9. EIS, European Innovation Scoreboard 2003 10. www.indexmundi.com/taiwan/life_expectancy_at_birth.html 11. www.nu.hu 12. www.worldlanguage.com 13. www.phrasebase.com 14. www.nationmaster.com 15. www.business.nsw.gov.au 16. www.serenate.org 17. www.cepd.gov.tw 18. http://www.nsf.gov - Science and Engineering Indicators–2002 19. UNIDO Scoreboard Database, Industrial Development Report – 2002/2003 20. DTI - http://www.innovation.gov.uk/projects/rd_scoreboard/database/databasefr.htm 21. UNCTAD, United Nations of Trade and Development 22. www.uneca.org 23. The ISO Survey of ISO 9000 & ISO 14000 Certificates 24. OECD Patent Database, July 2003 25. US Patent and Trademark Office, March 2004 26. OHIM, Office for Harmonization in the Internal Market 27. www.mof.gov.tw
17
The 29 relevant variables/indicators listed above were transformed using a
standardization procedure. The next step was the aggregation of the variables into each
dimension. Similar weights were used for all the variables, with the exceptions noted in
table 1 above, of two or three single indicators being aggregated into another indicator.
In these cases the aggregated outcome counted as just one indicator. Overall 24
resulting indicators were aggregated into the NIS dimensions generating eight
composite indicators.
We must clarify that in general each variable/indicator covered all the 69 countries in
the sample, even tough in a very few cases the data base that was built presented
missing values. In those cases the composite measure of each NIS dimension was
calculated for the country whose data was missing on the basis of only n-1 (or n-m,
more generally) indicators.
In what regards country selection we tried to gather information covering both the
advanced economies (large and small) and the catching up and developing economies.
All the OECD economies were included, plus the EU members and candidate countries.
All the Asian “tigers” were included, even tough not all of them are properly “nations”.
For the rest, the criterion was that the selected countries should have at least 20 million
inhabitants. In this way we could assure that the analysis covered a great part of the
world population. On the whole these countries stand for approximately 87.4% of the
world population.
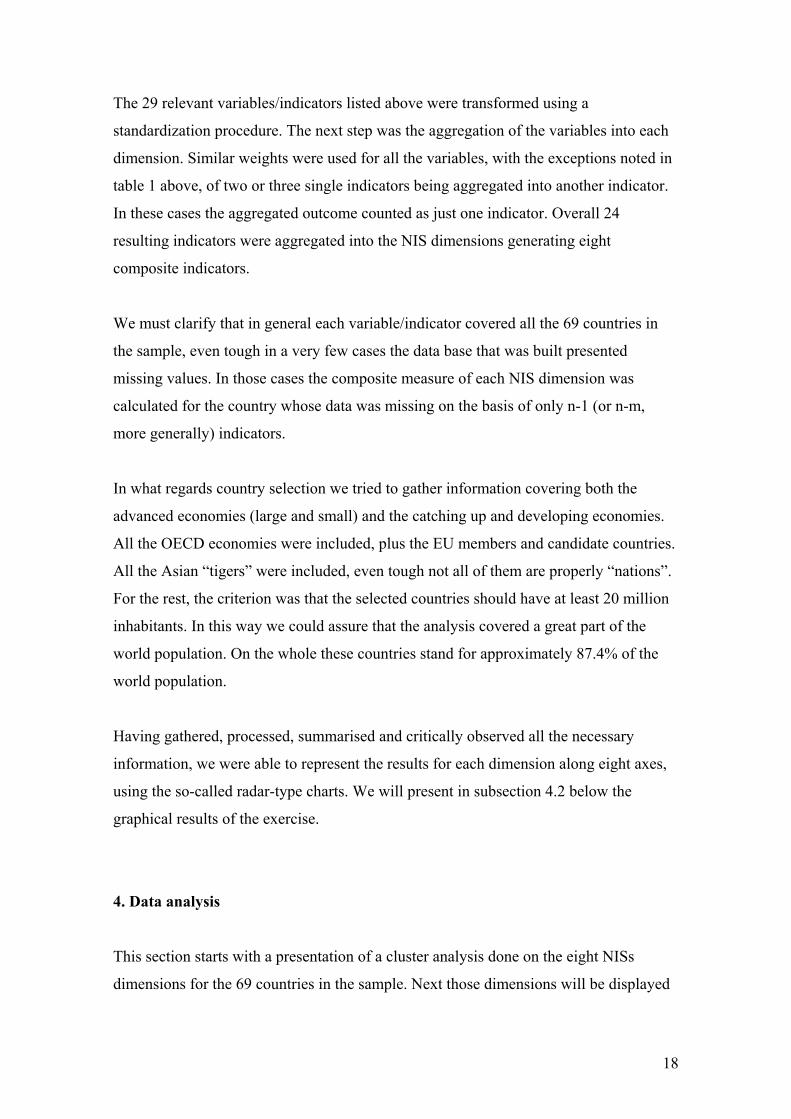
Having gathered, processed, summarised and critically observed all the necessary
information, we were able to represent the results for each dimension along eight axes,
using the so-called radar-type charts. We will present in subsection 4.2 below the
graphical results of the exercise.
4. Data analysis
This section starts with a presentation of a cluster analysis done on the eight NISs
dimensions for the 69 countries in the sample. Next those dimensions will be displayed
18

graphically for the different NISs in accordance to the cluster structure deriving from
the previous cluster analysis.
4.1. Cluster analysis
The analysis we will now describe aimed at aggregating the different economies we are
studying into relatively homogenous groupings of closely related NISs. The data used in
this exercise is inscribed in a matrix that has the 69 countries in the sample as its
individual “cases” and the eight NIS dimensions (determined through the steps
described above) as the “variables” to be analysed.
Cluster analysis starts by aggregating cases with closer characteristics into basic
clusters, and goes through a process of successive stages to aggregate relatively more
dissimilar cases into larger clusters up to a final stage in which all cases, regardless of
their differences, are aggregated into a single group. In the exercise we are undertaking
the process of agglomerating individual countries up to that final stage took 68 steps
(see the “agglomeration schedule” in the annexes) and it produced quite different sorts
of countries’ groupings along the sequential stages.
The decision of deciding in which stage of the aggregation process one should stop, thus
deciding the number of clusters to retain, depends on indications from the cluster
analysis statistical output together with the personal judgement of the researcher. In the
present case, based upon the analysis of the data provided by the clustering process, we
decided to work with a three level structure of clusters, which for the sake of simplicity
we will refer to as “megaclusters”, “clusters” and “subclusters”. Each megacluster
comprises one or several clusters, while on its turn each cluster comprises one or several
subclusters. This structure is presented in table 2 and stems from the dendrogram
presented as an annex in the end of the paper.
19
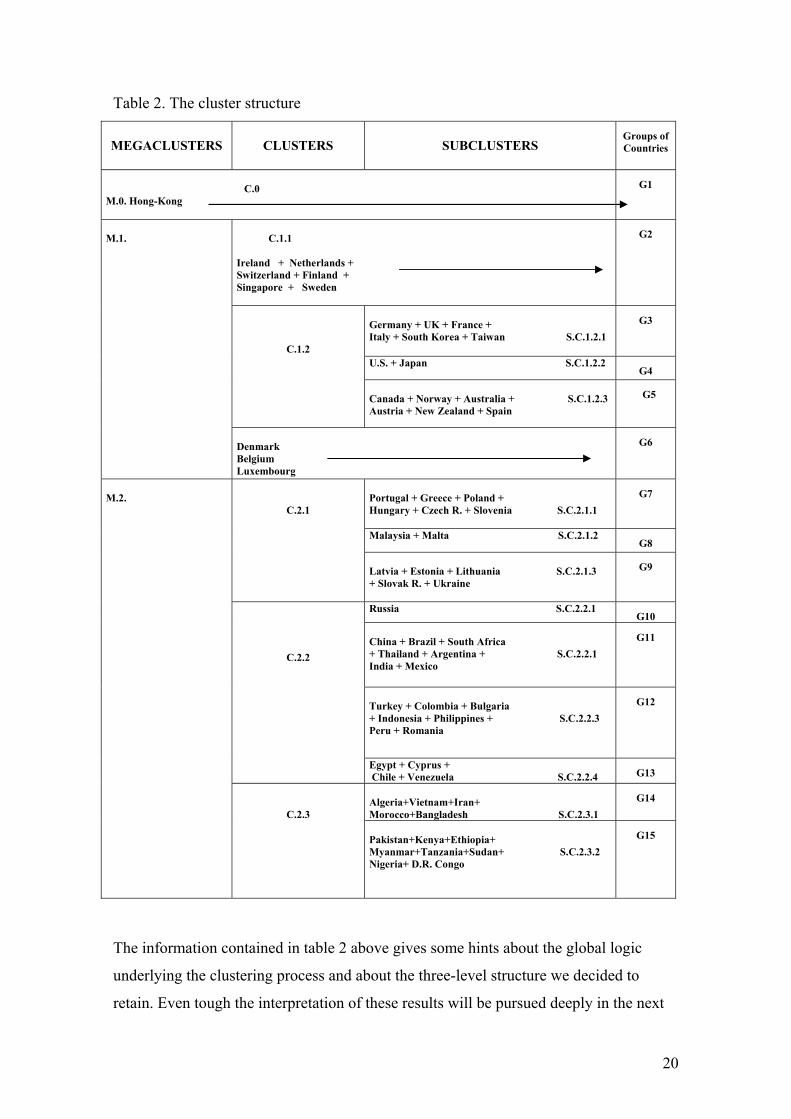
Table 2. The cluster structure
MEGACLUSTERS CLUSTERS SUBCLUSTERS Groups of Countries
C.0 M.0. Hong-Kong
G1
C.1.1 Ireland + Netherlands + Switzerland + Finland + Singapore + Sweden
G2
Germany + UK + France + Italy + South Korea + Taiwan S.C.1.2.1
G3
U.S. + Japan S.C.1.2.2 G4
C.1.2
Canada + Norway + Australia + S.C.1.2.3 Austria + New Zealand + Spain
G5
M.1.
Denmark Belgium Luxembourg
G6
Portugal + Greece + Poland + Hungary + Czech R. + Slovenia S.C.2.1.1
G7
Malaysia + Malta S.C.2.1.2 G8
C.2.1
Latvia + Estonia + Lithuania S.C.2.1.3 + Slovak R. + Ukraine
G9
Russia S.C.2.2.1 G10
China + Brazil + South Africa + Thailand + Argentina + S.C.2.2.1 India + Mexico
G11
Turkey + Colombia + Bulgaria + Indonesia + Philippines + S.C.2.2.3 Peru + Romania
G12
C.2.2
Egypt + Cyprus + Chile + Venezuela S.C.2.2.4 G13 Algeria+Vietnam+Iran+ Morocco+Bangladesh S.C.2.3.1
G14
M.2.
C.2.3
Pakistan+Kenya+Ethiopia+ Myanmar+Tanzania+Sudan+ S.C.2.3.2 Nigeria+ D.R. Congo
G15
The information contained in table 2 above gives some hints about the global logic
underlying the clustering process and about the three-level structure we decided to
retain. Even tough the interpretation of these results will be pursued deeply in the next
20

section, by looking at both the data concerning the eight NIS dimensions and the
statistical output of the cluster analysis, we can already provide some remarks that will
help to clarify the three-level structure displayed in the previous table.
Overall three megaclusters were generated, two with a very large number of cases each
and a third one with just an individual case (Hong Kong).3 The two larger megaclusters,
the first with 23 innovation systems, and the second with 45 countries, reflect the
greatest divide in our study: megacluster 1 contains the developed (or “mature”)
innovation systems, while megacluster 2 contains the developing (or “forming”)
innovation systems.
Each of the two larger megaclusters is formed by three individual clusters. These
clusters in turn contain between 1 and 4 subclusters each. Finally the 15 subclusters that
were generated in this way agglomerate on average more than 4 cases each (in practice
this means a variation between 1 and 8 cases).
Looking at the individual NISs into these different groupings, we have attempted at
providing a classification for each of the six clusters that were constituted. The
classification presented in table 3 below stems both from the observation of the cluster
analysis’ results and from previous general knowledge about each of the economies in
our study.
3 This economy resisted agglomeration into larger clusters up to the final stage of the clustering process. This is a direct result of an innovation system that overall seems to perform quite well but that displays some very peculiar characteristics (an extremely high “external communication” rating, but weak values for “institutional conditions” and particularly for “knowledge”).
21
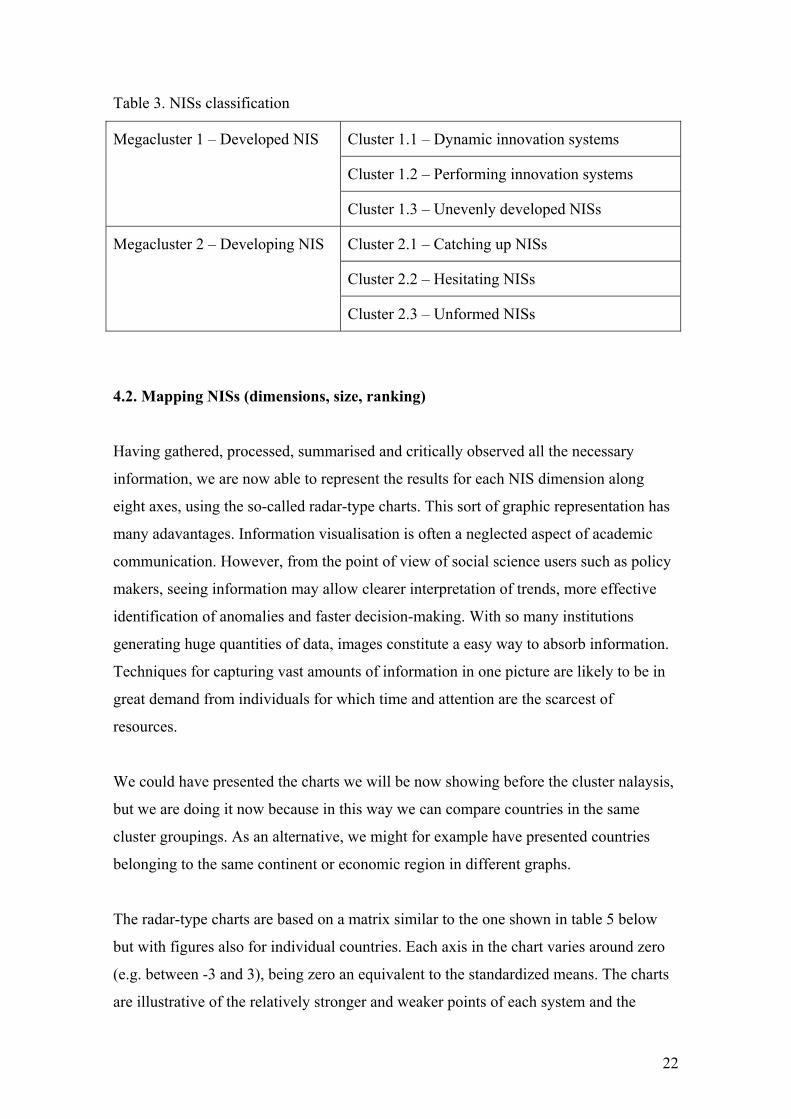
Table 3. NISs classification
Cluster 1.1 – Dynamic innovation systems
Cluster 1.2 – Performing innovation systems
Megacluster 1 – Developed NIS
Cluster 1.3 – Unevenly developed NISs
Cluster 2.1 – Catching up NISs
Cluster 2.2 – Hesitating NISs
Megacluster 2 – Developing NIS
Cluster 2.3 – Unformed NISs
4.2. Mapping NISs (dimensions, size, ranking)
Having gathered, processed, summarised and critically observed all the necessary
information, we are now able to represent the results for each NIS dimension along
eight axes, using the so-called radar-type charts. This sort of graphic representation has
many adavantages. Information visualisation is often a neglected aspect of academic
communication. However, from the point of view of social science users such as policy
makers, seeing information may allow clearer interpretation of trends, more effective
identification of anomalies and faster decision-making. With so many institutions
generating huge quantities of data, images constitute a easy way to absorb information.
Techniques for capturing vast amounts of information in one picture are likely to be in
great demand from individuals for which time and attention are the scarcest of
resources.
We could have presented the charts we will be now showing before the cluster nalaysis,
but we are doing it now because in this way we can compare countries in the same
cluster groupings. As an alternative, we might for example have presented countries
belonging to the same continent or economic region in different graphs.
The radar-type charts are based on a matrix similar to the one shown in table 5 below
but with figures also for individual countries. Each axis in the chart varies around zero
(e.g. between -3 and 3), being zero an equivalent to the standardized means. The charts
are illustrative of the relatively stronger and weaker points of each system and the
22

cluster groups they belong to. For the sake of pragmatism we are presenting below just
a few charts of the more than two dozens that were built, to exemplify the potentialities
of the technique.
Clusters
-2
-1,5
-1
-0,5
0
0,5
1
1,5
21
2
3
4
5
6
7
8
C.1.1
C.1.2
C.1.3
C.2.1
C.2.2
C.2.3
Cluster 1.1
0
0,5
1
1,5
2
2,51
2
3
4
5
6
7
8
Ireland
Netherlands
Switzerland
Singapore
Finland
Sweden
23
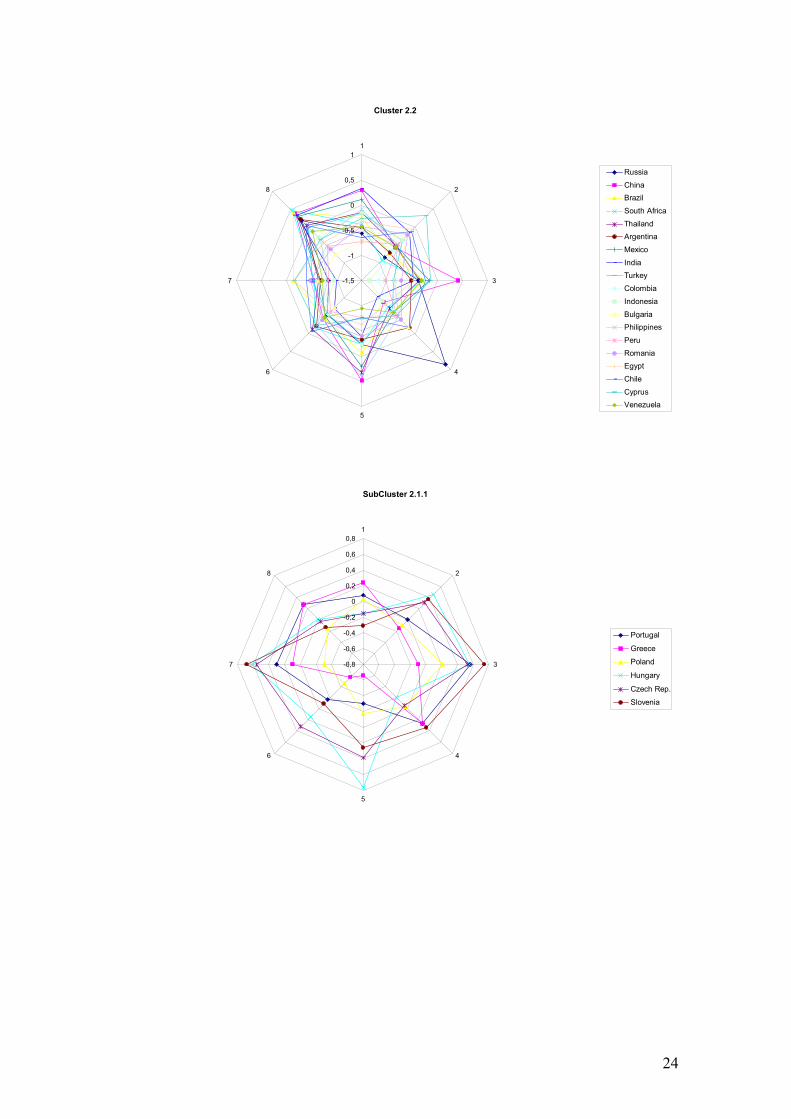
Cluster 2.2
-1,5
-1
-0,5
0
0,5
11
2
3
4
5
6
7
8
Russia
China Brazil
South Africa
ThailandArgentina
Mexico
India Turkey
Colombia
Indonesia
BulgariaPhilippines
Peru
Romania Egypt
Chile
Cyprus Venezuela
SubCluster 2.1.1
-0,8
-0,6
-0,4
-0,2
0
0,2
0,4
0,6
0,81
2
3
4
5
6
7
8
Portugal
Greece
Poland
Hungary
Czech Rep.
Slovenia
24
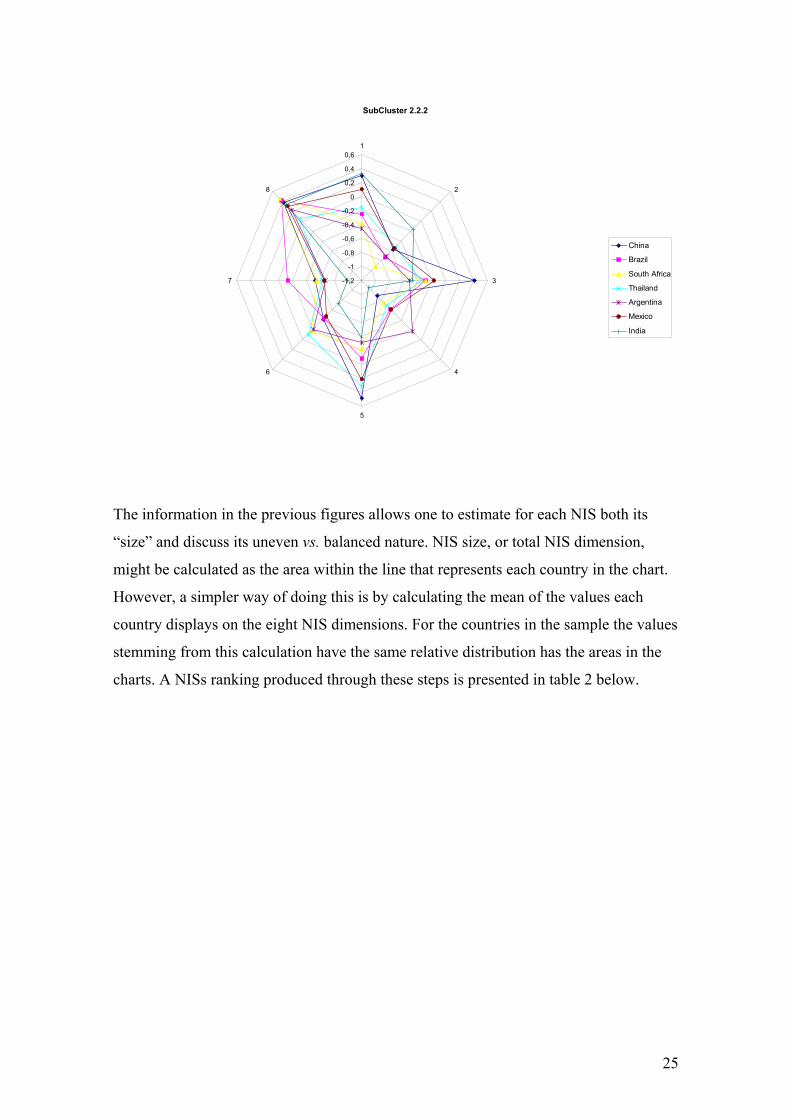
SubCluster 2.2.2
-1,2
-1
-0,8
-0,6
-0,4
-0,2
0
0,2
0,4
0,61
2
3
4
5
6
7
8
China
Brazil
South Africa
Thailand
Argentina
Mexico
India
The information in the previous figures allows one to estimate for each NIS both its
“size” and discuss its uneven vs. balanced nature. NIS size, or total NIS dimension,
might be calculated as the area within the line that represents each country in the chart.
However, a simpler way of doing this is by calculating the mean of the values each
country displays on the eight NIS dimensions. For the countries in the sample the values
stemming from this calculation have the same relative distribution has the areas in the
charts. A NISs ranking produced through these steps is presented in table 2 below.
25

Table 4. NIS ranking 1. Switzerland 1,15 24. Hungary 0,27 47. India -0,39 2. Sweden 1,13 25. Czech R. 0,23 48. Turkey -0,42 3. Netherlands 0,91 26. Slovenia 0,23 49. Ukraine -0,43 4. Denmark 0,90 27. New Zealand 0,21 50. Egypt -0,43 5. Finland 0,90 28. Portugal 0,13 51. Romania -0,45 6. Hong Kong 0,90 29. Malta 0,05 52. Venezuela -0,52 7. United Kingdom 0,88 30. Malaysia 0,05 53. Bulgaria -0,56 8. United States 0,86 31. Slovak R. 0,00 54. Indonesia -0,58 9. Singapore 0,86 32. Greece -0,07 55. Morocco -0,59 10. Japan 0,85 33. China -0,10 56. Viet Nam -0,59 11. Germany 0,81 34. Estonia -0,11 57. Colombia -0,63 12. Ireland 0,81 35. Poland -0,12 58. Algeria -0,67 13. Korea (R. of) 0,67 36. Mexico -0,23 59. Peru -0,68 14. France 0,62 37. Cyprus -0,26 60. Iran (I.R.) -0,75 15. Taiwan 0,60 38. Thailand -0,26 61. Bangladesh -0,77 16. Austria 0,57 39. Brazil -0,27 62. Pakistan -0,82 17. Norway 0,51 40. Lithuania -0,29 63. Nigeria -0,89 18. Belgium 0,50 41. Chile -0,29 64. Kenya -0,94 19. Spain 0,50 42. Russia -0,30 65. Ethiopia -0,97 20. Canada 0,44 43. Latvia -0,30 66. Myanmar -0,98 21. Italy 0,44 44. Argentina -0,35 67. Tanzania -0,99 22. Austrália 0,40 45. South Africa -0,35 68. D.R. Congo -1,05 23. Luxembou 0,38 46. Philippines -0,36 69. Sudan -1,06
The discussion of the unevenness of the system can be done by simply observing the
charts to see whether the country has a regular shape with all eight dimensions showing
a similar length, or otherwise it can be calculated as the standard deviation of the
country’s values in each of the eight axes. We are not presenting here figures for this,
but in Godinho et al. (2003) we have exemplified this process.
5. Interpretation of the cluster structure (levels 1, 2 and 3)
The interpretation we will suggest now of the general patterns presented in section 4.1
above is based on the analysis of data concerning each of the three-level cluster
structure. That data stemmed from the agglomeration process of cluster analysis.
Further, for each group, regardless of being a megacluster, a cluster or a subcluster, the
mean values and the standard deviation for the eight dimensions of the innovation
systems were calculated. This facilitates the understanding of what are the strongest and
26

weaker dimensions in each group, together with providing information about the
variation within the group4 (see table 5 below, just with the mean values).
The main lesson we draw from such analysis is that the three dimensions that most
differentiate the different types of groups we are working with are innovation, diffusion
and knowledge. In contrast, the factors associated with the five remaining dimensions
we have considered as characterizing innovation systems, which include market
conditions, institutional conditions, intangible and tangible investment, economic
structure and external communication, normally play a much smaller role in explaining
the overall differences between groups.
Starting the analysis with the two larger megaclusters, it is very clear that the
“Developed NISs” perform very well on all the former three dimensions, while the
“Developing NISs” show a very poor record on them. Observing the figures for those
three dimensions presented in table 5 below, they show mean values of around +.9 for
Megacluster 1 and very contrasting values of only about -.5 for Megacluster 2 (to
interpret adequately these results it is convenient to recall that we are operating with
standardised variables).
We will now concentrate first the analysis on clusters in Megacluster 1, and next we
will turn to clusters in Megacluster 1.
4 Smaller standard deviations mean that all countries share the same characteristic with the same intensity, while higher standard deviations have the opposite meaning.
27

Table 5. Clusters’ performance along the eight NIS dimensions Values
AXIS 1 AXIS 2 AXIS 3 AXIS 4 AXIS 5 AXIS 6 AXIS 7 AXIS 8 AXES 1-to-8
M0 1,38 0,1 0,37 -0,5 0,67 3,38 1,08 0,68 0,9
M1 0,6886 0,5724 0,5416 0,8556 0,6537 0,4368 0,8525 0,9263 0,691
M2 -0,3842 -0,3081 -0,3765 -0,5426 -0,3604 -0,3049 -0,4719 -0,6102 -0,4198
C.1.1 0,6207 0,6766 0,7131 1,1585 1,45585 0,9855 1,3224 0,7272 0,9578
C.1.2 0,7093 0,4526 0,5045 0,8958 0,4177 -0,0301 0,7687 1,05988 0,5973
C.1.3 0,7279 0,9233 0,3717 0,062 0,1455 1,5183 0,3039 0,7013 0,5942
C.2.1 -0,313 0,0358 0,2314 -0,0321 0,1032 0,0478 0,0607 -0,3578 -0,028
C.2.2 -0,2879 -0,4293 -0,531 -0,5181 -0,301 -0,4171 -0,5996 -0,0541 -0,3923
C.2.3 -0,5959 -0,4748 -0,7585 -1,0889 -0,9109 -0,4935 -0,818 -1,6756 -0,852
S.C.1.2.1 0,9976 0,2769 0,4212 0,6971 0,7876 0,1809 0,8052 1,1874 0,6693
S.C.1.2.2 1,5618 0,4895 0,7883 1,0288 1,2861 -0,678 0,7431 1,6306 0,8562
S.C.1.2.3 0,1369 0,616 0,4933 1,0502 -0,2416 -0,0251 0,7408 0,7418 0,439
S.C.2.1.1 -0,0463 0,1476 0,4165 0,0986 0,0488 -0,1379 0,322 0,0405 0,1112
S.C.2.1.2 -0,1184 -0,0632 -0,1007 -0,7225 0,8314 0,5902 0,1353 -0,1506 0,0502
S.C.2.1.3 -0,711 -0,0589 0,1422 0,873 -0,1226 0,0538 -0,2827 -0,9187 -0,2263
S.C.2.2.1 -0,56 -0,85 -0,38 0,85 -0,24 -0,53 -0,84 0,19 -0,3
S.C.2.2.2 -0,0716 -0,5951 -0,2409 -0,6878 -0,0008 -0,3664 -0,5975 0,3152 -0,2806
S.C.2.2.3 -0,3936 -0,3902 -0,9799 -0,5338 -0,3424 -0,4967 -0,7073 -0,3726 -0,5271
S.C.2.2.4 -0,4129 -0,1012 -0,2905 -0,5357 -0,769 -0,3382 -0,3551 -0,204 -0,3758
S.C.2.3.1 -0,3478 -0,2966 -0,059 -0,8727 -0,8366 -0,439 -0,7775 -1,7666 -0,6745
S.C.2.3.2 -0,751 -0,5862 -1,1956 -1,224 -0,9574 -0,5275 -0,8434 -1,6187 -0,963
Megacluster 1
The analysis of clusters 1.1, 1.2 and 1.3 shows strong contrasting patterns in what
concerns innovation and diffusion, as it happened in relation to the overall differences
between megaclusters 1 and 2. Cluster 1.1 performs very well in diffusion (+1.3) but not
so well in innovation (+0.7), while the opposite happens with cluster 1.2 (+0.8 and +1.1,
respectively) and, to increase further the contrasts within megacluster 1, cluster 1.3
shows a relatively poor performance simultaneously in innovation (+0.7) and diffusion
(+0.3). There are some other dimensions, however, in which the three clusters reveal
results that deserve to be singled out. That is the case of cluster 1.1 that shows values
much higher than the whole sample average in economic structure (+1.5) and in
knowledge (+1.2). Cluster 1.2 is good in knowledge (+0.9) but performs very badly in
external communication. This contrasts strongly with cluster 1.3 that precisely shows
strong results in external communication. This third cluster has also a relatively weak
record in knowledge (+0.1) even tough this cluster’s countries display quite distinct
behaviours on this dimension. Moreover, this third cluster of the “developed NISs”
megacluster reveals an excellent performance in external communication (+1.5), which
28
certainly relates to the small size of its members and to their integration in the EU
market. Yet in terms of country size, one shall note that cluster 1.1 is made up of
relatively small countries, while many of the 14 countries in cluster 1.2 are large or very
large regardless of taking into consideration population, GDP or geographic size
criteria.
We will now deepen the analysis of cluster 1.2 which according to the cluster analysis
results presented before divides itself into three subclusters. The groups that were
obtained are very interesting both in their coherence and in some contrasting
characteristics that define them. Subcluster 1.2.1 contains the 4 largest EU economies,
together with South Korea and Taiwan. The innovation systems of these economies are
characterised by certain evenness, with values relatively similar over the 8 NIS
dimensions. Exceptions to that evenness are innovation performance that on average is
very good (+1.2) and institutional conditions that on the opposite seems to be faltering
(only +0.3, this may derive among other aspects from aging populations).
Subcluster 1.2.2 contains the two largest OECD economies, the US and Japan. Their
innovation systems emerge has much more uneven than those of the former group. They
excel in innovation and in market conditions (both +1.6) and they also show good
results in economic structure (+1.3) and in knowledge (+1.0). In contrast, they do
relatively less well in institutional conditions (+0.5) and particularly in the external
communication dimension, in which they present an extremely low value of -0.7. Some
of these results might be surprising but that does not mean one can not account for
them. In fact, as these two countries have very large domestic economies (revealed in
the market conditions values), that might make external communication a less important
requirement for the adequate functioning of their innovation systems.
Turning to the last subcluster of cluster 1.2, the group of countries that cluster analysis
aggregated into this cluster, which at first sight might seem paradoxical, also has its
own coherence. Two countries with very extensive unpopulated territories (Canada and
Australia) were aggregated with two economies which share a peripheral nature (New
Zealand and Norway, in the extreme Northwest of Scandinavia). But a further element
ties these four countries together: they all share an international specialization in which
natural resources and primary productions have a prominent role. This might account
29
for their not so good performance in the economic structure dimension (-0.2). And it
also allows one to understand why Spain appears in this subcluster: the extension of the
tourism industry in this country might be understood as a partial result of her natural
resources endowment (sun and beaches).
Megacluster 2
We will now move to the analysis of Megacluster 2. The 45 countries in this
megacluster are distributed between 3 clusters. Again innovation and diffusion are the
dimensions along which these 3 clusters differentiate. Cluster 2.1, classified as
“catching up NIS” in the previous section, reveals a poor performance in innovation (-
0.4) but does relatively much better in diffusion (+0.2). Exactly the opposite happens
with cluster 2.2, classified as “hesitating NIS”, that shows a performance in innovation
closer to the whole sample average (-0.1) but a much poorer performance in diffusion (-
0.6). Finally, cluster 2.3, that comprises the countries of “unformed NIS”, performs
badly both on diffusion (-1.1) and much particularly on innovation (-1.7). It is
interesting to note that the “catching up NIS” do well in intangible and tangible
investment (+0,2) but have weaker market conditions (-0.3).
The subclusters of cluster 2.1 are all uneven, with some NIS dimensions relatively much
better than others. Subcluster 2.1.1 comprises two small Southern European countries
(Portugal and Greece) and four Central European countries (Slovenia, Czech Republic,
Hungary and Poland). They all do well in diffusion (+0.3) and in innovation even tough
to a minor degree in this second dimension (+0.04). The next two subclusters do less
well in both innovation and diffusion (respectively -0.2 and +0.1 for subcluster 2.1.2 and
-0.9 and -0.3 for subcluster 2.1.3). Subcluster 2.1.2 has a small number of countries
(Malaysia and Malta) which have in common a good economic structure (+0.8) and
good external communication (+0.6), but does badly in other dimensions, particularly in
knowledge (-0.7). Finally subcluster 2.1.3 shows weak market conditions (-0.7) in
consonance with the small size of the Baltic republics that are its members.
Cluster 2.2 comprises 4 relatively distinct subclusters. The first subcluster has just one
country – Russia – that resisted almost to the last stages of the clustering process to
integrate other clusters. In this perspective, Russia is similar to Hong Kong: this country
30

also has a very idiosyncratic and uneven NIS. In fact, Russia displays a good result in
the innovation dimension (+0.9) but a symmetrical and similarly impressive result is
recorded in institutional conditions (-0.9). If this latter dimension were less bad, one
might conjecture that Russia could have joined the former cluster of the “catching up
NIS” at it happened for example with Ukraine.5
The next subcluster is particularly important. In fact, its constituent countries make up
almost 45% of the world population and it comprises the most important emerging
economies: China, India, Brazil, Mexico and South Africa.6 They all do relatively well
in innovation (+0.3), even better than any other subcluster of cluster 2.1. They show
however weak performances in knowledge (-0.7) and in institutional conditions (-.06).
Further, in line with the overall size of their economies, they show market conditions
above what might be expected. The unevenness of the NISs that characterizes this
subcluster only reveals the strong dualism of many of the countries that are its
constituents. As a matter of fact, modern advanced sectors operate in parallel with
outdated technologies and processes that still dominate extensive segments of these
countries’ economies.
The last two subclusters of cluster 2.2 reveal on average a much weaker performance
than the previous two subclusters. In fact, all the values exhibited in the eight
dimensions characterising their NISs are negative. However, one shall note the
configuration of these NISs, in particular that of subcluster 2.2.3, is much more even
than that of subclusters 2.2.1 and 2.2.2. Despite that, stronger and weaker points still
emerge in the analysis. Subcluster 2.2.3 has its most important fragilities in intangible
and tangible investment (-1.0) and in diffusion (-0.7), while subcluster 2.2.4 has its
weakest point in economic structure (-0.8). Given the weaknesses they display,
countries in both these two subclusters risk strongly to fall down to cluster 2.3. This is
the reason why cluster 2.2 was given the “oscillating NIS” classification: some of its
countries might well move forward to the “catching up NIS” group and even envisage
in the longer term to reach the “developed NIS” status of megacluster 1, but many of its
5 Note however that Russia has a higher positioning than Ukraine in the overall NIS ranking presented before. 6 Thailand and Argentina are also part of subcluster 2.2.2.
31

members also risk to get stuck in the vicious circles of underdevelopment and fall
further below their current levels.
Finally on this analysis and interpretation of the three-level cluster structure that was
proposed, we concentrate on cluster 2.3, which was classified as of “unformed NIS”.
This designation has to do with the fact that in this cluster one does not detect signs of
innovation activities or of any type of organization that might deserve the “system”
classification. However, two situations in cluster 2.3 are detectable and they have to do
with subclusters 2.3.1 and 2.3.2. On average countries in the former subcluster perform
better than countries in the latter. This may represent an attempt of the former countries
of escaping the traps we have mentioned above. In doing so and with a value that is
close to the overall sample average (-0.1) the intangible and tangible investment
dimension might testify those efforts. Also their performance in institutional conditions
is not dramatically negative. In the second subcluster, however, the situation is in
general bleaker on all dimensions and the mapping of their performances provides
strong indications of a structural endemic crisis in these countries.
6. Conclusion: Towards a NISs taxonomy
The analysis developed above will now be re-examined. First we will concentrate on the
method that has been suggested for mapping national innovation systems. Next we will
return to the results of the clustering exercise, which was carried out in order to helping
us to envisage a NISs taxonomy. Finally, we conclude with some remarks on the
normative implications and elaborate on further research needs in this area.
Some conclusions regarding the NIS mapping technique
The exercise that was carried out shows that the NIS mapping technique we have
deployed although simple in the steps it requires has significant analytical potential. In
what regards the analytical value, we are aware that different arguments may be raised
in relation to the process that led us to the identification of eight major NIS dimensions.
Even tough we think those dimensions are sound and credible, we think that what is
strategically more important is the process involved in their definition. This is so
32
beacuse by getting involved in that process one is forced to be specific about what
exactly is meant by “national innovation system”, concentrating on the aspects that
deserve to be analysed with greater attention. Such process might help the conceptual
work in this area to evolve further in the future, moving out of vague discussions to
more precise definitions of “NIS” and its components.
A possible NIS taxonomy
The cluster analysis that was implemented and that has been interpreted in sections 4
and 5 produced a break-down of the 69 countries in the sample into a three level
structure: two large megaclusters; six clusters; and fifteen subclusters. Such break-down
provides ground for a possible NISs taxonomy. What are thus the major lines separating
the different NISs groupings to which cluster analysis led us to? We saw that what
differentiates most the countries in the sample is their performance in three critical
dimensions of the innovation systems: innovation, diffusion and (but to a lesser extent)
knowledge. These dimensions separated clearly countries in megacluster 1 from those in
megacluster 2. Moreover, within each megacluster, and even between certain
subclusters, it was possible to detect strong behavioural differences along the previous
first two dimensions.
Another aspect that emerged as important in differentiating both clusters and subclusters
is the overall country size, namely with regard to GDP and population numbers. In fact,
we noticed that very large countries tend to cluster together. That was the case of US
and Japan, but also of China, India, Brazil, Mexico and South Africa. And the fact that
Russia resisted agglomeration is also an indication that large countries have certain
specificities that separate them from the remaining countries. In contrast, smaller and
medium size economies tended to agglomerate in certain clusters or subclusters,
showing on average better performances in external communication but not so good
performances in market conditions, which is where normally larger countries tend to
perform relatively better. These two dimensions emerge therefore as partial substitutes
in connection to country size.
Finally, an additional aspect that surfaced as relevant is the endowment of countries in
natural resources. This was clear in the case of some “developed NISs” for which such
33

endowments (being them minerals, forests, good grazing lands or sun and beaches)
seem to be acting in practice as partial substitutes of other critical dimensions and
providing a dynamism revealed in these countries’ positioning in the overall NISs
ranking.
Table 6 below suggests a synthesis of our analysis, in terms of a possible taxonomy of
innovation systems and the factors that affect the localisation of countries in “NIS
space”. The white cells indicate the positions in which typically one might find the
different NISs, given the major dimensions referred to above that drive the
differentiation of innovation systems plus the critical contingency factors. The
taxonomy that is proposed has six main types of countries plus two additional minor
groups, stemming the latter groups from possible good endowments in natural
resources.
34

Table 6. A taxonomy of national innovation systems based on the localisation of
countries in “NIS space”
Critical dimensions (Innovation, Diffusion…)
Absolute high values Absolute Low values
Megaclusters
M. 0, M. 1 M. 2
Clusters and subclusters
Relatively High in
Innovation and Low in Diffusion
Relatively Low in
Innovation and High in
Diffusion
Relatively Low in both Innovation
and Diffusion
Relatively High in
Innovation and Low in Diffusion
Relatively Low in
Innovation and High in
Diffusion
Relatively Low in both Innovation
and Diffusion
Large/ /Very large
C.1.2 C.2.2. Country
Size Small/
/medium C.1.1 C.1.3
↓(DK) C.2.1 C.2.3
Criti
cal c
ontin
genc
y fa
ctor
s
Good natural resources endowment
Sub. 1.2.3 ↑(Nigeria)
Normative implications and further research
In what concerns the practical policy-making dimension, the cartography of NISs that
was produced through the method put forward, together with its associated indicators
and the taxonomy we have drawn above, indisputably show high potential. In this
respect, it is clear that our work follows in line with some key recommendations of the
innovation systems research: «Concrete empirical and comparative analyses are
absolutely necessary for the design of specific policies in the fields of R&D and
innovation. The S[systems of] I[nnovation] approach is an analytical framework suited
for such analyses. It is appropriate for this purpose because it places innovation at the
very centre of focus and because it is able to capture differences between systems. In
this way specific problems that should be objects of innovation policy can be
identified.» (Edquist 2002, p. 22).
On the policy side we must also recall here the conclusions of a OECD project on
“Dynamising National Innovation Systems”: «the need to engage in effective learning
35

processes suggests that governments may benefit from intensified international
benchmarking of policy practices in this [NIS] respect» (OECD 2002, p. 81).
In conclusion, it becomes clear that the mapping tool that was implemented fits well
into the type of comparative and benchmarking analyses that have been sought both by
academics and policy-makers. This tool has the advantage of avoiding the
oversimplification that has been associated with many recent scoreboard exercises,
which have tended to sum up the analysis to single summary measures of innovation. In
contrast, our method allows for a clear identification of the weakest and strongest
dimensions of each NIS. Moreover, and as it was shown, this tool and the resulting
taxonomy have policy-making value for both the advanced countries, the intermediate
catching up countries and the developing economies as well.
To finalise with we must say that besides eventual disagreements that may arise in what
concerns the definition of the NIS dimensions etc., an aspect that we are aware is the
incompleteness of the present exercise in terms of several key indicators that are
lacking. Among others, there are three key areas in which indicators do not exist for
such a larger sample as the one we were dealing with. First, there is no comprehensive
and updated data for the nature of the R&D activities in many countries, detailing the
share of business in total GERD or identifying the relative weight of basic and applied
R&D. Second, the number of indicators regarding innovation we can mobilise for a
comparative exercise like the present one is still very limited. Surveys like CIS in
Europe needed to be promoted in other continents as well to supply indicators about the
outputs of the innovation process. In Latin America a good deal of work on this has
been done, and a revised version of the Bogotá Manual has been announced. This
together with the expected new version of the Oslo Manual might be an impulse for a
wider and globally more planned establishment of innovation surveys. Finally, a third
area in which we critically need information is about the type and quality of interactions
established within the innovation systems. Indicators such as “Business funding of
government and university R&D”, “R&D arrangements between firms and university or
Research and Technology Organizations”, or yet “SMEs in cooperation to innovate” are
critically needed so that a better characterization of innovation systems might advance
further.
36

References
Amable, B., R. Barré and R. Boyer (1997) Les Sstèmes d’Innovation à l’Ére de la Globalisation. Paris : Economica. Arundel, A. (2001) Innovation Scoreboards: Promises, Pitfalls and Policy Applications, in B. Thuriaux, E. Arnold and C. Couchot (Eds.) Innovation and Enterprise Creation, Statistics and Indicators, European Commission, Directorate General for Enterprise EUR 17038, pp 246-251. Asheim, B. and Gertler, M. (2004) Regional systems of innovation, in J. Fagerberg, D.C. Mowery and R.R. Nelson (eds.), The Oxford Handbook of Innovation. Oxford: Oxford University Press. Autio, E. and T. Laamanen (1995) Measurement and Evaluation of Technology Transfer: Review of Technology Transfer Mechanisms and Indicators, in Int. J. Technology Management, Vol. 10, Nos 7/8, pp. 643-664. Braczyk, H. J. et al. (1998) Regional Innovation Systems. UCL Press, London. Breschi, S. and F. Malerba (1997) Sectoral systems of innovation: technological regimes, Schumpeterian dynamics, and spatial boundaries, in C. Edquist (ed.), Systems of Innovation: Technologies, Institutions and Organization. London: Pinter. Carlsson, B. and R. Stankiewicz (1995) On the nature, function and composition of technological systems, in B. Carlsson (ed.), Technological Systems and Economic Performance: The Case of Factory Automation. Boston: Kluwer Academic Publishers. Carlsson, B. and S. Jacobsson (1997) In search of a useful technology policy – general lessons and key issues for policy makers, in Carlsson B. (ed.), Technological Systems and Industrial Dynamics. Boston: Kluwer Academic Publishers. Cassiolato, J.E., H. Lastres and M. L. Maciel (eds.) (2003) Systems of Innovation and Development: Evidence from Brazil. Cheltenham, UK: Edward Elgar Publishing. Cimoli, M. (ed.) (2000), Developing Innovation System: Mexico in the Global Context. New York and London: Continuum-Pinter. Cooke, P. (1998) Introduction. Origins of the concept, in Braczyk, H.-J. et. al. (Eds.), Regional Innovation Systems. London: UCL Press. David, P. and D. Foray (1995) Accessing and expanding the science and technology knowledge base, in STI Review, 16, pp. 13-68. Edquist, C. (2002) Innovation policy – A systemic approach. Paper presented to the IES Seminar, ISEG/UTLisbon. Evangelista, R., T. Sandven, G. Sirilli and K. Smith (1998), Measuring innovation in European industry, in International Journal of Economics and Business 3 (5), pp. 311-333.
37

Fagerberg, J. and M. Godinho (2004) Catching up and Innovation, in J. Fagerberg, D. Mowery and R. Nelson (eds.), The Oxford Handbook of Innovation. Oxford: Oxford University Press. Freeman, C. (1987) Technology Policy and Economic Performance: Lessons from Japan. London: Pinter. Freeman, C. (1979) The determinants of innovation, in Futures, June, 206-215. Freeman, C. (2004) Technological infrastructure and international competitiveness, in Industrial and Corporate Change, Vol. 13, No. 3, pp. 551-69. Freeman, C. and C. Perez (1988), Structural crisis of adjustment: business cycles and investment behaviour, in G. Dosi et al. (eds.), Technical Change and Economic Theory. London: Pinter. Freeman, C. and L. Soete (1997) The Economics of Industrial Innovation. London: Pinter. Godinho, M. M., S. Mendonça and T. S. Pereira (2003) Mapping Innovation Systems: a framework based on innovation surveys data, paper presented at the First Globelics Conference ‘Innovation Systems and Development Strategies for the Third Millennium’, Rio de Janeiro November, 2-6 Nov. 2003 Gregersen, B. and B. Johnson (2001) Learning Economy, Innovation Systems and Development, Paper prepared for the Converge Project (“Strategies and policies for systemic interactions and convergence in Europe – Converge”). Gu, Shulin (1997) China’s National Innovation System Approach to Participating in Information Technology: The Innovative Recombination of Technological Capability, Discussion Paper Series 9701, INTECH, United Nations University. Intarakumnerd, Patarapong (2004) Thailand national innovation system in transition, paper presented at the ASIALICS International Conference on “Innovation Systems and Clusters in Asia: Challenges and Regional Integration,” 1-2 April 2004, at Bangkok, Thailand. Kline, S.J. and N. Rosenberg (1986) An overview of innovation, in R. Landau and N. Rosenberg (eds.), National Systems of Innovation. Oxford University Press. Krishnan, R. T. (2003) The Evolution of a Developing Country Innovation System During Economic Liberalization: The Case of India, paper presented at the First Globelics Conference ‘Innovation Systems and Development Strategies for the Third Millennium’ Rio de Janeiro November, 2-6 Nov. 2003 Landabaso, M. (1995), The promotion of innovation in Regional Community Policy: Lessons and proposal for a Regional Innovation Strategy, paper presented at the RESTPOR ’95 Meeting.
38

Lundvall, B.-A. (1985) Product Innovation and User-Producer Interaction. Aalborg: Aaalborg University Press. Lundvall, B.-A. (ed.) (1992) National Systems of Innovation - Towards a Theory of Innovation and Interactive Learning. London: Pinter. Lundvall, B.-A. (2004) Introduction to ‘Technological infrastructure and international competitiveness’ by Christopher Freeman, in Industrial and Corporate Change, Vol. 13, No. 3, pp. 531-39. Lundvall, B.-Å. and S. Borràs (1999) The Globalising Learning Economy: Implications for Innovation Policy, Brussels, DG XII. Malerba, F. (2004) Sectoral Systems: How and Why Innovation Differs Across Sectors, in J. Fagerberg, D. Mowery and R. Nelson (eds.), The Oxford Handbook of Innovation. Oxford: Oxford University Press.
Mendonça, S., T. S. Pereira and M. Godinho (2004) Trademarks as an innovation indicator, forthcoming in Research Policy. Meyer-Krahmer, F. et al. (1998) Internationalisation of Research and Technology: Trends, Issues and Applications for Science and Technology in Europe. Brussels: European Commission, ETAN Working Paper. Nelson, R. R. (ed.) (1993) National Innovation Systems: A Comparative Analysis. Oxford: Oxford University Press. OECD (1992) Proposed Guidelines for Collecting and Interpreting Technological Innovation Data: Oslo Manual. Paris: OECD. OECD (2002), Dynamising National Innovation Systems. Paris: OECD. Patel, P. (1995) Localised production of technology for global markets, in Cambridge Journal of Economics, nº 19. Pavitt, K. (1984) Patterns of Technical Change: Towards a Taxonomy and a Theory, in Research Policy, 13, 343–74. Rush, H., M. Hobday and J. Bessant (1996) Technology Institutes: Strategies for Best Practice. Routledge. Saxenian, A. (1994) Regional advantage: Culture and competition in Silicon Valleyand route 128. Cambridge, MA: Harvard University Press. Sinh, Bach Tan (2004) Transformation of Vietnam National System of Innovation: The case of organizational and policy learning in the industrial technology R&D institutes, paper presented at the ASIALICS International Conference on “Innovation Systems and Clusters in Asia: Challenges and Regional Integration,” 1-2 April 2004, at Bangkok, Thailand.
39

Smith, K. (1992) Technological innovation indicators: experience and prospects, in Science and Public Policy, 19(6), 383-392. Smith, K. (2004), Measuring Innovation, in J. Fagerberg, D. Mowery and R. Nelson (eds.), The Oxford Handbook of Innovation. Oxford: Oxford University Press. Teubal, M., D. Foray, M. Justman and E. Zuscovitch (eds.) (1996) Technological Infrastructure Policy: an International Perspective. Kluwer Academic Publishers Zanfei, A. (2000) Transnational firms and the changing organisation of innovative activities, in Cambridge Journal of Economics, 24, pp. 515-542.
40

Annexes
41

42
Annex 1. Cluster Analysis Agglomeration Schedule
Agglomeration Schedule
64 67 ,193 0 0 724 25 ,224 0 0 1151 53 ,320 0 0 1636 38 ,329 0 0 1557 59 ,331 0 0 1639 45 ,331 0 0 1364 69 ,408 1 0 2240 43 ,447 0 0 3311 14 ,466 0 0 3137 50 ,520 0 0 2624 26 ,572 2 0 5048 54 ,585 0 0 2139 44 ,623 6 0 1516 19 ,649 0 0 1836 39 ,761 4 13 3851 57 ,765 3 5 3041 52 ,773 0 0 2616 20 ,774 14 0 4428 32 ,814 0 0 2322 27 ,817 0 0 3246 48 ,827 0 12 3063 64 ,852 0 7 3928 35 ,873 19 0 508 10 1,001 0 0 54
55 58 1,008 0 0 2737 41 1,032 10 17 4255 60 1,048 25 0 4131 34 1,090 0 0 333 9 1,145 0 0 55
46 51 1,186 21 16 4211 13 1,191 9 0 3617 22 1,270 0 20 4431 40 1,276 28 8 5165 68 1,323 0 0 4729 30 1,330 0 0 577 11 1,368 0 31 402 5 1,445 0 0 63
33 36 1,465 0 15 4362 63 1,501 0 22 457 15 1,560 36 0 52
55 56 1,567 27 0 5337 46 1,669 26 30 4933 47 1,730 38 0 4916 17 1,847 18 32 6262 66 1,916 39 0 471 12 2,071 0 0 55
62 65 2,094 45 34 564 18 2,197 0 0 60
33 37 2,202 43 42 5824 28 2,278 11 23 5731 49 2,443 33 0 597 21 2,467 40 0 54
55 61 2,497 41 0 567 8 2,754 52 24 621 3 2,768 46 29 63
55 62 3,135 53 47 6624 29 3,216 50 35 5933 42 3,366 49 0 6124 31 3,439 57 51 614 23 3,622 48 0 65
24 33 4,139 59 58 667 16 4,349 54 44 641 2 5,199 55 37 641 7 5,777 63 62 651 4 6,521 64 60 67
24 55 6,821 61 56 681 6 13,684 65 0 681 24 15,427 67 66 0
Stage 1 2 3 4 5 6 7 8 9 10 11 12 13 14 15 16 17 18 19 20 21 22 23 24 25 26 27 28 29 30 31 32 33 34 35 36 37 38 39 40 41 42 43 44 45 46 47 48 49 50 51 52 53 54 55 56 57 58 59 60 61 62 63 64 65 66 67 68
Cluster 1 Cluster 2Cluster Combined
Coefficients Cluster 1 Cluster 2
Stage Cluster FirstAppears
Next Stage
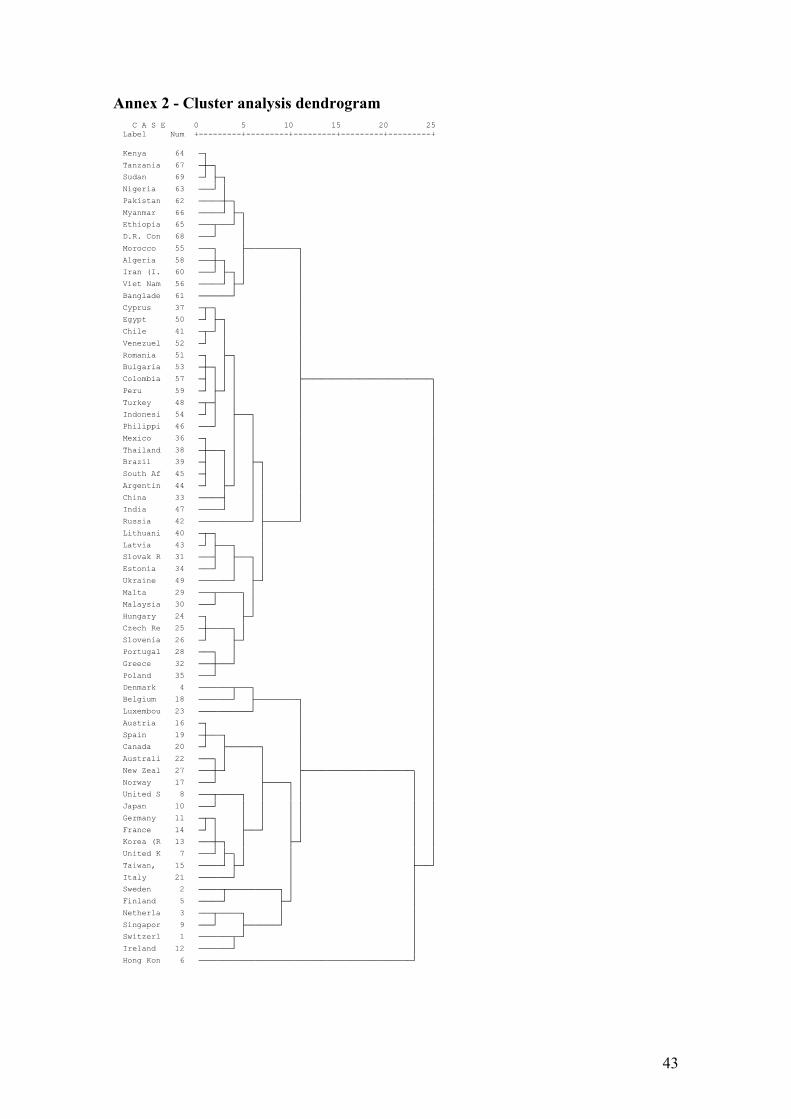
Annex 2 - Cluster analysis dendrogram C A S E 0 5 10 15 20 25 Label Num +---------+---------+---------+---------+---------+ Kenya 64 òø Tanzania 67 òôòø Sudan 69 ò÷ ùòø Nigeria 63 òòò÷ ó Pakistan 62 òòòòòôòø Myanmar 66 òòòòò÷ ùòø Ethiopia 65 òòòûòòò÷ ó D.R. Con 68 òòò÷ ó Morocco 55 òòòø ùòòòòòòòòòòòø Algeria 58 òòòôòø ó ó Iran (I. 60 òòò÷ ùòø ó ó Viet Nam 56 òòòòò÷ ùò÷ ó Banglade 61 òòòòòòò÷ ó Cyprus 37 òûòø ó Egypt 50 ò÷ ùòø ó Chile 41 òûò÷ ó ó Venezuel 52 ò÷ ó ó Romania 51 òø ùòø ó Bulgaria 53 òôòø ó ó ó Colombia 57 òú ó ó ó ùòòòòòòòòòòòòòòòòòòòòòòòòòòòø Peru 59 ò÷ ùò÷ ó ó ó Turkey 48 òûòú ó ó ó Indonesi 54 ò÷ ó ùòòòø ó ó Philippi 46 òòò÷ ó ó ó ó Mexico 36 òø ó ó ó ó Thailand 38 òôòòòø ó ó ó ó Brazil 39 òú ó ó ùòø ó ó South Af 45 òú ó ó ó ó ó ó Argentin 44 ò÷ ùò÷ ó ó ó ó China 33 òòòòòú ó ó ó ó India 47 òòòòò÷ ó ó ó ó Russia 42 òòòòòòòòòòò÷ ùòòòòòòò÷ ó Lithuani 40 òûòø ó ó Latvia 43 ò÷ ùòòòø ó ó Slovak R 31 òòòú ùòòòø ó ó Estonia 34 òòò÷ ó ó ó ó Ukraine 49 òòòòòòò÷ ùò÷ ó Malta 29 òòòûòòòòòø ó ó Malaysia 30 òòò÷ ó ó ó Hungary 24 òø ùò÷ ó Czech Re 25 òôòòòòòø ó ó Slovenia 26 ò÷ ùò÷ ó Portugal 28 òòòø ó ó Greece 32 òòòôòòò÷ ó Poland 35 òòò÷ ó Denmark 4 òòòòòòòûòòòø ó Belgium 18 òòòòòòò÷ ùòòòòòòòòòø ó Luxembou 23 òòòòòòòòòòò÷ ó ó Austria 16 òø ó ó Spain 19 òôòòòø ó ó Canada 20 ò÷ ùòòòòòòòø ó ó Australi 22 òòòø ó ó ó ó New Zeal 27 òòòôò÷ ó ùòòòòòòòòòòòòòòòòòòòòòòòø ó Norway 17 òòò÷ ùòòòòòø ó ó ó United S 8 òòòûòòòòòø ó ó ó ó ó Japan 10 òòò÷ ó ó ó ó ó ó Germany 11 òûòø ó ó ó ó ó ó France 14 ò÷ ó ùòòò÷ ó ó ó ó Korea (R 13 òòòôòø ó ùò÷ ó ó United K 7 òòò÷ ùòø ó ó ó ó Taiwan, 15 òòòòò÷ ùò÷ ó ùòòò÷ Italy 21 òòòòòòò÷ ó ó Sweden 2 òòòòòûòòòòòòòòòòòø ó ó Finland 5 òòòòò÷ ùò÷ ó Netherla 3 òòòûòòòòòø ó ó Singapor 9 òòò÷ ùòòòòòòò÷ ó Switzerl 1 òòòòòòòûò÷ ó Ireland 12 òòòòòòò÷ ó Hong Kon 6 òòòòòòòòòòòòòòòòòòòòòòòòòòòòòòòòòòòòòòòòòòòòò÷
43
Related Documents