Received October 5, 2009 / Accepted November 3, 2009 J. Technol. Manag. Innov. 2009, Volume 4, Issue 4 _________________________________________________________________________________ ISSN: 0718-2724. (http://www.jotmi.org) Journal of Technology Management & Innovation © Universidad Alberto Hurtado, Facultad de Economía y Negocios Firm’s Innovation Expectation, Potential and Actions: Impressions on the Japanese Videogame Console Market Paulo A. Zawislak, Fabiano Larentis, Cássio B. Machado, Alexandre M. Andrade 1 Abstract From the major assumptions proposed by the Theory of the Firm, it is possible to understand the firm as the primary site for innovation. Innovation efforts are justified by the vital need of any firm to generate enough solutions to be validated in the market. All along the market validation process, one can identify the life cycle of the innovation, easily represented by an “S-curve”. Whether due to the new solution’s success in terms of sales, market share or technological improvements, there is a sequence of stages that are, invariably, repeated in all technologies: startup, development and maturity. This paper presents, based on an S-curve model for innovation expectation and potential, the analysis of the major players (Nintendo, Sony and Microsoft) actions´ in the Japanese videogame console market. The most interesting findings are that firms launch new products somewhere just before the inflexion point of the previous S-curve, and stress the life cycle of each on-going technology by keeping, simultaneously, different versions of the consoles. Keywords: technology; innovation; S-Curve; videogame console market; decision making; performance. 1 School of Management, Federal University of the State of Rio Grande do Sul (EA/UFRGS) Rua Washington Luiz, 855 Centro. Porto Alegre - RS. Postal Code: 90.010-460. +55 51 33083536. (Corresponding authors) E-mail: [email protected] , [email protected] , [email protected] , [email protected]

Welcome message from author
This document is posted to help you gain knowledge. Please leave a comment to let me know what you think about it! Share it to your friends and learn new things together.
Transcript

Received October 5, 2009 / Accepted November 3, 2009 J. Technol. Manag. Innov. 2009, Volume 4, Issue 4
_________________________________________________________________________________
ISSN: 0718-2724. (http://www.jotmi.org) Journal of Technology Management & Innovation © Universidad Alberto Hurtado, Facultad de Economía y Negocios
Firm’s Innovation Expectation, Potential and Actions: Impressions on the
Japanese Videogame Console Market
Paulo A. Zawislak, Fabiano Larentis, Cássio B. Machado, Alexandre M. Andrade 1
Abstract
From the major assumptions proposed by the Theory of the Firm, it is possible to understand the firm as the primary site for innovation. Innovation efforts are justified by the vital need of any firm to generate enough solutions to be validated in the market. All along the market validation process, one can identify the life cycle of the innovation, easily represented by an “S-curve”. Whether due to the new solution’s success in terms of sales, market share or technological improvements, there is a sequence of stages that are, invariably, repeated in all technologies: startup, development and maturity. This paper presents, based on an S-curve model for innovation expectation and potential, the analysis of the major players (Nintendo, Sony and Microsoft) actions´ in the Japanese videogame console market. The most interesting findings are that firms launch new products somewhere just before the inflexion point of the previous S-curve, and stress the life cycle of each on-going technology by keeping, simultaneously, different versions of the consoles.
Keywords: technology; innovation; S-Curve; videogame console market; decision making; performance.
1 School of Management, Federal University of the State of Rio Grande do Sul (EA/UFRGS) Rua Washington Luiz, 855 Centro. Porto Alegre - RS. Postal Code: 90.010-460. +55 51 33083536. (Corresponding authors) E-mail: [email protected] , [email protected], [email protected], [email protected]

J. T echnol. Manag. Innov. 2009, Volume 4, Issue 4
70 ISSN: 0718-2724. (http://www.jotmi.org) Journal of Technology Management & Innovation © Universidad Alberto Hurtado, Facultad de Economía y Negocios
1. Introduction
In his seminal “The Nature of The firm”, Ronald Coase suggested that market relations and price searching were not enough to guarantee the internal functioning and the profitability of productive organizations. Instead, and in an attempt to overcome imperfections that are translated into transaction costs, the internal presence of an entrepreneur-coordinator was necessary. Somehow, despite using different approaches, Coase (1937) has entered into consonance with Schumpeter (1912) and gave back to the firm its actual significance: to create value before its factual validation in the market.
Yes, the firm does matter. And it matters because firms search internally for solutions that, even before becoming different one from the other (once competing in the market), may increase their chances of succeeding. This is why there are various products and values in the markets – what reinforces the existence of different prices – providing consumers with a great array of choices.
From the encounter between the products with different values and consumers with different expectations rises diversity, i.e. the very essence and purpose of each and every firm: innovation.
Innovation is expressed by a new solution (e.g. a new technology, process or product) with recognized economic value. It results from the creative combination of available technology, information and knowledge, whose results should be taken as an economic advantage in the market, that is, an extraordinary profit (according to Schumpeter). The economic advantage emerges from the fact that any new value may surprise consumers’ current value expectation, making them willing to pay more than they would for formerly available products within the current expectation; or, even in case they already own the product, to buy a new one so as to replace the old one.
Not all firms act this way, eliminating the latent possibility of market convergence to a pre-determined situation. Conversely, there will be a tangle of competitive alternatives. In fact, every firm becomes an expected potential innovation bearer, making ‘innovation’ its ‘only’ strategic option to win consumers and overcome competition.
However, only a posteriori will the firm be able to draw conclusions over its success (or failure). Somehow, reaching the market could be compared to a sort of ‘taking the plunge’, whether success will dependent on the firm’s judging capacity and, obviously, on consumers’ acceptance. But what molds a firm’s judging capacity? How can it know, with the highest probability of succeeding, what is going to be accepted by the market? And once it is, when will it be the time to ‘leap’ to a new solution, a new value alternative?
In an attempt to answer this and other questions, we present a simple model to approach the firm’s expectation and potential of innovation. Innovation expectation can be understood as the positive interpretation of an extraordinary profit made possible by a specific strategic action, whereas innovation potential represents the capacity of carrying out the result of such interpretation. The basis of this model is the identification of the firm’s position on the S-curve and, thus, inferring the subsequent probability distribution for the next steps to be taken.
The purpose of this article is, having this model in mind, to deepen the analysis of some firms’ actions along different S-curves. To do so recent historical data on sales volumes of different videogame consoles produced by Nintendo, Sony and Microsoft in the Japanese market were used. It is assumed that this set of data will allow us to better understand the behavior of the firm in order to release new market solutions in contrast to consumers’ expectations and purchasing behavior.
The paper is organized as follows. The next sections will present some theoretical predecessors related to the firm, innovation and its evolution (section 2), as well as the innovation expectation and potential model based on the S-curve pattern of behavior (section 3). In section 4, based on the market analysis of different videogame consoles in Japan, impressions will be taken about the model and its inference capacity concerning the innovation actions of the firms. Finally, the last section will present some reflections on the application of this model.
2. The firm, the innovation and the evolution
To understand what is proposed here, it is necessary to consider a different concept for the firm. It is not only the economic agent in charge of the combination of

J. T echnol. Manag. Innov. 2009, Volume 4, Issue 4
71 ISSN: 0718-2724. (http://www.jotmi.org) Journal of Technology Management & Innovation © Universidad Alberto Hurtado, Facultad de Economía y Negocios
production factors according to a previously defined notion of top efficiency originated from a given technology to produce goods and services with specified values. If it were only like this, each and every firm would only produce according to the current value expectation, becoming a convergent simple organizational structure. However, they are not.
2.1. The innovating firm
The firm is much more of an agent capable of discovering new combinations (different from what is expected!) of resources to solve consumers’ problems, i.e. the acquisition by the consumer of a certain product, that, when supplied, would fulfill (due to its utility) what is missing in terms of the consumer value expectation. In other words, it should fit the consumer’s curve of utility, the supposed benefit that a given product should provide them in exchange for a given monetary expenditure.
À la Knight, the firm develops a judgment capacity to look forward extraordinary Schumpeterian profits. This judgment process is based on the gathering, the evaluation and the process of at least one unit of information more than what is expected from the other economic agents, both firms and consumers. This notion of firm is based on its judgment capacity to adjust, to change and to go beyond the several environmental signs (Schumpeter, 1912; Knight, 1921; Penrose, 1959; Nelson and Winter, 1982; Amendola, 1983).
Every firm with an insight of positive interpretation about the extraordinary profit expectation, i.e. with a project to overcome its internal and external hindrances, will tend reach the market. On the other hand, every firm that, with the same difficulties, has a negative interpretation of the extraordinary profit expectation, for considering itself unable and very risky to solve the consumers’ value problem, will not reach the market; or, if it does, it will have extraordinary transaction costs. From this ongoing information and judgment processing, comes the clash among different firms in the market.
The functioning of the firm is based on a set of coordinated strategic actions (among which is the combination of factors) that, by overcoming internal difficulties, aims to make new recognized valuable goods and services. The production of new products should be
perceived by the firm as better, with higher value potential, than the cost of purchasing similar (or equivalent) ones in the market.
The firm is hence defined as an innovation strategy agent, going from the very internal process of entrepreneurial coordination, according to the aforementioned Schumpeterian-Coasean coupled innovation and marketing assumption, until the transaction itself. Briefly, a firm is a compound of technological, organizational and institutional capabilities whose main purpose is to guarantee extraordinary profit that can reward its assets above market expectations (Chandler, 1962; Richardson, 1972; Williamson, 1985; Lall, 1992).
The only way to obtain such reward is through innovation in the market.
2.2. Evolution and the actions of the firms
Somehow, every firm undertakes, or should undertake, an actual and continuous crusade for more innovation. Such crusade describes a path of evolution, closely connected to the choices of the firm (Dosi, 1991). This is the so-called path dependency that is naturally related to the S-curve, an analytical tool describing the evolution of any given technology. Somehow, it outlines the probability distribution of a certain path for a firm in its quest for innovation.
Any technology evolution curve invariably has, whenever considered along time, the shape of a logistic curve. If this is true, they can be used to estimate or even to predict the introduction and acceptance rates of any given technology, based on its performance growth or, alternatively, on the growth rate of its market shares. It is assumed, taking all this into consideration, an initial slow growth followed by a quick one, and after that a slow decline in the growth rate to its saturation. As the technological development reflects the firm’s innovation effort, likewise the S-curve describes the history of the technological evolution, pointing three key moments: innovation itself and early imitation (1); followers and general diffusion (2); and then slowdown and maturity (3) of a technology.
Figure 1 below sums up the path of evolution and its three key moments.

J. T echnol. Manag. Innov. 2009, Volume 4, Issue 4
72 ISSN: 0718-2724. (http://www.jotmi.org) Journal of Technology Management & Innovation © Universidad Alberto Hurtado, Facultad de Economía y Negocios
Figure 1. Technologic Evolution S-curve
The vertical axis shows, through different proxy variables, the amount of existing knowledge necessary to make any technology (`T´, in the Figure 1 above) economically efficient2
The first moment (1) expresses all the fierceness of the Schumpeterian competition, based on innovators and early imitators (Nelson and Winter, 1982). Such innovation will be mimicked by competition and occasional newcomers that are trying to obtain, even if partially, the expected extraordinary profit, already obtained by the first mover. Therefore, the technology ‘T’ describes a path with increasing adoption (imitation and diffusion) rates.
. The basic mechanism is simple: a successful technology, product or process, released by a firm, once acknowledged by the market (originally by consumers and subsequently by other firms), is then incorporated to the general knowledge database, i.e., to the state of the art (‘A’) along a given t time.
The second phase (2) is characterized by the inflexion point of the curve. The increasing innovation outcomes cease to happen and the path of evolution presents decreasing rates. It becomes more and more costly to keep the innovating capacity. This will tend to fade away as its adoption and use reach generalization.The outcomes, based on lower expectations of extraordinary profits, will then be smaller.
The firms, at this point, no longer compete through a differential, but through price reduction, what implies in a
2 The state-of-the-art (´A´) of a technology (`T´) can be inferred from different proxy variables. Besides the technical performance of a technology, the number of patents related to it, the market share it provides or even the accumulated sales, among others, are measures whose behavior has, originating from the market competitive forces , the shape of the S-curve
production cost reduction so as to keep the profit margins. As cost reduction depends on increasing technology efficiency, the limits of the latter lead to a minimum (lowest) level of the former. In this stage, competitiveness is usually achieved through margin reduction, making the ‘fountain’ of extraordinary profits to dry.
In the third phase (3), the technology ‘T’ is reaching its maturity (the limit of state-of-the-art ‘A’). Once a certain kind of knowledge is widely spread, innovation rate drops, tending towards zero. It becomes harder and harder, and less and less efficient to add novelties to technology without going through the harshness caused by partial or inappropriate efforts of meeting market’s expectations. Beyond the limit point, technology tends to generate diseconomies, which makes its use non-viable.
Due to this, one can infer some of the behavior features, which express the expectations of the firm itself. The discovery of a technology evolution can happen through the inference of the subsequent path of its probability distribution, based on the previous path that had been taken. The firm’s awareness of its S-curve can represent a more accurate notion of what its future may be like.
It is possible to assume that, according to the firm’s technologic development and capacity level, the actions of a firm will essentially be of two kinds:
(a) up to the inflexion point of the S-curve, innovating through its own capacity; or
(b) after the inflexion point, acquiring innovative technology via simple adaptation or adoption, just for filling a gap in its own capacity.

J. T echnol. Manag. Innov. 2009, Volume 4, Issue 4
73 ISSN: 0718-2724. (http://www.jotmi.org) Journal of Technology Management & Innovation © Universidad Alberto Hurtado, Facultad de Economía y Negocios
Hence, how to decide which is the best option? How to decide what to do in different stages of a technology? How to act so as to accomplish (with positive outcomes) a technologic development process? These are some questions that can be answered with the help of the model of innovation expectation and potential.
3. A model for innovation expectation and potential
For the better understanding of what it is proposed here, the firm is, even if we had criticized on section 2, initially defined as being a combination of resources that, based on a technology, makes viable the production of goods and services.
To make it easier, two resources will be taken into consideration, namely capital (K) and labor (L), and an existing state-of-art and technology level (A) effectively efficient from an economic viewpoint. Its outcome (Y) will then be a production function:
Y = f (K, L, A) (1)
Where K, L and A are independent stochastic processes, and Y is a random variable depending on these processes.
However, it is known that the contents of K and L are actually determined by the level of A. This cross impact turns the innovation process much more dependent on internal decisions of the firms themselves then on market definitions. Thus, it is necessary to go beyond the simple production function.
Considering that the outcome Yt, at time t, will only be obtained if the technology A has previously shown to be efficient to arrange K and L, it is considered that Yt is a variable known a posteriori. This comes from the assumption that all the information contained in Kt, Lt and At is already available at time t-1, and it has only more information added (∆ A) according to a probability distribution. This addition originates from the evolution obtained in the existing technology levels.
Given that, historically, the relation between K and L follows opposed paths – as they are substitutes – it is possible to infer that the K additions will be balanced by L reductions, and vice-versa. Moreover, it is also known that
the mere increase of K and L explains, only residually, the evolution behavior of Y3
Thus, it is said that the most meaningful addition relationship among the three independent stochastic processes is that of A, in which:
.
At = At-1 + ΔA (2)
where ΔA is a random variable that denotes innovation with an occurrence probability.
Considering that Kt-1, Lt-1 and At-1 are in fact known at the t moment (once they have already happened and are fully acknowledged), the expectation of a positive result Yt will depend on the technological development effort aiming at innovation. In this way, the production function is above all an ‘innovation function’ (Zawislak et al, 2008).
The expectation of a positive result in time t is denoted by:
E(Yt) = f (ΔA) (3)
Due to the fact that it is an expectation, the projection is based on previous results (“path dependency”), well represented by Yt-1. Thus, (3) is now denoted as:
E(Yt) = f (Yt-1, ΔA) (4)
Then, the goal is to know what ΔA is going to be. Innovation expectation – piece of data that shapes the Y development curve according to the S-curve (as previously seen in section 2) – will be influenced by Yt-1, that is, the last result actually accomplished, and from the resulted expectation itself E(Yt), according to a probability distribution, thus:
E(ΔA) = f (dYt-1/dt-1, dE(Yt)/dt) (5)
Where E(ΔA) denotes the innovation expectation of the firm.
3 Here reference is made to Robert Solow’s essential work on technical progress and aggregate production function. According to Solow (1957), only 1/8 of the productivity increases could be explained through the relationship between K and L. The other 7/8 should be attributed to technical progress. Some of his inferences are implicit in the subsequent reasoning.

J. T echnol. Manag. Innov. 2009, Volume 4, Issue 4
74 ISSN: 0718-2724. (http://www.jotmi.org) Journal of Technology Management & Innovation © Universidad Alberto Hurtado, Facultad de Economía y Negocios
The development effort of an innovating technology by a firm will result from a prospective image of the technology history4
The innovation process could be explained this way: the first moment would present an infinite expectation (once it is unknown). What comes next would only result from a behavior based on a technological evolution ‘image’ according to the structure and the shape of the S-curve, where:
. As shown before, we have here the chosen path influencing the strategic actions of the firms.
E(ΔA) is maximal for dY/dt > 0 until the inflexion point;
E(ΔA) tends to maturity for dY/dt > 0 after the inflexion point;
E(ΔA) tends to collapse for dY/dt = 0.
Having explained this, the main assumption of the innovation expectation model goes as follows: for the firm to assess its actual innovation potential, it would be enough to find out the point of the curve (dY/dt) where the firm is. If it is before and until the inflexion point, the firm should innovate one unit of ΔA else; if it is after the inflexion point, it must search for new T curves.
As the principle of the model is the same for all, i.e., it is possible to know the stage of the standard technology in t-1, the most relevant information becomes, again, the potential position of the firm in t. And this will depend directly on the technological capability of the firm to remain within the path tendency outlined by the S-curve.
Developing the judging capacity for generating innovations depends on the analysis of the environment, as well as of the position held by the company. Products released by different firms can faithfully portrait the situation immediately before the period aimed at. The model proposed is based on these analytical elements.
As the position of a firm up to the preceding period is previously determined and its evolution potential depends on the shape of the S-curve and the capability of the firm,
4 See Nonaka and Takeuchi (1995) according to which, both explicit and tacit knowledge are based on a previous set of accumulated competencies. See also the notion of abilities and routines as ‘genetic baggage’ in Nelson and Winter (1982). More than this, the definition of firm should incorporate elements such as qualifications, competencies and choices.
the firm has to find, in its industry, a proxy variable that better describes the environment, so that it can outline the whole curve to this moment. From then on, the decision (based on the two proposed alternatives shown in section 2) can be made.
4. Innovative behavior and actions of firms in the Japanese videogame console market
This section applies the assumptions of the model presented, considering the analysis of a set of actual secondary data. Upon scrutinizing the S-curve and its different mathematical variations, it is proposed an analysis pattern that attempts to raise new prospects about the innovative actions of the firms.
Taking into consideration the limited data availability, as well as the non-availability of R&D investment values (to correctly estimate the impact of ΔA5
4.1 Method
), this paper will analyze only the sales behavior as an estimator of Y and its evolutions along time (dY/dt).
To perform what is proposed here, secondary sales data of videogame console units in Japan from 1991 to 2007 (Vgchartz, 2008) were used6
5 If these data were available, it would be possible to determine more accurately the judging and decision moment concerning the kind of innovation action that every firm takes, and when it takes it. However, it does not prevent one from inferring, in general terms, that such decision happens necessarily before the release of a new product, and that it takes into account the time needed to have the projects carried out by R&D. Moreover, it is assumed that such time must be quite similar for all firms, only differing in terms of project content, that is, whether it involves goals related to technologic innovation, adaptation or mere adjustments
(see the appendix for the whole data). The companies researched were Nintendo, Sony and Microsoft, the main players in the Japanese market. The videogame sector was chosen because its innovation is fundamentally the development of new technical-scientific knowledge, and theoretically they work with state-of-the-art as a requirement to remain themselves in the market. And
6 VGChartz is a web site (www.vgchartz.com) set up with the aim of providing the gaming public with a detailed view of the videogame industry; which products are selling and which are not. It presents detailed mixture of sales figures, discussion boards, sales analysis, developer interviews, reviews, features, social networking and a sprawling game database.

J. T echnol. Manag. Innov. 2009, Volume 4, Issue 4
75 ISSN: 0718-2724. (http://www.jotmi.org) Journal of Technology Management & Innovation © Universidad Alberto Hurtado, Facultad de Economía y Negocios
Japanese market was used because of the recurrence of data availability since 19917
Regarding Nintendo, the analyses included data of Super Nintendo consoles (SNES) sold until 2000; Nintendo 64, sold from 1996 to 2002; Game Cube, sold from 2001, and Wii, sold from 2006 onwards. As for Sony, the data included referred to Playstation consoles, sold from 1994 to 2005; Playstation 2, sold from 2000 and Playstation 3, sold from 2006 on. Microsoft data were related to two of its consoles, Xbox, released in the Japanese Market in 2002, and Xbox360, sold from 2005 onwards.
.
Although weekly sales data were available, it was chosen to study the yearly sales due to large variation at the end of each week – what could make the analysis difficult to be carried out.
The model test was performed based on the change of the yearly sales curves into accumulated sales curves along the life cycle of each console under consideration. Firstly, it was verified that the products present an S-curve behavior, with key phases of introduction, development and maturity. Subsequently, through the angle coefficient calculation (dY/dt), the strategy of each product was evaluated.
4.2 Data analysis
Based on the assumptions made in the previous section, the temporal series of Nintendo, Sony and Microsoft in the Japanese market of videogame consoles will be presented. After that, the inflexion points of the curves will be analyzed8
Considering Nintendo’s consoles sales, in 1991 the SuperNintendo (SNES) was already being sold (it was released in Japan in late 1990). According to graph 1, this product reached its inflexion point in 1992, then having its sales decreased to the point it was withdrawn from the
7 US and European Community markets are also available, but their availability is not regular. One should know, though, that results, because of national idiosyncratic consumer behavior, could change leaders and followers. However, it will not change the analytical proposition on how do different firms act in terms of new product release. 8 To make the analysis easier, only these three companies were considered as being active in the market, once the other ones (like Atari) do not present significant figures for comparison.
market in 2000. In 1996, a new console, Nintendo64, was released, when SNES was already in decay. Its first year in the market was its best sales phase. In 2002 it was discontinued. In 2001, the GameCube was released, which reached its maturity in 2002. Wii was released in 2006. In 2007, basically due to Wii, Nintendo approached its 1992 sales and surpassed Sony in terms of units sold. This had not happened since 1995.
Sony’s Playstation was released in 1994, reached its inflexion point in 1997 and was discontinued in 2005. Playstation 2 was released in 2000 and reached its inflexion point in 2002. Playstation was the best-selling videogame in the world by 2006. In 2006, Sony released Playstation 3; the same year Wii reached the market.
Microsoft’s consoles sales started in 2002 with Xbox, when it reached its highest sales rate. Xbox360 came to market in 2005 and so far its top sales happened in 2007.
For all the firms, one can notice that the consoles cease to be sold after their sales have decreased to an insignificant share in the market – and even when there is another on-going product platform of a higher quality within the same company.
The model of innovation expectation and potential, as presented previously, indicates that, if the firm leading the market is at a point before the inflexion, it attempts to innovate, trying to change to a new curve, once after the inflexion point the income will start to decrease.
In other words, somewhere before the inflexion point there must be the strategic moment when the innovating firms ‘leap’ to another innovative essay and, consequently, tends to bring on a new curve.
Bearing all this in mind, if we focus on Sony, the main player analyzed (from 1996 to 2006), the coming of Playstation2 to the market in 2000 happened three years after Playstation had reached its inflexion point. Even after the release of Playstation 2 in 2000, Playstation was still sold until 2005. It is important to point out that in 2002 Playstation had a subtle recovery, due to a slight change in the console design. The coming of Playstation2 (new product and new curve) happened much ahead of the inflexion point presented by Playstation. As to Playstation 3, it was released four years after Playstation 2 reached its inflexion point.

J. T echnol. Manag. Innov. 2009, Volume 4, Issue 4
76 ISSN: 0718-2724. (http://www.jotmi.org) Journal of Technology Management & Innovation © Universidad Alberto Hurtado, Facultad de Economía y Negocios
Graph 1. Yearly consoles sale in Japan (in millions). Source: Based on Vgchartz (2008)
Thus, it can be noticed that, even upon releasing a new product, for a while, the firm will not discontinue the former one.
The release of the new product occurs, in avarege, 3 years after the previous product has reached its inflexion point. As to the leading firm, Sony, its three products present a behavior inferred by the theoretical analysis of the S-curve. Nonetheless, the strategic decision of innovating (here identified by the release of a new product) does not seem
to occur before the inflexion point. If it does, this happens in the internal scope of the firm, with the market unaware of it, that is, as an activity of the R&D. Somehow, with the variables available, what is suggested by the model of innovation expectation and potential does not completely occur.
The accumulated sales are analyzed below as a function of time
.
Graph 2. Accumulated sales per console (in millions) Source: Based on Vgchartz (2008)

J. T echnol. Manag. Innov. 2009, Volume 4, Issue 4
77 ISSN: 0718-2724. (http://www.jotmi.org) Journal of Technology Management & Innovation © Universidad Alberto Hurtado, Facultad de Economía y Negocios
If we take the accumulated sales by console (graph 2), it is possible to see clearly that the S-curve happens to all of them, but in different ways. If we analyze the angle
coefficient of some curves, there will be significant differences, allowing a distinction according to the innovation level.
Graph 3. Tendency Curves (first derivatives) Source: Based on Vgchartz (2008)
By analyzing graph 3, it is possible to clearly identify three behavior patterns of the curve’s mean derivatives. The tendency curves, described as equations, allow us to isolate the average angle coefficient of the straight lines shown in Graph 3. From these coefficients, it is possible to
compare numerically the tendency curves. To do it, it was chosen to normalize them, dividing each coefficient by the lowest one among them. The equation original coefficients, presented in decreasing order, can be seen in Table 1.
Console Angle Coefficient
Wii 0.77
Playstation 2 0.58
Playstation 0.38
SNES 0.33
Playstation 3 0.25
N64 0.13
GameCube 0.10
Xbox360 0.05
Xbox 0.01
Table 1 – Angle Coefficient of the Tendency Curves (first derivatives) Source: Based on Vgchartz (2008)

J. T echnol. Manag. Innov. 2009, Volume 4, Issue 4
78 ISSN: 0718-2724. (http://www.jotmi.org) Journal of Technology Management & Innovation © Universidad Alberto Hurtado, Facultad de Economía y Negocios
When comparing the curves and the average angle coefficients, it becomes possible to classify the different technologic actions of the firms.
The coefficients for Wii´s and Playstation 2´s consoles are clearly the highest ones, what enables us to classify them as purely innovations. They describe a whole S-curve, from the very slow begin going through the inflexion point until its maturity. We will describe them as being typical first phase products. They are technologically innovating products with a great market acceptance. Playstation 2 has innovated with the graphic realism and Nintendo Wii has created the interactivity concept.
The consoles SNES, Playstation and Playstation 3 have also presented high coefficients, but typical of the second phase of the S-curve, after the inflexion point, that is, being successful with their adaptive characteristics.
GameCube and Nintendo64 have shown to be less innovating, typically characterizing products that started their path somewhere in a third phase like of the S-curve, nearby the maturity moment. As to Microsoft consoles, Xbox and Xbox360, both presented a low coefficient, indicating that an imitation strategy tend not to work out, since they starts in the maturity phase of the curve9
Another interesting fact suggests that the firms not only analyze their curves, but also those of the competition. Coincidently, the introduction of a new product by a competitor happens at the very moment when the curve of the previously innovating product reaches high rates of sales decline. They behave as if they were waiting for the inflexion point to be reached, and then release a new product.
.
In such case, what are the reasons to make the firms in the videogame sector in Japan act differently from what is primarily proposed by the model of innovation expectation and potential?
9 It is interesting to note that if one takes worldwide statistics, thus considering Japanese, US and European markets, Microsoft’s Xbox consoles are much more competitive. This may suggests that each company should also acts taking in account different nationwide market specificities.
4.3. Some implications for firm’s innovative actions
Freely inspired on the Freeman’s technological strategy model (1982), according to the evolution level of the product and its own technological capability, the firm may choose from three kinds of technological strategies (and, thus, uprising actions) to enter and remain in the market:
1) innovative strategy, through which it intentionally aims being technological, and whenever possible, the market leadership;
2) adaptive strategy, when the firm deliberately develops actions whose outcomes are improvements in the current technology; or
3) follower strategy, when the firms waits, on purpose, to see the course taken by its sector, only then to outline the coming actions.
Moreover, some topics are raised here for consideration, mainly related to the sector’s time to market, but also to price reduction and the appearance of the new utility curves. In addition, it is known that such companies do not rely solely on videogame consoles to obtain profitability, higher sales and a good use of their installed base.
First, it has to be considered that the time to market in this sector has its peculiarities. The technology for the so-called innovating console is developed even before the former product has its first sales decline. Moreover, to release a new product, it is necessary to have compatible videogame software. Once the console technology is ready, it goes to the videogame programming department to develop suitable alternatives, what may delay the release of the product for commercialization. However, the development of compatible videogame software does not necessarily occur at the same pace as the console development or by the same companies (e.g. Sega, Kunami), and how successful the console will be strongly depends on the release of compatible games.
Secondly, it is believed that two kinds of consumers may coexist: the one who longs for owning the state-of-the-art in videogames, and the one who likes videogames, but does not buy it because of having prioritized another investment. The price cuts practices, used by the segment mainly when the product is declining; allow the product to reach utility curves for these consumers that, till then, had

J. T echnol. Manag. Innov. 2009, Volume 4, Issue 4
79 ISSN: 0718-2724. (http://www.jotmi.org) Journal of Technology Management & Innovation © Universidad Alberto Hurtado, Facultad de Economía y Negocios
decided not to buy it. By relating both kinds of consumers, it is possible for two product curves to coexist for a certain time. In other words, the market absorbs different products from the same manufacturer, but in different utility curves for each consumer.
Another peculiarity observed in the data is the fact that Nintendo was in a favorable position in the market (almost monopolistic), when Sony released its first console. The new concept of this console, using media instead of cartridge, and with more attractive graphic interface, made Sony’s sales surpass those of Nintendo for more than twelve years. Nintendo regained leadership in the market, after introducing a new concept of ‘playability’, in which the user starts to participate more actively in the game through motion sensors located in the control.
With Wii, Nintendo reaches utility curves of consumers that had not even participated in the videogame market previously. In this case it can be noticed that the user accepts consoles that change the current market standard, present a very distinct technology and whose incremental developments go in different directions from the ones taken by the previous versions.
Another observation is necessary when there are R&D investments that need to be won back; for a console to start to become profitable for a company, it must surpass the total invested in its development plus the opportunity cost offered by the market, considering an average of what could be earned if resources were invested in another business alternative. This causes the lack of releases while sales are still increasing, even because the introduction of a new technology at this point could cannibalize the profits of the previous one. This may explain the delay between introductions of products in the market, once they may overlap with the release of new products by competition.
Finally, due to the installed base and the pre-existing market that validated the previous product, and adding the segment achieved, there is the coexistence of two lines. Games are developed simultaneously for the different versions of consoles available in the market, what generates ‘incremental’ innovations in an ‘out-fashioned’ console. The consumers to whom the new product did not appeal may feel attracted to the new games, thus generating a possibility of ‘incremental profit’.
By having consumers with different utility curves, as presented previously, it is possible to win bigger market shares. When analyzing the total of Sony’s and Nintendo’s sales, the highest share percentage that Sony has reached (92.8%) when compared to its main competitor, happened when it released Playstation 2, of which 23% related to the sales of the old Playstation, and 70% to the new videogame.
Nintendo’s recovery has been happening only in the last few years; in 2007 it reached, when compared only to Sony, approximately 65% of the market. Most of the success obtained is due to the innovating technology perceived by the market in the Wii console10
5. Final observations
.
When examining in detail the S-curve and its different mathematical variations, it is created an analysis pattern that attempts to assign a kind of basic assumption to the model. What is wanted here is to overcome the obvious knowledge and rationality limitations of the firm and – once the other ones are equally limited – to provide an analysis framework that contains, in its core, the firm general features of behavior.
This paper analyzed the release behavior of the main videogame console companies in Japan. The application of this model in this specific market shows some peculiarities not necessarily foreseen in the original model. In all the cases, the firms let their products perish in the market – going against the possibility of always working with extra profit. Prices are cut to the point that the market no longer has space for that product, which is then discontinued.
What the proposed model did not take into consideration is that there are markets where innovation is only validated by one segment of consumers, and when its price is reduced, another one is reached, one that previously saw it as innovating, but whose price was not included in its utility curve. As two different kinds of consumers are affected, products from the same brand will not be competing. In further studies, this same model might be
10 Recent data (VGchartz, 2009) suggests that Nintendo´s Wii has become the best seller ever, with 48% of worldwide market against 27% of Sony´s consoles.

J. T echnol. Manag. Innov. 2009, Volume 4, Issue 4
80 ISSN: 0718-2724. (http://www.jotmi.org) Journal of Technology Management & Innovation © Universidad Alberto Hurtado, Facultad de Economía y Negocios
applied in other segments, to identify markets where innovation is a factor that eliminates the former product.
Finally, the purpose of this study was to apply the proposed model and, with it, to make easier the process of making (innovating!) strategic decisions; in other words, to make the firm try to reach the ‘best figures’ so that, with its perceiving capacity focusing exclusively on the decision, it may make the ‘best choices’. Even before being an organizational structure, every firm is a judging and acting agent.
Regarding this issue, some observations can be made. Firstly, in fact, it suffices for the firm to derive its own accumulated sales growth curve to have an idea if its product is innovating or a success adaptation, or a mere follower version. From the data analyzed, in each of the three kinds, the smaller the inclination of the derivative curve, the shorter the product shall live. Now, bearing this in mind, one can accelerate the substitution or even the discontinuing process.
Another conclusion has to do with the development and release cycles. Once there has been a release with proven success, i.e., an innovation, the others should know that the tendencies will have less and less inclined derivative curves. With the passing time, a new successful release should, necessarily, fall out the current expectation pattern. This seems to be exactly the case with Playstation 2, when compared to Nintendo’s former consoles, and with Nintendo Wii, in comparison to Sony’s consoles. In both cases, each one at its time, there was a change in the use pattern, whether graphically (with Playstation 2), or interactively (with Wii). In other words, there has been a change of the very curve of consumer’s utility.
Summing up, an innovation will obviously only be acknowledged in the market by assessing consumers’ acceptance behaviors and the impacts that a novelty produces in its utility curves. However, it is clear that the actions of the firms should focus on a set of novelties such that enables to establish an uncommon evolution path.
Through the behavior analysis of the S-curves of different products, it is indeed possible to outline more appropriate innovation strategies. In situations where the market seems to be saturated with some technology, it is vital for the firms to develop new alternatives. They should escape
the whole current technologic pattern, and not only a certain position in the curve.
Acknowledgments
Authors would like to thanks the research support of Brazilian National Council for Scientific and Technological Development (CNPq) and the Brazilian Coordination for the Improvement of Higher Education (CAPES).
References
AMENDOLA, M. (1983). Un changement de perspective dans l'analyse du processus d'innovation. In: Tournemine, Régis L. de. (1983) L'Innovation. La Documentation Française. Paris.
CHANDLER, A. D. j.r. (1962). Strategy and Structure. The M.I.T. Press, Cambridge, MA.
COASE, R. H. (1937). The Nature of the Firm. Economica. 4(16): 386-405, November.
DOSI, G. (1991). Perspectives on evolutionary theory. Science and Public Policy, 18(6):353-61, December.
FREEMAN, C. (1982). The economics of industrial innovation. The MIT Press, Cambridge, MA.
KNIGHT, F. H. (1921). Risk, Uncertainty, and Profit. Kelley and Millman, New York.
LALL, S. (1992). Technological capabilities and industrialization. World Development, 20(2):165-86.
NELSON, R.R. and WINTER, S.G. (1982). An Evolutionary Theory of Economic Change. Belknap, Cambridge, MA.
NONAKA, I. and TAKEUCHI, H. (1995). The knowledge-creating company: how Japanese companies create the dynamics of innovation. Oxford University Press, New York.
PAVITT, K. (1992). Some foundations for a theory of large innovating firm. In: DOSI, G. et al. (Eds.). Technology and Enterprise in a Historical Perspective. Oxford University Press, Oxford.
PENROSE, E. (1959). The Theory of the Growth of the Firm. Oxford University Press, Oxford.
J. T echnol. Manag. Innov. 2009, Volume 4, Issue 4
81 ISSN: 0718-2724. (http://www.jotmi.org) Journal of Technology Management & Innovation © Universidad Alberto Hurtado, Facultad de Economía y Negocios
RICHARDSON, G. B. 1972. The organization of industry, The Economic Journal, 1972
SCHUMPETER, J. A. (1912). The Theory of Economic Development. Abril Cultural, São Paulo. 1985 (for the Brazilian translation).
SOLOW, R. (1957). Technical Change and The Aggregate Production Function. Review of Economics and Statistics. August, pp.312-20.
VGCHARTZ (2008). Video Games, Charts, News, Forums, Reviews, Wii, PS3, Xbox360, DS, PSP. http://www.vgchartz.com. [Retrieved from the Web 11/06/08].
VGCHARTZ (2009). Video Games, Charts, News, Forums, Reviews, Wii, PS3, Xbox360, DS, PSP. http://www.vgchartz.com. [Retrieved from the Web 30/11/09.]
WILLIAMSON, O. E. (1985). The Economic Institutions of Capitalism: Firms, Markets, Relational Contracting. The Free Press, New York.
ZAWISLAK, P. A et al (2008). Towards the Innovation Function. Journal of Technology Management & Innovation. 3(4):17-30.
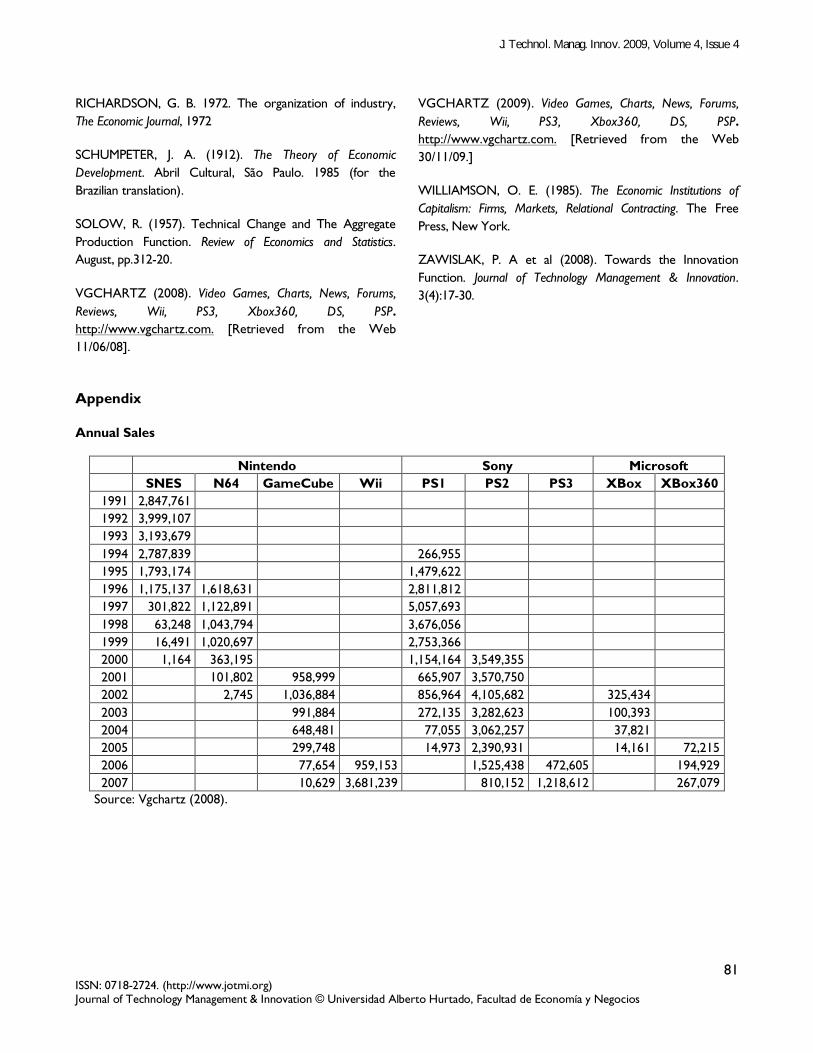
Appendix Annual Sales
Nintendo Sony Microsoft SNES N64 GameCube Wii PS1 PS2 PS3 XBox XBox360
1991 2,847,761 1992 3,999,107 1993 3,193,679 1994 2,787,839 266,955 1995 1,793,174 1,479,622 1996 1,175,137 1,618,631 2,811,812 1997 301,822 1,122,891 5,057,693 1998 63,248 1,043,794 3,676,056 1999 16,491 1,020,697 2,753,366 2000 1,164 363,195 1,154,164 3,549,355 2001 101,802 958,999 665,907 3,570,750 2002 2,745 1,036,884 856,964 4,105,682 325,434 2003 991,884 272,135 3,282,623 100,393 2004 648,481 77,055 3,062,257 37,821 2005 299,748 14,973 2,390,931 14,161 72,215 2006 77,654 959,153 1,525,438 472,605 194,929 2007 10,629 3,681,239 810,152 1,218,612 267,079
Source: Vgchartz (2008).
Related Documents