Course Objectives 1. To help students to appreciate the need for Quality Concepts in the modern business environment 2. To establish the connect Business Performance and adherence to Quality Philosophy 3. To appreciate the process of implementing Quality Programs in the organization Course Outcomes: On completion of this course, the students will be able to CO1. Analyze Business Processes and identify quality shortcomings CO2. Design Quality Improvement Programs CO3. Implement Quality Programs and Monitor them Catalog Description Total Quality Management is taught as an elective to students of Operations Management and also, Logistics & Supply Chain Management in the third semester i.e. when they have acquired an overview of an organization the Internship and are at the beginning of the placement cycle. It helps students to pursue certification in six-sigma (Green Belt). This course emphasizes the philosophy of quality management, the structure of analysis (DMAIC and DMADV) and statistical tools used in it. Course Content Unit I: Introduction 6 lecture hours Quality, Reliability, Quality Assurance, Monitoring and Control, Big and Small Q, Total Quality Management, Cost of Quality, Leadership, Customer Satisfaction, Employee Involvement, Contribution of Quality Guru’s to Quality Management Unit II: TQM Principles 6 lecture hours Business Processes, Process Analysis and Management, Continuous Process Improvement and Performance Measures, Supplier Relationship and Quality in Supply Chain Partners Quality in Service Sector, SERVIQUAL Unit III: Statistical Process Control 12 lecture hours SEVEN TOOLS OF QUALITY: Old Planning Tools - Pareto chart, Cause-and-effect Diagram, Check Sheet, Histogram, Scatter Diagram, Control Charts and Graphs. SEVEN TOOLS OF QUALITY: Addition New Planning Tools – Jiro Kawakita Diagram, Relationship Diagram, Tree Diagram (FAST), Matrix, Arrow Diagram, Process Decision Program Chart STATISTICAL FUNDAMENTALS (HANDS-ON WITH MINITAB): Statistical Thinking at various levels of Organization; Probability Distribution; Sampling, Sampling Distribution; Statistical Estimation (Confidence Limits), Sample Size, Hypothesis Formulation and Testing; STATISTICAL FUNDAMENTALS (HANDS-ON WITH MINITAB): Classical and Modern Methods of Experimentation, Design of Experiment, Taguchi’s approach to Experimental Design, Shianin and Red X Approach to Experiment Design; Regression analysis Unit IV: TQM Tools 4.5 lecture hours MBCG 746 Total Quality Management L T P C Version 1.0 3 0 0 3 Pre-requisites/Exposure Co-requisites --

Welcome message from author
This document is posted to help you gain knowledge. Please leave a comment to let me know what you think about it! Share it to your friends and learn new things together.
Transcript
Course Objectives 1. To help students to appreciate the need for Quality Concepts in the modern business environment 2. To establish the connect Business Performance and adherence to Quality Philosophy 3. To appreciate the process of implementing Quality Programs in the organization
Course Outcomes: On completion of this course, the students will be able to CO1. Analyze Business Processes and identify quality shortcomings CO2. Design Quality Improvement Programs CO3. Implement Quality Programs and Monitor them Catalog Description Total Quality Management is taught as an elective to students of Operations Management and also, Logistics & Supply Chain Management in the third semester i.e. when they have acquired an overview of an organization the Internship and are at the beginning of the placement cycle. It helps students to pursue certification in six-sigma (Green Belt). This course emphasizes the philosophy of quality management, the structure of analysis (DMAIC and DMADV) and statistical tools used in it. Course Content
Unit I: Introduction 6 lecture hours Quality, Reliability, Quality Assurance, Monitoring and Control, Big and Small Q, Total Quality Management, Cost of Quality, Leadership, Customer Satisfaction, Employee Involvement, Contribution of Quality Guru’s to Quality Management Unit II: TQM Principles 6 lecture hours Business Processes, Process Analysis and Management, Continuous Process Improvement and Performance Measures, Supplier Relationship and Quality in Supply Chain Partners Quality in Service Sector, SERVIQUAL Unit III: Statistical Process Control 12 lecture hours SEVEN TOOLS OF QUALITY: Old Planning Tools - Pareto chart, Cause-and-effect Diagram, Check Sheet, Histogram, Scatter Diagram, Control Charts and Graphs. SEVEN TOOLS OF QUALITY: Addition New Planning Tools – Jiro Kawakita Diagram, Relationship Diagram, Tree Diagram (FAST), Matrix, Arrow Diagram, Process Decision Program Chart STATISTICAL FUNDAMENTALS (HANDS-ON WITH MINITAB): Statistical Thinking at various levels of Organization; Probability Distribution; Sampling, Sampling Distribution; Statistical Estimation (Confidence Limits), Sample Size, Hypothesis Formulation and Testing; STATISTICAL FUNDAMENTALS (HANDS-ON WITH MINITAB): Classical and Modern Methods of Experimentation, Design of Experiment, Taguchi’s approach to Experimental Design, Shianin and Red X Approach to Experiment Design; Regression analysis Unit IV: TQM Tools 4.5 lecture hours
MBCG 746 Total Quality Management L T P C
Version 1.0 3 0 0 3 Pre-requisites/Exposure
Co-requisites --
Benchmarking, Quality Function Deployment (QFD), Taguchi Quality Engineering, Total Productive Maintenance (TPM) Unit V: Quality Systems 3 lecture hours ISO 9000, ISO 14000 Unit VI: Overview of Six Sigma 4.5 lecture hours Introduction to Six Sigma, Application of Six Sigma, Methodology and Tools for Lean Six Sigma Text Books
Gryna Frank M., Chua Richard C.H., Defeo Joseph A. (2001). Juran’s Quality Planning & Analysis for Enterprise Quality, 5th Edition. Tata McGraw-Hill
Reference Books
1. Charantimath, Poornima M. (2012). Total Quality Management, 2nd Edition. Pearson
Modes of Evaluation: Components of Continuous Evaluatiom: Individual Assignment (IA)/Group Assignment (GA)/Written Quiz (WQ) Components IA GA WQ End Semester Examination
Weightage (%) 30 10 10 50
Relationship between the Course Outcomes (COs) and Program Outcomes (POs)
Mapping between COs and POs
COURSE OUTCOMES ( COs )
POs
CO 1
Analyze Business Processes and identify quality shortcomings PO 1,2, 3,4,7,8,9,10, 11,13, 14
CO 2
Design Quality Improvement Programs PO 1,2, 3, 7,8,9,10, 11,14
CO 3
Implement Quality Programs and Monitor them
PO 1,2, 3, 8,9,10, 11, 13,14
Program Outcome / Course Outcome mapping
Course
Outcomes
CO 1 CO 2 CO 3
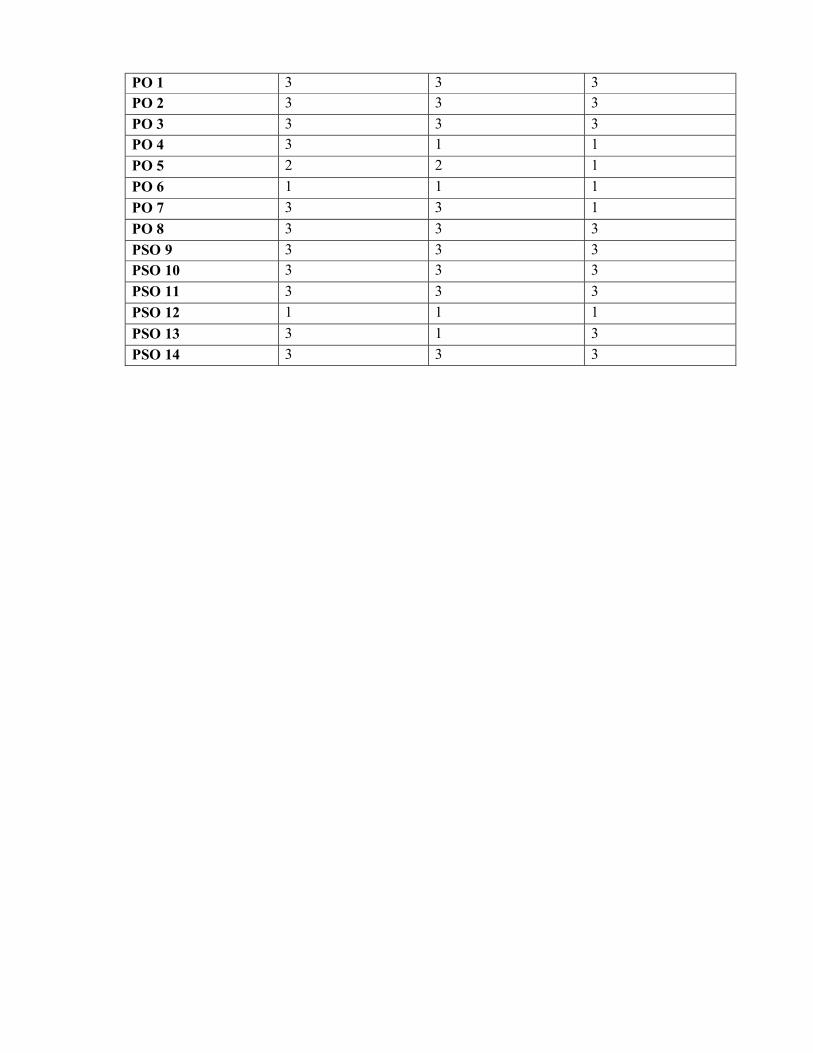
PO 1 3 3 3
PO 2 3 3 3
PO 3 3 3 3
PO 4 3 1 1
PO 5 2 2 1
PO 6 1 1 1
PO 7 3 3 1
PO 8 3 3 3
PSO 9 3 3 3
PSO 10 3 3 3
PSO 11 3 3 3
PSO 12 1 1 1
PSO 13 3 1 3
PSO 14 3 3 3
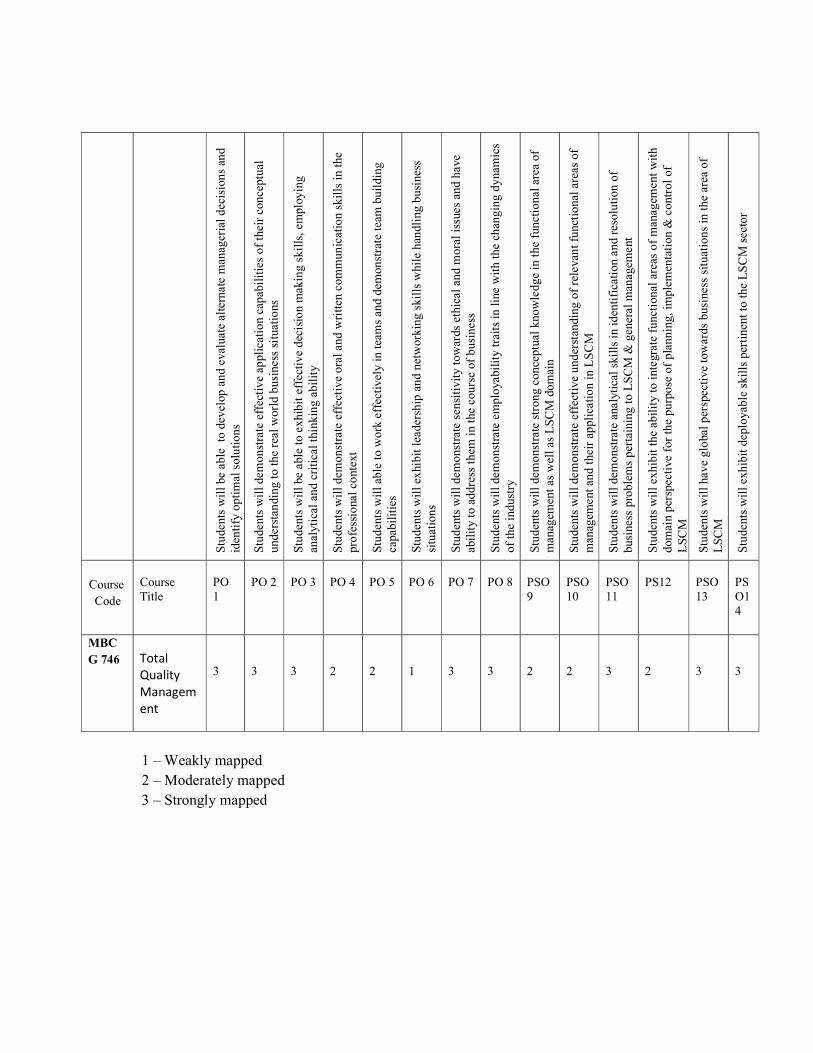
Stud
ents
wil
l be
able
to
deve
lop
and
eval
uate
alt
erna
te m
anag
eria
l dec
isio
ns a
nd
iden
tify
opt
imal
sol
utio
ns
Stud
ents
wil
l dem
onst
rate
eff
ecti
ve a
pplic
atio
n ca
pabi
litie
s of
thei
r co
ncep
tual
un
ders
tand
ing
to th
e re
al w
orld
bus
ines
s si
tuat
ions
Stud
ents
wil
l be
able
to e
xhib
it e
ffec
tive
deci
sion
mak
ing
skil
ls, e
mpl
oyin
g an
alyt
ical
and
cri
tical
thin
king
abi
lity
Stud
ents
wil
l dem
onst
rate
eff
ecti
ve o
ral a
nd w
ritte
n co
mm
unic
atio
n sk
ills
in th
e pr
ofes
sion
al c
onte
xt
Stud
ents
wil
l abl
e to
wor
k ef
fect
ivel
y in
team
s an
d de
mon
stra
te te
am b
uild
ing
capa
bilit
ies
Stud
ents
wil
l exh
ibit
lead
ersh
ip a
nd n
etw
orki
ng s
kill
s w
hile
han
dlin
g bu
sine
ss
situ
atio
ns
Stud
ents
wil
l dem
onst
rate
sen
siti
vity
tow
ards
eth
ical
and
mor
al is
sues
and
hav
e ab
ilit
y to
add
ress
them
in th
e co
urse
of
busi
ness
Stud
ents
wil
l dem
onst
rate
em
ploy
abil
ity
trai
ts in
line
wit
h th
e ch
angi
ng d
ynam
ics
of th
e in
dust
ry
Stud
ents
wil
l dem
onst
rate
str
ong
conc
eptu
al k
now
ledg
e in
the
fun
ctio
nal a
rea
of
man
agem
ent a
s w
ell a
s L
SCM
dom
ain
Stud
ents
wil
l dem
onst
rate
eff
ecti
ve u
nder
stan
ding
of
rele
vant
fun
ctio
nal a
reas
of
man
agem
ent a
nd th
eir
appl
icat
ion
in L
SC
M
Stud
ents
wil
l dem
onst
rate
ana
lytic
al s
kills
in id
enti
fica
tion
and
res
olut
ion
of
busi
ness
pro
blem
s pe
rtai
ning
to L
SC
M &
gen
eral
man
agem
ent
Stud
ents
wil
l exh
ibit
the
abili
ty to
inte
grat
e fu
ncti
onal
are
as o
f m
anag
emen
t wit
h do
mai
n pe
rspe
ctiv
e fo
r th
e pu
rpos
e of
pla
nnin
g, im
plem
enta
tion
& c
ontr
ol o
f L
SCM
Stud
ents
wil
l hav
e gl
obal
per
spec
tive
tow
ards
bus
ines
s si
tuat
ions
in th
e ar
ea o
f L
SCM
Stud
ents
wil
l exh
ibit
depl
oyab
le s
kill
s pe
rtin
ent t
o th
e L
SC
M s
ecto
r
Course Code
Course Title
PO 1
PO 2
PO 3
PO 4
PO 5
PO 6
PO 7
PO 8
PSO 9
PSO 10
PSO 11
PS12
PSO 13
PSO14
MBCG 746
Total Quality Management
3
3
3
2
2
1
3
3
2
2
3
2
3
3
1 – Weakly mapped 2 – Moderately mapped 3 – Strongly mapped
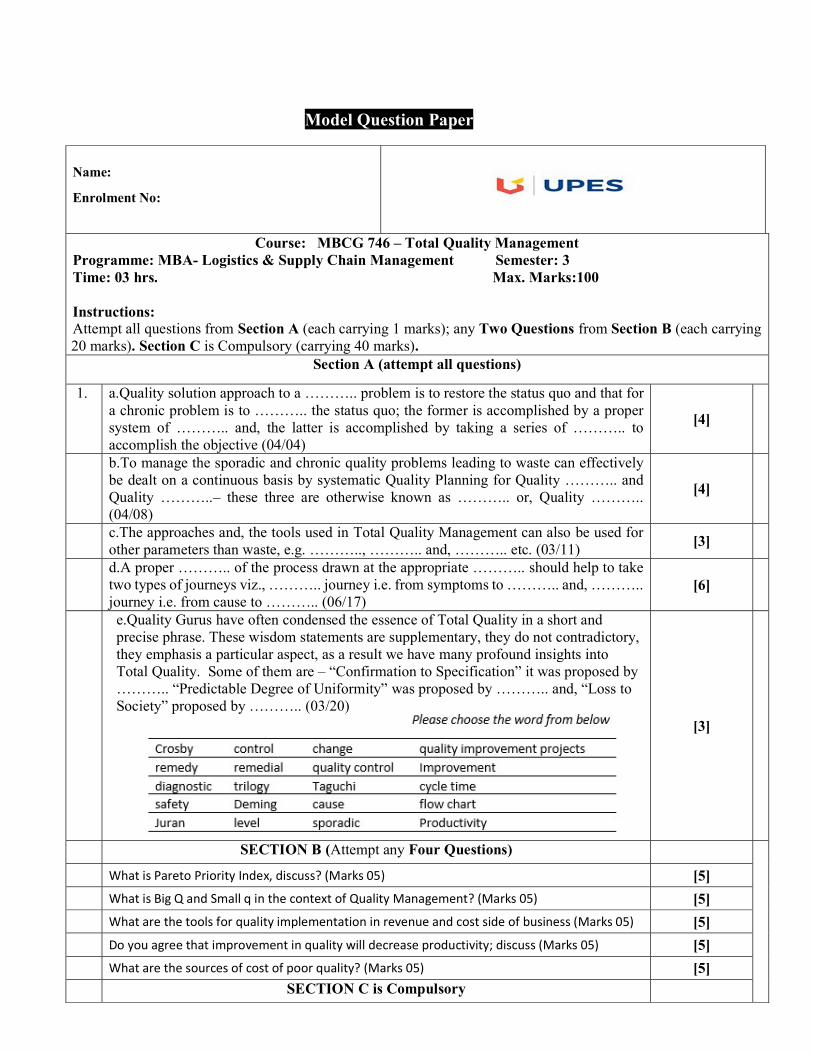
Model Question Paper
Name:
Enrolment No:
Course: MBCG 746 – Total Quality Management Programme: MBA- Logistics & Supply Chain Management Semester: 3 Time: 03 hrs. Max. Marks:100 Instructions: Attempt all questions from Section A (each carrying 1 marks); any Two Questions from Section B (each carrying 20 marks). Section C is Compulsory (carrying 40 marks).
Section A (attempt all questions)
1. a.Quality solution approach to a ……….. problem is to restore the status quo and that for a chronic problem is to ……….. the status quo; the former is accomplished by a proper system of ……….. and, the latter is accomplished by taking a series of ……….. to accomplish the objective (04/04)
[4]
b.To manage the sporadic and chronic quality problems leading to waste can effectively be dealt on a continuous basis by systematic Quality Planning for Quality ……….. and Quality ………..– these three are otherwise known as ……….. or, Quality ……….. (04/08)
[4]
c.The approaches and, the tools used in Total Quality Management can also be used for other parameters than waste, e.g. ……….., ……….. and, ……….. etc. (03/11)
[3]
d.A proper ……….. of the process drawn at the appropriate ……….. should help to take two types of journeys viz., ……….. journey i.e. from symptoms to ……….. and, ……….. journey i.e. from cause to ……….. (06/17)
[6]
e.Quality Gurus have often condensed the essence of Total Quality in a short and precise phrase. These wisdom statements are supplementary, they do not contradictory, they emphasis a particular aspect, as a result we have many profound insights into Total Quality. Some of them are – “Confirmation to Specification” it was proposed by ……….. “Predictable Degree of Uniformity” was proposed by ……….. and, “Loss to Society” proposed by ……….. (03/20)
[3]
SECTION B (Attempt any Four Questions)
What is Pareto Priority Index, discuss? (Marks 05) [5] What is Big Q and Small q in the context of Quality Management? (Marks 05) [5] What are the tools for quality implementation in revenue and cost side of business (Marks 05) [5] Do you agree that improvement in quality will decrease productivity; discuss (Marks 05) [5] What are the sources of cost of poor quality? (Marks 05) [5] SECTION C is Compulsory
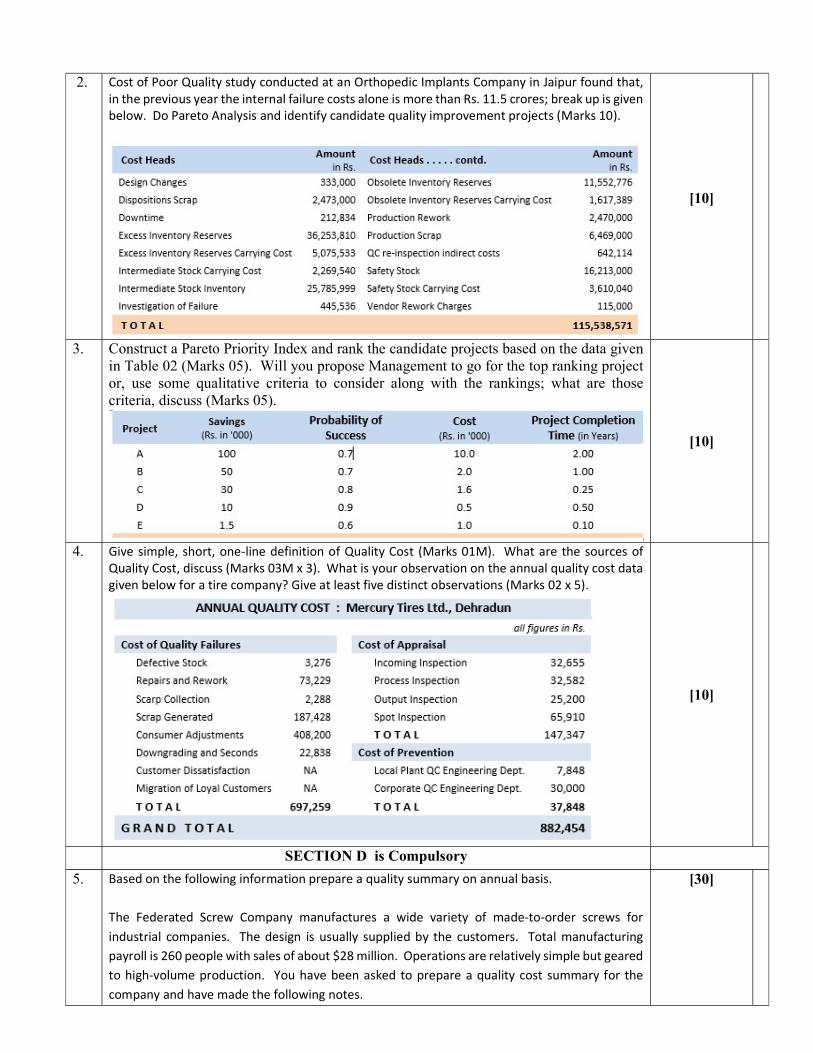
2. Cost of Poor Quality study conducted at an Orthopedic Implants Company in Jaipur found that, in the previous year the internal failure costs alone is more than Rs. 11.5 crores; break up is given below. Do Pareto Analysis and identify candidate quality improvement projects (Marks 10).
[10]
3. Construct a Pareto Priority Index and rank the candidate projects based on the data given in Table 02 (Marks 05). Will you propose Management to go for the top ranking project or, use some qualitative criteria to consider along with the rankings; what are those criteria, discuss (Marks 05).
[10]
4. Give simple, short, one-line definition of Quality Cost (Marks 01M). What are the sources of Quality Cost, discuss (Marks 03M x 3). What is your observation on the annual quality cost data given below for a tire company? Give at least five distinct observations (Marks 02 x 5).
[10]
SECTION D is Compulsory 5. Based on the following information prepare a quality summary on annual basis.
The Federated Screw Company manufactures a wide variety of made-to-order screws for industrial companies. The design is usually supplied by the customers. Total manufacturing payroll is 260 people with sales of about $28 million. Operations are relatively simple but geared to high-volume production. You have been asked to prepare a quality cost summary for the company and have made the following notes.
[30]
The quality control department is primarily a final inspection department (eight inspectors), which also inspects the incoming wire. Patrol inspection (One inspector) is performed in the Heading Room by checking the first and last piece of each run. The quality control department also checks and sets all gears used by that department and by production personnel. An inspector’s salary is approximately $24,000 a year. Quality during manufacturing is the responsibility of the operator setup teams assigned to batteries of about four machines each. It is difficult to estimate how much of their time is spent checking setups or checking the running of the machines, so you have not tries to do this yet. Production has two sorting INSPECTORS, EACH EARNING $18,000, WHO SORT lots rejected by the final inspection. The engineering department prepares quotations, designs tools, plans the routing of jobs, and establishes quality requirements, working from customer prints. The engineers also do trouble shooting, at a cost of about $20,000 a year. Another $16,000 is spent in previewing customers’ prints to identify critical dimensions, trying to get such items changed by the customer, and interpreting customers’ quality requirements into specifications for use by the Federated inspectors and manufacturing personnel. Records of scrap, rework, and customer returns are meager, but you have been able to piece together a certain amount of information from records and estimates: Scrap from final inspection rejections and customer returns amounted to 438,000 and 667,000 pieces, respectively, for the last two months. Customer returns requiring rework average about 1 million pieces per month. Scrap generated during production is believed to be about half of the total floor scrap (the rest is not quality related) of 30,000 kgs. per month . . . 30,000 POUNDS PER MONTH. Final inspection rejects an average of 400,000 reworkable pieces per month. These items can then be flat rolled or rerolled. Rough cost figures have been obtained from the accountants, who say that scrap items can be figured at $1.20 per thousand pieces, FLOOR SCRAP AT $800 PER THOUSAND POUNDS, REWORKING OF CUSTOMER RETURNS AT $4.00 PER THOUSAND PIECES, AND FLAT ROLLING OR REROLLING AT $1.20 PER THOUSAND PIECES. These figures are supposed to include factory overhead.
Related Documents