TOPSE: Tropospheric Ozone Production About the Spring Equinox Elliot Atlas & TOPSE Science Team

TOPSE: Tropospheric Ozone Production About the Spring Equinox Elliot Atlas & TOPSE Science Team.
Dec 20, 2015
Welcome message from author
This document is posted to help you gain knowledge. Please leave a comment to let me know what you think about it! Share it to your friends and learn new things together.
Transcript

TOPSE: Tropospheric Ozone Production
About the Spring Equinox
Elliot Atlas &
TOPSE Science Team

Primary Objective of TOPSE
To investigate the chemical and dynamic evolution of tropospheric chemical composition
over mid- to high-latitude continental North America during the winter/spring transition, with
particular emphasis on the springtime ozone maximum in the troposphere.

Measurement InvestigatorsRemote Ozone/Aerosols Browell et al., NASAAcidic Trace Gases/7-Be Talbot, Dibb, et al. UNHNMHC, Halocarbons, RONO2 Blake et al., UCINO2, Peroxynitrates Cohen, Thornton et al., UCBSpeciated Peroxides Heikes, Snow, URIOH, H2SO4 Eisele, Mauldin, NCARHO2, RO2 Cantrell, Stephens, NCARHNO3 Zondlo, NCARNOx, NOy, Ozone Ridley, Walega, NCARCH2O, H2O2 Fried, NCARJ values Shetter, Lefer et al., NCARPAN, PPN Flocke, Weinheimer, NCARCO, N2O Coffey, Hannigan, NCARUltrafine Aerosols Weber, GITMission Scientists/P.I.s Atlas, Cantrell, Ridley, NCAR
TOPSE Investigators: Measurements

Modeling/Collaboration InvestigatorsRegional/Forecast Model (HANK) Klonecki, Hess et al., NCARGlobal Model Analysis Tie, Emmons et al., NCAR
(MOZART) Brasseur et al., MPIProcess and Radiation Models Madronich, Stroud et al., NCARGlobal Model/Process Studies Jacob, Evans, Harvard U.Stratosphere/Troposphere Exch. Allen, Pickering, U. Md.Regional/other Models Wang et al., Rutgers U.Meteorological Forecast/ Moody, Cooper, Wimmers, U.Va.
Remote SensingOzonesonde Network Merrill, URI; Fast, PNWL
GOME BrO Richter, Burrows, U. BremenMet. Forecasts (UT/LS) Newman, NASAPolar Sunrise Expt., 2000 Shepson, Purdue;
Bottenheim, Can. Met. Serv.
TOPSE Investigators: Modeling/Collaboration
90
80
70
60
50
40
30
Latit
ude
-140 -120 -100 -80 -60 -40 -20
Longitude
Denver
Winnipeg
Churchill
Thule
Alert
TOPSE Flight Tracks: Feb - May, 2000
1 2 3 4 5 6 7
Deployment Number
TOPSE Flight Tracks

• Seasonal variation in trace gases/aerosols• Evolution strong function of altitude and latitude• Decline in NMHC; Spring maximum in sulfate• PAN most significant odd-nitrogen component of NOy
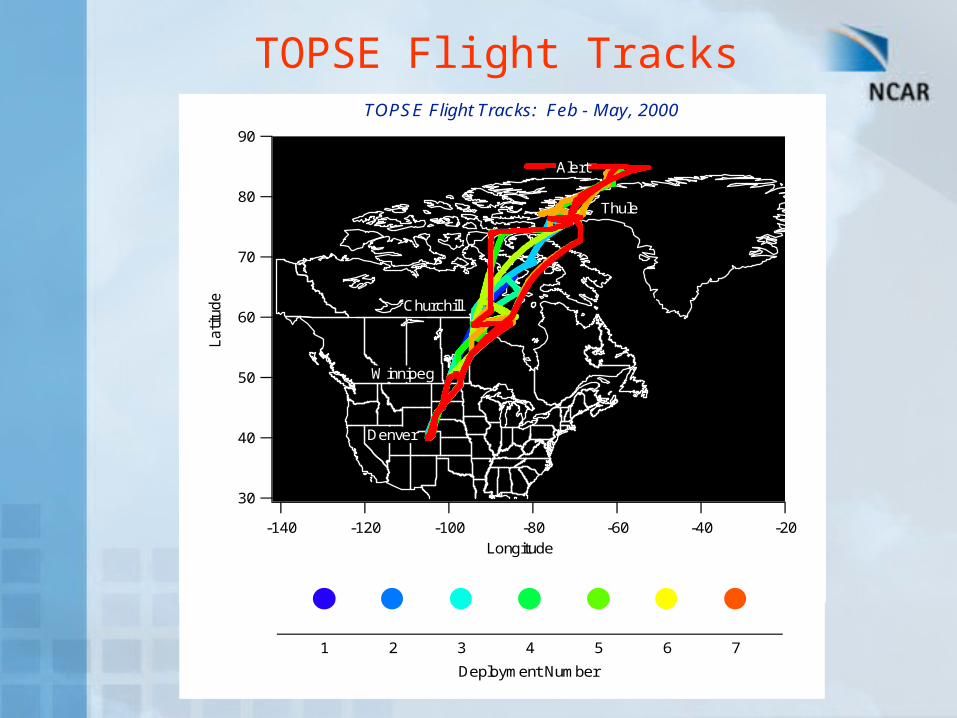
• Ozone evolution in the mid-troposphere• Increase about 20 ppb from Feb-May• Covariation in PANs, aerosols; no PV trend• Photochemical/surface sources implicated
• Surface ozone depletion• Observations in early spring-May• Br-catalyzed ozone loss• Long-range transport of depleted air suggested
• Transport processes• Most sampled air masses representative of
background mid-troposphere• Distant pollution sources were encountered in layers
Some TOPSE Highlights

•In-situ photochemical processes• Measured radicals consistent with constrained
models• Hydrogen peroxide 2 – 10 x lower than model• Formaldehyde photolysis significant HOX source
at high latitudes• Calculated increase in in-situ ozone production in
spring from increasing HOX sources and NO
• Stratosphere-troposphere exchange• Remote sensing (satellite/lidar) indicate
folds/streamers/STE(?)• In-situ encounters with lower stratosphere during
flights• 7-Be measurements/models suggest significant
fraction of tropospheric ozone is from stratosphere. Seasonal modulation by photochemistry with contribution by STE
Some TOPSE Highlights (cont’d)

Seasonal evolution of NMHC vs. latitude and altitude during TOPSE
(Blake et al., UCI)

8000
7000
6000
5000
4000
3000
2000
1000
0
Pal
t m
102 4 6 8
1002 4 6 8
1000
[CH2O] pptv
102 4 6 8
1002 4 6 8
1000
[CH2O] pptv
102 4 6 8
1002 4 6 8
1000
[CH2O] pptv
40 to 50 N Lat
All Meas Median Meas in Alt Bin Median Model in Alt Bin
50 to 57 N Lat > 57 N Lat
Figure 1
(Fried et al. – NCAR)
Formaldehyde vertical distributions vs. latitude:Feb – May, 2000

TOPSE SULFATE MIXING RATIO GEOMETRIC MEAN ALTITUDE PROFILE
(Latitudes 58oN to 85oN)
Aerosol sulfate mixing ratio (pptv)
0 50 100 150 200 250
Pre
ssu
re A
ltitu
de
(m
ete
rs)
0
2000
4000
6000
1
1
1
1
1
1
1
1
2
2
2
2
2
2
2
2
3
3
3
3
3
3
3
3
4
4
4
4
4
4
4
4
5
5
5
5
5
5
5
5
6
6
6
6
6
6
6
6
7
7
7
7
7
7
7
7
1
2
3
4
5
6
7
1988 GTE/ABLE 3A Summertime SO42- Averages
(Scheuer, Talbot, Dibb – UNH)
Evolution of Sulfate Aerosol Vertical Distribution
1 – 7 = Deployment number (Feb – May)

6000
4000
2000
0
Pre
ssur
e A
ltitu
de (
m)
250200150100500Ozone (ppbv)
140
120
100
80
60
40
Day of Y
ear
(Ridley, Walega - NCAR)
Ozone vertical profile: Evolution during winter-spring
BR_O3
52.315 53.8957.04
59.63562.86 63.065
74.61
30
40
50
60
70
80
90
100
0 1 2 3 4 5 6 7 8
Mission

Deployment 1 Deployment 3
Deployment 6Deployment 5
Deployment 4
Deployment 7
Average Ozone Distributions During TOPSE(Browell et al., NASA)
40 60 80 100 120 140 16050
100
150
200
250
300
350
400
450
500
2 km > altitude < 6 kmlatitude > 50 N
TOPSE: Average Trends in O3 and PANs
PANs
PA
Ns
(ppt
)
Day of Year
45
50
55
60
65
70
75
80
85
90O
3 (ppb)
O3
(Cohen, Thornton – UCB Flocke, Ridley – NCAR)
PANs and ozone in the mid-troposphere

(Dibb et al., UNH)
7Be measurements diagnose stratospheric O3
7Be/O3 correlation during TOPSE
Observations of stratospheric influence: 7Be, HNO3, O3

Chemical Transport Models (Global and Regional)
Significant Model Differences:MOZART HANK
Domain Global North of 20o
Hor. Resolution 2o x 1.9o 243 km (Mercator proj.)
Vert. Resolution 60 layers to 0.1 hPa 38 layers to 100 hPa
Meteorology ECMWF MM5 (NCEP)
Stratospheric O3 Climatological Relaxed to P.V.
Model Similarities: Chemical Mechanisms, Emissions, Dry Deposition, Washout, Lightning
(Emmons, Hess, et al. – NCAR)

Average of O3 for all flights
All TOPSE flights: 40-85N, 235-300E, Surface to 350 hPa
Good agreement between models and data until May

O3 Budget: 30o-90o North, Surface-350 hPa MOZART, HANK
PRODUCTION:
HO2+NO->NO2+OH
RO2+NO->NO2+RO
DESTRUCTION:
HO2+O3->OH+2O2
OH+O3->HO2+O2
H2O+O(1D)->2OH

O3 Production and Loss Rates: 40-60NComparison with Steady-State Model constrained by TOPSE
observations (Cantrell)
MOZART
HANK
SS-Model
Prod.
Loss

ODE
DIAL observations of surface ozone depletion over Hudson Bay
(Browell et al. – NASA)

4000
3000
2000
1000
0
Pre
ssur
e A
ltitu
de (
m)
72x103
717069686766Midtime (secs after midnight)
60
40
20
0
Ozo
ne (
ppbv
) an
d S
olub
le B
rom
ide
(ppt
v)
600
500
400
300
200
100
0
Ethyne (pptv)
Pressure Altitude (m) Ozone (ppbv) Ethyne (pptv) SolubleBromide (pptv)
TOPSE - HUDSON BAY : Low Ozone Transect
(Ridley-NCAR; Blake-UCI; Talbot-UNH)
In-situ measurements over Hudson Bay:Observations of surface ozone depletion

Transport of ozone depleted surface air from Arctic to Hudson Bay:
Evidence from measurements, models, satellite

SummaryTOPSE characterized seasonal evolution of ozone and precursors over continental N.America
Seasonal and altitude dependent transport Siberia/Europe vs. Asia
Ozone background has strong stratospheric source, but growth in spring is primarily from in-situ chemistry in troposphere
O3/aerosol/precursor relationships7Be analysis/models(Surface ozone depletion widespread
in Arctic…transport significant)
Models capture many features of seasonal change after improvements from measurement comparison, but questions remain.
Hydrogen peroxideFormaldehyde in UTetc….

TOPSE Science Team
Engineers, technicians, staff and pilots of NCAR Research Aviation Facility
Ground support at Churchill Airport and Thule Air Base
Financial support of the National Science Foundation Atmospheric Chemistry Polar Programs NCAR Directors Fund
Administrative and logistical support of the Atmospheric Chemistry Division, Traffic Services
Acknowledgments
Related Documents