1 Title: Topological basis of epileptogenesis in a model of severe cortical trauma 2 Authors: Vladislav Volman 1,2 , Terrence J. Sejnowski 1,2,3 , Maxim Bazhenov 4 3 4 1. Howard Hughes Medical Institute, Computational Neurobiology Laboratory, The Salk 5 Institute for Biological Studies, La Jolla, CA 92037, USA 6 2. Center for Theoretical Biological Physics, University of California San Diego, La Jolla, 7 CA 92093, USA 8 3. Division of Biological Sciences, University of California, San Diego, La Jolla, CA 9 92093, USA 10 4. Department of Cell Biology and Neuroscience, University of California, Riverside, 11 Riverside, CA 92521, USA 12 13 Running title: Epileptogenesis in severely traumatized cortex 14 15 Corresponding author: 16 Dr. Maxim Bazhenov 17 Department of Cell Biology and Neuroscience, University of California, Riverside, 18 Riverside, CA 92521, USA. 19 Email: [email protected] 20 21 22 23 24 25 26 Articles in PresS. J Neurophysiol (July 20, 2011). doi:10.1152/jn.00458.2011 Copyright © 2011 by the American Physiological Society.

Welcome message from author
This document is posted to help you gain knowledge. Please leave a comment to let me know what you think about it! Share it to your friends and learn new things together.
Transcript

1
Title: Topological basis of epileptogenesis in a model of severe cortical trauma 2
Authors: Vladislav Volman1,2, Terrence J. Sejnowski1,2,3, Maxim Bazhenov4 3
4
1. Howard Hughes Medical Institute, Computational Neurobiology Laboratory, The Salk 5 Institute for Biological Studies, La Jolla, CA 92037, USA 6
2. Center for Theoretical Biological Physics, University of California San Diego, La Jolla, 7 CA 92093, USA 8
3. Division of Biological Sciences, University of California, San Diego, La Jolla, CA 9 92093, USA 10
4. Department of Cell Biology and Neuroscience, University of California, Riverside, 11 Riverside, CA 92521, USA 12
13
Running title: Epileptogenesis in severely traumatized cortex 14
15
Corresponding author: 16 Dr. Maxim Bazhenov 17 Department of Cell Biology and Neuroscience, University of California, Riverside, 18 Riverside, CA 92521, USA. 19 Email: [email protected] 20 21
22
23
24
25
26
Articles in PresS. J Neurophysiol (July 20, 2011). doi:10.1152/jn.00458.2011
Copyright © 2011 by the American Physiological Society.

2
Abstract 27
28
Epileptic activity often arises after a latent period following traumatic brain injury. Several 29
factors contribute to the emergence of post-traumatic epilepsy, including disturbances to ionic 30
homeostasis, pathological action of intrinsic and synaptic homeostatic plasticity and remodeling 31
of anatomical network synaptic connectivity. We simulated a large-scale biophysically realistic 32
computational model of cortical tissue to study the mechanisms underlying the genesis of post-33
traumatic paroxysmal epileptic-like activity in the deafferentation model of a severely 34
traumatized cortical network. Post-traumatic generation of paroxysmal events did not require 35
changes of the structural connectivity. Rather, network bursts were induced following the action 36
of homeostatic synaptic plasticity which selectively influenced functionally dominant groups of 37
intact neurons with preserved inputs. This effect critically depended on the spatial density of 38
intact neurons. Thus, in the deafferentation model of post-traumatic epilepsy, trauma-induced 39
change in functional (rather than anatomical) connectivity might be sufficient for 40
epileptogenesis. 41
42
Keywords: homeostatic plasticity, paroxysmal discharge, seizure. 43
44
45
46
47
48
49
50

3
51
Introduction 52
53
Interictal epileptiform discharges (IEDs), characterized by brief repetitive (~200-500 ms) bursts 54
of highly correlated population activity, are often considered as an important diagnostic feature 55
of epileptic seizures (Dzhala and Staley 2003; Wendling et al. 2005). Despite the fundamental 56
significance of IEDs, the mechanisms responsible for their generation in epileptic brains are still 57
elusive (de Curtis and Avanzini 2001; Keller et al. 2010). IEDs could reflect complex network 58
interactions in heterogeneous neuronal populations (Keller et al. 2010), which depend on many 59
different network organization parameters such as connectivity and topological correlations 60
(Srinivas et al. 2007; Bogaard et al. 2009). 61
62
To address this question, we designed a large-scale model of a cortical network to study the 63
characteristics of post-traumatic IED activity, which often arises in vivo after a latent period that 64
follows traumatic brain injury (TBI) (Pitkanen et al. 2006). Understanding how brain trauma 65
affects the propensity to observe IEDs can help reveal the ways in which a traumatized brain 66
can become epileptic. Earlier studies indicated that in the traumatized network, adjustable 67
remodeling of network's anatomical connectivity can result in transition from normal 68
(asynchronous) to burst-like collective activity (Dyhrfjeld-Johnsen et al. 2007; Morgan and 69
Soltesz 2008). Other studies suggested that intrinsic and synaptic homeostatic plasticity 70
(Turrigiano et al. 1998) after brain trauma may contribute to epileptogenesis (Houweling et al. 71
2005; Avramescu and Timofeev 2008; Frohlich et al. 2008; Timofeev et al. 2010). 72
73
In this study, we show that the transition to IED does not necessarily rely on changes in the 74
network topology. Rather, the emergence of paroxysmal bursts critically depends on the 75
functional connectivity that is primarily determined by the spatial distribution of trauma-76

4
surviving (intact) neurons and the dominant synaptic connections between them. We further 77
show that topological determinants of this intact subnetwork only weakly affect the rate of post-78
traumatic interictal activity; rather, the spatial density of intact neurons is the pivotal parameter. 79
This suggests a new, previously overlooked role for the spatial pattern of brain trauma in 80
determining the chances of developing pathological activity. 81
82
83

5
84
Materials and Methods 85
86
The cortical network model 87
A cortical network was modeled as a 2D network (80 x 80 neurons) in which each neuron could 88
establish synapses with its peers with probability 6.0=Cp within its local footprint (10 x 10 89
neurons). Pyramidal neurons constituted 80% of network population (5120 out of 6400 90
neurons), and inhibitory neurons constituted the remaining 20% (1280 out of 6400 neurons). 91
We have not implemented layer specific features in the model because our goal was to define 92
general properties of a cortical network responding to traumatic intervention. This is a common 93
approach that has both its advantages (many layer specific properties are not well known and 94
generic model captures common dynamics of the cortical network) and disadvantages (layer 95
specific features, e.g., predisposition of the specific layers or areas to the epileptogenesis cannot 96
be tested). 97
98
Parameters were tuned such that in the baseline conditions, model pyramidal (PY) and 99
inhibitory (IN) neurons fired with average rates of 5 and 10 Hz, respectively (Figure 2A). For 100
each model neuron, the current equation was 101
( ) ( ) ( )tItItIdt
dVC EXsynion
mm ++−= (1) 102
The ionic current evolved according to (Prescott et al. 2006): 103
( ) ( )( ) ( )( ) ( ) ( )( )1007010050 ++++++−= ∞ mAmLmmKmmNaion VtGVGVVmGVVwGtI (2) 104
The fraction of open Na channels was 105
( ) ( )( ) ( )( )422cosh15.0 +−= ∞ mmm VVwVwdt
dw (3) 106
The steady-state fractions of Na and K channels were, correspondingly 107

6
( ) ( )( )( )212tanh15.0 ++=∞ mm VVw ; ( ) ( )( )( )232.1tanh15.0 ++=∞ mm VVm (4) 108
Adaptation conductance, ( )tGA , was nonzero only for PY neurons 109
( ) ( ) ( )tzcmmStGA23= (5) 110
( )
−+
+−⋅=5exp1
1005.0
mVz
dt
dz (6) 111
Values of other parameters: 112
2222 1,3.1,10,10 cmFCcmmSGcmmSGcmmSG mLKNa μ==== . 113
114
Synaptic dynamics 115
Synaptic transmission was modeled as a deterministic process in which both AMPA and 116
GABAa conductances were described as 117
( )SPIKEXD
XX ttDGg
dt
dg−+−= δ
τ (7) 118
where msD 5=τ was the time of synaptic conductance decay. Per spike synaptic conductances 119
were: 2222 4.74,372,28.89,4.74 cmSGcmSGcmSGcmSG IIPIIPPP μμμμ ==== . 120
NMDA conductance dynamics was modeled as 121
( ) ( ) ( )( )m
FSNMDA V
tgtgtg
06.0exp264.01 −+−
= (8) 122
with 123
( )SPIKENMDASF
SFSF ttDGg
dt
dg−+−= δ
τ ,
,, (9) 124
NMDA receptor activation parameters were: msmscmSG SFNMDA 80,2,928.8 2 === ττμ . 125
The parameter D accounted for short-term synaptic depression at AMPA/NMDA synapses: 126
( )SPIKER
ttUD
dt
dD −−−= δτ
1 (10) 127

7
Depression parameters were: 07.0,8.0 == UsRτ . All synaptic currents were related to their 128
conductances by ( ) ( )( )XmXX EVtgtI −−= , with mVEmVEE GABANMDAAMPA 70,0 −=== . In 129
addition to network current, each model neuron received an excitatory current 130
( ) ( )( )EXmEXEX EVtgtI −−= from “the rest” of the cortex. Synaptic conductance of this current 131
evolved according to ( )EXEXEX
EXEX ttGg
dt
dg−+−= δ
τ, and was stimulated at times EXt at the 132
baseline Poisson rate of HzEX 100=ν . Other parameters of external stimulation were 133
mVEmscmSG EXEXEX 0;5;300 2 === τμ . This external stimulation will be henceforth 134
referred to as “afferent excitation”. This afferent excitation was responsible for the generation of 135
background electrical activity in network models. Afferent excitation was present throughout 136
the simulations in all model neurons, albeit its intensity for a given neuron depended on the 137
specific trauma scenario that we studied, as described below. 138
139
Trauma 140
In its simplest form, trauma can be described as deafferentation, following which the amount of 141
external input to the network is reduced (Grafstein and Sastry 1957; Prince and Tseng 1993). In 142
the present model, we assumed that deafferentation is parameterized by both the number of 143
deafferented neurons and the reduction in the rate of their afferent excitation. Thus, the trauma 144
in our model was described by two parameters: Df , fraction of deafferented neurons, and Dr , 145
the remaining (relative to baseline scenario of HzEX 100=ν ) rate of afferent excitation. As an 146
example, ( )4.0,3.0 == DD rf describes a scenario in which the external stimulation rate to 30 147
percent of randomly picked neurons is reduced to 40 percent (40 Hz) of its value in “healthy” 148
network (100 Hz). We mainly considered scenarios with almost complete deafferentation. A 149
small number of model neurons (1 to 5 percent of total network population, labeled as IN ) 150

8
preserved their external afferent inputs after the trauma (that is, at all times after the trauma the 151
rate of afferent excitation to these neurons was the same as in the baseline model, 152
HzEX 100=ν ). These neurons were referred to as “intact” neurons and were distributed in 153
space as described below. 154
155
Spatial density of intact model neurons 156
One of our main results is the observation that the rate of paroxysmal discharges in severely 157
traumatized network critically depends on the distribution of intact neurons – the neurons that 158
preserve intact afferent input after deafferentation. To vary the spatial distribution of these intact 159
neurons, we defined their spatial density, as follows. We first defined the area in which intact 160
neurons could be distributed as a square (symmetric with respect to the center of our 2D lattice 161
on which the network was built) of side IL (in lattice units). A predefined number IN of 162
neurons were then randomly selected from all II LL × neurons in the region of interest (each 163
lattice site in our 2D lattice could accommodate only one model neuron). These selected 164
neurons preserved their input after deafferentation. All other neurons in the network were 165
deafferented. The ratio, ( )IIII LLN ×=ρ , then defined the spatial density of intact neurons 166
within II LL × area after deafferentation. According to this definition, 1Iρ = implies that all the 167
neurons within selected II LL × area were intact and all the deafferented neurons were 168
distributed outside this area. 0Iρ = implies that all the neurons of the network were 169
deafferented. Note that this definition of “intact neuron density” applies only to the case of 170
traumatized network, when the population of model neurons can be subdivided into 171
“deafferented” and “intact” on the basis of the afferent excitation they receive. 172
173
Homeostatic synaptic plasticity 174

9
Following earlier studies (Houweling et al. 2005; Frohlich et al. 2008), we employed an 175
approximation whereby homeostatic adjustments of collateral synaptic conductances (of intra-176
network connections) were calculated at the end of every 4 seconds of simulation on the basis of 177
activity during the preceding 4 seconds. The following equations were applied to adjust 178
collateral synaptic conductances 179
( ) PPPPPP GGG νν −+= −0
310 ; ( ) PIPIPI GGG νν −⋅−= −0
4105 (11) 180
in which ν is the averaged (over all PY neurons in the network) firing rate during the preceding 181
4 seconds, and 0ν is the target firing rate (5 Hz). Longer monitoring intervals (8 and 12 182
seconds) affected the rate with which the network approached its post-traumatic steady state, 183
but had no qualitative effect on results or conclusions of the present study. Note also that in our 184
present model, homeostatic synaptic plasticity scaled all PY-PY synaptic conductances by the 185
same amount, and all PY-IN conductances were scaled by the same amount as well (though 186
different from that of PY-PY case). Because of this similarity across all synapses of the same 187
type, we could quantify the extent of homeostatic synaptic plasticity simply by computing the 188
percentage of change in synaptic conductance relative to its value in the baseline model. Thus, 189
taking PY-PY synapse as an example, ( ) ( )
( )0
0100
==−=
⋅≡tG
tGTtGHSP
PP
PPPP , where the time T is 190
taken to be sufficiently long after the trauma event (in the new post-traumatic steady state). 191
192
Analysis of network structure 193
We applied several widely used measures to characterize organization of the intact subnetwork. 194
The interconnectedness of the intact subnetwork was quantified by computing the network 195
averaged in-degree ik , the mean number of incoming connections received by a typical intact 196
neuron from other intact neurons. To quantify the topological correlations in the subnetwork of 197

10
intact neurons, we computed its clustering coefficient. The clustering coefficient of i-th intact 198
neuron was defined as 199
( )
1, 1
1
KN
ij im jmj m
iK K
e e e
cN N= ==
−
(12) 200
where KN is the number of intact neurons that send synaptic connections to the i-th intact 201
neuron, 1=ije if j-th intact neuron projects a synapse to i-th intact neuron (and 0=ije if there 202
is no such synaptic connection) and the double sum runs over all pairs of intact neurons that 203
send synaptic connections to i-th intact neuron. The clustering coefficient measures the 204
abundance of "connectivity triangles" and thus can be used to estimate the number of 205
elementary recurrent circuits in the subnetwork of presynaptic intact neurons that send synapses 206
to a given intact neuron. A network averaged clustering coefficient of intact subnetwork was 207
obtained by averaging ic over all intact neurons. 208
209
In a set of simulations, we replaced the intact subnetworks with their equivalent random graphs. 210
These graphs were composed of the same set of intact neurons iN , had the same mean in-211
degree ik (same averaged number of synapses from other intact neurons to a given neuron) 212
but uniform probability ( ) iiij kNp 1−= to establish a pair-wise connection between intact 213
neurons, and were characterized by a much lower clustering coefficient as compared to the 214
intact subnetworks of the baseline model from which they were derived (see Figure 1 for 215
schematic diagram; see also Figure 4A for quantification of clustering coefficient reduction). 216
217
As we show in Results, the mean number of incoming connections in intact subnetworks 218
increased as the density of intact neurons increased. Thus, either one of these parameters 219
(incoming connectivity or spatial density of intact neurons) could in principle affect the rate of 220

11
paroxysmal discharges. To clearly determine the relative role of connectivity vs. spatial density, 221
in another set of simulations we replaced the intact subnetworks with a network that had preset 222
connectivity (the same mean number of incoming connections per intact neuron was used for 223
subnetworks with different spatial distribution of their neurons). Specifically, for each density 224
scenario we determined the intact neurons (same number of intact neurons was used regardless 225
of their spatial density), and then imposed synaptic connections between them (same mean 226
number of synapses to a given intact neuron from other intact neurons was used, regardless of 227
their spatial density), in addition to synaptic connections those intact neurons formed with 228
deafferented neurons (Figure 1). This allowed us to avoid mixing the effects of spatial 229
distribution of intact neurons with the changes in their interconnectedness in the intact 230
subnetwork. 231
232
233

12
Results 234
235
Rate of post-traumatic IEDs depends on the spatial distribution of intact neurons 236
237
To study effects of synaptic deafferentation on the network dynamics we designed large-scale 238
network model of the cortical excitatory neurons and inhibitory interneurons (see Methods) that 239
displayed random asynchronous activity in the physiological frequency range (Figure 2A). 240
Immediately following the deafferentation, the averaged firing rate of pyramidal neurons 241
dropped to the very low levels (< 1 Hz) (Figure 2B). Synaptic interactions significantly 242
contributed to neuronal dynamics in our model: Thus, after deafferentation the firing rate of 243
intact neurons was also reduced. The extent of the drop in the firing rate of intact neurons 244
depended on the parameters for deafferentation and on the spatial density of intact neurons (e.g. 245
for scenario considered in Figure 2C the initial drop in averaged firing rate of intact neurons 246
was from 5 Hz to ~0.4 Hz, but for scenario considered in Figure 2D the initial drop was from 5 247
Hz to ~3 Hz). Evidence from experimental studies and clinical data suggests that post-traumatic 248
networks undergo significant remodeling of anatomical and functional connectivity that aims to 249
compensate for the trauma-induced reduction of excitability and activity (Dyhrfjeld-Johnsen et 250
al. 2007; Butz et al. 2009; Jin et al. 2006; Avramescu and Timofeev 2008). In particular, 251
trauma-induced acute reduction of activity may modify synaptic strengths by activating 252
homeostatic synaptic plasticity (HSP) (Avramescu and Timofeev 2008), which up-regulates 253
depolarizing influences (e.g., excitatory intrinsic and synaptic conductances) and down-254
regulates hyperpolarizing ones (e.g., inhibitory conductances) (Turrigiano et al. 1998). This 255
regulatory process depends on the ongoing network activity and operates on a faster time-scale 256
than do the mechanisms of structural network reorganization (e.g., post-traumatic sprouting, see 257

13
(Dyhrfjeld-Johnsen et al. 2007; Morgan and Soltesz 2008)). We implemented HSP in our model 258
of post-traumatic network reorganization. 259
260
In our model, homeostatic regulation adjusted the strengths of synaptic conductances to bring 261
the network-averaged firing rate to a preset target level of 5 Hz corresponding to a typical rate 262
of asynchronous firing in intact neocortex (Figure 2E). We previously demonstrated that HSP-263
mediated up-regulation was able to recover normal asynchronous spiking activity for low to 264
moderate levels of deafferentation only (Houweling et al. 2005; Frohlich et al. 2008). A result 265
of homeostatic regulation following severe deafferentation was the transformation of collective 266
activity from asynchronous (for “healthy” cortex, Figure 2A) to burst-like activity (Figure 2B-267
D) that resembled the IEDs; each burst lasted ~200 ms and gradually recruited all model 268
neurons. Importantly, however, here we found that the effect of HSP on the mean firing rate 269
depended on the spatial distribution of intact neurons (see definition of “intact neuron density” 270
in Methods), with low density scenarios (intact neurons widely scattered in space; low Iρ ) 271
resulting in failure to achieve the preset rate for physiological levels of synaptic scaling 272
(maximal up-regulation limited at 100%, corresponding to the double of the initial synaptic 273
strength, as in (Turrigiano et al. 1998)). The rate at which bursts were generated depended on 274
the density, Iρ , of intact sub-population (Figure 2B-D). The bursts emerged only after 275
homeostatic plasticity changed synaptic conductances to become sufficiently strong, suggesting 276
that this mode of collective activity depends on synaptic interactions. In lower density 277
scenarios, model neurons fired more spikes per burst compared to the higher density scenario 278
(compare middle panels in Figure 2B-D) thus compensating for the lower burst rate and helping 279
to bring the network average firing rate of PY neurons toward its target value. Taken together 280
with the apparent dependence of post-traumatic burst rate on spatial distribution of intact 281
neurons, this suggests that the network organization of a small set of coupled intact neurons 282

14
may significantly affect post-traumatic activity in a whole network; this important issue was the 283
focus of the current study. 284
285
Topological determinants of intact subnetwork correlate with the rate of post-traumatic 286
IEDs 287
288
We now quantify the effects of the spatial distribution of intact neurons on reorganization of 289
collective activity in post-traumatic network. The spatial density of intact neurons was varied by 290
uniformly distributing them in square blocks of preset dimensions. We found that the rate at 291
which IEDs were generated significantly changed with the density of intact neurons Iρ (Figure 292
3A). The asymptotic (after a sufficiently long time) level of homeostatic synaptic scaling 293
increased for the network with a low density of intact neurons until it saturated at 100% (Figure 294
3B). For a given spatial density, the rate of IEDs depended nonlinearly on deafferentation - the 295
amount of reduction in the rate of extra-layer afferent stimulation (see below, Figure 6A). 296
Earlier studies by other groups (Netoff et al. 2004; Dyhrfjeld-Johnsen et al. 2007; Bogaard et al. 297
2009) suggested that changes of the network topology (e.g., averaged number of incoming 298
connections per neuron, clustering coefficient of a network, or minimal path length) can lead to 299
epileptic-like activity. To understand how the network organization of a small number of intact 300
neurons that survived the trauma determines the chances of generating collective interictal 301
dynamics in our model networks, we computed the clustering coefficient of the directional 302
graph that described subnetwork ω of intact neurons ( Ω⊂ω , where Ω denotes the entire 303
network), for different spatial densities of intact neurons. A clustering coefficient of i-th neuron, 304
ic , measures the abundance of "connectivity triangles" (elementary recurrent circuits) in the 305
subnetwork defined by that neurons’ projections from other intact neurons (Methods); thus, 306
higher ic is expected to lead to a more correlated, and possibly stronger, excitation of the i-th 307

15
neuron. As is seen from Figure 3C, in our networks the distribution of ic was much broader 308
with high peak near zero when intact neurons were scattered in low density, as compared with 309
the high density scenario in which the intact neurons were clustered in space. The network-310
averaged clustering coefficient of intact subnetwork was positively correlated with the rate of 311
IEDs that engulfed the entire traumatized network (Figure 3E), and was also positively 312
correlated with the spatial density of intact neurons (Figure 3D). Thus, we conclude, that 313
topological determinants of network structure positively correlate with the rate of paroxysmal 314
burst generation. 315
316
Spatial density, but not topology, of intact subnetwork is causal in increasing the rate of 317
IEDs in traumatized network 318
319
Is the rate of paroxysmal discharges in post-traumatic network determined solely by the 320
topological organization of intact subnetwork? Both the clustering coefficient and the mean 321
number of collateral synapses, ik , between intact neurons scaled up with the density of intact 322
neurons (Figures 3D,F). In general, these two characteristics of the network topology are 323
independent and the observed burst rate increase after deafferentation could be conflated with 324
either of them or with both. Alternatively, the burst rate increase can be primarily mediated by 325
increase of the spatial density of intact neurons. To answer this question, in simulations below, 326
we alternated the connectivity structure of the population of intact neurons that “survived” 327
deafferentation. 328
329
To determine the role of topological clustering in paroxysmal burst generation, we substituted, 330
immediately after deafferentation, the equivalent random graph for the subnetwork ω of all 331
intact neurons. This graph consisted of the same set of intact neurons with each neuron 332

16
receiving the same averaged number of synapses from other intact neurons but probability to 333
establish a pair-wise connection between intact neurons was uniform (see Methods). Such 334
randomization of intact subnetwork topology significantly reduced the average clustering 335
coefficient of the network (Figure 4A), while resulting in a small but significant decrease in the 336
incidence of post-traumatic paroxysmal bursts (Figure 4B). Thus, a higher clustering coefficient 337
correlated with an increased rate of paroxysmal discharge, but explained only a small part of it. 338
339
To assess the extent to which increased number of collateral synapses in the intact subnetwork 340
affects the rate of paroxysmal discharges, we substituted, immediately after deafferentation, the 341
network with fixed connectivity for the subnetwork ω of all intact neurons. Specifically, we 342
replaced connectivity between intact neurons by fixed connectivity with the same mean number 343
of synapses regardless of the spatial density of intact neurons (see Methods). Thus, in this fixed 344
connectivity network the structure and number of synapses between intact neurons was kept 345
constant regardless of their density (Figure 4C). Interestingly, in the networks with fixed 346
connectivity, the rate of IEDs still showed a very strong dependence on the spatial density of 347
intact neurons (Figure 4D). When density was low, synaptic drive to deafferented neurons from 348
intact ones was insufficient to initiate spikes required for global activity propagation regardless 349
of the connectivity pattern between intact neurons. Thus, increased collateral connectivity of 350
intact subnetwork correlated with the increased rate of paroxysmal discharge, but also explained 351
only a small part of it. 352
353
Network averaged minimal path length defines the averaged number of connected neurons that 354
separate any two neurons in the network. Minimal path length is relatively low in networks with 355
random structure of synaptic connectivity. It has been suggested that the low path length could 356
facilitate fast signal propagation in networks (Dorogovtsev and Mendes 2003); thus, it could 357

17
also affect the rate at which paroxysmal events are generated (Netoff et al. 2004). However, our 358
results suggest that in our model, path length is not causally related to the rate of burst 359
generation. Indeed, in a network with fixed connectivity (Figure 4C) path length was also fixed 360
(path length was 2 for the case 12=ik , and was 1.75 for the case 24=ik ), but that did not 361
in itself eliminate the increase in burst rate with increasing spatial density of intact neurons 362
(Figure 4D). Furthermore, the rate of paroxysmal bursts was nearly the same between two 363
networks with different path length. 364
365
Collectively, these results suggest that the topological parameters of a network of intact neurons 366
that "survived" deafferentation only weakly affected the form of post-traumatic activity; 367
nonetheless, the spatial density of trauma-surviving neurons per se had a dominant role. 368
369
Patterns of electrical activity are modulated by properties of synaptic transmission at PY-370
PY synapses 371
372
Since burst initiation and propagation in our networks critically relied on synaptic interactions, 373
we wanted to further elaborate the extent to which properties of synaptic transmission (in 374
particular at PY-PY synapses) could shape collective activity in post-traumatic networks. We 375
focused on the effects of NMDA conductance and short-term synaptic depression at PY-PY 376
synapses. 377
378
In principle, burst initiation could be affected by the NMDA conductance at PY-PY synapses. 379
Initiation of intense bursting requires effective summation of activity from several presynaptic 380
neurons. Given the relatively slow time scale of NMDA current decay, it could affect the 381
excitability of post-synaptic neuron, affect temporal summation of excitatory input from 382

18
collateral synapses, and thus affect the propensity for burst generation. We tested the role of 383
slow NMDA currents by removing NMDA conductance from PY-PY synapses. Removal of 384
NMDA conductance from PY-PY synapses had dramatic effects on the properties of collective 385
electrical activity in post-traumatic networks (Figure 5). For sufficiently high density of intact 386
neurons, bursts were generated at high rate (Figure 5A) and propagated through the network as 387
sharp waves during which each model neuron fired at most 1 action potential (Figure 5C, 388
middle panel, compare to the top panel for baseline model network). Homeostatic synaptic 389
scaling in these networks without NMDA conductance attained highest allowed values 390
(maximal up-regulation of 100 percent, Figure 5B), yet the network averaged firing rate of PY 391
neurons failed to reach the target value of 5 Hz. Notably, below a critical spatial density the 392
characteristics of electrical activity (burst rate, HSP scaling factor) were the same for baseline 393
model networks and for networks without NMDA conductance. Thus, we conclude that NMDA 394
conductance at PY-PY synapses can modulate the pattern of collective electrical activity (by 395
increasing the number of spikes fired by a PY model neuron per burst, thus increasing the mean 396
neuronal firing rate and decreasing the rate of paroxysmal discharges), but its effects again 397
depended on the spatial density of intact neurons. Without NMDA conductance, the target 398
values of the network firing rate could be only achieved as a result of extreme up-regulation of 399
the fast excitatory synapses that led to the very high level of synchrony of firing. 400
401
Synaptic transmission could also be affected by the presence of short-term synaptic depression, 402
which was incorporated at PY-PY synapses in our model network. The strength of synaptic 403
depression in our model was characterized by “resource usage” parameter U that quantified 404
how much “synaptic resource” was used by a synapse per each synaptic spike (lower values of 405
U mean milder depression). Reducing U to 50% of its baseline value led to a reduction in 406
burst rate (Figure 5A, green diamonds vs. black squares). At the same time, bursts became 407

19
wider, with each model neuron firing intensely during the bursting event (Figure 5C, bottom 408
panel). The amount of HSP at model synapses and the mean firing rate of PY neurons were also 409
affected (Figures 5B,D). When synaptic depression was completely removed from PY-PY 410
synapses, bursts were generated at a very low rate (0.035 Hz, data not shown), but each bursting 411
event lasted about 5 seconds, with neurons firing intensely during the entire burst, similar to 412
seizure-like activity. 413
414
Thus, properties of synaptic transmission at PY-PY synapses could modulate the emerging 415
pattern of collective activity in post-traumatized networks. With only weak depression of 416
synaptic coupling between pyramidal neurons, collective activity resembled seizures (periods of 417
intense activity each lasting several seconds) occurring at a low rate. Stronger depression led to 418
earlier burst termination and promoted generation of paroxysmal-like network bursts of short 419
duration at higher rate. In all cases, the rate at which these bursts were generated critically 420
depended on the spatial density of intact neurons. 421
422
Functional severity of cortical trauma affects initiation and propagation of paroxysmal 423
bursts 424
425
The spatial density of intact neurons affects the rate of IEDs through strong excitation of nearby 426
deafferented neurons, which occurred because of the larger number of intact neurons, firing at a 427
relatively high rate, projecting to a given deafferented neuron and promoted burst propagation 428
through the network in spite of low excitability of traumatized neurons. A single intact neuron is 429
not likely to excite its postsynaptic deafferented target to a point of spike generation. However, 430
when several intact neurons are close enough in space, there is a possibility that they are 431
synaptically coupled, as well as share one or more postsynaptic targets. Thus, there is an 432

20
increased chance for activity to be propagated through the intact subnetwork, and intact neurons 433
can provide stronger input to nearby deafferented neurons, increasing the chance for the latter to 434
fire action potentials. Upregulation of synaptic conductances by homeostatic synaptic plasticity 435
increases synaptic coupling and so would further increase the excitation of deafferented neurons 436
by their intact peers. We reasoned that neuronal excitability (partially controlled in our networks 437
by parameter Dr : the remaining rate of afferent stimulation of traumatized neurons after 438
deafferentation) could also affect the rate of post-traumatic paroxysmal bursts. As Figure 6A 439
shows, the burst rate peaked for a certain, density-invariant, value of Dr , with low rates of 440
activity both for strong (low Dr ) and mild (high Dr ) trauma scenarios. The amount of HSP 441
needed to reach these levels of activity was a monotonic increasing function of trauma severity 442
(Figure 6C). 443
444
One interesting observation from Figure 6A is that the rate of paroxysmal discharges depended 445
on the spatial density of intact neurons (characterized by Iρ ) only in the severe trauma regime 446
(small Dr ) and was largely independent of the spatial density for milder trauma (high Dr ). To 447
understand why this difference between severe and mild trauma regimes arose, we computed 448
the standard deviation of firing rate of all PY neurons in the network (Figure 6B). In mild 449
trauma regime, standard deviation of PY neurons firing rates was largely the same for all 450
density scenarios, and attained smaller values for higher Dr (milder trauma). This suggests that 451
in mild trauma regime, deafferented neurons become more like their intact peers. The milder the 452
trauma, the less is the drop in afferent stimulation, and deafferented neurons are more excitable 453
immediately after deafferentation. In addition, for milder trauma HSP is able to compensate for 454
a reduction in firing rate incurred by a relatively small decrease in afferent excitation. Thus, in 455
this scenario the excitability level of deafferented neurons is close to that of their intact peers. 456
Consequently the exact spatial configuration of intact neurons (a critical factor which 457

21
determines the ability of an intact subnetwork to engage the deafferented neurons paroxysmal 458
burst) becomes less important, thus blurring the role of spatial density. By the same token, the 459
differences between intact and deafferented neurons becomes more pronounced in severe 460
trauma regimes (low Dr ), thus underscoring the role that spatial configuration of intact 461
subnetwork has in burst generation (Figure 6A, severe trauma regime). 462
463
Another interesting feature seen in Figure 6A is that, for medium and low spatial density of 464
intact neurons (low Iρ ) the rate of paroxysmal discharges exhibited a peak when plotted vs. the 465
functional severity of trauma, Dr . We explain this finding using the following heuristic 466
argument: First, note that the HSP is strongest for most severe trauma and then monotonically 467
reduces for milder trauma (Figure 5D); Second, note that the excitability of an isolated model 468
neuron that is driven only by afferent external input increased for milder trauma (Figure 6C) vs. 469
more severe trauma. This offers the following explanation for the non-monotonic dependence of 470
the burst rate on the severity of trauma: Quite generally, the rate of IEDs depends on two factors 471
- neuronal excitability and the strength of collateral synaptic connections. Excitability of 472
traumatized neurons is low in severe trauma cases (low Dr ), making it unlikely that a network 473
can initiate and propagate global IEDs, despite the very strong synaptic conductance that is 474
scaled up by HSP to its maximum value at 100%. Those events require correlated activity of 475
remaining intact neurons and are therefore rarely generated in the network of randomly spiking 476
cells. On the other hand, in a mild trauma scenario (high Dr ), neurons are relatively excitable 477
and noisy, but collateral connections even after HSP up-regulation are not strong enough to 478
ensure reliable propagation of correlated burst. Thus, in this limit the network favors the 479
asynchronous mode over the IEDs. For traumatic events of a moderate severity, IEDs can be 480
generated at the highest rate that is limited by the balance of intrinsic (remaining rate of afferent 481
stimulation) and synaptic (HSP) excitability (Figure 6E). 482

22
483
484
Discussion 485
486
Alterations in network connectivity can significantly promote epileptogenesis through 487
establishment of long-range connections which lead to the formation of "small-world" networks 488
(Netoff et al. 2004; Dyhrfjeld-Johnsen et al. 2007). Here, we studied the emergence of IEDs in 489
the deafferentation model of post-traumatic epileptogenesis. Our results suggest that structural 490
change in connectivity might be a sufficient, but not a necessary condition for the generation of 491
IEDs. In our model, bursting depended on the change in the functional connectivity (the extent 492
to which one neuron can affect another) of intact subnetwork, as well as on the ability of the 493
traumatized network to convey the burst that was generated by the intact neurons. Thus, we 494
showed that the geometrical organization of a small number of trauma-surviving neurons can be 495
a decisive factor in determining the properties of post-traumatic IEDs. 496
497
The mechanism by which a small number of intact neurons affected burst generation in our 498
model was based on their geometrical organization. Because of the local synaptic footprint, 499
intact neurons had to be proximal enough in space in order to be able to form recurrent 500
connections between them and also to create a situation in which nearby deafferented neurons 501
would have sufficiently large number of synaptic contacts from their intact peers. Proximity of 502
intact neurons elevated their firing rates by means of their synaptic interaction, which 503
consequently elevated the excitation of deafferented neurons. Homeostatic synaptic plasticity 504
further upregulated synaptic coupling strength and thus also contributed to the increased firing 505
rate of intact neurons and to the increased excitation of nearby deafferented neurons. When 506
sufficiently excited by their intact peers, deafferented neurons generated action potentials that 507

23
further propagated through the network of deafferented neurons in form of paroxysmal burst. 508
Synaptic depression and time course of synaptic conductance (slow NMDA) affected the time-509
dependent strength of synaptic coupling and thus modulated the rate of paroxysmal burst 510
generation. 511
512
In the model presented in this study we assumed a population of intact neurons embedded in a 513
“sea” of traumatized neurons. Thus, we implicitly assumed that even in what might appear to be 514
a completely deafferented piece of cortical tissue, there might be some small number of neurons 515
that preserve their intact afferent input after deafferentation. In reality, trauma is more likely to 516
create a traumatized region surrounded by the intact network; however, in this situation it is 517
difficult to correctly define the spatial density of intact neurons. Experimental data (Topolnik et 518
al. 2003) and our preliminary modeling results suggest that paroxysmal bursts were generated 519
by intact neurons at the boundary between traumatized and intact regions. Nevertheless, we 520
chose in this study to focus on the effects of spatial density and investigate the scenario in 521
which a small set of intact neurons is embedded in a large traumatized network. 522
523
Netoff et al. (2004) showed, in a computational model of hippocampal network, that bursting 524
(but not seizing) is facilitated in networks with low clustering coefficient and short path length. 525
Analysis of in-vitro glutamate injury models of hippocampal neuronal networks led to the same 526
conclusion – an increase in burst rate was accompanied by a strong reduction in network 527
clustering coefficient (Srinivas et al. 2007). Our own results suggest that while clustering 528
coefficient of intact subnetwork positively correlates with the rate of interictal events, in itself it 529
is not a causal factor leading to the IED generation. Significant change of the clustering 530
coefficient in the model led to only slight change of the burst rate. However, those earlier 531
studies focused on epileptogenesis in networks of cells with homogeneous excitability 532

24
properties. By contrast, in our model the trauma created two populations of neurons 533
(deafferented and intact) with different excitability properties. Subsequent action of HSP only 534
increased this difference. Burst generation depended on the ability of the intact population to 535
“ignite” the deafferented population of neurons. This differs from the conclusions of earlier 536
studies (Netoff et al. 2004; Srinivas et al. 2007) in which bursting depended on the ability to 537
quickly propagate spikes in a network of neurons with same excitability. Indeed, neither one of 538
the topological parameters of our model (clustering coefficient and minimal path length 539
between model neurons) had a causal influence on the rate of paroxysmal discharges; however, 540
the rate of bursts was critically affected by the spatial density of intact neurons. Thus, in the 541
deafferentation model of post-traumatic epilepsy, structural changes in connectivity may be not 542
a primary factor in burst generation. 543
544
Earlier computational models stressed the importance of network interconnectedness (mean 545
number of synapses received by a neuron) in setting the rate of interictal bursting activity, 546
suggesting that more interconnected networks can generate bursts of collective activity at higher 547
rate (Figure 4C,F in (Netoff et al. 2004)). Our own results suggest that in the post-traumatic 548
epilepsy scenario, mean number of connections between intact neurons may not play a central 549
role – the rate of IEDs in model networks with fixed connectivity of intact subnetwork was 550
virtually indistinguishable from that of the baseline model (Figure 4C,D). At first, this may 551
appear to contradict the conclusions of an earlier study (Netoff et al. 2004). However, in 552
contrast to the IEDs induced by stronger recurrent connectivity (Netoff et al. 2004), the trauma 553
in our model of IEDs significantly reduced the network excitability by decreasing the afferent 554
excitation (captured by the parameter Dr in our model) thus making the post-traumatic network 555
harder to excite. We found that increasing mean number of connections between intact neurons 556
only increased the burst rate if it was accompanied by increasing mean number of projections 557

25
from intact neurons to deafferented cells. The last occurred when spatial density of intact 558
neurons was increased. 559
560
Homeostatic synaptic plasticity in post-traumatic cortical networks might be mediated by 561
diffusible tumor necrosis factor (TNF) alpha (Stellwagen and Malenka, 2006). This molecule is 562
believed to be released from astrocytes in response to neural trauma (Lau and Yu, 2001), and it 563
was shown that TNF alpha plays a critical role in synaptic scaling (Stellwagen and Malenka, 564
2006; Steinmetz and Turrrigiano, 2010). Initially after traumatic event, astrocytic response 565
might create “patches” of high TNF alpha concentration co-localized with those parts of the 566
network that are more severely affected by the trauma. In such early post-traumatic scenario of 567
spatially heterogeneous trauma, the model of HSP will need to be critically revised to reflect the 568
dependence of HSP on local levels of synaptic inactivity. In contrast, our present model 569
assumes that HSP is evaluated based on the global, network-wide, level of inactivity, an 570
assumption which reflects the situation when the levels of TNF alpha have equilibrated by 571
diffusion (Edelstein-Keshet and Spiros 2002). This is likely to occur during the late stage of 572
post-traumatic reorganization, after the network has reached its new steady-state. Thus, our 573
present model might implicitly reflect the situation in the post-traumatic steady state. Our 574
preliminary results (to be published elsewhere) indicate that during the early post-traumatic 575
phase, the spatially localized action of the HSP might render the cortical network with strong 576
sensitivity toward local perturbations of electrical activity, thus potentially resulting in a high 577
rate of paroxysmal bursts. However, experimentally no (or very little) epileptic-like activity has 578
been observed immediately following the trauma. This suggests that the network might employ 579
additional, neuro-protective, mechanisms that would reduce the rate of paroxysmal discharge in 580
spite of high sensitivity to perturbations. These mechanisms and their actions are being 581
investigated in ongoing work. 582

26
583
The HSP that followed the deafferentation in our model increased connectivity strength which 584
in turn increased the firing rate of intact neurons. However, this increased firing rate was not 585
always communicated to the rest of the network – only in special space configurations 586
(relatively high density of intact neurons) could intact neurons collectively nucleate sufficiently 587
strong activity that initiated spiking in deafferented neurons and took the form of IEDs 588
propagating through the cortical network. Thus, the excitability and the spatial distribution of a 589
small number of neurons that preserved their inputs after trauma, overshadows the role of 590
network topology and connectivity in the generation of post-traumatic IEDs. Several studies 591
have indicated that topological correlation in connectivity can enhance burst generation 592
(Bogaard et al. 2009; Dyhrfjeld-Johnsen et al. 2007); however, this can be heavily affected by 593
the dynamics of neuronal excitability. Thus, more detailed studies, aiming to investigate the 594
interplay of trauma pattern, synaptic connectivity and intrinsic neuronal excitability, are 595
required to understand the emergence of pathological rhythms in traumatized brain. 596
597
598

27
Acknowledgements 599
600
This research was supported by the NIH grant R01 NS059740 and the Howard Hughes Medical 601
Institute. 602
603

28
References 604
605
Avramescu S, Timofeev I. Synaptic strength modulation after cortical trauma: a role in 606
epileptogenesis. J Neurosci 28:6760-6772, 2008. 607
608
Bogaard A, Parent J, Zochowski M, Booth V. Interaction of cellular and network mechanisms 609
in spatiotemporal pattern formation in neuronal networks. J Neurosci 29:1677-1687, 2009. 610
611
Butz M, van Ooyen A, Worgotter F. A model for cortical rewiring following deafferentation 612
and focal stroke. Frontiers Comput Neurosci 3:10, 2009. 613
614
de Curtis M, Avanzini G. Interictal spikes in focal epileptogenesis. Prog Neurobiol 63:541-567, 615
2001. 616
617
Dorogovtsev SN, Mendes JFF. Evolution of networks: from biological nets to the Internet and 618
WWW. Oxford Univ Press USA, 2003. 619
620
Dyhrfjeld-Johnsen J, Santhakumar V, Morgan RJ, Huerta R, Tsimring L, Soltesz I. Topological 621
determinants of epileptogenesis in large-scale structural and functional models of the dentate 622
gyrus derived from experimental data. J Neurophysiol 97:1566-1587, 2007 623
624
Dzhala VI, Staley KJ. Transition from interictal to ictal activity in limbic networks in vitro. J 625
Neurosci 23:7873-7880, 2003. 626
627

29
Edelstein-Keshet L, Spiros A. Exploring the formation of Alzheimer’s disease senile plaques in 628
silico. J Theor Biol 216-301-326, 2002. 629
630
Frohlich F, Bazhenov M, Sejnowski TJ. Pathological effect of homeostatic synaptic scaling on 631
network dynamics in diseases of the cortex. J Neurosci 28:1709-1720, 2008. 632
633
Grafstein B, Sastry PB. Some preliminary electrophysiological studies on chronic neuronally 634
isolated cerebral cortex. Electroencephalogr Clin Neurophysiol Suppl 9:723-725, 1957. 635
636
Houweling AR, Bazhenov M, Timofeev I, Steriade M, Sejnowski TJ. Homeostatic synaptic 637
plasticity can explain post-traumatic epileptogenesis in chronically isolated neocortex. Cereb 638
Cortex 15:834-845, 2005. 639
640
Jin X, Prince DA, Huguenard JR. Enhanced excitatory synaptic connectivity in layer V 641
pyramidal neurons of chronically injured epileptogenic neocortex in rats. J Neurosci 26:4891-642
4900, 2006. 643
644
Keller CJ, Truccolo W, Gale JT, Eskandar E, Thesen T, Carlson C, Devinsky O, Kuzniecky R, 645
Doyle WK, Madsen JR, Schomer DL, Mehta AD, Brown EN, Hochberg LR, Ulbert I, Halgren 646
E, Cash SS. Heterogeneous neuronal firing patterns during interictal epileptiform discharges in 647
the human cortex. Brain 133:1668-1681, 2010. 648
649
Lau LT, Yu ACH (2001) Astrocytes produce and release interleukin-1, interleukin-6, tumor 650
necrosis factor alpha and interferon-gamma following traumatic and metabolic injury. J 651
Neurotrauma 18: 351-359, 2001. 652

30
653
Morgan RJ, Soltesz I. Nonrandom connectivity of the epileptic dentate gyrus predicts a major 654
role for neuronal hubs in seizures. Proc Natl Acad Sci USA 105:6179-6184, 2008 655
656
Netoff TI, Clewley R, Arno S, Keck T, White JA. Epilepsy in small-world networks. J Neurosci 657
24:8075-8083, 2004. 658
659
Pitkanen A, Schwartzkroin PA, Moshe SL. Models of seizure and epilepsy (editors). Elsevier 660
Science, 2006. 661
662
Prescott SA, Ratte S, De Koninck Y, Sejnowski TJ. Nonlinear interaction between shunting and 663
adaptation controls a switch between integration and coincidence detection in pyramidal 664
neurons. J Neurosci 26:9084-9097, 2006. 665
666
Prince DA, Tseng GF. Epileptogenesis in chronically injured cortex: in vitro studies. J 667
Neurophysiol 69:1276-1291, 1993. 668
669
Srinivas KV, Jain R, Saurav S, Sikdar SK. Small-world network topology of hippocampal 670
neuronal network is lost, in an in vitro glutamate injury model of epilepsy. Eu J Neurosci 671
25:3276-3286, 2007 672
673
Steinmetz CC, Turrigiano GG. Tumor necrosis factor-α signaling maintains the ability of 674
cortical synapses to express synaptic scaling. J Neurosci 30: 14685-14690, 2010. 675
676

31
Stellwagen D, Malenka RC. Synaptic scaling mediated by glial TNF-α. Nature 440: 1054-1059, 677
2006. 678
679
Timofeev I, Bazhenov M, Avramescu S, Nita DA. Posttraumatic epilepsy: the roles of synaptic 680
plasticity. Neuroscientist 16:19-27, 2010. 681
682
Topolnik L, Steriade M, Timofeev I. Partial cortical deafferentation promotes development of 683
paroxysmal activity. Cereb Cortex 13:883-93, 2003. 684
685
Turrigiano GG, Leslie KR, Desai NS, Rutherford LC, Nelson SB. Activity-dependent scaling of 686
quantal amplitude in neocortical neurons. Nature 391:892-896, 1998. 687
688
Wendling F, Hernandez A, Bellanger JJ, Chauvel P, Bartolomei F. Interictal to ictal transition in 689
human temporal lobe epilepsy: insights from a computational model of intracerebral EEG. J 690
Clin Neurophysiol 22:343-356, 2005. 691
692
32
693
Figure Legends 694
695
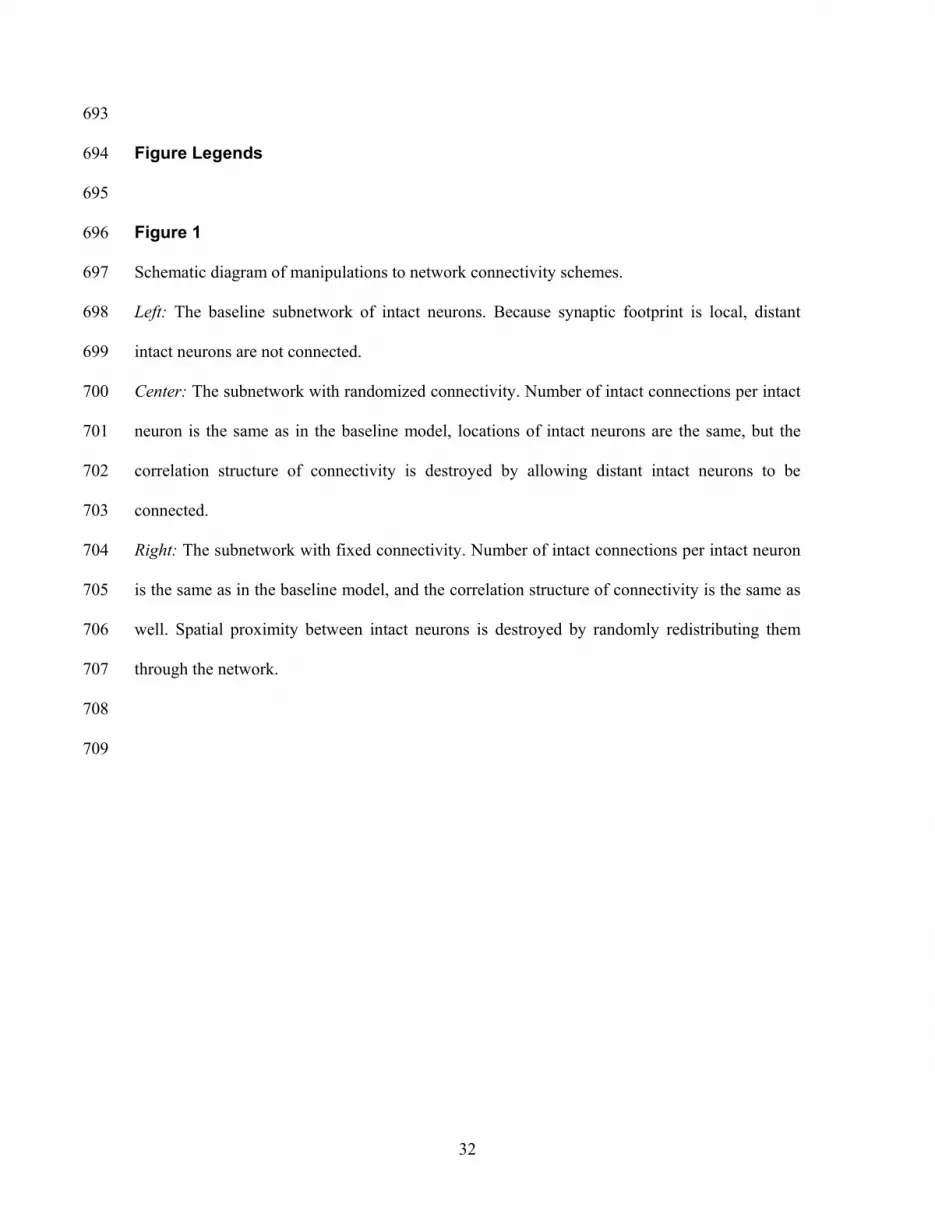
Figure 1 696
Schematic diagram of manipulations to network connectivity schemes. 697
Left: The baseline subnetwork of intact neurons. Because synaptic footprint is local, distant 698
intact neurons are not connected. 699
Center: The subnetwork with randomized connectivity. Number of intact connections per intact 700
neuron is the same as in the baseline model, locations of intact neurons are the same, but the 701
correlation structure of connectivity is destroyed by allowing distant intact neurons to be 702
connected. 703
Right: The subnetwork with fixed connectivity. Number of intact connections per intact neuron 704
is the same as in the baseline model, and the correlation structure of connectivity is the same as 705
well. Spatial proximity between intact neurons is destroyed by randomly redistributing them 706
through the network. 707
708
709

33
Figure 2 710
Trauma induced transformation of network electrical activity. 711
A "Healthy" cortical network exhibited asynchronous activity, with PY neurons firing at ~5 Hz 712
and IN neurons firing at ~10 Hz. 713
B,C,D Examples of post-traumatic steady state collective activity (left) for different spatial 714
patterns of trauma parameterized with different spatial densities Iρ of intact neurons (right). In 715
the left plots, Y axis indexes the 250 sampled neurons. In center panels, we show temporal 716
profiles of representative paroxysmal bursts for each scenario. In right plots, black dots denote 717
the intact neurons that survived the trauma. The white space within the boxes represents the 718
deafferented neurons that lost their afferent excitation following the trauma. Because we 719
considered cases of severe deafferentation (only up to 5 percent of network neurons survive the 720
trauma) the density (definition given in Methods) of intact neurons is close to 1 for all cases 721
considered. 722
E Following deafferentation, the network-averaged PY firing rate dropped dramatically, but 723
then slowly recovered due to the action of HSP. Temporal dynamics (fluctuations) of the firing 724
rate depended on the spatial pattern of deafferentation. Each dot represents network-averaged 725
firing rate of model pyramidal neurons in the window of 4 seconds. Different colors correspond 726
to the different spatial densities Iρ of intact neurons: green line - 02.0=Iρ , red line - 727
06.0=Iρ , black line - 1=Iρ . In all panels (B-E), the number of intact neurons was the same 728
( 100=IN ). 729
730
731

34
732
Figure 3 733
Post-traumatic interictal activity depends on spatial organization of trauma-surviving neurons. 734
A Burst rate vs. spatial density of intact neurons. Number of intact neurons: 100=IN 735
(squares); 400=IN (circles). 736
B Amount of HSP at model synapses. Symbols are the same as in (A). 737
C Distributions of local clustering coefficient in intact subnetwork. 738
D Averaged clustering coefficient of intact subnetwork plotted vs. the spatial density of intact 739
neurons. 740
E Burst rate plotted vs. the network averaged clustering coefficient. 741
F Mean number of collateral intact synapses, vs. density of intact neurons. Data points are mean 742
± S.E.M. (N=4). 743
744
745

35
746
Figure 4 747
Network topology weakly affects paroxysmal activity. 748
A Network-averaged clustering coefficient for baseline intact network (squares) and equivalent 749
randomized network (circles) vs. the density of intact neurons. 750
B Burst rate plotted vs. the density of intact neurons, for scenarios considered in (A). 751
C Mean number of intact synapses per intact neuron in baseline intact network (squares) and 752
intact network with fixed connectivity (green diamonds, 12=Ik ; red circles, 24=Ik ) vs. 753
the spatial density of intact neurons. 754
D Burst rate plotted vs. the spatial density of intact neurons, for scenarios considered in (C). For 755
all cases, 100=IN and 1.0=Dr . Data points are mean ± S.E.M. (N=4). 756
757
758
759

36
Figure 5 760
Properties of synaptic transmission modulate collective electrical activity in post-traumatic 761
network. 762
A Burst rate vs. the spatial density of intact neurons, for different scenarios of synaptic 763
transmission at PY-PY synapses: the baseline model with synaptic depression and NMDA 764
conductance at PY-PY synapses (black squares), the model with synaptic depression but 765
without NMDA conductance at PY-PY synapses (red circles), the model without synaptic 766
depression but with NMDA conductance at PY-PY synapses (green diamonds). 767
B Amount of HSP at model PY-PY synapses, for different scenarios shown in (A). Data keys 768
are the same ones as in (A). 769
C Representative sample raster plots of collective electrical activity for different scenarios 770
shown in (A): the baseline model (top panel), the model without NMDA conductance (middle 771
panel), the model without synaptic depression (bottom panel). For all plots, 1=Iρ (all the 772
neurons within selected area in the middle of the network are intact). 773
D Network averaged firing rate of PY model neurons for different scenarios shown in (A). Data 774
keys are the same ones as in (A).775

37
776
Figure 6 777
Reduction in the rate of afferent excitation determines the propensity for burst generation. 778
A Burst rate plotted vs. the rate drop parameter, Dr , for different densities of trauma-surviving 779
neurons: 1=Iρ (black squares); 06.0=Iρ (red circles); 02.0=Iρ (green diamonds). 780
B Standard deviation (across all PY neurons) of firing rates of PY model neurons, plotted vs. 781
the rate drop parameter, Dr . Symbols are the same as in (A). 782
C Firing rate of isolated neuron, plotted vs. Dr . Data points are averages over 100 neurons. 783
D Amount of HSP at model synapses. Symbols are the same as in (A). In (A, B, D) data points 784
are mean ± S.E.M. (N=4). 785
E Schematic presentation showing how the peak burst rate arises due to the competing action of 786
intra-cellular excitability (black line, strong for mild trauma) and homeostatic synaptic plasticity 787
(gray line, strong for strong trauma). Hypothetical burst rate is dashed red line (not to scale). 788


Related Documents