Neurobiology of Aging 31 (2010) 1132–1144 Topography of EEG multivariate phase synchronization in early Alzheimer’s disease Maria G. Knyazeva a,b,∗,1 , Mahdi Jalili c,∗∗,1 , Andrea Brioschi a , Isabelle Bourquin a , Eleonora Fornari b , Martin Hasler c , Reto Meuli b , Philippe Maeder b , Joseph Ghika a a Department of Neurology, Centre Hospitalier Universitaire Vaudois and University of Lausanne, Switzerland b Department of Radiology, Centre Hospitalier Universitaire Vaudois and University of Lausanne, Switzerland c École Polytechnique Fédérale de Lausanne (EPFL), School of Computer and Communication Sciences, Laboratory of Nonlinear Systems, Switzerland Received 10 April 2008; received in revised form 17 July 2008; accepted 24 July 2008 Available online 5 September 2008 Abstract Alzheimer’s disease (AD) is likely to disrupt the synchronization of the bioelectrical processes in the distributed cortical networks underlying cognition. We analyze the surface topography of the multivariate phase synchronization (MPS) of multichannel EEG in 17 patients (Clinical Dementia Rating (CDR) Scale: 0.5–1; Functional Assessment Staging (FAST): 3–4) compared to 17 controls by applying a combination of global and regional MPS measures to the resting EEG. In early AD, whole-head mapping reveals a specific landscape of synchronization characterized by a decrease in MPS over the fronto-temporal region and an increase over the temporo-parieto-occipital region predominantly of the left hemisphere. These features manifest themselves through the EEG delta–beta bands and discriminate patients from controls with an accuracy of up to 94%. Moreover, the abnormal MPS in both anterior and posterior clusters correlates with the Mini Mental State Examination score, binding regional EEG synchronization to cognitive decline in AD patients. The MPS technique reveals that the EEG phenotype of early AD is relevant to the clinical picture and may ultimately become its sensitive and specific biomarker. © 2008 Elsevier Inc. All rights reserved. Keywords: Alzheimer’s disease; Connectivity; Dysconnection; EEG; Multivariate phase synchronization 1. Introduction Alzheimer’s disease (AD) is a neurodegenerative disorder characterized by progressive cognitive deterioration starting with memory loss and leading to the impairment of daily life activities, to neuropsychiatric symptoms, to mental and behavioral disturbances, and finally to motor deficits. The ∗ Corresponding author at: Department of Neurology, Centre Hospitalier Universitaire Vaudois and University of Lausanne, 1011 Lausanne, Switzer- land. Tel.: +41 21 314 32 31. ∗∗ Corresponding author at: École Polytechnique Fédérale de Lausanne (EPFL), School of Computer and Communication Sciences, Laboratory of Nonlinear Systems, Station 14, IC-LANOS, 1015 Lausanne, Switzerland. Tel.: +41 21 693 46 83; fax: +41 21 693 67 00. E-mail addresses: [email protected] (M.G. Knyazeva), Mahdi.Jalili@epfl.ch (M. Jalili). 1 These two authors contributed equally to this work. key features of AD include the accumulation of beta-amyloid and tau-protein fragments predominantly in the associative cortical areas, the dysfunction and loss of synapses, and, as recently emphasized, myelination breakdown. These abnor- malities are likely to disrupt cortical circuitry and, therefore, cooperation between and within the distributed neural popu- lations underlying human cognition. EEG/MEG synchronization studies of cooperation in the brain networks have been mostly implemented with spectral analysis using power and coherence functions. With these techniques, a decrease in local and distant synchronization has been repeatedly shown in AD. In particular, the recog- nized EEG sign of AD is a reduction in the power of alpha and higher frequencies (the so called “EEG slowing”) sup- posedly due to the failure in local synchronization (Fernández et al., 2006; Jelic et al., 1996; Lindau et al., 2003). Similarly, EEG coherence (or phase) analysis revealed a decrease in 0197-4580/$ – see front matter © 2008 Elsevier Inc. All rights reserved. doi:10.1016/j.neurobiolaging.2008.07.019

Welcome message from author
This document is posted to help you gain knowledge. Please leave a comment to let me know what you think about it! Share it to your friends and learn new things together.
Transcript

A
cDgcoasA©
K
1
cwlb
Ul
(NT
M
0d
Neurobiology of Aging 31 (2010) 1132–1144
Topography of EEG multivariate phase synchronization in earlyAlzheimer’s disease
Maria G. Knyazeva a,b,∗,1, Mahdi Jalili c,∗∗,1, Andrea Brioschi a, Isabelle Bourquin a,Eleonora Fornari b, Martin Hasler c, Reto Meuli b, Philippe Maeder b, Joseph Ghika a
a Department of Neurology, Centre Hospitalier Universitaire Vaudois and University of Lausanne, Switzerlandb Department of Radiology, Centre Hospitalier Universitaire Vaudois and University of Lausanne, Switzerland
c École Polytechnique Fédérale de Lausanne (EPFL), School of Computer and Communication Sciences,Laboratory of Nonlinear Systems, Switzerland
Received 10 April 2008; received in revised form 17 July 2008; accepted 24 July 2008Available online 5 September 2008
bstract
Alzheimer’s disease (AD) is likely to disrupt the synchronization of the bioelectrical processes in the distributed cortical networks underlyingognition. We analyze the surface topography of the multivariate phase synchronization (MPS) of multichannel EEG in 17 patients (Clinicalementia Rating (CDR) Scale: 0.5–1; Functional Assessment Staging (FAST): 3–4) compared to 17 controls by applying a combination oflobal and regional MPS measures to the resting EEG. In early AD, whole-head mapping reveals a specific landscape of synchronizationharacterized by a decrease in MPS over the fronto-temporal region and an increase over the temporo-parieto-occipital region predominantlyf the left hemisphere. These features manifest themselves through the EEG delta–beta bands and discriminate patients from controls with an
ccuracy of up to 94%. Moreover, the abnormal MPS in both anterior and posterior clusters correlates with the Mini Mental State Examinationcore, binding regional EEG synchronization to cognitive decline in AD patients. The MPS technique reveals that the EEG phenotype of earlyD is relevant to the clinical picture and may ultimately become its sensitive and specific biomarker.2008 Elsevier Inc. All rights reserved.variate
kacr
eywords: Alzheimer’s disease; Connectivity; Dysconnection; EEG; Multi
. Introduction
Alzheimer’s disease (AD) is a neurodegenerative disorderharacterized by progressive cognitive deterioration starting
ith memory loss and leading to the impairment of dailyife activities, to neuropsychiatric symptoms, to mental andehavioral disturbances, and finally to motor deficits. The
∗ Corresponding author at: Department of Neurology, Centre Hospitalierniversitaire Vaudois and University of Lausanne, 1011 Lausanne, Switzer-
and. Tel.: +41 21 314 32 31.∗∗ Corresponding author at: École Polytechnique Fédérale de LausanneEPFL), School of Computer and Communication Sciences, Laboratory ofonlinear Systems, Station 14, IC-LANOS, 1015 Lausanne, Switzerland.el.: +41 21 693 46 83; fax: +41 21 693 67 00.
E-mail addresses: [email protected] (M.G. Knyazeva),[email protected] (M. Jalili).1 These two authors contributed equally to this work.
mcl
bathnapeE
197-4580/$ – see front matter © 2008 Elsevier Inc. All rights reserved.oi:10.1016/j.neurobiolaging.2008.07.019
phase synchronization
ey features of AD include the accumulation of beta-amyloidnd tau-protein fragments predominantly in the associativeortical areas, the dysfunction and loss of synapses, and, asecently emphasized, myelination breakdown. These abnor-alities are likely to disrupt cortical circuitry and, therefore,
ooperation between and within the distributed neural popu-ations underlying human cognition.
EEG/MEG synchronization studies of cooperation in therain networks have been mostly implemented with spectralnalysis using power and coherence functions. With theseechniques, a decrease in local and distant synchronizationas been repeatedly shown in AD. In particular, the recog-ized EEG sign of AD is a reduction in the power of alpha
nd higher frequencies (the so called “EEG slowing”) sup-osedly due to the failure in local synchronization (Fernándezt al., 2006; Jelic et al., 1996; Lindau et al., 2003). Similarly,EG coherence (or phase) analysis revealed a decrease in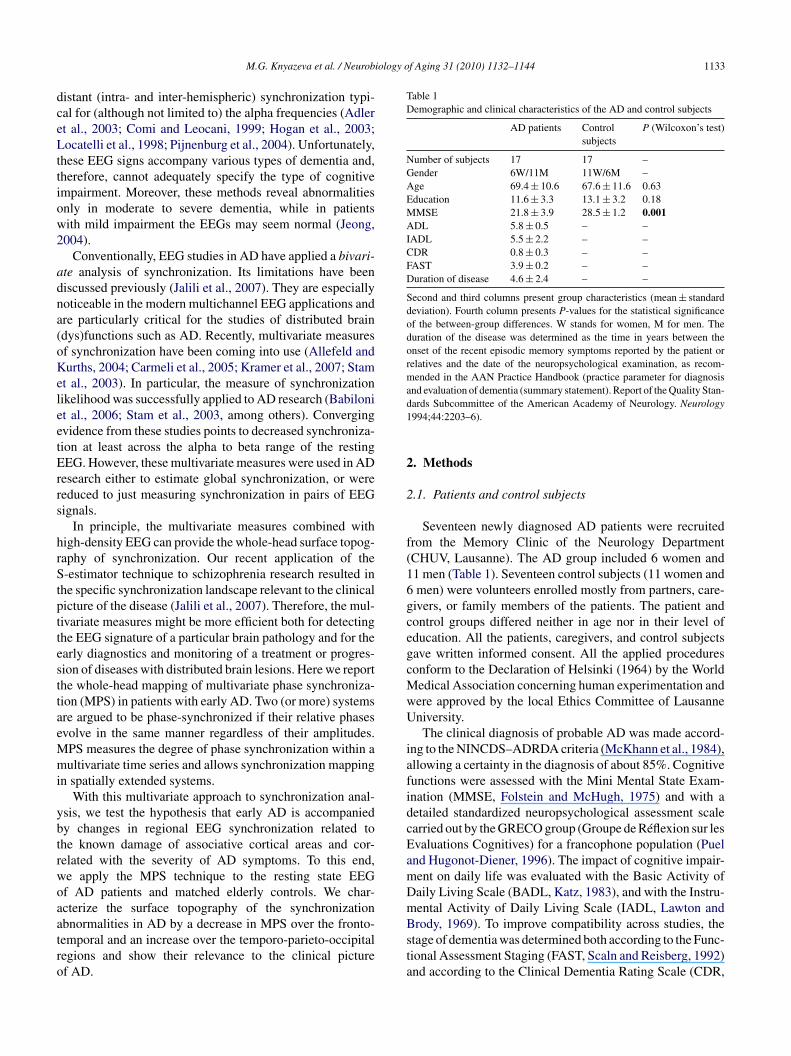
iology of Aging 31 (2010) 1132–1144 1133
dceLttiow2
adna(oKeleetErrs
hrStpttesttaeMmi
ybtrwoaatro
Table 1Demographic and clinical characteristics of the AD and control subjects
AD patients Controlsubjects
P (Wilcoxon’s test)
Number of subjects 17 17 –Gender 6W/11M 11W/6M –Age 69.4 ± 10.6 67.6 ± 11.6 0.63Education 11.6 ± 3.3 13.1 ± 3.2 0.18MMSE 21.8 ± 3.9 28.5 ± 1.2 0.001ADL 5.8 ± 0.5 – –IADL 5.5 ± 2.2 – –CDR 0.8 ± 0.3 – –FAST 3.9 ± 0.2 – –Duration of disease 4.6 ± 2.4 – –
Second and third columns present group characteristics (mean ± standarddeviation). Fourth column presents P-values for the statistical significanceof the between-group differences. W stands for women, M for men. Theduration of the disease was determined as the time in years between theonset of the recent episodic memory symptoms reported by the patient orrelatives and the date of the neuropsychological examination, as recom-mended in the AAN Practice Handbook (practice parameter for diagnosisand evaluation of dementia (summary statement). Report of the Quality Stan-d1
2
2
f(16gcegcMwU
iafidcEamDm
M.G. Knyazeva et al. / Neurob
istant (intra- and inter-hemispheric) synchronization typi-al for (although not limited to) the alpha frequencies (Adlert al., 2003; Comi and Leocani, 1999; Hogan et al., 2003;ocatelli et al., 1998; Pijnenburg et al., 2004). Unfortunately,
hese EEG signs accompany various types of dementia and,herefore, cannot adequately specify the type of cognitivempairment. Moreover, these methods reveal abnormalitiesnly in moderate to severe dementia, while in patientsith mild impairment the EEGs may seem normal (Jeong,004).
Conventionally, EEG studies in AD have applied a bivari-te analysis of synchronization. Its limitations have beeniscussed previously (Jalili et al., 2007). They are especiallyoticeable in the modern multichannel EEG applications andre particularly critical for the studies of distributed braindys)functions such as AD. Recently, multivariate measuresf synchronization have been coming into use (Allefeld andurths, 2004; Carmeli et al., 2005; Kramer et al., 2007; Stam
t al., 2003). In particular, the measure of synchronizationikelihood was successfully applied to AD research (Babilonit al., 2006; Stam et al., 2003, among others). Convergingvidence from these studies points to decreased synchroniza-ion at least across the alpha to beta range of the restingEG. However, these multivariate measures were used in AD
esearch either to estimate global synchronization, or wereeduced to just measuring synchronization in pairs of EEGignals.
In principle, the multivariate measures combined withigh-density EEG can provide the whole-head surface topog-aphy of synchronization. Our recent application of the-estimator technique to schizophrenia research resulted in
he specific synchronization landscape relevant to the clinicalicture of the disease (Jalili et al., 2007). Therefore, the mul-ivariate measures might be more efficient both for detectinghe EEG signature of a particular brain pathology and for thearly diagnostics and monitoring of a treatment or progres-ion of diseases with distributed brain lesions. Here we reporthe whole-head mapping of multivariate phase synchroniza-ion (MPS) in patients with early AD. Two (or more) systemsre argued to be phase-synchronized if their relative phasesvolve in the same manner regardless of their amplitudes.PS measures the degree of phase synchronization within aultivariate time series and allows synchronization mapping
n spatially extended systems.With this multivariate approach to synchronization anal-
sis, we test the hypothesis that early AD is accompaniedy changes in regional EEG synchronization related tohe known damage of associative cortical areas and cor-elated with the severity of AD symptoms. To this end,e apply the MPS technique to the resting state EEGf AD patients and matched elderly controls. We char-cterize the surface topography of the synchronization
bnormalities in AD by a decrease in MPS over the fronto-emporal and an increase over the temporo-parieto-occipitalegions and show their relevance to the clinical picturef AD.Bsta
ards Subcommittee of the American Academy of Neurology. Neurology994;44:2203–6).
. Methods
.1. Patients and control subjects
Seventeen newly diagnosed AD patients were recruitedrom the Memory Clinic of the Neurology DepartmentCHUV, Lausanne). The AD group included 6 women and1 men (Table 1). Seventeen control subjects (11 women andmen) were volunteers enrolled mostly from partners, care-ivers, or family members of the patients. The patient andontrol groups differed neither in age nor in their level ofducation. All the patients, caregivers, and control subjectsave written informed consent. All the applied proceduresonform to the Declaration of Helsinki (1964) by the Worldedical Association concerning human experimentation andere approved by the local Ethics Committee of Lausanneniversity.The clinical diagnosis of probable AD was made accord-
ng to the NINCDS–ADRDA criteria (McKhann et al., 1984),llowing a certainty in the diagnosis of about 85%. Cognitiveunctions were assessed with the Mini Mental State Exam-nation (MMSE, Folstein and McHugh, 1975) and with aetailed standardized neuropsychological assessment scalearried out by the GRECO group (Groupe de Réflexion sur lesvaluations Cognitives) for a francophone population (Puelnd Hugonot-Diener, 1996). The impact of cognitive impair-ent on daily life was evaluated with the Basic Activity ofaily Living Scale (BADL, Katz, 1983), and with the Instru-ental Activity of Daily Living Scale (IADL, Lawton and
rody, 1969). To improve compatibility across studies, thetage of dementia was determined both according to the Func-ional Assessment Staging (FAST, Scaln and Reisberg, 1992)nd according to the Clinical Dementia Rating Scale (CDR,

1 iology o
Mm
icpnp(seas0
ccbvhwa
2
tww(wrEm1wttcpfst2
meffcatior
2c
tbabcorur
ttp(btba
fi.
iocT(
ϕ
fs
Y
wbsYti
M
wpr
134 M.G. Knyazeva et al. / Neurob
orris, 1993). For this analysis we selected patients withild dementia (FAST: 3–4 and CDR: 0.5–1).Complete laboratory analyses and diagnostic neuroimag-
ng (CT or MRI) were performed in order to rule outognitive dysfunctions related to causes other than AD. Inarticular, the exclusion criteria were severe physical ill-ess, psychiatric or neurological disorders associated withotential cognitive dysfunction, other dementia conditionsfronto-temporal dementia, dementia associated with Parkin-onism, Lewy body disease, pure vascular or prion dementia,tc.), alcohol/drug abuse, regular use of neuroleptics,ntidepressants with anticholinergic action, benzodiazepines,timulants, or �-blockers, and stages of AD beyond CDR.5–1.
To confirm the absence of cognitive deficits and of psy-hoactive drugs use, or diseases that may interfere withognitive functions, potential control subjects underwent arief clinical interview and performed the MMSE. Only indi-iduals with no cognitive complaints and a score ≥28 for aigh level of education and ≥26 for a low level of educationere accepted as controls. Fifteen control subjects underwentbrain MRI.
.2. EEG recording and pre-processing
The EEG data were collected while subjects were sit-ing relaxed with eyes closed (reported here) and thenith eyes open (to be reported elsewhere). The EEGsere recorded with the 128-channel Geodesic Sensor Net
EGI, USA) for 3–4 min. All the electrode impedancesere kept under 30 k�—that is, much lower than the
ecommended limit (50 k�) for the high-input-impedanceGI amplifiers (Ferree et al., 2001). The recordings wereade with vertex reference using a low-pass filter set to
00 Hz. The signals were digitized at a rate of 500 samples/sith a 12-bit analog-to-digital converter. They were fil-
ered (FIR, band-pass of 1–50 Hz) and re-referenced againsthe common-average-reference. In multichannel EEG appli-ations, this montage closely approximates reference-freeotentials. The common-average-reference EEG signalsrom a high-density array of sensors provide the spatialcale appropriate for measuring the regional-to-global poten-ials dominating the resting state EEG (Srinivasan et al.,006).
To obtain a higher confidence in the synchronization esti-ates, the signals were segmented into non-overlapping 1-s
pochs (Nunez and Srinivasan, 2006). Using short segmentsor analysis allowed us to reach 205 ± 58 artifact-free epochsor the patients and 193 ± 72 for the controls. Artifacts in allhannels were edited off-line: first, automatically, based on
n absolute voltage threshold (100 �V) and on a transitionhreshold (50 �V), and then on the basis of a thorough visualnspection. The sensors that recorded artifactual EEG (>20%f the recording time) were corrected using the bad channeleplacement tool (NS 4.2 EGI, USA).s
tsfi
f Aging 31 (2010) 1132–1144
.3. Multivariate phase synchronization as a measure ofooperativeness
Here we use a strategy of multivariate phase synchroniza-ion mapping, which extends assessing synchronization fromivariate to multivariate time series. The bivariate methodsre suitable for the analysis of several pairs of signals, but theyecome less efficient as the number of pairs is increased. Inontrast, the MPS method successfully exploits the potentialf modern multichannel EEG techniques by creating easilyeadable synchronization maps and, eventually, providing annbiased overview of the changes in functional connectivityelated to AD and other distributed brain pathologies.
We computed MPS based on the instantaneous phase ofhe EEG time series determined by means of the Hilbertransform (Quiroga et al., 2002). First, we filtered the pre-rocessed epoched EEG data (see Section 2.2) in the delta1–3 Hz), theta (3–7 Hz), alpha1 (7–9.5 Hz), alpha2 (9.5–13),eta1 (13–20 Hz), and beta2 (20–30 Hz) frequency bands. Tohis end, digital filtering with no phase-shift was done off-liney applying an Elliptic filter with 0.5 dB of peak-peak ripplend a minimum stopband attenuation of 20 dB.
Second, we obtained a phase value from each univariateltered EEG time series at sensor position i, i.e., Yi(t), t = 1,. ., L, where t indicates a sample in a single epoch and Ls the number of available samples. In our case, an epochf 1-s is sampled at 500 Hz, making L equal to 500. Let usonsider the Hilbert transform of Yi(t) as Yi(t) (Hahn, 1996).he instantaneous phase of the time series Yi is obtained as
Boccaletti et al., 2002)
i(t) = arctan
(Yi(t)
Yi(t)
). (1)
Third, we estimated the degree of phase synchronizationor multivariate phases. Let us consider a multivariate timeeries Y
(t) = {Yi(t)}, i = 1, . . . , I, (2)
here I is the number of univariate time series, i.e., the num-er of sensors for which the MPS is calculated. At eachample t, Y(t) is an I dimensional vector. In other words,
is an I × L matrix. For each Y(t), the corresponding mul-ivariate phases are obtained as {ϕ(t)}, i = 1, . . ., I. The MPSs defined as (Boccaletti et al., 2002)
PS = 1
LI
L∑t=1
∣∣∣∣∣I∑
i=1
ejϕi(t)
∣∣∣∣∣ , (3)
here j is the imaginary unit. Therefore, the MPS is the meanhase synchrony averaged over the observation samples. Itanges from 1/
√I for completely non-phase-synchronized
ystems to 1 for completely phase-synchronized systems.
Finally, to obtain a time-reliable measures, we averagedhe MPS values over all available artifact-free epochs. In thistudy the MPS was computed for each sensor including itsrst- and second-nearest neighbors. These MPS values were

iology o
poqlsstt((i
pSatuHsM
2
epitlspa3dTp(
2
spMCcfim
2
Eos
sawwvEafil1t
3
3
aStatpiogdimtdtwoih
3
cbptstEctf
M.G. Knyazeva et al. / Neurob
resented as individual whole-head MPS maps integratedver the delta, theta, alpha1, alpha2, beta1, and beta2 fre-uency bands. In order to remove the effects of the generalevel of synchronization, each MPS map was relativized byubtracting its average value from the MPS-value of each sen-or. Finally, the subjects’ MPS maps were collected into thewo groups of AD patients and controls to be considered inhe next step of analysis. The global phase synchronizationGPS), involving all sensors, was also computed using Eq.3). The GPS values were averaged over epochs and poolednto two groups (patients and controls) for statistical analysis.
The statistical analysis of the MPS and GPS values waserformed with Student’s permutation t-test (Higgins, 2004).ince the first- and second-nearest neighbors of each sensorre involved in computing the MPS-value for that sensor,he P-values of the sensor-wise comparisons were correctedsing the BH false discovery rate method (Benjamini andochberg, 1995). The BH-corrected P-values were taken as
ignificant at P < 0.05. The computations were performed inatLab.
.4. Linear discriminant analysis of MPS
In order to test to what extent the distinctive features thatmerged from the MPS analysis distinguish individual ADatients from control subjects, we applied a linear discrim-nant analysis (Bishop, 2006). In particular, the distinctiveraits of the MPS landscapes were used for tuning a Fisher’sinear discriminator. Given the small number of availableubjects, the statistical validation of the discriminator waserformed by means of the leave-one-out cross-validationlgorithm. That is, the discriminator was tuned and evaluated4 times. Each subject, one by one, was iteratively left outuring the tuning and used for evaluating the discriminator.he accuracy of the discriminator was computed as the pro-ortion of the total number of classifications that were correctBishop, 2006).
.5. Correlation analysis of MPS
To assess whether the differences in synchronization land-capes of AD patients are linked to the clinical ratings,atients’ GPS- and MPS-values were correlated with theMSE scores of the patients by means of the Spearman Rankorrelation, resulting in the correlation coefficient (r) and theorresponding level of statistical significance (P). To accountor multiple (sensor-wise) comparisons, the statistical signif-cance was corrected according to the BH false discovery rate
ethod (Benjamini and Hochberg, 1995).
.6. EEG power analysis
To be able to describe our AD group in conventionalEG terms, we applied two measures of EEG power, onef them being sensor-specific and the other one an across-ensor average. First, for each sensor and epoch the power
fgst
f Aging 31 (2010) 1132–1144 1135
pectral density (PSD) was computed by means of Welch’sveraged modified periodogram (Welch, 1967). These PSDsere averaged sensor-wise across all available epochs. Thehole-head topography of the changes in PSD was addressedia the maps of EEG power integrated over the conventionalEG bands (see Section 2.3). Furthermore, the PSDs wereveraged over all sensors, resulting in a single value for eachrequency band of each subject. To test AD-related changesn EEG power, the average PSDs and PSD-maps were col-ected into groups of AD patients and controls consisting of7 members each and compared with Student’s permutation-test (Higgins, 2004), with BH correction when necessary.
. Results
.1. EEG power topography in AD patients
Considering that our group of patients is less severelyffected than the majority of those studied previously (seeection 4), we begin by presenting the results of the spec-
ral analysis, which confirm that our patients carry the EEGbnormalities typical for AD. As can be seen in Fig. 1A,he hallmark of EEG changes in AD – a shift of theower spectrum to the lower frequencies – is significantn this group. Indeed, the across-sensor average spectraf absolute power (left), supplemented by the probabilityraph of between-group differences (right), clearly show aecrease at frequencies over 10 Hz in contrast to an increasen the delta–theta diapason. The between-group differenceaps of absolute power provide the surface topography of
hese abnormalities for conventional EEG bands within theelta–beta range (Fig. 1B). In particular, they illustrate thathe low frequency activity increases over the frontal areas,hereas decreases in alpha2 and beta1 activity are spreadver the whole head. A reduction of the fast beta rhythmss significant post-centrally and predominant over the rightemisphere.
.2. Synchronization topography in AD patients
The GPS, which includes regional and long-distance syn-hronization across all sensors, showed neither significantetween-group difference (P > 0.17), nor correlation with theatients’ MMSE scores (P > 0.39) in any EEG band. Impor-antly, our data showed a high variation of GPS amongubjects. The standard deviations among patients and con-rols ranged from 51% to 58% of the respective means acrossEG bands. To separate these global effects from regionalhanges, we further analyzed individual maps relativized toheir mean MPS level. Fig. 2 shows the between-group dif-erences of such relative MPS maps for conventional EEG
requency bands. Note that the value of a significant between-roup variation in MPS, assigned to a single sensor as a colorpot, represents phase synchronization of a region limited tohe second-order neighbors of this sensor.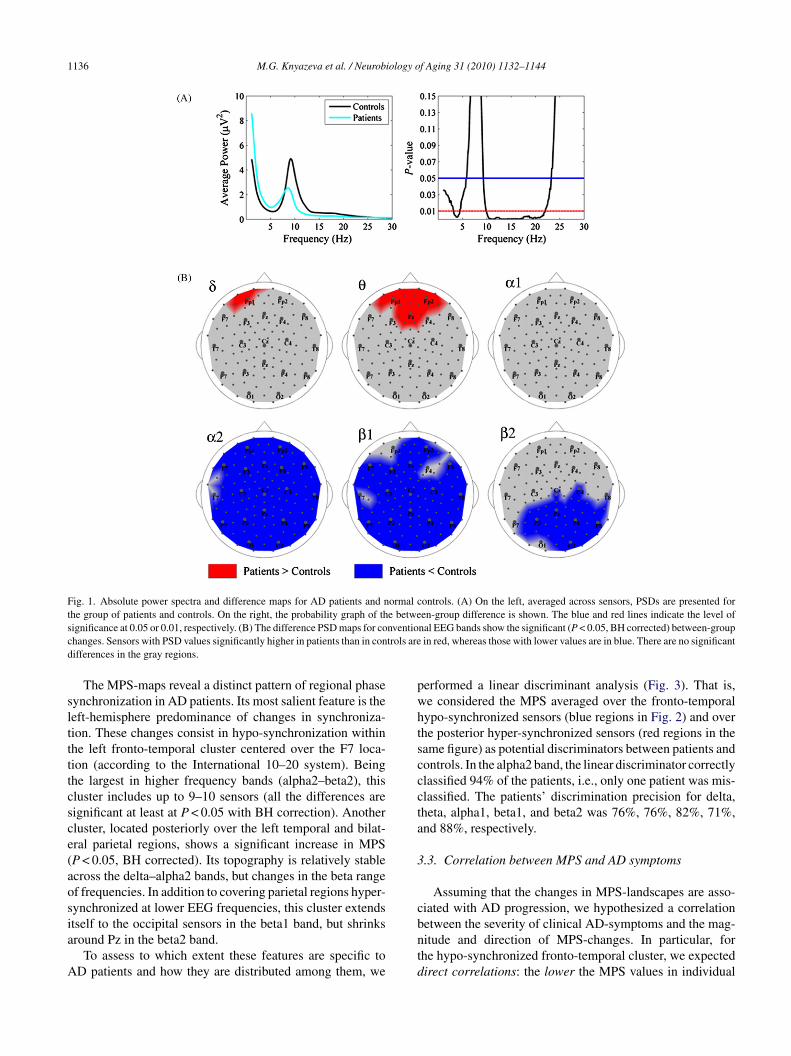
1136 M.G. Knyazeva et al. / Neurobiology of Aging 31 (2010) 1132–1144
Fig. 1. Absolute power spectra and difference maps for AD patients and normal controls. (A) On the left, averaged across sensors, PSDs are presented forthe group of patients and controls. On the right, the probability graph of the between-group difference is shown. The blue and red lines indicate the level ofs nventioc trols ared
slttttcsce(aosia
A
pwhtscccta
3
c
ignificance at 0.05 or 0.01, respectively. (B) The difference PSD maps for cohanges. Sensors with PSD values significantly higher in patients than in conifferences in the gray regions.
The MPS-maps reveal a distinct pattern of regional phaseynchronization in AD patients. Its most salient feature is theeft-hemisphere predominance of changes in synchroniza-ion. These changes consist in hypo-synchronization withinhe left fronto-temporal cluster centered over the F7 loca-ion (according to the International 10–20 system). Beinghe largest in higher frequency bands (alpha2–beta2), thisluster includes up to 9–10 sensors (all the differences areignificant at least at P < 0.05 with BH correction). Anotherluster, located posteriorly over the left temporal and bilat-ral parietal regions, shows a significant increase in MPSP < 0.05, BH corrected). Its topography is relatively stablecross the delta–alpha2 bands, but changes in the beta rangef frequencies. In addition to covering parietal regions hyper-ynchronized at lower EEG frequencies, this cluster extends
tself to the occipital sensors in the beta1 band, but shrinksround Pz in the beta2 band.To assess to which extent these features are specific toD patients and how they are distributed among them, we
bntd
nal EEG bands show the significant (P < 0.05, BH corrected) between-groupin red, whereas those with lower values are in blue. There are no significant
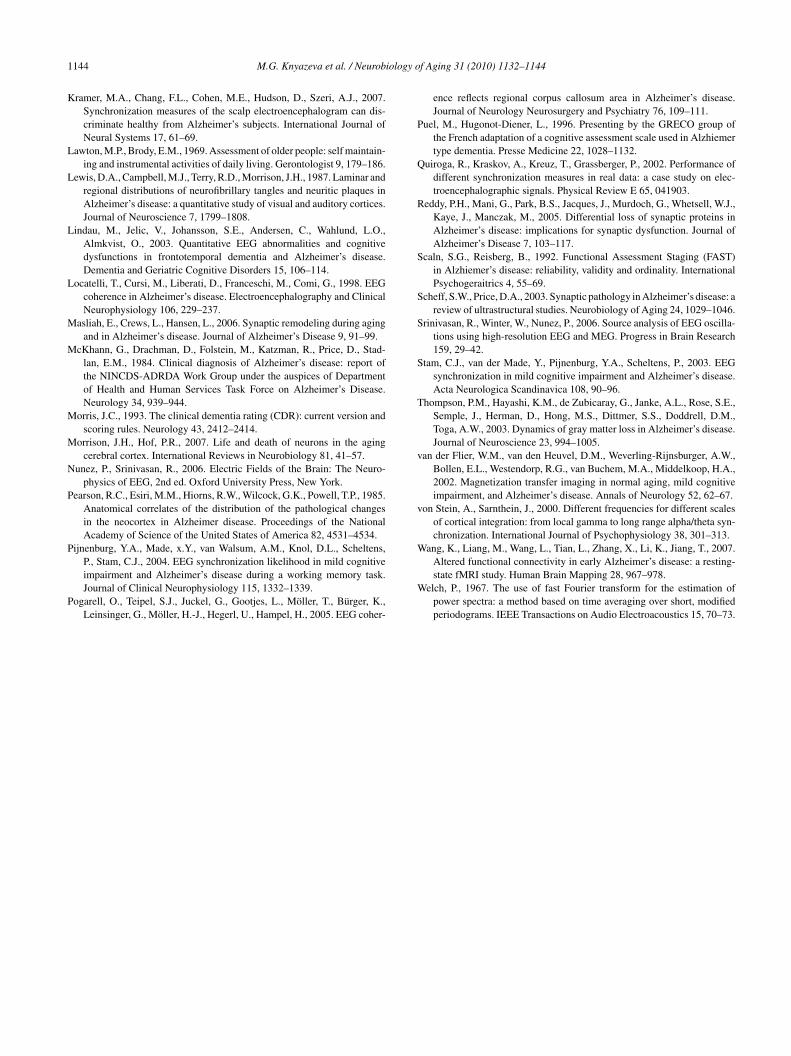
erformed a linear discriminant analysis (Fig. 3). That is,e considered the MPS averaged over the fronto-temporalypo-synchronized sensors (blue regions in Fig. 2) and overhe posterior hyper-synchronized sensors (red regions in theame figure) as potential discriminators between patients andontrols. In the alpha2 band, the linear discriminator correctlylassified 94% of the patients, i.e., only one patient was mis-lassified. The patients’ discrimination precision for delta,heta, alpha1, beta1, and beta2 was 76%, 76%, 82%, 71%,nd 88%, respectively.
.3. Correlation between MPS and AD symptoms
Assuming that the changes in MPS-landscapes are asso-iated with AD progression, we hypothesized a correlation
etween the severity of clinical AD-symptoms and the mag-itude and direction of MPS-changes. In particular, forhe hypo-synchronized fronto-temporal cluster, we expectedirect correlations: the lower the MPS values in individual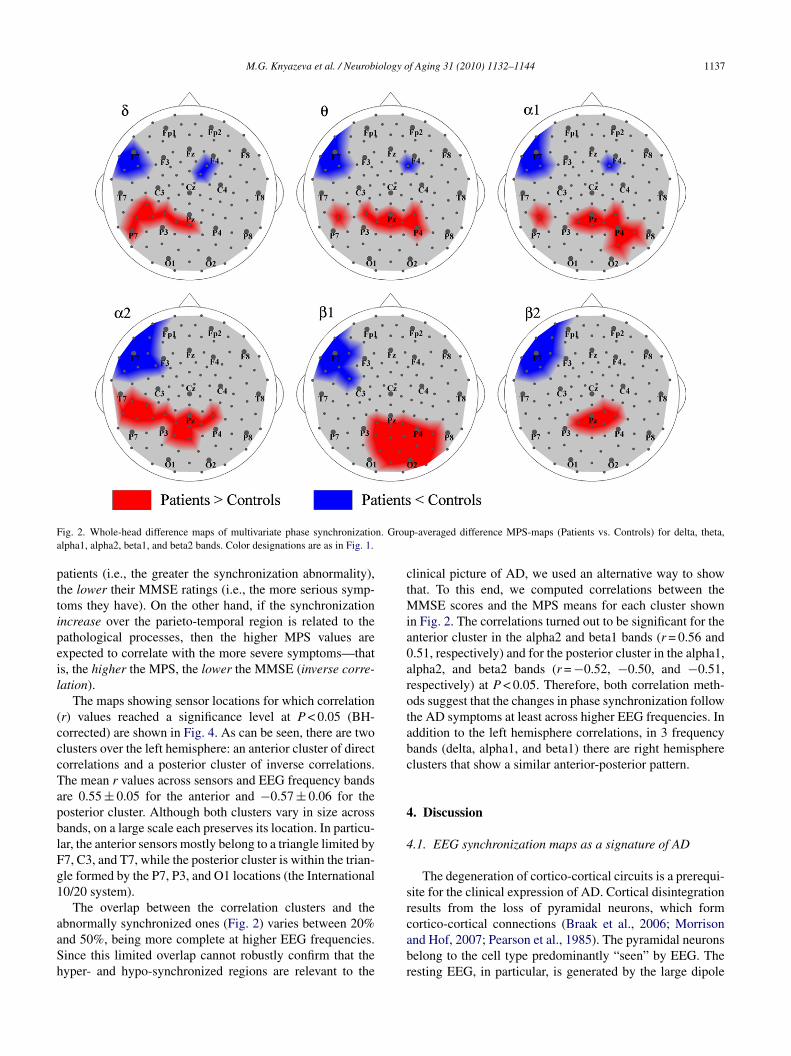
M.G. Knyazeva et al. / Neurobiology of Aging 31 (2010) 1132–1144 1137
F n. Groua
pttipeil
(cccTapblFg1
aaSh
ctMia0arotabc
4
4
sr
ig. 2. Whole-head difference maps of multivariate phase synchronizatiolpha1, alpha2, beta1, and beta2 bands. Color designations are as in Fig. 1.
atients (i.e., the greater the synchronization abnormality),he lower their MMSE ratings (i.e., the more serious symp-oms they have). On the other hand, if the synchronizationncrease over the parieto-temporal region is related to theathological processes, then the higher MPS values arexpected to correlate with the more severe symptoms—thats, the higher the MPS, the lower the MMSE (inverse corre-ation).
The maps showing sensor locations for which correlationr) values reached a significance level at P < 0.05 (BH-orrected) are shown in Fig. 4. As can be seen, there are twolusters over the left hemisphere: an anterior cluster of directorrelations and a posterior cluster of inverse correlations.he mean r values across sensors and EEG frequency bandsre 0.55 ± 0.05 for the anterior and −0.57 ± 0.06 for theosterior cluster. Although both clusters vary in size acrossands, on a large scale each preserves its location. In particu-ar, the anterior sensors mostly belong to a triangle limited by7, C3, and T7, while the posterior cluster is within the trian-le formed by the P7, P3, and O1 locations (the International0/20 system).
The overlap between the correlation clusters and the
bnormally synchronized ones (Fig. 2) varies between 20%nd 50%, being more complete at higher EEG frequencies.ince this limited overlap cannot robustly confirm that theyper- and hypo-synchronized regions are relevant to thecabr
p-averaged difference MPS-maps (Patients vs. Controls) for delta, theta,
linical picture of AD, we used an alternative way to showhat. To this end, we computed correlations between the
MSE scores and the MPS means for each cluster shownn Fig. 2. The correlations turned out to be significant for thenterior cluster in the alpha2 and beta1 bands (r = 0.56 and.51, respectively) and for the posterior cluster in the alpha1,lpha2, and beta2 bands (r = −0.52, −0.50, and −0.51,espectively) at P < 0.05. Therefore, both correlation meth-ds suggest that the changes in phase synchronization followhe AD symptoms at least across higher EEG frequencies. Inddition to the left hemisphere correlations, in 3 frequencyands (delta, alpha1, and beta1) there are right hemispherelusters that show a similar anterior-posterior pattern.
. Discussion
.1. EEG synchronization maps as a signature of AD
The degeneration of cortico-cortical circuits is a prerequi-ite for the clinical expression of AD. Cortical disintegrationesults from the loss of pyramidal neurons, which form
ortico-cortical connections (Braak et al., 2006; Morrisonnd Hof, 2007; Pearson et al., 1985). The pyramidal neuronselong to the cell type predominantly “seen” by EEG. Theesting EEG, in particular, is generated by the large dipole
1138 M.G. Knyazeva et al. / Neurobiology of Aging 31 (2010) 1132–1144
Fig. 3. Linear discrimination of subjects via MPS features. Linear discrimination of subjects according to the features that emerged from the MPS analysis ispresented in the main EEG frequency bands. The feature coordinates are: abscissa—average MPS across the posterior sensors showing an increase of MPSi ft fronti discrimc and wi
lab
mamthpft0Mlte
bfibaaii
(aip
Eaatdrmpcaot2aa
n AD patients (red clusters in Fig. 2); ordinate—average MPS across the len the same map). Subjects whose EEG parameters fall to the right of theoordinates in the features space are designated with circles for AD patients
ayers of pyramidal neurons in gyral crowns (Srinivasan etl., 2006). These features suggest that the resting EEG coulde sensitive to the AD-related cortical deterioration.
Indeed, our application of multivariate synchronizationapping to the analysis of functional connectivity revealedspecific landscape of synchronization in early AD. Itsost prominent features include hypo-synchronization over
he fronto-temporal brain region of the left hemisphere andyper-synchronization over the left temporal and bilateralarietal regions. This landscape aptly discriminates patientsrom controls. Moreover, in spite of the small variation inhe severity of symptoms (the group was limited to the CDR.5–1.0) we have found significant correlations between thePS abnormalities and MMSE ratings. The bilateral corre-
ations suggest that the right hemisphere is also involved inhe pathological process, although this involvement is notvident from the between-group comparison.
The multivariate synchronization changes appear to be sta-le across a broad frequency range, thus replicating previousndings of similar synchronization changes in various EEGands (Adler et al., 2003; Babiloni et al., 2006; Berendse et
l., 2000; Besthorn et al., 1994; Czigler et al., 2008; Knott etl., 2001; Kramer et al., 2007; Pogarell et al., 2005). Assum-ng that in the normal brain, the frequency of synchronizations related to the distance between synchronized assembliesmedm
o-temporal cluster showing a decrease of MPS in AD patients (blue regioninating line are classified as AD patients, and to the left as controls. Theth crosses for controls.
von Stein and Sarnthein, 2000), the frequency-nonspecificlterations in an AD brain seem to be very likely due to thenvolvement of various-range connections in the pathologicalrocess.
Importantly, the MPS changes are dissimilar from theEG power alterations (cf. Figs. 1 and 2), which makessignificant effect of volume conduction unlikely and
llows an interpretation in terms of regional synchroniza-ion. Because of the low spatial resolution of EEG, weiscuss the AD-related changes in synchronization topog-aphy in large-scale terms. On this scale, the MPS differenceaps characterized by the anteriorly (fronto-temporal) and
osteriorly (parieto-temporal) located abnormalities in syn-hronization are consistent with the topography of gyraltrophy (Giannakopoulos et al., 1997), with the topographyf cortical gray matter loss (Thompson et al., 2003), and withhe topography of amyloid deposits in AD (Buckner et al.,005). Therefore, such a synchronization landscape presentsmore accurate and specific picture than the selective bivari-te measurements of synchronization.
The majority of the synchronization measures including
ultivariate and bivariate methods detect coupling (Carmelit al., 2005; Quiroga et al., 2002). Specifically in the ADomain, a recent comparison of nonlinear synchronizationeasures with phase synchronization demonstrated their

M.G. Knyazeva et al. / Neurobiology of Aging 31 (2010) 1132–1144 1139
F ographib The regT
swwScdeoMsiq
to2eSd(decmMa
sifB2
tbcoaltaaP1lawrw
ig. 4. Correlation between MPS and MMSE scores of AD patients. Topetween MMSE scores and MPS are presented for conventional EEG bands.here are no significant correlations in the gray regions.
imilar performance (Kramer et al., 2007). Furthermore,e analyzed EEG synchronization in AD patients not onlyith MPS as presented above, but also, in parallel, with-estimator (Carmeli et al., 2005). The latter determines syn-hronization from the embedding dimension in a state-spaceomain based on the theoretical consequence of the coop-rative behavior of simultaneous time series—the shrinkingf the state-space embedding dimension. The results of ourPS and S-estimator analyses appeared to be similar, as
upplementary Figs. S1 and S2 confirm. Therefore, find-ngs based on various synchronization measures seem to beualitatively compatible.
In the AD literature, a consensus exists on the reduc-ion of EEG synchronization, which has been tested in pairsf locations or globally (Adler et al., 2003; Babiloni et al.,006; Berendse et al., 2000; Czigler et al., 2008; Franciottit al., 2006; Koenig et al., 2005; Pijnenburg et al., 2004;tam et al., 2003). Furthermore, in neuroimaging studies,ealing with very low temporal frequencies, long-distancee.g., fronto-parietal) synchronization was also shown to beecreased (Grady et al., 2001; Horwitz et al., 1995; Wangt al., 2007). Such changes of functional connectivity are
onsistent with the demyelination observed in postmortemorphological studies (Bartzokis et al., 2004) and in in vivoagnetization Transfer Imaging AD studies (van der Flier etl., 2002). The anterior clusters of hypo-synchronized EEG
cbti
es of the significant Spearman rank correlations (P < 0.05, BH corrected)ions with direct correlations are shown in brown, with inverse, in turquoise.
ignals from the landscapes of MPS abnormalities describedn the present paper are in agreement with frequently reportedrontal decoupling (Adler et al., 2003; Babiloni et al., 2006;erendse et al., 2000; Besthorn et al., 1994; Czigler et al.,008; Knott et al., 2001; Pogarell et al., 2005).
The AD-related increase in synchronization over the leftemporal and bilateral parietal and occipital cortices has nevereen reported in EEG studies (except for low EEG frequen-ies, e.g., see Koenig et al., 2005). The discrepancy betweenur findings and those reported in the EEG/MEG literaturere likely to be due to the fact that previous studies analyzedong-distance synchronization, whereas we consider connec-ions within the circle of 10–12 cm in diameter. Notably,n increase in intraregional functional connectivity againstdecrease in interregional connectivity was observed withET and fMRI methods (Grady et al., 2001; Horwitz et al.,995; Wang et al., 2007). The last reference is of particu-ar interest for our discussion, since in this paper (Wang etl., 2007), the resting-state functional connectivity over thehole brain was analyzed. These authors found increased cor-
elations between spontaneous fluctuations of BOLD signalsithin prefrontal, parietal, and occipital lobes in AD patients
ompared to controls. Another reason for the discrepancy cane related to the fact that, according to the MMSE ratings,he symptoms in our patients were milder than in patientsn the majority of EEG synchronization studies (cf. Adler

1 iology o
ePfie
4c
TappsPitigtwor
tpdpip1ga(srMfe(irrtts
bwatelar(
tw
acowscii(raar
soscsnotweddt6
gthsldsiyopAveiid
Ei
140 M.G. Knyazeva et al. / Neurob
t al., 2003; Berendse et al., 2000; Franciotti et al., 2006;ijnenburg et al., 2004; Stam et al., 2003). Therefore, thisnding suggests some particular mechanisms working at anarly stage of AD.
.2. Abnormal EEG synchronization and plasticity ofortical circuits in early AD
Such a mechanism can be provided by synaptic plasticity.he scenario that binds the EEG synchronization alterationsnd synaptic plasticity might be as follows. The death ofyramidal neurons and the loss of synapses in AD are accom-anied by plastic processes, including axonal and dendriticprouting (Adams, 1991; Masliah et al., 2006; Scheff andrice, 2003). This aberrant sprouting together with a decrease
n the number of afferent neurons and with the expansion ofhe territory occupied by a single axon/dendrite are likely toncrease the temporal coordination of input signals to a tar-et cortical area. A more synchronized input would increasehe postsynaptic synchronization visible in EEG. Eventually,ith the progression of the disease, the pathological cascadevercomes this plastic response and ruins connectivity, whichesults in a synchronization decrease.
Applied to our data, this two-stage scenario suggests thathe anterior (fronto-temporal) and posterior associative areasass the compensatory and further degradation stages atifferent times and/or vary in the mechanisms/ability of com-ensation. Indeed, the AD-related annual loss of gray mattern the fronto-temporal cortex reaches 4–5%, whereas in theosterior temporal and parietal cortices it is mostly within–2% (Thompson et al., 2003). The analysis of the overallene expression change in AD has shown that the temporalnd prefrontal cortices are the most vulnerable brain regionsHaroutunian et al., 2007). Furthermore, the neurochemicaltudies of synaptic plasticity provide some evidence of inter-egional differences. For example, in brain specimens from
CI and AD patients, the loss of synaptic proteins in therontal cortex is more severe than in the parietal cortex (Reddyt al., 2005), and less severe than in the temporal cortexCounts et al., 2006). Plasticity of the synaptic contact zonen AD brains also varies among the inferior temporal, supe-ior parietal, parieto-occipital, and superior frontal corticalegions (Adams, 1991). Specifically, this last study revealedhat the loss of synapses is accompanied by an increase inhe synaptic contact length only in the inferior temporal anduperior parietal cortices.
Of particular interest for this discussion is the distri-ution of neuro-fibrillary tangles (NFT), the number ofhich strongly correlates with AD progression. The NFT
re found predominantly in layers III and V of the neocor-ex (Giannakopoulos et al., 1997; Lewis et al., 1987; Pearsont al., 1985). In general, layer V contains more NFT than
ayer III; however, in the visual association cortex the NFTre predominantly found in layer III, whereas in the tempo-al association cortex about two thirds of NFT are in layer VLewis et al., 1987). Furthermore, the NFT are less frequent inMtTd
f Aging 31 (2010) 1132–1144
he parietal and occipital cortices than in the temporal cortex,hile the frontal cortex displays intermediate densities.The neurons of layers II and III provide feed-forward,
ssociation, and callosal connections, whereas feedbackonnections and those descending to subcortical structuresriginate in layer V. The interaction of these cortical featuresith the across-layer and across-region distribution of NFT
uggests that feedback and descending connections, espe-ially in the frontal and temporal areas, are at a higher riskn AD than are feed-forward connections. Finally, consider-ng that layer V is strongly implicated in cortical synchronyConnors and Amitai, 1995), one can assume that the AD-elated abnormalities of EEG synchronization would be moredvanced in the fronto-temporal than in the parietal areas,n assumption that agrees with the interregional differenceeported here.
If the effect of the AD per se consists of the hypo-ynchronization of fronto-temporal networks, whereas thatf plasticity comprises temporal and posterior hyper-ynchronization, we might expect the hyper-synchronizedlusters to shrink and the hypo-synchronized clusters topread out with the progression of AD. Since the newly diag-osed patients represented a homogenous group in termsf their AD stage (see Table 1), we used the duration ofhe disease as an index of AD progression. The patientsere divided into two groups: 9 patients with short dis-
ase duration (2.7 ± 0.5 years) and 8 patients with longeruration (6.8 ± 1.7 years). The between-group difference inuration was significant at P < 0.0001 (Student’s permutation-test), whereas the mean age did not differ (71.9 ± 7.8 and5.8 ± 12.8 years, respectively).
As Fig. 5 shows, the MPS difference maps for theseroups are indeed characterized by the predicted fea-ures. In the short-duration group (Fig. 5A), there are 90yper-synchronized (red) and 27 hypo-synchronized (blue)ensors (summarized across EEG bands), whereas in theong-duration group (Fig. 5B), the number of red sensorsramatically reduces to only 36, while the number of blue sen-ors increases up to 47. Furthermore, by dividing our patientsnto groups according to their age (8 patients younger than 66ears of age (60.1 ± 6.7), and 9 patients older than 70 yearsf age (76.9 ± 6.1)), we could show that only red (“com-ensatory”) clusters reduce with age (70 vs. 36), whereasD-related clusters do not differ between the groups (46s. 43, Fig. 6). The result is not a surprising one, consid-ring that neither stage nor duration of AD (4.9 ± 2.0 yearsn the younger vs. 4.3 ± 2.8 years in the older patients) differn these groups, whereas the plastic properties of the brainecrease with age.
However, it is not clear whether the processes that result inEG synchronization can compensate for cognitive deficits
n AD: the inverse correlations between the parieto-temporal
PS and the MMSE scores in our group of patients suggesthat the MPS increase is related to more severe symptoms.his might be accounted for by sprouting that leads to theecreased selectivity of connections. The enlarged activa-

M.G. Knyazeva et al. / Neurobiology of Aging 31 (2010) 1132–1144 1141
F long dus nts witha
t(tp
thtiioha
satrts
D
ig. 5. Changes in synchronization landscape in AD patients with short andynchronization for the two subgroups of AD patients are shown. (A) Patiend longer. Other designations are as in Fig. 2.
ion area shown in AD patients with neuroimaging methodsWang et al., 2007 and references therein) probably reflectshis effect. Finally, insufficiently selective connections fail torovide real functional compensation.
The topography of EEG synchronization in AD seemso be a promising area for further research. Moreover, ourypothesis based on this topography provides specific andestable predictions: (i) the AD progression would resultn replacing the synchronization increase with its reduction
n posterior associative areas; (ii) the MCI and mild early-nset AD patients are likely to have relatively wide-spreadyper-synchronized regions, including fronto-temporal ones;nd (iii) patients with late-onset AD would have less exten-oV
ration of disease. The group-averaged difference maps of multivariate phaseAD duration of 3 years or shorter; (B) patients with AD duration 4 years
ive hyper-synchronized regions. Although these predictionsre partially supported by our preliminary evidence, addi-ional studies including the analysis of task-related EEG areequired to confirm them. The results would be important forhe early diagnostics and for the adequate choice of treatmenttrategies.
isclosure
Dr. Knyazeva reported no biomedical financial interestsr potential conflicts of interest mentioned in (a)–(c) of theerification requirements.

1142 M.G. Knyazeva et al. / Neurobiology of Aging 31 (2010) 1132–1144
Fig. 6. Changes in synchronization landscape in early- and late-onset AD patients. The group-averaged difference maps of multivariate phase synchronizationf 66 yeari
pV
oV
oV
pi
pV
pV
p
or the two subgroups of AD patients are shown. (A) Patients younger thann Fig. 2.
Mr. Jalili reported no biomedical financial interests orotential conflicts of interest mentioned in (a)–(c) of theerification requirements.
Mme Brioschi reported no biomedical financial interestsr potential conflicts of interest mentioned in (a)–(c) of theerification requirements.
Mme Bourquin reported no biomedical financial interestsr potential conflicts of interest mentioned in (a)–(c) of the
erification requirements.Dr. Fornari reported no biomedical financial interests orotential conflicts of interest mentioned in (a)–(c) of the Ver-fication requirements.
i
pV
s of age; (B) patients older than 70 years of age. Other designations are as
Dr. Hasler reported no biomedical financial interests orotential conflicts of interest mentioned in (a)–(c) of theerification requirements.
Dr. Meuli reported no biomedical financial interests orotential conflicts of interest mentioned in (a)–(c) of theerification requirements.
Dr. Maeder reported no biomedical financial interests orotential conflicts of interest mentioned in (a)–(c) of the Ver-
fication requirements.Dr. Ghika reported no biomedical financial interests orotential conflicts of interest mentioned in (a)–(c) of theerification requirements.

iology o
A
U(fdctf
A
bn
R
A
A
A
B
B
B
B
B
B
B
B
B
C
C
C
C
C
F
F
F
F
G
G
H
H
H
H
H
J
J
J
K
K
M.G. Knyazeva et al. / Neurob
cknowledgments
This work was supported by an Interdisciplinary FBM-NIL grant and by Swiss National Science Foundation grants
Nos. 200020-117975/1 and 3100A0-103993). We are grate-ul to Dr. S. Joray for her invaluable help in recruiting andiagnosing patients. We thank Dr. O. De Feo for his helpfulomments, and Ms. D. Polzik for assistance in the prepara-ion of the manuscript. We are grateful to our peer-reviewersor meaningful and inspiring comments on the manuscript.
ppendix A. Supplementary data
Supplementary data associated with this article cane found, in the online version, at doi:10.1016/j.eurobiolaging.2008.07.019.
eferences
dams, I.M., 1991. Structural plasticity of synapses in Alzheimer’s disease.Molecular Neurobiology 5, 411–419.
dler, G., Brassen, S., Jajcevic, A., 2003. EEG coherence in Alzheimer’sdementia. Journal of Neural Transmission 110, 1051–1058.
llefeld, C., Kurths, J., 2004. An approach to multivariate phase syn-chronization analysis and its application to event-related potentials.International Journal of Bifurcation and Chaos 14, 417–426.
abiloni, C., Ferri, R., Binetti, G., Cassarino, A., Dal Forno, G., Ercolani, M.,Ferreri, F., Frisoni, G.B., Lanuzza, B., Miniussi, C., Nobili, F., Rodriguez,G., Rundo, F., Stam, C.J., Musha, T., Vecchio, F., Rossini, P., 2006.Fronto-parietal coupling of brain rhythms in mild cognitive impairment:a multicentric EEG study. Brain Research Bulletin 69, 63–73.
artzokis, G., Sultzer, D., Lu, P.H., Nuechterlein, K.H., Mintz, J., Cum-mings, J.L., 2004. Heterogeneous age-related breakdown of white matterstructural integrity: implications for cortical “disconnection” in agingand Alzheimer’s disease. Neurobiology of Aging 25, 843–851.
enjamini, Y., Hochberg, Y., 1995. Controlling the false discovery rate—apractical and powerful approach to multiple testing. Journal of the RoyalStatistical Society Series B—Methodological 57, 289–300.
erendse, H.W., Verbunt, J.P., Scheltens, P., van Dijk, B.W., Jonkman,E.J., 2000. Magnetoencephalographic analysis of cortical activity inAlzheimer’s disease: a pilot study. Clinical Neurophysiology 111,604–612.
esthorn, C., Förstl, H., Geiger-Kabisch, C., Sattel, H., Gasser, T.,Schreiter-Gasser, U., 1994. EEG coherence in Alzheimer disease. Elec-troencephalography and Clinical Neurophysiology 90, 242–245.
ishop, C.M., 2006. Pattern Recognition and Machine Learning, 1st ed.Springer, Singapore.
occaletti, S., Kurths, J., Osipov, G., Valladares, D.L., Zhou, C.S., 2002.The synchronization of chaotic systems. Physics Reports 366, 1–101.
raak, H., Rüb, U., Schultz, C., Del Tredici, K., 2006. Vulnerability ofcortical neurons to Alzheimer’s and Parkinson’s diseases. Journal ofAlzheimer’s Disease 9, 35–44.
uckner, R.L., Snyder, A.Z., Shannon, B.J., LaRossa, G., Sachs, R., Fotenos,A.F., Sheline, Y.I., Klunk, W.E., Mathis, C.A., Morris, J.C., Mintun,M.A., 2005. Molecular, structural, and functional characterization of
Alzheimer’s disease: evidence for a relationship between default activity,amyloid, and memory. Journal of Neuroscience 25, 7709–7717.armeli, C., Knyazeva, M., Innocenti, G., De Feo, O., 2005. Assessmentof EEG synchronization based on state-space analysis. NeuroImage 25,339–354.
K
f Aging 31 (2010) 1132–1144 1143
omi, G., Leocani, L., 1999. Neurophysiological imaging techniques indementia. Italian Journal of Neurological Sciences 20, 265–269.
onnors, B.W., Amitai, Y., 1995. Function of local circuits in neocortex:Synchrony and laminae. In: Gutnick, M.J., Mody, I. (Eds.), The CorticalNeurons. Oxford University Press.
ounts, S.E., Nadeem, M., Lad, S.P., Wuu, J., Mufson, E.J., 2006. Dif-ferential expression of synaptic proteins in the frontal and temporalcortex of elderly subjects with mild cognitive impairment. Journal ofNeuropathology and Experimental Neurology 65, 592–601.
zigler, B., Csikós, D., Hidasi, Z., Gaál, Z.A., Csibri, É., Kiss, É., Salacz,P., Molnár, M., 2008. Quantitative EEG in early Alzheimer’s diseasepatients—power spectrum and complexity features. International Journalof Psychophysiology 68, 75–80.
ernández, A., Hornero, R., Mayo, A., Poza, J., Gil-Gregorio, P., Ortiz, T.,2006. MEG spectral profile in Alzheimer’s disease and mild cognitiveimpairment. Clinical Neurophysiology 117, 306–314.
erree, T.C., Luu, P., Russell, G.S., Tucker, D.M., 2001. Scalp electrodeimpedance, infection risk, and EEG data quality. Journal of ClinicalNeurophysiology 112, 536–544.
olstein, M.F., McHugh, P., 1975. Mini-Mental state: a practical methodfor grading the cognitive state of patients for the clinician. Journal ofPsychiatric Research 12, 189–198.
ranciotti, R., Iacono, D., Della Penna, S., Pizzella, V., Torquati, K., Onofrj,M., Romani, G.L., 2006. Cortical rhythms reactivity in AD LBD andnormal subjects: a quantitative MEG study. Neurobiology of Aging 27,1100–1109.
iannakopoulos, P., Hof, P.R., Michel, J.P., Guimon, J., Bouras, C., 1997.Cerebral cortex pathology in aging and Alzheimer’s disease: a quanti-tative survey of large hospital-based geriatric and psychiatric cohorts.Brain Research Brain Research Reviews 25, 217–245.
rady, C.L., Furey, M.L., Pietrini, P., Horwitz, B., Rapoport, S.I., 2001.Altered brain functional connectivity and impaired short-term memoryin Alzheimer’s disease. Brain 124, 739–756.
ahn, S.L., 1996. Hilbert Transforms in Signal Processing. Artech HousePublishers.
aroutunian, V., Katsel, P., Schmeidler, J., 2007. Transcriptional vulnerabil-ity of brain regions in Alzheimer’s disease and dementia. Neurobiologyof Aging, doi:10.1016/j.neurobiolaging.2007.07.021.
iggins, J.J., 2004. Introduction to Modern Nonparametric Statistics.Brooks/Cole-Thomson Learning, Pacific-Grove, CA.
ogan, M.J., Swanwick, G.R., Kaiser, J., Rowan, M., Lawlor, B.,2003. Memory-related EEG power and coherence reductions in mildAlzheimer’s disease. International Journal of Psychophysiology 49,147–163.
orwitz, B., McIntosh, A.R., Haxby, J.V., Furey, M., Salerno, J.A., Schapiro,M.B., Rapoport, S.I., Grady, C.L., 1995. Network analysis of PET-mapped visual pathways in Alzheimer type dementia. Neuroreport 6,2287–2292.
alili, M., Lavoie, S., Deppen, P., Meuli, R., Do, K.Q., Cuenod, M., Hasler,M., De Feo, O., Knyazeva, M.G., 2007. Dysconnection Topography inschizophrenia with state-space analysis of EEG. PLoS ONE 2, e1059.
elic, V., Shigeta, M., Julina, P., Almkvist, O., Winblad, B., Wahlund, L.-O., 1996. Quantitative electroencephalography power and coherencein Alzheimer’s disease and mild cognitive impairment. Dementia andGeriatric Cognitive Disorders 7, 314–323.
eong, J., 2004. EEG dynamics in patients with Alzheimer’s disease. ClinicalNeurophysiology 115, 1490–1505.
atz, S., 1983. Assessing self-maintenance: activities of daily living, mobil-ity, and instrumental activities of daily living. Journal of the AmericanGeriatrics Society 31, 721–727.
nott, V., Mohr, E., Mahoney, C., Ilivitsky, V., 2001. Quantitative elec-troencephalography in Alzheimer’s disease: comparison with a control
group, population norms and mental status. Journal of Psychiatry andNeurscience 26, 106–116.oenig, T., Prichepb, L., Dierksa, T., Hubla, D., Wahlundd, L.O., John, E.R.,Jelicd, V., 2005. Decreased EEG synchronization in Alzheimer’s diseaseand mild cognitive impairment. Neurobiology of Aging 26, 165–171.
1 iology o
K
L
L
L
L
M
M
M
M
N
P
P
P
P
Q
R
S
S
S
S
T
v
v
W
144 M.G. Knyazeva et al. / Neurob
ramer, M.A., Chang, F.L., Cohen, M.E., Hudson, D., Szeri, A.J., 2007.Synchronization measures of the scalp electroencephalogram can dis-criminate healthy from Alzheimer’s subjects. International Journal ofNeural Systems 17, 61–69.
awton, M.P., Brody, E.M., 1969. Assessment of older people: self maintain-ing and instrumental activities of daily living. Gerontologist 9, 179–186.
ewis, D.A., Campbell, M.J., Terry, R.D., Morrison, J.H., 1987. Laminar andregional distributions of neurofibrillary tangles and neuritic plaques inAlzheimer’s disease: a quantitative study of visual and auditory cortices.Journal of Neuroscience 7, 1799–1808.
indau, M., Jelic, V., Johansson, S.E., Andersen, C., Wahlund, L.O.,Almkvist, O., 2003. Quantitative EEG abnormalities and cognitivedysfunctions in frontotemporal dementia and Alzheimer’s disease.Dementia and Geriatric Cognitive Disorders 15, 106–114.
ocatelli, T., Cursi, M., Liberati, D., Franceschi, M., Comi, G., 1998. EEGcoherence in Alzheimer’s disease. Electroencephalography and ClinicalNeurophysiology 106, 229–237.
asliah, E., Crews, L., Hansen, L., 2006. Synaptic remodeling during agingand in Alzheimer’s disease. Journal of Alzheimer’s Disease 9, 91–99.
cKhann, G., Drachman, D., Folstein, M., Katzman, R., Price, D., Stad-lan, E.M., 1984. Clinical diagnosis of Alzheimer’s disease: report ofthe NINCDS-ADRDA Work Group under the auspices of Departmentof Health and Human Services Task Force on Alzheimer’s Disease.Neurology 34, 939–944.
orris, J.C., 1993. The clinical dementia rating (CDR): current version andscoring rules. Neurology 43, 2412–2414.
orrison, J.H., Hof, P.R., 2007. Life and death of neurons in the agingcerebral cortex. International Reviews in Neurobiology 81, 41–57.
unez, P., Srinivasan, R., 2006. Electric Fields of the Brain: The Neuro-physics of EEG, 2nd ed. Oxford University Press, New York.
earson, R.C., Esiri, M.M., Hiorns, R.W., Wilcock, G.K., Powell, T.P., 1985.Anatomical correlates of the distribution of the pathological changesin the neocortex in Alzheimer disease. Proceedings of the NationalAcademy of Science of the United States of America 82, 4531–4534.
ijnenburg, Y.A., Made, x.Y., van Walsum, A.M., Knol, D.L., Scheltens,
P., Stam, C.J., 2004. EEG synchronization likelihood in mild cognitiveimpairment and Alzheimer’s disease during a working memory task.Journal of Clinical Neurophysiology 115, 1332–1339.ogarell, O., Teipel, S.J., Juckel, G., Gootjes, L., Möller, T., Bürger, K.,Leinsinger, G., Möller, H.-J., Hegerl, U., Hampel, H., 2005. EEG coher-
W
f Aging 31 (2010) 1132–1144
ence reflects regional corpus callosum area in Alzheimer’s disease.Journal of Neurology Neurosurgery and Psychiatry 76, 109–111.
uel, M., Hugonot-Diener, L., 1996. Presenting by the GRECO group ofthe French adaptation of a cognitive assessment scale used in Alzhiemertype dementia. Presse Medicine 22, 1028–1132.
uiroga, R., Kraskov, A., Kreuz, T., Grassberger, P., 2002. Performance ofdifferent synchronization measures in real data: a case study on elec-troencephalographic signals. Physical Review E 65, 041903.
eddy, P.H., Mani, G., Park, B.S., Jacques, J., Murdoch, G., Whetsell, W.J.,Kaye, J., Manczak, M., 2005. Differential loss of synaptic proteins inAlzheimer’s disease: implications for synaptic dysfunction. Journal ofAlzheimer’s Disease 7, 103–117.
caln, S.G., Reisberg, B., 1992. Functional Assessment Staging (FAST)in Alzhiemer’s disease: reliability, validity and ordinality. InternationalPsychogeraitrics 4, 55–69.
cheff, S.W., Price, D.A., 2003. Synaptic pathology in Alzheimer’s disease: areview of ultrastructural studies. Neurobiology of Aging 24, 1029–1046.
rinivasan, R., Winter, W., Nunez, P., 2006. Source analysis of EEG oscilla-tions using high-resolution EEG and MEG. Progress in Brain Research159, 29–42.
tam, C.J., van der Made, Y., Pijnenburg, Y.A., Scheltens, P., 2003. EEGsynchronization in mild cognitive impairment and Alzheimer’s disease.Acta Neurologica Scandinavica 108, 90–96.
hompson, P.M., Hayashi, K.M., de Zubicaray, G., Janke, A.L., Rose, S.E.,Semple, J., Herman, D., Hong, M.S., Dittmer, S.S., Doddrell, D.M.,Toga, A.W., 2003. Dynamics of gray matter loss in Alzheimer’s disease.Journal of Neuroscience 23, 994–1005.
an der Flier, W.M., van den Heuvel, D.M., Weverling-Rijnsburger, A.W.,Bollen, E.L., Westendorp, R.G., van Buchem, M.A., Middelkoop, H.A.,2002. Magnetization transfer imaging in normal aging, mild cognitiveimpairment, and Alzheimer’s disease. Annals of Neurology 52, 62–67.
on Stein, A., Sarnthein, J., 2000. Different frequencies for different scalesof cortical integration: from local gamma to long range alpha/theta syn-chronization. International Journal of Psychophysiology 38, 301–313.
ang, K., Liang, M., Wang, L., Tian, L., Zhang, X., Li, K., Jiang, T., 2007.
Altered functional connectivity in early Alzheimer’s disease: a resting-state fMRI study. Human Brain Mapping 28, 967–978.elch, P., 1967. The use of fast Fourier transform for the estimation ofpower spectra: a method based on time averaging over short, modifiedperiodograms. IEEE Transactions on Audio Electroacoustics 15, 70–73.
Related Documents