TOPLINE Monthly Harvard-Harris Poll: January 2018 This survey was conducted online within the United States between January 13-16, 2018 among 1,962 registered voters by The Harris Poll. The results reflect a nationally representative sample. Results were weighted for age within gender, region, race/ethnicity, marital status, household size, income, employment, political party, political ideology, and education where necessary to align them with their actual proportions in the population. Propensity score weighting was also used to adjust for respondents’ propensity to be online.

Welcome message from author
This document is posted to help you gain knowledge. Please leave a comment to let me know what you think about it! Share it to your friends and learn new things together.
Transcript

TOPLINE
Monthly Harvard-Harris Poll: January 2018
This survey was conducted online within the United States between January 13-16, 2018
among 1,962 registered voters by The Harris Poll.
The results reflect a nationally representative sample. Results were weighted for age within
gender, region, race/ethnicity, marital status, household size, income, employment, political
party, political ideology, and education where necessary to align them with their actual
proportions in the population. Propensity score weighting was also used to adjust for
respondents’ propensity to be online.

Base n=1962
AGE*
18-34 26%
35-49 24%
50-64 30%
65+ 21%
SEX*
Male 48%
Female 52%
EDUCATION*
Less than high school degree 8% High school degree to less than 4 year college degree 58% 4 year college degree or more 34% RACE/ETHNICITY*
White 67%
Black/African American 11%
Hispanic 13%
Asian 5%
Other 4%
*Denotes weighting variable
Base n=1962
POLITICAL PARTY*
Democrat 37%
Republican 31%
Independent 29%
Other 4%
LOCALE
Urban 28%
Suburban 51%
Rural 21%
POLITICAL IDEOLOGY*
Liberal 27%
Moderate 43%
Conservative 31%

Page 1
QuickQuery
Fielding Period: January 13-16, 2018
HCAPS (Filtered on Registered Voters)
Weighted To The U.S. General Adult Population - Propensity
18 Jan 2018
Table 1
D1 What is your age?
Base: All Respondents
Presidential
Election Candidate
Gender Age Ethnicity Political Party Political Ideology Voted For Education Locale Income
_____________ ______________________ _______________________ ____________________ ____________________ _____________________ _____________ ________________ _________
Colle- Some
Cons- ge Gr- Colle- $75K Less
Hisp- Black Repub- Democ- Indep- Libe- Mode- erva- 3rd ad And ge Or Urb- Subu- Or Than
Total Male Female 18-34 35-49 50-64 65+ White anic /AA Other lican rat endent ral rate tive Clinton Trump Party Higher Less an rban Rural More $75K
______ _____ _______ _____ _____ _____ ____ _____ _____ _____ _____ ______ ______ ______ ______ ______ ______ ________ ______ _____ ______ ______ ____ _____ _____ ____ ____
Unweighted Base 1962 882 1080 384 500 636 442 1530 136 183 39 600 711 571 518 818 626 731 698 184 700 1262 519 952 491 577 1275
Weighted Base 1962 942 1020 502 467 580 414 1315 261 221 75 605 722 564 523 834 605 759 680 181 670 1292 545 1001 415 811 1039
Effective Base 1157 573 585 220 294 390 295 974 90 119 28 385 404 332 294 468 401 424 438 101 434 728 315 555 298 384 744
18-34 502 212 290 502 - - - 257 110 74 21 140 217 120 167 229 106 207 108 54 161 340 189 238 75 205 269
26% 22% 28% 100% - - - 20% 42% 33% 28% 23% 30% 21% 32% 27% 17% 27% 16% 30% 24% 26% 35% 24% 18% 25% 26%
35-49 467 219 247 - 467 - - 314 64 47 12 119 173 161 117 218 132 168 157 46 166 301 113 240 113 213 236
24% 23% 24% - 100% - - 24% 25% 21% 16% 20% 24% 29% 22% 26% 22% 22% 23% 26% 25% 23% 21% 24% 27% 26% 23%
50-64 580 305 275 - - 580 - 415 65 59 29 189 190 176 141 246 193 211 228 52 179 401 160 291 129 245 307
30% 32% 27% - - 100% - 32% 25% 27% 39% 31% 26% 31% 27% 30% 32% 28% 34% 29% 27% 31% 29% 29% 31% 30% 30%
65+ 414 206 208 - - - 414 329 22 41 12 157 142 107 98 142 174 173 187 29 164 249 82 232 99 148 227
21% 22% 20% - - - 100% 25% 8% 19% 17% 26% 20% 19% 19% 17% 29% 23% 28% 16% 25% 19% 15% 23% 24% 18% 22%
Mean 48.6 50.1 47.2 27.0 41.7 56.8 71.1 51.3 41.0 45.8 48.3 51.1 46.9 48.7 46.6 46.8 52.7 48.4 53.0 46.2 50.0 47.9 45.7 49.4 50.6 48.0 48.7
Std. Dev. 16.70 16.29 16.97 5.13 4.50 4.20 4.74 16.10 15.77 16.49 18.40 17.12 16.45 16.18 16.67 16.38 16.45 16.81 15.84 16.43 15.98 17.02 16.07 17.1415.9615.9116.93
Std. Err. 0.38 0.55 0.52 0.26 0.20 0.17 0.23 0.41 1.35 1.22 2.95 0.70 0.62 0.68 0.73 0.57 0.66 0.62 0.60 1.21 0.60 0.48 0.71 0.56 0.72 0.66 0.47
Sigma 1962 942 1020 502 467 580 414 1315 261 221 75 605 722 564 523 834 605 759 680 181 670 1292 545 1001 415 811 1039
100% 100% 100% 100% 100% 100% 100% 100% 100% 100% 100% 100% 100% 100% 100% 100% 100% 100% 100% 100% 100% 100% 100% 100% 100% 100% 100%

Page 2
QuickQuery
Fielding Period: January 13-16, 2018
HCAPS (Filtered on Registered Voters)
Weighted To The U.S. General Adult Population - Propensity
18 Jan 2018
Table 2
D2 What is your gender?
Base: All Respondents
Presidential
Election Candidate
Gender Age Ethnicity Political Party Political Ideology Voted For Education Locale Income
_____________ ______________________ _______________________ ____________________ ____________________ _____________________ _____________ ________________ _________
Colle- Some
Cons- ge Gr- Colle- $75K Less
Hisp- Black Repub- Democ- Indep- Libe- Mode- erva- 3rd ad And ge Or Urb- Subu- Or Than
Total Male Female 18-34 35-49 50-64 65+ White anic /AA Other lican rat endent ral rate tive Clinton Trump Party Higher Less an rban Rural More $75K
______ _____ _______ _____ _____ _____ ____ _____ _____ _____ _____ ______ ______ ______ ______ ______ ______ ________ ______ _____ ______ ______ ____ _____ _____ ____ ____
Unweighted Base 1962 882 1080 384 500 636 442 1530 136 183 39 600 711 571 518 818 626 731 698 184 700 1262 519 952 491 577 1275
Weighted Base 1962 942 1020 502 467 580 414 1315 261 221 75 605 722 564 523 834 605 759 680 181 670 1292 545 1001 415 811 1039
Effective Base 1157 573 585 220 294 390 295 974 90 119 28 385 404 332 294 468 401 424 438 101 434 728 315 555 298 384 744
Male 942 942 - 212 219 305 206 667 115 94 26 336 284 295 230 386 326 318 387 98 362 580 288 463 191 431 467
48% 100% - 42% 47% 53% 50% 51% 44% 43% 34% 56% 39% 52% 44% 46% 54% 42% 57% 54% 54% 45% 53% 46% 46% 53% 45%
Female 1020 - 1020 290 247 275 208 647 146 127 50 268 438 269 292 449 279 441 293 82 308 712 257 539 225 379 572
52% - 100% 58% 53% 47% 50% 49% 56% 57% 66% 44% 61% 48% 56% 54% 46% 58% 43% 46% 46% 55% 47% 54% 54% 47% 55%
Sigma 1962 942 1020 502 467 580 414 1315 261 221 75 605 722 564 523 834 605 759 680 181 670 1292 545 1001 415 811 1039
100% 100% 100% 100% 100% 100% 100% 100% 100% 100% 100% 100% 100% 100% 100% 100% 100% 100% 100% 100% 100% 100% 100% 100% 100% 100% 100%

Page 3
QuickQuery
Fielding Period: January 13-16, 2018
HCAPS (Filtered on Registered Voters)
Weighted To The U.S. General Adult Population - Propensity
18 Jan 2018
Table 3
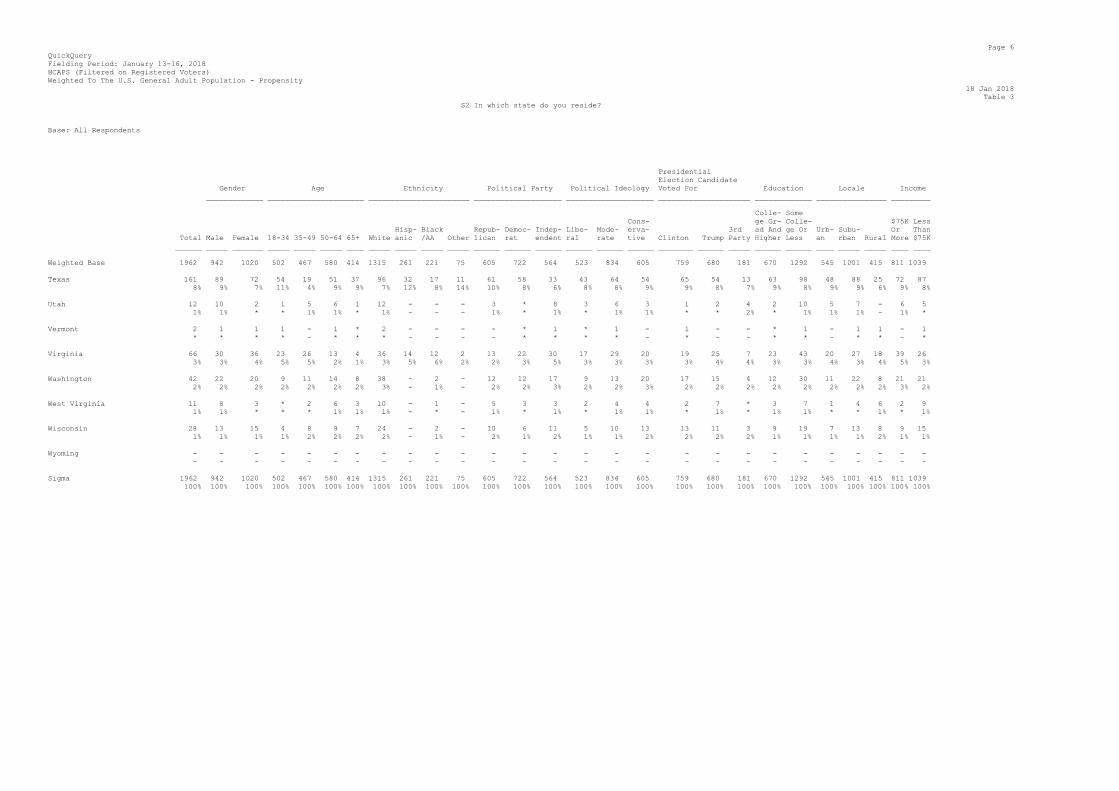
S2 In which state do you reside?
Base: All Respondents
Presidential
Election Candidate
Gender Age Ethnicity Political Party Political Ideology Voted For Education Locale Income
_____________ ______________________ _______________________ ____________________ ____________________ _____________________ _____________ ________________ _________
Colle- Some
Cons- ge Gr- Colle- $75K Less
Hisp- Black Repub- Democ- Indep- Libe- Mode- erva- 3rd ad And ge Or Urb- Subu- Or Than
Total Male Female 18-34 35-49 50-64 65+ White anic /AA Other lican rat endent ral rate tive Clinton Trump Party Higher Less an rban Rural More $75K
______ _____ _______ _____ _____ _____ ____ _____ _____ _____ _____ ______ ______ ______ ______ ______ ______ ________ ______ _____ ______ ______ ____ _____ _____ ____ ____
Unweighted Base 1962 882 1080 384 500 636 442 1530 136 183 39 600 711 571 518 818 626 731 698 184 700 1262 519 952 491 577 1275
Weighted Base 1962 942 1020 502 467 580 414 1315 261 221 75 605 722 564 523 834 605 759 680 181 670 1292 545 1001 415 811 1039
Effective Base 1157 573 585 220 294 390 295 974 90 119 28 385 404 332 294 468 401 424 438 101 434 728 315 555 298 384 744
Alabama 18 9 9 4 9 3 3 16 - 1 - 9 5 4 5 9 5 5 9 1 6 13 4 6 8 3 15
1% 1% 1% 1% 2% * 1% 1% - * - 1% 1% 1% 1% 1% 1% 1% 1% 1% 1% 1% 1% 1% 2% * 1%
Alaska 5 4 2 2 2 2 - 5 - - - 1 1 3 1 3 1 1 1 2 - 5 1 3 1 3 1
* * * * * * - * - - - * * 1% * * * * * 1% - * * * * * *
Arizona 29 10 19 6 10 7 5 22 5 2 - 12 9 4 10 10 8 9 12 - 9 19 12 11 6 12 16
1% 1% 2% 1% 2% 1% 1% 2% 2% 1% - 2% 1% 1% 2% 1% 1% 1% 2% - 1% 2% 2% 1% 1% 2% 1%
Arkansas 7 2 5 2 3 1 * 3 1 3 - 1 3 3 2 4 1 3 2 1 1 6 1 3 3 1 6
* * * * 1% * * * 1% 1% - * * * * * * * * 1% * * * * 1% * 1%
California 246 126 120 86 54 61 45 100 94 17 12 65 122 54 90 103 52 127 62 22 83 162 106 126 14 125 103
13% 13% 12% 17% 12% 11% 11% 8% 36% 7% 16% 11% 17% 9% 17% 12% 9% 17% 9% 12% 12% 13% 19% 13% 3% 15% 10%
Colorado 22 14 7 6 4 4 8 13 3 1 5 7 4 9 5 9 8 7 9 1 9 13 6 9 6 10 11
1% 2% 1% 1% 1% 1% 2% 1% 1% * 6% 1% 1% 2% 1% 1% 1% 1% 1% 1% 1% 1% 1% 1% 2% 1% 1%
Connecticut 15 7 8 4 6 3 1 13 1 1 - 3 7 4 6 7 2 8 3 * 6 9 4 8 4 7 8
1% 1% 1% 1% 1% 1% * 1% * * - * 1% 1% 1% 1% * 1% * * 1% 1% 1% 1% 1% 1% 1%
Delaware 8 5 3 3 - 3 2 5 - 3 - 4 1 - 3 1 4 4 4 - 3 6 2 4 2 5 3
* 1% * 1% - 1% * * - 2% - 1% * - 1% * 1% 1% 1% - * * * * 1% 1% *
District of Columbia 7 4 2 2 2 2 1 4 - 2 1 2 3 1 4 3 - 3 2 - 4 3 3 4 - 4 3
* * * * * * * * - 1% 1% * * * 1% * - * * - 1% * * * - * *
Florida 133 56 77 32 27 36 39 90 22 9 8 31 46 54 50 58 26 63 40 16 51 83 33 90 10 55 67
7% 6% 8% 6% 6% 6% 9% 7% 8% 4% 11% 5% 6% 10% 10% 7% 4% 8% 6% 9% 8% 6% 6% 9% 3% 7% 6%
Georgia 90 36 54 24 23 22 21 50 6 29 3 29 36 21 29 30 31 37 31 7 30 61 14 55 22 37 46
5% 4% 5% 5% 5% 4% 5% 4% 2% 13% 4% 5% 5% 4% 6% 4% 5% 5% 5% 4% 4% 5% 3% 6% 5% 5% 4%
Hawaii 19 4 15 9 9 1 - 8 - - - - 10 9 5 11 3 6 3 - 5 14 8 11 * 15 4
1% * 1% 2% 2% * - 1% - - - - 1% 2% 1% 1% * 1% * - 1% 1% 1% 1% * 2% *
Idaho 13 5 7 6 2 4 1 8 - 1 2 6 2 5 - 9 4 2 5 3 3 10 2 4 7 2 11
1% 1% 1% 1% * 1% * 1% - * 3% 1% * 1% - 1% 1% * 1% 2% * 1% * * 2% * 1%

Page 4
QuickQuery
Fielding Period: January 13-16, 2018
HCAPS (Filtered on Registered Voters)
Weighted To The U.S. General Adult Population - Propensity
18 Jan 2018
Table 3
S2 In which state do you reside?
Base: All Respondents
Presidential
Election Candidate
Gender Age Ethnicity Political Party Political Ideology Voted For Education Locale Income
_____________ ______________________ _______________________ ____________________ ____________________ _____________________ _____________ ________________ _________
Colle- Some
Cons- ge Gr- Colle- $75K Less
Hisp- Black Repub- Democ- Indep- Libe- Mode- erva- 3rd ad And ge Or Urb- Subu- Or Than
Total Male Female 18-34 35-49 50-64 65+ White anic /AA Other lican rat endent ral rate tive Clinton Trump Party Higher Less an rban Rural More $75K
______ _____ _______ _____ _____ _____ ____ _____ _____ _____ _____ ______ ______ ______ ______ ______ ______ ________ ______ _____ ______ ______ ____ _____ _____ ____ ____
Weighted Base 1962 942 1020 502 467 580 414 1315 261 221 75 605 722 564 523 834 605 759 680 181 670 1292 545 1001 415 811 1039
Illinois 84 40 44 25 16 25 20 60 11 8 - 28 33 22 21 38 26 28 23 12 25 60 28 41 15 30 51
4% 4% 4% 5% 3% 4% 5% 5% 4% 3% - 5% 5% 4% 4% 5% 4% 4% 3% 6% 4% 5% 5% 4% 4% 4% 5%
Indiana 40 16 24 3 12 15 10 37 * 2 - 21 10 8 6 16 17 15 23 * 7 33 15 14 11 16 23
2% 2% 2% 1% 3% 3% 2% 3% * 1% - 3% 1% 1% 1% 2% 3% 2% 3% * 1% 3% 3% 1% 3% 2% 2%
Iowa 13 2 11 4 * 5 3 13 - - - 2 5 6 5 5 3 7 3 - 2 11 3 3 7 3 7
1% * 1% 1% * 1% 1% 1% - - - * 1% 1% 1% 1% 1% 1% * - * 1% 1% * 2% * 1%
Kansas 17 11 6 2 4 5 6 13 2 - 1 5 4 7 3 8 6 6 7 2 9 8 4 9 4 3 12
1% 1% 1% * 1% 1% 1% 1% 1% - 2% 1% 1% 1% 1% 1% 1% 1% 1% 1% 1% 1% 1% 1% 1% * 1%
Kentucky 21 7 14 4 10 1 5 19 - 1 - 7 8 5 3 10 8 6 10 1 5 16 4 7 11 1 20
1% 1% 1% 1% 2% * 1% 1% - * - 1% 1% 1% 1% 1% 1% 1% 1% 1% 1% 1% 1% 1% 3% * 2%
Louisiana 16 9 7 3 5 3 6 12 - 3 - 9 5 2 3 4 9 5 10 - 1 14 4 7 5 1 13
1% 1% 1% 1% 1% * 1% 1% - 1% - 2% 1% * 1% 1% 1% 1% 1% - * 1% 1% 1% 1% * 1%
Maine 7 4 3 1 4 2 1 6 - 1 - 6 * 1 1 2 5 1 5 * 3 4 - 3 4 4 3
* * * * 1% * * * - * - 1% * * * * 1% * 1% * * * - * 1% * *
Maryland 42 26 16 8 10 14 10 30 - 11 - 8 18 15 10 12 20 19 19 1 20 22 7 23 12 19 23
2% 3% 2% 2% 2% 2% 2% 2% - 5% - 1% 3% 3% 2% 1% 3% 3% 3% 1% 3% 2% 1% 2% 3% 2% 2%
Massachusetts 32 10 22 5 9 13 5 28 - 4 - 3 16 13 14 14 5 14 6 4 15 17 7 21 4 18 14
2% 1% 2% 1% 2% 2% 1% 2% - 2% - * 2% 2% 3% 2% 1% 2% 1% 2% 2% 1% 1% 2% 1% 2% 1%
Michigan 61 29 32 13 11 27 10 50 2 3 2 20 21 17 14 28 20 27 27 2 22 39 10 35 16 28 28
3% 3% 3% 3% 2% 5% 3% 4% 1% 1% 2% 3% 3% 3% 3% 3% 3% 4% 4% 1% 3% 3% 2% 4% 4% 3% 3%
Minnesota 40 18 23 9 7 13 11 32 2 4 - 14 10 12 13 15 12 16 11 6 13 27 5 25 10 11 25
2% 2% 2% 2% 2% 2% 3% 2% 1% 2% - 2% 1% 2% 3% 2% 2% 2% 2% 3% 2% 2% 1% 3% 2% 1% 2%
Mississippi 10 6 4 4 4 2 - 8 - 2 - 8 2 - 2 4 4 1 3 - - 10 1 1 7 4 6
* 1% * 1% 1% * - 1% - 1% - 1% * - * 1% 1% * 1% - - 1% * * 2% * 1%
Missouri 49 24 25 13 9 19 8 41 3 3 2 11 17 18 13 20 16 18 17 5 14 35 10 26 13 14 34
3% 3% 2% 3% 2% 3% 2% 3% 1% 1% 2% 2% 2% 3% 3% 2% 3% 2% 3% 3% 2% 3% 2% 3% 3% 2% 3%
Montana 1 1 * 1 - * - 1 - - - 1 - - - 1 * - 1 - * 1 - - 1 - 1
* * * * - * - * - - - * - - - * * - * - * * - - * - *
Nebraska 4 3 2 - 2 1 1 3 - - - 3 2 - - 3 1 1 3 - 1 3 1 * 3 1 3
* * * - * * * * - - - * * - - * * * 1% - * * * * 1% * *

Page 5
QuickQuery
Fielding Period: January 13-16, 2018
HCAPS (Filtered on Registered Voters)
Weighted To The U.S. General Adult Population - Propensity
18 Jan 2018
Table 3
S2 In which state do you reside?
Base: All Respondents
Presidential
Election Candidate
Gender Age Ethnicity Political Party Political Ideology Voted For Education Locale Income
_____________ ______________________ _______________________ ____________________ ____________________ _____________________ _____________ ________________ _________
Colle- Some
Cons- ge Gr- Colle- $75K Less
Hisp- Black Repub- Democ- Indep- Libe- Mode- erva- 3rd ad And ge Or Urb- Subu- Or Than
Total Male Female 18-34 35-49 50-64 65+ White anic /AA Other lican rat endent ral rate tive Clinton Trump Party Higher Less an rban Rural More $75K
______ _____ _______ _____ _____ _____ ____ _____ _____ _____ _____ ______ ______ ______ ______ ______ ______ ________ ______ _____ ______ ______ ____ _____ _____ ____ ____
Weighted Base 1962 942 1020 502 467 580 414 1315 261 221 75 605 722 564 523 834 605 759 680 181 670 1292 545 1001 415 811 1039
Nevada 12 8 4 2 6 2 1 8 3 1 - 2 6 4 2 7 2 3 2 3 3 9 7 5 * 6 5
1% 1% * * 1% * * 1% 1% * - * 1% 1% * 1% * * * 2% * 1% 1% * * 1% 1%
New Hampshire 7 2 5 * 4 * 2 7 - - - * * 6 3 3 1 2 3 - 3 4 1 3 2 4 2
* * * * 1% * 1% 1% - - - * * 1% 1% * * * 1% - * * * * 1% * *
New Jersey 43 25 19 16 5 10 12 32 7 4 - 19 13 12 10 18 15 13 19 2 21 23 8 32 4 23 17
2% 3% 2% 3% 1% 2% 3% 2% 3% 2% - 3% 2% 2% 2% 2% 3% 2% 3% 1% 3% 2% 1% 3% 1% 3% 2%
New Mexico 21 12 8 6 4 6 5 9 9 * 2 5 9 6 2 4 14 9 2 5 7 13 2 12 7 5 13
1% 1% 1% 1% 1% 1% 1% 1% 4% * 3% 1% 1% 1% * 1% 2% 1% * 3% 1% 1% * 1% 2% 1% 1%
New York 147 66 81 29 37 47 34 93 20 17 8 42 63 33 36 77 34 66 42 5 61 86 67 50 30 69 71
7% 7% 8% 6% 8% 8% 8% 7% 8% 8% 11% 7% 9% 6% 7% 9% 6% 9% 6% 3% 9% 7% 12% 5% 7% 8% 7%
North Carolina 58 30 28 8 10 27 13 32 8 13 4 13 29 13 11 24 23 27 19 4 21 36 13 31 14 20 30
3% 3% 3% 2% 2% 5% 3% 2% 3% 6% 5% 2% 4% 2% 2% 3% 4% 4% 3% 2% 3% 3% 2% 3% 3% 2% 3%
North Dakota 2 1 * - - 2 - 2 - - - * * 1 1 1 - * * 1 - 2 - 1 * 1 1
* * * - - * - * - - - * * * * * - * * 1% - * - * * * *
Ohio 71 28 43 21 18 17 15 56 3 8 1 36 20 14 9 34 27 22 31 3 19 51 17 37 17 16 51
4% 3% 4% 4% 4% 3% 4% 4% 1% 4% 2% 6% 3% 2% 2% 4% 4% 3% 5% 2% 3% 4% 3% 4% 4% 2% 5%
Oklahoma 16 5 12 4 7 3 3 10 3 3 - 3 6 6 3 8 5 5 3 3 8 8 5 11 1 7 9
1% 1% 1% 1% 1% 1% 1% 1% 1% 1% - 1% 1% 1% 1% 1% 1% 1% * 2% 1% 1% 1% 1% * 1% 1%
Oregon 30 16 14 9 4 12 6 20 3 1 3 6 14 10 9 20 2 10 7 11 11 19 4 13 14 12 19
2% 2% 1% 2% 1% 2% 1% 1% 1% 1% 4% 1% 2% 2% 2% 2% * 1% 1% 6% 2% 1% 1% 1% 3% 1% 2%
Pennsylvania 92 37 55 21 19 36 16 65 3 19 4 30 37 25 21 43 28 28 37 10 31 60 20 49 23 37 46
5% 4% 5% 4% 4% 6% 4% 5% 1% 9% 5% 5% 5% 4% 4% 5% 5% 4% 5% 6% 5% 5% 4% 5% 5% 5% 4%
Rhode Island 3 1 2 - 2 * 1 3 - - - - * 2 1 1 1 * 2 - 2 1 * 2 1 2 1
* * * - * * * * - - - - * * * * * * * - * * * * * * *
South Carolina 42 23 19 7 13 9 13 29 2 6 3 9 10 21 10 10 22 9 17 9 14 28 5 30 7 15 23
2% 2% 2% 1% 3% 1% 3% 2% 1% 3% 4% 2% 1% 4% 2% 1% 4% 1% 3% 5% 2% 2% 1% 3% 2% 2% 2%
South Dakota 7 5 2 - 6 1 1 6 - - 1 1 5 1 - 5 2 - 5 2 2 6 1 1 5 5 3
* 1% * - 1% * * * - - 2% * 1% * - 1% * - 1% 1% * * * * 1% 1% *
Tennessee 39 18 22 7 7 14 10 33 1 4 1 18 9 8 6 16 17 8 23 2 7 33 11 12 17 9 27
2% 2% 2% 1% 2% 2% 2% 3% * 2% 2% 3% 1% 1% 1% 2% 3% 1% 3% 1% 1% 3% 2% 1% 4% 1% 3%
Page 6
QuickQuery
Fielding Period: January 13-16, 2018
HCAPS (Filtered on Registered Voters)
Weighted To The U.S. General Adult Population - Propensity
18 Jan 2018
Table 3
S2 In which state do you reside?
Base: All Respondents
Presidential
Election Candidate
Gender Age Ethnicity Political Party Political Ideology Voted For Education Locale Income
_____________ ______________________ _______________________ ____________________ ____________________ _____________________ _____________ ________________ _________
Colle- Some
Cons- ge Gr- Colle- $75K Less
Hisp- Black Repub- Democ- Indep- Libe- Mode- erva- 3rd ad And ge Or Urb- Subu- Or Than
Total Male Female 18-34 35-49 50-64 65+ White anic /AA Other lican rat endent ral rate tive Clinton Trump Party Higher Less an rban Rural More $75K
______ _____ _______ _____ _____ _____ ____ _____ _____ _____ _____ ______ ______ ______ ______ ______ ______ ________ ______ _____ ______ ______ ____ _____ _____ ____ ____
Weighted Base 1962 942 1020 502 467 580 414 1315 261 221 75 605 722 564 523 834 605 759 680 181 670 1292 545 1001 415 811 1039
Texas 161 89 72 54 19 51 37 96 32 17 11 61 58 33 43 64 54 65 54 13 63 98 48 88 25 72 87
8% 9% 7% 11% 4% 9% 9% 7% 12% 8% 14% 10% 8% 6% 8% 8% 9% 9% 8% 7% 9% 8% 9% 9% 6% 9% 8%
Utah 12 10 2 1 5 6 1 12 - - - 3 * 8 3 6 3 1 2 4 2 10 5 7 - 6 5
1% 1% * * 1% 1% * 1% - - - 1% * 1% * 1% 1% * * 2% * 1% 1% 1% - 1% *
Vermont 2 1 1 1 - 1 * 2 - - - - * 1 * 1 - 1 - - * 1 - 1 1 - 1
* * * * - * * * - - - - * * * * - * - - * * - * * - *
Virginia 66 30 36 23 26 13 4 36 14 12 2 13 22 30 17 29 20 19 25 7 23 43 20 27 18 39 26
3% 3% 4% 5% 5% 2% 1% 3% 5% 6% 2% 2% 3% 5% 3% 3% 3% 3% 4% 4% 3% 3% 4% 3% 4% 5% 3%
Washington 42 22 20 9 11 14 8 38 - 2 - 12 12 17 9 13 20 17 15 4 12 30 11 22 8 21 21
2% 2% 2% 2% 2% 2% 2% 3% - 1% - 2% 2% 3% 2% 2% 3% 2% 2% 2% 2% 2% 2% 2% 2% 3% 2%
West Virginia 11 8 3 * 2 6 3 10 - 1 - 5 3 3 2 4 4 2 7 * 3 7 1 4 6 2 9
1% 1% * * * 1% 1% 1% - * - 1% * 1% * 1% 1% * 1% * 1% 1% * * 1% * 1%
Wisconsin 28 13 15 4 8 9 7 24 - 2 - 10 6 11 5 10 13 13 11 3 9 19 7 13 8 9 15
1% 1% 1% 1% 2% 2% 2% 2% - 1% - 2% 1% 2% 1% 1% 2% 2% 2% 2% 1% 1% 1% 1% 2% 1% 1%
Wyoming - - - - - - - - - - - - - - - - - - - - - - - - - - -
- - - - - - - - - - - - - - - - - - - - - - - - - - -
Sigma 1962 942 1020 502 467 580 414 1315 261 221 75 605 722 564 523 834 605 759 680 181 670 1292 545 1001 415 811 1039
100% 100% 100% 100% 100% 100% 100% 100% 100% 100% 100% 100% 100% 100% 100% 100% 100% 100% 100% 100% 100% 100% 100% 100% 100% 100% 100%

Page 7
QuickQuery
Fielding Period: January 13-16, 2018
HCAPS (Filtered on Registered Voters)
Weighted To The U.S. General Adult Population - Propensity
18 Jan 2018
Table 4
S1 Are you over 18 years of age and registered to vote?
Base: All Respondents
Presidential
Election Candidate
Gender Age Ethnicity Political Party Political Ideology Voted For Education Locale Income
_____________ ______________________ _______________________ ____________________ ____________________ _____________________ _____________ ________________ _________
Colle- Some
Cons- ge Gr- Colle- $75K Less
Hisp- Black Repub- Democ- Indep- Libe- Mode- erva- 3rd ad And ge Or Urb- Subu- Or Than
Total Male Female 18-34 35-49 50-64 65+ White anic /AA Other lican rat endent ral rate tive Clinton Trump Party Higher Less an rban Rural More $75K
______ _____ _______ _____ _____ _____ ____ _____ _____ _____ _____ ______ ______ ______ ______ ______ ______ ________ ______ _____ ______ ______ ____ _____ _____ ____ ____
Unweighted Base 1962 882 1080 384 500 636 442 1530 136 183 39 600 711 571 518 818 626 731 698 184 700 1262 519 952 491 577 1275
Weighted Base 1962 942 1020 502 467 580 414 1315 261 221 75 605 722 564 523 834 605 759 680 181 670 1292 545 1001 415 811 1039
Effective Base 1157 573 585 220 294 390 295 974 90 119 28 385 404 332 294 468 401 424 438 101 434 728 315 555 298 384 744
Yes 1962 942 1020 502 467 580 414 1315 261 221 75 605 722 564 523 834 605 759 680 181 670 1292 545 1001 415 811 1039
100% 100% 100% 100% 100% 100% 100% 100% 100% 100% 100% 100% 100% 100% 100% 100% 100% 100% 100% 100% 100% 100% 100% 100% 100% 100% 100%
No - - - - - - - - - - - - - - - - - - - - - - - - - - -
- - - - - - - - - - - - - - - - - - - - - - - - - - -
Sigma 1962 942 1020 502 467 580 414 1315 261 221 75 605 722 564 523 834 605 759 680 181 670 1292 545 1001 415 811 1039
100% 100% 100% 100% 100% 100% 100% 100% 100% 100% 100% 100% 100% 100% 100% 100% 100% 100% 100% 100% 100% 100% 100% 100% 100% 100% 100%
Page 8
QuickQuery
Fielding Period: January 13-16, 2018
HCAPS (Filtered on Registered Voters)
Weighted To The U.S. General Adult Population - Propensity
18 Jan 2018
Table 5
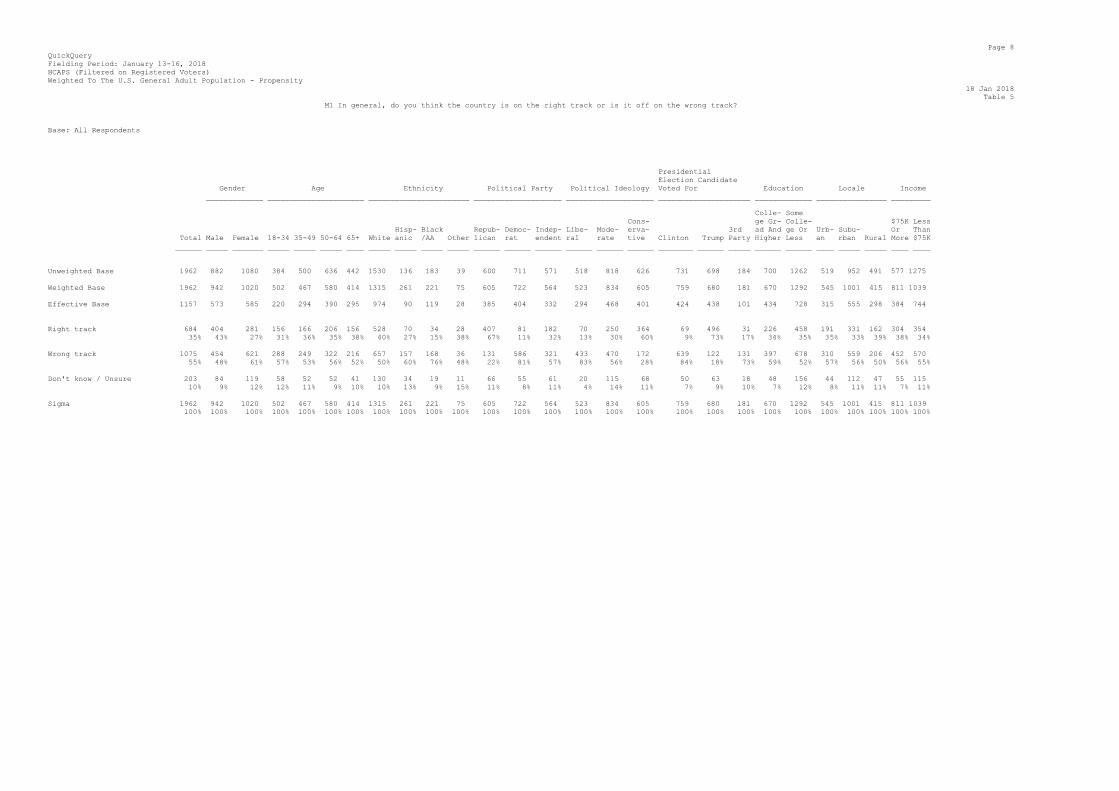
M1 In general, do you think the country is on the right track or is it off on the wrong track?
Base: All Respondents
Presidential
Election Candidate
Gender Age Ethnicity Political Party Political Ideology Voted For Education Locale Income
_____________ ______________________ _______________________ ____________________ ____________________ _____________________ _____________ ________________ _________
Colle- Some
Cons- ge Gr- Colle- $75K Less
Hisp- Black Repub- Democ- Indep- Libe- Mode- erva- 3rd ad And ge Or Urb- Subu- Or Than
Total Male Female 18-34 35-49 50-64 65+ White anic /AA Other lican rat endent ral rate tive Clinton Trump Party Higher Less an rban Rural More $75K
______ _____ _______ _____ _____ _____ ____ _____ _____ _____ _____ ______ ______ ______ ______ ______ ______ ________ ______ _____ ______ ______ ____ _____ _____ ____ ____
Unweighted Base 1962 882 1080 384 500 636 442 1530 136 183 39 600 711 571 518 818 626 731 698 184 700 1262 519 952 491 577 1275
Weighted Base 1962 942 1020 502 467 580 414 1315 261 221 75 605 722 564 523 834 605 759 680 181 670 1292 545 1001 415 811 1039
Effective Base 1157 573 585 220 294 390 295 974 90 119 28 385 404 332 294 468 401 424 438 101 434 728 315 555 298 384 744
Right track 684 404 281 156 166 206 156 528 70 34 28 407 81 182 70 250 364 69 496 31 226 458 191 331 162 304 354
35% 43% 27% 31% 36% 35% 38% 40% 27% 15% 38% 67% 11% 32% 13% 30% 60% 9% 73% 17% 34% 35% 35% 33% 39% 38% 34%
Wrong track 1075 454 621 288 249 322 216 657 157 168 36 131 586 321 433 470 172 639 122 131 397 678 310 559 206 452 570
55% 48% 61% 57% 53% 56% 52% 50% 60% 76% 48% 22% 81% 57% 83% 56% 28% 84% 18% 73% 59% 52% 57% 56% 50% 56% 55%
Don't know / Unsure 203 84 119 58 52 52 41 130 34 19 11 66 55 61 20 115 68 50 63 18 48 156 44 112 47 55 115
10% 9% 12% 12% 11% 9% 10% 10% 13% 9% 15% 11% 8% 11% 4% 14% 11% 7% 9% 10% 7% 12% 8% 11% 11% 7% 11%
Sigma 1962 942 1020 502 467 580 414 1315 261 221 75 605 722 564 523 834 605 759 680 181 670 1292 545 1001 415 811 1039
100% 100% 100% 100% 100% 100% 100% 100% 100% 100% 100% 100% 100% 100% 100% 100% 100% 100% 100% 100% 100% 100% 100% 100% 100% 100% 100%

Page 9
QuickQuery
Fielding Period: January 13-16, 2018
HCAPS (Filtered on Registered Voters)
Weighted To The U.S. General Adult Population - Propensity
18 Jan 2018
Table 6
M2 In general, do you think the American economy is on right track or is it off on the wrong track?
Base: All Respondents
Presidential
Election Candidate
Gender Age Ethnicity Political Party Political Ideology Voted For Education Locale Income
_____________ ______________________ _______________________ ____________________ ____________________ _____________________ _____________ ________________ _________
Colle- Some
Cons- ge Gr- Colle- $75K Less
Hisp- Black Repub- Democ- Indep- Libe- Mode- erva- 3rd ad And ge Or Urb- Subu- Or Than
Total Male Female 18-34 35-49 50-64 65+ White anic /AA Other lican rat endent ral rate tive Clinton Trump Party Higher Less an rban Rural More $75K
______ _____ _______ _____ _____ _____ ____ _____ _____ _____ _____ ______ ______ ______ ______ ______ ______ ________ ______ _____ ______ ______ ____ _____ _____ ____ ____
Unweighted Base 1962 882 1080 384 500 636 442 1530 136 183 39 600 711 571 518 818 626 731 698 184 700 1262 519 952 491 577 1275
Weighted Base 1962 942 1020 502 467 580 414 1315 261 221 75 605 722 564 523 834 605 759 680 181 670 1292 545 1001 415 811 1039
Effective Base 1157 573 585 220 294 390 295 974 90 119 28 385 404 332 294 468 401 424 438 101 434 728 315 555 298 384 744
Right track 1008 580 429 217 221 318 253 754 121 55 39 488 205 292 155 391 463 239 569 74 381 627 264 522 222 477 478
51% 62% 42% 43% 47% 55% 61% 57% 46% 25% 52% 81% 28% 52% 30% 47% 77% 32% 84% 41% 57% 49% 48% 52% 53% 59% 46%
Wrong track 683 256 427 207 177 186 113 400 100 127 34 72 395 194 286 300 96 393 74 82 207 477 205 341 137 240 413
35% 27% 42% 41% 38% 32% 27% 30% 38% 58% 46% 12% 55% 34% 55% 36% 16% 52% 11% 45% 31% 37% 38% 34% 33% 30% 40%
Don't know / Unsure 270 106 165 78 69 76 48 161 40 39 2 45 122 79 81 143 46 126 37 25 83 188 76 138 57 93 148
14% 11% 16% 15% 15% 13% 12% 12% 15% 18% 2% 7% 17% 14% 16% 17% 8% 17% 5% 14% 12% 15% 14% 14% 14% 12% 14%
Sigma 1962 942 1020 502 467 580 414 1315 261 221 75 605 722 564 523 834 605 759 680 181 670 1292 545 1001 415 811 1039
100% 100% 100% 100% 100% 100% 100% 100% 100% 100% 100% 100% 100% 100% 100% 100% 100% 100% 100% 100% 100% 100% 100% 100% 100% 100% 100%

Page 10
QuickQuery
Fielding Period: January 13-16, 2018
HCAPS (Filtered on Registered Voters)
Weighted To The U.S. General Adult Population - Propensity
18 Jan 2018
Table 7
M3 Do you approve or disapprove of the job Donald Trump is doing as President of the United States?
Base: All Respondents
Presidential
Election Candidate
Gender Age Ethnicity Political Party Political Ideology Voted For Education Locale Income
_____________ ______________________ _______________________ ____________________ ____________________ _____________________ _____________ ________________ _________
Colle- Some
Cons- ge Gr- Colle- $75K Less
Hisp- Black Repub- Democ- Indep- Libe- Mode- erva- 3rd ad And ge Or Urb- Subu- Or Than
Total Male Female 18-34 35-49 50-64 65+ White anic /AA Other lican rat endent ral rate tive Clinton Trump Party Higher Less an rban Rural More $75K
______ _____ _______ _____ _____ _____ ____ _____ _____ _____ _____ ______ ______ ______ ______ ______ ______ ________ ______ _____ ______ ______ ____ _____ _____ ____ ____
Unweighted Base 1962 882 1080 384 500 636 442 1530 136 183 39 600 711 571 518 818 626 731 698 184 700 1262 519 952 491 577 1275
Weighted Base 1962 942 1020 502 467 580 414 1315 261 221 75 605 722 564 523 834 605 759 680 181 670 1292 545 1001 415 811 1039
Effective Base 1157 573 585 220 294 390 295 974 90 119 28 385 404 332 294 468 401 424 438 101 434 728 315 555 298 384 744
Strongly/Somewhat Approve 833 471 363 178 210 260 186 657 77 28 43 500 71 230 67 299 467 40 600 49 260 573 210 410 213 339 440
(Net) 42% 50% 36% 35% 45% 45% 45% 50% 30% 12% 57% 83% 10% 41% 13% 36% 77% 5% 88% 27% 39% 44% 39% 41% 51% 42% 42%
Strongly approve 367 227 140 66 80 116 105 313 22 7 15 274 14 70 29 82 256 6 316 6 113 254 98 177 93 152 197
19% 24% 14% 13% 17% 20% 25% 24% 8% 3% 20% 45% 2% 12% 6% 10% 42% 1% 47% 3% 17% 20% 18% 18% 22% 19% 19%
Somewhat approve 467 244 223 112 129 144 81 344 56 20 27 226 57 159 38 217 212 35 284 43 147 320 113 234 120 187 243
24% 26% 22% 22% 28% 25% 20% 26% 21% 9% 36% 37% 8% 28% 7% 26% 35% 5% 42% 24% 22% 25% 21% 23% 29% 23% 23%
Strongly/Somewhat Disapprove 1129 471 658 324 257 320 228 658 184 193 33 104 651 335 456 535 138 719 80 132 410 718 335 591 202 472 599
(Net) 58% 50% 64% 65% 55% 55% 55% 50% 70% 88% 43% 17% 90% 59% 87% 64% 23% 95% 12% 73% 61% 56% 61% 59% 49% 58% 58%
Somewhat disapprove 280 123 156 84 69 75 51 178 45 38 4 68 104 96 39 167 73 102 63 50 95 185 73 155 52 126 139
14% 13% 15% 17% 15% 13% 12% 14% 17% 17% 5% 11% 14% 17% 8% 20% 12% 13% 9% 27% 14% 14% 13% 15% 12% 16% 13%
Strongly disapprove 849 348 501 240 188 244 177 480 139 155 29 36 547 239 417 368 65 617 17 82 316 533 262 436 151 345 461
43% 37% 49% 48% 40% 42% 43% 36% 53% 70% 39% 6% 76% 42% 80% 44% 11% 81% 3% 45% 47% 41% 48% 44% 36% 43% 44%
Sigma 1962 942 1020 502 467 580 414 1315 261 221 75 605 722 564 523 834 605 759 680 181 670 1292 545 1001 415 811 1039
100% 100% 100% 100% 100% 100% 100% 100% 100% 100% 100% 100% 100% 100% 100% 100% 100% 100% 100% 100% 100% 100% 100% 100% 100% 100% 100%

Page 11
QuickQuery
Fielding Period: January 13-16, 2018
HCAPS (Filtered on Registered Voters)
Weighted To The U.S. General Adult Population - Propensity
18 Jan 2018
Table 8
M3A Do you approve or disapprove of the job President Trump is doing on ...?
Summary Of Approve
Base: All Respondents
Presidential
Election Candidate
Gender Age Ethnicity Political Party Political Ideology Voted For Education Locale Income
_____________ ______________________ _______________________ ____________________ ____________________ _____________________ _____________ ________________ _________
Colle- Some
Cons- ge Gr- Colle- $75K Less
Hisp- Black Repub- Democ- Indep- Libe- Mode- erva- 3rd ad And ge Or Urb- Subu- Or Than
Total Male Female 18-34 35-49 50-64 65+ White anic /AA Other lican rat endent ral rate tive Clinton Trump Party Higher Less an rban Rural More $75K
______ _____ _______ _____ _____ _____ ____ _____ _____ _____ _____ ______ ______ ______ ______ ______ ______ ________ ______ _____ ______ ______ ____ _____ _____ ____ ____
Unweighted Base 1962 882 1080 384 500 636 442 1530 136 183 39 600 711 571 518 818 626 731 698 184 700 1262 519 952 491 577 1275
Weighted Base 1962 942 1020 502 467 580 414 1315 261 221 75 605 722 564 523 834 605 759 680 181 670 1292 545 1001 415 811 1039
Effective Base 1157 573 585 220 294 390 295 974 90 119 28 385 404 332 294 468 401 424 438 101 434 728 315 555 298 384 744
Stimulating jobs 1062 597 464 245 251 331 235 819 100 56 42 552 171 302 121 414 527 152 634 91 362 699 270 541 251 462 532
54% 63% 46% 49% 54% 57% 57% 62% 38% 25% 56% 91% 24% 54% 23% 50% 87% 20% 93% 50% 54% 54% 49% 54% 60% 57% 51%
The economy 1058 598 460 248 246 321 243 820 111 47 43 553 171 299 134 413 511 165 636 91 351 707 270 542 246 473 517
54% 64% 45% 49% 53% 55% 59% 62% 42% 21% 57% 92% 24% 53% 26% 50% 85% 22% 93% 50% 52% 55% 50% 54% 59% 58% 50%
Fighting terrorism 982 552 430 204 231 325 222 763 88 49 46 527 137 286 84 398 500 115 619 79 324 659 259 484 240 409 509
50% 59% 42% 41% 50% 56% 54% 58% 34% 22% 61% 87% 19% 51% 16% 48% 83% 15% 91% 44% 48% 51% 47% 48% 58% 50% 49%
Immigration 843 476 368 156 208 281 197 670 75 30 39 499 82 232 67 309 467 53 605 58 264 579 202 421 220 343 444
43% 50% 36% 31% 45% 49% 48% 51% 29% 14% 52% 83% 11% 41% 13% 37% 77% 7% 89% 32% 39% 45% 37% 42% 53% 42% 43%
Foreign affairs 778 444 334 175 187 241 176 612 69 32 37 461 74 215 59 288 431 57 553 51 241 537 210 369 199 323 402
40% 47% 33% 35% 40% 42% 42% 47% 27% 15% 50% 76% 10% 38% 11% 35% 71% 8% 81% 28% 36% 42% 38% 37% 48% 40% 39%
Administering the government 761 422 339 166 185 242 168 609 68 23 34 457 69 206 61 278 422 45 542 43 235 526 194 365 202 318 401
39% 45% 33% 33% 40% 42% 41% 46% 26% 11% 45% 76% 10% 37% 12% 33% 70% 6% 80% 24% 35% 41% 36% 36% 49% 39% 39%

Page 12
QuickQuery
Fielding Period: January 13-16, 2018
HCAPS (Filtered on Registered Voters)
Weighted To The U.S. General Adult Population - Propensity
18 Jan 2018
Table 9
M3A Do you approve or disapprove of the job President Trump is doing on ...?
Summary Of Disapprove
Base: All Respondents
Presidential
Election Candidate
Gender Age Ethnicity Political Party Political Ideology Voted For Education Locale Income
_____________ ______________________ _______________________ ____________________ ____________________ _____________________ _____________ ________________ _________
Colle- Some
Cons- ge Gr- Colle- $75K Less
Hisp- Black Repub- Democ- Indep- Libe- Mode- erva- 3rd ad And ge Or Urb- Subu- Or Than
Total Male Female 18-34 35-49 50-64 65+ White anic /AA Other lican rat endent ral rate tive Clinton Trump Party Higher Less an rban Rural More $75K
______ _____ _______ _____ _____ _____ ____ _____ _____ _____ _____ ______ ______ ______ ______ ______ ______ ________ ______ _____ ______ ______ ____ _____ _____ ____ ____
Unweighted Base 1962 882 1080 384 500 636 442 1530 136 183 39 600 711 571 518 818 626 731 698 184 700 1262 519 952 491 577 1275
Weighted Base 1962 942 1020 502 467 580 414 1315 261 221 75 605 722 564 523 834 605 759 680 181 670 1292 545 1001 415 811 1039
Effective Base 1157 573 585 220 294 390 295 974 90 119 28 385 404 332 294 468 401 424 438 101 434 728 315 555 298 384 744
Administering the government 1201 520 681 336 281 338 246 706 193 197 42 147 653 358 461 557 183 714 139 137 436 765 351 636 214 493 638
61% 55% 67% 67% 60% 58% 59% 54% 74% 89% 55% 24% 90% 63% 88% 67% 30% 94% 20% 76% 65% 59% 64% 64% 51% 61% 61%
Foreign affairs 1184 497 686 326 280 339 238 702 192 189 38 144 648 350 463 546 174 702 127 130 429 754 336 632 216 487 637
60% 53% 67% 65% 60% 58% 58% 53% 73% 85% 50% 24% 90% 62% 89% 65% 29% 92% 19% 72% 64% 58% 62% 63% 52% 60% 61%
Immigration 1119 466 653 346 258 298 217 645 186 191 36 106 640 332 456 525 138 706 75 123 406 713 343 580 195 468 595
57% 50% 64% 69% 55% 51% 52% 49% 71% 86% 48% 17% 89% 59% 87% 63% 23% 93% 11% 68% 61% 55% 63% 58% 47% 58% 57%
Fighting terrorism 980 389 590 298 235 255 191 552 174 172 29 78 585 279 438 437 105 644 62 101 347 633 287 518 175 402 531
50% 41% 58% 59% 50% 44% 46% 42% 66% 78% 39% 13% 81% 49% 84% 52% 17% 85% 9% 56% 52% 49% 53% 52% 42% 50% 51%
The economy 904 344 560 253 221 259 170 494 150 174 33 51 551 265 389 421 93 594 45 90 319 585 275 459 170 338 522
46% 36% 55% 51% 47% 45% 41% 38% 58% 79% 43% 8% 76% 47% 74% 50% 15% 78% 7% 50% 48% 45% 50% 46% 41% 42% 50%
Stimulating jobs 900 345 556 257 216 249 179 495 161 165 33 52 551 262 402 420 78 607 47 90 308 592 276 461 164 348 507
46% 37% 54% 51% 46% 43% 43% 38% 62% 75% 44% 9% 76% 46% 77% 50% 13% 80% 7% 50% 46% 46% 51% 46% 40% 43% 49%

Page 13
QuickQuery
Fielding Period: January 13-16, 2018
HCAPS (Filtered on Registered Voters)
Weighted To The U.S. General Adult Population - Propensity
18 Jan 2018
Table 10
M3A_1 Do you approve or disapprove of the job President Trump is doing on ...?
The economy
Base: All Respondents
Presidential
Election Candidate
Gender Age Ethnicity Political Party Political Ideology Voted For Education Locale Income
_____________ ______________________ _______________________ ____________________ ____________________ _____________________ _____________ ________________ _________
Colle- Some
Cons- ge Gr- Colle- $75K Less
Hisp- Black Repub- Democ- Indep- Libe- Mode- erva- 3rd ad And ge Or Urb- Subu- Or Than
Total Male Female 18-34 35-49 50-64 65+ White anic /AA Other lican rat endent ral rate tive Clinton Trump Party Higher Less an rban Rural More $75K
______ _____ _______ _____ _____ _____ ____ _____ _____ _____ _____ ______ ______ ______ ______ ______ ______ ________ ______ _____ ______ ______ ____ _____ _____ ____ ____
Unweighted Base 1962 882 1080 384 500 636 442 1530 136 183 39 600 711 571 518 818 626 731 698 184 700 1262 519 952 491 577 1275
Weighted Base 1962 942 1020 502 467 580 414 1315 261 221 75 605 722 564 523 834 605 759 680 181 670 1292 545 1001 415 811 1039
Effective Base 1157 573 585 220 294 390 295 974 90 119 28 385 404 332 294 468 401 424 438 101 434 728 315 555 298 384 744
Approve (Net) 1058 598 460 248 246 321 243 820 111 47 43 553 171 299 134 413 511 165 636 91 351 707 270 542 246 473 517
54% 64% 45% 49% 53% 55% 59% 62% 42% 21% 57% 92% 24% 53% 26% 50% 85% 22% 93% 50% 52% 55% 50% 54% 59% 58% 50%
Strongly approve 548 343 205 95 131 178 144 446 39 12 31 354 27 147 34 168 346 26 425 30 191 357 131 276 141 261 254
28% 36% 20% 19% 28% 31% 35% 34% 15% 6% 41% 59% 4% 26% 6% 20% 57% 3% 63% 17% 29% 28% 24% 28% 34% 32% 24%
Somewhat approve 510 255 255 153 115 143 99 374 72 34 12 199 144 152 100 245 165 139 210 61 160 350 139 266 105 211 263
26% 27% 25% 31% 25% 25% 24% 28% 27% 16% 16% 33% 20% 27% 19% 29% 27% 18% 31% 34% 24% 27% 26% 27% 25% 26% 25%
Disapprove (Net) 904 344 560 253 221 259 170 494 150 174 33 51 551 265 389 421 93 594 45 90 319 585 275 459 170 338 522
46% 36% 55% 51% 47% 45% 41% 38% 58% 79% 43% 8% 76% 47% 74% 50% 15% 78% 7% 50% 48% 45% 50% 46% 41% 42% 50%
Somewhat disapprove 364 142 222 85 89 116 73 213 53 62 8 37 194 117 117 195 52 195 37 42 140 224 96 198 70 132 214
19% 15% 22% 17% 19% 20% 18% 16% 20% 28% 11% 6% 27% 21% 22% 23% 9% 26% 5% 23% 21% 17% 18% 20% 17% 16% 21%
Strongly disapprove 540 201 339 168 132 143 97 282 97 112 24 14 358 148 272 226 42 399 7 48 179 361 179 261 100 206 308
28% 21% 33% 33% 28% 25% 23% 21% 37% 51% 32% 2% 50% 26% 52% 27% 7% 53% 1% 26% 27% 28% 33% 26% 24% 25% 30%
Sigma 1962 942 1020 502 467 580 414 1315 261 221 75 605 722 564 523 834 605 759 680 181 670 1292 545 1001 415 811 1039
100% 100% 100% 100% 100% 100% 100% 100% 100% 100% 100% 100% 100% 100% 100% 100% 100% 100% 100% 100% 100% 100% 100% 100% 100% 100% 100%
Page 14
QuickQuery
Fielding Period: January 13-16, 2018
HCAPS (Filtered on Registered Voters)
Weighted To The U.S. General Adult Population - Propensity
18 Jan 2018
Table 11
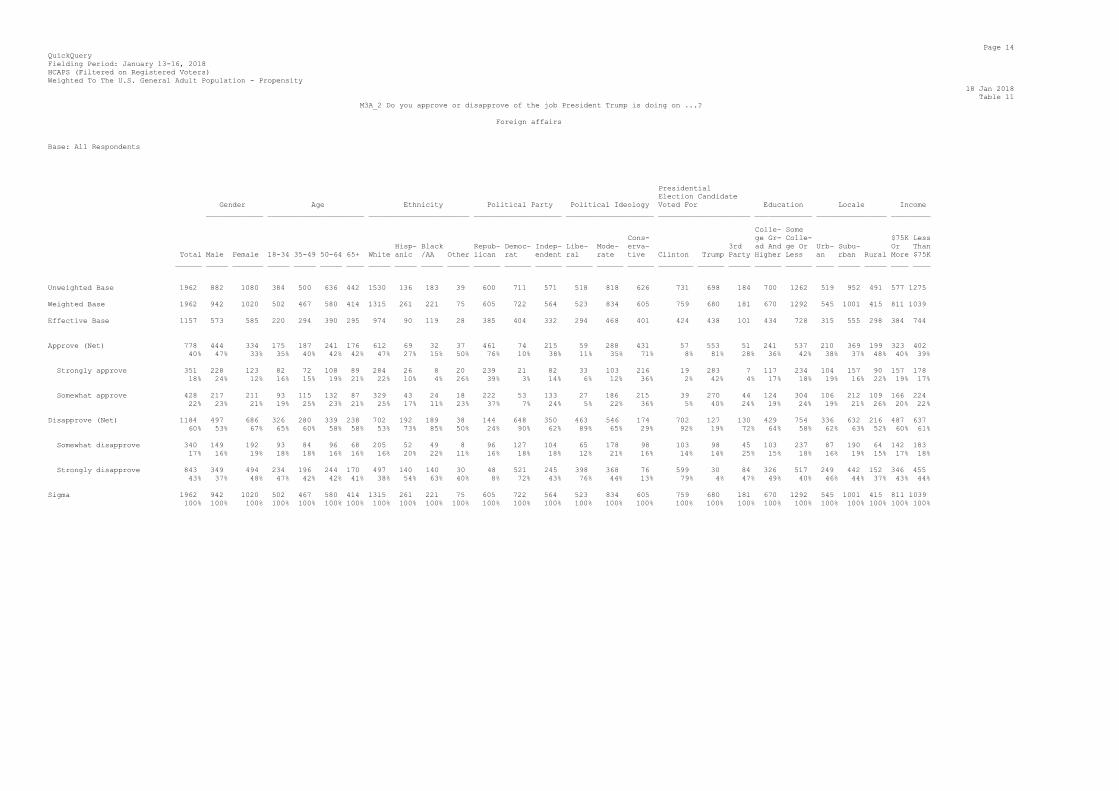
M3A_2 Do you approve or disapprove of the job President Trump is doing on ...?
Foreign affairs
Base: All Respondents
Presidential
Election Candidate
Gender Age Ethnicity Political Party Political Ideology Voted For Education Locale Income
_____________ ______________________ _______________________ ____________________ ____________________ _____________________ _____________ ________________ _________
Colle- Some
Cons- ge Gr- Colle- $75K Less
Hisp- Black Repub- Democ- Indep- Libe- Mode- erva- 3rd ad And ge Or Urb- Subu- Or Than
Total Male Female 18-34 35-49 50-64 65+ White anic /AA Other lican rat endent ral rate tive Clinton Trump Party Higher Less an rban Rural More $75K
______ _____ _______ _____ _____ _____ ____ _____ _____ _____ _____ ______ ______ ______ ______ ______ ______ ________ ______ _____ ______ ______ ____ _____ _____ ____ ____
Unweighted Base 1962 882 1080 384 500 636 442 1530 136 183 39 600 711 571 518 818 626 731 698 184 700 1262 519 952 491 577 1275
Weighted Base 1962 942 1020 502 467 580 414 1315 261 221 75 605 722 564 523 834 605 759 680 181 670 1292 545 1001 415 811 1039
Effective Base 1157 573 585 220 294 390 295 974 90 119 28 385 404 332 294 468 401 424 438 101 434 728 315 555 298 384 744
Approve (Net) 778 444 334 175 187 241 176 612 69 32 37 461 74 215 59 288 431 57 553 51 241 537 210 369 199 323 402
40% 47% 33% 35% 40% 42% 42% 47% 27% 15% 50% 76% 10% 38% 11% 35% 71% 8% 81% 28% 36% 42% 38% 37% 48% 40% 39%
Strongly approve 351 228 123 82 72 108 89 284 26 8 20 239 21 82 33 103 216 19 283 7 117 234 104 157 90 157 178
18% 24% 12% 16% 15% 19% 21% 22% 10% 4% 26% 39% 3% 14% 6% 12% 36% 2% 42% 4% 17% 18% 19% 16% 22% 19% 17%
Somewhat approve 428 217 211 93 115 132 87 329 43 24 18 222 53 133 27 186 215 39 270 44 124 304 106 212 109 166 224
22% 23% 21% 19% 25% 23% 21% 25% 17% 11% 23% 37% 7% 24% 5% 22% 36% 5% 40% 24% 19% 24% 19% 21% 26% 20% 22%
Disapprove (Net) 1184 497 686 326 280 339 238 702 192 189 38 144 648 350 463 546 174 702 127 130 429 754 336 632 216 487 637
60% 53% 67% 65% 60% 58% 58% 53% 73% 85% 50% 24% 90% 62% 89% 65% 29% 92% 19% 72% 64% 58% 62% 63% 52% 60% 61%
Somewhat disapprove 340 149 192 93 84 96 68 205 52 49 8 96 127 104 65 178 98 103 98 45 103 237 87 190 64 142 183
17% 16% 19% 18% 18% 16% 16% 16% 20% 22% 11% 16% 18% 18% 12% 21% 16% 14% 14% 25% 15% 18% 16% 19% 15% 17% 18%
Strongly disapprove 843 349 494 234 196 244 170 497 140 140 30 48 521 245 398 368 76 599 30 84 326 517 249 442 152 346 455
43% 37% 48% 47% 42% 42% 41% 38% 54% 63% 40% 8% 72% 43% 76% 44% 13% 79% 4% 47% 49% 40% 46% 44% 37% 43% 44%
Sigma 1962 942 1020 502 467 580 414 1315 261 221 75 605 722 564 523 834 605 759 680 181 670 1292 545 1001 415 811 1039
100% 100% 100% 100% 100% 100% 100% 100% 100% 100% 100% 100% 100% 100% 100% 100% 100% 100% 100% 100% 100% 100% 100% 100% 100% 100% 100%
Page 15
QuickQuery
Fielding Period: January 13-16, 2018
HCAPS (Filtered on Registered Voters)
Weighted To The U.S. General Adult Population - Propensity
18 Jan 2018
Table 12
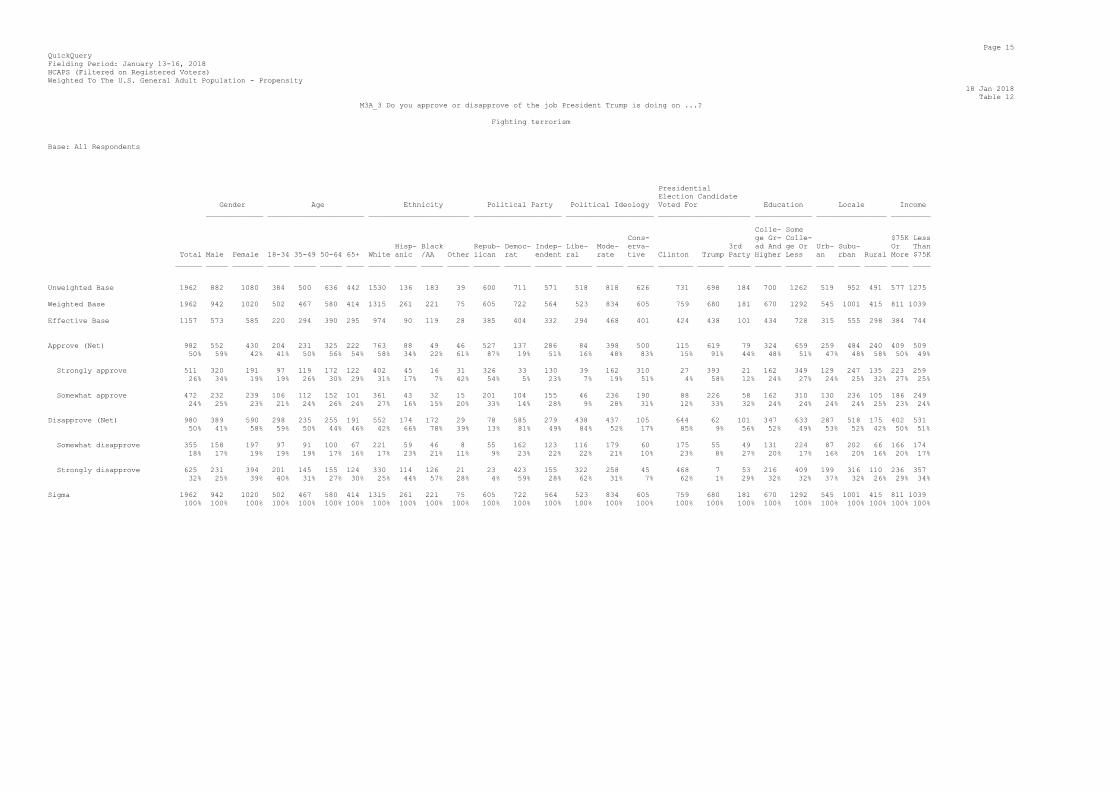
M3A_3 Do you approve or disapprove of the job President Trump is doing on ...?
Fighting terrorism
Base: All Respondents
Presidential
Election Candidate
Gender Age Ethnicity Political Party Political Ideology Voted For Education Locale Income
_____________ ______________________ _______________________ ____________________ ____________________ _____________________ _____________ ________________ _________
Colle- Some
Cons- ge Gr- Colle- $75K Less
Hisp- Black Repub- Democ- Indep- Libe- Mode- erva- 3rd ad And ge Or Urb- Subu- Or Than
Total Male Female 18-34 35-49 50-64 65+ White anic /AA Other lican rat endent ral rate tive Clinton Trump Party Higher Less an rban Rural More $75K
______ _____ _______ _____ _____ _____ ____ _____ _____ _____ _____ ______ ______ ______ ______ ______ ______ ________ ______ _____ ______ ______ ____ _____ _____ ____ ____
Unweighted Base 1962 882 1080 384 500 636 442 1530 136 183 39 600 711 571 518 818 626 731 698 184 700 1262 519 952 491 577 1275
Weighted Base 1962 942 1020 502 467 580 414 1315 261 221 75 605 722 564 523 834 605 759 680 181 670 1292 545 1001 415 811 1039
Effective Base 1157 573 585 220 294 390 295 974 90 119 28 385 404 332 294 468 401 424 438 101 434 728 315 555 298 384 744
Approve (Net) 982 552 430 204 231 325 222 763 88 49 46 527 137 286 84 398 500 115 619 79 324 659 259 484 240 409 509
50% 59% 42% 41% 50% 56% 54% 58% 34% 22% 61% 87% 19% 51% 16% 48% 83% 15% 91% 44% 48% 51% 47% 48% 58% 50% 49%
Strongly approve 511 320 191 97 119 172 122 402 45 16 31 326 33 130 39 162 310 27 393 21 162 349 129 247 135 223 259
26% 34% 19% 19% 26% 30% 29% 31% 17% 7% 42% 54% 5% 23% 7% 19% 51% 4% 58% 12% 24% 27% 24% 25% 32% 27% 25%
Somewhat approve 472 232 239 106 112 152 101 361 43 32 15 201 104 155 46 236 190 88 226 58 162 310 130 236 105 186 249
24% 25% 23% 21% 24% 26% 24% 27% 16% 15% 20% 33% 14% 28% 9% 28% 31% 12% 33% 32% 24% 24% 24% 24% 25% 23% 24%
Disapprove (Net) 980 389 590 298 235 255 191 552 174 172 29 78 585 279 438 437 105 644 62 101 347 633 287 518 175 402 531
50% 41% 58% 59% 50% 44% 46% 42% 66% 78% 39% 13% 81% 49% 84% 52% 17% 85% 9% 56% 52% 49% 53% 52% 42% 50% 51%
Somewhat disapprove 355 158 197 97 91 100 67 221 59 46 8 55 162 123 116 179 60 175 55 49 131 224 87 202 66 166 174
18% 17% 19% 19% 19% 17% 16% 17% 23% 21% 11% 9% 23% 22% 22% 21% 10% 23% 8% 27% 20% 17% 16% 20% 16% 20% 17%
Strongly disapprove 625 231 394 201 145 155 124 330 114 126 21 23 423 155 322 258 45 468 7 53 216 409 199 316 110 236 357
32% 25% 39% 40% 31% 27% 30% 25% 44% 57% 28% 4% 59% 28% 62% 31% 7% 62% 1% 29% 32% 32% 37% 32% 26% 29% 34%
Sigma 1962 942 1020 502 467 580 414 1315 261 221 75 605 722 564 523 834 605 759 680 181 670 1292 545 1001 415 811 1039
100% 100% 100% 100% 100% 100% 100% 100% 100% 100% 100% 100% 100% 100% 100% 100% 100% 100% 100% 100% 100% 100% 100% 100% 100% 100% 100%

Page 16
QuickQuery
Fielding Period: January 13-16, 2018
HCAPS (Filtered on Registered Voters)
Weighted To The U.S. General Adult Population - Propensity
18 Jan 2018
Table 13
M3A_4 Do you approve or disapprove of the job President Trump is doing on ...?
Administering the government
Base: All Respondents
Presidential
Election Candidate
Gender Age Ethnicity Political Party Political Ideology Voted For Education Locale Income
_____________ ______________________ _______________________ ____________________ ____________________ _____________________ _____________ ________________ _________
Colle- Some
Cons- ge Gr- Colle- $75K Less
Hisp- Black Repub- Democ- Indep- Libe- Mode- erva- 3rd ad And ge Or Urb- Subu- Or Than
Total Male Female 18-34 35-49 50-64 65+ White anic /AA Other lican rat endent ral rate tive Clinton Trump Party Higher Less an rban Rural More $75K
______ _____ _______ _____ _____ _____ ____ _____ _____ _____ _____ ______ ______ ______ ______ ______ ______ ________ ______ _____ ______ ______ ____ _____ _____ ____ ____
Unweighted Base 1962 882 1080 384 500 636 442 1530 136 183 39 600 711 571 518 818 626 731 698 184 700 1262 519 952 491 577 1275
Weighted Base 1962 942 1020 502 467 580 414 1315 261 221 75 605 722 564 523 834 605 759 680 181 670 1292 545 1001 415 811 1039
Effective Base 1157 573 585 220 294 390 295 974 90 119 28 385 404 332 294 468 401 424 438 101 434 728 315 555 298 384 744
Approve (Net) 761 422 339 166 185 242 168 609 68 23 34 457 69 206 61 278 422 45 542 43 235 526 194 365 202 318 401
39% 45% 33% 33% 40% 42% 41% 46% 26% 11% 45% 76% 10% 37% 12% 33% 70% 6% 80% 24% 35% 41% 36% 36% 49% 39% 39%
Strongly approve 313 184 129 67 69 94 83 256 22 8 15 228 15 64 27 79 208 17 260 3 101 212 92 144 77 141 156
16% 20% 13% 13% 15% 16% 20% 19% 9% 4% 20% 38% 2% 11% 5% 9% 34% 2% 38% 2% 15% 16% 17% 14% 19% 17% 15%
Somewhat approve 448 237 210 99 117 148 85 353 46 16 19 229 54 143 35 199 214 28 282 40 134 314 102 222 124 177 244
23% 25% 21% 20% 25% 25% 20% 27% 18% 7% 25% 38% 7% 25% 7% 24% 35% 4% 41% 22% 20% 24% 19% 22% 30% 22% 23%
Disapprove (Net) 1201 520 681 336 281 338 246 706 193 197 42 147 653 358 461 557 183 714 139 137 436 765 351 636 214 493 638
61% 55% 67% 67% 60% 58% 59% 54% 74% 89% 55% 24% 90% 63% 88% 67% 30% 94% 20% 76% 65% 59% 64% 64% 51% 61% 61%
Somewhat disapprove 371 169 202 116 94 94 67 228 56 54 12 109 129 114 59 194 118 123 113 51 123 247 105 201 65 159 186
19% 18% 20% 23% 20% 16% 16% 17% 21% 25% 16% 18% 18% 20% 11% 23% 19% 16% 17% 28% 18% 19% 19% 20% 16% 20% 18%
Strongly disapprove 830 351 479 220 187 244 179 477 137 143 30 38 524 244 402 363 65 592 26 87 312 518 247 435 149 334 452
42% 37% 47% 44% 40% 42% 43% 36% 52% 65% 40% 6% 73% 43% 77% 43% 11% 78% 4% 48% 47% 40% 45% 43% 36% 41% 44%
Sigma 1962 942 1020 502 467 580 414 1315 261 221 75 605 722 564 523 834 605 759 680 181 670 1292 545 1001 415 811 1039
100% 100% 100% 100% 100% 100% 100% 100% 100% 100% 100% 100% 100% 100% 100% 100% 100% 100% 100% 100% 100% 100% 100% 100% 100% 100% 100%

Page 17
QuickQuery
Fielding Period: January 13-16, 2018
HCAPS (Filtered on Registered Voters)
Weighted To The U.S. General Adult Population - Propensity
18 Jan 2018
Table 14
M3A_5 Do you approve or disapprove of the job President Trump is doing on ...?
Stimulating jobs
Base: All Respondents
Presidential
Election Candidate
Gender Age Ethnicity Political Party Political Ideology Voted For Education Locale Income
_____________ ______________________ _______________________ ____________________ ____________________ _____________________ _____________ ________________ _________
Colle- Some
Cons- ge Gr- Colle- $75K Less
Hisp- Black Repub- Democ- Indep- Libe- Mode- erva- 3rd ad And ge Or Urb- Subu- Or Than
Total Male Female 18-34 35-49 50-64 65+ White anic /AA Other lican rat endent ral rate tive Clinton Trump Party Higher Less an rban Rural More $75K
______ _____ _______ _____ _____ _____ ____ _____ _____ _____ _____ ______ ______ ______ ______ ______ ______ ________ ______ _____ ______ ______ ____ _____ _____ ____ ____
Unweighted Base 1962 882 1080 384 500 636 442 1530 136 183 39 600 711 571 518 818 626 731 698 184 700 1262 519 952 491 577 1275
Weighted Base 1962 942 1020 502 467 580 414 1315 261 221 75 605 722 564 523 834 605 759 680 181 670 1292 545 1001 415 811 1039
Effective Base 1157 573 585 220 294 390 295 974 90 119 28 385 404 332 294 468 401 424 438 101 434 728 315 555 298 384 744
Approve (Net) 1062 597 464 245 251 331 235 819 100 56 42 552 171 302 121 414 527 152 634 91 362 699 270 541 251 462 532
54% 63% 46% 49% 54% 57% 57% 62% 38% 25% 56% 91% 24% 54% 23% 50% 87% 20% 93% 50% 54% 54% 49% 54% 60% 57% 51%
Strongly approve 531 332 199 94 121 178 139 428 41 15 31 351 28 134 33 162 336 23 421 28 180 352 122 267 142 237 264
27% 35% 20% 19% 26% 31% 33% 33% 16% 7% 41% 58% 4% 24% 6% 19% 56% 3% 62% 16% 27% 27% 22% 27% 34% 29% 25%
Somewhat approve 530 265 265 150 130 154 97 391 59 40 11 201 143 168 88 252 191 129 212 63 183 348 147 274 110 225 268
27% 28% 26% 30% 28% 26% 23% 30% 23% 18% 14% 33% 20% 30% 17% 30% 32% 17% 31% 35% 27% 27% 27% 27% 26% 28% 26%
Disapprove (Net) 900 345 556 257 216 249 179 495 161 165 33 52 551 262 402 420 78 607 47 90 308 592 276 461 164 348 507
46% 37% 54% 51% 46% 43% 43% 38% 62% 75% 44% 9% 76% 46% 77% 50% 13% 80% 7% 50% 46% 46% 51% 46% 40% 43% 49%
Somewhat disapprove 378 131 247 97 91 116 75 216 67 63 12 36 200 122 136 192 50 213 37 43 137 241 106 197 75 154 207
19% 14% 24% 19% 19% 20% 18% 16% 26% 28% 16% 6% 28% 22% 26% 23% 8% 28% 5% 24% 20% 19% 19% 20% 18% 19% 20%
Strongly disapprove 522 214 308 160 125 133 104 279 94 102 21 17 351 140 266 229 28 394 10 47 171 351 169 263 89 195 300
27% 23% 30% 32% 27% 23% 25% 21% 36% 46% 28% 3% 49% 25% 51% 27% 5% 52% 1% 26% 26% 27% 31% 26% 22% 24% 29%
Sigma 1962 942 1020 502 467 580 414 1315 261 221 75 605 722 564 523 834 605 759 680 181 670 1292 545 1001 415 811 1039
100% 100% 100% 100% 100% 100% 100% 100% 100% 100% 100% 100% 100% 100% 100% 100% 100% 100% 100% 100% 100% 100% 100% 100% 100% 100% 100%

Page 18
QuickQuery
Fielding Period: January 13-16, 2018
HCAPS (Filtered on Registered Voters)
Weighted To The U.S. General Adult Population - Propensity
18 Jan 2018
Table 15
M3A_6 Do you approve or disapprove of the job President Trump is doing on ...?
Immigration
Base: All Respondents
Presidential
Election Candidate
Gender Age Ethnicity Political Party Political Ideology Voted For Education Locale Income
_____________ ______________________ _______________________ ____________________ ____________________ _____________________ _____________ ________________ _________
Colle- Some
Cons- ge Gr- Colle- $75K Less
Hisp- Black Repub- Democ- Indep- Libe- Mode- erva- 3rd ad And ge Or Urb- Subu- Or Than
Total Male Female 18-34 35-49 50-64 65+ White anic /AA Other lican rat endent ral rate tive Clinton Trump Party Higher Less an rban Rural More $75K
______ _____ _______ _____ _____ _____ ____ _____ _____ _____ _____ ______ ______ ______ ______ ______ ______ ________ ______ _____ ______ ______ ____ _____ _____ ____ ____
Unweighted Base 1962 882 1080 384 500 636 442 1530 136 183 39 600 711 571 518 818 626 731 698 184 700 1262 519 952 491 577 1275
Weighted Base 1962 942 1020 502 467 580 414 1315 261 221 75 605 722 564 523 834 605 759 680 181 670 1292 545 1001 415 811 1039
Effective Base 1157 573 585 220 294 390 295 974 90 119 28 385 404 332 294 468 401 424 438 101 434 728 315 555 298 384 744
Approve (Net) 843 476 368 156 208 281 197 670 75 30 39 499 82 232 67 309 467 53 605 58 264 579 202 421 220 343 444
43% 50% 36% 31% 45% 49% 48% 51% 29% 14% 52% 83% 11% 41% 13% 37% 77% 7% 89% 32% 39% 45% 37% 42% 53% 42% 43%
Strongly approve 441 254 187 68 104 162 107 349 32 16 26 281 28 111 32 135 275 18 347 23 129 312 91 219 131 164 251
22% 27% 18% 14% 22% 28% 26% 27% 12% 7% 35% 47% 4% 20% 6% 16% 45% 2% 51% 13% 19% 24% 17% 22% 32% 20% 24%
Somewhat approve 402 221 181 88 104 119 90 321 43 14 13 217 55 121 35 174 192 35 258 35 135 267 111 202 89 179 193
20% 23% 18% 17% 22% 21% 22% 24% 17% 6% 17% 36% 8% 21% 7% 21% 32% 5% 38% 19% 20% 21% 20% 20% 21% 22% 19%
Disapprove (Net) 1119 466 653 346 258 298 217 645 186 191 36 106 640 332 456 525 138 706 75 123 406 713 343 580 195 468 595
57% 50% 64% 69% 55% 51% 52% 49% 71% 86% 48% 17% 89% 59% 87% 63% 23% 93% 11% 68% 61% 55% 63% 58% 47% 58% 57%
Somewhat disapprove 299 136 163 94 79 79 47 188 32 48 15 61 117 107 54 181 65 114 58 33 103 196 90 160 48 139 147
15% 14% 16% 19% 17% 14% 11% 14% 12% 22% 19% 10% 16% 19% 10% 22% 11% 15% 9% 18% 15% 15% 17% 16% 12% 17% 14%
Strongly disapprove 820 331 489 252 179 220 169 457 154 143 22 45 523 225 402 344 73 592 17 90 303 517 253 420 147 329 448
42% 35% 48% 50% 38% 38% 41% 35% 59% 65% 29% 7% 72% 40% 77% 41% 12% 78% 3% 50% 45% 40% 46% 42% 35% 41% 43%
Sigma 1962 942 1020 502 467 580 414 1315 261 221 75 605 722 564 523 834 605 759 680 181 670 1292 545 1001 415 811 1039
100% 100% 100% 100% 100% 100% 100% 100% 100% 100% 100% 100% 100% 100% 100% 100% 100% 100% 100% 100% 100% 100% 100% 100% 100% 100% 100%

Page 19
QuickQuery
Fielding Period: January 13-16, 2018
HCAPS (Filtered on Registered Voters)
Weighted To The U.S. General Adult Population - Propensity
18 Jan 2018
Table 16
M4 Do you approve or disapprove of the way the Republican Party is handling its job?
Base: All Respondents
Presidential
Election Candidate
Gender Age Ethnicity Political Party Political Ideology Voted For Education Locale Income
_____________ ______________________ _______________________ ____________________ ____________________ _____________________ _____________ ________________ _________
Colle- Some
Cons- ge Gr- Colle- $75K Less
Hisp- Black Repub- Democ- Indep- Libe- Mode- erva- 3rd ad And ge Or Urb- Subu- Or Than
Total Male Female 18-34 35-49 50-64 65+ White anic /AA Other lican rat endent ral rate tive Clinton Trump Party Higher Less an rban Rural More $75K
______ _____ _______ _____ _____ _____ ____ _____ _____ _____ _____ ______ ______ ______ ______ ______ ______ ________ ______ _____ ______ ______ ____ _____ _____ ____ ____
Unweighted Base 1962 882 1080 384 500 636 442 1530 136 183 39 600 711 571 518 818 626 731 698 184 700 1262 519 952 491 577 1275
Weighted Base 1962 942 1020 502 467 580 414 1315 261 221 75 605 722 564 523 834 605 759 680 181 670 1292 545 1001 415 811 1039
Effective Base 1157 573 585 220 294 390 295 974 90 119 28 385 404 332 294 468 401 424 438 101 434 728 315 555 298 384 744
Strongly/Somewhat Approve 714 400 314 187 183 198 146 559 75 27 25 444 82 171 74 262 378 68 482 34 223 490 189 345 180 297 374
(Net) 36% 42% 31% 37% 39% 34% 35% 42% 29% 12% 33% 73% 11% 30% 14% 31% 63% 9% 71% 19% 33% 38% 35% 34% 43% 37% 36%
Strongly approve 129 75 53 46 39 28 16 105 15 1 1 100 8 17 24 38 66 11 95 3 48 80 47 51 31 64 59
7% 8% 5% 9% 8% 5% 4% 8% 6% * 2% 17% 1% 3% 5% 5% 11% 1% 14% 2% 7% 6% 9% 5% 7% 8% 6%
Somewhat approve 585 325 260 141 144 170 130 454 60 26 24 344 74 154 50 223 312 57 387 31 175 410 142 294 149 233 314
30% 34% 26% 28% 31% 29% 31% 35% 23% 12% 32% 57% 10% 27% 9% 27% 52% 8% 57% 17% 26% 32% 26% 29% 36% 29% 30%
Strongly/Somewhat Disapprove 1248 542 707 314 284 382 268 756 186 194 50 161 640 393 449 573 227 691 199 146 447 801 356 656 236 514 665
(Net) 64% 58% 69% 63% 61% 66% 65% 58% 71% 88% 67% 27% 89% 70% 86% 69% 37% 91% 29% 81% 67% 62% 65% 66% 57% 63% 64%
Somewhat disapprove 527 213 314 125 124 161 117 344 60 68 21 130 190 175 89 272 166 194 159 69 181 346 126 295 107 231 261
27% 23% 31% 25% 27% 28% 28% 26% 23% 31% 28% 21% 26% 31% 17% 33% 27% 26% 23% 38% 27% 27% 23% 29% 26% 29% 25%
Strongly disapprove 721 328 393 189 159 221 151 412 127 125 29 31 450 218 360 300 61 496 40 77 266 455 230 362 129 283 405
37% 35% 38% 38% 34% 38% 36% 31% 48% 57% 38% 5% 62% 39% 69% 36% 10% 65% 6% 43% 40% 35% 42% 36% 31% 35% 39%
Sigma 1962 942 1020 502 467 580 414 1315 261 221 75 605 722 564 523 834 605 759 680 181 670 1292 545 1001 415 811 1039
100% 100% 100% 100% 100% 100% 100% 100% 100% 100% 100% 100% 100% 100% 100% 100% 100% 100% 100% 100% 100% 100% 100% 100% 100% 100% 100%

Page 20
QuickQuery
Fielding Period: January 13-16, 2018
HCAPS (Filtered on Registered Voters)
Weighted To The U.S. General Adult Population - Propensity
18 Jan 2018
Table 17
M5 Do you approve or disapprove of the way the Democratic Party is handling its job?
Base: All Respondents
Presidential
Election Candidate
Gender Age Ethnicity Political Party Political Ideology Voted For Education Locale Income
_____________ ______________________ _______________________ ____________________ ____________________ _____________________ _____________ ________________ _________
Colle- Some
Cons- ge Gr- Colle- $75K Less
Hisp- Black Repub- Democ- Indep- Libe- Mode- erva- 3rd ad And ge Or Urb- Subu- Or Than
Total Male Female 18-34 35-49 50-64 65+ White anic /AA Other lican rat endent ral rate tive Clinton Trump Party Higher Less an rban Rural More $75K
______ _____ _______ _____ _____ _____ ____ _____ _____ _____ _____ ______ ______ ______ ______ ______ ______ ________ ______ _____ ______ ______ ____ _____ _____ ____ ____
Unweighted Base 1962 882 1080 384 500 636 442 1530 136 183 39 600 711 571 518 818 626 731 698 184 700 1262 519 952 491 577 1275
Weighted Base 1962 942 1020 502 467 580 414 1315 261 221 75 605 722 564 523 834 605 759 680 181 670 1292 545 1001 415 811 1039
Effective Base 1157 573 585 220 294 390 295 974 90 119 28 385 404 332 294 468 401 424 438 101 434 728 315 555 298 384 744
Strongly/Somewhat Approve 791 364 427 246 189 219 138 476 116 141 19 100 490 186 349 353 89 501 112 48 296 496 280 363 148 330 424
(Net) 40% 39% 42% 49% 41% 38% 33% 36% 44% 64% 25% 17% 68% 33% 67% 42% 15% 66% 17% 26% 44% 38% 51% 36% 36% 41% 41%
Strongly approve 165 84 80 55 36 39 34 89 21 39 6 23 127 14 82 67 15 117 19 2 60 105 84 54 27 65 97
8% 9% 8% 11% 8% 7% 8% 7% 8% 18% 8% 4% 18% 2% 16% 8% 3% 15% 3% 1% 9% 8% 15% 5% 6% 8% 9%
Somewhat approve 627 280 347 190 153 180 104 387 95 101 13 77 363 172 267 286 74 385 94 46 236 391 196 310 121 266 328
32% 30% 34% 38% 33% 31% 25% 29% 36% 46% 17% 13% 50% 30% 51% 34% 12% 51% 14% 25% 35% 30% 36% 31% 29% 33% 32%
Strongly/Somewhat Disapprove 1171 578 593 256 277 361 276 839 145 80 56 505 232 379 174 481 516 258 568 133 375 796 265 638 268 480 615
(Net) 60% 61% 58% 51% 59% 62% 67% 64% 56% 36% 75% 83% 32% 67% 33% 58% 85% 34% 83% 74% 56% 62% 49% 64% 64% 59% 59%
Somewhat disapprove 606 257 350 155 161 160 131 412 88 57 16 196 186 198 132 307 168 206 194 71 187 419 163 332 112 256 311
31% 27% 34% 31% 34% 28% 32% 31% 34% 26% 22% 32% 26% 35% 25% 37% 28% 27% 29% 39% 28% 32% 30% 33% 27% 32% 30%
Strongly disapprove 564 321 243 101 117 201 145 427 57 23 40 309 46 180 42 174 348 52 374 62 188 376 102 306 156 224 303
29% 34% 24% 20% 25% 35% 35% 32% 22% 11% 53% 51% 6% 32% 8% 21% 57% 7% 55% 34% 28% 29% 19% 31% 38% 28% 29%
Sigma 1962 942 1020 502 467 580 414 1315 261 221 75 605 722 564 523 834 605 759 680 181 670 1292 545 1001 415 811 1039
100% 100% 100% 100% 100% 100% 100% 100% 100% 100% 100% 100% 100% 100% 100% 100% 100% 100% 100% 100% 100% 100% 100% 100% 100% 100% 100%

Page 21
QuickQuery
Fielding Period: January 13-16, 2018
HCAPS (Filtered on Registered Voters)
Weighted To The U.S. General Adult Population - Propensity
18 Jan 2018
Table 18
M9 Which of the following should be the top priority for President Trump and Republicans in Congress?
Base: All Respondents
Presidential
Election Candidate
Gender Age Ethnicity Political Party Political Ideology Voted For Education Locale Income
_____________ ______________________ _______________________ ____________________ ____________________ _____________________ _____________ ________________ _________
Colle- Some
Cons- ge Gr- Colle- $75K Less
Hisp- Black Repub- Democ- Indep- Libe- Mode- erva- 3rd ad And ge Or Urb- Subu- Or Than
Total Male Female 18-34 35-49 50-64 65+ White anic /AA Other lican rat endent ral rate tive Clinton Trump Party Higher Less an rban Rural More $75K
______ _____ _______ _____ _____ _____ ____ _____ _____ _____ _____ ______ ______ ______ ______ ______ ______ ________ ______ _____ ______ ______ ____ _____ _____ ____ ____
Unweighted Base 1962 882 1080 384 500 636 442 1530 136 183 39 600 711 571 518 818 626 731 698 184 700 1262 519 952 491 577 1275
Weighted Base 1962 942 1020 502 467 580 414 1315 261 221 75 605 722 564 523 834 605 759 680 181 670 1292 545 1001 415 811 1039
Effective Base 1157 573 585 220 294 390 295 974 90 119 28 385 404 332 294 468 401 424 438 101 434 728 315 555 298 384 744
Stimulating American jobs 565 277 289 172 130 166 97 359 76 90 15 113 263 165 167 284 114 271 129 59 184 381 172 288 105 225 310
29% 29% 28% 34% 28% 29% 23% 27% 29% 41% 20% 19% 36% 29% 32% 34% 19% 36% 19% 33% 27% 30% 32% 29% 25% 28% 30%
Passing an infrastructure 342 195 147 45 70 125 102 233 44 40 13 61 159 117 150 128 64 203 64 40 167 175 96 171 75 154 172
spending bill 17% 21% 14% 9% 15% 22% 25% 18% 17% 18% 17% 10% 22% 21% 29% 15% 11% 27% 9% 22% 25% 14% 18% 17% 18% 19% 17%
Repealing and replacing the 246 115 131 71 69 71 35 184 22 11 17 130 33 68 28 101 117 33 130 28 71 176 54 129 63 120 106
Affordable Care Act (also 13% 12% 13% 14% 15% 12% 9% 14% 8% 5% 22% 22% 5% 12% 5% 12% 19% 4% 19% 16% 11% 14% 10% 13% 15% 15% 10%
known as "Obamacare")
Destroying ISIS 200 81 119 60 49 43 49 130 35 25 - 70 78 47 35 89 76 80 75 19 61 139 52 105 43 69 121
10% 9% 12% 12% 10% 7% 12% 10% 13% 12% - 12% 11% 8% 7% 11% 13% 11% 11% 10% 9% 11% 10% 10% 10% 9% 12%
Passing a comprehensive tax 170 66 105 40 50 47 34 112 25 17 8 51 58 53 48 73 50 57 56 18 65 105 51 86 33 92 68
reform bill 9% 7% 10% 8% 11% 8% 8% 9% 10% 8% 10% 8% 8% 9% 9% 9% 8% 8% 8% 10% 10% 8% 9% 9% 8% 11% 7%
Reducing the total amount of 160 86 74 22 30 56 52 131 15 11 3 99 16 39 15 52 92 17 120 3 43 117 47 77 36 57 97
immigrants allowed in the 8% 9% 7% 4% 6% 10% 13% 10% 6% 5% 4% 16% 2% 7% 3% 6% 15% 2% 18% 2% 6% 9% 9% 8% 9% 7% 9%
United States
Building a wall between the 92 50 41 19 22 33 19 64 5 7 9 46 13 31 11 24 57 10 67 * 24 68 23 42 27 31 57
United States and Mexico 5% 5% 4% 4% 5% 6% 4% 5% 2% 3% 12% 8% 2% 5% 2% 3% 9% 1% 10% * 4% 5% 4% 4% 7% 4% 5%
Renegotiating trade deals 88 37 51 28 17 22 22 52 20 7 4 18 49 19 30 42 17 33 25 5 24 64 16 57 16 27 51
with other countries 4% 4% 5% 6% 4% 4% 5% 4% 8% 3% 5% 3% 7% 3% 6% 5% 3% 4% 4% 3% 4% 5% 3% 6% 4% 3% 5%
Expanding family leave 74 23 50 43 19 9 2 37 15 9 8 8 44 19 37 27 10 47 7 7 26 48 22 38 14 28 41
policies 4% 2% 5% 9% 4% 2% 1% 3% 6% 4% 10% 1% 6% 3% 7% 3% 2% 6% 1% 4% 4% 4% 4% 4% 3% 3% 4%
Undoing the Iran deal 25 12 12 2 12 7 3 12 5 4 - 9 8 8 2 15 8 6 9 1 5 20 13 9 3 8 17
1% 1% 1% * 3% 1% 1% 1% 2% 2% - 1% 1% 1% * 2% 1% 1% 1% 1% 1% 2% 2% 1% 1% 1% 2%
Sigma 1962 942 1020 502 467 580 414 1315 261 221 75 605 722 564 523 834 605 759 680 181 670 1292 545 1001 415 811 1039
100% 100% 100% 100% 100% 100% 100% 100% 100% 100% 100% 100% 100% 100% 100% 100% 100% 100% 100% 100% 100% 100% 100% 100% 100% 100% 100%

Page 22
QuickQuery
Fielding Period: January 13-16, 2018
HCAPS (Filtered on Registered Voters)
Weighted To The U.S. General Adult Population - Propensity
18 Jan 2018
Table 19
Q1903 Regardless of how you may vote, what do you usually consider yourself?
Base: All Respondents
Presidential
Election Candidate
Gender Age Ethnicity Political Party Political Ideology Voted For Education Locale Income
_____________ ______________________ _______________________ ____________________ ____________________ _____________________ _____________ ________________ _________
Colle- Some
Cons- ge Gr- Colle- $75K Less
Hisp- Black Repub- Democ- Indep- Libe- Mode- erva- 3rd ad And ge Or Urb- Subu- Or Than
Total Male Female 18-34 35-49 50-64 65+ White anic /AA Other lican rat endent ral rate tive Clinton Trump Party Higher Less an rban Rural More $75K
______ _____ _______ _____ _____ _____ ____ _____ _____ _____ _____ ______ ______ ______ ______ ______ ______ ________ ______ _____ ______ ______ ____ _____ _____ ____ ____
Unweighted Base 1962 882 1080 384 500 636 442 1530 136 183 39 600 711 571 518 818 626 731 698 184 700 1262 519 952 491 577 1275
Weighted Base 1962 942 1020 502 467 580 414 1315 261 221 75 605 722 564 523 834 605 759 680 181 670 1292 545 1001 415 811 1039
Effective Base 1157 573 585 220 294 390 295 974 90 119 28 385 404 332 294 468 401 424 438 101 434 728 315 555 298 384 744
Democrat 722 284 438 217 173 190 142 384 135 152 21 - 722 - 361 291 70 566 33 24 257 465 261 339 122 282 406
37% 30% 43% 43% 37% 33% 34% 29% 52% 69% 27% - 100% - 69% 35% 12% 75% 5% 13% 38% 36% 48% 34% 29% 35% 39%
Republican 605 336 268 140 119 189 157 519 38 10 23 605 - - 40 167 398 28 478 29 198 406 148 308 148 251 312
31% 36% 26% 28% 25% 33% 38% 39% 15% 4% 31% 100% - - 8% 20% 66% 4% 70% 16% 30% 31% 27% 31% 36% 31% 30%
Independent 564 295 269 120 161 176 107 379 79 42 23 - - 564 111 331 122 154 160 113 205 360 123 320 121 257 278
29% 31% 26% 24% 35% 30% 26% 29% 30% 19% 31% - - 100% 21% 40% 20% 20% 23% 63% 31% 28% 23% 32% 29% 32% 27%
Other 71 27 44 25 14 24 8 34 9 17 8 - - - 11 46 14 10 10 15 11 60 12 34 25 21 43
4% 3% 4% 5% 3% 4% 2% 3% 3% 8% 11% - - - 2% 5% 2% 1% 1% 8% 2% 5% 2% 3% 6% 3% 4%
Sigma 1962 942 1020 502 467 580 414 1315 261 221 75 605 722 564 523 834 605 759 680 181 670 1292 545 1001 415 811 1039
100% 100% 100% 100% 100% 100% 100% 100% 100% 100% 100% 100% 100% 100% 100% 100% 100% 100% 100% 100% 100% 100% 100% 100% 100% 100% 100%

Page 23
QuickQuery
Fielding Period: January 13-16, 2018
HCAPS (Filtered on Registered Voters)
Weighted To The U.S. General Adult Population - Propensity
18 Jan 2018
Table 20
Q1905 Would you call yourself a strong Republican or a not-so-strong Republican?
Base: Republican
Presidential
Election Candidate
Gender Age Ethnicity Political Party Political Ideology Voted For Education Locale Income
_____________ ______________________ _______________________ ____________________ ____________________ _____________________ _____________ ________________ _________
Colle- Some
Cons- ge Gr- Colle- $75K Less
Hisp- Black Repub- Democ- Indep- Libe- Mode- erva- 3rd ad And ge Or Urb- Subu- Or Than
Total Male Female 18-34 35-49 50-64 65+ White anic /AA Other lican rat endent ral rate tive Clinton Trump Party Higher Less an rban Rural More $75K
______ _____ _______ _____ _____ _____ ____ _____ _____ _____ _____ ______ ______ ______ ______ ______ ______ ________ ______ _____ ______ ______ ____ _____ _____ ____ ____
Unweighted Base 600 288 312 106 133 201 160 547 18 9 13 600 - - 29 166 405 25 474 34 195 405 126 301 173 177 384
Weighted Base 605 336 268 140 119 189 157 519 38 10 23 605 - - 40 167 398 28 478 29 198 406 148 308 148 251 312
Effective Base 385 195 195 66 76 139 117 361 12 7 11 385 - - 18 105 265 12 311 25 122 263 77 202 114 128 247
Strong Republican 348 202 146 78 83 101 86 298 21 7 13 348 - - 35 58 255 12 300 8 115 233 93 168 87 144 187
58% 60% 54% 56% 70% 53% 55% 58% 56% 71% 54% 58% - - 87% 35% 64% 44% 63% 27% 58% 57% 63% 55% 58% 57% 60%
Not-so-strong Republican 256 134 122 62 36 88 70 220 17 3 11 256 - - 5 109 142 16 178 21 83 173 55 140 62 107 125
42% 40% 46% 44% 30% 47% 45% 42% 44% 29% 46% 42% - - 13% 65% 36% 56% 37% 73% 42% 43% 37% 45% 42% 43% 40%
Sigma 605 336 268 140 119 189 157 519 38 10 23 605 - - 40 167 398 28 478 29 198 406 148 308 148 251 312
100% 100% 100% 100% 100% 100% 100% 100% 100% 100% 100% 100% - - 100% 100% 100% 100% 100% 100% 100% 100% 100% 100% 100% 100% 100%

Page 24
QuickQuery
Fielding Period: January 13-16, 2018
HCAPS (Filtered on Registered Voters)
Weighted To The U.S. General Adult Population - Propensity
18 Jan 2018
Table 21
Q1910 Would you call yourself a strong Democrat or a not-so-strong Democrat?
Base: Democrat
Presidential
Election Candidate
Gender Age Ethnicity Political Party Political Ideology Voted For Education Locale Income
_____________ ______________________ _______________________ ____________________ ____________________ _____________________ _____________ ________________ _________
Colle- Some
Cons- ge Gr- Colle- $75K Less
Hisp- Black Repub- Democ- Indep- Libe- Mode- erva- 3rd ad And ge Or Urb- Subu- Or Than
Total Male Female 18-34 35-49 50-64 65+ White anic /AA Other lican rat endent ral rate tive Clinton Trump Party Higher Less an rban Rural More $75K
______ _____ _______ _____ _____ _____ ____ _____ _____ _____ _____ ______ ______ ______ ______ ______ ______ ________ ______ _____ ______ ______ ____ _____ _____ ____ ____
Unweighted Base 711 274 437 159 177 229 146 472 69 129 11 - 711 - 360 280 71 536 38 30 268 443 253 321 137 201 478
Weighted Base 722 284 438 217 173 190 142 384 135 152 21 - 722 - 361 291 70 566 33 24 257 465 261 339 122 282 406
Effective Base 404 170 235 90 105 145 87 285 45 86 8 - 404 - 197 162 46 305 22 19 170 240 152 175 80 133 258
Strong Democrat 445 184 261 123 91 121 109 235 66 121 10 - 445 - 270 137 38 395 5 7 173 272 179 192 74 178 254
62% 65% 60% 57% 53% 63% 77% 61% 49% 79% 47% - 62% - 75% 47% 54% 70% 15% 28% 67% 58% 68% 57% 61% 63% 62%
Not-so-strong Democrat 277 100 177 93 81 69 33 149 69 31 11 - 277 - 91 153 33 170 28 17 83 194 82 147 48 104 152
38% 35% 40% 43% 47% 37% 23% 39% 51% 21% 53% - 38% - 25% 53% 46% 30% 85% 72% 33% 42% 32% 43% 39% 37% 38%
Sigma 722 284 438 217 173 190 142 384 135 152 21 - 722 - 361 291 70 566 33 24 257 465 261 339 122 282 406
100% 100% 100% 100% 100% 100% 100% 100% 100% 100% 100% - 100% - 100% 100% 100% 100% 100% 100% 100% 100% 100% 100% 100% 100% 100%

Page 25
QuickQuery
Fielding Period: January 13-16, 2018
HCAPS (Filtered on Registered Voters)
Weighted To The U.S. General Adult Population - Propensity
18 Jan 2018
Table 22
Q1912 Insert text assignment
Base: Independent/Other
Presidential
Election Candidate
Gender Age Ethnicity Political Party Political Ideology Voted For Education Locale Income
_____________ ______________________ _______________________ ____________________ ____________________ _____________________ _____________ ________________ _________
Colle- Some
Cons- ge Gr- Colle- $75K Less
Hisp- Black Repub- Democ- Indep- Libe- Mode- erva- 3rd ad And ge Or Urb- Subu- Or Than
Total Male Female 18-34 35-49 50-64 65+ White anic /AA Other lican rat endent ral rate tive Clinton Trump Party Higher Less an rban Rural More $75K
______ _____ _______ _____ _____ _____ ____ _____ _____ _____ _____ ______ ______ ______ ______ ______ ______ ________ ______ _____ ______ ______ ____ _____ _____ ____ ____
Unweighted Base 651 320 331 119 190 206 136 511 49 45 15 - - 571 129 372 150 170 186 120 237 414 140 330 181 199 413
Weighted Base 635 322 314 145 175 200 115 412 88 58 31 - - 564 122 377 137 165 169 128 216 420 136 354 145 278 321
Effective Base 371 209 166 65 114 113 95 332 33 27 10 - - 332 82 203 90 113 105 63 142 231 88 185 105 124 247
Republican/Democratic 321 159 162 93 86 88 55 200 45 34 17 - - 286 62 192 67 73 78 74 110 211 68 180 73 140 166
51% 50% 52% 64% 49% 44% 48% 48% 51% 57% 55% - - 51% 51% 51% 49% 45% 46% 58% 51% 50% 50% 51% 50% 50% 52%
Democratic/Republican 314 162 152 52 90 113 60 213 43 25 14 - - 278 60 184 69 91 91 54 106 208 68 174 72 138 155
49% 50% 48% 36% 51% 56% 52% 52% 49% 43% 45% - - 49% 49% 49% 51% 55% 54% 42% 49% 50% 50% 49% 50% 50% 48%
Sigma 635 322 314 145 175 200 115 412 88 58 31 - - 564 122 377 137 165 169 128 216 420 136 354 145 278 321
100% 100% 100% 100% 100% 100% 100% 100% 100% 100% 100% - - 100% 100% 100% 100% 100% 100% 100% 100% 100% 100% 100% 100% 100% 100%
Page 26
QuickQuery
Fielding Period: January 13-16, 2018
HCAPS (Filtered on Registered Voters)
Weighted To The U.S. General Adult Population - Propensity
18 Jan 2018
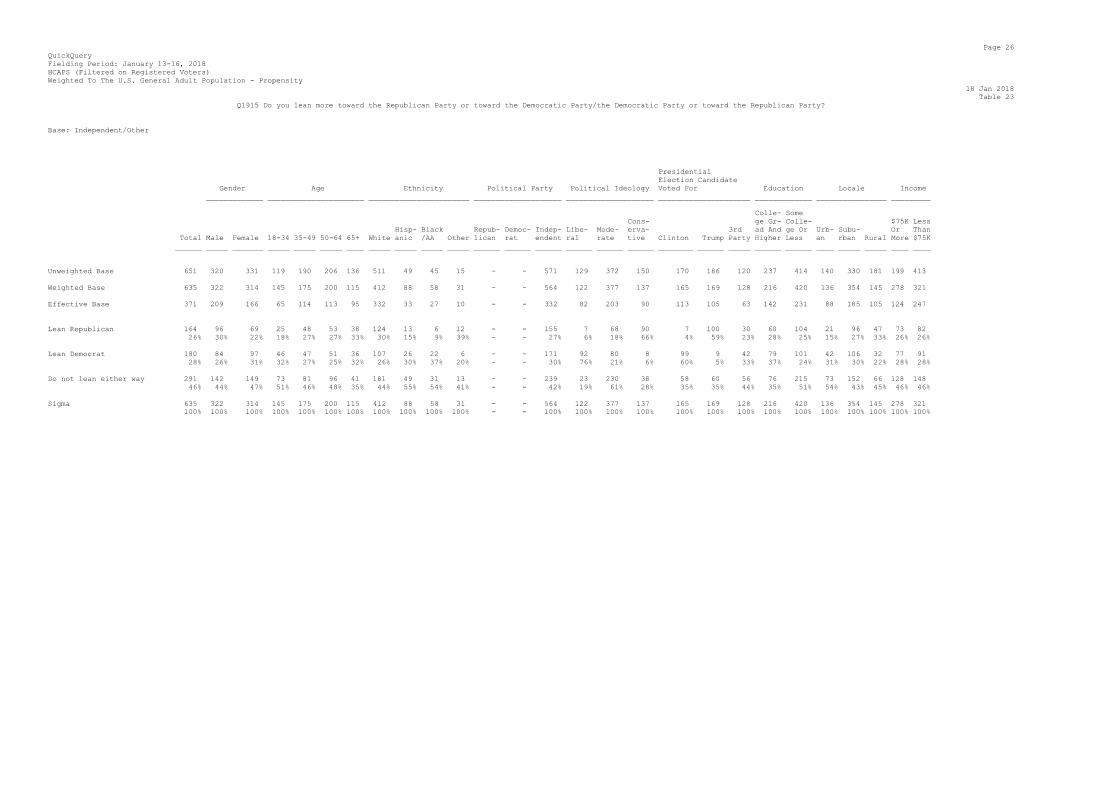
Table 23
Q1915 Do you lean more toward the Republican Party or toward the Democratic Party/the Democratic Party or toward the Republican Party?
Base: Independent/Other
Presidential
Election Candidate
Gender Age Ethnicity Political Party Political Ideology Voted For Education Locale Income
_____________ ______________________ _______________________ ____________________ ____________________ _____________________ _____________ ________________ _________
Colle- Some
Cons- ge Gr- Colle- $75K Less
Hisp- Black Repub- Democ- Indep- Libe- Mode- erva- 3rd ad And ge Or Urb- Subu- Or Than
Total Male Female 18-34 35-49 50-64 65+ White anic /AA Other lican rat endent ral rate tive Clinton Trump Party Higher Less an rban Rural More $75K
______ _____ _______ _____ _____ _____ ____ _____ _____ _____ _____ ______ ______ ______ ______ ______ ______ ________ ______ _____ ______ ______ ____ _____ _____ ____ ____
Unweighted Base 651 320 331 119 190 206 136 511 49 45 15 - - 571 129 372 150 170 186 120 237 414 140 330 181 199 413
Weighted Base 635 322 314 145 175 200 115 412 88 58 31 - - 564 122 377 137 165 169 128 216 420 136 354 145 278 321
Effective Base 371 209 166 65 114 113 95 332 33 27 10 - - 332 82 203 90 113 105 63 142 231 88 185 105 124 247
Lean Republican 164 96 69 25 48 53 38 124 13 6 12 - - 155 7 68 90 7 100 30 60 104 21 96 47 73 82
26% 30% 22% 18% 27% 27% 33% 30% 15% 9% 39% - - 27% 6% 18% 66% 4% 59% 23% 28% 25% 15% 27% 33% 26% 26%
Lean Democrat 180 84 97 46 47 51 36 107 26 22 6 - - 171 92 80 8 99 9 42 79 101 42 106 32 77 91
28% 26% 31% 32% 27% 25% 32% 26% 30% 37% 20% - - 30% 76% 21% 6% 60% 5% 33% 37% 24% 31% 30% 22% 28% 28%
Do not lean either way 291 142 149 73 81 96 41 181 49 31 13 - - 239 23 230 38 58 60 56 76 215 73 152 66 128 148
46% 44% 47% 51% 46% 48% 35% 44% 55% 54% 41% - - 42% 19% 61% 28% 35% 35% 44% 35% 51% 54% 43% 45% 46% 46%
Sigma 635 322 314 145 175 200 115 412 88 58 31 - - 564 122 377 137 165 169 128 216 420 136 354 145 278 321
100% 100% 100% 100% 100% 100% 100% 100% 100% 100% 100% - - 100% 100% 100% 100% 100% 100% 100% 100% 100% 100% 100% 100% 100% 100%

Page 27
QuickQuery
Fielding Period: January 13-16, 2018
HCAPS (Filtered on Registered Voters)
Weighted To The U.S. General Adult Population - Propensity
18 Jan 2018
Table 24
DNCNOMINATION1 Who would you support for the 2020 Democratic nomination for President? Please select your top choice.
Base: Democrat
Presidential
Election Candidate
Gender Age Ethnicity Political Party Political Ideology Voted For Education Locale Income
_____________ ______________________ _______________________ ____________________ ____________________ _____________________ _____________ ________________ _________
Colle- Some
Cons- ge Gr- Colle- $75K Less
Hisp- Black Repub- Democ- Indep- Libe- Mode- erva- 3rd ad And ge Or Urb- Subu- Or Than
Total Male Female 18-34 35-49 50-64 65+ White anic /AA Other lican rat endent ral rate tive Clinton Trump Party Higher Less an rban Rural More $75K
______ _____ _______ _____ _____ _____ ____ _____ _____ _____ _____ ______ ______ ______ ______ ______ ______ ________ ______ _____ ______ ______ ____ _____ _____ ____ ____
Unweighted Base 711 274 437 159 177 229 146 472 69 129 11 - 711 - 360 280 71 536 38 30 268 443 253 321 137 201 478
Weighted Base 722 284 438 217 173 190 142 384 135 152 21 - 722 - 361 291 70 566 33 24 257 465 261 339 122 282 406
Effective Base 404 170 235 90 105 145 87 285 45 86 8 - 404 - 197 162 46 305 22 19 170 240 152 175 80 133 258
Elizabeth Warren 72 25 47 23 13 18 18 40 21 10 - - 72 - 62 8 1 57 * 1 38 33 22 38 12 34 36
10% 9% 11% 11% 7% 10% 13% 10% 16% 7% - - 10% - 17% 3% 2% 10% 1% 5% 15% 7% 8% 11% 10% 12% 9%
Bernie Sanders 118 42 76 59 23 24 11 61 21 22 7 - 118 - 62 48 8 86 7 5 37 80 48 48 22 39 71
16% 15% 17% 27% 13% 13% 8% 16% 15% 14% 35% - 16% - 17% 16% 11% 15% 20% 20% 15% 17% 19% 14% 18% 14% 17%
Hillary Clinton 95 41 53 30 28 25 12 42 15 32 2 - 95 - 33 46 16 83 1 - 32 63 43 39 12 40 47
13% 15% 12% 14% 16% 13% 8% 11% 11% 21% 9% - 13% - 9% 16% 22% 15% 4% - 12% 14% 17% 12% 10% 14% 12%
Oprah Winfrey 94 26 68 38 28 24 4 35 22 31 4 - 94 - 35 46 13 71 1 5 18 75 42 32 20 35 57
13% 9% 16% 17% 16% 13% 3% 9% 16% 20% 22% - 13% - 10% 16% 19% 13% 3% 23% 7% 16% 16% 9% 16% 12% 14%
Andrew Cuomo 14 8 6 1 5 6 3 9 2 3 - - 14 - 5 8 1 9 5 * 8 7 5 8 1 7 7
2% 3% 1% * 3% 3% 2% 2% 2% 2% - - 2% - 1% 3% 1% 2% 14% 2% 3% 1% 2% 2% 1% 2% 2%
Kirsten Gillibrand 11 5 6 2 2 3 3 7 - 1 1 - 11 - 8 3 - 10 - - 7 4 3 6 2 5 6
1% 2% 1% 1% 1% 2% 2% 2% - 1% 6% - 1% - 2% 1% - 2% - - 3% 1% 1% 2% 1% 2% 1%
Kamala Harris 28 10 18 9 3 9 8 20 3 2 - - 28 - 21 7 - 27 * 1 15 13 12 10 6 13 11
4% 4% 4% 4% 2% 4% 6% 5% 2% 2% - - 4% - 6% 2% - 5% 1% 4% 6% 3% 4% 3% 5% 5% 3%
Cory Booker 31 12 19 1 13 12 5 16 6 6 - - 31 - 21 6 4 23 1 - 9 22 5 23 3 12 19
4% 4% 4% 1% 7% 6% 3% 4% 4% 4% - - 4% - 6% 2% 5% 4% 2% - 3% 5% 2% 7% 3% 4% 5%
Joe Biden 192 80 111 43 41 53 55 105 40 34 4 - 192 - 88 86 17 163 7 3 67 125 60 101 31 73 111
27% 28% 25% 20% 23% 28% 39% 27% 30% 22% 17% - 27% - 24% 30% 25% 29% 22% 13% 26% 27% 23% 30% 25% 26% 27%
Someone else 69 35 34 10 18 17 24 50 4 10 2 - 69 - 25 33 11 38 10 8 27 42 22 34 13 25 42
10% 12% 8% 5% 11% 9% 17% 13% 3% 7% 12% - 10% - 7% 11% 15% 7% 31% 34% 10% 9% 8% 10% 11% 9% 10%
Sigma 722 284 438 217 173 190 142 384 135 152 21 - 722 - 361 291 70 566 33 24 257 465 261 339 122 282 406
100% 100% 100% 100% 100% 100% 100% 100% 100% 100% 100% - 100% - 100% 100% 100% 100% 100% 100% 100% 100% 100% 100% 100% 100% 100%

Page 28
QuickQuery
Fielding Period: January 13-16, 2018
HCAPS (Filtered on Registered Voters)
Weighted To The U.S. General Adult Population - Propensity
18 Jan 2018
Table 25
DNCNOMINATION2 Who would be your second choice?
Base: Democrat
Presidential
Election Candidate
Gender Age Ethnicity Political Party Political Ideology Voted For Education Locale Income
_____________ ______________________ _______________________ ____________________ ____________________ _____________________ _____________ ________________ _________
Colle- Some
Cons- ge Gr- Colle- $75K Less
Hisp- Black Repub- Democ- Indep- Libe- Mode- erva- 3rd ad And ge Or Urb- Subu- Or Than
Total Male Female 18-34 35-49 50-64 65+ White anic /AA Other lican rat endent ral rate tive Clinton Trump Party Higher Less an rban Rural More $75K
______ _____ _______ _____ _____ _____ ____ _____ _____ _____ _____ ______ ______ ______ ______ ______ ______ ________ ______ _____ ______ ______ ____ _____ _____ ____ ____
Unweighted Base 711 274 437 159 177 229 146 472 69 129 11 - 711 - 360 280 71 536 38 30 268 443 253 321 137 201 478
Weighted Base 722 284 438 217 173 190 142 384 135 152 21 - 722 - 361 291 70 566 33 24 257 465 261 339 122 282 406
Effective Base 404 170 235 90 105 145 87 285 45 86 8 - 404 - 197 162 46 305 22 19 170 240 152 175 80 133 258
Elizabeth Warren 72 33 39 28 13 18 13 44 16 2 4 - 72 - 51 18 3 66 1 1 37 35 25 36 10 29 39
10% 12% 9% 13% 7% 10% 9% 11% 12% 1% 20% - 10% - 14% 6% 4% 12% 4% 6% 15% 7% 10% 11% 9% 10% 10%
Bernie Sanders 117 40 77 53 15 28 21 62 29 22 - - 117 - 46 57 14 85 3 6 37 80 36 66 15 42 71
16% 14% 18% 25% 9% 15% 14% 16% 22% 14% - - 16% - 13% 20% 20% 15% 10% 26% 14% 17% 14% 19% 12% 15% 18%
Hillary Clinton 109 29 80 34 30 32 14 48 28 29 4 - 109 - 55 40 15 96 * - 21 89 47 37 25 36 73
15% 10% 18% 16% 17% 17% 9% 12% 21% 19% 22% - 15% - 15% 14% 21% 17% 1% - 8% 19% 18% 11% 20% 13% 18%
Oprah Winfrey 90 39 50 23 30 24 13 44 8 30 2 - 90 - 37 42 11 66 1 1 19 71 45 31 14 31 52
12% 14% 12% 10% 17% 13% 9% 11% 6% 20% 12% - 12% - 10% 14% 16% 12% 4% 4% 8% 15% 17% 9% 11% 11% 13%
Andrew Cuomo 29 17 12 2 13 8 6 19 4 2 1 - 29 - 8 18 3 19 3 - 15 14 11 16 3 12 13
4% 6% 3% 1% 8% 4% 4% 5% 3% 2% 6% - 4% - 2% 6% 5% 3% 10% - 6% 3% 4% 5% 2% 4% 3%
Kirsten Gillibrand 24 7 17 7 4 6 8 11 6 2 3 - 24 - 11 10 3 20 - 1 9 15 4 12 8 10 12
3% 3% 4% 3% 2% 3% 5% 3% 5% 1% 13% - 3% - 3% 3% 4% 4% - 3% 3% 3% 2% 4% 6% 3% 3%
Kamala Harris 34 19 16 8 10 5 11 25 5 4 1 - 34 - 26 5 4 31 1 - 26 8 18 14 3 21 13
5% 7% 4% 4% 6% 2% 8% 6% 3% 3% 4% - 5% - 7% 2% 5% 5% 2% - 10% 2% 7% 4% 2% 8% 3%
Cory Booker 31 12 19 4 7 8 12 20 - 8 - - 31 - 25 6 - 29 1 - 21 10 9 13 9 22 8
4% 4% 4% 2% 4% 4% 8% 5% - 5% - - 4% - 7% 2% - 5% 4% - 8% 2% 4% 4% 8% 8% 2%
Joe Biden 126 55 71 41 24 43 18 63 29 26 3 - 126 - 74 49 4 104 6 3 50 76 41 62 23 53 70
18% 19% 16% 19% 14% 22% 13% 16% 22% 17% 14% - 18% - 20% 17% 6% 18% 18% 12% 20% 16% 16% 18% 19% 19% 17%
Someone else 89 32 57 17 26 18 28 49 10 27 2 - 89 - 29 46 14 49 15 12 21 68 24 52 13 26 55
12% 11% 13% 8% 15% 9% 20% 13% 7% 18% 9% - 12% - 8% 16% 19% 9% 45% 49% 8% 15% 9% 15% 10% 9% 14%
Sigma 722 284 438 217 173 190 142 384 135 152 21 - 722 - 361 291 70 566 33 24 257 465 261 339 122 282 406
100% 100% 100% 100% 100% 100% 100% 100% 100% 100% 100% - 100% - 100% 100% 100% 100% 100% 100% 100% 100% 100% 100% 100% 100% 100%

Page 29
QuickQuery
Fielding Period: January 13-16, 2018
HCAPS (Filtered on Registered Voters)
Weighted To The U.S. General Adult Population - Propensity
18 Jan 2018
Table 26
F1 Now we will show you some names. Please indicate if you have a favorable
or unfavorable view of that person - or if you've never heard of them.
Summary Of Ever Heard Of
Base: All Respondents
Presidential
Election Candidate
Gender Age Ethnicity Political Party Political Ideology Voted For Education Locale Income
_____________ ______________________ _______________________ ____________________ ____________________ _____________________ _____________ ________________ _________
Colle- Some
Cons- ge Gr- Colle- $75K Less
Hisp- Black Repub- Democ- Indep- Libe- Mode- erva- 3rd ad And ge Or Urb- Subu- Or Than
Total Male Female 18-34 35-49 50-64 65+ White anic /AA Other lican rat endent ral rate tive Clinton Trump Party Higher Less an rban Rural More $75K
______ _____ _______ _____ _____ _____ ____ _____ _____ _____ _____ ______ ______ ______ ______ ______ ______ ________ ______ _____ ______ ______ ____ _____ _____ ____ ____
Unweighted Base 1962 882 1080 384 500 636 442 1530 136 183 39 600 711 571 518 818 626 731 698 184 700 1262 519 952 491 577 1275
Weighted Base 1962 942 1020 502 467 580 414 1315 261 221 75 605 722 564 523 834 605 759 680 181 670 1292 545 1001 415 811 1039
Effective Base 1157 573 585 220 294 390 295 974 90 119 28 385 404 332 294 468 401 424 438 101 434 728 315 555 298 384 744
Donald Trump 1899 917 982 489 446 569 395 1282 255 208 72 590 694 550 509 802 588 740 669 177 655 1245 530 969 401 787 1006
97% 97% 96% 97% 96% 98% 95% 98% 98% 94% 95% 98% 96% 97% 97% 96% 97% 98% 98% 98% 98% 96% 97% 97% 96% 97% 97%
Hillary Clinton 1865 916 949 463 448 559 395 1273 237 199 72 591 684 530 510 762 592 724 671 172 647 1218 521 943 401 789 975
95% 97% 93% 92% 96% 96% 95% 97% 91% 90% 96% 98% 95% 94% 98% 91% 98% 95% 99% 95% 97% 94% 95% 94% 97% 97% 94%
Oprah Winfrey 1752 857 895 446 421 528 358 1176 234 198 68 543 651 498 470 735 547 684 621 154 610 1143 500 879 374 737 916
89% 91% 88% 89% 90% 91% 87% 89% 90% 90% 91% 90% 90% 88% 90% 88% 90% 90% 91% 85% 91% 88% 92% 88% 90% 91% 88%
Bernie Sanders 1745 878 867 455 396 523 371 1168 242 193 66 538 653 503 487 719 539 696 615 174 640 1105 501 897 347 744 905
89% 93% 85% 91% 85% 90% 90% 89% 93% 87% 87% 89% 90% 89% 93% 86% 89% 92% 90% 97% 95% 86% 92% 90% 84% 92% 87%
Mike Pence 1656 839 817 408 383 503 361 1134 230 156 63 540 627 449 469 644 542 654 631 153 605 1051 466 856 333 715 861
84% 89% 80% 81% 82% 87% 87% 86% 88% 71% 84% 89% 87% 80% 90% 77% 90% 86% 93% 85% 90% 81% 85% 86% 80% 88% 83%
Paul Ryan 1562 825 737 353 365 493 350 1078 207 159 65 505 585 429 458 606 498 640 584 153 587 975 430 801 331 673 811
80% 88% 72% 70% 78% 85% 85% 82% 79% 72% 86% 83% 81% 76% 88% 73% 82% 84% 86% 85% 88% 75% 79% 80% 80% 83% 78%
Nancy Pelosi 1547 838 709 307 364 504 372 1087 197 144 57 530 543 438 415 592 541 585 622 150 594 954 429 798 320 686 785
79% 89% 70% 61% 78% 87% 90% 83% 75% 65% 75% 88% 75% 78% 79% 71% 89% 77% 91% 83% 89% 74% 79% 80% 77% 85% 76%
Elizabeth Warren 1364 735 629 297 307 430 331 946 169 134 56 429 501 398 407 500 457 558 521 130 556 808 380 708 276 605 695
70% 78% 62% 59% 66% 74% 80% 72% 65% 61% 75% 71% 69% 71% 78% 60% 76% 74% 77% 72% 83% 63% 70% 71% 66% 75% 67%
Jeff Sessions 1331 750 581 289 311 418 313 911 178 129 60 414 515 374 403 511 416 569 489 137 541 790 395 679 256 606 662
68% 80% 57% 58% 67% 72% 76% 69% 68% 59% 79% 68% 71% 66% 77% 61% 69% 75% 72% 76% 81% 61% 72% 68% 62% 75% 64%
Stephen Bannon 1304 723 582 292 270 424 318 904 173 124 53 414 499 365 403 493 409 567 477 126 546 758 367 688 249 607 637
66% 77% 57% 58% 58% 73% 77% 69% 66% 56% 71% 68% 69% 65% 77% 59% 68% 75% 70% 70% 81% 59% 67% 69% 60% 75% 61%
Mitch McConnell 1286 739 547 267 284 418 317 899 165 123 48 409 482 370 388 487 411 544 479 125 517 769 365 664 257 572 652
66% 78% 54% 53% 61% 72% 77% 68% 63% 56% 64% 68% 67% 66% 74% 58% 68% 72% 70% 69% 77% 60% 67% 66% 62% 71% 63%
Chuck Schumer 1211 708 503 237 285 394 294 862 149 101 51 405 428 347 344 446 421 478 491 117 515 695 327 641 242 550 599
62% 75% 49% 47% 61% 68% 71% 66% 57% 46% 68% 67% 59% 62% 66% 53% 70% 63% 72% 65% 77% 54% 60% 64% 58% 68% 58%
Robert Mueller 1190 699 490 218 280 397 295 831 153 117 45 389 433 344 352 443 395 489 458 118 502 687 348 611 231 554 577
61% 74% 48% 43% 60% 68% 71% 63% 59% 53% 60% 64% 60% 61% 67% 53% 65% 64% 67% 66% 75% 53% 64% 61% 56% 68% 56%

Page 30
QuickQuery
Fielding Period: January 13-16, 2018
HCAPS (Filtered on Registered Voters)
Weighted To The U.S. General Adult Population - Propensity
18 Jan 2018
Table 27
F1 Now we will show you some names. Please indicate if you have a favorable
or unfavorable view of that person - or if you've never heard of them.
Summary Of Very Favorable/Favorable
Base: All Respondents
Presidential
Election Candidate
Gender Age Ethnicity Political Party Political Ideology Voted For Education Locale Income
_____________ ______________________ _______________________ ____________________ ____________________ _____________________ _____________ ________________ _________
Colle- Some
Cons- ge Gr- Colle- $75K Less
Hisp- Black Repub- Democ- Indep- Libe- Mode- erva- 3rd ad And ge Or Urb- Subu- Or Than
Total Male Female 18-34 35-49 50-64 65+ White anic /AA Other lican rat endent ral rate tive Clinton Trump Party Higher Less an rban Rural More $75K
______ _____ _______ _____ _____ _____ ____ _____ _____ _____ _____ ______ ______ ______ ______ ______ ______ ________ ______ _____ ______ ______ ____ _____ _____ ____ ____
Unweighted Base 1962 882 1080 384 500 636 442 1530 136 183 39 600 711 571 518 818 626 731 698 184 700 1262 519 952 491 577 1275
Weighted Base 1962 942 1020 502 467 580 414 1315 261 221 75 605 722 564 523 834 605 759 680 181 670 1292 545 1001 415 811 1039
Effective Base 1157 573 585 220 294 390 295 974 90 119 28 385 404 332 294 468 401 424 438 101 434 728 315 555 298 384 744
Oprah Winfrey 1121 490 631 322 292 305 202 702 165 168 36 210 559 314 408 513 199 609 218 91 416 705 374 532 215 490 576
57% 52% 62% 64% 63% 53% 49% 53% 63% 76% 48% 35% 77% 56% 78% 61% 33% 80% 32% 50% 62% 55% 69% 53% 52% 60% 55%
Bernie Sanders 1038 471 567 321 240 285 192 609 172 167 32 147 564 301 450 470 118 609 165 90 396 642 351 512 175 442 542
53% 50% 56% 64% 51% 49% 46% 46% 66% 76% 42% 24% 78% 53% 86% 56% 19% 80% 24% 50% 59% 50% 64% 51% 42% 55% 52%
Donald Trump 758 436 322 161 173 250 174 610 65 25 37 481 48 199 55 259 444 28 580 36 237 521 194 366 198 312 403
39% 46% 32% 32% 37% 43% 42% 46% 25% 12% 49% 80% 7% 35% 10% 31% 73% 4% 85% 20% 35% 40% 36% 37% 48% 38% 39%
Mike Pence 754 434 320 143 165 254 192 598 75 27 31 458 95 185 67 240 446 78 535 53 263 491 185 373 196 323 388
38% 46% 31% 29% 35% 44% 46% 46% 29% 12% 41% 76% 13% 33% 13% 29% 74% 10% 79% 29% 39% 38% 34% 37% 47% 40% 37%
Hillary Clinton 738 318 420 207 192 191 148 411 118 141 21 54 528 142 369 301 68 575 42 17 283 454 265 343 129 325 382
38% 34% 41% 41% 41% 33% 36% 31% 45% 64% 28% 9% 73% 25% 71% 36% 11% 76% 6% 10% 42% 35% 49% 34% 31% 40% 37%
Elizabeth Warren 672 318 354 164 155 194 159 434 88 93 18 83 408 169 352 248 72 461 92 50 305 367 236 323 113 304 336
34% 34% 35% 33% 33% 33% 39% 33% 34% 42% 24% 14% 57% 30% 67% 30% 12% 61% 14% 27% 45% 28% 43% 32% 27% 37% 32%
Paul Ryan 645 369 276 144 143 198 160 501 57 42 28 381 89 154 72 227 346 98 416 50 240 405 158 331 156 283 323
33% 39% 27% 29% 31% 34% 39% 38% 22% 19% 37% 63% 12% 27% 14% 27% 57% 13% 61% 28% 36% 31% 29% 33% 37% 35% 31%
Robert Mueller 611 360 250 107 150 201 153 430 68 72 14 123 301 183 267 246 98 375 118 64 297 314 209 300 102 311 275
31% 38% 25% 21% 32% 35% 37% 33% 26% 33% 18% 20% 42% 32% 51% 29% 16% 49% 17% 35% 44% 24% 38% 30% 24% 38% 26%
Nancy Pelosi 568 275 293 127 132 173 137 354 74 95 10 71 362 130 281 216 70 396 69 33 259 308 210 262 95 266 285
29% 29% 29% 25% 28% 30% 33% 27% 28% 43% 14% 12% 50% 23% 54% 26% 12% 52% 10% 18% 39% 24% 39% 26% 23% 33% 27%
Chuck Schumer 488 254 234 99 114 157 117 313 69 71 11 77 279 126 239 194 55 330 85 25 236 252 167 242 79 233 234
25% 27% 23% 20% 25% 27% 28% 24% 26% 32% 14% 13% 39% 22% 46% 23% 9% 44% 12% 14% 35% 20% 31% 24% 19% 29% 23%
Jeff Sessions 410 273 137 84 85 114 126 316 35 23 18 248 58 98 48 122 240 61 287 22 185 226 121 208 82 196 190
21% 29% 13% 17% 18% 20% 31% 24% 14% 10% 24% 41% 8% 17% 9% 15% 40% 8% 42% 12% 28% 17% 22% 21% 20% 24% 18%
Mitch McConnell 400 254 146 88 95 113 103 300 35 29 15 236 64 95 62 135 203 73 251 31 164 236 129 195 76 184 201
20% 27% 14% 17% 20% 20% 25% 23% 14% 13% 20% 39% 9% 17% 12% 16% 34% 10% 37% 17% 24% 18% 24% 19% 18% 23% 19%
Stephen Bannon 179 122 57 69 49 43 19 135 22 12 3 92 39 44 47 72 60 47 102 12 77 103 67 85 27 93 82
9% 13% 6% 14% 10% 7% 5% 10% 9% 5% 4% 15% 5% 8% 9% 9% 10% 6% 15% 6% 11% 8% 12% 8% 7% 11% 8%

Page 31
QuickQuery
Fielding Period: January 13-16, 2018
HCAPS (Filtered on Registered Voters)
Weighted To The U.S. General Adult Population - Propensity
18 Jan 2018
Table 28
F1 Now we will show you some names. Please indicate if you have a favorable
or unfavorable view of that person - or if you've never heard of them.
Summary Of Very Unfavorable/Unfavorable
Base: All Respondents
Presidential
Election Candidate
Gender Age Ethnicity Political Party Political Ideology Voted For Education Locale Income
_____________ ______________________ _______________________ ____________________ ____________________ _____________________ _____________ ________________ _________
Colle- Some
Cons- ge Gr- Colle- $75K Less
Hisp- Black Repub- Democ- Indep- Libe- Mode- erva- 3rd ad And ge Or Urb- Subu- Or Than
Total Male Female 18-34 35-49 50-64 65+ White anic /AA Other lican rat endent ral rate tive Clinton Trump Party Higher Less an rban Rural More $75K
______ _____ _______ _____ _____ _____ ____ _____ _____ _____ _____ ______ ______ ______ ______ ______ ______ ________ ______ _____ ______ ______ ____ _____ _____ ____ ____
Unweighted Base 1962 882 1080 384 500 636 442 1530 136 183 39 600 711 571 518 818 626 731 698 184 700 1262 519 952 491 577 1275
Weighted Base 1962 942 1020 502 467 580 414 1315 261 221 75 605 722 564 523 834 605 759 680 181 670 1292 545 1001 415 811 1039
Effective Base 1157 573 585 220 294 390 295 974 90 119 28 385 404 332 294 468 401 424 438 101 434 728 315 555 298 384 744
Donald Trump 1141 482 660 328 273 319 221 672 190 183 35 110 646 351 454 543 143 713 89 141 418 724 335 603 203 475 604
58% 51% 65% 65% 59% 55% 53% 51% 73% 83% 47% 18% 90% 62% 87% 65% 24% 94% 13% 78% 62% 56% 62% 60% 49% 59% 58%
Hillary Clinton 1127 598 529 256 257 367 247 862 118 58 51 538 156 388 141 462 524 149 629 155 364 763 256 600 272 464 593
57% 64% 52% 51% 55% 63% 60% 66% 45% 26% 68% 89% 22% 69% 27% 55% 87% 20% 92% 86% 54% 59% 47% 60% 65% 57% 57%
Stephen Bannon 1125 601 525 223 222 381 299 769 151 112 50 321 459 321 356 420 349 520 375 115 470 656 300 604 222 513 555
57% 64% 51% 45% 47% 66% 72% 58% 58% 51% 66% 53% 64% 57% 68% 50% 58% 69% 55% 63% 70% 51% 55% 60% 53% 63% 53%
Nancy Pelosi 979 563 416 180 233 331 236 733 123 49 46 459 180 308 133 376 470 189 553 117 334 645 218 536 225 420 500
50% 60% 41% 36% 50% 57% 57% 56% 47% 22% 62% 76% 25% 55% 26% 45% 78% 25% 81% 65% 50% 50% 40% 54% 54% 52% 48%
Jeff Sessions 920 477 443 205 225 303 187 596 142 107 42 166 457 277 355 389 176 508 202 115 356 564 274 472 175 410 472
47% 51% 43% 41% 48% 52% 45% 45% 54% 48% 55% 27% 63% 49% 68% 47% 29% 67% 30% 64% 53% 44% 50% 47% 42% 51% 45%
Paul Ryan 917 456 461 210 223 295 190 577 150 117 37 123 496 274 386 379 152 542 168 103 347 570 272 470 175 389 488
47% 48% 45% 42% 48% 51% 46% 44% 58% 53% 49% 20% 69% 49% 74% 45% 25% 71% 25% 57% 52% 44% 50% 47% 42% 48% 47%
Mike Pence 902 405 497 265 219 249 169 536 154 129 33 82 533 264 402 404 96 577 97 100 342 560 281 483 137 393 473
46% 43% 49% 53% 47% 43% 41% 41% 59% 58% 43% 14% 74% 47% 77% 48% 16% 76% 14% 55% 51% 43% 52% 48% 33% 48% 46%
Mitch McConnell 886 486 401 179 188 305 214 599 130 94 33 173 417 275 327 352 208 470 227 94 353 533 236 469 181 388 451
45% 52% 39% 36% 40% 53% 52% 46% 50% 43% 44% 29% 58% 49% 63% 42% 34% 62% 33% 52% 53% 41% 43% 47% 44% 48% 43%
Chuck Schumer 723 454 269 138 171 237 177 548 81 30 41 329 149 221 105 252 365 147 407 92 279 443 160 400 163 317 365
37% 48% 26% 27% 37% 41% 43% 42% 31% 14% 54% 54% 21% 39% 20% 30% 60% 19% 60% 51% 42% 34% 29% 40% 39% 39% 35%
Bernie Sanders 707 407 300 134 156 238 179 559 70 26 34 391 89 202 37 249 421 87 450 85 244 463 151 385 172 301 363
36% 43% 29% 27% 34% 41% 43% 43% 27% 12% 45% 65% 12% 36% 7% 30% 70% 11% 66% 47% 36% 36% 28% 38% 41% 37% 35%
Elizabeth Warren 692 417 276 133 152 236 172 512 80 41 38 346 93 230 55 252 385 97 428 81 251 441 144 385 163 302 359
35% 44% 27% 27% 33% 41% 41% 39% 31% 19% 51% 57% 13% 41% 10% 30% 64% 13% 63% 45% 37% 34% 26% 38% 39% 37% 35%
Oprah Winfrey 632 367 264 124 129 223 156 475 69 30 32 333 92 183 62 222 348 75 403 63 194 438 126 347 159 247 340
32% 39% 26% 25% 28% 38% 38% 36% 26% 13% 43% 55% 13% 32% 12% 27% 58% 10% 59% 35% 29% 34% 23% 35% 38% 30% 33%
Robert Mueller 579 339 240 111 130 196 142 400 84 45 31 266 133 160 85 197 297 114 340 55 206 373 138 311 130 243 302
30% 36% 24% 22% 28% 34% 34% 30% 32% 20% 41% 44% 18% 28% 16% 24% 49% 15% 50% 30% 31% 29% 25% 31% 31% 30% 29%

Page 32
QuickQuery
Fielding Period: January 13-16, 2018
HCAPS (Filtered on Registered Voters)
Weighted To The U.S. General Adult Population - Propensity
18 Jan 2018
Table 29
F1_1 Now we will show you some names. Please indicate if you have a favorable
or unfavorable view of that person - or if you've never heard of them.
Hillary Clinton
Base: All Respondents
Presidential
Election Candidate
Gender Age Ethnicity Political Party Political Ideology Voted For Education Locale Income
_____________ ______________________ _______________________ ____________________ ____________________ _____________________ _____________ ________________ _________
Colle- Some
Cons- ge Gr- Colle- $75K Less
Hisp- Black Repub- Democ- Indep- Libe- Mode- erva- 3rd ad And ge Or Urb- Subu- Or Than
Total Male Female 18-34 35-49 50-64 65+ White anic /AA Other lican rat endent ral rate tive Clinton Trump Party Higher Less an rban Rural More $75K
______ _____ _______ _____ _____ _____ ____ _____ _____ _____ _____ ______ ______ ______ ______ ______ ______ ________ ______ _____ ______ ______ ____ _____ _____ ____ ____
Unweighted Base 1962 882 1080 384 500 636 442 1530 136 183 39 600 711 571 518 818 626 731 698 184 700 1262 519 952 491 577 1275
Weighted Base 1962 942 1020 502 467 580 414 1315 261 221 75 605 722 564 523 834 605 759 680 181 670 1292 545 1001 415 811 1039
Effective Base 1157 573 585 220 294 390 295 974 90 119 28 385 404 332 294 468 401 424 438 101 434 728 315 555 298 384 744
Ever Heard Of (Net) 1865 916 949 463 448 559 395 1273 237 199 72 591 684 530 510 762 592 724 671 172 647 1218 521 943 401 789 975
95% 97% 93% 92% 96% 96% 95% 97% 91% 90% 96% 98% 95% 94% 98% 91% 98% 95% 99% 95% 97% 94% 95% 94% 97% 97% 94%
Very Favorable/Favorable 738 318 420 207 192 191 148 411 118 141 21 54 528 142 369 301 68 575 42 17 283 454 265 343 129 325 382
(Sub-Net) 38% 34% 41% 41% 41% 33% 36% 31% 45% 64% 28% 9% 73% 25% 71% 36% 11% 76% 6% 10% 42% 35% 49% 34% 31% 40% 37%
Very favorable 236 108 127 71 62 62 41 114 48 61 6 17 190 24 126 81 28 197 10 3 81 154 111 86 39 95 132
12% 12% 12% 14% 13% 11% 10% 9% 19% 27% 8% 3% 26% 4% 24% 10% 5% 26% 1% 2% 12% 12% 20% 9% 9% 12% 13%
Favorable 502 209 293 135 129 130 107 296 70 81 15 37 338 118 243 219 39 379 33 14 202 300 153 258 91 231 249
26% 22% 29% 27% 28% 22% 26% 23% 27% 36% 20% 6% 47% 21% 47% 26% 7% 50% 5% 8% 30% 23% 28% 26% 22% 28% 24%
Very Unfavorable/ 1127 598 529 256 257 367 247 862 118 58 51 538 156 388 141 462 524 149 629 155 364 763 256 600 272 464 593
Unfavorable (Sub-Net) 57% 64% 52% 51% 55% 63% 60% 66% 45% 26% 68% 89% 22% 69% 27% 55% 87% 20% 92% 86% 54% 59% 47% 60% 65% 57% 57%
Unfavorable 337 154 183 109 80 102 47 225 44 37 9 84 95 145 90 181 67 117 86 56 122 215 110 177 50 155 164
17% 16% 18% 22% 17% 18% 11% 17% 17% 17% 11% 14% 13% 26% 17% 22% 11% 15% 13% 31% 18% 17% 20% 18% 12% 19% 16%
Very unfavorable 790 444 346 148 177 265 201 637 74 21 42 453 61 243 51 281 458 31 542 99 242 549 145 423 222 309 430
40% 47% 34% 29% 38% 46% 48% 48% 28% 10% 56% 75% 8% 43% 10% 34% 76% 4% 80% 55% 36% 42% 27% 42% 53% 38% 41%
Never heard of them 10 3 7 4 1 - 5 2 1 5 * 4 5 1 - 8 2 5 * 1 1 10 4 3 3 2 8
1% * 1% 1% * - 1% * * 2% * 1% 1% * - 1% * 1% * 1% * 1% 1% * 1% * 1%
No opinion 87 23 64 34 18 21 14 40 24 16 2 9 33 33 12 64 11 30 9 8 23 64 21 55 12 19 56
4% 2% 6% 7% 4% 4% 3% 3% 9% 7% 3% 2% 5% 6% 2% 8% 2% 4% 1% 4% 3% 5% 4% 5% 3% 2% 5%
Sigma 1962 942 1020 502 467 580 414 1315 261 221 75 605 722 564 523 834 605 759 680 181 670 1292 545 1001 415 811 1039
100% 100% 100% 100% 100% 100% 100% 100% 100% 100% 100% 100% 100% 100% 100% 100% 100% 100% 100% 100% 100% 100% 100% 100% 100% 100% 100%

Page 33
QuickQuery
Fielding Period: January 13-16, 2018
HCAPS (Filtered on Registered Voters)
Weighted To The U.S. General Adult Population - Propensity
18 Jan 2018
Table 30
F1_2 Now we will show you some names. Please indicate if you have a favorable
or unfavorable view of that person - or if you've never heard of them.
Donald Trump
Base: All Respondents
Presidential
Election Candidate
Gender Age Ethnicity Political Party Political Ideology Voted For Education Locale Income
_____________ ______________________ _______________________ ____________________ ____________________ _____________________ _____________ ________________ _________
Colle- Some
Cons- ge Gr- Colle- $75K Less
Hisp- Black Repub- Democ- Indep- Libe- Mode- erva- 3rd ad And ge Or Urb- Subu- Or Than
Total Male Female 18-34 35-49 50-64 65+ White anic /AA Other lican rat endent ral rate tive Clinton Trump Party Higher Less an rban Rural More $75K
______ _____ _______ _____ _____ _____ ____ _____ _____ _____ _____ ______ ______ ______ ______ ______ ______ ________ ______ _____ ______ ______ ____ _____ _____ ____ ____
Unweighted Base 1962 882 1080 384 500 636 442 1530 136 183 39 600 711 571 518 818 626 731 698 184 700 1262 519 952 491 577 1275
Weighted Base 1962 942 1020 502 467 580 414 1315 261 221 75 605 722 564 523 834 605 759 680 181 670 1292 545 1001 415 811 1039
Effective Base 1157 573 585 220 294 390 295 974 90 119 28 385 404 332 294 468 401 424 438 101 434 728 315 555 298 384 744
Ever Heard Of (Net) 1899 917 982 489 446 569 395 1282 255 208 72 590 694 550 509 802 588 740 669 177 655 1245 530 969 401 787 1006
97% 97% 96% 97% 96% 98% 95% 98% 98% 94% 95% 98% 96% 97% 97% 96% 97% 98% 98% 98% 98% 96% 97% 97% 96% 97% 97%
Very Favorable/Favorable 758 436 322 161 173 250 174 610 65 25 37 481 48 199 55 259 444 28 580 36 237 521 194 366 198 312 403
(Sub-Net) 39% 46% 32% 32% 37% 43% 42% 46% 25% 12% 49% 80% 7% 35% 10% 31% 73% 4% 85% 20% 35% 40% 36% 37% 48% 38% 39%
Very favorable 368 223 144 72 73 119 104 313 24 8 14 278 10 72 28 95 245 11 320 4 106 261 105 165 98 144 207
19% 24% 14% 14% 16% 20% 25% 24% 9% 3% 19% 46% 1% 13% 5% 11% 40% 1% 47% 2% 16% 20% 19% 16% 24% 18% 20%
Favorable 390 213 178 89 100 131 70 297 40 18 23 203 37 127 27 164 199 16 260 32 130 260 89 201 100 168 196
20% 23% 17% 18% 21% 23% 17% 23% 15% 8% 30% 34% 5% 23% 5% 20% 33% 2% 38% 18% 19% 20% 16% 20% 24% 21% 19%
Very Unfavorable/ 1141 482 660 328 273 319 221 672 190 183 35 110 646 351 454 543 143 713 89 141 418 724 335 603 203 475 604
Unfavorable (Sub-Net) 58% 51% 65% 65% 59% 55% 53% 51% 73% 83% 47% 18% 90% 62% 87% 65% 24% 94% 13% 78% 62% 56% 62% 60% 49% 59% 58%
Unfavorable 209 93 117 63 58 55 34 147 30 13 7 66 65 70 33 112 65 69 55 35 74 136 53 124 33 95 95
11% 10% 11% 13% 12% 9% 8% 11% 12% 6% 10% 11% 9% 12% 6% 13% 11% 9% 8% 20% 11% 11% 10% 12% 8% 12% 9%
Very unfavorable 932 389 543 265 216 264 187 524 160 170 28 43 581 281 422 431 79 644 34 106 344 588 282 480 170 380 508
48% 41% 53% 53% 46% 46% 45% 40% 61% 77% 37% 7% 81% 50% 81% 52% 13% 85% 5% 58% 51% 46% 52% 48% 41% 47% 49%
Never heard of them 8 3 5 1 3 - 4 1 - 5 - - 8 - 1 5 2 5 - - - 8 6 - 2 - 8
* * 1% * 1% - 1% * - 2% - - 1% - * 1% * 1% - - - 1% 1% - * - 1%
No opinion 55 22 33 12 18 11 14 32 7 7 3 14 20 15 12 27 16 13 11 4 16 39 9 32 13 24 25
3% 2% 3% 2% 4% 2% 3% 2% 2% 3% 5% 2% 3% 3% 2% 3% 3% 2% 2% 2% 2% 3% 2% 3% 3% 3% 2%
Sigma 1962 942 1020 502 467 580 414 1315 261 221 75 605 722 564 523 834 605 759 680 181 670 1292 545 1001 415 811 1039
100% 100% 100% 100% 100% 100% 100% 100% 100% 100% 100% 100% 100% 100% 100% 100% 100% 100% 100% 100% 100% 100% 100% 100% 100% 100% 100%
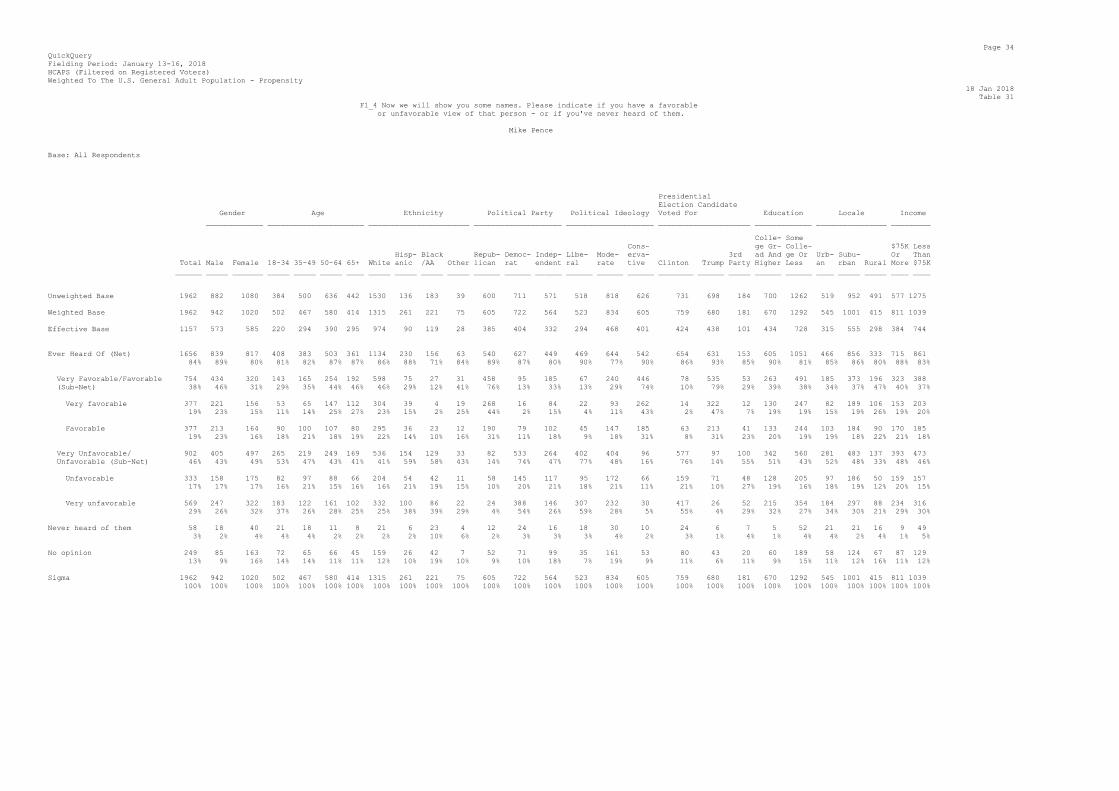
Page 34
QuickQuery
Fielding Period: January 13-16, 2018
HCAPS (Filtered on Registered Voters)
Weighted To The U.S. General Adult Population - Propensity
18 Jan 2018
Table 31
F1_4 Now we will show you some names. Please indicate if you have a favorable
or unfavorable view of that person - or if you've never heard of them.
Mike Pence
Base: All Respondents
Presidential
Election Candidate
Gender Age Ethnicity Political Party Political Ideology Voted For Education Locale Income
_____________ ______________________ _______________________ ____________________ ____________________ _____________________ _____________ ________________ _________
Colle- Some
Cons- ge Gr- Colle- $75K Less
Hisp- Black Repub- Democ- Indep- Libe- Mode- erva- 3rd ad And ge Or Urb- Subu- Or Than
Total Male Female 18-34 35-49 50-64 65+ White anic /AA Other lican rat endent ral rate tive Clinton Trump Party Higher Less an rban Rural More $75K
______ _____ _______ _____ _____ _____ ____ _____ _____ _____ _____ ______ ______ ______ ______ ______ ______ ________ ______ _____ ______ ______ ____ _____ _____ ____ ____
Unweighted Base 1962 882 1080 384 500 636 442 1530 136 183 39 600 711 571 518 818 626 731 698 184 700 1262 519 952 491 577 1275
Weighted Base 1962 942 1020 502 467 580 414 1315 261 221 75 605 722 564 523 834 605 759 680 181 670 1292 545 1001 415 811 1039
Effective Base 1157 573 585 220 294 390 295 974 90 119 28 385 404 332 294 468 401 424 438 101 434 728 315 555 298 384 744
Ever Heard Of (Net) 1656 839 817 408 383 503 361 1134 230 156 63 540 627 449 469 644 542 654 631 153 605 1051 466 856 333 715 861
84% 89% 80% 81% 82% 87% 87% 86% 88% 71% 84% 89% 87% 80% 90% 77% 90% 86% 93% 85% 90% 81% 85% 86% 80% 88% 83%
Very Favorable/Favorable 754 434 320 143 165 254 192 598 75 27 31 458 95 185 67 240 446 78 535 53 263 491 185 373 196 323 388
(Sub-Net) 38% 46% 31% 29% 35% 44% 46% 46% 29% 12% 41% 76% 13% 33% 13% 29% 74% 10% 79% 29% 39% 38% 34% 37% 47% 40% 37%
Very favorable 377 221 156 53 65 147 112 304 39 4 19 268 16 84 22 93 262 14 322 12 130 247 82 189 106 153 203
19% 23% 15% 11% 14% 25% 27% 23% 15% 2% 25% 44% 2% 15% 4% 11% 43% 2% 47% 7% 19% 19% 15% 19% 26% 19% 20%
Favorable 377 213 164 90 100 107 80 295 36 23 12 190 79 102 45 147 185 63 213 41 133 244 103 184 90 170 185
19% 23% 16% 18% 21% 18% 19% 22% 14% 10% 16% 31% 11% 18% 9% 18% 31% 8% 31% 23% 20% 19% 19% 18% 22% 21% 18%
Very Unfavorable/ 902 405 497 265 219 249 169 536 154 129 33 82 533 264 402 404 96 577 97 100 342 560 281 483 137 393 473
Unfavorable (Sub-Net) 46% 43% 49% 53% 47% 43% 41% 41% 59% 58% 43% 14% 74% 47% 77% 48% 16% 76% 14% 55% 51% 43% 52% 48% 33% 48% 46%
Unfavorable 333 158 175 82 97 88 66 204 54 42 11 58 145 117 95 172 66 159 71 48 128 205 97 186 50 159 157
17% 17% 17% 16% 21% 15% 16% 16% 21% 19% 15% 10% 20% 21% 18% 21% 11% 21% 10% 27% 19% 16% 18% 19% 12% 20% 15%
Very unfavorable 569 247 322 183 122 161 102 332 100 86 22 24 388 146 307 232 30 417 26 52 215 354 184 297 88 234 316
29% 26% 32% 37% 26% 28% 25% 25% 38% 39% 29% 4% 54% 26% 59% 28% 5% 55% 4% 29% 32% 27% 34% 30% 21% 29% 30%
Never heard of them 58 18 40 21 18 11 8 21 6 23 4 12 24 16 18 30 10 24 6 7 5 52 21 21 16 9 49
3% 2% 4% 4% 4% 2% 2% 2% 2% 10% 6% 2% 3% 3% 3% 4% 2% 3% 1% 4% 1% 4% 4% 2% 4% 1% 5%
No opinion 249 85 163 72 65 66 45 159 26 42 7 52 71 99 35 161 53 80 43 20 60 189 58 124 67 87 129
13% 9% 16% 14% 14% 11% 11% 12% 10% 19% 10% 9% 10% 18% 7% 19% 9% 11% 6% 11% 9% 15% 11% 12% 16% 11% 12%
Sigma 1962 942 1020 502 467 580 414 1315 261 221 75 605 722 564 523 834 605 759 680 181 670 1292 545 1001 415 811 1039
100% 100% 100% 100% 100% 100% 100% 100% 100% 100% 100% 100% 100% 100% 100% 100% 100% 100% 100% 100% 100% 100% 100% 100% 100% 100% 100%

Page 35
QuickQuery
Fielding Period: January 13-16, 2018
HCAPS (Filtered on Registered Voters)
Weighted To The U.S. General Adult Population - Propensity
18 Jan 2018
Table 32
F1_8 Now we will show you some names. Please indicate if you have a favorable
or unfavorable view of that person - or if you've never heard of them.
Paul Ryan
Base: All Respondents
Presidential
Election Candidate
Gender Age Ethnicity Political Party Political Ideology Voted For Education Locale Income
_____________ ______________________ _______________________ ____________________ ____________________ _____________________ _____________ ________________ _________
Colle- Some
Cons- ge Gr- Colle- $75K Less
Hisp- Black Repub- Democ- Indep- Libe- Mode- erva- 3rd ad And ge Or Urb- Subu- Or Than
Total Male Female 18-34 35-49 50-64 65+ White anic /AA Other lican rat endent ral rate tive Clinton Trump Party Higher Less an rban Rural More $75K
______ _____ _______ _____ _____ _____ ____ _____ _____ _____ _____ ______ ______ ______ ______ ______ ______ ________ ______ _____ ______ ______ ____ _____ _____ ____ ____
Unweighted Base 1962 882 1080 384 500 636 442 1530 136 183 39 600 711 571 518 818 626 731 698 184 700 1262 519 952 491 577 1275
Weighted Base 1962 942 1020 502 467 580 414 1315 261 221 75 605 722 564 523 834 605 759 680 181 670 1292 545 1001 415 811 1039
Effective Base 1157 573 585 220 294 390 295 974 90 119 28 385 404 332 294 468 401 424 438 101 434 728 315 555 298 384 744
Ever Heard Of (Net) 1562 825 737 353 365 493 350 1078 207 159 65 505 585 429 458 606 498 640 584 153 587 975 430 801 331 673 811
80% 88% 72% 70% 78% 85% 85% 82% 79% 72% 86% 83% 81% 76% 88% 73% 82% 84% 86% 85% 88% 75% 79% 80% 80% 83% 78%
Very Favorable/Favorable 645 369 276 144 143 198 160 501 57 42 28 381 89 154 72 227 346 98 416 50 240 405 158 331 156 283 323
(Sub-Net) 33% 39% 27% 29% 31% 34% 39% 38% 22% 19% 37% 63% 12% 27% 14% 27% 57% 13% 61% 28% 36% 31% 29% 33% 37% 35% 31%
Very favorable 125 67 58 41 23 33 29 100 7 9 2 91 15 17 19 41 65 18 89 2 44 81 33 58 34 54 71
6% 7% 6% 8% 5% 6% 7% 8% 3% 4% 3% 15% 2% 3% 4% 5% 11% 2% 13% 1% 7% 6% 6% 6% 8% 7% 7%
Favorable 520 302 218 103 120 165 132 401 50 32 26 290 74 138 53 186 281 80 327 49 197 323 125 274 121 230 252
26% 32% 21% 21% 26% 28% 32% 31% 19% 15% 34% 48% 10% 24% 10% 22% 46% 11% 48% 27% 29% 25% 23% 27% 29% 28% 24%
Very Unfavorable/ 917 456 461 210 223 295 190 577 150 117 37 123 496 274 386 379 152 542 168 103 347 570 272 470 175 389 488
Unfavorable (Sub-Net) 47% 48% 45% 42% 48% 51% 46% 44% 58% 53% 49% 20% 69% 49% 74% 45% 25% 71% 25% 57% 52% 44% 50% 47% 42% 48% 47%
Unfavorable 398 212 187 84 125 113 76 279 58 41 7 96 174 119 105 171 122 183 132 41 156 242 118 195 85 180 202
20% 22% 18% 17% 27% 19% 18% 21% 22% 19% 9% 16% 24% 21% 20% 21% 20% 24% 19% 23% 23% 19% 22% 20% 20% 22% 19%
Very unfavorable 519 244 275 126 97 182 114 298 93 76 30 27 321 155 280 208 30 360 36 61 191 328 154 275 90 210 285
26% 26% 27% 25% 21% 31% 27% 23% 36% 34% 39% 4% 45% 27% 54% 25% 5% 47% 5% 34% 28% 25% 28% 27% 22% 26% 27%
Never heard of them 105 28 77 57 22 19 7 46 18 23 6 21 49 30 21 63 22 35 10 6 11 94 46 45 14 34 67
5% 3% 8% 11% 5% 3% 2% 4% 7% 10% 8% 3% 7% 5% 4% 8% 4% 5% 1% 3% 2% 7% 8% 5% 3% 4% 6%
No opinion 295 89 206 91 79 68 57 191 36 39 4 79 88 106 44 166 85 84 87 22 72 223 70 155 71 104 162
15% 9% 20% 18% 17% 12% 14% 14% 14% 18% 6% 13% 12% 19% 8% 20% 14% 11% 13% 12% 11% 17% 13% 15% 17% 13% 16%
Sigma 1962 942 1020 502 467 580 414 1315 261 221 75 605 722 564 523 834 605 759 680 181 670 1292 545 1001 415 811 1039
100% 100% 100% 100% 100% 100% 100% 100% 100% 100% 100% 100% 100% 100% 100% 100% 100% 100% 100% 100% 100% 100% 100% 100% 100% 100% 100%

Page 36
QuickQuery
Fielding Period: January 13-16, 2018
HCAPS (Filtered on Registered Voters)
Weighted To The U.S. General Adult Population - Propensity
18 Jan 2018
Table 33
F1_9 Now we will show you some names. Please indicate if you have a favorable
or unfavorable view of that person - or if you've never heard of them.
Nancy Pelosi
Base: All Respondents
Presidential
Election Candidate
Gender Age Ethnicity Political Party Political Ideology Voted For Education Locale Income
_____________ ______________________ _______________________ ____________________ ____________________ _____________________ _____________ ________________ _________
Colle- Some
Cons- ge Gr- Colle- $75K Less
Hisp- Black Repub- Democ- Indep- Libe- Mode- erva- 3rd ad And ge Or Urb- Subu- Or Than
Total Male Female 18-34 35-49 50-64 65+ White anic /AA Other lican rat endent ral rate tive Clinton Trump Party Higher Less an rban Rural More $75K
______ _____ _______ _____ _____ _____ ____ _____ _____ _____ _____ ______ ______ ______ ______ ______ ______ ________ ______ _____ ______ ______ ____ _____ _____ ____ ____
Unweighted Base 1962 882 1080 384 500 636 442 1530 136 183 39 600 711 571 518 818 626 731 698 184 700 1262 519 952 491 577 1275
Weighted Base 1962 942 1020 502 467 580 414 1315 261 221 75 605 722 564 523 834 605 759 680 181 670 1292 545 1001 415 811 1039
Effective Base 1157 573 585 220 294 390 295 974 90 119 28 385 404 332 294 468 401 424 438 101 434 728 315 555 298 384 744
Ever Heard Of (Net) 1547 838 709 307 364 504 372 1087 197 144 57 530 543 438 415 592 541 585 622 150 594 954 429 798 320 686 785
79% 89% 70% 61% 78% 87% 90% 83% 75% 65% 75% 88% 75% 78% 79% 71% 89% 77% 91% 83% 89% 74% 79% 80% 77% 85% 76%
Very Favorable/Favorable 568 275 293 127 132 173 137 354 74 95 10 71 362 130 281 216 70 396 69 33 259 308 210 262 95 266 285
(Sub-Net) 29% 29% 29% 25% 28% 30% 33% 27% 28% 43% 14% 12% 50% 23% 54% 26% 12% 52% 10% 18% 39% 24% 39% 26% 23% 33% 27%
Very favorable 116 62 53 37 18 34 27 60 24 24 1 19 88 9 70 37 8 95 13 1 49 66 59 40 17 46 63
6% 7% 5% 7% 4% 6% 7% 5% 9% 11% 1% 3% 12% 2% 13% 4% 1% 13% 2% 1% 7% 5% 11% 4% 4% 6% 6%
Favorable 452 212 240 90 114 139 110 294 50 71 9 52 275 121 211 179 62 301 57 32 210 242 152 222 78 220 221
23% 23% 23% 18% 24% 24% 26% 22% 19% 32% 12% 9% 38% 21% 40% 21% 10% 40% 8% 18% 31% 19% 28% 22% 19% 27% 21%
Very Unfavorable/ 979 563 416 180 233 331 236 733 123 49 46 459 180 308 133 376 470 189 553 117 334 645 218 536 225 420 500
Unfavorable (Sub-Net) 50% 60% 41% 36% 50% 57% 57% 56% 47% 22% 62% 76% 25% 55% 26% 45% 78% 25% 81% 65% 50% 50% 40% 54% 54% 52% 48%
Unfavorable 334 188 146 91 93 93 57 227 58 24 11 101 117 110 90 159 85 124 100 52 121 213 102 172 60 153 158
17% 20% 14% 18% 20% 16% 14% 17% 22% 11% 14% 17% 16% 20% 17% 19% 14% 16% 15% 29% 18% 16% 19% 17% 14% 19% 15%
Very unfavorable 646 375 270 89 140 238 179 506 65 25 36 358 63 198 43 217 385 65 453 65 213 432 116 364 165 266 342
33% 40% 26% 18% 30% 41% 43% 39% 25% 11% 47% 59% 9% 35% 8% 26% 64% 9% 67% 36% 32% 33% 21% 36% 40% 33% 33%
Never heard of them 119 19 100 79 22 13 5 51 17 31 6 17 68 28 35 65 19 45 11 12 7 112 43 58 18 38 71
6% 2% 10% 16% 5% 2% 1% 4% 7% 14% 8% 3% 9% 5% 7% 8% 3% 6% 2% 6% 1% 9% 8% 6% 4% 5% 7%
No opinion 296 85 211 116 81 63 36 176 47 46 13 58 111 99 73 178 46 129 47 19 69 226 74 145 77 87 183
15% 9% 21% 23% 17% 11% 9% 13% 18% 21% 17% 10% 15% 18% 14% 21% 8% 17% 7% 11% 10% 18% 13% 15% 18% 11% 18%
Sigma 1962 942 1020 502 467 580 414 1315 261 221 75 605 722 564 523 834 605 759 680 181 670 1292 545 1001 415 811 1039
100% 100% 100% 100% 100% 100% 100% 100% 100% 100% 100% 100% 100% 100% 100% 100% 100% 100% 100% 100% 100% 100% 100% 100% 100% 100% 100%

Page 37
QuickQuery
Fielding Period: January 13-16, 2018
HCAPS (Filtered on Registered Voters)
Weighted To The U.S. General Adult Population - Propensity
18 Jan 2018
Table 34
F1_10 Now we will show you some names. Please indicate if you have a favorable
or unfavorable view of that person - or if you've never heard of them.
Mitch McConnell
Base: All Respondents
Presidential
Election Candidate
Gender Age Ethnicity Political Party Political Ideology Voted For Education Locale Income
_____________ ______________________ _______________________ ____________________ ____________________ _____________________ _____________ ________________ _________
Colle- Some
Cons- ge Gr- Colle- $75K Less
Hisp- Black Repub- Democ- Indep- Libe- Mode- erva- 3rd ad And ge Or Urb- Subu- Or Than
Total Male Female 18-34 35-49 50-64 65+ White anic /AA Other lican rat endent ral rate tive Clinton Trump Party Higher Less an rban Rural More $75K
______ _____ _______ _____ _____ _____ ____ _____ _____ _____ _____ ______ ______ ______ ______ ______ ______ ________ ______ _____ ______ ______ ____ _____ _____ ____ ____
Unweighted Base 1962 882 1080 384 500 636 442 1530 136 183 39 600 711 571 518 818 626 731 698 184 700 1262 519 952 491 577 1275
Weighted Base 1962 942 1020 502 467 580 414 1315 261 221 75 605 722 564 523 834 605 759 680 181 670 1292 545 1001 415 811 1039
Effective Base 1157 573 585 220 294 390 295 974 90 119 28 385 404 332 294 468 401 424 438 101 434 728 315 555 298 384 744
Ever Heard Of (Net) 1286 739 547 267 284 418 317 899 165 123 48 409 482 370 388 487 411 544 479 125 517 769 365 664 257 572 652
66% 78% 54% 53% 61% 72% 77% 68% 63% 56% 64% 68% 67% 66% 74% 58% 68% 72% 70% 69% 77% 60% 67% 66% 62% 71% 63%
Very Favorable/Favorable 400 254 146 88 95 113 103 300 35 29 15 236 64 95 62 135 203 73 251 31 164 236 129 195 76 184 201
(Sub-Net) 20% 27% 14% 17% 20% 20% 25% 23% 14% 13% 20% 39% 9% 17% 12% 16% 34% 10% 37% 17% 24% 18% 24% 19% 18% 23% 19%
Very favorable 49 32 17 25 11 7 5 35 3 8 - 29 11 9 21 14 15 15 28 3 27 22 28 11 10 24 25
3% 3% 2% 5% 2% 1% 1% 3% 1% 4% - 5% 1% 2% 4% 2% 2% 2% 4% 2% 4% 2% 5% 1% 2% 3% 2%
Favorable 351 222 129 63 84 106 98 266 33 21 15 207 54 86 41 122 188 58 224 28 137 214 101 183 66 160 176
18% 24% 13% 13% 18% 18% 24% 20% 12% 9% 20% 34% 7% 15% 8% 15% 31% 8% 33% 15% 20% 17% 18% 18% 16% 20% 17%
Very Unfavorable/ 886 486 401 179 188 305 214 599 130 94 33 173 417 275 327 352 208 470 227 94 353 533 236 469 181 388 451
Unfavorable (Sub-Net) 45% 52% 39% 36% 40% 53% 52% 46% 50% 43% 44% 29% 58% 49% 63% 42% 34% 62% 33% 52% 53% 41% 43% 47% 44% 48% 43%
Unfavorable 386 225 161 79 95 127 86 275 63 28 10 128 133 118 68 176 141 144 162 30 147 239 85 209 92 168 195
20% 24% 16% 16% 20% 22% 21% 21% 24% 13% 13% 21% 18% 21% 13% 21% 23% 19% 24% 17% 22% 19% 16% 21% 22% 21% 19%
Very unfavorable 500 260 240 100 94 178 128 323 67 67 23 46 285 157 258 175 67 326 65 64 206 294 151 261 89 220 257
25% 28% 24% 20% 20% 31% 31% 25% 25% 30% 31% 8% 39% 28% 49% 21% 11% 43% 10% 35% 31% 23% 28% 26% 21% 27% 25%
Never heard of them 243 61 181 121 65 41 16 119 54 39 11 51 114 64 61 141 41 92 48 21 32 211 80 107 55 85 151
12% 7% 18% 24% 14% 7% 4% 9% 21% 18% 14% 8% 16% 11% 12% 17% 7% 12% 7% 12% 5% 16% 15% 11% 13% 11% 15%
No opinion 433 141 292 114 118 121 80 296 42 59 16 144 127 130 73 207 153 124 154 35 122 312 100 230 103 153 236
22% 15% 29% 23% 25% 21% 19% 23% 16% 27% 22% 24% 18% 23% 14% 25% 25% 16% 23% 19% 18% 24% 18% 23% 25% 19% 23%
Sigma 1962 942 1020 502 467 580 414 1315 261 221 75 605 722 564 523 834 605 759 680 181 670 1292 545 1001 415 811 1039
100% 100% 100% 100% 100% 100% 100% 100% 100% 100% 100% 100% 100% 100% 100% 100% 100% 100% 100% 100% 100% 100% 100% 100% 100% 100% 100%

Page 38
QuickQuery
Fielding Period: January 13-16, 2018
HCAPS (Filtered on Registered Voters)
Weighted To The U.S. General Adult Population - Propensity
18 Jan 2018
Table 35
F1_11 Now we will show you some names. Please indicate if you have a favorable
or unfavorable view of that person - or if you've never heard of them.
Chuck Schumer
Base: All Respondents
Presidential
Election Candidate
Gender Age Ethnicity Political Party Political Ideology Voted For Education Locale Income
_____________ ______________________ _______________________ ____________________ ____________________ _____________________ _____________ ________________ _________
Colle- Some
Cons- ge Gr- Colle- $75K Less
Hisp- Black Repub- Democ- Indep- Libe- Mode- erva- 3rd ad And ge Or Urb- Subu- Or Than
Total Male Female 18-34 35-49 50-64 65+ White anic /AA Other lican rat endent ral rate tive Clinton Trump Party Higher Less an rban Rural More $75K
______ _____ _______ _____ _____ _____ ____ _____ _____ _____ _____ ______ ______ ______ ______ ______ ______ ________ ______ _____ ______ ______ ____ _____ _____ ____ ____
Unweighted Base 1962 882 1080 384 500 636 442 1530 136 183 39 600 711 571 518 818 626 731 698 184 700 1262 519 952 491 577 1275
Weighted Base 1962 942 1020 502 467 580 414 1315 261 221 75 605 722 564 523 834 605 759 680 181 670 1292 545 1001 415 811 1039
Effective Base 1157 573 585 220 294 390 295 974 90 119 28 385 404 332 294 468 401 424 438 101 434 728 315 555 298 384 744
Ever Heard Of (Net) 1211 708 503 237 285 394 294 862 149 101 51 405 428 347 344 446 421 478 491 117 515 695 327 641 242 550 599
62% 75% 49% 47% 61% 68% 71% 66% 57% 46% 68% 67% 59% 62% 66% 53% 70% 63% 72% 65% 77% 54% 60% 64% 58% 68% 58%
Very Favorable/Favorable 488 254 234 99 114 157 117 313 69 71 11 77 279 126 239 194 55 330 85 25 236 252 167 242 79 233 234
(Sub-Net) 25% 27% 23% 20% 25% 27% 28% 24% 26% 32% 14% 13% 39% 22% 46% 23% 9% 44% 12% 14% 35% 20% 31% 24% 19% 29% 23%
Very favorable 109 60 50 24 20 36 30 74 16 17 - 16 80 13 75 32 2 86 16 2 58 52 57 38 15 58 45
6% 6% 5% 5% 4% 6% 7% 6% 6% 7% - 3% 11% 2% 14% 4% * 11% 2% 1% 9% 4% 10% 4% 4% 7% 4%
Favorable 379 194 184 75 95 122 87 240 53 55 11 60 199 113 164 162 53 244 68 23 178 200 111 204 64 174 190
19% 21% 18% 15% 20% 21% 21% 18% 20% 25% 14% 10% 28% 20% 31% 19% 9% 32% 10% 13% 27% 16% 20% 20% 15% 21% 18%
Very Unfavorable/ 723 454 269 138 171 237 177 548 81 30 41 329 149 221 105 252 365 147 407 92 279 443 160 400 163 317 365
Unfavorable (Sub-Net) 37% 48% 26% 27% 37% 41% 43% 42% 31% 14% 54% 54% 21% 39% 20% 30% 60% 19% 60% 51% 42% 34% 29% 40% 39% 39% 35%
Unfavorable 301 176 125 71 81 85 63 231 31 18 8 114 90 90 69 135 97 92 125 50 115 186 81 166 55 130 155
15% 19% 12% 14% 17% 15% 15% 18% 12% 8% 11% 19% 13% 16% 13% 16% 16% 12% 18% 28% 17% 14% 15% 17% 13% 16% 15%
Very unfavorable 422 278 144 66 90 152 114 317 49 12 32 215 59 131 36 117 268 55 281 42 164 257 79 234 109 188 210
21% 30% 14% 13% 19% 26% 28% 24% 19% 6% 43% 35% 8% 23% 7% 14% 44% 7% 41% 23% 25% 20% 15% 23% 26% 23% 20%
Never heard of them 295 86 209 153 62 59 21 143 63 55 9 63 127 84 79 165 52 116 51 27 46 249 93 137 65 103 178
15% 9% 20% 31% 13% 10% 5% 11% 24% 25% 12% 10% 18% 15% 15% 20% 9% 15% 7% 15% 7% 19% 17% 14% 16% 13% 17%
No opinion 456 148 308 111 119 127 98 310 49 64 15 136 167 134 100 223 132 166 138 36 109 347 125 223 108 158 262
23% 16% 30% 22% 26% 22% 24% 24% 19% 29% 20% 22% 23% 24% 19% 27% 22% 22% 20% 20% 16% 27% 23% 22% 26% 20% 25%
Sigma 1962 942 1020 502 467 580 414 1315 261 221 75 605 722 564 523 834 605 759 680 181 670 1292 545 1001 415 811 1039
100% 100% 100% 100% 100% 100% 100% 100% 100% 100% 100% 100% 100% 100% 100% 100% 100% 100% 100% 100% 100% 100% 100% 100% 100% 100% 100%

Page 39
QuickQuery
Fielding Period: January 13-16, 2018
HCAPS (Filtered on Registered Voters)
Weighted To The U.S. General Adult Population - Propensity
18 Jan 2018
Table 36
F1_12 Now we will show you some names. Please indicate if you have a favorable
or unfavorable view of that person - or if you've never heard of them.
Bernie Sanders
Base: All Respondents
Presidential
Election Candidate
Gender Age Ethnicity Political Party Political Ideology Voted For Education Locale Income
_____________ ______________________ _______________________ ____________________ ____________________ _____________________ _____________ ________________ _________
Colle- Some
Cons- ge Gr- Colle- $75K Less
Hisp- Black Repub- Democ- Indep- Libe- Mode- erva- 3rd ad And ge Or Urb- Subu- Or Than
Total Male Female 18-34 35-49 50-64 65+ White anic /AA Other lican rat endent ral rate tive Clinton Trump Party Higher Less an rban Rural More $75K
______ _____ _______ _____ _____ _____ ____ _____ _____ _____ _____ ______ ______ ______ ______ ______ ______ ________ ______ _____ ______ ______ ____ _____ _____ ____ ____
Unweighted Base 1962 882 1080 384 500 636 442 1530 136 183 39 600 711 571 518 818 626 731 698 184 700 1262 519 952 491 577 1275
Weighted Base 1962 942 1020 502 467 580 414 1315 261 221 75 605 722 564 523 834 605 759 680 181 670 1292 545 1001 415 811 1039
Effective Base 1157 573 585 220 294 390 295 974 90 119 28 385 404 332 294 468 401 424 438 101 434 728 315 555 298 384 744
Ever Heard Of (Net) 1745 878 867 455 396 523 371 1168 242 193 66 538 653 503 487 719 539 696 615 174 640 1105 501 897 347 744 905
89% 93% 85% 91% 85% 90% 90% 89% 93% 87% 87% 89% 90% 89% 93% 86% 89% 92% 90% 97% 95% 86% 92% 90% 84% 92% 87%
Very Favorable/Favorable 1038 471 567 321 240 285 192 609 172 167 32 147 564 301 450 470 118 609 165 90 396 642 351 512 175 442 542
(Sub-Net) 53% 50% 56% 64% 51% 49% 46% 46% 66% 76% 42% 24% 78% 53% 86% 56% 19% 80% 24% 50% 59% 50% 64% 51% 42% 55% 52%
Very favorable 365 151 214 143 75 93 55 196 78 60 8 21 249 91 225 120 21 254 26 32 143 222 127 179 59 154 199
19% 16% 21% 29% 16% 16% 13% 15% 30% 27% 11% 4% 35% 16% 43% 14% 3% 33% 4% 18% 21% 17% 23% 18% 14% 19% 19%
Favorable 673 319 353 178 165 192 137 413 95 107 24 125 315 209 226 350 97 356 138 57 253 420 224 333 116 288 343
34% 34% 35% 36% 35% 33% 33% 31% 36% 49% 31% 21% 44% 37% 43% 42% 16% 47% 20% 32% 38% 33% 41% 33% 28% 36% 33%
Very Unfavorable/ 707 407 300 134 156 238 179 559 70 26 34 391 89 202 37 249 421 87 450 85 244 463 151 385 172 301 363
Unfavorable (Sub-Net) 36% 43% 29% 27% 34% 41% 43% 43% 27% 12% 45% 65% 12% 36% 7% 30% 70% 11% 66% 47% 36% 36% 28% 38% 41% 37% 35%
Unfavorable 319 165 155 57 86 97 80 247 36 11 15 156 52 105 19 137 164 54 173 49 127 193 73 178 68 152 151
16% 17% 15% 11% 18% 17% 19% 19% 14% 5% 20% 26% 7% 19% 4% 16% 27% 7% 25% 27% 19% 15% 13% 18% 16% 19% 15%
Very unfavorable 388 243 145 77 70 141 99 311 34 15 19 235 37 97 18 112 258 32 278 35 117 270 77 207 104 149 212
20% 26% 14% 15% 15% 24% 24% 24% 13% 7% 25% 39% 5% 17% 3% 13% 43% 4% 41% 20% 18% 21% 14% 21% 25% 18% 20%
Never heard of them 27 7 20 8 12 3 4 13 2 7 2 11 15 1 5 12 10 10 5 - * 26 8 9 10 6 21
1% 1% 2% 2% 3% * 1% 1% 1% 3% 3% 2% 2% * 1% 1% 2% 1% 1% - * 2% 1% 1% 2% 1% 2%
No opinion 190 57 134 38 58 55 39 133 17 21 7 56 54 61 31 104 56 53 60 6 30 160 36 96 58 61 113
10% 6% 13% 8% 12% 9% 9% 10% 7% 10% 10% 9% 8% 11% 6% 12% 9% 7% 9% 3% 4% 12% 7% 10% 14% 8% 11%
Sigma 1962 942 1020 502 467 580 414 1315 261 221 75 605 722 564 523 834 605 759 680 181 670 1292 545 1001 415 811 1039
100% 100% 100% 100% 100% 100% 100% 100% 100% 100% 100% 100% 100% 100% 100% 100% 100% 100% 100% 100% 100% 100% 100% 100% 100% 100% 100%

Page 40
QuickQuery
Fielding Period: January 13-16, 2018
HCAPS (Filtered on Registered Voters)
Weighted To The U.S. General Adult Population - Propensity
18 Jan 2018
Table 37
F1_13 Now we will show you some names. Please indicate if you have a favorable
or unfavorable view of that person - or if you've never heard of them.
Elizabeth Warren
Base: All Respondents
Presidential
Election Candidate
Gender Age Ethnicity Political Party Political Ideology Voted For Education Locale Income
_____________ ______________________ _______________________ ____________________ ____________________ _____________________ _____________ ________________ _________
Colle- Some
Cons- ge Gr- Colle- $75K Less
Hisp- Black Repub- Democ- Indep- Libe- Mode- erva- 3rd ad And ge Or Urb- Subu- Or Than
Total Male Female 18-34 35-49 50-64 65+ White anic /AA Other lican rat endent ral rate tive Clinton Trump Party Higher Less an rban Rural More $75K
______ _____ _______ _____ _____ _____ ____ _____ _____ _____ _____ ______ ______ ______ ______ ______ ______ ________ ______ _____ ______ ______ ____ _____ _____ ____ ____
Unweighted Base 1962 882 1080 384 500 636 442 1530 136 183 39 600 711 571 518 818 626 731 698 184 700 1262 519 952 491 577 1275
Weighted Base 1962 942 1020 502 467 580 414 1315 261 221 75 605 722 564 523 834 605 759 680 181 670 1292 545 1001 415 811 1039
Effective Base 1157 573 585 220 294 390 295 974 90 119 28 385 404 332 294 468 401 424 438 101 434 728 315 555 298 384 744
Ever Heard Of (Net) 1364 735 629 297 307 430 331 946 169 134 56 429 501 398 407 500 457 558 521 130 556 808 380 708 276 605 695
70% 78% 62% 59% 66% 74% 80% 72% 65% 61% 75% 71% 69% 71% 78% 60% 76% 74% 77% 72% 83% 63% 70% 71% 66% 75% 67%
Very Favorable/Favorable 672 318 354 164 155 194 159 434 88 93 18 83 408 169 352 248 72 461 92 50 305 367 236 323 113 304 336
(Sub-Net) 34% 34% 35% 33% 33% 33% 39% 33% 34% 42% 24% 14% 57% 30% 67% 30% 12% 61% 14% 27% 45% 28% 43% 32% 27% 37% 32%
Very favorable 265 123 142 79 52 77 57 159 47 37 7 21 197 47 192 63 11 214 18 12 137 128 95 132 38 127 128
14% 13% 14% 16% 11% 13% 14% 12% 18% 17% 9% 3% 27% 8% 37% 8% 2% 28% 3% 7% 20% 10% 18% 13% 9% 16% 12%
Favorable 407 195 211 85 103 117 102 275 41 56 11 63 211 122 160 185 61 247 74 37 168 239 141 191 75 177 208
21% 21% 21% 17% 22% 20% 25% 21% 16% 25% 15% 10% 29% 22% 31% 22% 10% 33% 11% 21% 25% 18% 26% 19% 18% 22% 20%
Very Unfavorable/ 692 417 276 133 152 236 172 512 80 41 38 346 93 230 55 252 385 97 428 81 251 441 144 385 163 302 359
Unfavorable (Sub-Net) 35% 44% 27% 27% 33% 41% 41% 39% 31% 19% 51% 57% 13% 41% 10% 30% 64% 13% 63% 45% 37% 34% 26% 38% 39% 37% 35%
Unfavorable 238 137 102 55 62 76 46 166 39 19 3 103 47 86 34 117 88 60 110 31 93 146 60 122 56 117 114
12% 15% 10% 11% 13% 13% 11% 13% 15% 9% 4% 17% 6% 15% 7% 14% 15% 8% 16% 17% 14% 11% 11% 12% 13% 14% 11%
Very unfavorable 454 280 174 78 90 160 126 346 42 22 35 243 46 144 21 136 297 37 318 50 159 295 84 263 107 184 245
23% 30% 17% 16% 19% 28% 30% 26% 16% 10% 47% 40% 6% 25% 4% 16% 49% 5% 47% 28% 24% 23% 15% 26% 26% 23% 24%
Never heard of them 229 73 156 120 65 34 10 118 41 42 10 63 101 51 54 121 55 81 44 19 20 209 84 98 47 70 139
12% 8% 15% 24% 14% 6% 3% 9% 16% 19% 13% 10% 14% 9% 10% 14% 9% 11% 6% 11% 3% 16% 15% 10% 11% 9% 13%
No opinion 369 134 235 85 95 116 72 250 52 45 9 113 120 115 62 213 93 119 116 31 94 275 81 195 93 136 205
19% 14% 23% 17% 20% 20% 17% 19% 20% 20% 12% 19% 17% 20% 12% 26% 15% 16% 17% 17% 14% 21% 15% 19% 22% 17% 20%
Sigma 1962 942 1020 502 467 580 414 1315 261 221 75 605 722 564 523 834 605 759 680 181 670 1292 545 1001 415 811 1039
100% 100% 100% 100% 100% 100% 100% 100% 100% 100% 100% 100% 100% 100% 100% 100% 100% 100% 100% 100% 100% 100% 100% 100% 100% 100% 100%

Page 41
QuickQuery
Fielding Period: January 13-16, 2018
HCAPS (Filtered on Registered Voters)
Weighted To The U.S. General Adult Population - Propensity
18 Jan 2018
Table 38
F1_21 Now we will show you some names. Please indicate if you have a favorable
or unfavorable view of that person - or if you've never heard of them.
Jeff Sessions
Base: All Respondents
Presidential
Election Candidate
Gender Age Ethnicity Political Party Political Ideology Voted For Education Locale Income
_____________ ______________________ _______________________ ____________________ ____________________ _____________________ _____________ ________________ _________
Colle- Some
Cons- ge Gr- Colle- $75K Less
Hisp- Black Repub- Democ- Indep- Libe- Mode- erva- 3rd ad And ge Or Urb- Subu- Or Than
Total Male Female 18-34 35-49 50-64 65+ White anic /AA Other lican rat endent ral rate tive Clinton Trump Party Higher Less an rban Rural More $75K
______ _____ _______ _____ _____ _____ ____ _____ _____ _____ _____ ______ ______ ______ ______ ______ ______ ________ ______ _____ ______ ______ ____ _____ _____ ____ ____
Unweighted Base 1962 882 1080 384 500 636 442 1530 136 183 39 600 711 571 518 818 626 731 698 184 700 1262 519 952 491 577 1275
Weighted Base 1962 942 1020 502 467 580 414 1315 261 221 75 605 722 564 523 834 605 759 680 181 670 1292 545 1001 415 811 1039
Effective Base 1157 573 585 220 294 390 295 974 90 119 28 385 404 332 294 468 401 424 438 101 434 728 315 555 298 384 744
Ever Heard Of (Net) 1331 750 581 289 311 418 313 911 178 129 60 414 515 374 403 511 416 569 489 137 541 790 395 679 256 606 662
68% 80% 57% 58% 67% 72% 76% 69% 68% 59% 79% 68% 71% 66% 77% 61% 69% 75% 72% 76% 81% 61% 72% 68% 62% 75% 64%
Very Favorable/Favorable 410 273 137 84 85 114 126 316 35 23 18 248 58 98 48 122 240 61 287 22 185 226 121 208 82 196 190
(Sub-Net) 21% 29% 13% 17% 18% 20% 31% 24% 14% 10% 24% 41% 8% 17% 9% 15% 40% 8% 42% 12% 28% 17% 22% 21% 20% 24% 18%
Very favorable 69 54 14 31 18 13 7 55 8 2 - 47 15 6 20 21 27 16 47 1 46 23 36 21 12 43 24
3% 6% 1% 6% 4% 2% 2% 4% 3% 1% - 8% 2% 1% 4% 3% 5% 2% 7% * 7% 2% 7% 2% 3% 5% 2%
Favorable 342 219 123 53 67 102 120 261 28 21 18 201 43 92 28 101 213 46 240 21 139 203 85 187 70 153 166
17% 23% 12% 11% 14% 18% 29% 20% 11% 9% 24% 33% 6% 16% 5% 12% 35% 6% 35% 11% 21% 16% 16% 19% 17% 19% 16%
Very Unfavorable/ 920 477 443 205 225 303 187 596 142 107 42 166 457 277 355 389 176 508 202 115 356 564 274 472 175 410 472
Unfavorable (Sub-Net) 47% 51% 43% 41% 48% 52% 45% 45% 54% 48% 55% 27% 63% 49% 68% 47% 29% 67% 30% 64% 53% 44% 50% 47% 42% 51% 45%
Unfavorable 364 193 172 71 106 120 67 250 53 32 15 120 115 124 79 164 122 118 152 50 128 237 110 173 82 164 183
19% 20% 17% 14% 23% 21% 16% 19% 20% 15% 19% 20% 16% 22% 15% 20% 20% 16% 22% 28% 19% 18% 20% 17% 20% 20% 18%
Very unfavorable 556 284 272 134 120 183 120 346 89 74 27 46 342 152 276 225 54 390 49 65 228 328 164 299 93 246 289
28% 30% 27% 27% 26% 32% 29% 26% 34% 34% 36% 8% 47% 27% 53% 27% 9% 51% 7% 36% 34% 25% 30% 30% 22% 30% 28%
Never heard of them 207 48 158 112 48 32 14 110 32 43 5 49 78 62 52 111 44 64 36 18 21 185 65 97 44 58 138
11% 5% 16% 22% 10% 6% 3% 8% 12% 19% 7% 8% 11% 11% 10% 13% 7% 8% 5% 10% 3% 14% 12% 10% 11% 7% 13%
No opinion 425 143 281 101 108 130 86 293 52 49 10 142 129 128 67 213 145 125 156 26 108 316 86 224 115 147 240
22% 15% 28% 20% 23% 22% 21% 22% 20% 22% 13% 23% 18% 23% 13% 25% 24% 17% 23% 14% 16% 25% 16% 22% 28% 18% 23%
Sigma 1962 942 1020 502 467 580 414 1315 261 221 75 605 722 564 523 834 605 759 680 181 670 1292 545 1001 415 811 1039
100% 100% 100% 100% 100% 100% 100% 100% 100% 100% 100% 100% 100% 100% 100% 100% 100% 100% 100% 100% 100% 100% 100% 100% 100% 100% 100%

Page 42
QuickQuery
Fielding Period: January 13-16, 2018
HCAPS (Filtered on Registered Voters)
Weighted To The U.S. General Adult Population - Propensity
18 Jan 2018
Table 39
F1_34 Now we will show you some names. Please indicate if you have a favorable
or unfavorable view of that person - or if you've never heard of them.
Robert Mueller
Base: All Respondents
Presidential
Election Candidate
Gender Age Ethnicity Political Party Political Ideology Voted For Education Locale Income
_____________ ______________________ _______________________ ____________________ ____________________ _____________________ _____________ ________________ _________
Colle- Some
Cons- ge Gr- Colle- $75K Less
Hisp- Black Repub- Democ- Indep- Libe- Mode- erva- 3rd ad And ge Or Urb- Subu- Or Than
Total Male Female 18-34 35-49 50-64 65+ White anic /AA Other lican rat endent ral rate tive Clinton Trump Party Higher Less an rban Rural More $75K
______ _____ _______ _____ _____ _____ ____ _____ _____ _____ _____ ______ ______ ______ ______ ______ ______ ________ ______ _____ ______ ______ ____ _____ _____ ____ ____
Unweighted Base 1962 882 1080 384 500 636 442 1530 136 183 39 600 711 571 518 818 626 731 698 184 700 1262 519 952 491 577 1275
Weighted Base 1962 942 1020 502 467 580 414 1315 261 221 75 605 722 564 523 834 605 759 680 181 670 1292 545 1001 415 811 1039
Effective Base 1157 573 585 220 294 390 295 974 90 119 28 385 404 332 294 468 401 424 438 101 434 728 315 555 298 384 744
Ever Heard Of (Net) 1190 699 490 218 280 397 295 831 153 117 45 389 433 344 352 443 395 489 458 118 502 687 348 611 231 554 577
61% 74% 48% 43% 60% 68% 71% 63% 59% 53% 60% 64% 60% 61% 67% 53% 65% 64% 67% 66% 75% 53% 64% 61% 56% 68% 56%
Very Favorable/Favorable 611 360 250 107 150 201 153 430 68 72 14 123 301 183 267 246 98 375 118 64 297 314 209 300 102 311 275
(Sub-Net) 31% 38% 25% 21% 32% 35% 37% 33% 26% 33% 18% 20% 42% 32% 51% 29% 16% 49% 17% 35% 44% 24% 38% 30% 24% 38% 26%
Very favorable 222 126 96 41 42 75 64 152 28 29 3 24 139 57 128 85 9 172 18 11 114 108 80 100 42 116 97
11% 13% 9% 8% 9% 13% 16% 12% 11% 13% 3% 4% 19% 10% 24% 10% 1% 23% 3% 6% 17% 8% 15% 10% 10% 14% 9%
Favorable 389 234 155 66 108 126 89 279 40 43 11 99 162 127 139 161 89 202 100 53 183 206 129 199 60 195 178
20% 25% 15% 13% 23% 22% 21% 21% 15% 19% 15% 16% 22% 22% 27% 19% 15% 27% 15% 29% 27% 16% 24% 20% 14% 24% 17%
Very Unfavorable/ 579 339 240 111 130 196 142 400 84 45 31 266 133 160 85 197 297 114 340 55 206 373 138 311 130 243 302
Unfavorable (Sub-Net) 30% 36% 24% 22% 28% 34% 34% 30% 32% 20% 41% 44% 18% 28% 16% 24% 49% 15% 50% 30% 31% 29% 25% 31% 31% 30% 29%
Unfavorable 319 181 139 61 75 101 81 219 45 25 14 158 71 76 46 118 155 63 178 38 121 198 83 168 69 142 157
16% 19% 14% 12% 16% 17% 20% 17% 17% 11% 19% 26% 10% 13% 9% 14% 26% 8% 26% 21% 18% 15% 15% 17% 17% 17% 15%
Very unfavorable 260 158 101 50 55 95 60 181 39 20 17 108 62 84 39 79 142 51 162 17 85 175 55 143 61 101 144
13% 17% 10% 10% 12% 16% 15% 14% 15% 9% 23% 18% 9% 15% 7% 9% 24% 7% 24% 9% 13% 14% 10% 14% 15% 13% 14%
Never heard of them 264 59 205 146 61 35 21 135 46 47 9 61 117 68 68 144 51 94 50 26 42 222 89 123 52 84 167
13% 6% 20% 29% 13% 6% 5% 10% 18% 21% 12% 10% 16% 12% 13% 17% 9% 12% 7% 15% 6% 17% 16% 12% 12% 10% 16%
No opinion 509 184 325 138 126 148 98 349 62 57 21 154 171 152 103 247 158 176 173 36 126 382 108 268 132 173 295
26% 20% 32% 27% 27% 25% 24% 27% 24% 26% 28% 25% 24% 27% 20% 30% 26% 23% 25% 20% 19% 30% 20% 27% 32% 21% 28%
Sigma 1962 942 1020 502 467 580 414 1315 261 221 75 605 722 564 523 834 605 759 680 181 670 1292 545 1001 415 811 1039
100% 100% 100% 100% 100% 100% 100% 100% 100% 100% 100% 100% 100% 100% 100% 100% 100% 100% 100% 100% 100% 100% 100% 100% 100% 100% 100%

Page 43
QuickQuery
Fielding Period: January 13-16, 2018
HCAPS (Filtered on Registered Voters)
Weighted To The U.S. General Adult Population - Propensity
18 Jan 2018
Table 40
F1_35 Now we will show you some names. Please indicate if you have a favorable
or unfavorable view of that person - or if you've never heard of them.
Stephen Bannon
Base: All Respondents
Presidential
Election Candidate
Gender Age Ethnicity Political Party Political Ideology Voted For Education Locale Income
_____________ ______________________ _______________________ ____________________ ____________________ _____________________ _____________ ________________ _________
Colle- Some
Cons- ge Gr- Colle- $75K Less
Hisp- Black Repub- Democ- Indep- Libe- Mode- erva- 3rd ad And ge Or Urb- Subu- Or Than
Total Male Female 18-34 35-49 50-64 65+ White anic /AA Other lican rat endent ral rate tive Clinton Trump Party Higher Less an rban Rural More $75K
______ _____ _______ _____ _____ _____ ____ _____ _____ _____ _____ ______ ______ ______ ______ ______ ______ ________ ______ _____ ______ ______ ____ _____ _____ ____ ____
Unweighted Base 1962 882 1080 384 500 636 442 1530 136 183 39 600 711 571 518 818 626 731 698 184 700 1262 519 952 491 577 1275
Weighted Base 1962 942 1020 502 467 580 414 1315 261 221 75 605 722 564 523 834 605 759 680 181 670 1292 545 1001 415 811 1039
Effective Base 1157 573 585 220 294 390 295 974 90 119 28 385 404 332 294 468 401 424 438 101 434 728 315 555 298 384 744
Ever Heard Of (Net) 1304 723 582 292 270 424 318 904 173 124 53 414 499 365 403 493 409 567 477 126 546 758 367 688 249 607 637
66% 77% 57% 58% 58% 73% 77% 69% 66% 56% 71% 68% 69% 65% 77% 59% 68% 75% 70% 70% 81% 59% 67% 69% 60% 75% 61%
Very Favorable/Favorable 179 122 57 69 49 43 19 135 22 12 3 92 39 44 47 72 60 47 102 12 77 103 67 85 27 93 82
(Sub-Net) 9% 13% 6% 14% 10% 7% 5% 10% 9% 5% 4% 15% 5% 8% 9% 9% 10% 6% 15% 6% 11% 8% 12% 8% 7% 11% 8%
Very favorable 25 22 3 17 5 2 1 16 5 2 - 16 6 3 10 10 5 4 16 * 19 7 15 7 4 17 8
1% 2% * 3% 1% * * 1% 2% 1% - 3% 1% * 2% 1% 1% * 2% * 3% 1% 3% 1% 1% 2% 1%
Favorable 154 101 53 52 44 40 18 120 17 10 3 76 33 41 37 62 55 44 86 11 58 96 53 78 24 76 74
8% 11% 5% 10% 9% 7% 4% 9% 7% 5% 4% 13% 5% 7% 7% 7% 9% 6% 13% 6% 9% 7% 10% 8% 6% 9% 7%
Very Unfavorable/ 1125 601 525 223 222 381 299 769 151 112 50 321 459 321 356 420 349 520 375 115 470 656 300 604 222 513 555
Unfavorable (Sub-Net) 57% 64% 51% 45% 47% 66% 72% 58% 58% 51% 66% 53% 64% 57% 68% 50% 58% 69% 55% 63% 70% 51% 55% 60% 53% 63% 53%
Unfavorable 376 202 173 89 90 102 95 260 46 38 14 185 83 101 55 134 187 89 209 34 145 230 93 196 87 167 189
19% 21% 17% 18% 19% 18% 23% 20% 18% 17% 19% 31% 11% 18% 10% 16% 31% 12% 31% 19% 22% 18% 17% 20% 21% 21% 18%
Very unfavorable 750 398 352 134 132 280 204 508 104 74 36 137 377 220 302 286 162 431 166 81 324 425 207 407 135 347 366
38% 42% 34% 27% 28% 48% 49% 39% 40% 33% 47% 23% 52% 39% 58% 34% 27% 57% 24% 45% 48% 33% 38% 41% 33% 43% 35%
Never heard of them 254 66 189 110 83 41 20 136 42 43 13 62 97 75 54 134 65 73 57 27 31 223 78 120 56 66 174
13% 7% 18% 22% 18% 7% 5% 10% 16% 20% 18% 10% 13% 13% 10% 16% 11% 10% 8% 15% 5% 17% 14% 12% 14% 8% 17%
No opinion 403 153 250 100 114 115 75 274 46 54 9 129 126 125 65 207 131 119 147 28 93 310 100 193 110 138 228
21% 16% 25% 20% 24% 20% 18% 21% 18% 24% 12% 21% 17% 22% 12% 25% 22% 16% 22% 16% 14% 24% 18% 19% 26% 17% 22%
Sigma 1962 942 1020 502 467 580 414 1315 261 221 75 605 722 564 523 834 605 759 680 181 670 1292 545 1001 415 811 1039
100% 100% 100% 100% 100% 100% 100% 100% 100% 100% 100% 100% 100% 100% 100% 100% 100% 100% 100% 100% 100% 100% 100% 100% 100% 100% 100%

Page 44
QuickQuery
Fielding Period: January 13-16, 2018
HCAPS (Filtered on Registered Voters)
Weighted To The U.S. General Adult Population - Propensity
18 Jan 2018
Table 41
F1_36 Now we will show you some names. Please indicate if you have a favorable
or unfavorable view of that person - or if you've never heard of them.
Oprah Winfrey
Base: All Respondents
Presidential
Election Candidate
Gender Age Ethnicity Political Party Political Ideology Voted For Education Locale Income
_____________ ______________________ _______________________ ____________________ ____________________ _____________________ _____________ ________________ _________
Colle- Some
Cons- ge Gr- Colle- $75K Less
Hisp- Black Repub- Democ- Indep- Libe- Mode- erva- 3rd ad And ge Or Urb- Subu- Or Than
Total Male Female 18-34 35-49 50-64 65+ White anic /AA Other lican rat endent ral rate tive Clinton Trump Party Higher Less an rban Rural More $75K
______ _____ _______ _____ _____ _____ ____ _____ _____ _____ _____ ______ ______ ______ ______ ______ ______ ________ ______ _____ ______ ______ ____ _____ _____ ____ ____
Unweighted Base 1962 882 1080 384 500 636 442 1530 136 183 39 600 711 571 518 818 626 731 698 184 700 1262 519 952 491 577 1275
Weighted Base 1962 942 1020 502 467 580 414 1315 261 221 75 605 722 564 523 834 605 759 680 181 670 1292 545 1001 415 811 1039
Effective Base 1157 573 585 220 294 390 295 974 90 119 28 385 404 332 294 468 401 424 438 101 434 728 315 555 298 384 744
Ever Heard Of (Net) 1752 857 895 446 421 528 358 1176 234 198 68 543 651 498 470 735 547 684 621 154 610 1143 500 879 374 737 916
89% 91% 88% 89% 90% 91% 87% 89% 90% 90% 91% 90% 90% 88% 90% 88% 90% 90% 91% 85% 91% 88% 92% 88% 90% 91% 88%
Very Favorable/Favorable 1121 490 631 322 292 305 202 702 165 168 36 210 559 314 408 513 199 609 218 91 416 705 374 532 215 490 576
(Sub-Net) 57% 52% 62% 64% 63% 53% 49% 53% 63% 76% 48% 35% 77% 56% 78% 61% 33% 80% 32% 50% 62% 55% 69% 53% 52% 60% 55%
Very favorable 429 149 280 150 104 102 72 226 84 90 7 48 266 99 191 188 50 275 48 18 142 287 166 186 76 179 230
22% 16% 27% 30% 22% 18% 17% 17% 32% 41% 9% 8% 37% 17% 37% 22% 8% 36% 7% 10% 21% 22% 31% 19% 18% 22% 22%
Favorable 692 341 351 171 188 203 130 476 81 78 30 162 293 216 217 325 149 335 169 73 274 418 207 346 138 311 346
35% 36% 34% 34% 40% 35% 31% 36% 31% 36% 40% 27% 41% 38% 42% 39% 25% 44% 25% 40% 41% 32% 38% 35% 33% 38% 33%
Very Unfavorable/ 632 367 264 124 129 223 156 475 69 30 32 333 92 183 62 222 348 75 403 63 194 438 126 347 159 247 340
Unfavorable (Sub-Net) 32% 39% 26% 25% 28% 38% 38% 36% 26% 13% 43% 55% 13% 32% 12% 27% 58% 10% 59% 35% 29% 34% 23% 35% 38% 30% 33%
Unfavorable 298 164 134 73 59 89 77 231 27 13 9 158 56 81 42 104 152 55 162 29 107 191 66 159 72 129 148
15% 17% 13% 15% 13% 15% 19% 18% 10% 6% 12% 26% 8% 14% 8% 12% 25% 7% 24% 16% 16% 15% 12% 16% 17% 16% 14%
Very unfavorable 334 204 130 51 70 134 79 244 42 17 23 175 36 102 20 118 196 20 241 34 87 247 60 188 87 119 192
17% 22% 13% 10% 15% 23% 19% 19% 16% 8% 30% 29% 5% 18% 4% 14% 32% 3% 35% 19% 13% 19% 11% 19% 21% 15% 18%
Never heard of them 13 * 13 2 6 1 4 3 5 4 - 6 7 * * 12 1 7 6 * 2 11 7 6 - 3 10
1% * 1% * 1% * 1% * 2% 2% - 1% 1% * * 1% * 1% 1% * * 1% 1% 1% - * 1%
No opinion 197 84 112 54 40 51 51 135 22 19 7 55 64 66 52 88 57 68 54 27 58 138 39 117 41 70 113
10% 9% 11% 11% 9% 9% 12% 10% 8% 8% 9% 9% 9% 12% 10% 10% 9% 9% 8% 15% 9% 11% 7% 12% 10% 9% 11%
Sigma 1962 942 1020 502 467 580 414 1315 261 221 75 605 722 564 523 834 605 759 680 181 670 1292 545 1001 415 811 1039
100% 100% 100% 100% 100% 100% 100% 100% 100% 100% 100% 100% 100% 100% 100% 100% 100% 100% 100% 100% 100% 100% 100% 100% 100% 100% 100%

Page 45
QuickQuery
Fielding Period: January 13-16, 2018
HCAPS (Filtered on Registered Voters)
Weighted To The U.S. General Adult Population - Propensity
18 Jan 2018
Table 42
I1 What would you say are the most important issues facing the country today? Please select three.
Base: All Respondents
Presidential
Election Candidate
Gender Age Ethnicity Political Party Political Ideology Voted For Education Locale Income
_____________ ______________________ _______________________ ____________________ ____________________ _____________________ _____________ ________________ _________
Colle- Some
Cons- ge Gr- Colle- $75K Less
Hisp- Black Repub- Democ- Indep- Libe- Mode- erva- 3rd ad And ge Or Urb- Subu- Or Than
Total Male Female 18-34 35-49 50-64 65+ White anic /AA Other lican rat endent ral rate tive Clinton Trump Party Higher Less an rban Rural More $75K
______ _____ _______ _____ _____ _____ ____ _____ _____ _____ _____ ______ ______ ______ ______ ______ ______ ________ ______ _____ ______ ______ ____ _____ _____ ____ ____
Unweighted Base 1962 882 1080 384 500 636 442 1530 136 183 39 600 711 571 518 818 626 731 698 184 700 1262 519 952 491 577 1275
Weighted Base 1962 942 1020 502 467 580 414 1315 261 221 75 605 722 564 523 834 605 759 680 181 670 1292 545 1001 415 811 1039
Effective Base 1157 573 585 220 294 390 295 974 90 119 28 385 404 332 294 468 401 424 438 101 434 728 315 555 298 384 744
Health care 780 339 441 193 182 254 151 529 111 86 25 200 348 216 252 322 207 355 215 71 268 512 201 415 164 322 417
40% 36% 43% 38% 39% 44% 37% 40% 43% 39% 34% 33% 48% 38% 48% 39% 34% 47% 32% 39% 40% 40% 37% 41% 40% 40% 40%
Economy and jobs 636 320 316 156 204 179 97 433 64 74 28 210 198 198 124 298 214 214 248 65 224 412 174 330 132 283 317
32% 34% 31% 31% 44% 31% 23% 33% 24% 33% 37% 35% 27% 35% 24% 36% 35% 28% 37% 36% 33% 32% 32% 33% 32% 35% 31%
Terrorism/national security 596 263 333 114 133 197 153 455 43 54 22 270 156 149 106 223 266 152 279 51 189 407 151 297 148 237 326
30% 28% 33% 23% 28% 34% 37% 35% 16% 24% 30% 45% 22% 26% 20% 27% 44% 20% 41% 28% 28% 31% 28% 30% 36% 29% 31%
National debt/ federal 489 285 203 83 108 171 127 357 53 40 15 184 138 153 85 198 206 140 210 54 163 326 118 234 136 215 249
budget deficits 25% 30% 20% 16% 23% 30% 31% 27% 20% 18% 20% 30% 19% 27% 16% 24% 34% 18% 31% 30% 24% 25% 22% 23% 33% 26% 24%
Immigration 482 255 227 104 94 142 142 355 53 33 26 247 97 114 71 172 238 101 292 20 142 340 129 234 119 176 278
25% 27% 22% 21% 20% 24% 34% 27% 20% 15% 35% 41% 13% 20% 14% 21% 39% 13% 43% 11% 21% 26% 24% 23% 29% 22% 27%
Environment / climate change 306 131 175 99 53 91 63 226 43 13 12 41 173 86 164 102 39 192 40 33 113 192 90 156 60 130 154
16% 14% 17% 20% 11% 16% 15% 17% 16% 6% 16% 7% 24% 15% 31% 12% 7% 25% 6% 18% 17% 15% 16% 16% 15% 16% 15%
Corruption 299 158 142 90 57 91 61 192 66 29 5 90 98 101 64 152 83 108 112 22 91 209 76 165 58 107 173
15% 17% 14% 18% 12% 16% 15% 15% 25% 13% 6% 15% 14% 18% 12% 18% 14% 14% 16% 12% 14% 16% 14% 16% 14% 13% 17%
Education 296 142 154 121 64 58 53 169 59 48 11 53 138 93 106 132 57 150 53 35 119 177 85 157 54 120 149
15% 15% 15% 24% 14% 10% 13% 13% 22% 22% 14% 9% 19% 16% 20% 16% 9% 20% 8% 19% 18% 14% 16% 16% 13% 15% 14%
Taxes 270 132 137 74 88 69 39 178 36 28 6 87 99 72 68 118 84 75 114 21 87 183 73 153 44 138 119
14% 14% 13% 15% 19% 12% 9% 14% 14% 13% 7% 14% 14% 13% 13% 14% 14% 10% 17% 12% 13% 14% 13% 15% 11% 17% 11%
Race relations 260 115 145 81 64 66 48 139 28 69 12 35 148 64 108 119 32 165 30 15 90 169 92 120 48 108 137
13% 12% 14% 16% 14% 11% 12% 11% 11% 31% 16% 6% 20% 11% 21% 14% 5% 22% 4% 8% 13% 13% 17% 12% 12% 13% 13%
Income inequality 258 102 156 78 61 71 48 151 42 40 10 27 128 98 116 126 16 163 28 34 107 152 90 126 42 105 136
13% 11% 15% 16% 13% 12% 12% 11% 16% 18% 13% 4% 18% 17% 22% 15% 3% 21% 4% 19% 16% 12% 17% 13% 10% 13% 13%
Crime and drugs 258 115 143 67 52 78 62 173 41 23 3 87 78 87 39 121 98 86 99 26 66 192 67 128 63 92 158
13% 12% 14% 13% 11% 13% 15% 13% 16% 11% 4% 14% 11% 15% 7% 14% 16% 11% 15% 14% 10% 15% 12% 13% 15% 11% 15%
Foreign policy 180 100 80 44 43 50 43 121 27 16 6 61 67 49 53 71 56 81 57 14 93 87 47 98 34 89 79
9% 11% 8% 9% 9% 9% 10% 9% 10% 7% 8% 10% 9% 9% 10% 8% 9% 11% 8% 8% 14% 7% 9% 10% 8% 11% 8%

Page 46
QuickQuery
Fielding Period: January 13-16, 2018
HCAPS (Filtered on Registered Voters)
Weighted To The U.S. General Adult Population - Propensity
18 Jan 2018
Table 42
I1 What would you say are the most important issues facing the country today? Please select three.
Base: All Respondents
Presidential
Election Candidate
Gender Age Ethnicity Political Party Political Ideology Voted For Education Locale Income
_____________ ______________________ _______________________ ____________________ ____________________ _____________________ _____________ ________________ _________
Colle- Some
Cons- ge Gr- Colle- $75K Less
Hisp- Black Repub- Democ- Indep- Libe- Mode- erva- 3rd ad And ge Or Urb- Subu- Or Than
Total Male Female 18-34 35-49 50-64 65+ White anic /AA Other lican rat endent ral rate tive Clinton Trump Party Higher Less an rban Rural More $75K
______ _____ _______ _____ _____ _____ ____ _____ _____ _____ _____ ______ ______ ______ ______ ______ ______ ________ ______ _____ ______ ______ ____ _____ _____ ____ ____
Weighted Base 1962 942 1020 502 467 580 414 1315 261 221 75 605 722 564 523 834 605 759 680 181 670 1292 545 1001 415 811 1039
Cybersecurity 175 80 95 29 43 59 43 115 25 16 11 45 63 56 48 79 48 69 53 23 66 109 45 95 35 79 84
9% 9% 9% 6% 9% 10% 10% 9% 9% 7% 14% 7% 9% 10% 9% 9% 8% 9% 8% 13% 10% 8% 8% 9% 8% 10% 8%
Criminal justice (policing, 162 81 81 58 41 38 25 81 40 32 3 29 67 59 40 86 37 60 45 14 43 120 57 75 31 60 93
courts, prisons) 8% 9% 8% 12% 9% 7% 6% 6% 15% 15% 4% 5% 9% 10% 8% 10% 6% 8% 7% 8% 6% 9% 10% 7% 7% 7% 9%
Defense 156 85 71 32 42 36 46 110 21 11 7 78 42 32 15 63 77 35 91 11 63 94 49 86 21 73 77
8% 9% 7% 6% 9% 6% 11% 8% 8% 5% 10% 13% 6% 6% 3% 8% 13% 5% 13% 6% 9% 7% 9% 9% 5% 9% 7%
Political correctness 132 64 68 32 34 51 15 70 19 21 15 41 37 36 21 70 42 36 54 19 24 109 37 64 31 45 84
7% 7% 7% 6% 7% 9% 4% 5% 7% 10% 20% 7% 5% 6% 4% 8% 7% 5% 8% 10% 4% 8% 7% 6% 8% 6% 8%
Women's rights 126 46 80 49 33 29 15 71 14 25 7 24 81 20 77 44 6 85 15 6 55 71 47 63 16 44 73
6% 5% 8% 10% 7% 5% 4% 5% 5% 11% 9% 4% 11% 4% 15% 5% 1% 11% 2% 3% 8% 6% 9% 6% 4% 5% 7%
Other 26 12 15 2 5 10 10 18 1 3 2 4 11 10 10 9 7 9 5 8 11 15 7 11 9 10 15
1% 1% 1% * 1% 2% 2% 1% * 1% 2% 1% 2% 2% 2% 1% 1% 1% 1% 4% 2% 1% 1% 1% 2% 1% 1%
Sigma 5886 2825 3061 1505 1400 1740 1242 3944 784 662 226 1814 2166 1693 1568 2503 1815 2277 2041 542 2011 3875 1636 3004 1246 2432 3117
300% 300% 300% 300% 300% 300% 300% 300% 300% 300% 300% 300% 300% 300% 300% 300% 300% 300% 300% 300% 300% 300% 300% 300% 300% 300% 300%

Page 47
QuickQuery
Fielding Period: January 13-16, 2018
HCAPS (Filtered on Registered Voters)
Weighted To The U.S. General Adult Population - Propensity
18 Jan 2018
Table 43
I3 How strong do you think the U.S. economy is today?
Base: All Respondents
Presidential
Election Candidate
Gender Age Ethnicity Political Party Political Ideology Voted For Education Locale Income
_____________ ______________________ _______________________ ____________________ ____________________ _____________________ _____________ ________________ _________
Colle- Some
Cons- ge Gr- Colle- $75K Less
Hisp- Black Repub- Democ- Indep- Libe- Mode- erva- 3rd ad And ge Or Urb- Subu- Or Than
Total Male Female 18-34 35-49 50-64 65+ White anic /AA Other lican rat endent ral rate tive Clinton Trump Party Higher Less an rban Rural More $75K
______ _____ _______ _____ _____ _____ ____ _____ _____ _____ _____ ______ ______ ______ ______ ______ ______ ________ ______ _____ ______ ______ ____ _____ _____ ____ ____
Unweighted Base 1962 882 1080 384 500 636 442 1530 136 183 39 600 711 571 518 818 626 731 698 184 700 1262 519 952 491 577 1275
Weighted Base 1962 942 1020 502 467 580 414 1315 261 221 75 605 722 564 523 834 605 759 680 181 670 1292 545 1001 415 811 1039
Effective Base 1157 573 585 220 294 390 295 974 90 119 28 385 404 332 294 468 401 424 438 101 434 728 315 555 298 384 744
Very/Somewhat Strong (Net) 1339 729 610 288 300 423 328 974 151 109 42 521 412 373 324 514 501 451 597 106 524 815 369 706 264 628 636
68% 77% 60% 58% 64% 73% 79% 74% 58% 50% 56% 86% 57% 66% 62% 62% 83% 59% 88% 59% 78% 63% 68% 70% 64% 77% 61%
Very strong 292 201 91 73 51 90 77 222 29 14 16 167 56 63 51 81 160 58 188 11 140 152 91 152 49 154 129
15% 21% 9% 15% 11% 16% 19% 17% 11% 6% 22% 28% 8% 11% 10% 10% 26% 8% 28% 6% 21% 12% 17% 15% 12% 19% 12%
Somewhat strong 1047 528 519 215 249 333 251 752 122 96 26 354 356 310 273 433 341 394 409 95 385 662 277 554 215 474 507
53% 56% 51% 43% 53% 57% 61% 57% 47% 43% 34% 59% 49% 55% 52% 52% 56% 52% 60% 52% 57% 51% 51% 55% 52% 58% 49%
Very/Somewhat Weak (Net) 623 213 410 213 166 157 86 341 110 111 33 84 310 191 199 321 104 308 83 75 146 477 177 295 151 183 403
32% 23% 40% 42% 36% 27% 21% 26% 42% 50% 44% 14% 43% 34% 38% 38% 17% 41% 12% 41% 22% 37% 32% 30% 36% 23% 39%
Somewhat weak 532 181 351 176 143 136 78 292 88 96 29 69 255 176 164 282 86 263 76 66 129 404 152 257 123 168 332
27% 19% 34% 35% 31% 23% 19% 22% 34% 43% 39% 11% 35% 31% 31% 34% 14% 35% 11% 37% 19% 31% 28% 26% 30% 21% 32%
Very weak 91 32 59 37 23 22 9 49 22 15 4 15 55 15 34 38 18 45 7 9 17 73 24 38 28 15 71
5% 3% 6% 7% 5% 4% 2% 4% 8% 7% 5% 2% 8% 3% 7% 5% 3% 6% 1% 5% 3% 6% 4% 4% 7% 2% 7%
Sigma 1962 942 1020 502 467 580 414 1315 261 221 75 605 722 564 523 834 605 759 680 181 670 1292 545 1001 415 811 1039
100% 100% 100% 100% 100% 100% 100% 100% 100% 100% 100% 100% 100% 100% 100% 100% 100% 100% 100% 100% 100% 100% 100% 100% 100% 100% 100%

Page 48
QuickQuery
Fielding Period: January 13-16, 2018
HCAPS (Filtered on Registered Voters)
Weighted To The U.S. General Adult Population - Propensity
18 Jan 2018
Table 44
I4 Would you say that your personal financial situation is improving or getting worse?
Base: All Respondents
Presidential
Election Candidate
Gender Age Ethnicity Political Party Political Ideology Voted For Education Locale Income
_____________ ______________________ _______________________ ____________________ ____________________ _____________________ _____________ ________________ _________
Colle- Some
Cons- ge Gr- Colle- $75K Less
Hisp- Black Repub- Democ- Indep- Libe- Mode- erva- 3rd ad And ge Or Urb- Subu- Or Than
Total Male Female 18-34 35-49 50-64 65+ White anic /AA Other lican rat endent ral rate tive Clinton Trump Party Higher Less an rban Rural More $75K
______ _____ _______ _____ _____ _____ ____ _____ _____ _____ _____ ______ ______ ______ ______ ______ ______ ________ ______ _____ ______ ______ ____ _____ _____ ____ ____
Unweighted Base 1962 882 1080 384 500 636 442 1530 136 183 39 600 711 571 518 818 626 731 698 184 700 1262 519 952 491 577 1275
Weighted Base 1962 942 1020 502 467 580 414 1315 261 221 75 605 722 564 523 834 605 759 680 181 670 1292 545 1001 415 811 1039
Effective Base 1157 573 585 220 294 390 295 974 90 119 28 385 404 332 294 468 401 424 438 101 434 728 315 555 298 384 744
Improving 602 350 252 151 149 174 128 454 64 43 28 280 156 147 124 213 265 167 313 51 256 346 181 303 118 339 234
31% 37% 25% 30% 32% 30% 31% 35% 25% 20% 37% 46% 22% 26% 24% 26% 44% 22% 46% 28% 38% 27% 33% 30% 28% 42% 23%
Getting worse 478 183 295 144 129 131 74 280 78 69 22 85 214 166 155 231 92 223 98 50 124 354 146 227 104 133 314
24% 19% 29% 29% 28% 23% 18% 21% 30% 31% 30% 14% 30% 29% 30% 28% 15% 29% 14% 28% 19% 27% 27% 23% 25% 16% 30%
Just as well off 716 354 362 147 159 225 185 511 85 76 16 215 278 208 204 295 216 301 242 67 264 452 165 393 157 303 382
36% 38% 35% 29% 34% 39% 45% 39% 33% 34% 21% 36% 39% 37% 39% 35% 36% 40% 36% 37% 39% 35% 30% 39% 38% 37% 37%
No opinion 166 54 112 60 29 51 27 69 33 32 9 25 74 43 40 95 32 68 28 12 26 140 52 78 36 35 109
8% 6% 11% 12% 6% 9% 6% 5% 13% 15% 12% 4% 10% 8% 8% 11% 5% 9% 4% 7% 4% 11% 10% 8% 9% 4% 10%
Sigma 1962 942 1020 502 467 580 414 1315 261 221 75 605 722 564 523 834 605 759 680 181 670 1292 545 1001 415 811 1039
100% 100% 100% 100% 100% 100% 100% 100% 100% 100% 100% 100% 100% 100% 100% 100% 100% 100% 100% 100% 100% 100% 100% 100% 100% 100% 100%

Page 49
QuickQuery
Fielding Period: January 13-16, 2018
HCAPS (Filtered on Registered Voters)
Weighted To The U.S. General Adult Population - Propensity
18 Jan 2018
Table 45
M3B Do you approve or disapprove of the way President Trump is handling North Korea?
Base: All Respondents
Presidential
Election Candidate
Gender Age Ethnicity Political Party Political Ideology Voted For Education Locale Income
_____________ ______________________ _______________________ ____________________ ____________________ _____________________ _____________ ________________ _________
Colle- Some
Cons- ge Gr- Colle- $75K Less
Hisp- Black Repub- Democ- Indep- Libe- Mode- erva- 3rd ad And ge Or Urb- Subu- Or Than
Total Male Female 18-34 35-49 50-64 65+ White anic /AA Other lican rat endent ral rate tive Clinton Trump Party Higher Less an rban Rural More $75K
______ _____ _______ _____ _____ _____ ____ _____ _____ _____ _____ ______ ______ ______ ______ ______ ______ ________ ______ _____ ______ ______ ____ _____ _____ ____ ____
Unweighted Base 1962 882 1080 384 500 636 442 1530 136 183 39 600 711 571 518 818 626 731 698 184 700 1262 519 952 491 577 1275
Weighted Base 1962 942 1020 502 467 580 414 1315 261 221 75 605 722 564 523 834 605 759 680 181 670 1292 545 1001 415 811 1039
Effective Base 1157 573 585 220 294 390 295 974 90 119 28 385 404 332 294 468 401 424 438 101 434 728 315 555 298 384 744
Approve 792 463 329 167 197 243 185 625 73 38 32 461 75 236 63 286 443 61 554 58 255 537 204 394 194 323 424
40% 49% 32% 33% 42% 42% 45% 48% 28% 17% 42% 76% 10% 42% 12% 34% 73% 8% 81% 32% 38% 42% 37% 39% 47% 40% 41%
Disapprove 1170 479 691 334 270 337 229 689 188 183 44 143 647 328 459 549 162 698 126 122 415 755 341 607 221 488 615
60% 51% 68% 67% 58% 58% 55% 52% 72% 83% 58% 24% 90% 58% 88% 66% 27% 92% 19% 68% 62% 58% 63% 61% 53% 60% 59%
Sigma 1962 942 1020 502 467 580 414 1315 261 221 75 605 722 564 523 834 605 759 680 181 670 1292 545 1001 415 811 1039
100% 100% 100% 100% 100% 100% 100% 100% 100% 100% 100% 100% 100% 100% 100% 100% 100% 100% 100% 100% 100% 100% 100% 100% 100% 100% 100%

Page 50
QuickQuery
Fielding Period: January 13-16, 2018
HCAPS (Filtered on Registered Voters)
Weighted To The U.S. General Adult Population - Propensity
18 Jan 2018
Table 46
M3C Do you think the U.S. government on should leave the Iran nuclear deal as it is or attempt to renegotiate it?
Base: All Respondents
Presidential
Election Candidate
Gender Age Ethnicity Political Party Political Ideology Voted For Education Locale Income
_____________ ______________________ _______________________ ____________________ ____________________ _____________________ _____________ ________________ _________
Colle- Some
Cons- ge Gr- Colle- $75K Less
Hisp- Black Repub- Democ- Indep- Libe- Mode- erva- 3rd ad And ge Or Urb- Subu- Or Than
Total Male Female 18-34 35-49 50-64 65+ White anic /AA Other lican rat endent ral rate tive Clinton Trump Party Higher Less an rban Rural More $75K
______ _____ _______ _____ _____ _____ ____ _____ _____ _____ _____ ______ ______ ______ ______ ______ ______ ________ ______ _____ ______ ______ ____ _____ _____ ____ ____
Unweighted Base 1962 882 1080 384 500 636 442 1530 136 183 39 600 711 571 518 818 626 731 698 184 700 1262 519 952 491 577 1275
Weighted Base 1962 942 1020 502 467 580 414 1315 261 221 75 605 722 564 523 834 605 759 680 181 670 1292 545 1001 415 811 1039
Effective Base 1157 573 585 220 294 390 295 974 90 119 28 385 404 332 294 468 401 424 438 101 434 728 315 555 298 384 744
Leave as it is 853 393 460 241 221 223 168 539 125 124 18 169 403 259 351 381 121 468 167 88 329 524 256 444 152 396 422
43% 42% 45% 48% 47% 38% 41% 41% 48% 56% 24% 28% 56% 46% 67% 46% 20% 62% 25% 49% 49% 41% 47% 44% 37% 49% 41%
Attempt to renegotiate it 1109 549 560 261 245 357 246 776 136 97 57 435 319 305 172 454 484 291 513 93 342 767 289 557 263 415 617
57% 58% 55% 52% 53% 62% 59% 59% 52% 44% 76% 72% 44% 54% 33% 54% 80% 38% 75% 51% 51% 59% 53% 56% 63% 51% 59%
Sigma 1962 942 1020 502 467 580 414 1315 261 221 75 605 722 564 523 834 605 759 680 181 670 1292 545 1001 415 811 1039
100% 100% 100% 100% 100% 100% 100% 100% 100% 100% 100% 100% 100% 100% 100% 100% 100% 100% 100% 100% 100% 100% 100% 100% 100% 100% 100%

Page 51
QuickQuery
Fielding Period: January 13-16, 2018
HCAPS (Filtered on Registered Voters)
Weighted To The U.S. General Adult Population - Propensity
18 Jan 2018
Table 47
WIRANPROTESTS Do you think the U.S. government should be vocal in supporting pro-democracy protests
in Iran, or should it not comment on the protests and wait and see?
Base: All Respondents
Presidential
Election Candidate
Gender Age Ethnicity Political Party Political Ideology Voted For Education Locale Income
_____________ ______________________ _______________________ ____________________ ____________________ _____________________ _____________ ________________ _________
Colle- Some
Cons- ge Gr- Colle- $75K Less
Hisp- Black Repub- Democ- Indep- Libe- Mode- erva- 3rd ad And ge Or Urb- Subu- Or Than
Total Male Female 18-34 35-49 50-64 65+ White anic /AA Other lican rat endent ral rate tive Clinton Trump Party Higher Less an rban Rural More $75K
______ _____ _______ _____ _____ _____ ____ _____ _____ _____ _____ ______ ______ ______ ______ ______ ______ ________ ______ _____ ______ ______ ____ _____ _____ ____ ____
Unweighted Base 1962 882 1080 384 500 636 442 1530 136 183 39 600 711 571 518 818 626 731 698 184 700 1262 519 952 491 577 1275
Weighted Base 1962 942 1020 502 467 580 414 1315 261 221 75 605 722 564 523 834 605 759 680 181 670 1292 545 1001 415 811 1039
Effective Base 1157 573 585 220 294 390 295 974 90 119 28 385 404 332 294 468 401 424 438 101 434 728 315 555 298 384 744
Vocally support pro- 737 438 299 207 169 211 149 514 108 55 29 271 240 203 192 258 286 256 322 62 293 444 220 366 150 315 384
democracy protests in Iran 38% 46% 29% 41% 36% 36% 36% 39% 42% 25% 39% 45% 33% 36% 37% 31% 47% 34% 47% 34% 44% 34% 40% 37% 36% 39% 37%
Withhold comment and wait 1225 504 721 295 297 369 265 801 153 166 46 334 482 361 331 576 319 503 358 119 377 848 325 635 266 495 655
and see 62% 54% 71% 59% 64% 64% 64% 61% 58% 75% 61% 55% 67% 64% 63% 69% 53% 66% 53% 66% 56% 66% 60% 63% 64% 61% 63%
Sigma 1962 942 1020 502 467 580 414 1315 261 221 75 605 722 564 523 834 605 759 680 181 670 1292 545 1001 415 811 1039
100% 100% 100% 100% 100% 100% 100% 100% 100% 100% 100% 100% 100% 100% 100% 100% 100% 100% 100% 100% 100% 100% 100% 100% 100% 100% 100%

Page 52
QuickQuery
Fielding Period: January 13-16, 2018
HCAPS (Filtered on Registered Voters)
Weighted To The U.S. General Adult Population - Propensity
18 Jan 2018
Table 48
QIRANPROTESTS2 Do you think the government of Iran has the support of its people or not?
Base: All Respondents
Presidential
Election Candidate
Gender Age Ethnicity Political Party Political Ideology Voted For Education Locale Income
_____________ ______________________ _______________________ ____________________ ____________________ _____________________ _____________ ________________ _________
Colle- Some
Cons- ge Gr- Colle- $75K Less
Hisp- Black Repub- Democ- Indep- Libe- Mode- erva- 3rd ad And ge Or Urb- Subu- Or Than
Total Male Female 18-34 35-49 50-64 65+ White anic /AA Other lican rat endent ral rate tive Clinton Trump Party Higher Less an rban Rural More $75K
______ _____ _______ _____ _____ _____ ____ _____ _____ _____ _____ ______ ______ ______ ______ ______ ______ ________ ______ _____ ______ ______ ____ _____ _____ ____ ____
Unweighted Base 1962 882 1080 384 500 636 442 1530 136 183 39 600 711 571 518 818 626 731 698 184 700 1262 519 952 491 577 1275
Weighted Base 1962 942 1020 502 467 580 414 1315 261 221 75 605 722 564 523 834 605 759 680 181 670 1292 545 1001 415 811 1039
Effective Base 1157 573 585 220 294 390 295 974 90 119 28 385 404 332 294 468 401 424 438 101 434 728 315 555 298 384 744
Government of Iran has the 407 186 221 140 124 89 54 254 58 67 17 130 155 106 114 198 95 154 124 38 130 277 136 184 88 156 230
support of its people 21% 20% 22% 28% 27% 15% 13% 19% 22% 30% 23% 22% 22% 19% 22% 24% 16% 20% 18% 21% 19% 21% 25% 18% 21% 19% 22%
Government of Iran does not 1555 756 799 362 343 490 360 1060 203 154 58 474 567 459 409 636 510 605 556 142 541 1014 409 817 328 654 809
have the support of its 79% 80% 78% 72% 73% 85% 87% 81% 78% 70% 77% 78% 78% 81% 78% 76% 84% 80% 82% 79% 81% 79% 75% 82% 79% 81% 78%
people
Sigma 1962 942 1020 502 467 580 414 1315 261 221 75 605 722 564 523 834 605 759 680 181 670 1292 545 1001 415 811 1039
100% 100% 100% 100% 100% 100% 100% 100% 100% 100% 100% 100% 100% 100% 100% 100% 100% 100% 100% 100% 100% 100% 100% 100% 100% 100% 100%

Page 53
QuickQuery
Fielding Period: January 13-16, 2018
HCAPS (Filtered on Registered Voters)
Weighted To The U.S. General Adult Population - Propensity
18 Jan 2018
Table 49
QIRANPROTESTS3 Do you think Iran is a working democracy or is it run by a group of religious leaders
who claim absolute power based on religion?
Base: All Respondents
Presidential
Election Candidate
Gender Age Ethnicity Political Party Political Ideology Voted For Education Locale Income
_____________ ______________________ _______________________ ____________________ ____________________ _____________________ _____________ ________________ _________
Colle- Some
Cons- ge Gr- Colle- $75K Less
Hisp- Black Repub- Democ- Indep- Libe- Mode- erva- 3rd ad And ge Or Urb- Subu- Or Than
Total Male Female 18-34 35-49 50-64 65+ White anic /AA Other lican rat endent ral rate tive Clinton Trump Party Higher Less an rban Rural More $75K
______ _____ _______ _____ _____ _____ ____ _____ _____ _____ _____ ______ ______ ______ ______ ______ ______ ________ ______ _____ ______ ______ ____ _____ _____ ____ ____
Unweighted Base 1962 882 1080 384 500 636 442 1530 136 183 39 600 711 571 518 818 626 731 698 184 700 1262 519 952 491 577 1275
Weighted Base 1962 942 1020 502 467 580 414 1315 261 221 75 605 722 564 523 834 605 759 680 181 670 1292 545 1001 415 811 1039
Effective Base 1157 573 585 220 294 390 295 974 90 119 28 385 404 332 294 468 401 424 438 101 434 728 315 555 298 384 744
Iran is a working democracy 275 120 155 112 75 58 31 145 47 50 10 91 106 67 88 134 52 118 83 11 76 199 99 124 52 95 169
14% 13% 15% 22% 16% 10% 7% 11% 18% 23% 14% 15% 15% 12% 17% 16% 9% 16% 12% 6% 11% 15% 18% 12% 12% 12% 16%
Iran is run by a group of 1687 821 865 390 392 522 383 1169 214 171 65 513 616 498 434 700 553 641 597 170 595 1092 446 877 364 715 870
religious leaders 86% 87% 85% 78% 84% 90% 93% 89% 82% 77% 86% 85% 85% 88% 83% 84% 91% 84% 88% 94% 89% 85% 82% 88% 88% 88% 84%
Sigma 1962 942 1020 502 467 580 414 1315 261 221 75 605 722 564 523 834 605 759 680 181 670 1292 545 1001 415 811 1039
100% 100% 100% 100% 100% 100% 100% 100% 100% 100% 100% 100% 100% 100% 100% 100% 100% 100% 100% 100% 100% 100% 100% 100% 100% 100% 100%

Page 54
QuickQuery
Fielding Period: January 13-16, 2018
HCAPS (Filtered on Registered Voters)
Weighted To The U.S. General Adult Population - Propensity
18 Jan 2018
Table 50
QPAKISTAN Do you support or oppose the U.S. government's decision to withhold over one billion dollars in military and other aid to
Pakistan until they do more to eliminate terrorist safe havens in the country?
Base: All Respondents
Presidential
Election Candidate
Gender Age Ethnicity Political Party Political Ideology Voted For Education Locale Income
_____________ ______________________ _______________________ ____________________ ____________________ _____________________ _____________ ________________ _________
Colle- Some
Cons- ge Gr- Colle- $75K Less
Hisp- Black Repub- Democ- Indep- Libe- Mode- erva- 3rd ad And ge Or Urb- Subu- Or Than
Total Male Female 18-34 35-49 50-64 65+ White anic /AA Other lican rat endent ral rate tive Clinton Trump Party Higher Less an rban Rural More $75K
______ _____ _______ _____ _____ _____ ____ _____ _____ _____ _____ ______ ______ ______ ______ ______ ______ ________ ______ _____ ______ ______ ____ _____ _____ ____ ____
Unweighted Base 1962 882 1080 384 500 636 442 1530 136 183 39 600 711 571 518 818 626 731 698 184 700 1262 519 952 491 577 1275
Weighted Base 1962 942 1020 502 467 580 414 1315 261 221 75 605 722 564 523 834 605 759 680 181 670 1292 545 1001 415 811 1039
Effective Base 1157 573 585 220 294 390 295 974 90 119 28 385 404 332 294 468 401 424 438 101 434 728 315 555 298 384 744
Support 1507 789 718 319 337 494 356 1084 168 140 63 561 472 426 349 617 541 479 647 143 515 992 391 782 334 635 786
77% 84% 70% 64% 72% 85% 86% 82% 64% 63% 84% 93% 65% 76% 67% 74% 89% 63% 95% 79% 77% 77% 72% 78% 80% 78% 76%
Oppose 455 153 303 182 129 85 58 230 93 81 12 44 250 138 174 217 64 280 33 37 155 300 154 220 82 176 253
23% 16% 30% 36% 28% 15% 14% 18% 36% 37% 16% 7% 35% 24% 33% 26% 11% 37% 5% 21% 23% 23% 28% 22% 20% 22% 24%
Sigma 1962 942 1020 502 467 580 414 1315 261 221 75 605 722 564 523 834 605 759 680 181 670 1292 545 1001 415 811 1039
100% 100% 100% 100% 100% 100% 100% 100% 100% 100% 100% 100% 100% 100% 100% 100% 100% 100% 100% 100% 100% 100% 100% 100% 100% 100% 100%

Page 55
QuickQuery
Fielding Period: January 13-16, 2018
HCAPS (Filtered on Registered Voters)
Weighted To The U.S. General Adult Population - Propensity
18 Jan 2018
Table 51
M3D Do you support or oppose the decision to recognize Jerusalem as the capital of Israel and
move the U.S. embassy to Israel over the next few years?
Base: All Respondents
Presidential
Election Candidate
Gender Age Ethnicity Political Party Political Ideology Voted For Education Locale Income
_____________ ______________________ _______________________ ____________________ ____________________ _____________________ _____________ ________________ _________
Colle- Some
Cons- ge Gr- Colle- $75K Less
Hisp- Black Repub- Democ- Indep- Libe- Mode- erva- 3rd ad And ge Or Urb- Subu- Or Than
Total Male Female 18-34 35-49 50-64 65+ White anic /AA Other lican rat endent ral rate tive Clinton Trump Party Higher Less an rban Rural More $75K
______ _____ _______ _____ _____ _____ ____ _____ _____ _____ _____ ______ ______ ______ ______ ______ ______ ________ ______ _____ ______ ______ ____ _____ _____ ____ ____
Unweighted Base 1962 882 1080 384 500 636 442 1530 136 183 39 600 711 571 518 818 626 731 698 184 700 1262 519 952 491 577 1275
Weighted Base 1962 942 1020 502 467 580 414 1315 261 221 75 605 722 564 523 834 605 759 680 181 670 1292 545 1001 415 811 1039
Effective Base 1157 573 585 220 294 390 295 974 90 119 28 385 404 332 294 468 401 424 438 101 434 728 315 555 298 384 744
Support 1073 558 515 264 238 339 232 787 109 85 49 512 234 290 162 405 506 213 595 83 338 735 280 540 254 447 563
55% 59% 50% 53% 51% 59% 56% 60% 42% 39% 65% 85% 32% 51% 31% 49% 84% 28% 87% 46% 50% 57% 51% 54% 61% 55% 54%
Oppose 889 384 505 237 229 240 182 527 152 135 26 93 488 274 361 429 99 546 85 97 332 556 265 462 161 364 476
45% 41% 50% 47% 49% 41% 44% 40% 58% 61% 35% 15% 68% 49% 69% 51% 16% 72% 13% 54% 50% 43% 49% 46% 39% 45% 46%
Sigma 1962 942 1020 502 467 580 414 1315 261 221 75 605 722 564 523 834 605 759 680 181 670 1292 545 1001 415 811 1039
100% 100% 100% 100% 100% 100% 100% 100% 100% 100% 100% 100% 100% 100% 100% 100% 100% 100% 100% 100% 100% 100% 100% 100% 100% 100% 100%

Page 87
QuickQuery
Fielding Period: January 13-16, 2018
HCAPS (Filtered on Registered Voters)
Weighted To The U.S. General Adult Population - Propensity
18 Jan 2018
Table 79
QPOT1 Do you favor or oppose legalization of marijuana for recreational purposes in the United States?
Base: All Respondents
Presidential
Election Candidate
Gender Age Ethnicity Political Party Political Ideology Voted For Education Locale Income
_____________ ______________________ _______________________ ____________________ ____________________ _____________________ _____________ ________________ _________
Colle- Some
Cons- ge Gr- Colle- $75K Less
Hisp- Black Repub- Democ- Indep- Libe- Mode- erva- 3rd ad And ge Or Urb- Subu- Or Than
Total Male Female 18-34 35-49 50-64 65+ White anic /AA Other lican rat endent ral rate tive Clinton Trump Party Higher Less an rban Rural More $75K
______ _____ _______ _____ _____ _____ ____ _____ _____ _____ _____ ______ ______ ______ ______ ______ ______ ________ ______ _____ ______ ______ ____ _____ _____ ____ ____
Unweighted Base 1962 882 1080 384 500 636 442 1530 136 183 39 600 711 571 518 818 626 731 698 184 700 1262 519 952 491 577 1275
Weighted Base 1962 942 1020 502 467 580 414 1315 261 221 75 605 722 564 523 834 605 759 680 181 670 1292 545 1001 415 811 1039
Effective Base 1157 573 585 220 294 390 295 974 90 119 28 385 404 332 294 468 401 424 438 101 434 728 315 555 298 384 744
Favor 1129 578 551 319 299 336 175 735 159 136 45 250 476 348 401 498 230 513 282 118 362 767 345 558 226 487 583
58% 61% 54% 64% 64% 58% 42% 56% 61% 62% 60% 41% 66% 62% 77% 60% 38% 68% 42% 65% 54% 59% 63% 56% 54% 60% 56%
Oppose 833 363 469 182 168 244 239 579 102 85 30 355 246 216 122 336 375 246 398 63 308 525 200 443 189 323 457
42% 39% 46% 36% 36% 42% 58% 44% 39% 38% 40% 59% 34% 38% 23% 40% 62% 32% 58% 35% 46% 41% 37% 44% 46% 40% 44%
Sigma 1962 942 1020 502 467 580 414 1315 261 221 75 605 722 564 523 834 605 759 680 181 670 1292 545 1001 415 811 1039
100% 100% 100% 100% 100% 100% 100% 100% 100% 100% 100% 100% 100% 100% 100% 100% 100% 100% 100% 100% 100% 100% 100% 100% 100% 100% 100%

Page 88
QuickQuery
Fielding Period: January 13-16, 2018
HCAPS (Filtered on Registered Voters)
Weighted To The U.S. General Adult Population - Propensity
18 Jan 2018
Table 80
QPOT2 Do you feel individual states should be allowed to legalize marijuana usage or should it be decided
by Congress and the federal government on a national level?
Base: All Respondents
Presidential
Election Candidate
Gender Age Ethnicity Political Party Political Ideology Voted For Education Locale Income
_____________ ______________________ _______________________ ____________________ ____________________ _____________________ _____________ ________________ _________
Colle- Some
Cons- ge Gr- Colle- $75K Less
Hisp- Black Repub- Democ- Indep- Libe- Mode- erva- 3rd ad And ge Or Urb- Subu- Or Than
Total Male Female 18-34 35-49 50-64 65+ White anic /AA Other lican rat endent ral rate tive Clinton Trump Party Higher Less an rban Rural More $75K
______ _____ _______ _____ _____ _____ ____ _____ _____ _____ _____ ______ ______ ______ ______ ______ ______ ________ ______ _____ ______ ______ ____ _____ _____ ____ ____
Unweighted Base 1962 882 1080 384 500 636 442 1530 136 183 39 600 711 571 518 818 626 731 698 184 700 1262 519 952 491 577 1275
Weighted Base 1962 942 1020 502 467 580 414 1315 261 221 75 605 722 564 523 834 605 759 680 181 670 1292 545 1001 415 811 1039
Effective Base 1157 573 585 220 294 390 295 974 90 119 28 385 404 332 294 468 401 424 438 101 434 728 315 555 298 384 744
Individual states should be 1258 604 654 333 305 382 238 827 176 150 55 327 513 370 404 534 321 548 351 150 435 823 332 655 272 520 660
allowed to legalize 64% 64% 64% 66% 65% 66% 58% 63% 68% 68% 73% 54% 71% 66% 77% 64% 53% 72% 52% 83% 65% 64% 61% 65% 65% 64% 64%
marijuana usage
It should be a decision by 704 338 366 168 162 198 175 488 85 71 20 277 209 194 119 301 284 211 330 31 235 468 214 346 144 291 379
Congress and the federal 36% 36% 36% 34% 35% 34% 42% 37% 32% 32% 27% 46% 29% 34% 23% 36% 47% 28% 48% 17% 35% 36% 39% 35% 35% 36% 36%
government
Sigma 1962 942 1020 502 467 580 414 1315 261 221 75 605 722 564 523 834 605 759 680 181 670 1292 545 1001 415 811 1039
100% 100% 100% 100% 100% 100% 100% 100% 100% 100% 100% 100% 100% 100% 100% 100% 100% 100% 100% 100% 100% 100% 100% 100% 100% 100% 100%
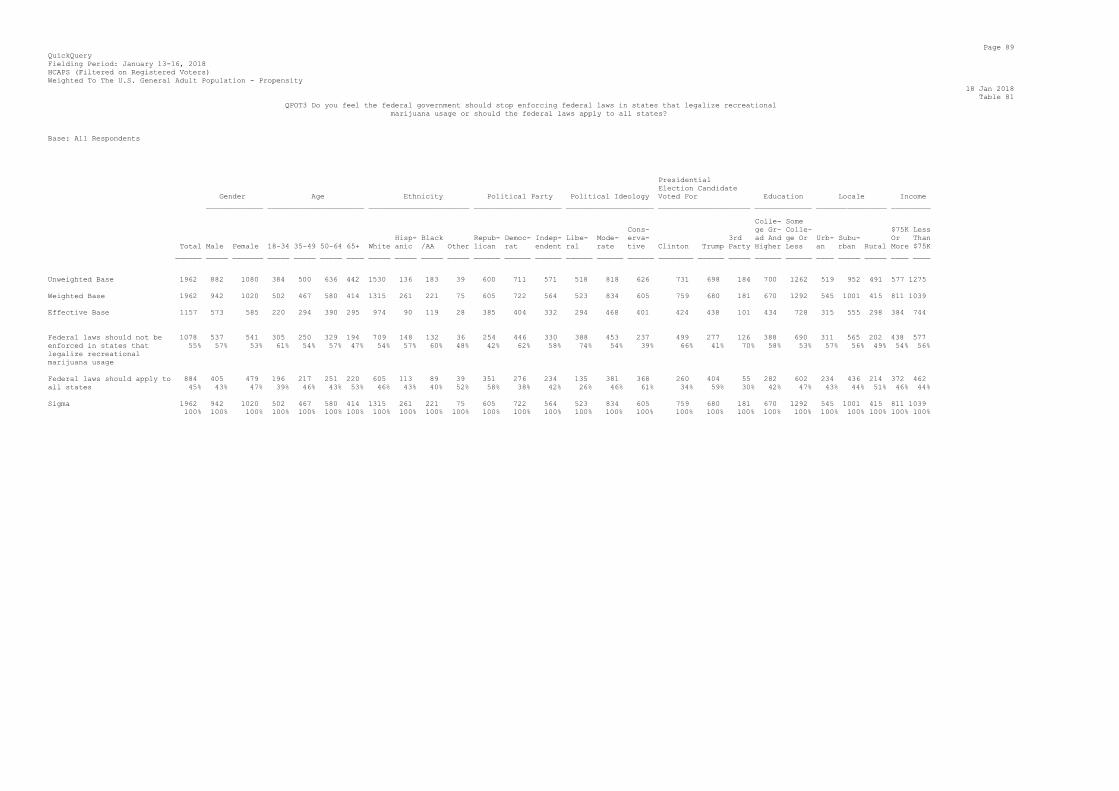
Page 89
QuickQuery
Fielding Period: January 13-16, 2018
HCAPS (Filtered on Registered Voters)
Weighted To The U.S. General Adult Population - Propensity
18 Jan 2018
Table 81
QPOT3 Do you feel the federal government should stop enforcing federal laws in states that legalize recreational
marijuana usage or should the federal laws apply to all states?
Base: All Respondents
Presidential
Election Candidate
Gender Age Ethnicity Political Party Political Ideology Voted For Education Locale Income
_____________ ______________________ _______________________ ____________________ ____________________ _____________________ _____________ ________________ _________
Colle- Some
Cons- ge Gr- Colle- $75K Less
Hisp- Black Repub- Democ- Indep- Libe- Mode- erva- 3rd ad And ge Or Urb- Subu- Or Than
Total Male Female 18-34 35-49 50-64 65+ White anic /AA Other lican rat endent ral rate tive Clinton Trump Party Higher Less an rban Rural More $75K
______ _____ _______ _____ _____ _____ ____ _____ _____ _____ _____ ______ ______ ______ ______ ______ ______ ________ ______ _____ ______ ______ ____ _____ _____ ____ ____
Unweighted Base 1962 882 1080 384 500 636 442 1530 136 183 39 600 711 571 518 818 626 731 698 184 700 1262 519 952 491 577 1275
Weighted Base 1962 942 1020 502 467 580 414 1315 261 221 75 605 722 564 523 834 605 759 680 181 670 1292 545 1001 415 811 1039
Effective Base 1157 573 585 220 294 390 295 974 90 119 28 385 404 332 294 468 401 424 438 101 434 728 315 555 298 384 744
Federal laws should not be 1078 537 541 305 250 329 194 709 148 132 36 254 446 330 388 453 237 499 277 126 388 690 311 565 202 438 577
enforced in states that 55% 57% 53% 61% 54% 57% 47% 54% 57% 60% 48% 42% 62% 58% 74% 54% 39% 66% 41% 70% 58% 53% 57% 56% 49% 54% 56%
legalize recreational
marijuana usage
Federal laws should apply to 884 405 479 196 217 251 220 605 113 89 39 351 276 234 135 381 368 260 404 55 282 602 234 436 214 372 462
all states 45% 43% 47% 39% 46% 43% 53% 46% 43% 40% 52% 58% 38% 42% 26% 46% 61% 34% 59% 30% 42% 47% 43% 44% 51% 46% 44%
Sigma 1962 942 1020 502 467 580 414 1315 261 221 75 605 722 564 523 834 605 759 680 181 670 1292 545 1001 415 811 1039
100% 100% 100% 100% 100% 100% 100% 100% 100% 100% 100% 100% 100% 100% 100% 100% 100% 100% 100% 100% 100% 100% 100% 100% 100% 100% 100%

Page 123
QuickQuery
Fielding Period: January 13-16, 2018
HCAPS (Filtered on Registered Voters)
Weighted To The U.S. General Adult Population - Propensity
18 Jan 2018
Table 109
M8 Which is closer to your view?
Base: All Respondents
Presidential
Election Candidate
Gender Age Ethnicity Political Party Political Ideology Voted For Education Locale Income
_____________ ______________________ _______________________ ____________________ ____________________ _____________________ _____________ ________________ _________
Colle- Some
Cons- ge Gr- Colle- $75K Less
Hisp- Black Repub- Democ- Indep- Libe- Mode- erva- 3rd ad And ge Or Urb- Subu- Or Than
Total Male Female 18-34 35-49 50-64 65+ White anic /AA Other lican rat endent ral rate tive Clinton Trump Party Higher Less an rban Rural More $75K
______ _____ _______ _____ _____ _____ ____ _____ _____ _____ _____ ______ ______ ______ ______ ______ ______ ________ ______ _____ ______ ______ ____ _____ _____ ____ ____
Unweighted Base 1962 882 1080 384 500 636 442 1530 136 183 39 600 711 571 518 818 626 731 698 184 700 1262 519 952 491 577 1275
Weighted Base 1962 942 1020 502 467 580 414 1315 261 221 75 605 722 564 523 834 605 759 680 181 670 1292 545 1001 415 811 1039
Effective Base 1157 573 585 220 294 390 295 974 90 119 28 385 404 332 294 468 401 424 438 101 434 728 315 555 298 384 744
President Trump should hold 531 281 251 115 133 176 108 402 61 30 23 306 56 140 44 198 289 36 378 31 134 397 128 267 135 210 290
out for his agenda, even if 27% 30% 25% 23% 28% 30% 26% 31% 24% 14% 31% 51% 8% 25% 8% 24% 48% 5% 56% 17% 20% 31% 24% 27% 33% 26% 28%
it means achieving change
without Congressional or
Democratic approval
President Trump should 1431 661 770 386 334 404 306 912 200 190 52 299 666 424 479 636 316 723 303 149 536 894 417 734 280 600 749
compromise on his agenda in 73% 70% 75% 77% 72% 70% 74% 69% 76% 86% 69% 49% 92% 75% 92% 76% 52% 95% 44% 83% 80% 69% 76% 73% 67% 74% 72%
order to work together with
Congress and Democrats
Sigma 1962 942 1020 502 467 580 414 1315 261 221 75 605 722 564 523 834 605 759 680 181 670 1292 545 1001 415 811 1039
100% 100% 100% 100% 100% 100% 100% 100% 100% 100% 100% 100% 100% 100% 100% 100% 100% 100% 100% 100% 100% 100% 100% 100% 100% 100% 100%

Page 124
QuickQuery
Fielding Period: January 13-16, 2018
HCAPS (Filtered on Registered Voters)
Weighted To The U.S. General Adult Population - Propensity
18 Jan 2018
Table 110
M19 Which is closest to your view?
Base: All Respondents
Presidential
Election Candidate
Gender Age Ethnicity Political Party Political Ideology Voted For Education Locale Income
_____________ ______________________ _______________________ ____________________ ____________________ _____________________ _____________ ________________ _________
Colle- Some
Cons- ge Gr- Colle- $75K Less
Hisp- Black Repub- Democ- Indep- Libe- Mode- erva- 3rd ad And ge Or Urb- Subu- Or Than
Total Male Female 18-34 35-49 50-64 65+ White anic /AA Other lican rat endent ral rate tive Clinton Trump Party Higher Less an rban Rural More $75K
______ _____ _______ _____ _____ _____ ____ _____ _____ _____ _____ ______ ______ ______ ______ ______ ______ ________ ______ _____ ______ ______ ____ _____ _____ ____ ____
Unweighted Base 1962 882 1080 384 500 636 442 1530 136 183 39 600 711 571 518 818 626 731 698 184 700 1262 519 952 491 577 1275
Weighted Base 1962 942 1020 502 467 580 414 1315 261 221 75 605 722 564 523 834 605 759 680 181 670 1292 545 1001 415 811 1039
Effective Base 1157 573 585 220 294 390 295 974 90 119 28 385 404 332 294 468 401 424 438 101 434 728 315 555 298 384 744
Democrats should boycott and 455 197 258 158 124 112 61 215 91 100 14 46 294 99 201 207 47 301 36 32 115 339 171 199 85 153 279
resist everything President 23% 21% 25% 31% 27% 19% 15% 16% 35% 45% 19% 8% 41% 18% 38% 25% 8% 40% 5% 18% 17% 26% 31% 20% 20% 19% 27%
Trump and his administration
are doing
Democrats should look to 1507 745 762 344 343 468 353 1100 171 121 61 558 428 465 322 628 558 458 645 148 555 952 375 802 331 658 760
cooperate with President 77% 79% 75% 69% 73% 81% 85% 84% 65% 55% 81% 92% 59% 82% 62% 75% 92% 60% 95% 82% 83% 74% 69% 80% 80% 81% 73%
Trump and his administration
and make deals on the issues
they support
Sigma 1962 942 1020 502 467 580 414 1315 261 221 75 605 722 564 523 834 605 759 680 181 670 1292 545 1001 415 811 1039
100% 100% 100% 100% 100% 100% 100% 100% 100% 100% 100% 100% 100% 100% 100% 100% 100% 100% 100% 100% 100% 100% 100% 100% 100% 100% 100%

Page 125
QuickQuery
Fielding Period: January 13-16, 2018
HCAPS (Filtered on Registered Voters)
Weighted To The U.S. General Adult Population - Propensity
18 Jan 2018
Table 111
M9B Do you think that, for his actions, President Trump should be impeached and
removed from office, censured by Congress, or no action should be taken?
Base: All Respondents
Presidential
Election Candidate
Gender Age Ethnicity Political Party Political Ideology Voted For Education Locale Income
_____________ ______________________ _______________________ ____________________ ____________________ _____________________ _____________ ________________ _________
Colle- Some
Cons- ge Gr- Colle- $75K Less
Hisp- Black Repub- Democ- Indep- Libe- Mode- erva- 3rd ad And ge Or Urb- Subu- Or Than
Total Male Female 18-34 35-49 50-64 65+ White anic /AA Other lican rat endent ral rate tive Clinton Trump Party Higher Less an rban Rural More $75K
______ _____ _______ _____ _____ _____ ____ _____ _____ _____ _____ ______ ______ ______ ______ ______ ______ ________ ______ _____ ______ ______ ____ _____ _____ ____ ____
Unweighted Base 1962 882 1080 384 500 636 442 1530 136 183 39 600 711 571 518 818 626 731 698 184 700 1262 519 952 491 577 1275
Weighted Base 1962 942 1020 502 467 580 414 1315 261 221 75 605 722 564 523 834 605 759 680 181 670 1292 545 1001 415 811 1039
Effective Base 1157 573 585 220 294 390 295 974 90 119 28 385 404 332 294 468 401 424 438 101 434 728 315 555 298 384 744
Impeached and removed from 805 350 455 251 192 225 137 463 134 140 24 67 509 208 382 360 64 554 57 71 279 526 274 389 142 324 445
office 41% 37% 45% 50% 41% 39% 33% 35% 51% 64% 32% 11% 71% 37% 73% 43% 11% 73% 8% 39% 42% 41% 50% 39% 34% 40% 43%
Censured by Congress 342 146 196 99 95 75 73 207 57 47 11 79 133 121 84 191 67 145 63 53 137 205 96 183 63 140 176
17% 16% 19% 20% 20% 13% 18% 16% 22% 21% 15% 13% 18% 21% 16% 23% 11% 19% 9% 30% 20% 16% 18% 18% 15% 17% 17%
No action should be taken 815 446 369 152 179 280 204 645 70 34 40 459 80 236 57 284 474 61 560 56 254 561 175 429 210 347 418
42% 47% 36% 30% 38% 48% 49% 49% 27% 15% 53% 76% 11% 42% 11% 34% 78% 8% 82% 31% 38% 43% 32% 43% 51% 43% 40%
Sigma 1962 942 1020 502 467 580 414 1315 261 221 75 605 722 564 523 834 605 759 680 181 670 1292 545 1001 415 811 1039
100% 100% 100% 100% 100% 100% 100% 100% 100% 100% 100% 100% 100% 100% 100% 100% 100% 100% 100% 100% 100% 100% 100% 100% 100% 100% 100%

Page 166
QuickQuery
Fielding Period: January 13-16, 2018
HCAPS (Filtered on Registered Voters)
Weighted To The U.S. General Adult Population - Propensity
18 Jan 2018
Table 140
CAP1 Do you think that the United States should become a socialist country?
Base: All Respondents
Presidential
Election Candidate
Gender Age Ethnicity Political Party Political Ideology Voted For Education Locale Income
_____________ ______________________ _______________________ ____________________ ____________________ _____________________ _____________ ________________ _________
Colle- Some
Cons- ge Gr- Colle- $75K Less
Hisp- Black Repub- Democ- Indep- Libe- Mode- erva- 3rd ad And ge Or Urb- Subu- Or Than
Total Male Female 18-34 35-49 50-64 65+ White anic /AA Other lican rat endent ral rate tive Clinton Trump Party Higher Less an rban Rural More $75K
______ _____ _______ _____ _____ _____ ____ _____ _____ _____ _____ ______ ______ ______ ______ ______ ______ ________ ______ _____ ______ ______ ____ _____ _____ ____ ____
Unweighted Base 1962 882 1080 384 500 636 442 1530 136 183 39 600 711 571 518 818 626 731 698 184 700 1262 519 952 491 577 1275
Weighted Base 1962 942 1020 502 467 580 414 1315 261 221 75 605 722 564 523 834 605 759 680 181 670 1292 545 1001 415 811 1039
Effective Base 1157 573 585 220 294 390 295 974 90 119 28 385 404 332 294 468 401 424 438 101 434 728 315 555 298 384 744
Yes 284 143 140 136 65 61 21 158 59 36 13 59 135 80 139 112 33 135 58 38 92 192 108 128 47 88 186
14% 15% 14% 27% 14% 10% 5% 12% 23% 16% 18% 10% 19% 14% 27% 13% 5% 18% 8% 21% 14% 15% 20% 13% 11% 11% 18%
No 1678 799 880 365 402 519 392 1156 202 185 62 546 587 484 384 722 572 624 623 142 579 1100 437 873 368 723 853
86% 85% 86% 73% 86% 90% 95% 88% 77% 84% 82% 90% 81% 86% 73% 87% 95% 82% 92% 79% 86% 85% 80% 87% 89% 89% 82%
Sigma 1962 942 1020 502 467 580 414 1315 261 221 75 605 722 564 523 834 605 759 680 181 670 1292 545 1001 415 811 1039
100% 100% 100% 100% 100% 100% 100% 100% 100% 100% 100% 100% 100% 100% 100% 100% 100% 100% 100% 100% 100% 100% 100% 100% 100% 100% 100%

Page 167
QuickQuery
Fielding Period: January 13-16, 2018
HCAPS (Filtered on Registered Voters)
Weighted To The U.S. General Adult Population - Propensity
18 Jan 2018
Table 141
CAP2 Do you think that the United States should maintain a capitalist, free enterprise-based economy?
Base: All Respondents
Presidential
Election Candidate
Gender Age Ethnicity Political Party Political Ideology Voted For Education Locale Income
_____________ ______________________ _______________________ ____________________ ____________________ _____________________ _____________ ________________ _________
Colle- Some
Cons- ge Gr- Colle- $75K Less
Hisp- Black Repub- Democ- Indep- Libe- Mode- erva- 3rd ad And ge Or Urb- Subu- Or Than
Total Male Female 18-34 35-49 50-64 65+ White anic /AA Other lican rat endent ral rate tive Clinton Trump Party Higher Less an rban Rural More $75K
______ _____ _______ _____ _____ _____ ____ _____ _____ _____ _____ ______ ______ ______ ______ ______ ______ ________ ______ _____ ______ ______ ____ _____ _____ ____ ____
Unweighted Base 1962 882 1080 384 500 636 442 1530 136 183 39 600 711 571 518 818 626 731 698 184 700 1262 519 952 491 577 1275
Weighted Base 1962 942 1020 502 467 580 414 1315 261 221 75 605 722 564 523 834 605 759 680 181 670 1292 545 1001 415 811 1039
Effective Base 1157 573 585 220 294 390 295 974 90 119 28 385 404 332 294 468 401 424 438 101 434 728 315 555 298 384 744
Yes 1702 829 873 397 397 526 382 1165 229 176 62 572 591 486 409 721 572 622 645 154 598 1105 455 878 369 736 865
87% 88% 86% 79% 85% 91% 92% 89% 88% 80% 82% 95% 82% 86% 78% 86% 95% 82% 95% 85% 89% 86% 84% 88% 89% 91% 83%
No 260 112 147 105 70 53 32 149 32 45 13 33 131 79 114 113 33 137 35 27 73 187 90 123 46 74 174
13% 12% 14% 21% 15% 9% 8% 11% 12% 20% 18% 5% 18% 14% 22% 14% 5% 18% 5% 15% 11% 14% 16% 12% 11% 9% 17%
Sigma 1962 942 1020 502 467 580 414 1315 261 221 75 605 722 564 523 834 605 759 680 181 670 1292 545 1001 415 811 1039
100% 100% 100% 100% 100% 100% 100% 100% 100% 100% 100% 100% 100% 100% 100% 100% 100% 100% 100% 100% 100% 100% 100% 100% 100% 100% 100%

Page 168
QuickQuery
Fielding Period: January 13-16, 2018
HCAPS (Filtered on Registered Voters)
Weighted To The U.S. General Adult Population - Propensity
18 Jan 2018
Table 142
CAP3 Which system would be better for the United States: to remain a capitalist, free enterprise country or become a socialist country?
Base: All Respondents
Presidential
Election Candidate
Gender Age Ethnicity Political Party Political Ideology Voted For Education Locale Income
_____________ ______________________ _______________________ ____________________ ____________________ _____________________ _____________ ________________ _________
Colle- Some
Cons- ge Gr- Colle- $75K Less
Hisp- Black Repub- Democ- Indep- Libe- Mode- erva- 3rd ad And ge Or Urb- Subu- Or Than
Total Male Female 18-34 35-49 50-64 65+ White anic /AA Other lican rat endent ral rate tive Clinton Trump Party Higher Less an rban Rural More $75K
______ _____ _______ _____ _____ _____ ____ _____ _____ _____ _____ ______ ______ ______ ______ ______ ______ ________ ______ _____ ______ ______ ____ _____ _____ ____ ____
Unweighted Base 1962 882 1080 384 500 636 442 1530 136 183 39 600 711 571 518 818 626 731 698 184 700 1262 519 952 491 577 1275
Weighted Base 1962 942 1020 502 467 580 414 1315 261 221 75 605 722 564 523 834 605 759 680 181 670 1292 545 1001 415 811 1039
Effective Base 1157 573 585 220 294 390 295 974 90 119 28 385 404 332 294 468 401 424 438 101 434 728 315 555 298 384 744
Remain a capitalist, free 1723 836 887 396 397 532 398 1196 215 190 60 570 606 488 409 738 576 639 651 151 597 1126 466 884 373 738 881
enterprise country 88% 89% 87% 79% 85% 92% 96% 91% 82% 86% 80% 94% 84% 86% 78% 88% 95% 84% 96% 84% 89% 87% 86% 88% 90% 91% 85%
Become a socialist country 239 106 133 106 69 48 16 119 46 31 15 35 116 77 114 96 28 120 29 30 73 165 79 117 43 73 158
12% 11% 13% 21% 15% 8% 4% 9% 18% 14% 20% 6% 16% 14% 22% 12% 5% 16% 4% 16% 11% 13% 14% 12% 10% 9% 15%
Sigma 1962 942 1020 502 467 580 414 1315 261 221 75 605 722 564 523 834 605 759 680 181 670 1292 545 1001 415 811 1039
100% 100% 100% 100% 100% 100% 100% 100% 100% 100% 100% 100% 100% 100% 100% 100% 100% 100% 100% 100% 100% 100% 100% 100% 100% 100% 100%

Page 169
QuickQuery
Fielding Period: January 13-16, 2018
HCAPS (Filtered on Registered Voters)
Weighted To The U.S. General Adult Population - Propensity
18 Jan 2018
Table 143
CAP4 Which system do you think you personally would do better in: a capitalist, free enterprise system or a socialist system?
Base: All Respondents
Presidential
Election Candidate
Gender Age Ethnicity Political Party Political Ideology Voted For Education Locale Income
_____________ ______________________ _______________________ ____________________ ____________________ _____________________ _____________ ________________ _________
Colle- Some
Cons- ge Gr- Colle- $75K Less
Hisp- Black Repub- Democ- Indep- Libe- Mode- erva- 3rd ad And ge Or Urb- Subu- Or Than
Total Male Female 18-34 35-49 50-64 65+ White anic /AA Other lican rat endent ral rate tive Clinton Trump Party Higher Less an rban Rural More $75K
______ _____ _______ _____ _____ _____ ____ _____ _____ _____ _____ ______ ______ ______ ______ ______ ______ ________ ______ _____ ______ ______ ____ _____ _____ ____ ____
Unweighted Base 1962 882 1080 384 500 636 442 1530 136 183 39 600 711 571 518 818 626 731 698 184 700 1262 519 952 491 577 1275
Weighted Base 1962 942 1020 502 467 580 414 1315 261 221 75 605 722 564 523 834 605 759 680 181 670 1292 545 1001 415 811 1039
Effective Base 1157 573 585 220 294 390 295 974 90 119 28 385 404 332 294 468 401 424 438 101 434 728 315 555 298 384 744
A capitalist, free 1646 806 840 383 393 503 367 1132 218 182 57 569 561 454 363 712 571 584 640 144 553 1093 455 851 340 704 841
enterprise system 84% 86% 82% 76% 84% 87% 89% 86% 84% 82% 76% 94% 78% 80% 69% 85% 94% 77% 94% 79% 82% 85% 83% 85% 82% 87% 81%
A socialist system 316 136 180 118 74 77 46 182 43 39 18 35 161 111 160 122 34 175 41 37 118 198 91 150 75 107 198
16% 14% 18% 24% 16% 13% 11% 14% 16% 18% 24% 6% 22% 20% 31% 15% 6% 23% 6% 21% 18% 15% 17% 15% 18% 13% 19%
Sigma 1962 942 1020 502 467 580 414 1315 261 221 75 605 722 564 523 834 605 759 680 181 670 1292 545 1001 415 811 1039
100% 100% 100% 100% 100% 100% 100% 100% 100% 100% 100% 100% 100% 100% 100% 100% 100% 100% 100% 100% 100% 100% 100% 100% 100% 100% 100%

Page 170
QuickQuery
Fielding Period: January 13-16, 2018
HCAPS (Filtered on Registered Voters)
Weighted To The U.S. General Adult Population - Propensity
18 Jan 2018
Table 144
CAP5 Do you think that our economy needs more regulation or less regulation?
Base: All Respondents
Presidential
Election Candidate
Gender Age Ethnicity Political Party Political Ideology Voted For Education Locale Income
_____________ ______________________ _______________________ ____________________ ____________________ _____________________ _____________ ________________ _________
Colle- Some
Cons- ge Gr- Colle- $75K Less
Hisp- Black Repub- Democ- Indep- Libe- Mode- erva- 3rd ad And ge Or Urb- Subu- Or Than
Total Male Female 18-34 35-49 50-64 65+ White anic /AA Other lican rat endent ral rate tive Clinton Trump Party Higher Less an rban Rural More $75K
______ _____ _______ _____ _____ _____ ____ _____ _____ _____ _____ ______ ______ ______ ______ ______ ______ ________ ______ _____ ______ ______ ____ _____ _____ ____ ____
Unweighted Base 1962 882 1080 384 500 636 442 1530 136 183 39 600 711 571 518 818 626 731 698 184 700 1262 519 952 491 577 1275
Weighted Base 1962 942 1020 502 467 580 414 1315 261 221 75 605 722 564 523 834 605 759 680 181 670 1292 545 1001 415 811 1039
Effective Base 1157 573 585 220 294 390 295 974 90 119 28 385 404 332 294 468 401 424 438 101 434 728 315 555 298 384 744
More regulation 967 407 561 278 230 273 186 585 163 132 30 191 471 271 374 428 166 517 204 70 308 660 306 474 187 367 542
49% 43% 55% 55% 49% 47% 45% 45% 63% 60% 40% 32% 65% 48% 72% 51% 27% 68% 30% 39% 46% 51% 56% 47% 45% 45% 52%
Less regulation 995 535 460 224 237 307 228 729 98 89 45 413 251 294 148 407 439 242 477 111 363 632 239 527 228 444 497
51% 57% 45% 45% 51% 53% 55% 55% 37% 40% 60% 68% 35% 52% 28% 49% 73% 32% 70% 61% 54% 49% 44% 53% 55% 55% 48%
Sigma 1962 942 1020 502 467 580 414 1315 261 221 75 605 722 564 523 834 605 759 680 181 670 1292 545 1001 415 811 1039
100% 100% 100% 100% 100% 100% 100% 100% 100% 100% 100% 100% 100% 100% 100% 100% 100% 100% 100% 100% 100% 100% 100% 100% 100% 100% 100%

Page 171
QuickQuery
Fielding Period: January 13-16, 2018
HCAPS (Filtered on Registered Voters)
Weighted To The U.S. General Adult Population - Propensity
18 Jan 2018
Table 145
CAP6 Are you more concerned about how some people can become too wealthy in our economy or more concerned about
people who could work living off government programs instead?
Base: All Respondents
Presidential
Election Candidate
Gender Age Ethnicity Political Party Political Ideology Voted For Education Locale Income
_____________ ______________________ _______________________ ____________________ ____________________ _____________________ _____________ ________________ _________
Colle- Some
Cons- ge Gr- Colle- $75K Less
Hisp- Black Repub- Democ- Indep- Libe- Mode- erva- 3rd ad And ge Or Urb- Subu- Or Than
Total Male Female 18-34 35-49 50-64 65+ White anic /AA Other lican rat endent ral rate tive Clinton Trump Party Higher Less an rban Rural More $75K
______ _____ _______ _____ _____ _____ ____ _____ _____ _____ _____ ______ ______ ______ ______ ______ ______ ________ ______ _____ ______ ______ ____ _____ _____ ____ ____
Unweighted Base 1962 882 1080 384 500 636 442 1530 136 183 39 600 711 571 518 818 626 731 698 184 700 1262 519 952 491 577 1275
Weighted Base 1962 942 1020 502 467 580 414 1315 261 221 75 605 722 564 523 834 605 759 680 181 670 1292 545 1001 415 811 1039
Effective Base 1157 573 585 220 294 390 295 974 90 119 28 385 404 332 294 468 401 424 438 101 434 728 315 555 298 384 744
More concerned about how 892 410 481 282 197 251 162 524 158 136 31 142 492 236 388 392 111 531 138 74 320 572 307 429 155 328 522
some people can become too 45% 44% 47% 56% 42% 43% 39% 40% 60% 61% 41% 23% 68% 42% 74% 47% 18% 70% 20% 41% 48% 44% 56% 43% 37% 40% 50%
wealthy
More concerned about people 1070 531 539 220 270 329 252 790 103 85 45 462 230 328 135 442 493 228 542 107 350 720 238 572 260 483 517
who could live of government 55% 56% 53% 44% 58% 57% 61% 60% 40% 39% 59% 77% 32% 58% 26% 53% 82% 30% 80% 59% 52% 56% 44% 57% 63% 60% 50%
programs
Sigma 1962 942 1020 502 467 580 414 1315 261 221 75 605 722 564 523 834 605 759 680 181 670 1292 545 1001 415 811 1039
100% 100% 100% 100% 100% 100% 100% 100% 100% 100% 100% 100% 100% 100% 100% 100% 100% 100% 100% 100% 100% 100% 100% 100% 100% 100% 100%

Page 172
QuickQuery
Fielding Period: January 13-16, 2018
HCAPS (Filtered on Registered Voters)
Weighted To The U.S. General Adult Population - Propensity
18 Jan 2018
Table 146
CAP7 Should the government pay for all healthcare in the United States?
Base: All Respondents
Presidential
Election Candidate
Gender Age Ethnicity Political Party Political Ideology Voted For Education Locale Income
_____________ ______________________ _______________________ ____________________ ____________________ _____________________ _____________ ________________ _________
Colle- Some
Cons- ge Gr- Colle- $75K Less
Hisp- Black Repub- Democ- Indep- Libe- Mode- erva- 3rd ad And ge Or Urb- Subu- Or Than
Total Male Female 18-34 35-49 50-64 65+ White anic /AA Other lican rat endent ral rate tive Clinton Trump Party Higher Less an rban Rural More $75K
______ _____ _______ _____ _____ _____ ____ _____ _____ _____ _____ ______ ______ ______ ______ ______ ______ ________ ______ _____ ______ ______ ____ _____ _____ ____ ____
Unweighted Base 1962 882 1080 384 500 636 442 1530 136 183 39 600 711 571 518 818 626 731 698 184 700 1262 519 952 491 577 1275
Weighted Base 1962 942 1020 502 467 580 414 1315 261 221 75 605 722 564 523 834 605 759 680 181 670 1292 545 1001 415 811 1039
Effective Base 1157 573 585 220 294 390 295 974 90 119 28 385 404 332 294 468 401 424 438 101 434 728 315 555 298 384 744
Yes 1084 471 613 335 269 286 194 638 181 169 36 172 578 292 420 512 151 587 184 91 342 742 358 517 209 399 621
55% 50% 60% 67% 58% 49% 47% 49% 69% 77% 47% 28% 80% 52% 80% 61% 25% 77% 27% 50% 51% 57% 66% 52% 50% 49% 60%
No 878 471 408 167 198 294 220 676 80 52 40 433 144 272 102 323 453 172 496 90 328 550 188 484 207 412 418
45% 50% 40% 33% 42% 51% 53% 51% 31% 23% 53% 72% 20% 48% 20% 39% 75% 23% 73% 50% 49% 43% 34% 48% 50% 51% 40%
Sigma 1962 942 1020 502 467 580 414 1315 261 221 75 605 722 564 523 834 605 759 680 181 670 1292 545 1001 415 811 1039
100% 100% 100% 100% 100% 100% 100% 100% 100% 100% 100% 100% 100% 100% 100% 100% 100% 100% 100% 100% 100% 100% 100% 100% 100% 100% 100%

Page 173
QuickQuery
Fielding Period: January 13-16, 2018
HCAPS (Filtered on Registered Voters)
Weighted To The U.S. General Adult Population - Propensity
18 Jan 2018
Table 147
CAP8 Should the government pay for all college in the United States?
Base: All Respondents
Presidential
Election Candidate
Gender Age Ethnicity Political Party Political Ideology Voted For Education Locale Income
_____________ ______________________ _______________________ ____________________ ____________________ _____________________ _____________ ________________ _________
Colle- Some
Cons- ge Gr- Colle- $75K Less
Hisp- Black Repub- Democ- Indep- Libe- Mode- erva- 3rd ad And ge Or Urb- Subu- Or Than
Total Male Female 18-34 35-49 50-64 65+ White anic /AA Other lican rat endent ral rate tive Clinton Trump Party Higher Less an rban Rural More $75K
______ _____ _______ _____ _____ _____ ____ _____ _____ _____ _____ ______ ______ ______ ______ ______ ______ ________ ______ _____ ______ ______ ____ _____ _____ ____ ____
Unweighted Base 1962 882 1080 384 500 636 442 1530 136 183 39 600 711 571 518 818 626 731 698 184 700 1262 519 952 491 577 1275
Weighted Base 1962 942 1020 502 467 580 414 1315 261 221 75 605 722 564 523 834 605 759 680 181 670 1292 545 1001 415 811 1039
Effective Base 1157 573 585 220 294 390 295 974 90 119 28 385 404 332 294 468 401 424 438 101 434 728 315 555 298 384 744
Yes 864 360 504 309 214 213 128 468 168 142 36 141 460 230 336 408 119 475 160 70 283 581 303 404 157 322 489
44% 38% 49% 62% 46% 37% 31% 36% 64% 64% 48% 23% 64% 41% 64% 49% 20% 63% 24% 39% 42% 45% 55% 40% 38% 40% 47%
No 1098 582 517 192 253 367 286 847 93 79 39 464 262 335 186 426 486 284 520 110 387 711 243 597 258 488 550
56% 62% 51% 38% 54% 63% 69% 64% 36% 36% 52% 77% 36% 59% 36% 51% 80% 37% 76% 61% 58% 55% 45% 60% 62% 60% 53%
Sigma 1962 942 1020 502 467 580 414 1315 261 221 75 605 722 564 523 834 605 759 680 181 670 1292 545 1001 415 811 1039
100% 100% 100% 100% 100% 100% 100% 100% 100% 100% 100% 100% 100% 100% 100% 100% 100% 100% 100% 100% 100% 100% 100% 100% 100% 100% 100%
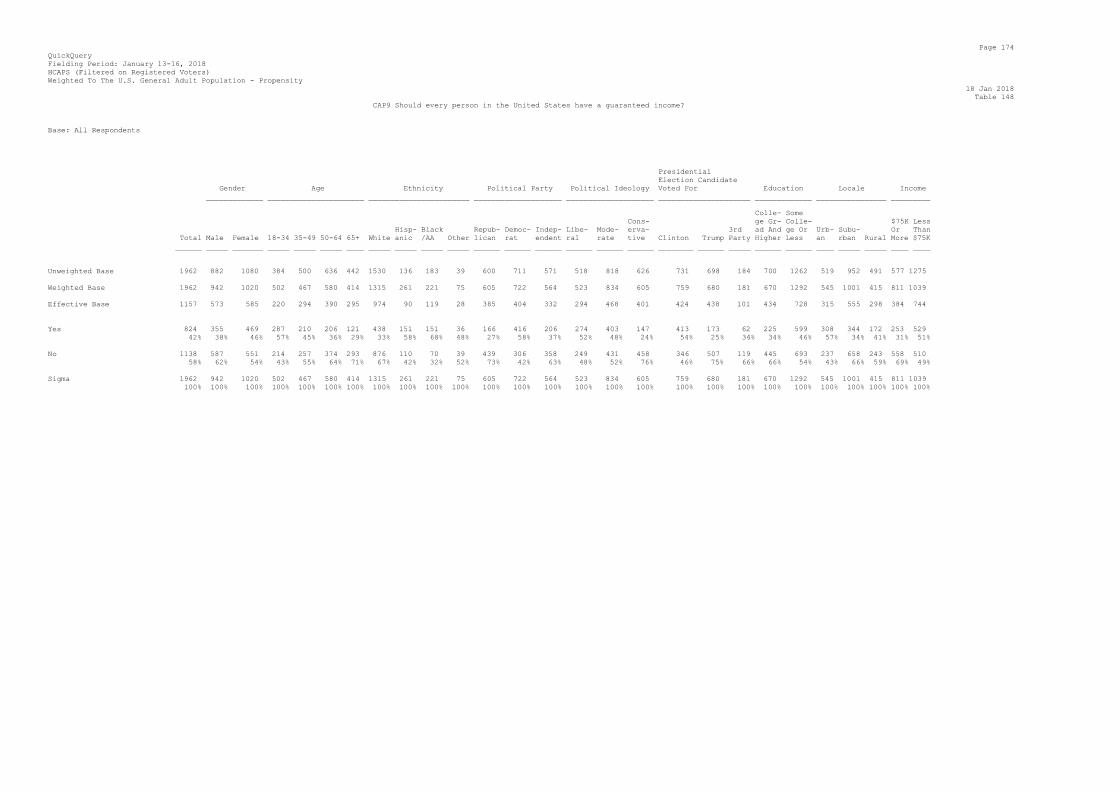
Page 174
QuickQuery
Fielding Period: January 13-16, 2018
HCAPS (Filtered on Registered Voters)
Weighted To The U.S. General Adult Population - Propensity
18 Jan 2018
Table 148
CAP9 Should every person in the United States have a guaranteed income?
Base: All Respondents
Presidential
Election Candidate
Gender Age Ethnicity Political Party Political Ideology Voted For Education Locale Income
_____________ ______________________ _______________________ ____________________ ____________________ _____________________ _____________ ________________ _________
Colle- Some
Cons- ge Gr- Colle- $75K Less
Hisp- Black Repub- Democ- Indep- Libe- Mode- erva- 3rd ad And ge Or Urb- Subu- Or Than
Total Male Female 18-34 35-49 50-64 65+ White anic /AA Other lican rat endent ral rate tive Clinton Trump Party Higher Less an rban Rural More $75K
______ _____ _______ _____ _____ _____ ____ _____ _____ _____ _____ ______ ______ ______ ______ ______ ______ ________ ______ _____ ______ ______ ____ _____ _____ ____ ____
Unweighted Base 1962 882 1080 384 500 636 442 1530 136 183 39 600 711 571 518 818 626 731 698 184 700 1262 519 952 491 577 1275
Weighted Base 1962 942 1020 502 467 580 414 1315 261 221 75 605 722 564 523 834 605 759 680 181 670 1292 545 1001 415 811 1039
Effective Base 1157 573 585 220 294 390 295 974 90 119 28 385 404 332 294 468 401 424 438 101 434 728 315 555 298 384 744
Yes 824 355 469 287 210 206 121 438 151 151 36 166 416 206 274 403 147 413 173 62 225 599 308 344 172 253 529
42% 38% 46% 57% 45% 36% 29% 33% 58% 68% 48% 27% 58% 37% 52% 48% 24% 54% 25% 34% 34% 46% 57% 34% 41% 31% 51%
No 1138 587 551 214 257 374 293 876 110 70 39 439 306 358 249 431 458 346 507 119 445 693 237 658 243 558 510
58% 62% 54% 43% 55% 64% 71% 67% 42% 32% 52% 73% 42% 63% 48% 52% 76% 46% 75% 66% 66% 54% 43% 66% 59% 69% 49%
Sigma 1962 942 1020 502 467 580 414 1315 261 221 75 605 722 564 523 834 605 759 680 181 670 1292 545 1001 415 811 1039
100% 100% 100% 100% 100% 100% 100% 100% 100% 100% 100% 100% 100% 100% 100% 100% 100% 100% 100% 100% 100% 100% 100% 100% 100% 100% 100%

Page 175
QuickQuery
Fielding Period: January 13-16, 2018
HCAPS (Filtered on Registered Voters)
Weighted To The U.S. General Adult Population - Propensity
18 Jan 2018
Table 149
CAP10 Do you believe that competition brings out the best in people or that cooperation is the best way for people to coexist?
Base: All Respondents
Presidential
Election Candidate
Gender Age Ethnicity Political Party Political Ideology Voted For Education Locale Income
_____________ ______________________ _______________________ ____________________ ____________________ _____________________ _____________ ________________ _________
Colle- Some
Cons- ge Gr- Colle- $75K Less
Hisp- Black Repub- Democ- Indep- Libe- Mode- erva- 3rd ad And ge Or Urb- Subu- Or Than
Total Male Female 18-34 35-49 50-64 65+ White anic /AA Other lican rat endent ral rate tive Clinton Trump Party Higher Less an rban Rural More $75K
______ _____ _______ _____ _____ _____ ____ _____ _____ _____ _____ ______ ______ ______ ______ ______ ______ ________ ______ _____ ______ ______ ____ _____ _____ ____ ____
Unweighted Base 1962 882 1080 384 500 636 442 1530 136 183 39 600 711 571 518 818 626 731 698 184 700 1262 519 952 491 577 1275
Weighted Base 1962 942 1020 502 467 580 414 1315 261 221 75 605 722 564 523 834 605 759 680 181 670 1292 545 1001 415 811 1039
Effective Base 1157 573 585 220 294 390 295 974 90 119 28 385 404 332 294 468 401 424 438 101 434 728 315 555 298 384 744
Competition brings out the 1042 607 436 245 251 308 239 714 141 101 45 428 305 266 188 425 430 326 476 83 368 675 283 538 221 454 539
best in people 53% 64% 43% 49% 54% 53% 58% 54% 54% 46% 60% 71% 42% 47% 36% 51% 71% 43% 70% 46% 55% 52% 52% 54% 53% 56% 52%
Cooperation is the best way 920 335 585 257 215 272 175 600 120 120 30 176 417 298 335 410 175 433 204 98 303 617 262 463 195 357 500
for people to coexist 47% 36% 57% 51% 46% 47% 42% 46% 46% 54% 40% 29% 58% 53% 64% 49% 29% 57% 30% 54% 45% 48% 48% 46% 47% 44% 48%
Sigma 1962 942 1020 502 467 580 414 1315 261 221 75 605 722 564 523 834 605 759 680 181 670 1292 545 1001 415 811 1039
100% 100% 100% 100% 100% 100% 100% 100% 100% 100% 100% 100% 100% 100% 100% 100% 100% 100% 100% 100% 100% 100% 100% 100% 100% 100% 100%

Page 176
QuickQuery
Fielding Period: January 13-16, 2018
HCAPS (Filtered on Registered Voters)
Weighted To The U.S. General Adult Population - Propensity
18 Jan 2018
Table 150
CAP11 Would you rather live in a country where everyone works for their own wealth and there are no limits to wealth
accumulation, or a country where wealth is distributed to everyone equally?
Base: All Respondents
Presidential
Election Candidate
Gender Age Ethnicity Political Party Political Ideology Voted For Education Locale Income
_____________ ______________________ _______________________ ____________________ ____________________ _____________________ _____________ ________________ _________
Colle- Some
Cons- ge Gr- Colle- $75K Less
Hisp- Black Repub- Democ- Indep- Libe- Mode- erva- 3rd ad And ge Or Urb- Subu- Or Than
Total Male Female 18-34 35-49 50-64 65+ White anic /AA Other lican rat endent ral rate tive Clinton Trump Party Higher Less an rban Rural More $75K
______ _____ _______ _____ _____ _____ ____ _____ _____ _____ _____ ______ ______ ______ ______ ______ ______ ________ ______ _____ ______ ______ ____ _____ _____ ____ ____
Unweighted Base 1962 882 1080 384 500 636 442 1530 136 183 39 600 711 571 518 818 626 731 698 184 700 1262 519 952 491 577 1275
Weighted Base 1962 942 1020 502 467 580 414 1315 261 221 75 605 722 564 523 834 605 759 680 181 670 1292 545 1001 415 811 1039
Effective Base 1157 573 585 220 294 390 295 974 90 119 28 385 404 332 294 468 401 424 438 101 434 728 315 555 298 384 744
Everyone works for their own 1465 743 723 324 342 460 339 1058 168 122 60 538 468 409 337 593 536 500 608 135 543 922 382 785 299 668 707
wealth 75% 79% 71% 65% 73% 79% 82% 80% 64% 55% 80% 89% 65% 72% 64% 71% 89% 66% 89% 75% 81% 71% 70% 78% 72% 82% 68%
Wealth is distributed to 497 199 298 178 125 120 75 257 93 99 15 67 254 156 186 241 69 259 73 45 127 369 163 217 116 143 333
everyone equally 25% 21% 29% 35% 27% 21% 18% 20% 36% 45% 20% 11% 35% 28% 36% 29% 11% 34% 11% 25% 19% 29% 30% 22% 28% 18% 32%
Sigma 1962 942 1020 502 467 580 414 1315 261 221 75 605 722 564 523 834 605 759 680 181 670 1292 545 1001 415 811 1039
100% 100% 100% 100% 100% 100% 100% 100% 100% 100% 100% 100% 100% 100% 100% 100% 100% 100% 100% 100% 100% 100% 100% 100% 100% 100% 100%

Page 177
QuickQuery
Fielding Period: January 13-16, 2018
HCAPS (Filtered on Registered Voters)
Weighted To The U.S. General Adult Population - Propensity
18 Jan 2018
Table 151
CAP12 Should the government be fully involved in the economy or should it only interfere where laws are needed or they have been broken?
Base: All Respondents
Presidential
Election Candidate
Gender Age Ethnicity Political Party Political Ideology Voted For Education Locale Income
_____________ ______________________ _______________________ ____________________ ____________________ _____________________ _____________ ________________ _________
Colle- Some
Cons- ge Gr- Colle- $75K Less
Hisp- Black Repub- Democ- Indep- Libe- Mode- erva- 3rd ad And ge Or Urb- Subu- Or Than
Total Male Female 18-34 35-49 50-64 65+ White anic /AA Other lican rat endent ral rate tive Clinton Trump Party Higher Less an rban Rural More $75K
______ _____ _______ _____ _____ _____ ____ _____ _____ _____ _____ ______ ______ ______ ______ ______ ______ ________ ______ _____ ______ ______ ____ _____ _____ ____ ____
Unweighted Base 1962 882 1080 384 500 636 442 1530 136 183 39 600 711 571 518 818 626 731 698 184 700 1262 519 952 491 577 1275
Weighted Base 1962 942 1020 502 467 580 414 1315 261 221 75 605 722 564 523 834 605 759 680 181 670 1292 545 1001 415 811 1039
Effective Base 1157 573 585 220 294 390 295 974 90 119 28 385 404 332 294 468 401 424 438 101 434 728 315 555 298 384 744
Government should be fully 614 287 327 190 157 170 97 365 118 76 23 163 279 150 224 257 134 308 165 42 202 412 205 283 126 247 347
involved in economy 31% 30% 32% 38% 34% 29% 23% 28% 45% 35% 31% 27% 39% 27% 43% 31% 22% 41% 24% 23% 30% 32% 38% 28% 30% 30% 33%
Government should only 1348 655 693 312 309 410 317 950 143 145 52 442 443 414 299 578 471 451 515 138 469 879 340 718 289 564 692
interfere where laws are 69% 70% 68% 62% 66% 71% 77% 72% 55% 65% 69% 73% 61% 73% 57% 69% 78% 59% 76% 77% 70% 68% 62% 72% 70% 70% 67%
needed or when laws are
broken
Sigma 1962 942 1020 502 467 580 414 1315 261 221 75 605 722 564 523 834 605 759 680 181 670 1292 545 1001 415 811 1039
100% 100% 100% 100% 100% 100% 100% 100% 100% 100% 100% 100% 100% 100% 100% 100% 100% 100% 100% 100% 100% 100% 100% 100% 100% 100% 100%
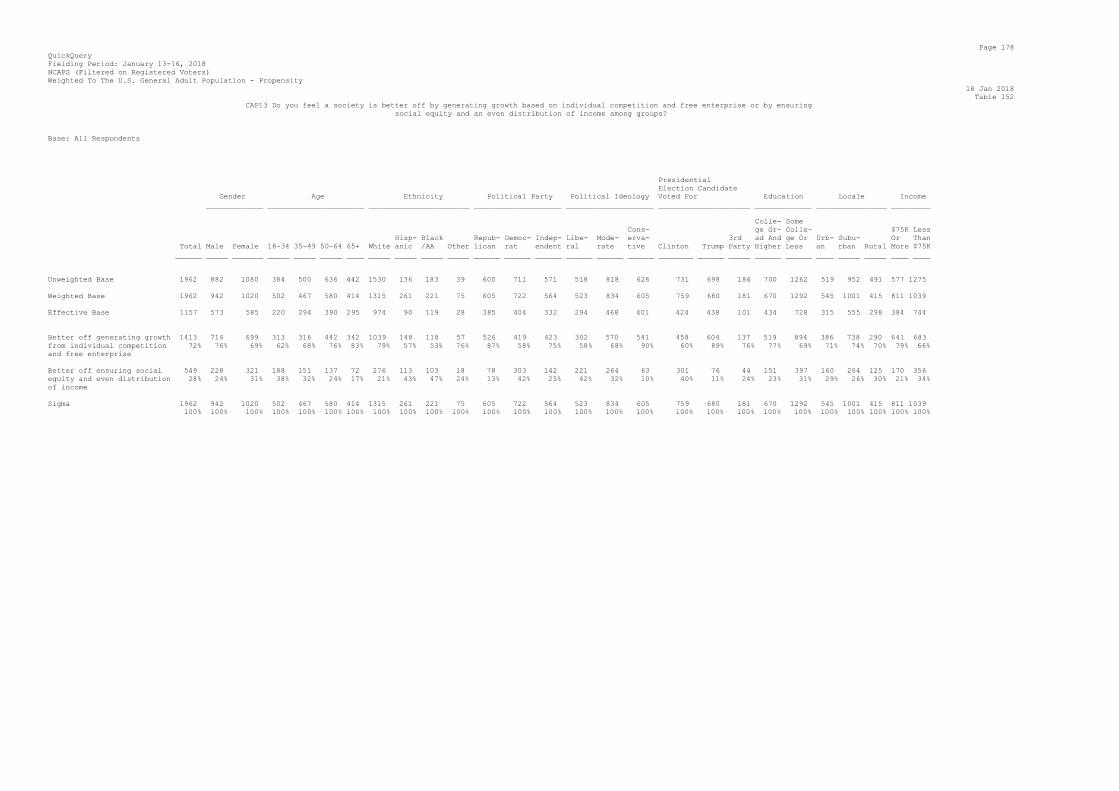
Page 178
QuickQuery
Fielding Period: January 13-16, 2018
HCAPS (Filtered on Registered Voters)
Weighted To The U.S. General Adult Population - Propensity
18 Jan 2018
Table 152
CAP13 Do you feel a society is better off by generating growth based on individual competition and free enterprise or by ensuring
social equity and an even distribution of income among groups?
Base: All Respondents
Presidential
Election Candidate
Gender Age Ethnicity Political Party Political Ideology Voted For Education Locale Income
_____________ ______________________ _______________________ ____________________ ____________________ _____________________ _____________ ________________ _________
Colle- Some
Cons- ge Gr- Colle- $75K Less
Hisp- Black Repub- Democ- Indep- Libe- Mode- erva- 3rd ad And ge Or Urb- Subu- Or Than
Total Male Female 18-34 35-49 50-64 65+ White anic /AA Other lican rat endent ral rate tive Clinton Trump Party Higher Less an rban Rural More $75K
______ _____ _______ _____ _____ _____ ____ _____ _____ _____ _____ ______ ______ ______ ______ ______ ______ ________ ______ _____ ______ ______ ____ _____ _____ ____ ____
Unweighted Base 1962 882 1080 384 500 636 442 1530 136 183 39 600 711 571 518 818 626 731 698 184 700 1262 519 952 491 577 1275
Weighted Base 1962 942 1020 502 467 580 414 1315 261 221 75 605 722 564 523 834 605 759 680 181 670 1292 545 1001 415 811 1039
Effective Base 1157 573 585 220 294 390 295 974 90 119 28 385 404 332 294 468 401 424 438 101 434 728 315 555 298 384 744
Better off generating growth 1413 714 699 313 316 442 342 1039 148 118 57 526 419 423 302 570 541 458 604 137 519 894 386 738 290 641 683
from individual competition 72% 76% 69% 62% 68% 76% 83% 79% 57% 53% 76% 87% 58% 75% 58% 68% 90% 60% 89% 76% 77% 69% 71% 74% 70% 79% 66%
and free enterprise
Better off ensuring social 549 228 321 188 151 137 72 276 113 103 18 78 303 142 221 264 63 301 76 44 151 397 160 264 125 170 356
equity and even distribution 28% 24% 31% 38% 32% 24% 17% 21% 43% 47% 24% 13% 42% 25% 42% 32% 10% 40% 11% 24% 23% 31% 29% 26% 30% 21% 34%
of income
Sigma 1962 942 1020 502 467 580 414 1315 261 221 75 605 722 564 523 834 605 759 680 181 670 1292 545 1001 415 811 1039
100% 100% 100% 100% 100% 100% 100% 100% 100% 100% 100% 100% 100% 100% 100% 100% 100% 100% 100% 100% 100% 100% 100% 100% 100% 100% 100%

Page 179
QuickQuery
Fielding Period: January 13-16, 2018
HCAPS (Filtered on Registered Voters)
Weighted To The U.S. General Adult Population - Propensity
18 Jan 2018
Table 153
NETNEUTRALITY1 Do you think that internet providers should be able to charge companies for internet service by usage tiers, so that companies that need very high-speed delivery
for services like online video pay more and companies that predominately send mail and text that can be delivered at slower speeds pay less,
or should they not be allowed to charge companies in that way?
Base: All Respondents
Presidential
Election Candidate
Gender Age Ethnicity Political Party Political Ideology Voted For Education Locale Income
_____________ ______________________ _______________________ ____________________ ____________________ _____________________ _____________ ________________ _________
Colle- Some
Cons- ge Gr- Colle- $75K Less
Hisp- Black Repub- Democ- Indep- Libe- Mode- erva- 3rd ad And ge Or Urb- Subu- Or Than
Total Male Female 18-34 35-49 50-64 65+ White anic /AA Other lican rat endent ral rate tive Clinton Trump Party Higher Less an rban Rural More $75K
______ _____ _______ _____ _____ _____ ____ _____ _____ _____ _____ ______ ______ ______ ______ ______ ______ ________ ______ _____ ______ ______ ____ _____ _____ ____ ____
Unweighted Base 1962 882 1080 384 500 636 442 1530 136 183 39 600 711 571 518 818 626 731 698 184 700 1262 519 952 491 577 1275
Weighted Base 1962 942 1020 502 467 580 414 1315 261 221 75 605 722 564 523 834 605 759 680 181 670 1292 545 1001 415 811 1039
Effective Base 1157 573 585 220 294 390 295 974 90 119 28 385 404 332 294 468 401 424 438 101 434 728 315 555 298 384 744
Internet providers should be 694 386 308 145 168 204 177 507 79 58 29 285 187 195 133 256 305 199 332 60 265 429 212 322 161 305 350
able to charge for internet 35% 41% 30% 29% 36% 35% 43% 39% 30% 26% 38% 47% 26% 35% 25% 31% 50% 26% 49% 33% 40% 33% 39% 32% 39% 38% 34%
service by usage tiers
Internet providers should 1268 555 713 357 298 376 237 808 182 162 46 320 535 369 390 578 299 560 349 121 405 863 334 680 255 506 689
not be able to charge by 65% 59% 70% 71% 64% 65% 57% 61% 70% 74% 62% 53% 74% 65% 75% 69% 50% 74% 51% 67% 60% 67% 61% 68% 61% 62% 66%
usage tiers
Sigma 1962 942 1020 502 467 580 414 1315 261 221 75 605 722 564 523 834 605 759 680 181 670 1292 545 1001 415 811 1039
100% 100% 100% 100% 100% 100% 100% 100% 100% 100% 100% 100% 100% 100% 100% 100% 100% 100% 100% 100% 100% 100% 100% 100% 100% 100% 100%

Page 180
QuickQuery
Fielding Period: January 13-16, 2018
HCAPS (Filtered on Registered Voters)
Weighted To The U.S. General Adult Population - Propensity
18 Jan 2018
Table 154
NETNEUTRALITY2 Should consumers be offered tiers of internet service that allow them to choose whether they need higher or lower speed services and
respectively pay more or less for these services, or should such plans not be offered to consumers?
Base: All Respondents
Presidential
Election Candidate
Gender Age Ethnicity Political Party Political Ideology Voted For Education Locale Income
_____________ ______________________ _______________________ ____________________ ____________________ _____________________ _____________ ________________ _________
Colle- Some
Cons- ge Gr- Colle- $75K Less
Hisp- Black Repub- Democ- Indep- Libe- Mode- erva- 3rd ad And ge Or Urb- Subu- Or Than
Total Male Female 18-34 35-49 50-64 65+ White anic /AA Other lican rat endent ral rate tive Clinton Trump Party Higher Less an rban Rural More $75K
______ _____ _______ _____ _____ _____ ____ _____ _____ _____ _____ ______ ______ ______ ______ ______ ______ ________ ______ _____ ______ ______ ____ _____ _____ ____ ____
Unweighted Base 1962 882 1080 384 500 636 442 1530 136 183 39 600 711 571 518 818 626 731 698 184 700 1262 519 952 491 577 1275
Weighted Base 1962 942 1020 502 467 580 414 1315 261 221 75 605 722 564 523 834 605 759 680 181 670 1292 545 1001 415 811 1039
Effective Base 1157 573 585 220 294 390 295 974 90 119 28 385 404 332 294 468 401 424 438 101 434 728 315 555 298 384 744
Consumers should be offered 1232 613 619 265 291 371 305 866 129 137 48 454 392 342 260 531 440 420 500 103 404 828 338 616 277 502 652
tiers of internet service 63% 65% 61% 53% 62% 64% 74% 66% 49% 62% 63% 75% 54% 61% 50% 64% 73% 55% 73% 57% 60% 64% 62% 62% 67% 62% 63%
that give choice of speed,
access, and price
Consumers should not be 730 329 401 237 176 209 109 448 132 84 28 150 330 222 263 303 165 339 180 78 266 464 207 385 138 309 387
offered these tiers 37% 35% 39% 47% 38% 36% 26% 34% 51% 38% 37% 25% 46% 39% 50% 36% 27% 45% 27% 43% 40% 36% 38% 38% 33% 38% 37%
Sigma 1962 942 1020 502 467 580 414 1315 261 221 75 605 722 564 523 834 605 759 680 181 670 1292 545 1001 415 811 1039
100% 100% 100% 100% 100% 100% 100% 100% 100% 100% 100% 100% 100% 100% 100% 100% 100% 100% 100% 100% 100% 100% 100% 100% 100% 100% 100%

Page 181
QuickQuery
Fielding Period: January 13-16, 2018
HCAPS (Filtered on Registered Voters)
Weighted To The U.S. General Adult Population - Propensity
18 Jan 2018
Table 155
NETNEUTRALITY3 Do you favor or oppose net neutrality?
Base: All Respondents
Presidential
Election Candidate
Gender Age Ethnicity Political Party Political Ideology Voted For Education Locale Income
_____________ ______________________ _______________________ ____________________ ____________________ _____________________ _____________ ________________ _________
Colle- Some
Cons- ge Gr- Colle- $75K Less
Hisp- Black Repub- Democ- Indep- Libe- Mode- erva- 3rd ad And ge Or Urb- Subu- Or Than
Total Male Female 18-34 35-49 50-64 65+ White anic /AA Other lican rat endent ral rate tive Clinton Trump Party Higher Less an rban Rural More $75K
______ _____ _______ _____ _____ _____ ____ _____ _____ _____ _____ ______ ______ ______ ______ ______ ______ ________ ______ _____ ______ ______ ____ _____ _____ ____ ____
Unweighted Base 1962 882 1080 384 500 636 442 1530 136 183 39 600 711 571 518 818 626 731 698 184 700 1262 519 952 491 577 1275
Weighted Base 1962 942 1020 502 467 580 414 1315 261 221 75 605 722 564 523 834 605 759 680 181 670 1292 545 1001 415 811 1039
Effective Base 1157 573 585 220 294 390 295 974 90 119 28 385 404 332 294 468 401 424 438 101 434 728 315 555 298 384 744
Favor 1188 592 595 326 274 342 246 825 161 109 48 321 464 359 384 502 301 513 350 123 440 747 352 587 249 527 590
61% 63% 58% 65% 59% 59% 59% 63% 62% 49% 64% 53% 64% 64% 74% 60% 50% 68% 51% 68% 66% 58% 65% 59% 60% 65% 57%
Oppose 774 349 425 176 193 238 168 490 100 112 27 283 258 205 138 332 304 246 330 58 230 545 194 414 167 284 449
39% 37% 42% 35% 41% 41% 41% 37% 38% 51% 36% 47% 36% 36% 26% 40% 50% 32% 49% 32% 34% 42% 35% 41% 40% 35% 43%
Sigma 1962 942 1020 502 467 580 414 1315 261 221 75 605 722 564 523 834 605 759 680 181 670 1292 545 1001 415 811 1039
100% 100% 100% 100% 100% 100% 100% 100% 100% 100% 100% 100% 100% 100% 100% 100% 100% 100% 100% 100% 100% 100% 100% 100% 100% 100% 100%

Page 182
QuickQuery
Fielding Period: January 13-16, 2018
HCAPS (Filtered on Registered Voters)
Weighted To The U.S. General Adult Population - Propensity
18 Jan 2018
Table 156
BP1 In your view, does Congress have about the right amount of power in our political system, or should its powers be increased or decreased?
Base: All Respondents
Presidential
Election Candidate
Gender Age Ethnicity Political Party Political Ideology Voted For Education Locale Income
_____________ ______________________ _______________________ ____________________ ____________________ _____________________ _____________ ________________ _________
Colle- Some
Cons- ge Gr- Colle- $75K Less
Hisp- Black Repub- Democ- Indep- Libe- Mode- erva- 3rd ad And ge Or Urb- Subu- Or Than
Total Male Female 18-34 35-49 50-64 65+ White anic /AA Other lican rat endent ral rate tive Clinton Trump Party Higher Less an rban Rural More $75K
______ _____ _______ _____ _____ _____ ____ _____ _____ _____ _____ ______ ______ ______ ______ ______ ______ ________ ______ _____ ______ ______ ____ _____ _____ ____ ____
Unweighted Base 1962 882 1080 384 500 636 442 1530 136 183 39 600 711 571 518 818 626 731 698 184 700 1262 519 952 491 577 1275
Weighted Base 1962 942 1020 502 467 580 414 1315 261 221 75 605 722 564 523 834 605 759 680 181 670 1292 545 1001 415 811 1039
Effective Base 1157 573 585 220 294 390 295 974 90 119 28 385 404 332 294 468 401 424 438 101 434 728 315 555 298 384 744
Congress has about the right 1092 540 551 257 254 310 271 771 131 96 49 335 406 316 313 451 328 450 370 101 394 697 309 571 212 459 561
amount of power 56% 57% 54% 51% 54% 53% 65% 59% 50% 43% 65% 55% 56% 56% 60% 54% 54% 59% 54% 56% 59% 54% 57% 57% 51% 57% 54%
Congress should have more 290 143 147 122 72 63 33 144 67 50 4 73 133 75 92 137 61 135 60 24 98 193 100 135 55 114 167
power 15% 15% 14% 24% 15% 11% 8% 11% 25% 23% 6% 12% 18% 13% 18% 16% 10% 18% 9% 13% 15% 15% 18% 14% 13% 14% 16%
Congress should have less 580 258 322 122 141 207 110 399 64 75 22 197 183 173 117 246 217 174 250 56 178 402 136 295 149 238 311
power 30% 27% 32% 24% 30% 36% 27% 30% 24% 34% 30% 33% 25% 31% 22% 29% 36% 23% 37% 31% 27% 31% 25% 30% 36% 29% 30%
Sigma 1962 942 1020 502 467 580 414 1315 261 221 75 605 722 564 523 834 605 759 680 181 670 1292 545 1001 415 811 1039
100% 100% 100% 100% 100% 100% 100% 100% 100% 100% 100% 100% 100% 100% 100% 100% 100% 100% 100% 100% 100% 100% 100% 100% 100% 100% 100%

Page 183
QuickQuery
Fielding Period: January 13-16, 2018
HCAPS (Filtered on Registered Voters)
Weighted To The U.S. General Adult Population - Propensity
18 Jan 2018
Table 157
BP2 In your view, does the federal court system have about the right amount of power in our political system, or should its powers
be increased or decreased?
Base: All Respondents
Presidential
Election Candidate
Gender Age Ethnicity Political Party Political Ideology Voted For Education Locale Income
_____________ ______________________ _______________________ ____________________ ____________________ _____________________ _____________ ________________ _________
Colle- Some
Cons- ge Gr- Colle- $75K Less
Hisp- Black Repub- Democ- Indep- Libe- Mode- erva- 3rd ad And ge Or Urb- Subu- Or Than
Total Male Female 18-34 35-49 50-64 65+ White anic /AA Other lican rat endent ral rate tive Clinton Trump Party Higher Less an rban Rural More $75K
______ _____ _______ _____ _____ _____ ____ _____ _____ _____ _____ ______ ______ ______ ______ ______ ______ ________ ______ _____ ______ ______ ____ _____ _____ ____ ____
Unweighted Base 1962 882 1080 384 500 636 442 1530 136 183 39 600 711 571 518 818 626 731 698 184 700 1262 519 952 491 577 1275
Weighted Base 1962 942 1020 502 467 580 414 1315 261 221 75 605 722 564 523 834 605 759 680 181 670 1292 545 1001 415 811 1039
Effective Base 1157 573 585 220 294 390 295 974 90 119 28 385 404 332 294 468 401 424 438 101 434 728 315 555 298 384 744
The courts have about the 1158 541 618 268 279 342 269 821 124 118 43 338 460 325 364 498 296 515 334 113 425 733 330 607 221 476 610
right amount of power 59% 57% 61% 53% 60% 59% 65% 62% 48% 53% 57% 56% 64% 58% 70% 60% 49% 68% 49% 63% 63% 57% 60% 61% 53% 59% 59%
The courts should have more 283 127 156 105 82 61 36 154 65 38 7 73 126 73 90 139 54 125 78 16 82 201 90 137 56 109 163
power 14% 14% 15% 21% 18% 11% 9% 12% 25% 17% 9% 12% 18% 13% 17% 17% 9% 17% 11% 9% 12% 16% 17% 14% 13% 13% 16%
The courts should have less 520 274 247 129 106 177 109 340 72 65 25 194 135 166 69 197 254 119 269 52 163 357 125 257 138 226 266
power 27% 29% 24% 26% 23% 30% 26% 26% 28% 29% 34% 32% 19% 29% 13% 24% 42% 16% 40% 29% 24% 28% 23% 26% 33% 28% 26%
Sigma 1962 942 1020 502 467 580 414 1315 261 221 75 605 722 564 523 834 605 759 680 181 670 1292 545 1001 415 811 1039
100% 100% 100% 100% 100% 100% 100% 100% 100% 100% 100% 100% 100% 100% 100% 100% 100% 100% 100% 100% 100% 100% 100% 100% 100% 100% 100%

Page 184
QuickQuery
Fielding Period: January 13-16, 2018
HCAPS (Filtered on Registered Voters)
Weighted To The U.S. General Adult Population - Propensity
18 Jan 2018
Table 158
BP3 When we talk about the U.S. system of government, we hear a lot about checks and balances. Whether or not you approve of President Trump and his actions,
do you believe that the current Congress has done too much or not enough to serve as a check and balance against President Trump,
or has Congress been doing about the right amount?
Base: All Respondents
Presidential
Election Candidate
Gender Age Ethnicity Political Party Political Ideology Voted For Education Locale Income
_____________ ______________________ _______________________ ____________________ ____________________ _____________________ _____________ ________________ _________
Colle- Some
Cons- ge Gr- Colle- $75K Less
Hisp- Black Repub- Democ- Indep- Libe- Mode- erva- 3rd ad And ge Or Urb- Subu- Or Than
Total Male Female 18-34 35-49 50-64 65+ White anic /AA Other lican rat endent ral rate tive Clinton Trump Party Higher Less an rban Rural More $75K
______ _____ _______ _____ _____ _____ ____ _____ _____ _____ _____ ______ ______ ______ ______ ______ ______ ________ ______ _____ ______ ______ ____ _____ _____ ____ ____
Unweighted Base 1962 882 1080 384 500 636 442 1530 136 183 39 600 711 571 518 818 626 731 698 184 700 1262 519 952 491 577 1275
Weighted Base 1962 942 1020 502 467 580 414 1315 261 221 75 605 722 564 523 834 605 759 680 181 670 1292 545 1001 415 811 1039
Effective Base 1157 573 585 220 294 390 295 974 90 119 28 385 404 332 294 468 401 424 438 101 434 728 315 555 298 384 744
Too much 355 191 164 86 70 105 93 271 40 19 17 178 57 101 48 121 186 47 240 19 118 237 102 166 86 156 171
18% 20% 16% 17% 15% 18% 22% 21% 15% 8% 23% 29% 8% 18% 9% 14% 31% 6% 35% 11% 18% 18% 19% 17% 21% 19% 16%
Not enough 1038 455 584 266 241 308 223 637 171 161 26 173 525 303 393 464 182 571 169 117 365 673 299 523 216 426 547
53% 48% 57% 53% 52% 53% 54% 48% 66% 73% 35% 29% 73% 54% 75% 56% 30% 75% 25% 65% 54% 52% 55% 52% 52% 53% 53%
About the right amount 569 296 273 149 155 167 98 406 50 41 32 254 139 160 82 250 237 141 271 45 187 382 144 312 113 228 321
29% 31% 27% 30% 33% 29% 24% 31% 19% 19% 42% 42% 19% 28% 16% 30% 39% 19% 40% 25% 28% 30% 26% 31% 27% 28% 31%
Sigma 1962 942 1020 502 467 580 414 1315 261 221 75 605 722 564 523 834 605 759 680 181 670 1292 545 1001 415 811 1039
100% 100% 100% 100% 100% 100% 100% 100% 100% 100% 100% 100% 100% 100% 100% 100% 100% 100% 100% 100% 100% 100% 100% 100% 100% 100% 100%

Page 185
QuickQuery
Fielding Period: January 13-16, 2018
HCAPS (Filtered on Registered Voters)
Weighted To The U.S. General Adult Population - Propensity
18 Jan 2018
Table 159
BP4 Do you believe that the federal courts have done too much or not enough to serve as a check and balance against President Trump, or have
the courts been doing about the right amount?
Base: All Respondents
Presidential
Election Candidate
Gender Age Ethnicity Political Party Political Ideology Voted For Education Locale Income
_____________ ______________________ _______________________ ____________________ ____________________ _____________________ _____________ ________________ _________
Colle- Some
Cons- ge Gr- Colle- $75K Less
Hisp- Black Repub- Democ- Indep- Libe- Mode- erva- 3rd ad And ge Or Urb- Subu- Or Than
Total Male Female 18-34 35-49 50-64 65+ White anic /AA Other lican rat endent ral rate tive Clinton Trump Party Higher Less an rban Rural More $75K
______ _____ _______ _____ _____ _____ ____ _____ _____ _____ _____ ______ ______ ______ ______ ______ ______ ________ ______ _____ ______ ______ ____ _____ _____ ____ ____
Unweighted Base 1962 882 1080 384 500 636 442 1530 136 183 39 600 711 571 518 818 626 731 698 184 700 1262 519 952 491 577 1275
Weighted Base 1962 942 1020 502 467 580 414 1315 261 221 75 605 722 564 523 834 605 759 680 181 670 1292 545 1001 415 811 1039
Effective Base 1157 573 585 220 294 390 295 974 90 119 28 385 404 332 294 468 401 424 438 101 434 728 315 555 298 384 744
Too much 399 255 145 74 68 145 113 319 33 19 23 225 43 111 33 113 253 35 301 29 138 262 96 202 102 189 189
20% 27% 14% 15% 15% 25% 27% 24% 13% 9% 31% 37% 6% 20% 6% 14% 42% 5% 44% 16% 21% 20% 18% 20% 24% 23% 18%
Not enough 772 303 469 220 205 202 145 423 143 137 29 108 432 203 278 380 114 439 112 64 245 527 241 378 153 286 444
39% 32% 46% 44% 44% 35% 35% 32% 55% 62% 39% 18% 60% 36% 53% 46% 19% 58% 16% 35% 37% 41% 44% 38% 37% 35% 43%
About the right amount 791 384 407 208 194 232 156 572 85 65 23 272 246 250 211 342 238 285 268 88 288 503 209 422 161 336 406
40% 41% 40% 41% 42% 40% 38% 44% 33% 29% 30% 45% 34% 44% 40% 41% 39% 38% 39% 49% 43% 39% 38% 42% 39% 41% 39%
Sigma 1962 942 1020 502 467 580 414 1315 261 221 75 605 722 564 523 834 605 759 680 181 670 1292 545 1001 415 811 1039
100% 100% 100% 100% 100% 100% 100% 100% 100% 100% 100% 100% 100% 100% 100% 100% 100% 100% 100% 100% 100% 100% 100% 100% 100% 100% 100%

Page 186
QuickQuery
Fielding Period: January 13-16, 2018
HCAPS (Filtered on Registered Voters)
Weighted To The U.S. General Adult Population - Propensity
18 Jan 2018
Table 160
QNEW What is your race?
Base: All Respondents
Presidential
Election Candidate
Gender Age Ethnicity Political Party Political Ideology Voted For Education Locale Income
_____________ ______________________ _______________________ ____________________ ____________________ _____________________ _____________ ________________ _________
Colle- Some
Cons- ge Gr- Colle- $75K Less
Hisp- Black Repub- Democ- Indep- Libe- Mode- erva- 3rd ad And ge Or Urb- Subu- Or Than
Total Male Female 18-34 35-49 50-64 65+ White anic /AA Other lican rat endent ral rate tive Clinton Trump Party Higher Less an rban Rural More $75K
______ _____ _______ _____ _____ _____ ____ _____ _____ _____ _____ ______ ______ ______ ______ ______ ______ ________ ______ _____ ______ ______ ____ _____ _____ ____ ____
Unweighted Base 1962 882 1080 384 500 636 442 1530 136 183 39 600 711 571 518 818 626 731 698 184 700 1262 519 952 491 577 1275
Weighted Base 1962 942 1020 502 467 580 414 1315 261 221 75 605 722 564 523 834 605 759 680 181 670 1292 545 1001 415 811 1039
Effective Base 1157 573 585 220 294 390 295 974 90 119 28 385 404 332 294 468 401 424 438 101 434 728 315 555 298 384 744
White 1315 667 647 257 314 415 329 1315 - - - 519 384 379 325 505 485 435 576 113 489 826 305 680 330 576 655
67% 71% 63% 51% 67% 72% 79% 100% - - - 86% 53% 67% 62% 60% 80% 57% 85% 62% 73% 64% 56% 68% 79% 71% 63%
Black or African American 221 94 127 74 47 59 41 - - 221 - 10 152 42 89 101 30 141 16 19 50 171 96 99 26 55 158
11% 10% 12% 15% 10% 10% 10% - - 100% - 2% 21% 7% 17% 12% 5% 19% 2% 11% 7% 13% 18% 10% 6% 7% 15%
Hispanic, Latino, or Spanish 261 115 146 110 64 65 22 - 261 - - 38 135 79 65 147 49 130 50 23 70 191 89 144 28 107 139
origin 13% 12% 14% 22% 14% 11% 5% - 100% - - 6% 19% 14% 12% 18% 8% 17% 7% 13% 10% 15% 16% 14% 7% 13% 13%
Asian origin (includes 90 40 50 40 29 12 10 - - - - 14 31 42 29 54 7 29 19 8 38 52 36 43 12 51 36
people of Asian Indian, 5% 4% 5% 8% 6% 2% 2% - - - - 2% 4% 7% 6% 7% 1% 4% 3% 4% 6% 4% 7% 4% 3% 6% 3%
Chinese, Korean, Filipino,
and Japanese origin)
Other 75 26 50 21 12 29 12 - - - 75 23 21 23 14 27 33 23 19 18 24 52 20 35 20 22 51
4% 3% 5% 4% 3% 5% 3% - - - 100% 4% 3% 4% 3% 3% 6% 3% 3% 10% 4% 4% 4% 4% 5% 3% 5%
Sigma 1962 942 1020 502 467 580 414 1315 261 221 75 605 722 564 523 834 605 759 680 181 670 1292 545 1001 415 811 1039
100% 100% 100% 100% 100% 100% 100% 100% 100% 100% 100% 100% 100% 100% 100% 100% 100% 100% 100% 100% 100% 100% 100% 100% 100% 100% 100%

Page 187
QuickQuery
Fielding Period: January 13-16, 2018
HCAPS (Filtered on Registered Voters)
Weighted To The U.S. General Adult Population - Propensity
18 Jan 2018
Table 161
Q398_1 Next, we have a few employment and economic questions.
Are you employed full time for pay with an organization or company?
Base: Ask Sequential Employment
Presidential
Election Candidate
Gender Age Ethnicity Political Party Political Ideology Voted For Education Locale Income
_____________ ______________________ _______________________ ____________________ ____________________ _____________________ _____________ ________________ _________
Colle- Some
Cons- ge Gr- Colle- $75K Less
Hisp- Black Repub- Democ- Indep- Libe- Mode- erva- 3rd ad And ge Or Urb- Subu- Or Than
Total Male Female 18-34 35-49 50-64 65+ White anic /AA Other lican rat endent ral rate tive Clinton Trump Party Higher Less an rban Rural More $75K
______ _____ _______ _____ _____ _____ ____ _____ _____ _____ _____ ______ ______ ______ ______ ______ ______ ________ ______ _____ ______ ______ ____ _____ _____ ____ ____
Unweighted Base 1962 882 1080 384 500 636 442 1530 136 183 39 600 711 571 518 818 626 731 698 184 700 1262 519 952 491 577 1275
Weighted Base 1962 942 1020 502 467 580 414 1315 261 221 75 605 722 564 523 834 605 759 680 181 670 1292 545 1001 415 811 1039
Effective Base 1157 573 585 220 294 390 295 974 90 119 28 385 404 332 294 468 401 424 438 101 434 728 315 555 298 384 744
Yes 871 482 389 252 318 270 32 580 127 101 19 263 337 247 242 392 237 368 286 84 378 493 255 471 145 481 375
44% 51% 38% 50% 68% 47% 8% 44% 49% 46% 25% 44% 47% 44% 46% 47% 39% 49% 42% 46% 56% 38% 47% 47% 35% 59% 36%
No 1091 460 631 250 149 310 382 735 134 120 56 341 385 318 281 442 368 391 394 97 292 799 290 530 270 330 665
56% 49% 62% 50% 32% 53% 92% 56% 51% 54% 75% 56% 53% 56% 54% 53% 61% 51% 58% 54% 44% 62% 53% 53% 65% 41% 64%
Sigma 1962 942 1020 502 467 580 414 1315 261 221 75 605 722 564 523 834 605 759 680 181 670 1292 545 1001 415 811 1039
100% 100% 100% 100% 100% 100% 100% 100% 100% 100% 100% 100% 100% 100% 100% 100% 100% 100% 100% 100% 100% 100% 100% 100% 100% 100% 100%

Page 188
QuickQuery
Fielding Period: January 13-16, 2018
HCAPS (Filtered on Registered Voters)
Weighted To The U.S. General Adult Population - Propensity
18 Jan 2018
Table 162
Q398_2 Next, we have a few employment and economic questions.
Are you employed part time for pay with an organization or company?
Base: Ask Sequential Employment
Presidential
Election Candidate
Gender Age Ethnicity Political Party Political Ideology Voted For Education Locale Income
_____________ ______________________ _______________________ ____________________ ____________________ _____________________ _____________ ________________ _________
Colle- Some
Cons- ge Gr- Colle- $75K Less
Hisp- Black Repub- Democ- Indep- Libe- Mode- erva- 3rd ad And ge Or Urb- Subu- Or Than
Total Male Female 18-34 35-49 50-64 65+ White anic /AA Other lican rat endent ral rate tive Clinton Trump Party Higher Less an rban Rural More $75K
______ _____ _______ _____ _____ _____ ____ _____ _____ _____ _____ ______ ______ ______ ______ ______ ______ ________ ______ _____ ______ ______ ____ _____ _____ ____ ____
Unweighted Base 1962 882 1080 384 500 636 442 1530 136 183 39 600 711 571 518 818 626 731 698 184 700 1262 519 952 491 577 1275
Weighted Base 1962 942 1020 502 467 580 414 1315 261 221 75 605 722 564 523 834 605 759 680 181 670 1292 545 1001 415 811 1039
Effective Base 1157 573 585 220 294 390 295 974 90 119 28 385 404 332 294 468 401 424 438 101 434 728 315 555 298 384 744
Yes 356 129 227 137 93 78 48 226 65 36 9 104 135 107 99 153 103 125 110 47 103 253 97 183 76 124 209
18% 14% 22% 27% 20% 13% 12% 17% 25% 16% 12% 17% 19% 19% 19% 18% 17% 16% 16% 26% 15% 20% 18% 18% 18% 15% 20%
No 1606 813 794 365 373 502 366 1089 196 185 66 501 587 458 423 681 502 634 570 134 567 1039 449 818 339 687 830
82% 86% 78% 73% 80% 87% 88% 83% 75% 84% 88% 83% 81% 81% 81% 82% 83% 84% 84% 74% 85% 80% 82% 82% 82% 85% 80%
Sigma 1962 942 1020 502 467 580 414 1315 261 221 75 605 722 564 523 834 605 759 680 181 670 1292 545 1001 415 811 1039
100% 100% 100% 100% 100% 100% 100% 100% 100% 100% 100% 100% 100% 100% 100% 100% 100% 100% 100% 100% 100% 100% 100% 100% 100% 100% 100%

Page 189
QuickQuery
Fielding Period: January 13-16, 2018
HCAPS (Filtered on Registered Voters)
Weighted To The U.S. General Adult Population - Propensity
18 Jan 2018
Table 163
Q398_3 Next, we have a few employment and economic questions.
Are you self-employed full time?
Base: Ask Sequential Employment
Presidential
Election Candidate
Gender Age Ethnicity Political Party Political Ideology Voted For Education Locale Income
_____________ ______________________ _______________________ ____________________ ____________________ _____________________ _____________ ________________ _________
Colle- Some
Cons- ge Gr- Colle- $75K Less
Hisp- Black Repub- Democ- Indep- Libe- Mode- erva- 3rd ad And ge Or Urb- Subu- Or Than
Total Male Female 18-34 35-49 50-64 65+ White anic /AA Other lican rat endent ral rate tive Clinton Trump Party Higher Less an rban Rural More $75K
______ _____ _______ _____ _____ _____ ____ _____ _____ _____ _____ ______ ______ ______ ______ ______ ______ ________ ______ _____ ______ ______ ____ _____ _____ ____ ____
Unweighted Base 1962 882 1080 384 500 636 442 1530 136 183 39 600 711 571 518 818 626 731 698 184 700 1262 519 952 491 577 1275
Weighted Base 1962 942 1020 502 467 580 414 1315 261 221 75 605 722 564 523 834 605 759 680 181 670 1292 545 1001 415 811 1039
Effective Base 1157 573 585 220 294 390 295 974 90 119 28 385 404 332 294 468 401 424 438 101 434 728 315 555 298 384 744
Yes 154 94 60 43 51 45 15 91 34 17 * 57 43 50 51 54 49 47 64 21 50 104 51 75 28 70 82
8% 10% 6% 9% 11% 8% 4% 7% 13% 8% * 9% 6% 9% 10% 7% 8% 6% 9% 11% 7% 8% 9% 7% 7% 9% 8%
No 1808 848 960 459 415 535 399 1224 227 204 75 548 679 515 472 780 556 711 617 160 621 1187 495 926 387 740 957
92% 90% 94% 91% 89% 92% 96% 93% 87% 92% 100% 91% 94% 91% 90% 93% 92% 94% 91% 89% 93% 92% 91% 93% 93% 91% 92%
Sigma 1962 942 1020 502 467 580 414 1315 261 221 75 605 722 564 523 834 605 759 680 181 670 1292 545 1001 415 811 1039
100% 100% 100% 100% 100% 100% 100% 100% 100% 100% 100% 100% 100% 100% 100% 100% 100% 100% 100% 100% 100% 100% 100% 100% 100% 100% 100%

Page 190
QuickQuery
Fielding Period: January 13-16, 2018
HCAPS (Filtered on Registered Voters)
Weighted To The U.S. General Adult Population - Propensity
18 Jan 2018
Table 164
Q398_4 Next, we have a few employment and economic questions.
Are you self-employed part time?
Base: Ask Sequential Employment
Presidential
Election Candidate
Gender Age Ethnicity Political Party Political Ideology Voted For Education Locale Income
_____________ ______________________ _______________________ ____________________ ____________________ _____________________ _____________ ________________ _________
Colle- Some
Cons- ge Gr- Colle- $75K Less
Hisp- Black Repub- Democ- Indep- Libe- Mode- erva- 3rd ad And ge Or Urb- Subu- Or Than
Total Male Female 18-34 35-49 50-64 65+ White anic /AA Other lican rat endent ral rate tive Clinton Trump Party Higher Less an rban Rural More $75K
______ _____ _______ _____ _____ _____ ____ _____ _____ _____ _____ ______ ______ ______ ______ ______ ______ ________ ______ _____ ______ ______ ____ _____ _____ ____ ____
Unweighted Base 1962 882 1080 384 500 636 442 1530 136 183 39 600 711 571 518 818 626 731 698 184 700 1262 519 952 491 577 1275
Weighted Base 1962 942 1020 502 467 580 414 1315 261 221 75 605 722 564 523 834 605 759 680 181 670 1292 545 1001 415 811 1039
Effective Base 1157 573 585 220 294 390 295 974 90 119 28 385 404 332 294 468 401 424 438 101 434 728 315 555 298 384 744
Yes 112 53 60 43 25 31 13 69 21 13 4 33 42 33 51 37 25 35 34 14 36 76 30 58 25 39 69
6% 6% 6% 9% 5% 5% 3% 5% 8% 6% 6% 5% 6% 6% 10% 4% 4% 5% 5% 8% 5% 6% 6% 6% 6% 5% 7%
No 1850 889 961 458 442 549 401 1246 240 208 71 572 680 531 472 798 580 724 646 167 634 1216 515 944 391 772 970
94% 94% 94% 91% 95% 95% 97% 95% 92% 94% 94% 95% 94% 94% 90% 96% 96% 95% 95% 92% 95% 94% 94% 94% 94% 95% 93%
Sigma 1962 942 1020 502 467 580 414 1315 261 221 75 605 722 564 523 834 605 759 680 181 670 1292 545 1001 415 811 1039
100% 100% 100% 100% 100% 100% 100% 100% 100% 100% 100% 100% 100% 100% 100% 100% 100% 100% 100% 100% 100% 100% 100% 100% 100% 100% 100%

Page 191
QuickQuery
Fielding Period: January 13-16, 2018
HCAPS (Filtered on Registered Voters)
Weighted To The U.S. General Adult Population - Propensity
18 Jan 2018
Table 165
Q402 Which of the following best describes your current situation?
Base: Not At All Employed
Presidential
Election Candidate
Gender Age Ethnicity Political Party Political Ideology Voted For Education Locale Income
_____________ ______________________ _______________________ ____________________ ____________________ _____________________ _____________ ________________ _________
Colle- Some
Cons- ge Gr- Colle- $75K Less
Hisp- Black Repub- Democ- Indep- Libe- Mode- erva- 3rd ad And ge Or Urb- Subu- Or Than
Total Male Female 18-34 35-49 50-64 65+ White anic /AA Other lican rat endent ral rate tive Clinton Trump Party Higher Less an rban Rural More $75K
______ _____ _______ _____ _____ _____ ____ _____ _____ _____ _____ ______ ______ ______ ______ ______ ______ ________ ______ _____ ______ ______ ____ _____ _____ ____ ____
Unweighted Base 849 339 510 107 129 269 344 658 55 88 25 266 296 247 198 354 297 290 321 70 237 612 215 391 243 155 627
Weighted Base 710 293 417 107 84 204 315 469 83 90 47 227 243 206 163 301 246 255 264 57 182 528 185 343 182 187 451
Effective Base 513 219 295 64 83 148 227 431 35 62 20 171 179 142 116 206 194 169 201 40 143 371 125 240 152 99 392
Looking for work 104 36 68 42 27 26 9 49 15 27 8 14 46 30 24 65 16 35 18 5 15 89 40 40 24 13 78
15% 12% 16% 39% 33% 13% 3% 11% 18% 31% 16% 6% 19% 14% 15% 21% 6% 14% 7% 9% 8% 17% 22% 12% 13% 7% 17%
Not looking for work 440 186 254 49 35 93 264 322 42 37 27 161 133 130 101 166 173 157 190 44 145 296 84 237 118 151 240
62% 63% 61% 46% 41% 45% 84% 69% 50% 41% 57% 71% 55% 63% 62% 55% 70% 61% 72% 77% 79% 56% 46% 69% 65% 81% 53%
Unable to work due to a 166 71 95 16 22 85 43 98 27 26 12 52 64 46 39 70 57 63 56 8 22 143 60 65 40 24 133
disability or illness 23% 24% 23% 15% 26% 42% 14% 21% 32% 29% 27% 23% 26% 22% 24% 23% 23% 25% 21% 14% 12% 27% 33% 19% 22% 13% 29%
Sigma 710 293 417 107 84 204 315 469 83 90 47 227 243 206 163 301 246 255 264 57 182 528 185 343 182 187 451
100% 100% 100% 100% 100% 100% 100% 100% 100% 100% 100% 100% 100% 100% 100% 100% 100% 100% 100% 100% 100% 100% 100% 100% 100% 100% 100%

Page 192
QuickQuery
Fielding Period: January 13-16, 2018
HCAPS (Filtered on Registered Voters)
Weighted To The U.S. General Adult Population - Propensity
18 Jan 2018
Table 166
Q404 Do any of the following describe you? Please select all that apply.
Base: Ask Sequential Employment
Presidential
Election Candidate
Gender Age Ethnicity Political Party Political Ideology Voted For Education Locale Income
_____________ ______________________ _______________________ ____________________ ____________________ _____________________ _____________ ________________ _________
Colle- Some
Cons- ge Gr- Colle- $75K Less
Hisp- Black Repub- Democ- Indep- Libe- Mode- erva- 3rd ad And ge Or Urb- Subu- Or Than
Total Male Female 18-34 35-49 50-64 65+ White anic /AA Other lican rat endent ral rate tive Clinton Trump Party Higher Less an rban Rural More $75K
______ _____ _______ _____ _____ _____ ____ _____ _____ _____ _____ ______ ______ ______ ______ ______ ______ ________ ______ _____ ______ ______ ____ _____ _____ ____ ____
Unweighted Base 1962 882 1080 384 500 636 442 1530 136 183 39 600 711 571 518 818 626 731 698 184 700 1262 519 952 491 577 1275
Weighted Base 1962 942 1020 502 467 580 414 1315 261 221 75 605 722 564 523 834 605 759 680 181 670 1292 545 1001 415 811 1039
Effective Base 1157 573 585 220 294 390 295 974 90 119 28 385 404 332 294 468 401 424 438 101 434 728 315 555 298 384 744
Retired and collecting 457 247 210 6 10 100 341 355 32 43 18 172 145 130 103 162 192 174 207 40 168 289 104 238 115 158 257
retirement benefits/pension 23% 26% 21% 1% 2% 17% 82% 27% 12% 20% 24% 29% 20% 23% 20% 19% 32% 23% 30% 22% 25% 22% 19% 24% 28% 20% 25%
A stay-at-home spouse or 182 22 160 48 66 52 15 108 31 19 11 60 50 59 38 87 57 43 65 14 27 155 46 82 54 44 126
partner 9% 2% 16% 10% 14% 9% 4% 8% 12% 9% 15% 10% 7% 10% 7% 10% 9% 6% 10% 8% 4% 12% 8% 8% 13% 5% 12%
A student 177 68 109 143 24 9 * 70 39 23 18 42 70 54 65 73 39 71 31 19 21 156 37 103 37 59 105
9% 7% 11% 29% 5% 2% * 5% 15% 10% 24% 7% 10% 9% 12% 9% 6% 9% 5% 10% 3% 12% 7% 10% 9% 7% 10%
None of these 1171 611 560 317 369 421 65 791 161 138 32 338 461 333 322 521 329 475 383 111 458 713 365 588 218 560 565
60% 65% 55% 63% 79% 73% 16% 60% 61% 62% 42% 56% 64% 59% 62% 62% 54% 63% 56% 61% 68% 55% 67% 59% 52% 69% 54%
Sigma 1987 948 1039 514 469 582 421 1325 263 223 79 612 727 575 527 844 616 764 686 183 674 1313 552 1011 424 821 1054
101% 101% 102% 103% 101% 100% 102% 101% 101% 101% 105% 101% 101% 102% 101% 101% 102% 101% 101% 101% 100% 102% 101% 101% 102% 101% 101%

Page 193
QuickQuery
Fielding Period: January 13-16, 2018
HCAPS (Filtered on Registered Voters)
Weighted To The U.S. General Adult Population - Propensity
18 Jan 2018
Table 167
Q406 What is your employment status?
Base: All Respondents
Presidential
Election Candidate
Gender Age Ethnicity Political Party Political Ideology Voted For Education Locale Income
_____________ ______________________ _______________________ ____________________ ____________________ _____________________ _____________ ________________ _________
Colle- Some
Cons- ge Gr- Colle- $75K Less
Hisp- Black Repub- Democ- Indep- Libe- Mode- erva- 3rd ad And ge Or Urb- Subu- Or Than
Total Male Female 18-34 35-49 50-64 65+ White anic /AA Other lican rat endent ral rate tive Clinton Trump Party Higher Less an rban Rural More $75K
______ _____ _______ _____ _____ _____ ____ _____ _____ _____ _____ ______ ______ ______ ______ ______ ______ ________ ______ _____ ______ ______ ____ _____ _____ ____ ____
Unweighted Base 1962 882 1080 384 500 636 442 1530 136 183 39 600 711 571 518 818 626 731 698 184 700 1262 519 952 491 577 1275
Weighted Base 1962 942 1020 502 467 580 414 1315 261 221 75 605 722 564 523 834 605 759 680 181 670 1292 545 1001 415 811 1039
Effective Base 1157 573 585 220 294 390 295 974 90 119 28 385 404 332 294 468 401 424 438 101 434 728 315 555 298 384 744
Employed full time 972 547 425 279 339 307 46 644 144 110 20 296 367 282 275 422 275 402 330 94 410 562 285 522 165 529 426
50% 58% 42% 56% 73% 53% 11% 49% 55% 50% 26% 49% 51% 50% 53% 51% 46% 53% 48% 52% 61% 44% 52% 52% 40% 65% 41%
Employed part time 413 160 253 153 102 100 57 267 69 43 13 123 156 120 121 170 121 145 131 53 127 286 110 214 89 142 243
21% 17% 25% 31% 22% 17% 14% 20% 26% 20% 18% 20% 22% 21% 23% 20% 20% 19% 19% 29% 19% 22% 20% 21% 21% 18% 23%
Self-employed full time 154 94 60 43 51 45 15 91 34 17 * 57 43 50 51 54 49 47 64 21 50 104 51 75 28 70 82
8% 10% 6% 9% 11% 8% 4% 7% 13% 8% * 9% 6% 9% 10% 7% 8% 6% 9% 11% 7% 8% 9% 7% 7% 9% 8%
Not employed, but looking 104 36 68 42 27 26 9 49 15 27 8 14 46 30 24 65 16 35 18 5 15 89 40 40 24 13 78
for work 5% 4% 7% 8% 6% 4% 2% 4% 6% 12% 10% 2% 6% 5% 5% 8% 3% 5% 3% 3% 2% 7% 7% 4% 6% 2% 8%
Not employed and not looking 440 186 254 49 35 93 264 322 42 37 27 161 133 130 101 166 173 157 190 44 145 296 84 237 118 151 240
for work 22% 20% 25% 10% 7% 16% 64% 24% 16% 17% 35% 27% 18% 23% 19% 20% 29% 21% 28% 24% 22% 23% 15% 24% 29% 19% 23%
Not employed, unable to work 166 71 95 16 22 85 43 98 27 26 12 52 64 46 39 70 57 63 56 8 22 143 60 65 40 24 133
due to a disability or 8% 7% 9% 3% 5% 15% 10% 7% 10% 12% 16% 9% 9% 8% 7% 8% 9% 8% 8% 5% 3% 11% 11% 7% 10% 3% 13%
illness
Retired 457 247 210 6 10 100 341 355 32 43 18 172 145 130 103 162 192 174 207 40 168 289 104 238 115 158 257
23% 26% 21% 1% 2% 17% 82% 27% 12% 20% 24% 29% 20% 23% 20% 19% 32% 23% 30% 22% 25% 22% 19% 24% 28% 20% 25%
Student 177 68 109 143 24 9 * 70 39 23 18 42 70 54 65 73 39 71 31 19 21 156 37 103 37 59 105
9% 7% 11% 29% 5% 2% * 5% 15% 10% 24% 7% 10% 9% 12% 9% 6% 9% 5% 10% 3% 12% 7% 10% 9% 7% 10%
Stay-at-home spouse or 182 22 160 48 66 52 15 108 31 19 11 60 50 59 38 87 57 43 65 14 27 155 46 82 54 44 126
partner 9% 2% 16% 10% 14% 9% 4% 8% 12% 9% 15% 10% 7% 10% 7% 10% 9% 6% 10% 8% 4% 12% 8% 8% 13% 5% 12%
Self-employed part time 112 53 60 43 25 31 13 69 21 13 4 33 42 33 51 37 25 35 34 14 36 76 30 58 25 39 69
6% 6% 6% 9% 5% 5% 3% 5% 8% 6% 6% 5% 6% 6% 10% 4% 4% 5% 5% 8% 5% 6% 6% 6% 6% 5% 7%
Sigma 3177 1484 1693 824 702 848 803 2073 453 358 131 1010 1119 932 867 1306 1004 1173 1125 311 1020 2157 847 1634 696 1227 1760
162% 158% 166% 164% 150% 146% 194% 158% 173% 162% 174% 167% 155% 165% 166% 157% 166% 155% 165% 172% 152% 167% 155% 163% 168% 151% 169%

Page 194
QuickQuery
Fielding Period: January 13-16, 2018
HCAPS (Filtered on Registered Voters)
Weighted To The U.S. General Adult Population - Propensity
18 Jan 2018
Table 168
Q410 Which one of the following best describes your employment status?
Base: 18 Years Old Or Older And (Single Employment Item Selected And More Than 1 Valid Code From Q406)
Presidential
Election Candidate
Gender Age Ethnicity Political Party Political Ideology Voted For Education Locale Income
_____________ ______________________ _______________________ ____________________ ____________________ _____________________ _____________ ________________ _________
Colle- Some
Cons- ge Gr- Colle- $75K Less
Hisp- Black Repub- Democ- Indep- Libe- Mode- erva- 3rd ad And ge Or Urb- Subu- Or Than
Total Male Female 18-34 35-49 50-64 65+ White anic /AA Other lican rat endent ral rate tive Clinton Trump Party Higher Less an rban Rural More $75K
______ _____ _______ _____ _____ _____ ____ _____ _____ _____ _____ ______ ______ ______ ______ ______ ______ ________ ______ _____ ______ ______ ____ _____ _____ ____ ____
Unweighted Base 1962 882 1080 384 500 636 442 1530 136 183 39 600 711 571 518 818 626 731 698 184 700 1262 519 952 491 577 1275
Weighted Base 1962 942 1020 502 467 580 414 1315 261 221 75 605 722 564 523 834 605 759 680 181 670 1292 545 1001 415 811 1039
Effective Base 1157 573 585 220 294 390 295 974 90 119 28 385 404 332 294 468 401 424 438 101 434 728 315 555 298 384 744
Employed full time 824 468 356 236 297 260 31 556 110 98 19 253 312 233 229 372 224 356 271 77 366 458 242 446 137 467 344
42% 50% 35% 47% 64% 45% 8% 42% 42% 45% 25% 42% 43% 41% 44% 45% 37% 47% 40% 43% 55% 35% 44% 45% 33% 58% 33%
Employed part time 213 68 145 82 39 51 40 149 30 21 1 65 83 58 53 92 68 82 67 24 57 156 58 105 50 60 132
11% 7% 14% 16% 8% 9% 10% 11% 12% 9% 2% 11% 11% 10% 10% 11% 11% 11% 10% 14% 8% 12% 11% 10% 12% 7% 13%
Self-employed full time 107 72 34 22 31 41 12 72 15 9 - 36 32 36 34 31 42 32 46 13 39 67 38 47 21 50 55
5% 8% 3% 4% 7% 7% 3% 5% 6% 4% - 6% 4% 6% 7% 4% 7% 4% 7% 7% 6% 5% 7% 5% 5% 6% 5%
Not employed, but looking 66 24 42 25 20 19 2 35 6 17 4 9 26 21 13 42 11 19 13 4 7 59 24 25 16 7 52
for work 3% 3% 4% 5% 4% 3% * 3% 2% 8% 6% 2% 4% 4% 2% 5% 2% 2% 2% 2% 1% 5% 4% 3% 4% 1% 5%
Not employed and not looking 31 8 23 2 10 16 2 13 12 5 - 6 13 10 7 16 8 10 14 2 4 27 8 17 6 11 17
for work 2% 1% 2% * 2% 3% 1% 1% 5% 2% - 1% 2% 2% 1% 2% 1% 1% 2% 1% 1% 2% 1% 2% 2% 1% 2%
Not employed, unable to work 100 43 58 11 18 62 9 64 13 14 9 26 44 27 29 40 31 37 29 7 12 88 40 35 25 14 80
due to a disability or 5% 5% 6% 2% 4% 11% 2% 5% 5% 6% 12% 4% 6% 5% 6% 5% 5% 5% 4% 4% 2% 7% 7% 3% 6% 2% 8%
illness
Retired 389 198 191 2 3 84 300 295 31 37 19 146 125 110 89 142 158 149 174 33 140 249 83 207 99 127 222
20% 21% 19% * 1% 15% 72% 22% 12% 17% 25% 24% 17% 19% 17% 17% 26% 20% 26% 18% 21% 19% 15% 21% 24% 16% 21%
Student 90 32 58 76 11 3 - 34 23 8 13 14 41 29 35 38 17 40 12 10 16 74 22 47 21 36 43
5% 3% 6% 15% 2% 1% - 3% 9% 3% 17% 2% 6% 5% 7% 5% 3% 5% 2% 6% 2% 6% 4% 5% 5% 4% 4%
Stay-at-home spouse or 98 5 93 26 35 28 9 66 13 9 7 32 27 33 18 45 35 24 37 6 16 82 24 45 28 24 66
partner 5% 1% 9% 5% 7% 5% 2% 5% 5% 4% 10% 5% 4% 6% 3% 5% 6% 3% 5% 3% 2% 6% 4% 5% 7% 3% 6%
Self-employed part time 46 24 22 19 3 16 8 29 8 2 3 17 18 9 16 18 12 11 19 4 14 32 7 27 11 15 28
2% 3% 2% 4% 1% 3% 2% 2% 3% 1% 4% 3% 3% 2% 3% 2% 2% 1% 3% 2% 2% 2% 1% 3% 3% 2% 3%
Sigma 1962 942 1020 502 467 580 414 1315 261 221 75 605 722 564 523 834 605 759 680 181 670 1292 545 1001 415 811 1039
100% 100% 100% 100% 100% 100% 100% 100% 100% 100% 100% 100% 100% 100% 100% 100% 100% 100% 100% 100% 100% 100% 100% 100% 100% 100% 100%

Page 195
QuickQuery
Fielding Period: January 13-16, 2018
HCAPS (Filtered on Registered Voters)
Weighted To The U.S. General Adult Population - Propensity
18 Jan 2018
Table 169
D5 The organization you work for is in which of the following?
Base: Employed FT/PT
Presidential
Election Candidate
Gender Age Ethnicity Political Party Political Ideology Voted For Education Locale Income
_____________ ______________________ _______________________ ____________________ ____________________ _____________________ _____________ ________________ _________
Colle- Some
Cons- ge Gr- Colle- $75K Less
Hisp- Black Repub- Democ- Indep- Libe- Mode- erva- 3rd ad And ge Or Urb- Subu- Or Than
Total Male Female 18-34 35-49 50-64 65+ White anic /AA Other lican rat endent ral rate tive Clinton Trump Party Higher Less an rban Rural More $75K
______ _____ _______ _____ _____ _____ ____ _____ _____ _____ _____ ______ ______ ______ ______ ______ ______ ________ ______ _____ ______ ______ ____ _____ _____ ____ ____
Unweighted Base 931 452 479 226 330 304 71 738 63 80 8 283 342 275 258 400 273 378 314 92 399 532 249 476 206 365 529
Weighted Base 1037 536 501 318 336 311 72 705 140 119 20 318 395 292 282 463 291 437 338 102 423 614 299 551 187 527 476
Effective Base 571 309 264 134 201 209 49 495 45 52 5 188 201 173 157 234 186 224 208 51 254 320 159 286 135 252 308
Public sector 420 194 226 122 139 129 30 280 56 62 10 110 175 131 136 167 117 188 123 47 165 255 111 212 96 216 191
41% 36% 45% 38% 41% 42% 41% 40% 40% 52% 49% 35% 44% 45% 48% 36% 40% 43% 36% 46% 39% 42% 37% 39% 51% 41% 40%
Private sector 430 277 153 134 137 132 28 321 48 33 6 151 147 116 109 190 131 178 164 41 207 222 138 244 48 250 169
41% 52% 30% 42% 41% 42% 39% 46% 34% 28% 30% 48% 37% 40% 39% 41% 45% 41% 48% 40% 49% 36% 46% 44% 26% 47% 36%
Not-for-profit 116 39 77 25 42 36 14 69 17 11 3 39 49 26 25 56 35 47 39 8 47 70 29 59 28 52 57
11% 7% 15% 8% 12% 12% 20% 10% 12% 9% 15% 12% 12% 9% 9% 12% 12% 11% 11% 8% 11% 11% 10% 11% 15% 10% 12%
Other 27 12 15 15 6 5 - 14 9 2 1 7 9 8 2 20 4 10 4 4 3 24 9 11 6 5 22
3% 2% 3% 5% 2% 2% - 2% 6% 2% 6% 2% 2% 3% 1% 4% 1% 2% 1% 4% 1% 4% 3% 2% 3% 1% 5%
Don't know 44 13 31 22 13 9 - 21 10 12 - 10 14 11 9 30 4 14 9 2 1 43 11 24 9 4 36
4% 2% 6% 7% 4% 3% - 3% 7% 10% - 3% 4% 4% 3% 7% 1% 3% 3% 2% * 7% 4% 4% 5% 1% 8%
Sigma 1037 536 501 318 336 311 72 705 140 119 20 318 395 292 282 463 291 437 338 102 423 614 299 551 187 527 476
100% 100% 100% 100% 100% 100% 100% 100% 100% 100% 100% 100% 100% 100% 100% 100% 100% 100% 100% 100% 100% 100% 100% 100% 100% 100% 100%

Page 196
QuickQuery
Fielding Period: January 13-16, 2018
HCAPS (Filtered on Registered Voters)
Weighted To The U.S. General Adult Population - Propensity
18 Jan 2018
Table 170
D6 Is anyone in your household a member of a labor union?
Base: All Respondents
Presidential
Election Candidate
Gender Age Ethnicity Political Party Political Ideology Voted For Education Locale Income
_____________ ______________________ _______________________ ____________________ ____________________ _____________________ _____________ ________________ _________
Colle- Some
Cons- ge Gr- Colle- $75K Less
Hisp- Black Repub- Democ- Indep- Libe- Mode- erva- 3rd ad And ge Or Urb- Subu- Or Than
Total Male Female 18-34 35-49 50-64 65+ White anic /AA Other lican rat endent ral rate tive Clinton Trump Party Higher Less an rban Rural More $75K
______ _____ _______ _____ _____ _____ ____ _____ _____ _____ _____ ______ ______ ______ ______ ______ ______ ________ ______ _____ ______ ______ ____ _____ _____ ____ ____
Unweighted Base 1962 882 1080 384 500 636 442 1530 136 183 39 600 711 571 518 818 626 731 698 184 700 1262 519 952 491 577 1275
Weighted Base 1962 942 1020 502 467 580 414 1315 261 221 75 605 722 564 523 834 605 759 680 181 670 1292 545 1001 415 811 1039
Effective Base 1157 573 585 220 294 390 295 974 90 119 28 385 404 332 294 468 401 424 438 101 434 728 315 555 298 384 744
I am a member of a labor 173 98 76 36 45 54 38 126 24 17 4 59 55 56 56 70 47 68 67 13 72 101 54 82 37 97 70
union 9% 10% 7% 7% 10% 9% 9% 10% 9% 8% 5% 10% 8% 10% 11% 8% 8% 9% 10% 7% 11% 8% 10% 8% 9% 12% 7%
Someone else in my household 113 50 63 37 35 27 14 70 25 4 4 30 42 39 26 61 26 41 39 13 37 75 24 68 21 56 47
is a member of a labor union 6% 5% 6% 7% 8% 5% 3% 5% 10% 2% 5% 5% 6% 7% 5% 7% 4% 5% 6% 7% 6% 6% 4% 7% 5% 7% 5%
Both me and another member 30 19 11 17 8 1 4 8 13 5 - 7 14 10 16 8 6 11 6 5 14 16 13 15 3 16 14
of my household are members 2% 2% 1% 3% 2% * 1% 1% 5% 2% - 1% 2% 2% 3% 1% 1% 1% 1% 3% 2% 1% 2% 1% 1% 2% 1%
of a labor union
No one in my household is a 1574 741 833 368 368 481 356 1086 176 176 68 501 587 434 405 655 513 609 554 147 531 1043 432 800 342 624 867
member of a labor union 80% 79% 82% 73% 79% 83% 86% 83% 67% 80% 90% 83% 81% 77% 77% 79% 85% 80% 81% 81% 79% 81% 79% 80% 82% 77% 83%
Decline to state 73 34 38 44 10 16 2 24 23 18 - 8 25 26 20 40 12 30 14 3 17 56 23 38 12 18 40
4% 4% 4% 9% 2% 3% * 2% 9% 8% - 1% 3% 5% 4% 5% 2% 4% 2% 2% 2% 4% 4% 4% 3% 2% 4%
Sigma 1962 942 1020 502 467 580 414 1315 261 221 75 605 722 564 523 834 605 759 680 181 670 1292 545 1001 415 811 1039
100% 100% 100% 100% 100% 100% 100% 100% 100% 100% 100% 100% 100% 100% 100% 100% 100% 100% 100% 100% 100% 100% 100% 100% 100% 100% 100%
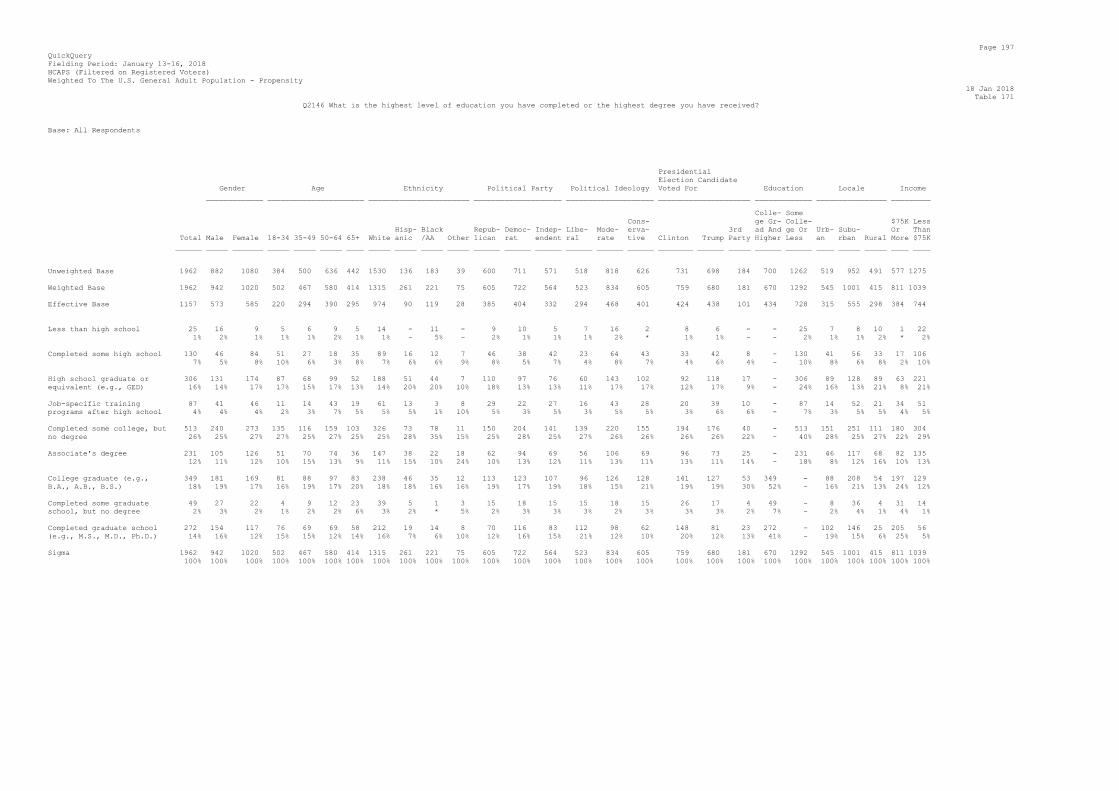
Page 197
QuickQuery
Fielding Period: January 13-16, 2018
HCAPS (Filtered on Registered Voters)
Weighted To The U.S. General Adult Population - Propensity
18 Jan 2018
Table 171
Q2146 What is the highest level of education you have completed or the highest degree you have received?
Base: All Respondents
Presidential
Election Candidate
Gender Age Ethnicity Political Party Political Ideology Voted For Education Locale Income
_____________ ______________________ _______________________ ____________________ ____________________ _____________________ _____________ ________________ _________
Colle- Some
Cons- ge Gr- Colle- $75K Less
Hisp- Black Repub- Democ- Indep- Libe- Mode- erva- 3rd ad And ge Or Urb- Subu- Or Than
Total Male Female 18-34 35-49 50-64 65+ White anic /AA Other lican rat endent ral rate tive Clinton Trump Party Higher Less an rban Rural More $75K
______ _____ _______ _____ _____ _____ ____ _____ _____ _____ _____ ______ ______ ______ ______ ______ ______ ________ ______ _____ ______ ______ ____ _____ _____ ____ ____
Unweighted Base 1962 882 1080 384 500 636 442 1530 136 183 39 600 711 571 518 818 626 731 698 184 700 1262 519 952 491 577 1275
Weighted Base 1962 942 1020 502 467 580 414 1315 261 221 75 605 722 564 523 834 605 759 680 181 670 1292 545 1001 415 811 1039
Effective Base 1157 573 585 220 294 390 295 974 90 119 28 385 404 332 294 468 401 424 438 101 434 728 315 555 298 384 744
Less than high school 25 16 9 5 6 9 5 14 - 11 - 9 10 5 7 16 2 8 6 - - 25 7 8 10 1 22
1% 2% 1% 1% 1% 2% 1% 1% - 5% - 2% 1% 1% 1% 2% * 1% 1% - - 2% 1% 1% 2% * 2%
Completed some high school 130 46 84 51 27 18 35 89 16 12 7 46 38 42 23 64 43 33 42 8 - 130 41 56 33 17 106
7% 5% 8% 10% 6% 3% 8% 7% 6% 6% 9% 8% 5% 7% 4% 8% 7% 4% 6% 4% - 10% 8% 6% 8% 2% 10%
High school graduate or 306 131 174 87 68 99 52 188 51 44 7 110 97 76 60 143 102 92 118 17 - 306 89 128 89 63 221
equivalent (e.g., GED) 16% 14% 17% 17% 15% 17% 13% 14% 20% 20% 10% 18% 13% 13% 11% 17% 17% 12% 17% 9% - 24% 16% 13% 21% 8% 21%
Job-specific training 87 41 46 11 14 43 19 61 13 3 8 29 22 27 16 43 28 20 39 10 - 87 14 52 21 34 51
programs after high school 4% 4% 4% 2% 3% 7% 5% 5% 5% 1% 10% 5% 3% 5% 3% 5% 5% 3% 6% 6% - 7% 3% 5% 5% 4% 5%
Completed some college, but 513 240 273 135 116 159 103 326 73 78 11 150 204 141 139 220 155 194 176 40 - 513 151 251 111 180 304
no degree 26% 25% 27% 27% 25% 27% 25% 25% 28% 35% 15% 25% 28% 25% 27% 26% 26% 26% 26% 22% - 40% 28% 25% 27% 22% 29%
Associate's degree 231 105 126 51 70 74 36 147 38 22 18 62 94 69 56 106 69 96 73 25 - 231 46 117 68 82 135
12% 11% 12% 10% 15% 13% 9% 11% 15% 10% 24% 10% 13% 12% 11% 13% 11% 13% 11% 14% - 18% 8% 12% 16% 10% 13%
College graduate (e.g., 349 181 169 81 88 97 83 238 46 35 12 113 123 107 96 126 128 141 127 53 349 - 88 208 54 197 129
B.A., A.B., B.S.) 18% 19% 17% 16% 19% 17% 20% 18% 18% 16% 16% 19% 17% 19% 18% 15% 21% 19% 19% 30% 52% - 16% 21% 13% 24% 12%
Completed some graduate 49 27 22 4 9 12 23 39 5 1 3 15 18 15 15 18 15 26 17 4 49 - 8 36 4 31 14
school, but no degree 2% 3% 2% 1% 2% 2% 6% 3% 2% * 5% 2% 3% 3% 3% 2% 3% 3% 3% 2% 7% - 2% 4% 1% 4% 1%
Completed graduate school 272 154 117 76 69 69 58 212 19 14 8 70 116 83 112 98 62 148 81 23 272 - 102 146 25 205 56
(e.g., M.S., M.D., Ph.D.) 14% 16% 12% 15% 15% 12% 14% 16% 7% 6% 10% 12% 16% 15% 21% 12% 10% 20% 12% 13% 41% - 19% 15% 6% 25% 5%
Sigma 1962 942 1020 502 467 580 414 1315 261 221 75 605 722 564 523 834 605 759 680 181 670 1292 545 1001 415 811 1039
100% 100% 100% 100% 100% 100% 100% 100% 100% 100% 100% 100% 100% 100% 100% 100% 100% 100% 100% 100% 100% 100% 100% 100% 100% 100% 100%

Page 198
QuickQuery
Fielding Period: January 13-16, 2018
HCAPS (Filtered on Registered Voters)
Weighted To The U.S. General Adult Population - Propensity
18 Jan 2018
Table 172
Q2135 What is your marital status?
Base: All Respondents
Presidential
Election Candidate
Gender Age Ethnicity Political Party Political Ideology Voted For Education Locale Income
_____________ ______________________ _______________________ ____________________ ____________________ _____________________ _____________ ________________ _________
Colle- Some
Cons- ge Gr- Colle- $75K Less
Hisp- Black Repub- Democ- Indep- Libe- Mode- erva- 3rd ad And ge Or Urb- Subu- Or Than
Total Male Female 18-34 35-49 50-64 65+ White anic /AA Other lican rat endent ral rate tive Clinton Trump Party Higher Less an rban Rural More $75K
______ _____ _______ _____ _____ _____ ____ _____ _____ _____ _____ ______ ______ ______ ______ ______ ______ ________ ______ _____ ______ ______ ____ _____ _____ ____ ____
Unweighted Base 1962 882 1080 384 500 636 442 1530 136 183 39 600 711 571 518 818 626 731 698 184 700 1262 519 952 491 577 1275
Weighted Base 1962 942 1020 502 467 580 414 1315 261 221 75 605 722 564 523 834 605 759 680 181 670 1292 545 1001 415 811 1039
Effective Base 1157 573 585 220 294 390 295 974 90 119 28 385 404 332 294 468 401 424 438 101 434 728 315 555 298 384 744
Married or civil union 962 497 465 169 240 315 238 712 121 65 34 350 306 277 209 395 358 342 407 84 428 533 232 525 205 553 364
49% 53% 46% 34% 51% 54% 58% 54% 46% 30% 45% 58% 42% 49% 40% 47% 59% 45% 60% 46% 64% 41% 43% 52% 49% 68% 35%
Single, never married 539 266 273 277 127 91 43 288 81 98 25 110 250 156 186 245 108 237 119 60 121 418 191 254 94 159 338
27% 28% 27% 55% 27% 16% 10% 22% 31% 44% 33% 18% 35% 28% 36% 29% 18% 31% 17% 33% 18% 32% 35% 25% 23% 20% 33%
Divorced 228 90 138 11 47 106 64 171 27 21 4 76 78 67 51 96 82 78 90 18 59 169 60 117 51 34 186
12% 10% 14% 2% 10% 18% 15% 13% 10% 10% 6% 13% 11% 12% 10% 11% 14% 10% 13% 10% 9% 13% 11% 12% 12% 4% 18%
Separated 42 20 22 7 18 12 5 18 10 9 1 11 8 14 4 31 7 14 8 5 11 31 10 18 14 14 26
2% 2% 2% 1% 4% 2% 1% 1% 4% 4% 1% 2% 1% 3% 1% 4% 1% 2% 1% 3% 2% 2% 2% 2% 3% 2% 2%
Widowed/Widower 88 33 55 - 7 29 52 63 7 12 5 32 37 19 29 25 33 42 34 5 25 63 22 40 26 11 66
4% 3% 5% - 1% 5% 13% 5% 3% 6% 7% 5% 5% 3% 6% 3% 5% 6% 5% 3% 4% 5% 4% 4% 6% 1% 6%
Living with partner 104 37 67 38 28 27 11 63 15 14 6 26 44 32 43 43 18 46 24 9 27 77 30 47 26 39 59
5% 4% 7% 8% 6% 5% 3% 5% 6% 7% 8% 4% 6% 6% 8% 5% 3% 6% 3% 5% 4% 6% 6% 5% 6% 5% 6%
Sigma 1962 942 1020 502 467 580 414 1315 261 221 75 605 722 564 523 834 605 759 680 181 670 1292 545 1001 415 811 1039
100% 100% 100% 100% 100% 100% 100% 100% 100% 100% 100% 100% 100% 100% 100% 100% 100% 100% 100% 100% 100% 100% 100% 100% 100% 100% 100%

Page 199
QuickQuery
Fielding Period: January 13-16, 2018
HCAPS (Filtered on Registered Voters)
Weighted To The U.S. General Adult Population - Propensity
18 Jan 2018
Table 173
D9 How many children live in your household?
Base: All Respondents
Presidential
Election Candidate
Gender Age Ethnicity Political Party Political Ideology Voted For Education Locale Income
_____________ ______________________ _______________________ ____________________ ____________________ _____________________ _____________ ________________ _________
Colle- Some
Cons- ge Gr- Colle- $75K Less
Hisp- Black Repub- Democ- Indep- Libe- Mode- erva- 3rd ad And ge Or Urb- Subu- Or Than
Total Male Female 18-34 35-49 50-64 65+ White anic /AA Other lican rat endent ral rate tive Clinton Trump Party Higher Less an rban Rural More $75K
______ _____ _______ _____ _____ _____ ____ _____ _____ _____ _____ ______ ______ ______ ______ ______ ______ ________ ______ _____ ______ ______ ____ _____ _____ ____ ____
Unweighted Base 1962 882 1080 384 500 636 442 1530 136 183 39 600 711 571 518 818 626 731 698 184 700 1262 519 952 491 577 1275
Weighted Base 1962 942 1020 502 467 580 414 1315 261 221 75 605 722 564 523 834 605 759 680 181 670 1292 545 1001 415 811 1039
Effective Base 1157 573 585 220 294 390 295 974 90 119 28 385 404 332 294 468 401 424 438 101 434 728 315 555 298 384 744
None 1145 599 546 240 156 381 369 824 98 136 41 365 419 322 345 429 372 460 412 101 387 758 313 580 253 410 657
58% 64% 54% 48% 33% 66% 89% 63% 38% 62% 55% 60% 58% 57% 66% 51% 61% 61% 61% 56% 58% 59% 57% 58% 61% 51% 63%
One 360 142 218 115 102 104 39 216 67 37 20 96 136 113 90 188 82 124 120 40 107 253 85 208 67 177 167
18% 15% 21% 23% 22% 18% 9% 16% 26% 17% 27% 16% 19% 20% 17% 23% 14% 16% 18% 22% 16% 20% 16% 21% 16% 22% 16%
Two 272 123 149 80 117 70 4 169 60 28 4 79 97 87 58 132 83 113 84 26 113 160 76 138 58 142 117
14% 13% 15% 16% 25% 12% 1% 13% 23% 13% 5% 13% 13% 15% 11% 16% 14% 15% 12% 14% 17% 12% 14% 14% 14% 17% 11%
Three 142 71 71 57 65 19 1 83 26 14 9 49 58 31 21 65 55 54 48 9 57 85 61 58 22 72 68
7% 8% 7% 11% 14% 3% * 6% 10% 6% 12% 8% 8% 6% 4% 8% 9% 7% 7% 5% 8% 7% 11% 6% 5% 9% 7%
Four or more 43 7 36 10 26 5 1 23 10 7 1 16 12 11 9 21 13 8 16 5 7 36 10 17 15 9 29
2% 1% 4% 2% 6% 1% * 2% 4% 3% 1% 3% 2% 2% 2% 3% 2% 1% 2% 3% 1% 3% 2% 2% 4% 1% 3%
Sigma 1962 942 1020 502 467 580 414 1315 261 221 75 605 722 564 523 834 605 759 680 181 670 1292 545 1001 415 811 1039
100% 100% 100% 100% 100% 100% 100% 100% 100% 100% 100% 100% 100% 100% 100% 100% 100% 100% 100% 100% 100% 100% 100% 100% 100% 100% 100%

Page 200
QuickQuery
Fielding Period: January 13-16, 2018
HCAPS (Filtered on Registered Voters)
Weighted To The U.S. General Adult Population - Propensity
18 Jan 2018
Table 174
M12 Which best describes your political ideology?
Base: All Respondents
Presidential
Election Candidate
Gender Age Ethnicity Political Party Political Ideology Voted For Education Locale Income
_____________ ______________________ _______________________ ____________________ ____________________ _____________________ _____________ ________________ _________
Colle- Some
Cons- ge Gr- Colle- $75K Less
Hisp- Black Repub- Democ- Indep- Libe- Mode- erva- 3rd ad And ge Or Urb- Subu- Or Than
Total Male Female 18-34 35-49 50-64 65+ White anic /AA Other lican rat endent ral rate tive Clinton Trump Party Higher Less an rban Rural More $75K
______ _____ _______ _____ _____ _____ ____ _____ _____ _____ _____ ______ ______ ______ ______ ______ ______ ________ ______ _____ ______ ______ ____ _____ _____ ____ ____
Unweighted Base 1962 882 1080 384 500 636 442 1530 136 183 39 600 711 571 518 818 626 731 698 184 700 1262 519 952 491 577 1275
Weighted Base 1962 942 1020 502 467 580 414 1315 261 221 75 605 722 564 523 834 605 759 680 181 670 1292 545 1001 415 811 1039
Effective Base 1157 573 585 220 294 390 295 974 90 119 28 385 404 332 294 468 401 424 438 101 434 728 315 555 298 384 744
Strong/Lean Liberal (Net) 523 230 292 167 117 141 98 325 65 89 14 40 361 111 523 - - 391 43 30 223 300 189 260 74 240 270
27% 24% 29% 33% 25% 24% 24% 25% 25% 40% 19% 7% 50% 20% 100% - - 51% 6% 17% 33% 23% 35% 26% 18% 30% 26%
Strong liberal 276 126 149 95 57 65 59 165 34 53 10 27 203 41 276 - - 213 24 16 129 147 128 108 39 119 149
14% 13% 15% 19% 12% 11% 14% 13% 13% 24% 13% 4% 28% 7% 53% - - 28% 3% 9% 19% 11% 24% 11% 9% 15% 14%
Lean liberal 247 104 143 72 60 75 40 160 31 37 4 13 158 70 247 - - 178 19 15 94 153 60 152 35 121 122
13% 11% 14% 14% 13% 13% 10% 12% 12% 17% 6% 2% 22% 12% 47% - - 23% 3% 8% 14% 12% 11% 15% 8% 15% 12%
Moderate 834 386 449 229 218 246 142 505 147 101 27 167 291 331 - 834 - 313 218 98 242 593 228 432 174 341 433
43% 41% 44% 46% 47% 42% 34% 38% 56% 46% 37% 28% 40% 59% - 100% - 41% 32% 54% 36% 46% 42% 43% 42% 42% 42%
Strong/Lean Conservative 605 326 279 106 132 193 174 485 49 30 33 398 70 122 - - 605 56 419 53 206 399 128 309 167 229 336
(Net) 31% 35% 27% 21% 28% 33% 42% 37% 19% 14% 44% 66% 10% 22% - - 100% 7% 62% 29% 31% 31% 24% 31% 40% 28% 32%
Lean conservative 296 169 127 51 60 92 92 236 21 14 22 160 41 91 - - 296 36 175 39 121 175 61 161 74 120 156
15% 18% 12% 10% 13% 16% 22% 18% 8% 6% 30% 26% 6% 16% - - 49% 5% 26% 22% 18% 14% 11% 16% 18% 15% 15%
Strong conservative 309 157 152 55 72 100 82 249 28 17 11 238 30 32 - - 309 20 244 13 85 224 68 148 94 109 179
16% 17% 15% 11% 15% 17% 20% 19% 11% 8% 15% 39% 4% 6% - - 51% 3% 36% 7% 13% 17% 12% 15% 23% 13% 17%
Sigma 1962 942 1020 502 467 580 414 1315 261 221 75 605 722 564 523 834 605 759 680 181 670 1292 545 1001 415 811 1039
100% 100% 100% 100% 100% 100% 100% 100% 100% 100% 100% 100% 100% 100% 100% 100% 100% 100% 100% 100% 100% 100% 100% 100% 100% 100% 100%
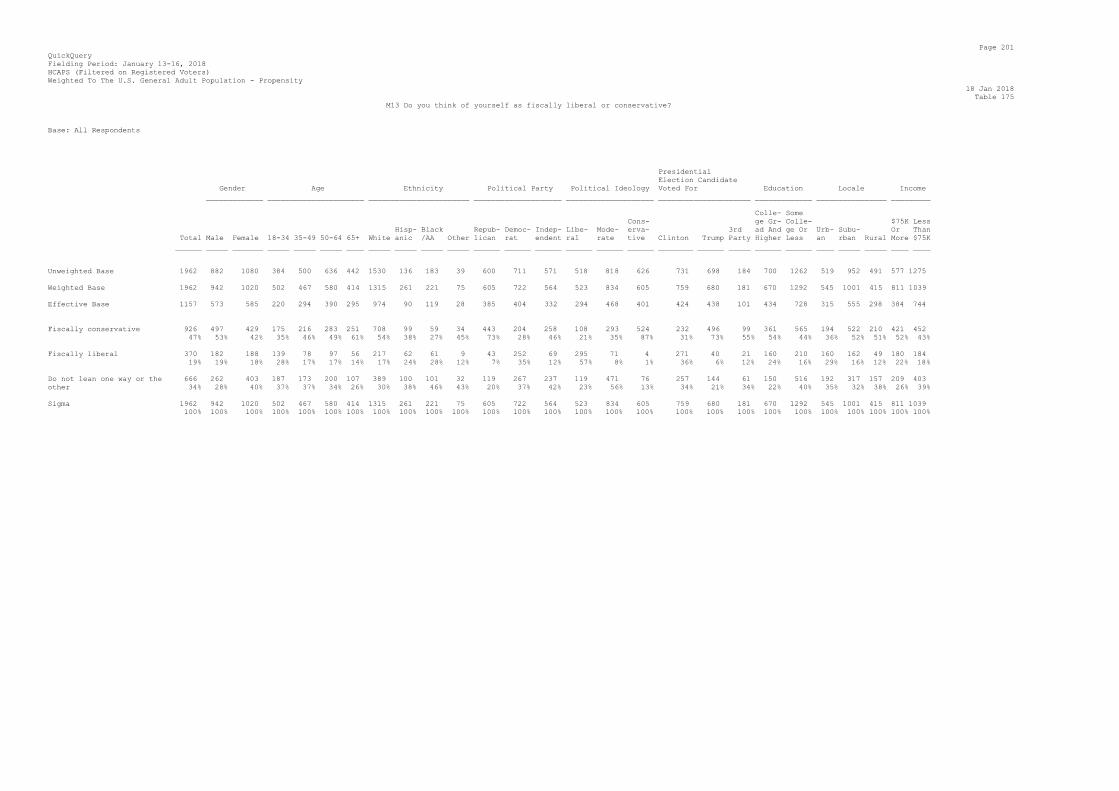
Page 201
QuickQuery
Fielding Period: January 13-16, 2018
HCAPS (Filtered on Registered Voters)
Weighted To The U.S. General Adult Population - Propensity
18 Jan 2018
Table 175
M13 Do you think of yourself as fiscally liberal or conservative?
Base: All Respondents
Presidential
Election Candidate
Gender Age Ethnicity Political Party Political Ideology Voted For Education Locale Income
_____________ ______________________ _______________________ ____________________ ____________________ _____________________ _____________ ________________ _________
Colle- Some
Cons- ge Gr- Colle- $75K Less
Hisp- Black Repub- Democ- Indep- Libe- Mode- erva- 3rd ad And ge Or Urb- Subu- Or Than
Total Male Female 18-34 35-49 50-64 65+ White anic /AA Other lican rat endent ral rate tive Clinton Trump Party Higher Less an rban Rural More $75K
______ _____ _______ _____ _____ _____ ____ _____ _____ _____ _____ ______ ______ ______ ______ ______ ______ ________ ______ _____ ______ ______ ____ _____ _____ ____ ____
Unweighted Base 1962 882 1080 384 500 636 442 1530 136 183 39 600 711 571 518 818 626 731 698 184 700 1262 519 952 491 577 1275
Weighted Base 1962 942 1020 502 467 580 414 1315 261 221 75 605 722 564 523 834 605 759 680 181 670 1292 545 1001 415 811 1039
Effective Base 1157 573 585 220 294 390 295 974 90 119 28 385 404 332 294 468 401 424 438 101 434 728 315 555 298 384 744
Fiscally conservative 926 497 429 175 216 283 251 708 99 59 34 443 204 258 108 293 524 232 496 99 361 565 194 522 210 421 452
47% 53% 42% 35% 46% 49% 61% 54% 38% 27% 45% 73% 28% 46% 21% 35% 87% 31% 73% 55% 54% 44% 36% 52% 51% 52% 43%
Fiscally liberal 370 182 188 139 78 97 56 217 62 61 9 43 252 69 295 71 4 271 40 21 160 210 160 162 49 180 184
19% 19% 18% 28% 17% 17% 14% 17% 24% 28% 12% 7% 35% 12% 57% 8% 1% 36% 6% 12% 24% 16% 29% 16% 12% 22% 18%
Do not lean one way or the 666 262 403 187 173 200 107 389 100 101 32 119 267 237 119 471 76 257 144 61 150 516 192 317 157 209 403
other 34% 28% 40% 37% 37% 34% 26% 30% 38% 46% 43% 20% 37% 42% 23% 56% 13% 34% 21% 34% 22% 40% 35% 32% 38% 26% 39%
Sigma 1962 942 1020 502 467 580 414 1315 261 221 75 605 722 564 523 834 605 759 680 181 670 1292 545 1001 415 811 1039
100% 100% 100% 100% 100% 100% 100% 100% 100% 100% 100% 100% 100% 100% 100% 100% 100% 100% 100% 100% 100% 100% 100% 100% 100% 100% 100%

Page 202
QuickQuery
Fielding Period: January 13-16, 2018
HCAPS (Filtered on Registered Voters)
Weighted To The U.S. General Adult Population - Propensity
18 Jan 2018
Table 176
M14 Do you think of yourself as socially liberal or conservative?
Base: All Respondents
Presidential
Election Candidate
Gender Age Ethnicity Political Party Political Ideology Voted For Education Locale Income
_____________ ______________________ _______________________ ____________________ ____________________ _____________________ _____________ ________________ _________
Colle- Some
Cons- ge Gr- Colle- $75K Less
Hisp- Black Repub- Democ- Indep- Libe- Mode- erva- 3rd ad And ge Or Urb- Subu- Or Than
Total Male Female 18-34 35-49 50-64 65+ White anic /AA Other lican rat endent ral rate tive Clinton Trump Party Higher Less an rban Rural More $75K
______ _____ _______ _____ _____ _____ ____ _____ _____ _____ _____ ______ ______ ______ ______ ______ ______ ________ ______ _____ ______ ______ ____ _____ _____ ____ ____
Unweighted Base 1962 882 1080 384 500 636 442 1530 136 183 39 600 711 571 518 818 626 731 698 184 700 1262 519 952 491 577 1275
Weighted Base 1962 942 1020 502 467 580 414 1315 261 221 75 605 722 564 523 834 605 759 680 181 670 1292 545 1001 415 811 1039
Effective Base 1157 573 585 220 294 390 295 974 90 119 28 385 404 332 294 468 401 424 438 101 434 728 315 555 298 384 744
Socially conservative 680 361 319 136 155 200 188 519 70 38 26 405 112 153 29 159 492 99 449 52 231 449 156 350 173 267 380
35% 38% 31% 27% 33% 35% 45% 40% 27% 17% 35% 67% 16% 27% 5% 19% 81% 13% 66% 29% 34% 35% 29% 35% 42% 33% 37%
Socially liberal 678 314 365 209 161 184 124 426 111 91 21 66 401 199 434 214 31 440 77 86 305 373 222 362 94 333 317
35% 33% 36% 42% 35% 32% 30% 32% 43% 41% 27% 11% 56% 35% 83% 26% 5% 58% 11% 48% 46% 29% 41% 36% 23% 41% 30%
Do not lean one way or the 604 267 337 156 150 195 102 369 81 91 28 134 209 212 60 462 81 220 154 43 135 469 167 289 148 211 342
other 31% 28% 33% 31% 32% 34% 25% 28% 31% 41% 38% 22% 29% 38% 12% 55% 13% 29% 23% 24% 20% 36% 31% 29% 36% 26% 33%
Sigma 1962 942 1020 502 467 580 414 1315 261 221 75 605 722 564 523 834 605 759 680 181 670 1292 545 1001 415 811 1039
100% 100% 100% 100% 100% 100% 100% 100% 100% 100% 100% 100% 100% 100% 100% 100% 100% 100% 100% 100% 100% 100% 100% 100% 100% 100% 100%

Page 203
QuickQuery
Fielding Period: January 13-16, 2018
HCAPS (Filtered on Registered Voters)
Weighted To The U.S. General Adult Population - Propensity
18 Jan 2018
Table 177
S3 Some people had the chance to vote in this year's presidential election on November
8, 2016. Others did not. Did you vote in November's presidential election?
Base: All Respondents
Presidential
Election Candidate
Gender Age Ethnicity Political Party Political Ideology Voted For Education Locale Income
_____________ ______________________ _______________________ ____________________ ____________________ _____________________ _____________ ________________ _________
Colle- Some
Cons- ge Gr- Colle- $75K Less
Hisp- Black Repub- Democ- Indep- Libe- Mode- erva- 3rd ad And ge Or Urb- Subu- Or Than
Total Male Female 18-34 35-49 50-64 65+ White anic /AA Other lican rat endent ral rate tive Clinton Trump Party Higher Less an rban Rural More $75K
______ _____ _______ _____ _____ _____ ____ _____ _____ _____ _____ ______ ______ ______ ______ ______ ______ ________ ______ _____ ______ ______ ____ _____ _____ ____ ____
Unweighted Base 1962 882 1080 384 500 636 442 1530 136 183 39 600 711 571 518 818 626 731 698 184 700 1262 519 952 491 577 1275
Weighted Base 1962 942 1020 502 467 580 414 1315 261 221 75 605 722 564 523 834 605 759 680 181 670 1292 545 1001 415 811 1039
Effective Base 1157 573 585 220 294 390 295 974 90 119 28 385 404 332 294 468 401 424 438 101 434 728 315 555 298 384 744
Yes 1677 828 849 380 383 516 399 1164 208 186 63 544 634 458 469 670 538 759 680 181 632 1045 469 864 344 728 851
85% 88% 83% 76% 82% 89% 96% 89% 80% 84% 84% 90% 88% 81% 90% 80% 89% 100% 100% 100% 94% 81% 86% 86% 83% 90% 82%
No 285 113 171 122 84 64 15 151 54 34 12 60 88 106 53 165 66 - - - 39 246 76 138 71 82 188
15% 12% 17% 24% 18% 11% 4% 11% 20% 16% 16% 10% 12% 19% 10% 20% 11% - - - 6% 19% 14% 14% 17% 10% 18%
Sigma 1962 942 1020 502 467 580 414 1315 261 221 75 605 722 564 523 834 605 759 680 181 670 1292 545 1001 415 811 1039
100% 100% 100% 100% 100% 100% 100% 100% 100% 100% 100% 100% 100% 100% 100% 100% 100% 100% 100% 100% 100% 100% 100% 100% 100% 100% 100%

Page 204
QuickQuery
Fielding Period: January 13-16, 2018
HCAPS (Filtered on Registered Voters)
Weighted To The U.S. General Adult Population - Propensity
18 Jan 2018
Table 178
S4 Confidentially and for statistical purposes only which candidate did you vote for in the presidential election on Nov. 8, 2016?
Base: Voted In Presidential Election
Presidential
Election Candidate
Gender Age Ethnicity Political Party Political Ideology Voted For Education Locale Income
_____________ ______________________ _______________________ ____________________ ____________________ _____________________ _____________ ________________ _________
Colle- Some
Cons- ge Gr- Colle- $75K Less
Hisp- Black Repub- Democ- Indep- Libe- Mode- erva- 3rd ad And ge Or Urb- Subu- Or Than
Total Male Female 18-34 35-49 50-64 65+ White anic /AA Other lican rat endent ral rate tive Clinton Trump Party Higher Less an rban Rural More $75K
______ _____ _______ _____ _____ _____ ____ _____ _____ _____ _____ ______ ______ ______ ______ ______ ______ ________ ______ _____ ______ ______ ____ _____ _____ ____ ____
Unweighted Base 1679 779 900 292 404 559 424 1337 108 150 33 546 617 469 462 655 562 731 698 184 660 1019 442 823 414 527 1058
Weighted Base 1677 828 849 380 383 516 399 1164 208 186 63 544 634 458 469 670 538 759 680 181 632 1045 469 864 344 728 851
Effective Base 998 506 493 169 238 340 282 850 73 95 23 351 352 281 265 380 359 424 438 101 407 595 267 486 259 355 615
Hillary Clinton 759 318 441 207 168 211 173 435 130 141 23 28 566 154 391 313 56 759 - - 316 443 268 361 131 340 384
45% 38% 52% 55% 44% 41% 43% 37% 63% 76% 36% 5% 89% 34% 83% 47% 10% 100% - - 50% 42% 57% 42% 38% 47% 45%
Donald Trump 680 387 293 108 157 228 187 576 50 16 19 478 33 160 43 218 419 - 680 - 225 456 151 353 176 289 349
41% 47% 35% 28% 41% 44% 47% 50% 24% 9% 30% 88% 5% 35% 9% 33% 78% - 100% - 36% 44% 32% 41% 51% 40% 41%
Gary Johnson 82 40 42 26 15 24 16 61 1 8 11 15 6 52 7 47 27 - - 82 40 42 13 59 10 44 31
5% 5% 5% 7% 4% 5% 4% 5% 1% 4% 18% 3% 1% 11% 2% 7% 5% - - 45% 6% 4% 3% 7% 3% 6% 4%
Jill Stein 38 23 15 14 15 3 5 16 13 4 - - 4 31 13 23 2 - - 38 8 30 10 25 3 10 26
2% 3% 2% 4% 4% 1% 1% 1% 6% 2% - - 1% 7% 3% 3% * - - 21% 1% 3% 2% 3% 1% 1% 3%
Other 61 35 26 13 15 25 7 36 8 8 7 14 13 31 10 28 23 - - 61 33 28 11 36 14 25 33
4% 4% 3% 4% 4% 5% 2% 3% 4% 4% 11% 3% 2% 7% 2% 4% 4% - - 34% 5% 3% 2% 4% 4% 3% 4%
Prefer not to answer 57 25 33 12 11 25 9 40 5 9 3 9 12 31 6 41 11 - - - 11 46 17 29 11 22 29
3% 3% 4% 3% 3% 5% 2% 3% 2% 5% 5% 2% 2% 7% 1% 6% 2% - - - 2% 4% 4% 3% 3% 3% 3%
Sigma 1677 828 849 380 383 516 399 1164 208 186 63 544 634 458 469 670 538 759 680 181 632 1045 469 864 344 728 851
100% 100% 100% 100% 100% 100% 100% 100% 100% 100% 100% 100% 100% 100% 100% 100% 100% 100% 100% 100% 100% 100% 100% 100% 100% 100% 100%

Page 205
QuickQuery
Fielding Period: January 13-16, 2018
HCAPS (Filtered on Registered Voters)
Weighted To The U.S. General Adult Population - Propensity
18 Jan 2018
Table 179
S4A In casting your vote, what was most important to you - the candidate's likeability or their stand on the issues?
Base: Voted In Presidential Election
Presidential
Election Candidate
Gender Age Ethnicity Political Party Political Ideology Voted For Education Locale Income
_____________ ______________________ _______________________ ____________________ ____________________ _____________________ _____________ ________________ _________
Colle- Some
Cons- ge Gr- Colle- $75K Less
Hisp- Black Repub- Democ- Indep- Libe- Mode- erva- 3rd ad And ge Or Urb- Subu- Or Than
Total Male Female 18-34 35-49 50-64 65+ White anic /AA Other lican rat endent ral rate tive Clinton Trump Party Higher Less an rban Rural More $75K
______ _____ _______ _____ _____ _____ ____ _____ _____ _____ _____ ______ ______ ______ ______ ______ ______ ________ ______ _____ ______ ______ ____ _____ _____ ____ ____
Unweighted Base 1679 779 900 292 404 559 424 1337 108 150 33 546 617 469 462 655 562 731 698 184 660 1019 442 823 414 527 1058
Weighted Base 1677 828 849 380 383 516 399 1164 208 186 63 544 634 458 469 670 538 759 680 181 632 1045 469 864 344 728 851
Effective Base 998 506 493 169 238 340 282 850 73 95 23 351 352 281 265 380 359 424 438 101 407 595 267 486 259 355 615
Their stand on the issues 1489 706 783 293 316 496 383 1048 166 168 58 470 559 422 400 586 502 675 605 154 557 932 383 790 316 632 760
89% 85% 92% 77% 83% 96% 96% 90% 80% 90% 92% 86% 88% 92% 85% 88% 93% 89% 89% 85% 88% 89% 82% 91% 92% 87% 89%
Likeability 189 123 66 87 66 20 15 116 41 19 5 74 75 36 69 83 36 84 75 26 75 114 86 74 29 97 91
11% 15% 8% 23% 17% 4% 4% 10% 20% 10% 8% 14% 12% 8% 15% 12% 7% 11% 11% 15% 12% 11% 18% 9% 8% 13% 11%
Sigma 1677 828 849 380 383 516 399 1164 208 186 63 544 634 458 469 670 538 759 680 181 632 1045 469 864 344 728 851
100% 100% 100% 100% 100% 100% 100% 100% 100% 100% 100% 100% 100% 100% 100% 100% 100% 100% 100% 100% 100% 100% 100% 100% 100% 100% 100%

Page 206
QuickQuery
Fielding Period: January 13-16, 2018
HCAPS (Filtered on Registered Voters)
Weighted To The U.S. General Adult Population - Propensity
18 Jan 2018
Table 180
D10 Are you registered to vote at your present address?
Base: All Respondents
Presidential
Election Candidate
Gender Age Ethnicity Political Party Political Ideology Voted For Education Locale Income
_____________ ______________________ _______________________ ____________________ ____________________ _____________________ _____________ ________________ _________
Colle- Some
Cons- ge Gr- Colle- $75K Less
Hisp- Black Repub- Democ- Indep- Libe- Mode- erva- 3rd ad And ge Or Urb- Subu- Or Than
Total Male Female 18-34 35-49 50-64 65+ White anic /AA Other lican rat endent ral rate tive Clinton Trump Party Higher Less an rban Rural More $75K
______ _____ _______ _____ _____ _____ ____ _____ _____ _____ _____ ______ ______ ______ ______ ______ ______ ________ ______ _____ ______ ______ ____ _____ _____ ____ ____
Unweighted Base 1962 882 1080 384 500 636 442 1530 136 183 39 600 711 571 518 818 626 731 698 184 700 1262 519 952 491 577 1275
Weighted Base 1962 942 1020 502 467 580 414 1315 261 221 75 605 722 564 523 834 605 759 680 181 670 1292 545 1001 415 811 1039
Effective Base 1157 573 585 220 294 390 295 974 90 119 28 385 404 332 294 468 401 424 438 101 434 728 315 555 298 384 744
Yes 1767 863 904 421 407 538 400 1221 224 198 60 551 665 501 479 721 566 733 658 163 640 1127 483 918 366 760 900
90% 92% 89% 84% 87% 93% 97% 93% 86% 90% 80% 91% 92% 89% 92% 86% 94% 97% 97% 90% 95% 87% 89% 92% 88% 94% 87%
No 150 66 84 59 47 30 14 76 31 21 8 45 43 47 36 87 27 22 21 15 23 128 44 68 39 37 108
8% 7% 8% 12% 10% 5% 3% 6% 12% 10% 11% 7% 6% 8% 7% 10% 4% 3% 3% 8% 3% 10% 8% 7% 9% 5% 10%
Not Sure 45 12 33 21 12 12 - 18 7 2 7 9 14 17 7 27 11 5 2 2 8 37 18 16 11 13 31
2% 1% 3% 4% 3% 2% - 1% 3% 1% 9% 1% 2% 3% 1% 3% 2% 1% * 1% 1% 3% 3% 2% 3% 2% 3%
Sigma 1962 942 1020 502 467 580 414 1315 261 221 75 605 722 564 523 834 605 759 680 181 670 1292 545 1001 415 811 1039
100% 100% 100% 100% 100% 100% 100% 100% 100% 100% 100% 100% 100% 100% 100% 100% 100% 100% 100% 100% 100% 100% 100% 100% 100% 100% 100%

Page 207
QuickQuery
Fielding Period: January 13-16, 2018
HCAPS (Filtered on Registered Voters)
Weighted To The U.S. General Adult Population - Propensity
18 Jan 2018
Table 181
D11 What is your religion?
Base: All Respondents
Presidential
Election Candidate
Gender Age Ethnicity Political Party Political Ideology Voted For Education Locale Income
_____________ ______________________ _______________________ ____________________ ____________________ _____________________ _____________ ________________ _________
Colle- Some
Cons- ge Gr- Colle- $75K Less
Hisp- Black Repub- Democ- Indep- Libe- Mode- erva- 3rd ad And ge Or Urb- Subu- Or Than
Total Male Female 18-34 35-49 50-64 65+ White anic /AA Other lican rat endent ral rate tive Clinton Trump Party Higher Less an rban Rural More $75K
______ _____ _______ _____ _____ _____ ____ _____ _____ _____ _____ ______ ______ ______ ______ ______ ______ ________ ______ _____ ______ ______ ____ _____ _____ ____ ____
Unweighted Base 1962 882 1080 384 500 636 442 1530 136 183 39 600 711 571 518 818 626 731 698 184 700 1262 519 952 491 577 1275
Weighted Base 1962 942 1020 502 467 580 414 1315 261 221 75 605 722 564 523 834 605 759 680 181 670 1292 545 1001 415 811 1039
Effective Base 1157 573 585 220 294 390 295 974 90 119 28 385 404 332 294 468 401 424 438 101 434 728 315 555 298 384 744
Evangelical Protestant 224 110 114 45 36 75 67 163 23 26 8 115 61 46 28 74 122 58 126 17 81 144 64 92 69 85 127
11% 12% 11% 9% 8% 13% 16% 12% 9% 12% 11% 19% 9% 8% 5% 9% 20% 8% 19% 9% 12% 11% 12% 9% 17% 10% 12%
Non-Evangelical Protestant 169 96 73 25 32 51 62 140 5 18 6 62 56 49 48 54 67 63 65 19 70 99 31 97 41 74 85
9% 10% 7% 5% 7% 9% 15% 11% 2% 8% 8% 10% 8% 9% 9% 6% 11% 8% 10% 10% 10% 8% 6% 10% 10% 9% 8%
Roman Catholic 482 230 253 118 106 157 101 306 135 17 6 147 183 139 95 242 145 201 174 16 201 281 133 272 78 242 216
25% 24% 25% 23% 23% 27% 24% 23% 52% 8% 7% 24% 25% 25% 18% 29% 24% 26% 26% 9% 30% 22% 24% 27% 19% 30% 21%
Mormon 35 19 16 12 10 11 2 19 10 - 5 24 3 8 2 23 11 2 16 7 7 28 10 18 7 16 18
2% 2% 2% 2% 2% 2% * 1% 4% - 6% 4% * 1% * 3% 2% * 2% 4% 1% 2% 2% 2% 2% 2% 2%
Other Christian 386 166 220 107 108 104 67 263 17 77 16 149 128 102 74 163 149 113 166 35 82 303 100 191 94 119 249
20% 18% 22% 21% 23% 18% 16% 20% 6% 35% 21% 25% 18% 18% 14% 19% 25% 15% 24% 19% 12% 23% 18% 19% 23% 15% 24%
Jewish 67 34 33 7 9 27 25 65 1 1 1 13 35 17 27 19 21 38 21 4 46 21 19 45 3 50 14
3% 4% 3% 1% 2% 5% 6% 5% * 1% 1% 2% 5% 3% 5% 2% 4% 5% 3% 2% 7% 2% 3% 5% 1% 6% 1%
Muslim 11 6 5 4 6 1 1 5 - 5 1 1 9 1 6 5 - 6 2 2 4 7 3 5 4 2 10
1% 1% 1% 1% 1% * * * - 2% 1% * 1% * 1% 1% - 1% * 1% 1% 1% * * 1% * 1%
Hindu 8 2 6 4 2 - 2 - - - - - 3 3 3 4 - 3 - - 8 - 2 6 - 5 3
* * 1% 1% * - * - - - - - * * 1% 1% - * - - 1% - * 1% - 1% *
Buddhist 20 8 12 2 6 6 6 8 - 3 - 1 9 9 8 11 1 8 1 3 9 11 8 10 3 13 5
1% 1% 1% * 1% 1% 1% 1% - 1% - * 1% 2% 1% 1% * 1% * 2% 1% 1% 1% 1% 1% 2% 1%
Atheist/Agnostic 246 143 102 84 63 52 47 184 16 13 10 36 113 89 134 83 29 134 34 45 93 153 76 129 40 113 120
13% 15% 10% 17% 14% 9% 11% 14% 6% 6% 13% 6% 16% 16% 26% 10% 5% 18% 5% 25% 14% 12% 14% 13% 10% 14% 12%
Other 314 129 185 94 89 96 35 163 55 61 24 57 121 101 97 157 60 134 74 34 69 245 101 136 76 92 193
16% 14% 18% 19% 19% 17% 8% 12% 21% 28% 32% 9% 17% 18% 19% 19% 10% 18% 11% 19% 10% 19% 19% 14% 18% 11% 19%
Sigma 1962 942 1020 502 467 580 414 1315 261 221 75 605 722 564 523 834 605 759 680 181 670 1292 545 1001 415 811 1039
100% 100% 100% 100% 100% 100% 100% 100% 100% 100% 100% 100% 100% 100% 100% 100% 100% 100% 100% 100% 100% 100% 100% 100% 100% 100% 100%

Page 208
QuickQuery
Fielding Period: January 13-16, 2018
HCAPS (Filtered on Registered Voters)
Weighted To The U.S. General Adult Population - Propensity
18 Jan 2018
Table 182
D12 How often do you attend religion services, events, or gatherings?
Base: All Respondents
Presidential
Election Candidate
Gender Age Ethnicity Political Party Political Ideology Voted For Education Locale Income
_____________ ______________________ _______________________ ____________________ ____________________ _____________________ _____________ ________________ _________
Colle- Some
Cons- ge Gr- Colle- $75K Less
Hisp- Black Repub- Democ- Indep- Libe- Mode- erva- 3rd ad And ge Or Urb- Subu- Or Than
Total Male Female 18-34 35-49 50-64 65+ White anic /AA Other lican rat endent ral rate tive Clinton Trump Party Higher Less an rban Rural More $75K
______ _____ _______ _____ _____ _____ ____ _____ _____ _____ _____ ______ ______ ______ ______ ______ ______ ________ ______ _____ ______ ______ ____ _____ _____ ____ ____
Unweighted Base 1962 882 1080 384 500 636 442 1530 136 183 39 600 711 571 518 818 626 731 698 184 700 1262 519 952 491 577 1275
Weighted Base 1962 942 1020 502 467 580 414 1315 261 221 75 605 722 564 523 834 605 759 680 181 670 1292 545 1001 415 811 1039
Effective Base 1157 573 585 220 294 390 295 974 90 119 28 385 404 332 294 468 401 424 438 101 434 728 315 555 298 384 744
Daily 30 18 12 13 6 8 3 13 8 5 3 13 13 3 11 11 8 13 13 1 15 14 20 9 * 15 15
2% 2% 1% 3% 1% 1% 1% 1% 3% 2% 5% 2% 2% * 2% 1% 1% 2% 2% * 2% 1% 4% 1% * 2% 1%
Weekly 485 236 249 101 113 146 125 324 66 69 9 211 138 125 72 189 223 150 233 42 177 307 116 244 125 177 277
25% 25% 24% 20% 24% 25% 30% 25% 25% 31% 12% 35% 19% 22% 14% 23% 37% 20% 34% 23% 26% 24% 21% 24% 30% 22% 27%
A few times per month 223 108 116 72 55 55 41 137 37 32 5 62 83 75 50 115 58 92 70 20 90 133 60 126 37 104 108
11% 11% 11% 14% 12% 9% 10% 10% 14% 15% 7% 10% 11% 13% 10% 14% 10% 12% 10% 11% 13% 10% 11% 13% 9% 13% 10%
Once a month 157 80 77 34 45 45 33 106 4 22 7 52 60 41 38 67 52 54 66 9 72 85 57 67 32 81 72
8% 9% 7% 7% 10% 8% 8% 8% 2% 10% 9% 9% 8% 7% 7% 8% 9% 7% 10% 5% 11% 7% 11% 7% 8% 10% 7%
Almost never 1068 500 568 280 249 327 212 734 147 92 50 267 429 321 352 453 263 450 299 109 316 752 292 555 221 433 567
54% 53% 56% 56% 53% 56% 51% 56% 56% 42% 67% 44% 59% 57% 67% 54% 44% 59% 44% 60% 47% 58% 53% 55% 53% 53% 55%
Sigma 1962 942 1020 502 467 580 414 1315 261 221 75 605 722 564 523 834 605 759 680 181 670 1292 545 1001 415 811 1039
100% 100% 100% 100% 100% 100% 100% 100% 100% 100% 100% 100% 100% 100% 100% 100% 100% 100% 100% 100% 100% 100% 100% 100% 100% 100% 100%

Page 209
QuickQuery
Fielding Period: January 13-16, 2018
HCAPS (Filtered on Registered Voters)
Weighted To The U.S. General Adult Population - Propensity
18 Jan 2018
Table 183
D13 How important or unimportant is religion in your life?
Base: All Respondents
Presidential
Election Candidate
Gender Age Ethnicity Political Party Political Ideology Voted For Education Locale Income
_____________ ______________________ _______________________ ____________________ ____________________ _____________________ _____________ ________________ _________
Colle- Some
Cons- ge Gr- Colle- $75K Less
Hisp- Black Repub- Democ- Indep- Libe- Mode- erva- 3rd ad And ge Or Urb- Subu- Or Than
Total Male Female 18-34 35-49 50-64 65+ White anic /AA Other lican rat endent ral rate tive Clinton Trump Party Higher Less an rban Rural More $75K
______ _____ _______ _____ _____ _____ ____ _____ _____ _____ _____ ______ ______ ______ ______ ______ ______ ________ ______ _____ ______ ______ ____ _____ _____ ____ ____
Unweighted Base 1962 882 1080 384 500 636 442 1530 136 183 39 600 711 571 518 818 626 731 698 184 700 1262 519 952 491 577 1275
Weighted Base 1962 942 1020 502 467 580 414 1315 261 221 75 605 722 564 523 834 605 759 680 181 670 1292 545 1001 415 811 1039
Effective Base 1157 573 585 220 294 390 295 974 90 119 28 385 404 332 294 468 401 424 438 101 434 728 315 555 298 384 744
Very/Somewhat Important 1306 594 711 319 289 408 290 846 179 182 50 454 454 349 265 572 469 464 519 103 434 872 371 652 282 511 726
(Net) 67% 63% 70% 64% 62% 70% 70% 64% 69% 82% 67% 75% 63% 62% 51% 69% 78% 61% 76% 57% 65% 68% 68% 65% 68% 63% 70%
Very important 702 314 388 159 154 221 168 447 83 124 22 274 237 168 142 298 262 238 297 51 224 478 215 319 168 258 401
36% 33% 38% 32% 33% 38% 41% 34% 32% 56% 29% 45% 33% 30% 27% 36% 43% 31% 44% 28% 33% 37% 39% 32% 40% 32% 39%
Somewhat important 604 280 324 160 135 187 122 399 96 58 28 180 218 181 123 274 207 227 222 52 209 394 156 333 114 253 325
31% 30% 32% 32% 29% 32% 29% 30% 37% 26% 38% 30% 30% 32% 24% 33% 34% 30% 33% 29% 31% 31% 29% 33% 28% 31% 31%
Very/Somewhat Unimportant 656 347 309 183 177 172 124 469 82 39 25 150 268 215 258 263 136 295 161 78 237 419 174 349 133 300 313
(Net) 33% 37% 30% 36% 38% 30% 30% 36% 31% 18% 33% 25% 37% 38% 49% 31% 22% 39% 24% 43% 35% 32% 32% 35% 32% 37% 30%
Somewhat unimportant 267 121 146 74 67 77 49 187 42 12 7 82 98 76 87 115 65 95 85 24 95 172 61 151 55 127 121
14% 13% 14% 15% 14% 13% 12% 14% 16% 5% 9% 14% 14% 13% 17% 14% 11% 12% 12% 13% 14% 13% 11% 15% 13% 16% 12%
Very unimportant 389 227 163 109 110 95 75 282 40 27 18 68 169 140 171 148 71 200 77 53 142 248 113 198 78 172 192
20% 24% 16% 22% 24% 16% 18% 21% 15% 12% 24% 11% 23% 25% 33% 18% 12% 26% 11% 30% 21% 19% 21% 20% 19% 21% 18%
Sigma 1962 942 1020 502 467 580 414 1315 261 221 75 605 722 564 523 834 605 759 680 181 670 1292 545 1001 415 811 1039
100% 100% 100% 100% 100% 100% 100% 100% 100% 100% 100% 100% 100% 100% 100% 100% 100% 100% 100% 100% 100% 100% 100% 100% 100% 100% 100%
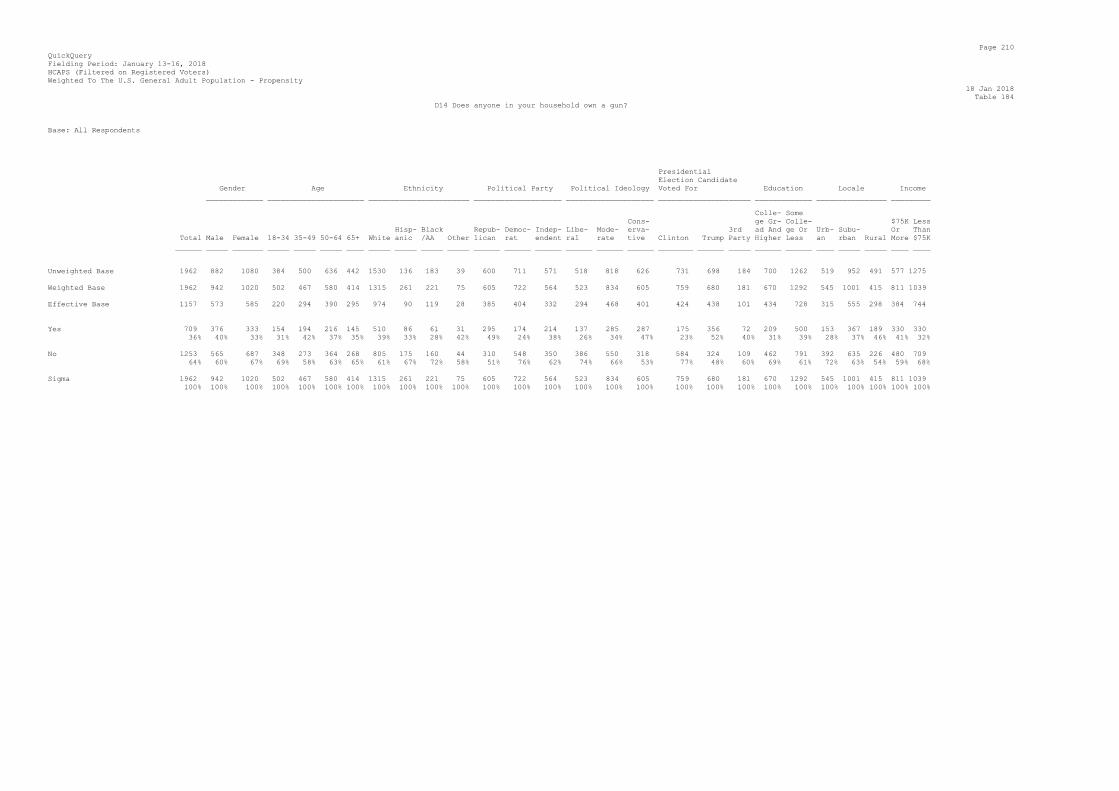
Page 210
QuickQuery
Fielding Period: January 13-16, 2018
HCAPS (Filtered on Registered Voters)
Weighted To The U.S. General Adult Population - Propensity
18 Jan 2018
Table 184
D14 Does anyone in your household own a gun?
Base: All Respondents
Presidential
Election Candidate
Gender Age Ethnicity Political Party Political Ideology Voted For Education Locale Income
_____________ ______________________ _______________________ ____________________ ____________________ _____________________ _____________ ________________ _________
Colle- Some
Cons- ge Gr- Colle- $75K Less
Hisp- Black Repub- Democ- Indep- Libe- Mode- erva- 3rd ad And ge Or Urb- Subu- Or Than
Total Male Female 18-34 35-49 50-64 65+ White anic /AA Other lican rat endent ral rate tive Clinton Trump Party Higher Less an rban Rural More $75K
______ _____ _______ _____ _____ _____ ____ _____ _____ _____ _____ ______ ______ ______ ______ ______ ______ ________ ______ _____ ______ ______ ____ _____ _____ ____ ____
Unweighted Base 1962 882 1080 384 500 636 442 1530 136 183 39 600 711 571 518 818 626 731 698 184 700 1262 519 952 491 577 1275
Weighted Base 1962 942 1020 502 467 580 414 1315 261 221 75 605 722 564 523 834 605 759 680 181 670 1292 545 1001 415 811 1039
Effective Base 1157 573 585 220 294 390 295 974 90 119 28 385 404 332 294 468 401 424 438 101 434 728 315 555 298 384 744
Yes 709 376 333 154 194 216 145 510 86 61 31 295 174 214 137 285 287 175 356 72 209 500 153 367 189 330 330
36% 40% 33% 31% 42% 37% 35% 39% 33% 28% 42% 49% 24% 38% 26% 34% 47% 23% 52% 40% 31% 39% 28% 37% 46% 41% 32%
No 1253 565 687 348 273 364 268 805 175 160 44 310 548 350 386 550 318 584 324 109 462 791 392 635 226 480 709
64% 60% 67% 69% 58% 63% 65% 61% 67% 72% 58% 51% 76% 62% 74% 66% 53% 77% 48% 60% 69% 61% 72% 63% 54% 59% 68%
Sigma 1962 942 1020 502 467 580 414 1315 261 221 75 605 722 564 523 834 605 759 680 181 670 1292 545 1001 415 811 1039
100% 100% 100% 100% 100% 100% 100% 100% 100% 100% 100% 100% 100% 100% 100% 100% 100% 100% 100% 100% 100% 100% 100% 100% 100% 100% 100%

Page 211
QuickQuery
Fielding Period: January 13-16, 2018
HCAPS (Filtered on Registered Voters)
Weighted To The U.S. General Adult Population - Propensity
18 Jan 2018
Table 185
Q2145 Which of the following best describes your current primary residence?
I/We live in...
Base: All Respondents
Presidential
Election Candidate
Gender Age Ethnicity Political Party Political Ideology Voted For Education Locale Income
_____________ ______________________ _______________________ ____________________ ____________________ _____________________ _____________ ________________ _________
Colle- Some
Cons- ge Gr- Colle- $75K Less
Hisp- Black Repub- Democ- Indep- Libe- Mode- erva- 3rd ad And ge Or Urb- Subu- Or Than
Total Male Female 18-34 35-49 50-64 65+ White anic /AA Other lican rat endent ral rate tive Clinton Trump Party Higher Less an rban Rural More $75K
______ _____ _______ _____ _____ _____ ____ _____ _____ _____ _____ ______ ______ ______ ______ ______ ______ ________ ______ _____ ______ ______ ____ _____ _____ ____ ____
Unweighted Base 1962 882 1080 384 500 636 442 1530 136 183 39 600 711 571 518 818 626 731 698 184 700 1262 519 952 491 577 1275
Weighted Base 1962 942 1020 502 467 580 414 1315 261 221 75 605 722 564 523 834 605 759 680 181 670 1292 545 1001 415 811 1039
Effective Base 1157 573 585 220 294 390 295 974 90 119 28 385 404 332 294 468 401 424 438 101 434 728 315 555 298 384 744
A house that I/we own 1165 589 576 243 270 370 281 848 142 86 46 400 390 339 279 488 399 435 475 114 450 715 219 659 288 582 510
59% 63% 56% 48% 58% 64% 68% 65% 55% 39% 61% 66% 54% 60% 53% 58% 66% 57% 70% 63% 67% 55% 40% 66% 69% 72% 49%
An apartment or condominium 91 47 44 17 19 24 31 64 5 6 3 27 35 29 22 38 31 36 28 7 46 44 40 45 5 47 38
that I/we own 5% 5% 4% 3% 4% 4% 7% 5% 2% 3% 4% 4% 5% 5% 4% 5% 5% 5% 4% 4% 7% 3% 7% 5% 1% 6% 4%
Another type of home that I/ 38 19 19 8 12 12 6 28 5 2 3 12 13 12 8 17 13 10 10 8 8 30 6 20 13 2 35
we own 2% 2% 2% 2% 3% 2% 1% 2% 2% 1% 4% 2% 2% 2% 2% 2% 2% 1% 2% 4% 1% 2% 1% 2% 3% * 3%
A house that I/we rent or 298 139 158 103 85 76 33 189 48 37 10 88 105 95 99 110 88 113 84 28 76 222 105 134 58 112 169
lease 15% 15% 16% 21% 18% 13% 8% 14% 18% 17% 14% 15% 15% 17% 19% 13% 15% 15% 12% 16% 11% 17% 19% 13% 14% 14% 16%
An apartment or condominium 303 122 181 102 60 88 52 151 45 77 10 51 158 79 102 144 58 150 56 21 81 222 159 115 29 61 230
that I/we rent or lease 15% 13% 18% 20% 13% 15% 13% 11% 17% 35% 13% 8% 22% 14% 19% 17% 10% 20% 8% 12% 12% 17% 29% 11% 7% 7% 22%
Another type of home that I/ 25 8 17 9 9 5 3 12 8 4 - 14 5 4 6 12 8 5 11 2 7 18 4 14 7 4 22
we rent or lease 1% 1% 2% 2% 2% 1% 1% 1% 3% 2% - 2% 1% 1% 1% 1% 1% 1% 2% 1% 1% 1% 1% 1% 2% * 2%
None of these 43 18 25 21 11 4 7 23 8 10 3 13 16 7 7 26 10 10 17 1 3 40 12 15 16 4 34
2% 2% 2% 4% 2% 1% 2% 2% 3% 4% 4% 2% 2% 1% 1% 3% 2% 1% 2% * * 3% 2% 2% 4% * 3%
Sigma 1962 942 1020 502 467 580 414 1315 261 221 75 605 722 564 523 834 605 759 680 181 670 1292 545 1001 415 811 1039
100% 100% 100% 100% 100% 100% 100% 100% 100% 100% 100% 100% 100% 100% 100% 100% 100% 100% 100% 100% 100% 100% 100% 100% 100% 100% 100%

Page 212
QuickQuery
Fielding Period: January 13-16, 2018
HCAPS (Filtered on Registered Voters)
Weighted To The U.S. General Adult Population - Propensity
18 Jan 2018
Table 186
D16 Do you live in a suburban, urban, or rural area?
Base: All Respondents
Presidential
Election Candidate
Gender Age Ethnicity Political Party Political Ideology Voted For Education Locale Income
_____________ ______________________ _______________________ ____________________ ____________________ _____________________ _____________ ________________ _________
Colle- Some
Cons- ge Gr- Colle- $75K Less
Hisp- Black Repub- Democ- Indep- Libe- Mode- erva- 3rd ad And ge Or Urb- Subu- Or Than
Total Male Female 18-34 35-49 50-64 65+ White anic /AA Other lican rat endent ral rate tive Clinton Trump Party Higher Less an rban Rural More $75K
______ _____ _______ _____ _____ _____ ____ _____ _____ _____ _____ ______ ______ ______ ______ ______ ______ ________ ______ _____ ______ ______ ____ _____ _____ ____ ____
Unweighted Base 1962 882 1080 384 500 636 442 1530 136 183 39 600 711 571 518 818 626 731 698 184 700 1262 519 952 491 577 1275
Weighted Base 1962 942 1020 502 467 580 414 1315 261 221 75 605 722 564 523 834 605 759 680 181 670 1292 545 1001 415 811 1039
Effective Base 1157 573 585 220 294 390 295 974 90 119 28 385 404 332 294 468 401 424 438 101 434 728 315 555 298 384 744
Urban 545 288 257 189 113 160 82 305 89 96 20 148 261 123 189 228 128 268 151 33 198 347 545 - - 214 304
28% 31% 25% 38% 24% 28% 20% 23% 34% 43% 27% 25% 36% 22% 36% 27% 21% 35% 22% 18% 30% 27% 100% - - 26% 29%
Suburban 1001 463 539 238 240 291 232 680 144 99 35 308 339 320 260 432 309 361 353 121 390 612 - 1001 - 485 449
51% 49% 53% 47% 51% 50% 56% 52% 55% 45% 47% 51% 47% 57% 50% 52% 51% 48% 52% 67% 58% 47% - 100% - 60% 43%
Rural 415 191 225 75 113 129 99 330 28 26 20 148 122 121 74 174 167 131 176 27 83 332 - - 415 111 286
21% 20% 22% 15% 24% 22% 24% 25% 11% 12% 26% 25% 17% 21% 14% 21% 28% 17% 26% 15% 12% 26% - - 100% 14% 28%
Sigma 1962 942 1020 502 467 580 414 1315 261 221 75 605 722 564 523 834 605 759 680 181 670 1292 545 1001 415 811 1039
100% 100% 100% 100% 100% 100% 100% 100% 100% 100% 100% 100% 100% 100% 100% 100% 100% 100% 100% 100% 100% 100% 100% 100% 100% 100% 100%

Page 213
QuickQuery
Fielding Period: January 13-16, 2018
HCAPS (Filtered on Registered Voters)
Weighted To The U.S. General Adult Population - Propensity
18 Jan 2018
Table 187
D18 Are you a Citizen of the United States?
Base: All Respondents
Presidential
Election Candidate
Gender Age Ethnicity Political Party Political Ideology Voted For Education Locale Income
_____________ ______________________ _______________________ ____________________ ____________________ _____________________ _____________ ________________ _________
Colle- Some
Cons- ge Gr- Colle- $75K Less
Hisp- Black Repub- Democ- Indep- Libe- Mode- erva- 3rd ad And ge Or Urb- Subu- Or Than
Total Male Female 18-34 35-49 50-64 65+ White anic /AA Other lican rat endent ral rate tive Clinton Trump Party Higher Less an rban Rural More $75K
______ _____ _______ _____ _____ _____ ____ _____ _____ _____ _____ ______ ______ ______ ______ ______ ______ ________ ______ _____ ______ ______ ____ _____ _____ ____ ____
Unweighted Base 1962 882 1080 384 500 636 442 1530 136 183 39 600 711 571 518 818 626 731 698 184 700 1262 519 952 491 577 1275
Weighted Base 1962 942 1020 502 467 580 414 1315 261 221 75 605 722 564 523 834 605 759 680 181 670 1292 545 1001 415 811 1039
Effective Base 1157 573 585 220 294 390 295 974 90 119 28 385 404 332 294 468 401 424 438 101 434 728 315 555 298 384 744
Yes 1944 930 1014 491 463 576 414 1312 255 217 75 598 712 562 515 826 603 755 680 181 666 1279 537 996 411 801 1031
99% 99% 99% 98% 99% 99% 100% 100% 98% 98% 100% 99% 99% 100% 99% 99% 100% 100% 100% 100% 99% 99% 98% 99% 99% 99% 99%
No 18 12 6 11 4 3 - 3 6 3 - 6 10 2 7 9 2 4 - - 5 13 8 6 4 9 8
1% 1% 1% 2% 1% 1% - * 2% 2% - 1% 1% * 1% 1% * * - - 1% 1% 2% 1% 1% 1% 1%
Sigma 1962 942 1020 502 467 580 414 1315 261 221 75 605 722 564 523 834 605 759 680 181 670 1292 545 1001 415 811 1039
100% 100% 100% 100% 100% 100% 100% 100% 100% 100% 100% 100% 100% 100% 100% 100% 100% 100% 100% 100% 100% 100% 100% 100% 100% 100% 100%

Page 214
QuickQuery
Fielding Period: January 13-16, 2018
HCAPS (Filtered on Registered Voters)
Weighted To The U.S. General Adult Population - Propensity
18 Jan 2018
Table 188
HO1 Do you have health insurance?
Base: All Respondents
Presidential
Election Candidate
Gender Age Ethnicity Political Party Political Ideology Voted For Education Locale Income
_____________ ______________________ _______________________ ____________________ ____________________ _____________________ _____________ ________________ _________
Colle- Some
Cons- ge Gr- Colle- $75K Less
Hisp- Black Repub- Democ- Indep- Libe- Mode- erva- 3rd ad And ge Or Urb- Subu- Or Than
Total Male Female 18-34 35-49 50-64 65+ White anic /AA Other lican rat endent ral rate tive Clinton Trump Party Higher Less an rban Rural More $75K
______ _____ _______ _____ _____ _____ ____ _____ _____ _____ _____ ______ ______ ______ ______ ______ ______ ________ ______ _____ ______ ______ ____ _____ _____ ____ ____
Unweighted Base 1962 882 1080 384 500 636 442 1530 136 183 39 600 711 571 518 818 626 731 698 184 700 1262 519 952 491 577 1275
Weighted Base 1962 942 1020 502 467 580 414 1315 261 221 75 605 722 564 523 834 605 759 680 181 670 1292 545 1001 415 811 1039
Effective Base 1157 573 585 220 294 390 295 974 90 119 28 385 404 332 294 468 401 424 438 101 434 728 315 555 298 384 744
Yes 1796 871 925 421 425 539 411 1219 237 196 66 559 673 511 476 762 558 719 637 162 646 1150 483 931 381 782 911
92% 93% 91% 84% 91% 93% 99% 93% 91% 89% 88% 93% 93% 91% 91% 91% 92% 95% 94% 89% 96% 89% 89% 93% 92% 97% 88%
No 166 70 96 81 42 41 3 96 25 25 9 45 49 53 47 73 47 40 43 19 25 141 62 70 34 28 128
8% 7% 9% 16% 9% 7% 1% 7% 9% 11% 12% 7% 7% 9% 9% 9% 8% 5% 6% 11% 4% 11% 11% 7% 8% 3% 12%
Sigma 1962 942 1020 502 467 580 414 1315 261 221 75 605 722 564 523 834 605 759 680 181 670 1292 545 1001 415 811 1039
100% 100% 100% 100% 100% 100% 100% 100% 100% 100% 100% 100% 100% 100% 100% 100% 100% 100% 100% 100% 100% 100% 100% 100% 100% 100% 100%

Page 215
QuickQuery
Fielding Period: January 13-16, 2018
HCAPS (Filtered on Registered Voters)
Weighted To The U.S. General Adult Population - Propensity
18 Jan 2018
Table 189
HO2 How did you acquire your health insurance?
Base: Has Health Insurance
Presidential
Election Candidate
Gender Age Ethnicity Political Party Political Ideology Voted For Education Locale Income
_____________ ______________________ _______________________ ____________________ ____________________ _____________________ _____________ ________________ _________
Colle- Some
Cons- ge Gr- Colle- $75K Less
Hisp- Black Repub- Democ- Indep- Libe- Mode- erva- 3rd ad And ge Or Urb- Subu- Or Than
Total Male Female 18-34 35-49 50-64 65+ White anic /AA Other lican rat endent ral rate tive Clinton Trump Party Higher Less an rban Rural More $75K
______ _____ _______ _____ _____ _____ ____ _____ _____ _____ _____ ______ ______ ______ ______ ______ ______ ________ ______ _____ ______ ______ ____ _____ _____ ____ ____
Unweighted Base 1800 817 983 324 456 584 436 1417 120 159 35 555 663 523 478 746 576 695 650 164 671 1129 461 889 450 563 1135
Weighted Base 1796 871 925 421 425 539 411 1219 237 196 66 559 673 511 476 762 558 719 637 162 646 1150 483 931 381 782 911
Effective Base 1064 534 531 184 268 356 292 915 78 101 25 359 375 308 272 428 369 405 409 88 415 653 280 522 272 378 659
Through my work or my 899 456 442 238 288 310 63 640 106 78 25 278 316 278 254 378 267 373 317 87 420 479 234 503 162 562 299
spouse's work 50% 52% 48% 57% 68% 57% 15% 53% 45% 40% 38% 50% 47% 54% 53% 50% 48% 52% 50% 54% 65% 42% 48% 54% 42% 72% 33%
Through a union, guild, or 60 40 20 27 17 10 7 23 27 7 - 24 16 20 13 32 15 16 23 7 14 47 12 39 9 28 27
organization 3% 5% 2% 6% 4% 2% 2% 2% 11% 4% - 4% 2% 4% 3% 4% 3% 2% 4% 4% 2% 4% 3% 4% 2% 4% 3%
Through a government program 684 297 386 115 88 169 311 448 84 95 35 205 286 169 170 293 221 276 232 52 157 526 186 319 179 138 496
(e.g. Medicare, Medicaid, 38% 34% 42% 27% 21% 31% 76% 37% 36% 49% 52% 37% 43% 33% 36% 38% 40% 38% 36% 32% 24% 46% 39% 34% 47% 18% 54%
Obamacare, state program)
I purchased my own 153 77 76 41 32 50 30 108 20 15 7 52 55 44 39 59 55 55 64 16 55 98 50 71 32 54 89
9% 9% 8% 10% 7% 9% 7% 9% 8% 8% 10% 9% 8% 9% 8% 8% 10% 8% 10% 10% 8% 9% 10% 8% 8% 7% 10%
Sigma 1796 871 925 421 425 539 411 1219 237 196 66 559 673 511 476 762 558 719 637 162 646 1150 483 931 381 782 911
100% 100% 100% 100% 100% 100% 100% 100% 100% 100% 100% 100% 100% 100% 100% 100% 100% 100% 100% 100% 100% 100% 100% 100% 100% 100% 100%
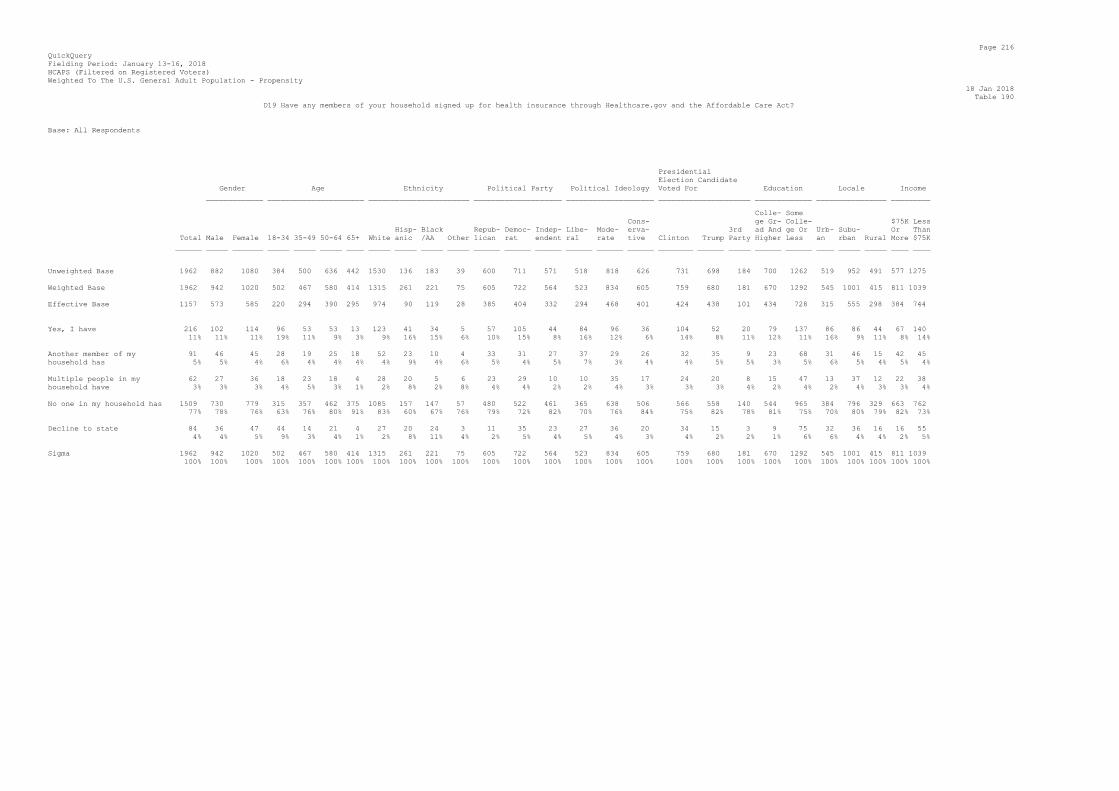
Page 216
QuickQuery
Fielding Period: January 13-16, 2018
HCAPS (Filtered on Registered Voters)
Weighted To The U.S. General Adult Population - Propensity
18 Jan 2018
Table 190
D19 Have any members of your household signed up for health insurance through Healthcare.gov and the Affordable Care Act?
Base: All Respondents
Presidential
Election Candidate
Gender Age Ethnicity Political Party Political Ideology Voted For Education Locale Income
_____________ ______________________ _______________________ ____________________ ____________________ _____________________ _____________ ________________ _________
Colle- Some
Cons- ge Gr- Colle- $75K Less
Hisp- Black Repub- Democ- Indep- Libe- Mode- erva- 3rd ad And ge Or Urb- Subu- Or Than
Total Male Female 18-34 35-49 50-64 65+ White anic /AA Other lican rat endent ral rate tive Clinton Trump Party Higher Less an rban Rural More $75K
______ _____ _______ _____ _____ _____ ____ _____ _____ _____ _____ ______ ______ ______ ______ ______ ______ ________ ______ _____ ______ ______ ____ _____ _____ ____ ____
Unweighted Base 1962 882 1080 384 500 636 442 1530 136 183 39 600 711 571 518 818 626 731 698 184 700 1262 519 952 491 577 1275
Weighted Base 1962 942 1020 502 467 580 414 1315 261 221 75 605 722 564 523 834 605 759 680 181 670 1292 545 1001 415 811 1039
Effective Base 1157 573 585 220 294 390 295 974 90 119 28 385 404 332 294 468 401 424 438 101 434 728 315 555 298 384 744
Yes, I have 216 102 114 96 53 53 13 123 41 34 5 57 105 44 84 96 36 104 52 20 79 137 86 86 44 67 140
11% 11% 11% 19% 11% 9% 3% 9% 16% 15% 6% 10% 15% 8% 16% 12% 6% 14% 8% 11% 12% 11% 16% 9% 11% 8% 14%
Another member of my 91 46 45 28 19 25 18 52 23 10 4 33 31 27 37 29 26 32 35 9 23 68 31 46 15 42 45
household has 5% 5% 4% 6% 4% 4% 4% 4% 9% 4% 6% 5% 4% 5% 7% 3% 4% 4% 5% 5% 3% 5% 6% 5% 4% 5% 4%
Multiple people in my 62 27 36 18 23 18 4 28 20 5 6 23 29 10 10 35 17 24 20 8 15 47 13 37 12 22 38
household have 3% 3% 3% 4% 5% 3% 1% 2% 8% 2% 8% 4% 4% 2% 2% 4% 3% 3% 3% 4% 2% 4% 2% 4% 3% 3% 4%
No one in my household has 1509 730 779 315 357 462 375 1085 157 147 57 480 522 461 365 638 506 566 558 140 544 965 384 796 329 663 762
77% 78% 76% 63% 76% 80% 91% 83% 60% 67% 76% 79% 72% 82% 70% 76% 84% 75% 82% 78% 81% 75% 70% 80% 79% 82% 73%
Decline to state 84 36 47 44 14 21 4 27 20 24 3 11 35 23 27 36 20 34 15 3 9 75 32 36 16 16 55
4% 4% 5% 9% 3% 4% 1% 2% 8% 11% 4% 2% 5% 4% 5% 4% 3% 4% 2% 2% 1% 6% 6% 4% 4% 2% 5%
Sigma 1962 942 1020 502 467 580 414 1315 261 221 75 605 722 564 523 834 605 759 680 181 670 1292 545 1001 415 811 1039
100% 100% 100% 100% 100% 100% 100% 100% 100% 100% 100% 100% 100% 100% 100% 100% 100% 100% 100% 100% 100% 100% 100% 100% 100% 100% 100%

Page 217
QuickQuery
Fielding Period: January 13-16, 2018
HCAPS (Filtered on Registered Voters)
Weighted To The U.S. General Adult Population - Propensity
18 Jan 2018
Table 191
Q2157 Which of the following income categories best describes your total 2017 household income before taxes?
Base: All Respondents
Presidential
Election Candidate
Gender Age Ethnicity Political Party Political Ideology Voted For Education Locale Income
_____________ ______________________ _______________________ ____________________ ____________________ _____________________ _____________ ________________ _________
Colle- Some
Cons- ge Gr- Colle- $75K Less
Hisp- Black Repub- Democ- Indep- Libe- Mode- erva- 3rd ad And ge Or Urb- Subu- Or Than
Total Male Female 18-34 35-49 50-64 65+ White anic /AA Other lican rat endent ral rate tive Clinton Trump Party Higher Less an rban Rural More $75K
______ _____ _______ _____ _____ _____ ____ _____ _____ _____ _____ ______ ______ ______ ______ ______ ______ ________ ______ _____ ______ ______ ____ _____ _____ ____ ____
Unweighted Base 1962 882 1080 384 500 636 442 1530 136 183 39 600 711 571 518 818 626 731 698 184 700 1262 519 952 491 577 1275
Weighted Base 1962 942 1020 502 467 580 414 1315 261 221 75 605 722 564 523 834 605 759 680 181 670 1292 545 1001 415 811 1039
Effective Base 1157 573 585 220 294 390 295 974 90 119 28 385 404 332 294 468 401 424 438 101 434 728 315 555 298 384 744
Less than $15,000 157 56 101 71 30 45 12 65 35 45 10 33 74 36 31 80 46 61 37 8 9 148 64 40 54 - 157
8% 6% 10% 14% 6% 8% 3% 5% 14% 20% 13% 5% 10% 6% 6% 10% 8% 8% 5% 4% 1% 11% 12% 4% 13% - 15%
$15,000 to $24,999 154 58 96 25 36 50 42 102 15 19 11 47 60 40 38 69 46 57 55 8 19 135 47 58 49 - 154
8% 6% 9% 5% 8% 9% 10% 8% 6% 9% 15% 8% 8% 7% 7% 8% 8% 7% 8% 4% 3% 10% 9% 6% 12% - 15%
$25,000 to $34,999 166 69 97 39 42 35 50 101 24 26 7 46 73 45 43 78 45 68 50 16 26 139 47 68 51 - 166
8% 7% 10% 8% 9% 6% 12% 8% 9% 12% 9% 8% 10% 8% 8% 9% 7% 9% 7% 9% 4% 11% 9% 7% 12% - 16%
$35,000 to $49,999 234 104 130 42 64 76 52 163 23 31 11 71 76 77 71 85 78 85 86 23 53 181 58 112 64 - 234
12% 11% 13% 8% 14% 13% 12% 12% 9% 14% 15% 12% 10% 14% 14% 10% 13% 11% 13% 13% 8% 14% 11% 11% 15% - 23%
$50,000 to $74,999 329 181 148 92 65 100 71 225 42 37 12 114 123 80 87 121 121 113 121 34 92 236 89 172 68 - 329
17% 19% 14% 18% 14% 17% 17% 17% 16% 17% 16% 19% 17% 14% 17% 14% 20% 15% 18% 19% 14% 18% 16% 17% 16% - 32%
$75,000 to $99,999 252 133 119 62 65 70 54 181 35 13 6 78 79 90 71 104 76 95 94 21 99 153 55 147 49 252 -
13% 14% 12% 12% 14% 12% 13% 14% 13% 6% 8% 13% 11% 16% 14% 13% 13% 13% 14% 12% 15% 12% 10% 15% 12% 31% -
$100,000 to $124,999 238 112 126 70 54 68 46 160 38 20 5 78 84 72 70 94 73 110 88 19 131 107 60 144 35 238 -
12% 12% 12% 14% 12% 12% 11% 12% 15% 9% 7% 13% 12% 13% 13% 11% 12% 14% 13% 10% 20% 8% 11% 14% 8% 29% -
$125,000 to $149,999 125 81 44 25 33 42 24 97 16 7 - 40 55 27 45 44 36 66 48 5 73 52 44 73 8 125 -
6% 9% 4% 5% 7% 7% 6% 7% 6% 3% - 7% 8% 5% 9% 5% 6% 9% 7% 3% 11% 4% 8% 7% 2% 15% -
$150,000 to $199,999 109 59 51 21 29 43 17 77 10 6 9 34 23 46 28 54 27 37 36 13 67 42 30 73 7 109 -
6% 6% 5% 4% 6% 7% 4% 6% 4% 3% 12% 6% 3% 8% 5% 6% 5% 5% 5% 7% 10% 3% 5% 7% 2% 13% -
$200,000 to $249,999 51 24 27 16 23 10 1 39 - 6 - 5 30 15 12 36 3 19 11 15 41 9 16 26 8 51 -
3% 3% 3% 3% 5% 2% * 3% - 3% - 1% 4% 3% 2% 4% * 2% 2% 8% 6% 1% 3% 3% 2% 6% -
$250,000 or more 36 23 13 11 8 12 5 21 9 2 2 16 11 7 13 9 14 13 12 5 21 15 10 23 4 36 -
2% 2% 1% 2% 2% 2% 1% 2% 3% 1% 3% 3% 2% 1% 3% 1% 2% 2% 2% 3% 3% 1% 2% 2% 1% 4% -
Decline to answer 112 43 69 28 17 27 39 84 16 8 2 42 34 29 12 61 40 35 42 14 39 74 27 67 18 - -
6% 5% 7% 6% 4% 5% 9% 6% 6% 3% 3% 7% 5% 5% 2% 7% 7% 5% 6% 8% 6% 6% 5% 7% 4% - -
Sigma 1962 942 1020 502 467 580 414 1315 261 221 75 605 722 564 523 834 605 759 680 181 670 1292 545 1001 415 811 1039
100% 100% 100% 100% 100% 100% 100% 100% 100% 100% 100% 100% 100% 100% 100% 100% 100% 100% 100% 100% 100% 100% 100% 100% 100% 100% 100%

Page 218
QuickQuery
Fielding Period: January 13-16, 2018
HCAPS (Filtered on Registered Voters)
Weighted To The U.S. General Adult Population - Propensity
18 Jan 2018
Table 192
CA1 Which carrier do you subscribe to for mobile calling and data services?
Base: All Respondents
Presidential
Election Candidate
Gender Age Ethnicity Political Party Political Ideology Voted For Education Locale Income
_____________ ______________________ _______________________ ____________________ ____________________ _____________________ _____________ ________________ _________
Colle- Some
Cons- ge Gr- Colle- $75K Less
Hisp- Black Repub- Democ- Indep- Libe- Mode- erva- 3rd ad And ge Or Urb- Subu- Or Than
Total Male Female 18-34 35-49 50-64 65+ White anic /AA Other lican rat endent ral rate tive Clinton Trump Party Higher Less an rban Rural More $75K
______ _____ _______ _____ _____ _____ ____ _____ _____ _____ _____ ______ ______ ______ ______ ______ ______ ________ ______ _____ ______ ______ ____ _____ _____ ____ ____
Unweighted Base 1962 882 1080 384 500 636 442 1530 136 183 39 600 711 571 518 818 626 731 698 184 700 1262 519 952 491 577 1275
Weighted Base 1962 942 1020 502 467 580 414 1315 261 221 75 605 722 564 523 834 605 759 680 181 670 1292 545 1001 415 811 1039
Effective Base 1157 573 585 220 294 390 295 974 90 119 28 385 404 332 294 468 401 424 438 101 434 728 315 555 298 384 744
Verizon 521 242 279 129 111 157 124 409 53 34 13 191 184 138 119 218 184 185 208 50 207 314 103 278 139 258 234
27% 26% 27% 26% 24% 27% 30% 31% 20% 16% 17% 32% 26% 24% 23% 26% 30% 24% 31% 28% 31% 24% 19% 28% 34% 32% 22%
AT&T 428 206 222 85 107 126 109 301 42 47 13 151 159 111 126 161 140 181 171 23 172 256 135 211 82 218 184
22% 22% 22% 17% 23% 22% 26% 23% 16% 21% 18% 25% 22% 20% 24% 19% 23% 24% 25% 13% 26% 20% 25% 21% 20% 27% 18%
T-Mobile 288 138 150 125 62 74 28 144 67 27 19 67 116 92 94 134 60 125 79 23 103 185 89 180 18 124 146
15% 15% 15% 25% 13% 13% 7% 11% 26% 12% 25% 11% 16% 16% 18% 16% 10% 16% 12% 13% 15% 14% 16% 18% 4% 15% 14%
Sprint 161 86 75 34 44 55 28 106 23 16 14 41 56 50 30 80 50 61 62 17 62 99 40 100 21 78 78
8% 9% 7% 7% 9% 9% 7% 8% 9% 7% 19% 7% 8% 9% 6% 10% 8% 8% 9% 9% 9% 8% 7% 10% 5% 10% 8%
MetroPCS 98 49 49 36 30 24 7 41 23 26 - 13 53 29 34 41 23 46 16 10 16 82 51 37 9 16 79
5% 5% 5% 7% 7% 4% 2% 3% 9% 12% - 2% 7% 5% 6% 5% 4% 6% 2% 6% 2% 6% 9% 4% 2% 2% 8%
TracFone 78 41 37 16 13 29 20 62 10 6 - 29 25 21 20 40 18 27 25 4 13 64 17 40 20 17 55
4% 4% 4% 3% 3% 5% 5% 5% 4% 2% - 5% 3% 4% 4% 5% 3% 4% 4% 2% 2% 5% 3% 4% 5% 2% 5%
Straight Talk 59 23 36 16 19 18 6 44 4 9 2 17 19 17 13 31 15 16 17 8 11 48 13 19 27 11 44
3% 2% 4% 3% 4% 3% 2% 3% 2% 4% 2% 3% 3% 3% 2% 4% 2% 2% 2% 5% 2% 4% 2% 2% 6% 1% 4%
Consumer Cellular 48 32 16 6 6 8 28 34 5 5 2 15 20 12 19 18 11 23 13 7 20 28 9 22 17 21 25
2% 3% 2% 1% 1% 1% 7% 3% 2% 2% 2% 2% 3% 2% 4% 2% 2% 3% 2% 4% 3% 2% 2% 2% 4% 3% 2%
Cricket 46 18 28 11 20 9 5 24 8 10 3 12 8 22 9 24 14 12 13 13 13 34 12 22 12 12 33
2% 2% 3% 2% 4% 2% 1% 2% 3% 4% 4% 2% 1% 4% 2% 3% 2% 2% 2% 7% 2% 3% 2% 2% 3% 1% 3%
Boost Mobile 33 11 22 6 16 8 4 21 1 10 2 12 13 7 5 14 14 13 12 1 3 30 15 10 8 8 22
2% 1% 2% 1% 3% 1% 1% 2% * 5% 2% 2% 2% 1% 1% 2% 2% 2% 2% * * 2% 3% 1% 2% 1% 2%
US Cellular 32 16 16 4 10 8 8 31 - * - 11 8 10 5 11 15 11 11 2 8 23 1 15 16 12 13
2% 2% 2% 1% 2% 1% 2% 2% - * - 2% 1% 2% 1% 1% 3% 1% 2% 1% 1% 2% * 2% 4% 1% 1%
Virgin Mobile 28 11 17 2 4 12 10 16 - 10 1 7 11 9 12 8 8 9 7 2 7 21 16 9 2 8 19
1% 1% 2% * 1% 2% 2% 1% - 4% 2% 1% 2% 2% 2% 1% 1% 1% 1% 1% 1% 2% 3% 1% 1% 1% 2%
Net10 10 8 2 1 1 6 2 5 5 - - 4 3 4 2 5 3 3 5 1 5 5 3 7 1 2 6
1% 1% * * * 1% * * 2% - - 1% * 1% * 1% * * 1% * 1% * 1% 1% * * 1%

Page 219
QuickQuery
Fielding Period: January 13-16, 2018
HCAPS (Filtered on Registered Voters)
Weighted To The U.S. General Adult Population - Propensity
18 Jan 2018
Table 192
CA1 Which carrier do you subscribe to for mobile calling and data services?
Base: All Respondents
Presidential
Election Candidate
Gender Age Ethnicity Political Party Political Ideology Voted For Education Locale Income
_____________ ______________________ _______________________ ____________________ ____________________ _____________________ _____________ ________________ _________
Colle- Some
Cons- ge Gr- Colle- $75K Less
Hisp- Black Repub- Democ- Indep- Libe- Mode- erva- 3rd ad And ge Or Urb- Subu- Or Than
Total Male Female 18-34 35-49 50-64 65+ White anic /AA Other lican rat endent ral rate tive Clinton Trump Party Higher Less an rban Rural More $75K
______ _____ _______ _____ _____ _____ ____ _____ _____ _____ _____ ______ ______ ______ ______ ______ ______ ________ ______ _____ ______ ______ ____ _____ _____ ____ ____
Weighted Base 1962 942 1020 502 467 580 414 1315 261 221 75 605 722 564 523 834 605 759 680 181 670 1292 545 1001 415 811 1039
Walmart FamilyMobile 5 2 4 5 - * - 1 - 5 - 1 2 - - 5 * 2 1 2 - 5 2 2 1 - 5
* * * 1% - * - * - 2% - * * - - 1% * * * 1% - * * * * - 1%
Other 62 27 35 15 16 18 12 33 10 11 1 10 22 26 16 23 23 21 14 11 15 47 18 25 19 19 42
3% 3% 3% 3% 3% 3% 3% 2% 4% 5% 1% 2% 3% 5% 3% 3% 4% 3% 2% 6% 2% 4% 3% 2% 5% 2% 4%
None of the above 67 33 34 8 7 28 23 44 10 5 6 23 23 16 19 22 27 23 28 5 17 50 21 23 23 8 52
3% 3% 3% 2% 2% 5% 6% 3% 4% 2% 8% 4% 3% 3% 4% 3% 4% 3% 4% 3% 3% 4% 4% 2% 5% 1% 5%
Sigma 1962 942 1020 502 467 580 414 1315 261 221 75 605 722 564 523 834 605 759 680 181 670 1292 545 1001 415 811 1039
100% 100% 100% 100% 100% 100% 100% 100% 100% 100% 100% 100% 100% 100% 100% 100% 100% 100% 100% 100% 100% 100% 100% 100% 100% 100% 100%

Page 220
QuickQuery
Fielding Period: January 13-16, 2018
HCAPS (Filtered on Registered Voters)
Weighted To The U.S. General Adult Population - Propensity
18 Jan 2018
Table 193
CA2 Which internet service provider do you subscribe to for internet connectivity in your home?
Base: All Respondents
Presidential
Election Candidate
Gender Age Ethnicity Political Party Political Ideology Voted For Education Locale Income
_____________ ______________________ _______________________ ____________________ ____________________ _____________________ _____________ ________________ _________
Colle- Some
Cons- ge Gr- Colle- $75K Less
Hisp- Black Repub- Democ- Indep- Libe- Mode- erva- 3rd ad And ge Or Urb- Subu- Or Than
Total Male Female 18-34 35-49 50-64 65+ White anic /AA Other lican rat endent ral rate tive Clinton Trump Party Higher Less an rban Rural More $75K
______ _____ _______ _____ _____ _____ ____ _____ _____ _____ _____ ______ ______ ______ ______ ______ ______ ________ ______ _____ ______ ______ ____ _____ _____ ____ ____
Unweighted Base 1962 882 1080 384 500 636 442 1530 136 183 39 600 711 571 518 818 626 731 698 184 700 1262 519 952 491 577 1275
Weighted Base 1962 942 1020 502 467 580 414 1315 261 221 75 605 722 564 523 834 605 759 680 181 670 1292 545 1001 415 811 1039
Effective Base 1157 573 585 220 294 390 295 974 90 119 28 385 404 332 294 468 401 424 438 101 434 728 315 555 298 384 744
Comcast 387 174 213 97 85 132 72 288 29 44 9 114 144 119 112 151 124 161 132 39 133 254 99 233 55 183 178
20% 19% 21% 19% 18% 23% 17% 22% 11% 20% 13% 19% 20% 21% 21% 18% 21% 21% 19% 22% 20% 20% 18% 23% 13% 23% 17%
AT&T 381 190 191 103 70 116 92 241 70 42 13 120 149 105 105 155 122 161 133 32 157 224 132 215 34 188 177
19% 20% 19% 20% 15% 20% 22% 18% 27% 19% 17% 20% 21% 19% 20% 19% 20% 21% 20% 18% 23% 17% 24% 21% 8% 23% 17%
Time Warner Cable 274 122 152 81 64 85 44 164 52 21 18 75 126 60 70 142 62 98 80 24 75 199 92 139 44 93 167
14% 13% 15% 16% 14% 15% 11% 12% 20% 9% 24% 12% 17% 11% 13% 17% 10% 13% 12% 13% 11% 15% 17% 14% 10% 11% 16%
Verizon 174 100 75 55 38 45 36 112 23 30 2 58 65 42 35 80 59 69 64 14 76 98 50 93 31 92 72
9% 11% 7% 11% 8% 8% 9% 9% 9% 14% 3% 10% 9% 8% 7% 10% 10% 9% 9% 8% 11% 8% 9% 9% 8% 11% 7%
Charter 106 50 56 32 23 25 25 76 8 10 3 26 39 37 44 37 24 48 32 10 45 61 25 53 27 36 62
5% 5% 5% 6% 5% 4% 6% 6% 3% 5% 3% 4% 5% 7% 9% 4% 4% 6% 5% 6% 7% 5% 5% 5% 7% 4% 6%
CenturyLink 94 50 44 15 33 29 16 65 21 5 - 37 24 25 26 44 23 30 34 6 26 68 30 35 29 32 58
5% 5% 4% 3% 7% 5% 4% 5% 8% 2% - 6% 3% 5% 5% 5% 4% 4% 5% 3% 4% 5% 5% 3% 7% 4% 6%
Frontier 63 26 37 12 6 22 23 41 13 5 4 22 20 21 19 21 23 33 23 1 27 37 16 34 13 28 32
3% 3% 4% 2% 1% 4% 6% 3% 5% 2% 5% 4% 3% 4% 4% 3% 4% 4% 3% * 4% 3% 3% 3% 3% 4% 3%
Cox Cable Communications 62 35 27 8 27 17 10 36 5 8 5 21 17 23 11 32 19 13 28 8 18 44 25 30 7 25 34
3% 4% 3% 2% 6% 3% 3% 3% 2% 4% 6% 4% 2% 4% 2% 4% 3% 2% 4% 5% 3% 3% 5% 3% 2% 3% 3%
Bright House 42 15 27 10 11 9 12 27 9 3 1 9 16 17 10 26 6 23 11 4 13 29 11 29 2 17 20
2% 2% 3% 2% 2% 2% 3% 2% 3% 2% 1% 1% 2% 3% 2% 3% 1% 3% 2% 2% 2% 2% 2% 3% * 2% 2%
Cablevision 37 24 14 8 12 7 10 26 3 7 - 9 13 14 11 19 8 12 14 8 15 23 10 26 1 16 20
2% 3% 1% 2% 3% 1% 3% 2% 1% 3% - 1% 2% 3% 2% 2% 1% 2% 2% 4% 2% 2% 2% 3% * 2% 2%
Suddenlink 21 8 12 8 5 7 2 10 4 7 - 10 8 2 11 3 7 12 7 1 8 12 7 7 6 10 8
1% 1% 1% 2% 1% 1% * 1% 2% 3% - 2% 1% * 2% * 1% 2% 1% 1% 1% 1% 1% 1% 1% 1% 1%
Windstream 19 5 14 2 13 3 1 11 - 5 - 4 8 5 7 9 3 7 8 - 1 18 1 5 12 3 14
1% 1% 1% * 3% 1% * 1% - 2% - 1% 1% 1% 1% 1% 1% 1% 1% - * 1% * 1% 3% * 1%
Mediacom 16 4 13 5 1 4 6 12 - 4 - 3 9 2 3 4 9 8 5 - 3 13 6 4 7 2 12
1% * 1% 1% * 1% 1% 1% - 2% - * 1% * 1% * 1% 1% 1% - 1% 1% 1% * 2% * 1%

Page 221
QuickQuery
Fielding Period: January 13-16, 2018
HCAPS (Filtered on Registered Voters)
Weighted To The U.S. General Adult Population - Propensity
18 Jan 2018
Table 193
CA2 Which internet service provider do you subscribe to for internet connectivity in your home?
Base: All Respondents
Presidential
Election Candidate
Gender Age Ethnicity Political Party Political Ideology Voted For Education Locale Income
_____________ ______________________ _______________________ ____________________ ____________________ _____________________ _____________ ________________ _________
Colle- Some
Cons- ge Gr- Colle- $75K Less
Hisp- Black Repub- Democ- Indep- Libe- Mode- erva- 3rd ad And ge Or Urb- Subu- Or Than
Total Male Female 18-34 35-49 50-64 65+ White anic /AA Other lican rat endent ral rate tive Clinton Trump Party Higher Less an rban Rural More $75K
______ _____ _______ _____ _____ _____ ____ _____ _____ _____ _____ ______ ______ ______ ______ ______ ______ ________ ______ _____ ______ ______ ____ _____ _____ ____ ____
Weighted Base 1962 942 1020 502 467 580 414 1315 261 221 75 605 722 564 523 834 605 759 680 181 670 1292 545 1001 415 811 1039
Cincinnati Bell 4 2 2 2 * 1 1 4 - - - 1 1 2 * 2 2 1 1 2 - 4 - 3 1 - 4
* * * * * * * * - - - * * * * * * * * 1% - * - * * - *
Other 222 115 107 44 59 58 61 166 19 15 17 79 64 70 46 84 92 68 88 24 58 164 22 77 123 75 133
11% 12% 10% 9% 13% 10% 15% 13% 7% 7% 23% 13% 9% 12% 9% 10% 15% 9% 13% 13% 9% 13% 4% 8% 30% 9% 13%
None of the above 60 22 38 19 20 18 3 36 5 12 4 18 18 19 11 26 22 14 20 8 15 45 19 18 22 8 48
3% 2% 4% 4% 4% 3% 1% 3% 2% 5% 5% 3% 3% 3% 2% 3% 4% 2% 3% 4% 2% 3% 4% 2% 5% 1% 5%
Sigma 1962 942 1020 502 467 580 414 1315 261 221 75 605 722 564 523 834 605 759 680 181 670 1292 545 1001 415 811 1039
100% 100% 100% 100% 100% 100% 100% 100% 100% 100% 100% 100% 100% 100% 100% 100% 100% 100% 100% 100% 100% 100% 100% 100% 100% 100% 100%
Related Documents