TOPIC 4 PERFORMANCE MANAGEMENT

Welcome message from author
This document is posted to help you gain knowledge. Please leave a comment to let me know what you think about it! Share it to your friends and learn new things together.
Transcript

TOPIC 4
PERFORMANCE MANAGEMENT

Lecture outline:1. Understand what is performance
management2. Understand limitation of traditional
PMS3. Explain the BSC4. Understand performance evaluation
for service organisations and non-profit organisation
5. Explain reward systems6. Understand critical success factors
and key performance indicator

What is Performance Measurement and Management?
► Performance measurement - A process of assessing progress toward achieving predetermined goals.
► Performance management - The use of performance measurement information to create positive change in organisational culture, systems and processes. helping to set agreed-upon performance goals allocating and prioritizing resources informing managers to either confirm or change
current policy or program directions to meet those goals
sharing results of performance in pursuing those goals.

The Building Blocks of Performance Management
Source: Fitzgerald & Moon, 1996
STRATEGY
DIMENSIONSFinancial
OrFinancial and non-financial
TARGETSOwnership
AchievabilityEquity
REWARDSClarity
MotivationControllability

Performance Measurement Systems
► Measurements are not in tune with strategic objectives.
► Measurements are not customer driven. ► Financial measures are too late for any
corrective action and encourage a short term focus.
► Many key non-financial performance indicators are ignored.
► Measures are often used for punishment rather than for learning.
What is wrong with the present measurement systems?
Financial vs Non-financial Measures
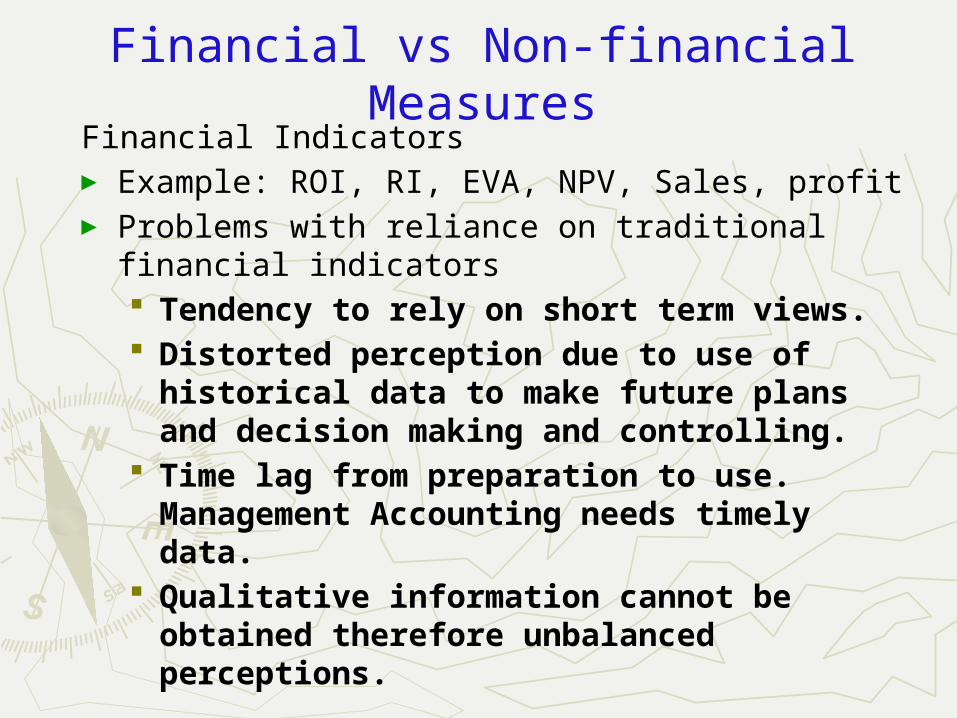
Financial Indicators ► Example: ROI, RI, EVA, NPV, Sales, profit► Problems with reliance on traditional financial
indicators Tendency to rely on short term views. Distorted perception due to use of
historical data to make future plans and decision making and controlling.
Time lag from preparation to use. Management Accounting needs timely data.
Qualitative information cannot be obtained therefore unbalanced perceptions.

Financial vs Non-financial Measures
Non-financial indicators► Example: customer satisfaction, on-time
delivery, quality.► Benefits of non-financial indicators:
Able to view firms as having many dimensions needed for survival.
Able to assess potentials. More accurate to measure operations of an
organization. Less reliance on proxy financial measures which are less accurate

The Balanced Scorecard
► Designed by Kaplan and Norton ► Use financial and non-financial measurements
within 4 perspectives-Financial, Customers, Internal Business Process, Learning and Growth. How do customers see us? (customer perspective) What must we excel at? (internal business process
perspective) Can we continue to improve and create value? (learning
and growth perspective) How do we look to shareholders? (financial perspective)
► Each perspectives has two to three measurements.
► Link strategy with overall performance measures.

The Balanced Scorecard► To implement the BSC the major objectives for each of the 4
perspectives should be articulated and these objectives should be translated into specific performance measures.
► A critical assumption of BSC is that each performance measure is part of a cause-and-effect relationship.
Each measurements relate to each others e.g. profit (financial)-customer turnover (customer)- On time deliveries (internal business process)- training hours (learning and growth)
► The BSC consists of two types of performance measures:
Lagging measures Leading measures Example of lag measure is increase in turnover, while order
execution time would be lead measure for it.

The Balanced Scorecard► Strategy Map – guides the organization to
achieve its objectives and translates strategy into action.
► The description of strategy maps: All the information is contained on one page; this
enables relatively easy strategic communication.
There are four perspectives: Financial; Customer; Internal; Learning and Growth.
The cause-and-effect relationships are described by connecting arrows. The argument has it that succeeding against objectives from the learning and growth perspective (the foundation of the strategy map) has a causal effect on success of the IBP perspective, which in turn creates success from the CP and finally to the FP.

Figure 1: Strategy Map

© 2000 Colin Drury
Figure 2 The Balanced Scorecard (Source: Kaplan and Norton, 1996b)

Eg: internal business process (IBP)
objective measures targetAchieve fast ground turnaround
Time at gateOn-time departure
30 minutes90%

The Balanced Scorecard
►The BSC Management System (see Figure 2) is a scorecard of measures, targets and initiatives that supports the Strategy Map.
►The scorecard shows the measures that is used by an organization to track its progress towards achieving its strategic objectives.

Four Perspectives in Balanced Scorecard
►Financial perspectives-ROI, EPS, Profit/Sales, Debt/Equity, Sales/Asset
►Customer perspectives- No. customer complaints, Market share, Product returns/
Sales, No. new customers
►Internal Business process- On time deliveries, Quality costs, Setup time, standard cost
variances
►Learning and growth- Suggestions per employees, Employees turnover, Hours of
training

Advantages of Balanced Scorecard
►Link long term strategy with short term objectives and measures.
►Encourage continual improvement.►Balanced view between needs of
financial and non-financial objectives.
►Modifiable for different organisations.
►Facilitate communications of company’s strategy to lower level subordinates.

Measuring Customer Performance
►Customer profitability analysis- the reporting and analysis of revenues earned from customers and the costs incurred to earn those revenues.
- attention given to customers who make large contributions to the operating income.

Performance Evaluation for Service Organizations
► Service companies differ from manufacturing companies in several ways:
Outputs for most services are intangible. Outputs for services are heterogeneous. The production and consumption of many
services are simultaneous. Services are perishable.

►As in manufacturing companies, managers of service companies now require accurate, timely information to improve the quality, timeliness and efficiency of their activities, and to make decisions about their individual products, services and customers.
►Fitzgerald et al (1993) proposes the Results and Determinants Framework as a PMS for service companies.
Performance Evaluation for Service Organizations

Performance Evaluation for Service Organizations – Results & Determinants
F/workPerformance Dimensions Types of Measures
Competitiveness Relative market share and position
Sales growth, Measures re customer base
Financial Performance Profitability, Liquidity, Capital Structure,
Market Ratios, etc.
Quality of Service
Reliability, Responsiveness, Appearance, Cleanliness, Comfort, Friendliness, Communication, Courtesy, Competence, Access, Availability, Security etc.
Flexibility Volume Flexibility, Specification and Speed of Delivery Flexibility
Resource Utilisation Productivity, Efficiency, etc.
Innovation Performance of the innovation process, Performance of individual innovations, etc.

Performance Evaluation for NPO ► NPO are different from profit organization.
Reason for existence – NPO no profit motive.
► The best performance indicators for NPO are generally not in the financial terms. Thus, it is more difficult to measure performance of NPO compared to the profit companies.
► Kaplan & Norton (2001) suggest that NPO can use BSC to measure their performances.
► Refer Figure 5.4 (Module, p 103).

►Why would managers do not provide good service? There are three reasons:
They may have low ability. They may prefer not to work hard. They may prefer to spend company
resources (privilege given to them).
The purpose of reward is to motivate superior performance among managers and employees to achieve organization’s goals.
Reward Systems: Incentives for managers

Reward Systems► Frequently managerial rewards include
incentives tied to performance.
► The objective of managerial rewards is to encourage goal congruence, so that managers will act in the best interests of the company. When controls can motivate behavior that is
organizationally desirable, they are described as encouraging goal congruence.
► Managerial rewards can be: Monetary and non-monetary Examples - salary increases, bonuses based on
reported income, stock options, and recognition

Performance Measurement & Reward Systems
► How to tie reward to performance effectively (Atkinson et al, 2007, p369) by:
1. Ensuring that employees understand how their jobs contribute to achieve organizational goals;
2. Ensuring employees understand and trust the reward system.
3. Ensuring employees believe that it measures what they can control.

Performance Measurement & Reward Systems
► Employee must perceives the reward system as fair and predictable.
► If the reward system does not measure performance that is under the managers control,
► they may ignore the measured performance because it is independent of their efforts
► and the reward system will be ineffective.

Performance Measurement & Reward Systems
2. The designers of the PMS must make a careful choice about whether it measures employees’ inputs or outputs.
► In general, the greatest alignment between employees’ and the organisation’s interests is provided when the PMS monitors and rewards employee outputs that contribute to the organisation’s success.
► However, sometimes outputs are beyond the employee’s control.
► When outcome measurement is problematic, organisations often choose to monitor and reward inputs i.e. employee learning, demonstrated skill and time worked.

3. The elements of performance that the PMS monitors and rewards should reflect the organisation’s critical success factors.
► This to ensure that the PMS is relevant and motivates intended performance that matters to the organisation’s success.
► PMS must consider all facets of performance so that employees do not sacrifice performance on an unmeasured element for performance for performance on an element that the reward system measures.

Performance Measurement & Reward Systems
4.The reward system must set clear standards for performance that employees accept. Standards help employees assess whether
their skills and efforts create results that the PMS captures and reports as outcomes.
5.The measurement system must be calibrated so that it can accurately assess performance. PMS establishes clear relationship
between performance and outcome.
Performance Measurement & Reward Systems
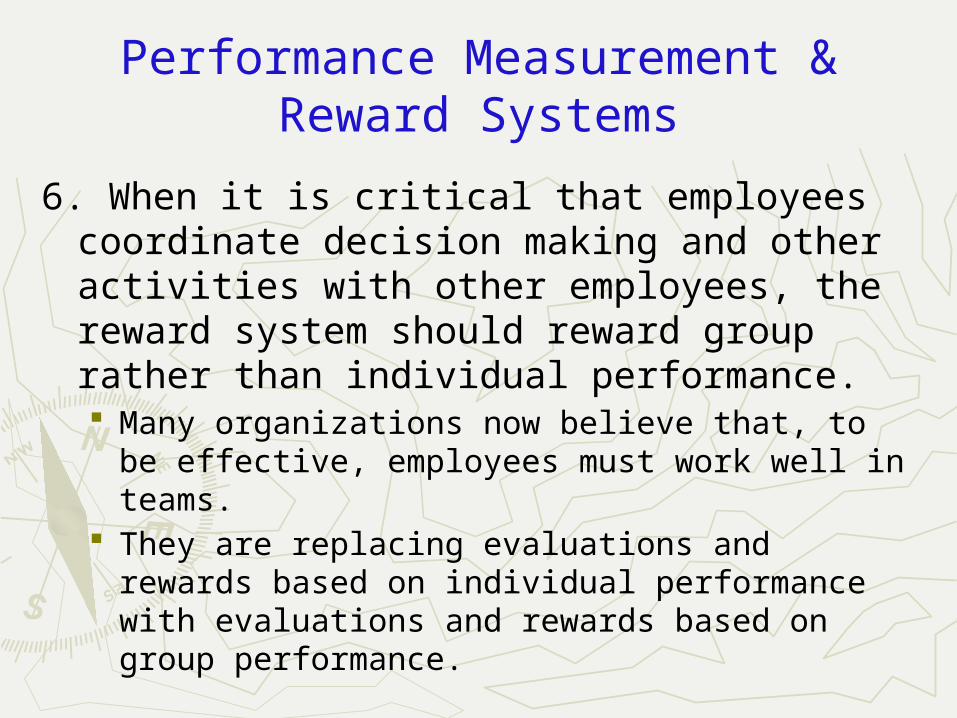
6. When it is critical that employees coordinate decision making and other activities with other employees, the reward system should reward group rather than individual performance. Many organizations now believe that, to be
effective, employees must work well in teams. They are replacing evaluations and rewards
based on individual performance with evaluations and rewards based on group performance.

Critical Success Factors
Definition ►A key area where satisfactory
performance is required for the organization to achieve its goals.
►A means of identifying the tasks and requirements needed for success.
►At the lowest level, CSF become concrete requirements.
►A means to prioritize requirements.

Types of Critical Success Factors – CSF
There are four basic types of critical success factors CSF’s1.Industry critical success factors (CSF’s) resulting from specific industry characteristics;2.Strategy critical success factors (CSF’s) resulting from the chosen competitive strategy of the business;3.Environmental critical success factors (CSF’s) resulting from economic or technological changes; and4.Temporal critical success factors (CSF’s) resulting from internal organizational needs and changes.
Things that are measured get done more often than things that are not measured.

Critical Success Factors
►CSF for a business organization will be:i) Serviceii) Qualityiii) Costiv) Customer

Critical Success Factors-Service
►The products’ tangible and intangible features promised to the customer; service is also known as value in use. How customers are treated before, during and after purchase decisions.

Critical Success Factors- Cost
►Resources used to provide the product or service. The aim is to produce with the least resources hence increase competitiveness.

Critical Success Factors- Quality
►The difference between the promised and the realized level of service; conformance to specifications.
►Example: Proton and Mercedes manufacture cars for different market segments and different product specifications. As long as both adhered to their specified standards, they achieve quality in their market segment.

Critical Success Factors- Customer
►Taking the value chain concept into perspective, Customers will be the most important determinant of a company’s success.
►“Customer is always right”.

Statistical research into CSF’s on organizations has shown there to be seven key areas. These CSF’s are:1.Training and education2.Quality data and reporting3.Management commitment, customer satisfaction4.Staff Orientation5.Role of the quality department6.Communication to improve quality, and7.Continuous improvement
Examples of Critical Success factors

According to a 2000 Standish Group Report, the top success factors for projects were as follows. The list is in decreasing order of percentage factors responsible for success.% – Success Factors•18% Executive support•16% User involvement•14% Experienced project manager•12% Clear business objectives•10% Minimized scope•8% Standard software infrastructure•6% Firm basic requirements•6% Formal methodology•5% Reliable estimates•5% Other criteria
Examples of Critical Success factors

Key Performance Indicators
►Performance measures used to assess an organization's performance on its critical success factors.
►Measurements can be non-financials and subjective by nature.

CSF KPIService Time to respond to customer orders,
time taken to resolve customer complaints.
Quality Number of complaints, customer satisfaction surveys, percent on-time delivery,returns, warranty claims.
Cost Ratio of costs to revenues, cost of particular activity, customer profitability, sales per hour.
Customer
No. of customers, no. of new customers, no. of lost customers, market share.

End of Topic 4“what gets measured gets done”
(Kaplan & Norton, 1996)
Related Documents