GWP2019IntegratedResourcePlan 1|Page

Welcome message from author
This document is posted to help you gain knowledge. Please leave a comment to let me know what you think about it! Share it to your friends and learn new things together.
Transcript
�GWP�2019�Integrated�Resource�Plan��
� �1�|�P a g e �
� �
�GWP�2019�Integrated�Resource�Plan��
� �2�|�P a g e �
Table�of�Contents�Acronyms�and�Abbreviations�..................................................................................................................................................�8�
1� Summary�.........................................................................................................................................................................�9�
1.1� Recommended�Portfolio�2019�–�2030�...................................................................................................................�9�
1.2� GWP�Electricity�Supply�Background�......................................................................................................................�9�
1.3� Clean�Energy�RFP�...................................................................................................................................................�9�
1.4� Portfolio�Evaluation�and�Recommended�Power�Plan�.........................................................................................�10�
1.5� Process�for�Updating�the�Integrated�Resource�Plan�...........................................................................................�14�
2� Background�...................................................................................................................................................................�15�
2.1� About�Glendale�Water�&�Power�..........................................................................................................................�15�
2.2� Existing�Assets,�Transmission�and�GWP’s�Current�Situation�...............................................................................�16�
2.2.1� Local�Generation�.............................................................................................................................................�16�
2.2.2� Purchased�Power�Contracts�............................................................................................................................�17�
2.2.3� Renewable�Resources�.....................................................................................................................................�18�
2.2.4� Transmission�Assets�........................................................................................................................................�20�
2.3� SB�350�and�SB�100�Requirements�........................................................................................................................�23�
2.4� Plan�and�Analysis�Timeline�..................................................................................................................................�23�
3� Analysis�of�Load�and�Resource�Needs�...........................................................................................................................�24�
3.1� Demand�Forecast�Summary�................................................................................................................................�24�
3.2� Peak�Demand�Forecast�........................................................................................................................................�27�
3.3� Transportation�Electrification�..............................................................................................................................�28�
3.4� Reliability�Requirements�......................................................................................................................................�29�
3.5� Ancillary�Requirements�.......................................................................................................................................�32�
4� Clean�Energy�RFP�Process�.............................................................................................................................................�33�
4.1� Background�..........................................................................................................................................................�33�
4.2� Process�Objectives�...............................................................................................................................................�33�
4.3� Resource�Selection�and�Candidate�Portfolio�Composition�..................................................................................�34�
5� Proposed�Power�Plan�....................................................................................................................................................�35�
5.1� Power�Planning�Goals�..........................................................................................................................................�35�
5.2� Recommended�Power�Plan�and�Resource�Portfolio�...........................................................................................�36�
5.3� Reliability�Assessment�.........................................................................................................................................�39�
5.4� Lifetime�Present�Value�Costs�...............................................................................................................................�42�
5.5� Cost�of�Carbon�.....................................................................................................................................................�44�
5.6� Effects�on�Load�and�Energy�Requirements�..........................................................................................................�44�
�GWP�2019�Integrated�Resource�Plan��
� �3�|�P a g e �
5.7� Hourly�Dispatch�...................................................................................................................................................�45�
5.7.1� Battery�Dispatch�..............................................................................................................................................�47�
5.7.2� ICE�Dispatch�.....................................................................................................................................................�47�
5.8� Benefits�Over�Original�262�MW�Grayson�Repower�.............................................................................................�48�
5.9� Renewable�and�Thermal�Resources�in�Proposed�Portfolio�.................................................................................�48�
6� Modeling�Process�and�Other�Considered�Power�Plans�.................................................................................................�49�
6.1� PowerSimm�Modeling�Process�............................................................................................................................�49�
6.1.1� Overview�of�PowerSimm�Modeling�................................................................................................................�49�
6.2� Other�Investigated�Portfolios�..............................................................................................................................�50�
6.2.1� Comparison�of�Alternative�Portfolios�..............................................................................................................�50�
6.2.2� Reliability,�Renewable�Content,�Cost�..............................................................................................................�52�
6.2.3� Selection�of�the�Proposed�Power�Plan�............................................................................................................�57�
7� Greenhouse�Gas�Emissions�...........................................................................................................................................�58�
7.1� Renewable�Portfolio�Content�..............................................................................................................................�58�
7.1.1� Renewable�Curtailment�...................................................................................................................................�61�
7.2� Portfolio�Emissions�..............................................................................................................................................�61�
7.3� Biogas�Generation�...............................................................................................................................................�64�
8� Transmission�and�Distribution�Systems�........................................................................................................................�65�
8.1� Current�Transmission�System�and�Contracted�Capacity�.....................................................................................�65�
8.2� Need�for�More�Transmission�Capacity�................................................................................................................�66�
9� DER,�DSM,�and�EE�Resources�........................................................................................................................................�67�
9.1� Contributions�to�Peak�Demand�...........................................................................................................................�67�
9.2� Demand�Response�Resources�in�the�Power�Plan�................................................................................................�68�
9.3� Energy�Efficiency�Resources�in�the�Power�Plan�...................................................................................................�68�
10� Local�Programs�and�Community�Effects�from�Proposed�Power�Plan�..................................................................�68�
10.1� Energy�Efficiency�Programs�.................................................................................................................................�68�
10.2� Demand�Response�Programs�...............................................................................................................................�73�
10.3� Current�Low�Income�Programs�............................................................................................................................�74�
10.4� Community�Solar�.................................................................................................................................................�75�
10.5� New�Programs�for�Disadvantaged�and�Low�Income�Customers�.........................................................................�75�
10.6� Transportation�Electrification�in�Disadvantaged�Communities�...........................................................................�75�
10.7� Localized�Air�Pollution�and�Disadvantaged�Communities�...................................................................................�79�
11� Rates�....................................................................................................................................................................�80�
11.1� Cost�of�Service�and�Rate�Design�Process�Overview�.............................................................................................�81�
11.2� Detailed�Explanation�of�Rate�Design�Steps�..........................................................................................................�82�
�GWP�2019�Integrated�Resource�Plan��
� �4�|�P a g e �
12� Community�Outreach�..........................................................................................................................................�85�
12.1� Context�and�Introduction�to�Community�Outreach�Process�................................................................................�85�
13� The�Road�to�100%�Clean�Energy�..........................................................................................................................�86�
14� Appendices�..........................................................................................................................................................�87�
14.1� Appendix�A�–�CEC�Standardized�Tables�...............................................................................................................�87�
14.1.1� Capacity�Resource�Accounting�Table�(CRAT)�..............................................................................................�88�
14.1.2� Energy�Balance�Table�(EBT)�.........................................................................................................................�88�
14.1.3� GHG�Emissions�Accounting�Table�(GEAT)�...................................................................................................�89�
14.1.4� Resource�Procurement�Table�(RPT)�............................................................................................................�89�
14.2� Appendix�B�–�PowerSimm�Modeling�Platform�....................................................................................................�90�
14.3� Appendix�C�–�Key�Modeling�Assumptions�...........................................................................................................�94�
14.3.1� Assorted�Modeling�Details�..........................................................................................................................�99�
14.4� Appendix�D�–�Community�Meetings�Summary�Report�.......................................................................................�99�
14.4.1� Workshop�details�........................................................................................................................................�99�
14.4.2� Workshop�outcomes�.................................................................................................................................�101�
14.5� Appendix�E�–�Energy�Risk�Management�Policy�..................................................................................................�112�
14.6� Appendix�F�–�Renewables�Portfolio�Standard�Procurement�Plan�.....................................................................�112�
�
� �
�GWP�2019�Integrated�Resource�Plan��
� �5�|�P a g e �
List�of�Figures�Figure�1:�Exceeding�Renewable�Goals�..................................................................................................................................�11�Figure�2:�Local�Capacity�through�2030�..................................................................................................................................�12�Figure�3:�Annual�Greenhouse�Gas�Emissions�........................................................................................................................�13�Figure�4:�Present�Value�Cost�Comparison�.............................................................................................................................�14�Figure�5:�Geographic�Transmission�Schematic�.....................................................................................................................�20�Figure�6:�Key�Load�Drivers�.....................................................................................................................................................�25�Figure�7:�Energy�Forecast�......................................................................................................................................................�26�Figure�8:�2030�Energy�Demand�Forecast�..............................................................................................................................�26�Figure�9:�Naïve�vs�Optimized�EV�Charging�Profiles�...............................................................................................................�29�Figure�10:�Griffith�Park�Fire�2018�..........................................................................................................................................�31�Figure�11:�Pacific�DC�Intertie�N�S�TCC�Outage�May�October�Yearly�(1997�2017)�................................................................�32�Figure�12:�Ancillary�Requirements�........................................................................................................................................�33�Figure�13:�Contracted�Capacity�through�2038�......................................................................................................................�39�Figure�14:�Local�Capacity�through�2038�................................................................................................................................�41�Figure�15:�Loss�of�Load�Hours�for�Proposed�Power�Plan�......................................................................................................�42�Figure�16:�Hourly�Dispatch�in�the�Spring�and�Summer�of�2035�............................................................................................�46�Figure�17:�Hourly�Dispatch�in�the�Summer�of�2036�when�the�Pacific�DC�Intertie�is�out�......................................................�47�Figure�18:�Portfolio�Capacity�Factors�....................................................................................................................................�49�Figure�19:�LOLH�of�Portfolio�G�and�Portfolio�F�......................................................................................................................�52�Figure�20:�Portfolio�G���100%�Clean�Transmission�Utilization�..............................................................................................�54�Figure�21:�Hourly�Dispatch�of�100%�Clean�in�August�of�2035�(Top)�and�August�of�2036�(Bottom)�.....................................�55�Figure�22:�GHG�Emissions�of�Portfolios�Evaluated�................................................................................................................�56�Figure�23:�Present�Value�Cost�Comparison�...........................................................................................................................�57�Figure�24:�Application�of�Criteria�Filter�and�Selection�of�Scenario�E�....................................................................................�58�Figure�25:�A�Pathway�to�60%�RPS�.........................................................................................................................................�59�Figure�26:�Example�sub�hourly�volatility�associated�with�renewable�energy�......................................................................�60�Figure�27:�Annual�Renewable�Curtailment�...........................................................................................................................�61�Figure�28:�Annual�Greenhouse�Gas�Emissions�......................................................................................................................�62�Figure�29:�Monthly�Greenhouse�Gas�Emissions�...................................................................................................................�63�Figure�30:�Local�SO2�and�NOx�Emissions�from�Proposed�Power�Plan�...................................................................................�64�Figure�31:�Monthly�Transmission�Utilization�........................................................................................................................�65�Figure�32:�Example�Hourly�Transmission�Utilization�with�and�without�Pacific�DC�Intertie�..................................................�66�Figure�33:�Annual�Energy�Savings�(GWh)�..............................................................................................................................�67�Figure�34:�Annual�Energy�Savings�on�Peak�...........................................................................................................................�68�Figure�35:�Cumulative�EE�Savings�with�CEC�adjustments�.....................................................................................................�73�Figure�36:�Electric�Vehicle�Charging�Station�Locations�in�Glendale�......................................................................................�77�Figure�37:�Disadvantaged�Communities�Map�.......................................................................................................................�80�Figure�38:�Estimating�Power�Plan�GHG�Performance�2038�2045�.........................................................................................�87�Figure�39:�PowerSimm's�Sim�Engine�.....................................................................................................................................�90�Figure�40:�The�value�of�stochastic�analysis�in�resource�planning�.........................................................................................�91�Figure�41:�Risk�premium�is�an�economic�concept�measuring�how�prone�a�portfolio�is�to�higher�than�expected�costs�.....�92�Figure�42:�Two�different�ways�to�express�LOLP�....................................................................................................................�92�Figure�43:�PowerFlex�calculates�the�amount�of�regulation�and�INC/DEC�needed�to�integrate�renewables.�.......................�94�Figure�44:�SoCal�Gas�Price�Forecast�inputs�to�PowerSimm�..................................................................................................�95�
�GWP�2019�Integrated�Resource�Plan��
� �6�|�P a g e �
Figure�45:�Implied�Heat�rates�for�2020,�2025,�2030,�2035�declining�over�time�with�greater�renewable�penetration�........�96�Figure�46:�SP�15�Projected�DA�Prices�for�2020,�2025,2030,2035�.........................................................................................�97�Figure�47:�SP�15�DA�Power�Prices�monthly�on�peak�and�off�peak�projection�.....................................................................�98�Figure�48:�Projected�DA�Price�Volatility�SP�15�......................................................................................................................�98��
� �
�GWP�2019�Integrated�Resource�Plan��
� �7�|�P a g e �
List�of�Tables�Table�1:�Proposed�Resource�Portfolio�..................................................................................................................................�10�Table�2:�GWP�Electric�Service�at�a�glance�as�of�2017�...........................................................................................................�15�Table�3:�GWP's�Resource�Portfolio�at�a�Glance�....................................................................................................................�16�Table�4:�Firm�Power�Supply�Purchase�Contracts�..................................................................................................................�17�Table�5:�GWP's�Renewable�Resources�..................................................................................................................................�19�Table�6:�RPS�and�GHG�Emissions�Targets�..............................................................................................................................�23�Table�7:�Energy�Demand�Forecast�2019���2038�....................................................................................................................�27�Table�8:�Peak�Demand�Forecast�of�Customer�Load�+�EV�Load�2019�2038�...........................................................................�27�Table�9:�Projected�Load�Increase�due�to�EVs�........................................................................................................................�28�Table�10:�Projected�Peak�Load�Increase�due�to�EVs�.............................................................................................................�29�Table�11:�Peak�Procurement�Requirement�Based�on�N�1�1�.................................................................................................�30�Table�12:�Clean�Energy�RFP�Proposal�Scoring�.......................................................................................................................�34�Table�13:�Proposed�Portfolio�................................................................................................................................................�37�Table�14:�N�1�1�Reserve�Capacity�Calculation�......................................................................................................................�40�Table�15:�Proposed�Power�Plan�Present�Value�Cost�Breakdown�.........................................................................................�43�Table�16:�Resource�EIM�Benefits�..........................................................................................................................................�43�Table�17:�Forecasted�Carbon�Prices�through�2038�...............................................................................................................�44�Table�18:�Change�in�Peak�Demand�Forecast�due�to�Proposed�Power�Plan�Resources�2021�2038�......................................�45�Table�19:�Energy�Demand�Forecast�of�Proposed�Power�Plan�2019�2038�............................................................................�45�Table�20:�Portfolios�Considered�............................................................................................................................................�51�Table�21:�Preferred�Renewable�Energy�Breakdown�by�Resource�........................................................................................�59�Table�22:�CVR�Program�Results�.............................................................................................................................................�71�Table�23:�2017�2018�EE�Program�Results�.............................................................................................................................�72�Table�24:�Annual�Targets�with�Codes�and�Standards�...........................................................................................................�73�� �
�GWP�2019�Integrated�Resource�Plan��
� �8�|�P a g e �
�
Acronyms�and�Abbreviations��
AAEE�–�Additional�Achievable�Energy�Efficiency���AAPV�–�Additional�Achievable�Photovoltaics��BTM�–�Behind�the�meter�CAISO�–�California�Independent�System�Operator�CARB�–�California�Air�Resources�Board�CC�–�Combined�Cycle�Combustion�Turbine�CE+LR�–�Clean�Energy�+�Load�Reduction�CEC�–�California�Energy�Commission�CT�–�Combustion�Turbine��DER�–�Distributed�Energy�Resource�DSM�–�Demand�Side�Management�EE�–�Energy�Efficiency�FoM�–�Front�of�Meter�GWP�–�Glendale�Water�&�Power�ICE�–�Internal�Combustion�Engine�IPP�–�Intermountain�Power�Project�LOLH�–�Loss�of�Load�Hours��MW�–�Megawatt�MWh�–�Megawatt�hour�POU�–�Publicly�Owned�Utility�RFP�–�Request�for�Proposal�RMI�–�Rocky�Mountain�Institute�PBC�–�Public�Benefits�Charge�PV���Photovoltaic� �
�GWP�2019�Integrated�Resource�Plan��
� �9�|�P a g e �
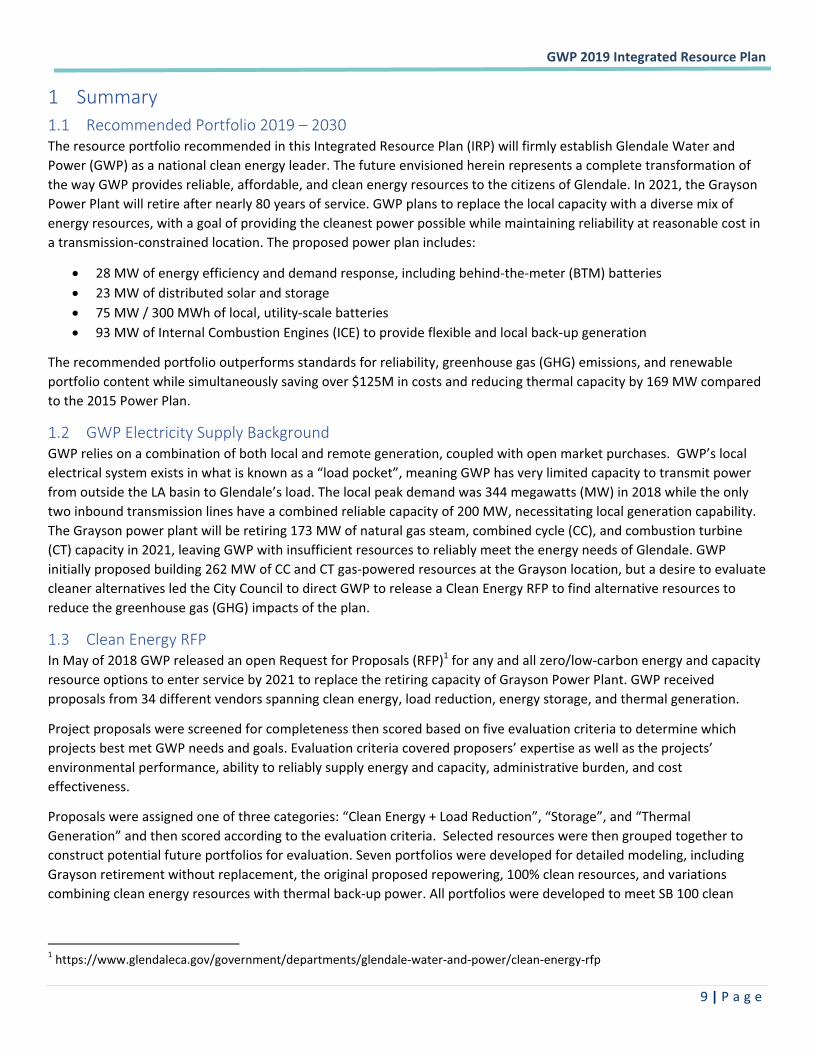
1 Summary��1.1 Recommended�Portfolio�2019�–�2030�The�resource�portfolio�recommended�in�this�Integrated�Resource�Plan�(IRP)�will�firmly�establish�Glendale�Water�and�Power�(GWP)�as�a�national�clean�energy�leader.�The�future�envisioned�herein�represents�a�complete�transformation�of�the�way�GWP�provides�reliable,�affordable,�and�clean�energy�resources�to�the�citizens�of�Glendale.�In�2021,�the�Grayson�Power�Plant�will�retire�after�nearly�80�years�of�service.�GWP�plans�to�replace�the�local�capacity�with�a�diverse�mix�of�energy�resources,�with�a�goal�of�providing�the�cleanest�power�possible�while�maintaining�reliability�at�reasonable�cost�in�a�transmission�constrained�location.�The�proposed�power�plan�includes:�
� 28�MW�of�energy�efficiency�and�demand�response,�including�behind�the�meter�(BTM)�batteries�� 23�MW�of�distributed�solar�and�storage�� 75�MW�/�300�MWh�of�local,�utility�scale�batteries��� 93�MW�of�Internal�Combustion�Engines�(ICE)�to�provide�flexible�and�local�back�up�generation�
The�recommended�portfolio�outperforms�standards�for�reliability,�greenhouse�gas�(GHG)�emissions,�and�renewable�portfolio�content�while�simultaneously�saving�over�$125M�in�costs�and�reducing�thermal�capacity�by�169�MW�compared�to�the�2015�Power�Plan.�
1.2 GWP�Electricity�Supply�Background�GWP�relies�on�a�combination�of�both�local�and�remote�generation,�coupled�with�open�market�purchases.��GWP’s�local�electrical�system�exists�in�what�is�known�as�a�“load�pocket”,�meaning�GWP�has�very�limited�capacity�to�transmit�power�from�outside�the�LA�basin�to�Glendale’s�load.�The�local�peak�demand�was�344�megawatts�(MW)�in�2018�while�the�only�two�inbound�transmission�lines�have�a�combined�reliable�capacity�of�200�MW,�necessitating�local�generation�capability.�The�Grayson�power�plant�will�be�retiring�173�MW�of�natural�gas�steam,�combined�cycle�(CC),�and�combustion�turbine�(CT)�capacity�in�2021,�leaving�GWP�with�insufficient�resources�to�reliably�meet�the�energy�needs�of�Glendale.�GWP�initially�proposed�building�262�MW�of�CC�and�CT�gas�powered�resources�at�the�Grayson�location,�but�a�desire�to�evaluate�cleaner�alternatives�led�the�City�Council�to�direct�GWP�to�release�a�Clean�Energy�RFP�to�find�alternative�resources�to�reduce�the�greenhouse�gas�(GHG)�impacts�of�the�plan.�
1.3 Clean�Energy�RFP�In�May�of�2018�GWP�released�an�open�Request�for�Proposals�(RFP)1�for�any�and�all�zero/low�carbon�energy�and�capacity�resource�options�to�enter�service�by�2021�to�replace�the�retiring�capacity�of�Grayson�Power�Plant.�GWP�received�proposals�from�34�different�vendors�spanning�clean�energy,�load�reduction,�energy�storage,�and�thermal�generation.��
Project�proposals�were�screened�for�completeness�then�scored�based�on�five�evaluation�criteria�to�determine�which�projects�best�met�GWP�needs�and�goals.�Evaluation�criteria�covered�proposers’�expertise�as�well�as�the�projects’�environmental�performance,�ability�to�reliably�supply�energy�and�capacity,�administrative�burden,�and�cost�effectiveness.�
Proposals�were�assigned�one�of�three�categories:�“Clean�Energy�+�Load�Reduction”,�“Storage”,�and�“Thermal�Generation”�and�then�scored�according�to�the�evaluation�criteria.��Selected�resources�were�then�grouped�together�to�construct�potential�future�portfolios�for�evaluation.�Seven�portfolios�were�developed�for�detailed�modeling,�including�Grayson�retirement�without�replacement,�the�original�proposed�repowering,�100%�clean�resources,�and�variations�combining�clean�energy�resources�with�thermal�back�up�power.�All�portfolios�were�developed�to�meet�SB�100�clean�
������������������������������������������������������������1�https://www.glendaleca.gov/government/departments/glendale�water�and�power/clean�energy�rfp�
�GWP�2019�Integrated�Resource�Plan��
� �10�|�P a g e �
energy�targets�as�well�as�N�1�1�reserve�requirements�(the�ability�to�serve�peak�demand�even�when�the�largest�transmission�and�generation�resources�are�experiencing�an�outage).��
1.4 Portfolio�Evaluation�and�Recommended�Power�Plan��GWP’s�objective�in�developing�this�Power�Plan�was�to�meet�power�reliability�requirements�with�the�cleanest�resource�portfolio�possible�while�also�keeping�the�rates�low.�By�evaluating�a�range�of�candidate�portfolios,�GWP�was�able�to�assess�the�performance�of�different�resource�mixes�across�various�metrics�(emissions,�cost,�reliability,�etc)�and�select�a�portfolio�that�most�closely�matched�GWP�and�the�Glendale�community’s�energy�goals.�GWP�firmly�believes�that�the�Power�Plan�proposed�in�this�IRP�represents�the�cleanest�and�most�cost�effective�option�to�ensure�reliable�power�for�the�city�of�Glendale�after�Grayson�retires.�
The�Power�Plan�proposed�here�is�comprised�of�the�following�resources:�
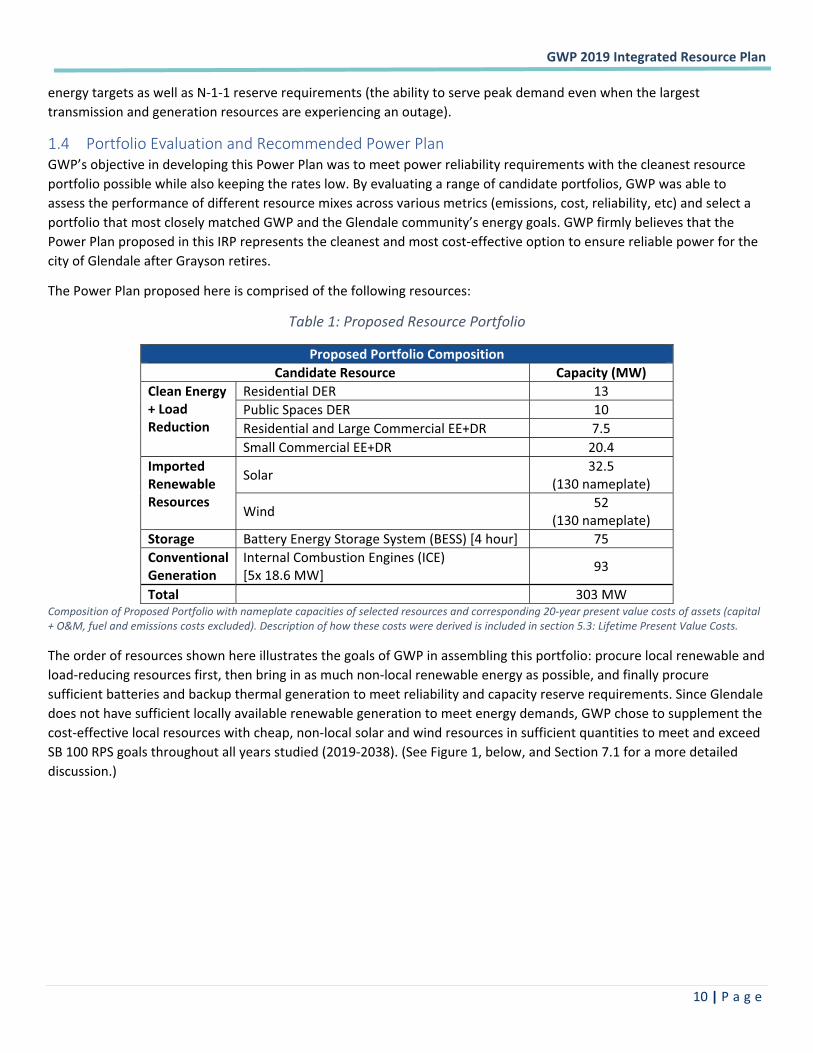
Table�1:�Proposed�Resource�Portfolio�
Proposed�Portfolio�Composition��Candidate�Resource� Capacity�(MW)�
Clean�Energy�+�Load�Reduction�
Residential�DER� 13�Public�Spaces�DER� 10�Residential�and�Large�Commercial�EE+DR� 7.5�Small�Commercial�EE+DR� 20.4�
Imported�Renewable�Resources�
Solar� 32.5�(130�nameplate)�
Wind� 52�(130�nameplate)�
Storage� Battery�Energy�Storage�System�(BESS)�[4�hour]� 75�Conventional�Generation��
Internal�Combustion�Engines�(ICE)�[5x�18.6�MW]� 93�
Total� � 303�MW�Composition�of�Proposed�Portfolio�with�nameplate�capacities�of�selected�resources�and�corresponding�20�year�present�value�costs�of�assets�(capital�+�O&M,�fuel�and�emissions�costs�excluded).�Description�of�how�these�costs�were�derived�is�included�in�section�5.3:�Lifetime�Present�Value�Costs.�
The�order�of�resources�shown�here�illustrates�the�goals�of�GWP�in�assembling�this�portfolio:�procure�local�renewable�and�load�reducing�resources�first,�then�bring�in�as�much�non�local�renewable�energy�as�possible,�and�finally�procure�sufficient�batteries�and�backup�thermal�generation�to�meet�reliability�and�capacity�reserve�requirements.�Since�Glendale�does�not�have�sufficient�locally�available�renewable�generation�to�meet�energy�demands,�GWP�chose�to�supplement�the�cost�effective�local�resources�with�cheap,�non�local�solar�and�wind�resources�in�sufficient�quantities�to�meet�and�exceed�SB�100�RPS�goals�throughout�all�years�studied�(2019�2038).�(See�Figure�1,�below,�and�Section�7.1�for�a�more�detailed�discussion.)�
�GWP�2019�Integrated�Resource�Plan��
� �11�|�P a g e �
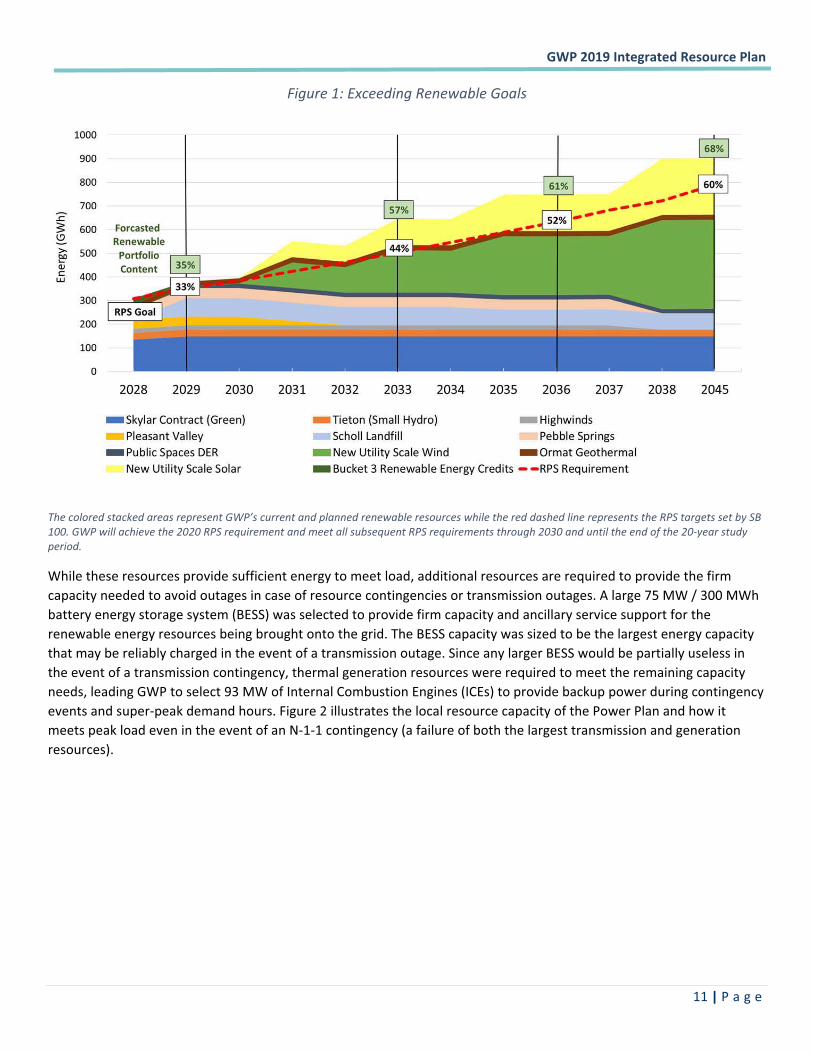
Figure�1:�Exceeding�Renewable�Goals�
�
The�colored�stacked�areas�represent�GWP’s�current�and�planned�renewable�resources�while�the�red�dashed�line�represents�the�RPS�targets�set�by�SB�100.�GWP�will�achieve�the�2020�RPS�requirement�and�meet�all�subsequent�RPS�requirements�through�2030�and�until�the�end�of�the�20�year�study�period.�
While�these�resources�provide�sufficient�energy�to�meet�load,�additional�resources�are�required�to�provide�the�firm�capacity�needed�to�avoid�outages�in�case�of�resource�contingencies�or�transmission�outages.�A�large�75�MW�/�300�MWh�battery�energy�storage�system�(BESS)�was�selected�to�provide�firm�capacity�and�ancillary�service�support�for�the�renewable�energy�resources�being�brought�onto�the�grid.�The�BESS�capacity�was�sized�to�be�the�largest�energy�capacity�that�may�be�reliably�charged�in�the�event�of�a�transmission�outage.�Since�any�larger�BESS�would�be�partially�useless�in�the�event�of�a�transmission�contingency,�thermal�generation�resources�were�required�to�meet�the�remaining�capacity�needs,�leading�GWP�to�select�93�MW�of�Internal�Combustion�Engines�(ICEs)�to�provide�backup�power�during�contingency�events�and�super�peak�demand�hours.�Figure�2�illustrates�the�local�resource�capacity�of�the�Power�Plan�and�how�it�meets�peak�load�even�in�the�event�of�an�N�1�1�contingency�(a�failure�of�both�the�largest�transmission�and�generation�resources).�
�GWP�2019�Integrated�Resource�Plan��
� �12�|�P a g e �
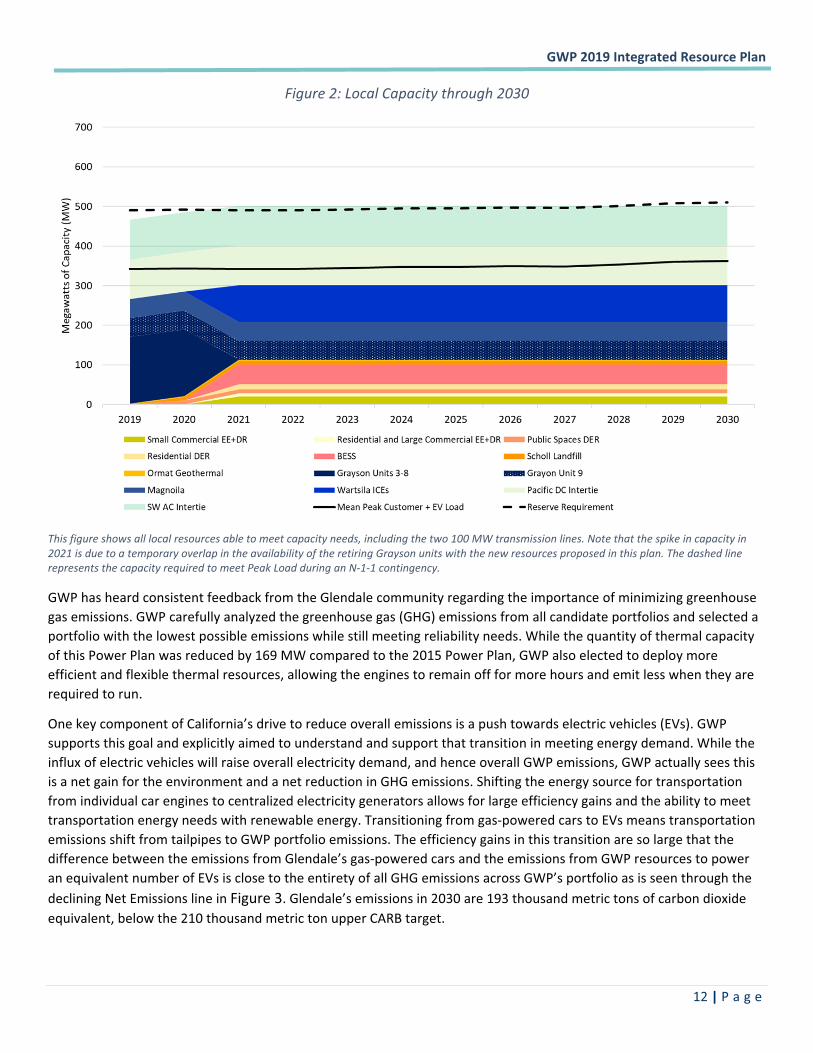
Figure�2:�Local�Capacity�through�2030�
�
This�figure�shows�all�local�resources�able�to�meet�capacity�needs,�including�the�two�100�MW�transmission�lines.�Note�that�the�spike�in�capacity�in�2021�is�due�to�a�temporary�overlap�in�the�availability�of�the�retiring�Grayson�units�with�the�new�resources�proposed�in�this�plan.�The�dashed�line�represents�the�capacity�required�to�meet�Peak�Load�during�an�N�1�1�contingency.�
GWP�has�heard�consistent�feedback�from�the�Glendale�community�regarding�the�importance�of�minimizing�greenhouse�gas�emissions.�GWP�carefully�analyzed�the�greenhouse�gas�(GHG)�emissions�from�all�candidate�portfolios�and�selected�a�portfolio�with�the�lowest�possible�emissions�while�still�meeting�reliability�needs.�While�the�quantity�of�thermal�capacity�of�this�Power�Plan�was�reduced�by�169�MW�compared�to�the�2015�Power�Plan,�GWP�also�elected�to�deploy�more�efficient�and�flexible�thermal�resources,�allowing�the�engines�to�remain�off�for�more�hours�and�emit�less�when�they�are�required�to�run.�
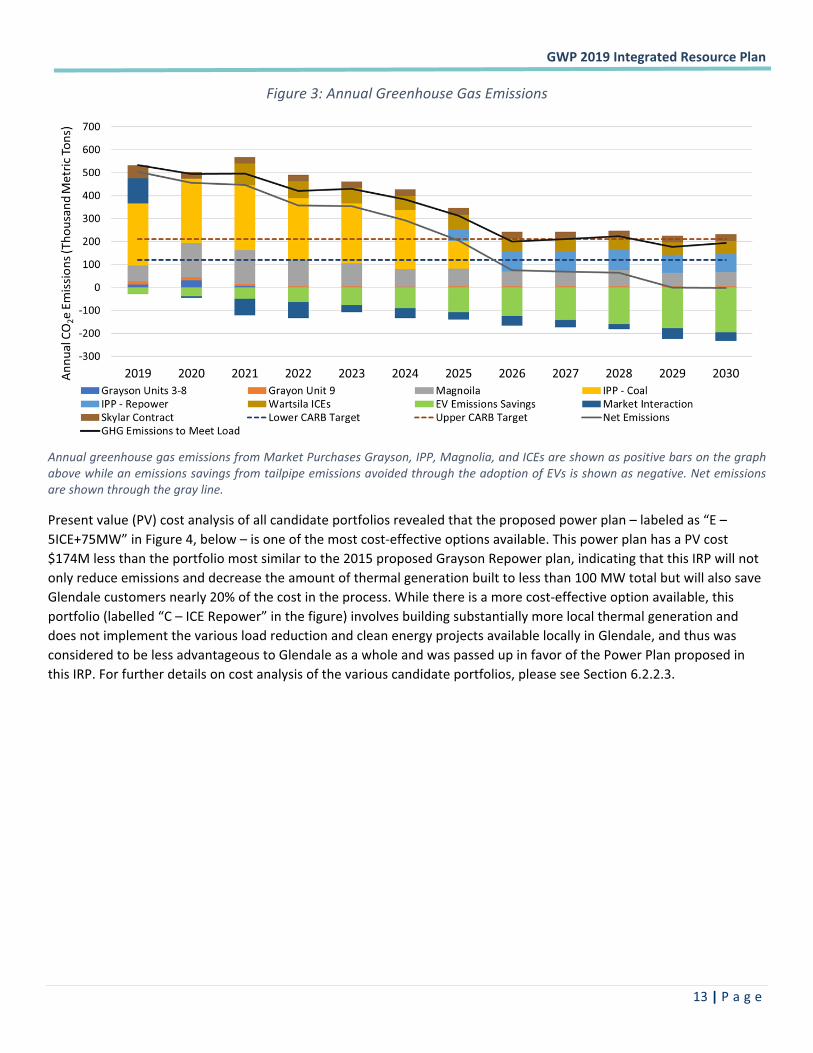
One�key�component�of�California’s�drive�to�reduce�overall�emissions�is�a�push�towards�electric�vehicles�(EVs).�GWP�supports�this�goal�and�explicitly�aimed�to�understand�and�support�that�transition�in�meeting�energy�demand.�While�the�influx�of�electric�vehicles�will�raise�overall�electricity�demand,�and�hence�overall�GWP�emissions,�GWP�actually�sees�this�is�a�net�gain�for�the�environment�and�a�net�reduction�in�GHG�emissions.�Shifting�the�energy�source�for�transportation�from�individual�car�engines�to�centralized�electricity�generators�allows�for�large�efficiency�gains�and�the�ability�to�meet�transportation�energy�needs�with�renewable�energy.�Transitioning�from�gas�powered�cars�to�EVs�means�transportation�emissions�shift�from�tailpipes�to�GWP�portfolio�emissions.�The�efficiency�gains�in�this�transition�are�so�large�that�the�difference�between�the�emissions�from�Glendale’s�gas�powered�cars�and�the�emissions�from�GWP�resources�to�power�an�equivalent�number�of�EVs�is�close�to�the�entirety�of�all�GHG�emissions�across�GWP’s�portfolio�as�is�seen�through�the�declining�Net�Emissions�line�in�Figure�3.�Glendale’s�emissions�in�2030�are�193�thousand�metric�tons�of�carbon�dioxide�equivalent,�below�the�210�thousand�metric�ton�upper�CARB�target.��
�GWP�2019�Integrated�Resource�Plan��
� �13�|�P a g e �
Figure�3:�Annual�Greenhouse�Gas�Emissions�
�Annual�greenhouse�gas�emissions�from�Market�Purchases�Grayson,�IPP,�Magnolia,�and�ICEs�are�shown�as�positive�bars�on�the�graph�above�while�an�emissions�savings�from�tailpipe�emissions�avoided�through�the�adoption�of�EVs�is�shown�as�negative.�Net�emissions�are�shown�through�the�gray�line.��
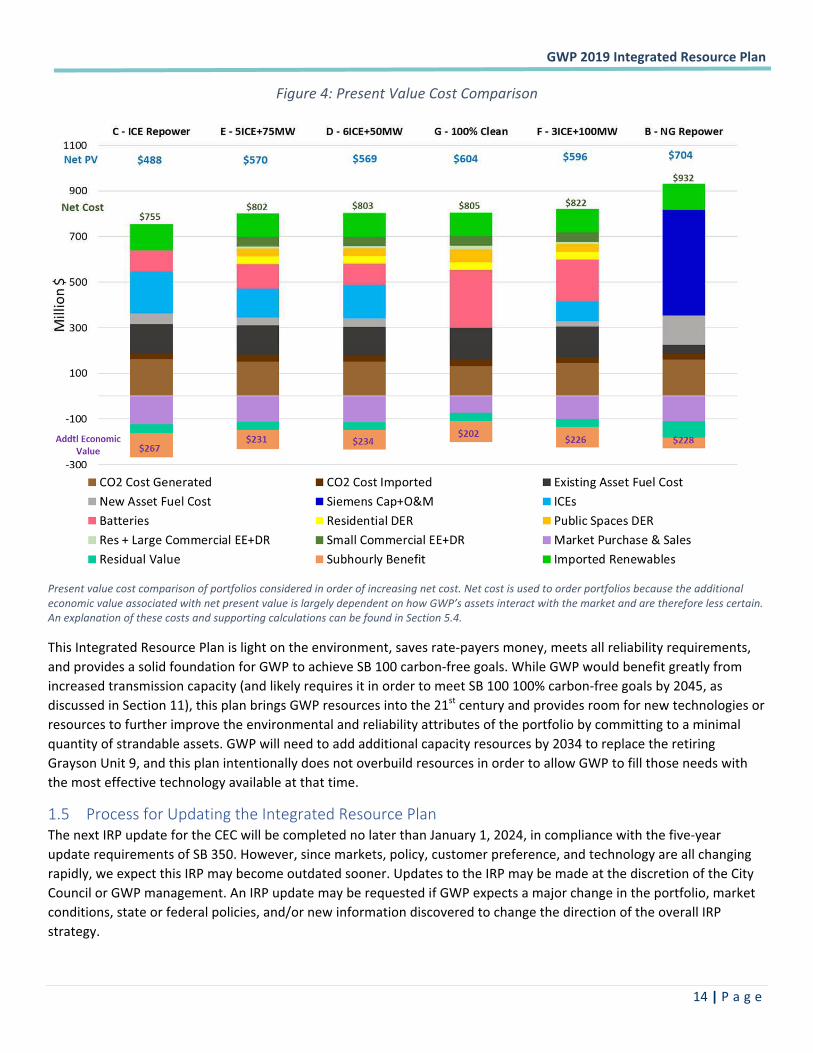
Present�value�(PV)�cost�analysis�of�all�candidate�portfolios�revealed�that�the�proposed�power�plan�–�labeled�as�“E�–�5ICE+75MW”�in�Figure�4,�below�–�is�one�of�the�most�cost�effective�options�available.�This�power�plan�has�a�PV�cost�$174M�less�than�the�portfolio�most�similar�to�the�2015�proposed�Grayson�Repower�plan,�indicating�that�this�IRP�will�not�only�reduce�emissions�and�decrease�the�amount�of�thermal�generation�built�to�less�than�100�MW�total�but�will�also�save�Glendale�customers�nearly�20%�of�the�cost�in�the�process.�While�there�is�a�more�cost�effective�option�available,�this�portfolio�(labelled�“C�–�ICE�Repower”�in�the�figure)�involves�building�substantially�more�local�thermal�generation�and�does�not�implement�the�various�load�reduction�and�clean�energy�projects�available�locally�in�Glendale,�and�thus�was�considered�to�be�less�advantageous�to�Glendale�as�a�whole�and�was�passed�up�in�favor�of�the�Power�Plan�proposed�in�this�IRP.�For�further�details�on�cost�analysis�of�the�various�candidate�portfolios,�please�see�Section�6.2.2.3.�
�GWP�2019�Integrated�Resource�Plan��
� �14�|�P a g e �
Figure�4:�Present�Value�Cost�Comparison�
�
Present�value�cost�comparison�of�portfolios�considered�in�order�of�increasing�net�cost.�Net�cost�is�used�to�order�portfolios�because�the�additional�economic�value�associated�with�net�present�value�is�largely�dependent�on�how�GWP’s�assets�interact�with�the�market�and�are�therefore�less�certain.�An�explanation�of�these�costs�and�supporting�calculations�can�be�found�in�Section�5.4.�
This�Integrated�Resource�Plan�is�light�on�the�environment,�saves�rate�payers�money,�meets�all�reliability�requirements,�and�provides�a�solid�foundation�for�GWP�to�achieve�SB�100�carbon�free�goals.�While�GWP�would�benefit�greatly�from�increased�transmission�capacity�(and�likely�requires�it�in�order�to�meet�SB�100�100%�carbon�free�goals�by�2045,�as�discussed�in�Section�11),�this�plan�brings�GWP�resources�into�the�21st�century�and�provides�room�for�new�technologies�or�resources�to�further�improve�the�environmental�and�reliability�attributes�of�the�portfolio�by�committing�to�a�minimal�quantity�of�strandable�assets.�GWP�will�need�to�add�additional�capacity�resources�by�2034�to�replace�the�retiring�Grayson�Unit�9,�and�this�plan�intentionally�does�not�overbuild�resources�in�order�to�allow�GWP�to�fill�those�needs�with�the�most�effective�technology�available�at�that�time.��
1.5 Process�for�Updating�the�Integrated�Resource�Plan��The�next�IRP�update�for�the�CEC�will�be�completed�no�later�than�January�1,�2024,�in�compliance�with�the�five�year�update�requirements�of�SB�350.�However,�since�markets,�policy,�customer�preference,�and�technology�are�all�changing�rapidly,�we�expect�this�IRP�may�become�outdated�sooner.�Updates�to�the�IRP�may�be�made�at�the�discretion�of�the�City�Council�or�GWP�management.�An�IRP�update�may�be�requested�if�GWP�expects�a�major�change�in�the�portfolio,�market�conditions,�state�or�federal�policies,�and/or�new�information�discovered�to�change�the�direction�of�the�overall�IRP�strategy.��
�
�GWP�2019�Integrated�Resource�Plan��
� �15�|�P a g e �
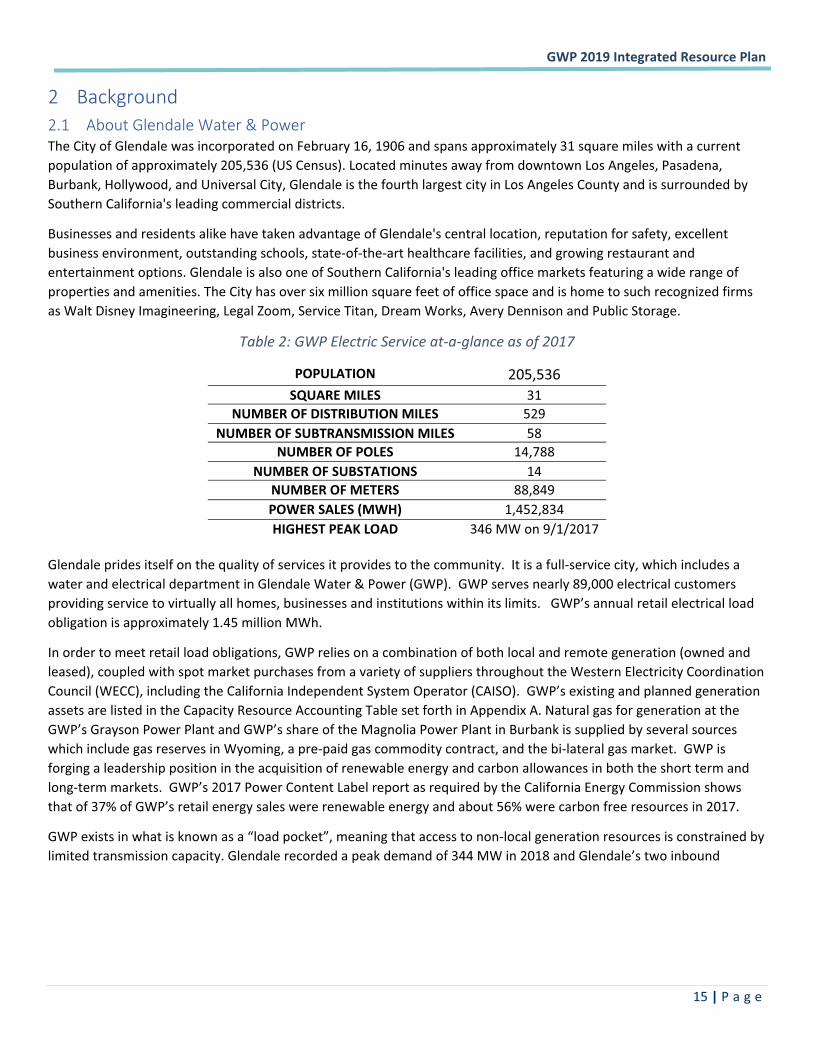
2 Background��2.1 About�Glendale�Water�&�Power��The�City�of�Glendale�was�incorporated�on�February�16,�1906�and�spans�approximately�31�square�miles�with�a�current�population�of�approximately�205,536�(US�Census).�Located�minutes�away�from�downtown�Los�Angeles,�Pasadena,�Burbank,�Hollywood,�and�Universal�City,�Glendale�is�the�fourth�largest�city�in�Los�Angeles�County�and�is�surrounded�by�Southern�California's�leading�commercial�districts.�
Businesses�and�residents�alike�have�taken�advantage�of�Glendale's�central�location,�reputation�for�safety,�excellent�business�environment,�outstanding�schools,�state�of�the�art�healthcare�facilities,�and�growing�restaurant�and�entertainment�options.�Glendale�is�also�one�of�Southern�California's�leading�office�markets�featuring�a�wide�range�of�properties�and�amenities.�The�City�has�over�six�million�square�feet�of�office�space�and�is�home�to�such�recognized�firms�as�Walt�Disney�Imagineering,�Legal�Zoom,�Service�Titan,�Dream�Works,�Avery�Dennison�and�Public�Storage.��
Table�2:�GWP�Electric�Service�at�a�glance�as�of�2017�
POPULATION� 205,536�SQUARE�MILES� 31�
NUMBER�OF�DISTRIBUTION�MILES� 529�NUMBER�OF�SUBTRANSMISSION�MILES� 58�
NUMBER�OF�POLES� 14,788�NUMBER�OF�SUBSTATIONS� 14�
NUMBER�OF�METERS� 88,849�POWER�SALES�(MWH)� 1,452,834�HIGHEST�PEAK�LOAD� 346�MW�on�9/1/2017�
�Glendale�prides�itself�on�the�quality�of�services�it�provides�to�the�community.��It�is�a�full�service�city,�which�includes�a�water�and�electrical�department�in�Glendale�Water�&�Power�(GWP).��GWP�serves�nearly�89,000�electrical�customers�providing�service�to�virtually�all�homes,�businesses�and�institutions�within�its�limits.���GWP’s�annual�retail�electrical�load�obligation�is�approximately�1.45�million�MWh.���
In�order�to�meet�retail�load�obligations,�GWP�relies�on�a�combination�of�both�local�and�remote�generation�(owned�and�leased),�coupled�with�spot�market�purchases�from�a�variety�of�suppliers�throughout�the�Western�Electricity�Coordination�Council�(WECC),�including�the�California�Independent�System�Operator�(CAISO).��GWP’s�existing�and�planned�generation�assets�are�listed�in�the�Capacity�Resource�Accounting�Table�set�forth�in�Appendix�A.�Natural�gas�for�generation�at�the�GWP’s�Grayson�Power�Plant�and�GWP’s�share�of�the�Magnolia�Power�Plant�in�Burbank�is�supplied�by�several�sources�which�include�gas�reserves�in�Wyoming,�a�pre�paid�gas�commodity�contract,�and�the�bi�lateral�gas�market.��GWP�is�forging�a�leadership�position�in�the�acquisition�of�renewable�energy�and�carbon�allowances�in�both�the�short�term�and�long�term�markets.��GWP’s�2017�Power�Content�Label�report�as�required�by�the�California�Energy�Commission�shows�that�of�37%�of�GWP’s�retail�energy�sales�were�renewable�energy�and�about�56%�were�carbon�free�resources�in�2017.�
GWP�exists�in�what�is�known�as�a�“load�pocket”,�meaning�that�access�to�non�local�generation�resources�is�constrained�by�limited�transmission�capacity.�Glendale�recorded�a�peak�demand�of�344�MW�in�2018�and�Glendale’s�two�inbound�
�GWP�2019�Integrated�Resource�Plan��
� �16�|�P a g e �
transmission�lines�only�have�200�MW2�of�capacity�to�import�renewable,�thermal,�and�market�resources.�GWP�will�continue�to�work�with�LADWP�to�look�for�opportunities�to�expand�GWP’s�transmission�import�capability.�This�remains�a�significant�challenge�given�the�difficulty�in�financing,�permitting�and�constructing�new�transmission�through�a�combination�of�urban�environment�and�high�fire�risk�mountains.��
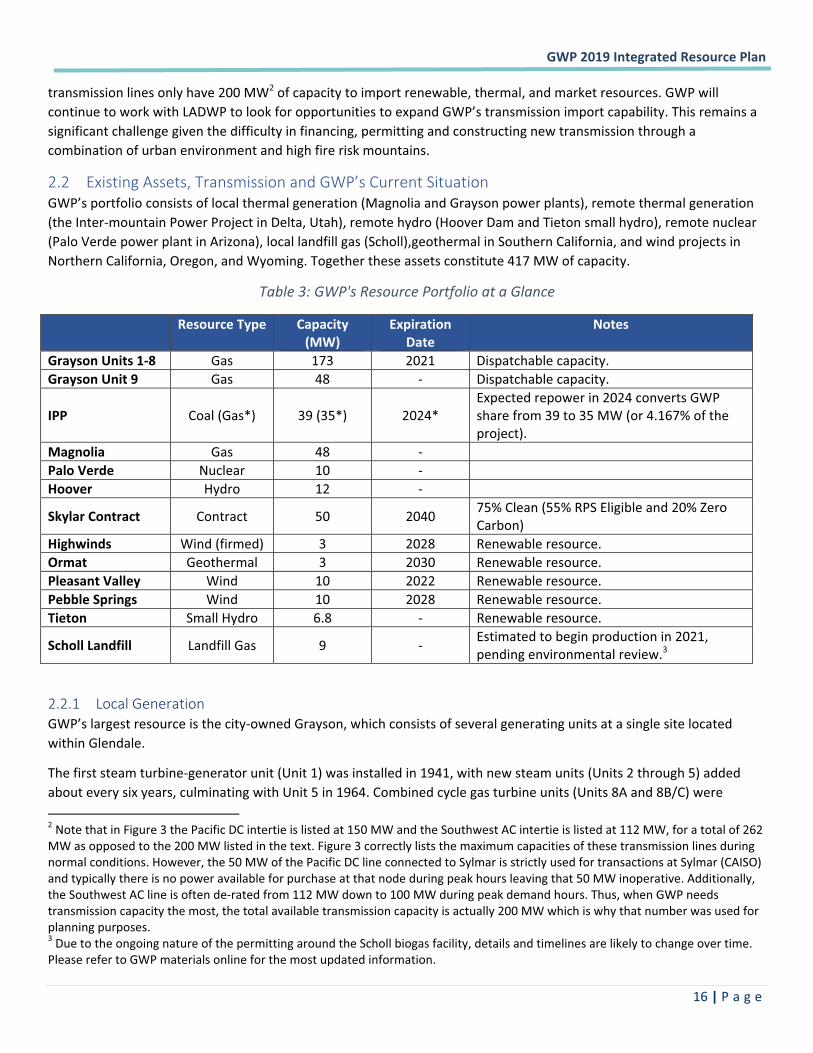
2.2 Existing�Assets,�Transmission�and�GWP’s�Current�Situation��GWP’s�portfolio�consists�of�local�thermal�generation�(Magnolia�and�Grayson�power�plants),�remote�thermal�generation�(the�Inter�mountain�Power�Project�in�Delta,�Utah),�remote�hydro�(Hoover�Dam�and�Tieton�small�hydro),�remote�nuclear�(Palo�Verde�power�plant�in�Arizona),�local�landfill�gas�(Scholl),geothermal�in�Southern�California,�and�wind�projects�in�Northern�California,�Oregon,�and�Wyoming.�Together�these�assets�constitute�417�MW�of�capacity.��
Table�3:�GWP's�Resource�Portfolio�at�a�Glance�
� Resource�Type� Capacity�(MW)�
Expiration�Date�
Notes�
Grayson�Units�1�8� Gas� 173� 2021� Dispatchable�capacity.�Grayson�Unit�9� Gas� 48� �� Dispatchable�capacity.�
IPP� Coal�(Gas*)� 39�(35*)� 2024*�Expected�repower�in�2024�converts�GWP�share�from�39�to�35�MW�(or�4.167%�of�the�project).�
Magnolia� Gas� 48� �� �Palo�Verde� Nuclear� 10� �� �Hoover� Hydro� 12� �� �
Skylar�Contract� Contract� 50� 2040� 75%�Clean�(55%�RPS�Eligible�and�20%�Zero�Carbon)�
Highwinds� Wind�(firmed)� 3� 2028� Renewable�resource.�Ormat� Geothermal� 3� 2030� Renewable�resource.�Pleasant�Valley� Wind� 10� 2022� Renewable�resource.�Pebble�Springs� Wind� 10� 2028� Renewable�resource.�Tieton� Small�Hydro� 6.8� �� Renewable�resource.�
Scholl�Landfill� Landfill�Gas� 9� �� Estimated�to�begin�production�in�2021,�pending�environmental�review.3�
�
2.2.1 Local�Generation��GWP’s�largest�resource�is�the�city�owned�Grayson,�which�consists�of�several�generating�units�at�a�single�site�located�within�Glendale.���
The�first�steam�turbine�generator�unit�(Unit�1)�was�installed�in�1941,�with�new�steam�units�(Units�2�through�5)�added�about�every�six�years,�culminating�with�Unit�5�in�1964.�Combined�cycle�gas�turbine�units�(Units�8A�and�8B/C)�were�������������������������������������������������������������2�Note�that�in�Figure�3�the�Pacific�DC�intertie�is�listed�at�150�MW�and�the�Southwest�AC�intertie�is�listed�at�112�MW,�for�a�total�of�262�MW�as�opposed�to�the�200�MW�listed�in�the�text.�Figure�3�correctly�lists�the�maximum�capacities�of�these�transmission�lines�during�normal�conditions.�However,�the�50�MW�of�the�Pacific�DC�line�connected�to�Sylmar�is�strictly�used�for�transactions�at�Sylmar�(CAISO)�and�typically�there�is�no�power�available�for�purchase�at�that�node�during�peak�hours�leaving�that�50�MW�inoperative.�Additionally,�the�Southwest�AC�line�is�often�de�rated�from�112�MW�down�to�100�MW�during�peak�demand�hours.�Thus,�when�GWP�needs�transmission�capacity�the�most,�the�total�available�transmission�capacity�is�actually�200�MW�which�is�why�that�number�was�used�for�planning�purposes.�3�Due�to�the�ongoing�nature�of�the�permitting�around�the�Scholl�biogas�facility,�details�and�timelines�are�likely�to�change�over�time.�Please�refer�to�GWP�materials�online�for�the�most�updated�information.�
�GWP�2019�Integrated�Resource�Plan��
� �17�|�P a g e �
installed�in�1977�with�the�repowering�of�the�first�two�steam�turbine�generators�(Units�1�and�2).��The�new�Unit�9�simple�cycle�gas�turbine,�General�Electric�LM6000,�was�installed�in�2003.�
Due�to�the�aging�nature�of�the�Grayson�units�most�of�these�resources�are�no�longer�able�to�provide�the�full�power�of�their�nameplate�capacity.�Accordingly,�this�IRP�has�adopted�the�convention�of�listing�“dispatchable”�capacity�for�each�Grayson�unit,�which�means�that�maximum�amount�of�power�that�can�safely�be�derived�from�each�resource�and�dispatched�to�the�grid.�While�these�“dispatchable”�numbers�will�differ�from�previously�published�“nameplate�capacity”�numbers,�GWP�believes�the�numbers�published�in�this�IRP�to�be�the�most�accurate�way�to�represent�the�current�status�of�GWP�resources.�
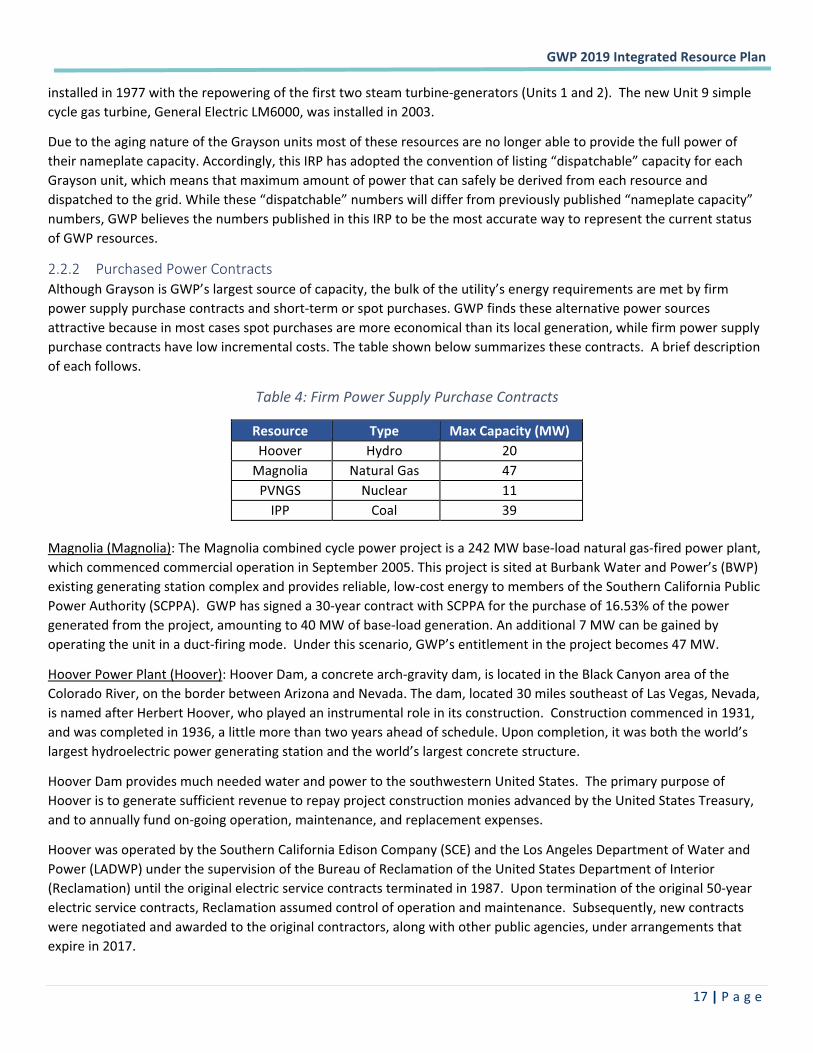
2.2.2 Purchased�Power�Contracts��Although�Grayson�is�GWP’s�largest�source�of�capacity,�the�bulk�of�the�utility’s�energy�requirements�are�met�by�firm�power�supply�purchase�contracts�and�short�term�or�spot�purchases.�GWP�finds�these�alternative�power�sources�attractive�because�in�most�cases�spot�purchases�are�more�economical�than�its�local�generation,�while�firm�power�supply�purchase�contracts�have�low�incremental�costs.�The�table�shown�below�summarizes�these�contracts.��A�brief�description�of�each�follows.��
Table�4:�Firm�Power�Supply�Purchase�Contracts�
Resource�� Type�� Max�Capacity�(MW)��Hoover�� Hydro�� 20��
Magnolia�� Natural�Gas�� 47��PVNGS�� Nuclear�� 11��
IPP�� Coal�� 39���Magnolia�(Magnolia):�The�Magnolia�combined�cycle�power�project�is�a�242�MW�base�load�natural�gas�fired�power�plant,�which�commenced�commercial�operation�in�September�2005.�This�project�is�sited�at�Burbank�Water�and�Power’s�(BWP)�existing�generating�station�complex�and�provides�reliable,�low�cost�energy�to�members�of�the�Southern�California�Public�Power�Authority�(SCPPA).��GWP�has�signed�a�30�year�contract�with�SCPPA�for�the�purchase�of�16.53%�of�the�power�generated�from�the�project,�amounting�to�40�MW�of�base�load�generation.�An�additional�7�MW�can�be�gained�by�operating�the�unit�in�a�duct�firing�mode.��Under�this�scenario,�GWP’s�entitlement�in�the�project�becomes�47�MW.�������
Hoover�Power�Plant�(Hoover):�Hoover�Dam,�a�concrete�arch�gravity�dam,�is�located�in�the�Black�Canyon�area�of�the�Colorado�River,�on�the�border�between�Arizona�and�Nevada.�The�dam,�located�30�miles�southeast�of�Las�Vegas,�Nevada,�is�named�after�Herbert�Hoover,�who�played�an�instrumental�role�in�its�construction.��Construction�commenced�in�1931,�and�was�completed�in�1936,�a�little�more�than�two�years�ahead�of�schedule.�Upon�completion,�it�was�both�the�world’s�largest�hydroelectric�power�generating�station�and�the�world’s�largest�concrete�structure.����
Hoover�Dam�provides�much�needed�water�and�power�to�the�southwestern�United�States.��The�primary�purpose�of�Hoover�is�to�generate�sufficient�revenue�to�repay�project�construction�monies�advanced�by�the�United�States�Treasury,�and�to�annually�fund�on�going�operation,�maintenance,�and�replacement�expenses.��
Hoover�was�operated�by�the�Southern�California�Edison�Company�(SCE)�and�the�Los�Angeles�Department�of�Water�and�Power�(LADWP)�under�the�supervision�of�the�Bureau�of�Reclamation�of�the�United�States�Department�of�Interior�(Reclamation)�until�the�original�electric�service�contracts�terminated�in�1987.��Upon�termination�of�the�original�50�year�electric�service�contracts,�Reclamation�assumed�control�of�operation�and�maintenance.��Subsequently,�new�contracts�were�negotiated�and�awarded�to�the�original�contractors,�along�with�other�public�agencies,�under�arrangements�that�expire�in�2017.����
�GWP�2019�Integrated�Resource�Plan��
� �18�|�P a g e �
There�are�17�main�turbines�at�Hoover,�nine�on�the�Arizona�side�of�the�Colorado�River,�and�eight�on�the�Nevada�side.��The�original�turbines�were�replaced�through�an�up�rating�program�between�1986�and�1993.�Presently,�Hoover�can�produce�2,080�MW�of�capacity�and�a�yearly�average�generation�of�4.5�billion�kilowatt�hours�to�serve�the�annual�needs�of�nearly�8�million�people�in�Arizona,�southern�California,�and�southern�Nevada.���������
As�an�original�contractor�for�Hoover�power,�GWP’s�entitlement�in�Hoover�totals�20�MW,�with�an�allocation�of�1.5874%�of�the�energy�generated.��Although�the�original�contract�expired�in�2017,�it�was�renewed�for�an�additional�50�year�term.��
Palo�Verde�Nuclear�Generating�Station�(PVNGS):�PVNGS�located�in�Wintersburg,�Arizona,�approximately�55�miles�west�of�Phoenix,�is�currently�the�largest�nuclear�generating�plant�in�the�United�States.�The�facility�is�on�4,000�acres�of�land�and�consists�of�three�reactors,�each�with�an�original�rating�of�1,270�MW.��Units�1�and�2�went�into�commercial�operation�in�1986�and�Unit�3�in�1988.��PVNGS�is�managed�and�operated�by�the�Arizona�Public�Service�Company.����
Due�to�its�location�in�the�Arizona�desert,�PVNGS�is�the�only�nuclear�generating�facility�in�the�world�that�is�not�adjacent�to�a�large�body�of�above�ground�water.�Instead,�it�uses�treated�sewage�effluent�from�several�nearby�municipalities�to�meet�its�cooling�water�needs.�Additionally,�PVNGS�does�not�use�fossil�fuels�to�generate�electricity,�making�it�a�zero�emissions�facility.��
With�the�completion�of�steam�generator�replacements�in�early�2009,�coupled�with�other�changes�and�upgrades,�the�plant�capacity�has�increased�to�approximately�4,010�MW.��GWP�has�rights�to�4.4%�of�SCPPA’s�228�MW�interest�in�this�plant,�which�amounts�to�approximately�11�MW.�The�contract�terminates�on�October�31,�2030.���
Intermountain�Power�Project�(IPP):�IPP�is�a�two�unit,�coal�fired�plant�located�near�Delta,�Utah.��It�is�operated�under�the�supervision�of�LADWP.��Based�upon�a�plant�rating�of�1,800�MW,�GWP’s�present�entitlement�in�this�plant�is�39�MW.��GWP,�together�with�LADWP�and�the�electric�utilities�of�the�Cities�of�Anaheim,�Burbank,�Pasadena,�and�Riverside,�is�a�party�to�a�“take�or�pay”�power�sales�contract�with�the�Intermountain�Power�Agency.��This�contract�was�executed�in�1980�and�is�for�a�term�extending�through�June�15,�2027.��Approximately�6�MW�of�this�purchase�is�from�excess�capacity�sold�by�other�IPP�owners.��This�excess�capacity�may�be�recalled�in�the�future�but�is�included�as�a�firm�resource.�
On�June�16,�2015,�the�City�Council�authorized�Glendale�to�execute�renewal�contracts�for�IPP�that�will�convert�the�existing�1800�MW�coal�plant�into�a�1200�MW�natural�gas�generation�facility�and�to�subscribe�to�up�to�a�50�MW�share�of�the�repowered�IPP.��GWP�subscribed�to�a�4.166%�share�of�the�project�through�June�15,�2077.��On�July�17,�2018,�the�City�Council�authorized�GWP�to�vote�in�favor�of�an�Alternative�Repowering�proposal,�which�reduced�the�size�of�the�proposed�repowering�from�1200�MW�to�840�MW.�With�the�Alternative�Repowering,�GWP�will�retain�its�4.166%�share�of�IPP�generation�and�transmission:�35�MW�of�generation�and�128�MW�of�transmission�from�IPP.��This�IRP�assumes�GWP�will�maintain�participation�in�IPP.�
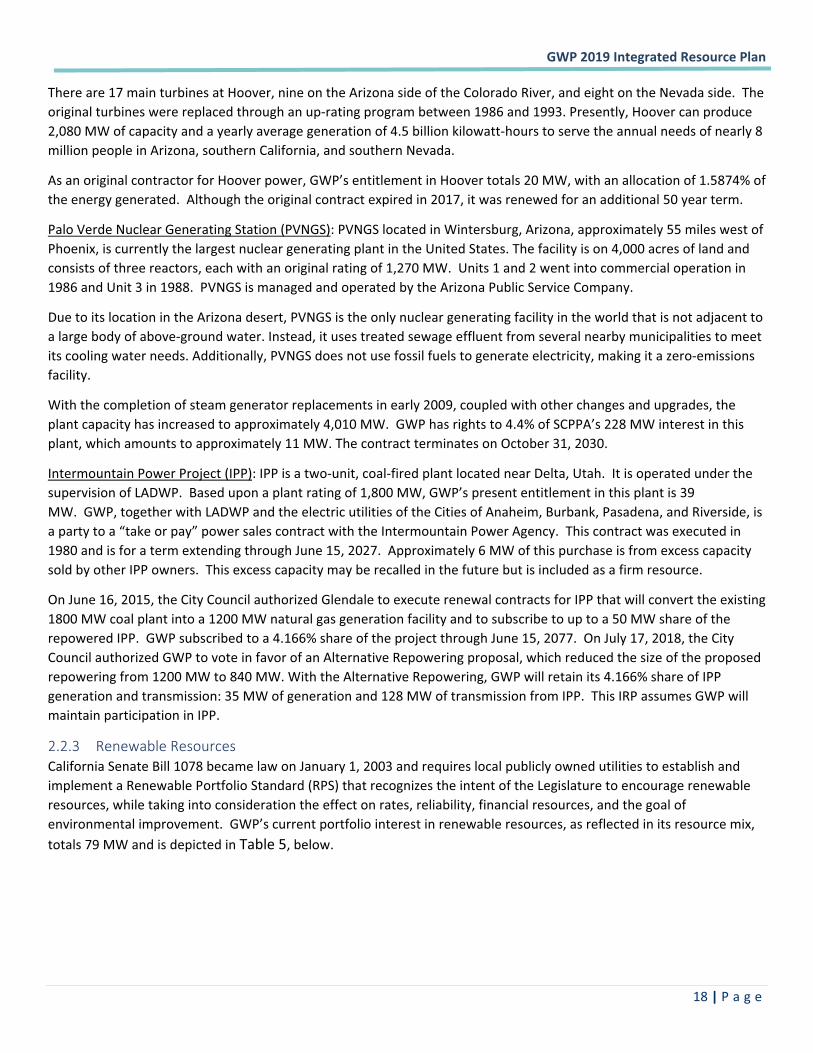
2.2.3 Renewable�Resources��California�Senate�Bill�1078�became�law�on�January�1,�2003�and�requires�local�publicly�owned�utilities�to�establish�and�implement�a�Renewable�Portfolio�Standard�(RPS)�that�recognizes�the�intent�of�the�Legislature�to�encourage�renewable�resources,�while�taking�into�consideration�the�effect�on�rates,�reliability,�financial�resources,�and�the�goal�of�environmental�improvement.��GWP’s�current�portfolio�interest�in�renewable�resources,�as�reflected�in�its�resource�mix,�totals�79�MW�and�is�depicted�in�Table�5,�below.�
�GWP�2019�Integrated�Resource�Plan��
� �19�|�P a g e �
Table�5:�GWP's�Renewable�Resources�
Resource�� Type�� Max�Capacity�(MW)��Tieton�� Small�Hydro�� 6��
High�Winds�� Wind�� 3��Pleasant�Valley�� Wind�� 10��Pebble�Springs�� Wind�� 20��
Ormat�� Geothermal�� 3��Scholl�Landfill�� Landfill�Gas�� 9��
Skylar� Aggregated�Renewable�Energy� 50�(28�renewable)���Tieton�Hydropower�Project�(Tieton):��The�project�was�built�in�2005�06�at�the�base�of�Tieton�Dam,�which�was�constructed�during�the�period�of�1917�25�for�irrigation�purposes.��At�times�during�the�year,�the�water�upstream�of�the�dam�is�frozen�and�the�plant�generates�no�energy.����The�plant�operates�only�when�water�is�released�through�the�dam�for�irrigation�needs,�which�is�anticipated�to�occur�annually�between�the�months�of�May�through�October.����
Tieton�is�located�near�Tieton,�Washington,�forty�miles�west�of�Yakima.��Tieton�has�a�nameplate�capacity�of�13.6�MW.��The�project�assets�include�the�generating�facility,�a�115�kV�transmission�line�connecting�the�generating�station�with�the�Tieton�Substation,�and�associated�operating�licenses�and�permits.����
GWP�acquired�50%�ownership�of�Tieton�in�2009�of�6.8�MW�with�an�annual�energy�allotment�of�approximately�24,000�MWh.���������
High�Winds�Generation�Facility�(High�Winds):��GWP�has�signed�a�25�year�power�purchase�contract�with�PPM,�now�Avangrid�Renewables�(AGR),�for�the�purchase�of�wind�powered�electrical�energy�associated�with�a�9�MW�share�of�the�145.8�MW�High�Winds�wind�generation�facility�located�in�Solano�County,�California.��The�contract�allows�GWP�to�have�power�delivered�at�a�flat�3�MW�based�on�a�33%�capacity�factor�at�Mead�Substation�(Mead).��Therefore,�this�resource�will�provide�26,208�MWh�of�renewable�energy�on�an�annual�basis�to�GWP�customers.��This�contract�commenced�on�September�1,�2003.��
Southwest�Wyoming�Wind�Generation�Facility�(Pleasant�Valley):��GWP�has�signed�a�16�year�power�purchase�contract�with�PPM,�now�Avangrid�Renewables�(AGR).��This�2nd�wind�power�contract�with�AGR�will�provide�up�to�10�MW�of�capacity�at�a�33%�capacity�factor�from�a�generation�facility�located�in�southwest�Wyoming.��The�contract�commenced�in�July�2006,�and�currently�provides�approximately�29,000�MWh�of�renewable�energy�on�an�annual�basis�to�GWP’s�customers.����
Pebble�Springs�Wind�Project�(Pebble�Springs):��GWP�has�signed�an�18�year�agreement�with�SCPPA�for�the�purchase�of�20�MW�of�wind�powered�generation�located�in�Gilliam�County,�Oregon.����
GWP’s�share�of�Pebble�Springs�is�20�MW�with�an�expected�capacity�factor�of�33%.��The�project�will�provide�GWP�with�approximately�56,000�MWh�of�energy�per�year.��The�project�commenced�service�on�January�1,�2009.���
Additionally,�GWP�has�an�annual�arrangement,�currently�with�Powerex�(PWX),�for�the�non�simultaneous�exchange�of�Pebble�Springs�energy.��PWX�will�receive�all�energy�generated�over�the�entire�year�at�the�plant�location�(Jones�Canyon�Substation)�and�redeliver�on�peak�exchange�energy�during�the�months�of�March�through�October�at�NOB�on�the�DC�Intertie,�where�GWP�has�rights�to�receive�and�deliver�the�energy�to�GWP's�service�area.����
Ormat�Geothermal�Power�Project�(Ormat):�GWP�has�signed�a�25�year�contract�with�SCPPA�for�the�purchase�of�3�MW�of�geothermal�power�delivered�at�Sylmar.�Ormat�is�located�in�the�geothermal�areas�of�Imperial�Valley,�California.�This�
�GWP�2019�Integrated�Resource�Plan��
� �20�|�P a g e �
contract�commenced�in�February�2006.��Currently,�GWP�receives�approximately�25,200�MWh�of�renewable�energy�on�an�annual�basis�from�this�project.��
Skylar:��This�contract�is�a�25�year�renewable�transaction�executed�under�a�WSPP�Agreement,�for�the�delivery�of�50MW�energy,�55%�of�which�comes�from�RPS�eligible�facilities�and�20%�incremental�energy�from�carbon�free�sources.�This�transaction�provides�Glendale�approximately�160,600�MWh�of�renewable�energy�per�year�through�2040.�
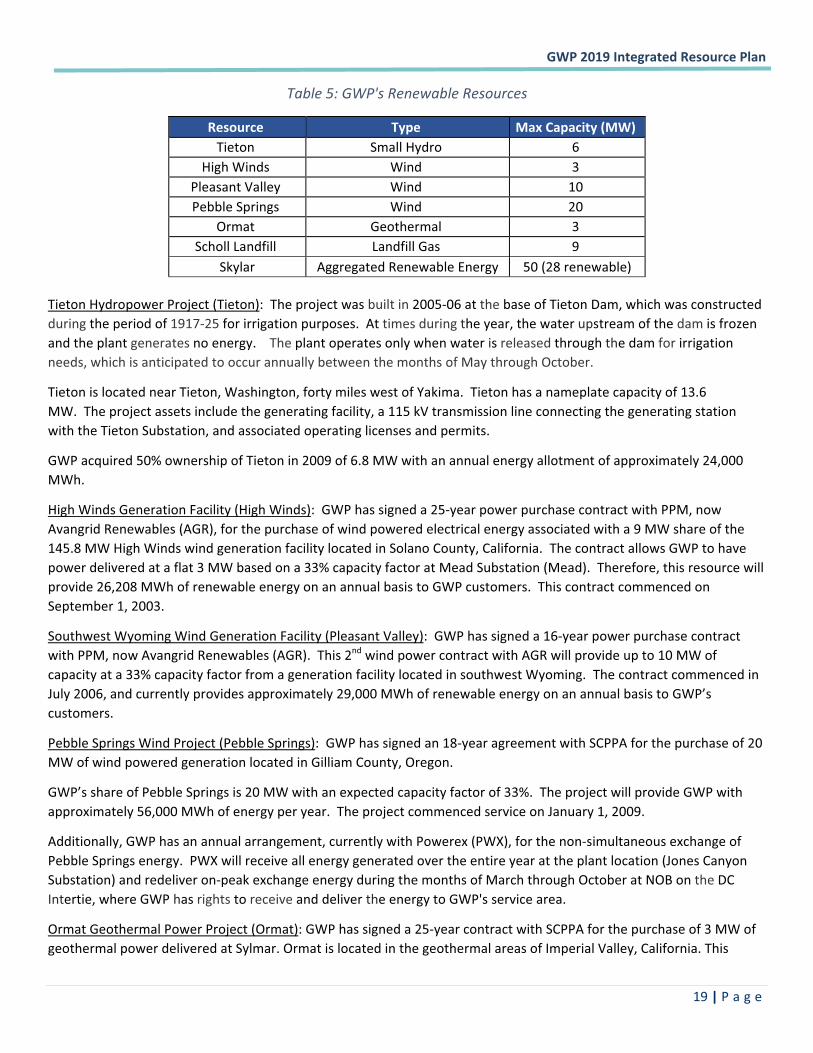
2.2.4 Transmission�Assets�GWP�has�contracted�capacity�along�a�number�of�transmission�lines,�as�shown�in�Figure�5,�in�order�to�bring�in�power�from�non�local�contracted�resources�including�wind�and�hydro�assets,�nuclear�power,�the�Skylar�renewable�energy�contract,�and�the�IPP.��
Figure�5:�Geographic�Transmission�Schematic�
�
GWP�has�contracts�with�resources�and�transmission�across�a�wide�geographic�area.�However,�all�transmission�is�bottlenecked�down�to�the�Pacific�DC�intertie�(listed�as�the�blue�arrow�connected�to�Air�Way�with�150�MW�capacity�in�the�figure�above)�and�the�Southwest�AC�intertie�(listed�as�the�blue�arrow�connected� to�Air�Way�with�112�MW�capacity�above).�All� non�local� resource�–� renewable,� thermal,� and�market�purchases�–�must�be�received� through� this� limited� transmission� capacity.� Furthermore,� the� Pacific�DC� intertie� has� 50�MW�contractually� dedicated� to� the� Sylmar� hub,�reducing�the�actual�usable�capacity�to�100�MW.�The�Southwest�AC�intertie�is�constructed�from�a�technology�that�is�sensitive�to�temperature�and�is�generally�de�rated�to�100�MW�during�the�hottest�days�of�the�year,�which�happen�to�be�the�exact�times�of�peak�load.�This�is�why�both�lines�have�been�treated�as�100�MW�resource�throughout�this�IRP.��
�GWP�2019�Integrated�Resource�Plan��
� �21�|�P a g e �
GWP’s�interconnection�with�other�utilities�is�through�the�Air�Way�Receiving�Station�(Air�Way)�and�the�Western�Receiving�Station�(WRS).��The�Air�Way�interconnection�is�used�to�receive�power�from�the�Pacific�Northwest�(PNW)�and�the�Desert�Southwest�(DSW)�regions,�while�WRS�is�used�to�receive�power�from�the�Magnolia�Power�Plant�(MPP).��Descriptions�of�the�transmission�resources�that�feed�into�Air�Way�and�WRS�are�as�follows.�
� Pacific�Northwest�DC�Intertie�(Pacific�DC�Intertie):�The�Pacific�DC�Intertie�is�a�direct�current�transmission�line�that�extends�846�miles�from�The�Dalles,�Oregon,�to�Sylmar,�California.��The�500�kilovolt�(kV)�High�Voltage�Direct�Current�(HVDC)�line�can�transmit�up�to�3,100�MW�of�power�from�the�PNW�to�participants�in�California,�and�2,730�MW�from�California�to�the�PNW.��GWP�owns�3.846%�of�the�line�or�approximately�119�MW�of�capacity�in�the�north�to�south�direction�and�38�MW�of�capacity�(due�to�an�operational�limitation)�in�the�south�to�north�direction.���
� The�Southern�Transmission�System�(STS):�The�STS�is�a�direct�current�transmission�line�between�IPP�near�Delta,�Utah,�and�Adelanto,�California.��This�500�kV�HVDC�line�is�490�miles�long�and�transmits�the�California�participants’�entitlements�from�IPP.��Up�to�2,400�MW�of�power�can�be�transmitted�over�the�STS�to�participating�members�in�southern�California.��GWP’s�share�of�the�line�is�2.274%,�or�approximately�55�MW.���
� The�Northern�Transmission�System�(NTS):�The�NTS�is�an�alternating�current�system�between�IPP�and�Mona�in�Utah,�and�IPP�and�the�Gonder�Switching�Station�in�Nevada.��GWP’s�entitlements�(varies�according�to�time�of�year)�in�the�NTS�are�up�to�21�MW�from�IPP�to�Mona�and�up�to�3�MW�from�IPP�to�Gonder.��
� Mead�Phoenix�&�Mead�Adelanto�Transmission�Line�Projects:�These�two�SCPPA�projects�commenced�commercial�operation�on�April�15,�1996.��The�Mead�Phoenix�line�can�transfer�approximately�1,900�MW�of�power�and�extends�from�the�Westwing�Switching�Station�near�Phoenix,�Arizona,�to�Mead�near�Boulder�City,�Nevada.��The�Mead�Adelanto�line�can�transfer�approximately�1,800�MW�of�power�and�extends�from�Mead�through�the�Marketplace�Substation�(Marketplace)�to�the�Adelanto�Switching�Station�(Adelanto)�near�Adelanto,�California.��Marketplace�was�constructed�to�facilitate�the�interconnection�between�these�two�projects.��GWP’s�entitlement�on�the�Mead�Phoenix�transmission�line�is�41�MW.��Additionally,�GWP’s�entitlements�on�the�Mead�Adelanto�transmission�line�are�112�MW�on�the�Mead�Marketplace�segment�and�97�MW�on�the�Marketplace�Adelanto�segment.��These�lines�provide�an�alternative�path�for�GWP’s�purchases�from�PVNGS,�SJ3,�and�Hoover.����
� Various�Other�Transmission�Service�Contracts:�Other�firm�transmission�service�contracts�with�LADWP�and�BWP�provide�GWP�with�the�ability�to�transmit�the�power�associated�with�the�aforementioned�transmission�projects�to�Air�Way�in�Glendale.��The�following�is�a�listing�of�these�agreements:��
� Hoover/Mead–Air�Way:��This�contract�with�LADWP�is�for�33�MW�of�bi�directional�firm�transmission�rights�between�Hoover/Mead�and�Air�Way.��This�contract�is�used�to�transmit�GWP’s�Hoover�entitlements�into�Glendale.��This�contract�will�terminate�on�September�30,�2017.��However,�GWP�has�the�right�to�renew�this�contract�for�a�term�concurrent�with�any�extension�of�GWP’s�contract�for�electric�service�from�Hoover.���
� Adelanto–Air�Way:��This�contract�with�LADWP�is�for�55�MW�of�bi�directional�firm�transmission�rights�between�Adelanto�and�Air�Way.��This�contract�is�used�to�transmit�GWP’s�IPP�entitlements�into�Glendale.��This�contract�will�terminate�on�June�15,�2027.��However,�GWP�has�the�right�to�renew�this�contract�for�a�term�concurrent�with�any�extension�of�GWP’s�contract�for�power�from�IPP.��
� McCullough–Victorville�Line�2:��This�contract�with�LADWP�is�for�26�MW�of�bi�directional�firm�transmission�rights�between�the�McCullough�Switching�Station�and�the�Victorville�Switching�Station�(Victorville).��This�contract�terminates�on�May�31,�2030.��
� Victorville–Air�Way:��This�contract�with�LADWP�is�for�26�MW�of�bi�directional�firm�transmission�rights�between�Victorville/Adelanto/Lugo�and�Air�Way.��This�contract�is�used�to�transmit�GWP’s�McCullough–Victorville�Line�2�entitlements�into�Glendale.��This�contract�will�terminate�on�May�31,�2030.����
� Sylmar–Air�Way:��This�contract�with�LADWP�is�for�50�MW�of�bi�directional�firm�transmission�rights�between�the�Sylmar�Switching�Station�(Sylmar)�and�Air�Way.�Termination�of�this�contract�may�occur�upon�ninety�(90)�days’�advanced�written�notice�by�either�party.���
�GWP�2019�Integrated�Resource�Plan��
� �22�|�P a g e �
� 1968�Interchange�Agreement:��This�agreement�with�LADWP�provides�for�bi�directional�firm�transmission�service�between�Sylmar�and�Air�Way�of�up�to�a�maximum�of�100�MW.��This�contract�is�primarily�used�to�transmit�power�delivered�over�the�DC�Intertie�into�Glendale.��This�contract�shall�continue�in�effect�until�the�termination�of�Hoover�or�the�DC�Intertie�project,�or�any�extension�of�either�of�these,�whichever�is�later.���
� Burbank–Glendale�Interconnection:��The�closure�of�BWP’s�Olive/Capon/Western�#1�and�#2�lines�(69�kV)�allows�Glendale�to�transfer�up�to�160�MW�of�energy.�If�one�line�is�down,�the�rating�is�reduced�to�80�MW.��The�1�hour�emergency�rating�for�each�line�is�125�MW.�After�one�hour,�the�line�will�be�rated�at�80�MW�maximum.��This�interconnection�is�primarily�utilized�to�deliver�Magnolia�energy�to�GWP.���
Despite�the�large�number�of�transmission�lines�shown�in�the�schematic,�all�non�local�power�is�forced�into�the�transmission�bottleneck�of�the�only�two�transmission�lines�going�into�the�LA�basin�–�the�Pacific�DC�Intertie�(running�north�of�Glendale,�listed�as�150�MW�in�the�schematic)�and�the�Southwest�AC�intertie�(running�to�the�east�of�Glendale,�listed�as�112�MW�in�the�schematic).��
The�bottleneck�posed�by�the�Pacific�and�Southwest�interties�imposes�a�capacity�limit�on�the�amount�of�energy�that�GWP�is�able�to�bring�into�Glendale�and�also�carries�a�reliability�risk�since�an�outage�on�either�line�comprises�a�full�50%�of�all�available�transmission�capacity.�The�capacity�of�these�interties�is�further�reduced�due�to�complications�with�how�these�interties�are�managed.�While�the�Pacific�DC�intertie�is�listed�at�150�MW,�50�MW�of�that�capacity�is�reserved�exclusively�for�transmitting�power�from�the�Sylmar�node.�This�node�is�frequently�oversubscribed�during�super�peak�demand�hours,�resulting�in�CAISO�preventing�GWP�from�purchasing�any�power�from�Sylmar�or�getting�any�use�from�the�50�MW�of�reserved�transmission�capacity�during�the�times�it�is�most�needed.�Hence,�the�Pacific�DC�intertie�is�considered�to�be�only�100�MW�of�capacity�for�the�purposes�of�planning�this�IRP,�since�that�is�all�that�is�available�to�GWP�during�peak�demand�hours.�Similarly,�while�the�Southwest�AC�intertie�is�listed�at�112�MW,�it�is�generally�de�rated�down�to�~100�MW�during�hot�weather�events�which�nearly�always�coincide�with�times�of�super�peak�demand.�This�IRP�considers�the�Southwest�AC�intertie�to�be�100�MW�of�capacity�since�that�is�all�that�is�reliably�available�during�peak�load�hours.�
One�further�caveat�with�the�transmission�system�involves�the�relationship�between�the�IPP�and�the�STS�transmission�line.�The�STS�transmission�line�(55�MW�going�northeast�into�Utah)�is�currently�GWP’s�only�way�of�accessing�the�plentiful,�cheap,�and�reliable�wind�power�resources�available�in�Wyoming�as�well�as�any�other�renewable�projects�that�are�being�developed�and�interconnected�at�the�IPP�bus.�For�the�purposes�of�increasing�the�amount�of�low�cost�renewable�power�that�GWP�imports,�GWP�considers�it�a�priority�to�maintain�access�to�the�STS�transmission�line.��However,�GWP�access�to�the�STS�line�is�contractually�contingent�upon�maintaining�a�share�of�the�IPP�power�plant.�In�simple�terms,�this�means�that�if�GWP�wants�to�have�access�to�cheap�renewable�resources,�it�must�purchase�a�share�of�the�IPP�plant�and�the�scheduled�repower�of�that�plant.�For�this�reason,�the�IRP�assumes�that�GWP�will�maintain�a�share�of�the�repower�IPP�and�maintain�access�to�these�resources.�
Grayson�Units�1�8�are�long�past�their�intended�life�cycles�and�will�be�retiring�in�2021.�This�173�MW�reduction�in�local�generation�capacity�will�leave�GWP�with�insufficient�resources�to�reliably�meet�the�energy�needs�of�Glendale,�thus�the�need�to�procure�new�power�resources.�GWP�initially�proposed�building�262�MW�of�combined�cycle�(CC)�and�combustion�turbine�(CT)�gas�powered�resources�at�the�Grayson�location4�(the�Original�Siemens�Repower�Plan).�Based�on�stakeholder�input,�the�City�Council�to�requested�GWP�to�explore�more�local�and�clean�resource�options.��In�May�2018,�GWP�issued�the�Clean�Energy�RFP�to�find�clean�energy�resources�to�reduce�the�GHG�impacts�of�the�repower.�(The�Clean�Energy�RFP�process�is�discussed�in�more�detail�in�Section�4.)�
The�resources�submitted�in�the�Clean�Energy�RFP�have�enabled�GWP�to�create�this�revised�IRP,�resulting�in�a�cleaner�and�affordable�resource�portfolio�than�the�one�initially�proposed�in�2015.�This�IRP�presents�that�plan�in�depth�and�aims�to�
������������������������������������������������������������4�http://graysonrepowering.com/#overview�
�GWP�2019�Integrated�Resource�Plan��
� �23�|�P a g e �
clarify�how�this�plan�is�the�best�solution�for�balancing�competing�reliability,�environmental,�and�budgetary�goals�of�GWP�and�the�community�of�Glendale.�While�GWP�acknowledges�that�no�power�plan�will�ever�be�able�to�meet�100%�of�the�desired�goals�of�all�citizens,�we�are�proud�to�present�this�plan�and�gratefully�acknowledge�the�role�played�by�the�Glendale�community�and�City�Council�in�steering�GWP�towards�a�plan�sets�up�Glendale�for�a�bold�clean�energy�future.�
2.3 SB�350�and�SB�100�Requirements��Glendale�Water�and�Power’s�mission�is�to�provide�clean,�reliable�and�affordable�power�to�the�diverse�citizens�and�businesses�of�Glendale�24�hours�per�week,�365�days�per�year.�GWP�has�provided�this�essential�service�for�decades�relying�on�a�diverse�mix�of�local�natural�gas�power�plants�and�power�generated�by�a�mix�of�remote�hydro�dams,�nuclear,�wind,�solar,�and�coal.�GWP�has�also�been�a�leader�in�implementing�energy�efficiency�programs�to�manage�load�growth�and�to�avoid�the�need�to�invest�in�new�power�plant�capacity.�In�2018,�Glendale’s�clean�energy�content�was�36%.�
California�has�been�a�leader�in�driving�renewable�energy�from�experimental�technology�towards�the�foundation�of�energy�supply�for�the�21st�century.�The�primary�policy�mechanism�has�been�the�renewable�portfolio�standard�(RPS),�which�requires�utilities�with�obligations�to�serve�customer�load�to�procure�an�increasing�percentage�of�their�energy�from�non�polluting�renewable�resources�including�wind,�solar,�small�hydro,�biomass,�and�geothermal.�Today�California�is�on�track�to�serve�33%�of�its�electricity�from�renewables�by�2020.��
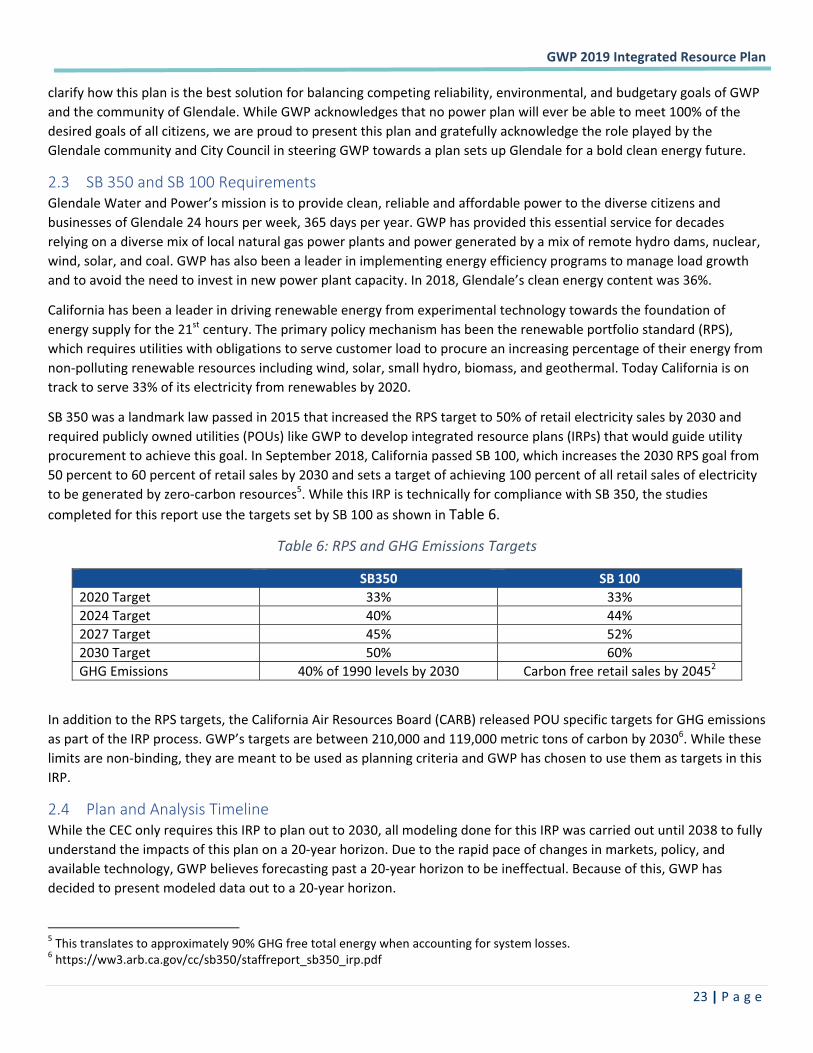
SB�350�was�a�landmark�law�passed�in�2015�that�increased�the�RPS�target�to�50%�of�retail�electricity�sales�by�2030�and�required�publicly�owned�utilities�(POUs)�like�GWP�to�develop�integrated�resource�plans�(IRPs)�that�would�guide�utility�procurement�to�achieve�this�goal.�In�September�2018,�California�passed�SB�100,�which�increases�the�2030�RPS�goal�from�50�percent�to�60�percent�of�retail�sales�by�2030�and�sets�a�target�of�achieving�100�percent�of�all�retail�sales�of�electricity�to�be�generated�by�zero�carbon�resources5.�While�this�IRP�is�technically�for�compliance�with�SB�350,�the�studies�completed�for�this�report�use�the�targets�set�by�SB�100�as�shown�in�Table�6.����
Table�6:�RPS�and�GHG�Emissions�Targets�
� SB350� SB�100�2020�Target� 33%� 33%�2024�Target� 40%� 44%�2027�Target� 45%� 52%�2030�Target� 50%� 60%�GHG�Emissions�� 40%�of�1990�levels�by�2030� Carbon�free�retail�sales�by�20452
�
In�addition�to�the�RPS�targets,�the�California�Air�Resources�Board�(CARB)�released�POU�specific�targets�for�GHG�emissions�as�part�of�the�IRP�process.�GWP’s�targets�are�between�210,000�and�119,000�metric�tons�of�carbon�by�20306.�While�these�limits�are�non�binding,�they�are�meant�to�be�used�as�planning�criteria�and�GWP�has�chosen�to�use�them�as�targets�in�this�IRP.��
2.4 Plan�and�Analysis�Timeline�While�the�CEC�only�requires�this�IRP�to�plan�out�to�2030,�all�modeling�done�for�this�IRP�was�carried�out�until�2038�to�fully�understand�the�impacts�of�this�plan�on�a�20�year�horizon.�Due�to�the�rapid�pace�of�changes�in�markets,�policy,�and�available�technology,�GWP�believes�forecasting�past�a�20�year�horizon�to�be�ineffectual.�Because�of�this,�GWP�has�decided�to�present�modeled�data�out�to�a�20�year�horizon.�
������������������������������������������������������������5�This�translates�to�approximately�90%�GHG�free�total�energy�when�accounting�for�system�losses.���6�https://ww3.arb.ca.gov/cc/sb350/staffreport_sb350_irp.pdf�
�GWP�2019�Integrated�Resource�Plan��
� �24�|�P a g e �
GWP�is,�however,�thinking�further�in�the�future�than�20�years�and�plotting�a�pathway�towards�100%�clean�energy�by�2045.�While�we�have�run�models�out�to�2045,�GWP�stresses�that�it�is�nearly�impossible�to�predict�the�technological,�market,�and�legal�conditions�of�the�world�25+�years�in�the�future,�and�so�minimal�emphasis�is�put�on�the�results�of�these�studies.�Instead�of�analyzing�numerical�predictions�of�markets�and�power�availability,�this�IRP�will�instead�attempt�to�lay�out�potential�pathways�to�achieve�100%�Clean�Energy�by�2045�and�understand�the�developments�that�will�be�required�to�get�there.�
3 Analysis�of�Load�and�Resource�Needs�This�IRP�used�the�CEC’s�2017�Integrated�Energy�Policy�Report�mid�demand�mid�AAEE/AAPV7�energy�demand�and�peak�load�forecasts8�as�a�baseline�for�all�load�forecasts�in�the�modeling�process.�This�forecast�includes�assumptions�for�the�expected�expansion�of�existing�and�future�energy�efficiency�(EE)�and�photovoltaic�(PV)�programs�as�calculated�by�CEC�analysts�using�historical�knowledge�of�Glendale�and�a�wider�understanding�of�future�developments�in�the�California�energy�sector.��
Load�contribution�from�electric�vehicles�(EV)�was�calculated�using�the�CEC�electric�vehicle�forecast�calculator9.�The�analysis�assumes�an�aggressive�deployment�of�electric�vehicles�that�meets�the�State’s�goal�of�5�million�EVs�on�California’s�roads�by�2030.��
Load�forecasts�were�input�to�PowerSimm’s�simulation�module�(“Sim�Engine”).�PowerSimm�is�a�stochastic�construct�and�through�100�or�more�simulations,�or�“sim�reps,”�we�probabilistically�envelop�all�possible�future�states�through�a�coherent�and�appropriately�correlated�set�of�data�inputs�and�forecasts.�In�the�PowerSimm�framework,�simulated�weather�drives�GWP’s�hourly�load�values.�In�this�way�we�are�able�to�model�100�different�realistic�weather�futures�that�drive�100�different�load�futures.�We�can�then�calculate�the�mean,�median,�and�any�percentile�(i.e.�P95,�P5,�etc.)�demand�forecasts�using�this�approach.�For�more�information�on�the�modeling�platform�see�Appendix�B.�
3.1 Demand�Forecast�Summary��While�customer�energy�consumption�is�the�primary�driver�of�load�demand�in�Glendale,�recent�technological�developments�–�such�as�rooftop�solar,�energy�efficient�lighting,�electric�vehicles,�and�smart�thermostats�–�are�beginning�to�have�a�key�secondary�impact�on�load�growth.�In�recent�years,�EE�and�PV�installations�have�been�moderating�the�growth�in�load.�However,�the�rise�of�electric�vehicles�–�and�especially�their�predicted�increase�within�the�next�few�years�–�is�expected�to�increase�electric�load�as�the�power�consumption�of�vehicles�shifts�from�fossil�fuel�gasoline�to�electricity.�
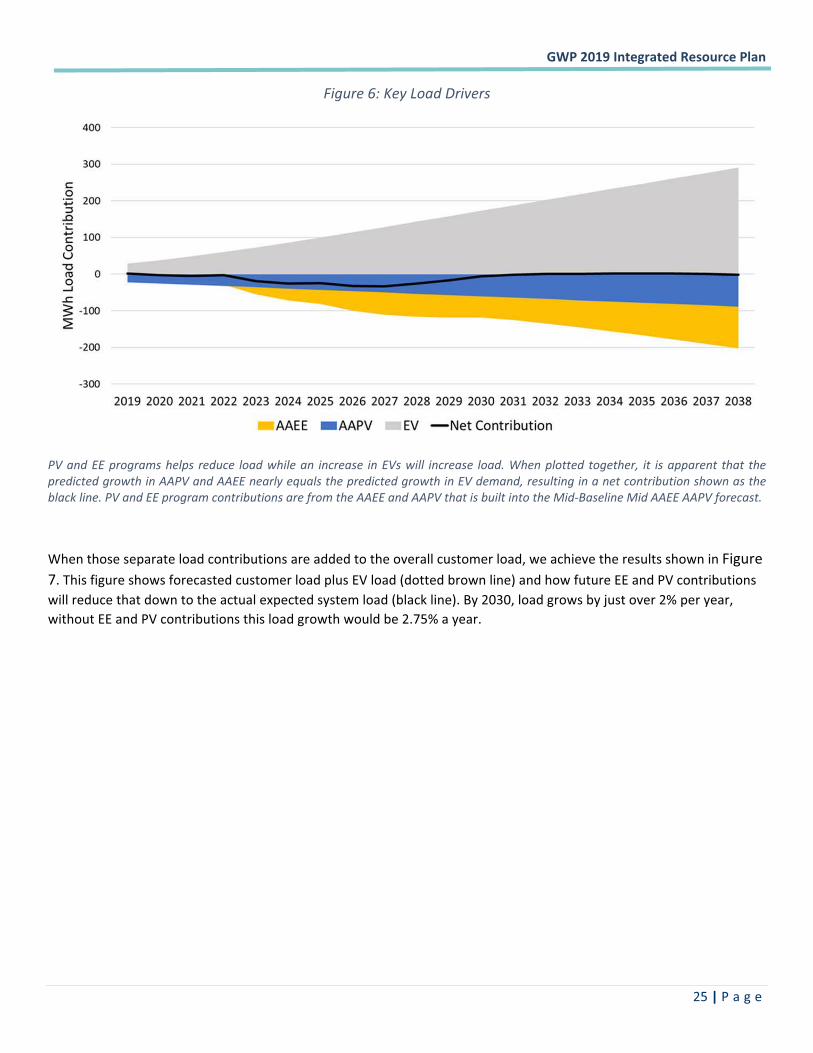
Figure�6�shows�the�forecasted�contributions�of�AAPV,�AAEE,�and�EVs�to�the�overall�load�within�Glendale,�resulting�in�an�overall�minimal�effect�on�total�demand.�
������������������������������������������������������������7�“Additional�achievable�energy�efficiency”/”Additional�achievable�photovoltaic”�(aka�rooftop�solar)�8�Retrieved�from�https://www.energy.ca.gov/2017_energypolicy/documents/2018�02�21_business_meeting/2018�02�21_middemandcase_forecst.php.�9�Retrieved�from�https://www.energy.ca.gov/2017_energypolicy/documents/#05312017at930�as�“Light�Duty�Plug�In�Electric�Vehicle�Energy�and�Emission�Calculator”.�
�GWP�2019�Integrated�Resource�Plan��
� �25�|�P a g e �
Figure�6:�Key�Load�Drivers�
�
PV�and�EE�programs�helps� reduce� load�while�an� increase� in�EVs�will� increase� load.�When�plotted� together,� it� is�apparent� that� the�predicted�growth�in�AAPV�and�AAEE�nearly�equals�the�predicted�growth�in�EV�demand,�resulting�in�a�net�contribution�shown�as�the�black�line.�PV�and�EE�program�contributions�are�from�the�AAEE�and�AAPV�that�is�built�into�the�Mid�Baseline�Mid�AAEE�AAPV�forecast.��
�
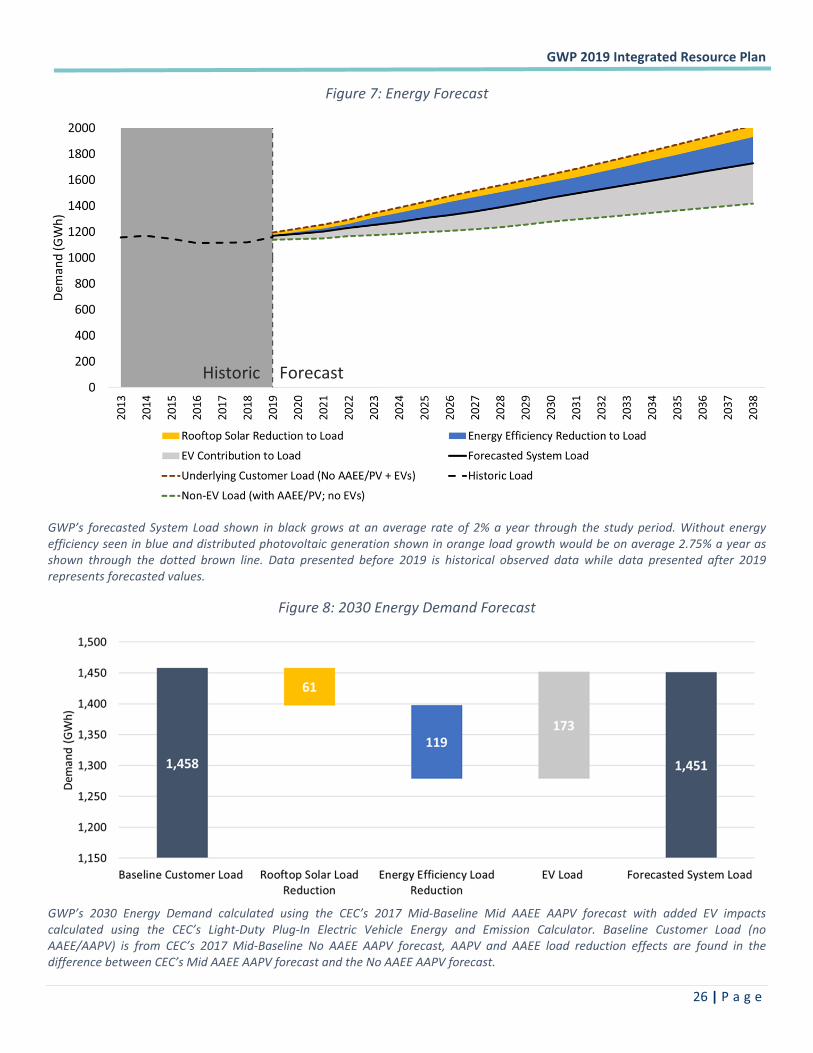
When�those�separate�load�contributions�are�added�to�the�overall�customer�load,�we�achieve�the�results�shown�in�Figure�7.�This�figure�shows�forecasted�customer�load�plus�EV�load�(dotted�brown�line)�and�how�future�EE�and�PV�contributions�will�reduce�that�down�to�the�actual�expected�system�load�(black�line).�By�2030,�load�grows�by�just�over�2%�per�year,�without�EE�and�PV�contributions�this�load�growth�would�be�2.75%�a�year.��
�GWP�2019�Integrated�Resource�Plan��
� �26�|�P a g e �
Figure�7:�Energy�Forecast���
�
GWP’s� forecasted�System�Load� shown� in�black�grows�at�an�average� rate�of�2%�a�year� through� the� study�period.�Without� energy�efficiency�seen�in�blue�and�distributed�photovoltaic�generation�shown�in�orange�load�growth�would�be�on�average�2.75%�a�year�as�shown� through� the� dotted� brown� line.� Data� presented� before� 2019� is� historical� observed� data� while� data� presented� after� 2019�represents�forecasted�values.�
Figure�8:�2030�Energy�Demand�Forecast�
�GWP’s� 2030� Energy� Demand� calculated� using� the� CEC’s� 2017� Mid�Baseline� Mid� AAEE� AAPV� forecast� with� added� EV� impacts�calculated� using� the� CEC’s� Light�Duty� Plug�In� Electric� Vehicle� Energy� and� Emission� Calculator.� Baseline� Customer� Load� (no�AAEE/AAPV)� is� from� CEC’s� 2017�Mid�Baseline� No� AAEE� AAPV� forecast,� AAPV� and� AAEE� load� reduction� effects� are� found� in� the�difference�between�CEC’s�Mid�AAEE�AAPV�forecast�and�the�No�AAEE�AAPV�forecast.���
Historic� Forecast
�GWP�2019�Integrated�Resource�Plan��
� �27�|�P a g e �
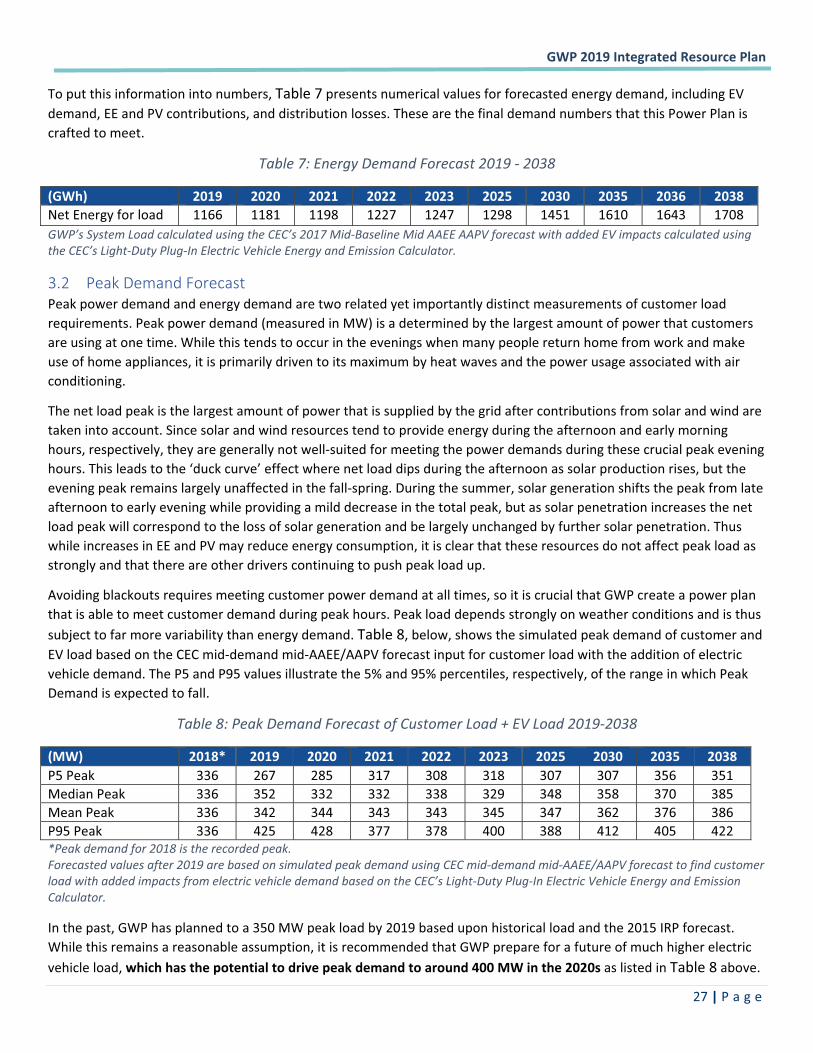
To�put�this�information�into�numbers,�Table�7�presents�numerical�values�for�forecasted�energy�demand,�including�EV�demand,�EE�and�PV�contributions,�and�distribution�losses.�These�are�the�final�demand�numbers�that�this�Power�Plan�is�crafted�to�meet.�
Table�7:�Energy�Demand�Forecast�2019���2038�
(GWh)� 2019� 2020� 2021� 2022� 2023� 2025� 2030� 2035� 2036� 2038�Net�Energy�for�load� 1166� 1181� 1198� 1227� 1247� 1298� 1451� 1610� 1643� 1708�GWP’s�System�Load�calculated�using�the�CEC’s�2017�Mid�Baseline�Mid�AAEE�AAPV�forecast�with�added�EV�impacts�calculated�using�the�CEC’s�Light�Duty�Plug�In�Electric�Vehicle�Energy�and�Emission�Calculator.��
3.2 Peak�Demand�Forecast��Peak�power�demand�and�energy�demand�are�two�related�yet�importantly�distinct�measurements�of�customer�load�requirements.�Peak�power�demand�(measured�in�MW)�is�a�determined�by�the�largest�amount�of�power�that�customers�are�using�at�one�time.�While�this�tends�to�occur�in�the�evenings�when�many�people�return�home�from�work�and�make�use�of�home�appliances,�it�is�primarily�driven�to�its�maximum�by�heat�waves�and�the�power�usage�associated�with�air�conditioning.��
The�net�load�peak�is�the�largest�amount�of�power�that�is�supplied�by�the�grid�after�contributions�from�solar�and�wind�are�taken�into�account.�Since�solar�and�wind�resources�tend�to�provide�energy�during�the�afternoon�and�early�morning�hours,�respectively,�they�are�generally�not�well�suited�for�meeting�the�power�demands�during�these�crucial�peak�evening�hours.�This�leads�to�the�‘duck�curve’�effect�where�net�load�dips�during�the�afternoon�as�solar�production�rises,�but�the�evening�peak�remains�largely�unaffected�in�the�fall�spring.�During�the�summer,�solar�generation�shifts�the�peak�from�late�afternoon�to�early�evening�while�providing�a�mild�decrease�in�the�total�peak,�but�as�solar�penetration�increases�the�net�load�peak�will�correspond�to�the�loss�of�solar�generation�and�be�largely�unchanged�by�further�solar�penetration.�Thus�while�increases�in�EE�and�PV�may�reduce�energy�consumption,�it�is�clear�that�these�resources�do�not�affect�peak�load�as�strongly�and�that�there�are�other�drivers�continuing�to�push�peak�load�up.��
Avoiding�blackouts�requires�meeting�customer�power�demand�at�all�times,�so�it�is�crucial�that�GWP�create�a�power�plan�that�is�able�to�meet�customer�demand�during�peak�hours.�Peak�load�depends�strongly�on�weather�conditions�and�is�thus�subject�to�far�more�variability�than�energy�demand.�Table�8,�below,�shows�the�simulated�peak�demand�of�customer�and�EV�load�based�on�the�CEC�mid�demand�mid�AAEE/AAPV�forecast�input�for�customer�load�with�the�addition�of�electric�vehicle�demand.�The�P5�and�P95�values�illustrate�the�5%�and�95%�percentiles,�respectively,�of�the�range�in�which�Peak�Demand�is�expected�to�fall.�
Table�8:�Peak�Demand�Forecast�of�Customer�Load�+�EV�Load�2019�2038�
(MW)� 2018*� 2019� 2020� 2021� 2022� 2023� 2025� 2030� 2035� 2038�P5�Peak� 336� 267� 285� 317� 308� 318� 307� 307� 356� 351�Median�Peak� 336� 352� 332� 332� 338� 329� 348� 358� 370� 385�Mean�Peak�� 336� 342� 344� 343� 343� 345� 347� 362� 376� 386�P95�Peak� 336� 425� 428� 377� 378� 400� 388� 412� 405� 422�*Peak�demand�for�2018�is�the�recorded�peak.��Forecasted�values�after�2019�are�based�on�simulated�peak�demand�using�CEC�mid�demand�mid�AAEE/AAPV�forecast�to�find�customer�load�with�added�impacts�from�electric�vehicle�demand�based�on�the�CEC’s�Light�Duty�Plug�In�Electric�Vehicle�Energy�and�Emission�Calculator.��
In�the�past,�GWP�has�planned�to�a�350�MW�peak�load�by�2019�based�upon�historical�load�and�the�2015�IRP�forecast.�While�this�remains�a�reasonable�assumption,�it�is�recommended�that�GWP�prepare�for�a�future�of�much�higher�electric�vehicle�load,�which�has�the�potential�to�drive�peak�demand�to�around�400�MW�in�the�2020s�as�listed�in�Table�8�above.��
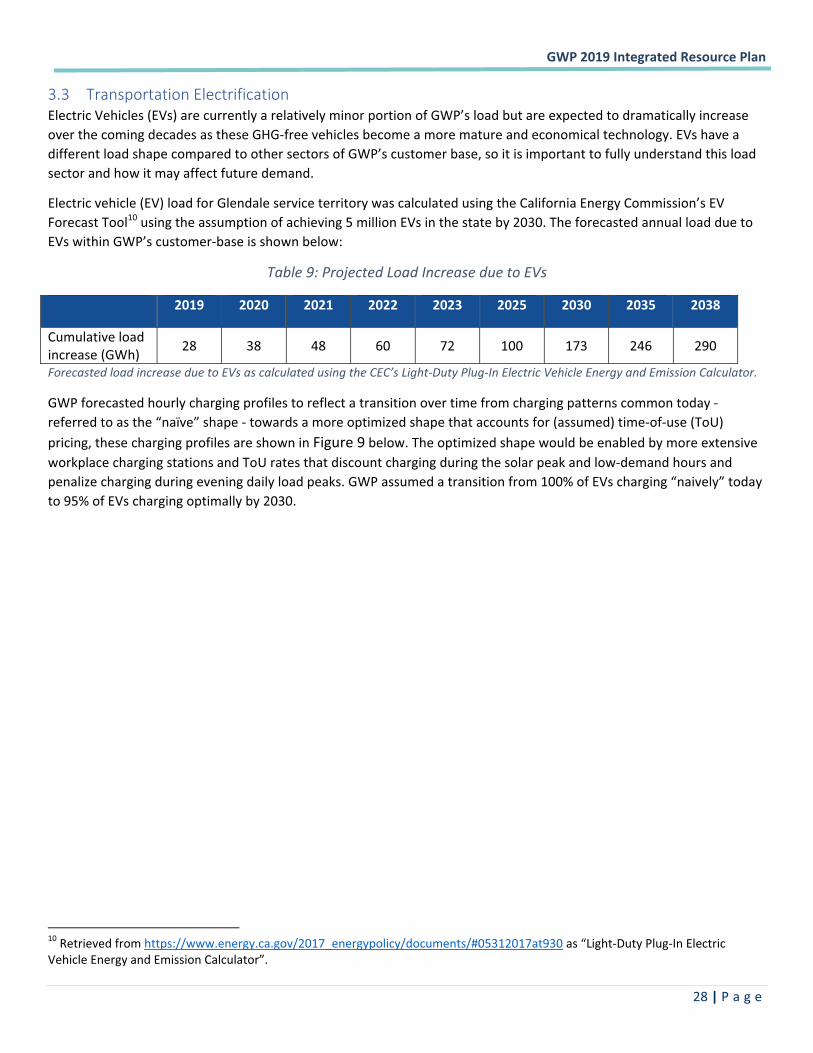
�GWP�2019�Integrated�Resource�Plan��
� �28�|�P a g e �
3.3 Transportation�Electrification��Electric�Vehicles�(EVs)�are�currently�a�relatively�minor�portion�of�GWP’s�load�but�are�expected�to�dramatically�increase�over�the�coming�decades�as�these�GHG�free�vehicles�become�a�more�mature�and�economical�technology.�EVs�have�a�different�load�shape�compared�to�other�sectors�of�GWP’s�customer�base,�so�it�is�important�to�fully�understand�this�load�sector�and�how�it�may�affect�future�demand.��
Electric�vehicle�(EV)�load�for�Glendale�service�territory�was�calculated�using�the�California�Energy�Commission’s�EV�Forecast�Tool10�using�the�assumption�of�achieving�5�million�EVs�in�the�state�by�2030.�The�forecasted�annual�load�due�to�EVs�within�GWP’s�customer�base�is�shown�below:�
Table�9:�Projected�Load�Increase�due�to�EVs�
� 2019� 2020� 2021� 2022� 2023� 2025� 2030� 2035� 2038�
Cumulative�load�increase�(GWh)� 28� 38� 48� 60� 72� 100� 173� 246� 290�
Forecasted�load�increase�due�to�EVs�as�calculated�using�the�CEC’s�Light�Duty�Plug�In�Electric�Vehicle�Energy�and�Emission�Calculator.�
GWP�forecasted�hourly�charging�profiles�to�reflect�a�transition�over�time�from�charging�patterns�common�today���referred�to�as�the�“naïve”�shape���towards�a�more�optimized�shape�that�accounts�for�(assumed)�time�of�use�(ToU)�pricing,�these�charging�profiles�are�shown�in�Figure�9�below.�The�optimized�shape�would�be�enabled�by�more�extensive�workplace�charging�stations�and�ToU�rates�that�discount�charging�during�the�solar�peak�and�low�demand�hours�and�penalize�charging�during�evening�daily�load�peaks.�GWP�assumed�a�transition�from�100%�of�EVs�charging�“naively”�today�to�95%�of�EVs�charging�optimally�by�2030.� ��
������������������������������������������������������������10�Retrieved�from�https://www.energy.ca.gov/2017_energypolicy/documents/#05312017at930�as�“Light�Duty�Plug�In�Electric�Vehicle�Energy�and�Emission�Calculator”.�
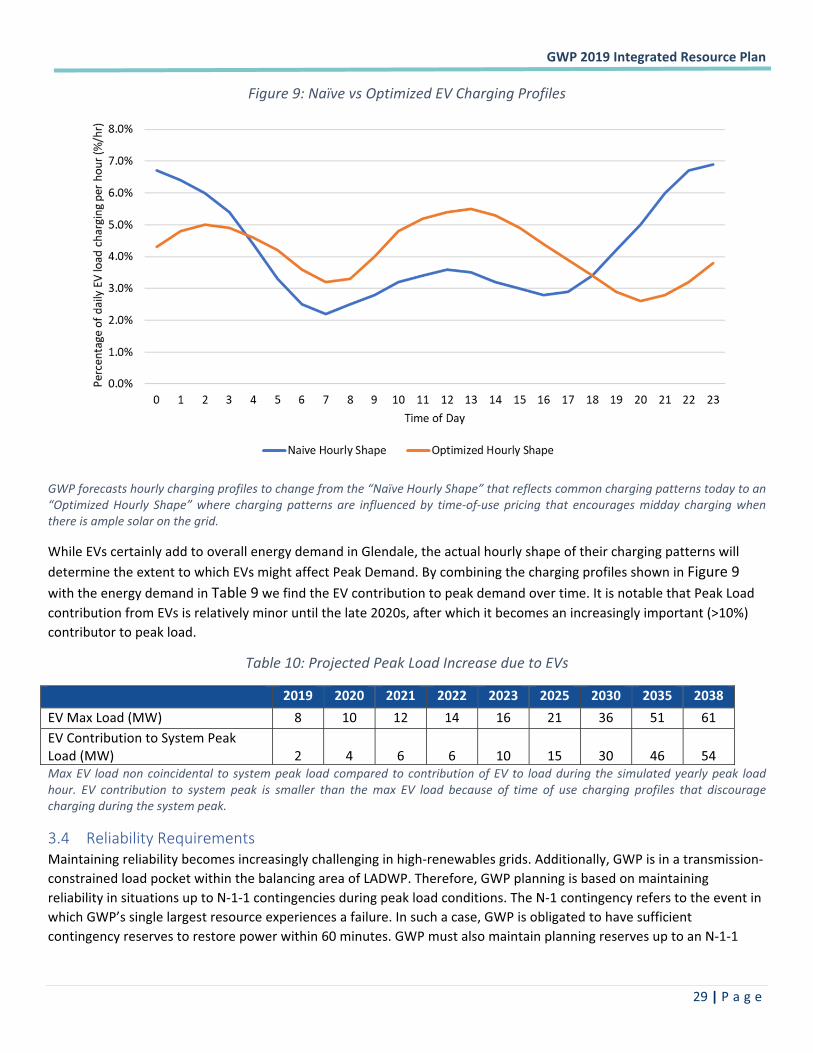
�GWP�2019�Integrated�Resource�Plan��
� �29�|�P a g e �
Figure�9:�Naïve�vs�Optimized�EV�Charging�Profiles�
�
GWP�forecasts�hourly�charging�profiles�to�change�from�the�“Naïve�Hourly�Shape”�that�reflects�common�charging�patterns�today�to�an�“Optimized�Hourly� Shape”�where� charging�patterns�are� influenced�by� time�of�use� pricing� that� encourages�midday� charging�when�there�is�ample�solar�on�the�grid.�
While�EVs�certainly�add�to�overall�energy�demand�in�Glendale,�the�actual�hourly�shape�of�their�charging�patterns�will�determine�the�extent�to�which�EVs�might�affect�Peak�Demand.�By�combining�the�charging�profiles�shown�in�Figure�9�with�the�energy�demand�in�Table�9�we�find�the�EV�contribution�to�peak�demand�over�time.�It�is�notable�that�Peak�Load�contribution�from�EVs�is�relatively�minor�until�the�late�2020s,�after�which�it�becomes�an�increasingly�important�(>10%)�contributor�to�peak�load.�
Table�10:�Projected�Peak�Load�Increase�due�to�EVs�
� 2019� 2020� 2021� 2022� 2023� 2025� 2030� 2035� 2038�EV�Max�Load�(MW)� 8� 10� 12� 14� 16� 21� 36� 51� 61�EV�Contribution�to�System�Peak�Load�(MW)� 2� 4� 6� 6� 10� 15� 30� 46� 54�Max�EV� load�non�coincidental� to�system�peak� load�compared� to�contribution�of�EV� to� load�during�the�simulated�yearly�peak� load�hour.� EV� contribution� to� system� peak� is� smaller� than� the�max� EV� load� because� of� time� of� use� charging� profiles� that� discourage�charging�during�the�system�peak.��
3.4 Reliability�Requirements��Maintaining�reliability�becomes�increasingly�challenging�in�high�renewables�grids.�Additionally,�GWP�is�in�a�transmission�constrained�load�pocket�within�the�balancing�area�of�LADWP.�Therefore,�GWP�planning�is�based�on�maintaining�reliability�in�situations�up�to�N�1�1�contingencies�during�peak�load�conditions.�The�N�1�contingency�refers�to�the�event�in�which�GWP’s�single�largest�resource�experiences�a�failure.�In�such�a�case,�GWP�is�obligated�to�have�sufficient�contingency�reserves�to�restore�power�within�60�minutes.�GWP�must�also�maintain�planning�reserves�up�to�an�N�1�1�
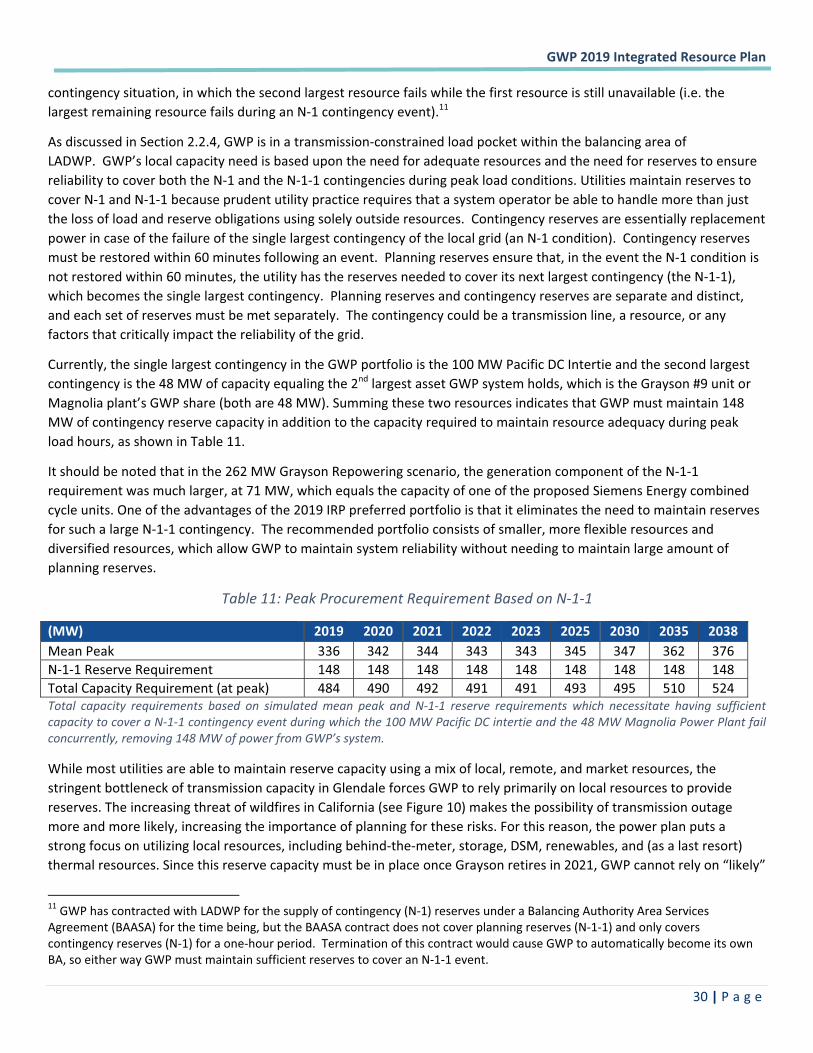
�GWP�2019�Integrated�Resource�Plan��
� �30�|�P a g e �
contingency�situation,�in�which�the�second�largest�resource�fails�while�the�first�resource�is�still�unavailable�(i.e.�the�largest�remaining�resource�fails�during�an�N�1�contingency�event).11
As�discussed�in�Section�2.2.4,�GWP�is�in�a�transmission�constrained�load�pocket�within�the�balancing�area�of�LADWP.��GWP’s�local�capacity�need�is�based�upon�the�need�for�adequate�resources�and�the�need�for�reserves�to�ensure�reliability�to�cover�both�the�N�1�and�the�N�1�1�contingencies�during�peak�load�conditions.�Utilities�maintain�reserves�to�cover�N�1�and�N�1�1�because�prudent�utility�practice�requires�that�a�system�operator�be�able�to�handle�more�than�just�the�loss�of�load�and�reserve�obligations�using�solely�outside�resources.��Contingency�reserves�are�essentially�replacement�power�in�case�of�the�failure�of�the�single�largest�contingency�of�the�local�grid�(an�N�1�condition).��Contingency�reserves�must�be�restored�within�60�minutes�following�an�event.��Planning�reserves�ensure�that,�in�the�event�the�N�1�condition�is�not�restored�within�60�minutes,�the�utility�has�the�reserves�needed�to�cover�its�next�largest�contingency�(the�N�1�1),�which�becomes�the�single�largest�contingency.��Planning�reserves�and�contingency�reserves�are�separate�and�distinct,�and�each�set�of�reserves�must�be�met�separately.��The�contingency�could�be�a�transmission�line,�a�resource,�or�any�factors�that�critically�impact�the�reliability�of�the�grid.���
Currently,�the�single�largest�contingency�in�the�GWP�portfolio�is�the�100�MW�Pacific�DC�Intertie�and�the�second�largest�contingency�is�the�48�MW�of�capacity�equaling�the�2nd�largest�asset�GWP�system�holds,�which�is�the�Grayson�#9�unit�or�Magnolia�plant’s�GWP�share�(both�are�48�MW).�Summing�these�two�resources�indicates�that�GWP�must�maintain�148�MW�of�contingency�reserve�capacity�in�addition�to�the�capacity�required�to�maintain�resource�adequacy�during�peak�load�hours,�as�shown�in�Table�11.�
It�should�be�noted�that�in�the�262�MW�Grayson�Repowering�scenario,�the�generation�component�of�the�N�1�1�requirement�was�much�larger,�at�71�MW,�which�equals�the�capacity�of�one�of�the�proposed�Siemens�Energy�combined�cycle�units.�One�of�the�advantages�of�the�2019�IRP�preferred�portfolio�is�that�it�eliminates�the�need�to�maintain�reserves�for�such�a�large�N�1�1�contingency.��The�recommended�portfolio�consists�of�smaller,�more�flexible�resources�and�diversified�resources,�which�allow�GWP�to�maintain�system�reliability�without�needing�to�maintain�large�amount�of�planning�reserves.
Table�11:�Peak�Procurement�Requirement�Based�on�N�1�1�
(MW)� 2019� 2020� 2021� 2022� 2023� 2025� 2030� 2035� 2038�Mean�Peak�� 336� 342� 344� 343� 343� 345� 347� 362� 376�N�1�1�Reserve�Requirement� 148� 148� 148� 148� 148� 148� 148� 148� 148�Total�Capacity�Requirement�(at�peak)� 484� 490� 492� 491� 491� 493� 495� 510� 524�Total� capacity� requirements� based� on� simulated�mean� peak� and� N�1�1� reserve� requirements� which� necessitate� having� sufficient�capacity�to�cover�a�N�1�1�contingency�event�during�which�the�100�MW�Pacific�DC�intertie�and�the�48�MW�Magnolia�Power�Plant�fail�concurrently,�removing�148�MW�of�power�from�GWP’s�system.�
While�most�utilities�are�able�to�maintain�reserve�capacity�using�a�mix�of�local,�remote,�and�market�resources,�the�stringent�bottleneck�of�transmission�capacity�in�Glendale�forces�GWP�to�rely�primarily�on�local�resources�to�provide�reserves.�The�increasing�threat�of�wildfires�in�California�(see�Figure�10)�makes�the�possibility�of�transmission�outage�more�and�more�likely,�increasing�the�importance�of�planning�for�these�risks.�For�this�reason,�the�power�plan�puts�a�strong�focus�on�utilizing�local�resources,�including�behind�the�meter,�storage,�DSM,�renewables,�and�(as�a�last�resort)�thermal�resources.�Since�this�reserve�capacity�must�be�in�place�once�Grayson�retires�in�2021,�GWP�cannot�rely�on�“likely”�
������������������������������������������������������������11�GWP�has�contracted�with�LADWP�for�the�supply�of�contingency�(N�1)�reserves�under�a�Balancing�Authority�Area�Services�Agreement�(BAASA)�for�the�time�being,�but�the�BAASA�contract�does�not�cover�planning�reserves�(N�1�1)�and�only�covers�contingency�reserves�(N�1)�for�a�one�hour�period.��Termination�of�this�contract�would�cause�GWP�to�automatically�become�its�own�BA,�so�either�way�GWP�must�maintain�sufficient�reserves�to�cover�an�N�1�1�event.�
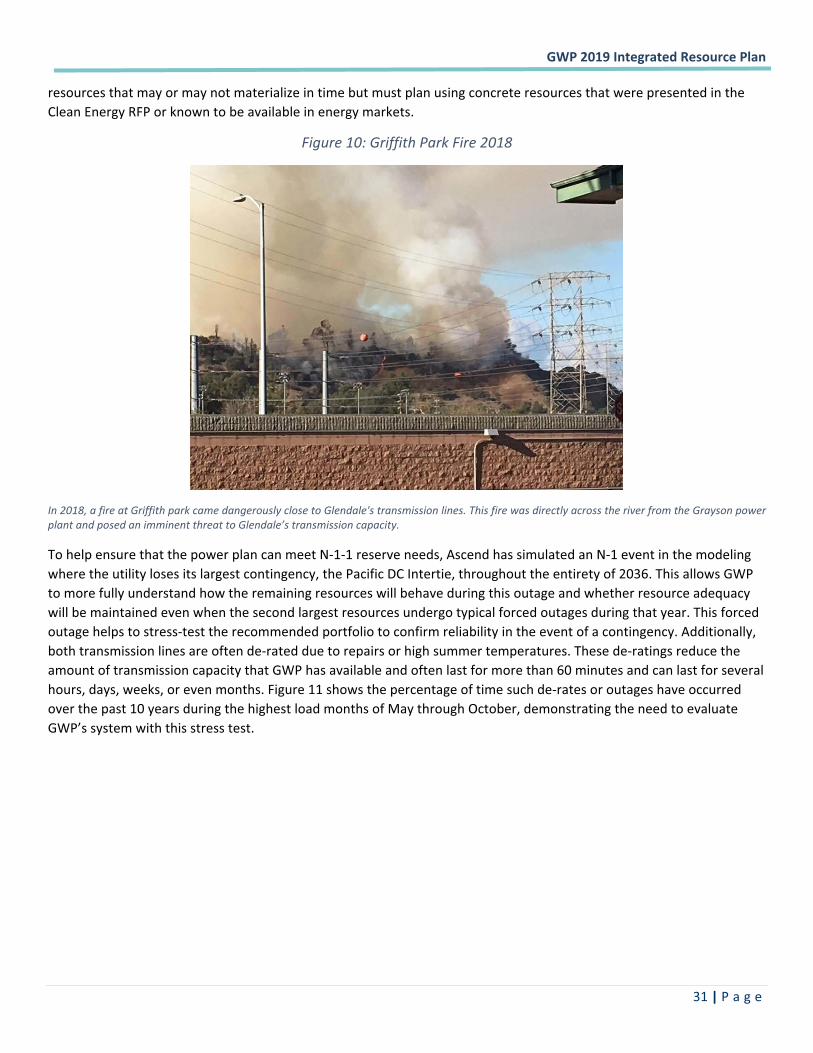
�GWP�2019�Integrated�Resource�Plan��
� �31�|�P a g e �
resources�that�may�or�may�not�materialize�in�time�but�must�plan�using�concrete�resources�that�were�presented�in�the�Clean�Energy�RFP�or�known�to�be�available�in�energy�markets.�
Figure�10:�Griffith�Park�Fire�2018�
�
In�2018,�a�fire�at�Griffith�park�came�dangerously�close�to�Glendale's�transmission�lines.�This�fire�was�directly�across�the�river�from�the�Grayson�power�plant�and�posed�an�imminent�threat�to�Glendale’s�transmission�capacity.�
To�help�ensure�that�the�power�plan�can�meet�N�1�1�reserve�needs,�Ascend�has�simulated�an�N�1�event�in�the�modeling�where�the�utility�loses�its�largest�contingency,�the�Pacific�DC�Intertie,�throughout�the�entirety�of�2036.�This�allows�GWP�to�more�fully�understand�how�the�remaining�resources�will�behave�during�this�outage�and�whether�resource�adequacy�will�be�maintained�even�when�the�second�largest�resources�undergo�typical�forced�outages�during�that�year.�This�forced�outage�helps�to�stress�test�the�recommended�portfolio�to�confirm�reliability�in�the�event�of�a�contingency.�Additionally,�both�transmission�lines�are�often�de�rated�due�to�repairs�or�high�summer�temperatures.�These�de�ratings�reduce�the�amount�of�transmission�capacity�that�GWP�has�available�and�often�last�for�more�than�60�minutes�and�can�last�for�several�hours,�days,�weeks,�or�even�months.�Figure�11�shows�the�percentage�of�time�such�de�rates�or�outages�have�occurred�over�the�past�10�years�during�the�highest�load�months�of�May�through�October,�demonstrating�the�need�to�evaluate�GWP’s�system�with�this�stress�test.��
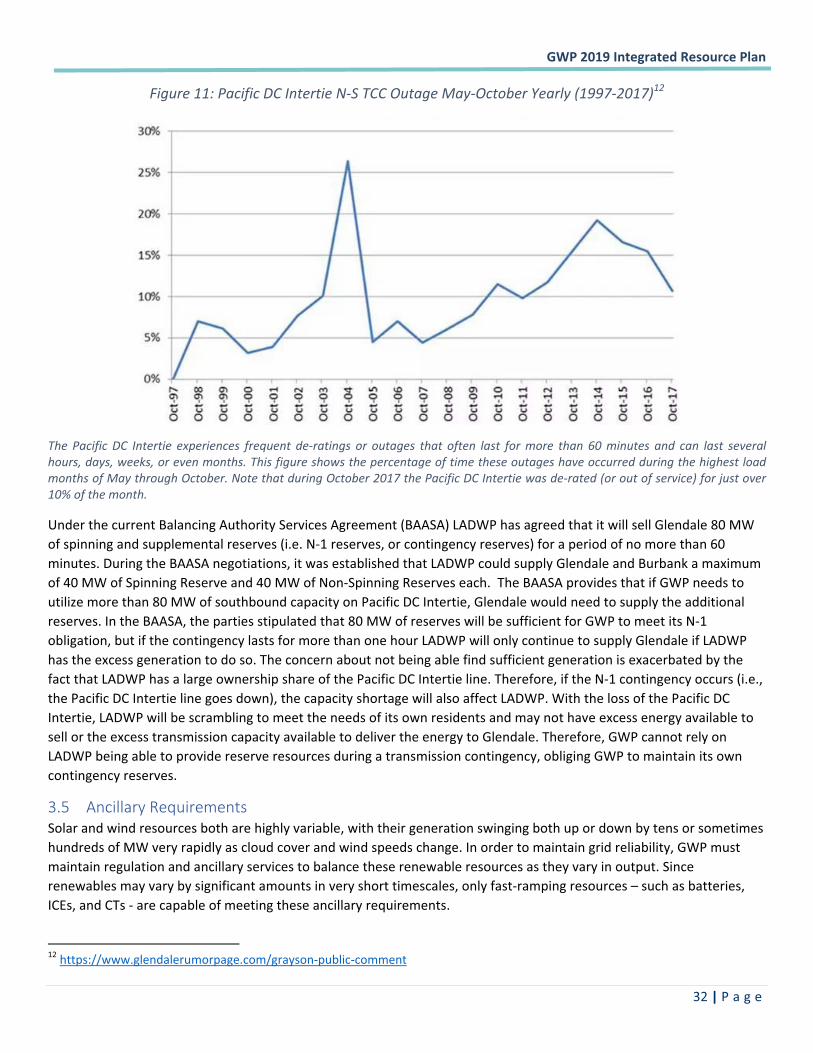
�GWP�2019�Integrated�Resource�Plan��
� �32�|�P a g e �
Figure�11:�Pacific�DC�Intertie�N�S�TCC�Outage�May�October�Yearly�(1997�2017)12�
�
The� Pacific�DC� Intertie� experiences� frequent� de�ratings� or� outages� that� often� last� for�more� than� 60�minutes� and� can� last� several�hours,�days,�weeks,�or�even�months.�This�figure�shows�the�percentage�of�time�these�outages�have�occurred�during�the�highest�load�months�of�May�through�October.�Note�that�during�October�2017�the�Pacific�DC�Intertie�was�de�rated�(or�out�of�service)�for�just�over�10%�of�the�month.���
Under�the�current�Balancing�Authority�Services�Agreement�(BAASA)�LADWP�has�agreed�that�it�will�sell�Glendale�80�MW�of�spinning�and�supplemental�reserves�(i.e.�N�1�reserves,�or�contingency�reserves)�for�a�period�of�no�more�than�60�minutes.�During�the�BAASA�negotiations,�it�was�established�that�LADWP�could�supply�Glendale�and�Burbank�a�maximum�of�40�MW�of�Spinning�Reserve�and�40�MW�of�Non�Spinning�Reserves�each.��The�BAASA�provides�that�if�GWP�needs�to�utilize�more�than�80�MW�of�southbound�capacity�on�Pacific�DC�Intertie,�Glendale�would�need�to�supply�the�additional�reserves.�In�the�BAASA,�the�parties�stipulated�that�80�MW�of�reserves�will�be�sufficient�for�GWP�to�meet�its�N�1�obligation,�but�if�the�contingency�lasts�for�more�than�one�hour�LADWP�will�only�continue�to�supply�Glendale�if�LADWP�has�the�excess�generation�to�do�so.�The�concern�about�not�being�able�find�sufficient�generation�is�exacerbated�by�the�fact�that�LADWP�has�a�large�ownership�share�of�the�Pacific�DC�Intertie�line.�Therefore,�if�the�N�1�contingency�occurs�(i.e.,�the�Pacific�DC�Intertie�line�goes�down),�the�capacity�shortage�will�also�affect�LADWP.�With�the�loss�of�the�Pacific�DC�Intertie,�LADWP�will�be�scrambling�to�meet�the�needs�of�its�own�residents�and�may�not�have�excess�energy�available�to�sell�or�the�excess�transmission�capacity�available�to�deliver�the�energy�to�Glendale.�Therefore,�GWP�cannot�rely�on�LADWP�being�able�to�provide�reserve�resources�during�a�transmission�contingency,�obliging�GWP�to�maintain�its�own�contingency�reserves.�
3.5 Ancillary�Requirements�Solar�and�wind�resources�both�are�highly�variable,�with�their�generation�swinging�both�up�or�down�by�tens�or�sometimes�hundreds�of�MW�very�rapidly�as�cloud�cover�and�wind�speeds�change.�In�order�to�maintain�grid�reliability,�GWP�must�maintain�regulation�and�ancillary�services�to�balance�these�renewable�resources�as�they�vary�in�output.�Since�renewables�may�vary�by�significant�amounts�in�very�short�timescales,�only�fast�ramping�resources�–�such�as�batteries,�ICEs,�and�CTs���are�capable�of�meeting�these�ancillary�requirements.�
������������������������������������������������������������12�https://www.glendalerumorpage.com/grayson�public�comment��
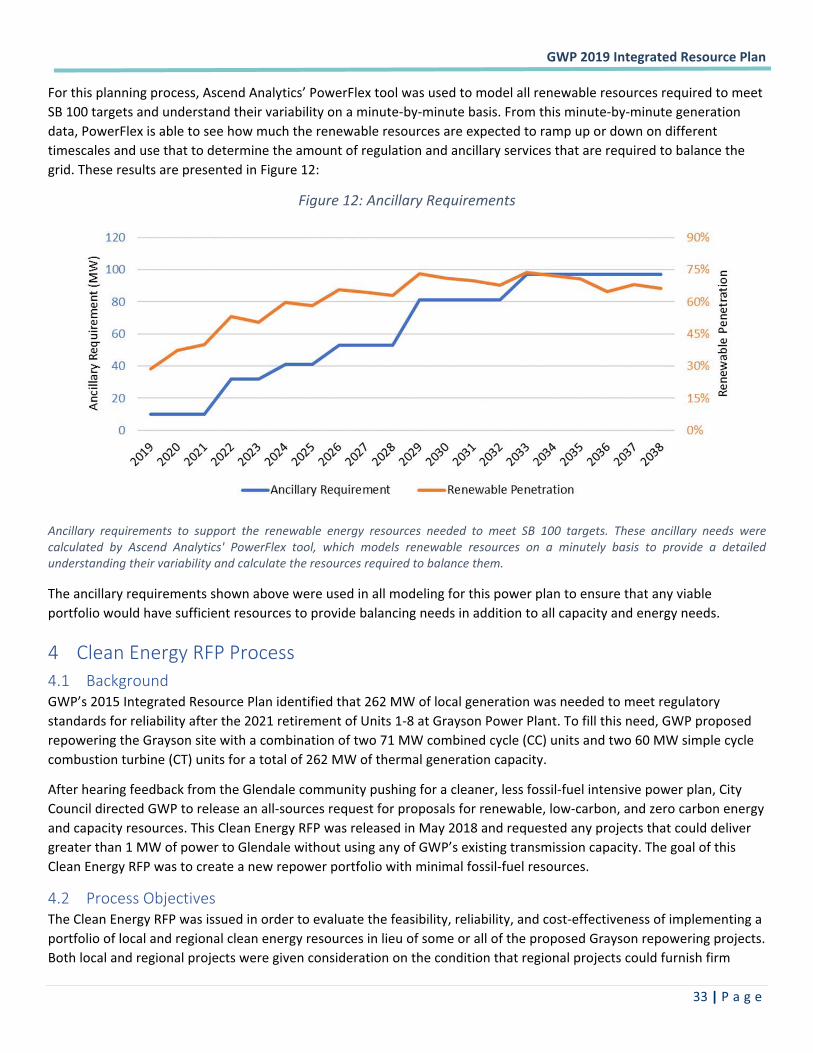
�GWP�2019�Integrated�Resource�Plan��
� �33�|�P a g e �
For�this�planning�process,�Ascend�Analytics’�PowerFlex�tool�was�used�to�model�all�renewable�resources�required�to�meet�SB�100�targets�and�understand�their�variability�on�a�minute�by�minute�basis.�From�this�minute�by�minute�generation�data,�PowerFlex�is�able�to�see�how�much�the�renewable�resources�are�expected�to�ramp�up�or�down�on�different�timescales�and�use�that�to�determine�the�amount�of�regulation�and�ancillary�services�that�are�required�to�balance�the�grid.�These�results�are�presented�in�Figure�12:�
Figure�12:�Ancillary�Requirements�
�
Ancillary� requirements� to� support� the� renewable� energy� resources� needed� to� meet� SB� 100� targets.� These� ancillary� needs� were�calculated� by� Ascend� Analytics'� PowerFlex� tool,� which� models� renewable� resources� on� a� minutely� basis� to� provide� a� detailed�understanding�their�variability�and�calculate�the�resources�required�to�balance�them.�
The�ancillary�requirements�shown�above�were�used�in�all�modeling�for�this�power�plan�to�ensure�that�any�viable�portfolio�would�have�sufficient�resources�to�provide�balancing�needs�in�addition�to�all�capacity�and�energy�needs.�
4 Clean�Energy�RFP�Process��4.1 Background��GWP’s�2015�Integrated�Resource�Plan�identified�that�262�MW�of�local�generation�was�needed�to�meet�regulatory�standards�for�reliability�after�the�2021�retirement�of�Units�1�8�at�Grayson�Power�Plant.�To�fill�this�need,�GWP�proposed�repowering�the�Grayson�site�with�a�combination�of�two�71�MW�combined�cycle�(CC)�units�and�two�60�MW�simple�cycle�combustion�turbine�(CT)�units�for�a�total�of�262�MW�of�thermal�generation�capacity.���
After�hearing�feedback�from�the�Glendale�community�pushing�for�a�cleaner,�less�fossil�fuel�intensive�power�plan,�City�Council�directed�GWP�to�release�an�all�sources�request�for�proposals�for�renewable,�low�carbon,�and�zero�carbon�energy�and�capacity�resources.�This�Clean�Energy�RFP�was�released�in�May�2018�and�requested�any�projects�that�could�deliver�greater�than�1�MW�of�power�to�Glendale�without�using�any�of�GWP’s�existing�transmission�capacity.�The�goal�of�this�Clean�Energy�RFP�was�to�create�a�new�repower�portfolio�with�minimal�fossil�fuel�resources.�
4.2 Process�Objectives��The�Clean�Energy�RFP�was�issued�in�order�to�evaluate�the�feasibility,�reliability,�and�cost�effectiveness�of�implementing�a�portfolio�of�local�and�regional�clean�energy�resources�in�lieu�of�some�or�all�of�the�proposed�Grayson�repowering�projects.�Both�local�and�regional�projects�were�given�consideration�on�the�condition�that�regional�projects�could�furnish�firm�
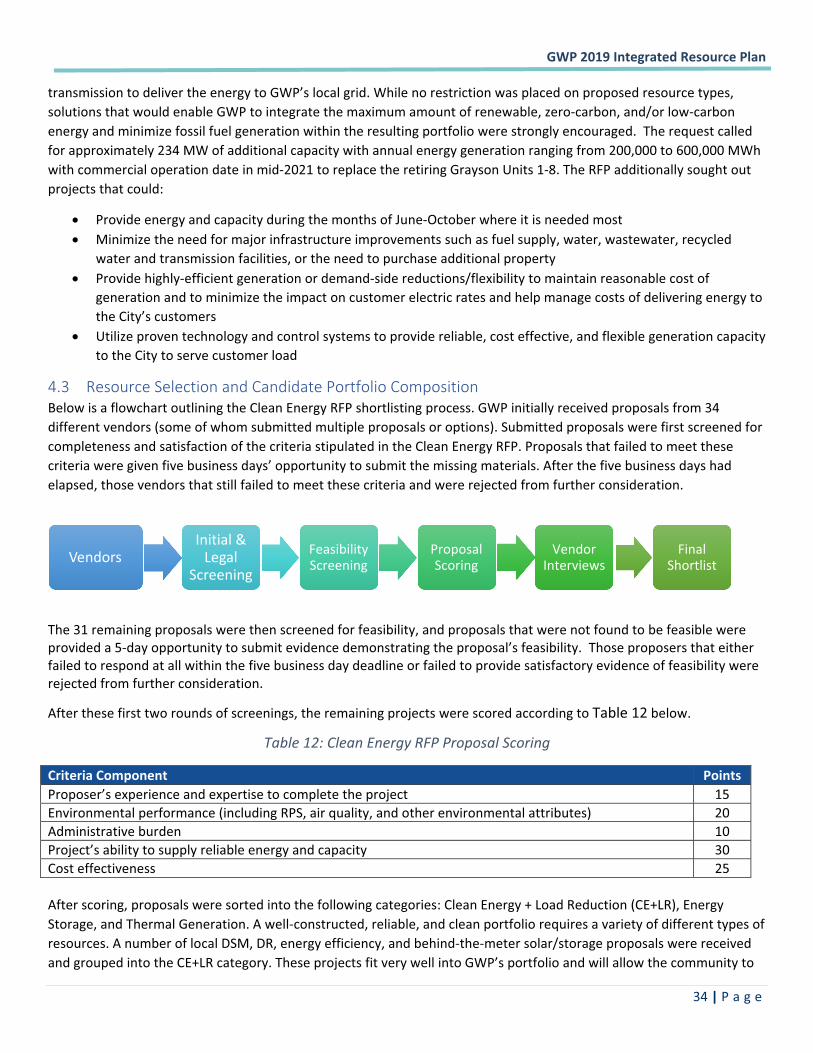
�GWP�2019�Integrated�Resource�Plan��
� �34�|�P a g e �
transmission�to�deliver�the�energy�to�GWP’s�local�grid.�While�no�restriction�was�placed�on�proposed�resource�types,�solutions�that�would�enable�GWP�to�integrate�the�maximum�amount�of�renewable,�zero�carbon,�and/or�low�carbon�energy�and�minimize�fossil�fuel�generation�within�the�resulting�portfolio�were�strongly�encouraged.��The�request�called�for�approximately�234�MW�of�additional�capacity�with�annual�energy�generation�ranging�from�200,000�to�600,000�MWh�with�commercial�operation�date�in�mid�2021�to�replace�the�retiring�Grayson�Units�1�8.�The�RFP�additionally�sought�out�projects�that�could:�
� Provide�energy�and�capacity�during�the�months�of�June�October�where�it�is�needed�most�� Minimize�the�need�for�major�infrastructure�improvements�such�as�fuel�supply,�water,�wastewater,�recycled�
water�and�transmission�facilities,�or�the�need�to�purchase�additional�property��� Provide�highly�efficient�generation�or�demand�side�reductions/flexibility�to�maintain�reasonable�cost�of�
generation�and�to�minimize�the�impact�on�customer�electric�rates�and�help�manage�costs�of�delivering�energy�to�the�City’s�customers�
� Utilize�proven�technology�and�control�systems�to�provide�reliable,�cost�effective,�and�flexible�generation�capacity�to�the�City�to�serve�customer�load�
4.3 Resource�Selection�and�Candidate�Portfolio�Composition��Below�is�a�flowchart�outlining�the�Clean�Energy�RFP�shortlisting�process.�GWP�initially�received�proposals�from�34�different�vendors�(some�of�whom�submitted�multiple�proposals�or�options).�Submitted�proposals�were�first�screened�for�completeness�and�satisfaction�of�the�criteria�stipulated�in�the�Clean�Energy�RFP.�Proposals�that�failed�to�meet�these�criteria�were�given�five�business�days’�opportunity�to�submit�the�missing�materials.�After�the�five�business�days�had�elapsed,�those�vendors�that�still�failed�to�meet�these�criteria�and�were�rejected�from�further�consideration.�
�
The�31�remaining�proposals�were�then�screened�for�feasibility,�and�proposals�that�were�not�found�to�be�feasible�were�provided�a�5�day�opportunity�to�submit�evidence�demonstrating�the�proposal’s�feasibility.��Those�proposers�that�either�failed�to�respond�at�all�within�the�five�business�day�deadline�or�failed�to�provide�satisfactory�evidence�of�feasibility�were�rejected�from�further�consideration.�
After�these�first�two�rounds�of�screenings,�the�remaining�projects�were�scored�according�to�Table�12�below.��
Table�12:�Clean�Energy�RFP�Proposal�Scoring�
Criteria�Component� Points�Proposer’s�experience�and�expertise�to�complete�the�project� 15�Environmental�performance�(including�RPS,�air�quality,�and�other�environmental�attributes)� 20�Administrative�burden� 10�Project’s�ability�to�supply�reliable�energy�and�capacity� 30�Cost�effectiveness� 25��After�scoring,�proposals�were�sorted�into�the�following�categories:�Clean�Energy�+�Load�Reduction�(CE+LR),�Energy�Storage,�and�Thermal�Generation.�A�well�constructed,�reliable,�and�clean�portfolio�requires�a�variety�of�different�types�of�resources.�A�number�of�local�DSM,�DR,�energy�efficiency,�and�behind�the�meter�solar/storage�proposals�were�received�and�grouped�into�the�CE+LR�category.�These�projects�fit�very�well�into�GWP’s�portfolio�and�will�allow�the�community�to�
VendorsInitial�&�
Legal�Screening
Feasibility�Screening
Proposal�Scoring
Vendor�Interviews
Final�Shortlist
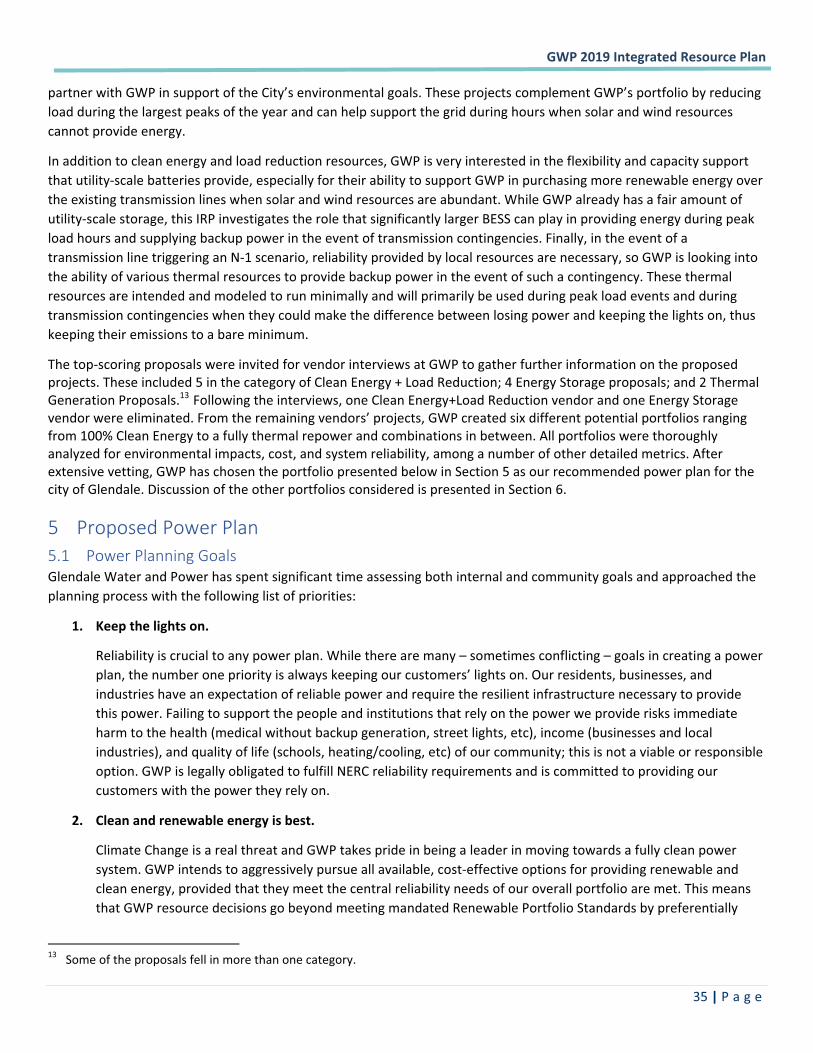
�GWP�2019�Integrated�Resource�Plan��
� �35�|�P a g e �
partner�with�GWP�in�support�of�the�City’s�environmental�goals.�These�projects�complement�GWP’s�portfolio�by�reducing�load�during�the�largest�peaks�of�the�year�and�can�help�support�the�grid�during�hours�when�solar�and�wind�resources�cannot�provide�energy.�
In�addition�to�clean�energy�and�load�reduction�resources,�GWP�is�very�interested�in�the�flexibility�and�capacity�support�that�utility�scale�batteries�provide,�especially�for�their�ability�to�support�GWP�in�purchasing�more�renewable�energy�over�the�existing�transmission�lines�when�solar�and�wind�resources�are�abundant.�While�GWP�already�has�a�fair�amount�of�utility�scale�storage,�this�IRP�investigates�the�role�that�significantly�larger�BESS�can�play�in�providing�energy�during�peak�load�hours�and�supplying�backup�power�in�the�event�of�transmission�contingencies.�Finally,�in�the�event�of�a�transmission�line�triggering�an�N�1�scenario,�reliability�provided�by�local�resources�are�necessary,�so�GWP�is�looking�into�the�ability�of�various�thermal�resources�to�provide�backup�power�in�the�event�of�such�a�contingency.�These�thermal�resources�are�intended�and�modeled�to�run�minimally�and�will�primarily�be�used�during�peak�load�events�and�during�transmission�contingencies�when�they�could�make�the�difference�between�losing�power�and�keeping�the�lights�on,�thus�keeping�their�emissions�to�a�bare�minimum.��
The�top�scoring�proposals�were�invited�for�vendor�interviews�at�GWP�to�gather�further�information�on�the�proposed�projects.�These�included�5�in�the�category�of�Clean�Energy�+�Load�Reduction;�4�Energy�Storage�proposals;�and�2�Thermal�Generation�Proposals.13 Following�the�interviews,�one�Clean�Energy+Load�Reduction�vendor�and�one�Energy�Storage�vendor�were�eliminated.�From�the�remaining�vendors’�projects,�GWP�created�six�different�potential�portfolios�ranging�from�100%�Clean�Energy�to�a�fully�thermal�repower�and�combinations�in�between.�All�portfolios�were�thoroughly�analyzed�for�environmental�impacts,�cost,�and�system�reliability,�among�a�number�of�other�detailed�metrics.�After�extensive�vetting,�GWP�has�chosen�the�portfolio�presented�below�in�Section�5�as�our�recommended�power�plan�for�the�city�of�Glendale.�Discussion�of�the�other�portfolios�considered�is�presented�in�Section�6.�
5 Proposed�Power�Plan��5.1 Power�Planning�Goals�Glendale�Water�and�Power�has�spent�significant�time�assessing�both�internal�and�community�goals�and�approached�the�planning�process�with�the�following�list�of�priorities:�
1. Keep�the�lights�on.�
Reliability�is�crucial�to�any�power�plan.�While�there�are�many�–�sometimes�conflicting�–�goals�in�creating�a�power�plan,�the�number�one�priority�is�always�keeping�our�customers’�lights�on.�Our�residents,�businesses,�and�industries�have�an�expectation�of�reliable�power�and�require�the�resilient�infrastructure�necessary�to�provide�this�power.�Failing�to�support�the�people�and�institutions�that�rely�on�the�power�we�provide�risks�immediate�harm�to�the�health�(medical�without�backup�generation,�street�lights,�etc),�income�(businesses�and�local�industries),�and�quality�of�life�(schools,�heating/cooling,�etc)�of�our�community;�this�is�not�a�viable�or�responsible�option.�GWP�is�legally�obligated�to�fulfill�NERC�reliability�requirements�and�is�committed�to�providing�our�customers�with�the�power�they�rely�on.�
2. Clean�and�renewable�energy�is�best.�
Climate�Change�is�a�real�threat�and�GWP�takes�pride�in�being�a�leader�in�moving�towards�a�fully�clean�power�system.�GWP�intends�to�aggressively�pursue�all�available,�cost�effective�options�for�providing�renewable�and�clean�energy,�provided�that�they�meet�the�central�reliability�needs�of�our�overall�portfolio�are�met.�This�means�that�GWP�resource�decisions�go�beyond�meeting�mandated�Renewable�Portfolio�Standards�by�preferentially�
������������������������������������������������������������13���Some�of�the�proposals�fell�in�more�than�one�category.�
�GWP�2019�Integrated�Resource�Plan��
� �36�|�P a g e �
incorporating�all�viable�and�reliable�clean�and�renewable�resources�before�turning�to�conventional�generation�options.�
3. The�community�plays�a�part.�
With�the�rise�of�behind�the�meter�resources,�utilities�are�no�longer�the�only�contributors�to�the�energy�grid.�Consumers�are�taking�a�larger�role�in�the�energy�landscape�through�rooftop�solar,�behind�the�meter�(BTM)�batteries,�energy�efficiency�efforts,�and�participation�in�demand�reduction�(DR)�programs.�GWP�intends�to�embrace�and�support�this�transformation.�This�means�that�if�the�community�supports�certain�goals,�like�reducing�our�reliance�on�fossil�fuels,�then�they�should�have�the�opportunity�to�pursue�those�goals�in�partnership�with�GWP�by�contributing�BTM�solar�and�storage�and�participating�in�DR�programs.�GWP�intends�to�maintain�its�leadership�role�by�paving�the�way�for�the�Glendale�community�to�actively�participate�in�the�power�plan�and�enable�GWP�to�expand�community�supported�clean�energy�opportunities.�
4. Plan�one�step�at�a�time.�
No�one�knows�what�the�future�will�look�like.�Technology�will�change�even�more�rapidly�in�the�next�20�years�than�it�did�in�the�previous�20�years.��GWP’s�planning�implements�a�prudent,�measured�approach�to�meeting�our�compliance�targets.��We�aim�for�a�plan�that�is�sufficient�to�meet�immediate�needs�and�flexible�enough�to�leverage�technological�advancements,�take�advantage�of�price�reductions�as�technologies�mature,�and�keep�our�rates�affordable�for�our�customers.��This�measured�approach�enables�us�to�accommodate�the�changing�energy�landscape�of�the�future.�
5. Keep�the�bills�low.�
Affordability�is�an�important�pillar�of�GWP’s�resource�planning.��Everyone�deserves�affordable�power�and�GWP�intends�to�deliver�the�most�cost�effective�energy�possible.�Maintaining�cost�competitive�and�affordable�pricing�is�important�to�GWP’s�customers�and�consistent�with�other�planning�goals.�GWP�is�additionally�committed�to�making�sure�that�the�distribution�of�benefits�and�costs�from�all�energy�resources�is�fair�across�all�citizens�in�Glendale.�This�is�accomplished�by�ensuring�that�all�customer�types�will�benefit�from�all�GWP�investments�and�that�lower�income�customers�will�not�be�subsidizing�resources�installed�for�the�primary�use�of�other�customers.�
5.2 Recommended�Power�Plan�and�Resource�Portfolio�After�assessing�all�submitted�resources�from�the�Clean�Energy�RFP�(as�described�in�Section�4),�GWP�has�chosen�the�following�resource�portfolio�as�the�best�suited�to�meet�Glendale’s�energy�needs�for�the�next�twenty�years:�
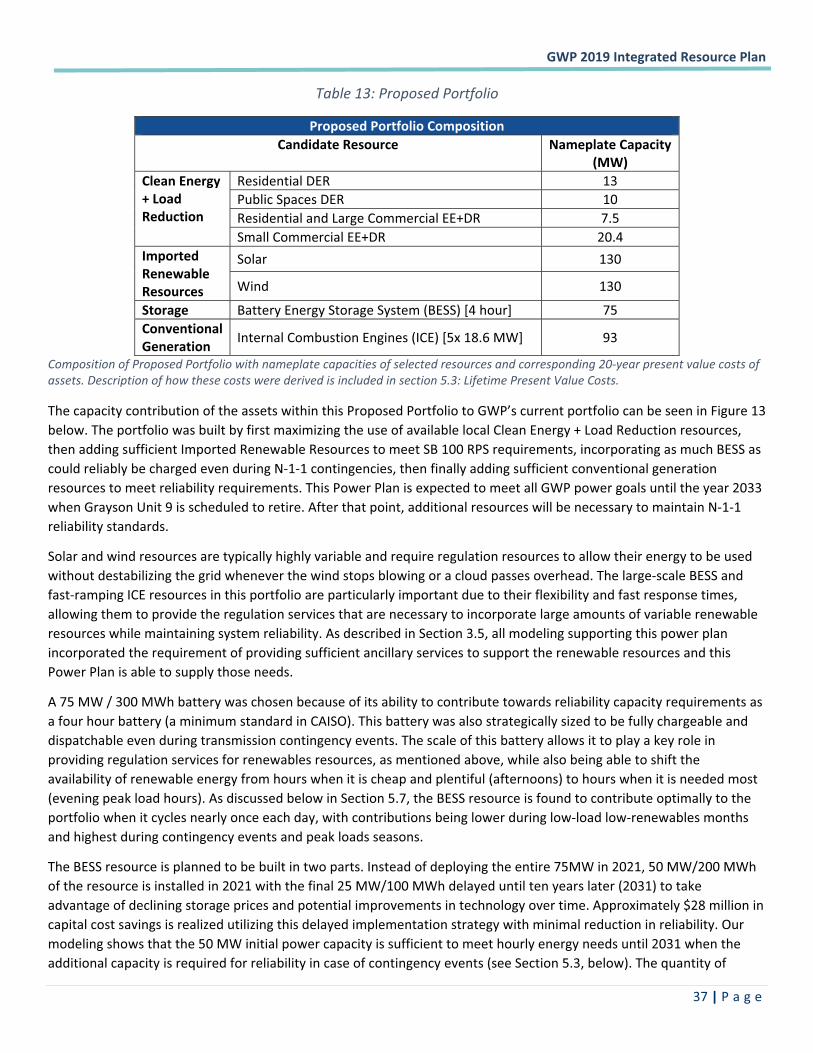
�GWP�2019�Integrated�Resource�Plan��
� �37�|�P a g e �
Table�13:�Proposed�Portfolio�
Proposed�Portfolio�Composition��Candidate�Resource� Nameplate�Capacity�
(MW)�Clean�Energy�+�Load�Reduction�
Residential�DER� 13�Public�Spaces�DER� 10�Residential�and�Large�Commercial�EE+DR� 7.5�Small�Commercial�EE+DR� 20.4�
Imported�Renewable�Resources�
Solar� 130�
Wind� 130�
Storage� Battery�Energy�Storage�System�(BESS)�[4�hour]� 75�Conventional�Generation�� Internal�Combustion�Engines�(ICE)�[5x�18.6�MW]� 93�
Composition�of�Proposed�Portfolio�with�nameplate�capacities�of�selected�resources�and�corresponding�20�year�present�value�costs�of�assets.�Description�of�how�these�costs�were�derived�is�included�in�section�5.3:�Lifetime�Present�Value�Costs.��
The�capacity�contribution�of�the�assets�within�this�Proposed�Portfolio�to�GWP’s�current�portfolio�can�be�seen�in�Figure�13�below.�The�portfolio�was�built�by�first�maximizing�the�use�of�available�local�Clean�Energy�+�Load�Reduction�resources,�then�adding�sufficient�Imported�Renewable�Resources�to�meet�SB�100�RPS�requirements,�incorporating�as�much�BESS�as�could�reliably�be�charged�even�during�N�1�1�contingencies,�then�finally�adding�sufficient�conventional�generation�resources�to�meet�reliability�requirements.�This�Power�Plan�is�expected�to�meet�all�GWP�power�goals�until�the�year�2033�when�Grayson�Unit�9�is�scheduled�to�retire.�After�that�point,�additional�resources�will�be�necessary�to�maintain�N�1�1�reliability�standards.�
Solar�and�wind�resources�are�typically�highly�variable�and�require�regulation�resources�to�allow�their�energy�to�be�used�without�destabilizing�the�grid�whenever�the�wind�stops�blowing�or�a�cloud�passes�overhead.�The�large�scale�BESS�and�fast�ramping�ICE�resources�in�this�portfolio�are�particularly�important�due�to�their�flexibility�and�fast�response�times,�allowing�them�to�provide�the�regulation�services�that�are�necessary�to�incorporate�large�amounts�of�variable�renewable�resources�while�maintaining�system�reliability.�As�described�in�Section�3.5,�all�modeling�supporting�this�power�plan�incorporated�the�requirement�of�providing�sufficient�ancillary�services�to�support�the�renewable�resources�and�this�Power�Plan�is�able�to�supply�those�needs.�
A�75�MW�/�300�MWh�battery�was�chosen�because�of�its�ability�to�contribute�towards�reliability�capacity�requirements�as�a�four�hour�battery�(a�minimum�standard�in�CAISO).�This�battery�was�also�strategically�sized�to�be�fully�chargeable�and�dispatchable�even�during�transmission�contingency�events.�The�scale�of�this�battery�allows�it�to�play�a�key�role�in�providing�regulation�services�for�renewables�resources,�as�mentioned�above,�while�also�being�able�to�shift�the�availability�of�renewable�energy�from�hours�when�it�is�cheap�and�plentiful�(afternoons)�to�hours�when�it�is�needed�most�(evening�peak�load�hours).�As�discussed�below�in�Section�5.7,�the�BESS�resource�is�found�to�contribute�optimally�to�the�portfolio�when�it�cycles�nearly�once�each�day,�with�contributions�being�lower�during�low�load�low�renewables�months�and�highest�during�contingency�events�and�peak�loads�seasons.�
The�BESS�resource�is�planned�to�be�built�in�two�parts.�Instead�of�deploying�the�entire�75MW�in�2021,�50�MW/200�MWh�of�the�resource�is�installed�in�2021�with�the�final�25�MW/100�MWh�delayed�until�ten�years�later�(2031)�to�take�advantage�of�declining�storage�prices�and�potential�improvements�in�technology�over�time.�Approximately�$28�million�in�capital�cost�savings�is�realized�utilizing�this�delayed�implementation�strategy�with�minimal�reduction�in�reliability.�Our�modeling�shows�that�the�50�MW�initial�power�capacity�is�sufficient�to�meet�hourly�energy�needs�until�2031�when�the�additional�capacity�is�required�for�reliability�in�case�of�contingency�events�(see�Section�5.3,�below).�The�quantity�of�
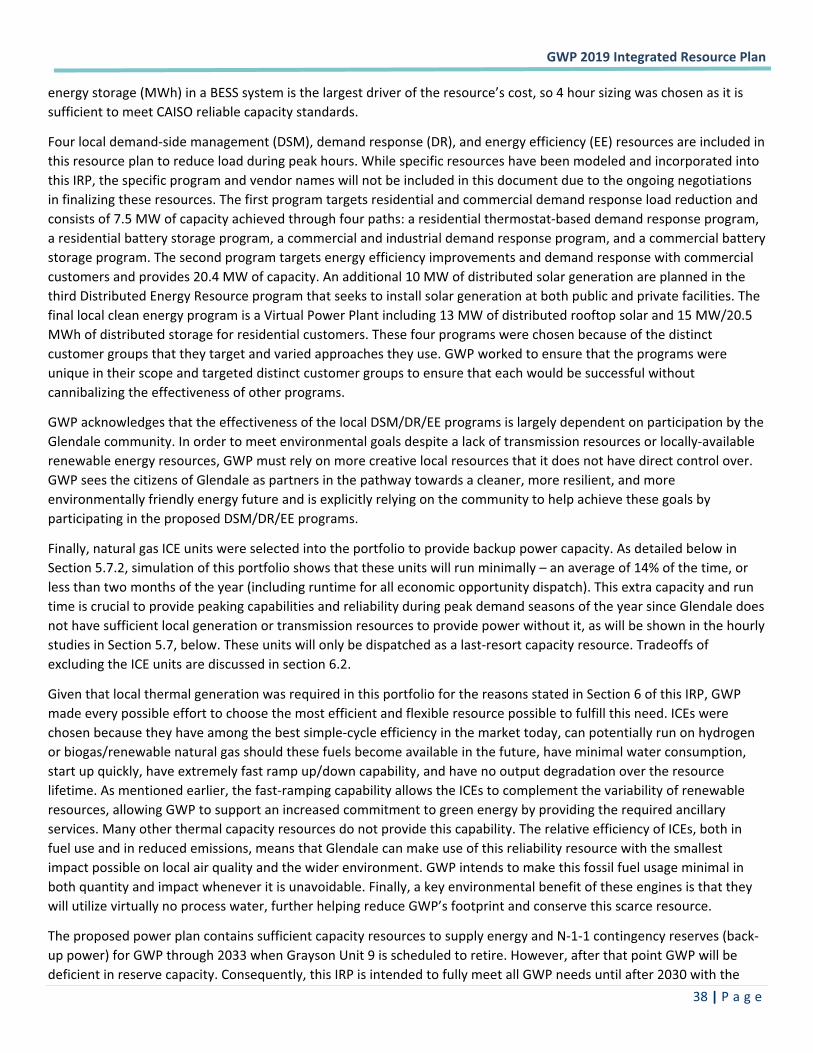
�GWP�2019�Integrated�Resource�Plan��
� �38�|�P a g e �
energy�storage�(MWh)�in�a�BESS�system�is�the�largest�driver�of�the�resource’s�cost,�so�4�hour�sizing�was�chosen�as�it�is�sufficient�to�meet�CAISO�reliable�capacity�standards.�
Four�local�demand�side�management�(DSM),�demand�response�(DR),�and�energy�efficiency�(EE)�resources�are�included�in�this�resource�plan�to�reduce�load�during�peak�hours.�While�specific�resources�have�been�modeled�and�incorporated�into�this�IRP,�the�specific�program�and�vendor�names�will�not�be�included�in�this�document�due�to�the�ongoing�negotiations�in�finalizing�these�resources.�The�first�program�targets�residential�and�commercial�demand�response�load�reduction�and�consists�of�7.5�MW�of�capacity�achieved�through�four�paths:�a�residential�thermostat�based�demand�response�program,�a�residential�battery�storage�program,�a�commercial�and�industrial�demand�response�program,�and�a�commercial�battery�storage�program.�The�second�program�targets�energy�efficiency�improvements�and�demand�response�with�commercial�customers�and�provides�20.4�MW�of�capacity.�An�additional�10�MW�of�distributed�solar�generation�are�planned�in�the�third�Distributed�Energy�Resource�program�that�seeks�to�install�solar�generation�at�both�public�and�private�facilities.�The�final�local�clean�energy�program�is�a�Virtual�Power�Plant�including�13�MW�of�distributed�rooftop�solar�and�15�MW/20.5�MWh�of�distributed�storage�for�residential�customers.�These�four�programs�were�chosen�because�of�the�distinct�customer�groups�that�they�target�and�varied�approaches�they�use.�GWP�worked�to�ensure�that�the�programs�were�unique�in�their�scope�and�targeted�distinct�customer�groups�to�ensure�that�each�would�be�successful�without�cannibalizing�the�effectiveness�of�other�programs.�
GWP�acknowledges�that�the�effectiveness�of�the�local�DSM/DR/EE�programs�is�largely�dependent�on�participation�by�the�Glendale�community.�In�order�to�meet�environmental�goals�despite�a�lack�of�transmission�resources�or�locally�available�renewable�energy�resources,�GWP�must�rely�on�more�creative�local�resources�that�it�does�not�have�direct�control�over.�GWP�sees�the�citizens�of�Glendale�as�partners�in�the�pathway�towards�a�cleaner,�more�resilient,�and�more�environmentally�friendly�energy�future�and�is�explicitly�relying�on�the�community�to�help�achieve�these�goals�by�participating�in�the�proposed�DSM/DR/EE�programs.��
Finally,�natural�gas�ICE�units�were�selected�into�the�portfolio�to�provide�backup�power�capacity.�As�detailed�below�in�Section�5.7.2,�simulation�of�this�portfolio�shows�that�these�units�will�run�minimally�–�an�average�of�14%�of�the�time,�or�less�than�two�months�of�the�year�(including�runtime�for�all�economic�opportunity�dispatch).�This�extra�capacity�and�run�time�is�crucial�to�provide�peaking�capabilities�and�reliability�during�peak�demand�seasons�of�the�year�since�Glendale�does�not�have�sufficient�local�generation�or�transmission�resources�to�provide�power�without�it,�as�will�be�shown�in�the�hourly�studies�in�Section�5.7,�below.�These�units�will�only�be�dispatched�as�a�last�resort�capacity�resource.�Tradeoffs�of�excluding�the�ICE�units�are�discussed�in�section�6.2.�
Given�that�local�thermal�generation�was�required�in�this�portfolio�for�the�reasons�stated�in�Section�6�of�this�IRP,�GWP�made�every�possible�effort�to�choose�the�most�efficient�and�flexible�resource�possible�to�fulfill�this�need.�ICEs�were�chosen�because�they�have�among�the�best�simple�cycle�efficiency�in�the�market�today,�can�potentially�run�on�hydrogen�or�biogas/renewable�natural�gas�should�these�fuels�become�available�in�the�future,�have�minimal�water�consumption,�start�up�quickly,�have�extremely�fast�ramp�up/down�capability,�and�have�no�output�degradation�over�the�resource�lifetime.�As�mentioned�earlier,�the�fast�ramping�capability�allows�the�ICEs�to�complement�the�variability�of�renewable�resources,�allowing�GWP�to�support�an�increased�commitment�to�green�energy�by�providing�the�required�ancillary�services.�Many�other�thermal�capacity�resources�do�not�provide�this�capability.�The�relative�efficiency�of�ICEs,�both�in�fuel�use�and�in�reduced�emissions,�means�that�Glendale�can�make�use�of�this�reliability�resource�with�the�smallest�impact�possible�on�local�air�quality�and�the�wider�environment.�GWP�intends�to�make�this�fossil�fuel�usage�minimal�in�both�quantity�and�impact�whenever�it�is�unavoidable.�Finally,�a�key�environmental�benefit�of�these�engines�is�that�they�will�utilize�virtually�no�process�water,�further�helping�reduce�GWP’s�footprint�and�conserve�this�scarce�resource.�
The�proposed�power�plan�contains�sufficient�capacity�resources�to�supply�energy�and�N�1�1�contingency�reserves�(back�up�power)�for�GWP�through�2033�when�Grayson�Unit�9�is�scheduled�to�retire.�However,�after�that�point�GWP�will�be�deficient�in�reserve�capacity.�Consequently,�this�IRP�is�intended�to�fully�meet�all�GWP�needs�until�after�2030�with�the�
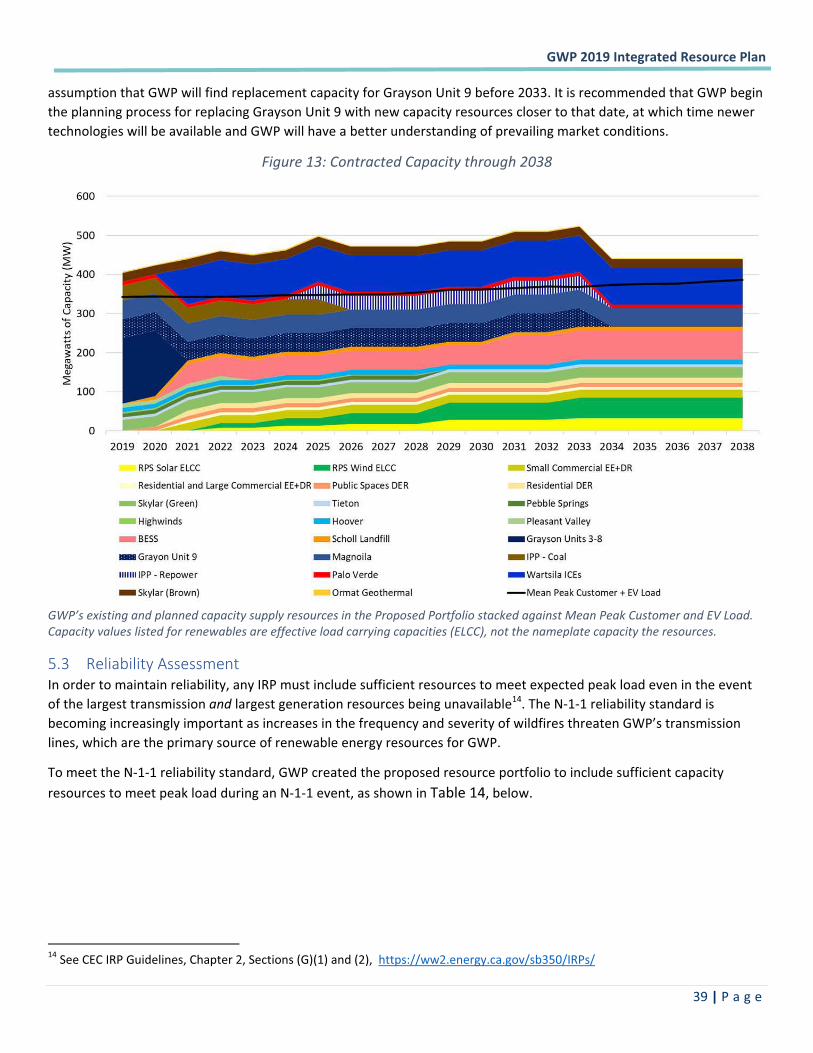
�GWP�2019�Integrated�Resource�Plan��
� �39�|�P a g e �
assumption�that�GWP�will�find�replacement�capacity�for�Grayson�Unit�9�before�2033.�It�is�recommended�that�GWP�begin�the�planning�process�for�replacing�Grayson�Unit�9�with�new�capacity�resources�closer�to�that�date,�at�which�time�newer�technologies�will�be�available�and�GWP�will�have�a�better�understanding�of�prevailing�market�conditions.�
Figure�13:�Contracted�Capacity�through�2038�
�GWP’s�existing�and�planned�capacity�supply�resources�in�the�Proposed�Portfolio�stacked�against�Mean�Peak�Customer�and�EV�Load.�Capacity�values�listed�for�renewables�are�effective�load�carrying�capacities�(ELCC),�not�the�nameplate�capacity�the�resources.��
5.3 Reliability�Assessment��In�order�to�maintain�reliability,�any�IRP�must�include�sufficient�resources�to�meet�expected�peak�load�even�in�the�event�of�the�largest�transmission�and�largest�generation�resources�being�unavailable14.�The�N�1�1�reliability�standard�is�becoming�increasingly�important�as�increases�in�the�frequency�and�severity�of�wildfires�threaten�GWP’s�transmission�lines,�which�are�the�primary�source�of�renewable�energy�resources�for�GWP.�
To�meet�the�N�1�1�reliability�standard,�GWP�created�the�proposed�resource�portfolio�to�include�sufficient�capacity�resources�to�meet�peak�load�during�an�N�1�1�event,�as�shown�in�Table�14,�below.��
������������������������������������������������������������14�See�CEC�IRP�Guidelines,�Chapter�2,�Sections�(G)(1)�and�(2),��https://ww2.energy.ca.gov/sb350/IRPs/��
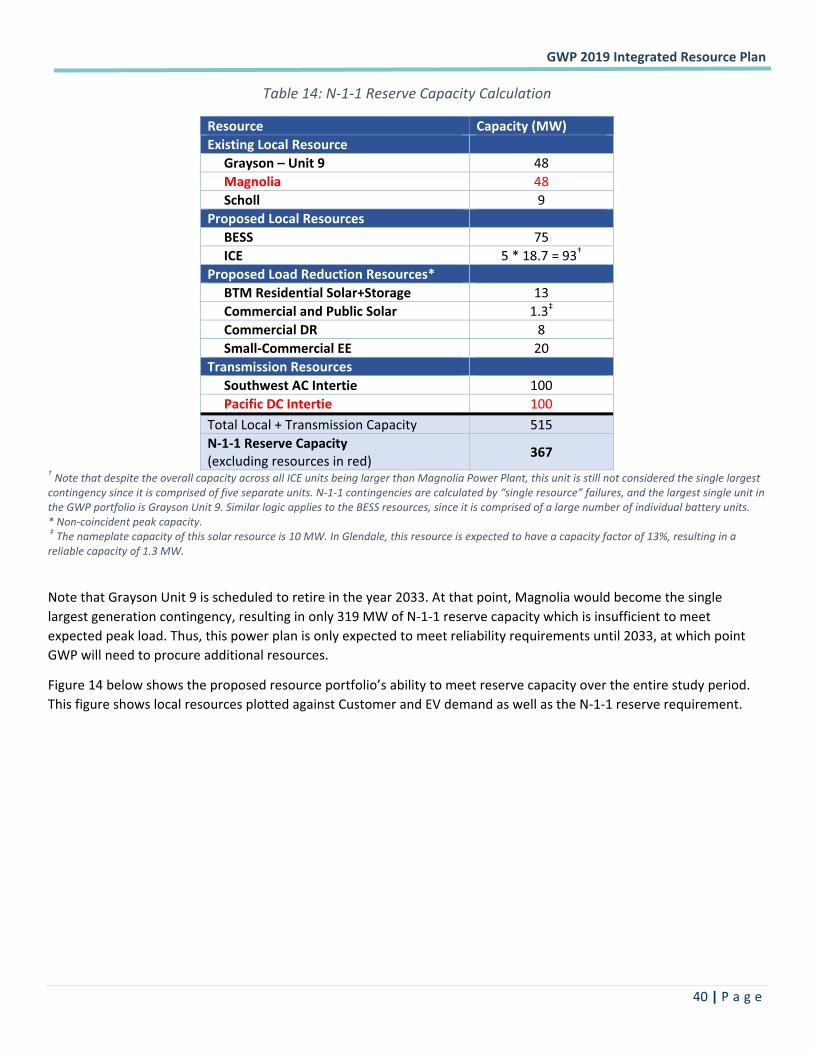
�GWP�2019�Integrated�Resource�Plan��
� �40�|�P a g e �
Table�14:�N�1�1�Reserve�Capacity�Calculation�
Resource�� Capacity�(MW)�Existing�Local�Resource� ������Grayson�–�Unit�9� 48������Magnolia� 48������Scholl� 9�Proposed�Local�Resources� ������BESS� 75������ICE� 5�*�18.7�=�93†�Proposed�Load�Reduction�Resources*� ������BTM�Residential�Solar+Storage� 13������Commercial�and�Public�Solar� 1.3‡������Commercial�DR� 8������Small�Commercial�EE� 20�Transmission�Resources� ������Southwest�AC�Intertie� 100������Pacific�DC�Intertie� 100�Total�Local�+�Transmission�Capacity� 515�N�1�1�Reserve�Capacity��(excluding�resources�in�red)� 367�
†�Note�that�despite�the�overall�capacity�across�all�ICE�units�being�larger�than�Magnolia�Power�Plant,�this�unit�is�still�not�considered�the�single�largest�contingency�since�it�is�comprised�of�five�separate�units.�N�1�1�contingencies�are�calculated�by�“single�resource”�failures,�and�the�largest�single�unit�in�the�GWP�portfolio�is�Grayson�Unit�9.�Similar�logic�applies�to�the�BESS�resources,�since�it�is�comprised�of�a�large�number�of�individual�battery�units.�*�Non�coincident�peak�capacity.��‡�The�nameplate�capacity�of�this�solar�resource�is�10�MW.�In�Glendale,�this�resource�is�expected�to�have�a�capacity�factor�of�13%,�resulting�in�a�reliable�capacity�of�1.3�MW.��
Note�that�Grayson�Unit�9�is�scheduled�to�retire�in�the�year�2033.�At�that�point,�Magnolia�would�become�the�single�largest�generation�contingency,�resulting�in�only�319�MW�of�N�1�1�reserve�capacity�which�is�insufficient�to�meet�expected�peak�load.�Thus,�this�power�plan�is�only�expected�to�meet�reliability�requirements�until�2033,�at�which�point�GWP�will�need�to�procure�additional�resources.�
Figure�14�below�shows�the�proposed�resource�portfolio’s�ability�to�meet�reserve�capacity�over�the�entire�study�period.�This�figure�shows�local�resources�plotted�against�Customer�and�EV�demand�as�well�as�the�N�1�1�reserve�requirement.���
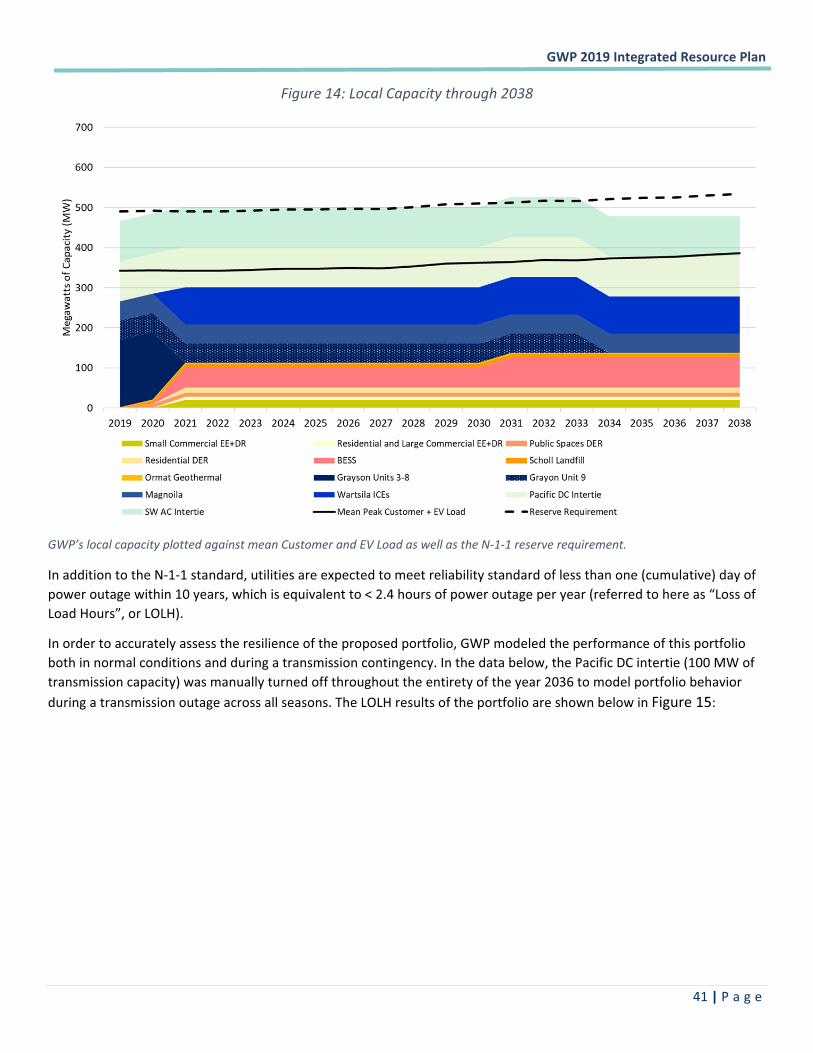
�GWP�2019�Integrated�Resource�Plan��
� �41�|�P a g e �
Figure�14:�Local�Capacity�through�2038�
�
GWP’s�local�capacity�plotted�against�mean�Customer�and�EV�Load�as�well�as�the�N�1�1�reserve�requirement.��
In�addition�to�the�N�1�1�standard,�utilities�are�expected�to�meet�reliability�standard�of�less�than�one�(cumulative)�day�of�power�outage�within�10�years,�which�is�equivalent�to�<�2.4�hours�of�power�outage�per�year�(referred�to�here�as�“Loss�of�Load�Hours”,�or�LOLH).�
In�order�to�accurately�assess�the�resilience�of�the�proposed�portfolio,�GWP�modeled�the�performance�of�this�portfolio�both�in�normal�conditions�and�during�a�transmission�contingency.�In�the�data�below,�the�Pacific�DC�intertie�(100�MW�of�transmission�capacity)�was�manually�turned�off�throughout�the�entirety�of�the�year�2036�to�model�portfolio�behavior�during�a�transmission�outage�across�all�seasons.�The�LOLH�results�of�the�portfolio�are�shown�below�in�Figure�15:�
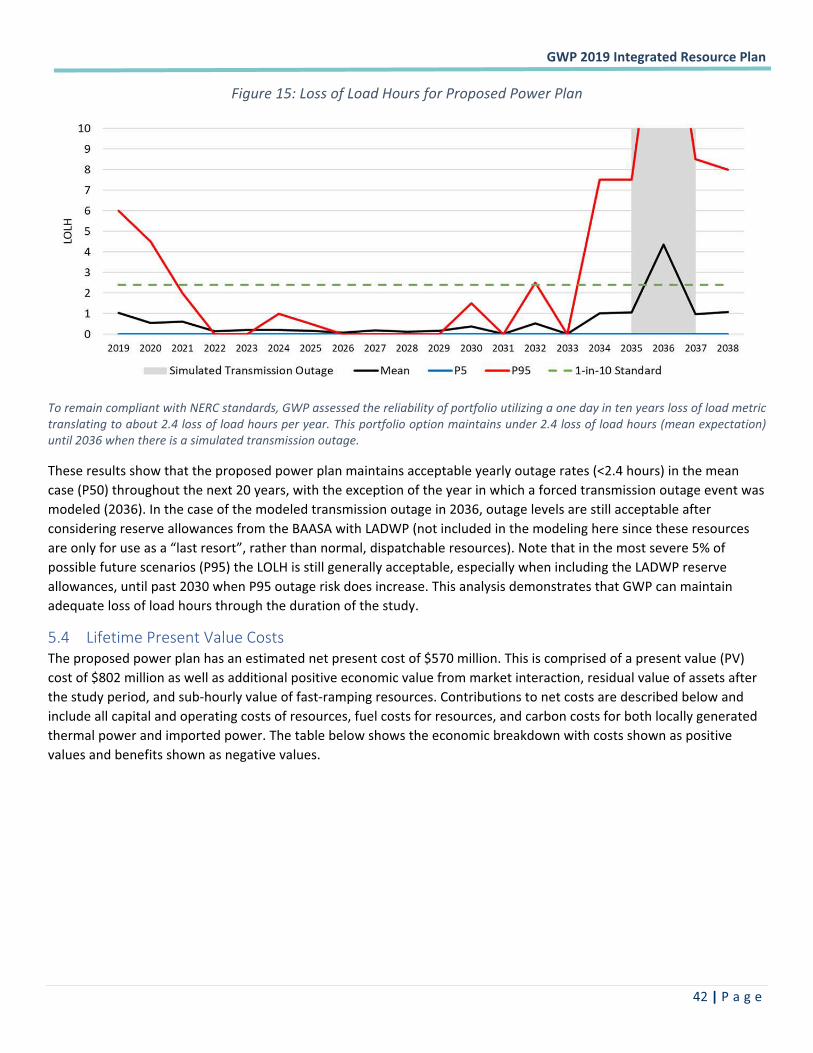
�GWP�2019�Integrated�Resource�Plan��
� �42�|�P a g e �
Figure�15:�Loss�of�Load�Hours�for�Proposed�Power�Plan�
�
To�remain�compliant�with�NERC�standards,�GWP�assessed�the�reliability�of�portfolio�utilizing�a�one�day�in�ten�years�loss�of�load�metric�translating�to�about�2.4�loss�of�load�hours�per�year.�This�portfolio�option�maintains�under�2.4�loss�of�load�hours�(mean�expectation)�until�2036�when�there�is�a�simulated�transmission�outage.�
These�results�show�that�the�proposed�power�plan�maintains�acceptable�yearly�outage�rates�(<2.4�hours)�in�the�mean�case�(P50)�throughout�the�next�20�years,�with�the�exception�of�the�year�in�which�a�forced�transmission�outage�event�was�modeled�(2036).�In�the�case�of�the�modeled�transmission�outage�in�2036,�outage�levels�are�still�acceptable�after�considering�reserve�allowances�from�the�BAASA�with�LADWP�(not�included�in�the�modeling�here�since�these�resources�are�only�for�use�as�a�“last�resort”,�rather�than�normal,�dispatchable�resources).�Note�that�in�the�most�severe�5%�of�possible�future�scenarios�(P95)�the�LOLH�is�still�generally�acceptable,�especially�when�including�the�LADWP�reserve�allowances,�until�past�2030�when�P95�outage�risk�does�increase.�This�analysis�demonstrates�that�GWP�can�maintain�adequate�loss�of�load�hours�through�the�duration�of�the�study.�
5.4 Lifetime�Present�Value�Costs��The�proposed�power�plan�has�an�estimated�net�present�cost�of�$570�million.�This�is�comprised�of�a�present�value�(PV)�cost�of�$802�million�as�well�as�additional�positive�economic�value�from�market�interaction,�residual�value�of�assets�after�the�study�period,�and�sub�hourly�value�of�fast�ramping�resources.�Contributions�to�net�costs�are�described�below�and�include�all�capital�and�operating�costs�of�resources,�fuel�costs�for�resources,�and�carbon�costs�for�both�locally�generated�thermal�power�and�imported�power.�The�table�below�shows�the�economic�breakdown�with�costs�shown�as�positive�values�and�benefits�shown�as�negative�values.��
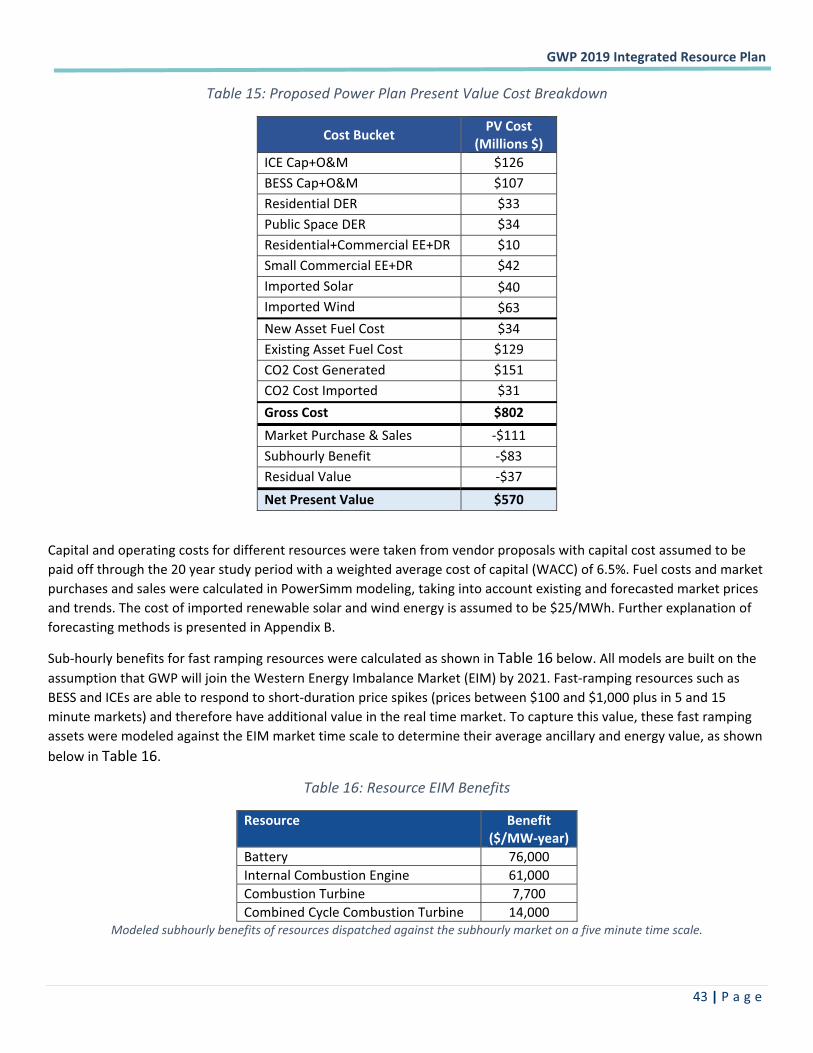
�GWP�2019�Integrated�Resource�Plan��
� �43�|�P a g e �
Table�15:�Proposed�Power�Plan�Present�Value�Cost�Breakdown�
Cost�Bucket� PV�Cost�(Millions�$)�
ICE�Cap+O&M� $126�BESS�Cap+O&M� $107�Residential�DER� $33�Public�Space�DER� $34�Residential+Commercial�EE+DR� $10�Small�Commercial�EE+DR� $42�Imported�Solar� $40�Imported�Wind� $63�New�Asset�Fuel�Cost� $34�Existing�Asset�Fuel�Cost� $129�CO2�Cost�Generated� $151�CO2�Cost�Imported� $31�Gross�Cost�� $802�Market�Purchase�&�Sales� �$111�Subhourly�Benefit� �$83�Residual�Value�� �$37�Net�Present�Value�� $570�
�
Capital�and�operating�costs�for�different�resources�were�taken�from�vendor�proposals�with�capital�cost�assumed�to�be�paid�off�through�the�20�year�study�period�with�a�weighted�average�cost�of�capital�(WACC)�of�6.5%.�Fuel�costs�and�market�purchases�and�sales�were�calculated�in�PowerSimm�modeling,�taking�into�account�existing�and�forecasted�market�prices�and�trends.�The�cost�of�imported�renewable�solar�and�wind�energy�is�assumed�to�be�$25/MWh.�Further�explanation�of�forecasting�methods�is�presented�in�Appendix�B.�
Sub�hourly�benefits�for�fast�ramping�resources�were�calculated�as�shown�in�Table�16�below.�All�models�are�built�on�the�assumption�that�GWP�will�join�the�Western�Energy�Imbalance�Market�(EIM)�by�2021.�Fast�ramping�resources�such�as�BESS�and�ICEs�are�able�to�respond�to�short�duration�price�spikes�(prices�between�$100�and�$1,000�plus�in�5�and�15�minute�markets)�and�therefore�have�additional�value�in�the�real�time�market.�To�capture�this�value,�these�fast�ramping�assets�were�modeled�against�the�EIM�market�time�scale�to�determine�their�average�ancillary�and�energy�value,�as�shown�below�in�Table�16.�
Table�16:�Resource�EIM�Benefits�
Resource� Benefit�($/MW�year)�
Battery� 76,000�Internal�Combustion�Engine�� 61,000�Combustion�Turbine� 7,700�Combined�Cycle�Combustion�Turbine� 14,000�
Modeled�subhourly�benefits�of�resources�dispatched�against�the�subhourly�market�on�a�five�minute�time�scale.��
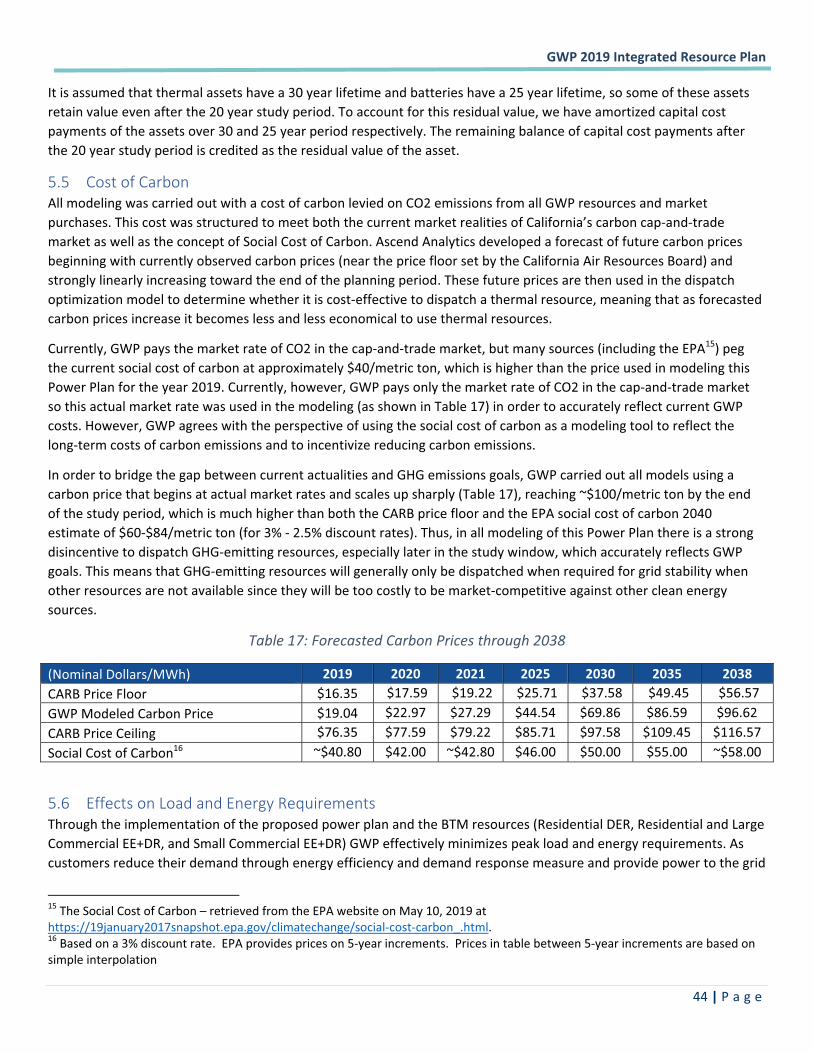
�GWP�2019�Integrated�Resource�Plan��
� �44�|�P a g e �
It�is�assumed�that�thermal�assets�have�a�30�year�lifetime�and�batteries�have�a�25�year�lifetime,�so�some�of�these�assets�retain�value�even�after�the�20�year�study�period.�To�account�for�this�residual�value,�we�have�amortized�capital�cost�payments�of�the�assets�over�30�and�25�year�period�respectively.�The�remaining�balance�of�capital�cost�payments�after�the�20�year�study�period�is�credited�as�the�residual�value�of�the�asset.�
5.5 Cost�of�Carbon�All�modeling�was�carried�out�with�a�cost�of�carbon�levied�on�CO2�emissions�from�all�GWP�resources�and�market�purchases.�This�cost�was�structured�to�meet�both�the�current�market�realities�of�California’s�carbon�cap�and�trade�market�as�well�as�the�concept�of�Social�Cost�of�Carbon.�Ascend�Analytics�developed�a�forecast�of�future�carbon�prices�beginning�with�currently�observed�carbon�prices�(near�the�price�floor�set�by�the�California�Air�Resources�Board)�and�strongly�linearly�increasing�toward�the�end�of�the�planning�period.�These�future�prices�are�then�used�in�the�dispatch�optimization�model�to�determine�whether�it�is�cost�effective�to�dispatch�a�thermal�resource,�meaning�that�as�forecasted�carbon�prices�increase�it�becomes�less�and�less�economical�to�use�thermal�resources.�
Currently,�GWP�pays�the�market�rate�of�CO2�in�the�cap�and�trade�market,�but�many�sources�(including�the�EPA15)�peg�the�current�social�cost�of�carbon�at�approximately�$40/metric�ton,�which�is�higher�than�the�price�used�in�modeling�this�Power�Plan�for�the�year�2019.�Currently,�however,�GWP�pays�only�the�market�rate�of�CO2�in�the�cap�and�trade�market�so�this�actual�market�rate�was�used�in�the�modeling�(as�shown�in�Table�17)�in�order�to�accurately�reflect�current�GWP�costs.�However,�GWP�agrees�with�the�perspective�of�using�the�social�cost�of�carbon�as�a�modeling�tool�to�reflect�the�long�term�costs�of�carbon�emissions�and�to�incentivize�reducing�carbon�emissions.�
In�order�to�bridge�the�gap�between�current�actualities�and�GHG�emissions�goals,�GWP�carried�out�all�models�using�a�carbon�price�that�begins�at�actual�market�rates�and�scales�up�sharply�(Table�17),�reaching�~$100/metric�ton�by�the�end�of�the�study�period,�which�is�much�higher�than�both�the�CARB�price�floor�and�the�EPA�social�cost�of�carbon�2040�estimate�of�$60�$84/metric�ton�(for�3%���2.5%�discount�rates).�Thus,�in�all�modeling�of�this�Power�Plan�there�is�a�strong�disincentive�to�dispatch�GHG�emitting�resources,�especially�later�in�the�study�window,�which�accurately�reflects�GWP�goals.�This�means�that�GHG�emitting�resources�will�generally�only�be�dispatched�when�required�for�grid�stability�when�other�resources�are�not�available�since�they�will�be�too�costly�to�be�market�competitive�against�other�clean�energy�sources.�
Table�17:�Forecasted�Carbon�Prices�through�2038�
(Nominal�Dollars/MWh)� 2019� 2020� 2021� 2025� 2030� 2035� 2038�CARB�Price�Floor� $16.35� �$17.59� �$19.22� �$25.71� �$37.58�� �$49.45�� �$56.57��GWP�Modeled�Carbon�Price� $19.04� $22.97�� $27.29�� $44.54�� $69.86�� $86.59�� $96.62��CARB�Price�Ceiling� $76.35� $77.59�� $79.22�� $85.71�� $97.58�� $109.45� $116.57��Social�Cost�of�Carbon16� ~$40.80� $42.00� ~$42.80� $46.00� $50.00� $55.00� ~$58.00��
5.6 Effects�on�Load�and�Energy�Requirements��Through�the�implementation�of�the�proposed�power�plan�and�the�BTM�resources�(Residential�DER,�Residential�and�Large�Commercial�EE+DR,�and�Small�Commercial�EE+DR)�GWP�effectively�minimizes�peak�load�and�energy�requirements.�As�customers�reduce�their�demand�through�energy�efficiency�and�demand�response�measure�and�provide�power�to�the�grid�
������������������������������������������������������������15�The�Social�Cost�of�Carbon�–�retrieved�from�the�EPA�website�on�May�10,�2019�at�https://19january2017snapshot.epa.gov/climatechange/social�cost�carbon_.html.�16�Based�on�a�3%�discount�rate.��EPA�provides�prices�on�5�year�increments.��Prices�in�table�between�5�year�increments�are�based�on�simple�interpolation�
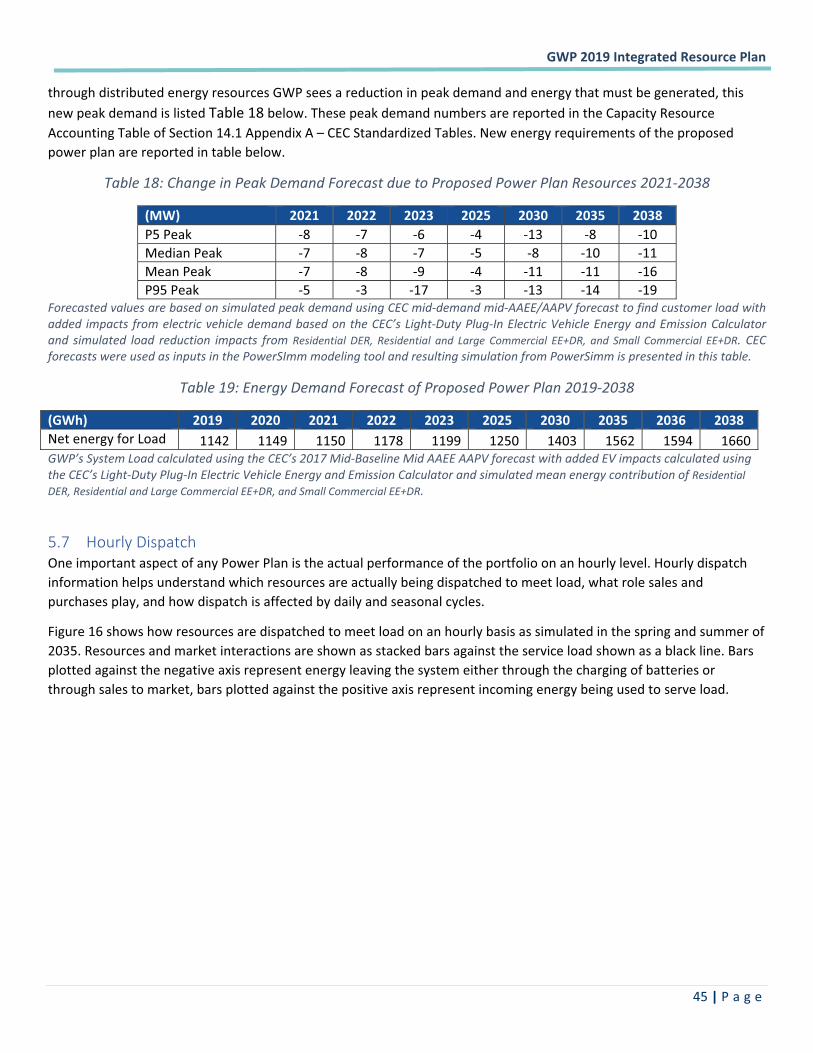
�GWP�2019�Integrated�Resource�Plan��
� �45�|�P a g e �
through�distributed�energy�resources�GWP�sees�a�reduction�in�peak�demand�and�energy�that�must�be�generated,�this�new�peak�demand�is�listed�Table�18�below.�These�peak�demand�numbers�are�reported�in�the�Capacity�Resource�Accounting�Table�of�Section�14.1�Appendix�A�–�CEC�Standardized�Tables.�New�energy�requirements�of�the�proposed�power�plan�are�reported�in�table�below.��
Table�18:�Change�in�Peak�Demand�Forecast�due�to�Proposed�Power�Plan�Resources�2021�2038�
(MW)� 2021� 2022� 2023� 2025� 2030� 2035� 2038�P5�Peak� �8� �7� �6� �4� �13� �8� �10�Median�Peak� �7� �8� �7� �5� �8� �10� �11�Mean�Peak�� �7� �8� �9� �4� �11� �11� �16�P95�Peak� �5� �3� �17� �3� �13� �14� �19�
Forecasted�values�are�based�on�simulated�peak�demand�using�CEC�mid�demand�mid�AAEE/AAPV�forecast�to�find�customer�load�with�added� impacts�from�electric�vehicle�demand�based�on�the�CEC’s�Light�Duty�Plug�In�Electric�Vehicle�Energy�and�Emission�Calculator�and� simulated� load� reduction� impacts� from�Residential� DER,� Residential� and� Large� Commercial� EE+DR,� and� Small� Commercial� EE+DR.� CEC�forecasts�were�used�as�inputs�in�the�PowerSImm�modeling�tool�and�resulting�simulation�from�PowerSimm�is�presented�in�this�table.�
Table�19:�Energy�Demand�Forecast�of�Proposed�Power�Plan�2019�2038�
(GWh)� 2019� 2020� 2021� 2022� 2023� 2025� 2030� 2035� 2036� 2038�Net�energy�for�Load�� 1142� 1149� 1150 1178 1199 1250 1403� 1562� 1594 1660GWP’s�System�Load�calculated�using�the�CEC’s�2017�Mid�Baseline�Mid�AAEE�AAPV�forecast�with�added�EV�impacts�calculated�using�the�CEC’s�Light�Duty�Plug�In�Electric�Vehicle�Energy�and�Emission�Calculator�and�simulated�mean�energy�contribution�of�Residential�DER,�Residential�and�Large�Commercial�EE+DR,�and�Small�Commercial�EE+DR.�
�
5.7 Hourly�Dispatch�One�important�aspect�of�any�Power�Plan�is�the�actual�performance�of�the�portfolio�on�an�hourly�level.�Hourly�dispatch�information�helps�understand�which�resources�are�actually�being�dispatched�to�meet�load,�what�role�sales�and�purchases�play,�and�how�dispatch�is�affected�by�daily�and�seasonal�cycles.�
Figure�16�shows�how�resources�are�dispatched�to�meet�load�on�an�hourly�basis�as�simulated�in�the�spring�and�summer�of�2035.�Resources�and�market�interactions�are�shown�as�stacked�bars�against�the�service�load�shown�as�a�black�line.�Bars�plotted�against�the�negative�axis�represent�energy�leaving�the�system�either�through�the�charging�of�batteries�or�through�sales�to�market,�bars�plotted�against�the�positive�axis�represent�incoming�energy�being�used�to�serve�load.�
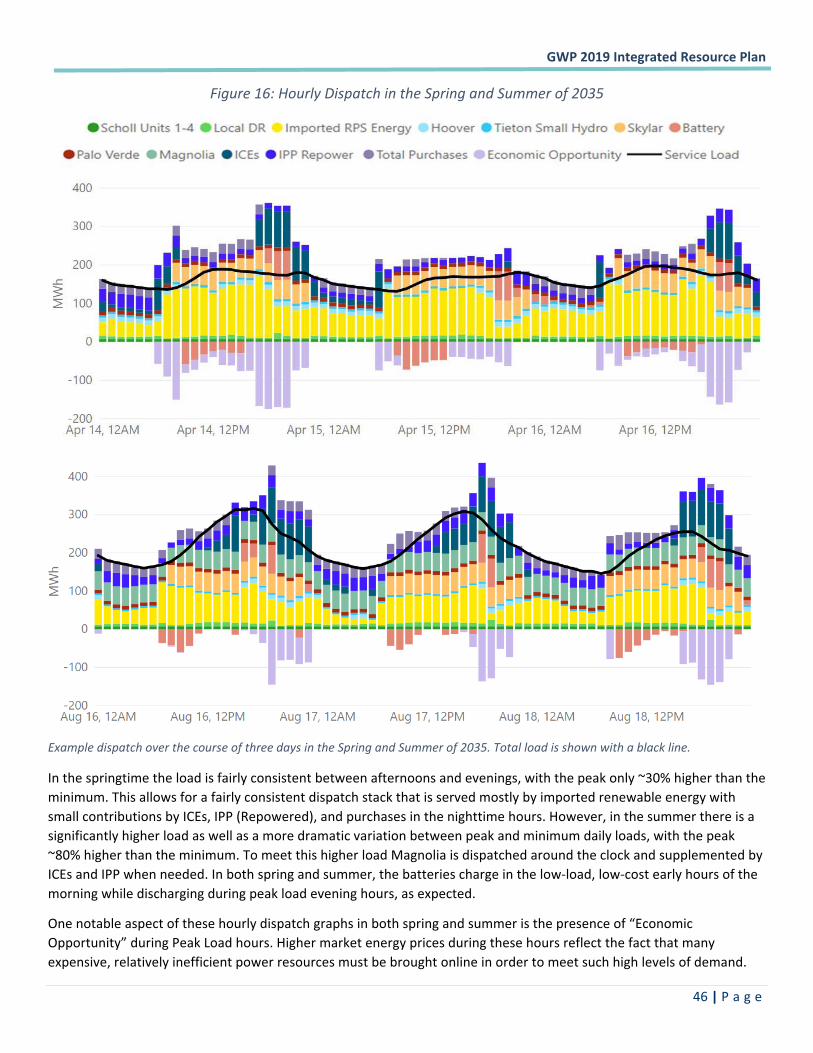
�GWP�2019�Integrated�Resource�Plan��
� �46�|�P a g e �
Figure�16:�Hourly�Dispatch�in�the�Spring�and�Summer�of�2035�
�
�
Example�dispatch�over�the�course�of�three�days�in�the�Spring�and�Summer�of�2035.�Total�load�is�shown�with�a�black�line.��
In�the�springtime�the�load�is�fairly�consistent�between�afternoons�and�evenings,�with�the�peak�only�~30%�higher�than�the�minimum.�This�allows�for�a�fairly�consistent�dispatch�stack�that�is�served�mostly�by�imported�renewable�energy�with�small�contributions�by�ICEs,�IPP�(Repowered),�and�purchases�in�the�nighttime�hours.�However,�in�the�summer�there�is�a�significantly�higher�load�as�well�as�a�more�dramatic�variation�between�peak�and�minimum�daily�loads,�with�the�peak�~80%�higher�than�the�minimum.�To�meet�this�higher�load�Magnolia�is�dispatched�around�the�clock�and�supplemented�by�ICEs�and�IPP�when�needed.�In�both�spring�and�summer,�the�batteries�charge�in�the�low�load,�low�cost�early�hours�of�the�morning�while�discharging�during�peak�load�evening�hours,�as�expected.�
One�notable�aspect�of�these�hourly�dispatch�graphs�in�both�spring�and�summer�is�the�presence�of�“Economic�Opportunity”�during�Peak�Load�hours.�Higher�market�energy�prices�during�these�hours�reflect�the�fact�that�many�expensive,�relatively�inefficient�power�resources�must�be�brought�online�in�order�to�meet�such�high�levels�of�demand.�
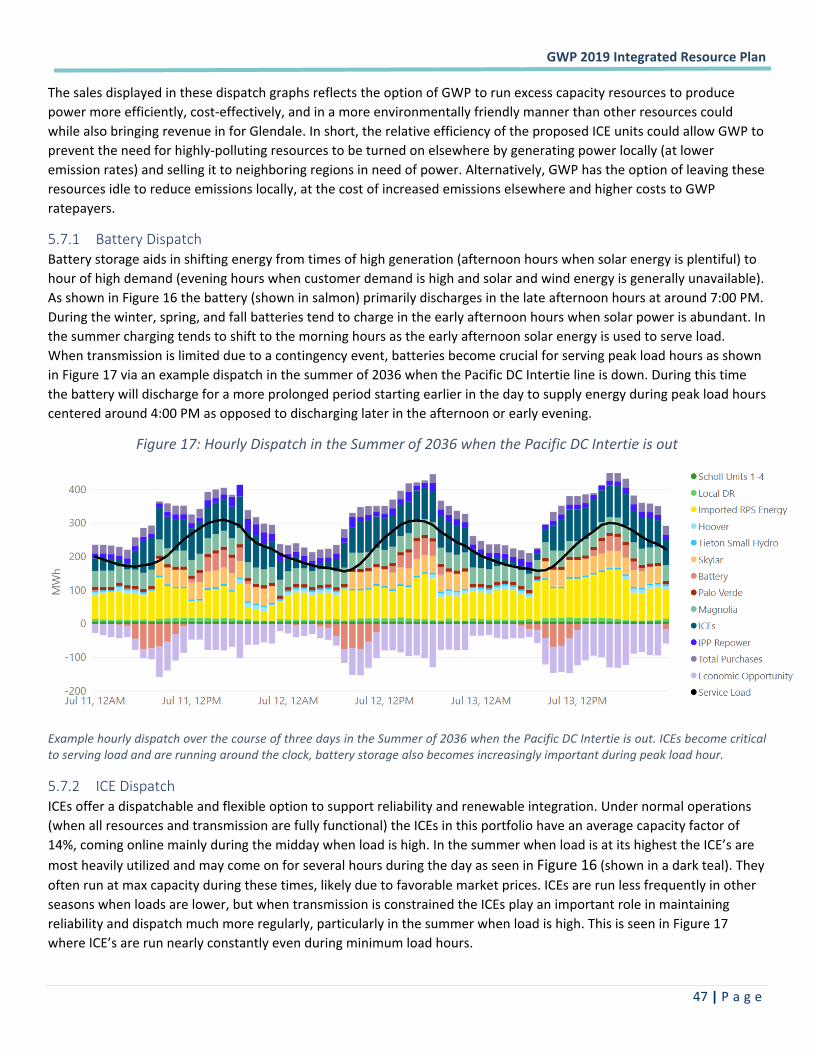
�GWP�2019�Integrated�Resource�Plan��
� �47�|�P a g e �
The�sales�displayed�in�these�dispatch�graphs�reflects�the�option�of�GWP�to�run�excess�capacity�resources�to�produce�power�more�efficiently,�cost�effectively,�and�in�a�more�environmentally�friendly�manner�than�other�resources�could�while�also�bringing�revenue�in�for�Glendale.�In�short,�the�relative�efficiency�of�the�proposed�ICE�units�could�allow�GWP�to�prevent�the�need�for�highly�polluting�resources�to�be�turned�on�elsewhere�by�generating�power�locally�(at�lower�emission�rates)�and�selling�it�to�neighboring�regions�in�need�of�power.�Alternatively,�GWP�has�the�option�of�leaving�these�resources�idle�to�reduce�emissions�locally,�at�the�cost�of�increased�emissions�elsewhere�and�higher�costs�to�GWP�ratepayers.��
5.7.1 Battery�Dispatch��Battery�storage�aids�in�shifting�energy�from�times�of�high�generation�(afternoon�hours�when�solar�energy�is�plentiful)�to�hour�of�high�demand�(evening�hours�when�customer�demand�is�high�and�solar�and�wind�energy�is�generally�unavailable).�As�shown�in�Figure�16�the�battery�(shown�in�salmon)�primarily�discharges�in�the�late�afternoon�hours�at�around�7:00�PM.�During�the�winter,�spring,�and�fall�batteries�tend�to�charge�in�the�early�afternoon�hours�when�solar�power�is�abundant.�In�the�summer�charging�tends�to�shift�to�the�morning�hours�as�the�early�afternoon�solar�energy�is�used�to�serve�load.��When�transmission�is�limited�due�to�a�contingency�event,�batteries�become�crucial�for�serving�peak�load�hours�as�shown�in�Figure�17�via�an�example�dispatch�in�the�summer�of�2036�when�the�Pacific�DC�Intertie�line�is�down.�During�this�time�the�battery�will�discharge�for�a�more�prolonged�period�starting�earlier�in�the�day�to�supply�energy�during�peak�load�hours�centered�around�4:00�PM�as�opposed�to�discharging�later�in�the�afternoon�or�early�evening.��
Figure�17:�Hourly�Dispatch�in�the�Summer�of�2036�when�the�Pacific�DC�Intertie�is�out�
�
Example�hourly�dispatch�over�the�course�of�three�days�in�the�Summer�of�2036�when�the�Pacific�DC�Intertie�is�out.�ICEs�become�critical�to�serving�load�and�are�running�around�the�clock,�battery�storage�also�becomes�increasingly�important�during�peak�load�hour.��
5.7.2 ICE�Dispatch��ICEs�offer�a�dispatchable�and�flexible�option�to�support�reliability�and�renewable�integration.�Under�normal�operations�(when�all�resources�and�transmission�are�fully�functional)�the�ICEs�in�this�portfolio�have�an�average�capacity�factor�of�14%,�coming�online�mainly�during�the�midday�when�load�is�high.�In�the�summer�when�load�is�at�its�highest�the�ICE’s�are�most�heavily�utilized�and�may�come�on�for�several�hours�during�the�day�as�seen�in�Figure�16�(shown�in�a�dark�teal).�They�often�run�at�max�capacity�during�these�times,�likely�due�to�favorable�market�prices.�ICEs�are�run�less�frequently�in�other�seasons�when�loads�are�lower,�but�when�transmission�is�constrained�the�ICEs�play�an�important�role�in�maintaining�reliability�and�dispatch�much�more�regularly,�particularly�in�the�summer�when�load�is�high.�This�is�seen�in�Figure�17�where�ICE’s�are�run�nearly�constantly�even�during�minimum�load�hours.��
�GWP�2019�Integrated�Resource�Plan��
� �48�|�P a g e �
Because�the�ICEs�are�more�efficient�than�other�plants�and�consume�no�water,�running�them�during�peaks�periods�may�offset�environmental�impacts�of�other�plants�outside�the�GWP�service�territory�while�also�providing�economic�value�to�GWP.�Alternatively,�these�resources�could�be�left�idle�to�reduce�emissions�locally�at�the�cost�of�increased�emissions�elsewhere,�while�also�increasing�costs�to�GWP�ratepayers.��
5.8 Benefits�Over�Original�262�MW�Grayson�Repower��The�Original�262�MW�Grayson�Repower�Plan�comprised�of�two�60�MW�simple�cycle�units�and�two�71�MW�one�on�one�combined�cycle�units17�totaling�262�MW�of�new�thermal�capacity.�This�new�Proposed�Power�Plan�includes�a�more�diversified�portfolio�that�better�meets�GWP’s�priorities�and�includes�a�smaller�gas�plant�comprised�of�ICEs�that�are�more�flexible,�faster�responding,�have�unlimited�start/stops,�and�more�efficient�than�the�original�262�MW�Grayson�Repower�plan.�ICEs�are�a�relatively�new�form�of�utility�scale�energy�generation.�These�engines�function�similarly�to�traditional�simple�cycle�combustion�turbines�in�that�they�can�provide�large�amounts�of�energy�very�quickly.�Unlike�traditional�turbines,�ICEs�may�be�run�for�long�periods�of�time�or�may�be�rapidly�cycled�on�and�off�with�no�penalty�to�performance�or�structural�integrity.�This�allows�ICEs�to�largely�fulfill�both�the�instant�energy�regulation�role�of�simple�cycle�CT�generators�and�baseload�power�capacity�role�of�combined�cycle�(CC)�turbines�while�also�being�able�to�turn�off�when�not�needed.�The�power�capacity�of�these�units�allows�them�to�fulfill�backup�power�requirements�for�a�utility�while�the�fast�ramping�capabilities�provide�flexibility�to�the�grid�by�being�able�to�balance�variable�resources�such�as�solar�and�wind.�While�ICEs�do�typically�use�fossil�fuel,�they�use�far�less�water�than�CT/CC�units,�run�more�efficiently�in�hot�weather�(when�they�are�most�likely�to�be�needed),�and�may�be�potentially�reconfigured�to�run�on�hydrogen�fuel�or�biogas/renewable�natural�gas�should�these�fuel�sources�become�available.�
This�proposed�portfolio�reduces�new�thermal�capacity�from�262�MW�to�under�100MW�while�reducing�overall�emissions�compared�to�the�original�2015�plan�while�still�meeting�all�GWP�capacity�needs.�Additionally,�this�plan�includes�a�variety�of�local�clean�energy�and�demand�reduction�programs�that�reduce�generation�needs,�supporting�renewable�energy�goals,�promoting�local�air�quality,�and�enabling�the�community�to�play�an�active�role�in�engaging�with�and�supporting�the�proposed�power�plan.�Finally,�this�plan�utilizes�a�utility�scale�battery�which�will�allow�GWP�to�better�integrate�a�large�amount�of�renewable�energy�into�their�system�by�shifting�this�energy�from�when�it�is�produced�during�peak�sun�and�wind�hours�to�the�peak�load�hours�when�it�is�really�needed.��
5.9 Renewable�and�Thermal�Resources�in�Proposed�Portfolio��While�this�proposed�portfolio�incorporates�new�thermal�resources,�the�goal�is�to�maximize�utilization�of�renewables�and�have�thermals�run�just�enough�to�ensure�system�reliability.�The�ICEs�within�this�portfolio�have�a�long�term�average�capacity�factor�of�14%,�even�when�including�participation�in�economic�opportunities,�indicating�that�these�resources�effectively�fulfill�GWP’s�back�up�capacity�needs�while�contributing�minimal�emissions�and�runtime.�This�is�shown�in��Figure�18.�Note�that�while�ICEs�start�off�with�a�capacity�factor�of�40%�in�the�year�2021�due�to�being�installed�just�in�time�for�peak�demand�summer�season�in�that�year�(and�hence�heavy�runtimes�for�four�of�the�six�months�that�they�are�operational�that�year),�they�quickly�drop�to�a�capacity�factor�of�12�15%�in�all�later�years.�In�2036�when�the�Pacific�DC�Intertie�is�modeled�to�be�out,�the�capacity�factor�rises�to�47%�because�the�inability�to�import�energy�necessitates�increased�local�generation.�Grayson�Unit�9�maintains�a�low�capacity�factor�of�approximately�2%�until�it’s�closure�in�2033�due�to�being�a�less�efficient�resource�than�all�newly�installed�resources.�Through�the�study�period�Magnolia�maintains�an�average�capacity�factor�of�50%�because�it�is�a�shared�resource�and�therefore�must�be�run�at�all�times�in�order�to�be�available�to�all�shareholders.�In�terms�of�non�local�resources,�IPP�has�an�average�capacity�factor�of�67%,�and�the�IPP�repower�has�a�capacity�factor�of�57%.�
���
������������������������������������������������������������17�https://www.glendaleca.gov/Home/ShowDocument?id=38874�
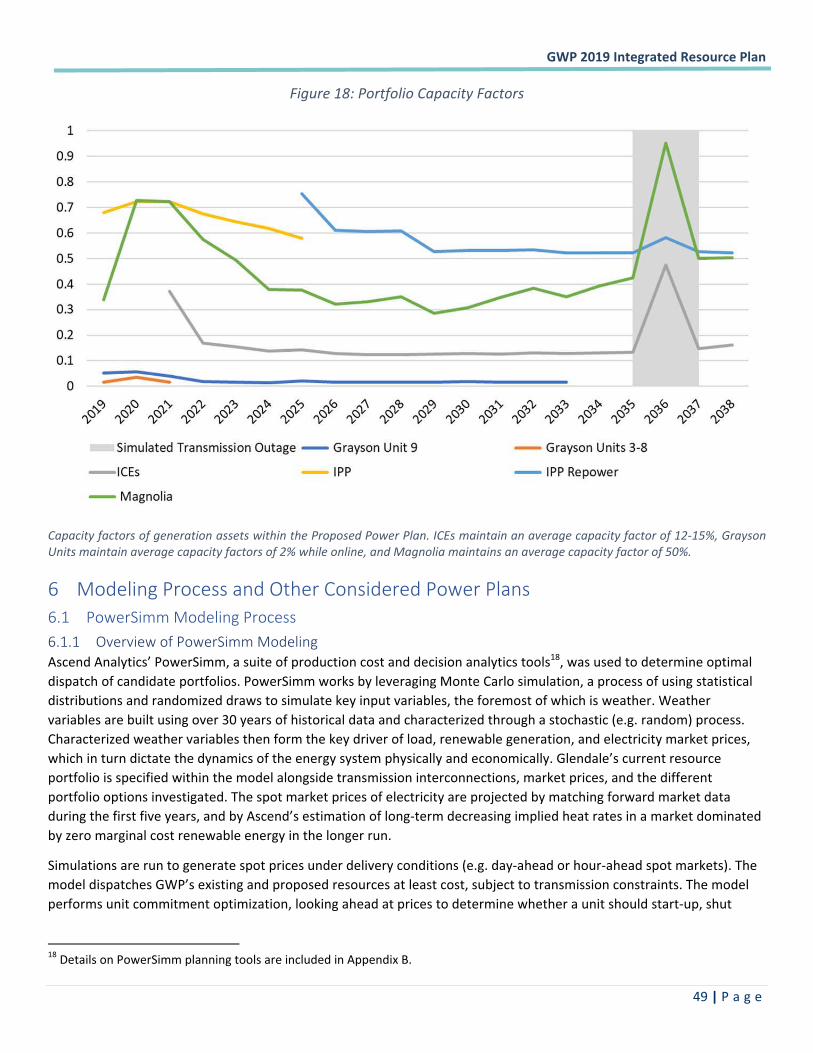
�GWP�2019�Integrated�Resource�Plan��
� �49�|�P a g e �
Figure�18:�Portfolio�Capacity�Factors�
�
Capacity�factors�of�generation�assets�within�the�Proposed�Power�Plan.�ICEs�maintain�an�average�capacity�factor�of�12�15%,�Grayson�Units�maintain�average�capacity�factors�of�2%�while�online,�and�Magnolia�maintains�an�average�capacity�factor�of�50%.����
6 Modeling�Process�and�Other�Considered�Power�Plans��6.1 PowerSimm�Modeling�Process�6.1.1 Overview�of�PowerSimm�Modeling��Ascend�Analytics’�PowerSimm,�a�suite�of�production�cost�and�decision�analytics�tools18,�was�used�to�determine�optimal�dispatch�of�candidate�portfolios.�PowerSimm�works�by�leveraging�Monte�Carlo�simulation,�a�process�of�using�statistical�distributions�and�randomized�draws�to�simulate�key�input�variables,�the�foremost�of�which�is�weather.�Weather�variables�are�built�using�over�30�years�of�historical�data�and�characterized�through�a�stochastic�(e.g.�random)�process.�Characterized�weather�variables�then�form�the�key�driver�of�load,�renewable�generation,�and�electricity�market�prices,�which�in�turn�dictate�the�dynamics�of�the�energy�system�physically�and�economically.�Glendale’s�current�resource�portfolio�is�specified�within�the�model�alongside�transmission�interconnections,�market�prices,�and�the�different�portfolio�options�investigated.�The�spot�market�prices�of�electricity�are�projected�by�matching�forward�market�data�during�the�first�five�years,�and�by�Ascend’s�estimation�of�long�term�decreasing�implied�heat�rates�in�a�market�dominated�by�zero�marginal�cost�renewable�energy�in�the�longer�run.��
Simulations�are�run�to�generate�spot�prices�under�delivery�conditions�(e.g.�day�ahead�or�hour�ahead�spot�markets).�The�model�dispatches�GWP’s�existing�and�proposed�resources�at�least�cost,�subject�to�transmission�constraints.�The�model�performs�unit�commitment�optimization,�looking�ahead�at�prices�to�determine�whether�a�unit�should�start�up,�shut�
������������������������������������������������������������18�Details�on�PowerSimm�planning�tools�are�included�in�Appendix�B.�
�GWP�2019�Integrated�Resource�Plan��
� �50�|�P a g e �
down,�or�run�at�minimum�generation,�and�what�output�is�feasible.�The�model�also�dispatches�units�to�provide�ancillary�services�to�maintain�reliability�requirements.�The�model’s�primary�results�are:�
� Monthly�and�hourly�dispatch�and�emission�results�by�unit�� Start�up,�shut�down,�fuel,�variable�O&M,�fixed�O&M,�and�emissions�costs�by�unit�
In�addition�to�ensuring�reliability�through�the�development�of�portfolios�that�meet�N�1�1�reserve�requirements,�this�IRP�measures�the�reliability�of�portfolios�considered�using�loss�of�load�probability�analysis.�PowerSimm’s�LOLH�(Loss�of�Load�Hours)�tool�simulates�load,�generation�outages,�and�battery�state�of�charge�to�determine�the�number�of�hours�in�a�year�when�load�is�greater�than�supply,�excluding�market�purchases.�The�One�Day�in�Ten�Years�metric�(1�in�10),�a�standard�metric�used�by�NERC�to�determine�system�reliability,�is�the�probability�that,�over�a�ten�year�time�frame,�the�utility�will�experience�loss�of�load�for�a�total�of�24�hours19.�A�prudent�portfolio�will�maintain�a�mean�LOLH�of�2.4�hours�per�year�or�less,�such�that�over�a�ten�year�time�frame�the�total�LOLH�is�less�than�or�equal�to�24�hours.�
For�a�list�of�key�assumptions�made�in�the�modeling�process,�please�see�Appendix�C�–�Key�Modeling�Assumptions.�
6.2 Other�Investigated�Portfolios��6.2.1 Comparison�of�Alternative�Portfolios��Since�a�wide�variety�of�projects�were�proposed,�GWP�investigated�and�modeled�several�different�combinations�of�resources�in�order�to�determine�the�combination�that�best�meets�Glendale’s�needs�and�has�optimal�synergy�with�GWP’s�existing�resources.�The�various�proposals�submitted�in�the�RFP�process�were�grouped�in�several�possible�future�portfolios.�Each�portfolio�was�built�around�a�different�approach�(e.g.�“100%�Clean�Energy”,�“Large�Battery�Storage”,�“Mixed�Clean�and�Thermal�Resources”,�“Build�Nothing�New”,�etc)�and�filled�with�resources�chosen�for�their�synergy�together�and�with�the�existing�GWP�portfolio,�as�well�as�for�their�ability�to�meet�reliability�requirements.�These�portfolios�were�designed�to�have�similar�capacity�and�asset�costs,�leading�to�tradeoffs�between�reliability�and�environmental�impacts.�Typically,�the�greenest�portfolios�tend�to�sacrifice�some�amount�of�overall�reliability�and�cost�compared�to�portfolios�that�rely�on�fossil�fuel�resources,�which�tend�to�increase�environmental�impacts.�Since�GWP�does�not�want�to�build�carbon�emitting�resources�but�does�want�to�keep�costs�at�reasonable�levels�and�must�meet�FERC�reliability�requirements,�we�investigated�multiple�portfolio�options�to�find�an�overall�portfolio�that�is�well�rounded�and�balances�the�community’s�cost,�environmental,�and�reliability�goals.�
Seven�portfolio�options�were�considered�ranging�from�a�Base�Case�of�building�nothing�new�to�a�100%�Clean�scenario�that�implemented�no�new�fossil�fuel�assets.�Intermediate�portfolios�between�these�scenarios�considered�a�variety�of�combinations�of�utility�scale�batteries,�local�DSM,�DR,�energy�efficiency,�and�behind�the�meter�solar/storage,�and�thermal�resources.�All�portfolio�options�were�built�to�ensure�N�1�1�reliability�using�resources�selected�from�the�Clean�Energy�RFP�along�with�generic�renewable�energy�resources�necessary�to�comply�with�SB�100�and�meet�RPS.�The�items�in�the�portfolios�considered�are�detailed�in�Table�20.��
������������������������������������������������������������19�Federal�Register�Volume�75,�Number�207�(Wednesday,�October�27,�2010)�
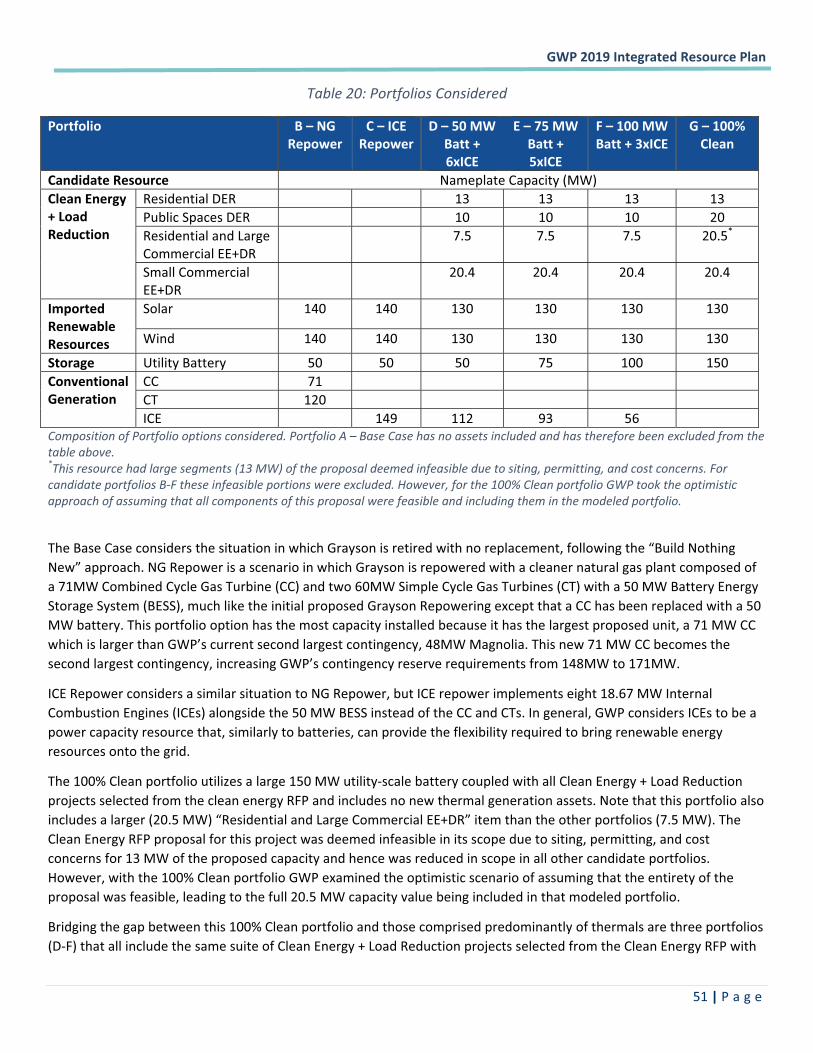
�GWP�2019�Integrated�Resource�Plan��
� �51�|�P a g e �
Table�20:�Portfolios�Considered�
Portfolio�� B�–�NG�Repower�
C�–�ICE�Repower
D�–�50�MW�Batt�+�6xICE�
E�–�75�MW�Batt�+�5xICE�
F�–�100�MW�Batt�+�3xICE�
G�–�100%�Clean�
Candidate�Resource�� Nameplate�Capacity�(MW)�Clean�Energy�+�Load�Reduction�
Residential�DER� � � 13� 13� 13� 13�Public�Spaces�DER� � � 10� 10� 10� 20�Residential�and�Large�Commercial�EE+DR�
� � 7.5� 7.5� 7.5� 20.5*
Small�Commercial�EE+DR�
� � 20.4� 20.4� 20.4� 20.4�
Imported�Renewable�Resources�
Solar�� 140� 140� 130� 130� 130� 130�
Wind� 140� 140� 130� 130� 130� 130�
Storage� Utility�Battery� 50� 50� 50� 75� 100� 150�Conventional�Generation�
CC� 71� � � � � �CT� 120� � � � � �ICE� � 149� 112� 93� 56� �
Composition�of�Portfolio�options�considered.�Portfolio�A�–�Base�Case�has�no�assets�included�and�has�therefore�been�excluded�from�the�table�above.�*This�resource�had�large�segments�(13�MW)�of�the�proposal�deemed�infeasible�due�to�siting,�permitting,�and�cost�concerns.�For�candidate�portfolios�B�F�these�infeasible�portions�were�excluded.�However,�for�the�100%�Clean�portfolio�GWP�took�the�optimistic�approach�of�assuming�that�all�components�of�this�proposal�were�feasible�and�including�them�in�the�modeled�portfolio.��
The�Base�Case�considers�the�situation�in�which�Grayson�is�retired�with�no�replacement,�following�the�“Build�Nothing�New”�approach.�NG�Repower�is�a�scenario�in�which�Grayson�is�repowered�with�a�cleaner�natural�gas�plant�composed�of�a�71MW�Combined�Cycle�Gas�Turbine�(CC)�and�two�60MW�Simple�Cycle�Gas�Turbines�(CT)�with�a�50�MW�Battery�Energy�Storage�System�(BESS),�much�like�the�initial�proposed�Grayson�Repowering�except�that�a�CC�has�been�replaced�with�a�50�MW�battery.�This�portfolio�option�has�the�most�capacity�installed�because�it�has�the�largest�proposed�unit,�a�71�MW�CC�which�is�larger�than�GWP’s�current�second�largest�contingency,�48MW�Magnolia.�This�new�71�MW�CC�becomes�the�second�largest�contingency,�increasing�GWP’s�contingency�reserve�requirements�from�148MW�to�171MW.��
ICE�Repower�considers�a�similar�situation�to�NG�Repower,�but�ICE�repower�implements�eight�18.67�MW�Internal�Combustion�Engines�(ICEs)�alongside�the�50�MW�BESS�instead�of�the�CC�and�CTs.�In�general,�GWP�considers�ICEs�to�be�a�power�capacity�resource�that,�similarly�to�batteries,�can�provide�the�flexibility�required�to�bring�renewable�energy�resources�onto�the�grid.�
The�100%�Clean�portfolio�utilizes�a�large�150�MW�utility�scale�battery�coupled�with�all�Clean�Energy�+�Load�Reduction�projects�selected�from�the�clean�energy�RFP�and�includes�no�new�thermal�generation�assets.�Note�that�this�portfolio�also�includes�a�larger�(20.5�MW)�“Residential�and�Large�Commercial�EE+DR”�item�than�the�other�portfolios�(7.5�MW).�The�Clean�Energy�RFP�proposal�for�this�project�was�deemed�infeasible�in�its�scope�due�to�siting,�permitting,�and�cost�concerns�for�13�MW�of�the�proposed�capacity�and�hence�was�reduced�in�scope�in�all�other�candidate�portfolios.�However,�with�the�100%�Clean�portfolio�GWP�examined�the�optimistic�scenario�of�assuming�that�the�entirety�of�the�proposal�was�feasible,�leading�to�the�full�20.5�MW�capacity�value�being�included�in�that�modeled�portfolio.�
Bridging�the�gap�between�this�100%�Clean�portfolio�and�those�comprised�predominantly�of�thermals�are�three�portfolios�(D�F)�that�all�include�the�same�suite�of�Clean�Energy�+�Load�Reduction�projects�selected�from�the�Clean�Energy�RFP�with�
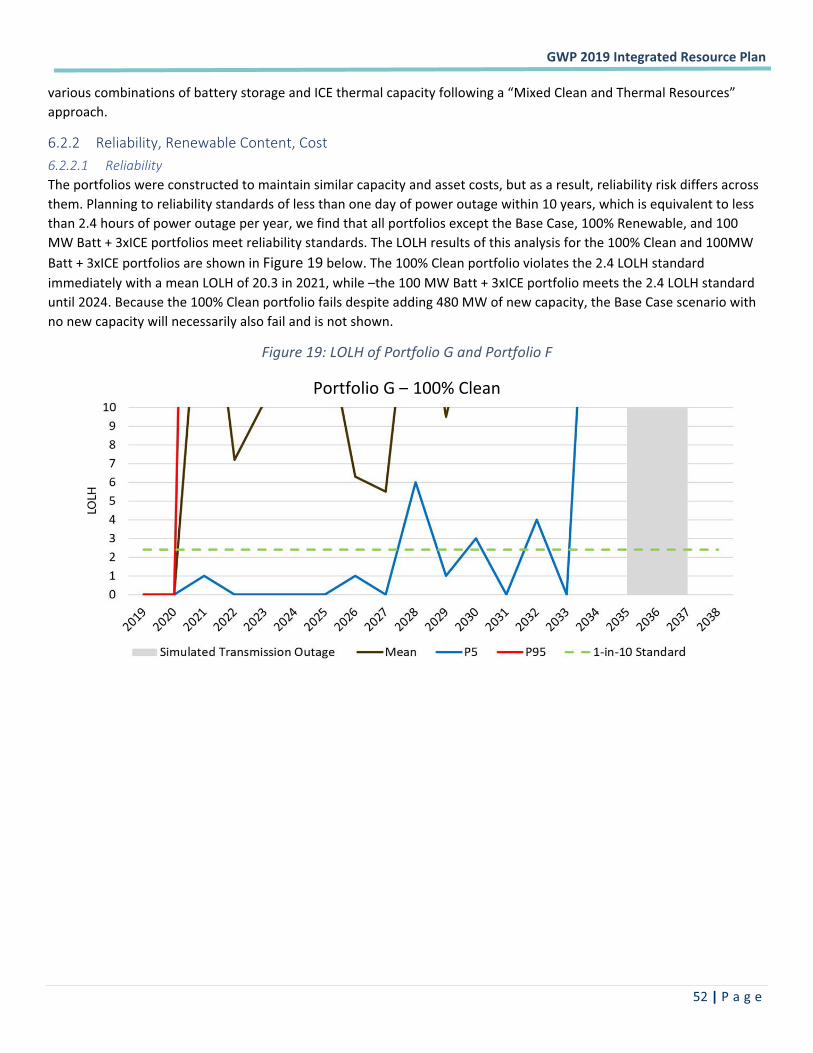
�GWP�2019�Integrated�Resource�Plan��
� �52�|�P a g e �
various�combinations�of�battery�storage�and�ICE�thermal�capacity�following�a�“Mixed�Clean�and�Thermal�Resources”�approach.��
6.2.2 Reliability,�Renewable�Content,�Cost�������� ������ ��The�portfolios�were�constructed�to�maintain�similar�capacity�and�asset�costs,�but�as�a�result,�reliability�risk�differs�across�them.�Planning�to�reliability�standards�of�less�than�one�day�of�power�outage�within�10�years,�which�is�equivalent�to�less�than�2.4�hours�of�power�outage�per�year,�we�find�that�all�portfolios�except�the�Base�Case,�100%�Renewable,�and�100�MW�Batt�+�3xICE�portfolios�meet�reliability�standards.�The�LOLH�results�of�this�analysis�for�the�100%�Clean�and�100MW�Batt�+�3xICE�portfolios�are�shown�in�Figure�19�below.�The�100%�Clean�portfolio�violates�the�2.4�LOLH�standard�immediately�with�a�mean�LOLH�of�20.3�in�2021,�while�–the�100�MW�Batt�+�3xICE�portfolio�meets�the�2.4�LOLH�standard�until�2024.�Because�the�100%�Clean�portfolio�fails�despite�adding�480�MW�of�new�capacity,�the�Base�Case�scenario�with�no�new�capacity�will�necessarily�also�fail�and�is�not�shown.��
Figure�19:�LOLH�of�Portfolio�G�and�Portfolio�F��
�
�
Portfolio�G�– 100%�Clean
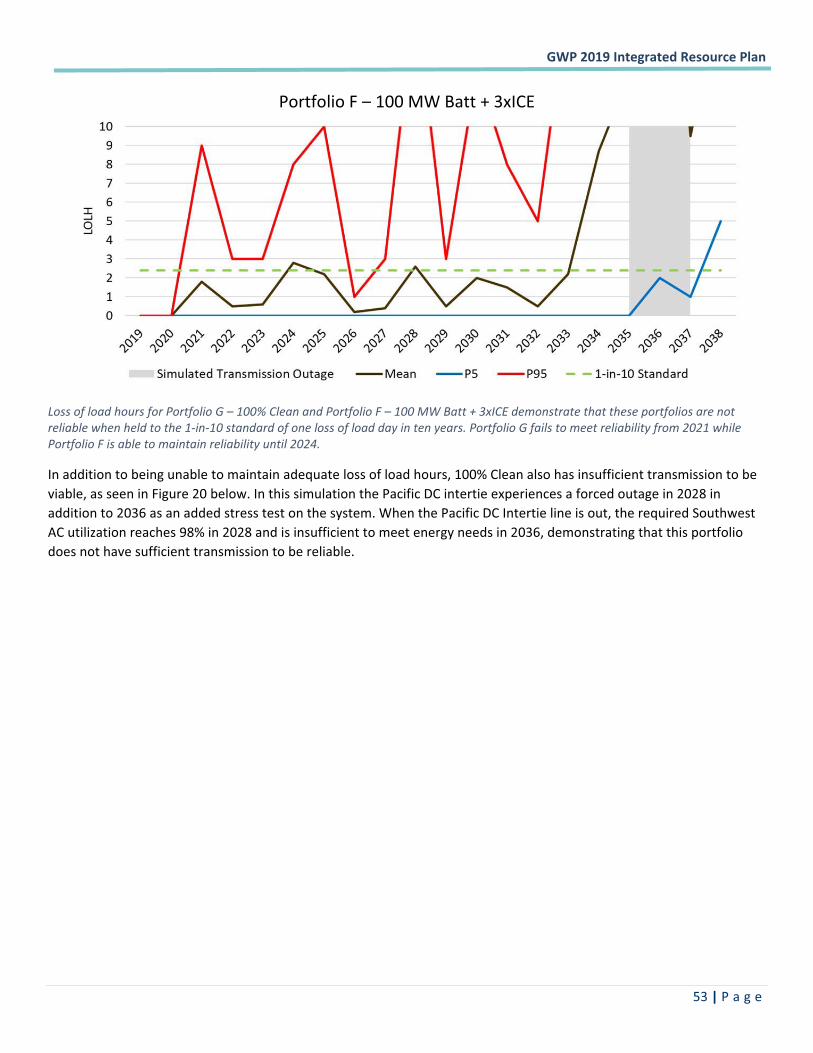
�GWP�2019�Integrated�Resource�Plan��
� �53�|�P a g e �
�
�
Loss�of�load�hours�for�Portfolio�G�–�100%�Clean�and�Portfolio�F�–�100�MW�Batt�+�3xICE�demonstrate�that�these�portfolios�are�not�reliable�when�held�to�the�1�in�10�standard�of�one�loss�of�load�day�in�ten�years.�Portfolio�G�fails�to�meet�reliability�from�2021�while�Portfolio�F�is�able�to�maintain�reliability�until�2024.��
In�addition�to�being�unable�to�maintain�adequate�loss�of�load�hours,�100%�Clean�also�has�insufficient�transmission�to�be�viable,�as�seen�in�Figure�20�below.�In�this�simulation�the�Pacific�DC�intertie�experiences�a�forced�outage�in�2028�in�addition�to�2036�as�an�added�stress�test�on�the�system.�When�the�Pacific�DC�Intertie�line�is�out,�the�required�Southwest�AC�utilization�reaches�98%�in�2028�and�is�insufficient�to�meet�energy�needs�in�2036,�demonstrating�that�this�portfolio�does�not�have�sufficient�transmission�to�be�reliable.���
Portfolio�F�– 100�MW�Batt�+�3xICE
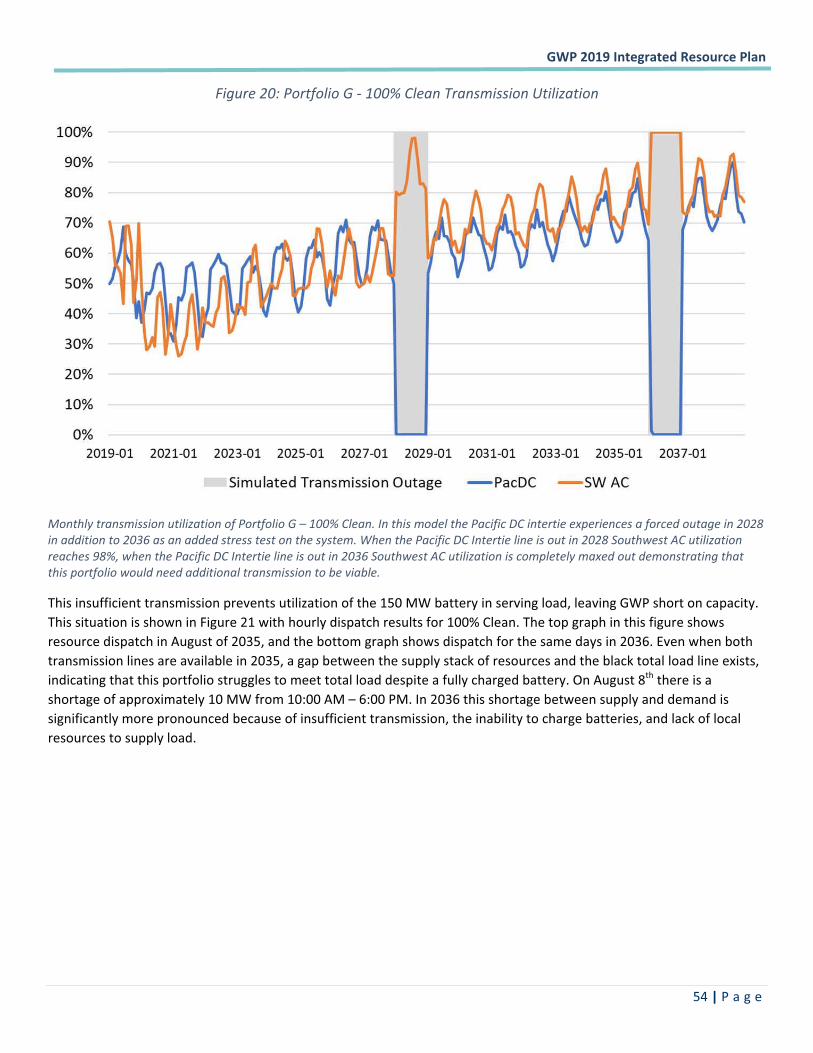
�GWP�2019�Integrated�Resource�Plan��
� �54�|�P a g e �
Figure�20:�Portfolio�G���100%�Clean�Transmission�Utilization�
�
Monthly�transmission�utilization�of�Portfolio�G�–�100%�Clean.�In�this�model�the�Pacific�DC�intertie�experiences�a�forced�outage�in�2028�in�addition�to�2036�as�an�added�stress�test�on�the�system.�When�the�Pacific�DC�Intertie�line�is�out�in�2028�Southwest�AC�utilization�reaches�98%,�when�the�Pacific�DC�Intertie�line�is�out�in�2036�Southwest�AC�utilization�is�completely�maxed�out�demonstrating�that�this�portfolio�would�need�additional�transmission�to�be�viable.��
This�insufficient�transmission�prevents�utilization�of�the�150�MW�battery�in�serving�load,�leaving�GWP�short�on�capacity.�This�situation�is�shown�in�Figure�21�with�hourly�dispatch�results�for�100%�Clean.�The�top�graph�in�this�figure�shows�resource�dispatch�in�August�of�2035,�and�the�bottom�graph�shows�dispatch�for�the�same�days�in�2036.�Even�when�both�transmission�lines�are�available�in�2035,�a�gap�between�the�supply�stack�of�resources�and�the�black�total�load�line�exists,�indicating�that�this�portfolio�struggles�to�meet�total�load�despite�a�fully�charged�battery.�On�August�8th�there�is�a�shortage�of�approximately�10�MW�from�10:00�AM�–�6:00�PM.�In�2036�this�shortage�between�supply�and�demand�is�significantly�more�pronounced�because�of�insufficient�transmission,�the�inability�to�charge�batteries,�and�lack�of�local�resources�to�supply�load.��
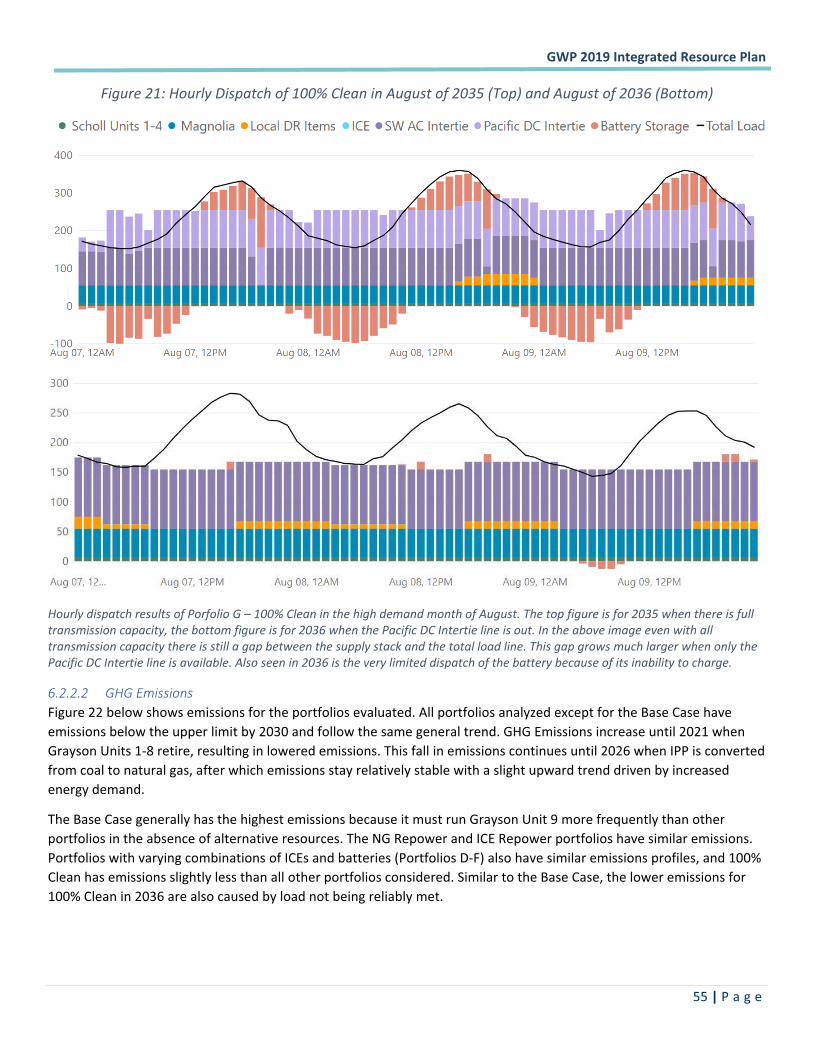
�GWP�2019�Integrated�Resource�Plan��
� �55�|�P a g e �
Figure�21:�Hourly�Dispatch�of�100%�Clean�in�August�of�2035�(Top)�and�August�of�2036�(Bottom)�
�
�
�
Hourly�dispatch�results�of�Porfolio�G�–�100%�Clean�in�the�high�demand�month�of�August.�The�top�figure�is�for�2035�when�there�is�full�transmission�capacity,�the�bottom�figure�is�for�2036�when�the�Pacific�DC�Intertie�line�is�out.�In�the�above�image�even�with�all�transmission�capacity�there�is�still�a�gap�between�the�supply�stack�and�the�total�load�line.�This�gap�grows�much�larger�when�only�the�Pacific�DC�Intertie�line�is�available.�Also�seen�in�2036�is�the�very�limited�dispatch�of�the�battery�because�of�its�inability�to�charge.��
������� �������������Figure�22�below�shows�emissions�for�the�portfolios�evaluated.�All�portfolios�analyzed�except�for�the�Base�Case�have�emissions�below�the�upper�limit�by�2030�and�follow�the�same�general�trend.�GHG�Emissions�increase�until�2021�when�Grayson�Units�1�8�retire,�resulting�in�lowered�emissions.�This�fall�in�emissions�continues�until�2026�when�IPP�is�converted�from�coal�to�natural�gas,�after�which�emissions�stay�relatively�stable�with�a�slight�upward�trend�driven�by�increased�energy�demand.��
The�Base�Case�generally�has�the�highest�emissions�because�it�must�run�Grayson�Unit�9�more�frequently�than�other�portfolios�in�the�absence�of�alternative�resources.�The�NG�Repower�and�ICE�Repower�portfolios�have�similar�emissions.�Portfolios�with�varying�combinations�of�ICEs�and�batteries�(Portfolios�D�F)�also�have�similar�emissions�profiles,�and�100%�Clean�has�emissions�slightly�less�than�all�other�portfolios�considered.�Similar�to�the�Base�Case,�the�lower�emissions�for�100%�Clean�in�2036�are�also�caused�by�load�not�being�reliably�met.�
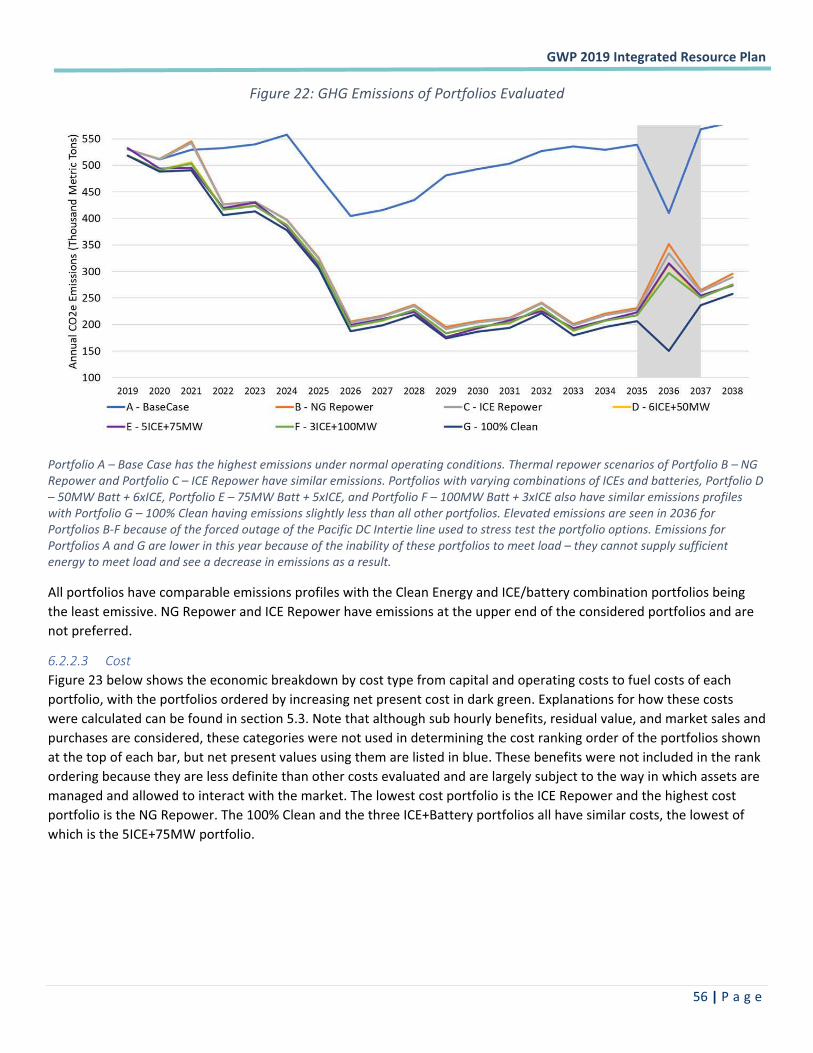
�GWP�2019�Integrated�Resource�Plan��
� �56�|�P a g e �
Figure�22:�GHG�Emissions�of�Portfolios�Evaluated�
�
Portfolio�A�–�Base�Case�has�the�highest�emissions�under�normal�operating�conditions.�Thermal�repower�scenarios�of�Portfolio�B�–�NG�Repower�and�Portfolio�C�–�ICE�Repower�have�similar�emissions.�Portfolios�with�varying�combinations�of�ICEs�and�batteries,�Portfolio�D�–�50MW�Batt�+�6xICE,�Portfolio�E�–�75MW�Batt�+�5xICE,�and�Portfolio�F�–�100MW�Batt�+�3xICE�also�have�similar�emissions�profiles�with�Portfolio�G�–�100%�Clean�having�emissions�slightly�less�than�all�other�portfolios.�Elevated�emissions�are�seen�in�2036�for�Portfolios�B�F�because�of�the�forced�outage�of�the�Pacific�DC�Intertie�line�used�to�stress�test�the�portfolio�options.�Emissions�for�Portfolios�A�and�G�are�lower�in�this�year�because�of�the�inability�of�these�portfolios�to�meet�load�–�they�cannot�supply�sufficient�energy�to�meet�load�and�see�a�decrease�in�emissions�as�a�result.��
All�portfolios�have�comparable�emissions�profiles�with�the�Clean�Energy�and�ICE/battery�combination�portfolios�being�the�least�emissive.�NG�Repower�and�ICE�Repower�have�emissions�at�the�upper�end�of�the�considered�portfolios�and�are�not�preferred.�
������� �����Figure�23�below�shows�the�economic�breakdown�by�cost�type�from�capital�and�operating�costs�to�fuel�costs�of�each�portfolio,�with�the�portfolios�ordered�by�increasing�net�present�cost�in�dark�green.�Explanations�for�how�these�costs�were�calculated�can�be�found�in�section�5.3.�Note�that�although�sub�hourly�benefits,�residual�value,�and�market�sales�and�purchases�are�considered,�these�categories�were�not�used�in�determining�the�cost�ranking�order�of�the�portfolios�shown�at�the�top�of�each�bar,�but�net�present�values�using�them�are�listed�in�blue.�These�benefits�were�not�included�in�the�rank�ordering�because�they�are�less�definite�than�other�costs�evaluated�and�are�largely�subject�to�the�way�in�which�assets�are�managed�and�allowed�to�interact�with�the�market.�The�lowest�cost�portfolio�is�the�ICE�Repower�and�the�highest�cost�portfolio�is�the�NG�Repower.�The�100%�Clean�and�the�three�ICE+Battery�portfolios�all�have�similar�costs,�the�lowest�of�which�is�the�5ICE+75MW�portfolio.�
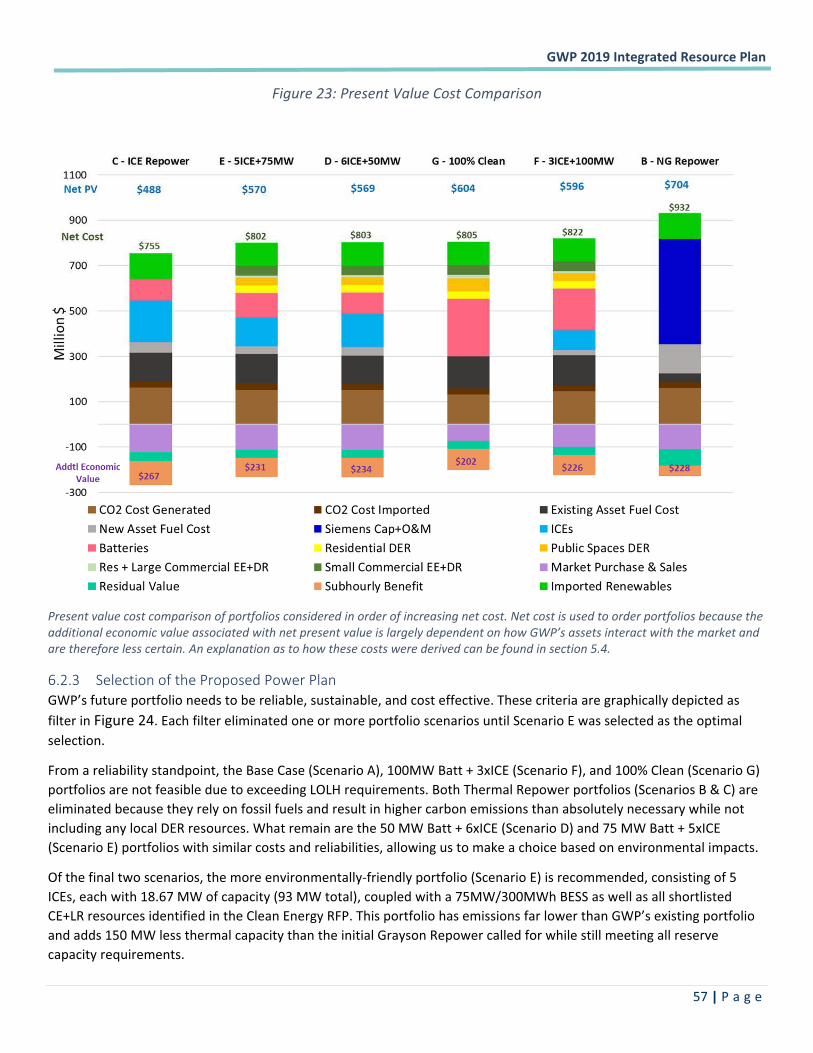
�GWP�2019�Integrated�Resource�Plan��
� �57�|�P a g e �
Figure�23:�Present�Value�Cost�Comparison�
�
Present�value�cost�comparison�of�portfolios�considered�in�order�of�increasing�net�cost.�Net�cost�is�used�to�order�portfolios�because�the�additional�economic�value�associated�with�net�present�value�is�largely�dependent�on�how�GWP’s�assets�interact�with�the�market�and�are�therefore�less�certain.�An�explanation�as�to�how�these�costs�were�derived�can�be�found�in�section�5.4.����
6.2.3 Selection�of�the�Proposed�Power�Plan��GWP’s�future�portfolio�needs�to�be�reliable,�sustainable,�and�cost�effective.�These�criteria�are�graphically�depicted�as�filter�in�Figure�24.�Each�filter�eliminated�one�or�more�portfolio�scenarios�until�Scenario�E�was�selected�as�the�optimal�selection.�
From�a�reliability�standpoint,�the�Base�Case�(Scenario�A),�100MW�Batt�+�3xICE�(Scenario�F),�and�100%�Clean�(Scenario�G)�portfolios�are�not�feasible�due�to�exceeding�LOLH�requirements.�Both�Thermal�Repower�portfolios�(Scenarios�B�&�C)�are�eliminated�because�they�rely�on�fossil�fuels�and�result�in�higher�carbon�emissions�than�absolutely�necessary�while�not�including�any�local�DER�resources.�What�remain�are�the�50�MW�Batt�+�6xICE�(Scenario�D)�and�75�MW�Batt�+�5xICE�(Scenario�E)�portfolios�with�similar�costs�and�reliabilities,�allowing�us�to�make�a�choice�based�on�environmental�impacts.��
Of�the�final�two�scenarios,�the�more�environmentally�friendly�portfolio�(Scenario�E)�is�recommended,�consisting�of�5�ICEs,�each�with�18.67�MW�of�capacity�(93�MW�total),�coupled�with�a�75MW/300MWh�BESS�as�well�as�all�shortlisted�CE+LR�resources�identified�in�the�Clean�Energy�RFP.�This�portfolio�has�emissions�far�lower�than�GWP’s�existing�portfolio�and�adds�150�MW�less�thermal�capacity�than�the�initial�Grayson�Repower�called�for�while�still�meeting�all�reserve�capacity�requirements.�
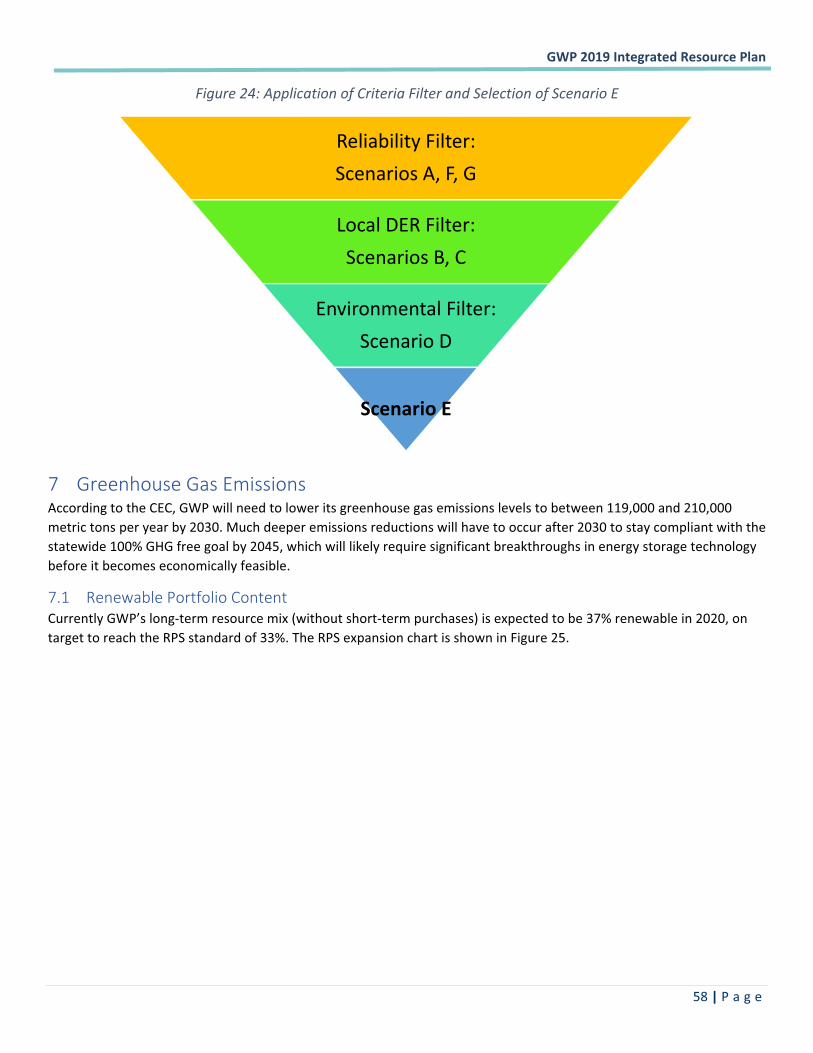
�GWP�2019�Integrated�Resource�Plan��
� �58�|�P a g e �
Figure�24:�Application�of�Criteria�Filter�and�Selection�of�Scenario�E�
�
7 Greenhouse�Gas�Emissions��According�to�the�CEC,�GWP�will�need�to�lower�its�greenhouse�gas�emissions�levels�to�between�119,000�and�210,000�metric�tons�per�year�by�2030.�Much�deeper�emissions�reductions�will�have�to�occur�after�2030�to�stay�compliant�with�the�statewide�100%�GHG�free�goal�by�2045,�which�will�likely�require�significant�breakthroughs�in�energy�storage�technology�before�it�becomes�economically�feasible.�
7.1 Renewable�Portfolio�Content��Currently�GWP’s�long�term�resource�mix�(without�short�term�purchases)�is�expected�to�be�37%�renewable�in�2020,�on�target�to�reach�the�RPS�standard�of�33%.�The�RPS�expansion�chart�is�shown�in�Figure�25.�
Reliability�Filter:Scenarios�A,�F,�G
Local�DER�Filter:Scenarios�B,�C
Environmental�Filter:Scenario�D
Scenario�E
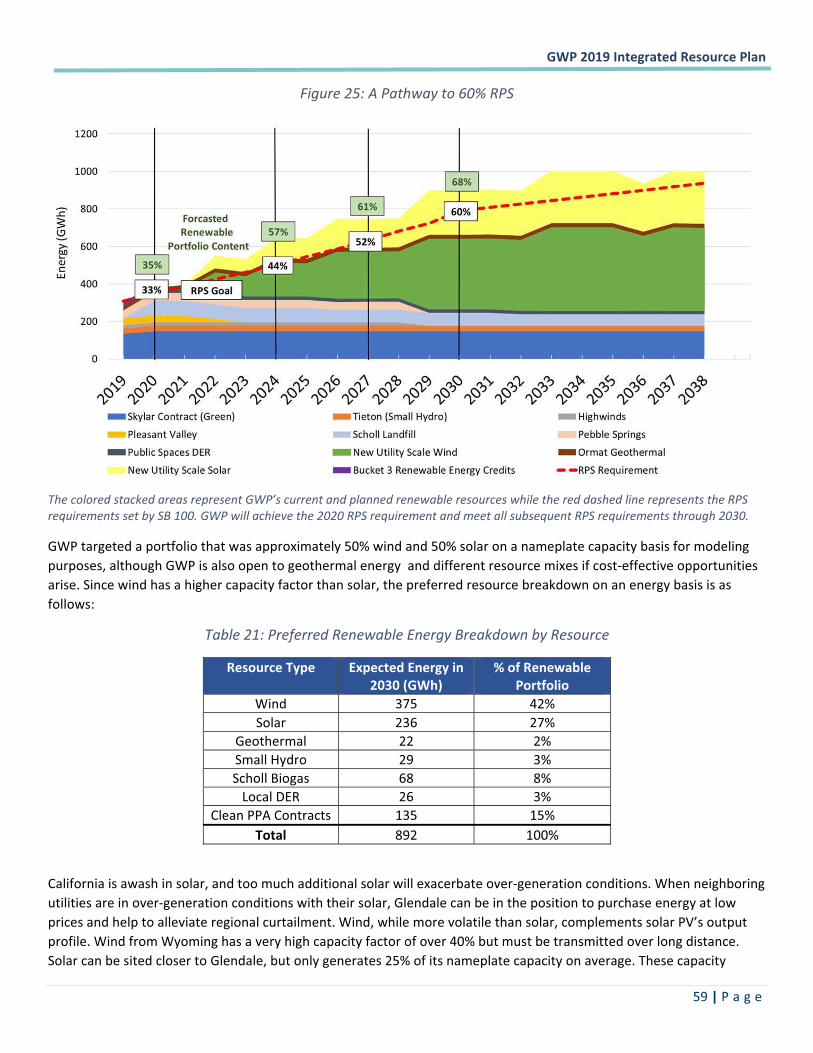
�GWP�2019�Integrated�Resource�Plan��
� �59�|�P a g e �
Figure�25:�A�Pathway�to�60%�RPS�
�
The�colored�stacked�areas�represent�GWP’s�current�and�planned�renewable�resources�while�the�red�dashed�line�represents�the�RPS�requirements�set�by�SB�100.�GWP�will�achieve�the�2020�RPS�requirement�and�meet�all�subsequent�RPS�requirements�through�2030.��
GWP�targeted�a�portfolio�that�was�approximately�50%�wind�and�50%�solar�on�a�nameplate�capacity�basis�for�modeling�purposes,�although�GWP�is�also�open�to�geothermal�energy��and�different�resource�mixes�if�cost�effective�opportunities�arise.�Since�wind�has�a�higher�capacity�factor�than�solar,�the�preferred�resource�breakdown�on�an�energy�basis�is�as�follows:�
Table�21:�Preferred�Renewable�Energy�Breakdown�by�Resource�
Resource�Type� Expected�Energy�in�2030�(GWh)�
%�of�Renewable�Portfolio�
Wind� 375� 42%�Solar� 236� 27%�
Geothermal�� 22� 2%�Small�Hydro�� 29� 3%�Scholl�Biogas� 68� 8%�
Local�DER� 26� 3%�Clean�PPA�Contracts 135� 15%�
Total� 892� 100%��
California�is�awash�in�solar,�and�too�much�additional�solar�will�exacerbate�over�generation�conditions.�When�neighboring�utilities�are�in�over�generation�conditions�with�their�solar,�Glendale�can�be�in�the�position�to�purchase�energy�at�low�prices�and�help�to�alleviate�regional�curtailment.�Wind,�while�more�volatile�than�solar,�complements�solar�PV’s�output�profile.�Wind�from�Wyoming�has�a�very�high�capacity�factor�of�over�40%�but�must�be�transmitted�over�long�distance.��Solar�can�be�sited�closer�to�Glendale,�but�only�generates�25%�of�its�nameplate�capacity�on�average.�These�capacity�
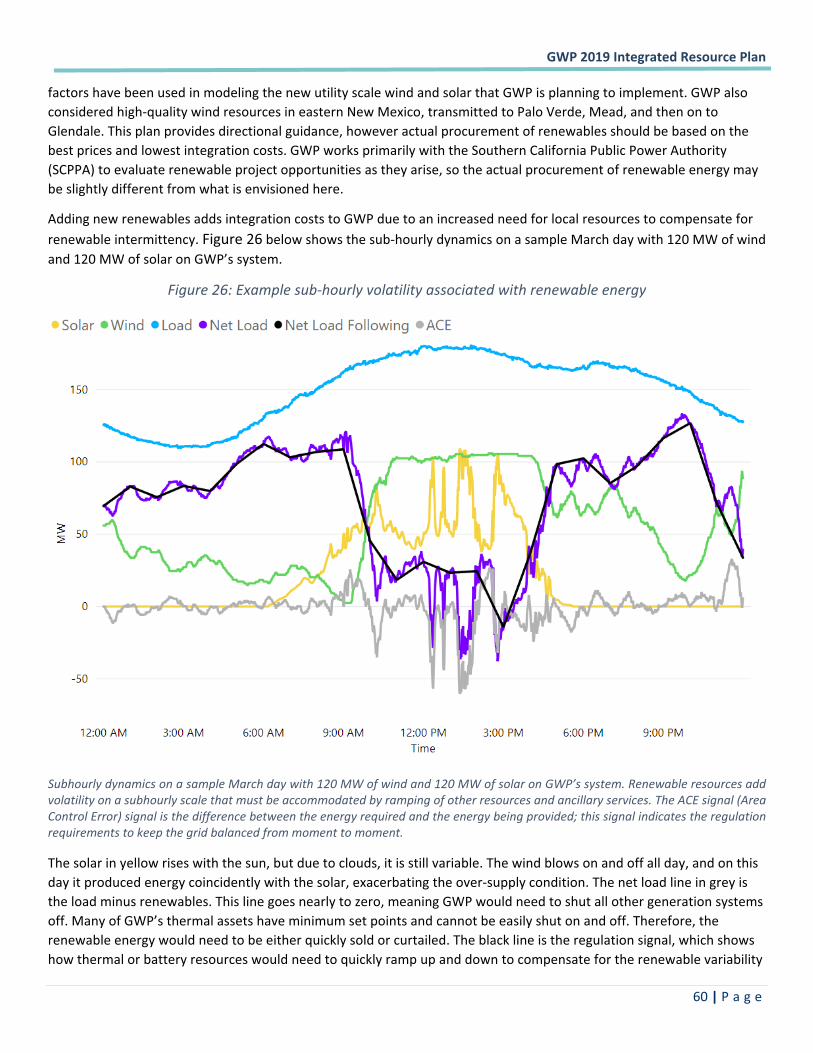
�GWP�2019�Integrated�Resource�Plan��
� �60�|�P a g e �
factors�have�been�used�in�modeling�the�new�utility�scale�wind�and�solar�that�GWP�is�planning�to�implement.�GWP�also�considered�high�quality�wind�resources�in�eastern�New�Mexico,�transmitted�to�Palo�Verde,�Mead,�and�then�on�to�Glendale.�This�plan�provides�directional�guidance,�however�actual�procurement�of�renewables�should�be�based�on�the�best�prices�and�lowest�integration�costs.�GWP�works�primarily�with�the�Southern�California�Public�Power�Authority�(SCPPA)�to�evaluate�renewable�project�opportunities�as�they�arise,�so�the�actual�procurement�of�renewable�energy�may�be�slightly�different�from�what�is�envisioned�here.���
Adding�new�renewables�adds�integration�costs�to�GWP�due�to�an�increased�need�for�local�resources�to�compensate�for�renewable�intermittency.�Figure�26�below�shows�the�sub�hourly�dynamics�on�a�sample�March�day�with�120�MW�of�wind�and�120�MW�of�solar�on�GWP’s�system.��
Figure�26:�Example�sub�hourly�volatility�associated�with�renewable�energy�
�
Subhourly�dynamics�on�a�sample�March�day�with�120�MW�of�wind�and�120�MW�of�solar�on�GWP’s�system.�Renewable�resources�add�volatility�on�a�subhourly�scale�that�must�be�accommodated�by�ramping�of�other�resources�and�ancillary�services.�The�ACE�signal�(Area�Control�Error)�signal�is�the�difference�between�the�energy�required�and�the�energy�being�provided;�this�signal�indicates�the�regulation�requirements�to�keep�the�grid�balanced�from�moment�to�moment.�
The�solar�in�yellow�rises�with�the�sun,�but�due�to�clouds,�it�is�still�variable.�The�wind�blows�on�and�off�all�day,�and�on�this�day�it�produced�energy�coincidently�with�the�solar,�exacerbating�the�over�supply�condition.�The�net�load�line�in�grey�is�the�load�minus�renewables.�This�line�goes�nearly�to�zero,�meaning�GWP�would�need�to�shut�all�other�generation�systems�off.�Many�of�GWP’s�thermal�assets�have�minimum�set�points�and�cannot�be�easily�shut�on�and�off.�Therefore,�the�renewable�energy�would�need�to�be�either�quickly�sold�or�curtailed.�The�black�line�is�the�regulation�signal,�which�shows�how�thermal�or�battery�resources�would�need�to�quickly�ramp�up�and�down�to�compensate�for�the�renewable�variability�
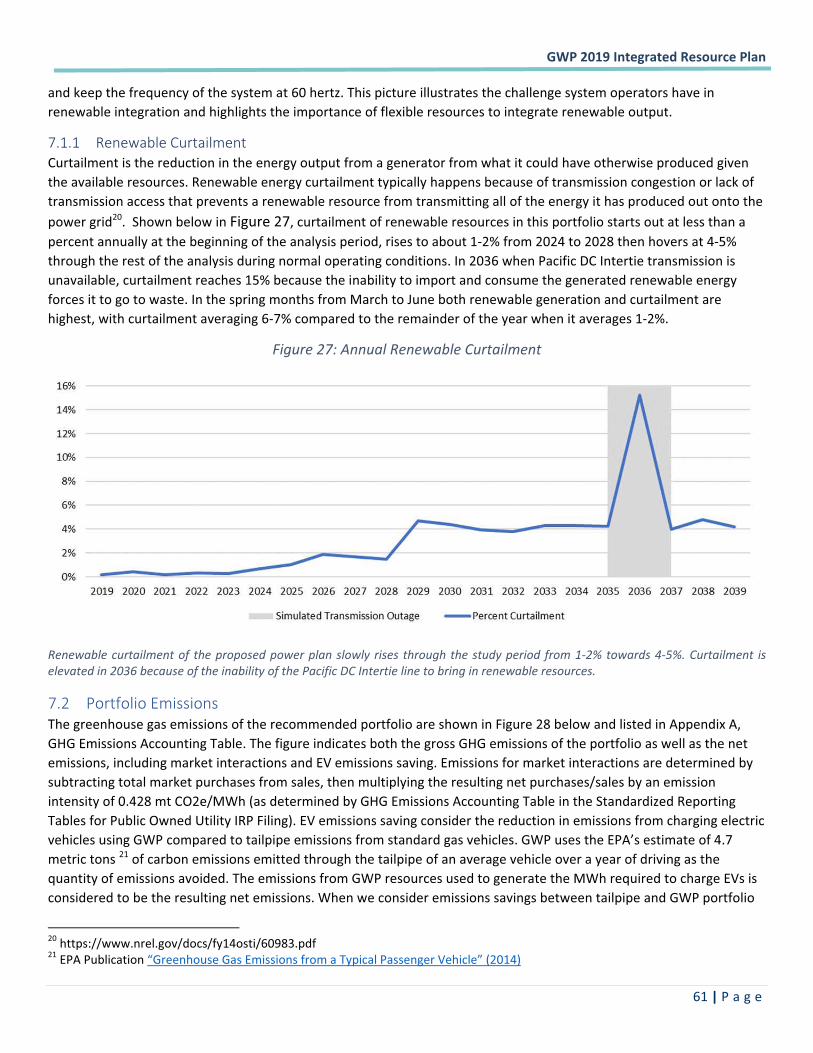
�GWP�2019�Integrated�Resource�Plan��
� �61�|�P a g e �
and�keep�the�frequency�of�the�system�at�60�hertz.�This�picture�illustrates�the�challenge�system�operators�have�in�renewable�integration�and�highlights�the�importance�of�flexible�resources�to�integrate�renewable�output.��
7.1.1 Renewable�Curtailment��Curtailment�is�the�reduction�in�the�energy�output�from�a�generator�from�what�it�could�have�otherwise�produced�given�the�available�resources.�Renewable�energy�curtailment�typically�happens�because�of�transmission�congestion�or�lack�of�transmission�access�that�prevents�a�renewable�resource�from�transmitting�all�of�the�energy�it�has�produced�out�onto�the�power�grid20.��Shown�below�in�Figure�27,�curtailment�of�renewable�resources�in�this�portfolio�starts�out�at�less�than�a�percent�annually�at�the�beginning�of�the�analysis�period,�rises�to�about�1�2%�from�2024�to�2028�then�hovers�at�4�5%�through�the�rest�of�the�analysis�during�normal�operating�conditions.�In�2036�when�Pacific�DC�Intertie�transmission�is�unavailable,�curtailment�reaches�15%�because�the�inability�to�import�and�consume�the�generated�renewable�energy�forces�it�to�go�to�waste.�In�the�spring�months�from�March�to�June�both�renewable�generation�and�curtailment�are�highest,�with�curtailment�averaging�6�7%�compared�to�the�remainder�of�the�year�when�it�averages�1�2%.��
Figure�27:�Annual�Renewable�Curtailment�
�
Renewable�curtailment�of� the�proposed�power�plan�slowly�rises� through�the�study�period� from�1�2%�towards�4�5%.�Curtailment� is�elevated�in�2036�because�of�the�inability�of�the�Pacific�DC�Intertie�line�to�bring�in�renewable�resources.���
7.2 Portfolio�Emissions��The�greenhouse�gas�emissions�of�the�recommended�portfolio�are�shown�in�Figure�28�below�and�listed�in�Appendix�A,�GHG�Emissions�Accounting�Table.�The�figure�indicates�both�the�gross�GHG�emissions�of�the�portfolio�as�well�as�the�net�emissions,�including�market�interactions�and�EV�emissions�saving.�Emissions�for�market�interactions�are�determined�by�subtracting�total�market�purchases�from�sales,�then�multiplying�the�resulting�net�purchases/sales�by�an�emission�intensity�of�0.428�mt�CO2e/MWh�(as�determined�by�GHG�Emissions�Accounting�Table�in�the�Standardized�Reporting�Tables�for�Public�Owned�Utility�IRP�Filing).�EV�emissions�saving�consider�the�reduction�in�emissions�from�charging�electric�vehicles�using�GWP�compared�to�tailpipe�emissions�from�standard�gas�vehicles.�GWP�uses�the�EPA’s�estimate�of�4.7�metric�tons�21�of�carbon�emissions�emitted�through�the�tailpipe�of�an�average�vehicle�over�a�year�of�driving�as�the�quantity�of�emissions�avoided.�The�emissions�from�GWP�resources�used�to�generate�the�MWh�required�to�charge�EVs�is�considered�to�be�the�resulting�net�emissions.�When�we�consider�emissions�savings�between�tailpipe�and�GWP�portfolio�
������������������������������������������������������������20�https://www.nrel.gov/docs/fy14osti/60983.pdf�21�EPA�Publication�“Greenhouse�Gas�Emissions�from�a�Typical�Passenger�Vehicle”�(2014)�
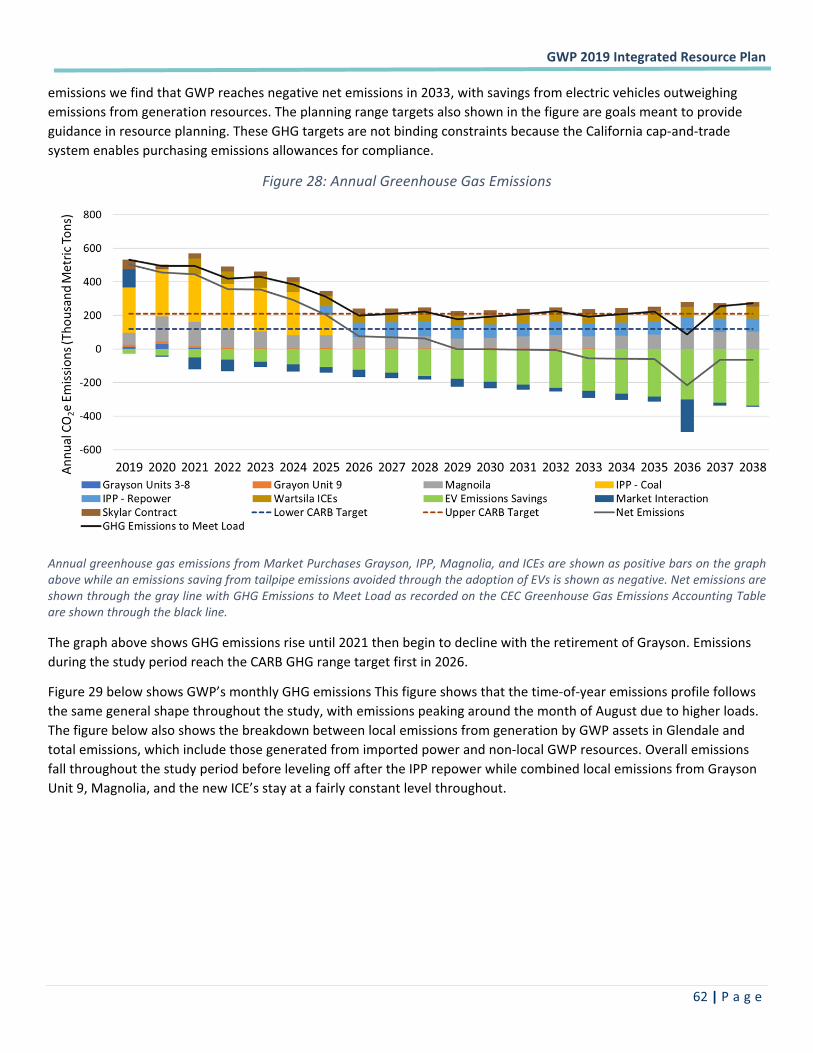
�GWP�2019�Integrated�Resource�Plan��
� �62�|�P a g e �
emissions�we�find�that�GWP�reaches�negative�net�emissions�in�2033,�with�savings�from�electric�vehicles�outweighing�emissions�from�generation�resources.�The�planning�range�targets�also�shown�in�the�figure�are�goals�meant�to�provide�guidance�in�resource�planning.�These�GHG�targets�are�not�binding�constraints�because�the�California�cap�and�trade�system�enables�purchasing�emissions�allowances�for�compliance.��
Figure�28:�Annual�Greenhouse�Gas�Emissions�
�
Annual�greenhouse�gas�emissions�from�Market�Purchases�Grayson,�IPP,�Magnolia,�and�ICEs�are�shown�as�positive�bars�on�the�graph�above�while�an�emissions�saving�from�tailpipe�emissions�avoided�through�the�adoption�of�EVs�is�shown�as�negative.�Net�emissions�are�shown�through�the�gray�line�with�GHG�Emissions�to�Meet�Load�as�recorded�on�the�CEC�Greenhouse�Gas�Emissions�Accounting�Table�are�shown�through�the�black�line.��
The�graph�above�shows�GHG�emissions�rise�until�2021�then�begin�to�decline�with�the�retirement�of�Grayson.�Emissions�during�the�study�period�reach�the�CARB�GHG�range�target�first�in�2026.��
Figure�29�below�shows�GWP’s�monthly�GHG�emissions�This�figure�shows�that�the�time�of�year�emissions�profile�follows�the�same�general�shape�throughout�the�study,�with�emissions�peaking�around�the�month�of�August�due�to�higher�loads.�The�figure�below�also�shows�the�breakdown�between�local�emissions�from�generation�by�GWP�assets�in�Glendale�and�total�emissions,�which�include�those�generated�from�imported�power�and�non�local�GWP�resources.�Overall�emissions�fall�throughout�the�study�period�before�leveling�off�after�the�IPP�repower�while�combined�local�emissions�from�Grayson�Unit�9,�Magnolia,�and�the�new�ICE’s�stay�at�a�fairly�constant�level�throughout.������
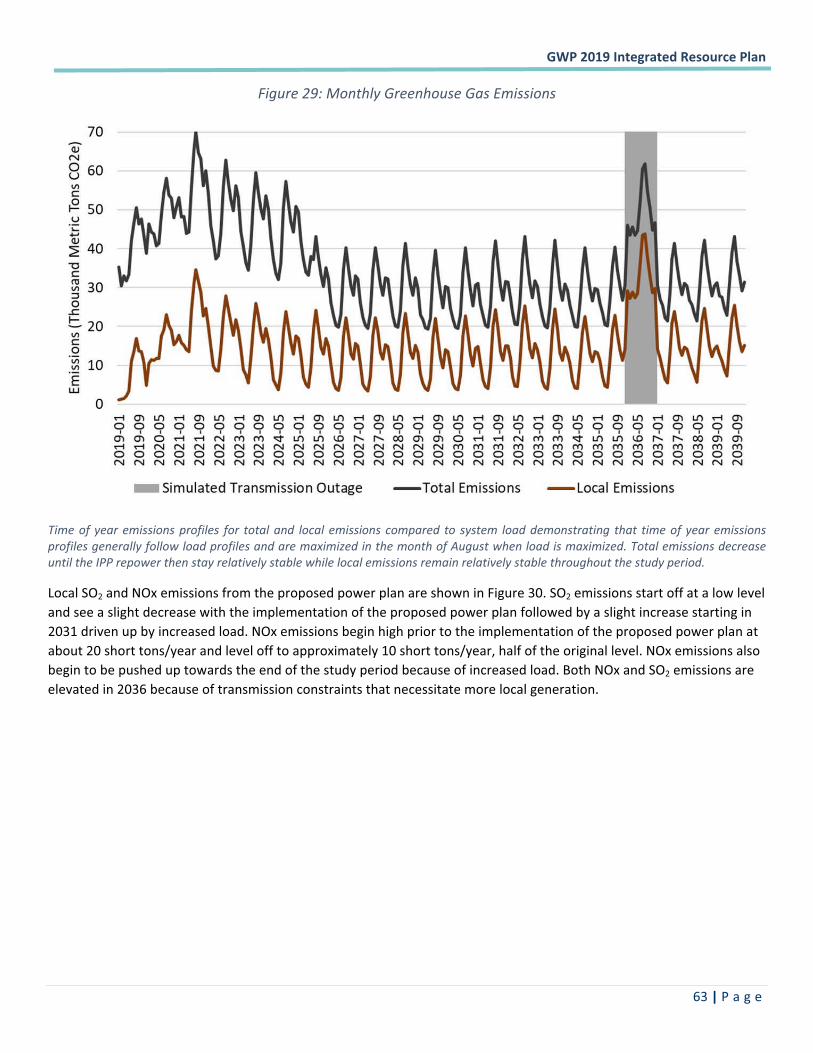
�GWP�2019�Integrated�Resource�Plan��
� �63�|�P a g e �
Figure�29:�Monthly�Greenhouse�Gas�Emissions�
�
Time�of�year�emissions�profiles� for� total�and� local� emissions� compared� to� system� load�demonstrating� that� time�of�year�emissions�profiles�generally�follow�load�profiles�and�are�maximized�in�the�month�of�August�when�load�is�maximized.�Total�emissions�decrease�until�the�IPP�repower�then�stay�relatively�stable�while�local�emissions�remain�relatively�stable�throughout�the�study�period.��
Local�SO2�and�NOx�emissions�from�the�proposed�power�plan�are�shown�in�Figure�30.�SO2�emissions�start�off�at�a�low�level�and�see�a�slight�decrease�with�the�implementation�of�the�proposed�power�plan�followed�by�a�slight�increase�starting�in�2031�driven�up�by�increased�load.�NOx�emissions�begin�high�prior�to�the�implementation�of�the�proposed�power�plan�at�about�20�short�tons/year�and�level�off�to�approximately�10�short�tons/year,�half�of�the�original�level.�NOx�emissions�also�begin�to�be�pushed�up�towards�the�end�of�the�study�period�because�of�increased�load.�Both�NOx�and�SO2�emissions�are�elevated�in�2036�because�of�transmission�constraints�that�necessitate�more�local�generation.���
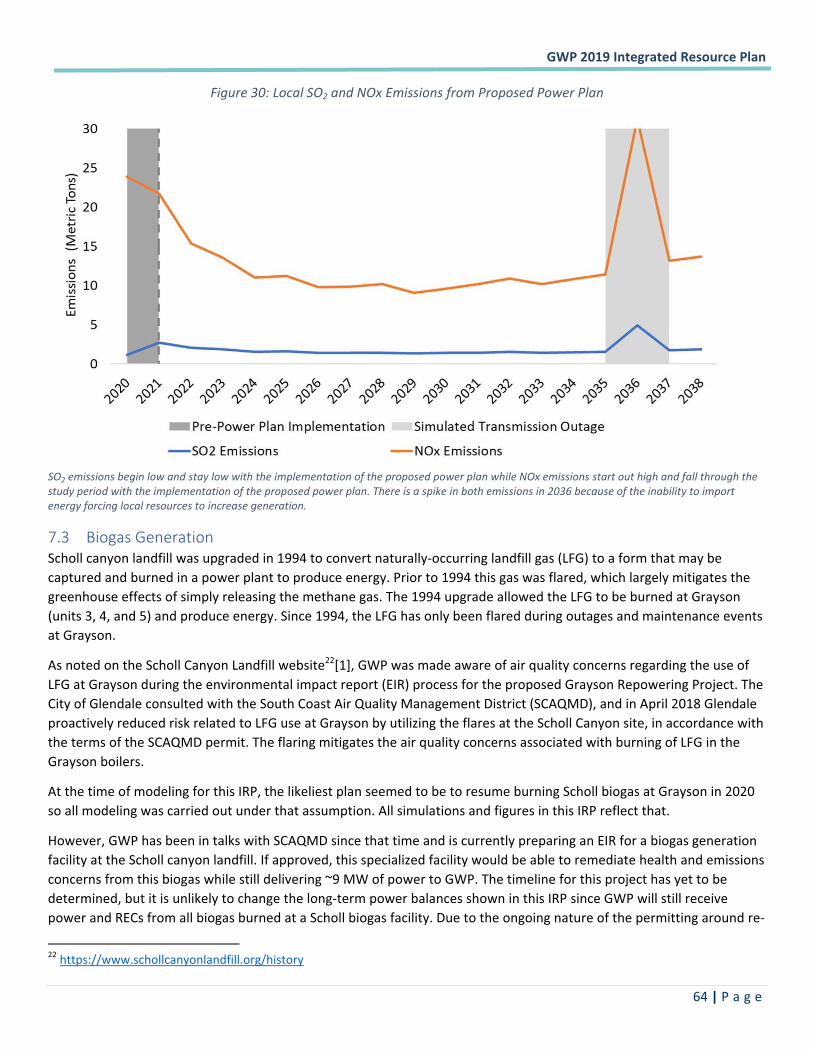
�GWP�2019�Integrated�Resource�Plan��
� �64�|�P a g e �
Figure�30:�Local�SO2�and�NOx�Emissions�from�Proposed�Power�Plan�
�SO2�emissions�begin�low�and�stay�low�with�the�implementation�of�the�proposed�power�plan�while�NOx�emissions�start�out�high�and�fall�through�the�study�period�with�the�implementation�of�the�proposed�power�plan.�There�is�a�spike�in�both�emissions�in�2036�because�of�the�inability�to�import�energy�forcing�local�resources�to�increase�generation.���
7.3 Biogas�Generation�Scholl�canyon�landfill�was�upgraded�in�1994�to�convert�naturally�occurring�landfill�gas�(LFG)�to�a�form�that�may�be�captured�and�burned�in�a�power�plant�to�produce�energy.�Prior�to�1994�this�gas�was�flared,�which�largely�mitigates�the�greenhouse�effects�of�simply�releasing�the�methane�gas.�The�1994�upgrade�allowed�the�LFG�to�be�burned�at�Grayson�(units�3,�4,�and�5)�and�produce�energy.�Since�1994,�the�LFG�has�only�been�flared�during�outages�and�maintenance�events�at�Grayson.�
As�noted�on�the�Scholl�Canyon�Landfill�website22[1],�GWP�was�made�aware�of�air�quality�concerns�regarding�the�use�of�LFG�at�Grayson�during�the�environmental�impact�report�(EIR)�process�for�the�proposed�Grayson�Repowering�Project.�The�City�of�Glendale�consulted�with�the�South�Coast�Air�Quality�Management�District�(SCAQMD),�and�in�April�2018�Glendale�proactively�reduced�risk�related�to�LFG�use�at�Grayson�by�utilizing�the�flares�at�the�Scholl�Canyon�site,�in�accordance�with�the�terms�of�the�SCAQMD�permit.�The�flaring�mitigates�the�air�quality�concerns�associated�with�burning�of�LFG�in�the�Grayson�boilers.�
At�the�time�of�modeling�for�this�IRP,�the�likeliest�plan�seemed�to�be�to�resume�burning�Scholl�biogas�at�Grayson�in�2020�so�all�modeling�was�carried�out�under�that�assumption.�All�simulations�and�figures�in�this�IRP�reflect�that.�
However,�GWP�has�been�in�talks�with�SCAQMD�since�that�time�and�is�currently�preparing�an�EIR�for�a�biogas�generation�facility�at�the�Scholl�canyon�landfill.�If�approved,�this�specialized�facility�would�be�able�to�remediate�health�and�emissions�concerns�from�this�biogas�while�still�delivering�~9�MW�of�power�to�GWP.�The�timeline�for�this�project�has�yet�to�be�determined,�but�it�is�unlikely�to�change�the�long�term�power�balances�shown�in�this�IRP�since�GWP�will�still�receive�power�and�RECs�from�all�biogas�burned�at�a�Scholl�biogas�facility.�Due�to�the�ongoing�nature�of�the�permitting�around�re�
������������������������������������������������������������22�https://www.schollcanyonlandfill.org/history�
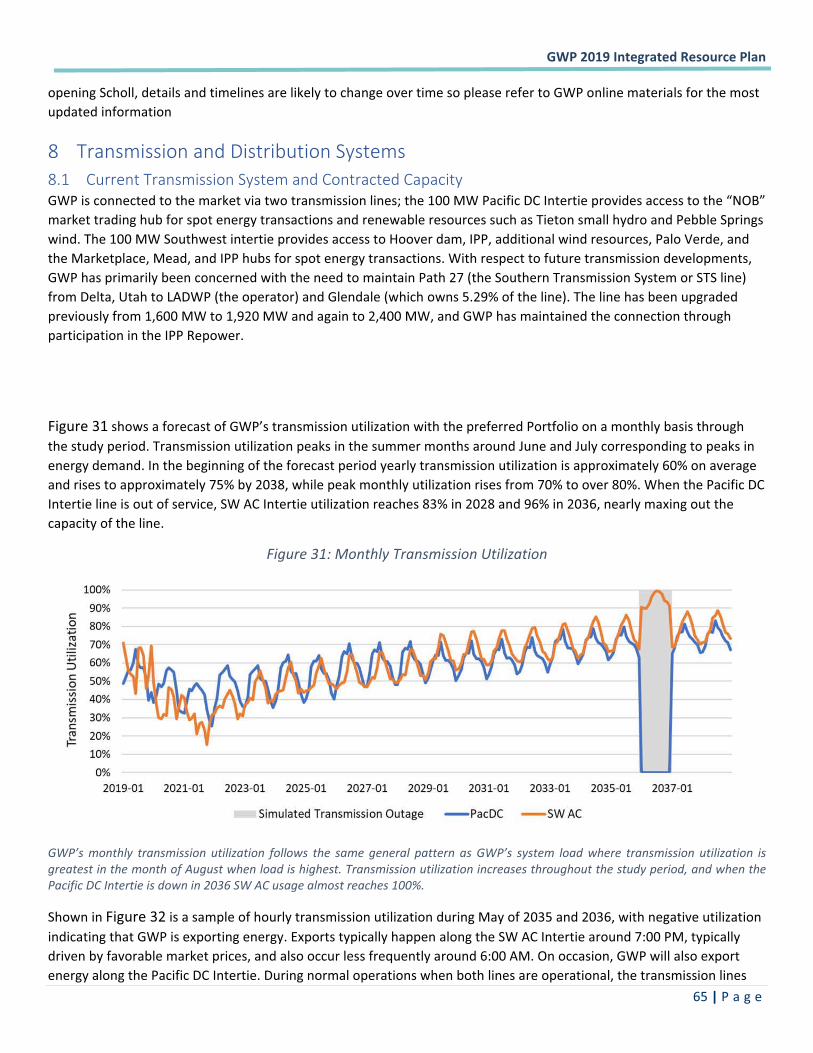
�GWP�2019�Integrated�Resource�Plan��
� �65�|�P a g e �
opening�Scholl,�details�and�timelines�are�likely�to�change�over�time�so�please�refer�to�GWP�online�materials�for�the�most�updated�information�
8 Transmission�and�Distribution�Systems��8.1 Current�Transmission�System�and�Contracted�Capacity��GWP�is�connected�to�the�market�via�two�transmission�lines;�the�100�MW�Pacific�DC�Intertie�provides�access�to�the�“NOB”�market�trading�hub�for�spot�energy�transactions�and�renewable�resources�such�as�Tieton�small�hydro�and�Pebble�Springs�wind.�The�100�MW�Southwest�intertie�provides�access�to�Hoover�dam,�IPP,�additional�wind�resources,�Palo�Verde,�and�the�Marketplace,�Mead,�and�IPP�hubs�for�spot�energy�transactions.�With�respect�to�future�transmission�developments,�GWP�has�primarily�been�concerned�with�the�need�to�maintain�Path�27�(the�Southern�Transmission�System�or�STS�line)�from�Delta,�Utah�to�LADWP�(the�operator)�and�Glendale�(which�owns�5.29%�of�the�line).�The�line�has�been�upgraded�previously�from�1,600�MW�to�1,920�MW�and�again�to�2,400�MW,�and�GWP�has�maintained�the�connection�through�participation�in�the�IPP�Repower.��
�
�
Figure�31�shows�a�forecast�of�GWP’s�transmission�utilization�with�the�preferred�Portfolio�on�a�monthly�basis�through�the�study�period.�Transmission�utilization�peaks�in�the�summer�months�around�June�and�July�corresponding�to�peaks�in�energy�demand.�In�the�beginning�of�the�forecast�period�yearly�transmission�utilization�is�approximately�60%�on�average�and�rises�to�approximately�75%�by�2038,�while�peak�monthly�utilization�rises�from�70%�to�over�80%.�When�the�Pacific�DC�Intertie�line�is�out�of�service,�SW�AC�Intertie�utilization�reaches�83%�in�2028�and�96%�in�2036,�nearly�maxing�out�the�capacity�of�the�line.��
Figure�31:�Monthly�Transmission�Utilization�
�
GWP’s�monthly� transmission� utilization� follows� the� same�general� pattern� as�GWP’s� system� load�where� transmission� utilization� is�greatest�in�the�month�of�August�when�load�is�highest.�Transmission�utilization�increases�throughout�the�study�period,�and�when�the�Pacific�DC�Intertie�is�down�in�2036�SW�AC�usage�almost�reaches�100%.��
Shown�in�Figure�32�is�a�sample�of�hourly�transmission�utilization�during�May�of�2035�and�2036,�with�negative�utilization�indicating�that�GWP�is�exporting�energy.�Exports�typically�happen�along�the�SW�AC�Intertie�around�7:00�PM,�typically�driven�by�favorable�market�prices,�and�also�occur�less�frequently�around�6:00�AM.�On�occasion,�GWP�will�also�export�energy�along�the�Pacific�DC�Intertie.�During�normal�operations�when�both�lines�are�operational,�the�transmission�lines�
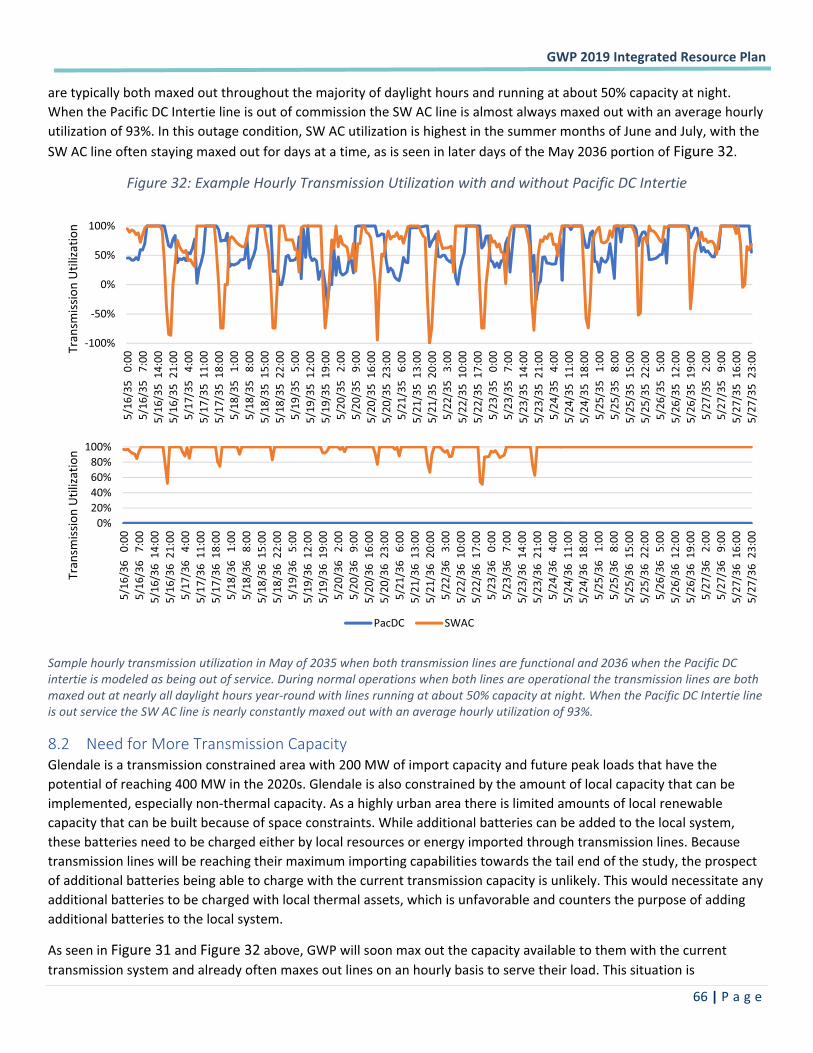
�GWP�2019�Integrated�Resource�Plan��
� �66�|�P a g e �
are�typically�both�maxed�out�throughout�the�majority�of�daylight�hours�and�running�at�about�50%�capacity�at�night.��When�the�Pacific�DC�Intertie�line�is�out�of�commission�the�SW�AC�line�is�almost�always�maxed�out�with�an�average�hourly�utilization�of�93%.�In�this�outage�condition,�SW�AC�utilization�is�highest�in�the�summer�months�of�June�and�July,�with�the�SW�AC�line�often�staying�maxed�out�for�days�at�a�time,�as�is�seen�in�later�days�of�the�May�2036�portion�of�Figure�32.��
Figure�32:�Example�Hourly�Transmission�Utilization�with�and�without�Pacific�DC�Intertie�
�
Sample�hourly�transmission�utilization�in�May�of�2035�when�both�transmission�lines�are�functional�and�2036�when�the�Pacific�DC�intertie�is�modeled�as�being�out�of�service.�During�normal�operations�when�both�lines�are�operational�the�transmission�lines�are�both�maxed�out�at�nearly�all�daylight�hours�year�round�with�lines�running�at�about�50%�capacity�at�night.�When�the�Pacific�DC�Intertie�line�is�out�service�the�SW�AC�line�is�nearly�constantly�maxed�out�with�an�average�hourly�utilization�of�93%.��
8.2 Need�for�More�Transmission�Capacity��Glendale�is�a�transmission�constrained�area�with�200�MW�of�import�capacity�and�future�peak�loads�that�have�the�potential�of�reaching�400�MW�in�the�2020s.�Glendale�is�also�constrained�by�the�amount�of�local�capacity�that�can�be�implemented,�especially�non�thermal�capacity.�As�a�highly�urban�area�there�is�limited�amounts�of�local�renewable�capacity�that�can�be�built�because�of�space�constraints.�While�additional�batteries�can�be�added�to�the�local�system,�these�batteries�need�to�be�charged�either�by�local�resources�or�energy�imported�through�transmission�lines.�Because�transmission�lines�will�be�reaching�their�maximum�importing�capabilities�towards�the�tail�end�of�the�study,�the�prospect�of�additional�batteries�being�able�to�charge�with�the�current�transmission�capacity�is�unlikely.�This�would�necessitate�any�additional�batteries�to�be�charged�with�local�thermal�assets,�which�is�unfavorable�and�counters�the�purpose�of�adding�additional�batteries�to�the�local�system.���
As�seen�in�Figure�31�and�Figure�32�above,�GWP�will�soon�max�out�the�capacity�available�to�them�with�the�current�transmission�system�and�already�often�maxes�out�lines�on�an�hourly�basis�to�serve�their�load.�This�situation�is�
�100%
�50%
0%
50%
100%
5/16
/35�
��0:0
05/
16/3
5���7
:00
5/16
/35�
�14:
005/
16/3
5��2
1:00
5/17
/35�
��4:0
05/
17/3
5��1
1:00
5/17
/35�
�18:
005/
18/3
5���1
:00
5/18
/35�
��8:0
05/
18/3
5��1
5:00
5/18
/35�
�22:
005/
19/3
5���5
:00
5/19
/35�
�12:
005/
19/3
5��1
9:00
5/20
/35�
��2:0
05/
20/3
5���9
:00
5/20
/35�
�16:
005/
20/3
5��2
3:00
5/21
/35�
��6:0
05/
21/3
5��1
3:00
5/21
/35�
�20:
005/
22/3
5���3
:00
5/22
/35�
�10:
005/
22/3
5��1
7:00
5/23
/35�
��0:0
05/
23/3
5���7
:00
5/23
/35�
�14:
005/
23/3
5��2
1:00
5/24
/35�
��4:0
05/
24/3
5��1
1:00
5/24
/35�
�18:
005/
25/3
5���1
:00
5/25
/35�
��8:0
05/
25/3
5�� 1
5:00
5/25
/35�
�22:
005/
26/3
5���5
:00
5/26
/35�
�12:
005/
26/3
5��1
9:00
5/27
/35�
��2:0
05/
27/3
5���9
:00
5/27
/35�
�16:
005/
27/3
5��2
3:00
Tran
smiss
ion�
Util
izatio
n
0%20%40%60%80%
100%
5/16
/36�
��0:0
05/
16/3
6���7
:00
5/16
/36�
�14:
005/
16/3
6��2
1:00
5/17
/36�
��4:0
05/
17/3
6��1
1:00
5/17
/36�
�18:
005/
18/3
6���1
:00
5/18
/36�
��8:0
05/
18/3
6��1
5:00
5/18
/36�
�22:
005/
19/3
6���5
:00
5/19
/36�
�12:
005/
19/3
6��1
9:00
5/20
/36�
��2:0
05/
20/3
6���9
:00
5/20
/36�
�16:
005/
20/3
6��2
3:00
5/21
/36�
��6:0
05/
21/3
6��1
3:00
5/21
/36�
�20:
005/
22/3
6���3
:00
5/22
/36�
�10:
005/
22/3
6��1
7:00
5/23
/36�
��0:0
05/
23/3
6���7
:00
5/23
/36�
�14:
005/
23/3
6��2
1:00
5/24
/36�
��4:0
05/
24/3
6��1
1:00
5/24
/36�
�18:
005/
25/3
6���1
:00
5/25
/36�
��8:0
05/
25/3
6�� 1
5:00
5/25
/36�
�22:
005/
26/3
6���5
:00
5/26
/36�
�12:
005/
26/3
6��1
9:00
5/27
/36�
��2:0
05/
27/3
6���9
:00
5/27
/36�
�16:
005/
27/3
6��2
3:00
Tran
smiss
ion�
Util
izatio
n
PacDC SWAC
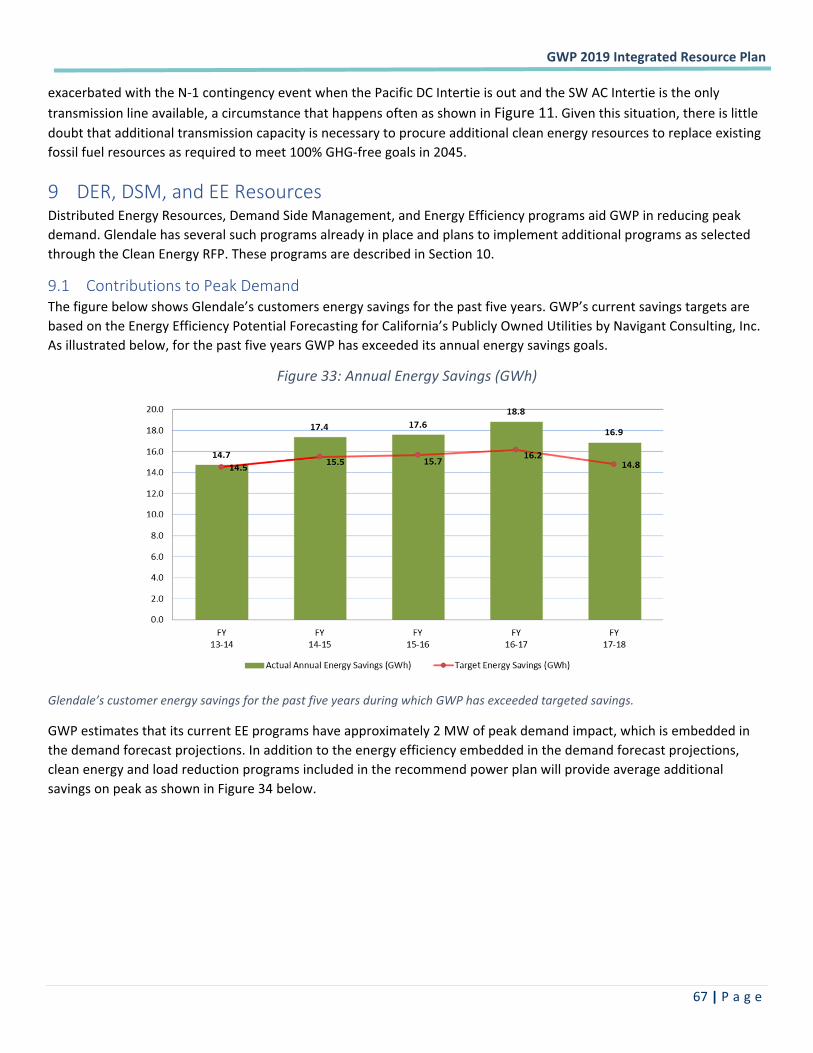
�GWP�2019�Integrated�Resource�Plan��
� �67�|�P a g e �
exacerbated�with�the�N�1�contingency�event�when�the�Pacific�DC�Intertie�is�out�and�the�SW�AC�Intertie�is�the�only�transmission�line�available,�a�circumstance�that�happens�often�as�shown�in�Figure�11.�Given�this�situation,�there�is�little�doubt�that�additional�transmission�capacity�is�necessary�to�procure�additional�clean�energy�resources�to�replace�existing�fossil�fuel�resources�as�required�to�meet�100%�GHG�free�goals�in�2045.��
9 DER,�DSM,�and�EE�Resources��Distributed�Energy�Resources,�Demand�Side�Management,�and�Energy�Efficiency�programs�aid�GWP�in�reducing�peak�demand.�Glendale�has�several�such�programs�already�in�place�and�plans�to�implement�additional�programs�as�selected�through�the�Clean�Energy�RFP.�These�programs�are�described�in�Section�10.��
9.1 Contributions�to�Peak�Demand��The�figure�below�shows�Glendale’s�customers�energy�savings�for�the�past�five�years.�GWP’s�current�savings�targets�are�based�on�the�Energy�Efficiency�Potential�Forecasting�for�California’s�Publicly�Owned�Utilities�by�Navigant�Consulting,�Inc.��As�illustrated�below,�for�the�past�five�years�GWP�has�exceeded�its�annual�energy�savings�goals.�
Figure�33:�Annual�Energy�Savings�(GWh)�
�
Glendale’s�customer�energy�savings�for�the�past�five�years�during�which�GWP�has�exceeded�targeted�savings.��
GWP�estimates�that�its�current�EE�programs�have�approximately�2�MW�of�peak�demand�impact,�which�is�embedded�in�the�demand�forecast�projections.�In�addition�to�the�energy�efficiency�embedded�in�the�demand�forecast�projections,�clean�energy�and�load�reduction�programs�included�in�the�recommend�power�plan�will�provide�average�additional�savings�on�peak�as�shown�in�Figure�34�below.��
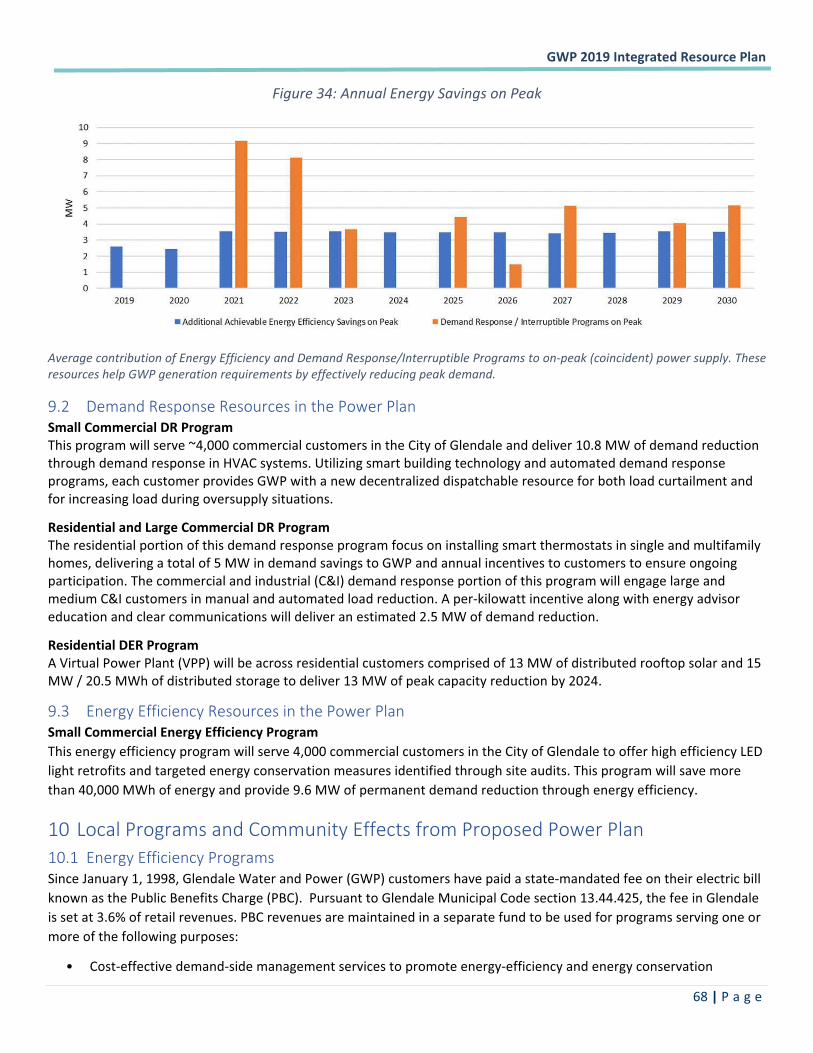
�GWP�2019�Integrated�Resource�Plan��
� �68�|�P a g e �
Figure�34:�Annual�Energy�Savings�on�Peak�
�
Average�contribution�of�Energy�Efficiency�and�Demand�Response/Interruptible�Programs�to�on�peak�(coincident)�power�supply.�These�resources�help�GWP�generation�requirements�by�effectively�reducing�peak�demand.��
9.2 Demand�Response�Resources�in�the�Power�Plan�Small�Commercial�DR�Program�This�program�will�serve�~4,000�commercial�customers�in�the�City�of�Glendale�and�deliver�10.8�MW�of�demand�reduction�through�demand�response�in�HVAC�systems.�Utilizing�smart�building�technology�and�automated�demand�response�programs,�each�customer�provides�GWP�with�a�new�decentralized�dispatchable�resource�for�both�load�curtailment�and�for�increasing�load�during�oversupply�situations.��
Residential�and�Large�Commercial�DR�Program�The�residential�portion�of�this�demand�response�program�focus�on�installing�smart�thermostats�in�single�and�multifamily�homes,�delivering�a�total�of�5�MW�in�demand�savings�to�GWP�and�annual�incentives�to�customers�to�ensure�ongoing�participation.�The�commercial�and�industrial�(C&I)�demand�response�portion�of�this�program�will�engage�large�and�medium�C&I�customers�in�manual�and�automated�load�reduction.�A�per�kilowatt�incentive�along�with�energy�advisor�education�and�clear�communications�will�deliver�an�estimated�2.5�MW�of�demand�reduction.��
Residential�DER�Program�A�Virtual�Power�Plant�(VPP)�will�be�across�residential�customers�comprised�of�13�MW�of�distributed�rooftop�solar�and�15�MW�/�20.5�MWh�of�distributed�storage�to�deliver�13�MW�of�peak�capacity�reduction�by�2024.�
9.3 Energy�Efficiency�Resources�in�the�Power�Plan��Small�Commercial�Energy�Efficiency�Program��This�energy�efficiency�program�will�serve�4,000�commercial�customers�in�the�City�of�Glendale�to�offer�high�efficiency�LED�light�retrofits�and�targeted�energy�conservation�measures�identified�through�site�audits.�This�program�will�save�more�than�40,000�MWh�of�energy�and�provide�9.6�MW�of�permanent�demand�reduction�through�energy�efficiency.��
10 Local�Programs�and�Community�Effects�from�Proposed�Power�Plan��10.1 Energy�Efficiency�Programs�Since�January�1,�1998,�Glendale�Water�and�Power�(GWP)�customers�have�paid�a�state�mandated�fee�on�their�electric�bill�known�as�the�Public�Benefits�Charge�(PBC).��Pursuant�to�Glendale�Municipal�Code�section�13.44.425,�the�fee�in�Glendale�is�set�at�3.6%�of�retail�revenues.�PBC�revenues�are�maintained�in�a�separate�fund�to�be�used�for�programs�serving�one�or�more�of�the�following�purposes:�
•� Cost�effective�demand�side�management�services�to�promote�energy�efficiency�and�energy�conservation�
�GWP�2019�Integrated�Resource�Plan��
� �69�|�P a g e �
•� New�investment�in�renewable�energy�resources�and�technologies�
•� Research,�development�and�demonstration�programs�
•� Services�provided�for�low�income�electricity�customers,�including,�but�not�limited�to,�targeted�energy�efficiency�service,�education,�weatherization�and�rate�discounts�
Section�9615�of�the�California�Public�Utilities�Code�requires�each�publicly�owned�utility�to�acquire�all�cost�effective,�reliable,�and�feasible�energy�efficiency�and�demand�reduction�resources�prior�to�other�resources�and�Section�9505(a)�of�the�California�Public�Utilities�Code�requires�each�publicly�owned�utility�to�report�its�investment�on�energy�efficiency�and�demand�reduction�programs�annually�to�its�customers�and�to�the�CEC.�
Since�1999,�GWP�has�been�a�leader�in�the�development�and�implementation�of�energy�efficiency�programs�for�its�customers,�and�GWP�programs�have�consistently�ranked�among�the�best�in�the�State�in�terms�of�annual�energy�savings�produced.�Since�2000,�GWP�has�invested�over�$47�million�on�energy�efficiency�programs�for�the�benefit�of�Glendale�customers�and�have�saved�over�1.7�million�MWhs.��At�today’s�average�electric�rate,�GWP�energy�efficiency�programs�will�have�produced�over�$333�million�in�customer�bill�reductions�over�the�life�of�installed�measures.�
Presently,�GWP�offers�over�23�energy�and�water�efficiency�programs�to�help�Glendale�customers�reduce�their�utility�bills�and�operation�costs.��Over�the�past�five�years,�Glendale�reported�saving�85.4�GWh�from�fiscal�year�2013/2014�through�fiscal�year�2017/2018.���
The�following�is�a�partial�list�of�GWP’s�various�energy�efficiency�programs:��
Residential�&�Commercial�Energy�Efficiency�Programs�
•� Smart�Home�AC�Tune�Ups.��First�approved�by�City�Council�in�2002,�this�program�provides�incentives�to�tune�up�existing�residential�AC�units.�Total�of�178,050�kWh�savings�in�FY�2017�18.�
•� Smart�Business�AC�Tune�Ups.��First�approved�by�City�Council�in�2002,�this�program�provides�incentives�to�tune�up�existing�small�business�AC�units.��Total�of�19,968�kWh�savings�in�FY�2017�18.�
•� Smart�Home�Rebates.��This�program�provides�an�easy�to�use�and�cost�effective�solution�for�providing�customers�with�energy�and�water�saving�rebates�using�new�modernization�technologies�and�web�based�services.��Total�of�81,051�kWh�savings�in�FY�2017�18.�
� Smart�Home�Rebates�Online�Portal.��This�portal�enables�residential�customers�to�apply�online�for�the�Smart�Home�Rebate�program.�
•� Tree�Power.��First�approved�by�City�Council�in�2006,�this�program�provides�free�shade�trees�to�residential�customers.�Total�of�39,172�kWh�savings�in�FY�2017�18.�
•� Home�Energy�Reports.��First�approved�by�City�Council�in�2009,�this�program�offers�Glendale�residents�with�a�quarterly�energy�usage�report�to�help�them�reduce�their�energy�consumption.��The�program�also�provides�residential�customers�with�web�access�to�their�hourly�usage�data.�Total�of�6,762,994�kWh�savings�in�FY�2017�18.�
•� Smart�Business�Energy�and�Water�Savings�Upgrades.��First�approved�by�City�Council�in�2002,�this�CMUA�award�winning�program�provides�free�energy�audits�and�energy�efficiency�measures�for�small�businesses�in�Glendale.�Total�of761,103�kWh�savings�in�FY�2017�18.�
•� Business�Energy�Solutions.��First�approved�by�City�Council�in�1999,�this�CMUA�award�winning�program�provides�incentives�for�comprehensive�energy�surveys�and�energy�saving�projects�for�large�business�customers.�Total�of�1,315,222�kWh�savings�in�FY�2017�18.��
�GWP�2019�Integrated�Resource�Plan��
� �70�|�P a g e �
•� Living�Wise.��First�approved�by�City�Council�in�2001,�this�program�provides�energy�and�water�conservation�education�in�local�public�and�private�schools.�Total�of�782,316�kWh�savings�in�FY�2017�18.�
In�addition�to�the�above,�existing�programs,�GWP�has�launched�the�following�new�residential�and�commercial�EE�programs�in�FY�2018�19:�
� Smart�Home�Energy�and�Water�Saving�Upgrades.��The�program�evaluates�the�efficiency�of�customer�homes,�installs�energy�and�water�saving�devices,�and�makes�recommendations�on�additional�energy�and�water�measures�customers�can�implement.��
•� Business�Customer�eNewsletter.��Electronic�newsletter�that�provides�news,�builds�relationships�and�provides�energy�and�water�conservation�and�efficiency�information�to�GWP’s�commercial�customers.���
Modernization�Programs���Research,�Development�&�Demonstration�(RD&D)�
Historically,�GWP�has�concentrated�its�PBC�expenditures�in�low�income,�energy�efficiency,�and�solar�programs.�One�of�GWP’s�strategic�goals�is�to�begin�offering�new�programs�and�services�that�allow�customers�to�take�advantage�of�GWP’s�modernization�investments.��For�example:�
� Smart�Home�Displays�and�Smart�Thermostats�Program.��This�California�Municipal�Utilities�Association�(CMUA)�award�winning�program�provides�customers�an�“In�Home�Display”�(Digital�Frame),�Smart�Thermostat,�and�Remote�Provisioning/Web�Portal.��Access�to�the�in�home�display�provides�real�time�electric�and�next�day�water�consumption�information.��In�addition�to�providing�energy�and�water�usage�information,�the�digital�frame�enhances�outreach�by�advertising�energy�efficiency�and�water�conservation�programs,�city�news/events,�conservation�information,�and�critical�event�messages.�Currently�there�are�a�total�of�1,145�participants�in�the�program.�Participants�of�the�In�Home�Display�and�Smart�Thermostat�Program�receive�a�free�installation�of�both�devices.���
� Conservation�Voltage�Reduction�(CVR)�program.��GWP’s�CVR�program�stands�as�an�example�for�other�POUs�in�achieving�the�energy�efficiency�goals�of�SB�350.�As�stated�in�the�CEC�report�Senate�Bill�350:�Doubling�Energy�Efficiency�Savings�by�2030:�“Conservation�Voltage�Reduction�Conservation�voltage�reduction�(CVR)�is�a�proven�technology�for�reducing�energy�use�and�peak�demand.�CVR�improves�the�efficiency�of�the�distribution�system�by�optimizing�voltage.”23��
This�program�is�a�cost�effective�demand�side�management�program.�Using�Dominion�Voltage�Inc.�(DVI)’s�Edge�system,�CVR�builds�on�GWP’s�investment�in�Automated�Metering�Infrastructure�(AMI)�by�using�the�data�generated�by�the�new�digital�meters�and�SCADA�to�reduce�customer�energy�consumption�by�maintaining�optimal�voltage�levels�on�GWP’s�distribution�transformers�and�feeders.�Roughly�95%�of�the�savings�generated�by�DVIs�Edge�CVR�are�in�the�customer’s�home.�When�GWP�started�the�program�in�2014,�the�program�was�expected�to�produce�energy�savings�of�2�4%�in�participating�transformers/feeders,�resulting�in�a�total�estimated�savings�of�14,430�28,378�MWh�annually.��Results�for�the�first�two�years�of�the�program�verified�these�estimates.��In�FY�2015�16�and�FY�2016�17,�GWP�was�able�to�achieve�energy�savings�of�between�1.2%�and�3.9%�per�transformer/feeders�for�an�average�2.5%.��Based�on�these�results,�GWP�expects�a�full�scale�CVR�program�in�the�next�three�to�five�years�to�produce�22,997�MWh�in�annual�energy�efficiency�savings,�which�is�2.2%�of�total�retail�electric�sales,�and�14,837�in�annual�greenhouse�gas�reductions.��
�������������������������������������������������������������23https://efiling.energy.ca.gov/URLRedirectPage.aspx?TN=TN221631_20171026T102305_Senate_Bill_350_Doubling_Energy_Efficiency_Savings_by_2030.pdf.com��at�page�45�of�the�Report.�
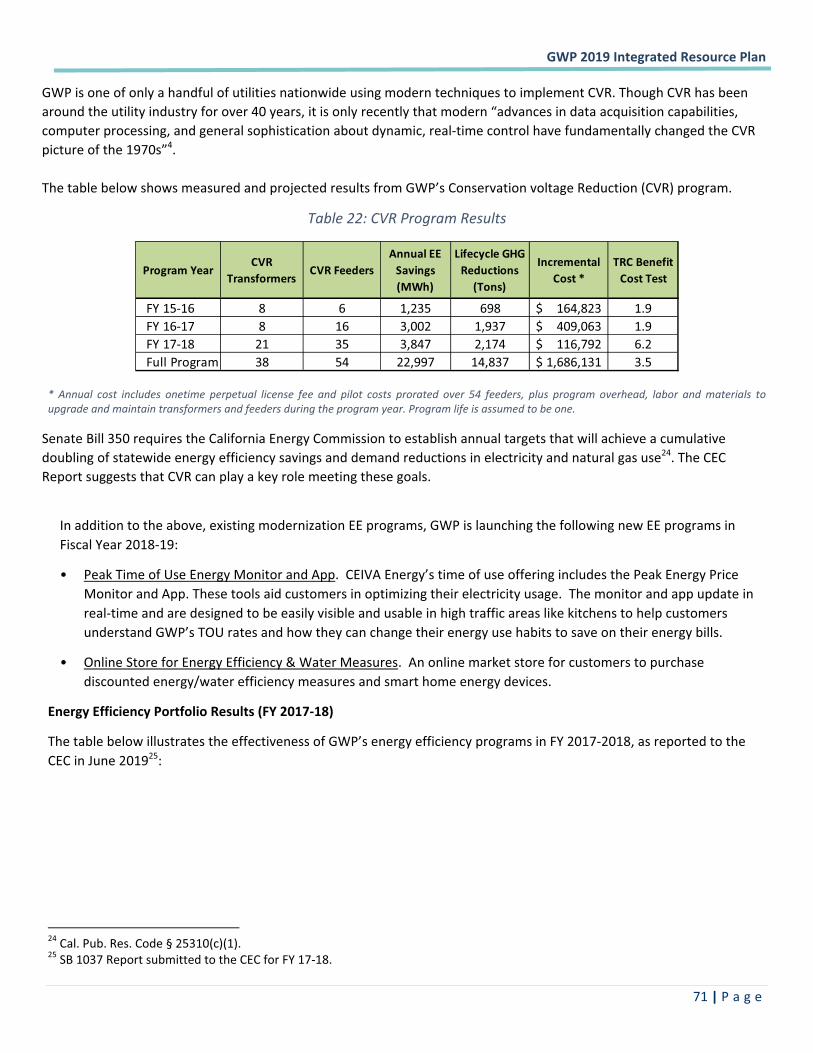
�GWP�2019�Integrated�Resource�Plan��
� �71�|�P a g e �
GWP�is�one�of�only�a�handful�of�utilities�nationwide�using�modern�techniques�to�implement�CVR.�Though�CVR�has�been�around�the�utility�industry�for�over�40�years,�it�is�only�recently�that�modern�“advances�in�data�acquisition�capabilities,�computer�processing,�and�general�sophistication�about�dynamic,�real�time�control�have�fundamentally�changed�the�CVR�picture�of�the�1970s”4.��The�table�below�shows�measured�and�projected�results�from�GWP’s�Conservation�voltage�Reduction�(CVR)�program.�
Table�22:�CVR�Program�Results�
�
*� Annual� cost� includes� onetime� perpetual� license� fee� and� pilot� costs� prorated� over� 54� feeders,� plus� program� overhead,� labor� and�materials� to�upgrade�and�maintain�transformers�and�feeders�during�the�program�year.�Program�life�is�assumed�to�be�one.��
Senate�Bill�350�requires�the�California�Energy�Commission�to�establish�annual�targets�that�will�achieve�a�cumulative�doubling�of�statewide�energy�efficiency�savings�and�demand�reductions�in�electricity�and�natural�gas�use24.�The�CEC�Report�suggests�that�CVR�can�play�a�key�role�meeting�these�goals.�
�
In�addition�to�the�above,�existing�modernization�EE�programs,�GWP�is�launching�the�following�new�EE�programs�in�Fiscal�Year�2018�19:�
•� Peak�Time�of�Use�Energy�Monitor�and�App.��CEIVA�Energy’s�time�of�use�offering�includes�the�Peak�Energy�Price�Monitor�and�App.�These�tools�aid�customers�in�optimizing�their�electricity�usage.��The�monitor�and�app�update�in�real�time�and�are�designed�to�be�easily�visible�and�usable�in�high�traffic�areas�like�kitchens�to�help�customers�understand�GWP’s�TOU�rates�and�how�they�can�change�their�energy�use�habits�to�save�on�their�energy�bills.��
•� Online�Store�for�Energy�Efficiency�&�Water�Measures.��An�online�market�store�for�customers�to�purchase�discounted�energy/water�efficiency�measures�and�smart�home�energy�devices.��
Energy�Efficiency�Portfolio�Results�(FY�2017�18)�
The�table�below�illustrates�the�effectiveness�of�GWP’s�energy�efficiency�programs�in�FY�2017�2018,�as�reported�to�the�CEC�in�June�201925:�
������������������������������������������������������������24�Cal.�Pub.�Res.�Code�§�25310(c)(1).�25�SB�1037�Report�submitted�to�the�CEC�for�FY�17�18.��
Program�YearCVR�
TransformersCVR�Feeders
Annual�EE�Savings�(MWh)
Lifecycle�GHG�Reductions�
(Tons)
Incremental�Cost�*
TRC�Benefit�Cost�Test
FY�15�16 8 6 1,235 698 164,823$����� 1.9FY�16�17 8 16 3,002 1,937 409,063$����� 1.9FY�17�18 21 35 3,847 2,174 116,792$����� 6.2Full�Program 38 54 22,997 14,837 1,686,131$�� 3.5
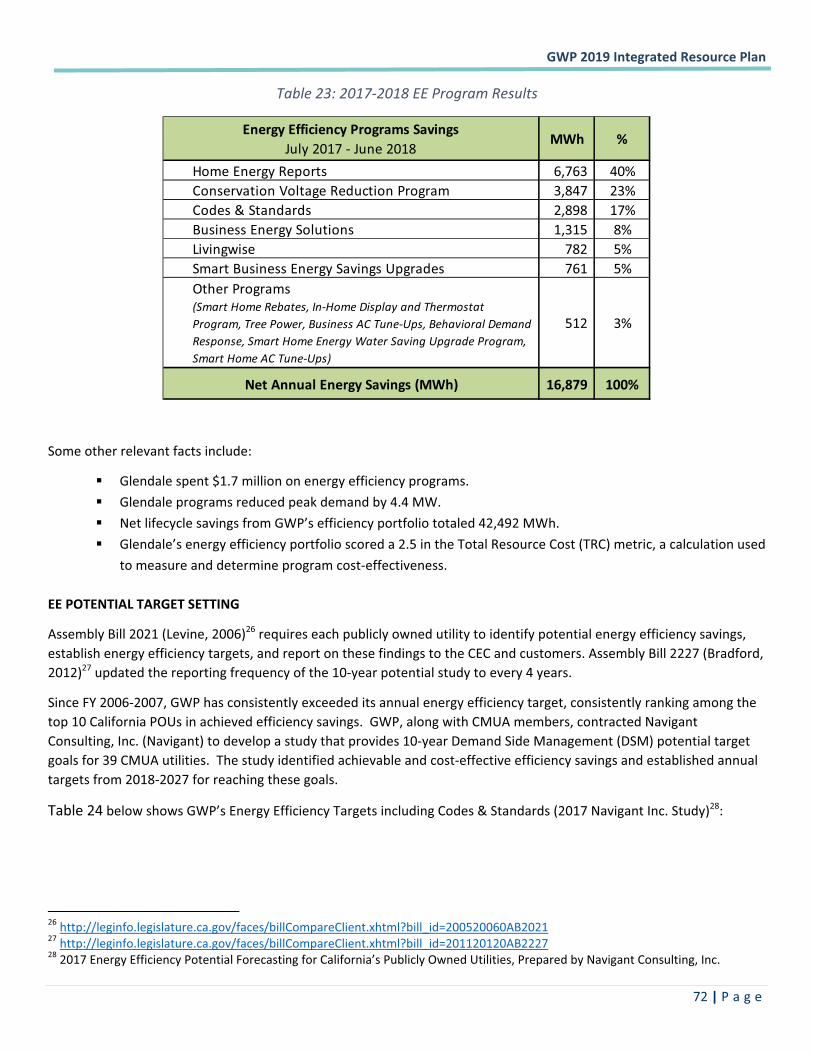
�GWP�2019�Integrated�Resource�Plan��
� �72�|�P a g e �
Table�23:�2017�2018�EE�Program�Results�
�
�
Some�other�relevant�facts�include:�
� Glendale�spent�$1.7�million�on�energy�efficiency�programs.�� Glendale�programs�reduced�peak�demand�by�4.4�MW.�� Net�lifecycle�savings�from�GWP’s�efficiency�portfolio�totaled�42,492�MWh.�� Glendale’s�energy�efficiency�portfolio�scored�a�2.5�in�the�Total�Resource�Cost�(TRC)�metric,�a�calculation�used�
to�measure�and�determine�program�cost�effectiveness.��
EE�POTENTIAL�TARGET�SETTING�
Assembly�Bill�2021�(Levine,�2006)26�requires�each�publicly�owned�utility�to�identify�potential�energy�efficiency�savings,�establish�energy�efficiency�targets,�and�report�on�these�findings�to�the�CEC�and�customers.�Assembly�Bill�2227�(Bradford,�2012)27�updated�the�reporting�frequency�of�the�10�year�potential�study�to�every�4�years.�
Since�FY�2006�2007,�GWP�has�consistently�exceeded�its�annual�energy�efficiency�target,�consistently�ranking�among�the�top�10�California�POUs�in�achieved�efficiency�savings.��GWP,�along�with�CMUA�members,�contracted�Navigant�Consulting,�Inc.�(Navigant)�to�develop�a�study�that�provides�10�year�Demand�Side�Management�(DSM)�potential�target�goals�for�39�CMUA�utilities.��The�study�identified�achievable�and�cost�effective�efficiency�savings�and�established�annual�targets�from�2018�2027�for�reaching�these�goals.��
Table�24�below�shows�GWP’s�Energy�Efficiency�Targets�including�Codes�&�Standards�(2017�Navigant�Inc.�Study)28:�
������������������������������������������������������������26�http://leginfo.legislature.ca.gov/faces/billCompareClient.xhtml?bill_id=200520060AB2021��27�http://leginfo.legislature.ca.gov/faces/billCompareClient.xhtml?bill_id=201120120AB2227��28�2017�Energy�Efficiency�Potential�Forecasting�for�California’s�Publicly�Owned�Utilities,�Prepared�by�Navigant�Consulting,�Inc.�
Energy�Efficiency�Programs�SavingsJuly�2017���June�2018
MWh %
Home�Energy�Reports 6,763��� 40%Conservation�Voltage�Reduction�Program 3,847��� 23%Codes�&�Standards 2,898��� 17%Business�Energy�Solutions 1,315��� 8%Livingwise 782������ 5%Smart�Business�Energy�Savings�Upgrades 761������ 5%Other�Programs(Smart�Home�Rebates,�In�Home�Display�and�Thermostat�Program,�Tree�Power,�Business�AC�Tune�Ups,�Behavioral�Demand�Response,�Smart�Home�Energy�Water�Saving�Upgrade�Program,�Smart�Home�AC�Tune�Ups)
512������ 3%
Net�Annual�Energy�Savings�(MWh) 16,879� 100%
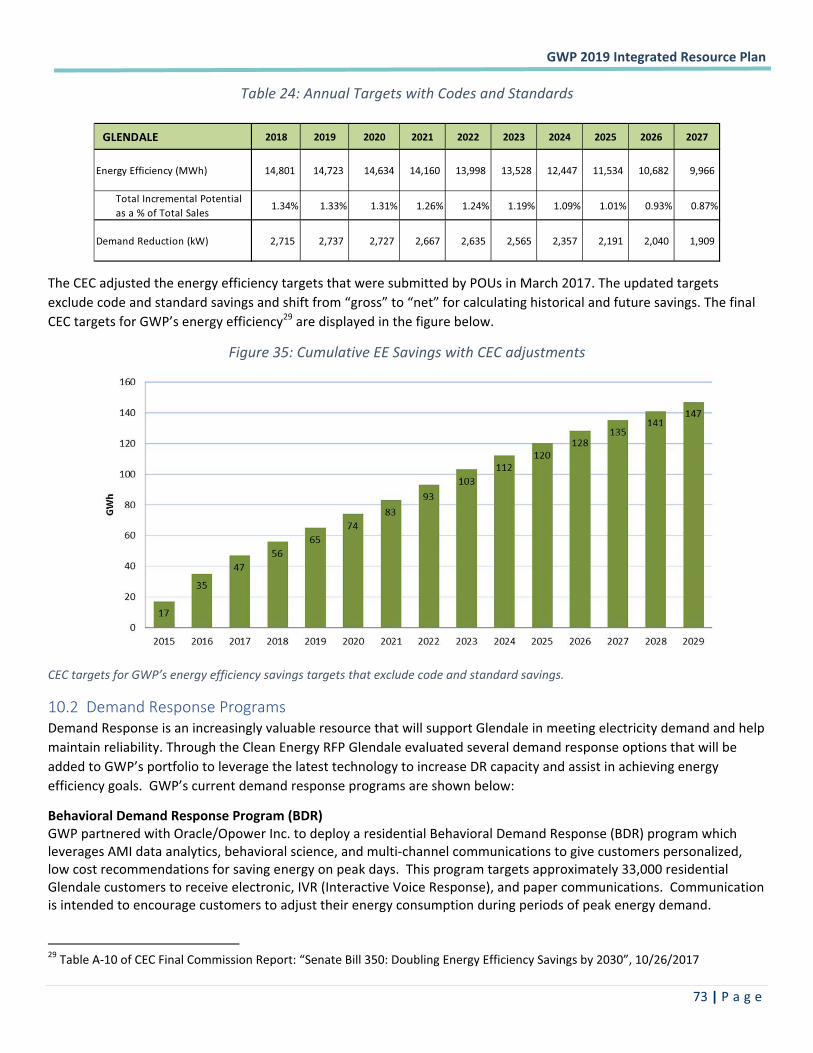
�GWP�2019�Integrated�Resource�Plan��
� �73�|�P a g e �
Table�24:�Annual�Targets�with�Codes�and�Standards�
�
The�CEC�adjusted�the�energy�efficiency�targets�that�were�submitted�by�POUs�in�March�2017.�The�updated�targets�exclude�code�and�standard�savings�and�shift�from�“gross”�to�“net”�for�calculating�historical�and�future�savings.�The�final�CEC�targets�for�GWP’s�energy�efficiency29�are�displayed�in�the�figure�below.�
Figure�35:�Cumulative�EE�Savings�with�CEC�adjustments�
�
CEC�targets�for�GWP’s�energy�efficiency�savings�targets�that�exclude�code�and�standard�savings.��
10.2 Demand�Response�Programs��Demand�Response�is�an�increasingly�valuable�resource�that�will�support�Glendale�in�meeting�electricity�demand�and�help�maintain�reliability.�Through�the�Clean�Energy�RFP�Glendale�evaluated�several�demand�response�options�that�will�be�added�to�GWP’s�portfolio�to�leverage�the�latest�technology�to�increase�DR�capacity�and�assist�in�achieving�energy�efficiency�goals.��GWP’s�current�demand�response�programs�are�shown�below:�
Behavioral�Demand�Response�Program�(BDR)�GWP�partnered�with�Oracle/Opower�Inc.�to�deploy�a�residential�Behavioral�Demand�Response�(BDR)�program�which�leverages�AMI�data�analytics,�behavioral�science,�and�multi�channel�communications�to�give�customers�personalized,�low�cost�recommendations�for�saving�energy�on�peak�days.��This�program�targets�approximately�33,000�residential�Glendale�customers�to�receive�electronic,�IVR�(Interactive�Voice�Response),�and�paper�communications.��Communication�is�intended�to�encourage�customers�to�adjust�their�energy�consumption�during�periods�of�peak�energy�demand.���������������������������������������������������������������29�Table�A�10�of�CEC�Final�Commission�Report:�“Senate�Bill�350:�Doubling�Energy�Efficiency�Savings�by�2030”,�10/26/2017�
GLENDALE 2018 2019 2020 2021 2022 2023 2024 2025 2026 2027
Energy�Efficiency�(MWh) 14,801��� 14,723��� 14,634���� 14,160�� 13,998�� 13,528�� 12,447�� 11,534�� 10,682�� 9,966����
Total�Incremental�Potential�as�a�%�of�Total�Sales
1.34% 1.33% 1.31% 1.26% 1.24% 1.19% 1.09% 1.01% 0.93% 0.87%
Demand�Reduction�(kW) 2,715����� 2,737����� 2,727������ 2,667���� 2,635���� 2,565���� 2,357���� 2,191���� 2,040���� 1,909����
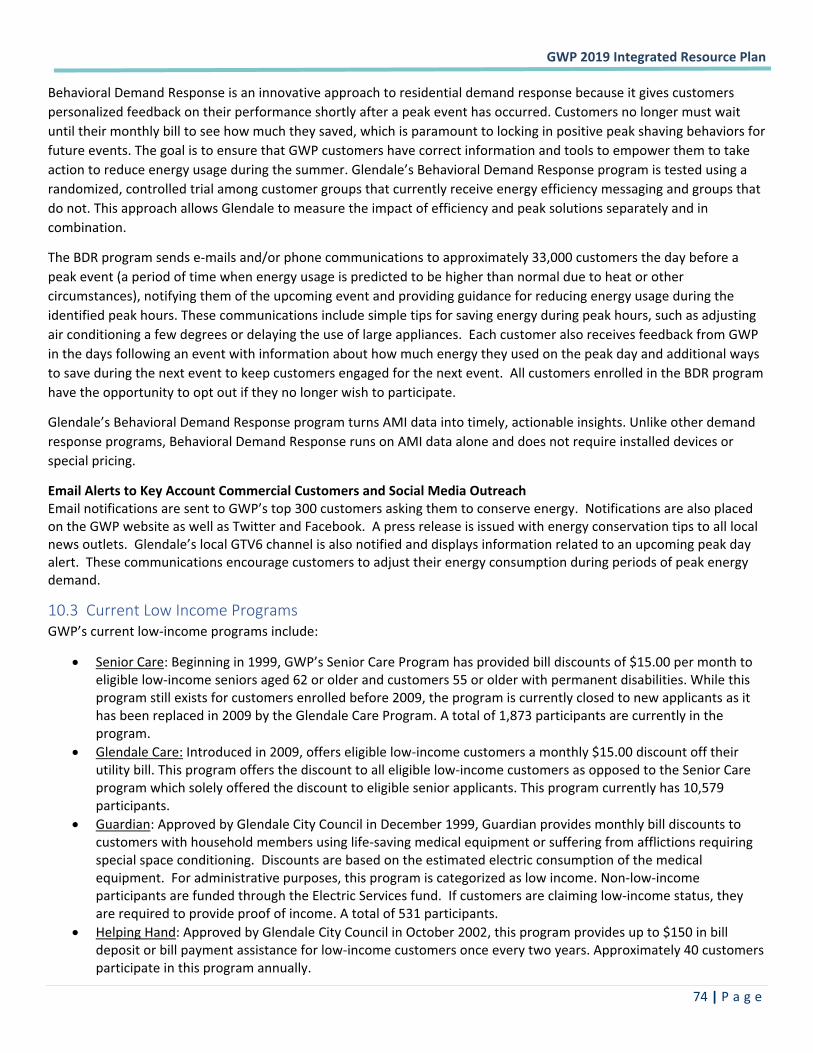
�GWP�2019�Integrated�Resource�Plan��
� �74�|�P a g e �
Behavioral�Demand�Response�is�an�innovative�approach�to�residential�demand�response�because�it�gives�customers�personalized�feedback�on�their�performance�shortly�after�a�peak�event�has�occurred.�Customers�no�longer�must�wait�until�their�monthly�bill�to�see�how�much�they�saved,�which�is�paramount�to�locking�in�positive�peak�shaving�behaviors�for�future�events.�The�goal�is�to�ensure�that�GWP�customers�have�correct�information�and�tools�to�empower�them�to�take�action�to�reduce�energy�usage�during�the�summer.�Glendale’s�Behavioral�Demand�Response�program�is�tested�using�a�randomized,�controlled�trial�among�customer�groups�that�currently�receive�energy�efficiency�messaging�and�groups�that�do�not.�This�approach�allows�Glendale�to�measure�the�impact�of�efficiency�and�peak�solutions�separately�and�in�combination.�
The�BDR�program�sends�e�mails�and/or�phone�communications�to�approximately�33,000�customers�the�day�before�a�peak�event�(a�period�of�time�when�energy�usage�is�predicted�to�be�higher�than�normal�due�to�heat�or�other�circumstances),�notifying�them�of�the�upcoming�event�and�providing�guidance�for�reducing�energy�usage�during�the�identified�peak�hours.�These�communications�include�simple�tips�for�saving�energy�during�peak�hours,�such�as�adjusting�air�conditioning�a�few�degrees�or�delaying�the�use�of�large�appliances.��Each�customer�also�receives�feedback�from�GWP�in�the�days�following�an�event�with�information�about�how�much�energy�they�used�on�the�peak�day�and�additional�ways�to�save�during�the�next�event�to�keep�customers�engaged�for�the�next�event.��All�customers�enrolled�in�the�BDR�program�have�the�opportunity�to�opt�out�if�they�no�longer�wish�to�participate.�
Glendale’s�Behavioral�Demand�Response�program�turns�AMI�data�into�timely,�actionable�insights.�Unlike�other�demand�response�programs,�Behavioral�Demand�Response�runs�on�AMI�data�alone�and�does�not�require�installed�devices�or�special�pricing.��
Email�Alerts�to�Key�Account�Commercial�Customers�and�Social�Media�Outreach�Email�notifications�are�sent�to�GWP’s�top�300�customers�asking�them�to�conserve�energy.��Notifications�are�also�placed�on�the�GWP�website�as�well�as�Twitter�and�Facebook.��A�press�release�is�issued�with�energy�conservation�tips�to�all�local�news�outlets.��Glendale’s�local�GTV6�channel�is�also�notified�and�displays�information�related�to�an�upcoming�peak�day�alert.��These�communications�encourage�customers�to�adjust�their�energy�consumption�during�periods�of�peak�energy�demand.�
10.3 Current�Low�Income�Programs��GWP’s�current�low�income�programs�include:�
� Senior�Care:�Beginning�in�1999,�GWP’s�Senior�Care�Program�has�provided�bill�discounts�of�$15.00�per�month�to�eligible�low�income�seniors�aged�62�or�older�and�customers�55�or�older�with�permanent�disabilities.�While�this�program�still�exists�for�customers�enrolled�before�2009,�the�program�is�currently�closed�to�new�applicants�as�it�has�been�replaced�in�2009�by�the�Glendale�Care�Program.�A�total�of�1,873�participants�are�currently�in�the�program.�
� Glendale�Care:�Introduced�in�2009,�offers�eligible�low�income�customers�a�monthly�$15.00�discount�off�their�utility�bill.�This�program�offers�the�discount�to�all�eligible�low�income�customers�as�opposed�to�the�Senior�Care�program�which�solely�offered�the�discount�to�eligible�senior�applicants.�This�program�currently�has�10,579�participants.�
� Guardian:�Approved�by�Glendale�City�Council�in�December�1999,�Guardian�provides�monthly�bill�discounts�to�customers�with�household�members�using�life�saving�medical�equipment�or�suffering�from�afflictions�requiring�special�space�conditioning.��Discounts�are�based�on�the�estimated�electric�consumption�of�the�medical�equipment.��For�administrative�purposes,�this�program�is�categorized�as�low�income.�Non�low�income�participants�are�funded�through�the�Electric�Services�fund.��If�customers�are�claiming�low�income�status,�they�are�required�to�provide�proof�of�income.�A�total�of�531�participants.�
� Helping�Hand:�Approved�by�Glendale�City�Council�in�October�2002,�this�program�provides�up�to�$150�in�bill�deposit�or�bill�payment�assistance�for�low�income�customers�once�every�two�years.�Approximately�40�customers�participate�in�this�program�annually.��
�GWP�2019�Integrated�Resource�Plan��
� �75�|�P a g e �
10.4 Community�Solar��The�California�Energy�Commission’s�2016�report�Low�Income�Barriers�Study,�Part�A�identified�several�recommendations,�one�being�that�POUs�should�explore�the�option�to�deploy�community�solar�installations�in�low�income�and�disadvantaged�communities.�This�recommendation�is�being�explored�by�Glendale�and�as�a�result,�GWP�has�budgeted�$1�million�to�support�a�Community�Solar�project�for�FY�2019�2020��
Community�Solar�is�a�local�solar�power�plant�whose�electricity�is�shared�by�more�than�one�customer.�Community�solar�allows�members�of�a�community�the�opportunity�to�share�the�benefits�of�solar�power�even�if�they�cannot�or�prefer�not�to�install�solar�panels�on�their�property.�Typical�participation�formats�include�ownership�(where�participants�purchase�some�panels�or�a�share�in�a�project�and�receive�a�credit�for�the�solar�power�produced�by�their�share),�subscription�(where�participants�subscribe�to�a�set�amount�of�power�produced�by�a�community�solar�installation�at�a�set�price),�and�donation�(which�allows�participants�to�donate�toward�the�installation�of�the�system�as�a�non�profit,�with�the�only�benefit�to�the�participant�being�philanthropic).�
The�City�of�Glendale�currently�has�ownership�of�the�following�locations�within�the�City�limits�that�can�potentially�accommodate�a�solar�development.�These�potential�sites�could�support�3.064�MW�of�solar:��
� Public�Works�Building/Parking�Area�(0.077�MW)�� Civic�Auditorium�Parking�Structure�(0.040�MW)�� Civic�Auditorium�Overflow�Lot�(0.175�MW)�� Diederich�Reservoir�(2.270�MW)�� Rossmoyne�Reservoir�(0.502�MW)�
10.5 New�Programs�for�Disadvantaged�and�Low�Income�Customers��Glendale�is�currently�designing�a�new�program�that�will�evaluate�the�efficiency�of�low�income�customer’s�home,�install�energy�and�water�saving�devices,�and�give�recommendations�regarding�additional�energy�and�water�measures�that�the�customer�can�implement.�The�residential�audit�will�inspect�and�install�a�number�of�energy�and�water�saving�measures�at�no�cost�to�the�customer,�including�the�potential�replacement�or�installation�of�an�Energy�Star�room�AC�and�an�Energy�Star�refrigerator�for�qualified�low�income�customers.����An�estimated�60%�of�Glendale’s�residential�electric�customers�live�in�multi�family�rental�units,�and�a�substantial�number�of�these�units�are�in�low�income�neighborhoods.�This�program�will�target�inefficient�room�AC�units�and�refrigerators�in�low�income�neighborhoods.�GWP�is�designing�this�new�program�with�the�intention�of�helping�low�income�customers�with�their�electric�bills�while�reducing�overall�system�demands�in�order�to�benefit�all�utility�customers.�This�program�will�provide�free�upgrades�to�Glendale�apartment�owners�who�have�low�income�tenants.��
�Given�the�fact�that�tenants�generally�pay�for�their�electric�bill,�apartment�owners�have�little�incentive,�if�any,�to�replace�aging,�inefficient�room�air�conditioning�systems�and�refrigerators�despite�having�minor�benefits�of�reduced�maintenance�cost.�This�program�will�change�this�situation�by�providing�the�program�free�to�qualified�low�income�customers�and�encouraging�apartment�owners�with�low�income�tenants�to�participate�in�the�program.�
10.6 Transportation�Electrification�in�Disadvantaged�Communities��Transportation�electrification�is�a�key�component�in�the�State’s�decarbonization�strategy.�According�to�the�California�Air�Resources�Board�(CARB),�41�percent�of�California’s�430�million�metric�tons�of�CO2�emissions�stem�from�the�transportation�sector.�For�comparison,�only�16�percent�of�CO2�emissions�are�traceable�to�electricity�generation.�For�California�to�achieve�its�goal�of�reaching�80�percent�below�1990�levels�by�2050,�the�vast�majority�of�transportation�related�energy�consumption�will�have�to�be�sourced�from�electricity.�To�put�that�into�numbers,�California�will�need�to�have�over�7�million�electric�vehicles�on�the�road�by�2030�to�meet�emissions�goals.��
�GWP�2019�Integrated�Resource�Plan��
� �76�|�P a g e �
In�a�future�of�very�high�penetration�of�electric�vehicles�in�GWP�service�territory�(perhaps�on�the�order�of�50%�or�more�EVs),�GWP�could�have�access�to�a�large�distributed�battery�resource�that�it�could�leverage�to�integrate�renewable�energy.�Ninety�five�percent�of�the�time30�vehicle�batteries�are�sitting�idle.�Theoretically,�vehicle�to�grid�(V2G)�control�technology�through�a�charger�network�could�allow�GWP�to�use�plugged�in�vehicles�for�grid�services�such�as�regulation�and�frequency�response.�So�far,�V2G�remains�an�interesting�concept�as�compensation�mechanisms�remain�immature�and�vehicle�manufacturers�have�failed�to�embrace�the�concept,�often�voiding�warranties�due�to�concerns�for�excess�wear�on�the�battery.�Another�alternative�is�known�as�“smart�charging”�which�simply�optimizes�the�time�to�charge�the�battery�relative�to�grid�conditions.�This�is�analogous�to�smart�thermostat�programs�which�automatically�turn�down�a�home�thermostat�when�prices�are�highest.��
Of�course,�there�are�risks�with�growing�the�EV�load�without�a�management�strategy.�According�to�the�Rocky�Mountain�Institute,�“if�7%�of�households�in�California�had�EVs�(a�total�of�870,322�vehicles,�which�is�below�California’s�target�for�2020)�charging�at�the�same�time,�the�EV�charging�load�would�range�from�3.8%�of�the�system’s�baseline�peak�load�with�Level�1�charging,�to�75.1%�with�Level�3�(40�kW)�charging�if�all�EVs�were�connected�to�the�grid�when�the�system�demand�reached�its�annual�peak”31.�According�to�a�CEC�analysis,�“demand�from�residential�and�nonresidential�EV�chargers�could�amount�to�more�than�1�GW�by�2025”32.�Another,�more�pressing�concern�is�the�impact�of�EV�load�on�local�distribution�circuits.�Currently,�EVs�tend�to�cluster�in�affluent�neighborhoods,�and�the�growth�of�EV�clustering�in�neighborhoods�may�someday�require�distribution�grid�and�substation�upgrades.��
Using�the�California�Communities�Environmental�Health�Screening�Tool,�GWP�has�identified�Disadvantaged�Communities�census�tracts�that�are�designated�as�being�in�the�highest�pollution�burden�percentiles.�Census�tracts�with�the�highest�air�emissions�from�vehicles�are�located�along�the�San�Fernando�Road�corridor,�adjacent�to�the�Interstate�5�Freeway.�As�the�transportation�industry�begins�to�transition�to�electric�vehicles,�GWP�will�continue�its�hard�work�to�expand�its�public�EV�charging�station�infrastructure�and�EV�residential�and�commercial�utility�programs.�GWP�is�exploring�the�options�of�installing�EV�charging�stations�along�those�areas�identified�at�the�highest�pollution�burden.�These�efforts�will�directly�benefit�these�disadvantaged�communities�by�reducing�local�air�pollution�in�these�areas.�
The�electricity�sector�has�significantly�more�options�to�create�clean�energy�than�does�the�transportation�fuel�industry.�A�combination�of�hydro,�nuclear,�and�renewable�generation�incorporated�with�energy�storage�technologies�and�larger�integrated�markets�could�accommodate�a�dramatically�increased�load�from�the�transportation�sector.��
Glendale�is�one�of�the�first�cities�in�California�providing�special�programs�to�promote�electrification�in�the�transportation�sector.�Improvements�in�electric�vehicle�technology�offer�a�significant�opportunity�for�the�city�to�demonstrate�government�leadership�toward�advancing�EV�infrastructure�and�increased�EV�integration�in�Glendale.��The�electrification�of�transportation�is�a�crucial�strategy�towards�achieving�air�quality�and�climate�goals�both�locally�and�statewide.�
California�Clean�Vehicle�Rebate�(CCVB)�program�data�through�February�2019�shows�that�the�City�of�Glendale�has�added�more�than�2,388�Battery�Electric�Vehicles�(BEVs),�Plugin�Hybrid�Electric�Vehicles�(PHEVs),�and�Fuel�Cell�Electric�Vehicles�(FCEVs)�since�January�2011.�According�to�the�Alternative�Fuels�Data�Center�of�the�US�Department�of�Energy,�there�are�86�public�access�and�privately�owned�charging�stations�within�the�city�of�Glendale�as�of�June�2019.�Figure�36�shows�the�locations�of�the�charging�stations�in�GWP�service�territory.�
������������������������������������������������������������30�https://www.greentechmedia.com/articles/read/why�is�vehicle�to�grid�taking�so�long�to�happen#gs.FgH4mCk�31�https://rmi.org/wp�content/uploads/2017/04/RMI_Electric_Vehicles_as_DERs_Final_V2.pdf�32https://efiling.energy.ca.gov/URLRedirectPage.aspx?TN=TN222986_20180316T143039_Staff_Report__California_PlugIn_Electric_Vehicle_Infrastructure.pdf�
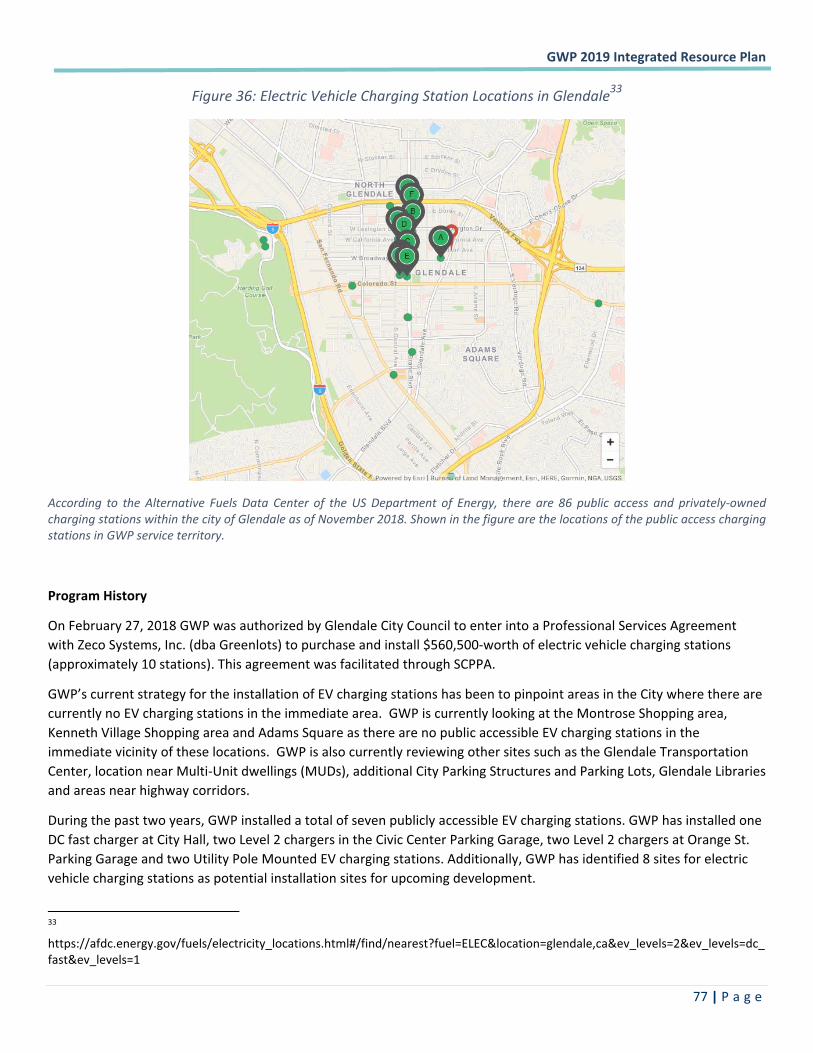
�GWP�2019�Integrated�Resource�Plan��
� �77�|�P a g e �
Figure�36:�Electric�Vehicle�Charging�Station�Locations�in�Glendale33�
�
According� to� the� Alternative� Fuels�Data� Center� of� the�US�Department� of� Energy,� there� are� 86� public� access� and� privately�owned�charging�stations�within�the�city�of�Glendale�as�of�November�2018.�Shown�in�the�figure�are�the�locations�of�the�public�access�charging�stations�in�GWP�service�territory.�
�
Program�History�
On�February�27,�2018�GWP�was�authorized�by�Glendale�City�Council�to�enter�into�a�Professional�Services�Agreement�with�Zeco�Systems,�Inc.�(dba�Greenlots)�to�purchase�and�install�$560,500�worth�of�electric�vehicle�charging�stations�(approximately�10�stations).�This�agreement�was�facilitated�through�SCPPA.�
GWP’s�current�strategy�for�the�installation�of�EV�charging�stations�has�been�to�pinpoint�areas�in�the�City�where�there�are�currently�no�EV�charging�stations�in�the�immediate�area.��GWP�is�currently�looking�at�the�Montrose�Shopping�area,�Kenneth�Village�Shopping�area�and�Adams�Square�as�there�are�no�public�accessible�EV�charging�stations�in�the�immediate�vicinity�of�these�locations.��GWP�is�also�currently�reviewing�other�sites�such�as�the�Glendale�Transportation�Center,�location�near�Multi�Unit�dwellings�(MUDs),�additional�City�Parking�Structures�and�Parking�Lots,�Glendale�Libraries�and�areas�near�highway�corridors.�
During�the�past�two�years,�GWP�installed�a�total�of�seven�publicly�accessible�EV�charging�stations.�GWP�has�installed�one�DC�fast�charger�at�City�Hall,�two�Level�2�chargers�in�the�Civic�Center�Parking�Garage,�two�Level�2�chargers�at�Orange�St.�Parking�Garage�and�two�Utility�Pole�Mounted�EV�charging�stations.�Additionally,�GWP�has�identified�8�sites�for�electric�vehicle�charging�stations�as�potential�installation�sites�for�upcoming�development.�
������������������������������������������������������������33�https://afdc.energy.gov/fuels/electricity_locations.html#/find/nearest?fuel=ELEC&location=glendale,ca&ev_levels=2&ev_levels=dc_fast&ev_levels=1�
�GWP�2019�Integrated�Resource�Plan��
� �78�|�P a g e �
Grants�
The�CEC�Alternative�and�Renewable�Fuel�and�Vehicle�Technology�Program�(PON�13�606),�was�a�grant�that�was�awarded�to�SCPPA�in�2014�and�all�of�its�members�which�includes�the�City�of�Glendale.�Through�this�grant,�GWP�was�awarded�funding�of�$50,000�for�one�Level�3�DC�fast�charger�that�was�installed�at�Glendale�City�Hall�parking�lot.�The�grant’s�goal�was�to�create�a�web�of�conveniently�located�charging�stations�within�a�mile�of�any�freeway�in�California,�to�make�travelling�for�EV�owners�in�the�state�more�accessible,�dependable,�and�hassle�free�and�to�encourage�the�use�of�additional�electric�vehicles�in�the�state.����
The�Mobile�Source�Air�Pollution�Reduction�Review�Committee�(MSRC)��
MSRC�has�reserved�funding�for�Glendale�to�partner�with�them�in�reducing�motor�vehicle�air�pollution.��The�MSRC’s�Local�Government�Partnership�Program�is�designed�to�forge�partnerships�between�the�MSRC�and�cities�or�counties�within�the�South�Coast�region�to�jumpstart�implementation�of�the�South�Coast�AQMD’s�2016�Air�Quality�Management�Plan�(AQMP).�The�2016�AQMP�relies�heavily�on�use�of�incentives�to�achieve�air�pollution�reductions�above�and�beyond�those�obtained�solely�by�regulation.�
The�Local�Government�Partnership�Program�is�a�unique�funding�opportunity�that�will�provide�GWP�with�additional�funding�to�implement�high�priority�clean�air�programs.�The�amount�of�funding�allocated�to�Glendale�will�scale�with�the�amount�of�air�quality�improvement�funding�the�City�receives�under�the�AB�2766�Motor�Vehicle�Subvention�Fund�Program.�The�City�of�Glendale�has�an�approved�Reserved�Funding�Amount�of�$260,500.���
GWP�will�be�pursuing�the�Electric�Vehicle�Charging�Infrastructure�Installation�category�of�the�Local�Government�Partnership�Program,�which�includes�the�costs�to�purchase�and�install�electric�vehicle�supply�equipment�(EVSE)�to�support�increasing�numbers�of�electric�and�plug�in�hybrid�vehicles.�The�MSRC�will�contribute�up�to�75%�of�the�cost�of�publicly�accessible�EVSE�installations�and�up�to�50%�of�the�total�EVSE�cost�for�private�access�EVSE.�
LCFS�Credits�
GWP�opted�into�the�Low�Carbon�Fuel�Standard�(LCFS)�Program�offered�by�the�CARB�in�March�2017.�CARB�adopted�the�LCFS�regulation�in�2009�to�reduce�the�carbon�intensity�of�transportation�fuels�used�in�California.�Through�this�program,�GWP�receives�LCFS�credits�from�public�EV�charging�stations�and�residential�EV�Charging�credits�based�on�the�number�of�electric�vehicles�that�“reside”�in�Glendale.�LCFS�credits�can�be�sold�and�traded�in�the�California�LCFS�market�through�competitive�solicitation�to�generate�revenue�and�fun�the�installation�of�more�publicly�accessible�charging�stations�in�Glendale.�
Southern�California�Public�Power�Authority�(SCPPA)�EV�Working�Group�
Glendale�is�part�of�the�SCPPA�EV�Working�Group.��The�working�group�aims�to�develop�a�consistent�presentation�of�information�to�customers�related�to�“all�things�EV”�throughout�the�southern�California�region.�The�mission�statement�of�the�group�is�focused�on�facilitating�the�electrification�of�the�transportation�sector�in�the�region�for�the�betterment�of�the�communities�that�we�serve�by:�
� Reducing�our�dependence�on�fossil�fuels�
� Improving�air�quality�through�a�reduction�in�greenhouse�gas�emissions�
� Creating�job�opportunities�and�economic�growth�in�the�region�
� Assisting�customers�in�reducing�transportation�costs�
� Improving�Utility�system�operating�efficiencies�and�containing�costs�
�GWP�2019�Integrated�Resource�Plan��
� �79�|�P a g e �
Electric�Vehicle�Level�II�Charger�Rebates�
This�program�was�launched�by�Glendale�on�July�2017�and�it�offers�a�maximum�$500�rebate�to�residential�customers�who�install�a�Level�II�(240V)�EV�charger�in�Glendale.�The�program�also�offers�a�Public�Access�electric�vehicle�charging�station�rebates�to�commercial�customers�who�install�a�level�2�(240�Volt)�or�higher�plug�in�electric�vehicle�(EV)�chargers�at�locations�accessible�to�patrons,�multi�family�dwelling�residents,�commuters�and�visitors.�Under�this�program,�GWP�will�reimburse�customers�for�out�of�pocket�expenses�of�up�to�$2,000�per�charging�station�for�public�access�locations.�The�annual�budget�for�this�program�is�currently�at�$75,000�per�fiscal�year.��GWP�will�explore�the�possibility�of�using�LCFS�revenue�to�supplement�this�program.�
Electric�Vehicle�Guest�Drive�Events����������� � � � � � �������
To�promote�the�adoption�of�electric�vehicles,�Glendale�will�host�multiple�Electric�Vehicle�Ride�&�Drive�Events�every�year.�These�events�provide�a�peer�to�peer,�experiential�learning�environment�for�prospective�EV�buyers.�The�events�will�provide�the�EV�experience�and�education�required�to�help�customers�facilitate�the�purchase�or�lease�of�an�electric�car.�These�events�will�be�staffed�by�EV�owners�who�are�knowledgeable�about�their�cars�and�are�able�and�willing�to�answers�questions�from�participants�as�they�test�drive�their�vehicle.��GWP’s�goal�is�to�expand�awareness�about�EVs�and�the�benefits�of�fueling�from�the�electric�grid.���
Electric�vehicle�infrastructure�is�an�important�part�of�the�Los�Angeles�region’s�future.�GWP�should�direct�resources�to�planning�Glendale’s�future�EV�infrastructure�needs.�Future�planning�studies�should�explore�this�topic�in�more�depth,�including�understanding�how�to�manage�EV�charging�to�avoid�new�peaking�capacity�and�distribution�grid�upgrades.�
At�this�current�early�stage�of�EV�development,�most�efforts�revolve�around�expanding�the�EV�charging�station�network�and�conversion�of�public�vehicles�to�electric34.�These�measures�include:�
� Charging�stations�and�preferential�parking�at�public�parking�lots.�� Incentives�for�local�businesses�to�install�EV�chargers�at�workplace�parking�lots.�� Requirements�of�apartment�building�owners�to�make�EV�charging�accessible�to�residents.�� Conversion�of�bus�fleets�and�city�fleets�to�electric35.��
10.7 Localized�Air�Pollution�and�Disadvantaged�Communities��California�Environmental�Protection�Agency�(CalEPA)�has�identified�California’s�most�pollution�burdened�and�vulnerable�communities.�Based�on�the�California�Communities�Environmental�Health�Screening�Tool�(CalEnviroScreen�3.0),�the�vast�majority�of�GWP’s�service�territory�is�designated�as�disadvantaged�areas.�Approximately�35%36�of�the�population�in�GWP’s�service�territory�lives�in�disadvantaged�communities�per�the�latest�CalEPA�data�and�2017�State�Census.�Disadvantaged�communities�are�mostly�located�near�local�air�pollutants�and�have�large�overlap�with�low�income�communities�(see�Figure�37).�
Glendale�is�currently�in�the�process�of�designing�and�implementing�more�programs�that�will�target�Glendale’s�Low�Income�customers�and�Disadvantaged�Communities�with�energy�efficiency,�demand�response,�and�electrification�
������������������������������������������������������������34�For�more�guidance�for�cities�on�vehicle�electrification�strategy,�see:�https://cleantechnica.com/files/2018/04/EV�Charging�Infrastructure�Guidelines�for�Cities.pdf��35�Incentives�are�available�from�the�State�of�California.�See:�https://www.californiahvip.org/��36�This�percentage�was�calculated�as�the�sum�of�the�populations�in�census�tracts�labeled�as�disadvantaged�communities�(Glendale�Disadvantaged�Communities�SB�535�List�of�DACs_CES30)�divided�by�2017�Glendale�census�total�population�(https://factfinder.census.gov/faces/tableservices/jsf/pages/productview.xhtml?src=bkmk)�with�adjustment�to�unincorporated�population.��
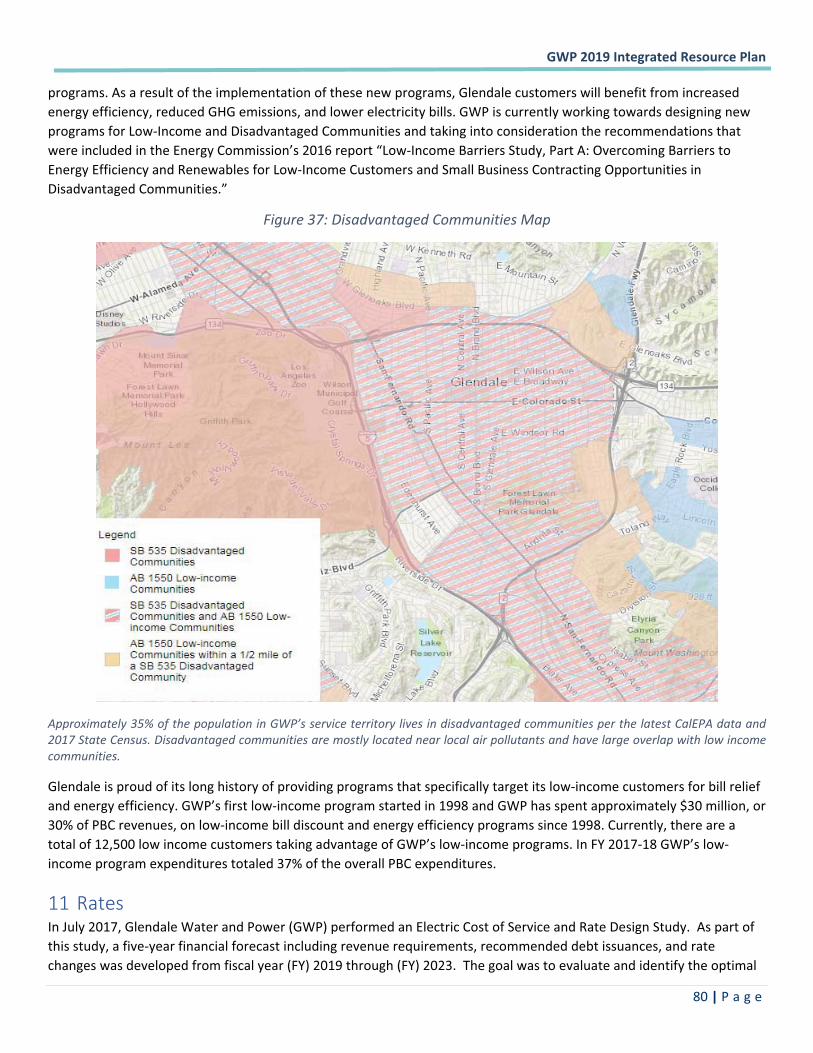
�GWP�2019�Integrated�Resource�Plan��
� �80�|�P a g e �
programs.�As�a�result�of�the�implementation�of�these�new�programs,�Glendale�customers�will�benefit�from�increased�energy�efficiency,�reduced�GHG�emissions,�and�lower�electricity�bills.�GWP�is�currently�working�towards�designing�new�programs�for�Low�Income�and�Disadvantaged�Communities�and�taking�into�consideration�the�recommendations�that�were�included�in�the�Energy�Commission’s�2016�report�“Low�Income�Barriers�Study,�Part�A:�Overcoming�Barriers�to�Energy�Efficiency�and�Renewables�for�Low�Income�Customers�and�Small�Business�Contracting�Opportunities�in�Disadvantaged�Communities.”�
Figure�37:�Disadvantaged�Communities�Map�
�
Approximately�35%�of�the�population�in�GWP’s�service�territory�lives�in�disadvantaged�communities�per�the�latest�CalEPA�data�and�2017�State�Census.�Disadvantaged�communities�are�mostly�located�near�local�air�pollutants�and�have�large�overlap�with�low�income�communities.�
Glendale�is�proud�of�its�long�history�of�providing�programs�that�specifically�target�its�low�income�customers�for�bill�relief�and�energy�efficiency.�GWP’s�first�low�income�program�started�in�1998�and�GWP�has�spent�approximately�$30�million,�or�30%�of�PBC�revenues,�on�low�income�bill�discount�and�energy�efficiency�programs�since�1998.�Currently,�there�are�a�total�of�12,500�low�income�customers�taking�advantage�of�GWP’s�low�income�programs.�In�FY�2017�18�GWP’s�low�income�program�expenditures�totaled�37%�of�the�overall�PBC�expenditures.�
11 Rates�In�July�2017,�Glendale�Water�and�Power�(GWP)�performed�an�Electric�Cost�of�Service�and�Rate�Design�Study.��As�part�of�this�study,�a�five�year�financial�forecast�including�revenue�requirements,�recommended�debt�issuances,�and�rate�changes�was�developed�from�fiscal�year�(FY)�2019�through�(FY)�2023.��The�goal�was�to�evaluate�and�identify�the�optimal�
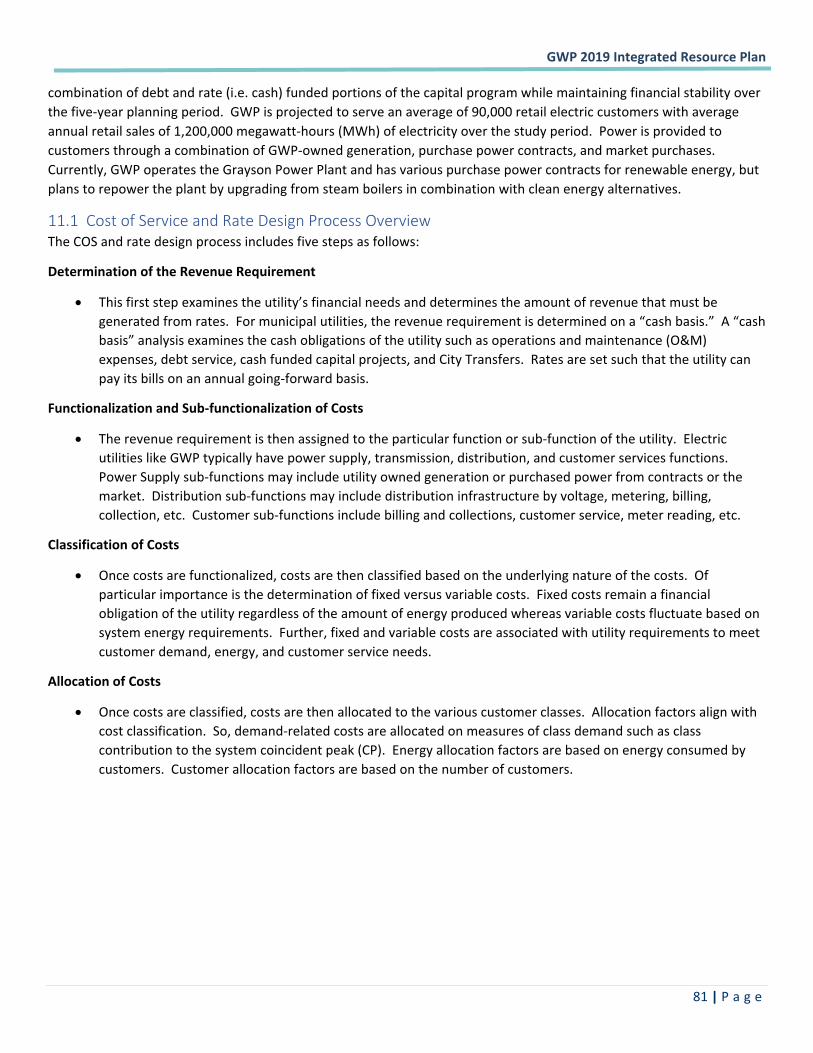
�GWP�2019�Integrated�Resource�Plan��
� �81�|�P a g e �
combination�of�debt�and�rate�(i.e.�cash)�funded�portions�of�the�capital�program�while�maintaining�financial�stability�over�the�five�year�planning�period.��GWP�is�projected�to�serve�an�average�of�90,000�retail�electric�customers�with�average�annual�retail�sales�of�1,200,000�megawatt�hours�(MWh)�of�electricity�over�the�study�period.��Power�is�provided�to�customers�through�a�combination�of�GWP�owned�generation,�purchase�power�contracts,�and�market�purchases.��Currently,�GWP�operates�the�Grayson�Power�Plant�and�has�various�purchase�power�contracts�for�renewable�energy,�but�plans�to�repower�the�plant�by�upgrading�from�steam�boilers�in�combination�with�clean�energy�alternatives.��
11.1 Cost�of�Service�and�Rate�Design�Process�Overview�The�COS�and�rate�design�process�includes�five�steps�as�follows:�
Determination�of�the�Revenue�Requirement�
� This�first�step�examines�the�utility’s�financial�needs�and�determines�the�amount�of�revenue�that�must�be�generated�from�rates.��For�municipal�utilities,�the�revenue�requirement�is�determined�on�a�“cash�basis.”��A�“cash�basis”�analysis�examines�the�cash�obligations�of�the�utility�such�as�operations�and�maintenance�(O&M)�expenses,�debt�service,�cash�funded�capital�projects,�and�City�Transfers.��Rates�are�set�such�that�the�utility�can�pay�its�bills�on�an�annual�going�forward�basis.�
Functionalization�and�Sub�functionalization�of�Costs�
� The�revenue�requirement�is�then�assigned�to�the�particular�function�or�sub�function�of�the�utility.��Electric�utilities�like�GWP�typically�have�power�supply,�transmission,�distribution,�and�customer�services�functions.��Power�Supply�sub�functions�may�include�utility�owned�generation�or�purchased�power�from�contracts�or�the�market.��Distribution�sub�functions�may�include�distribution�infrastructure�by�voltage,�metering,�billing,�collection,�etc.��Customer�sub�functions�include�billing�and�collections,�customer�service,�meter�reading,�etc.�
Classification�of�Costs�
� Once�costs�are�functionalized,�costs�are�then�classified�based�on�the�underlying�nature�of�the�costs.��Of�particular�importance�is�the�determination�of�fixed�versus�variable�costs.��Fixed�costs�remain�a�financial�obligation�of�the�utility�regardless�of�the�amount�of�energy�produced�whereas�variable�costs�fluctuate�based�on�system�energy�requirements.��Further,�fixed�and�variable�costs�are�associated�with�utility�requirements�to�meet�customer�demand,�energy,�and�customer�service�needs.� �
Allocation�of�Costs�
� Once�costs�are�classified,�costs�are�then�allocated�to�the�various�customer�classes.��Allocation�factors�align�with�cost�classification.��So,�demand�related�costs�are�allocated�on�measures�of�class�demand�such�as�class�contribution�to�the�system�coincident�peak�(CP).��Energy�allocation�factors�are�based�on�energy�consumed�by�customers.��Customer�allocation�factors�are�based�on�the�number�of�customers.�
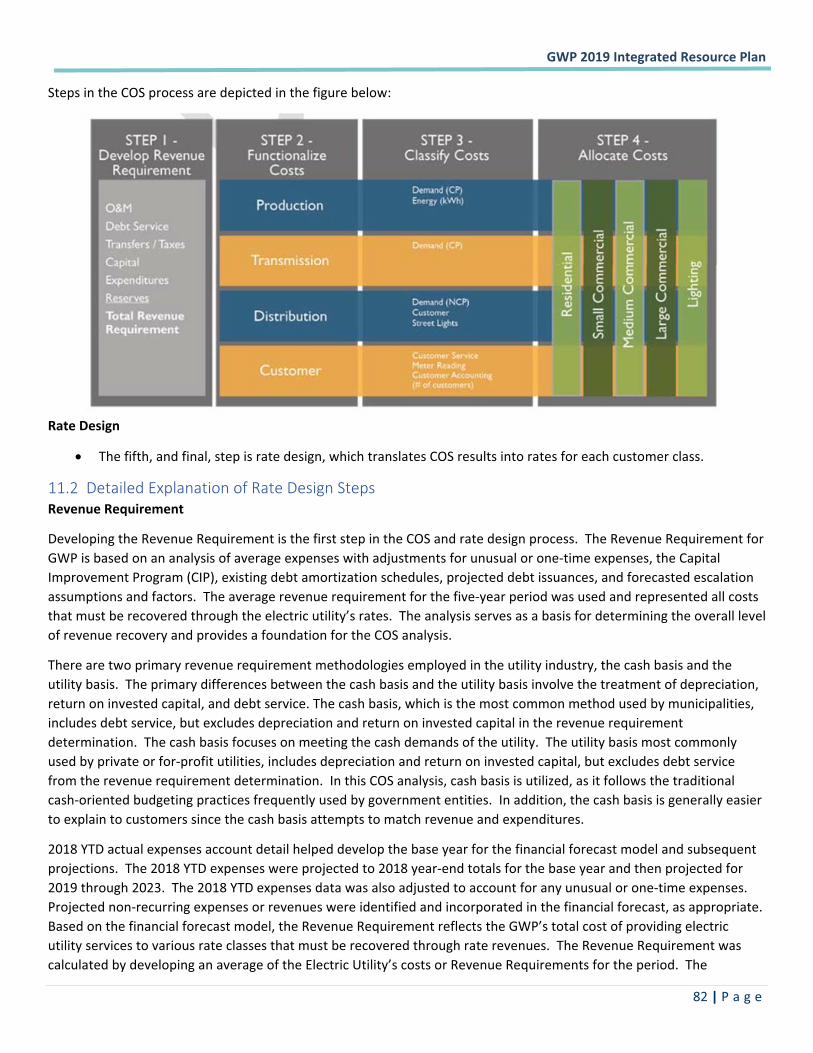
�GWP�2019�Integrated�Resource�Plan��
� �82�|�P a g e �
Steps�in�the�COS�process�are�depicted�in�the�figure�below:�
�
�Rate�Design�
� The�fifth,�and�final,�step�is�rate�design,�which�translates�COS�results�into�rates�for�each�customer�class.�
11.2 Detailed�Explanation�of�Rate�Design�Steps�Revenue�Requirement�
Developing�the�Revenue�Requirement�is�the�first�step�in�the�COS�and�rate�design�process.��The�Revenue�Requirement�for�GWP�is�based�on�an�analysis�of�average�expenses�with�adjustments�for�unusual�or�one�time�expenses,�the�Capital�Improvement�Program�(CIP),�existing�debt�amortization�schedules,�projected�debt�issuances,�and�forecasted�escalation�assumptions�and�factors.��The�average�revenue�requirement�for�the�five�year�period�was�used�and�represented�all�costs�that�must�be�recovered�through�the�electric�utility’s�rates.��The�analysis�serves�as�a�basis�for�determining�the�overall�level�of�revenue�recovery�and�provides�a�foundation�for�the�COS�analysis.�
There�are�two�primary�revenue�requirement�methodologies�employed�in�the�utility�industry,�the�cash�basis�and�the�utility�basis.��The�primary�differences�between�the�cash�basis�and�the�utility�basis�involve�the�treatment�of�depreciation,�return�on�invested�capital,�and�debt�service.�The�cash�basis,�which�is�the�most�common�method�used�by�municipalities,�includes�debt�service,�but�excludes�depreciation�and�return�on�invested�capital�in�the�revenue�requirement�determination.��The�cash�basis�focuses�on�meeting�the�cash�demands�of�the�utility.��The�utility�basis�most�commonly�used�by�private�or�for�profit�utilities,�includes�depreciation�and�return�on�invested�capital,�but�excludes�debt�service�from�the�revenue�requirement�determination.��In�this�COS�analysis,�cash�basis�is�utilized,�as�it�follows�the�traditional�cash�oriented�budgeting�practices�frequently�used�by�government�entities.��In�addition,�the�cash�basis�is�generally�easier�to�explain�to�customers�since�the�cash�basis�attempts�to�match�revenue�and�expenditures.�
2018�YTD�actual�expenses�account�detail�helped�develop�the�base�year�for�the�financial�forecast�model�and�subsequent�projections.��The�2018�YTD�expenses�were�projected�to�2018�year�end�totals�for�the�base�year�and�then�projected�for�2019�through�2023.��The�2018�YTD�expenses�data�was�also�adjusted�to�account�for�any�unusual�or�one�time�expenses.��Projected�non�recurring�expenses�or�revenues�were�identified�and�incorporated�in�the�financial�forecast,�as�appropriate.��Based�on�the�financial�forecast�model,�the�Revenue�Requirement�reflects�the�GWP’s�total�cost�of�providing�electric�utility�services�to�various�rate�classes�that�must�be�recovered�through�rate�revenues.��The�Revenue�Requirement�was�calculated�by�developing�an�average�of�the�Electric�Utility’s�costs�or�Revenue�Requirements�for�the�period.��The�
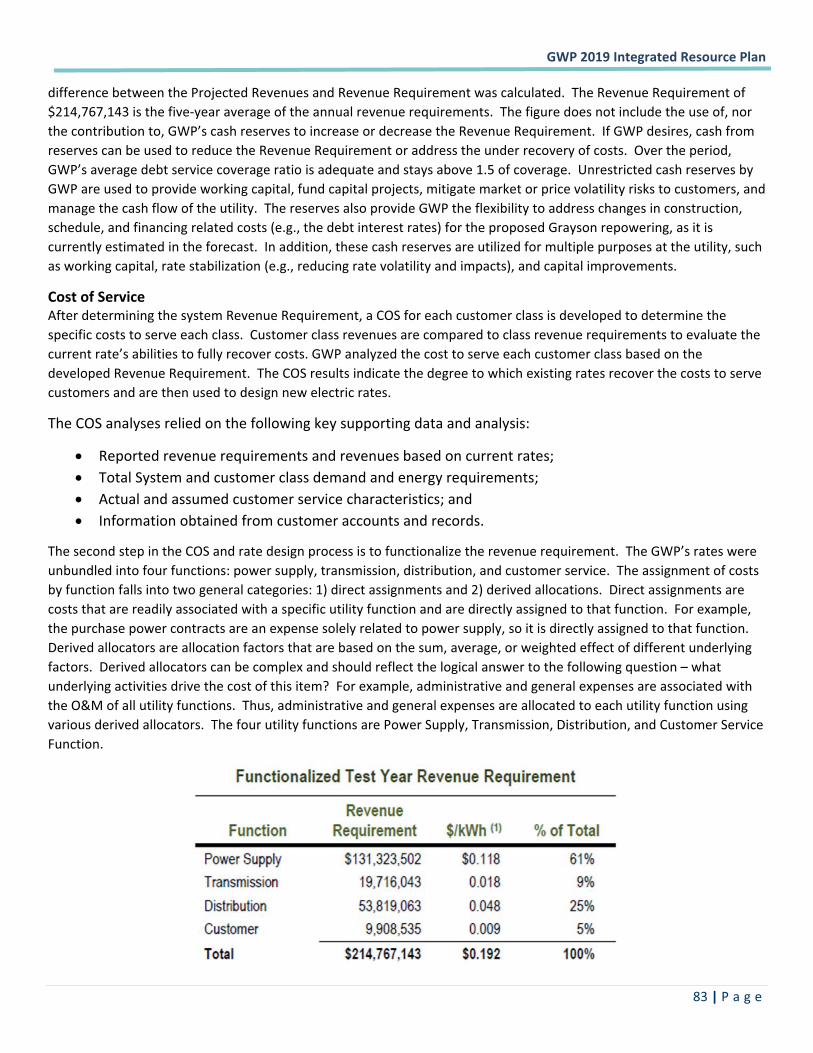
�GWP�2019�Integrated�Resource�Plan��
� �83�|�P a g e �
difference�between�the�Projected�Revenues�and�Revenue�Requirement�was�calculated.��The�Revenue�Requirement�of�$214,767,143�is�the�five�year�average�of�the�annual�revenue�requirements.��The�figure�does�not�include�the�use�of,�nor�the�contribution�to,�GWP’s�cash�reserves�to�increase�or�decrease�the�Revenue�Requirement.��If�GWP�desires,�cash�from�reserves�can�be�used�to�reduce�the�Revenue�Requirement�or�address�the�under�recovery�of�costs.��Over�the�period,�GWP’s�average�debt�service�coverage�ratio�is�adequate�and�stays�above�1.5�of�coverage.��Unrestricted�cash�reserves�by�GWP�are�used�to�provide�working�capital,�fund�capital�projects,�mitigate�market�or�price�volatility�risks�to�customers,�and�manage�the�cash�flow�of�the�utility.��The�reserves�also�provide�GWP�the�flexibility�to�address�changes�in�construction,�schedule,�and�financing�related�costs�(e.g.,�the�debt�interest�rates)�for�the�proposed�Grayson�repowering,�as�it�is�currently�estimated�in�the�forecast.��In�addition,�these�cash�reserves�are�utilized�for�multiple�purposes�at�the�utility,�such�as�working�capital,�rate�stabilization�(e.g.,�reducing�rate�volatility�and�impacts),�and�capital�improvements.�
Cost�of�Service�After�determining�the�system�Revenue�Requirement,�a�COS�for�each�customer�class�is�developed�to�determine�the�specific�costs�to�serve�each�class.��Customer�class�revenues�are�compared�to�class�revenue�requirements�to�evaluate�the�current�rate’s�abilities�to�fully�recover�costs.�GWP�analyzed�the�cost�to�serve�each�customer�class�based�on�the�developed�Revenue�Requirement.��The�COS�results�indicate�the�degree�to�which�existing�rates�recover�the�costs�to�serve�customers�and�are�then�used�to�design�new�electric�rates.�
The�COS�analyses�relied�on�the�following�key�supporting�data�and�analysis:�
� Reported�revenue�requirements�and�revenues�based�on�current�rates;�� Total�System�and�customer�class�demand�and�energy�requirements;�� Actual�and�assumed�customer�service�characteristics;�and�� Information�obtained�from�customer�accounts�and�records.�
The�second�step�in�the�COS�and�rate�design�process�is�to�functionalize�the�revenue�requirement.��The�GWP’s�rates�were�unbundled�into�four�functions:�power�supply,�transmission,�distribution,�and�customer�service.��The�assignment�of�costs�by�function�falls�into�two�general�categories:�1)�direct�assignments�and�2)�derived�allocations.��Direct�assignments�are�costs�that�are�readily�associated�with�a�specific�utility�function�and�are�directly�assigned�to�that�function.��For�example,�the�purchase�power�contracts�are�an�expense�solely�related�to�power�supply,�so�it�is�directly�assigned�to�that�function.��Derived�allocators�are�allocation�factors�that�are�based�on�the�sum,�average,�or�weighted�effect�of�different�underlying�factors.��Derived�allocators�can�be�complex�and�should�reflect�the�logical�answer�to�the�following�question�–�what�underlying�activities�drive�the�cost�of�this�item?��For�example,�administrative�and�general�expenses�are�associated�with�the�O&M�of�all�utility�functions.��Thus,�administrative�and�general�expenses�are�allocated�to�each�utility�function�using�various�derived�allocators.��The�four�utility�functions�are�Power�Supply,�Transmission,�Distribution,�and�Customer�Service�Function.��
��
�GWP�2019�Integrated�Resource�Plan��
� �84�|�P a g e �
Classification�of�Costs�
The�third�step�in�the�COS�and�rate�design�process�is�to�classify�the�functionalized�revenue�requirement.�System�costs�can�be�classified�into�four�generally�accepted�rate�making�cost�classifications:�(1)�demand�or�fixed�costs;�(2)�energy�or�variable�costs;�(3)�customer�related�costs;�and�(4)�directly�assignable�costs.��In�order�to�provide�a�reasonable�basis�for�the�assignment�of�total�revenue�requirements�(costs)�to�each�customer�class,�costs�for�each�function�have�been�analyzed�and�classified�into�four�cost�categories:�Demand,�Energy,�Customer,�and�Direct�Assignment.�
Allocation�of�Costs�
The�fourth�step�in�the�COS�and�rate�design�process�is�to�allocate�the�functionalized,�classified�revenue�requirement�to�the�various�customer�classes.��Customer�classes�represent�aggregations�of�customers�that�have�similar�customer�usage�characteristics�and�use�the�system�in�a�similar�manner.��These�groups�of�customers�have�similar�COS�results,�which�justify�similar�rates.��Based�upon�actual�and�assumed�customer�service�and�consumption�characteristics,�GWP�developed�various�factors�for�use�in�allocating�the�revenue�requirement�to�individual�customer�classes.�These�allocation�factors�reflect�accepted�ratemaking�principles�and�were�based�upon�embedded�cost�allocation�procedures.��Embedded�costs�are�the�total�system�costs�assuming�utility�resources�are�spread�across�all�customers.��Embedded�costs�are�generally�based�on�historical�or�known�costs�such�as�audited�financial�statements�and�budgets.�GWP�developed�demand�related,�energy�related,�customer�related,�and�direct�assignment�allocation�factors.�
Rate�Design�
Rate�design�is�the�culmination�of�a�COS�study�where�the�rates�and�charges�for�each�customer�classification�are�established�in�such�a�manner�that�the�total�revenue�requirement�of�the�utility�will�be�recovered�in�the�most�equitable�and�consistent�manner,�to�the�extent�reasonable�and�practical.��During�rate�design,�consideration�was�given�to�the�recovery�of�fixed�costs�in�the�customer�and�demand�charges,�implications�of�Proposition�26,�as�well�as�phasing�in�the�proposed�rates�over�time.�
In�general,�proposed�and�recommended�rate�structures�should�meet�the�following�objectives�and�best�practices:�
� Rates�should�be�equitable�among�customer�classes�and�individuals�within�classes,�taking�into�consideration�the�costs�incurred�to�serve�each�customer�class;�
� Rates�should�be�designed�to�encourage�the�most�efficient�use�of�the�utility’s�system;�� Rates�may�take�into�consideration�other�important�factors,�such�as�competitive�concerns,�conservation,�GWP�or�
City�Council�policies,�etc.;�� Rates�should�be�simple�and�understandable.�
Rate�design�typically�combines�COS�results�and�policy�considerations�important�to�the�community.��Specific�rate�design�goals�for�GWP�include:�
� Based�on�COS�results,�improve�fixed�cost�recovery;�� Align�rates�with�the�COS�results�between�and�within�classes;�� While�moving�rates�toward�COS,�to�the�extent�possible,�minimize�customer�and�class�adverse�impacts�to�
proposed�rates.�
The�electric�rates�include�a�customer�charge,�energy�charge,�demand�charge�(if�applicable),�Energy�Cost�Adjustment�Charge�(ECAC),�Regulatory�Adjustment�Charge�(RAC),�and�the�Revenue�Decoupling�Charge�(RDC).��The�customer,�energy,�and�demand�charges�are�commonly�referred�to�as�“base�rates,”�while�the�ECAC,�RAC,�and�RDC�are�referred�to�as�pass�through�adjustment�rates.��Rate�Design�also�includes�rates�to�collect�for�additional�revenue�goals.��The�GWP�revenue�adjustments�are�not�applied�equally�to�each�customer�class,�as�the�COS�support�varying�rates�for�each�customer�class,�in�
�GWP�2019�Integrated�Resource�Plan��
� �85�|�P a g e �
order�to�gradually�align�rates�that�are�grandfathered�under�Proposition�26.��Gradual�increases�will�better�align�rates�closer�to�the�COS,�while�minimizing�rate�shock.���
�
Ultimately,�GWP�must�ensure�sufficient�financial�resources�are�available�to�cover�the�cost�of�providing�service�and�funds�needed�for�capital�improvements,�such�as�the�Grayson�Repower�Project.��Such�improvements�will�help�align�GWP�with�State�and�Federal�regulations�such�as�SB�32,�SB�350�and�SB�100,�as�California�moves�towards�reducing�GHG�emissions�and�minimize�the�impacts�of�climate�change.��GWP�will�evaluate�and�minimize�the�impact�to�rates�from�future�projects�as�it�is�GWP’s�primary�goal�is�to�provide�affordable�and�reliable�electric�service�for�its�customers.�
12 Community�Outreach��12.1 Context�and�Introduction�to�Community�Outreach�Process�On�April�10,�2018,�the�City�Council�directed�GWP�to�seek�clean�energy�alternatives�to�the�proposed�262�MW�repowering�of�GPP.�On�May�4,�2018�GWP�issued�a�Request�for�Proposals�for�Local�and�Regional�Renewable,�Low�Carbon,�and�Zero�Carbon�Energy�and�Capacity�Resources�(the�Clean�Energy�RFP).��The�Clean�Energy�RFP�did�not�place�restrictions�on�the�types�of�projects,�processes,�or�methodologies�that�could�be�proposed.��GWP�sought�solutions�that�would�enable�the�utility�to�integrate�the�maximum�amount�of�renewable,�zero�carbon�and/or�low�carbon�energy�and�minimize�the�amount�of�fossil�fuel�generation�in�GWP’s�portfolio.��The�Clean�Energy�RFP�was�open�to�any�technology�type,�and�allowed�for�clean�energy�proposals�as�small�as�1�MW�in�size.�
On�December�18,�2018,�the�Glendale�City�Council�adopted�GWP’s�interim�IRP,�acknowledging�that�GWP�has�undertaken�planning�efforts�for�the�potential�repowering�of�the�Grayson�Power�Plant�(GPP),�but�a�decision�has�not�been�made�as�to�whether,�and�to�what�extent,�GPP�will�be�repowered�and�furthermore,�that�the�proposals�submitted�in�response�to�the�Clean�Energy�RFP�were�still�under�evaluation.�On�December�18,�2018,�the�City�Council�directed�GWP�to�update�the�IRP�in�2019�to�reflect�the�results�of�the�Clean�Energy�RFP.��
To�support�community�engagement�around�the�2019�IRP�process,�GWP�sought�Rocky�Mountain�Institute’s�(RMI’s)�support�in�designing�and�executing�a�series�of�community�workshops,�held�on�April�10,�11,�17,�and�18,�2019,�and�two�focus�groups�held�on�April�1,�2019�and�June�24,�2019.�Acting�as�a�neutral�facilitator,�RMI�convened�170�participants�across�the�five�workshops�that�included�content�presentations,�structured�feedback�sessions,�and�facilitated�small�group�breakout�sessions.�RMI�captured�detailed�notes�for�all�small�group�and�plenary�discussions.���
RMI�also�hosted�two�focus�groups�with�13�participants�that�were�selected�with�input�from�councilmembers.�This�diverse�group�of�participants�represented�residential,�small�business,�environmental,�minority,�government,�large�business,�science�and�financial�groups.�RMI�met�with�this�same�group�once�before�the�IRP�Community�Workshops�and�once�after.�A�summary�report�of�RMI’s�report�on�the�focus�group�and�community�workshops�is�available�as�part�of�Appendix�D.�
In�addition�to�the�IRP�Workshops,�GWP�made�available�on�its�website�an�online�customer�survey�to�gather�customer�feedback�on�the�IRP�Process.�The�survey�was�available�on�GWP’s�website�between�March�8�–�April�22,�2019.�RMI�assisted�in�the�design�of�the�survey�questions�and�the�survey�was�administered�and�tabulated�by�RKS�Research�&�Consulting.���
The�IRP�survey�was�also�available�in�Armenian,�Spanish�and�Korean.�Hard�copies�of�the�survey�were�available�at�the�Community�Workshops�for�those�customers�that�did�not�have�access�to�a�computer.�A�total�of�439�responses�were�received�to�the�IRP�Survey.�Only�GWP�customers�information�was�captured�as�a�valid�response�to�the�survey.�A�GWP�customer�was�defined�as�someone�with�a�valid�account�number�and�a�Glendale�zip�code.�One�customer�account�can�only�take�the�survey�once.�Even�though�account�information�was�requested,�no�identifying�information�was�passed�along�to�GWP.�
�GWP�2019�Integrated�Resource�Plan��
� �86�|�P a g e �
13 The�Road�to�100%�Clean�Energy��Figure�28�shows�that�GWP�can�reduce�GHG�emissions�into�the�range�of�CARB�targets�by�2026�and�stay�approximately�within�this�range�for�several�years�before�emissions�are�driven�up�by�increased�load.�However,�upward�pressure�on�emissions�is�likely�to�increase�past�the�2038�planning�horizon�considered�in�this�IRP,�requiring�additional�consideration�for�how�GWP�will�meet�the�SB�100�target�of�100%�GHG�Free�by�2045.�
GWP�has�run�preliminary�simulations�on�the�proposed�power�plan�extending�out�through�2045�in�order�to�gain�an�understanding�of�what�will�be�required�to�achieve�100%�GHG�free�status37.�Since�it�is�nearly�impossible�to�accurately�simulate�the�market�conditions,�policy�landscape,�or�available�technologies�20+�years�from�now�the�results�of�this�simulation�should�not�be�relied�on�for�any�quantitative�data�or�planning�sensitive�results.�However,�these�results�can�give�an�understanding�of�whether�GWP�is�in�a�position�to�meet�100%�GHG�free�goals�by�2045.�
The�extended�simulation�was�run�by�adding�an�additional�100�MW�/�400�MWh�battery�to�the�resources�proposed�in�this�IRP�in�order�to�provide�sufficient�capacity�for�future�load�growth�but�not�rely�on�unproven�local�renewable�resources�or�additional�transmission.�This�portfolio�tests�whether�GWP�can�bring�in�sufficient�renewable�energy�over�the�Pacific�DC�Intertie�and�SWAC�transmission�lines�to�meet�demand�with�entirely�GHG�free�resources,�which�largely�depends�on�keeping�the�400�MWh�battery�charged�and�able�to�discharge�clean�energy�peak�demand�hours.�The�results�of�the�simulation�can�be�seen�below�in�Figure�38�where�GHG�free�generation�has�been�plotted�against�retail�sales,�demonstrating�that�this�portfolio�is�insufficient�in�meeting�GHG�free�goals,�even�with�the�additional�100�MW/400�MWh�of�battery�storage.�This�is�due�to�the�available�transmission�capacity�limiting�the�amount�of�Generic�RPS�energy�that�can�be�brought�into�Glendale�(both�transmission�lines�were�run�nearly�24x7�at�full�capacity�in�this�study�but�were�still�unable�to�bring�in�sufficient�RPS�energy).�Without�locally�available�renewable�energy�or�increased�transmission�capacity�to�bring�in�non�local�renewables,�GWP�will�be�unable�to�meet�SB�100�GHG�free�targets.�
������������������������������������������������������������37�SB�100�stipulates�that�100%�of�energy�deliveries�to�end�use�customers�must�be�GHG�free�but�does�not�extend�that�requirement�to�100%�of�generated�energy.�This�means�that�the�10�12%�of�energy�that�is�lost�to�transmission,�distribution,�and�general�system�losses�is�not�required�to�be�GHG�free�by�SB�100.�
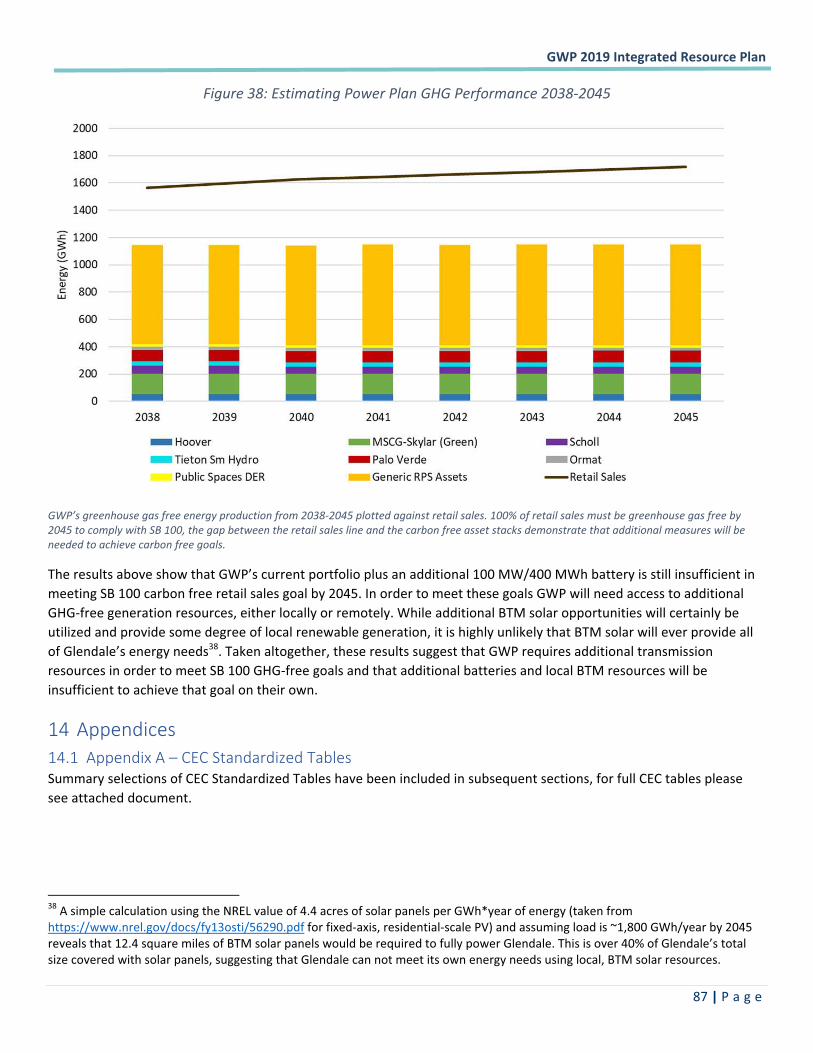
�GWP�2019�Integrated�Resource�Plan��
� �87�|�P a g e �
Figure�38:�Estimating�Power�Plan�GHG�Performance�2038�2045�
�
GWP’s�greenhouse�gas�free�energy�production�from�2038�2045�plotted�against�retail�sales.�100%�of�retail�sales�must�be�greenhouse�gas�free�by�2045�to�comply�with�SB�100,�the�gap�between�the�retail�sales�line�and�the�carbon�free�asset�stacks�demonstrate�that�additional�measures�will�be�needed�to�achieve�carbon�free�goals.��
The�results�above�show�that�GWP’s�current�portfolio�plus�an�additional�100�MW/400�MWh�battery�is�still�insufficient�in�meeting�SB�100�carbon�free�retail�sales�goal�by�2045.�In�order�to�meet�these�goals�GWP�will�need�access�to�additional�GHG�free�generation�resources,�either�locally�or�remotely.�While�additional�BTM�solar�opportunities�will�certainly�be�utilized�and�provide�some�degree�of�local�renewable�generation,�it�is�highly�unlikely�that�BTM�solar�will�ever�provide�all�of�Glendale’s�energy�needs38.�Taken�altogether,�these�results�suggest�that�GWP�requires�additional�transmission�resources�in�order�to�meet�SB�100�GHG�free�goals�and�that�additional�batteries�and�local�BTM�resources�will�be�insufficient�to�achieve�that�goal�on�their�own.�
14 Appendices��14.1 Appendix�A�–�CEC�Standardized�Tables��Summary�selections�of�CEC�Standardized�Tables�have�been�included�in�subsequent�sections,�for�full�CEC�tables�please�see�attached�document.��
������������������������������������������������������������38�A�simple�calculation�using�the�NREL�value�of�4.4�acres�of�solar�panels�per�GWh*year�of�energy�(taken�from�https://www.nrel.gov/docs/fy13osti/56290.pdf�for�fixed�axis,�residential�scale�PV)�and�assuming�load�is�~1,800�GWh/year�by�2045�reveals�that�12.4�square�miles�of�BTM�solar�panels�would�be�required�to�fully�power�Glendale.�This�is�over�40%�of�Glendale’s�total�size�covered�with�solar�panels,�suggesting�that�Glendale�can�not�meet�its�own�energy�needs�using�local,�BTM�solar�resources.�
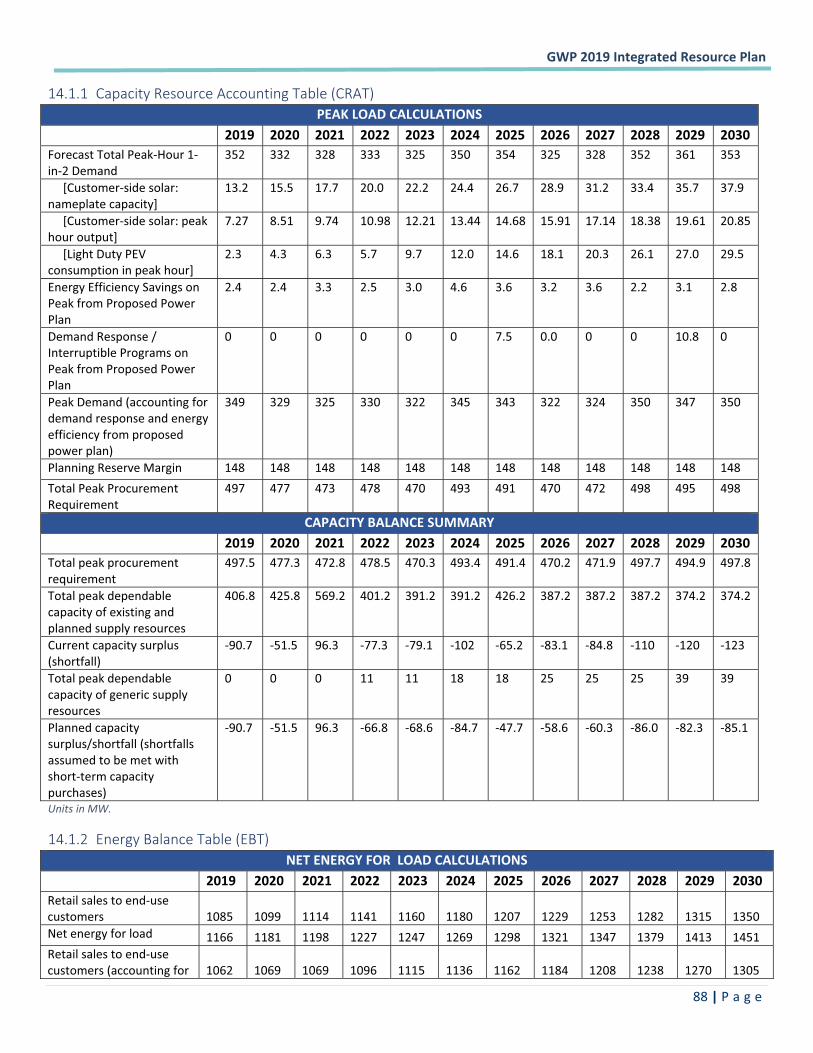
�GWP�2019�Integrated�Resource�Plan��
� �88�|�P a g e �
14.1.1 Capacity�Resource�Accounting�Table�(CRAT)�PEAK�LOAD�CALCULATIONS�
�� 2019� 2020� 2021� 2022� 2023� 2024� 2025� 2026� 2027� 2028� 2029� 2030�Forecast�Total�Peak�Hour�1�in�2�Demand�
352�� 332�� 328� 333� 325� 350� 354� 325� 328�� 352�� 361� 353�
�����[Customer�side�solar:�nameplate�capacity]�
13.2�� 15.5�� 17.7� 20.0� 22.2� 24.4� 26.7� 28.9� 31.2�� 33.4� 35.7� 37.9�
�����[Customer�side�solar:�peak�hour�output]�
7.27�� 8.51�� 9.74� 10.98� 12.21� 13.44� 14.68� 15.91�� 17.14�� 18.38� 19.61� 20.85�
�����[Light�Duty�PEV�consumption�in�peak�hour]�
2.3� 4.3�� 6.3� 5.7� 9.7� 12.0� 14.6� 18.1� 20.3�� 26.1� 27.0� 29.5�
Energy�Efficiency�Savings�on�Peak�from�Proposed�Power�Plan��
2.4� 2.4�� 3.3� 2.5� 3.0� 4.6� 3.6� 3.2� 3.6�� 2.2�� 3.1� 2.8�
Demand�Response�/�Interruptible�Programs�on�Peak�from�Proposed�Power�Plan��
0�� 0�� 0� 0 0 0� 7.5� 0.0� 0�� 0�� 10.8� 0
Peak�Demand�(accounting�for�demand�response�and�energy�efficiency�from�proposed�power�plan)��
349�� 329�� 325� 330� 322� 345� 343� 322� 324�� 350�� 347� 350�
Planning�Reserve�Margin� 148�� 148�� 148� 148� 148� 148� 148� 148� 148�� 148�� 148� 148�Total�Peak�Procurement�Requirement��
497�� 477�� 473� 478� 470� 493� 491� 470� 472�� 498�� 495� 498�
CAPACITY�BALANCE�SUMMARY��� 2019� 2020� 2021� 2022� 2023� 2024� 2025� 2026� 2027� 2028� 2029� 2030�Total�peak�procurement�requirement��
497.5� 477.3� 472.8 478.5 470.3 493.4 491.4 470.2� 471.9� 497.7 494.9 497.8
Total�peak�dependable�capacity�of�existing�and�planned�supply�resources�
406.8� 425.8� 569.2 401.2 391.2 391.2 426.2 387.2� 387.2� 387.2 374.2 374.2
Current�capacity�surplus�(shortfall)�
�90.7� �51.5� 96.3 �77.3 �79.1 �102 �65.2 �83.1 �84.8� �110 �120 �123
Total�peak�dependable�capacity�of�generic�supply�resources�
0�� 0�� 0�� 11� 11� 18� 18� 25� 25�� 25�� 39� 39�
Planned�capacity�surplus/shortfall�(shortfalls�assumed�to�be�met�with�short�term�capacity�purchases)�
�90.7� �51.5� 96.3 �66.8 �68.6 �84.7 �47.7 �58.6 �60.3� �86.0 �82.3 �85.1
Units�in�MW.��
14.1.2 Energy�Balance�Table�(EBT)�NET�ENERGY�FOR��LOAD�CALCULATIONS�
� 2019� 2020� 2021� 2022� 2023� 2024� 2025� 2026� 2027� 2028� 2029� 2030�Retail�sales�to�end�use�customers� 1085� 1099� 1114� 1141� 1160� 1180� 1207� 1229� 1253� 1282� 1315� 1350�Net�energy�for�load� 1166� 1181� 1198� 1227� 1247� 1269� 1298� 1321� 1347� 1379� 1413� 1451�Retail�sales�to�end�use�customers�(accounting�for� 1062� 1069� 1069� 1096� 1115� 1136� 1162� 1184� 1208� 1238� 1270� 1305�
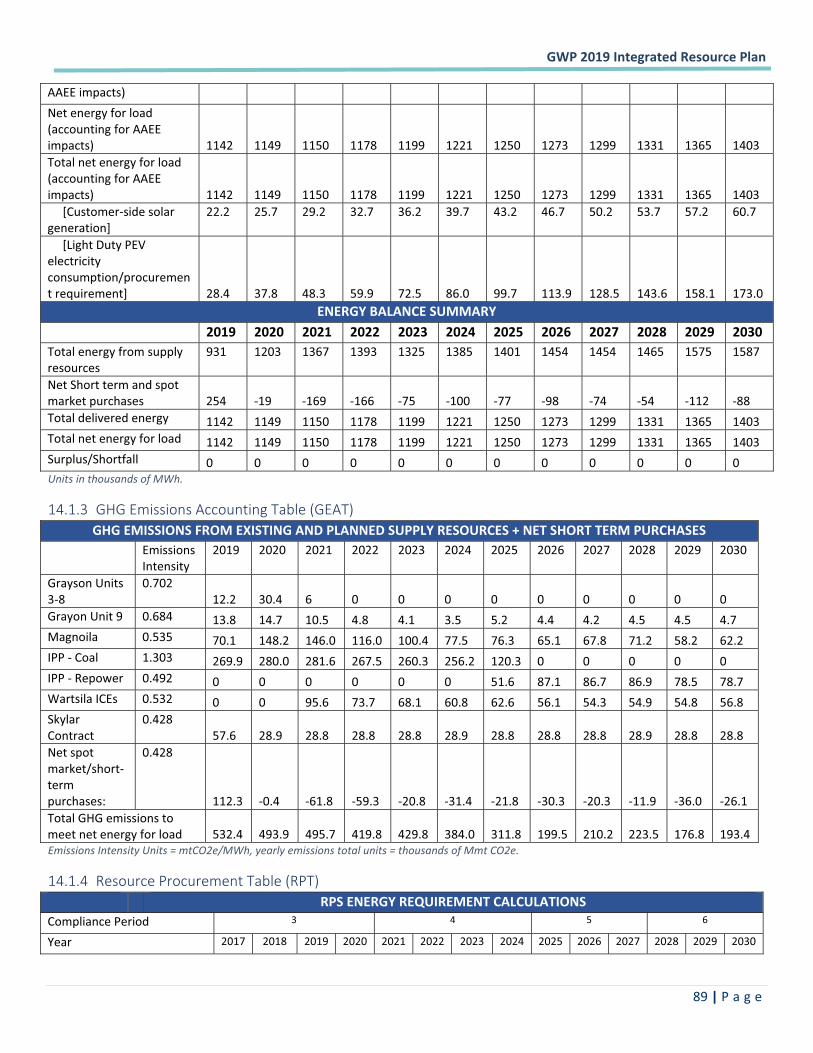
�GWP�2019�Integrated�Resource�Plan��
� �89�|�P a g e �
AAEE�impacts)�Net�energy�for�load�(accounting�for�AAEE�impacts)� 1142� 1149� 1150� 1178� 1199� 1221� 1250� 1273� 1299� 1331� 1365� 1403�Total�net�energy�for�load�(accounting�for�AAEE�impacts)�� 1142� 1149� 1150� 1178� 1199� 1221� 1250� 1273� 1299� 1331� 1365� 1403������[Customer�side�solar�generation]�
22.2� 25.7� 29.2� 32.7 36.2 39.7 43.2 46.7 50.2� 53.7 57.2 60.7
�����[Light�Duty�PEV�electricity�consumption/procurement�requirement]�
��������������28.4��
��������������37.8��
��������������48.3��
�������������59.9��
�������������72.5��
�������������86.0��
�������������99.7��
�������������113.9��
��������������128.5��
��������������143.6��
�������������158.1��
�������������173.0��
ENERGY�BALANCE�SUMMARY�� 2019� 2020� 2021� 2022� 2023� 2024� 2025� 2026� 2027� 2028� 2029� 2030�Total�energy�from�supply�resources��
931� 1203� 1367 1393 1325 1385 1401 1454 1454� 1465 1575 1587
Net�Short�term�and�spot�market�purchases��� 254� �19� �169� �166� �75� �100� �77� �98� �74� �54� �112� �88�Total�delivered�energy� 1142� 1149� 1150� 1178� 1199� 1221� 1250� 1273� 1299� 1331� 1365� 1403�Total�net�energy�for�load� 1142� 1149� 1150� 1178� 1199� 1221� 1250� 1273� 1299� 1331� 1365� 1403�Surplus/Shortfall�� 0� 0� 0� 0� 0� 0� 0� 0� 0� 0� 0� 0�Units�in�thousands�of�MWh.��
14.1.3 GHG�Emissions�Accounting�Table�(GEAT)�GHG�EMISSIONS�FROM�EXISTING�AND�PLANNED�SUPPLY�RESOURCES�+�NET�SHORT�TERM�PURCHASES�
� Emissions�Intensity�
2019� 2020� 2021 2022 2023 2024 2025 2026 2027� 2028 2029 2030
Grayson�Units�3�8��
0.702��12.2� 30.4� 6� 0� 0� 0� 0� 0� 0� 0� 0� 0�
Grayon�Unit�9�� 0.684�� 13.8� 14.7� 10.5� 4.8� 4.1� 3.5� 5.2� 4.4� 4.2� 4.5� 4.5� 4.7�Magnoila� 0.535�� 70.1� 148.2� 146.0� 116.0� 100.4� 77.5� 76.3� 65.1� 67.8� 71.2� 58.2� 62.2�IPP���Coal� 1.303�� 269.9� 280.0� 281.6� 267.5� 260.3� 256.2� 120.3� 0� 0� 0� 0� 0�IPP���Repower�� 0.492�� 0� 0� 0� 0� 0� 0� 51.6� 87.1� 86.7� 86.9� 78.5� 78.7�Wartsila�ICEs�� 0.532�� 0� 0� 95.6� 73.7� 68.1� 60.8� 62.6� 56.1� 54.3� 54.9� 54.8� 56.8�Skylar�Contract�
0.428�57.6� 28.9� 28.8� 28.8� 28.8� 28.9� 28.8� 28.8� 28.8� 28.9� 28.8� 28.8�
Net�spot�market/short�term�purchases:�
0.428�
112.3� �0.4� �61.8� �59.3� �20.8� �31.4� �21.8� �30.3� �20.3� �11.9� �36.0� �26.1�Total�GHG�emissions�to�meet�net�energy�for�load�� 532.4� 493.9� 495.7� 419.8� 429.8� 384.0� 311.8� 199.5� 210.2� 223.5� 176.8� 193.4�Emissions�Intensity�Units�=�mtCO2e/MWh,�yearly�emissions�total�units�=�thousands�of�Mmt�CO2e.��
14.1.4 Resource�Procurement�Table�(RPT)�� � RPS�ENERGY�REQUIREMENT�CALCULATIONS�
Compliance�Period� 3� 4 5� 6
Year� 2017� 2018� 2019� 2020� 2021� 2022� 2023� 2024� 2025� 2026� 2027� 2028� 2029� 2030�
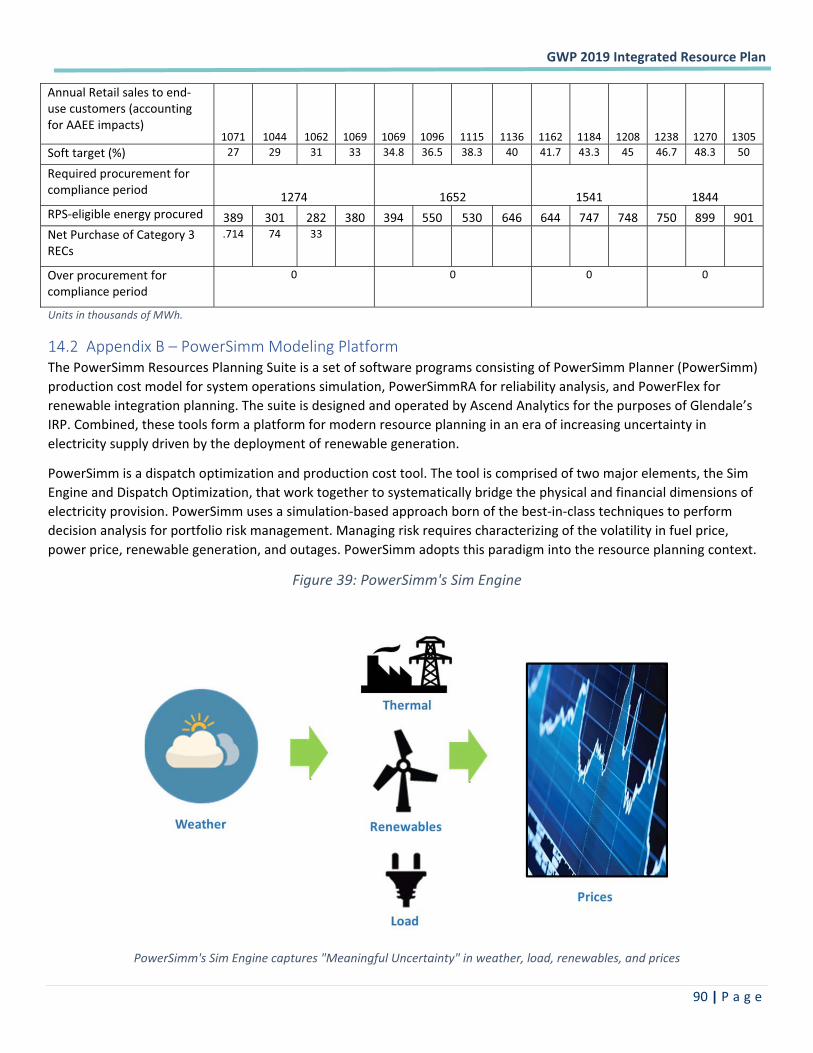
�GWP�2019�Integrated�Resource�Plan��
� �90�|�P a g e �
Annual�Retail�sales�to�end�use�customers�(accounting�for�AAEE�impacts)��
1071� 1044� 1062� 1069� 1069� 1096� 1115� 1136� 1162� 1184� 1208� 1238� 1270� 1305�Soft�target�(%)� 27� 29� 31� 33� 34.8� 36.5� 38.3� 40� 41.7� 43.3� 45� 46.7� 48.3� 50�
Required�procurement�for�compliance�period� 1274� 1652� 1541� 1844�RPS�eligible�energy�procured� 389� 301� 282� 380� 394� 550� 530� 646� 644� 747� 748� 750� 899� 901�Net�Purchase�of�Category�3�RECs�
.714� 74� 33� � � � � � � � � � � �
Over�procurement�for�compliance�period��
0� 0� 0� 0�
Units�in�thousands�of�MWh.��
14.2 Appendix�B�–�PowerSimm�Modeling�Platform��The�PowerSimm�Resources�Planning�Suite�is�a�set�of�software�programs�consisting�of�PowerSimm�Planner�(PowerSimm)�production�cost�model�for�system�operations�simulation,�PowerSimmRA�for�reliability�analysis,�and�PowerFlex�for�renewable�integration�planning.�The�suite�is�designed�and�operated�by�Ascend�Analytics�for�the�purposes�of�Glendale’s�IRP.�Combined,�these�tools�form�a�platform�for�modern�resource�planning�in�an�era�of�increasing�uncertainty�in�electricity�supply�driven�by�the�deployment�of�renewable�generation.��
PowerSimm�is�a�dispatch�optimization�and�production�cost�tool.�The�tool�is�comprised�of�two�major�elements,�the�Sim�Engine�and�Dispatch�Optimization,�that�work�together�to�systematically�bridge�the�physical�and�financial�dimensions�of�electricity�provision.�PowerSimm�uses�a�simulation�based�approach�born�of�the�best�in�class�techniques�to�perform�decision�analysis�for�portfolio�risk�management.�Managing�risk�requires�characterizing�of�the�volatility�in�fuel�price,�power�price,�renewable�generation,�and�outages.�PowerSimm�adopts�this�paradigm�into�the�resource�planning�context.��
Figure�39:�PowerSimm's�Sim�Engine��
�
PowerSimm's�Sim�Engine�captures�"Meaningful�Uncertainty"�in�weather,�load,�renewables,�and�prices�
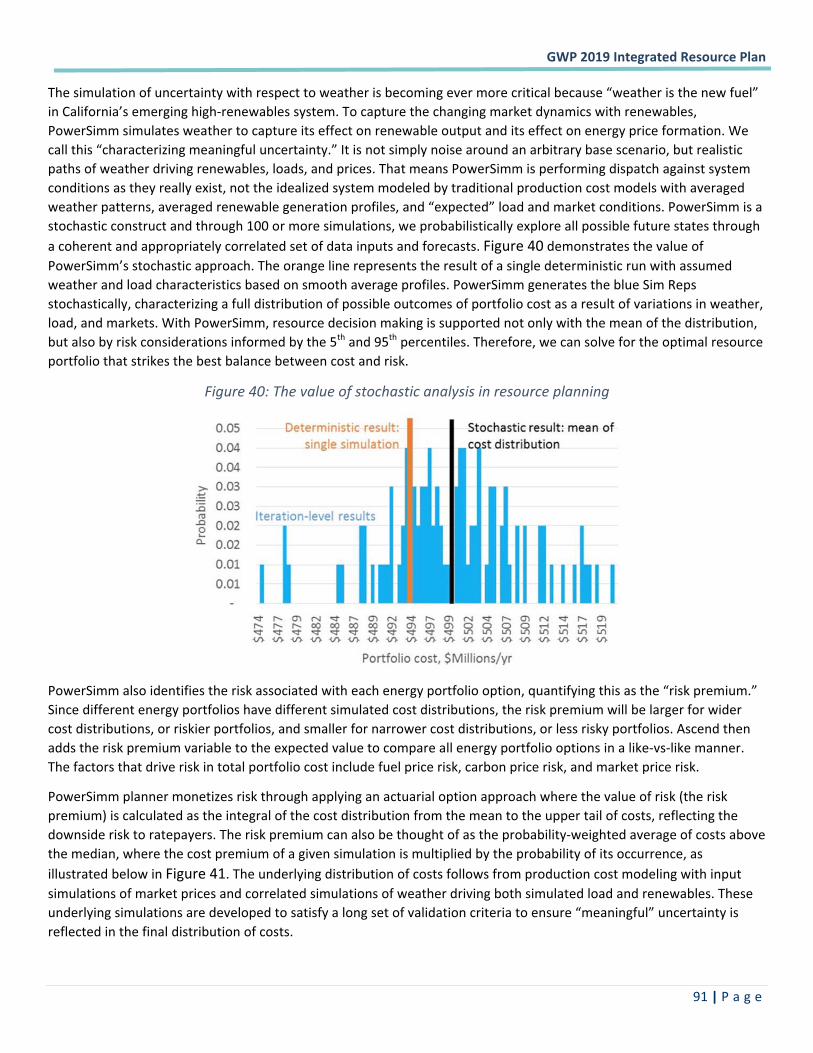
�GWP�2019�Integrated�Resource�Plan��
� �91�|�P a g e �
The�simulation�of�uncertainty�with�respect�to�weather�is�becoming�ever�more�critical�because�“weather�is�the�new�fuel”�in�California’s�emerging�high�renewables�system.�To�capture�the�changing�market�dynamics�with�renewables,�PowerSimm�simulates�weather�to�capture�its�effect�on�renewable�output�and�its�effect�on�energy�price�formation.�We�call�this�“characterizing�meaningful�uncertainty.”�It�is�not�simply�noise�around�an�arbitrary�base�scenario,�but�realistic�paths�of�weather�driving�renewables,�loads,�and�prices.�That�means�PowerSimm�is�performing�dispatch�against�system�conditions�as�they�really�exist,�not�the�idealized�system�modeled�by�traditional�production�cost�models�with�averaged�weather�patterns,�averaged�renewable�generation�profiles,�and�“expected”�load�and�market�conditions.�PowerSimm�is�a�stochastic�construct�and�through�100�or�more�simulations,�we�probabilistically�explore�all�possible�future�states�through�a�coherent�and�appropriately�correlated�set�of�data�inputs�and�forecasts.�Figure�40�demonstrates�the�value�of�PowerSimm’s�stochastic�approach.�The�orange�line�represents�the�result�of�a�single�deterministic�run�with�assumed�weather�and�load�characteristics�based�on�smooth�average�profiles.�PowerSimm�generates�the�blue�Sim�Reps�stochastically,�characterizing�a�full�distribution�of�possible�outcomes�of�portfolio�cost�as�a�result�of�variations�in�weather,�load,�and�markets.�With�PowerSimm,�resource�decision�making�is�supported�not�only�with�the�mean�of�the�distribution,�but�also�by�risk�considerations�informed�by�the�5th�and�95th�percentiles.�Therefore,�we�can�solve�for�the�optimal�resource�portfolio�that�strikes�the�best�balance�between�cost�and�risk.��
Figure�40:�The�value�of�stochastic�analysis�in�resource�planning�
�
PowerSimm�also�identifies�the�risk�associated�with�each�energy�portfolio�option,�quantifying�this�as�the�“risk�premium.”�Since�different�energy�portfolios�have�different�simulated�cost�distributions,�the�risk�premium�will�be�larger�for�wider�cost�distributions,�or�riskier�portfolios,�and�smaller�for�narrower�cost�distributions,�or�less�risky�portfolios.�Ascend�then�adds�the�risk�premium�variable�to�the�expected�value�to�compare�all�energy�portfolio�options�in�a�like�vs�like�manner.�The�factors�that�drive�risk�in�total�portfolio�cost�include�fuel�price�risk,�carbon�price�risk,�and�market�price�risk.��
PowerSimm�planner�monetizes�risk�through�applying�an�actuarial�option�approach�where�the�value�of�risk�(the�risk�premium)�is�calculated�as�the�integral�of�the�cost�distribution�from�the�mean�to�the�upper�tail�of�costs,�reflecting�the�downside�risk�to�ratepayers.�The�risk�premium�can�also�be�thought�of�as�the�probability�weighted�average�of�costs�above�the�median,�where�the�cost�premium�of�a�given�simulation�is�multiplied�by�the�probability�of�its�occurrence,�as�illustrated�below�in�Figure�41.�The�underlying�distribution�of�costs�follows�from�production�cost�modeling�with�input�simulations�of�market�prices�and�correlated�simulations�of�weather�driving�both�simulated�load�and�renewables.�These�underlying�simulations�are�developed�to�satisfy�a�long�set�of�validation�criteria�to�ensure�“meaningful”�uncertainty�is�reflected�in�the�final�distribution�of�costs.�
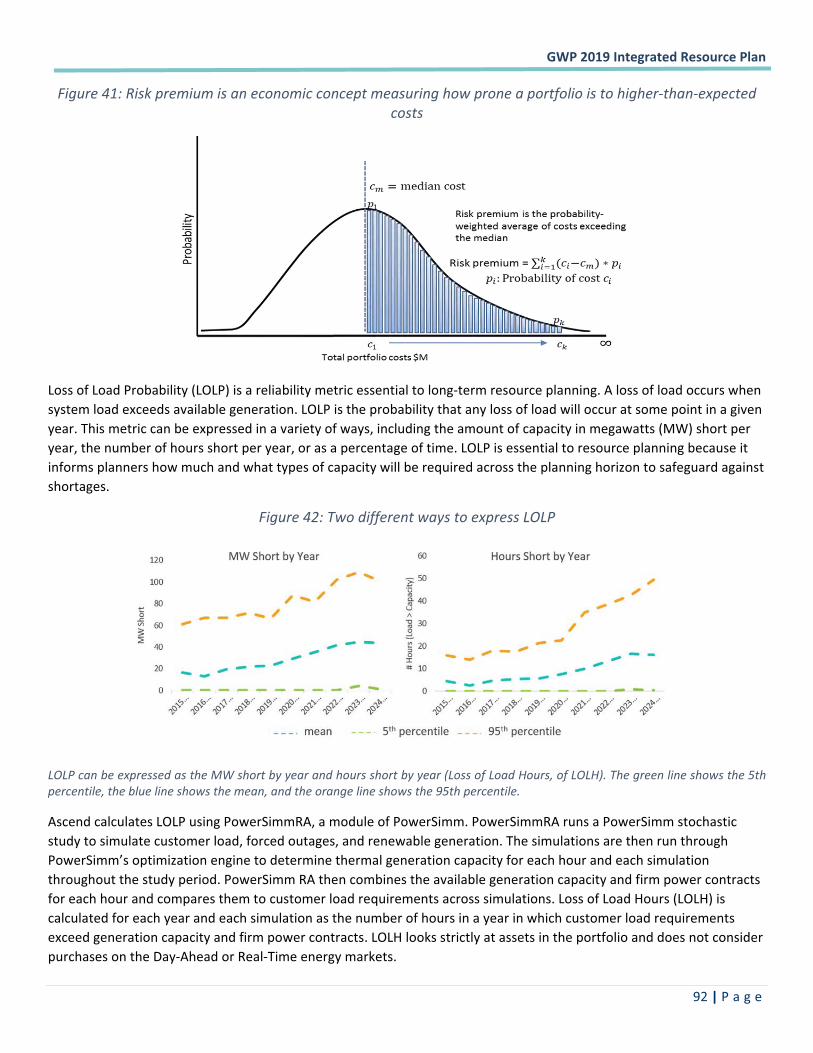
�GWP�2019�Integrated�Resource�Plan��
� �92�|�P a g e �
Figure�41:�Risk�premium�is�an�economic�concept�measuring�how�prone�a�portfolio�is�to�higher�than�expected�costs�
�
Loss�of�Load�Probability�(LOLP)�is�a�reliability�metric�essential�to�long�term�resource�planning.�A�loss�of�load�occurs�when�system�load�exceeds�available�generation.�LOLP�is�the�probability�that�any�loss�of�load�will�occur�at�some�point�in�a�given�year.�This�metric�can�be�expressed�in�a�variety�of�ways,�including�the�amount�of�capacity�in�megawatts�(MW)�short�per�year,�the�number�of�hours�short�per�year,�or�as�a�percentage�of�time.�LOLP�is�essential�to�resource�planning�because�it�informs�planners�how�much�and�what�types�of�capacity�will�be�required�across�the�planning�horizon�to�safeguard�against�shortages.��
Figure�42:�Two�different�ways�to�express�LOLP�
�
LOLP�can�be�expressed�as�the�MW�short�by�year�and�hours�short�by�year�(Loss�of�Load�Hours,�of�LOLH).�The�green�line�shows�the�5th�percentile,�the�blue�line�shows�the�mean,�and�the�orange�line�shows�the�95th�percentile.�
Ascend�calculates�LOLP�using�PowerSimmRA,�a�module�of�PowerSimm.�PowerSimmRA�runs�a�PowerSimm�stochastic�study�to�simulate�customer�load,�forced�outages,�and�renewable�generation.�The�simulations�are�then�run�through�PowerSimm’s�optimization�engine�to�determine�thermal�generation�capacity�for�each�hour�and�each�simulation�throughout�the�study�period.�PowerSimm�RA�then�combines�the�available�generation�capacity�and�firm�power�contracts�for�each�hour�and�compares�them�to�customer�load�requirements�across�simulations.�Loss�of�Load�Hours�(LOLH)�is�calculated�for�each�year�and�each�simulation�as�the�number�of�hours�in�a�year�in�which�customer�load�requirements�exceed�generation�capacity�and�firm�power�contracts.�LOLH�looks�strictly�at�assets�in�the�portfolio�and�does�not�consider�purchases�on�the�Day�Ahead�or�Real�Time�energy�markets.��
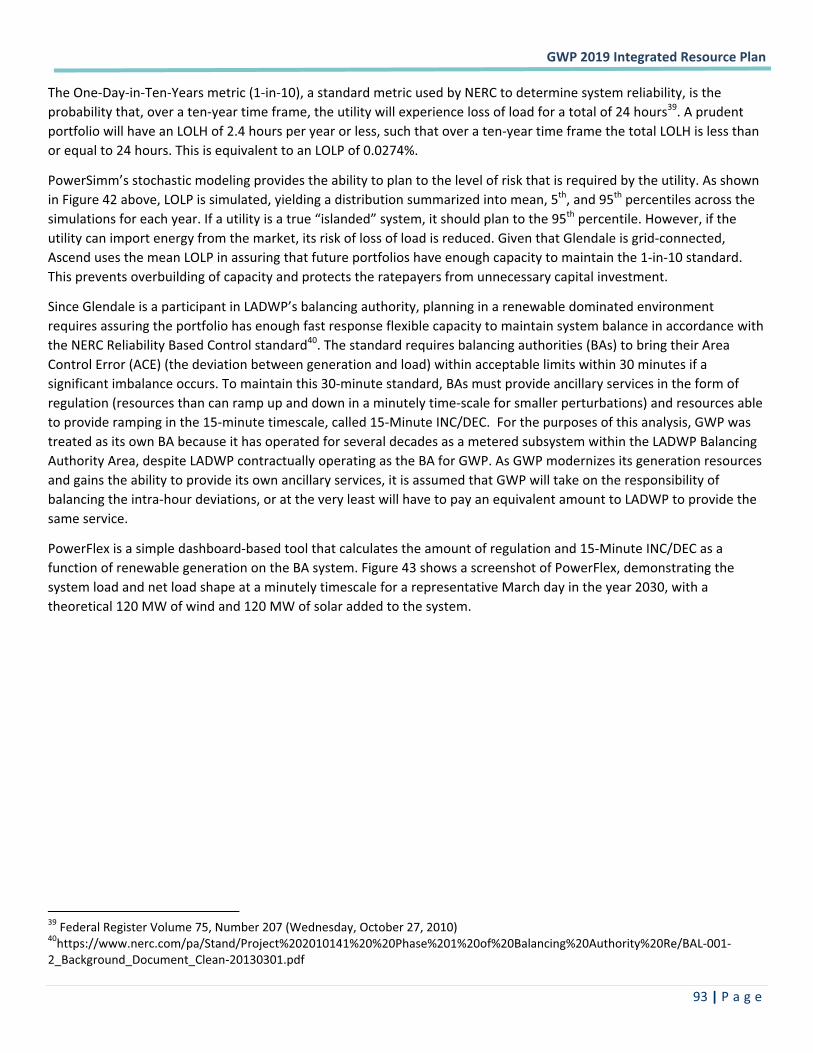
�GWP�2019�Integrated�Resource�Plan��
� �93�|�P a g e �
The�One�Day�in�Ten�Years�metric�(1�in�10),�a�standard�metric�used�by�NERC�to�determine�system�reliability,�is�the�probability�that,�over�a�ten�year�time�frame,�the�utility�will�experience�loss�of�load�for�a�total�of�24�hours39.�A�prudent�portfolio�will�have�an�LOLH�of�2.4�hours�per�year�or�less,�such�that�over�a�ten�year�time�frame�the�total�LOLH�is�less�than�or�equal�to�24�hours.�This�is�equivalent�to�an�LOLP�of�0.0274%.�
PowerSimm’s�stochastic�modeling�provides�the�ability�to�plan�to�the�level�of�risk�that�is�required�by�the�utility.�As�shown�in�Figure�42�above,�LOLP�is�simulated,�yielding�a�distribution�summarized�into�mean,�5th,�and�95th�percentiles�across�the�simulations�for�each�year.�If�a�utility�is�a�true�“islanded”�system,�it�should�plan�to�the�95th�percentile.�However,�if�the�utility�can�import�energy�from�the�market,�its�risk�of�loss�of�load�is�reduced.�Given�that�Glendale�is�grid�connected,�Ascend�uses�the�mean�LOLP�in�assuring�that�future�portfolios�have�enough�capacity�to�maintain�the�1�in�10�standard.�This�prevents�overbuilding�of�capacity�and�protects�the�ratepayers�from�unnecessary�capital�investment.��
Since�Glendale�is�a�participant�in�LADWP’s�balancing�authority,�planning�in�a�renewable�dominated�environment�requires�assuring�the�portfolio�has�enough�fast�response�flexible�capacity�to�maintain�system�balance�in�accordance�with�the�NERC�Reliability�Based�Control�standard40.�The�standard�requires�balancing�authorities�(BAs)�to�bring�their�Area�Control�Error�(ACE)�(the�deviation�between�generation�and�load)�within�acceptable�limits�within�30�minutes�if�a�significant�imbalance�occurs.�To�maintain�this�30�minute�standard,�BAs�must�provide�ancillary�services�in�the�form�of�regulation�(resources�than�can�ramp�up�and�down�in�a�minutely�time�scale�for�smaller�perturbations)�and�resources�able�to�provide�ramping�in�the�15�minute�timescale,�called�15�Minute�INC/DEC.��For�the�purposes�of�this�analysis,�GWP�was�treated�as�its�own�BA�because�it�has�operated�for�several�decades�as�a�metered�subsystem�within�the�LADWP�Balancing�Authority�Area,�despite�LADWP�contractually�operating�as�the�BA�for�GWP.�As�GWP�modernizes�its�generation�resources�and�gains�the�ability�to�provide�its�own�ancillary�services,�it�is�assumed�that�GWP�will�take�on�the�responsibility�of�balancing�the�intra�hour�deviations,�or�at�the�very�least�will�have�to�pay�an�equivalent�amount�to�LADWP�to�provide�the�same�service.�
PowerFlex�is�a�simple�dashboard�based�tool�that�calculates�the�amount�of�regulation�and�15�Minute�INC/DEC�as�a�function�of�renewable�generation�on�the�BA�system.�Figure�43�shows�a�screenshot�of�PowerFlex,�demonstrating�the�system�load�and�net�load�shape�at�a�minutely�timescale�for�a�representative�March�day�in�the�year�2030,�with�a�theoretical�120�MW�of�wind�and�120�MW�of�solar�added�to�the�system.��
������������������������������������������������������������39�Federal�Register�Volume�75,�Number�207�(Wednesday,�October�27,�2010)�40https://www.nerc.com/pa/Stand/Project%202010141%20%20Phase%201%20of%20Balancing%20Authority%20Re/BAL�001�2_Background_Document_Clean�20130301.pdf�
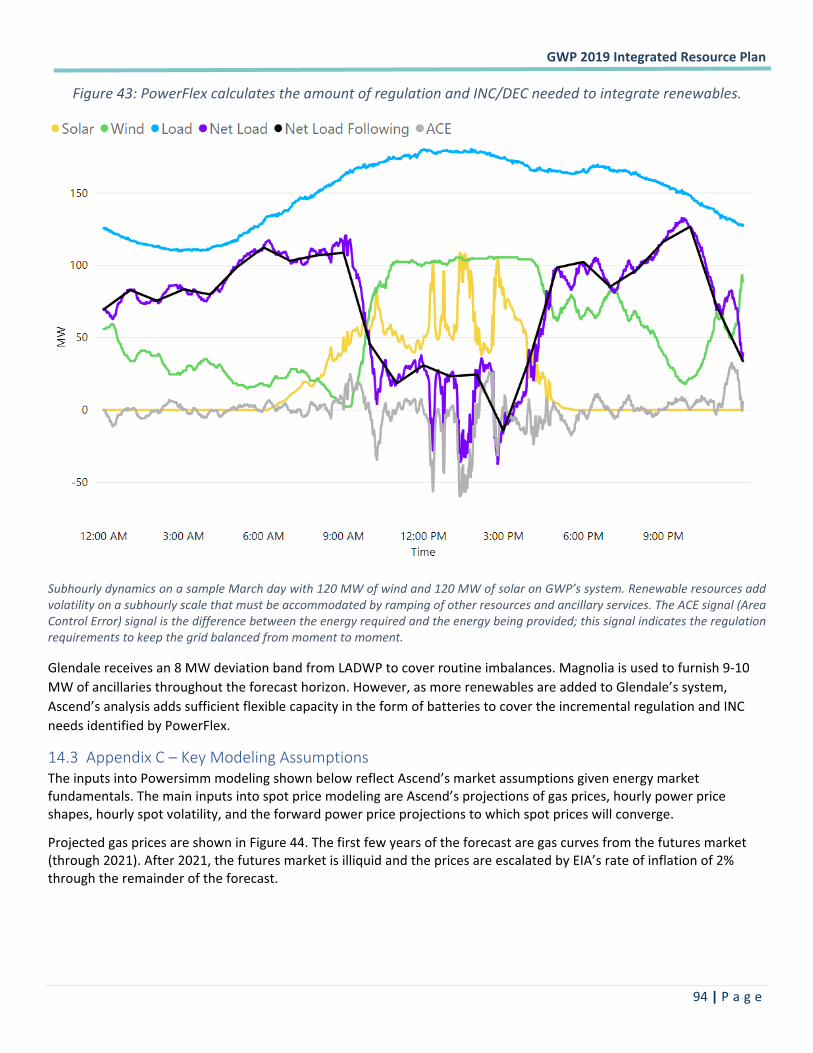
�GWP�2019�Integrated�Resource�Plan��
� �94�|�P a g e �
Figure�43:�PowerFlex�calculates�the�amount�of�regulation�and�INC/DEC�needed�to�integrate�renewables.�
�
Subhourly�dynamics�on�a�sample�March�day�with�120�MW�of�wind�and�120�MW�of�solar�on�GWP’s�system.�Renewable�resources�add�volatility�on�a�subhourly�scale�that�must�be�accommodated�by�ramping�of�other�resources�and�ancillary�services.�The�ACE�signal�(Area�Control�Error)�signal�is�the�difference�between�the�energy�required�and�the�energy�being�provided;�this�signal�indicates�the�regulation�requirements�to�keep�the�grid�balanced�from�moment�to�moment.�
Glendale�receives�an�8�MW�deviation�band�from�LADWP�to�cover�routine�imbalances.�Magnolia�is�used�to�furnish�9�10�MW�of�ancillaries�throughout�the�forecast�horizon.�However,�as�more�renewables�are�added�to�Glendale’s�system,�Ascend’s�analysis�adds�sufficient�flexible�capacity�in�the�form�of�batteries�to�cover�the�incremental�regulation�and�INC�needs�identified�by�PowerFlex.���
14.3 Appendix�C�–�Key�Modeling�Assumptions�The�inputs�into�Powersimm�modeling�shown�below�reflect�Ascend’s�market�assumptions�given�energy�market�fundamentals.�The�main�inputs�into�spot�price�modeling�are�Ascend’s�projections�of�gas�prices,�hourly�power�price�shapes,�hourly�spot�volatility,�and�the�forward�power�price�projections�to�which�spot�prices�will�converge.���
Projected�gas�prices�are�shown�in�Figure�44.�The�first�few�years�of�the�forecast�are�gas�curves�from�the�futures�market�(through�2021).�After�2021,�the�futures�market�is�illiquid�and�the�prices�are�escalated�by�EIA’s�rate�of�inflation�of�2%�through�the�remainder�of�the�forecast.��
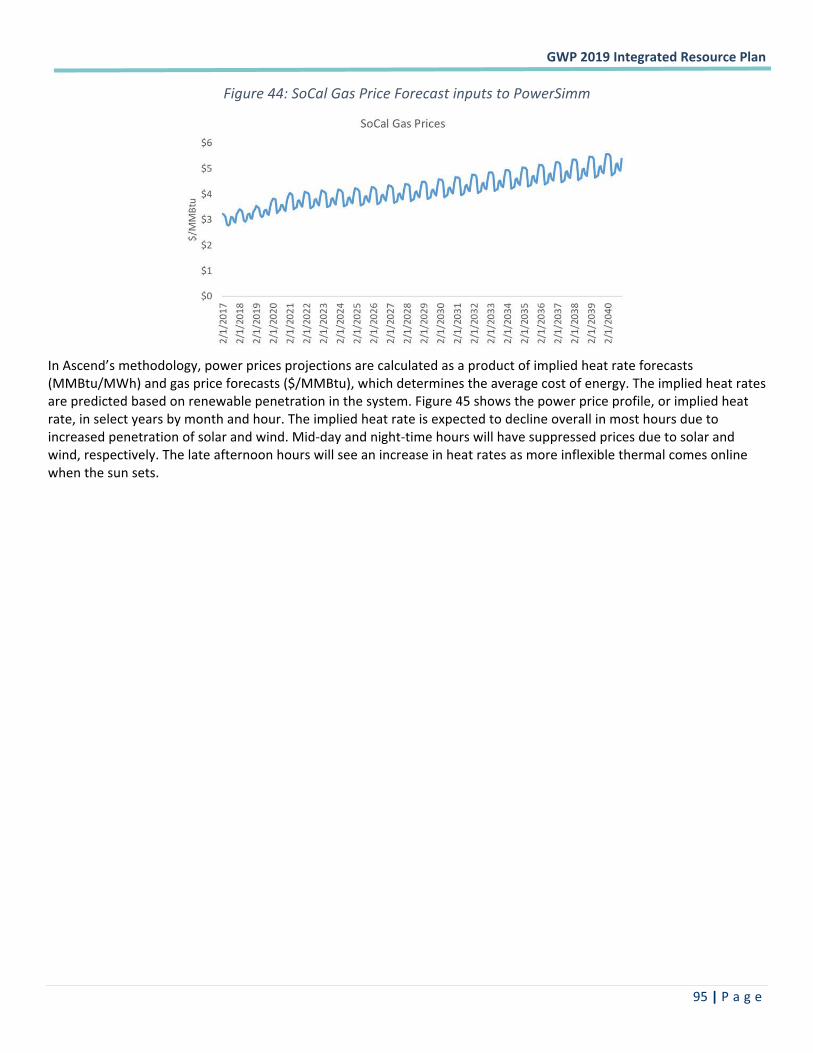
�GWP�2019�Integrated�Resource�Plan��
� �95�|�P a g e �
Figure�44:�SoCal�Gas�Price�Forecast�inputs�to�PowerSimm�
�
In�Ascend’s�methodology,�power�prices�projections�are�calculated�as�a�product�of�implied�heat�rate�forecasts�(MMBtu/MWh)�and�gas�price�forecasts�($/MMBtu),�which�determines�the�average�cost�of�energy.�The�implied�heat�rates�are�predicted�based�on�renewable�penetration�in�the�system.�Figure�45�shows�the�power�price�profile,�or�implied�heat�rate,�in�select�years�by�month�and�hour.�The�implied�heat�rate�is�expected�to�decline�overall�in�most�hours�due�to�increased�penetration�of�solar�and�wind.�Mid�day�and�night�time�hours�will�have�suppressed�prices�due�to�solar�and�wind,�respectively.�The�late�afternoon�hours�will�see�an�increase�in�heat�rates�as�more�inflexible�thermal�comes�online�when�the�sun�sets.��
�GWP�2019�Integrated�Resource�Plan��
� �96�|�P a g e �
Figure�45:�Implied�Heat�rates�for�2020,�2025,�2030,�2035�declining�over�time�with�greater�renewable�penetration�
�
The�implied�heat�rates�are�forecasted�by�seasonal,�day�of�week,�and�hour.�This�accounts�for�on�peak�and�off�peak�profiles,�as�well�as�seasonality.�Projected�implied�heat�rates�in�2022�and�after�are�multiplied�by�the�monthly�gas�prices�in�2022�and�after�to�forecast�out�power�prices�in�2022�onwards,�seen�in�Figure�46�below.�Intercontinental�Exchange�(ICE)�forward�curves�are�used�for�the�first�few�years�(through�2021),�until�the�market�is�illiquid.��
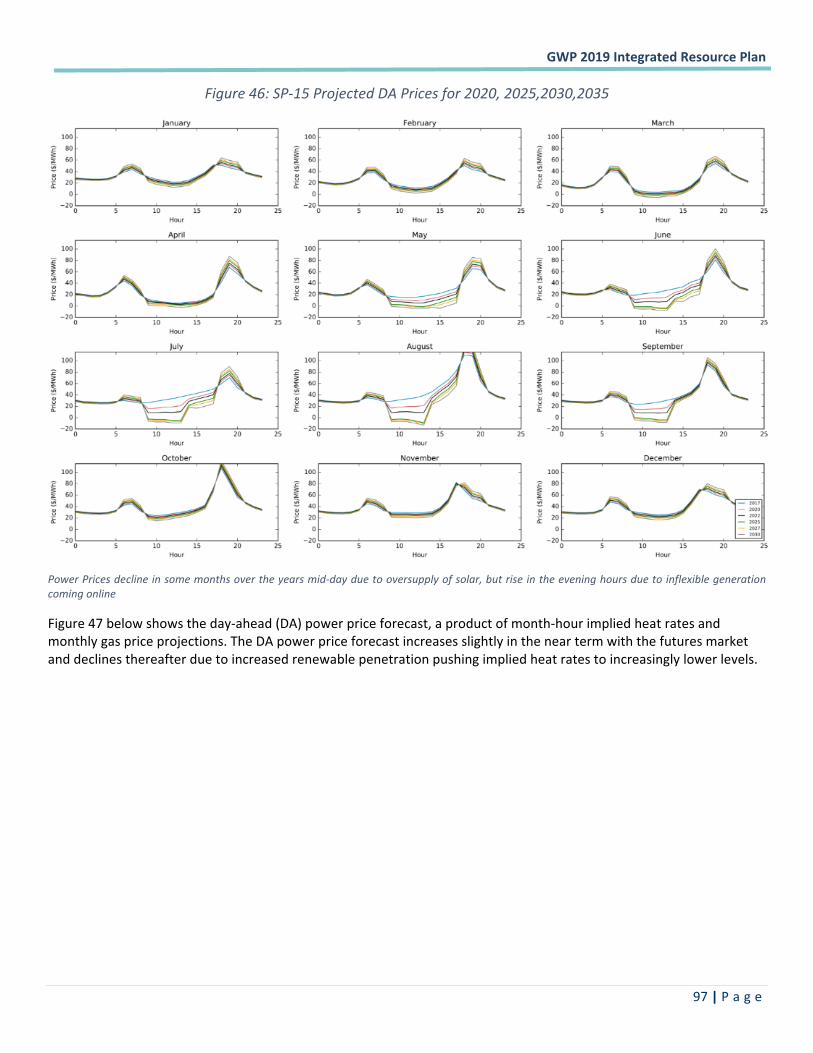
�GWP�2019�Integrated�Resource�Plan��
� �97�|�P a g e �
Figure�46:�SP�15�Projected�DA�Prices�for�2020,�2025,2030,2035�
�Power�Prices�decline�in�some�months�over�the�years�mid�day�due�to�oversupply�of�solar,�but�rise�in�the�evening�hours�due�to�inflexible�generation�coming�online�
Figure�47�below�shows�the�day�ahead�(DA)�power�price�forecast,�a�product�of�month�hour�implied�heat�rates�and�monthly�gas�price�projections.�The�DA�power�price�forecast�increases�slightly�in�the�near�term�with�the�futures�market�and�declines�thereafter�due�to�increased�renewable�penetration�pushing�implied�heat�rates�to�increasingly�lower�levels.��
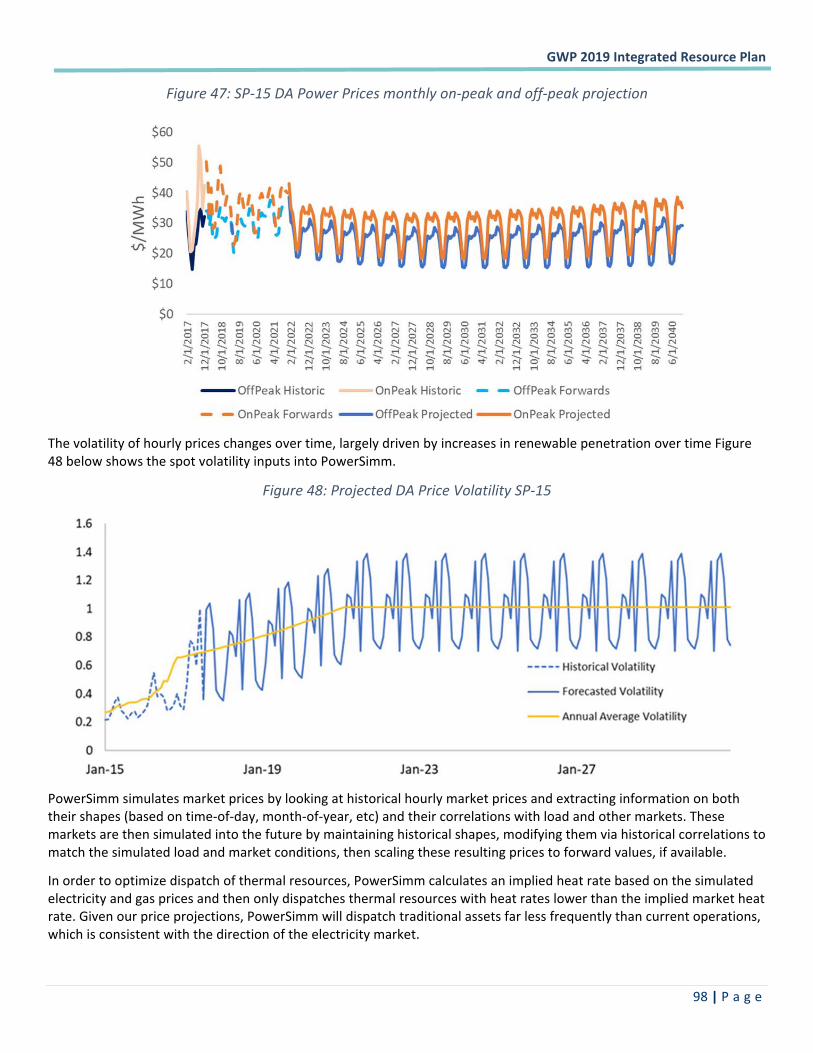
�GWP�2019�Integrated�Resource�Plan��
� �98�|�P a g e �
Figure�47:�SP�15�DA�Power�Prices�monthly�on�peak�and�off�peak�projection�
�
The�volatility�of�hourly�prices�changes�over�time,�largely�driven�by�increases�in�renewable�penetration�over�time�Figure�48�below�shows�the�spot�volatility�inputs�into�PowerSimm.�
Figure�48:�Projected�DA�Price�Volatility�SP�15�
�
PowerSimm�simulates�market�prices�by�looking�at�historical�hourly�market�prices�and�extracting�information�on�both�their�shapes�(based�on�time�of�day,�month�of�year,�etc)�and�their�correlations�with�load�and�other�markets.�These�markets�are�then�simulated�into�the�future�by�maintaining�historical�shapes,�modifying�them�via�historical�correlations�to�match�the�simulated�load�and�market�conditions,�then�scaling�these�resulting�prices�to�forward�values,�if�available.��
In�order�to�optimize�dispatch�of�thermal�resources,�PowerSimm�calculates�an�implied�heat�rate�based�on�the�simulated�electricity�and�gas�prices�and�then�only�dispatches�thermal�resources�with�heat�rates�lower�than�the�implied�market�heat�rate.�Given�our�price�projections,�PowerSimm�will�dispatch�traditional�assets�far�less�frequently�than�current�operations,�which�is�consistent�with�the�direction�of�the�electricity�market.�
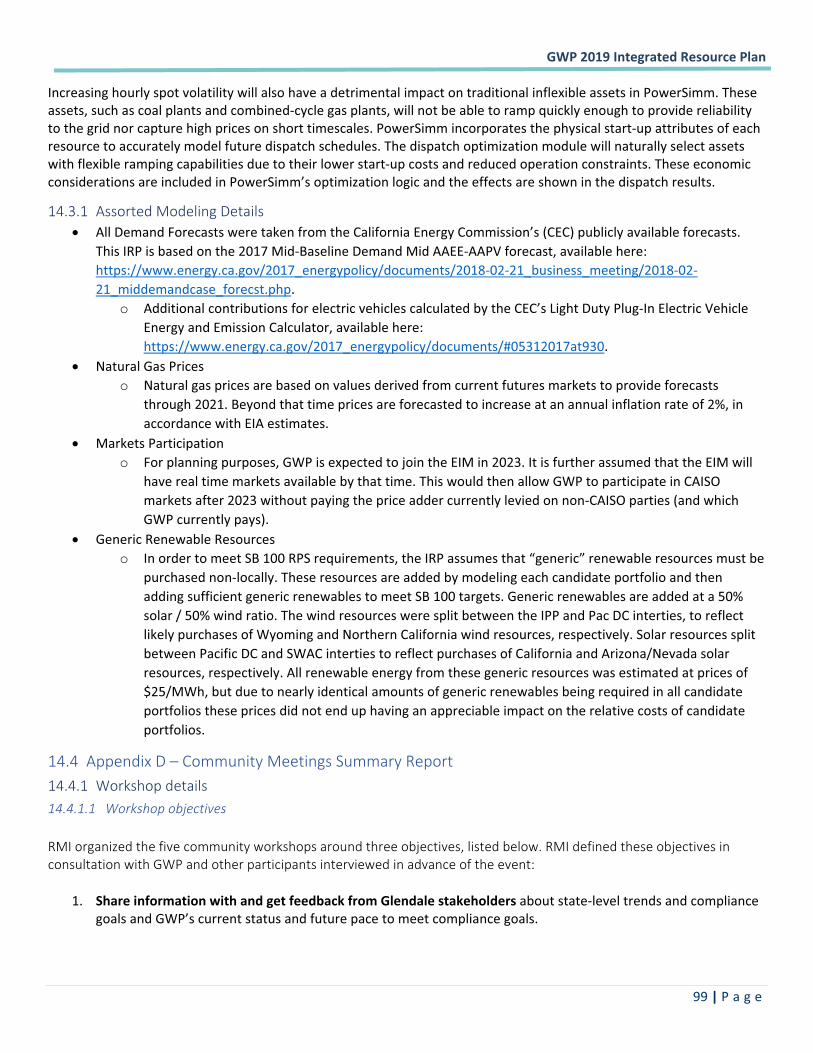
�GWP�2019�Integrated�Resource�Plan��
� �99�|�P a g e �
Increasing�hourly�spot�volatility�will�also�have�a�detrimental�impact�on�traditional�inflexible�assets�in�PowerSimm.�These�assets,�such�as�coal�plants�and�combined�cycle�gas�plants,�will�not�be�able�to�ramp�quickly�enough�to�provide�reliability�to�the�grid�nor�capture�high�prices�on�short�timescales.�PowerSimm�incorporates�the�physical�start�up�attributes�of�each�resource�to�accurately�model�future�dispatch�schedules.�The�dispatch�optimization�module�will�naturally�select�assets�with�flexible�ramping�capabilities�due�to�their�lower�start�up�costs�and�reduced�operation�constraints.�These�economic�considerations�are�included�in�PowerSimm’s�optimization�logic�and�the�effects�are�shown�in�the�dispatch�results.�
14.3.1 Assorted�Modeling�Details�� All�Demand�Forecasts�were�taken�from�the�California�Energy�Commission’s�(CEC)�publicly�available�forecasts.�
This�IRP�is�based�on�the�2017�Mid�Baseline�Demand�Mid�AAEE�AAPV�forecast,�available�here:�https://www.energy.ca.gov/2017_energypolicy/documents/2018�02�21_business_meeting/2018�02�21_middemandcase_forecst.php.�
o Additional�contributions�for�electric�vehicles�calculated�by�the�CEC’s�Light�Duty�Plug�In�Electric�Vehicle�Energy�and�Emission�Calculator,�available�here:�https://www.energy.ca.gov/2017_energypolicy/documents/#05312017at930.�
� Natural�Gas�Prices�o Natural�gas�prices�are�based�on�values�derived�from�current�futures�markets�to�provide�forecasts�
through�2021.�Beyond�that�time�prices�are�forecasted�to�increase�at�an�annual�inflation�rate�of�2%,�in�accordance�with�EIA�estimates.�
� Markets�Participation�o For�planning�purposes,�GWP�is�expected�to�join�the�EIM�in�2023.�It�is�further�assumed�that�the�EIM�will�
have�real�time�markets�available�by�that�time.�This�would�then�allow�GWP�to�participate�in�CAISO�markets�after�2023�without�paying�the�price�adder�currently�levied�on�non�CAISO�parties�(and�which�GWP�currently�pays).�
� Generic�Renewable�Resources�o In�order�to�meet�SB�100�RPS�requirements,�the�IRP�assumes�that�“generic”�renewable�resources�must�be�
purchased�non�locally.�These�resources�are�added�by�modeling�each�candidate�portfolio�and�then�adding�sufficient�generic�renewables�to�meet�SB�100�targets.�Generic�renewables�are�added�at�a�50%�solar�/�50%�wind�ratio.�The�wind�resources�were�split�between�the�IPP�and�Pac�DC�interties,�to�reflect�likely�purchases�of�Wyoming�and�Northern�California�wind�resources,�respectively.�Solar�resources�split�between�Pacific�DC�and�SWAC�interties�to�reflect�purchases�of�California�and�Arizona/Nevada�solar�resources,�respectively.�All�renewable�energy�from�these�generic�resources�was�estimated�at�prices�of�$25/MWh,�but�due�to�nearly�identical�amounts�of�generic�renewables�being�required�in�all�candidate�portfolios�these�prices�did�not�end�up�having�an�appreciable�impact�on�the�relative�costs�of�candidate�portfolios.�
14.4 Appendix�D�–�Community�Meetings�Summary�Report�14.4.1 Workshop�details��������� ��������������� ����
RMI�organized�the�five�community�workshops�around�three�objectives,�listed�below.�RMI�defined�these�objectives�in�consultation�with�GWP�and�other�participants�interviewed�in�advance�of�the�event:�
1. Share�information�with�and�get�feedback�from�Glendale�stakeholders�about�state�level�trends�and�compliance�goals�and�GWP’s�current�status�and�future�pace�to�meet�compliance�goals.��
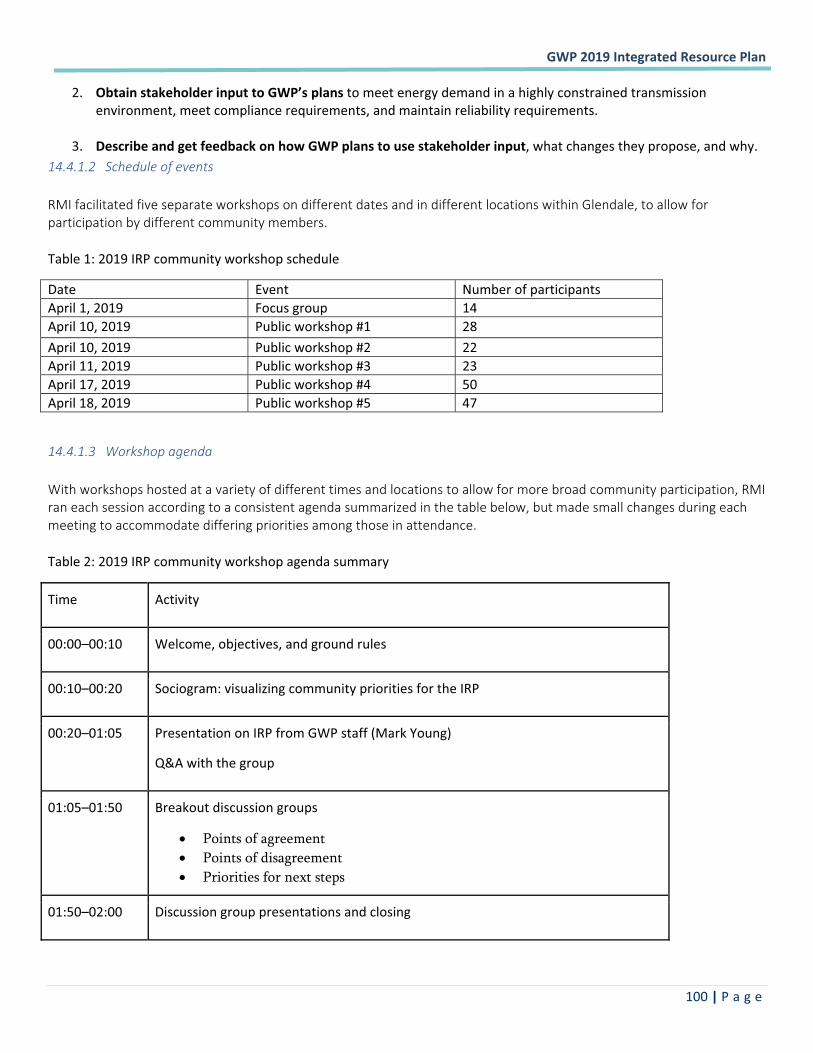
�GWP�2019�Integrated�Resource�Plan��
� �100�|�P a g e �
2. Obtain�stakeholder�input�to�GWP’s�plans�to�meet�energy�demand�in�a�highly�constrained�transmission�environment,�meet�compliance�requirements,�and�maintain�reliability�requirements.���
3. Describe�and�get�feedback�on�how�GWP�plans�to�use�stakeholder�input,�what�changes�they�propose,�and�why.��������� !���"#����$�� ������
RMI�facilitated�five�separate�workshops�on�different�dates�and�in�different�locations�within�Glendale,�to�allow�for�participation�by�different�community�members.��
Table�1:�2019�IRP�community�workshop�schedule�
Date� Event� Number�of�participants��April�1,�2019� Focus�group� 14�April�10,�2019� Public�workshop�#1� 28�April�10,�2019� Public�workshop�#2� 22�April�11,�2019� Public�workshop�#3� 23�April�17,�2019� Public�workshop�#4� 50�April�18,�2019� Public�workshop�#5� 47��
�������� ���������%��"�
With�workshops�hosted�at�a�variety�of�different�times�and�locations�to�allow�for�more�broad�community�participation,�RMI�ran�each�session�according�to�a�consistent�agenda�summarized�in�the�table�below,�but�made�small�changes�during�each�meeting�to�accommodate�differing�priorities�among�those�in�attendance.��
Table�2:�2019�IRP�community�workshop�agenda�summary�
Time� Activity�
00:00–00:10� Welcome,�objectives,�and�ground�rules�
00:10–00:20� Sociogram:�visualizing�community�priorities�for�the�IRP�
00:20–01:05� Presentation�on�IRP�from�GWP�staff�(Mark�Young)��
Q&A�with�the�group�
01:05–01:50�
�
�
Breakout�discussion�groups�
� Points of agreement � Points of disagreement � Priorities for next steps
01:50–02:00� Discussion�group�presentations�and�closing�
�
�GWP�2019�Integrated�Resource�Plan��
� �101�|�P a g e �
14.4.2 Workshop�outcomes�
This�section�summarizes�the�major�workshop�activities�and�outcomes�associated�with�each�objective.�To�ensure�that�RMI�captured�feedback�that�contributed�to�this�summary,�RMI�instructed�participants�to�write�all�their�questions�and�comments�down�during�the�presentation.�RMI�complemented�this�written�feedback�with�the�notes�taken�by�a�stenographer�present�for�each�workshop.��
�������� &����� ���'�!�����$�������(����"�%���$��"����$��������"����������"����
The�workshops�achieved�this�first�objective�through�a�short�GWP�presentation�followed�by�questions�and�answers�both�verbally�in�plenary�and�written�on�notes�addressing�each�slide�of�the�presentation.��
First,�Mark�Young�of�GWP�presented�a�short�slide�deck�with�information�responding�to�four�commonly�expressed�questions�about�the�IRP�and�overall�process.�GWP�staff�also�prepared�four�additional�printed�slides�with�information�related�to�other�questions�that�were�posted�during�the�workshops,�but�not�formally�presented.�During�the�presentation,�stakeholders�were�asked�to�write�down�their�questions�about�each�topic�and�then�post�them�on�the�related�printed�slides�arranged�around�the�room�in�order�to�accurately�capture�all�feedback.�Several�of�these�written�questions�were�then�addressed�verbally�in�plenary�so�as�to�hear�directly�from�stakeholders�in�the�room.�Full�notes�from�verbal�remarks�throughout�all�workshops�are�available�by�request�in�the�separate�stenographer’s�document.��
Key�points�of�feedback�are�included�below,�organized�according�to�the�slides�presented�by�GWP�that�prompted�their�discussion�during�the�workshops.�For�further�details�on�questions�asked�about�each�slide�topic,�please�refer�to�the�separate�Appendix.��
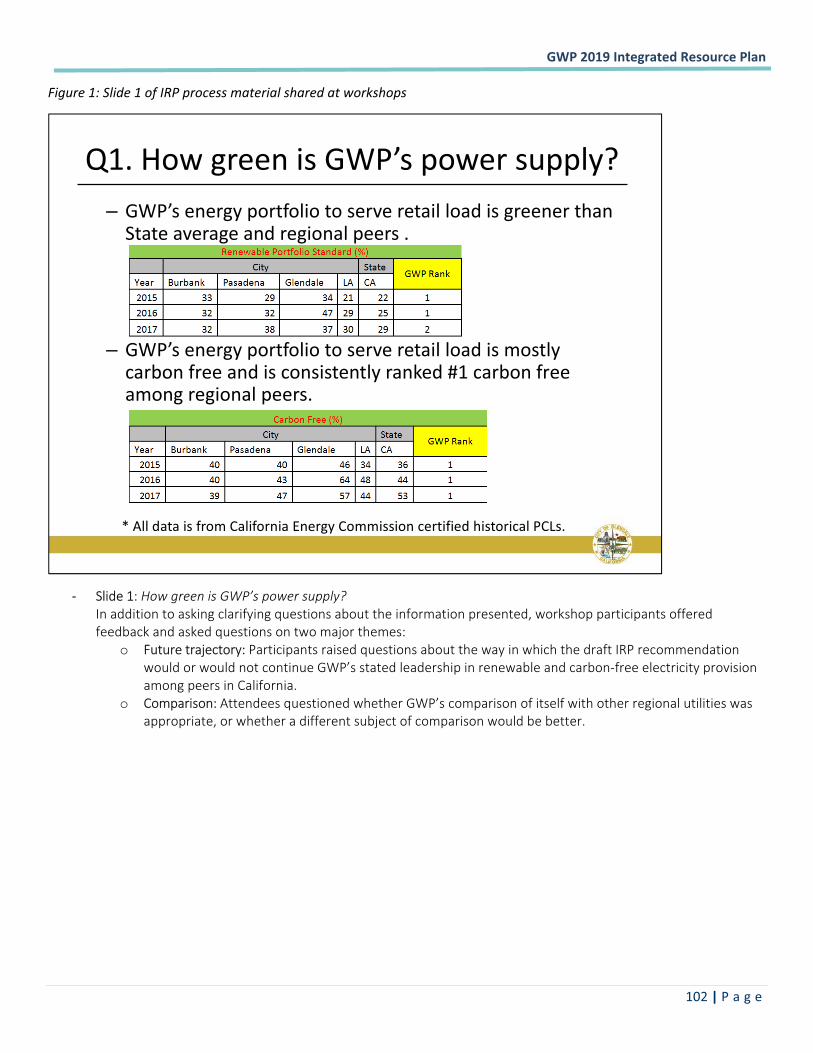
�GWP�2019�Integrated�Resource�Plan��
� �102�|�P a g e �
Figure�1:�Slide�1�of�IRP�process�material�shared�at�workshops�
�
� Slide�1:���(�%���������)*����(����#��� +�In�addition�to�asking�clarifying�questions�about�the�information�presented,�workshop�participants�offered�feedback�and�asked�questions�on�two�major�themes:��
o Future�trajectory:�Participants�raised�questions�about�the�way�in�which�the�draft�IRP�recommendation�would�or�would�not�continue�GWP’s�stated�leadership�in�renewable�and�carbon�free�electricity�provision�among�peers�in�California.���
o Comparison:�Attendees�questioned�whether�GWP’s�comparison�of�itself�with�other�regional�utilities�was�appropriate,�or�whether�a�different�subject�of�comparison�would�be�better.���
– GWP’s�energy�portfolio�to�serve�retail�load�is�greener�than�State�average�and�regional�peers�.�
– GWP’s�energy�portfolio�to�serve�retail�load�is�mostly�carbon�free�and�is�consistently�ranked�#1�carbon�free�among�regional�peers.�
Q1.�How�green�is�GWP’s�power�supply?
*�All�data�is�from�California�Energy�Commission�certified�historical�PCLs.�
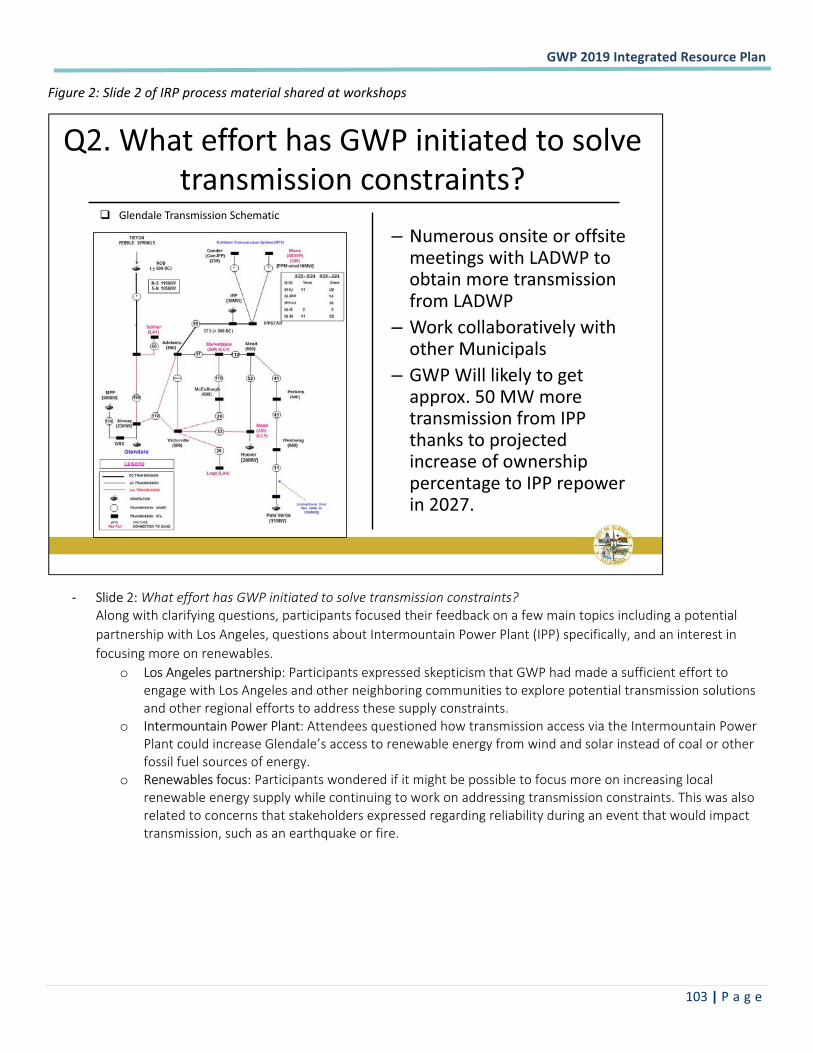
�GWP�2019�Integrated�Resource�Plan��
� �103�|�P a g e �
Figure�2:�Slide�2�of�IRP�process�material�shared�at�workshops�
�
� Slide�2:������$$���������)�����"������� ���������������������+��Along�with�clarifying�questions,�participants�focused�their�feedback�on�a�few�main�topics�including�a�potential�partnership�with�Los�Angeles,�questions�about�Intermountain�Power�Plant�(IPP)�specifically,�and�an�interest�in�focusing�more�on�renewables.�
o Los�Angeles�partnership:�Participants�expressed�skepticism�that�GWP�had�made�a�sufficient�effort�to�engage�with�Los�Angeles�and�other�neighboring�communities�to�explore�potential�transmission�solutions�and�other�regional�efforts�to�address�these�supply�constraints.��
o Intermountain�Power�Plant:�Attendees�questioned�how�transmission�access�via�the�Intermountain�Power�Plant�could�increase�Glendale’s�access�to�renewable�energy�from�wind�and�solar�instead�of�coal�or�other�fossil�fuel�sources�of�energy.�
o Renewables�focus:�Participants�wondered�if�it�might�be�possible�to�focus�more�on�increasing�local�renewable�energy�supply�while�continuing�to�work�on�addressing�transmission�constraints.�This�was�also�related�to�concerns�that�stakeholders�expressed�regarding�reliability�during�an�event�that�would�impact�transmission,�such�as�an�earthquake�or�fire.��
Q2.�What�effort�has�GWP�initiated�to�solve�transmission�constraints?
� Glendale�Transmission�Schematic
– Numerous�onsite�or�offsite�meetings�with�LADWP�to�obtain�more�transmission�from�LADWP
– Work�collaboratively�with�other�Municipals
– GWP�Will�likely�to�get�approx.�50�MW�more�transmission�from�IPP�thanks�to�projected�increase�of�ownership�percentage�to�IPP�repower�in�2027.
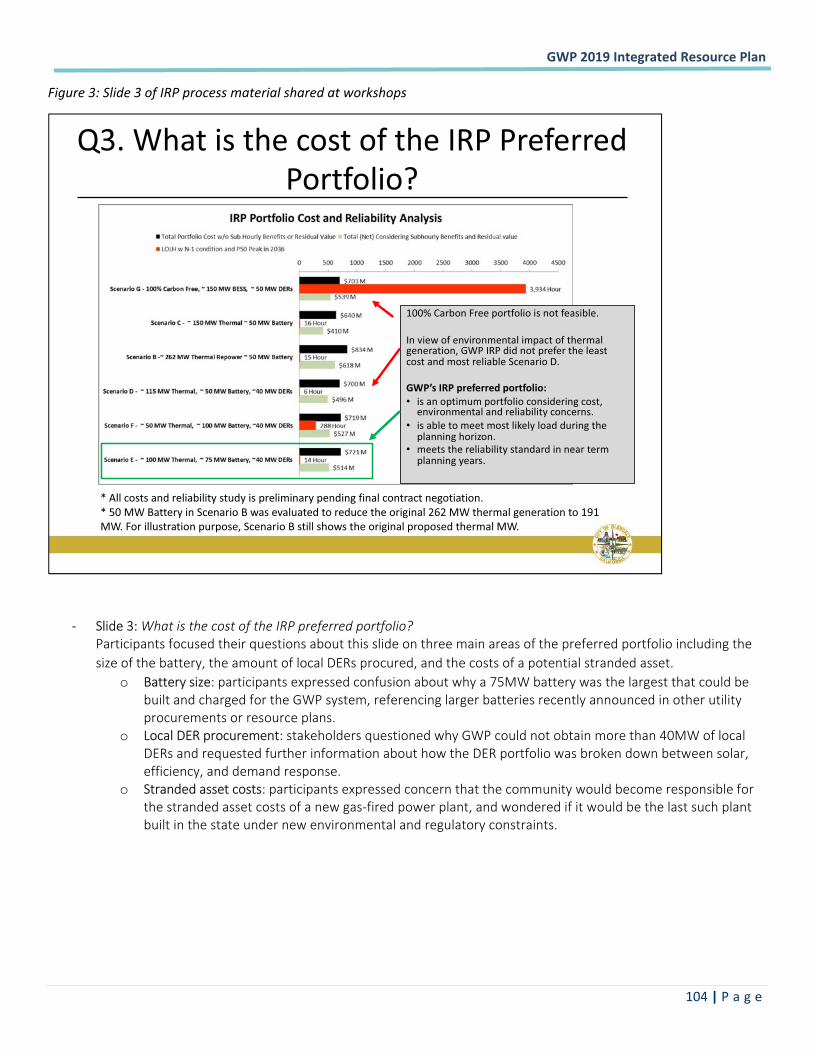
�GWP�2019�Integrated�Resource�Plan��
� �104�|�P a g e �
Figure�3:�Slide�3�of�IRP�process�material�shared�at�workshops�
�
�
� Slide�3:�����������������$�����,�)����$����"�����$���+�Participants�focused�their�questions�about�this�slide�on�three�main�areas�of�the�preferred�portfolio�including�the�size�of�the�battery,�the�amount�of�local�DERs�procured,�and�the�costs�of�a�potential�stranded�asset.��
o Battery�size:�participants�expressed�confusion�about�why�a�75MW�battery�was�the�largest�that�could�be�built�and�charged�for�the�GWP�system,�referencing�larger�batteries�recently�announced�in�other�utility�procurements�or�resource�plans.�
o Local�DER�procurement:�stakeholders�questioned�why�GWP�could�not�obtain�more�than�40MW�of�local�DERs�and�requested�further�information�about�how�the�DER�portfolio�was�broken�down�between�solar,�efficiency,�and�demand�response.�
o Stranded�asset�costs:�participants�expressed�concern�that�the�community�would�become�responsible�for�the�stranded�asset�costs�of�a�new�gas�fired�power�plant,�and�wondered�if�it�would�be�the�last�such�plant�built�in�the�state�under�new�environmental�and�regulatory�constraints.��
Q3.�What�is�the�cost�of�the�IRP�Preferred�Portfolio?�
*�All�costs�and�reliability�study�is�preliminary�pending�final�contract�negotiation.*�50�MW�Battery�in�Scenario�B�was�evaluated�to�reduce�the�original�262�MW�thermal�generation�to�191�MW.�For�illustration�purpose,�Scenario�B�still�shows�the�original�proposed�thermal�MW.�
100%�Carbon�Free�portfolio�is�not�feasible.
In�view�of�environmental�impact�of�thermal�generation,�GWP�IRP�did�not�prefer�the�least�cost�and�most�reliable�Scenario�D.
GWP’s�IRP�preferred�portfolio:• is�an�optimum�portfolio�considering�cost,�
environmental�and�reliability�concerns.�• is�able�to�meet�most�likely�load�during�the�
planning�horizon.• meets�the�reliability�standard�in�near�term�
planning�years.�
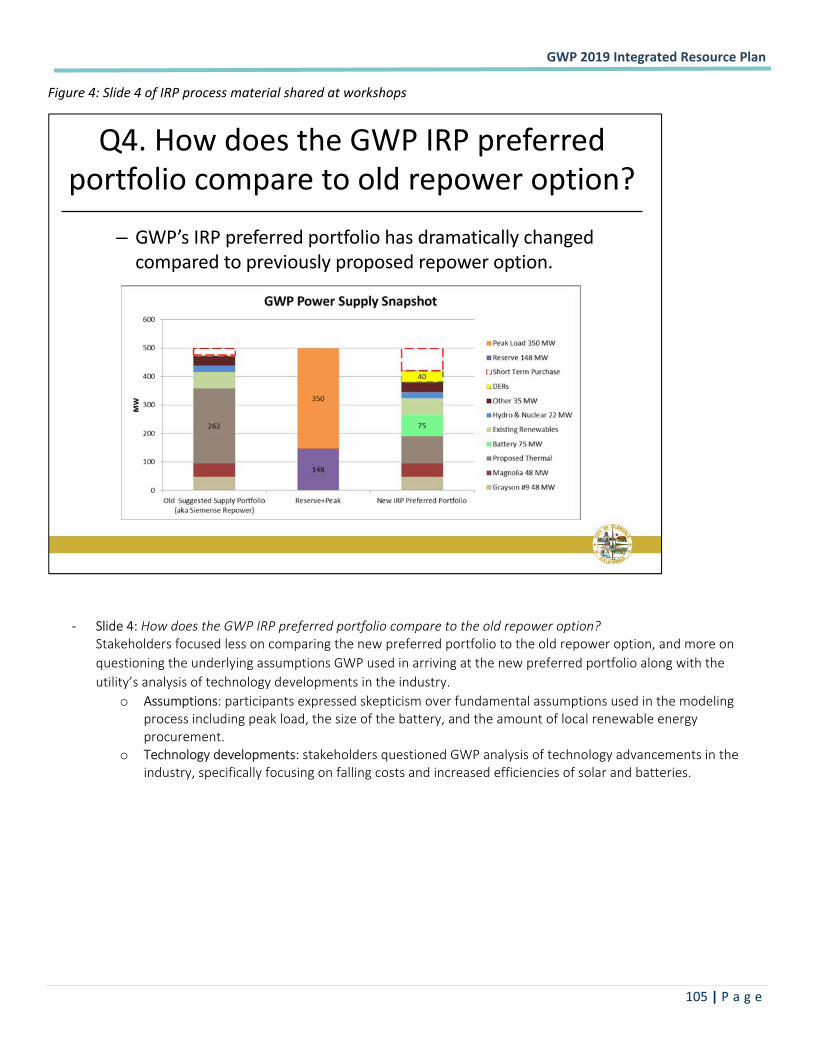
�GWP�2019�Integrated�Resource�Plan��
� �105�|�P a g e �
Figure�4:�Slide�4�of�IRP�process�material�shared�at�workshops�
�
�
� Slide�4:���(�"����������)�,�)����$����"�����$��������������������"�����(��������+�Stakeholders�focused�less�on�comparing�the�new�preferred�portfolio�to�the�old�repower�option,�and�more�on�questioning�the�underlying�assumptions�GWP�used�in�arriving�at�the�new�preferred�portfolio�along�with�the�utility’s�analysis�of�technology�developments�in�the�industry.��
o Assumptions:�participants�expressed�skepticism�over�fundamental�assumptions�used�in�the�modeling�process�including�peak�load,�the�size�of�the�battery,�and�the�amount�of�local�renewable�energy�procurement.��
o Technology�developments:�stakeholders�questioned�GWP�analysis�of�technology�advancements�in�the�industry,�specifically�focusing�on�falling�costs�and�increased�efficiencies�of�solar�and�batteries.�
Q4.�How�does�the�GWP�IRP�preferred�portfolio�compare�to�old�repower�option?�
– GWP’s�IRP�preferred�portfolio�has�dramatically�changed�compared�to�previously�proposed�repower�option.�
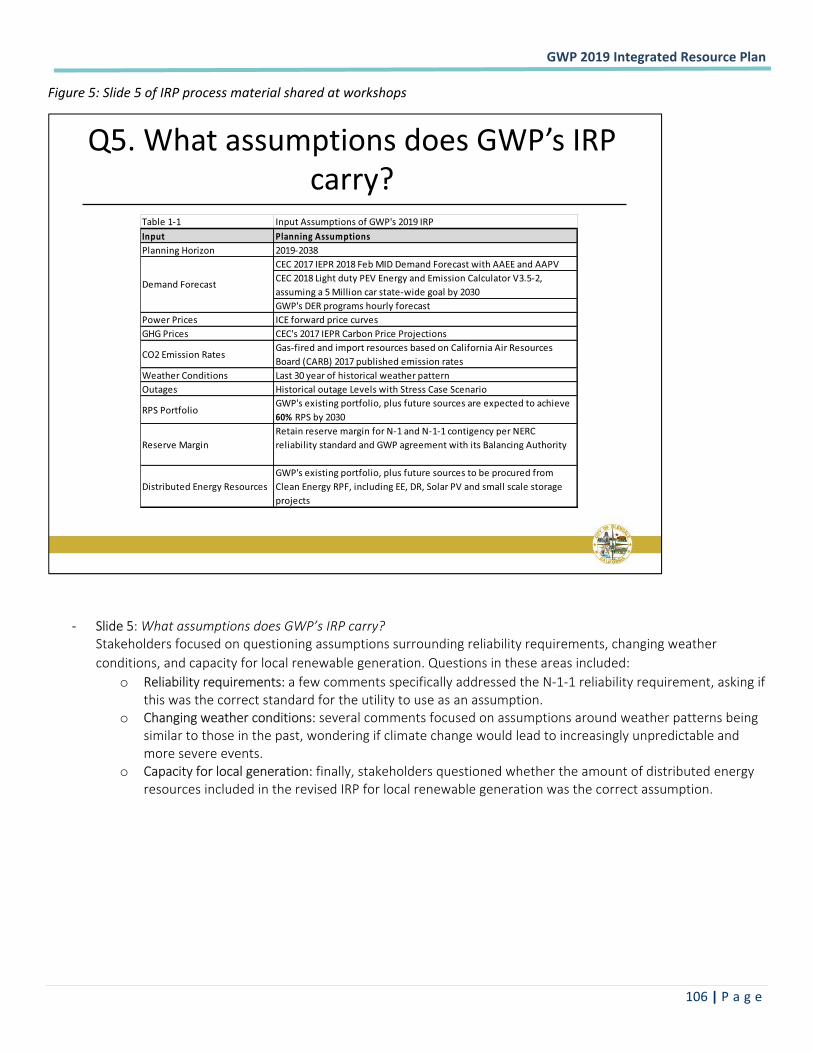
�GWP�2019�Integrated�Resource�Plan��
� �106�|�P a g e �
Figure�5:�Slide�5�of�IRP�process�material�shared�at�workshops�
�
�
� Slide�5:�������#�������"������)*��,�)���� +��Stakeholders�focused�on�questioning�assumptions�surrounding�reliability�requirements,�changing�weather�conditions,�and�capacity�for�local�renewable�generation.�Questions�in�these�areas�included:�
o Reliability�requirements:�a�few�comments�specifically�addressed�the�N�1�1�reliability�requirement,�asking�if�this�was�the�correct�standard�for�the�utility�to�use�as�an�assumption.�
o Changing�weather�conditions:�several�comments�focused�on�assumptions�around�weather�patterns�being�similar�to�those�in�the�past,�wondering�if�climate�change�would�lead�to�increasingly�unpredictable�and�more�severe�events.��
o Capacity�for�local�generation:�finally,�stakeholders�questioned�whether�the�amount�of�distributed�energy�resources�included�in�the�revised�IRP�for�local�renewable�generation�was�the�correct�assumption.�
Q5.�What�assumptions�does�GWP’s�IRP�carry?
Table�1�1� Input�Assumptions�of�GWP's�2019�IRPInput Planning�AssumptionsPlanning�Horizon 2019�2038
CEC�2017�IEPR�2018�Feb�MID�Demand�Forecast�with�AAEE�and�AAPVCEC�2018�Light�duty�PEV�Energy�and�Emission�Calculator�V3.5�2,�assuming�a�5�Million�car�state�wide�goal�by�2030GWP's�DER�programs�hourly�forecast
Power�Prices ICE�forward�price�curvesGHG�Prices CEC's�2017�IEPR�Carbon�Price�Projections
CO2�Emission�RatesGas�fired�and�import�resources�based�on�California�Air�Resources�Board�(CARB)�2017�published�emission�rates
Weather�Conditions Last�30�year�of�historical�weather�patternOutages Historical�outage�Levels�with�Stress�Case�Scenario
RPS�PortfolioGWP's�existing�portfolio,�plus�future�sources�are�expected�to�achieve�60% �RPS�by�2030
Reserve�MarginRetain�reserve�margin�for�N�1�and�N�1�1�contigency�per�NERC�reliability�standard�and�GWP�agreement�with�its�Balancing�Authority
Distributed�Energy�ResourcesGWP's�existing�portfolio,�plus�future�sources�to�be�procured�from�Clean�Energy�RPF,�including�EE,�DR,�Solar�PV�and�small�scale�storage�projects
Demand�Forecast
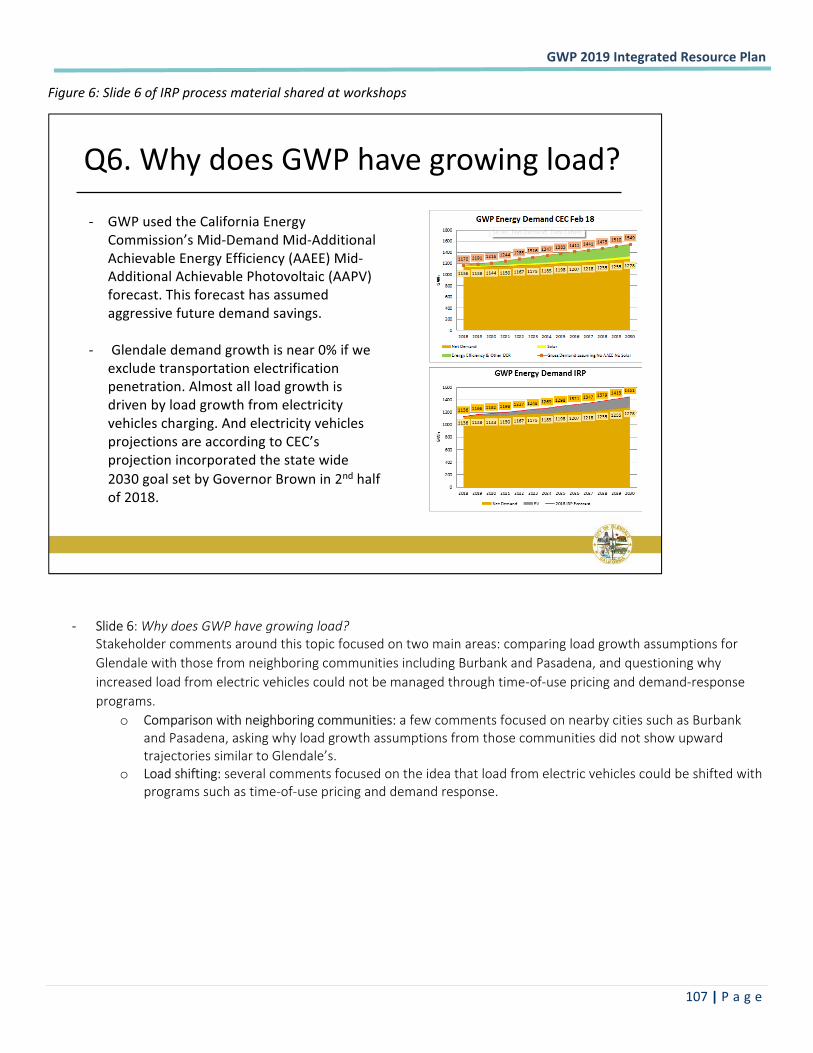
�GWP�2019�Integrated�Resource�Plan��
� �107�|�P a g e �
Figure�6:�Slide�6�of�IRP�process�material�shared�at�workshops�
�
�
� Slide�6:��� �"������)�� ��%��(�%���"+��Stakeholder�comments�around�this�topic�focused�on�two�main�areas:�comparing�load�growth�assumptions�for�Glendale�with�those�from�neighboring�communities�including�Burbank�and�Pasadena,�and�questioning�why�increased�load�from�electric�vehicles�could�not�be�managed�through�time�of�use�pricing�and�demand�response�programs.�
o Comparison�with�neighboring�communities:�a�few�comments�focused�on�nearby�cities�such�as�Burbank�and�Pasadena,�asking�why�load�growth�assumptions�from�those�communities�did�not�show�upward�trajectories�similar�to�Glendale’s.�
o Load�shifting:�several�comments�focused�on�the�idea�that�load�from�electric�vehicles�could�be�shifted�with�programs�such�as�time�of�use�pricing�and�demand�response.�
Q6.�Why�does�GWP�have�growing�load?
� GWP�used�the�California�Energy�Commission’s�Mid�Demand�Mid�Additional�Achievable�Energy�Efficiency�(AAEE)�Mid�Additional�Achievable�Photovoltaic�(AAPV)�forecast.�This�forecast�has�assumed�aggressive�future�demand�savings.
� Glendale�demand�growth�is�near�0%�if�we�exclude�transportation�electrification�penetration.�Almost�all�load�growth�is�driven�by�load�growth�from�electricity�vehicles�charging.�And�electricity�vehicles�projections�are�according�to�CEC’s�projection�incorporated�the�state�wide�2030�goal�set�by�Governor�Brown�in�2nd half�of�2018.�
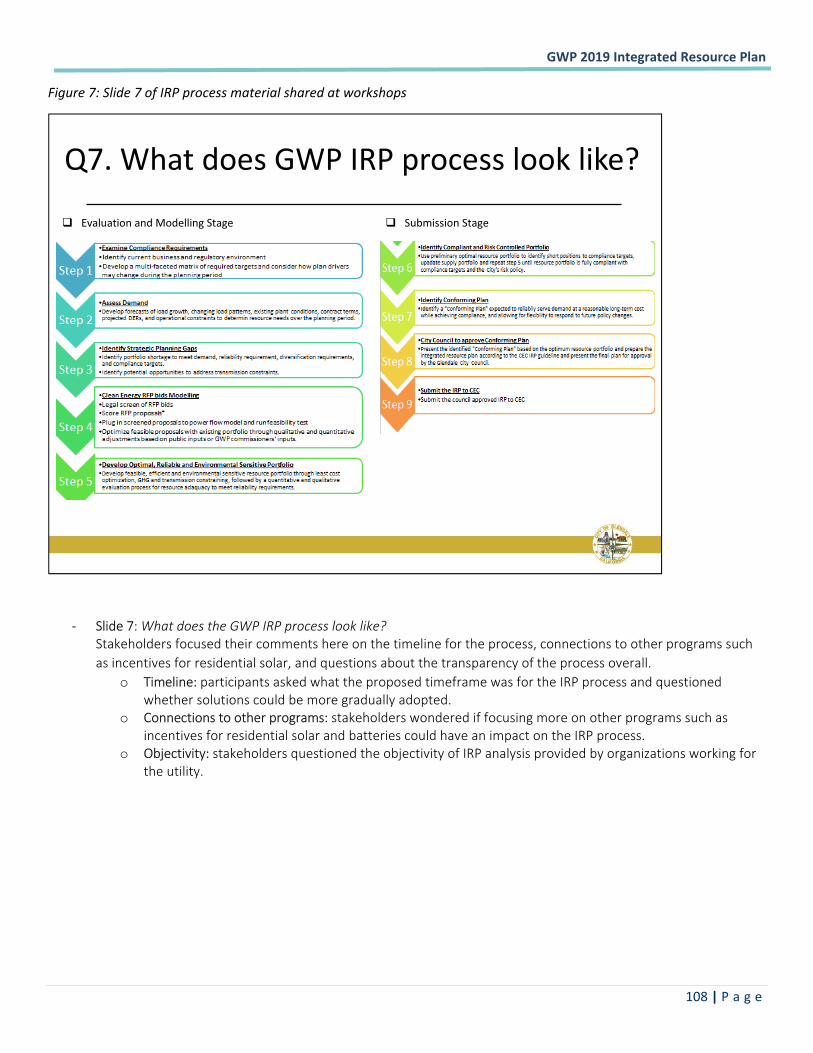
�GWP�2019�Integrated�Resource�Plan��
� �108�|�P a g e �
Figure�7:�Slide�7�of�IRP�process�material�shared�at�workshops�
�
�
� Slide�7:�����"����������)�,�)�����������������+�Stakeholders�focused�their�comments�here�on�the�timeline�for�the�process,�connections�to�other�programs�such�as�incentives�for�residential�solar,�and�questions�about�the�transparency�of�the�process�overall.�
o Timeline:�participants�asked�what�the�proposed�timeframe�was�for�the�IRP�process�and�questioned�whether�solutions�could�be�more�gradually�adopted.�
o Connections�to�other�programs:�stakeholders�wondered�if�focusing�more�on�other�programs�such�as�incentives�for�residential�solar�and�batteries�could�have�an�impact�on�the�IRP�process.�
o Objectivity:�stakeholders�questioned�the�objectivity�of�IRP�analysis�provided�by�organizations�working�for�the�utility.�
Q7.�What�does�GWP�IRP�process�look�like?
� Submission�Stage� Evaluation�and�Modelling�Stage
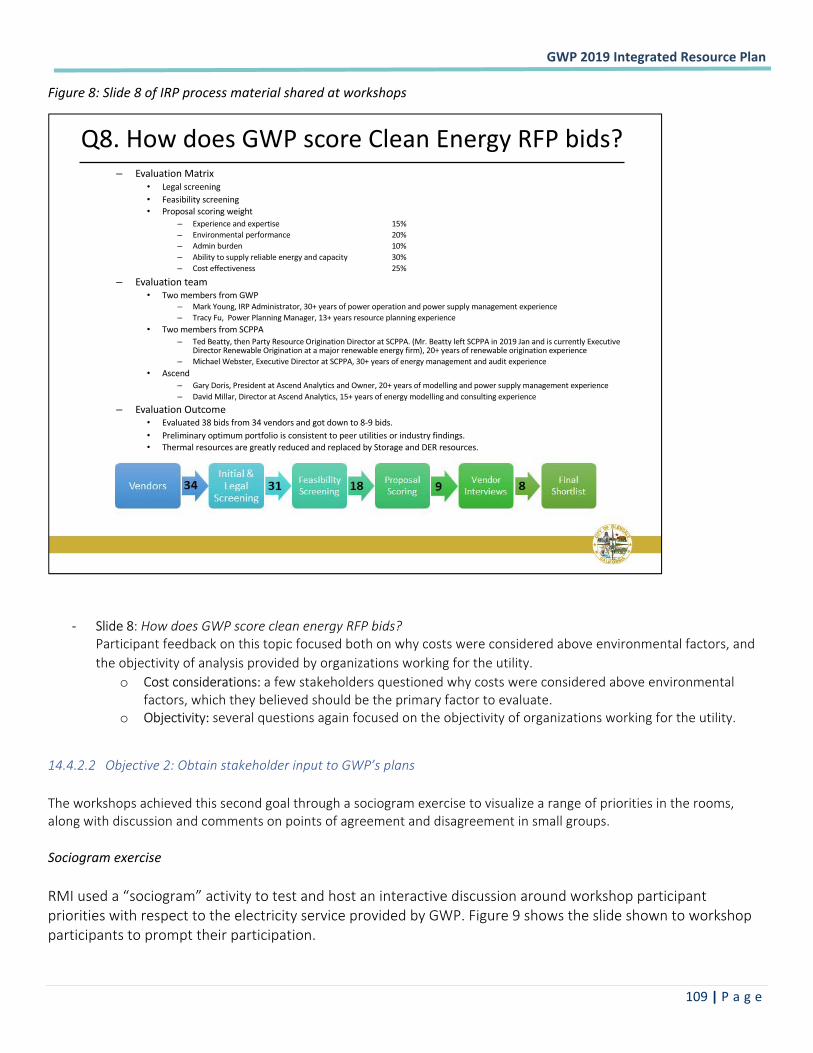
�GWP�2019�Integrated�Resource�Plan��
� �109�|�P a g e �
Figure�8:�Slide�8�of�IRP�process�material�shared�at�workshops�
��
�
� Slide�8:���(�"������)����������������% ��-)��"�+��Participant�feedback�on�this�topic�focused�both�on�why�costs�were�considered�above�environmental�factors,�and�the�objectivity�of�analysis�provided�by�organizations�working�for�the�utility.�
o Cost�considerations:�a�few�stakeholders�questioned�why�costs�were�considered�above�environmental�factors,�which�they�believed�should�be�the�primary�factor�to�evaluate.�
o Objectivity:�several�questions�again�focused�on�the�objectivity�of�organizations�working�for�the�utility.��
�������� &����� ���'�&�����������"�����#�������)*�������
The�workshops�achieved�this�second�goal�through�a�sociogram�exercise�to�visualize�a�range�of�priorities�in�the�rooms,�along�with�discussion�and�comments�on�points�of�agreement�and�disagreement�in�small�groups.�
Sociogram�exercise�
RMI�used�a�“sociogram”�activity�to�test�and�host�an�interactive�discussion�around�workshop�participant�priorities�with�respect�to�the�electricity�service�provided�by�GWP.�Figure�9�shows�the�slide�shown�to�workshop�participants�to�prompt�their�participation.�
�
Q8.�How�does�GWP�score�Clean�Energy�RFP�bids?– Evaluation�Matrix
• Legal�screening• Feasibility�screening• Proposal�scoring�weight
– Experience�and�expertise 15%– Environmental�performance 20%– Admin�burden 10%– Ability�to�supply�reliable�energy�and�capacity 30%– Cost�effectiveness 25%
– Evaluation�team• Two�members�from�GWP
– Mark�Young,�IRP�Administrator,�30+�years�of�power�operation�and�power�supply�management�experience– Tracy�Fu,��Power�Planning�Manager,�13+�years�resource�planning�experience�
• Two�members�from�SCPPA– Ted�Beatty,�then�Party�Resource�Origination�Director�at�SCPPA.�(Mr.�Beatty�left�SCPPA�in�2019�Jan�and�is�currently�Executive�
Director�Renewable�Origination�at�a�major�renewable�energy�firm),�20+�years�of�renewable�origination�experience– Michael�Webster, Executive�Director�at�SCPPA,�30+�years�of�energy�management�and�audit�experience
• Ascend– Gary�Doris,�President�at�Ascend�Analytics�and�Owner,�20+�years�of�modelling�and�power�supply�management�experience– David�Millar,�Director�at�Ascend�Analytics,�15+�years�of�energy�modelling�and�consulting�experience�
– Evaluation�Outcome• Evaluated�38�bids�from�34�vendors�and�got�down�to�8�9�bids.• Preliminary�optimum�portfolio�is�consistent�to�peer�utilities�or�industry�findings.• Thermal�resources�are�greatly�reduced�and�replaced�by�Storage�and�DER�resources.��
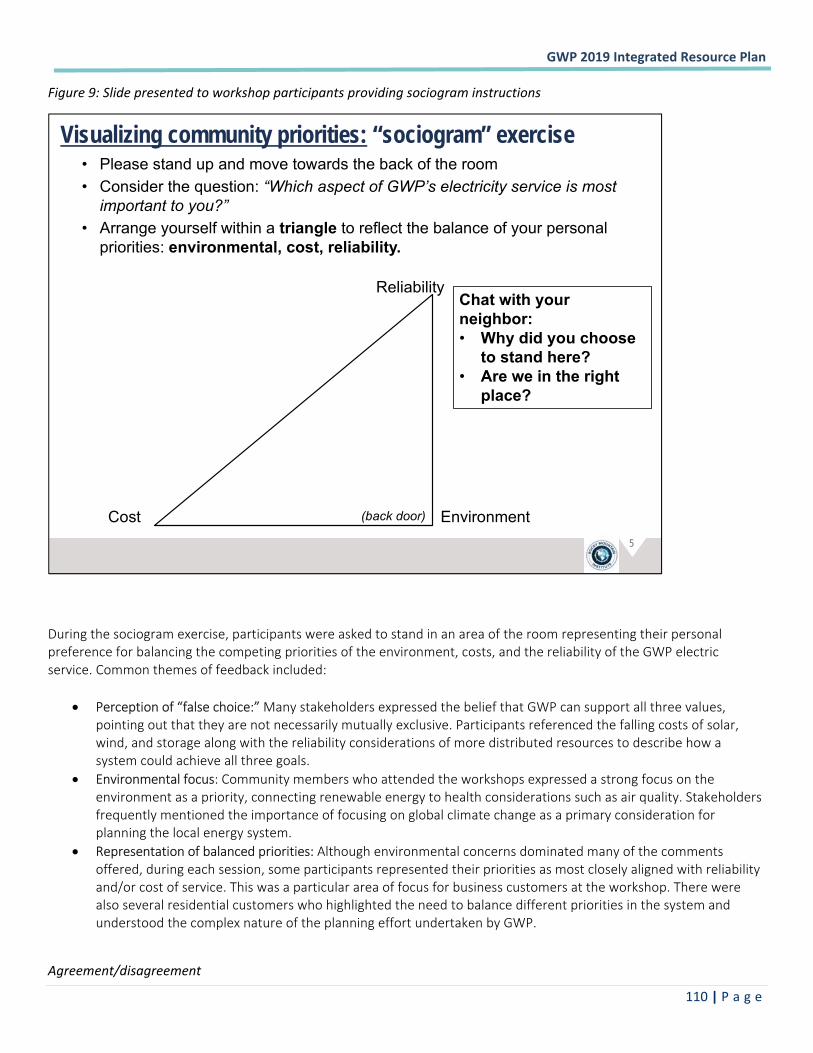
�GWP�2019�Integrated�Resource�Plan��
� �110�|�P a g e �
Figure�9:�Slide�presented�to�workshop�participants�providing�sociogram�instructions�
�
�
During�the�sociogram�exercise,�participants�were�asked�to�stand�in�an�area�of�the�room�representing�their�personal�preference�for�balancing�the�competing�priorities�of�the�environment,�costs,�and�the�reliability�of�the�GWP�electric�service.�Common�themes�of�feedback�included:�
� Perception�of�“false�choice:”�Many�stakeholders�expressed�the�belief�that�GWP�can�support�all�three�values,�pointing�out�that�they�are�not�necessarily�mutually�exclusive.�Participants�referenced�the�falling�costs�of�solar,�wind,�and�storage�along�with�the�reliability�considerations�of�more�distributed�resources�to�describe�how�a�system�could�achieve�all�three�goals.��
� Environmental�focus:�Community�members�who�attended�the�workshops�expressed�a�strong�focus�on�the�environment�as�a�priority,�connecting�renewable�energy�to�health�considerations�such�as�air�quality.�Stakeholders�frequently�mentioned�the�importance�of�focusing�on�global�climate�change�as�a�primary�consideration�for�planning�the�local�energy�system.��
� Representation�of�balanced�priorities:�Although�environmental�concerns�dominated�many�of�the�comments�offered,�during�each�session,�some�participants�represented�their�priorities�as�most�closely�aligned�with�reliability�and/or�cost�of�service.�This�was�a�particular�area�of�focus�for�business�customers�at�the�workshop.�There�were�also�several�residential�customers�who�highlighted�the�need�to�balance�different�priorities�in�the�system�and�understood�the�complex�nature�of�the�planning�effort�undertaken�by�GWP.��
�
Agreement/disagreement�
5
Visualizing community priorities: “sociogram” exercise• Please stand up and move towards the back of the room• Consider the question: “Which aspect of GWP’s electricity service is most
important to you?”• Arrange yourself within a triangle to reflect the balance of your personal
priorities: environmental, cost, reliability.
Cost
Reliability
Environment
Chat with your neighbor:• Why did you choose
to stand here?• Are we in the right
place?
(back door)
�GWP�2019�Integrated�Resource�Plan��
� �111�|�P a g e �
During�the�breakout�group�discussion�on�points�of�agreement�and�disagreement,�stakeholders�continued�to�focus�on�topics�raised�in�the�initial�presentation�including�transmission,�costs,�and�renewable�energy.�Areas�of�agreement�included:��
� Improvement�from�previous�plan:�Participants�acknowledged�that�the�new�IRP�preferred�portfolio�was�an�improvement�from�the�previous�plan.�They�specifically�referenced�the�increased�focus�on�battery�storage�and�renewables�and�the�decreased�size�of�the�proposed�gas�plant�as�positive�developments.�
� System�constraints:�Stakeholders�generally�understood�that�GWP�is�operating�within�specific�constraints�on�the�local�energy�system.�They�specifically�agreed�that�transmission�solutions�are�challenging�to�implement,�clean�energy�is�an�important�part�of�the�solution,�and�reliability�is�critical.�
� Understanding�of�trends:�Participants�expressed�an�understanding�of�the�trends�that�the�utility�highlighted,�including�the�need�for�a�diversified�mix�of�energy�supply�and�the�potential�load�growth�cause�by�electric�vehicles�and�electrification�of�appliances.�They�specifically�highlighted�the�complexities�of�balancing�competing�priorities�including�cost,�reliability,�and�environmental�concerns.�
� Appreciation�of�engagement:�Finally,�stakeholders�agreed�that�the�workshops�were�helpful�and�expressed�interest�in�further�engagement�with�the�utility�going�forward.�Several�participants�referenced�the�decision�to�host�workshops�run�by�a�neutral�facilitator�as�an�improvement�over�past�interactions.�
�Overall�areas�of�disagreement�included:�
� Questioning�IRP�assumptions:�Stakeholders�expressed�interest�in�reevaluating�assumptions�used�in�the�IRP�process�including�peak�load,�load�growth,�and�carbon�pricing.�They�requested�additional�analysis�by�a�different�and�independent�organization�beyond�the�review�process�already�completed�by�the�utility�and�a�third�party�analytical�firm.�
� Further�review�of�transmission�and�local�resources:�Stakeholders�continued�to�question�whether�GWP�had�made�a�sufficient�effort�to�explore�transmission�solutions�with�surrounding�communities,�and�asked�about�the�ability�to�increase�local�generation�from�distributed�energy�resources.�Several�stakeholders�offered�to�help�reach�out�to�surrounding�communities�about�transmission�solutions�or�provide�feedback�about�the�potential�for�local�renewable�resources.�
� Broader�context:�Participants�questioned�whether�the�plan�was�consistent�with�statewide�goals�and�trends,�and�whether�there�had�been�sufficient�consideration�of�social�equity�and�health�impacts.�Several�stakeholders�expressed�concern�that�the�overall�context�of�global�climate�change�and�environmental�impact�was�not�being�given�sufficient�consideration.�
� Further�engagement:�Finally,�many�stakeholders�requested�further�opportunities�for�community�input�and�additional�education�around�some�of�the�more�fundamental�concepts�of�the�industry.�
��������� &����� ���'�.��������"�%���$��"���������(���)���������#����������"�����#��
The�workshops�achieved�this�third�goal�through�comments�and�discussion�of�proposed�next�steps�in�small�groups,�which�participants�wrote�down�in�breakout�at�individual�tables�and�then�shared�back�with�the�entire�room�in�plenary.�Commonly�raised�suggestions�for�next�steps�included:�
� Continued�engagement:�Several�participants�expressed�an�interest�in�continued�community�engagement�with�the�utility�going�forward,�along�with�opportunities�to�consider�collaboration�and�learning�between�peer�cities�and�state�organizations.�Some�participants�volunteered�to�help�reach�out�to�other�groups�around�the�state�as�needed.�
� Revised�modeling:�Stakeholders�also�focused�on�the�possibility�of�revised�modeling�for�the�plan�including�further�consideration�of�the�cost�of�carbon,�cost�trajectories�for�new�technologies,�and�a�more�incremental�approach�that�matches�solutions�with�load�gradually�over�time.�As�mentioned�above,�some�participants�also�requested�additional�third�party�analysis.�

�GWP�2019�Integrated�Resource�Plan��
� �112�|�P a g e �
� Program�integration:�Workshop�attendees�expressed�a�desire�for�more�integration�between�city�programs�and�incentives�for�local�energy�resources�and�the�overall�GWP�planning�process,�especially�focusing�on�a�desire�to�include�more�clean�energy�locally�and�at�a�larger�utility�scale.�
�
14.5 Appendix�E�–�Energy�Risk�Management�Policy�See�pages�attached�to�the�end�of�this�document.�
14.6 Appendix�F�–�Renewables�Portfolio�Standard�Procurement�Plan�See�pages�attached�to�the�end�of�this�document.�
Energy Risk Management Policy
Glendale Water & Power 07/01/2019
ENERGY RISK MANAGEMENT POLICY July 1, 2019
Energy Risk Management Policy
Glendale Water & Power 07/01/2019 i
TABLE OF CONTENTS
1. POLICY PURPOSE 1
2. RISK MANAGEMENT OBJECTIVES 1
2.1 GWP Business Objectives 1 2.2 GWP Risk Management Objectives 2
3. ORGANIZATION & GOVERNANCE 3
3.1 City Council 5 3.2 City Manager 5 3.3 GWP General Manager 6 3.4 GWP Energy Risk Management Committee (ERMC) 7 3.4.1 Energy Risk Management Committee Structure 3.4.2 Meeting Timing,Frequency, and Voting Procedures 3.4.3 Member Vacancies 3.4.4 Energy Risk Committee Responsibilities 3.5 GWP Chief Assistant General Manager, Assistant General Manager, Deputy
General Manager, and Integrated Resources Planning Administrator (Power Management Services) 9
3.6 GWP Assistant General Manager, Deputy General Manager, and Business Transformation and Marketing Administrator (Business Services) 10
3.7 GWP Energy Marketers, Schedulers, and Real-Time Traders or Authorized Agents 11 3.8 GWP Energy Risk Manager 11 3.9 GWP Power Contracts Manager 13 3.10 GWP Utility Manager (Financial) 15 3.11 GWP Business Systems Support Manager 16 3.12 City of Glendale Finance 16 3.13 City of Glendale Legal 17 3.14 City of Glendale Audit 17 3.15 Conflict of Interest and Compliance 17
4. SCOPE OF BUSINESS ACTIVITIES GOVERNED BY THIS 18 POLICY
5. RELATED POLICIES 18
6. REPORTING 18
6.1 Reporting Requirements 18 Table 6.1 Reporting Requirements 19
Energy Risk Management Policy
Glendale Water & Power 07/01/2019 ii
7. POLICY REVIEW 20
8. PROCEDURES 20
Energy Risk Management Policy
Glendale Water & Power 07/01/2019
1
1. POLICY PURPOSE
Glendale Water & Power (GWP) is in the business of generation, transmission, and distribution of electricity for the benefit of the City of Glendale. One of GWP’s main objectives is to procure reliable and sustainable power for its customers at stable and predictable rates while optimizing existing and local resources. This Energy Risk Management Policy (the Policy) is designed to establish the framework for GWP to manage the risks that are inherent in the wholesale energy operations and markets it participates in. The purpose of this Policy is to formally establish an energy risk management program and document the organizational structure (Figure 3.1) utilized by GWP to meet the electricity needs of its customers and provide guidelines for GWP to plan, execute, and control the management of a variety of risks associated with energy portfolio activities. The purpose of this Policy is also to formalize the policies of GWP regarding managing its energy risks. Accordingly, this Policy will set forth GWP’s:
� risk management objectives; � risk governance structure and responsibilities; � scope of business activities governed by this Policy; and � list of associated guidelines, policy documents, and registry.
GWP intends that energy risk management will support the advancement of its strategic business plan and will properly manage its business and financial risks through:
� prudent oversight; � adequate mitigation of energy risks consistent with GWP’s defined risk
registry and tolerance; and � sufficient internal controls and procedures.
Managing the energy risks of GWP entails the coordination of resources and activities among all departments within GWP and within the City of Glendale (CoG) governance structure.
2. RISK MANAGEMENT OBJECTIVES
2.1 GWP BUSINESS OBJECTIVES
An effective energy risk management policy better equips a utility to achieve its energy portfolio objectives. This Policy is focused on helping GWP achieve these business objectives:
� Provide reliable, sustainable power to retail customers;
Energy Risk Management Policy
Glendale Water & Power 07/01/2019
2
� Manage the energy portfolio to stabilize rates and comply with mandatory renewable and clean energy standards, Dodd-Frank, and other regulatory requirements;
� Allow for hedging to protect against adverse changes in energy market prices and mitigate the risk to customers of significant rate increases and budget shortfalls;
� Allow for providing price and risk differentiated energy products to customers as appropriate; and
� Optimize GWP’s existing energy portfolio resources.
2.2 GWP RISK MANAGEMENT OBJECTIVES
The primary goal of this Policy and resulting risk management activities is to strengthen GWP’s ability to provide reliable, sustainable power to its retail customers at stable, predictable rates while managing risks and complying with mandatory regulatory requirements. This goal is best achieved by enabling GWP to transact business in different energy commodity markets while simultaneously monitoring, minimizing, and mitigating associated risks.
Other goals of risk management activities are to:
� Maintain risks within desired tolerances for a defined period in the future; � Enhance the value of GWP’s assets/resources; � Participate in commodity markets and derivative instruments for hedging
and not speculative purposes; � Develop a risk management culture and support GWP’s ongoing strategic
planning process; � Manage a portfolio of physical and financial positions to help stabilize the
cost of energy with associated risks while maintaining reliable energy supplies for customers and meeting regulatory requirements;
� Identify, quantify, and monitor market and regulatory risks; � Monitor trading activity to identify and report if policy violations occur and
established limits are exceeded without proper approval; � Work within the existing organizational structure to implement the Policy; � Remain flexible to accommodate changing needs of GWP’s energy
portfolio while maintaining control of the overall risk position; and � Operate a disciplined program to manage budget, cash flows, margining,
and transaction execution.
Energy Risk Management Policy
Glendale Water & Power 07/01/2019
3
3. ORGANIZATION & GOVERNANCE
Risk governance will follow a top-down approach whereby the GWP Energy Risk Management Committee (ERMC) identifies GWP’s energy risk management objectives and provides energy risk management oversight, consistent with the rates, annual budget, policies, and transaction authorities that are all periodically adopted by the City Council. Supporting controls, policies, and procedures will be implemented and aligned throughout the risk governance structure, with distinct roles and responsibilities that result in an energy risk controlled environment. Governance and controls include the organizational structure, policies, reporting processes, and procedures that support GWP’s business models, risk tolerances, energy supply objectives, and appropriately segregate responsibilities. The following sections identify and describe the levels within the organization with oversight and direct responsibility for the implementation of this Policy and the resulting program.
ASSIGNMENT OF RESPONSIBILITIES
The following organizational chart identifies the levels with oversight and direct responsibility for the implementation of risk management activities within this Policy. Also, it identifies the appropriate segregation of responsibilities within GWP for the primary functions that manage energy commodities:
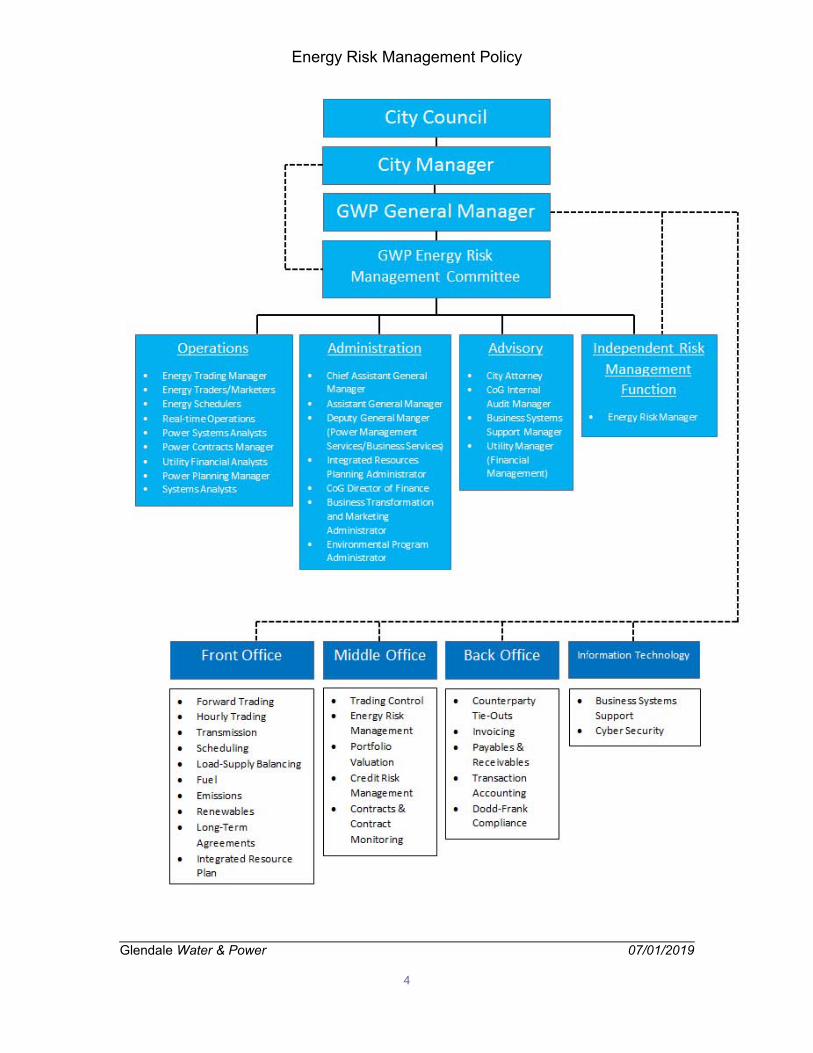
Energy Risk Management Policy
Glendale Water & Power 07/01/2019
4
Energy Risk Management Policy
Glendale Water & Power 07/01/2019
5
3.1 CITY COUNCIL
The City of Glendale City Council shall:
� Adopt an electric utility annual budget; � Review and approve retail electric customer rate changes; � Review and approve changes to the GWP Electric System Cash Reserve
Policy; � Approve transaction authorities for the City Manager and the GWP General
Manager established according to the Trading Authority Policy; � Approve recommended changes to the Energy Risk Management Policy
that establishes an overall framework for evaluation, management, and control of energy risk for GWP.
3.2 CITY MANAGER
The City Manager is responsible for providing the oversight of and support for energy risk management philosophies and principles. The City Manager shall:
� Establish scope and frequency of any GWP management reporting to the City Council;
� Periodically review energy risk exposures and compliance with policies and procedures;
� Discuss GWP’s energy risk exposures and the steps GWP management has taken or will take to mitigate, control, and monitor such exposures, as documented in GWP’s Risk Registry;
� Require adequate management involvement and financial controls and systems to monitor, report, and ensure the integrity of this Policy at all levels;
� Periodically review this Policy and the related policies as defined in Section 5, and recommend changes proposed by the GWP ERMC to the City Council and/or such other changes as the City Manager deems advisable; and
� Approve a Trading Authority Delegation reflecting delegation of trading authority and limits. Periodically review the Trading Authority Delegation and recommend proposed revisions, as needed.
Energy Risk Management Policy
Glendale Water & Power 07/01/2019
6
3.3 GWP GENERAL MANAGER
The GWP General Manager is responsible for the overall direction, structure, conduct, control, mitigation, reporting, and enforcement of GWP’s risk management activities. The GWP General Manager shall:
� Establish a risk management culture throughout the organization; � Periodically assess the adequacy and functioning of the system of controls
over market, credit, and operational risks; � Ensure that all energy risk control activities (e.g., position monitoring,
portfolio assessment, credit) are independent of energy purchases and sales;
� Approve a Trading Authority Delegation reflecting delegation of trading authority and limits. At a minimum, annually review the Trading Authority Delegation and revise, as needed;
� Report to the City Manager on GWP’s energy risk management activities, achievements, and goals;
� Annually review with the ERMC and assure compliance with the Energy Risk Management Policy and related policies, as defined in Section 5;
� Review with the GWP ERMC on GWP’s compliance with its energy risk policies and energy risk management in accordance with the policies;
� Periodically report, to the City Manager, the risk profile of GWP’s energy portfolio and on the results of energy risk management activities;
� Have authority to transact within the limits set by the City Council in the Trading Authority Policy;
� Approve proper organization, separation, or consolidation of functional activities;
� Ensure that the identification and quantification of energy risks and related energy risk mitigation strategies, as documented in GWP’s Risk Registry, are integrated into the GWP strategic planning process; and
� Establish and maintain an effective working relationship with associated energy service providers; and
� Serve on the ERMC.
Energy Risk Management Policy
Glendale Water & Power 07/01/2019
7
3.4 GWP ENERGY RISK MANAGEMENT COMMITTEE (ERMC)
The GWP ERMC has the responsibility for managing the target energy risk profiles and leading GWP’s energy risk management efforts on a path of continuous improvement. The GWP ERMC will provide direction and oversight to GWP concerning power supply planning, transacting, hedging, reporting, and related internal controls; and the development and implementation of policies and procedures consistent with this Policy. The GWP ERMC establishes a forum for discussion of GWP’s significant energy risks and must develop guidelines required to implement an appropriate energy risk management control infrastructure; this includes implementation and monitoring of compliance with GWP’s energy risk management-related policies, as defined in Section 5. The GWP ERMC executes its energy risk management responsibilities through direct oversight and prudent delegation of its responsibilities to the independent energy risk management function, as well as to other GWP and City of Glendale (CoG) personnel.
3.4.1 GWP Energy Risk Management Committee Structure Voting Membership: The GWP ERMC shall be comprised of six voting members and five non-voting members. The six voting members are: 1. City Manager; 2. GWP General Manager (Chair); 3. GWP CAGM, AGM, Deputy GM, Integrated Resources Planning
Administrator (Power Management Services) or as designated by the GWP General Manager;
4. GWP AGM, Deputy GM, Business Transformation and Marketing Administrator (Business Services) or as designated by the GWP General Manager;
5. GWP Energy Risk Manager; and 6. CoG Director of Finance.
The five non-voting members are the: 1. GWP Trading Manager 2. GWP Business Systems Support Manager; 3. GWP Utility Manager (Financial); 4. City Attorney; and 5. CoG Internal Audit Manager.
3.4.2 Meeting Timing, Frequency and Voting Procedures The GWP ERMC shall meet no less than twice per calendar quarter. Member attendance shall be recorded in the GWP ERMC meeting minutes.
Energy Risk Management Policy
Glendale Water & Power 07/01/2019
8
Any voting member of the GWP ERMC can request an emergency meeting of the GWP ERMC to address circumstances or issues that may require immediate attention. In the event any member is unable to attend a GWP ERMC meeting in person or by telephone, that member (whether a voting or non-voting member) may designate an alternate to attend in his or her absence. The six voting members shall each have a single vote on matters that come before the GWP ERMC and a voting member, or designee, must participate in the GWP ERMC meeting in order to vote and approve a proposed action. If a voting member is unable to attend a GWP ERMC meeting in person or by telephone, the member may designate an alternate to vote in his or her absence. If any three of the voting members, or their designees, are not present at a GWP ERMC meeting, a vote on a proposed action cannot take place. The GWP ERMC will make decisions and take actions by a simple majority vote. If the GWP ERMC reaches an impasse that cannot be addressed through a vote or if a tie vote occurs, the GWP General Manager will make a final decision by the end of the next business day.
3.4.3 Member Vacancies In cases where a committee member vacates the GWP ERMC, the GWP General Manager will resolve the GWP ERMC vacancy by making a discretionary interim appointment.
The GWP General Manager will designate a Secretary to the GWP ERMC to document all meetings and actions taken by the GWP ERMC in meeting minutes that will be distributed to GWP ERMC members for their review and approval. The Secretary need not be a member of the GWP ERMC. Approved meeting minutes will be distributed by the Secretary to the GWP ERMC members.
3.4.4 GWP Energy Risk Management Committee Responsibilities The GWP ERMC is responsible for:
� Aligning energy risk management with City Council approved budgets,
rates, policies and transaction authorities; � Setting a clear strategy and goals for hedging market price risk via the
Hedge Policy; reviewing and approving risk management strategies and hedging plans to be implemented by GWP;
� Establishing the scope of energy portfolio and risk management activities, the purpose for engaging in transactions, and the appropriate risk tolerances consistent with strategic direction;
� Establishing the strategic direction and risk threshold for retail load energy needs and wholesale transactions; reviewing and approving
Energy Risk Management Policy
Glendale Water & Power 07/01/2019
9
proposed energy risk management strategies for strategic fit, evaluate risk exposure consistent with energy risk tolerances, and reporting and control requirements. The GWP ERMC shall ensure that approved strategies are consistent with GWP’s approved strategic business plan, energy risk management objectives, approved energy risk tolerance guidelines, and compliance with energy risk policies;
� Reviewing reports by the independent energy risk management function concerning policy and procedural compliance and taking appropriate action to mitigate losses or increased risks, if any, as necessary;
� Providing oversight and direction for specific projects including new markets, RFP development and review of RFP responses for physical and financial energy, fuel, related transportation transactions, and tools and systems needed to manage the risks of participation in energy markets;
� Discussing elements of energy risk management best practices and developing an GWP ERMC opinion of their specific practicality;
� Overseeing the implementation and review of related Standard Operating Procedures and changes to them;
� Conducting other activities relevant to the implementation and oversight of this Policy and related policies, as defined in Section 5, and procedures;
� Recommending to the GWP General Manager the proper organizational structure, separation or consolidation of functional risk management activities;
� Periodically reviewing GWP’s energy risk management program and Risk Registry (a detailed review at least once a year) due to changes in business practices, improved procedures, GWP’s philosophy and strategy, or market changes; and ensuring continued compliance with its established guidelines;
� Reviewing this Policy and related policies as defined in Section 5, on an annual basis and recommending changes to this Policy to the City Manager for submittal to the City Council for approval; and
� Approving and periodically reviewing the related policies defined in Section 5.
3.5 GWP CHIEF ASSISTANT GENERAL MANAGER, ASSISTANT GENERAL MANAGER, DEPUTY GENERAL MANAGER, AND INTEGRATED RESOURCES PLANNING ADMINISTRATOR (POWER MANAGEMENT SERVICES)
The GWP Chief Assistant General Manager, Assistant General Manager, Deputy General Manager, and Integrated Resources Planning Administrator, as relates to Power Management Services, oversee the “front office,” reports directly to the GWP General Manager, is responsible for GWP’s overall energy supply, and shall:
Energy Risk Management Policy
Glendale Water & Power 07/01/2019
10
� Develop and maintain retail load forecasts and retail fuel and purchase power budgets;
� Assure compliance with this Policy and related policies, as defined in Section 5, by the Energy Trading Manager and Marketers, Analysts and Schedulers, Real-time Traders or Authorized Agents, and the GWP Power Contacts Manager involved in energy risk management activities;
� Establish a review and approval process to provide timely responses to issues arising from day-to-day operations;
� Oversee the development of hedge strategies to manage GWP’s energy exposure;
� Recommend hedge strategies to the GWP ERMC that address GWP’s plans to manage its energy exposure;
� Oversee the development of procedures for Energy Marketers, Schedulers, and Real-time Traders as needed;
� Support and assist in the preparation of reports listed in Section 6.1, Reporting Requirements; and
3.6 GWP ASSISTANT GENERAL MANAGER, DEPUTY GENERAL MANAGER, AND BUSINESS TRANSFORMATION AND MARKETING ADMINISTRATOR (BUSINESS SERVICES)
The GWP Assistant General Manager, Deputy General Manager, and Business Transformation and Marketing Administrator, as relates to Business Services, reports directly to the GWP General Manager, has responsibility for GWP’s marketing development and operations activities, and shall:
� Oversee the responsibilities of the GWP Utility Manager (Financial) and GWP Business Systems Support Manager;
� Provide management oversight for the direction and coordination of customer service activities with other sections of the utility;
� Direct marketing and public information activities of the utility. Oversee the development, implementation, promotion, evaluation, and modification of GWP customer relations, marketing, demand-side management, utility conservation, renewable energy, and revenue enhancing programs across all customer segments;
� Direct the activities of support service functions for the utility; � Prepare written reports and correspondence, and recommend procedural
changes to improve efficient operation of the section; � Prepare and monitor GWP budget and overall financial health of the utility; � Lead the utility wide change management effort with respect to smart grid
and related innovation. Responsible for the development and implementation of strategic and technology work plans;
� Direct personnel and activities in the development of distributed resources, dynamic rates, including time of use, critical peak, and real time pricing, demand response, smart appliance, consumer device, advanced storage,
Energy Risk Management Policy
Glendale Water & Power 07/01/2019
11
peak-shaving, new web based services, and other smart grid program options for empowering consumers;
� Assure compliance with the Energy Risk Management Policy and related policies, as defined in Section 5; and
� Serve on the GWP ERMC.
3.7 GWP ENERGY TRADING MANAGER, ENERGY MARKETERS, ANALYSTS AND SCHEDULERS, AND REAL- TIME TRADERS OR AUTHORIZED AGENTS
The GWP Energy Trading Manager, Energy Marketers, Schedulers, and Real Time Traders reports directly to the authority under section 3.5 and shall:
� Represent the “front office” in GWP’s energy risk management organization; The “front office” is responsible for energy trading, operations, portfolio optimization, load forecasting, transaction and scheduling, generating resource optimization, and hedging;
� Assure daily compliance with the Energy Risk Management Policy and related policies, as defined in Section 5, and timely responses to issues arising from day-to-day operations;
� Execute and manage energy transactions (purchases, sales, and hedges) in accordance with approved hedge strategies and within the requirements specified in the Trading Authority Delegation;
� Understand the types of transactions individuals may engage in to manage the energy portfolio;
� Adhere to the transaction approval process; � Actively acquire and analyze market intelligence and assist in developing
hedge strategies; � Prepare transaction analyses and reports; and � Communicate market intelligence within GWP’s risk management
organization; and � The GWP Energy Trading Manager will serve on the GWP ERMC.
3.8 GWP ENERGY RISK MANAGER
GWP’s Independent Risk Management Function is led by the GWP Energy Risk Manager. The GWP Energy Risk Manager represents the “middle office” in GWP’s energy risk management organization. The responsibilities of the GWP Energy Risk Manager include ensuring reports covering GWP’s energy portfolio position and credit exposures are prepared and reporting compliance with energy risk management policies and procedures. The GWP Energy Risk Manager also leads the development and review of business processes and internal control improvements throughout the energy transaction lifecycle. The GWP Energy Risk Manager will provide risk assessment input to the hedge planning and transacting activity, but will maintain a strict separation of duties. The GWP
Energy Risk Management Policy
Glendale Water & Power 07/01/2019
12
Energy Risk Manager will brief the GWP General Manager, as requested, regarding recent GWP energy risk management activities.
The GWP Energy Risk Manager will serve as facilitator of the GWP ERMC and reports directly to the GWP General Manager. In addition, the GWP Energy Risk Manager shall:
� Perform responsibilities delegated by the GWP ERMC; � Organize and conduct the GWP ERMC meetings; � Engage the EMRC in discussions regarding emerging risks, events and
developments that could expose GWP to potential losses; � Develop, recommend, and administer risk management processes and
procedures, including best practice procedures; � Provide and administer energy risk management education/training to
GWP management and staff; � Review energy risk management activities and risk controls, and
recommend modifications of controls to meet changing business needs; � Review adequacy and accuracy of reports, and report any deficiencies to
the GWP ERMC. Recommend actions to address deficiencies; � Assess energy risks to GWP in aggregate, by business unit, and by
material business activity; � Ensure compliance, review, and recommend changes to the Energy Risk
Management Policy and related policies, as defined in Section 5, and energy risk management procedures, as appropriate;
� Monitor compliance of transactions with GWP’s Trading Authority Policy and Trading Authority Delegation and monitor GWP’s portfolio for compliance with GWP’s Hedge Policy;
� Report to the GWP ERMC and GWP General Manager on GWP’s compliance with its energy risk policies and energy risk management in accordance with policies;
� Manage credit exposure in compliance with the GWP Credit Policy; � Report mark-to-market forward energy transactions for credit exposure
purposes; � Review and evaluate proposed longer-term transactions to be executed by
GWP and ensure adequate analysis has been performed with proper assessment and mitigation of any such risk consistent with energy risk management objectives, risk tolerance guidelines, and energy risk management policies, including the financial, legal, credit, regulatory, reliability, and operational impacts;
� Ensure the responsibilities of the GWP ERMC, as outlined in the Policy, are fulfilled;
� Provide advice regarding the effectiveness of tools used or evaluated to assist in energy risk management for measuring, monitoring, and reporting performance;
Energy Risk Management Policy
Glendale Water & Power 07/01/2019
13
� Validate the tools and data used throughout GWP to measure, monitor, and report risk;
� Support periodic internal audits of GWP risk control policies, processes and procedures with CoG Internal Audit to ensure overall operational compliance;
� Conduct periodic review and update of the GWP Risk Registry, including status of mitigation plans and risk prioritization, and ensure effective strategies are in place to mitigate the top energy risks;
� Review and advise the GWP ERMC and the GWP General Manager of risk exposures in the GWP Risk Registry;
� Ensure Standard Operating Procedures and Allegro Business Process Documents for each of the functional areas that fall under the Policy umbrella are maintained and updated, as necessary;
� Be responsible for the oversight and effectiveness of GWP’s energy risk management policies, procedures, and trading control environment;
� Review and recommend, to the GWP ERMC, changes to functional activities, as appropriate, to ensure proper segregation of duties;
� Provide a timely summary of GWP ERMC accomplishments for the past year and goals for the upcoming year to the GWP ERMC and GWP General Manager;
� Lead and assist in the preparation of reports listed in Section 6.1, Reporting Requirements;
� Participate, as required, on committees and working groups such as risk management, legislative, regulatory, and cybersecurity; and
� Report regularly to the GWP ERMC, the following information, at a minimum, but not limited to:
o Portfolio modeling risk measures (1-60 months); o Power cost projections and confidence intervals; o Production output and operational concerns; o Credit and contract risk exposures; o Hedging strategies; o Energy policy and procedural violations; o Regulatory and reliability compliance; o Business continuity; o Physical and cyber security in coordination with the City’s
Information Systems Department; o Updates to the GWP Risk Registry; and o Other Key Performance Indicators that support effective energy risk
management
3.9 GWP POWER CONTRACTS MANAGER
The GWP Power Contracts Manager reports directly to the authority under section 3.5 and recommends, negotiates, and prepares the City's power resource contracts and agreements in accordance with the direction and goals established
Energy Risk Management Policy
Glendale Water & Power 07/01/2019
14
by GWP management. The GWP Power Contracts Manager represents the “middle office” in GWP’s energy risk management organization. The GWP Power Contracts Manager shall:
� Actively participate in regulatory, legal, and project administration efforts. � Identify and assist in the negotiation and evaluation of contracts, including
resource purchases and sales, transmission, natural gas, transportation, renewables and emissions, settlement, interconnection, interchange, development, participation, operation, and agreements;
� Monitor and support the GWP’s participation in utility industry’s federal, state, and local regulatory authority activities;
� Review, evaluate, revise, and author contracts, regulatory filings, and legal filings related to the GWP's energy resource operations;
� Review and ensure the GWP is in compliance with contractual terms and is receiving similar compliance from contracting parties in accordance with prepared task lists, schedules and loss calculations, procedures, and guidelines for administering and evaluating all energy resource related agreements;
� Evaluate existing and proposed contractual arrangements and recommend desirable modifications for the purpose of optimizing the GWP's benefits;
� Analyze and recommend resource-operating strategies and assist in the creation of contractual guidelines for related resource functions; and
� Support strategies related to legal disputes. � Assign appropriate funding based on contract terms and budget; and � Notify GWP Management if it is anticipated that there will be inadequate
funds available in the budget to transact; � Adhere to confirmation process by confirming trades executed under
enabling agreements; � Manage the counterparty approval, credit, and collateral management
processes; � Develop and manage Power Management’s budget for bulk power, gas,
transmission, transportation, environmental commodities, and related contractual services;
� Oversee trade capture and validation activities including actualization of trades, etags, generation resource data, and review accuracy, completeness, and timeliness of data in the trading system;
� Monitor and manage Renewable Energy Credits as it relates to creation, transfer, and retirement for RPS Compliance;
� Carbon Allowance allocations, offsets, and mandatory greenhouse gas emissions reporting and verification;
� Assure compliance with the Energy Risk Management Policy and related policies, as defined in Section 5; and
� Serve as “Energy Risk Manager” back-up.
Energy Risk Management Policy
Glendale Water & Power 07/01/2019
15
3.10 GWP UTILITY MANAGER (FINANCIAL)
The GWP Utility Manager (Financial) reports directly to the authority under section 3.6 and manages the “back office” in GWP’s energy risk management organization. The Back Office, as part as the GWP Finance, provides settlement services; documents the required accounting treatment of forward transactions; and provides the related valuation of these transactions to enable the preparation of invoices and reporting of forward transactions in GWP’s financial statements in accordance with prevailing accounting rules. The GWP Utility Manager (Financial) shall:
� Oversee and monitor the back office for transactional analysis and accuracy;
� Develop and apply accounting policies to financial transactions; � Oversee the settlement of transactions (verification, accounts
payable/receivable process); � Correctly classify and report transactions. (Certain transactions may differ
in their reporting requirements, depending on whether they qualify as “existing assets, liabilities, and firm commitments” or “anticipated transactions” for hedge accounting. CoG Finance shall determine how transactions are classified for reporting purposes and ensure that hedges are accounted for in accordance with generally accepted accounting principles.);
� Be responsible for Dodd-Frank compliance; � Provide appropriate funding. (CoG Finance shall maintain control
procedures over electronic funds transfer for payments and collections. This is intended to ensure that cash payments are properly disbursed and authorized trades are independently confirmed and processed.); and Notify GWP Management and the Power Contracts Manager if GWP Finance anticipates there will be inadequate funds available in the budget to transact.
� Supports CoG Finance in preparing the Comprehensive Annual Financial Report (CAFR) that complies with the accounting requirements promulgated by the Governmental Accounting Standards Board (GASB);
� Participate, as required, on finance committees and working groups; � Assure compliance with the Energy Risk Management Policy and related
policies, as defined in Section 5; and � Serve on the GWP ERMC.
Under no circumstances will members of the GWP Finance be given the authority to enter into any energy transactions on behalf of the utility.
Energy Risk Management Policy
Glendale Water & Power 07/01/2019
16
3.11 GWP BUSINESS SYSTEMS SUPPORT MANAGER
The GWP Business Systems Support Manager reports directly to the authority under section 3.6 and has the responsibility of managing, directing, and coordinating the planning and implementation of major utility technology projects. GWP’s Business Systems Support Manager shall:
� Manage, support, and maintain the Energy Trading and Risk Management (ETRM) applications, databases, backups, and redundancies;
� Conduct quarterly audits of ETRM users access and provide reporting to management as needed;
� Maintain OATI security and certificate management; � Administer all aspects of IT security with firewall monitoring; � Develops and maintains GWP cybersecurity training, procedures, and
policies; � Participate, as required, on cybersecurity committees and working groups. � Coordinate information technology activities with City’s Information
Services; � Assure compliance with the Energy Risk Management Policy and related
policies, as defined in Section 5; and � Serve on the GWP ERMC
3.12 CITY OF GLENDALE FINANCE
The Finance Department provides timely, accurate, clear and concise information to the City Council, City Manager, GWP General Manager, GWP ERMC, and various City Departments and is dedicated to managing the City’s resources in a fiscally conservative manner. City of Glendale’s Director of Finance shall:
� Provide support and assistance on GWP financial and budgetary issues; � Provide long range financial planning functions including revenue and
operational expense projections; � Provide recommendations on operations effectiveness measures, and
revenue strategies; � Review existing and proposed ordinances, statues, resolutions, and other
documents; � Direct the City’s energy risk management functions including litigation,
insurance, and external auditors; � Confer on financial policies and procedures; � Assure compliance with this Policy and related policies, as defined in
Section 5; and � Serve on the GWP ERMC.
Energy Risk Management Policy
Glendale Water & Power 07/01/2019
17
3.13 CITY OF GLENDALE LEGAL
The City Attorney's Office is committed to providing professional, quality legal services that ultimately protect the interests of the City of Glendale, its departments, and the City Council. City of Glendale’s City Attorney shall:
� Review the Policy and the related policies, as defined in Section 5, and
recommend updates as appropriate in compliance with the City Charter and applicable law;
� Negotiate master/enabling agreements with counter-parties as directed by the authority under section 3.5 and GWP Power Contracts Manager;
� Assess legal enforceability of contracts with applicable laws and regulations;
� Assure compliance with the Energy Risk Management Policy and related policies, as defined in Section 5; and
� Serve on the GWP ERMC.
3.14 CITY OF GLENDALE AUDIT
The City of Glendale Internal Audit assists the City in improving operations by providing independent audits and consulting services designed to add value and promote transparency, accountability, efficiency and effectiveness. The Internal Audit Manager shall:
� Verify proper segregation of external and internal reporting, energy risk
management, accounting, treasury, and trading duties and maintenance of files;
� Sample and review activities for compliance with related policies and procedures;
� Document and report audit findings to GWP ERMC, including compliance with and discrepancies from this Policy and the related policies, as defined in Section 5, as well as any other irregularity which could expose GWP to financial or operational risk; and
� Serve on the GWP ERMC.
3.15 CONFLICT OF INTEREST AND COMPLIANCE
Potential conflict of interest by persons directly affected by this Policy is covered by State law and City of Glendale’s citywide Conflict of Interest Charter Code. All City of Glendale employees who hold positions mentioned in this Policy or perform functions described herein shall not enter into, or direct others to enter into, any wholesale energy transactions or other related transactions other than on behalf of GWP, the City of Glendale, or its authorized agents.
Energy Risk Management Policy
Glendale Water & Power 07/01/2019
18
4. SCOPE OF BUSINESS ACTIVITIES GOVERNED BY THIS POLICY
The scope of this Policy is designed to address the management of the energy risks associated with GWP, as documented in GWP’s Risk Registry. The GWP Risk Registry is a comprehensive list of risks that affect GWP’s short-term business operations and long-term strategic planning and is maintained by the GWP Energy Risk Manager. The GWP Risk Registry is comprised of Tier1, Tier 2, and Tier 3 risks distinguished by business category and prioritized by impact and likelihood. GWP and CoG personnel have been identified as the owners of each risk and are responsible for developing strategies to mitigate each risk. The number of risks may vary dictated by business and market changes. The GWP Risk Registry reporting requirement is outlined in Section 6.1. 5. RELATED POLICIES AND REGISTRY
Supporting related policies and registry are identified below. Responsibility for their approval, modification, oversight, and compliance shall be consistent with the organization and governance of this Policy (Section 3). * Denoted CoG City Council responsibility for final approval.
� GWP Trading Authority Policy* � GWP Trading Sanctions Policy � GWP Credit Policy � GWP Hedge Policy � GWP Business Continuity Policy � GWP Cyber Security Policy � GWP Risk Registry � GWP Electric Cash Reserves Policy*
6. REPORTING
Reports required by this Policy communicate the market and credit risks assumed by GWP, and provide information to evaluate the portfolio performance and the effectiveness of the energy risk management program. The reports should be used as a basis for management discussions to determine future energy transactions and strategy.
6.1 REPORTING REQUIREMENTS
Management reporting will act as a formal means of communicating the performance of energy transactions and management decisions. On an ongoing basis, management and staff must also establish sufficient communications among parties with responsibilities relative to this Policy.
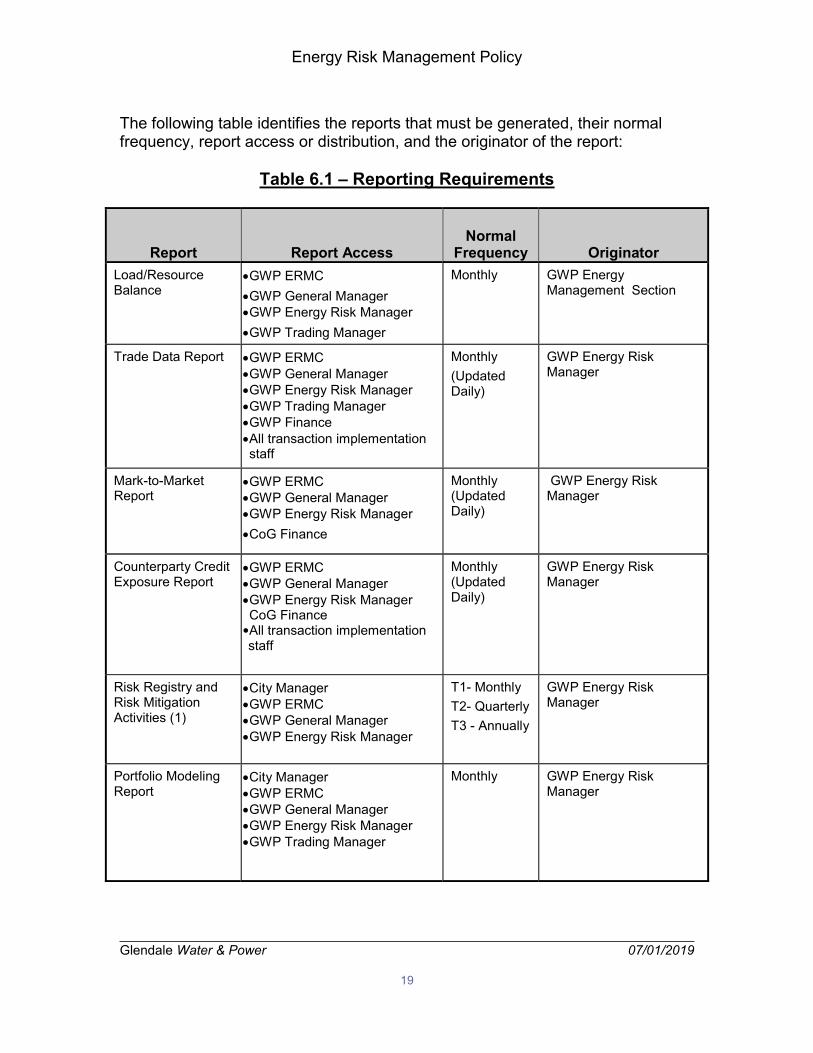
Energy Risk Management Policy
Glendale Water & Power 07/01/2019
19
The following table identifies the reports that must be generated, their normal frequency, report access or distribution, and the originator of the report:
Table 6.1 – Reporting Requirements
Report
Report Access
Normal
Frequency
Originator Load/Resource Balance
� GWP ERMC � GWP General Manager � GWP Energy Risk Manager � GWP Trading Manager
Monthly GWP Energy Management Section
Trade Data Report � GWP ERMC � GWP General Manager � GWP Energy Risk Manager � GWP Trading Manager � GWP Finance � All transaction implementation staff
Monthly (Updated Daily)
GWP Energy Risk Manager
Mark-to-Market Report
� GWP ERMC � GWP General Manager � GWP Energy Risk Manager � CoG Finance
Monthly (Updated Daily)
GWP Energy Risk Manager
Counterparty Credit Exposure Report
� GWP ERMC � GWP General Manager � GWP Energy Risk Manager CoG Finance
�All transaction implementation staff
Monthly (Updated Daily)
GWP Energy Risk Manager
Risk Registry and Risk Mitigation Activities (1)
� City Manager � GWP ERMC � GWP General Manager � GWP Energy Risk Manager
T1- Monthly T2- Quarterly T3 - Annually
GWP Energy Risk Manager
Portfolio Modeling Report
� City Manager � GWP ERMC � GWP General Manager � GWP Energy Risk Manager � GWP Trading Manager
Monthly GWP Energy Risk Manager
Energy Risk Management Policy
Glendale Water & Power 07/01/2019
20
(1) As required in Section 3.3, GWP General Manager Responsibilities, the GWP General Manager shall report to the City Manager, annually, on the risk profile of the energy portfolio and on the results of energy risk management activities.
7. POLICY REVIEW
Following approval of this Policy, the GWP ERMC shall periodically, no less than annually, review the Policy and the related policies, as defined in Section 5, and recommend updates as appropriate in coordination with the GWP General Manger. Examples of events prompting updates to this Policy and related policies and reviews are changes in regulatory requirements, significant changes in the resource portfolio, significant changes in variable energy prices of alternative resources, changes in regulations, and reliability concerns.
8. PROCEDURES
Standard Operating Procedures (SOPs) shall be developed for each functional area to provide specific operating criteria and parameters for day-to-day energy risk management activities as needed. The operating criteria and parameters shall be updated as frequently as appropriate to reflect changes in market conditions and staffing levels. The SOPs shall be approved by the functional leader and monitored and reviewed by the GWP ERMC.
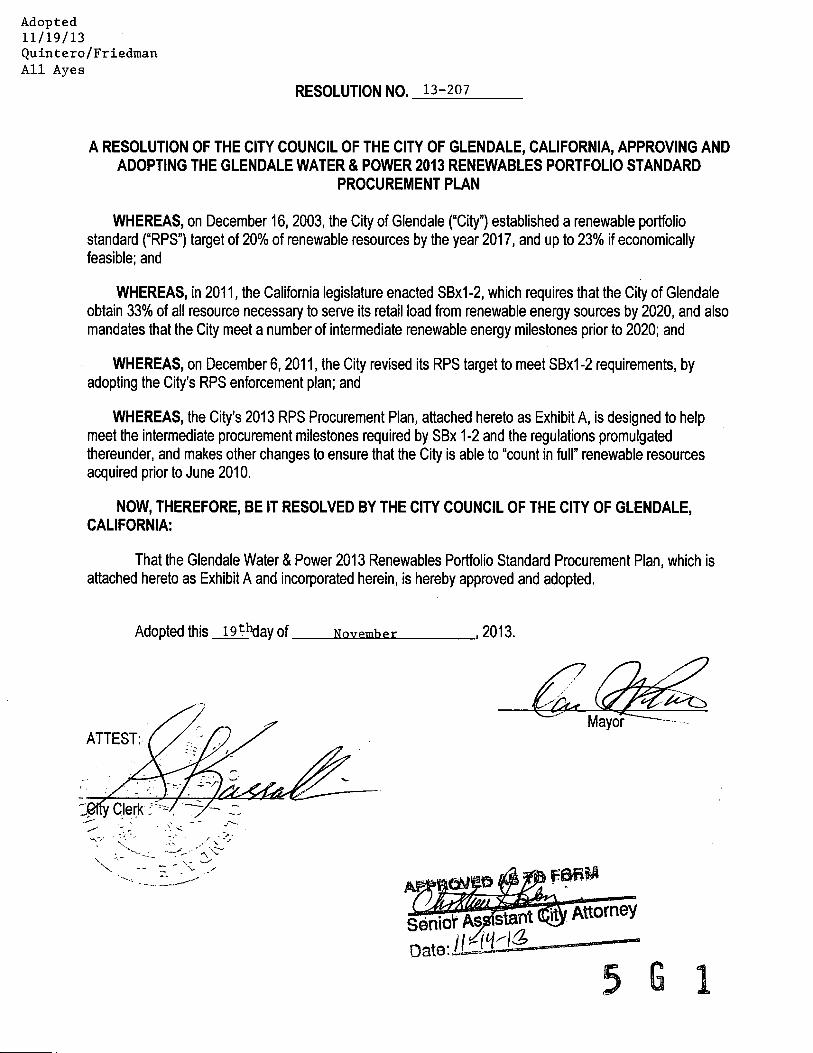

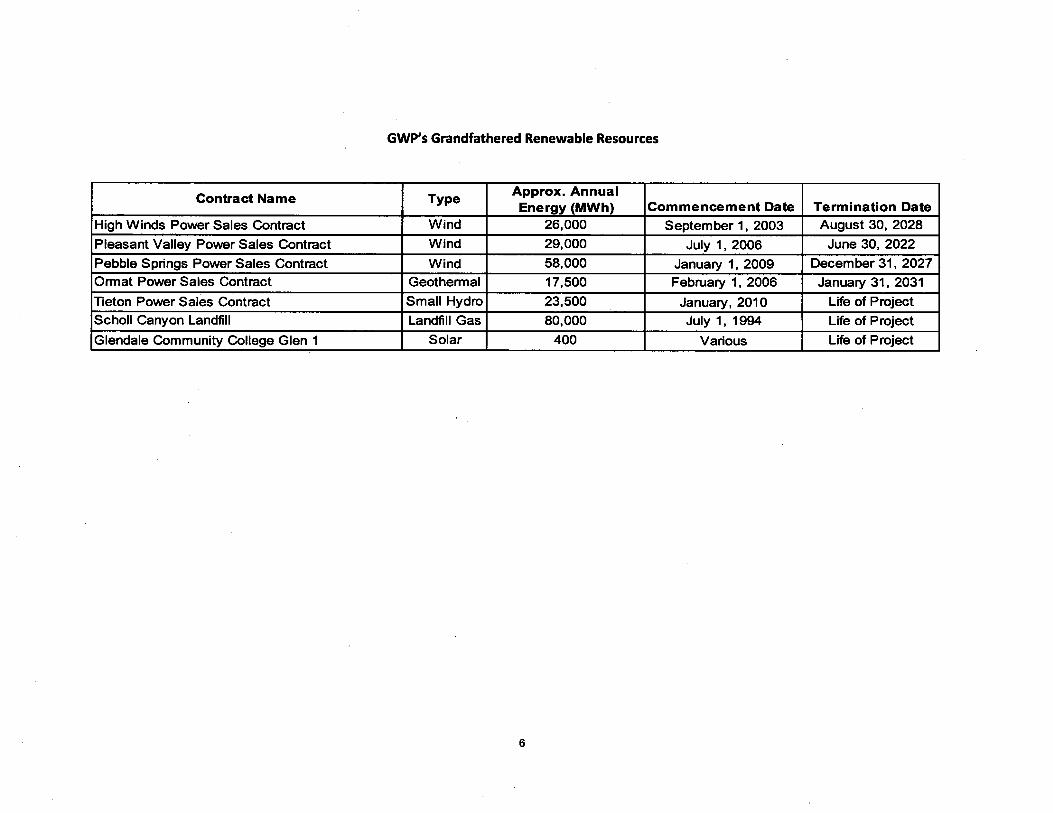
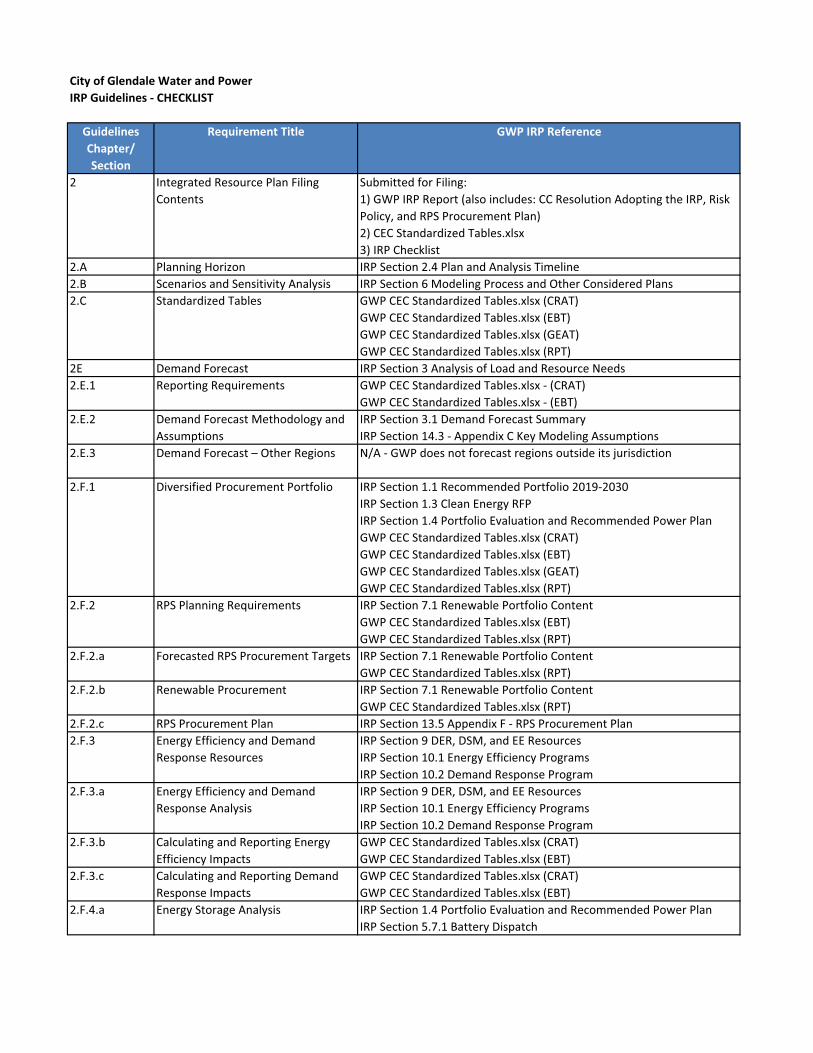
City�of�Glendale�Water�and�PowerIRP�Guidelines���CHECKLIST
Guidelines�Chapter/Section
Requirement�Title GWP�IRP�Reference
2 Integrated�Resource�Plan�Filing�Contents
Submitted�for�Filing:1)�GWP�IRP�Report�(also�includes:�CC�Resolution�Adopting�the�IRP,�Risk�Policy,�and�RPS�Procurement�Plan)2)�CEC�Standardized�Tables.xlsx3)�IRP�Checklist
2.A Planning�Horizon IRP�Section�2.4�Plan�and�Analysis�Timeline�2.B Scenarios�and�Sensitivity�Analysis IRP�Section�6�Modeling�Process�and�Other�Considered�Plans2.C Standardized�Tables GWP�CEC�Standardized�Tables.xlsx�(CRAT)
GWP�CEC�Standardized�Tables.xlsx�(EBT)GWP�CEC�Standardized�Tables.xlsx�(GEAT)GWP�CEC�Standardized�Tables.xlsx�(RPT)
2E Demand�Forecast IRP�Section�3�Analysis�of�Load�and�Resource�Needs2.E.1 Reporting�Requirements GWP�CEC�Standardized�Tables.xlsx���(CRAT)
GWP�CEC�Standardized�Tables.xlsx���(EBT)2.E.2 Demand�Forecast�Methodology�and�
AssumptionsIRP�Section�3.1�Demand�Forecast�SummaryIRP�Section�14.3���Appendix�C�Key�Modeling�Assumptions
2.E.3 Demand�Forecast�–�Other�Regions N/A���GWP�does�not�forecast�regions�outside�its�jurisdiction
2.F.1 Diversified�Procurement�Portfolio IRP�Section�1.1�Recommended�Portfolio�2019�2030IRP�Section�1.3�Clean�Energy�RFPIRP�Section�1.4�Portfolio�Evaluation�and�Recommended�Power�PlanGWP�CEC�Standardized�Tables.xlsx�(CRAT)GWP�CEC�Standardized�Tables.xlsx�(EBT)GWP�CEC�Standardized�Tables.xlsx�(GEAT)GWP�CEC�Standardized�Tables.xlsx�(RPT)
2.F.2 RPS�Planning�Requirements IRP�Section�7.1�Renewable�Portfolio�ContentGWP�CEC�Standardized�Tables.xlsx�(EBT)GWP�CEC�Standardized�Tables.xlsx�(RPT)
2.F.2.a Forecasted�RPS�Procurement�Targets IRP�Section�7.1�Renewable�Portfolio�ContentGWP�CEC�Standardized�Tables.xlsx�(RPT)
2.F.2.b Renewable�Procurement IRP�Section�7.1�Renewable�Portfolio�ContentGWP�CEC�Standardized�Tables.xlsx�(RPT)
2.F.2.c RPS�Procurement�Plan IRP�Section�13.5�Appendix�F���RPS�Procurement�Plan2.F.3 Energy�Efficiency�and�Demand�
Response�ResourcesIRP�Section�9�DER,�DSM,�and�EE�ResourcesIRP�Section�10.1�Energy�Efficiency�ProgramsIRP�Section�10.2�Demand�Response�Program
2.F.3.a Energy�Efficiency�and�Demand�Response�Analysis
IRP�Section�9�DER,�DSM,�and�EE�ResourcesIRP�Section�10.1�Energy�Efficiency�ProgramsIRP�Section�10.2�Demand�Response�Program
2.F.3.b Calculating�and�Reporting�Energy�Efficiency�Impacts
GWP�CEC�Standardized�Tables.xlsx�(CRAT)GWP�CEC�Standardized�Tables.xlsx�(EBT)
2.F.3.c Calculating�and�Reporting�Demand�Response�Impacts
GWP�CEC�Standardized�Tables.xlsx�(CRAT)GWP�CEC�Standardized�Tables.xlsx�(EBT)
2.F.4.a Energy�Storage�Analysis IRP�Section�1.4�Portfolio�Evaluation�and�Recommended�Power�PlanIRP�Section�5.7.1�Battery�Dispatch
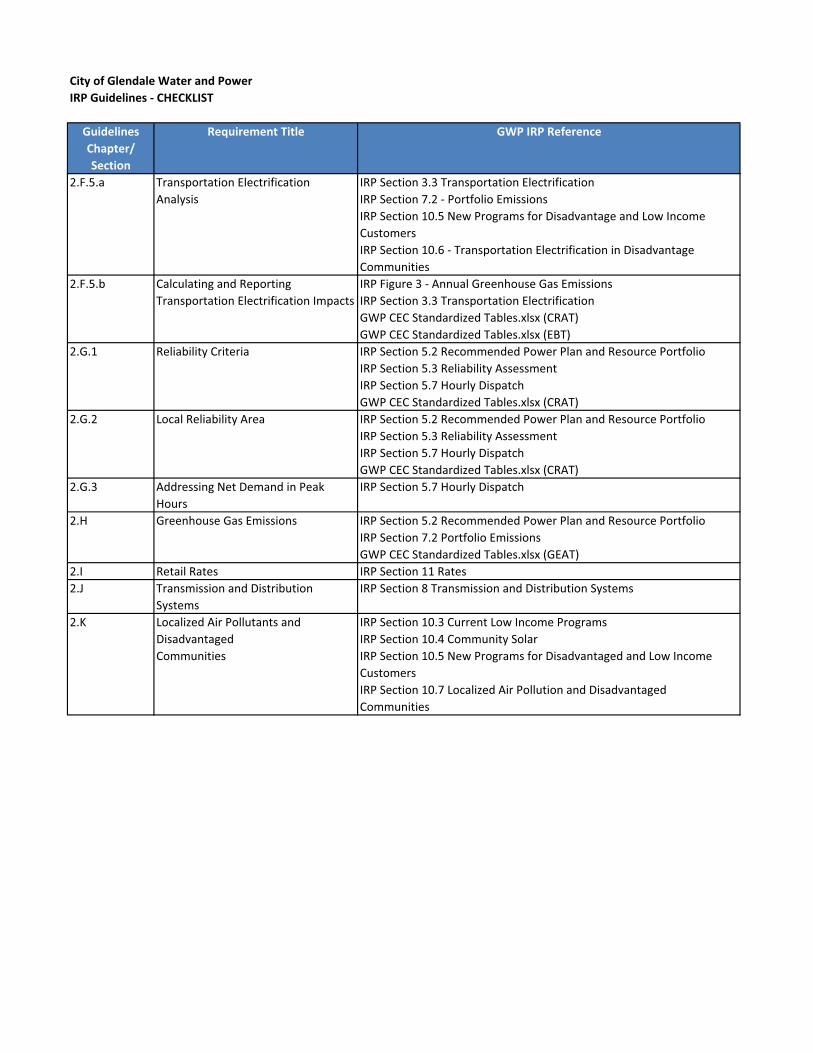
City�of�Glendale�Water�and�PowerIRP�Guidelines���CHECKLIST
Guidelines�Chapter/Section
Requirement�Title GWP�IRP�Reference
2.F.5.a Transportation�Electrification�Analysis
IRP�Section�3.3�Transportation�ElectrificationIRP�Section�7.2���Portfolio�EmissionsIRP�Section�10.5�New�Programs�for�Disadvantage�and�Low�Income�CustomersIRP�Section�10.6���Transportation�Electrification�in�Disadvantage�Communities
2.F.5.b Calculating�and�Reporting�Transportation�Electrification�Impacts
IRP�Figure�3���Annual�Greenhouse�Gas�Emissions�IRP�Section�3.3�Transportation�ElectrificationGWP�CEC�Standardized�Tables.xlsx�(CRAT)GWP�CEC�Standardized�Tables.xlsx�(EBT)
2.G.1 Reliability�Criteria IRP�Section�5.2�Recommended�Power�Plan�and�Resource�PortfolioIRP�Section�5.3�Reliability�AssessmentIRP�Section�5.7�Hourly�DispatchGWP�CEC�Standardized�Tables.xlsx�(CRAT)
2.G.2 Local�Reliability�Area IRP�Section�5.2�Recommended�Power�Plan�and�Resource�PortfolioIRP�Section�5.3�Reliability�AssessmentIRP�Section�5.7�Hourly�DispatchGWP�CEC�Standardized�Tables.xlsx�(CRAT)
2.G.3 Addressing�Net�Demand�in�Peak�Hours
IRP�Section�5.7�Hourly�Dispatch
2.H Greenhouse�Gas�Emissions IRP�Section�5.2�Recommended�Power�Plan�and�Resource�PortfolioIRP�Section�7.2�Portfolio�EmissionsGWP�CEC�Standardized�Tables.xlsx�(GEAT)
2.I Retail�Rates IRP�Section�11�Rates2.J Transmission�and�Distribution�
SystemsIRP�Section�8�Transmission�and�Distribution�Systems
2.K Localized�Air�Pollutants�and�DisadvantagedCommunities
IRP�Section�10.3�Current�Low�Income�ProgramsIRP�Section�10.4�Community�SolarIRP�Section�10.5�New�Programs�for�Disadvantaged�and�Low�Income�CustomersIRP�Section�10.7�Localized�Air�Pollution�and�Disadvantaged�Communities
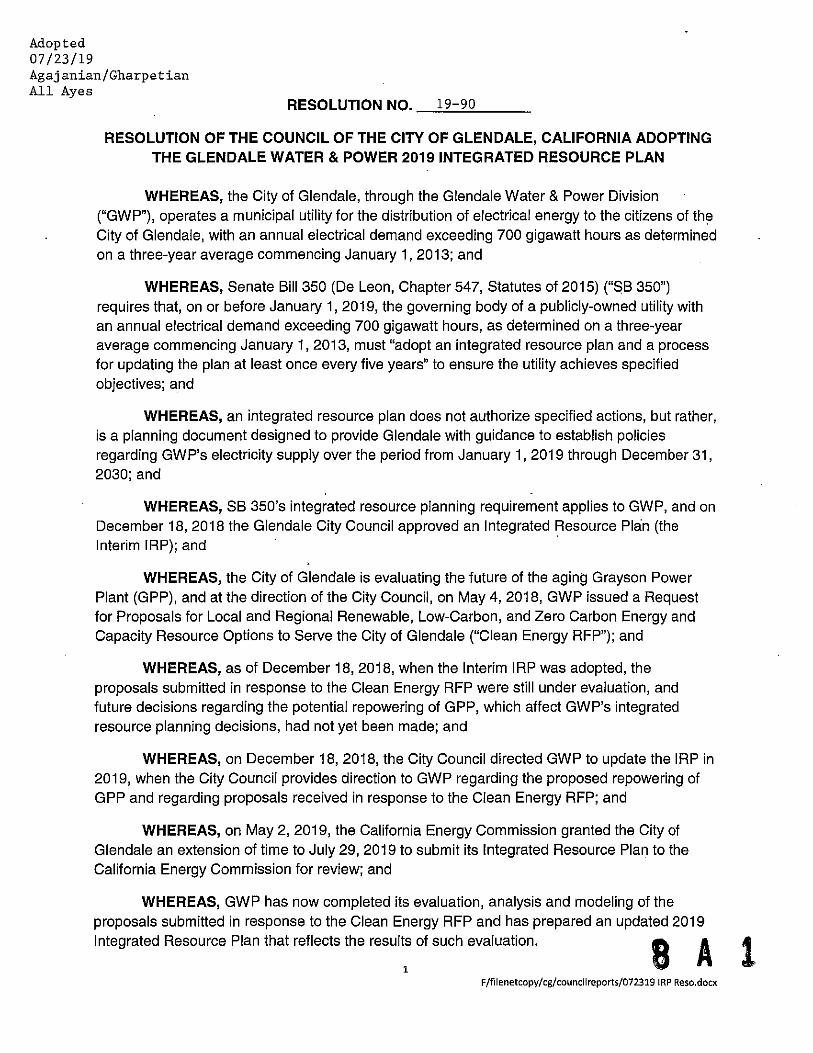
Related Documents