TM © 1999 Professional Postgraduate Services ® Perspectives on Lipid- Lowering Therapy With HMG-CoA Reductase Inhibitors

TM © 1999 Professional Postgraduate Services ® Perspectives on Lipid-Lowering Therapy With HMG-CoA Reductase Inhibitors.
Dec 23, 2015
Welcome message from author
This document is posted to help you gain knowledge. Please leave a comment to let me know what you think about it! Share it to your friends and learn new things together.
Transcript
TM
© 1999 Professional Postgraduate Services®
Perspectives on Lipid-Lowering Therapy With HMG-CoA
Reductase Inhibitors
TM
© 1999 Professional Postgraduate Services®
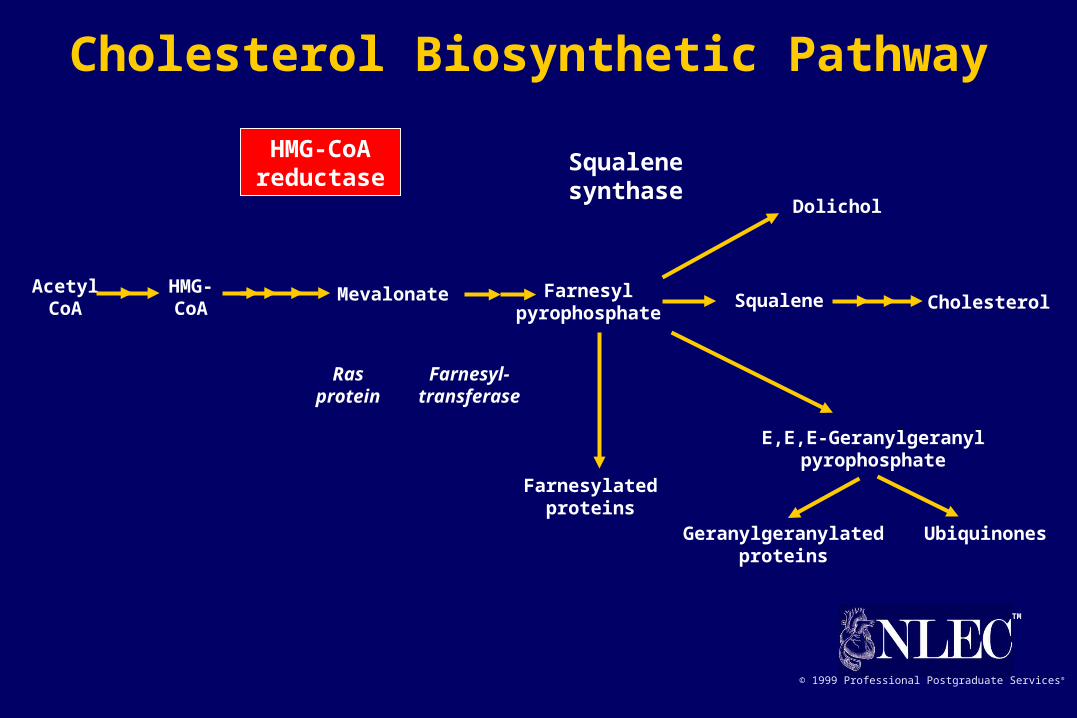
AcetylCoA
HMG-CoA
Mevalonate Farnesylpyrophosphate
Squalene Cholesterol
Squalenesynthase
Dolichol
HMG-CoAreductase
Rasprotein
Farnesyl-transferase
Farnesylatedproteins
E,E,E-Geranylgeranylpyrophosphate
Geranylgeranylatedproteins
Ubiquinones
Cholesterol Biosynthetic Pathway

TM
© 1999 Professional Postgraduate Services®
Agents LDL-C HDL-C VLDL-C
Bile acid sequestrants clearance (modest ) secretion
Niacin synthesis clearance synthesis
Fibric acid derivatives (modest ) synthesis clearance
HMG-CoA reductase clearance (modest ) clearanceinhibitors (statins) synthesis*
* with atorvastatin
Metabolic Effects of Lipid-Lowering Agents on Lipoproteins
Adapted from Levy et al. Circulation. 1993;87:III45-III53.
TM
© 1999 Professional Postgraduate Services®
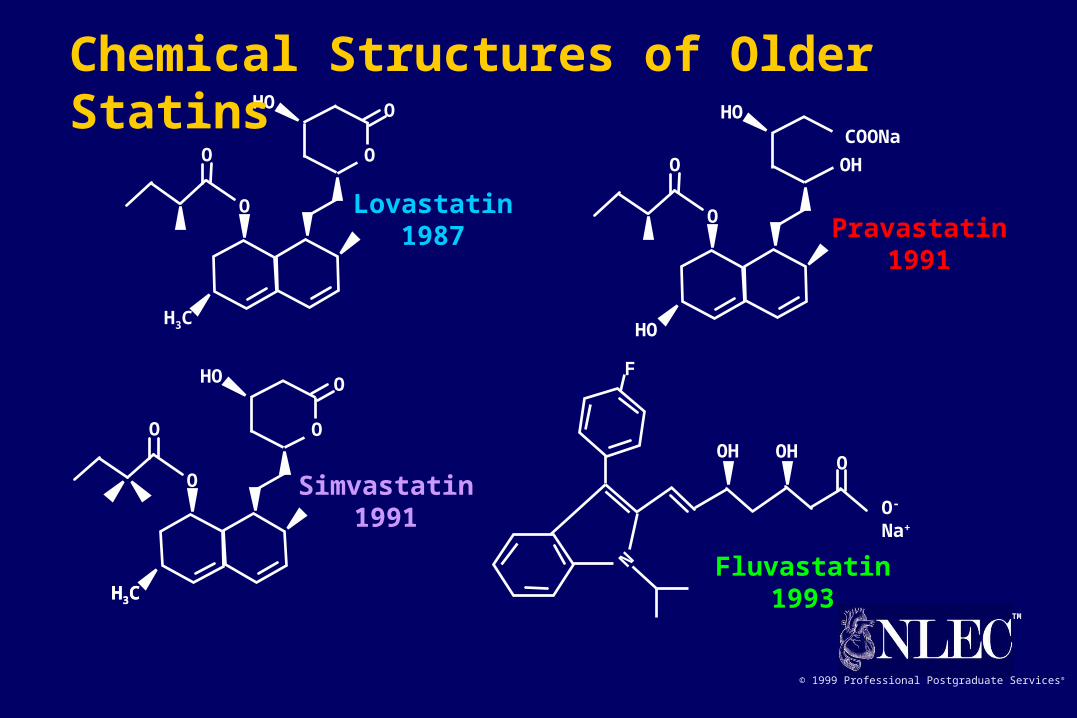
Lovastatin1987 Pravastatin
1991
Simvastatin1991
Fluvastatin1993
H3
C
OHO
O
O O
N
F
OOHOH
O- Na+
HO
HO
O
O
COONaO
H
H3
C
O
O
HO
O
O
H3
C
Chemical Structures of Older Statins
TM
© 1999 Professional Postgraduate Services®
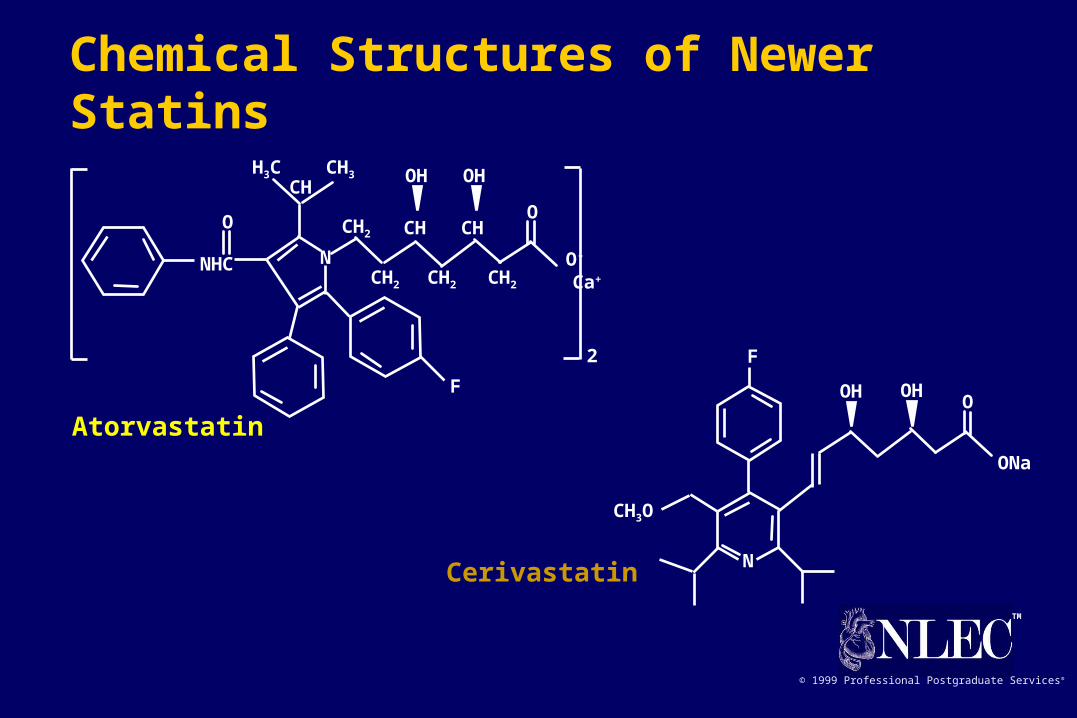
Atorvastatin
Cerivastatin
F
OOHOH
ONa
N
CH3O
O
OHOH
NNHC
O
F
O-
Ca+
2
H3C CH3
CH
CH2 CH2 CH2
CH2 CH CH
Chemical Structures of Newer Statins

TM
© 1999 Professional Postgraduate Services®
* Not FDA approved.
Atorvastatin Simvastatin Lovastatin Pravastatin Fluvastatin Cerivastatin TC LDL-C
— 10 20 20 40 0.2* 22 27
10 20 40 40 80 0.4 27 34
20 40 80 32 41
40 80 37 48
80 160* 42 55
Dose (mg) of agent % Reduction
Comparative Efficacy of Available Statins
Roberts WC. Am J Cardiol. 1997;80:106-107.Stein E et al. J Cardiovasc Pharmacol Therapeut. 1997;2:7-16.

TM
© 1999 Professional Postgraduate Services®
Cerivastatin 0.1 mg bidCerivastatin 0.2 mg qpmPlacebo
* Significantly different from placebo (P<0.05).† Significantly different from 0.1 mg bid (P<0.05).
Stein E et al. J Cardiovasc Pharmacol Therapeut. 1997;2:7-16.
Mean % + after 4 wk
TC LDL-C HDL-C TG ApoB
5.3
-29.4
2.3
-23.0
-1.4 -1.2-3.1
-0.4
-11.6
-18.9-21.4
-25.7
-11.6
-21.9
-0.01
-30
-25
-20
-15
-10
-5
0
5
10
*
**
*†
**
*
*†
Lipid Lowering With Cerivastatin in Primary Hypercholesterolemia

TM
© 1999 Professional Postgraduate Services®
-40
-30
-20
-10
0
10
20
LDL-C TC LDL-C Lova TC Lova
%+
Insull W et al. JACC. 1997;29(suppl A):46A.
Dose (mg)
0 0.05 0.1 0.15 0.2 0.25 0.3 40
Cerivastatin: TC and LDL-C Lowering in Patients With Primary Hypercholesterolemia
TM
© 1999 Professional Postgraduate Services®
-70
-60
-50
-40
-30
-20
-10
0
Baseline Week 2 Week 4 Last DB visit
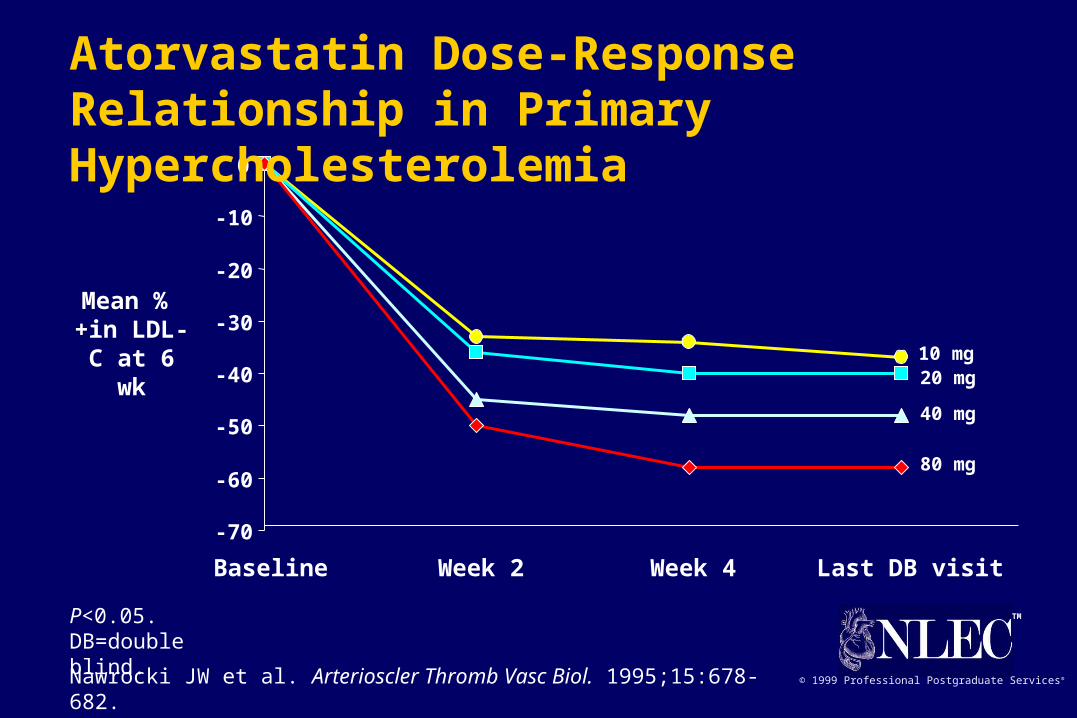
Mean % +in LDL-C
at 6 wk
P<0.05.DB=double blind.
Nawrocki JW et al. Arterioscler Thromb Vasc Biol. 1995;15:678-682.
10 mg20 mg
40 mg
80 mg
Atorvastatin Dose-Response Relationship in Primary Hypercholesterolemia
TM
© 1999 Professional Postgraduate Services®
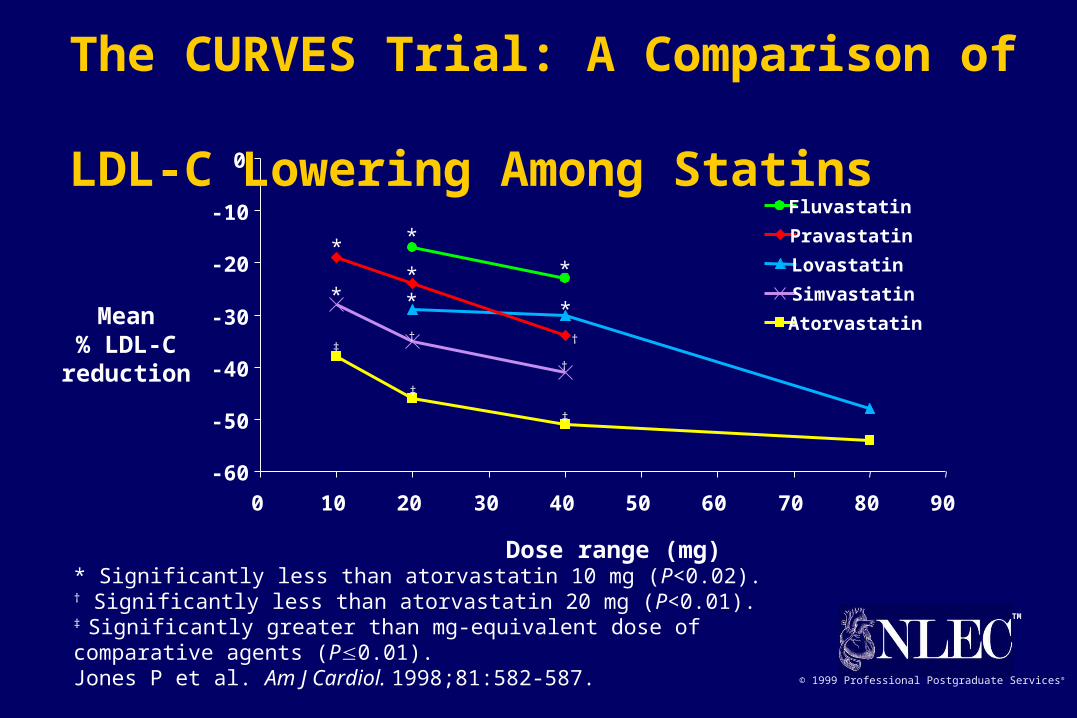
* Significantly less than atorvastatin 10 mg (P<0.02).† Significantly less than atorvastatin 20 mg (P<0.01).‡ Significantly greater than mg-equivalent dose of comparative agents (P0.01).Jones P et al. Am J Cardiol. 1998;81:582-587.
-60
-50
-40
-30
-20
-10
0
0 10 20 30 40 50 60 70 80 90
Atorvastatin
Fluvastatin
Lovastatin
Pravastatin
Simvastatin
Dose range (mg)
Mean% LDL-Creduction
*
**
*
** *
†
† †‡
‡
‡
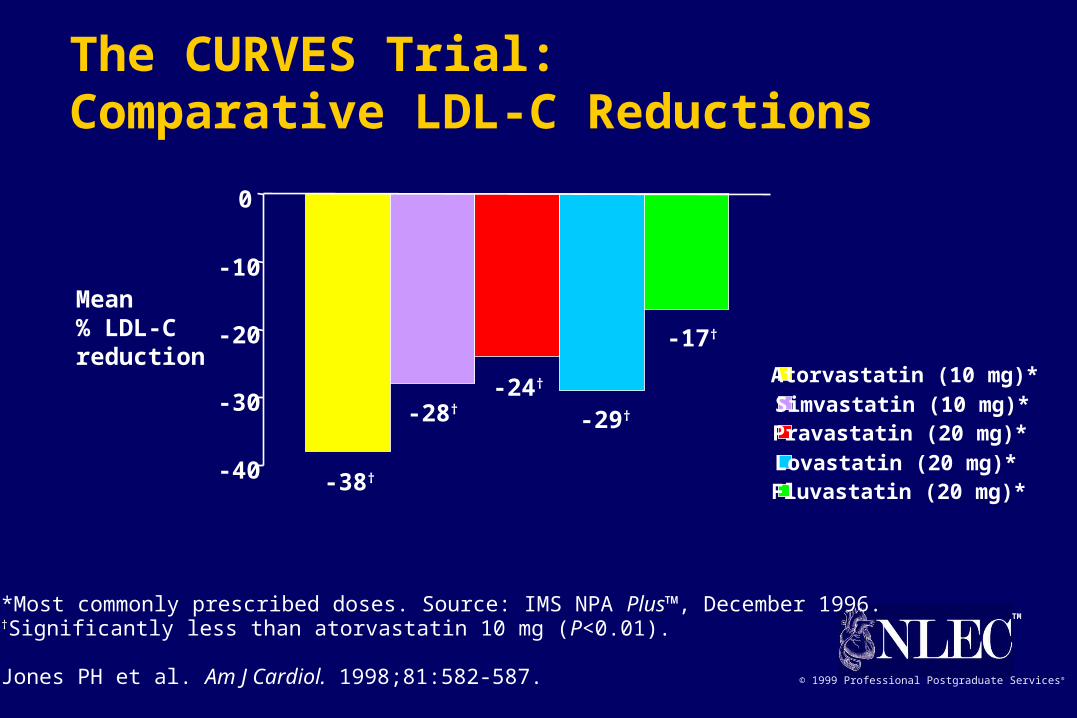
The CURVES Trial: A Comparison of LDL-C Lowering Among Statins
TM
© 1999 Professional Postgraduate Services®
Mean % LDL-C reduction
Atorvastatin (10 mg)*Simvastatin (10 mg)*Pravastatin (20 mg)*Lovastatin (20 mg)*Fluvastatin (20 mg)*
-40
-30
-20
-10
0
-38†
-28†-24†
-29†
-17†
*Most commonly prescribed doses. Source: IMS NPA Plus™, December 1996.†Significantly less than atorvastatin 10 mg (P<0.01).
Jones PH et al. Am J Cardiol. 1998;81:582-587.
The CURVES Trial: Comparative LDL-C Reductions

TM
© 1999 Professional Postgraduate Services®Davidson M et al. Am J Cardiol. 1997;79:1475-1481.
-36
1*
-27*
-40
-30
-20
-10
0
10
74
55
7
0
20
40
60
80
100
Placebo Atorvastatin 10 mg Lovastatin 20 mg
% Patients reaching NCEP LDL-C target†
*P<0.05 vs atorvastatin.†<160 mg/dL (<2RFs) 95% vs 86% <130 mg/dL (>2RFs) 67% vs 42% <100 mg/dL (CHD) 18% vs 3%
Mean % in LDL-C+
Reaching NCEP Goals for LDL-C:Atorvastatin vs Lovastatin
TM
© 1999 Professional Postgraduate Services®
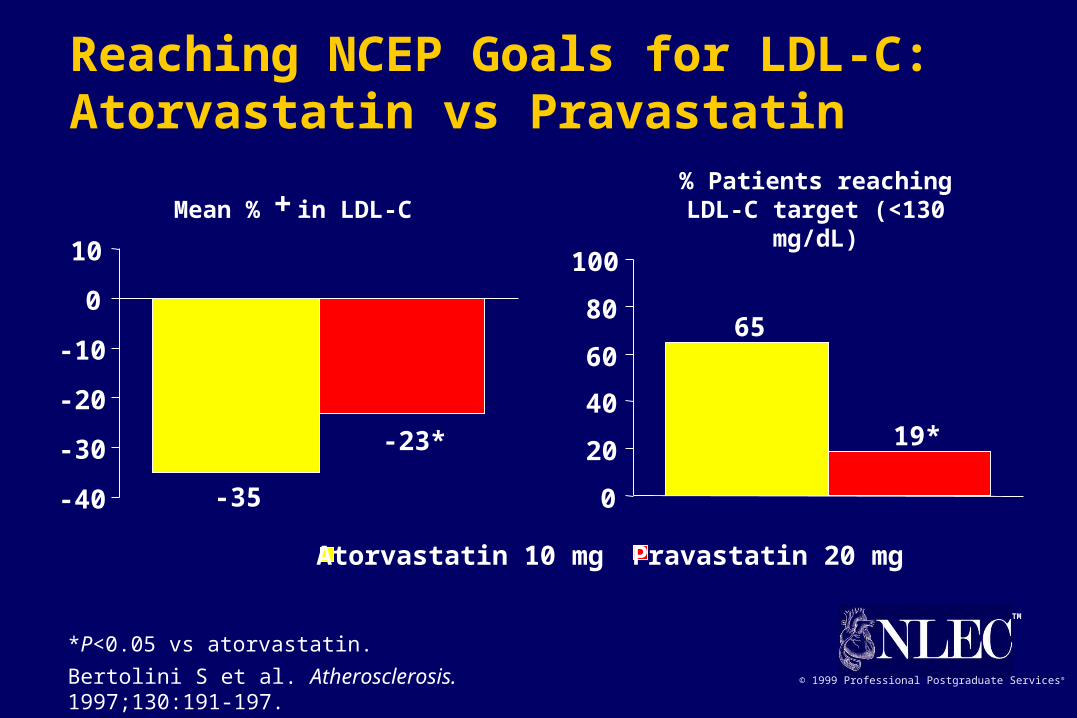
Atorvastatin 10 mg Pravastatin 20 mg
Bertolini S et al. Atherosclerosis. 1997;130:191-197.
-35
-23*
-40
-30
-20
-10
0
10
65
19*
0
20
40
60
80
100
*P<0.05 vs atorvastatin.
% Patients reaching LDL-C target (<130 mg/dL)Mean % in LDL-C+
Reaching NCEP Goals for LDL-C:Atorvastatin vs Pravastatin
TM
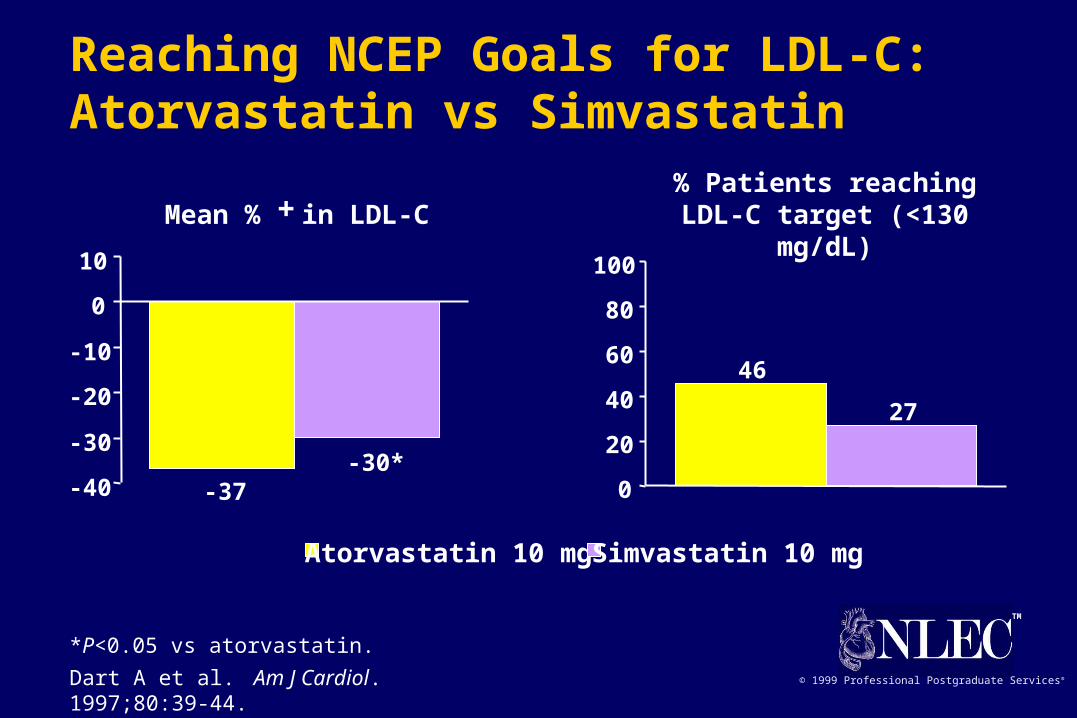
© 1999 Professional Postgraduate Services®Dart A et al. Am J Cardiol. 1997;80:39-44.
*P<0.05 vs atorvastatin.
Mean % in LDL-C+
-37-30*
-40
-30
-20
-10
0
10
46
27
0
20
40
60
80
100
% Patients reaching LDL-C target (<130 mg/dL)
Atorvastatin 10 mg Simvastatin 10 mg
Reaching NCEP Goals for LDL-C:Atorvastatin vs Simvastatin
TM
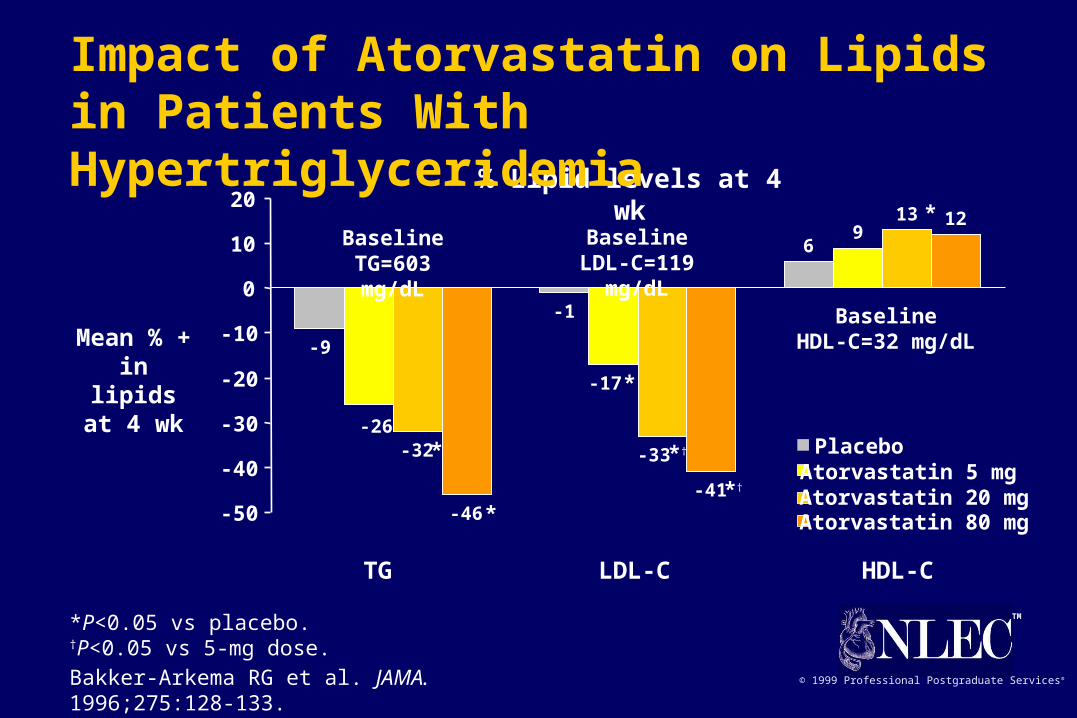
© 1999 Professional Postgraduate Services®Bakker-Arkema RG et al. JAMA. 1996;275:128-133.
Mean % + in lipidsat 4 wk
*P<0.05 vs placebo.†P<0.05 vs 5-mg dose.
% Lipid levels at 4 wk
-9
-1
69
-32
13
-46-41
12
-17
-26
-33
-50
-40
-30
-20
-10
0
10
20
PlaceboAtorvastatin 5 mgAtorvastatin 20 mgAtorvastatin 80 mg
*
BaselineTG=603 mg/dL
BaselineLDL-C=119 mg/dL
BaselineHDL-C=32 mg/dL
TG LDL-C HDL-C
*
*
*†
*†
*
Impact of Atorvastatin on Lipids in Patients With Hypertriglyceridemia

TM
© 1999 Professional Postgraduate Services®Marais AD et al. 12th DALM Symposium; November 7-10, 1995.
-22
-35
-17
-3
-35
-30
-25
-20
-15
-10
-5
0
Atorvastatin
Simvastatin
% Reduction in LDL-C
Receptor negative (N=2)Baseline LDL-C: 498 mg/dL
(12.9 mmol/L)
Receptor defective (N=6)Baseline LDL-C: 521 mg/dL
(13.5 mmol/L)
Impact of Statin Therapy on LDL-C in Patients With Homozygous FH
TM
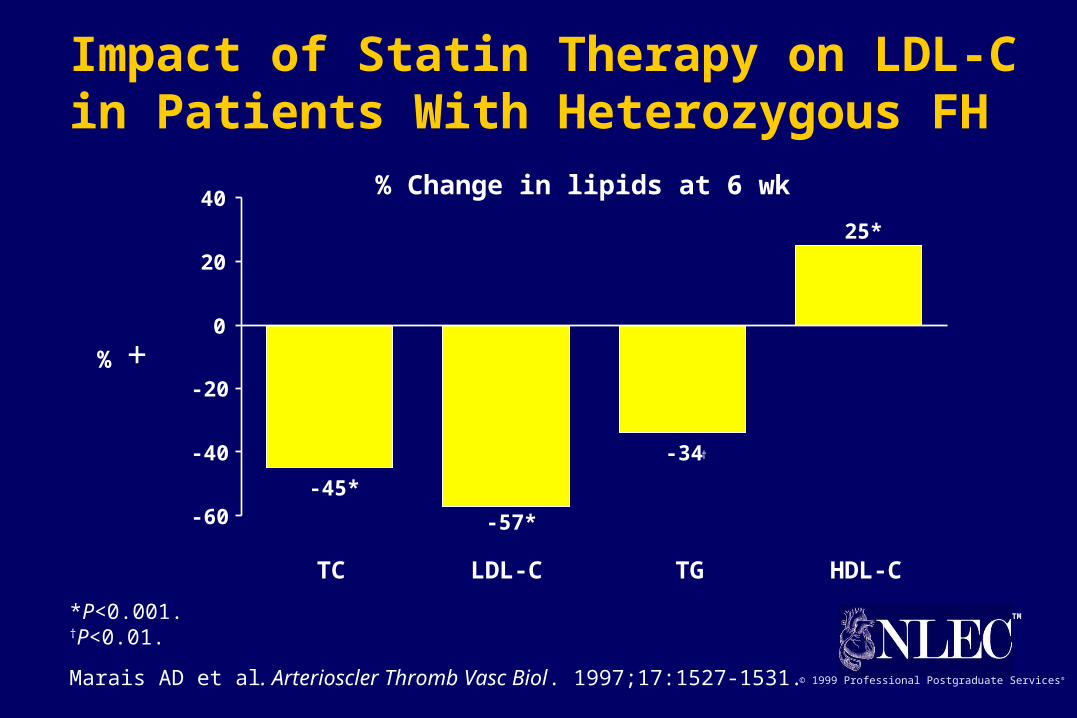
© 1999 Professional Postgraduate Services®Marais AD et al. Arterioscler Thromb Vasc Biol. 1997;17:1527-1531.
% +
% Change in lipids at 6 wk
-45*
-57*
-34
25*
-60
-40
-20
0
20
40
TC LDL-C HDL-CTG
†
*P<0.001.†P<0.01.
Impact of Statin Therapy on LDL-C in Patients With Heterozygous FH
TM
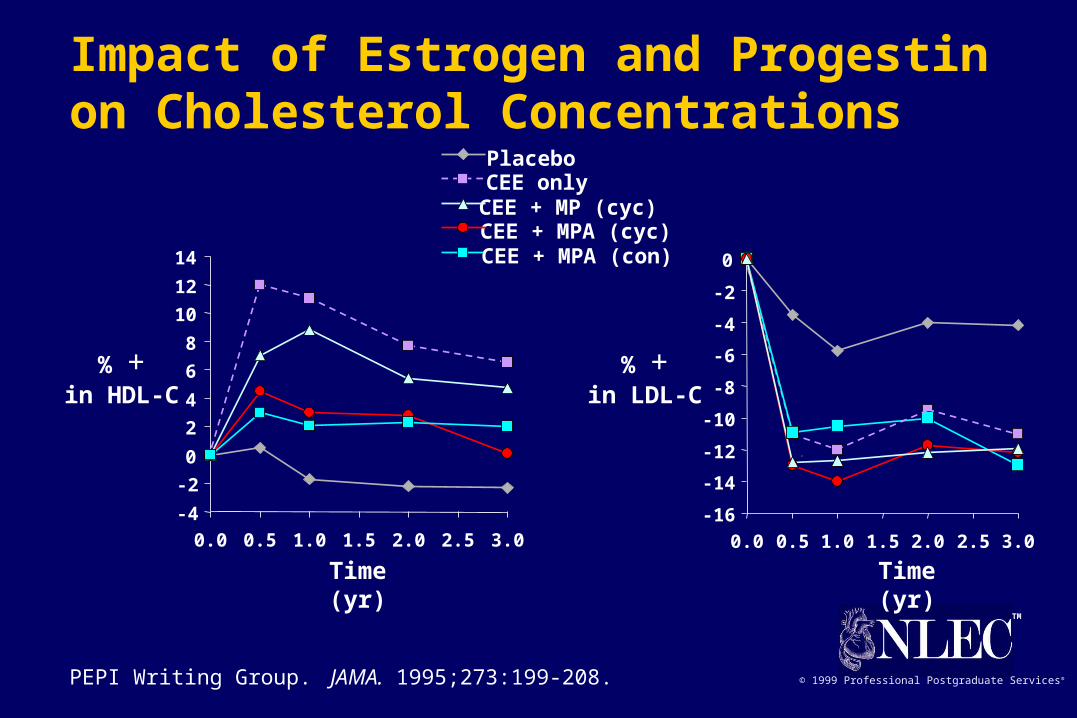
© 1999 Professional Postgraduate Services®PEPI Writing Group. JAMA. 1995;273:199-208.
Impact of Estrogen and Progestin on Cholesterol Concentrations
PlaceboCEE onlyCEE + MP (cyc)CEE + MPA (cyc)CEE + MPA (con)
-16
-14
-12
-10
-8
-6
-4
-2
0
0.0 0.5 1.0 1.5 2.0 2.5 3.0
Time (yr)
% +in LDL-C
-4
-2
0
2
4
6
8
10
12
14
0.0 0.5 1.0 1.5 2.0 2.5 3.0
Time (yr)
% +in HDL-C

TM
© 1999 Professional Postgraduate Services®
1
9
2
-3
-9
11
-30
-5
-46
16
4*
-43*
-7*
-31*
7
-50
-40
-30
-20
-10
0
10
20
Placebo
Atorvastatin 10 mg
Placebo + estradiol 1 mg
Atorvastatin 10 mg +estradiol 1 mg
Heinonen TM et al. 66th Congress, European Atherosclerosis Society. July 13-17, 1996.
Mean %+ at 12 wk
*P<0.05 vs placebo.
% Lipid levels at 12 wk
TC LDL-C HDL-CTG
Impact of Atorvastatin on Lipids in Postmenopausal Women
TM
© 1999 Professional Postgraduate Services®
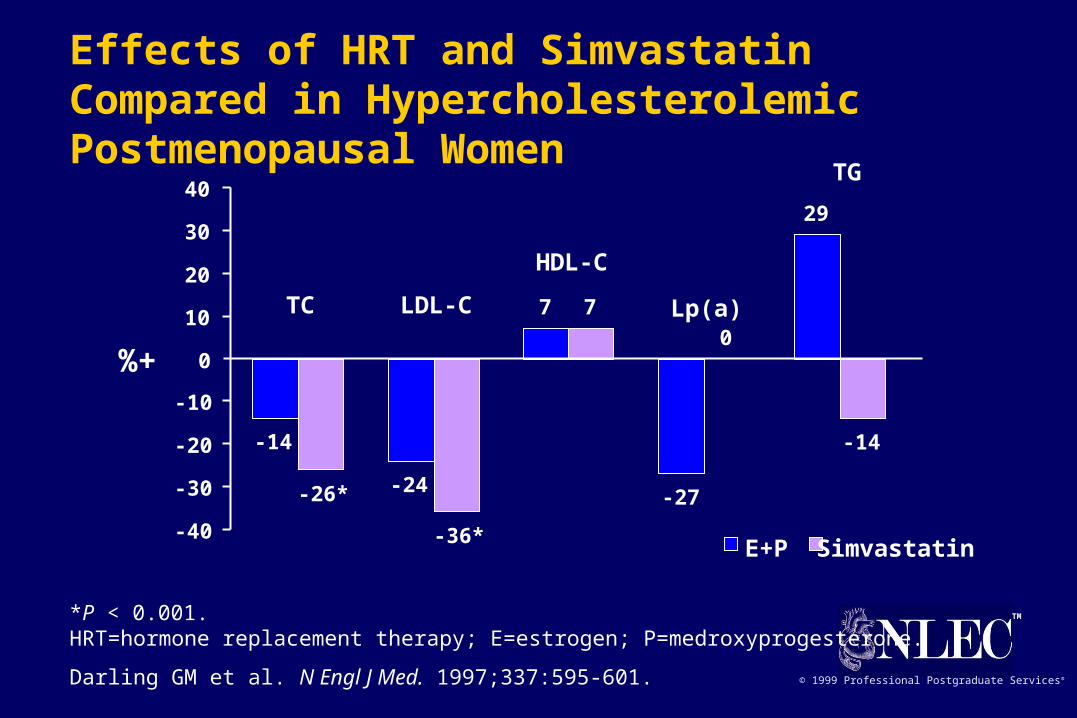
E+P Simvastatin
%+
*P < 0.001.HRT=hormone replacement therapy; E=estrogen; P=medroxyprogesterone.
Darling GM et al. N Engl J Med. 1997;337:595-601.
-14
-24
7
-27
29
-26*
-36*
7
0
-14
-40
-30
-20
-10
0
10
20
30
40
TC LDL-C
HDL-C
TG
Lp(a)
Effects of HRT and Simvastatin Compared in Hypercholesterolemic Postmenopausal Women

TM
© 1999 Professional Postgraduate Services®
HERS: Combined HRT Does Not Decrease All-Cause Mortality
Log rank P=0.56*0.625 mg conjugated equine estrogens plus 2.5 mg medroxyprogesterone acetate.Hulley S et al. JAMA. 1998;280:605-613.
Incidence (%)
Follow-up, yr (No. at risk)
0
5
10
15
0(2,763)
1(2,720)
2(2,666)
3(2,595)
4(1,590)
5(130)
Estrogen-Progestin*
Placebo
TM
© 1999 Professional Postgraduate Services®
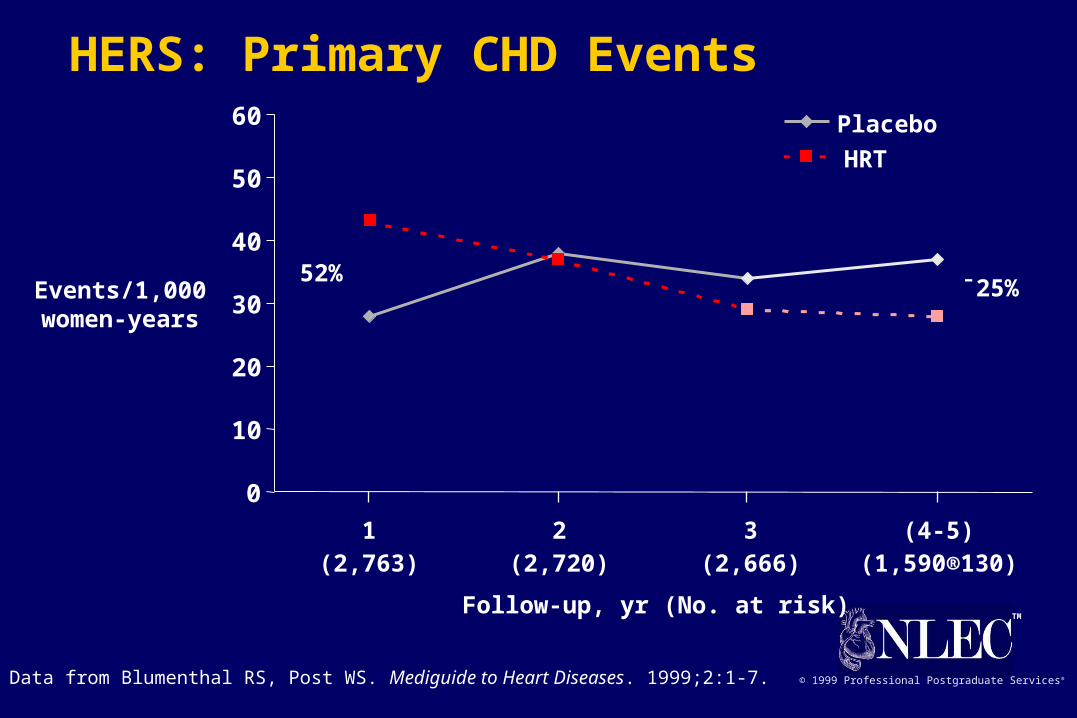
HERS: Primary CHD Events
Data from Blumenthal RS, Post WS. Mediguide to Heart Diseases. 1999;2:1-7.
Events/1,000women-years
Follow-up, yr (No. at risk)
0
10
20
30
40
50
60
1 2 3 (4-5)
Placebo
HRT
(2,763) (2,720) (2,666) (1,590®130)
52%¯25%
TM
© 1999 Professional Postgraduate Services®
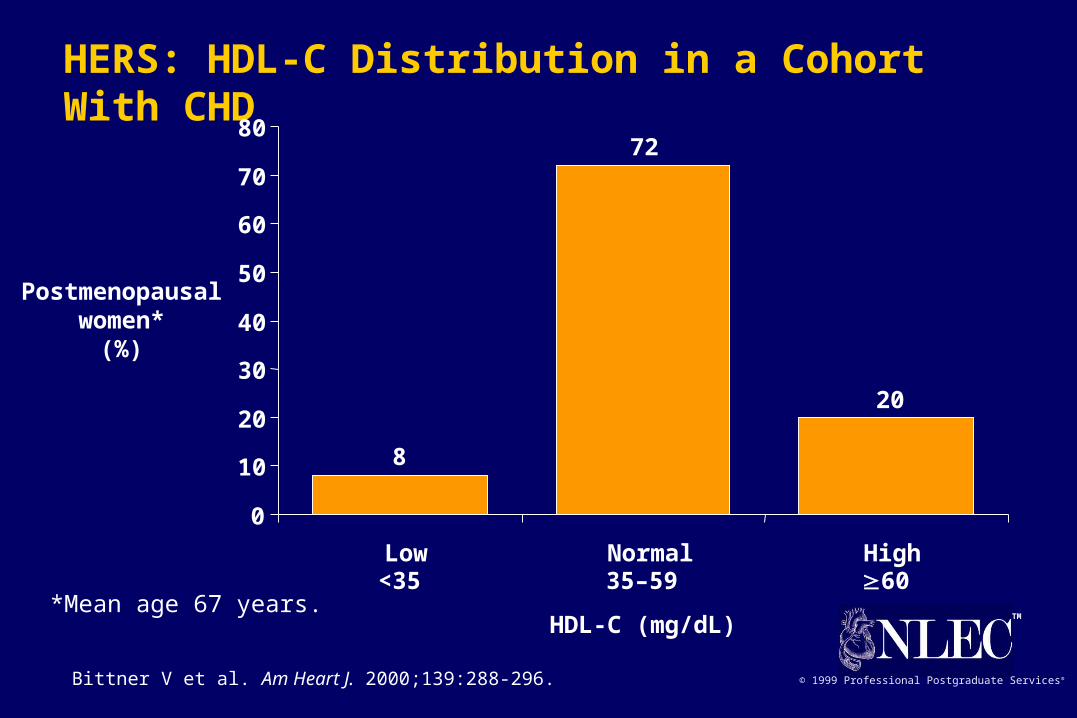
HERS: HDL-C Distribution in a Cohort With CHD
0
10
20
30
40
50
60
70
80
Low Normal High
Postmenopausalwomen*
(%)
HDL-C (mg/dL)
<35 35–59 60*Mean age 67 years.
8
72
20
Bittner V et al. Am Heart J. 2000;139:288-296.

TM
© 1999 Professional Postgraduate Services®
Log rank P=0.91.* Combined incidence of nonfatal MI and CHD death.† 0.625 mg conjugated equine estrogens plus 2.5 mg medroxyprogesterone acetate.Hulley S et al. JAMA. 1998;280:605-613.
HERS: Combined HRT Does Not Reduce Primary CHD End Points*
Estrogen-Progestin*
Placebo
0(2,763)
1(2,631)
2(2,506)
3(2,392)
4(1,435)
5(113)
Incidence (%)
Follow-up, yr (No. at risk)
0
5
10
15
TM
© 1999 Professional Postgraduate Services®
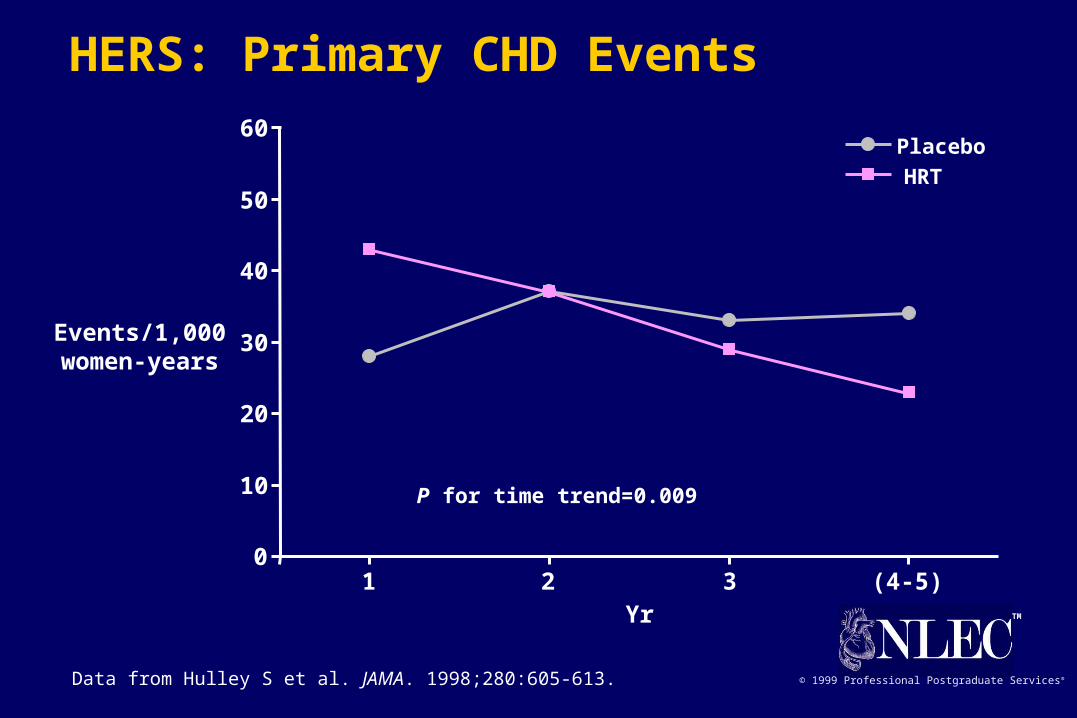
HERS: Primary CHD Events
Data from Hulley S et al. JAMA. 1998;280:605-613.
0
10
20
30
40
50
60Placebo
HRT
1 2 3 (4-5)Yr
Events/1,000women-years
P for time trend=0.009
TM
© 1999 Professional Postgraduate Services®
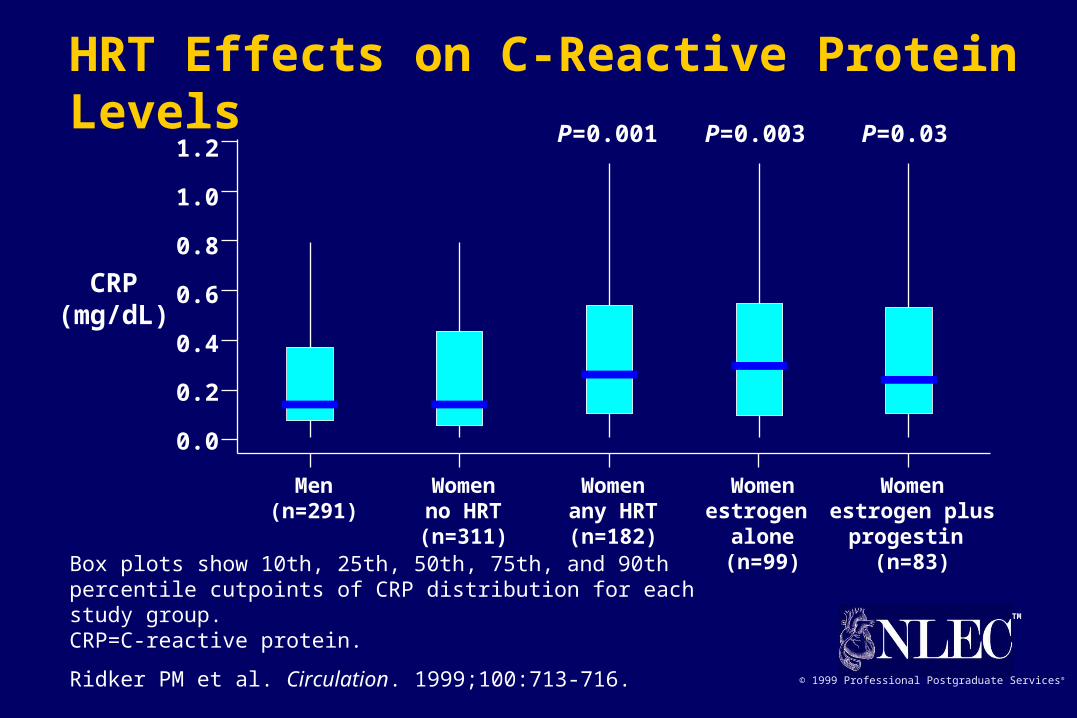
CRP(mg/dL)
Box plots show 10th, 25th, 50th, 75th, and 90th percentile cutpoints of CRP distribution for each study group.CRP=C-reactive protein.
Ridker PM et al. Circulation. 1999;100:713-716.
HRT Effects on C-Reactive Protein Levels
1.2
1.0
0.8
0.6
0.4
0.2
0.0
Men Women Women Women Women(n=291) no HRT any HRT estrogen estrogen plus
(n=311) (n=182) alone progestin (n=99) (n=83)
P=0.001 P=0.003 P=0.03

TM
© 1999 Professional Postgraduate Services®
HRT Effects on C-Reactive Protein Levels: PEPI Trial Subgroup
Cushman M et al. Circulation. 1999;100:717-722.
0 12 36
Placebo
CEE only
CEE + MP (cyc)
CEE + MPA (cyc)
CEE + MPA (con)
CRP(mg/L)
0
1
1.5
2
2.5
3
Time (mo)
P=0.0001
CRP = C-reactive protein
TM
© 1999 Professional Postgraduate Services®
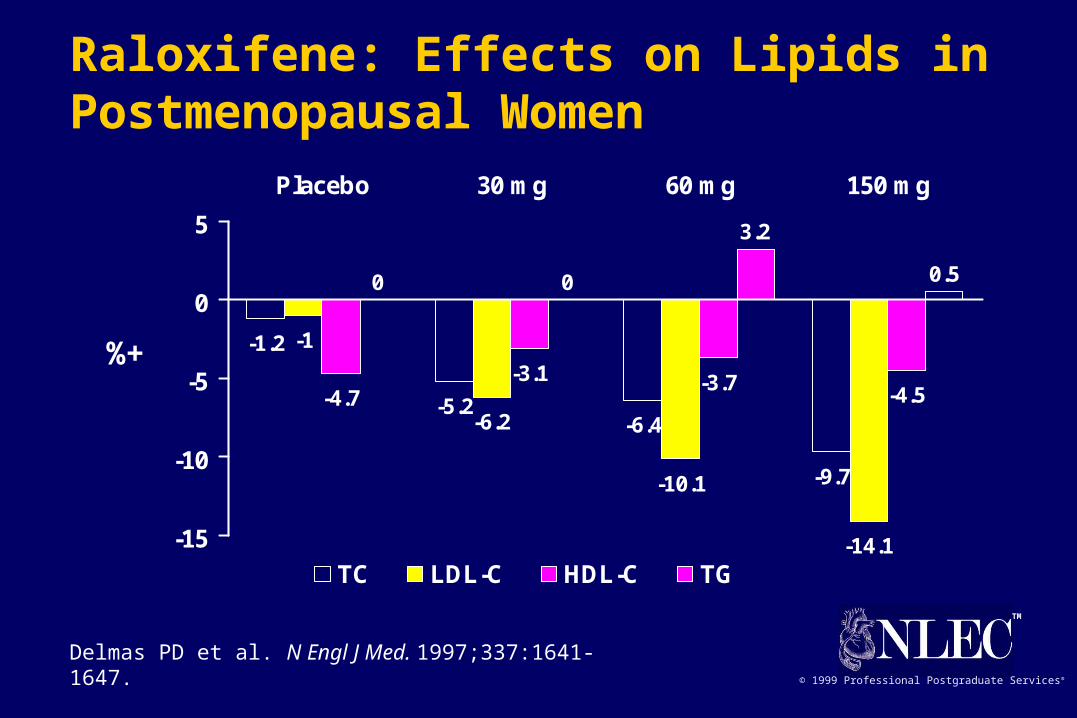
-1.2
-5.2-6.4
-9.7
-1
-6.2
-10.1
-14.1
-4.7-3.1 -3.7
-4.5
0 0
3.2
0.5
-15
-10
-5
0
5
Placebo 30 mg 60 mg 150 mg
TC LDL-C HDL-C TG
Delmas PD et al. N Engl J Med. 1997;337:1641-1647.
%+
Raloxifene: Effects on Lipids in Postmenopausal Women
TM
© 1999 Professional Postgraduate Services®
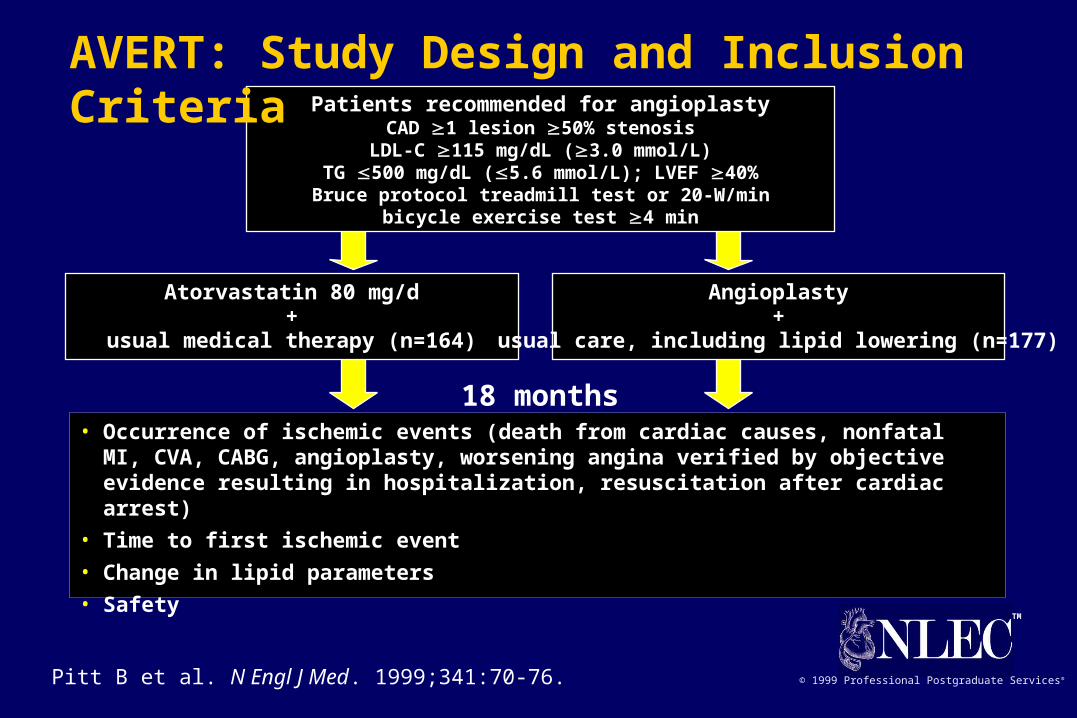
Patients recommended for angioplastyCAD 1 lesion 50% stenosis
LDL-C 115 mg/dL (3.0 mmol/L)TG 500 mg/dL (5.6 mmol/L); LVEF 40%Bruce protocol treadmill test or 20-W/min
bicycle exercise test 4 min
Atorvastatin 80 mg/d+
usual medical therapy (n=164)
Angioplasty+
usual care, including lipid lowering (n=177)
18 months• Occurrence of ischemic events (death from cardiac causes, nonfatal MI, CVA, CABG,
angioplasty, worsening angina verified by objective evidence resulting in hospitalization, resuscitation after cardiac arrest)
• Time to first ischemic event
• Change in lipid parameters
• Safety
Pitt B et al. N Engl J Med. 1999;341:70-76.
AVERT: Study Design and Inclusion Criteria
TM
© 1999 Professional Postgraduate Services®
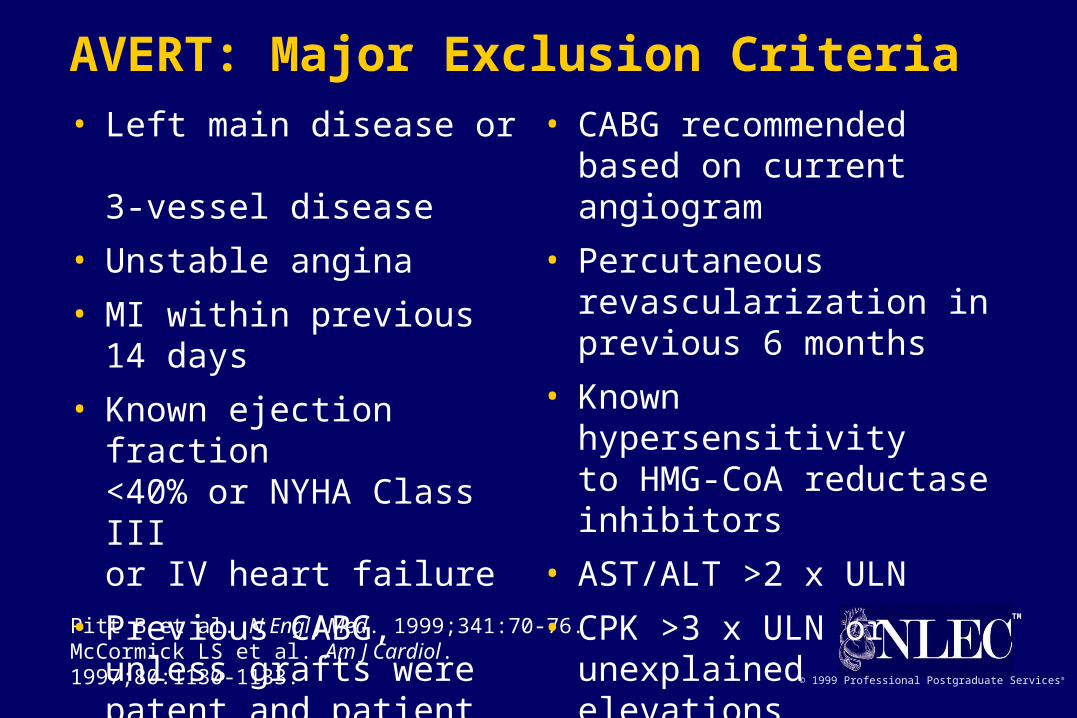
Pitt B et al. N Engl J Med. 1999;341:70-76. McCormick LS et al. Am J Cardiol. 1997;80:1130-1133.
AVERT: Major Exclusion Criteria• Left main disease or
3-vessel disease
• Unstable angina
• MI within previous 14 days
• Known ejection fraction <40% or NYHA Class III or IV heart failure
• Previous CABG, unless grafts were patent and patient did not have 3-vessel disease
• CABG recommended based on current angiogram
• Percutaneous revascularization in previous 6 months
• Known hypersensitivity to HMG-CoA reductaseinhibitors
• AST/ALT >2 x ULN
• CPK >3 x ULN or unexplained elevations

TM
© 1999 Professional Postgraduate Services®
Pitt B et al. N Engl J Med. 1999;341:70-76. McCormick LS et al. Am J Cardiol. 1997;80:1130-1133.
AVERT: Overview of Study Procedures
Treatment phase
• Patients randomized to atorvastatin
– discontinued other lipid-lowering medication and immediately began atorvastatin 80 mg/d
• Patients randomized to angioplasty/usual care (UC)
– underwent angioplasty followed by “usual care”
• usual care may or may not have included lipid-lowering therapy (eg, diet, behavior modification, or medication)
• angioplasty may or may not have included stenting
• usual care was determined by investigator or patient’s primary physician
TM
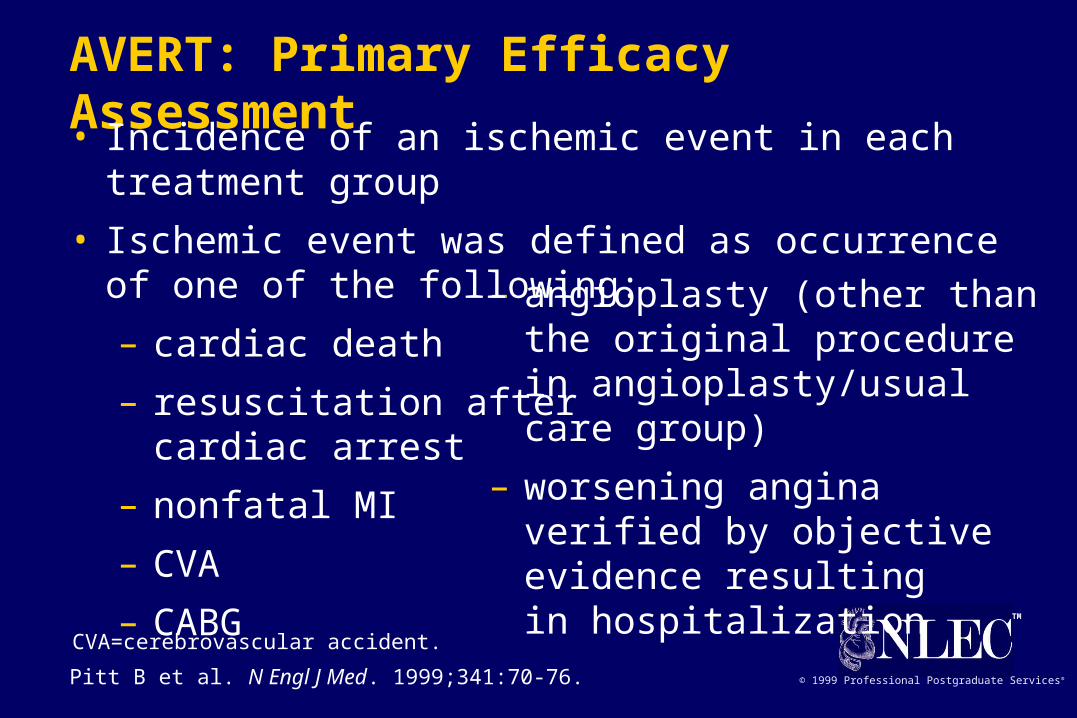
© 1999 Professional Postgraduate Services®Pitt B et al. N Engl J Med. 1999;341:70-76.
– angioplasty (other than the original procedure in angioplasty/usual care group)
– worsening angina verified by objective evidence resulting in hospitalization
CVA=cerebrovascular accident.
AVERT: Primary Efficacy Assessment
• Incidence of an ischemic event in each treatment group
• Ischemic event was defined as occurrence of one of the following:
– cardiac death
– resuscitation aftercardiac arrest
– nonfatal MI
– CVA
– CABG
TM
© 1999 Professional Postgraduate Services®
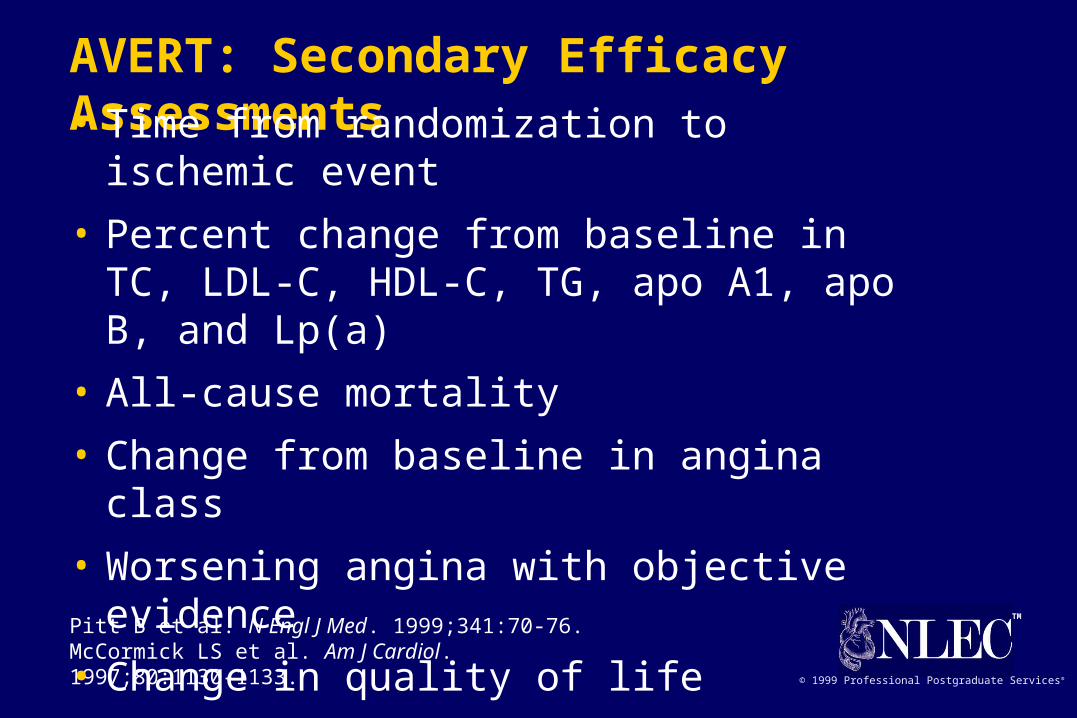
Pitt B et al. N Engl J Med. 1999;341:70-76. McCormick LS et al. Am J Cardiol. 1997;80:1130-1133.
AVERT: Secondary Efficacy Assessments• Time from randomization to ischemic event
• Percent change from baseline in TC, LDL-C, HDL-C, TG, apo A1, apo B, and Lp(a)
• All-cause mortality
• Change from baseline in angina class
• Worsening angina with objective evidence
• Change in quality of life
• Economic assessment
TM
© 1999 Professional Postgraduate Services®
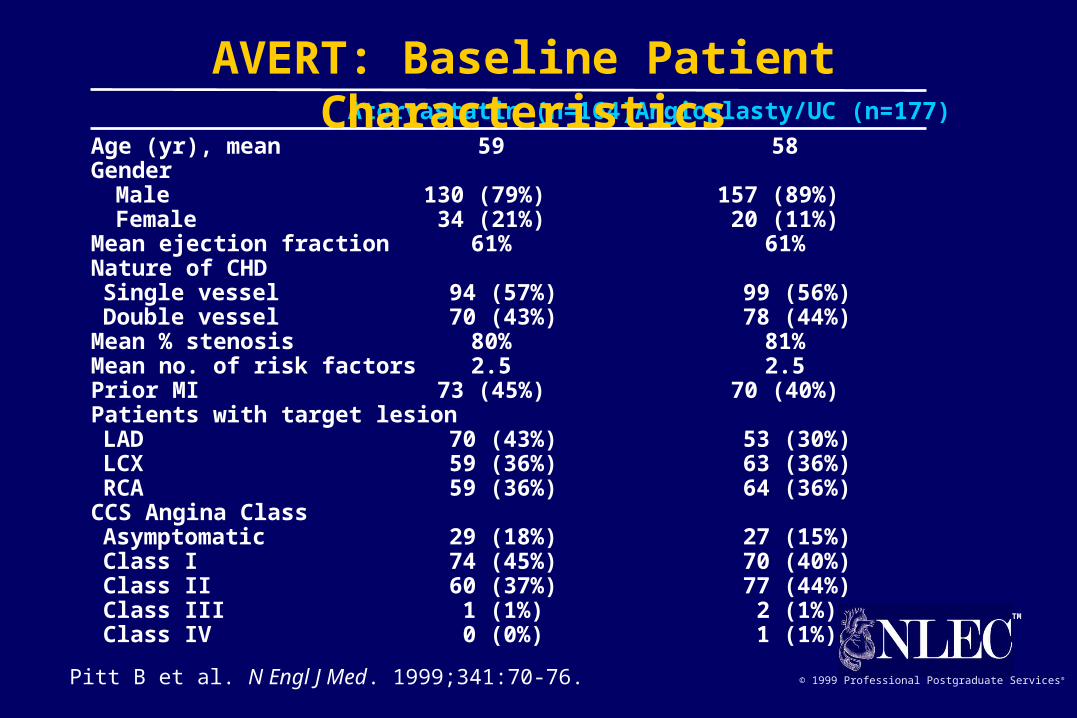
Atorvastatin (n=164) Angioplasty/UC (n=177)
Age (yr), mean 59 58Gender
Male 130 (79%) 157 (89%) Female 34 (21%) 20 (11%)
Mean ejection fraction 61% 61%Nature of CHDSingle vessel 94 (57%) 99 (56%)Double vessel 70 (43%) 78 (44%)
Mean % stenosis 80% 81%Mean no. of risk factors 2.5 2.5Prior MI 73 (45%) 70 (40%)Patients with target lesionLAD 70 (43%) 53 (30%)LCX 59 (36%) 63 (36%)RCA 59 (36%) 64 (36%)
CCS Angina ClassAsymptomatic 29 (18%) 27 (15%)Class I 74 (45%) 70 (40%)Class II 60 (37%) 77 (44%)Class III 1 (1%) 2 (1%)Class IV 0 (0%) 1 (1%)
Pitt B et al. N Engl J Med. 1999;341:70-76.
AVERT: Baseline Patient Characteristics

TM
© 1999 Professional Postgraduate Services®
Number (%) of patients experiencing an ischemic event
Atorvastatin Angioplasty/UCn=164 n=177 %
Any Ischemic event 22 (13) 37 (21) -36*
Death 1 (0.6) 1 (0.6)Resuscitated cardiac arrest 0 (0.0) 0 (0.0)Nonfatal MI 4 (2.4) 5 (2.8)CVA 0 (0.0) 0 (0.0)CABG 2 (1.2) 9 (5.1)Revascularization 18 (11.0) 21 (11.9)Worsening angina with objectiveevidence & hospitalization 11 (6.7) 25 (14.1)
*P=0.048 vs an adjusted significance level of 0.045.
Pitt B et al. N Engl J Med. 1999;341:70-76.
AVERT: Ischemic Events

TM
© 1999 Professional Postgraduate Services®
* P=0.048 vs an adjusted significance level of 0.045 atorvastatin vs angioplasty/UC.Data from Pitt B et al. N Engl J Med. 1999;341:70-76.
0
5
10
15
20
25
Atorvastatin Angioplasty/UC
% of patientswith an
ischemic event
13%
21%
-36% difference*
(P=0.048)
n=22 of 164 n=37 of 177
AVERT: Ischemic Events
TM
© 1999 Professional Postgraduate Services®
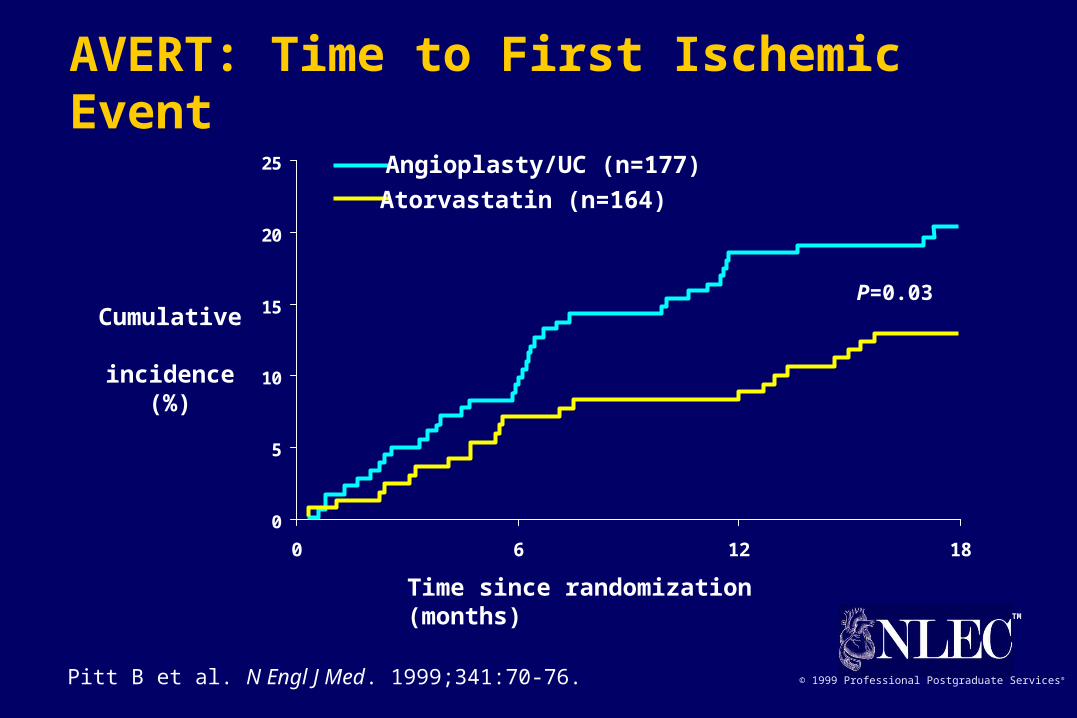
0
5
10
15
20
25
0 6 12 18
P=0.03Cumulative incidence
(%)
Time since randomization (months)
Pitt B et al. N Engl J Med. 1999;341:70-76.
Atorvastatin (n=164)
Angioplasty/UC (n=177)
AVERT: Time to First Ischemic Event
TM
© 1999 Professional Postgraduate Services®
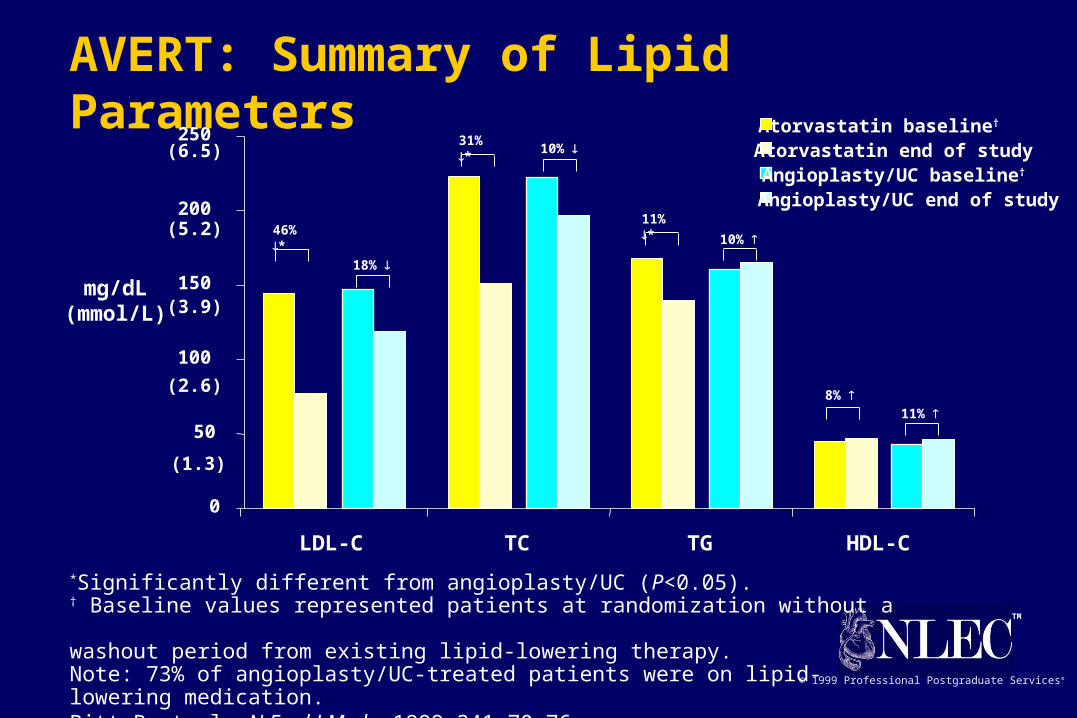
*Significantly different from angioplasty/UC (P<0.05).† Baseline values represented patients at randomization without a washout period from existing lipid-lowering therapy.Note: 73% of angioplasty/UC-treated patients were on lipid-lowering medication.Pitt B et al. N Engl J Med. 1999;341:70-76.
mg/dL(mmol/L)
Atorvastatin end of studyAngioplasty/UC baseline†
Angioplasty/UC end of study
Atorvastatin baseline†
10%
0
50
100
150
200
250
LDL-C TC TG HDL-C
18%
31% *
46% *
10%
11% *
8% 11%
(6.5)
(2.6)
(3.9)
(5.2)
(1.3)
AVERT: Summary of Lipid Parameters

TM
© 1999 Professional Postgraduate Services®
0
5
10
15
20
0-6 months >6-18 months
Atorvastatin
Angioplasty/UC
24% difference46%
difference
% of patientswith an
ischemic event
7%6%
10%11%
Pitt B et al. N Engl J Med. 1999;341:70-76.
AVERT: Incidence of First Ischemic Event by Time

TM
© 1999 Professional Postgraduate Services®Pitt B et al. N Engl J Med. 1999;341:70-76.
AVERT: Safety Evaluation
• Elevations in AST or ALT (consecutive elevations >3 x ULN)
– 4 (2.4%) atorvastatin-treated patients
– none in angioplasty/UC-treated patients
• Elevations in CPK (>10 x ULN)
– none in either treatment group
• There were no clinically significant differences in adverse event rates between the two treatment groups
– in this study, eight patients discontinued atorvastatin treatment due to an adverse event, seven of which remained in the study

TM
© 1999 Professional Postgraduate Services®
• Reduces ischemic events by 36%
• Delays the time to first event
• Is safe
• Can delay or prevent the need for percutaneous revascularization
Pitt B et al. N Engl J Med. 1999;341:70-76.
Aggressive lipid lowering with atorvastatin in stable CAD patients:
AVERT: Conclusions

TM
© 1999 Professional Postgraduate Services®
Lovastatin Study Groups I through IV. Arch Intern Med. 1993;153:1079-1087.Second Report of the Expert Panel on Detection, Evaluation, and Treatment of High Blood Cholesterol in Adults (ATP II). September 1993; NIH Publication 93-3095.
Safety Summary for HMG-CoA Reductase Inhibitors• Excellent patient acceptance
• Few drug-drug interactions
• Few side effects
– most common are gastrointestinal: mild to moderate
– at high doses, elevated ALT/AST in 1% to 2%
– myopathy reported in 0.1% (CK >10 x ULN)
• Only rare cases of toxicity
• No increases in total or non-CHD mortality

TM
© 1999 Professional Postgraduate Services®
C=control; T=treatment; A=aggressive; M=moderate.
Yusuf S, Anand S. Circulation. 1996;93:1774-1776.
5
10
15
20
25
Post-treatment TC (mg/dL)
5-yr CVevents (%)
CARE-T
Post-CABG-A 4S-T
CARE-C
Post-CABG-M 4S-C
155 174 193 212 232 251 271
Risk of CHD Events and Level of Cholesterol

TM
© 1999 Professional Postgraduate Services®
PI=placebo; Rx=treatment
Shepherd J et al. N Engl J Med. 1995;333:1301-1307.4S Study Group. Lancet. 1995;345:1274-1275.Sacks FM et al. N Engl J Med. 1996;335:1001-1009.Downs JR et al. JAMA. 1998;279:1615-1622.Tonkin A. Presented at AHA Scientific Sessions, 1997.
Mean LDL-C level at follow-up (mg/dL)
Relation Between CHD Events and LDL-C in Recent Statin Trials
0
5
10
15
20
25
30
90 110 130 150 170 190 210
% withCHD event CARE-Rx
LIPID-Rx
4S-Rx
CARE-PILIPID-PI
4S-PI
2° Prevention
1° Prevention
WOSCOPS-PI
WOSCOPS-RxAFCAPS/TexCAPS-Rx
AFCAPS/TexCAPS-PI
Related Documents


![HMG CoA reductase inhibitors [statins] for dialysis patients178940/UQ178940_OA.pdf · HMG CoA reductase inhibitors (statins) for dialysis patients Sankar D Navaneethan1, Rakesh Shrivastava2](https://static.cupdf.com/doc/110x72/5f0740f07e708231d41c12a3/hmg-coa-reductase-inhibitors-statins-for-dialysis-patients-178940uq178940oapdf.jpg)