Towards Sustainable Development in Angkor, Cambodia: Social, Environmental and Financial Aspects of Conserving Cultural Heritage Thanakvaro Thyl De Lopez Tin Ponlok Som Proeung Choeun Sinoeun Sing Thea Suon Manith Ros Sokrim Heng Vinet Tuy Vichet Suon Sadeth Tuy Somrath June, 2006

Welcome message from author
This document is posted to help you gain knowledge. Please leave a comment to let me know what you think about it! Share it to your friends and learn new things together.
Transcript
Towards Sustainable Development in Angkor, Cambodia: Social, Environmental and Financial
Aspects of Conserving Cultural Heritage
Thanakvaro Thyl De Lopez Tin Ponlok
Som Proeung Choeun Sinoeun
Sing Thea Suon Manith Ros Sokrim Heng Vinet Tuy Vichet Suon Sadeth Tuy Somrath
June, 2006
RIMSD
Text Box
This report is presented as received by IDRC from project recipient(s). It has not been subjected to peer review or other review processes. This work is used with the permission of Institute of Thanakvaro Thyl De Lopez, Tin Ponlok, Som Proeung, Choeun Sinoeun, Sing Thea, Suon Manith, Ros Sokrim, Heng Vinet, Tuy Vichet, Suon Sadeth, Tuy Somrath. © 2006, Thanakvaro Thyl De Lopez, Tin Ponlok, Som Proeung, Choeun Sinoeun, Sing Thea, Suon Manith, Ros Sokrim, Heng Vinet, Tuy Vichet, Suon Sadeth, Tuy Somrath.

Comments should be sent to: Dr Thanakvaro T. De Lopez
Cambodian Research Centre for Development (CRCD) PO Box 2515 Phnom Penh
Kingdom of Cambodia
Email: [email protected]
EEPSEA was established in May 1993 to support research and training in environmental and resource economics. Its objective is to enhance local capacity to undertake the economic analysis of environmental problems and policies. It uses a networking approach, involving courses, meetings, technical support, access to literature and opportunities for comparative research. Member countries are Thailand, Malaysia, Indonesia, the Philippines, Vietnam, Cambodia, Lao PDR, China, Papua New Guinea and Sri Lanka.
EEPSEA is supported by the International Development Research Centre (IDRC); the Swedish International Development Cooperation Agency (Sida); and the Canadian International Development Agency (CIDA).
EEPSEA publications are also available online at http://www.eepsea.org.
ACKNOWLEDGEMENTS
Colleagues, friends and families have made this work possible. Many other
people deserve acknowledgements for their continuous support and encouragement. You all know who you are.
The Ministry of Environment of the Kingdom of Cambodia and the ASPARA Authority have facilitated our research. The Economy and Environment Program for Southeast Asia has funded this undertaking, not only with finance, but also with knowledge, capital and warm support.
We would also like to thank the people of Angkor who have patiently endured our inquisition for more than a year. We can only hope that our work reflects the generosity and fortitude they have shown, and that as the old prophesy foretells, one day, there will be happiness in Angkor again. Sabay Angkor.

TABLE OF CONTENTS
EXECUTIVE SUMMARY ............................................................................................ 1
1.0 THE ANGKOR ARCHAEOLOGICAL PARK .............................................. 3 1.1 BACKGROUND ................................................................................................... 3 1.2 ANGKOR PARK MANAGEMENT.......................................................................... 3
2.0 RESEARCH OBJECTIVES AND METHODOLOGIES .............................. 6
3.0 REVENUES FROM VISITOR ENTRANCE FEES....................................... 7
4.0 WATER DEMANDS........................................................................................ 10
5.0 ANALYSIS OF PRIMARY SURVEY DATA ............................................... 13 5.1 SURVEYS OF SOUVENIR VENDORS AND OF LOCAL PEOPLE................................ 13 5.2 RESULTS OF THE SURVEY OF THE SOUVENIR VENDORS OF ANGKOR................. 14 5.3 RESULTS OF THE SURVEY OF THE VILLAGES OF ANGKOR................................. 18
6.0 MAKING ANGKOR MORE SUSTAINABLE ............................................. 32
7.0 SUMMARY OF FINDINGS............................................................................ 33
8.0 POLICY DISCUSSION ................................................................................... 35
9.0 CONCLUSIONS............................................................................................... 40
REFERENCES ............................................................................................................. 41
APPENDIX A: SURVEY SAMPLES OF THE VILLAGES OF ANGKOR.......... 44
APPENDIX B: STATISTICAL TABLES FOR THE SURVEY OF THE SOUVENIR VENDORS OF ANGKOR..................................................................... 46
APPENDIX C: STATISTICAL TABLES FOR THE HOUSEHOLD SURVEY OF THE VILLAGES OF ANGKOR ................................................................................ 49

LIST OF TABLES TABLE 1 SCENARIOS AND ASSUMPTIONS FOR ESTIMATING REVENUES FROM ANNUAL
ENTRANCE FEES TO ANGKOR ..................................................................................... 7 TABLE 2 SCHEDULE OF ENTRANCE FEES TO THE ANGKOR PARK (US $)............................ 8 TABLE 3 ESTIMATES OF ANGKOR ENTRANCE REVENUES USING VISITOR ARRIVAL DATA
FROM THE MINISTRY OF TOURISM FOR 2005 ............................................................. 8 TABLE 4 POTENTIAL FINANCING FOR APSARA FROM ENTRANCE REVENUES (US $ PER
YEAR) ........................................................................................................................ 9 TABLE 5 NUMBER AND LOCATIONS OF VENDORS INTERVIEWED...................................... 14 TABLE 6 SAMPLE SIZE AND POPULATION RESIDING IN ZONE 1 & ZONE 2 OF THE ANGKOR
PARK ....................................................................................................................... 14 TABLE 7 THEORETICAL VERSUS ACTUAL YEARS OF SCHOOLING FOR CHILDREN OF
HOUSEHOLDS INVOLVED IN TOURISM....................................................................... 15 TABLE 8 AVERAGE PROFIT MARGIN FOR SELECTED ITEMS SOLD BY SOUVENIR VENDORS
(US DOLLARS)......................................................................................................... 15 TABLE 9 THEORETICAL VERSUS ACTUAL YEARS OF SCHOOLING FOR ANGKOR’S CHILDREN
................................................................................................................................ 20 TABLE 10 SUMMARY OF THE CHARACTERISTICS OF ZONE 1 AND ZONE 2 OF THE ANGKOR
ARCHEOLOGICAL PARK (ADAPTED FROM THE ROYAL DECREE ESTABLISHING PROTECTED CULTURAL ZONES IN THE SIEM REAP/ANGKOR REGION AND GUIDELINES FOR THEIR MANAGEMENT, MAY 1994). .............................................. 27
TABLE 11 SUMMARY OF FINDINGS AND POLICY IMPLICATIONS ....................................... 35 TABLE 12 COSTS OF SELECTED COMMUNITY DEVELOPMENT PROJECTS ........................... 39
LIST OF FIGURES FIGURE 1 “HAS TOURISM IMPROVED YOUR LIFE?” (PERCENTAGE OF ALL SOUVENIR
VENDORS)................................................................................................................ 16 FIGURE 2 LITERACY RATES AND YEARS OF EDUCATION (PERCENTAGE OF ALL HEADS OF
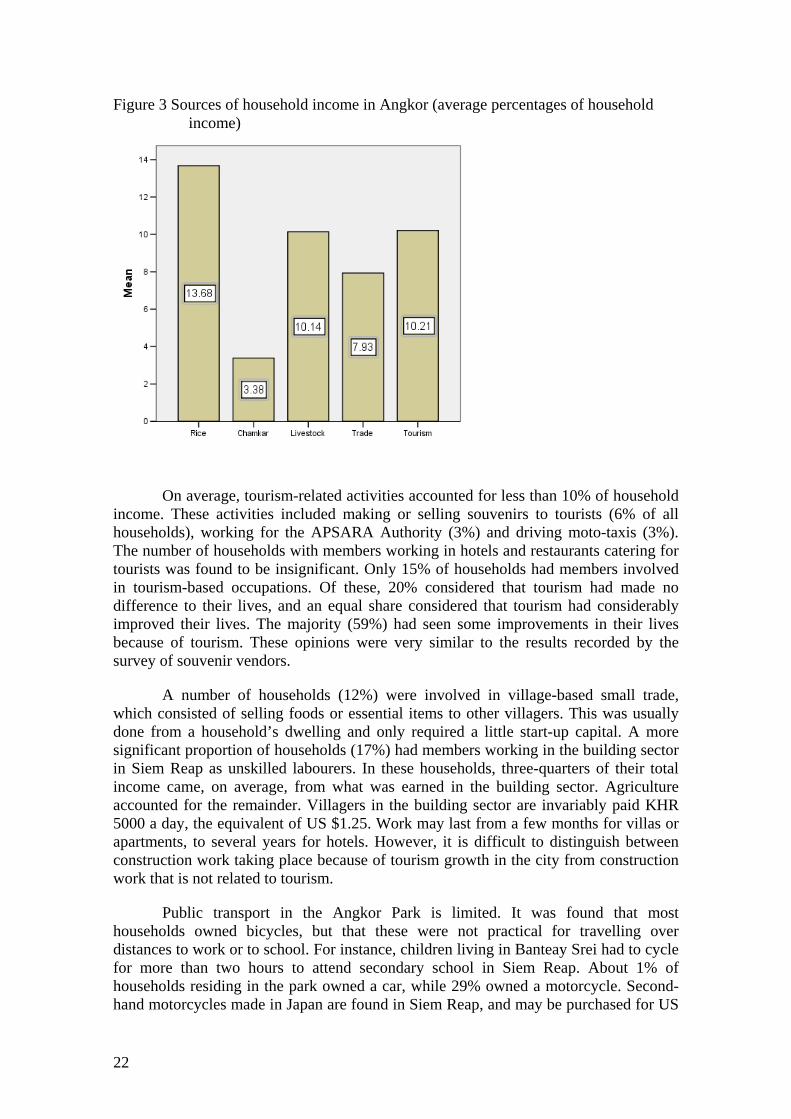
HOUSEHOLDS).......................................................................................................... 19 FIGURE 3 SOURCES OF HOUSEHOLD INCOME IN ANGKOR (AVERAGE PERCENTAGES OF
HOUSEHOLD INCOME) .............................................................................................. 22 FIGURE 4 “IN WHICH ZONE OF THE ANGKOR PARK IS YOUR VILLAGE LOCATED?”
(PERCENTAGE OF ALL HOUSEHOLDS)....................................................................... 28
ABBREVIATIONS
TECHNICAL TERMS/UNITS
CFL Compact Fluorescent Light
ha Hectare
kg Kilogram
km Kilometre
km2 Square Kilometre
kwh Kilowatt-hour
l litre
LPG Liquid Petroleum Gas
m Meter
m3 Cubic Meter
REE Rural Electricity Entrepreneur
ORGANIZATIONS
APSARA Autorité pour la Protection du Site et l’Aménagement de la Région d’Angkor
CCCO Cambodian Climate Change Office
CRCD Cambodian Research Centre for Development
CDRI Cambodia Development Research Institute
CoM Council of Ministers
EEPSEA Economy and Environment Program for Southeast Asia
JICA Japan International Cooperation Agency
IUCN World Conservation Union
MoE Ministry of Environment
MoT Ministry of Tourism
NGO Non Governmental Organization
NIS National Institute of Statistics

RGC Royal Government of Cambodia
UN United Nations
UNDP United Nations Development Program
UNESCO United Nations Educational Scientific and Cultural Organization
UNWFP United Nations World Food Programme
WCED World Commission on Environment and Development
WHO World Health Organisation


1
EXECUTIVE SUMMARY
Founded in the 9th century, the city of Angkor lies at the heart of Khmer cultural heritage and figures prominently in the history and on the standard of the Kingdom of Cambodia. At its zenith, the metropolis stretched over a 1,000 km2 and was inhabited by up to two million people. However last century Angkor remained in a relative slumber until the late 1990s as Cambodia’s tumultuous modern history had kept casual visitors at bay. However, in less than a decade, the number of foreign visitors to the temples of Angkor, now a World Heritage site, has jumped from a few thousand a year to almost one million. The neighbouring city of Siem Reap, gateway to Angkor, has also experienced rapid growth in recent years. Local infrastructure and services have struggled to keep up with the demands of international mass tourism.
While it represents a significant source of foreign currency for Cambodia, mass tourism has increased pressure on Angkor’s cultural and natural features. The question that needs to be urgently answered is how the development of Angkor can be made more sustainable from financial, environmental and social perspectives.
This study estimated the potential for entrance revenues from the Angkor Park. This was done by assessing tourist numbers and entrance fees. The estimate ranged from a low of US $11 million to a high of US $44 million per year. This represents a substantial source of funding to meet the needs of present generations and to ensure that the temples are protected against degradation for future generations. Without Angkor, there would be little use for neighbouring resorts, hotels and other tourism facilities. Economic logic dictates that, while returns on the temples must be maximised, further restoration and rehabilitation work needs to be undertaken.
Historically, the sustainable use of water resources has been a major concern in Angkor, from the Angkorian engineers who had to meet the water demands of a large metropolis, to present-day policymakers who have to satisfy the needs created by the development of tourism. While Angkorians devised an intricate hydraulic system to exploit runoff and overland flow, the extraction of groundwater is now favoured. The recent implementation of a centralised water supply system in the city of Siem Reap is an improvement over past practices in which individual hotels operated their own wells to meet customers’ demands. However, this system alone will not be able to cope with the numbers of visitors that have been predicted. If water extraction rates were to exceed aquifer recharge rates, land subsidence would occur. This would result in structural damage to the temples.
Angkor was once a capital city, and retains a large resident population. Settlements clustered around the temples (which are located in the strictly protected zones of the park) are the homes of an estimated 70,000 people. Surveys of more than 2,500 households and 400 souvenir sellers paint a picture of hardship and poverty. Levels of illiteracy remain high, even among children. Agriculture, which still accounts for about a third of household income, has low productivity. Paddy fields yield less than a ton per hectare per year. On average, tourism accounts for only 10% of household income. This shows that local people have not been able to benefit from the increased popularity of Angkor.

2
Tourism provides favourable prospects. It also constitutes a threat to the sustainable development of Angkor. Revenues from entrance fees represent a unique opportunity to restore Angkor to a thriving city and to conserve its cultural heritage. Local people’s desire to work with the authorities in the preservation of their heritage must be built upon through community-based conservation, as well as through the implementation of development projects in agriculture, education and water supply.
3
1.0 THE ANGKOR ARCHAEOLOGICAL PARK
1.1 Background
The Kingdom of Cambodia's Angkor Archaeological Park was added to the World Heritage List in 1992. The park is located north of the Great Lake, some 300 km from Phnom Penh by road. It contains some of the most significant monuments of Khmer civilization, which flourished between the 9th and the 15th centuries. Founded by Jayavarman II, Angkor was the political and cultural center of the Khmer Empire. The park stretches over an area of more than 400 km2 in the province of Siem Reap, and comprises 1,400 archaeological works. As listed by the United Nations Educational Scientific and Cultural Organization (UNESCO), these are of outstanding universal value from both historical, aesthetic and anthropological points of view. The famed towers of Angkor Wat figure prominently on Cambodia’s national flag, evidence of their enduring role in the country’s history and culture.
Although Angkor has attracted foreign visitors since the beginning of the 20th century, its popular claim to fame is relatively recent. From a little known and inaccessible destination a mere decade ago, Angkor is now advertised by major international tour operators. There has been substantial foreign investment to build up the city’s lodging facilities from just one hotel in 1997, to today’s plethora of guesthouses catering for backpackers and the half a dozen five-star hotels that are suited to high-end tourism (Gross 2006). The city of Siem Reap, gateway to the park, has experienced a rapid and chaotic growth in recent years. Public infrastructure and services have struggled to keep up with the demands of mass tourism. Power supply, waste management, sewerage systems and the road network remain largely inadequate.
Siem Reap’s transformation from a modest provincial town to an international travel destination has provided a significant source of foreign currency and may present opportunities for alleviating social woes. Once more, the Kingdom's ancient capital, shines as a beacon of economic development. But development has come with associated costs, including negative environmental and social impacts. Pollution, in the form of wastewater, solid waste and gaseous emissions, is directly discharged into the environment with little treatment. The increase in the number of visits has put additional pressure on local resources, notably water, and further increased pollution levels. As imbalances in development become more pronounced, the question arises as to what extent local people have benefited from the apparent tourism cornucopia. Without proper planning and adequate infrastructures, the temples of Angkor may have reached their carrying capacity, beyond which point they may suffer irreparable damage. In its current form, the development of Angkor appears unsustainable.
1.2 Angkor Park Management
Legal Framework
Over the past decade, a number of pieces of legislation governing the protection of Cambodia’s cultural heritage have been adopted by the National Assembly and the Royal Government of Cambodia (RGC). These now constitute a comprehensive legal framework. The general purpose of the Law on the Protection of Cultural Heritage (1996) is to protect national cultural heritage and cultural property against illegal destruction, modification, alteration, excavation, alienation, exportation or importation. While the Ministry of Culture and Fine Arts is responsible for policy implementation

4
throughout the Kingdom of Cambodia, the APSARA Authority (further discussed in the following sections) has jurisdiction over the management of Angkor and the region of Siem Reap.
Management Guidelines The management and development of Angkor is the responsibility of the
Autorité pour la Protection du Site et l’Aménagement de la Région d’Angkor (APSARA), namely the National Authority for the Protection of the Site and Development of Angkor. This acronym is a Khmer common word and signifies “celestial dancer”. A Royal Decree of 19th February 1995 provided the legal basis for the creation of APSARA as a national public establishment and details provisions governing its administration and financing. The resources of APSARA consist of subventions from the State and international donors, fees and rents collected from concessions, remuneration from services provided and loans.
APSARA’s mandate extends beyond the protection of Angkor’s cultural and natural heritage, and encompasses responsibilities over the social and economic development of the whole province of Siem Reap. APSARA has legal autonomy to implement decisions within its jurisdiction, and is independent from any other state agency. APSARA’s broad ranging mandate and authority was reinforced by Article Six, an additional Royal Decree issued in January 1999. Article Six clearly states that the APSARA Authority holds the exclusive right to grant building permits for the overall Angkor site. Any authorization or permit granted in disregard of the exclusive jurisdiction of APSARA is considered null and void. In addition, illegal buildings may be destroyed without compensation within 45 days of the date of notification. Protected Archaeological Reserves, that is, Zone 2, are the public domain of the State. Therefore, land transfers or concessions made in these reserves are null and void. Besides the sources of revenues listed above, APSARA is entitled to fees from pictures and films taken in Zone 1, revenues from cultural or artistic events and proceeds from rental agreements or use fees for government property.
Protected cultural zones The Angkor Park is divided into five categories of protected sites. These have
differing management objectives. The Royal Decree that established Protected Cultural Zones in the Siem Reap/Angkor Region and Guidelines for their Management was adopted in May 1994. It provides the legal basis for the zoning of the park and its management. The five categories of protected sites are as follows:
Zone 1: Monumental Sites
Zone 2: Protected Archaeological Reserves
Zone 3: Protected Cultural Landscapes
Zone 4: Sites of Archaeological, Anthropological or Historic Interest
Zone 5: The Socio-Economic and Cultural Development Zone of the Siem Reap/Angkor Region.
The monumental sites and the protected archaeological reserves constitute the core zones. These have the most significant archaeological features and the highest level of protection. There are three main, non-contiguous, monumental sites (Zone 1) around

5
the temples that surround the ancient capitals of Angkor Wat and Angkor Thom, Roluos and Banteay Srei. The Roluos group is located some 30 km southwest of Siem Reap, while Banteay Srei lies 40 km northwest of Angkor. The protected archaeological reserves (Zone 2) act as buffers around the monumental sites. The monumental site of Angkor and its protected archaeological reserve form a rectangle covering an area of more than 350 km2. This rectangle broadly corresponds to the original Angkor Park designated in 1925 (APSARA 2005a).
The monumental sites and the protected archaeological reserves are under the strictest management control. The majority of the articles of the Royal Decree articulate specific and differentiated management guidelines for Zone 1 and Zone 2. These guidelines are summarised in Table 10. There is a prohibition of development in any part of these zones with the following exceptions: development essential for the protection and enhancement of the monuments (Zone 1), and development essential for the protection and enhancement of the monuments and the preservation of local lifestyles (Zone 2). For instance, small-scale community irrigation may be allowed in Zone 2, provided it does not prejudice archaeological work. Furthermore, residency in Zone 1 is prohibited, while the preservation of the old villages in Zone 2 may be encouraged. In practice, there remains a significant population of local residents in Zone 1. By law, the expulsion of local people or presumed squatters would require that the state provide land and building materials for their resettlement elsewhere (Article 17, Royal Decree 1994). Although forced eviction may be envisaged by some policy makers, the financial costs and political fallout of such unpopular measures would be problematic. In November 2004, the government quickly reversed an attempt to expel squatters from the Angkor Wat compound after protests erupted in the park (Van 2004, Yun 2004).
Protected Cultural Landscapes (Zone 3) are areas preserved for their distinctive traditional physical and cultural features, which include historic buildings and land use practices. The Siem Reap and Roluos Rivers, which were artificially channelled into the Angkorian network of canals, are included in Zone 3. Sites of Archaeological, Anthropological or Historic Interests (Zone 4) are of less significance than the Monumental Sites, but require protection for research, education and tourism. The isolated temple of Phnom Krom, which overlooks Lake Tonle Sap, is included in Zone 4. The Socio-Economic and Cultural Development Zone (Zone 5) covers the whole of Siem Reap Province and broadly corresponds to the catchment area of greater metropolitan Angkor. Zone 5 is to be managed as a multiple-use area with an emphasis on economic and social development through sustainable natural resource use and cultural tourism.

6
2.0 RESEARCH OBJECTIVES AND METHODOLOGIES
The primary objective of this study was to explore policy options that would ensure the sustainable development of Angkor from financial, environmental and social perspectives. In other words, the study aimed to answer the question: How can the development of Angkor be made more sustainable? While tourism may represent a significant source of hard currency for an impoverished country such as Cambodia and bring economic benefits to the province of Siem Reap, mass tourism has increased pressure on Angkor's cultural and natural features. Against this background of rapid tourism development, Siem Reap Province has one of the highest rates of poverty in Cambodia, with some 54% of its population living below the official poverty line of less than 50 US cents a day (UNWFP 2002). The extent to which local people have benefited from tourism is undetermined.
To assess the sustainability options for Angkor, this study made use of secondary and primary data. Secondary data consisted of technical surveys and papers that were used to examine financial and environmental aspects. The study focused on the sustainable use of water resources. This has historically been a main area of concern and have attracted renewed attention from policy makers (Vachon 2004).
Surveys of souvenir sellers and of Angkor residents provided primary data to investigate the social aspects of sustainability. These surveys consisted of semi-structured face-to-face household interviews. These are provided in the appendices of this study. A total of 428 souvenir vendors and 2,514 households residing in Angkor were interviewed. The vendor survey was administered from February to May 2005, and the village survey from May to September 2005. The research methodologies are discussed in further detail in the relevant analytical sections.

7
3.0 REVENUES FROM VISITOR ENTRANCE FEES
The collection of visitors’ entrance fees to the Angkor Park is the exclusive right of a private company which was awarded the concession in April 1999. Contrary to popular belief, the APSARA Authority does not charge entrance fees to the park, although it receives part of the proceeds from visitors. This ticket concession system has been a contentious issue since its inception, however it was renewed in August 2005 until 2010 (Kay & Wasson 2005). The position of the International Monetary Fund with regards to the contract summarises the situation:
“The IMF has repeatedly urged the Government of Cambodia to use competitive bidding in granting or extending any concession agreement… Since the extension of the contract was not competitively bid, it is not possible to know if the government could have or would have obtained a better deal.” (Hagemann 2005)
Nevertheless, using visitor arrival figures to Cambodia, that have been recorded by the Ministry of Tourism (MOT), it is possible to indirectly estimate the annual proceeds from entrance fees to the Angkor Park. The Tourist Statistical Report provides details of monthly foreign visitor arrivals by air, land and boat for 2005. Arrivals by air are further divided between the international airports of Pochentong Phnom Penh and Siem Reap (MOT 2006). Annual arrivals, similarly divided by mode of transportation, are available from 1998. Aggregated annual arrivals have been recorded since 1994. While in 1994 fewer than 177,000 visits to Cambodia were recorded, the figure had increased steadily to more than 1,400,000 people in 2005. Furthermore, a team lead by John Howse reports that, according to estimates by the Ministry of Tourism, 67% of visitors to Cambodia in 1997 went to Angkor and stayed an average of two and a half days in Siem Reap (Howse et al. 1998).
Based on different combinations of these assumptions, the researchers proposed to carry out an estimate of the proceeds from entrance fees to the Angkor Park for 2005. The three scenarios used were named rosy, bleak and middle of the road and described possible events. The probability of any of these scenarios actually taking place was equal. In the rosy scenario, all visitors arriving in Siem Reap Airport and two-thirds of all other visitors visited Angkor for an average three-day stay. In the bleak scenario, only half of the visitors arriving in Siem Reap Airport and a third of all other visitors visited Angkor for just a day visit. The middle of the road scenario used a combination of the same assumptions.
Table 1 Scenarios and assumptions for estimating revenues from annual entrance fees to Angkor
Scenarios Assumptions Rosy - All visitors arriving in Siem Reap visit Angkor
- Two-thirds of all other visitors visit Angkor - All visitors stay an average of three days
Bleak - Half of visitors arriving in Siem Reap visit Angkor - A third of all other visitors visit Angkor - All visitors stay an average of a day
Middle of the Road - Two-thirds of visitors arriving in Siem Reap visit Angkor for a three-day visit - Half of all other visitors visit Angkor for a two-day visit

8
Table 2 Schedule of entrance fees to the Angkor Park (US $) Day Pass 20 Three-day Pass 40 Week Pass 60
The estimated number of visitors to Angkor ranged from fewer than 300,000 in the bleak scenario to more than 1,000,000 in the rosy scenario. According to APSARA, the number of tourists visiting Angkor could soon reach one million, making the rosy scenario not improbable (APSARA 2005b). Corresponding revenues from entrance fees estimated for 2005 varied from about US $11 million to almost US $44 million. Although the exact figure is obviously a matter for debate, it is important to recognise that the proceeds from entrance fees are substantial. Arguably, increased transparency and independent monitoring and auditing by third parties would settle the issue.
Table 3 Estimates of Angkor entrance revenues using visitor arrival data from the Ministry of Tourism for 2005
Rosy
Arrivals in Cambodia
Visitors to Angkor
Entrance Revenues (US $)
Phnom Penh Air 416,396 277,597 11,103,893 Siem Reap Air 440,125 440,125 17,605,000 Other 565,094 376,729 15,069,173 Total 1,421,615 1,094,452 43,778,067
Bleak
Arrivals in Cambodia
Visitors to Angkor
Entrance Revenues (US $)
Phnom Penh Air 416,396 138,799 2,775,973 Siem Reap Air 440,125 220,063 4,401,250 Other 565,094 188,365 3,767,293 Total 1,421,615 547,226 10,944,517
Middle of the Road
Arrivals in Cambodia
Visitors to Angkor
Entrance Revenues (US $)
Phnom Penh Air 416,396 208,198 8,327,920 Siem Reap Air 440,125 293,417 11,736,667 Other 565,094 282,547 11,301,880 Total 1,421,615 784,162 31,366,467
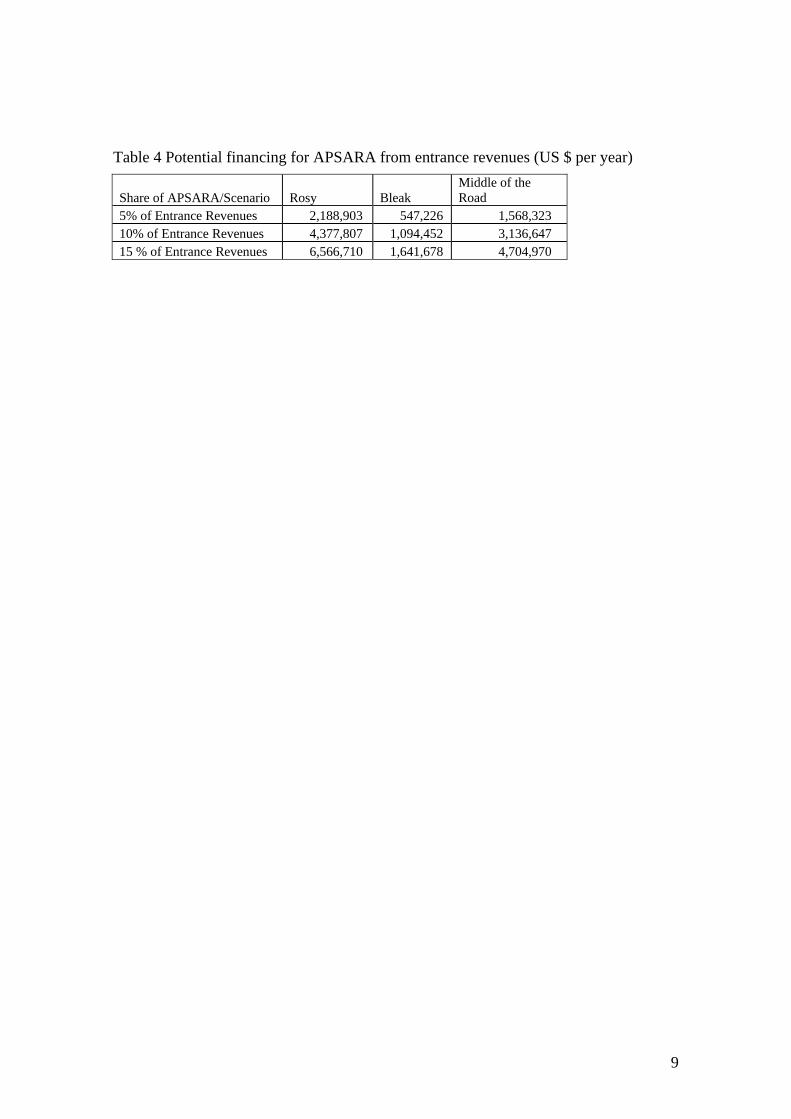
Estimates for APSARA’s share of the proceeds from visitor entrance fees have been reported at levels from 5% to 15% (Howse et al. 1998, Kay & Wasson 2005). The calculation of this share is based on official entrance fees collected. Even if APSARA was only allocated 5% of actual fees, it would receive from half a million US dollars in the bleak scenario to more than two million US dollars in the rosy scenario.
9
Table 4 Potential financing for APSARA from entrance revenues (US $ per year)
Share of APSARA/Scenario Rosy Bleak Middle of the Road
5% of Entrance Revenues 2,188,903 547,226 1,568,323 10% of Entrance Revenues 4,377,807 1,094,452 3,136,647 15 % of Entrance Revenues 6,566,710 1,641,678 4,704,970
10
4.0 WATER DEMANDS
La cité hydraulique angkorienne In his classic paper, “The Angkorian hydraulic city”, Bernard-Philippe Groslier
(1979) underscores the significance of water management and waterworks in Angkor. At its apogee, the capital of the Khmer empire may have been the home of at least a million inhabitants. In comparison, the entire province of Siem Reap currently numbers fewer than 800,000 people (NIS 2005). While the temples of Angkor have been the focus of extensive research, the hydraulic system, which covered an area of 1,000 km2, is less well understood. This complex system of canals, embankments, ponds and reservoirs is likely to have played a central role in religious ceremonies, and was essential to meeting the needs of a large urban population. Eileen Lustig (2001) and Roland Fletcher (2005) have argued that the water network was essential for risk mitigation in agriculture. In years of low rainfall, the hydraulic system provided enough supplementary water to guard against crop failure, thus ensuring a reliable agricultural production. Reservoirs, embankments and channels also acted as flood control structures during years of heavy rainfall.
The most prominent vestiges of the Angkorian hydraulic system are the baray, the famed Khmer elevated reservoirs. The baray is an artificial lake, supplied with water by a canal, and surrounded by a dyke that allows for storage above ground level. The largest baray covers an area of 17 km2. The combined storage capacity of all baray has been estimated at between 80 to 230 million m3 (Acker 1998, Garami and Kertai 1993, Kummu 2003, Lustig 2001).
Erosion and sedimentation might have eventually caught up with the Khmer water engineers (Evans and Fletcher 2003, Groslier 1979, Kummu 2003). The failure of the hydraulic network may have contributed to the decline of Angkor. As erratic drought and flooding spread across the area, stable agricultural production could no longer be achieved. Nevertheless, the Angkorian hydraulic city was sustainable for six centuries. Some would argue that it would still be sustainable if properly maintained. Of the old baray, the Western Baray and the Srah Srang have remained operational to the present day.
Water for Siem Reap City The Japan International Cooperation Agency (JICA) conducted a study on water
supply options for the city of Siem Reap (JICA 2000) between 1996 and 2000. The study projected that the city’s water demand would increase to 12,900 m3/day in 2010. The authors conducted a survey of 40 hotels, which all used their own wells to meet their customers’ water needs. Unit water demand was estimated at 500 litres per capita per day for tourists, compared with 100 to 120 litres for local residents. The study forecast that the total numbers of visitors coming to Siem Reap would reach some 756,000 people by 2010.
The study assessed four alternative sources of water for the supply to the city of Siem Reap: (1) groundwater, (2) the Western Baray, (3) the Siem Reap River and (4) Lake Tonle Sap.

11
According to topographical surveys conducted by JICA, the effective storage capacity of the Western Baray is estimated at 48.6 million m3, 66% of which is currently used for agricultural irrigation. Thus, the Western Baray could provide sufficient water to meet the city’s forecasted water needs. The Western Baray was built by King Udayadithyavarman II in 1050. Among the baray of Angkor, it is the largest, measuring 7.9 by 2.2 km, and one of two still in service. The Western Baray is located northwest of Siem Reap City, in the vicinity of the international airport. Lake Tonle Sap, Asia’s largest freshwater lake during the rainy season, is an alternative source of water. However, this would require water to be pumped over a distance of more than 19 km to the city centre. Finally, flow measurements taken at different locations along the Siem Reap River have shown that its capacity, particularly in the dry season, is insufficient to meet the city’s needs.
The study further examined the water quality of the different sources. With the exception of groundwater, water was found to contain high levels of organic and inorganic pollutants. This in turn would require the construction of water treatment facilities, that would contribute to an increase in project costs. In contrast, groundwater showed no contamination, and presented concentrations of iron and arsenic below World Health Organisation (WHO) standards. Supplying the city of Siem Reap with groundwater was thus identified as a priority project.
The authors of the JICA study considered the risks of land subsidence associated with groundwater extraction. They advised that, should groundwater extraction exceed the rate of natural recharge of the aquifers, land subsidence would occur, causing structural damage to buildings and infrastructure. The international airport and National Road 6 are closest to the pumping site, which is located 5 km northwest of the city of Siem Reap, in Zone 2 of the Angkor Park. Although the authors of the study ran computer simulations suggesting that the rate at which water would be pumped would not exceed recharge rates, they recommended close monitoring of groundwater levels “to avoid the problems due to pumping which cannot be forecasted at present”. In plain English, pumping rates would have to be decreased if land subsidence were to be observed in the Angkor Park.
The completion of the study was quickly followed by the implementation of the groundwater supply priority project. Stage 1 of the project was completed in 2005 and increased the capacity of the Siem Reap water supply system from 1,440 m3/day to 9,440 m3/day. Stage 2 consists of a further capacity increase to 12,000 m3/day by the end of 2006. Under Stage 1, water is pumped from ten wells that have been drilled to a depth of 50 m along National Road 6, in the vicinities of the Western Baray. Each well has a capacity of 800 m3/day. Water is disinfected with liquid chlorine before being pumped onwards to the Siem Reap distribution network. Five additional wells will be constructed under Stage 2 of the project.
From a sustainability point of view, the implementation of the Japanese funded water supply system for Siem Reap is an improvement when compared to current practices, where hotels and villas drill their own wells to a depth of 50 m to meet the water demands of their customers and dwellers. The project allows for centralised control over access to aquifers, thus reducing contamination and waste. Over the longer run, as the authors of the JICA study admit, the precautionary principle remains de rigueur. It is essential that groundwater levels and land subsidence be carefully monitored, as the pumping site remains precariously close to the core monumental zone

12
of Angkor. In addition, the project will only meet the forecasted water demands of Siem Reap City up to the year 2010. Beyond this date, there will be a need to implement further capacity increases and more efficient management of available water supplies. Furthermore, the project assumes a maximum number of visitors of 756,000 people per year in 2010, which is below the anticipated one million visitors. As supply side management is only one facet of the water issue, demand side management ought to be considered as early as possible.

13
5.0 ANALYSIS OF PRIMARY SURVEY DATA
5.1 Surveys of souvenir vendors and of local people
To collect primary data to analyse aspects of social sustainability, two household questionnaires were developed for two different groups of stakeholders: 1) A household tourism questionnaire for souvenir and food vendors working in the park. This questionnaire was administered at the main temples of the monumental zones of Angkor Wat, Banteay Srei and Roluos. 2) A household questionnaire for local people residing in the protected cultural zones of the park. This questionnaire was administered in the villages located in Zone 1 and Zone 2, including the monumental zones of Angkor Wat, Banteay Srei and Roluos.
The first questionnaire focused on tourism activities, while the second questionnaire broadly covered traditional rural livelihoods. The questionnaires were administered from February to September 2005.
The vendor survey was conducted at the 25 temples of the monumental zones where the APSARA Authority had allowed the construction of souvenir and food stalls. A total of 428 vendors were interviewed, 85% of who operated from souvenir stalls and 9% served meals at food stalls. The vendors interviewed were primarily the owners or tenants of each of the existing stalls. Thus, at each temple, the number of vendors interviewed corresponded to the number of existing stalls or restaurants. The survey did not cover the larger restaurants at Angkor Wat, all of which were owned by non-residents, nor did it cover the hawkers at the beaches of the Western Baray.
The number of souvenir vendors in the park fluctuates seasonally, as the high tourist season attracts more villagers. Authorities keep strict limits on the number of stalls and their operations. Vendors must pay concession fees to APSARA, the Ministry of Culture and Fine Arts and, in some instances, to police and commune authorities. The latter fees are not officially sanctioned. Around each group of stalls, a rope shows the area beyond which vendors cannot sell their wares. This prevents visitors from being hassled within the compounds of the temples. Assuming that a maximum number of five vendors work from a given stall, the total population of vendors in the park may be in the range of 2,000 people. This is a surprisingly modest figure when compared to the annual number of visitors or the total population of the park. This also means that the sample of the vendor survey was about 20% of the total population. This was large enough to produce statistically significant results.
The household survey was conducted in 59 different villages amongst a total sample of 2,514 households. Total population and household figures were collected for each village from the village chiefs and the commune authorities. Sample sizes varied from 5% of the population for the larger villages to 55% for the smaller villagers. These allowed for statistically significant results. In each village, all existing houses were assigned a unique number and a sample of households to be interviewed was randomly selected. The total sample size represented 20% of the total population, which stood at 69,946 people in 12,872 households. This compares to coarse estimates by the APSARA Authority which put the total number of residents in Zone 1 and Zone 2 at 100,000 people for the year 2002 (APSARA 2005c).

14
Table 5 Number and locations of vendors interviewed Temple Number of
InterviewsAngkor Wat 90Bakong 9Banteay Kdei 14Banteay Samre 7Banteay Srei 30Baphuon 25Baray Occidental 33Baray Tuek Vil 16Bayon 25Lolei 1Mebon Oriental 16Neak Pean 23Phalilay 4Phimeanakas 10Phnom Bakheng 8Prah Ko 8Prasat Kravan 8Pre Rup 8Preah Khan 15Preah Pitu 3Srah Srang 8Ta Keo 9Ta Prohm 41Ta Som 5Thommanon 12Total 428
Table 6 Sample size and population residing in Zone 1 & Zone 2 of the Angkor Park Sample size (households)
Total population in Zone 1 & Zone 2 (households)
Total population in Zone 1 & Zone 2 (inhabitants)
Number of villages surveyed
2,514 12,872 69,946 59
5.2 Results of the survey of the souvenir vendors of Angkor
Household demographics Male interviewees, excluding children, represented only 6% of all vendors. This
was because women largely dominate the sale of souvenirs and food to tourists at Angkor. Female spouses made up 46% of vendors, while children represented another 48%.
Education About 30% of all heads of households were illiterate, that is, they had never had
any form of schooling. Another 39% had only six years of primary education or less. Fewer than 7% had completed secondary education. On average the heads of

15
households of families involved in souvenir vending had benefited from 4.4 years of education while their spouses had an average 3.2 years of education.
The survey recorded the age and the number of years of schooling of all children in the household. Thus, it was possible to determine the theoretical number of years that every child would have attended school based on his or her age. It was found that by the age of ten, children were on average 2.7 years behind schedule. Three-quarters of children were five years or more behind schedule. For reference, school usually starts at age five and ends at age 18. Twelve years of education are required to successfully complete the baccalauréat double, the Cambodian high school diploma.
Table 7 Theoretical versus actual years of schooling for children of households involved in tourism
Child’s age Theoretical Number of Years of Schooling
Actual Average Number of Years of Schooling
17 12 6.8 16 11 5.8 15 10 5.4 14 9 4.9 13 8 4.2 12 7 3.9 11 6 2.7 10 5 2.2
9 4 1.9 8 3 1.2 7 2 1.8 6 1 1.4
Products sold Some 72% of vendors sold drinks, 47% sold t-shirts and another 44% sold
Khmer scarves. About 21% of vendors offered meals they prepared on their premises. Other souvenirs, which included books, postcards and handicraft, were sold by 29% of vendors.
Profit margins averaged 50% of the sales price for cans of soft drinks, t-shirts and Khmer scarves. Among vendors, there was relatively little variation in the purchase price of the most common items sold. While 44% of vendors purchased their goods from markets in Siem Reap, 56% relied on daily deliveries by mini-vans and trucks.
Table 8 Average profit margin for selected items sold by souvenir vendors (US dollars) Can of soft drink Small bottle of
water T-shirt Khmer scarf
Sales price 0.6 0.5 2.2 1.1 Cost 0.3 0.1 1.1 0.5 Profit 0.3 0.4 1.1 0.6 Profit margin (% of price)
50 80 50 55
Household income On average it was found that tourism provided some 74% of household income,
while paddy cultivation accounted for another 12%. Agricultural activities, including paddy, livestock, fishing and fruit and vegetable cultivation, represented 16% of
16
household income. About 40% of households relied entirely on tourism for their income. Three quarters of households were dependent on tourism for at least half of their income. Thus, there was a high degree of specialisation and dependence on tourism among the households of souvenir vendors. This made villagers vulnerable to sudden drop in the number of visitors, as during the Severe Acute Respiratory Syndrome (SARS) outbreak in 2003. However, it could be argued that household vulnerability to fluctuations in temple visits is no more significant than their vulnerability to fluctuations in climatic conditions, which still largely determine agricultural productivity in Angkor.
The mean highest monthly net income of vendors was US $102, while the mean lowest net income was US $38. Income was highly seasonal, with the tourist season peaking in January. The month of May marked the low point of the season. About a quarter of households achieved a highest monthly net income in excess of US $150 and maintained their monthly net income above US $50 at all times. The average net annual income was estimated at US $664, or an average of US $55 per month. During the low season, 63% of households earned less than a dollar a day in net income.
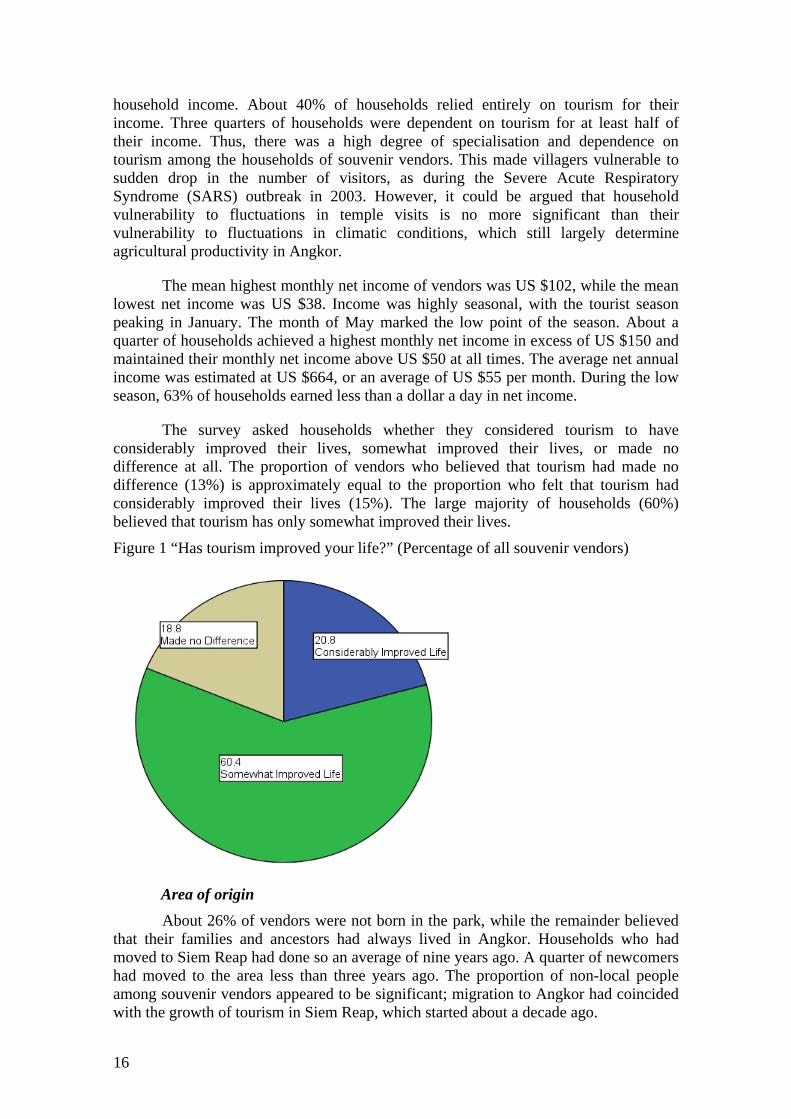
The survey asked households whether they considered tourism to have considerably improved their lives, somewhat improved their lives, or made no difference at all. The proportion of vendors who believed that tourism had made no difference (13%) is approximately equal to the proportion who felt that tourism had considerably improved their lives (15%). The large majority of households (60%) believed that tourism has only somewhat improved their lives.
Figure 1 “Has tourism improved your life?” (Percentage of all souvenir vendors)
Area of origin
About 26% of vendors were not born in the park, while the remainder believed that their families and ancestors had always lived in Angkor. Households who had moved to Siem Reap had done so an average of nine years ago. A quarter of newcomers had moved to the area less than three years ago. The proportion of non-local people among souvenir vendors appeared to be significant; migration to Angkor had coincided with the growth of tourism in Siem Reap, which started about a decade ago.

17
Almost all vendors who were born in the area believed that their ancestry could be traced back to the builders of Angkor. An insignificant proportion of vendors were uncertain about the Angkorian origins of their ancestors. All interviewees, including vendors from other provinces, were Khmer.
Local knowledge of the temples When asked to name the kings who built Angkor Wat (Suryavarman II), Angkor
Thom (Jayavarman VII) and the temples where they sold their wares, vendors were overwhelmingly unable to answer. An insignificant proportion provided correct answers. Jayavarman VII and Suryavarman II were well known figures among the interviewees. However, there was a great deal of confusion as to which temples these famed kings had built. The lack of knowledge about basic Khmer history was a reflection of the low level of education enjoyed by vendors. However, it was surprising that vendors were unable to name the kings who had built the temples where they work on a daily basis. An explanation may lie in the absence of signboards presenting basic temple facts in Khmer.
Some 39% of vendors had never visited any of the temples of Angkor. This was an unexpectedly high figure, considering the fact that vendors sell their wares within metres of the temples. Many vendors explained that they are too busy working. Some 29% of vendors visited the temples occasionally – from a few times a year to once a week.
These findings are significant because community-based heritage preservation essentially depends on the existence of a sense of ownership among local people. As discussed earlier, the large majority of vendors and their families are the descendants of the original inhabitants of Angkor. However, they have little knowledge and understanding of their past, which may not allow them to fully appreciate the historical and cultural significance of Angkor.
Social capital Social capital may be defined as features of social organisation that facilitate
cooperation for mutual benefits, such as networks and trust (Putnam 2000). Because of a traumatic history of genocides and conflicts, researchers have argued that social networks of trust and cooperation have essentially been destroyed in Cambodia (Coletta & Cullen 2000).
Because there are few interested buyers in comparison to the number of souvenir vendors around any given temple, competition among hawkers at Angkor may be intense. However, the evidence from the survey points to relatively high levels of mutual trust and reciprocity among vendors.
Vendors were asked whether they agreed or disagreed with the following statements: (1) vendors get on well with each other; (2) vendors help each other; (3) vendors do not care about each other; (4) vendors often argue with each other; and (5) vendors do not trust each other. An overwhelming proportion of those interviewed agreed that vendors got on well with each other (94%) and that they helped each other (83%). An equally high proportion disagreed with statements that vendors do not care about each other (89%), that they often argue with each other (89%) and that they do not trust each other (82%).
18
About 83% of vendors affirmed that they frequently helped other vendors on a voluntary basis. For instance, helping others sell souvenirs or food is a common practise. It was clear that should a vendor be busy serving a customer, another vendor would help her sell souvenirs to other customers, or that when a vendor could not tend to her stall because of other engagements, other vendors would readily sell her wares. There was no strict rule as to how the proceeds of any such sale should be shared. Normally vendors simply expected that their peers would return the favour should customers overwhelm their stall.
Fewer than 10% of interviewees rated the overall sense of community among vendors as low, while 48% rated it as average and 40% rated it as high. There was some competition among vendors and arguments occasionally erupted. Such problems appeared to be rare occurrences, both according to vendors and to what had been witnessed over the course of a year of fieldwork. The different groups of women, especially around the smaller temples, appeared to be closely knit. As discussed in the next section, social capital among vendors was significantly higher than among other villagers of the park.
Thus, evidence shows that bonding social capital among vendors was high. Although not specifically assessed by the survey questions, bridging capital may also have been equally high among vendors. To be able to sell their wares successfully, the vendors frequently interacted with foreign visitors. The expertise they had developed to facilitate this interaction, such as negotiation, languages and sales skills, made them better equipped to deal with a host of stakeholders than were other local people who rarely ventured beyond the boundaries of their villages. Vendors had experience interacting not only with foreign tourists but also with people from other villages, suppliers from the city, police officers, tour guides, drivers and APSARA staff. In other words, they were wilier in the ways of the park than other villagers. This may make them more receptive to, and may put them in a better position to benefit from, development projects.
Development projects requested by souvenir vendors Only half the vendors were able to suggest any development projects that would
help them improve their livelihoods. Some 14% requested the establishment of a credit scheme to help them further investment in their stalls and products. About 6% of vendors suggested that the authorities encourage visitors to buy souvenirs from local people rather than from stores in Siem Reap. Another 7% would like some financial support to complete secondary school or to undertake vocational training in marketing skills and foreign languages.
5.3 Results of the survey of the villages of Angkor
Household demographics The average age of the population was 25 years old. Half the villagers were
below 20 years of age and only a quarter above 35 years old. About 29% of households had at least five children. Households had an average of 3.3 children. The average size of the household was 5.6 people. A quarter of households had more than seven individuals. The largest households had 12 members. The entire population was Khmer.

19
Area of origin The overwhelming majority of households interviewed were originally from
Siem Reap Province. A mere 5% of interviewees were not born in the area, and had moved to the province on average more than nine years ago. Some 87% of households believed that they could trace their ancestry back to Angkorian times. Thus, the settlements of Angkor remain largely inhabited by descendants of the original builders. In contrast, the survey of souvenir vendors recorded a significantly larger proportion of individuals (about a quarter) who were born in other provinces.
Education Illiteracy rates were as high as 39% among heads of households and 48% for
their spouses. Three quarters of the heads of households had fewer than five years of formal education, while three quarters of their spouses had fewer than three years of formal education. Only 21% of the heads of households and 12% of their spouses had completed primary education. While 2% of heads of households had completed secondary education, the percentage of spouses who had done the same was insignificant. These results were markedly different from those of the vendor survey. Vendors and their families, as a group, appeared to be more educated than the rest of the residents of the park. For instance, literacy rates were, on average, ten percentage points higher for families of vendors.
Figure 2 Literacy rates and years of education (Percentage of all heads of households)
The village survey recorded the age and the number of years of schooling of all children in each surveyed household. A quarter of children were three years behind schedule, half were four years behind schedule and three quarters five years behind schedule. About 15% of children were at least six years behind schedule. Fewer than 3% of children were on schedule within their programmes of studies. The averages for years of schooling from the village survey were not substantially different from those of the survey of vendors. Although the children of households involved in selling souvenirs were more educated than other village children, the maximum difference in years of schooling for any given age group was only a little bit more than a year.

20
Illiteracy rates were alarmingly high for both adults and children. Educational problems cannot be corrected rapidly. If universal and free education were to be immediately available at Angkor, it would still take another generation before a significant change in educational levels would be witnessed.
Table 9 Theoretical versus actual years of schooling for Angkor’s children Child’s age Theoretical Number of Years
of Schooling Actual Average Number of
Years of Schooling 17 12 5.7 16 11 5.5 15 10 4.7 14 9 4.2 13 8 3.7 12 7 3.2 11 6 2.7 10 5 2.1
9 4 1.5 8 3 1.0 7 2 0.0 6 1 0.0
Local knowledge of the temples When householders were pressed to discuss the builders of Angkor Wat and
Angkor Thom, two names frequently appeared in discussions: the names of the famed kings Suryavarman II and Jayavarman VII. These kings were familiar names among local people, but there was a great deal of confusion as to which king built what temple and when.
The lack of knowledge was a reflection of the low levels of education among local people, but crucially it also showed that village folklore regarding the temples is no longer passed from one generation to another. In our surveys of villages, elders have been encountered who were knowledgeable about village and temple histories and how they had traditionally intermingled. The rule of the Khmer Rouge essentially put a brutal end to any folklore tradition in Angkor. With few survivors from previous generations, as the demographics of this survey showed, there are few elders able to transmit historical and cultural knowledge to present generations.
Household dwellings The income of households involved in souvenir and food vending around the
temples was determined in a straightforward manner. From one vendor to another, there was little variance in terms of products and profit margins. In addition, cash transactions were common, which greatly helped people to answer income or sales related questions. In contrast, a household whose main activities centred on agriculture would be unable to determine its monthly or annual income in an accurate manner. This is because a lot of agricultural production is generally for home consumption, rather than for sale at market.
Instead of attempting to determine household income in a quantitatively accurate manner, a number of proxies were used to classify households into distinct groups with different degrees of income and assets. The type of dwellings was used as one indicator of a household’s wealth. In this hierarchy, brick houses are the most costly, followed by wooden houses and houses with walls made with fronds or straw.
21
Mud houses are the cheapest homes, but are very uncommon in rural Cambodia. Similarly, there is a cost hierarchy for the roofs of dwellings. Tiles are the most energy efficient and aesthetically pleasing, but are expensive and require periodical replacement. Corrugated iron is a far less costly alternative but tends to keep heat trapped inside dwellings. Thatched roofs are inexpensive but require frequent repairs and may not be fully impermeable to heavy precipitation. Status also comes into play in the choice of building materials, whether for walls or roofs. While arguably, thatched roofs are superior to corrugated iron from an energy efficiency point of view, they are mainly used by poorer households. The traditional rural Khmer dwelling is made with wooden walls and has a tiled roof. However, any type of roof may be combined with any type of walls. The use of thatch, whether for walls or roofing, constitutes an indicator of poverty.
The survey of the households of Angkor revealed that only 4% of dwellings were made of brick, while 86% were made of wood. Houses with thatched walls accounted for 10% of dwellings, while mud houses constituted an insignificant number. Only 21% of houses had tiled roofs, compared with 47% which had corrugated iron roofs and 31% which had roofs made of fronds. Dwellings entirely made of thatch represented 9% of all houses, but dwellings that used thatch for either walls or roofs accounted for 32% of all houses.
Household income and assets As would be expected, the percentage of the surveyed households’ income that
came from agricultural activities was higher for the village survey (29%) than for the souvenir vendor survey (16%). Income from paddy cultivation and from livestock respectively accounted for 14% and 10% of household income on average. Cultivation of fruits and vegetables (chamkar) constituted only a negligible portion at less than 3% of income. However, large segments of the population planted fruit trees (81%) and grew vegetables (42%). Although these are not generally perceived as a source of income by households, as they are grown for family consumption, fruits and vegetables are essential to villagers’ diet. For example, in the villages surrounding the temple of Bakong, the majority of households grew lettuce, string beans, chilli peppers, eggplants and gourds. These vegetables attract wholesalers from the Siem Reap food market, which is located 25 km along the national highway that passes by Bakong. Yet, it was also common to see land left uncultivated around Khmer dwellings, which could be used to establish home vegetable plots.
22
Figure 3 Sources of household income in Angkor (average percentages of household income)
On average, tourism-related activities accounted for less than 10% of household income. These activities included making or selling souvenirs to tourists (6% of all households), working for the APSARA Authority (3%) and driving moto-taxis (3%). The number of households with members working in hotels and restaurants catering for tourists was found to be insignificant. Only 15% of households had members involved in tourism-based occupations. Of these, 20% considered that tourism had made no difference to their lives, and an equal share considered that tourism had considerably improved their lives. The majority (59%) had seen some improvements in their lives because of tourism. These opinions were very similar to the results recorded by the survey of souvenir vendors.
A number of households (12%) were involved in village-based small trade, which consisted of selling foods or essential items to other villagers. This was usually done from a household’s dwelling and only required a little start-up capital. A more significant proportion of households (17%) had members working in the building sector in Siem Reap as unskilled labourers. In these households, three-quarters of their total income came, on average, from what was earned in the building sector. Agriculture accounted for the remainder. Villagers in the building sector are invariably paid KHR 5000 a day, the equivalent of US $1.25. Work may last from a few months for villas or apartments, to several years for hotels. However, it is difficult to distinguish between construction work taking place because of tourism growth in the city from construction work that is not related to tourism.
Public transport in the Angkor Park is limited. It was found that most households owned bicycles, but that these were not practical for travelling over distances to work or to school. For instance, children living in Banteay Srei had to cycle for more than two hours to attend secondary school in Siem Reap. About 1% of households residing in the park owned a car, while 29% owned a motorcycle. Second-hand motorcycles made in Japan are found in Siem Reap, and may be purchased for US

23
$500 to US $700. These factors contributed to the relative isolation of the villages of Angkor.
Agriculture
About 67% of households owned land, of these, 73% grew paddy in the wet season, 3% grew paddy in the dry season and 7% grew corn. The average household plot was a hectare in size. However, a quarter of households had agricultural plots of less than half a hectare. Among households who grew paddy, rice accounted for an average of 21% of household income. For three-quarters of these households, rice accounted for 30% or less of household income. The fact that paddy did not constitute a higher proportion of household income stems from two factors: (1) the small size of household plots available for crop cultivation and (2) the absence of irrigation systems, which left farmers to rely entirely on rain-fed cultivation. Rice productivity in Angkor averaged 0.9 ton per hectare per year. Only 40% of households managed to exceed a ton per hectare per year, while half of households averaged 0.7 ton or less. This compares with reported national figures of about 2 t/ha/year for Cambodia. While a strategy focussing on low quality and high productivity may reach 4.3/t/ha/year, an alternative strategy focussing on high quality strains and low productivity would average 2.3/t/ha/year (McKenney & Prom 2002).
Some 46% of households owned at least a cow, while only 8% owned a least one water buffalo. Cattle were rarely raised for household consumption. Calves were sold every two years for income, and adult cows were used as plough and draft animals. Cattle constituted a household’s savings, and were only sold to meet a family’s expenditures such as healthcare or weddings. An adult cow fetched an average of US $350, while a two-year old calf fetched up to US $150. Only 20% of all households owned more than two cows.
About 31% of households raised pigs. Pig breeding is more labor intensive than cattle raising, as the animals require continuous feeding and cleaning. Villagers usually purchased piglets for US $30 per animal to fatten them up over a six-month period, at which point they were sold for US $60. Pigs were commonly raised on a medium scale (up to 25 animals) by rice wine distillers who fed them alcoholic rice residues. Three-quarters of households who raised pigs owned fewer than three animals.
The proportion of households raising chickens was 32%. Villagers reported recent unusually high mortality rates for poultry, with many households’ entire stocks dying. The syndromes they described invariably included sputum excretion and coughing, which would point to possible cases of avian flu. Thus, the number of households raising chicken would normally be higher than that recorded by the survey. Cambodia has confirmed cases of avian flu and human fatalities (Kvasager 2006).
Access to water
It was found that during the dry season wells constituted the main sources of water for all households. An insignificant number of villagers had access to rivers, lakes, ponds or piped water. During the wet season, which may last from June to October, all households used wells, but rain also constituted a source of water for 54% of them. Households estimated their average water consumption at about 19 litres/person during the dry season and 24 litres/person during the wet season. This included drinking water, as well as well as water for bathing and cooking. Although

24
water consumption increased during the wet season, villagers did not necessarily have containers, such as ceramic jars, cement basins or cisterns to stock rainwater. Half of all households in Angkor consumed fewer than 17 litres/person during the dry season, compared with 20 litres/person during the wet season. It is generally accepted that 20 to 40 litres/person per day is the minimum necessary for drinking and sanitation alone. This figure increases to 50 litres when bathing and cooking are added (Gleick 1996).
The months of March, April and May were the periods when the highest numbers of households experienced difficulties in securing water supplies. In April, 82% of households found access to sources of water difficult, compared with 37% in March and 31% in May. During the other months of the year the majority of households did not experience any difficulties in accessing water. The dry season forced 85% of households to reduce their water consumption and 31% to source their water from wells located further away. Thus, water shortages appear to be mainly seasonal.
For home gardening and livestock breeding 87% of households used water from wells during the dry season. Rivers and streams provided water for agricultural activities for another 7% of households. During the wet season, all households used rainwater for agriculture. While 65% of households cultivated wet season paddy, only 7% were able to do so in the dry season because of the lack of irrigation infrastructure. Dry season paddy appeared to be cultivated only in the surroundings of the Western Baray and along the old Angkorian network of canals in the districts of Banteay Srei, Angkor Thom and Phnom Bakong. Households experienced difficulties in securing enough water for agriculture from June to August, when the planting of rice seedlings usually occurs. This was therefore a critical period as crops fail under prolonged periods without precipitation. More than half of all households did not have enough water for farming in July and August. It was also found that water shortages for agriculture lasted well into September for 20% of households.
Energy for cooking and lighting
Almost all households used wood as a cooking fuel. More energy efficient fuels, such as charcoal, biogas or Liquid Petroleum Gas (LPG) were used by an insignificant proportion of villagers. Although charcoal is locally produced, notably around Banteay Srei Temple, where wood is relatively abundant, it was considered to be a more expensive fuel and was mainly sold in the city of Siem Reap. A kilogram of charcoal fetched up to KHR 500, or US 12 cents, and was sufficient for the daily use of a household. The type of cooking fuel can be used as a proxy for household income, as wealthier households use more energy efficient fuels. For example, biogas produced by digesters using pig and cattle manure is an efficient and clean fuel but requires an initial investment ranging form US $100 to US $300. It also requires the ownership of livestock.
The majority of households (53%) did not use any form of stove to cook food, they simply built a fire on the ground and put pots and pans on a few bricks or stones. Some 29% of households used bucket stoves for cooking. An insignificant proportion of households used efficient cookstoves or improved bucket stoves. Locally produced efficient cook stoves may save up to 30% of fuel over buckets stoves (CFSP 2006). This suggests that the broader dissemination of more energy efficient stoves would significantly cut wood consumption in the settlements of Angkor and so reduce pressure on forest resources.
25
The main sources of lighting for local people consisted of accumulators (32%) and oil lamps (88%). Household diesel generators, village mini-grids and solar energy, although used in Angkor, accounted for an insignificant proportion of lighting sources. Accumulators, owned by the households, were charged by battery-chargers who used small diesel engines. Battery chargers usually provided a door-to-door service whereby accumulators were picked up from a household and returned fully charged. The fee was usually KHR 2,500 for a battery powerful enough to run a few Compact Fluorescent Lights (CFLs), a radio or a black and white television set. The absence of mini-grid electricity in Angkor is an indicator of poverty. Mini-grids operated by Rural Electricity Entrepreneurs (REEs) would usually charge up to KHR 3,500/kWh of electricity in rural areas (Williamson et al. 2004).
Forest products collected in Angkor
Some 84% of households collected wood for fuel in Angkor. On average, villagers had to walk or cycle about 4 km to their wood collection area. Although a quarter of villagers found wood within a kilometre of their homes, about half had to travel more than 2 km. People travelled up to 40 km, usually to the Banteay Srei and Phnom Kulen areas which are more densely forested. Along the road to Banteay Srei, it was not uncommon to observe villagers cycling back home or to the city markets with their day’s collection of fuel wood. Some 10% of households cycled more than 10 km to gather wood for fuel.
The common units of measurement for fuel wood are bach toch (small bunch), bach thom (large bunch) and kang (bicycle load). A small bunch is sufficient to cook a pot of rice. While there is no standard correspondence between the three units, a bicycle is approximately equivalent to ten small bunches and a large bunch to two small bunches. Households collected an average of 13 small bunches of fuel wood per week, which amounted to more than 25,600 small bunches per week for the sample surveyed alone. Households involved in the fuel wood trade collected up to 200 small bunches per week. Assuming an average market price of KHR 1,000 or US 25 cents, the monetary value of collected fuel wood was approximately US $ 32,000 per week, or more than US $1.6 million per year, for the aggregated population residing in Zone 1 and Zone 2.
The quantities collected and the distances travelled by households to forested areas show that there is a significant local need for fuel wood. Even if local consumption patterns may be sustainable, fuel wood collection is bound to put additional pressure on the degraded forests of Angkor.
Aside from fuel wood, only 10% of households harvested timber and non-timber forest products from Angkor’s remaining forests. An insignificant proportion of households collected medicine, resin and timber, while fewer than 3% gathered wild fruits and vegetables. Some 8% of households collected a variety of ferns and vines for handicrafts and roofing.
Tree species preferred by villagers
Reforesting the park with native tree species and promoting natural regeneration are among APSARA’s stated management objectives. Given the extent of deforestation in Angkor, reforestation and afforestation activities are required on a significant scale and would likely benefit from the involvement of local people. The household survey

26
asked villagers to rate the usefulness of 21 native tree species on a simple scale (very useful, useful, not useful). Bamboo (Bambusa spp.) was assessed to be “very useful” by 87% of all households. The trees that villagers also found useful were those that provide wood suitable for construction: yeang (Dipterocarpus alatus), trach (Dipterocarpus intricatus), koki (Hopea odorata), beign (Afzelia xylocarpa), kragnourgn (Dalbergia latifolia), thnong (Pterocarpus indicus), sdaeuv (Casuarina equisetifolia), neangn nourgn (Dalbergia oliveri), and khlong (Dipterocarpus tuberculatus). Although nitrogen-fixing trees have well-established benefits in addition to their soil enrichment capacity (fodder, fuelwood, furniture etc.), they appeared to be generally less favoured by local people. When asked which benefits of trees were the most valuable, households answered construction (94%), fuel wood (56%), fruits and food (42%), shade (23%), cash income (20%), storm protection (8%) and water sources protection (6%).
Villagers were also asked to list the species of trees they would like to see planted around their homes, in their villages, in the community woodlot and in the rest of the park and around the temples. Answers differed markedly from one planting area to another. Around homes, in villages and community woodlots, there was an overwhelming preference for fruit trees, including banana, cashew, jackfruit, mango, papaya, guava and coconut. In contrast, villagers would prefer to see dipterocarps and ornamental trees planted in the rest of the park. Thus, community forestry projects wishing to enlist local people are likely to find little success if they aim to plant trees that do not meet villagers’ needs. In the light of these findings, requesting households to plant dipterocarp species around their homes and in villages makes little sense.
Protected cultural zones
Some 69% of the households interviewed lived in Zone 1 of the Angkor Park, that is, the core monumental zones of Angkor, Bakong and Beanteay Srei. The remainder of the households lived in Zone 2 or in settlements on its outer boundaries. Zone 1 contains the most significant archaeological sites and is under the highest level of protection. Zone 2 is also rich in archaeological remains, in particular underground artefacts, and acts as a buffer zone for the temples of Zone 1. The main management objectives and characteristics of Zone 1 and Zone 2 are summarised in the table below.
The regulations governing Zone 1 are more restrictive than those of Zone 2. While the old villages are to be preserved in Zone 2, no residency is allowed in Zone 1. This article remains to be fully enforced, as there are about 40 villages located in Zone 1. Both zones have stringent regulations governing new constructions, which are to be limited to development essential for the protection and enhancement of the sites. Zone 2 has the additional provision that development essential for the preservation of local lifestyles, such as small-scale irrigation and craft centers, may be allowed.
To determine which sets of regulations apply to them, the first step for villagers is to determine in which management zone their dwellings or agricultural fields are located. In this study, coordinates of each village were taken using Geographic Positioning System (GPS) receivers and cross-referenced with the official map of the zoning of the Angkor Park that had been digitized using a tablet. For obvious reasons, this would be an impossible task for local people. At the time of writing, APSARA had started building (across the park) signboards which presented a copy of the zoning map. Unfortunately, these signs did not indicate in which zone the individual signboards stand.

27
Table 10 Summary of the characteristics of Zone 1 and Zone 2 of the Angkor Archeological Park (Adapted from the Royal Decree Establishing Protected Cultural Zones in the Siem Reap/Angkor Region and Guidelines for their Management, May 1994).
Zone 1 Zone 2 Article 8: Guidelines Any development prohibited
except for protection and enhancement of archaeological sites
Any development prohibited except for protection and enhancement of archaeological sites, and preservation of local lifestyles
Article 9: Archaeology Under strict protection and managed for research, education and leisure
Under strict protection and control of any harmful activities
Article 10: Visitors - Limit and regulate visitors access - Show management presence - Fix entry price to generate sufficient income for conservation - Control access by cars, ban coaches
- Ban through traffic - Improve access for local residents, avoiding monumental sites - Visitor’s reception and parking facilities
Article 11: Tourist facilities - Small number of constructions for visitors (food, refreshments, bicycle stands etc…) - Restriction on parking - Arrangements for visitors to observe restoration in progress
- Minimise adverse impact of tourism on local communities - Provide craft centres in order to offer economic opportunities to residents
Article 12: Presentation of cultural sites
- Organise guided visits and set up descriptive panels
- Describe local lifestyles
Article 14: Water management - Maintain traditional rice fields - Strict control over replacement of structures
- Develop small-scale irrigation to increase productivity
Article 15: Management of landscapes
- Maintain natural forest and plant decorative trees
- Create forest buffer zone - Enhance landscape by means of agricultural improvements
Article 16: Natural resources - Regenerate native forest - Create botanical garden and forest paths - Maintain traditional rice paddies and pasture
- Undertake large programme for planting native trees - Encourage the planting of crops of higher value (orchards and vegetables) around villages
Article 17: Local residents - No residence - Assistance for relocation with provision of land, houses and community facilities
- Preserve all the old villages - Prohibit new construction - Assist the development of community facilities
Article 18: Pagodas - No new pagoda or religious facility - No overnight stay except in the monasteries of Angkor Wat, Bakong and Lolei
- Introduce regulations governing the siting and appearance of new pagodas
Some 38% of households were unable to say in which zone their villages were located. Only 17% of the households who lived in Zone 1 were aware of that fact. Similarly, for Zone 2, only 18% of households gave the correct answer when asked in which zone they live. Overall, about 17% of all households were able to accurately determine in which zone of the park their villages were located. Thus, the overwhelming majority of villagers remained confused about the zoning of the park. This led to further confusion about rights and obligations. There seemed to be moderate understanding of the fact that

28
building new houses was either prohibited or required the prior approval of APSARA. Local residents were also generally aware of a ban on logging within the park. However, there appeared to be some misunderstanding with regards to which crops and vegetables villagers were able to cultivate and whether they could fence their houses or sell their land. These conditions provided opportunities for land grabbers and other opportunists looking to take advantage of local people. To our knowledge, APSARA has never expropriated any local resident’s land without compensation, although it has attempted to strictly enforce residency regulations with outsiders. Local people have lost land to local leaders who were pretending to implement APSARA directives. Because they are uncertain about their basic rights and obligations, local residents are easy prey. Simply being aware that one’s village is located in a protected zone is insufficient. The management objectives of each zone, as summarised in the table above, are comprehensive and complex. For local people to abide by existing regulations, let alone participate in any form of community-based enforcement, it is essential that they acquire an improved understanding of the zoning of the park.
Figure 4 “In which zone of the Angkor Park is your village located?” (Percentage of all
households)
Social capital
When villagers were asked whether they commonly and voluntarily work together, some 93% of households answered positively. Tasks involving cooperation between different households included building houses and village infrastructure, farming, preparing religious ceremonies and celebrations and digging culverts, wells, irrigation canals and ponds. Most households agreed with the statement that villagers tend to help each other (87%) and disagreed with statements that villagers often argue with each other (87%) or do not trust each other (73%). Since mutual trust and cooperation form the basis of social capital, these results would suggest that there is a high level of social capital in the villages of Angkor. Yet, when asked to assess the overall sense of community in their villages, only 12% of respondents choose the highest rating, while the large majority assessed the sense of community as fair or average (81%).
Zone 1 Zone 2
29
People may have helped each other, trusted each other, and not argued with one another, but how well did they get along? Arguably, this question goes one step further and asks people whether they essentially like each other. For 58% of households, the answer was “so-so”, while another 36% got along well with other villagers. The extreme ratings of the scale (not getting along with other villagers and getting on very well with villagers) recorded an insignificant number of responses.
Did villagers “play” together or spend what leisure time they may have had together? The answer was clearly no, they did not. Some 78% of households had never played cards, chess or any popular games with other villagers, while 75% of households had never practised football, volleyball or sports with other villagers. It is to be noted that these questions were asked for all the members of the households, and not just for the persons interviewed. Arguably, there may be some forms of social dining and drinking which brings villagers together, but this probably happens rarely as there are generally no venues, such as cafes or restaurants where villagers can gather.
It was found that religion brought together some 78% of households on a regular basis, that is, for all the Buddhist holidays. However, 18% of households rarely attended religious ceremonies. This may be due to the fact that there are only eight pagodas in the park, a density that is much lower than in the central provinces of Cambodia, where pagodas are a more common sight. While it is beyond the scope of this paper to discuss in greater details the links between social capital and pagoda attendance, it is interesting to note that the Khmer Buddhist pagoda is usually not involved in the secular affairs of the village, such as the construction of communal infrastructure or helping the poorest households. There are, of course, exceptional cases where monks may be involved in community-based conservation and village self-help initiatives. Because the pagoda is a neutral ground beyond political bickering and personal animosity, it has traditionally attracted a broad range of people. Thus, there may exist opportunities for enrolling pagodas in community development projects funded by outside organizations.
While trust and cooperation within the village is an essential requisite to the implementation of community-based projects and getting people to work together, the experience of villagers in dealing with outsiders may also determine their ability to work successfully with unfamiliar stakeholders and endeavours. Were the villagers of Angkor connected with the rest of the province, Cambodia or even the world? It was found that newspapers were not available in villages, while television sets were enjoyed only by the well to do. However, it was also found that half of all households tuned in to radio programs on a regular basis. While the Voice of America’s Khmer language news is popular in cities, it was not clear whether rural people are able to tune to AM stations. A third of households never listened to the radio. This represents a large proportion of villagers who may be cut-off from the outside world. Traveling beyond their village, to other villages, was common for about 10% of households. Some 31% of households rarely travelled, while 52% of households declared that they have never left their villages. Siem Reap, the closest city, was considered to be far by 59% of households and very far by another 8%. Travelling took place by bicycle, motorbike or remorque (trailer taxis making the rounds of the villages of Angkor). Average distances travelled varied from 5 km for the closest communes within the central monumental zones to 35 km for villages located around Banteay Srei, northwest of Angkor. Within the group of households located within 5km of Siem Reap, 62% considered the city to be far. Though the actual distances that separate them are small, the perception of villagers

30
may be that of isolation. Some 21% of households said that they never left their villages and never listened to the radio.
Development projects requested by villagers
In an open-ended question, the survey asked villagers to assess which types of development projects would be the most useful. Some 34% of households suggested that water supply and sanitation projects be implemented in the park. These could include constructing wells, providing cisterns for water storage and building sanitary toilets. Some 17% and 11% of households were interested in attending training in cultivating vegetables and paddy, and in raising livestock, respectively. Another 3% of households suggested that training and support relating to the planting and care of fruit trees should be provided.
About 11% of households requested that the road network be improved so as to facilitate travel between settlements in Angkor. Irrigation, including the construction of canals and ponds, would benefit 7% of households. Only 5% of households asked for the establishment of rural credit schemes, in order to provide them with start-up capital and rotating loans for agricultural activities. Respectively 5% and 3% of households called for the construction of healthcare facilities and schools closer to their villages. Training in handicrafts, the distribution of rice and food, and the construction of village electric grids were potential projects suggested by an insignificant percentage of local residents.
From these results, it is clear that water supply and sanitation would meet the more immediate needs of local people. These projects would improve human health through the supply of clean water. They would also allow residents to grow vegetables and fruit around their homes and so contribute to a diversification of household diet and income. Considering the minimal productivity of local farming systems, the number of households requesting agricultural support appears to be low, which suggests that villagers do not realize that their agricultural production could be increased and diversified.
Villagers’ suggestions to improve park management
The suggestions of local people can be summarised in one single expression that was heard countless times in the course of the surveys: "Let us help in protecting the temples and the forest." The villagers might not have felt that they owned the temples and the forests in the same sense that they owned land or material possessions, but they did comprehend that the temples are part of their heritage and that they require better protection. About 20% of households requested that the temples be more strictly protected. Suggestions included educating visitors against drawing graffiti on the stones, preventing the theft of artefacts and controlling traffic that may damage gates and statues along causeways. Almost one third of households suggested that the authorities strictly enforce the logging ban and implement a comprehensive reforestation program in Angkor. Local people requested that the collection of fuel wood and deadwood be allowed.
About 2% of households expressed discontent that they were not able to construct houses or about restrictions on the size of new dwellings. Another 2% demanded full ownership rights over their land and the right to sell land. Although one man declared that “since I cannot cut trees, I will steal artefacts from the temples” he

31
was quite clearly a lone disgruntled voice among villagers. Given the surprisingly low level of dissatisfaction with current park management practises, one may rightly ask whether villagers freely expressed their opinions. Within the households that were interviewed, there was little doubt that the researchers were neither staff of APSARA nor of any other government agency. Researchers did not wear APSARA uniforms, they drove second-hand motorbikes rather than land cruisers, were respectful in interviews and spent enough time in Angkor to become part of the landscape. In addition, they never asked for the names of local people and made it clear that all answers would not be traceable to specific individuals. The statistics of the household survey confirm the general impression that local people and their suggestions are very reasonable. In Angkor, the relationship between park management authorities and local residents was found to be less antagonistic than that existing in other protected areas of Cambodia (De Lopez 2001a, 2003, 2005).

32
6.0 MAKING ANGKOR MORE SUSTAINABLE
Temples and substitutability
A commonly accepted definition of sustainable development was proposed by the Brundtland Commission, the World Commission on Environment and Development (WCED 1987): “development that meets the need of the present without compromising the ability of future generations to meet their own needs”. Thus, future generations should have the same economic opportunities that are available to present generations. In turn, these economic opportunities are determined by the way society uses its stocks of physical capital, human capital and natural capital. Physical or human-made capital may include factories, equipment and machinery. Human capital consists of the knowledge and skills necessary for economic processes and production. Similarly, the environment contributes a host of goods and services to an economy, including natural resources, sinks for waste and emissions, and ecosystem regulation. From a strong sustainability point of view, natural capital cannot be easily substituted by physical or human capital. For instance, Herman Daly (1996) has argued that natural and man-made capital are fundamentally complements and only marginally substitutable. A sawmill cannot function without a forest, nor a refinery without petroleum. Consequently, ecosystems that may be essential to human welfare should be protected and not be depleted (Pearce and Barbier 2000). From an intergenerational perspective, both the quantity and the composition of the total capital stock matter. Accumulation of human-made and knowledge capital through environmental degradation leaves future generations fewer available economic opportunities.
The temples of Angkor, although human-made, present many of the characteristics of natural capital. The temples contribute to Cambodia’s economy and to the well being of the present generations. Although some amount of restoration is possible, it remains a daunting task. For instance, the reconstruction of the temple of Baphuon, which started in 1967, continues to the present day (Royère 2004). While perfect copies of stone giants, apsaras and bas-reliefs are sold to tourists for a few hundred dollars, original Angkorian artefacts have fetched colossal prices in the world’s leading auction houses (Perlez 2005). The temples cannot be substituted by physical or knowledge capital. Even if the temples were to be “used up” by mass tourism to accumulate physical or knowledge capital, compensation to future generations for their irreversible loss would be impossible to ascertain. From a purely economic perspective, the temples must be protected against degradation, as their destruction would leave future generations fewer available opportunities.
The temples of Angkor complement the tourist facilities of Siem Reap City. Without Angkor, there would be little need for an international airport, resorts, hotels, restaurants or tour operators. Since Angkorian temples are in critically short supply, they constitute the limiting factor to further development. Economic logic dictates that the productivity of the limiting factor be maximized in the short run and investments in increasing its supply be undertaken in the long run. In other words, returns on the temples must be maximized, while further restoration and rehabilitation work must be carried out.
33
7.0 SUMMARY OF FINDINGS The potential for revenue generation from entrance fees to the Angkor
Archaeological Park was substantial. Based on official statistics for foreign visitor arrivals and durations of stay, estimates for annual entrance revenue were as high as US $44 million. This corresponds to some one million visitors per year.
The APSARA Authority received an insignificant proportion of entrance revenues.
Between 5% and 15% of fees officially collected were allocated to the agency, which may represent as little as US $500,000 per year.
While Angkor has historically relied on a complex hydraulic system to exploit runoff
and overland flow to meet the needs of a large urban population, present-day development favours groundwater extraction. Of the old Angkorian reservoirs, two remain in service. The Western Baray has sufficient storage capacity for both agricultural irrigation and urban development.
The use of groundwater alone to meet the needs of the city of Siem Reap is not
sustainable. While the current implementation of a centralised groundwater supply system is an improvement over uncontrolled drilling by hotels and other businesses, existing facilities are designed to meet a maximum number of 756,000 visitors per year. If groundwater extraction were to exceed the natural recharge of the aquifers, land subsidence would occur, causing damage to temples and other structures.
Tourism has not significantly benefited local residents.
- More than 80% of vendors and villagers assessed that tourism has made little or no improvement to their lives.
- The average net annual income for vendors was estimated at US $664, or an average of US $55 per month. This income was highly seasonal and was, on average, as low as a dollar a day during the off-peak season.
- Tourism related activities, including employment with APSARA, hotels and restaurants, and as taxi-drivers, accounted on average for less than 10% of household income in local communities.
The settlements of Angkor are largely inhabited by autochthonous populations.
- About 70,000 people reside in the monumental and protected cultural zones of the park (Zone 1 & Zone 2).
- While a quarter of vendors were not originally from Siem Reap, migrants accounted for fewer than 5% of villagers.
- Some 87% of households residing in the protected zones of the park believed they are of Angkorian lineage.
The settlements of Angkor remain socially and economically underdeveloped.
- Overall adult illiteracy rates averaged 43%, with only 2% of heads of households having completed secondary education. Half of children lagged four years behind their schooling schedules.
- Houses built of thatched roofs and walls accounted for 31% of all dwellings. Wood, bricks and tiles are construction materials unaffordable for a large segment of the population.
34
- On average, a third of household income was dependent on agriculture. Paddy cultivation was essentially rain-fed and had a low productivity of less than a ton per hectare per year.
- Access to water for household consumption was inadequate for the majority of villagers. During the dry season 82% of households experienced difficulties in securing water supplies. Average water consumption was 19 litres/person during the dry season, which is less than half the generally accepted minimum necessary of 50 litres/person for drinking, sanitation, bathing and cooking.
- Almost all households used wood as a cooking fuel. More costly and energy efficient fuels, such as charcoal, biogas or Liquid Petroleum Gas were used by an insignificant proportion of villagers. An overwhelming majority of households (88%) relied on oil lamps for lighting. There was no electric grid in the villages of Angkor.
Aside from fuelwood, the degraded forests of Angkor did not provide local people
with any significant sources of timber and non-timber products. Some 84% of households gathered fuel wood in Angkor. An estimated 128,000 small bunches (bach toch) were collected weekly, for an equivalent market value of US $1.6 million per year.
The tree species most valued by local people were those that provide construction
timber, fuelwood and fruit. In villages and community woodlots, households would prefer fruit trees to be planted. Around temples and in the rest of the park, households would prefer reforestation with dipterocarps and ornamental trees.
More than 80% of households were unaware of the management objectives and
regulations governing the protected cultural zones they reside in. About 70% of households resided in the core monumental zone, the remainder in the protected archaeological reserves. Only 17% of households were able to correctly determine in which zone their village was located.
Against a backdrop of persistent poverty, levels of social capital remained relatively
high in Angkor. Most villagers commonly and voluntarily worked together. Almost three-quarters of households stated that they trust other villagers. Levels of trust, mutual help and reciprocity were even higher among vendors, who formed closely bonded groups around temples.
Local residents requested to be involved in the conservation of the temples and
forests of Angkor. The settlements had an understanding that the temples are part of their common heritage and require better protection. An insignificant proportion of households harboured strong resentment against the APSARA authority. Residents also requested the implementation of village development projects as part of any community-based heritage conservation plan.
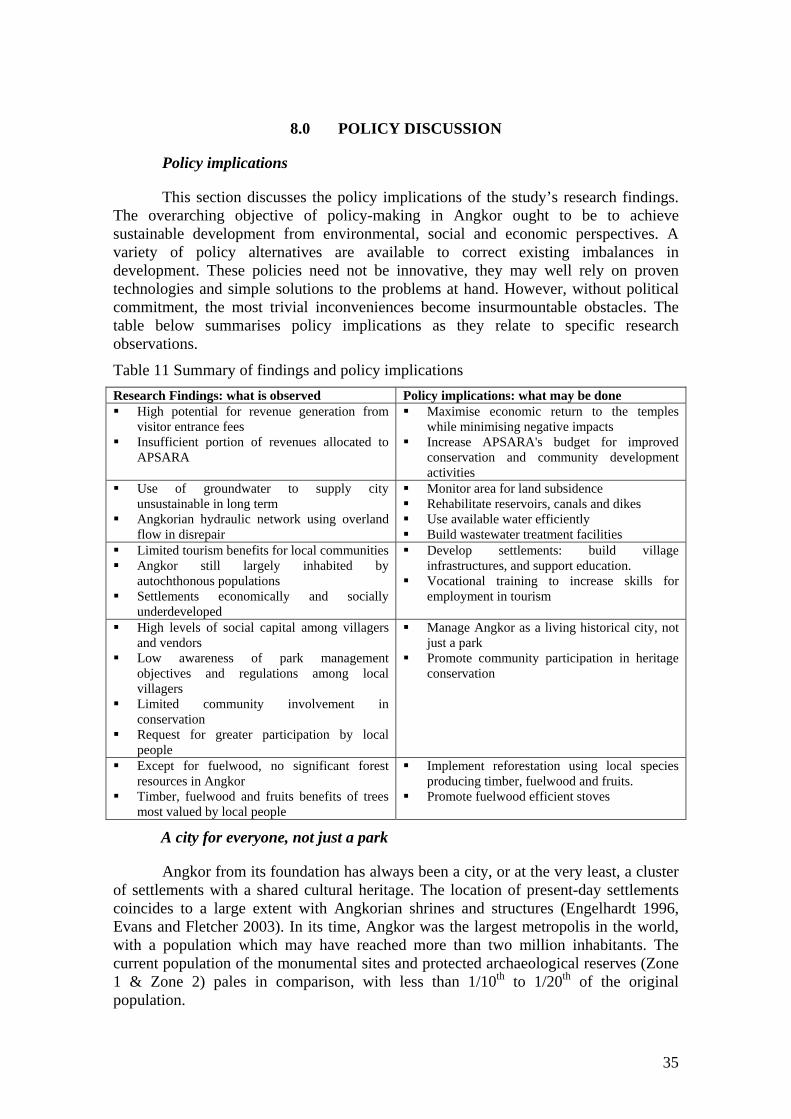
35
8.0 POLICY DISCUSSION
Policy implications
This section discusses the policy implications of the study’s research findings. The overarching objective of policy-making in Angkor ought to be to achieve sustainable development from environmental, social and economic perspectives. A variety of policy alternatives are available to correct existing imbalances in development. These policies need not be innovative, they may well rely on proven technologies and simple solutions to the problems at hand. However, without political commitment, the most trivial inconveniences become insurmountable obstacles. The table below summarises policy implications as they relate to specific research observations.
Table 11 Summary of findings and policy implications Research Findings: what is observed Policy implications: what may be done High potential for revenue generation from
visitor entrance fees Insufficient portion of revenues allocated to
APSARA
Maximise economic return to the temples while minimising negative impacts
Increase APSARA's budget for improved conservation and community development activities
Use of groundwater to supply city unsustainable in long term
Angkorian hydraulic network using overland flow in disrepair
Monitor area for land subsidence Rehabilitate reservoirs, canals and dikes Use available water efficiently Build wastewater treatment facilities
Limited tourism benefits for local communities Angkor still largely inhabited by
autochthonous populations Settlements economically and socially
underdeveloped
Develop settlements: build village infrastructures, and support education.
Vocational training to increase skills for employment in tourism
High levels of social capital among villagers and vendors
Low awareness of park management objectives and regulations among local villagers
Limited community involvement in conservation
Request for greater participation by local people
Manage Angkor as a living historical city, not just a park
Promote community participation in heritage conservation
Except for fuelwood, no significant forest resources in Angkor
Timber, fuelwood and fruits benefits of trees most valued by local people
Implement reforestation using local species producing timber, fuelwood and fruits.
Promote fuelwood efficient stoves
A city for everyone, not just a park
Angkor from its foundation has always been a city, or at the very least, a cluster of settlements with a shared cultural heritage. The location of present-day settlements coincides to a large extent with Angkorian shrines and structures (Engelhardt 1996, Evans and Fletcher 2003). In its time, Angkor was the largest metropolis in the world, with a population which may have reached more than two million inhabitants. The current population of the monumental sites and protected archaeological reserves (Zone 1 & Zone 2) pales in comparison, with less than 1/10th to 1/20th of the original population.

36
Why should local people be treated as unwanted outsiders? Why should their rights not be recognized? For the sake of the temples? It is obvious that the temples would be silent piles of stones without the people and their history. The builders of Angkor are no more, but at least their descendants have struggled on. As historians would tell us, when the Kings moved their courts south, some people decided to stay (Chandler 1996). Our surveys have clearly showed that the proportion of migrants residing in Angkor remains low, fewer than 5% of all inhabitants. It is far easier to encounter migrant workers from other provinces in Siem Reap City than in Angkor, where the local dialect is still thick with the twang and rhythmical slowness of Ancient Khmer.
From a practical point of view, it is impossible to resettle a population of more than 100,000 without political and financial costs. Gone are the days when one could send the cavalry to evict local people from national parks. In fact, from a legal perspective, Angkor is not to be managed as a national park, but as a protected landscape, as officially classified by the Ministry of Environment of the Kingdom of Cambodia (MOE). MOE uses the typology of the World Conservation Union, which states that protected landscapes are “where the interaction of people and nature over time has produced an area of distinct character with significant aesthetic, ecological and/or cultural value…” The temples are to be safeguarded, but equally important is the conservation of the traditional interaction between the people and the monuments. The Kingdom has a number of national parks, wildlife sanctuaries and multiple use areas with differing management and conservation objectives (De Lopez 2001b, 2001c, 2003).
Community-based approaches to conservation are not a novelty to environmentalists (Ghimire & Pimbert 1997), nor should they be to heritage managers (de Merode, Smeets & Westrik 2004). This does not necessarily imply that the participation of all stakeholders in the management of parks is warranted or necessary in all circumstances. The traditional “fines and fences” or “guns and fences” style of management is inevitable if looting of cultural artefacts is to be prevented, or encroachment by hotel developers is to be controlled. In other words, different interest groups or stakeholders should be managed differently (De Lopez 2001a, 2001b). A heavy-handed approach backed by security forces is uncalled for when local settlements are willing to participate in heritage protection. While the tourism police may maintain law and order adequately in Angkor, they clearly lack the skills to work with and for local people. Occasional community consultation workshops are not adequate to explain to residents the role of APSARA, the rights and obligations of all parties, and the zoning of Angkor, let alone build social capital or create fruitful working partnerships between residents and management authorities.
While the focus has been on accommodating a million tourists a year, the well being of local people has attracted less attention. As our surveys have showed, poverty and underdevelopment are rampant among the settlements of Angkor, as evidenced by indicators of access to water and sanitation, educational achievements, salubrious dwellings, energy consumption, agricultural productivity and household assets. At this stage of Angkor’s history, we believe that there is still an opportunity for managing the site as a living site for the people and with the people. In the course of our research, we met and heard thousands of local residents. Most seemed to be reasonable people, the sort of people who can be brushed aside, pushed aside and ignored easily. When asked how they would like to see Angkor managed, how they would see the role of the

37
APSARA Authority, many residents suggested that a guiding principle ought to be “let’s take care of each other”. Local people would help APSARA protect the temples, their heritage, if given the opportunity. At the same time, they ask that APSARA help improve their lives. Essentially, this is associated with principles of trust, reciprocity and mutual help. Social capital cannot be built through a top-down approach that leaves too much room for misunderstanding, but only through dialogue and conciliation.
Water for the residents of Angkor
Access to clean water for household use in sufficient quantities ought to be a priority of village development in Angkor. When compared to the average consumption of 19 litres per person in the dry season and 24 litres in the rainy season, water consumption of 500 litres per tourist per day is extravagant.
The formidable task of rehabilitating the old network of reservoirs, canals and embankments would provide water in sufficient quantities for the residents of Angkor, both for agricultural and household use. While the cost of this project is likely to be prohibitive for Cambodia and its timeframe extensive, it is certainly worth investigating the feasibility of restoring parts of the network, notably for areas in proximity to the Siem Reap and Roluos Rivers and along functioning canals and channels. The repair and renovation of the hydraulic system appears to be the only sustainable way to provide sufficient water for productive agricultural activities in Angkor.
For household uses and home gardening, the alternative to using water from rivers would be to use groundwater and precipitation. Shallow open wells alone do not generally provide enough water in the dry season. Drilled wells reach deeper into the aquifer, are equipped with hand pumps and provide cleaner water. However, they are not without their problems, as rural households may not be able to afford maintenance and spare parts. In addition, extracting water from the aquifer in sufficient quantities to meet the needs of all the residents of Angkor may not be sustainable. Land subsidence in the immediate vicinities of the temples would have devastating consequences. An alternative would be to use a semi-open well design: the well is open down to ten metres then drilled for another 30 or 40 metres (CRCD 2005). The semi-open well has the advantage of not using any hand pump, yet it provides water in larger quantities as it is drilled into the aquifer. Water extraction through semi-open wells is less likely to be unsustainable. In addition, the renovation of traditional household or village ponds, the Angkorian trapeang, would allow for the storage of rainwater during the wet season. Floods and precipitation would supply water to the trapeang, which could complement the use of wells.
The construction of wells and ponds ought to be paired with sanitation activities, including the distribution of water filters, the construction of toilets and training in basic hygiene. These activities would probably contribute to an improvement in health and sanitary conditions in the settlements of Angkor.
Agricultural support
Large segments of the resident population still rely on agricultural activities as their main or supplemental sources of income. Yet agricultural productivity and know-how remain low in Angkor. Without adequate irrigation it is unlikely that widespread and substantial improvements can be achieved. However, agricultural extension tailored to the needs of resident households may improve local livelihoods. Hands-on training in
38
paddy cultivation, tree planting and caring, home gardening and livestock raising have been requested by residents. Other possible activities in household agricultural support include the introduction of drought-resistant species, the timely dissemination of meteorological and flood information, and the marketing of local agricultural products.
It is not clear whether current levels of fuel wood collection are sustainable or not. With population growth fuel wood consumption is bound to increase. Thus, precautionary measures to conserve the remaining forests of Angkor ought to consist of providing alternative sources of energy, such as biogas, or alternative sources of fuel wood, such as village woodlots. Planting fast-growing nitrogen fixing trees could provide households with a host of benefits, including fuel wood, fodder for livestock, wood for construction and enriched soils. However, local people may not perceive fuel wood as an immediate need: they would rather plant fruit trees around their homes. Consequently, community forestry programs, if they are to elicit the meaningful participation of residents, ought to carefully balance conservation needs with local people’s needs.
Education for the children of Angkor
The levels of literacy and primary education of Angkor’s children is abysmally low, and will remain so without a strong commitment to implementing free universal education. If the next generation of residents are to take advantage of employment opportunities in the tourism sector, and to contribute to the preservation of its heritage, increased spending in education in Angkor is imperative. Practical measures to increase educational achievements may include the construction of additional primary and secondary schools, the awarding of scholarships for children, and the use of school buses or remorques for isolated settlements. Furthermore, the local school curriculum ought to include heritage preservation and history as they relate to the Angkorian villages.
Money matters
APSARA cannot fulfil its mandate of managing Angkor as a living and thriving heritage site without substantial increases to its annual budget. The Authority has struggled with conservation tasks alone, resorting to organizing elitist dinners for the international jet set wishing to eat by the moonlit stones (Wasson & Kuch, 2005). Community outreach and support activities will require further funding commitments.
The obvious source for increasing APSARA’s conservation and development income is the annual entrance revenue. Since the concessionaire is content with 20% of entrance revenues, 80% of revenues could be allocated to APSARA. As argued throughout this paper, given the miserable conditions in which residents live, there can be no logical justification as to why this has not been the case. While a discussion on a reform of the park’s concession system is beyond the scope of this paper, Angkor would benefit from the establishment of a transparent competitive bidding system in which national and international companies could participate. A number of multinational firms with extensive experience in resort and park management may be in a better position to more efficiently manage Angkor, including tourism promotion, revenue collection, heritage conservation, environmental management and community development.
In the same spirit of transparency, all stakeholders, including visitors, ought to be informed of the distribution of entrance fees. For instance, a ticket could clearly state
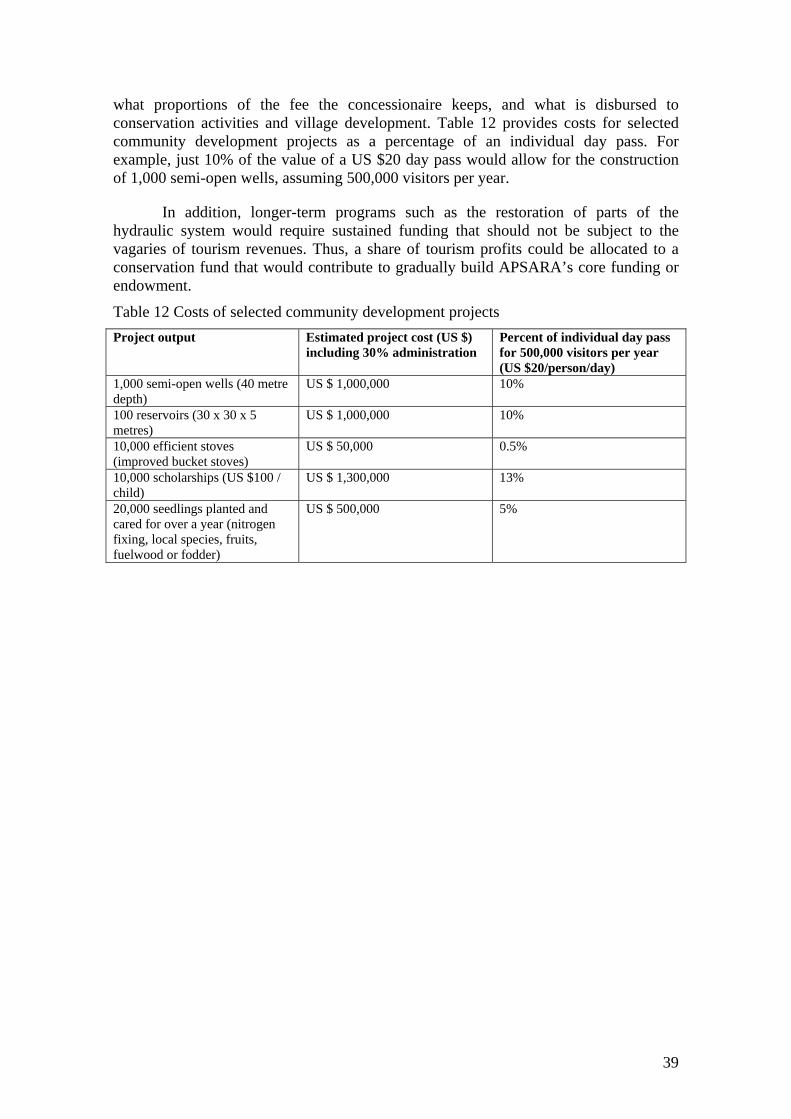
39
what proportions of the fee the concessionaire keeps, and what is disbursed to conservation activities and village development. Table 12 provides costs for selected community development projects as a percentage of an individual day pass. For example, just 10% of the value of a US $20 day pass would allow for the construction of 1,000 semi-open wells, assuming 500,000 visitors per year.
In addition, longer-term programs such as the restoration of parts of the hydraulic system would require sustained funding that should not be subject to the vagaries of tourism revenues. Thus, a share of tourism profits could be allocated to a conservation fund that would contribute to gradually build APSARA’s core funding or endowment.
Table 12 Costs of selected community development projects Project output Estimated project cost (US $)
including 30% administration Percent of individual day pass for 500,000 visitors per year (US $20/person/day)
1,000 semi-open wells (40 metre depth)
US $ 1,000,000 10%
100 reservoirs (30 x 30 x 5 metres)
US $ 1,000,000 10%
10,000 efficient stoves (improved bucket stoves)
US $ 50,000 0.5%
10,000 scholarships (US $100 / child)
US $ 1,300,000 13%
20,000 seedlings planted and cared for over a year (nitrogen fixing, local species, fruits, fuelwood or fodder)
US $ 500,000 5%

40
9.0 CONCLUSIONS
To the Khmer, Angkor is a reflection of their past and their present and also holds the promise of their future. For over six centuries, the greatest policymakers of the Kingdom of Cambodia were able to care for a population of up to two million people through adversity and prosperity. Angkor was never forgotten, never lost and so never had to be “rediscovered”. Though no longer a city in the modern sense, Angkor remains the home of a large population of local residents who can trace their ancestry to the original builders of the complex.
At the dawn of the 21st century, mass tourism both provides opportunities and constitutes threats for the sustainable development of Angkor. Entrance fees represent a unique opportunity to make Angkor, once more, a living thriving city. So does the desire of local communities to work with authorities and other stakeholders to preserve their heritage. However, the path to degradation and destruction is as real; it is the easier path to greater social disparities, continuous hardship and alienation for local people, increased levels of pollution, depleted natural resources, and misappropriation of revenues.
Some Khmer like to think and to say “we built Angkor”. We did not build Angkor, our ancestors did. But if we achieve sustainable development, we may say, with some pride, that we were the generation that began the protection and preservation of Angkor – not just for future generations of Cambodians, but for the whole world to experience.

41
REFERENCES
Acker, R. 1998. New geographic tests of the hydraulic thesis at Angkor. South East Asia Research. Vol. 6. pp. 5-47.
APSARA Authority. 2005a. Protected Cultural Zones in the Siem Reap/Angkor Region. Homepage of APSARA Authority, Online. Available: http://www.autoriteapsara.org/eng-0-laws/2-zoning.html. 2006, 6 March.
APSARA Authority. 2005b. Tourism Strategy. Homepage of APSARA Authority, Online. Available: http://www.autoriteapsara.org/en/apsara/tourism/strategy.html . 2006, 6 March.
APSARA Authority. 2005c. Department of Demography and Development. Homepage of APSARA Authority, Online. Available: http://www.autoriteapsara.org/en/apsara/demography.html. 2006, 6 March.
Cambodian Climate Change Office. 2005. Cambodian Designated National Authority Clean Development Mechanism Assessment Procedures. CCCO. Phnom Penh.
Cambodia Fuelwood Saving Project. 2006. Improved Cookstoves. Homepage of CFSP, Online. Available: http://www.cfsp.org.kh/ics_distribution.html. 2006, 28 March.
Cambodian Research Centre for Development. 2005. Water for Life. Homepage of CRCD, Online. Available: http://www.camdev.org/CRCD_Water.htm. 2006, 28 March.
Chandler, D.P. 1996. A History of Cambodia. Westview Press, Boulder.
Coletta, J.; and M. Cullen. 2000. Violent Conflict and the Transformation of Social Capital – Lessons from Cambodia, Rwanda, Guatemala, and Somalia. World Bank, Washington D.C.
Daly, H.E. 1996. Beyond Growth. Beacon Press, Boston.
De Lopez, T.T. 2001a. Brave new parks: lessons from internationally funded protected areas in Cambodia. Natural Areas Journal. Vol. 24. pp. 377-384.
De Lopez, T.T. 2001b. Deforestation in Cambodia: a stakeholder management approach. International Journal of Sustainable Development and World Ecology. Vol. 8. pp. 380-394.
De Lopez, T.T. 2001c. Stakeholder for conservation projects: a case study of Ream National Park, Cambodia. Environmental Management. Vol. 28. pp. 47-60.
De Lopez, T.T. 2003. Economics and stakeholders of Ream National Park, Cambodia. Ecological Economics. Vol. 46. pp. 269-282.
De Lopez, T.T. 2005. Resource degradation, property rights, social capital and community forestry in Cambodia. Forest Policy Trend 2005. pp. 35-44.
Engelhardt, R.A. 1996. New directions for archaeological research on the Angkor Plain: the use of remote sensing technology for research into ancient Khmer environmental engineering. Bulletin of the Indo-Pacific Prehistory Association. Vol 14. pp. 151-160.
Evans, D.; and R. Fletcher. 2003. Scale, structure and the demise of the “hydraulic city” at Angkor. Paper presented to the World Archeological Congress, Washington D.C. June.
Garami, F.; and I. Kertai. 1993. Water Management in the Angkor Area, Angkor Foundation, Budapest.
Ghimire, K.B.; and M.P. Pimbert (eds). 1997. Social Change and Conservation. Earthscan. London.
42
Gleick, P. 1996. Basic water requirements for human activities: Meeting basic needs. International Water. Vol. 21. pp. 83-92.
Groslier, B.P. 1979. La cité hydraulique angkorienne: exploitation ou surexploitation du sol? Bulletin de l’Ecole Française d’Extrême-Orient. Vol. 66. pp. 161-206.
Gross, M. 2006. Five stars and rising. Cambodia Daily (Phnom Penh). p. 12. 28-29, January.
Japan International Cooperation Agency. 2000. The Study on Water Supply System for Siem Reap Region in Cambodia. JICA. Tokyo.
Hagemann R. 2005. Did Not Back Sokimex Deal at Angkor. Homepage of International Monetary Fund, Online. Available: www.imf.org/external/np/vc/2005/082205.htm. 2006, 28 March.
Howse, J.M.; S. Eagle; F. Boffa; R. de Lambert; I. McCraken; D. MacMillan; I. Gray; G. Townley; D. Henderson; D. Ashwell; G. Turnbull; M. Steele; and N. Duke. 1998. Angkor Forest Rehabilitation and Landscape Enhancement Project. Fraser Thomas & Boffa Miskell, Auckland.
Kay, K.; and E. Wasson. 2005. IMF, resort owner dispute contract renewal. Cambodia Daily (Phnom Penh). p. 12. 7, September.
Kummu, M. 2003. The natural environment and historical water management of Angkor. Paper presented to the World Archeological Congress. Washington D.C. June.
Kvasager, W. 2006. Three from Kompong Speu tested for bird flue. Cambodia Daily (Phnom Penh). p. 12. 27, March.
Lustig, E. 2001. Water and the transformation of power in Angkor, 10th to 13th centuries. BA thesis. University of Sydney.
MacKenney, B.; and T. Prom. 2002. Natural Resources and Livelihoods in Rural Livelihoods in Cambodia: A Baseline Assessment. World Bank, Washington D.C.
de Merode, E. ; R. Smeets ; and C. Westrik (eds). 2004. Linking Universal and Local Values: Managing a Sustainable Future for World Heritage. UNESCO, Paris.
Ministry of Tourism. 2006. Tourist Statistical Report. Homepage of Ministry of Tourism of the Kingdom of Cambodia, Online. Available: http://www.mot.gov.kh/statistic.asp. 3, March.
National Institute of Statistics. 2005. Cambodia Inter-Censal Population Survey 2004. Homepage of National Institute of Statistics of the Kingdom of Cambodia, Online. Available: http://www.nis.gov.kh/SURVEYS/cips2004/cips_statis.htm. 2006, 28 March..
Putnam, R.D. 2000. Bowling Alone. Simon & Schuster, New York.
Pearce, D.; and E.B. Barbier. 2000. Blueprint for a Sustainable Economy. Earthscan. London.
Perlez, J. 2005. Cambodia tries to save treasures at Angkor from looters. New York Times (New York). p. 4. 21, March.
Royal Government of Cambodia. 2004. Quadrangular Strategy for Employment, Growth, Equity and Efficiency. RGC, Phnom Penh.
Royère P. 2004. De l'espace du temple à l'aménagement du territoire. Ecole Française d’Extrême-Orient, Online. Available: http://www.efeo.fr/recherche/angkor_1.shtml. 2006, 28 March.
United Nations World Food Programme. 2002. Commune-Level Poverty Rate 1998. UNWFP, Phnom Penh.
43
Vachon, M. 2004. Committee to tackle Angkor Water problems. Cambodia Daily (Phnom Penh). p. 17. 9, February.
Van, R. 2004. Sok An says some squatters can remain at Angkor Wat. Cambodia Daily (Phnom Penh). p. 13. 26, November.
Wasson, E.; and N. Kuch. 2005. Dinner parties regularly permitted at Angkor. Cambodia Daily (Phnom Penh). p. 12. 1, August.
Williamson, A.; B. McIntosh. T.T. De Lopez; and P. Tin. 2004. Sustainable Energy in Cambodia: Status and Assessment of the Potential for Clean Development Mechanism Projects. CRCD, Phnom Penh.
World Commission on Environment and Development. 1987. Our Common Future. Oxford University Press, Oxford.
Yun, S. 2004. APSARA Authority moves to evict hundreds of squatters. Cambodia Daily (Phnom Penh). p. 13. 11, August.

44
APPENDIX A: SURVEY SAMPLES OF THE VILLAGES OF ANGKOR Table A Survey Samples of the Villages of Angkor
District Commune Village Sample (Number of households)
Sample size(%) Population Households Male Female
Siem Reap Nokor Thom Anhchanh 26 10% 1370 258 705 665 Siem Reap Nokor Thom Areaks Svay 26 29% 470 91 238 232 Ankor Thom Leang Dai Bampenh Reach 28 25% 670 114 372 298 Puok Toek Vil Banteay Chheu 54 36% 796 149 362 434 Banteay Srei Khnar Sanday Banteay Srei 145 17% 5435 863 2578 2857 Puok Khnat Boeung Khnar 28 29% 544 95 154 390 Roluos Bakong Chambak 28 14% 1055 205 528 527 Puok Toek Vil Chrey 53 30% 992 176 480 512 Prasat bakong Mean Chey Doun Nom 26 13% 1121 194 548 573 Ankor Thom Leang Dai Doun Ov 55 55% 600 100 290 310 Roluos Bakong Doun Teav 28 13% 1273 224 580 693 Roluos Bakong Kanhchor 27 18% 794 147 390 404 Banteay Srei Khnar Sanday Khnar 57 32% 1038 177 492 546 Puok Khnat Khnat 53 40% 816 134 410 406 Siem Reap Kouk Chak Khvien 53 17% 920 306 385 535 Puok Doun Kaev Kok Thmei 10 3% 1912 335 943 969 Siem Reap Kouk Chak Kouk Beng 55 29% 984 190 636 348 Siem Reap Kouk Chak Kouk Chan 57 30% 1438 193 784 854 Ankor Thom Leang Dai Kouk Kreul 31 36% 564 87 285 279 Puok Khnat Kouk Snuol 54 40% 933 136 385 548 Roluos Bakong Kouk Srok 28 14% 1144 205 560 584 Puok Doun Kaev Kouk Thmei 19 6% 341 341 174 167 Siem Reap Kouk Chak Kouk Tnaot 77 21% 2027 359 1223 804 Siem Reap Nokor Thom Kravan 54 30% 881 179 433 448 Ankor Thom Leang Dai Leang Dai 55 42% 925 132 492 433 Prasat bakong Bakong Loley 53 22% 1310 236 658 652 Roluos Bakong Momeanh 28 14% 1178 204 586 592 Siem Reap Kouk Chak Nokor Krau 75 18% 2350 424 1134 1216 Banteay Srei Khnar Sanday Or Mnors 2 9% 145 23 75 70 Banteay Srei Preah Dak Ou Totueng 38 15% 1531 261 728 803 Prasat bakong Bakong Ovlaok 51 17% 1496 304 748 748 Puok Doun Kaev Peam 54 27% 1073 202 482 591 Ankor Thom Leang Dai Phlong 75 23% 2736 331 1253 1483 Puok Khnat Pralay 55 45% 709 121 246 463 Banteay Srei Preah Dak Preah Dak 54 18% 1457 294 719 738 Banteay Srei Khnar Sanday Prey 53 42% 873 126 309 564 Puok Khnat Prey Kmeng 28 35% 412 81 223 189 Siem Reap Nokor Thom Rohal 52 22% 1224 232 620 604 Roluos Bakong Roluos Kaeut 27 17% 922 158 445 477 Roluos Bakong Roluos Lech 31 13% 1271 243 596 675 Ankor Thom Leang Dai Samraong 65 22% 1670 301 791 879 Banteay Srei Khnar Sanday Sanday 29 25% 649 116 304 345 Ankor Thom Leang Dai Spean Thmey 29 9% 66 314 162 152 Siem Reap Nokor Thom Srah Srang Cheung 53 31% 952 173 463 489 Siem Reap Nokor Thom Srah Srang Tboung 27 25% 970 107 670 300 Prasat bakong Bakong Stueng 31 16% 1083 198 538 545 Banteay Srei Preah Dak Ta Koh 27 14% 1244 196 583 661
(continued)
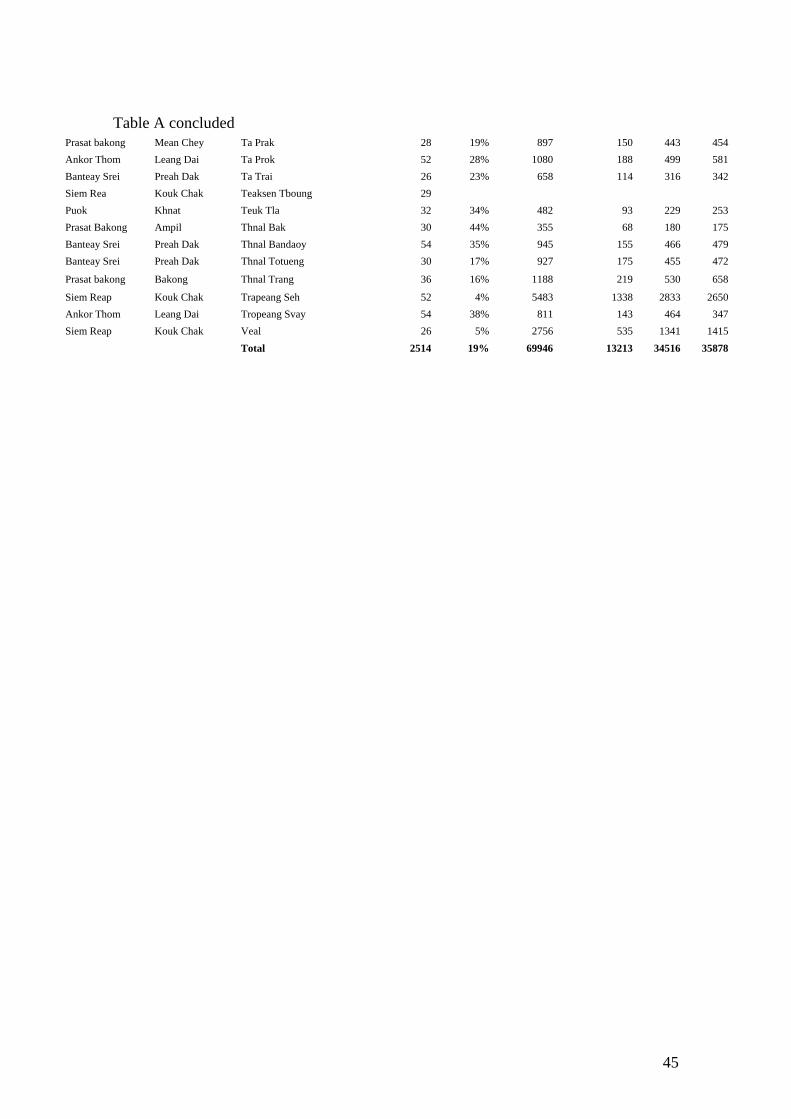
45
Table A concluded
Prasat bakong Mean Chey Ta Prak 28 19% 897 150 443 454 Ankor Thom Leang Dai Ta Prok 52 28% 1080 188 499 581 Banteay Srei Preah Dak Ta Trai 26 23% 658 114 316 342 Siem Rea Kouk Chak Teaksen Tboung 29 Puok Khnat Teuk Tla 32 34% 482 93 229 253 Prasat Bakong Ampil Thnal Bak 30 44% 355 68 180 175 Banteay Srei Preah Dak Thnal Bandaoy 54 35% 945 155 466 479 Banteay Srei Preah Dak Thnal Totueng 30 17% 927 175 455 472
Prasat bakong Bakong Thnal Trang 36 16% 1188 219 530 658
Siem Reap Kouk Chak Trapeang Seh 52 4% 5483 1338 2833 2650 Ankor Thom Leang Dai Tropeang Svay 54 38% 811 143 464 347 Siem Reap Kouk Chak Veal 26 5% 2756 535 1341 1415 Total 2514 19% 69946 13213 34516 35878

46
APPENDIX B: STATISTICAL TABLES FOR THE SURVEY OF THE SOUVENIR VENDORS OF ANGKOR
Table B1: Socio-economic characteristics of
households
Percent of households 95% confidence interval Number of observations
Lower bound Upper bound
Gender of interviewee
Husband 6.0 3.8 8.2 26
Wife 45.7 41.0 50.4 196
Female child 26.4 23.3 29.5 113
Male child 21.9 19.0 24.8 94
Ethnicity
Khmer 100.0 100.0 100.0 428
Born in Angkor
Yes 74.4 70.3 78.5 318
No 25.6 21.5 29.7 110
Angkorian ancestry
Yes 77.3 73.3 81.3 331
No 22.7 18.7 26.7 97
Main sources of income (% of household income)
Rice 12.1 9.0 15.2 52
Chamkar 1.3 0.2 2.4 6
Livestock 2.3 0.9 3.7 10
Aquaculture 0.0 - - -
Trade 0.5 - 1.2 2
Fishing 0.3 - 0.8 1
Tourism 74.2 70.0 78.3 317
Other 9.3 6.5 12.0 40
(continued)

47
Table B1 concluded
Mean 95% confidence interval Standard deviation 25% quartile 50% quartile 75% quartile
Lower bound Upper bound
Annual Income
US$ 664.0 598.8 729.6 641.9 252.0 440.0 900.0
Education (years)
Head of household 4.8 4.3 5.3 3.9 0.0 4.0 7.8
Spouse 3.2 2.8 3.6 3.3 0.0 3.0 5.0
Children under 18 4.0 3.8 4.2 3.4 2.0 4.0 6.0
Moved to area
Year 9.1 7.6 10.6 7.6 3.0 6.0 12.0
Table B2. Social capital
Percent of households 95% confidence interval Number of observations
Lower bound Upper bound
Interviewee regularly helps other vendors
Yes 82.9 79.3 86.5 355
No 17.1 13.5 20.7 73
Vendors get on well with each other
Agree 95.7 93.8 97.6 410
Disagree 4.3 2.4 6.2 18
Vendors help each other
Agree 91.6 89.0 94.2 392
Disagree 8.4 5.8 11.0 36
Vendors do not care about each other
Agree 8.4 5.8 11.0 36
Disagree 91.6 89.0 94.2 392
Vendors often argue with each other
Agree 7.2 4.8 9.6 31
Disagree 91.3 88.6 94.0 391
Vendors do not trust each other
Agree 10.6 7.7 13.5 45
Disagree 84.3 80.9 87.7 361
Overall sense of community
High 41.1 36.4 45.8 176
Average 49.4 44.7 54.1 211
Low 9.5 6.7 12.3 41
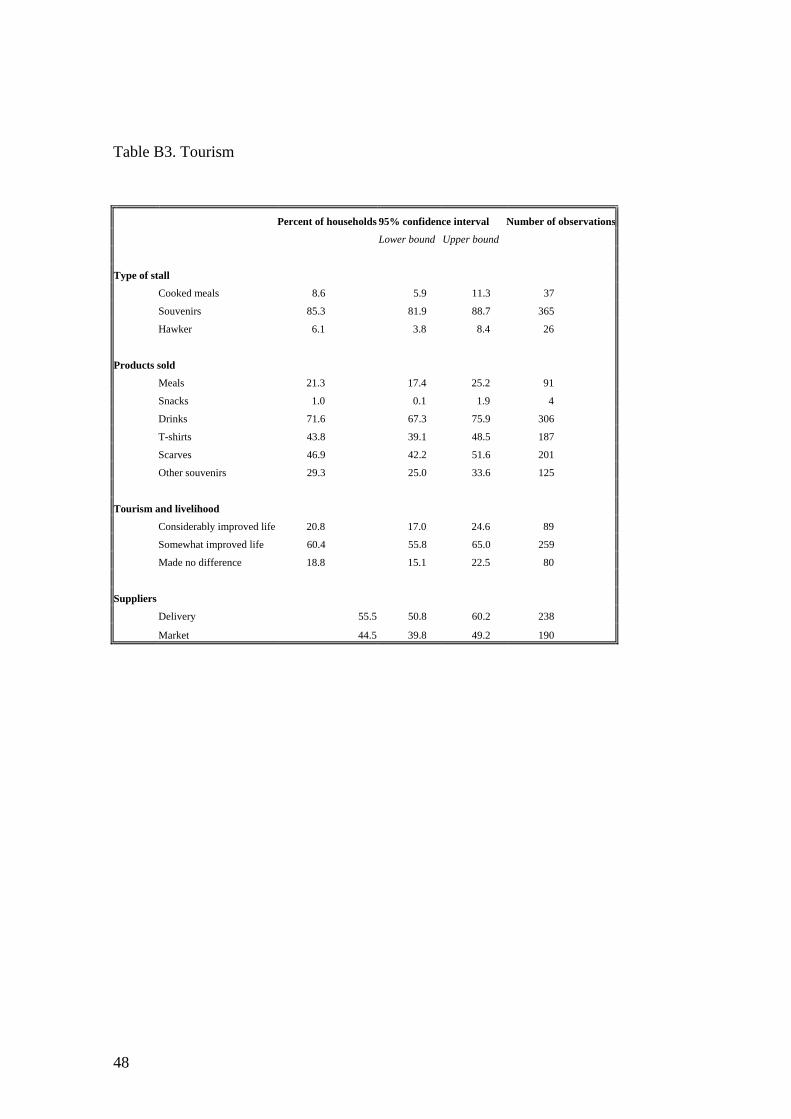
48
Table B3. Tourism
Percent of households 95% confidence interval Number of observations
Lower bound Upper bound
Type of stall
Cooked meals 8.6 5.9 11.3 37
Souvenirs 85.3 81.9 88.7 365
Hawker 6.1 3.8 8.4 26
Products sold
Meals 21.3 17.4 25.2 91
Snacks 1.0 0.1 1.9 4
Drinks 71.6 67.3 75.9 306
T-shirts 43.8 39.1 48.5 187
Scarves 46.9 42.2 51.6 201
Other souvenirs 29.3 25.0 33.6 125
Tourism and livelihood
Considerably improved life 20.8 17.0 24.6 89
Somewhat improved life 60.4 55.8 65.0 259
Made no difference 18.8 15.1 22.5 80
Suppliers
Delivery 55.5 50.8 60.2 238
Market 44.5 39.8 49.2 190

49
APPENDIX C: STATISTICAL TABLES FOR THE HOUSEHOLD SURVEY OF THE VILLAGES OF ANGKOR
Table C1 Socio-economic characteristics of households
Percent of households 95% confidence interval Number of observations
Lower bound Upper bound
Gender
Female 51.8 49.8 53.7 7,240
Male 48.2 46.3 50.2 6,749
Adult literacy
Illiterate 43.1 41.2 45.0 3,244
Ethnicity
Khmer 100.0 100.0 100.0 13,989
Born in Angkor
Yes 94.3 93.4 95.2 13,192
No 5.3 4.4 6.2 741
Angkorian ancestry
Yes 87.8 86.5 89.1 12,283
No 12.2 10.9 13.5 1,707
Main sources of income (% of household income)
Rice 13.7 12.4 15.0 344
Chamkar 3.4 2.7 4.1 85
Livestock 10.1 8.9 11.3 254
Aquaculture 0.4 0.2 0.6 10
Trade 7.8 6.8 8.8 196
Fishing 1.5 1.0 2.0 38
Tourism 10.2 9.0 11.4 256
Construction work 12.8 11.5 14.1 322
Other 36.0 34.1 37.9 905
Tourism and livelihood
Considerably improved life 21.3 19.7 22.9 535
Somewhat improved life 58.8 56.9 60.7 1,478
Made no difference 19.9 18.3 21.5 500
(continued)
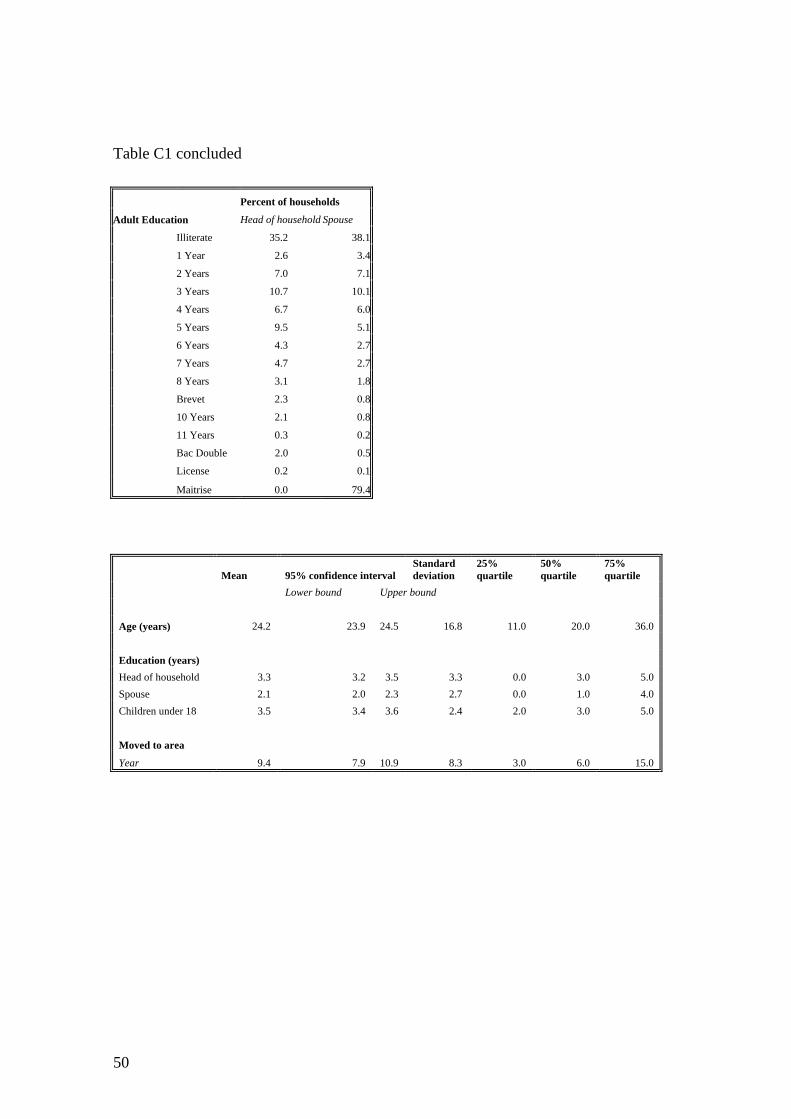
50
Table C1 concluded
Percent of households
Adult Education Head of household Spouse
Illiterate 35.2 38.1
1 Year 2.6 3.4
2 Years 7.0 7.1
3 Years 10.7 10.1
4 Years 6.7 6.0
5 Years 9.5 5.1
6 Years 4.3 2.7
7 Years 4.7 2.7
8 Years 3.1 1.8
Brevet 2.3 0.8
10 Years 2.1 0.8
11 Years 0.3 0.2
Bac Double 2.0 0.5
License 0.2 0.1
Maitrise 0.0 79.4
Mean 95% confidence interval Standard deviation
25% quartile
50% quartile
75% quartile
Lower bound Upper bound Age (years) 24.2 23.9 24.5 16.8 11.0 20.0 36.0 Education (years) Head of household 3.3 3.2 3.5 3.3 0.0 3.0 5.0 Spouse 2.1 2.0 2.3 2.7 0.0 1.0 4.0 Children under 18 3.5 3.4 3.6 2.4 2.0 3.0 5.0 Moved to area
Year 9.4 7.9 10.9 8.3 3.0 6.0 15.0

51
Table C2 Social capital
Percent of households 95% confidence interval Number of observations
Lower bound Upper bound
Villagers commonly work together
Agree 93.4 92.4 94.4 2,348
Disagree 6.6 5.6 7.6 166
Villagers help each other
Agree 90.9 89.8 92.0 2,285
Disagree 6.8 5.8 7.8 171
Villagers often argue
Agree 7.3 6.3 8.3 184
Disagree 87.2 85.9 88.5 2,192
Villagers do not trust each other
Agree 15 13.6 16.4 377
Disagree 73.4 71.7 75.1 1,845
Overall sense of community
High 12.3 11.0 13.6 309
Average 81.3 79.8 82.8 2,044
Low 6.3 5.4 7.2 158
How do villagers get along?
Very well 2.2 1.6 2.8 55
Well 35.7 33.8 37.6 897
So-so 60.4 58.5 62.3 1,518
Not so well 1.7 1.2 2.2 43
Not at all 0.0 - - -
(continued)

52
Table C2 concluded
Percent of households 95% confidence interval
Number of observations
Lower bound Upper bound
Playing games with other villagers
Regularly 1.7 1.2 2.2 43
Rarely 17.2 15.7 18.7 432
Never 81.1 79.6 82.6 2,039
Playing sports with other villagers
Regularly 10.4 9.2 11.6 261
Rarely 10.9 9.7 12.1 274
Never 78.7 77.1 80.3 1,979
Going to pagoda with other villagers
Regularly 78.3 76.7 79.9 1,968
Rarely 17.9 16.4 19.4 450
Never 3.8 3.1 4.5 96
Listening to the radio
Regularly 50.7 48.7 52.7 1,275
Rarely 15.7 14.3 17.1 395
Never 33.6 31.8 35.4 845
How far is Siem Reap?
Very far 8.2 7.1 9.3 206
Far 61.4 59.5 63.3 1,544
Close 29.8 28.0 31.6 749
Very close 0.6 0.3 0.9 15
Travelling to other villages
Regularly 9.5 8.4 10.6 239
Rarely 34.2 32.3 36.1 860
Never 56.3 54.4 58.2 1,415
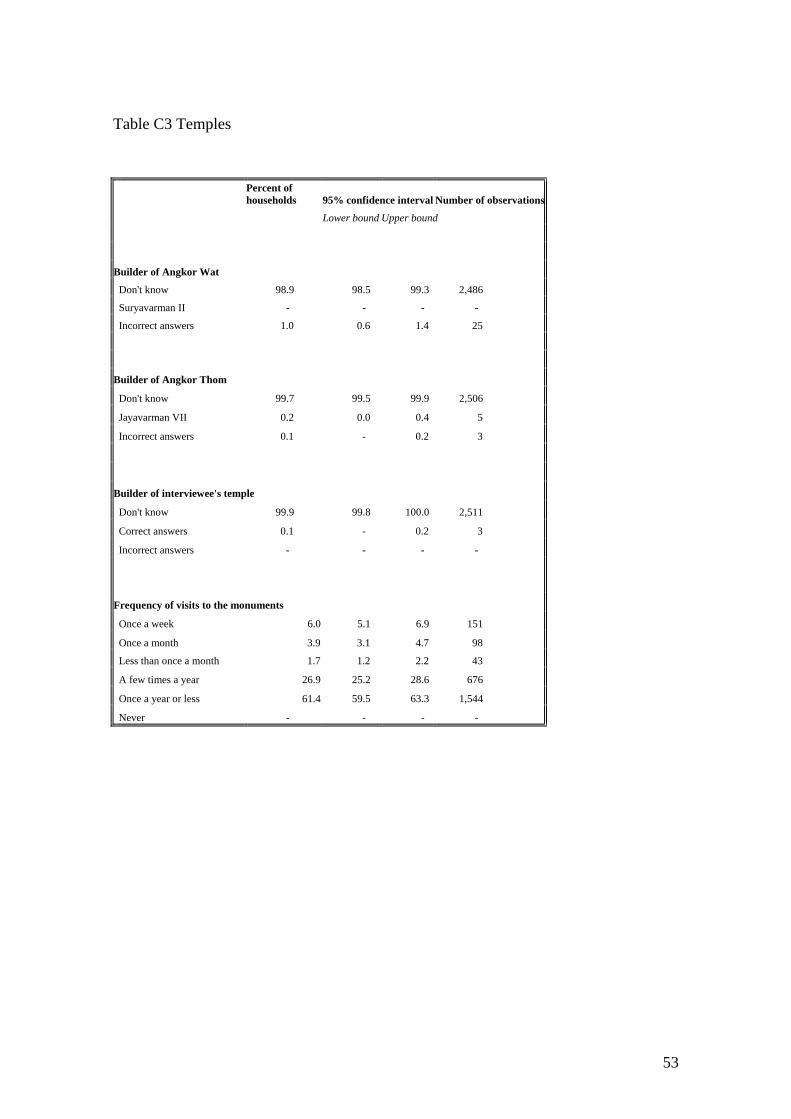
53
Table C3 Temples
Percent of households 95% confidence interval Number of observations
Lower bound Upper bound
Builder of Angkor Wat
Don't know 98.9 98.5 99.3 2,486
Suryavarman II - - - -
Incorrect answers 1.0 0.6 1.4 25
Builder of Angkor Thom
Don't know 99.7 99.5 99.9 2,506
Jayavarman VII 0.2 0.0 0.4 5
Incorrect answers 0.1 - 0.2 3
Builder of interviewee's temple
Don't know 99.9 99.8 100.0 2,511
Correct answers 0.1 - 0.2 3
Incorrect answers - - - -
Frequency of visits to the monuments
Once a week 6.0 5.1 6.9 151
Once a month 3.9 3.1 4.7 98
Less than once a month 1.7 1.2 2.2 43
A few times a year 26.9 25.2 28.6 676
Once a year or less 61.4 59.5 63.3 1,544
Never - - - -

54
Table C4 APSARA Zone location
Percent of households 95% confidence interval Number of observations
Lower bound Upper bound
Villages located in Zone 1
Zone 1 17.1 15.6 18.6 430
Zone 2 10.1 8.9 11.3 254
Zone 3 2.0 1.5 2.5 50
APSARA but doesn't know which 3.7 3.0 4.4 93
Outside Zone 11.2 10.0 12.4 282
Doesn't know 55.9 53.9 57.8 1,405
Villages located in Zone 2
Zone 1 12.8 11.5 14.1 322
Zone 2 18.5 17.0 20.0 465
Zone 3 2.1 1.5 2.7 53
APSARA but doesn't know which 0.3 0.1 0.5 8
Outside Zone 12.4 11.1 13.7 312
Doesn't know 53.9 51.9 55.8 1,355
Table C5 Household assets
Percent of households 95% confidence interval Number of observations
Lower bound Upper bound
Walls of dwelling
Concrete/brick 4.3 3.5 5.1 108
Wood 85.5 84.1 86.9 2149
Mud 0.2 0.0 0.4 5
Thatch 10.0 8.8 11.2 251
Roof of dwelling
Tiles 21.6 20.0 23.2 543
Iron 47.4 45.4 49.4 1192
Thatch 31.0 29.2 32.8 779
Ownership of
Motorbikes 32.2 30.3 34.0 808
Cars 1.4 1.0 1.9 36

55
Table C6 Energy
Percent of households 95% confidence interval Number of observations
Lower bound Upper bound
Stoves
Stones 52.6 50.6 54.6 1322
Traditional 11.8 10.5 13.1 297
Bucket 28.8 27.0 30.6 724
Improved bucket 1.0 0.6 1.4 25
Efficient stove 0.3 0.1 0.5 8
Other 5.5 4.6 6.4 138
Cooking energy
Fuelwood 98.9 98.5 99.3 2486
Charcoal 2.3 1.7 2.9 58
LPG 1.2 0.8 1.6 30
Biogas 0.7 0.4 1.0 18
Lighting energy
Battery 32.0 30.2 33.8 804
Diesel generator 0.3 0.1 0.5 8
Solar 0.1 - 0.2 3
Oil lamp 88.0 86.7 89.3 2212
Candle 2.6 2.0 3.2 65
Mini-grid 0.9 0.5 1.3 23

56
Table C7 Trees
Scientific name Khmer name Very useful Useful Not useful
Dipterocarpus alatus cheuhtil, yeang 87.9 5.2 0.2
Bambusa spp rasei 87.4 10.4 0.2
Dipterocarpus intricatus trach, trait 85.6 7.0 0.1
Hopea odorata koki 78.6 8.9 0.7
Afzelia xylocarpa beign 74.7 3.9 0.2
Dalbergia latifolia kragnourgn 67.6 5.1 1.1
Pterocarpus indicus/macrocarpus thnong 6.9 12.0 0.6
Azadirachta indica sdaeuv 64.1 30.1 0.9
Dalbergia oliveri / cochinchinensis neangn nourgn 59.4 1.6 0.9
Dipterocarpus tuberculatus khlong 53.3 12.0 1.4
Albizia myriophylla cheuh aem 27.1 8.8 0.6
Albizia saman ampil barang 22.7 45.8 4.3
Ceiba pentendra daem ko 22.4 68.4 2.9
Ziziphus cambodiana putrea 20.1 76.6 1.2
Leucaena leucocephala kathumthet 19.0 49.1 2.7
Senna siamea (Cassa sieamea) ankagn 18.1 41.6 3.7
Sesbania grandiflora angkir deille 17.4 68.6 1.3
Ficus religiosa po 16.4 57.5 12.0
Erythrina variegata relourh baille 10.4 44.9 18.9
Delonix regia kgnaok 8.4 43.4 11.4
Casuarina equisetifolia sgnaeuv 1.7 1.6 3.9
Percent of households 95% confidence interval
Lower bound Upper bound
Benefits of trees
No value 8.6 7.5 9.7
Cash 20.0 18.4 21.6
Construction 93.8 92.9 94.7
Fuelwood 56.2 54.3 58.1
Fruits 42.0 40.1 43.9
Shade 23.6 21.9 25.3
Storm protection 7.6 6.6 8.6
Water sources protection 6.4 5.4 7.4
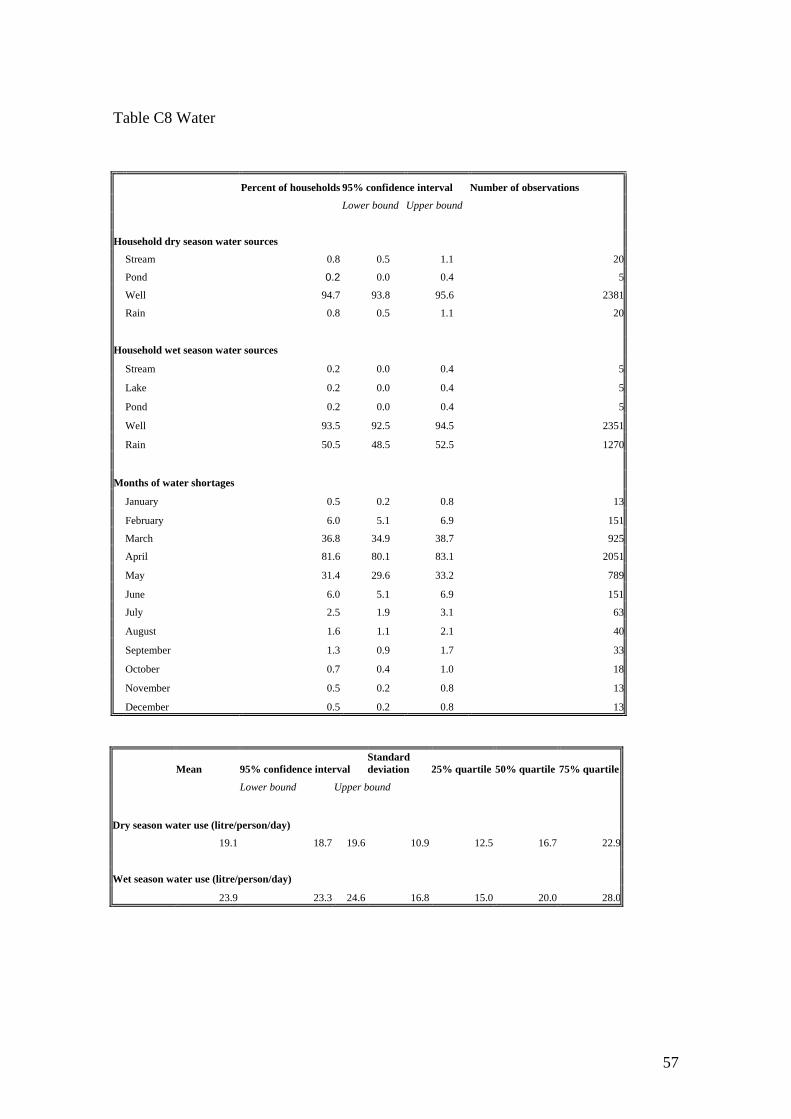
57
Table C8 Water
Percent of households 95% confidence interval Number of observations Lower bound Upper bound
Household dry season water sources
Stream 0.8 0.5 1.1 20
Pond 0.2 0.0 0.4 5
Well 94.7 93.8 95.6 2381
Rain 0.8 0.5 1.1 20
Household wet season water sources
Stream 0.2 0.0 0.4 5
Lake 0.2 0.0 0.4 5
Pond 0.2 0.0 0.4 5
Well 93.5 92.5 94.5 2351
Rain 50.5 48.5 52.5 1270
Months of water shortages
January 0.5 0.2 0.8 13
February 6.0 5.1 6.9 151
March 36.8 34.9 38.7 925
April 81.6 80.1 83.1 2051
May 31.4 29.6 33.2 789
June 6.0 5.1 6.9 151
July 2.5 1.9 3.1 63
August 1.6 1.1 2.1 40
September 1.3 0.9 1.7 33
October 0.7 0.4 1.0 18
November 0.5 0.2 0.8 13
December 0.5 0.2 0.8 13
Mean 95% confidence interval Standard deviation 25% quartile 50% quartile 75% quartile
Lower bound Upper bound
Dry season water use (litre/person/day)
19.1 18.7 19.6 10.9 12.5 16.7 22.9
Wet season water use (litre/person/day)
23.9 23.3 24.6 16.8 15.0 20.0 28.0

58
Table C9 Agriculture
Percent of households 95% confidence interval Number of observations
Lower bound Upper bound
Home garden
Fruits 76.2 74.5 77.9 1916
Vegetables 39.6 37.7 41.5 996
Ownership of
Land 67.1 65.3 68.9 1687
Buffaloes 7.8 6.8 8.8 196
Cows 45.8 43.9 47.8 1152
Pigs 31.1 29.3 32.9 781
Chicken/Ducks 53.2 51.2 55.1 1337
Goats 0.3 0.1 0.5 8
Mean 95% confidence interval Standard deviation 25% quartile 50% quartile 75% quartile
Lower bound Upper bound
Wet season rice productivity (ton/hectare)
0.96 0.91 1.05 0.87 0.48 0.72 0.12
Table C10 Forest Products
Percent of households 95% confidence interval
Number of observations
Lower bound Upper bound
Forest products
Bamboo 0.1 - 0.3 3
Timber 0.7 0.4 1.0 8
Resin 0.1 - 0.2 2
Medicine 0.2 - 0.3 4
Fruits & Vegetables 3.3 2.6 4.0 83
Vines & Ferns 7.8 6.8 8.9 197
Fuelwood 83.9 82.4 85.3 2109
Mean 95% confidence interval Standard deviation 25% quartile 50% quartile 75% quartile
Lower bound Upper bound
Fuelwood collected per household per week (bach toch)
13.0 12.4 13.7 14.9 4.0 7.0 20.0
Related Documents