Welcome message from author
This document is posted to help you gain knowledge. Please leave a comment to let me know what you think about it! Share it to your friends and learn new things together.
Transcript

India Emerging

ABOUT THE AUTHOR
Ifeena JOba is the Director, Maguru Consultants Limited, U.K., and is currentlyengaged in working on issues related to trade, climate change, food security, effectsof fiscal stimulus packages on employment at the global level and on inclusivegrowth issues. She was a visiting professorial fellow at Warwick University, U.K.,and a Research Fellow at IDRC. She wrote this book during this period. She workedfor the United Nations and its specialised organisations for over 20 years. She haspublished twelve books and served as an expert on several advisory boards in Indiaand abroad.

The
VEENA JHA
a**K FO»*0''
ACADEMIC FOUNDATION
NEW DELHI
Ottawa • Cairo • Montevideo • Nairobi • New DelhiInternational Development Reserch Centre
India Emering
Reality Checks

First published in 2012by
ACADEMIC FOUNDATION4772-73 / 23 Bharat Ram Road, (23 Ansari Road],Darya Ganj, New Delhi - 110 002 ¡India).Phones : 23245001 / 02 / 03 / 04.Fax: +91-11-23245005.E-mail: [email protected]
Co-published with the
INTERNATIONAL DEVELOPMENT CENTREPO Box 8500, Ottawa, ON K1G 3H9CanadaE-mail: [email protected]
Copyright O 2011: International Development Research Centre
ALL RIGHTS RESERVED.No part oí this book shall be reproduced, stored in a retrieval system,or transmitted by any means, electronic, mechanical, photocopying, recording,or otherwise, without the prior written permission of the copyright holder(s)and/or the publishers.
Cataloging in Publication Data-DKCourtesy: D.K. Agencies (P) Ltd. <[email protected]>
¡ha, Tfcena, 1959-India emerging : the reality checks / Veena ¡ha.p. em.
Includes bibliographical references.ISBN 9788171889525ISBN 9781552505489 ¡e-book)
1. Economic development-India. 2, Informal sector(Economics)-India. 3. India.-Economic policy-1991- I.Tide.
DDC 338.954 23
Typeset by Italics India, New Delhi.Printed and bound in India.
ContentsContentsContentsContentsContents
List of Tables and Figures . . . . . . . . . . . . . . . . . . . . . . . . . . . . . . . . . . . . . . 9
Preface . . . . . . . . . . . . . . . . . . . . . . . . . . . . . . . . . . . . . . . . . . . . . . . . . . . . 13
Introduction . . . . . . . . . . . . . . . . . . . . . . . . . . . . . . . . . . . . . . . . . . . . . . . 17
Part I
1. Role of ICTs and its Trickle-Down Effects onIndia’s Economic Emergence . . . . . . . . . . . . . . . . . . . . . . . . . . . . . . 35
Introduction
Is IT a GPT in India
Modelling ICT as a GPT
ICT and Poverty
Multiplier Effects of IT and ITES
Mobile Telephony and its Trickle Down
Conclusions and Recommendations
2. Inter-State Migration and Trickle-Down Effect . . . . . . . . . . . . . 85Introduction
Theories of Migration
How do these Theories Apply to India
Effects of Migration: Reviewing Contrasting Views
Convergence between States andWhether Inter-State Migration has a Role to Play
Factors Determining Trickle Down throughInter-State Migration: A Case Study-based Approach
Conclusions and Policy Recommendations

6 INDIA EMERGING • VEENA JHA
Part II
3. Trickling Down Growth through the Informal Sector:Can Asset Formation Trickle Up Growth. . . . . . . . . . . . . . . . . . . 145
Informal Sector in the Developing World
Growth, Poverty and the Informal Sector: ReviewingContrasting Points of Views on the Informal Economy in India
Economic Growth and Structural Changesin the Indian Informal Sector
Factors that Determine Informal Sector Asset Building and Incomes
Initiatives of the Government of India for Improving SkillDevelopment and Infrastructure of the Informal Economy
Conclusions and Policy Recommendations
4. Trickle Up Growth through Gender Parity . . . . . . . . . . . . . . . . 215
Introduction
Operational Concepts of Gender Parity
Trickling Up Growth through Gender Parity
India’s Growth Experience and Gender Equality
Examining Correlations between Gender Equality and Growth
Examining Gender Parity in Education and Health with Growth
Gender and Poverty
Conclusions and Options
Part III
5. Can Philanthropy Accelerate Trickling Down . . . . . . . . . . . . . . 253Introduction
History of Philanthropic Traditions in India
An Analysis of Philanthropic Point Sources of Information
Models of Philanthropy in India
Intermediary Philanthropy Organisations
Legal Provisions for Philanthropy
Is Trickle Down Accelerated through Philanthropy?
Conclusions and a Way Forward

7CONTENTS
6. Governance Issues and Public Policy in Trickle Down. . . . . . 299What is Good Governance?
Surveys on Good Governance in India
So What is Going Wrong in India?
Why Government Policies have not Accelerated Trickle Down:Political and Administrative Rent-Seeking
The Legal Framework for Poverty Alleviationand Greater Accountability
Is Funding for Social Services Delivery Adequate?
Third Party Evaluations of the Various GovernmentProgrammes in India
Nutrition Programmes
Author Survey of the Anganwadi Scheme
National Rural Employment Guarantee Act (NREGA)
Author Survey of NREGA
Sarva Shiksha Abhiyan (SSA)
Achieving Gender Parity
Problems in Monitoring Government Programmes
Learning from Successful Examples of Social Service Delivery
Governance Indicators and Poverty Alleviation:A Business-based Approach
What should be done to Stimulate the Private Sector toShare in the Delivery of Public Services
Conclusions
7. Conclusions . . . . . . . . . . . . . . . . . . . . . . . . . . . . . . . . . . . . . . . . . . . . . 367How Growth can Trickle Down
How Growth can Trickle Up
How can Trickle Down and Trickle Up be Assisted

This page intentionally left blank

List of TList of TList of TList of TList of Tables and Fables and Fables and Fables and Fables and Figurigurigurigurigureseseseses
TABLES
1.1 Definitions . . . . . . . . . . . . . . . . . . . . . . . . . . . . . . . . . . . . . . . . . . . . 44
1.2 Regressing Growth in Output Per Capitawith Dummy of E-Readiness . . . . . . . . . . . . . . . . . . . . . . . . . . . . . . 44
1.3 Summary of Variables . . . . . . . . . . . . . . . . . . . . . . . . . . . . . . . . . . . . 45
1.4 Impact of E-Development upon Poverty . . . . . . . . . . . . . . . . . . . . . 48
1.5 Regression Result of the Impact of E-Impact on Poverty . . . . . . . . . 48
1.6 Five-Year Revenue Forecasts for Key Service Linesin the Domestic Market . . . . . . . . . . . . . . . . . . . . . . . . . . . . . . . . . . 55
1.7 Comparison of the Vendor Addressed Market andthe In-House Spend by Key Services . . . . . . . . . . . . . . . . . . . . . . . . 57
1.8 Domestic ITES-BPO Revenues . . . . . . . . . . . . . . . . . . . . . . . . . . . . . 57
1.9 Domestic ITES-BPO Revenues by Vertical Market (2004) . . . . . . . 58
1.10 Analysis of the Impact of Density ofMobile Users upon Gross Output . . . . . . . . . . . . . . . . . . . . . . . . . . 62
1.11 Summary of Variables . . . . . . . . . . . . . . . . . . . . . . . . . . . . . . . . . . . . 62
1.12 List of Average of Density of Mobile Users (per 100) inMajor States during 2001 to 2004 . . . . . . . . . . . . . . . . . . . . . . . . . . 63
1.13 Average Difference between States Having Higher andLower Density of Mobile Users: ‘t’ Test . . . . . . . . . . . . . . . . . . . . . . 63
1.14 Panel-Regression Results . . . . . . . . . . . . . . . . . . . . . . . . . . . . . . . . . 64
1.15 Mobile Teledensity per 100 Persons . . . . . . . . . . . . . . . . . . . . . . . . . 66
1.16 Wireless Subscriber Base . . . . . . . . . . . . . . . . . . . . . . . . . . . . . . . . . 68
2.1 Abbreviation of Variables . . . . . . . . . . . . . . . . . . . . . . . . . . . . . . . . 111
2.2 Summary of Variables . . . . . . . . . . . . . . . . . . . . . . . . . . . . . . . . . . . 111
2.3 Convergence of Per Capita Incomes across States . . . . . . . . . . . . . 111

10 INDIA EMERGING • VEENA JHA
2.4 List of Abbreviations . . . . . . . . . . . . . . . . . . . . . . . . . . . . . . . . . . . 114
2.5 Correlation between HDV and Pov . . . . . . . . . . . . . . . . . . . . . . . . 114
2.6 Explaining Poverty Convergence through Inter-State Migration . . 115
2.7 Fixed Effects on HDV through Migration . . . . . . . . . . . . . . . . . . . 115
2.8 Fixed Effects on Informal Sector Wages through Migration . . . . . . 116
2.9 Summary of Variables . . . . . . . . . . . . . . . . . . . . . . . . . . . . . . . . . . . 116
2.10 State-wise Percentage of Migrants . . . . . . . . . . . . . . . . . . . . . . . . . 120
2.11 Characteristics of Migrants . . . . . . . . . . . . . . . . . . . . . . . . . . . . . . 120
2.12 Percentage Distribution of the Basis of Payment Made forPersons Covered by the Survey . . . . . . . . . . . . . . . . . . . . . . . . . . . 120
2.13 Percentage Distribution of Persons brought above theMinimum Wage Level through Migration . . . . . . . . . . . . . . . . . . . 121
2.14 Use of Remittances by Migrant Families . . . . . . . . . . . . . . . . . . . . 121
2.15 Asset Building by Migrants . . . . . . . . . . . . . . . . . . . . . . . . . . . . . . 122
2.16 List of Abbreviations . . . . . . . . . . . . . . . . . . . . . . . . . . . . . . . . . . . 123
2.17 Logit Estimates of Asset Building with Remittances . . . . . . . . . . . 123
3.1 Formal and Informal Employment in India . . . . . . . . . . . . . . . . . . 153
3.2 Estimates of Labour Force, Employment and Unemployment . . . 154
3.3 Dependent Variable: Log (PPv) (For the Period 1984/85 to2000/01) at 95 Per cent Level of Significance . . . . . . . . . . . . . . . . 162
3.4 Distribution of Households by Type of Employment . . . . . . . . . . . 165
3.5 Abbreviations Used for Explanatory Variables . . . . . . . . . . . . . . . . 174
3.6 Regression Result from Survey Analysis . . . . . . . . . . . . . . . . . . . . 176
3.7 Linear Least Square Regression . . . . . . . . . . . . . . . . . . . . . . . . . . . 177
4.1 Economic Growth and Gender Indicators . . . . . . . . . . . . . . . . . . . 225
4.2 Labour Force Participation Rates . . . . . . . . . . . . . . . . . . . . . . . . . . 226
4.3 Definition of Variables . . . . . . . . . . . . . . . . . . . . . . . . . . . . . . . . . . 232
4.4 Sources of Data . . . . . . . . . . . . . . . . . . . . . . . . . . . . . . . . . . . . . . . 233
4.5 Regression Results . . . . . . . . . . . . . . . . . . . . . . . . . . . . . . . . . . . . . 234
4.6 Reverse Regression . . . . . . . . . . . . . . . . . . . . . . . . . . . . . . . . . . . . . 234
11LIST OF TABLES AND F IGURES
4.7 Wage Differentials in Agricultural Occupationsbetween States . . . . . . . . . . . . . . . . . . . . . . . . . . . . . . . . . . . . . . . . 235
4.8 Regression Results . . . . . . . . . . . . . . . . . . . . . . . . . . . . . . . . . . . . . 236
4.9 Regression Results . . . . . . . . . . . . . . . . . . . . . . . . . . . . . . . . . . . . . 237
4.10 Correlation Results . . . . . . . . . . . . . . . . . . . . . . . . . . . . . . . . . . . . . 238
4.11 Composite Component with Log(IHe), Log(IEd) . . . . . . . . . . . . . . 239
4.12 Regression Results . . . . . . . . . . . . . . . . . . . . . . . . . . . . . . . . . . . . . 239
4.13 Correlation Results . . . . . . . . . . . . . . . . . . . . . . . . . . . . . . . . . . . . . 241
4.14 Composite Component with Log(IHe), Log(IEd) & Log(IEr) . . . . . 242
4.15 Regression Results . . . . . . . . . . . . . . . . . . . . . . . . . . . . . . . . . . . . . 242
5.1 Trends of Foreign Contributions to Charities in India . . . . . . . . . 264
5.2 Indicative Economic Model for Charities . . . . . . . . . . . . . . . . . . . 270
5.3 Diasporic Philanthropy and Religion . . . . . . . . . . . . . . . . . . . . . . . 274
5.4 Regression Results . . . . . . . . . . . . . . . . . . . . . . . . . . . . . . . . . . . . . 286
5.5 Results of Principle Component Analysis . . . . . . . . . . . . . . . . . . . 288
6.1 WGI for India . . . . . . . . . . . . . . . . . . . . . . . . . . . . . . . . . . . . . . . . . 304
6.2 Families Availing Anganwadi Scheme . . . . . . . . . . . . . . . . . . . . . . 323
6.3 Ambience of the Anganwadi Centres . . . . . . . . . . . . . . . . . . . . . . . 323
6.4 Source of Information: Anganwadi Scheme . . . . . . . . . . . . . . . . . . 323
FIGURES
1.1 Growth of IT Spending in India . . . . . . . . . . . . . . . . . . . . . . . . . . . . 55
1.2 Domestic IT Services Revenues byKey Vertical Markets (2004) . . . . . . . . . . . . . . . . . . . . . . . . . . . . . . . 56
1.3 Log of Gross Output versus Linear Prediction:For Year 2001 . . . . . . . . . . . . . . . . . . . . . . . . . . . . . . . . . . . . . . . . . . 64
1.4 Log of Gross Output versus Linear Prediction:For Year 2004 . . . . . . . . . . . . . . . . . . . . . . . . . . . . . . . . . . . . . . . . . . 65
3.1 1994/95 to 1999/2000 Poverty Reduction, Growth inInformal Sector Wages and Informal Sector Asset Formation . . . . 160

12 INDIA EMERGING • VEENA JHA
3.2 1989/90 to 1994/95 Poverty Reduction, Growth inInformal Sector Wages and Informal Sector Asset Formation . . . . 161
4.1 Economic Growth and Female Labour Force Participation . . . . . . 224
4.2 Economic Growth and Female Labour Participationin the Organised Sector . . . . . . . . . . . . . . . . . . . . . . . . . . . . . . . . . 228
4.3 Economic Growth and Female Labour Participationin Rural Areas . . . . . . . . . . . . . . . . . . . . . . . . . . . . . . . . . . . . . . . . . 230
4.4 Growth and Gender Development Index . . . . . . . . . . . . . . . . . . . . 231
6.1 A. Life Expectancy at Birth (Years) during 2000-2005 . . . . . . . . . . 306
B. Under-Five Mortality Rate (Per 1,000 Live Births) . . . . . . . . . . 306
C. Infant Mortality Rate (Per 1,000 Live Births) . . . . . . . . . . . . . . 307
D. Maternal Mortality Rate (Per 1,00,000 Live Births) in 2005 . . . . . . . . . . . . . . . . . . . . . . . . . . . . . . . . . . . . . . . . . . . 307
6.2 Income Level versus Percentage of People Availing NREGA . . . . . 328
6.3 Working Conditions . . . . . . . . . . . . . . . . . . . . . . . . . . . . . . . . . . . . 329
6.4 Problems Faced in Getting Job Card . . . . . . . . . . . . . . . . . . . . . . . 330
6.5 Problems Faced in Getting Job after Having Job Card . . . . . . . . . . 331

PPPPPrrrrrefaceefaceefaceefaceeface
Three decades ago, if asked to draw lessons from the Indian developmentexperience for some of the great development debates—democracy versusdevelopment, states versus markets, opportunities versus guarantees—theanswer would have been straightforward: never do as India does. With theexception of a stubbornly persistent democracy, Indian economicperformance had been unremarkable, and India remained the poster childfor development policy choices gone wrong.1
Today, though, these questions have acquired a new relevance becauseIndia has something to offer after all. After nearly three decades ofdisappointing but not disastrous growth, famously dubbed the ‘Hindugrowth’, it has in the following three decades posted solid growth of 6.5 percent per year, and nearly 8 per cent in the last decade or so. As a result,poverty has declined measurably and nearly all indicators of socialoutcomes have improved substantially. And although it is struggling to getout of China’s shadow, and despite Lord Meghnad Desai’s dashing ofIndian hopes and perhaps pretensions in his pronouncement that ‘Chinawill be a Great Power but India will just be a Great Democracy,’ the buzz isthat India is now becoming impossible to ignore. In fact, in the aftermath(if indeed the crisis is behind us) of the global financial crisis, with theprospects of the industrial countries heading south rapidly, India with itsstrong performance will attract even more attention.
With success and transformation, however, have come a new set ofchallenges, which Veena Jha in this book summarises correctly as theproblem of making growth inclusive. Inequality—across states and regions,skill levels and sectors—has been rising, the writ of the state does not run
1. It is telling that in a famous paper authored by the Nobel Prize winner, Robert Lucas,as recently as 1988, India was chosen as the archetypal ‘poor’ country, the exemplarof underdevelopment.

14 INDIA EMERGING • VEENA JHA
in about 25 per cent of Maoist insurrection-afflicted India, the quality ofessential public services has been deteriorating, and above all corruptionseems to have crossed some lakshman rekha of tolerability. Analysing andmaking sense of these inter-related pathologies and coming up with somesensible solutions are the tasks that Veena Jha has set for herself in thisambitious, comprehensive and timely book.
It is commendable that instead of going down the well-trodden path ofclichéd dichotomies—agriculture versus manufacturing or manufacturingversus services—Veena has identified a few sectors and issues that answerthe question of inclusive growth but in a non-obvious manner. Each of thechapters provides a useful review of the academic literature to ground thesubsequent discussion.
For example, there is an important chapter on inter-state migrationand how it affects inter-state inequality. What is the effect of migration oninequality, on poverty reduction, and informal wage growth? In theory,migration should be an important channel that exercises a restraininginfluence on inequality and divergence. If one state does very well, labourshould move to that state from other parts of the country in search ofbetter opportunities, exerting an equalising effect on labour marketoutcomes. Veena sheds interesting empirical light on these questions.
The author has also been careful in illuminating the role andimportance of gender issues. Amartya Sen famously and starklycharacterised the gender problem as one of ‘missing women’. Veena Jhaexamines whether economic growth has been good for women, noting theimprovement in female labour force participation and declining fertility,and also the effect on poverty of having households headed by women. Asection on the plight of widows in India is particularly intriguing.
Perhaps my favourite chapter in the book is on philanthropy in India.Here Veena Jha surveys the history of philanthropic giving in India goingback to the Rig Veda down to Mahatma Gandhi; provides a taxonomy ofcharities, and presents some very interesting data on them. For example, itmight come as a surprise to know that India has about 2 million to 3million charities; that the Indian Government may be the largest source offunding for charities in India; that the percentage of registered charities ishighest in Maharashtra (74%) and lowest in Tamil Nadu (47%); and that

15PREFACE
the number of employees in the charity sector almost equal (82%) of allCentral government employees.
One clear theme that recurs through this book is the need for India tosustain high levels of economic growth to facilitate the famous trickle-downeffect to the poor and vulnerable. The book also illustrates that the growth-equity debate is founded on a false dichotomy. As this book neatly shows,India needs sustained and high growth and a set of actions by the public,private and non-profit sectors to ensure trickle down and inclusiveness.Growth will prove to be politically unsustainable unless there is a widelyshared perception that a wide cross-section has a reasonable shot atparticipating in it; it will also prove unsustainable if growth is seen as theresult of a rigged system of rules. On the other hand, equity without growthhas rarely in history proved to be a successful formula for economicadvancement.
Veena Jha’s well-researched and important book will serve to enrichthe quality of debate on these difficult and pressing issues.
— Arvind Subramanian
Senior FellowPeterson Institute for International Economics
and Centre for Global Development

This page intentionally left blank

IntrIntrIntrIntrIntroductionoductionoductionoductionoduction
The major challenge for India’s development is inclusive growth. Growthhas reduced poverty and improved the human condition in India. Buteconomic gains of the middle and richer classes have been greater thanthose that went to the poorer sections of society. This is evident from thefact that reforms in areas such as telecommunications, banks, stockmarkets, airlines, trade and industrial policy have not been matched byagricultural and human development. India’s industrialisation continues tobe capital and knowledge intensive at a time when over 250 million peoplesurvive on less than a dollar a day. If India grows in this way, it will take along time to eradicate poverty, illiteracy and malnutrition. Moreover, slowprogress in human development in areas such as education and health willmake it tougher for India to grow in the long run. Increased inequality inthe initial phases of growth has been noted in both theoretical andempirical economic literature. In this sense, India’s experience is nodifferent from those of other countries. The big challenge for India is thatbeing a democratic state, tolerance for inequality and poverty is rapidlydiminishing as is shown by the increase in crime, naxalism and othersocioeconomic problems. Nevertheless, it is instructive to briefly revieweconomic literature before analysing India’s growth experience.
Theoretical and Empirical Literature
The much discussed Kuznets hypothesis (1955) stated that economicgrowth and equality were related in a ‘Converse U Curve’. At the earlystages of economic growth, inequality increases; in the middle stages,inequality becomes stable and in the final stages, inequality decreases alongwith economic growth. This means, inequality rises until countries reach‘middle income status’.

18 INDIA EMERGING • VEENA JHA
Kaldor (1956) also thought that inequality in income distributiontransfers wealth from the poor to the rich. Because the marginal savingsrate of the rich is higher than that of the poor, wide gaps in incomedistribution would boost economic growth when growth and savings rateswere positively correlated.
Adelman and Morris (1973) and Chenery and Syrquin (1975) mostlysupported Kuznets’ and Kaldor ’s hypothesis. However, Persson andTabellini (1994) showed that there was a significantly negative correlationbetween inequality and growth in democratic countries. Atkinson (1995)had also shown that many European countries which had experiencedincreases in income inequality had also seen an increasing number ofpeople suffering from poverty and social exclusion.
Sen (1983) cited such examples as Brazil, Mexico and South Korea,whose per capita GDPs are much higher than those of Sri Lanka andChina. However, in terms of social development indicators, Sri Lankaand China are much further ahead than the other three countries. Infact, after the reforms of 1978 in China, the growth in life expectancyand the reduction of infant mortality rates have slowed down. Studies byChen and Ravallion (2000), Deaton and Drèze (2002), Wade (2004) andBiswas and Sindzingre (2006) found that economic growth is not alwaysrelated to reduced poverty or inequality. Rather, it can impoverish morepeople and widen gaps of inequality. Even Nobel Laureate MichaelSpence (2009) stated that inequality often rises in the presence ofgrowth.
However, Bruno et al. (1997) examine evidence concerning therelation between growth and distribution (equity), the effect of pro-growthpolicies on distribution and distribution on growth. They review a largevolume of empirical research, including some of their own analyses. Theresults did not support Kuznets that growth is initially associated withinequality. Their study showed that many countries that are recoveringfrom economic crisis have experienced rapid economic growth as well asequitable distribution, and some transitory economies have experienceddecline in economic growth and worsening inequality. Solimano et al.(2000) said that countries which have been most successful in reducing
19INTRODUCTION
poverty are those that have grown fastest. During the 1990s it wasestimated that growth elasticity of poverty was between-2.0 to -3.0 (Adams, 2004; Chen and Ravaillon, 2000). However, estimatesby Bhalla (2002) suggest that the earlier correct growth elasticity ofpoverty was around -5.0.
How does India’s Experience Relate tothese Theoretical and Empirical Evidence
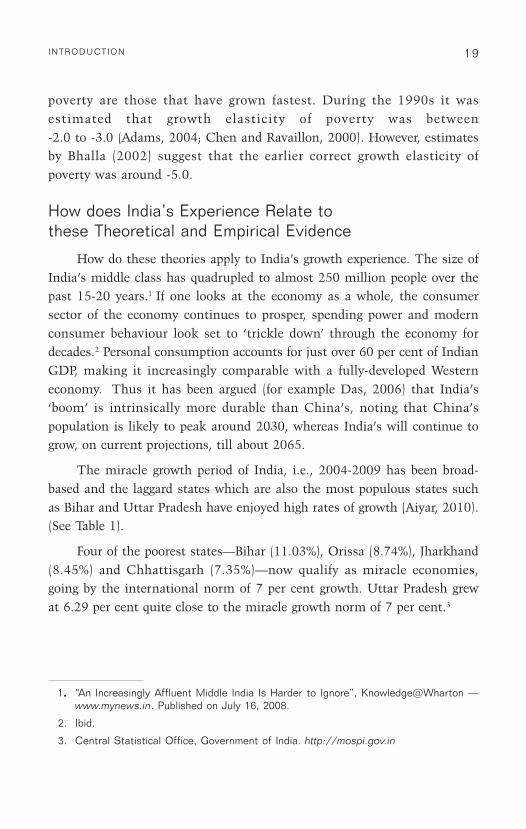
How do these theories apply to India’s growth experience. The size ofIndia’s middle class has quadrupled to almost 250 million people over thepast 15-20 years.1 If one looks at the economy as a whole, the consumersector of the economy continues to prosper, spending power and modernconsumer behaviour look set to ‘trickle down’ through the economy fordecades.2 Personal consumption accounts for just over 60 per cent of IndianGDP, making it increasingly comparable with a fully-developed Westerneconomy. Thus it has been argued (for example Das, 2006) that India’s‘boom’ is intrinsically more durable than China’s, noting that China’spopulation is likely to peak around 2030, whereas India’s will continue togrow, on current projections, till about 2065.
The miracle growth period of India, i.e., 2004-2009 has been broad-based and the laggard states which are also the most populous states suchas Bihar and Uttar Pradesh have enjoyed high rates of growth (Aiyar, 2010).(See Table 1).
Four of the poorest states—Bihar (11.03%), Orissa (8.74%), Jharkhand(8.45%) and Chhattisgarh (7.35%)—now qualify as miracle economies,going by the international norm of 7 per cent growth. Uttar Pradesh grewat 6.29 per cent quite close to the miracle growth norm of 7 per cent.3
1..... “An Increasingly Affluent Middle India Is Harder to Ignore”, Knowledge@Wharton —www.mynews.in. Published on July 16, 2008.
2. Ibid.
3. Central Statistical Office, Government of India. http://mospi.gov.in

20 INDIA EMERGING • VEENA JHA
Table 1
Annual Growth (%) of Gross State Domestic Product
State 2004-05 2005-06 2006-07 2007-08 2008-09 5-YearAverage
Gujarat 8.88 13.44 9.09 12.79 N.A. 11.05
Bihar 12.17 1.49 22.00 8.04 11.44 11.03
Kerala 9.97 9.17 11.10 10.42 N.A. 10.14
Haryana 8.64 9.37 14.20 9.35 8.02 9.92
Karnataka 9.85 13.53 7.33 12.92 5.08 9.74
Maharashtra 8.71 9.67 9.82 9.18 N.A. 9.34
Uttarakhand 12.99 5.66 9.84 9.37 8.67 9.31
Andhra Pradesh 8.15 10.24 11.16 10.62 5.53 9.14
Orissa 12.61 6.37 12.12 5.85 6.74 8.74
Tamil Nadu 11.45 11.89 11.29 4.41 4.55 8.72
Himachal Pradesh 7.56 8.54 9.20 8.59 N.A. 8.47
Jharkhand 15.21 2.79 12.53 6.18 5.52 8.45
Chhattisgarh 5.49 6.94 7.99 8.63 7.69 7.35
West Bengal 6.89 5.72 8.77 7.74 N.A. 7.28
Uttar Pradesh 5.40 5.25 7.18 7.16 6.46 6.29
Rajasthan -1.85 6.89 11.81 7.33 7.12 6.25
Jammu & Kashmir 5.23 6.17 6.25 6.28 N.A. 5.98
Punjab 4.95 4.50 7.32 6.54 6.26 5.91
Assam 3.74 4.94 6.97 6.06 6.04 5.55
Madhya Pradesh 3.08 6.48 4.75 5.25 N.A. 4.89
All-India 7.47 9.52 9.75 9.01 6.70 8.49
Note: N.A.: Not Available.
Source: Central Statistical Organisation (CSO), Delhi, India.
This is not a case of a few sectors, or services driving growth, butrather of widespread growth, especially in poor states with largepopulations. Once these high growth rates had been achieved, governmentrevenues also increased dramatically. Though fiscal deficits remain high,government spending on social sectors and welfare increased significantly.Thus programmes such as National Rural Employment Guarantee Scheme(NREGS), Bharat Nirman (infrastructure development programmes), SarvaShiksha Abhiyan (SSA) (education for all), the farm loan waiver andenormous oil subsidies could be sustained (Aiyar, 2010). These were part ofthe trickle down policies of the government.

21INTRODUCTION
The widespread participation in the growth process is confirmed bythe rapid rise in rural sales of motorcycles and branded consumer goods.Even stronger confirmation comes from the spread of the cellphonerevolution. The rate of new cellphone connections has risen steadily totouch 12-18 million per month reaching 51.05 per cent of the populationin terms of teledensity.4 Hundreds of millions earlier excluded fromtelecom are now getting included.
As of September 2009, urban teledensity in Rajasthan (104.4%) andOrissa (101.59%) exceeded the national level (101.38%). Bihar andJharkhand (99.41%) were almost on par, with Uttar Pradesh andUttarakhand (88.13%) not far behind (Aiyar, 2010).
Analysing the Agents of Trickle Down:The Purpose of the Book
While rapid growth was substantially inclusive, India still has aburden of poverty to the extent of one-quarter to one-third of its population.Much more needs to be done and these growth miracle patches need to besustained. India’s high growth trajectory, which is essential fordevelopment, has become reasonably stable. The debate is not aboutwhether India will grow at 6 per cent or at 4 per cent per annum. Thedebate is whether India will grow at 10 per cent or 8 per cent per annum.As Economic Survey 2009-10 reveals, the Indian economy has been inrecent times, to a large extent, affected by the happenings in developedeconomies because of its growing integration with a globalised world. Theannual growth rate had reached 9.7 per cent in 2006-07, began slidingdown to 9.2 per cent in 2007-08 and 6.7 per cent in 2008-09 and in (2009-2010) it was about 7.2 per cent.5 This is a substantial achievement.However, poverty has not reduced especially in terms of absolute numbers.
There are certain factors which are instrinsic to the Indian economy’sgrowth process which is inherently inimical to reducing poverty. Theseinclude the growth of its informal or unorganised sector, the huge
4. Statement by Telecom Regulatory Authority of India, (TRAI), http://www.siliconindia.com/shownews/Teledensity_in_India_touches_5105_percent-nid-66647-cid—sid-.html
5. Economic Survey, 2009-10.

22 INDIA EMERGING • VEENA JHA
differences in the rates of growth of different states, the increasingdependence on services, especially ITES and telecommunications forsustaining high growth rates. Additionally, development literature hasthrown up gender disparity as a major cause of poverty in countries. Theseissues are examined in the book. Additionally, the book examines themeasures adopted by both the private sector philanthropies and thegovernment in the field of social development.
The book is divided into three parts. The first examines the sources ofgrowth in the Indian economy and whether they can be effective agents oftrickle down. The major thrust of growth in the Indian economy has beenthe IT, ITES sector and telecommunications. The two account for over 10-15 per cent of the GDP and if their output multipliers are correct (seeChapter 1), their share of the GDP is almost double. This sector has beengrowing at an average rate of well over 30 per cent over the last 15 years. Aback of the envelope calculation shows that this sector therefore accountsfor roughly half to two-thirds of the growth rate of India. Hence, this sectoris an intrinsic part of India’s growth miracle. Given that its share of growthis so high, it must also be an important agent of trickle down to alleviatepoverty. However, while its share of GDP is very high, its share in overallemployment, even using the employment multiplier is no more than 1-2per cent of the total labour force.
Services, particularly computer software and hardware industriestogether accounted for 35.49 per cent of the total FDI in India between2000 and 2007 (Sarker, 2009). Even in this period of economic recession(2007-onwards), India’s services sector expanded at a faster pace in the firstseven months of the fiscal year (2009-10) compared to (2008-09).6 This isdespite the fact that India was hit by the worldwide recession in thissector.7 It is argued that high technology industries, especially IT and ITEShave not yet been able to generate significant linkages with the rest of theIndian economy. Hence, services and particularly IT and telecommuni-cations led growth process has little potential to be an agent of
6. Confederation of Indian Industry, Survey of 33 Service Sectors, December 2009,http://www.calcuttanews.net/story/579570
7. Ibid.
23INTRODUCTION
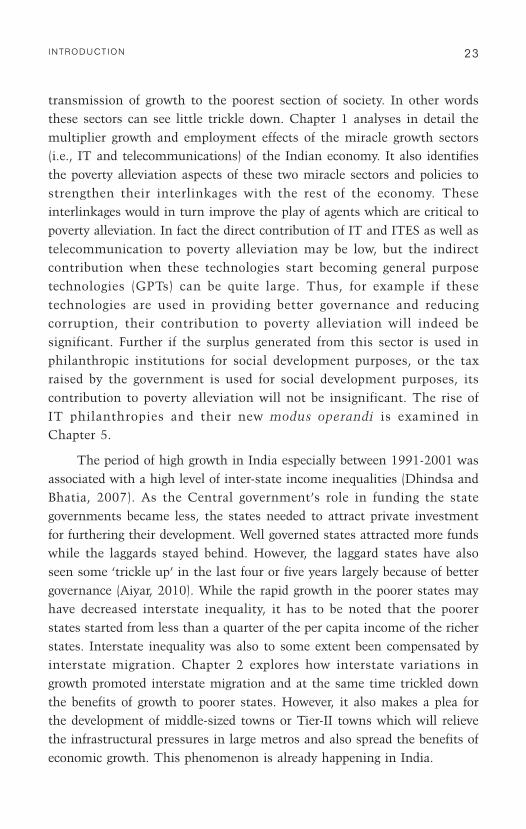
transmission of growth to the poorest section of society. In other wordsthese sectors can see little trickle down. Chapter 1 analyses in detail themultiplier growth and employment effects of the miracle growth sectors(i.e., IT and telecommunications) of the Indian economy. It also identifiesthe poverty alleviation aspects of these two miracle sectors and policies tostrengthen their interlinkages with the rest of the economy. Theseinterlinkages would in turn improve the play of agents which are critical topoverty alleviation. In fact the direct contribution of IT and ITES as well astelecommunication to poverty alleviation may be low, but the indirectcontribution when these technologies start becoming general purposetechnologies (GPTs) can be quite large. Thus, for example if thesetechnologies are used in providing better governance and reducingcorruption, their contribution to poverty alleviation will indeed besignificant. Further if the surplus generated from this sector is used inphilanthropic institutions for social development purposes, or the taxraised by the government is used for social development purposes, itscontribution to poverty alleviation will not be insignificant. The rise ofIT philanthropies and their new modus operandi is examined inChapter 5.
The period of high growth in India especially between 1991-2001 wasassociated with a high level of inter-state income inequalities (Dhindsa andBhatia, 2007). As the Central government’s role in funding the stategovernments became less, the states needed to attract private investmentfor furthering their development. Well governed states attracted more fundswhile the laggards stayed behind. However, the laggard states have alsoseen some ‘trickle up’ in the last four or five years largely because of bettergovernance (Aiyar, 2010). While the rapid growth in the poorer states mayhave decreased interstate inequality, it has to be noted that the poorerstates started from less than a quarter of the per capita income of the richerstates. Interstate inequality was also to some extent been compensated byinterstate migration. Chapter 2 explores how interstate variations ingrowth promoted interstate migration and at the same time trickled downthe benefits of growth to poorer states. However, it also makes a plea forthe development of middle-sized towns or Tier-II towns which will relievethe infrastructural pressures in large metros and also spread the benefits ofeconomic growth. This phenomenon is already happening in India.

24 INDIA EMERGING • VEENA JHA
The development of Tier-II cities in India is presaged on industrialgrowth. India’s industrialisation is beginning to demand more and moreland (Euro RSCG, 2007; Ernst & Young, 2008). Industrial land acquisitionneeds to be based on the consent of the local people. Acquisition needs tobe preceded by compensation and welfare measures that render theacquisition of land for industrial purposes a developmental endeavour.Fertile double cropped land needs to be largely left for cultivation. Thecurrent laws give the government substantial powers to acquire land.8
Forced land acquisition by the government has led to violent unrest insome parts of India.9 Land acquisition has been successful in areas wheredevelopers have worked with state governments and the local people forgaining consent by attempting to uplift their human condition. States likeTamil Nadu, Andhra Pradesh, Gujarat and Maharashtra have tried tostreamline some of these procedures at the sub-national level (Mukherji,2005). Investment-friendly states are able to craft developmentalbureaucracies that work more effectively for the local people and investors(Bhide et al., 2005). The processes need to be streamlined in the poorerstates too. This will undoubtedly lead to the development of Tier-II townswhich will also relieve the infrastructural pressures of inter-state migration.The emerging middle class is also to be found in Tier-II towns rather thanmetro cities of India. Thus, the policy prescriptions of Chapter 2 arepresaged on how middle-sized towns should be developed.
The second part of the book focusses on the sectors that have largelybeen bypassed by the growth process. While these sectors and sections ofsociety are not the epicentre of India’s growth process, nevertheless growthdynamics and interlinkages have not left them untouched.
An examination of India’s economic growth process shows that it hasmore or less bypassed the agriculture sector in the 1990s.10 According tomost estimates, 50-70 per cent of India’s population is dependent on
8. The Land Acquisition (Amendment) Bill, 2007, http://www.dolr.nic.in/LABill2007.pdf
9. “Recent Unrest in Andal, West Bengal: Site of Aerotropolis”, April 18, 2010, http://sanhati.com/excerpted/2277/
10. Dholakia (2007). Also Arjun Sengupta Report on the Unorganised Sector, 2007.

25INTRODUCTION
agriculture either directly or indirectly. Most of the labour in this sectorworks informally (Bhalla, 2010). Hence, the plight of the informal sectorwould be of critical importance in determining whether this sector has beenan agent for trickling up growth. Furthermore even in the industrial sector,India’s trade union laws increase the propensity of Indian industry toremain capital intensive, resulting in unemployment and increasedemployment in the unorganised sector. The textile industry, which is thelargest industry after agriculture, has managed to create some suchlinkages, but the availability of local inputs makes it almost entirely self-sufficient, so these linkages are not dynamic, rendering them largelyinefficient. Furthermore, 80 per cent of the jobs in the textile industry havebeen outsourced to the informal sector.11 In the services sector too, a largeproportion of the employment is informal. This implies that one of theimportant indicators of social development of the Indian economy would bethe state of the informal sector. Equally, economic growth should bereflected in improvements in income and asset formation in theinformal sector. It is also important to analyse the triggers which resultin the maximum gains for the informal sector. Policy could thus beoriented to improve the play of these factors to improve the lot of theinformal sector. These issues are analysed in detail in Chapter 3. It ishoped that the policies identified in Chapter 3 would be an integral partof a strategy of inclusive growth and would help achieve povertyalleviation more rapidly. In other words, the trickle up story should comefrom the informal sector.
It is also important in a growing economy to examine the plight ofwomen who constitute one half of India’s population. It is argued that areduction of gender disparity leads to an increase in the rate of economicgrowth, which, in turn, is poverty reducing. This is because greater genderequality enables women to take up income-earning opportunities, andparticipate in the growth process (Klasen, 1999). Furthermore, genderinequality in access to education may hinder a reduction in fertility andinfant mortality (Balatchandirane, 2007). This issue is examined in detailin Chapter 4. This chapter also evaluates various policy options zeroing in
11. “Economic Growth and Social Inequality: Does the Trickle Down Effect Really TakePlace?”. www.ojs.library.ubc.ca

26 INDIA EMERGING • VEENA JHA
on those that would result in the maximum social benefit, given thecultural context of the Indian economy. The gender dimensions of theIndian economy would also reflect how growth has trickled up from thegrassroots. These issues are examined in Chapter 4.
The third section of the book deals with an examination of theschemes and policies for ‘trickling down’ the benefits of economic growthto the poor. The so-called growth elasticity of poverty reduction is muchhigher in China than in India because the same one per cent growth ratereduces poverty in India by much less than it does in China (Bardhan,2010). A 2002 study of Dutt and Ravallion that compared the Indianprovinces has pointed out that the growth elasticity of poverty depends onthe initial distribution of land and human capital. This elasticity is low inhigh-growth states such as Maharashtra and Karnataka, and high in statessuch as Kerala and West Bengal (Dutt and Ravallion, 2002). A recent WorldBank study shows that land distribution inequalities play a relativelyinsignificant role in development in comparison to inequalities in humancapital (Do and Levchenko, 2009). It is these inequalities, i.e., primarilyeducation, health and income-earning opportunities, that privatephilanthropy or social development schemes of the government seek tocorrect.
Recognising the unequal growth which India has seen, where a verysmall number of high net worth individuals account more than one-fourthof India’s GDP, it is incumbent on them and the government to help theprocess of poverty alleviation. India has a long established tradition ofphilanthropy. The number of wealthy Indians has been rising fast over thelast decade, by 11 per cent every year since 2000, possibly the fastest pacein the world, to more than 115,000 now. However, philanthropy in Indiaprobably totalled about $7.5 billion in 2009, according to the study by Bain& Co., equivalent to about 0.6 per cent of the country’s GDP.12 While thisis higher than Brazil’s 0.3 per cent and rival China’s 0.1 per cent, but itfalls way short of the 2.2 per cent in the United States and 1.3 per cent inBritain.13 Most Indians have no qualms about giving cash to family, friends,
12. Asian Philanthropy News Digest 03/18/10. http://www.asianphilanthropyforum.org/india/index.html
13. Ibid.
27INTRODUCTION
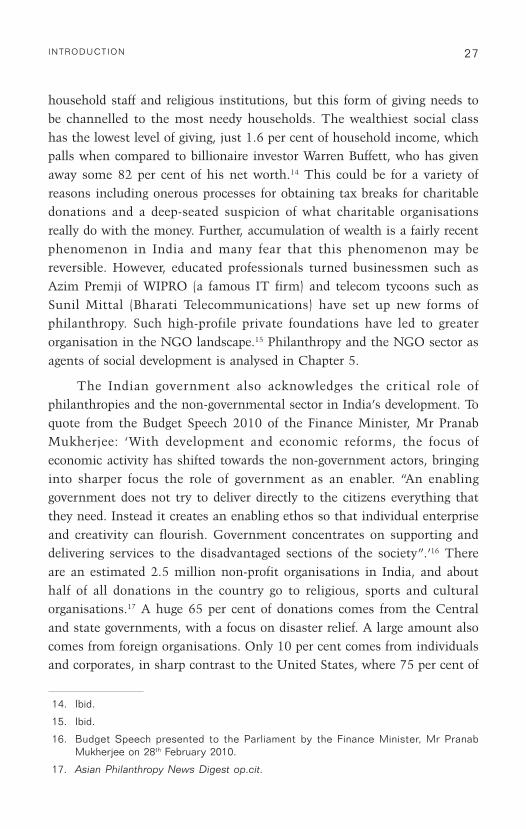
household staff and religious institutions, but this form of giving needs tobe channelled to the most needy households. The wealthiest social classhas the lowest level of giving, just 1.6 per cent of household income, whichpalls when compared to billionaire investor Warren Buffett, who has givenaway some 82 per cent of his net worth.14 This could be for a variety ofreasons including onerous processes for obtaining tax breaks for charitabledonations and a deep-seated suspicion of what charitable organisationsreally do with the money. Further, accumulation of wealth is a fairly recentphenomenon in India and many fear that this phenomenon may bereversible. However, educated professionals turned businessmen such asAzim Premji of WIPRO (a famous IT firm) and telecom tycoons such asSunil Mittal (Bharati Telecommunications) have set up new forms ofphilanthropy. Such high-profile private foundations have led to greaterorganisation in the NGO landscape.15 Philanthropy and the NGO sector asagents of social development is analysed in Chapter 5.
The Indian government also acknowledges the critical role ofphilanthropies and the non-governmental sector in India’s development. Toquote from the Budget Speech 2010 of the Finance Minister, Mr PranabMukherjee: ‘With development and economic reforms, the focus ofeconomic activity has shifted towards the non-government actors, bringinginto sharper focus the role of government as an enabler. “An enablinggovernment does not try to deliver directly to the citizens everything thatthey need. Instead it creates an enabling ethos so that individual enterpriseand creativity can flourish. Government concentrates on supporting anddelivering services to the disadvantaged sections of the society”.’16 Thereare an estimated 2.5 million non-profit organisations in India, and abouthalf of all donations in the country go to religious, sports and culturalorganisations.17 A huge 65 per cent of donations comes from the Centraland state governments, with a focus on disaster relief. A large amount alsocomes from foreign organisations. Only 10 per cent comes from individualsand corporates, in sharp contrast to the United States, where 75 per cent of
14. Ibid.
15. Ibid.
16. Budget Speech presented to the Parliament by the Finance Minister, Mr PranabMukherjee on 28th February 2010.
17. Asian Philanthropy News Digest op.cit.

28 INDIA EMERGING • VEENA JHA
charitable giving is from individuals and corporates.18 Models of interactionbetween philanthropy, NGO and the government in delivering socialservices is studied in detail in Chapter 5. This chapter also examines howthe NGO sector can be made more effective in delivering social services.
While philanthropy may be important, it is the government that canprovide its citizens with basic needs through employment generationprogrammes, land reforms, extending credit to the poor, crop insurance,rural roads, rural housing, rural water supply, rural electrification,universalising primary education, comprehensive health care system,labour welfare etc. Without government intervention, it is impossible tohave egalitarian growth. It is natural for market-driven growth to onlyoccur in certain areas, which may be determined either by geography orsector. The increase in products and/or services in those areas either createa demand for domestic consumption or for export. Ever since recession hasset in, prices of consumer items have been increasing at an accelerated rateand it means a substantial portion of the incomes of the poor at large istaken away to meet basic needs and this makes the ultimate distribution ofnational income more skewed. The incidence of unemployment has beenincreasing because of severe recession in the countries that have beenbuyers of India’s goods and services. Many of the BPOs and call centreshave closed down or shifted elsewhere. Moreover, the rate of growth ofemployment opportunities has plummeted to just one per cent. Theemphasis has been on increasing labour productivity or getting a smallernumber of workers produce more and more surplus value. Whilemanufacturing sector seems to have recovered and its rate of growth thatdeclined from 14.9 per cent in 2006-07 to 10.3 per cent in 2007-08 and 3.2per cent in 2008-09, it had gone up to 8.9 per cent in 2010; the agriculturalsector on which almost 60 per cent of the population depends for itslivelihood has grown very little. The rate of growth of agriculturalproduction has declined from 4.7 per cent in 2007-08 to 1.6 per cent in2008-09 and during 2010 it is was negative, i.e., -0.2 per cent.19
18. Ibid.
19. Economic Survey 2009-10, Planning Commission, Government of India.

29INTRODUCTION
A recent study from the UN says that in 2008-09 alone as many as 34million people were pushed below the poverty line. According to the figuresof the last Census, between 1991 and 2001, 8 million farmers were forcedto quit agricultural sector and seek sources of livelihood elsewhere. In2008, in spite all the efforts of the government to lessen the incidence ofindebtedness, the major factor behind the suicides, 16,196 farmers endedtheir lives. Thus, between 1997 and 2008, 199,132 farmers took their lives(Sarker, 2009). In this situation the major programmes of the governmentsuch as National Rural Employment Guarantee Act (NREGA), Sarva SikshaAbhiyan (SSA) (education for all), the National Rural Health Mission(NRHM), Nutrition for All, assume special significance. An examination ofthe government programmes and how they have helped alleviate poverty isthe subject of Chapter 6.
Finally, the book sums up the policy recommendations from theearlier chapters pointing to the future growth scenario of the Indianeconomy. On the basis of confirmed high growth rates, the book points to aprioritisation of issues and policies which can accelerate trickle down. Thepolicies suggested by each of the individual chapters which are self-standingin their own way are however interlinked in the conclusions.

30 INDIA EMERGING • VEENA JHA
ReferencesAdams, Richard H. (2004). “Economic Growth, Inequality and Poverty: Estimating the
Growth Elasticity of Poverty”, World Development 32(12): 1989-2014.
Adelman, I.G. and C.T. Morris (1973). Economic Growth and Social Equity in DevelopingCountries. Stanford, USA: Stanford University Press.
Aiyar, Swaminathan S. Anklesaria (2010). “Fast Growth Trickles up from the States”.Economic Times Bureau Report, January 6. India.
Atkinson, Anthony B. (1995). “Income Distribution in OECD Countries: Evidence fromLuxemburg Income Study”, OECD Social Policy Studies No. 18. Paris.
Balatchandirane, G. (2002). Gender Discrimination in Education and EconomicDevelopment, Institute of Developing Economies, Japan External Trade Organisation,http://www.ide.go.jp/English/Publish/Download/Vrf/pdf/426.pdf
Bardhan, P. (2010). Awakening Giants, Feet of Clay: Assessing the Economic Rise ofChina and India. Princeton University Press.
Bhalla, Surjit S. (2002). Imagine there is No Country: Poverty, Inequality and Growth inthe Era of Globalization. Washington DC: Institute for International Economics.
————. (2010). “India’s Economy: Performances and Challenges, Essays in Honour ofMontek Singh Ahluwalia”, Indian Economic Growth: Three Puzzles. February 10.New Delhi: O[X]US Research & Investments.
Bhide, Shashanka, Rajesh Chadha and Kaliappa Kalirajan (2005). “Growth Interdependenceamong Indian States: An Exploration”, Asia-Pacific Development Journal 12(2),December.
Biswas, Rongili and Alice Sindzingre (2006). “Trade Openness, Poverty and Inequality inIndia: Literature and Empirics at the Sub-National Level”, Paper presented at theInternational Conference on the Indian Economy in the Era of Financial Globalization.Paris, September 28-29.
Bruno, Michael, Martin Ravallion and Lyn Squire (1997). “Equity and Growth in DevelopingCountries: Old and New Perspectives on the Policy Issues”, in Vito Tanzi and Ke-Young Chu (eds), Income Distribution and High Quality Growth. pp.117-50.Cambridge: MIT Press.
Chen, S. and M. Ravallion (2000). How did the World’s Poor Fare in the 1990s.Development Research Group. Washington: World Bank.
Chenery, H. and M. Syrquin (1975). Patterns of Development 1950-1970. London: OxfordUniversity Press.
Das, G. (2006). “The Indian Model (Economic Development)”, Foreign Affairs 85(4), July–August 2006.
Deaton, Angus and Jean Drèze (2002). “Poverty and Inequality in India: A Reexamination”,Economic and Political Weekly: 3729-48. (September 7th).
Dhindsa, Paramjeet Kaur and Seozy Bhatia (2007). “Growth and Poverty in India: AnAnalysis of Interstate Differences”. https://editorialexpress.com/cgi-bin/conference,India.
Dholakia, Bakul H. (2007). “Sources of India’s Accelerated Growth and the Vision of IndianEconomy in 2020”, Indian Economic Journal 49(4).
Do, Quy-Toan and Andrei Levchenko (2009). “Trade, Inequality, and the Political Economyof Institutions”, Journal of Economic Theory 114(4): 1489–520.
31INTRODUCTION
Dutt, G. and M. Ravallion. (2002). “Has India’s Post–Reform Economic Growth Left thePoor Behind”, Journal of Economic Perspectives (Summer): 80-108. Nashville.
Ernst & Young (2008). “The Dhoni Effect: Rise of Small Town India”, Ernst & Young, March.
Euro RSCG (2007). “The Bunty Syndrome”, Euro RSCG India. October.
Kaldor, N. (1956). “Alternative Theories of Distribution”, Review of Economic StudiesXXIII: 83-100.
Klasen, Stephan (1999). “Does Gender Inequality Reduce Growth and Development?Evidence from Cross-Country Regressions”, Policy Research Report on Gender andDevelopment Working Paper Series, No. 7, November 1999, The World BankDevelopment Research Group/Poverty Reduction and Economic ManagementNetwork.
Kuznets, S. (1955). “Economic Growth and Economic Inequality”, in Mitchell A. Seligsonand John T. Passé-Smith (eds.), Development and Underdevelopment. Colorado:Lynne Rienner Publishers. 1998. pp.43-55.
Mukherji, Rahul (2005). “The State, Economic Growth, and Development in India”, IndiaReview 4(5), April.
Persson, T. and G. Tabellini (1994). “Is Inequality Harmful for Growth? Theory andEvidence”, American Economic Review 84: 600-21, Journal of Economic Literature.New York. F22, F40.
Sarker, Kanchan (2009). “Economic Growth and Social Inequality: Does The Trickle DownEffect Really Take Place”, Journal of Marxism and Interdisciplinary Inquiry 3(1): 42-60. (October). Grant MacEwan College.
Sen, A. (1983). “Economics and the Family”, Asian Development Review 1.
Solimano, Andres, Eduardo Aninat and Nancy Birdsall (2000). Distributive Justice andEconomic Development: The Case of Chile and Developing Countries. Ann Arbor:University of Michigan Press.
Spence, M. (2009). Report of the Growth Commission. Jointly hosted by DFID, WorldBank.
Wade, R. (2004). “Is Globalization Reducing Poverty and Inequality?”, World Development32(4): 567-89.

This page intentionally left blank

Part I

This page intentionally left blank
Role of ICTRole of ICTRole of ICTRole of ICTRole of ICTs and its Ts and its Ts and its Ts and its Ts and its Trickle-rickle-rickle-rickle-rickle-Down Effects on India’sDown Effects on India’sDown Effects on India’sDown Effects on India’sDown Effects on India’sEconomic EmerEconomic EmerEconomic EmerEconomic EmerEconomic Emergencegencegencegencegence
Introduction
Two technologies which have dominated India’s economic emergenceand made it a global player are information technology (IT) and mobiletelephony. In fact both may be described as general purpose technologies(GPTs) which affect an economy and its global interaction profoundly.Wikipedia describes GPTs as great leaps of innovation that can affect anentire economy (usually at a national or global level). Unlike traditionaltechnologies, which economists view as a smooth advancement, GPTs aredrastic advancements that redefine society. Examples are the steam engine,railroad, electricity, electronics, the automobile, the computer and theinternet and mobile telephony.
India has the cheapest internet and mobile access at the global level.Among its 500 million mobile users in 2010 which was growing at the rateof over 10 million a month, roughly a quarter use mobiles for their internetconnection. As 3G technology spreads in India and is used in largenumbers, internet penetration which stood at only 3 per cent versus 50 percent mobile penetration in 2010 is likely to increase dramatically. Alongwith an almost unlimited supply of workers and the huge potential forwidespread use, ICT has the potential to work like a GPT in the Indiancontext.
The information technology and information technology enabledsector (IT/ITES) accounted for over 6.4 per cent of India’s GDP (2010) upfrom about 1.2 per cent a decade ago. Another estimate of computer-relatedservices and communication services shows that these together account for
11111

36 INDIA EMERGING • VEENA JHA
nearly 9 per cent of GDP (DIT and NCAER, 2010). It earned the countryabout US $59 billion of foreign exchange in 2010—a crucial commodity forIndia—and directly employed about 2 million people. In the composition ofIndia’s exports of goods and services, it grossed by far the largest exportrevenue. According to the Ministry of Labour and Employment, India’s IT/ITES sector employs 12 per cent of the private sector workforce, making itthe sector’s biggest employer (NASSCOM, 2010). The dominant share ofthe ICT sector in the Indian economy is borne out by its size, which isabout 60 per cent that of all registered manufacturing activities and exceedsthe combined size of the banking and insurance sectors (DIT and NCAER,2010). The output multiplier for computer-related services is 2.1 (DIT andNCAER, 2010).
The telecom sector in 2009 grossed about US $25 billion in terms ofrevenue of which 90 per cent was accounted for by the mobile telephonysector. Indian telecom service sector contributed approximately 2 per cent ofthe GDP in FY 2008-09 and its contribution was expected to rise further.Teledensity grew from a mere 1.3 per cent in 1995 to over 50 per cent as ofApril 2010. Despite the significant volumes and growth story, India still hadover 500 million addressable population. This provides a huge opportunity aswell as challenge for the operators and telecom sector as a whole. Due tohyper competition (approximately 8-9 operators in each circle) and thedynamics of the market, India has one of the lowest tariffs globally(PricewaterhouseCoopers, 2010).
The Indian IT and mobile telephony sector is recognised as a globalphenomenon for its economic contribution to both India and the globaleconomy. While the role of IT and mobiles on the Indian economy may beprofound, a related issue that is addressed by this chapter is whether ittrickled down to the poor in such a way that it increased their capacity togenerate incomes and reduce poverty. The real trickle down of the IT sectoris not simply through software and hi-tech services, but it is through sociallyrelevant products and services, community initiatives, human resourcedevelopment, education, health and women’s empowerment.
This chapter examines the role of both IT/ITES and mobile telephonyservices in promoting the trickle down of India’s high growth rates. Thefirst section of the chapter focusses on how IT/ITES could act as a GPT to

37ROLE OF ICTS AND ITS TRICKLE-DOWN EFFECTS ON INDIA’S ECONOMIC. . .
fuel India’s growth process. The second section analyses the effects of e-readiness, a proxy of ICT usage on poverty in different states of India. Thethird section looks at secondary studies for an analysis of multiplier effectsof ICT. The fourth section analyses the trickle-down effects of mobiletelephony. The last section concludes with the potential and realsocioeconomic effects of the two technologies on India.
I
Is IT a GPT in India
The TheorThe TheorThe TheorThe TheorThe Theoretical Basis of a GPTetical Basis of a GPTetical Basis of a GPTetical Basis of a GPTetical Basis of a GPT
GPTs are radical new ideas or techniques that have the potential toimpact many industries in an economy. Bresnahan and Trajtenberg (1995)identified three key characteristics of GPTs: commonness (they are used asinputs by many downstream industries); technological dynamism (inherentpotential for technical improvements); and innovational complementaritieswith other forms of advancement (meaning that the productivity of R&D indownstream industries increases as a consequence of innovation in theGPT) (Laursen et al., 2002).
India’s recent ICT ‘revolution’ can be seen to be one such GPT, sincetoday, computers and related equipment are used in several industries andin a number of services of the economy. ICTs have also displayed asubstantial level of technological dynamism spurring not only radicalimprovement in computational capacity, but also a successive wave of newtechnologies (ranging from the semiconductor to the internet). Moreover,ICTs have seriously facilitated new ways of organising firms, including thedecentralisation of decision-making and team production (Milgrom andRoberts, 1990; Brynjolfsson and Hitt, 2000; Bresnahan et al., 2002).Thereby, ICTs have clearly exhibited innovational complementarities withother forms of advancement. As India was starting from a much lower levelof IT-adoption, the potential gains would be expected to be very high. Infact, countries such as India have leapfrogged over older, more expensiveapproaches such as Electronic Data Interchange, which represent
38 INDIA EMERGING • VEENA JHA
significant legacy investments in countries such as the US (Laursen et al.,2002).
Bresnahan and Trajtenberg (1995) point to the importance of thematch between GPTs and specific institutions that facilitate or hinder GPTsin playing out their roles as engines of growth. If institutions show adisinterest in new technologies, an economy with the ‘wrong’ institutionsmay prove inadequate for supporting GPTs, including the applicationindustries. This sector has been marked by an absence of regulation in theIndian economy, even being exempted from corporate taxes. Critics claimthat this absence of regulation could have had a beneficial facilitating effecton the ICT sector (NASSCOM, 2010).
To analyse the contribution of information and communicationtechnology (ICT) to economic growth, Schreyer (2000) used a well-established growth accounting framework and considered three ways inwhich ICT can influence economic growth:
1. ICT production: The role of ICT producers on the economy’s totalvalue added or GDP. Using this parameter, the contribution of ICTto the Indian GDP has increased from less than 1 per cent in 2000to over 6 per cent in 2010. The growth rate of this sector has beenover 30 per cent and this growth has contributed about 2percentage points to GDP growth (Nasscom, 2010).
2. ICT as capital input: This approach focusses on the importance ofcomputers and information technology as an input in otherindustries. This approach treats ICT capital goods as all othertypes of capital goods. In India too, there are strongcomplementarities between the IT sector and other sectors.Examples of areas where increased efficiency have been observedinclude: accounting, procurement, inventory management andproduction operations (Bhatnagar and Schware, 2000). In thecontext of complementarities, it is also important to recognise thatthese effects are not just in terms of cost savings. ITimplementation may enhance the quality of service beyondanything that is feasible through other methods (Desai, 2000).Furthermore, depending on who the ‘customers’ are, the benefitsmay accrue to a broad cross-section of the population. Improved

39ROLE OF ICTS AND ITS TRICKLE-DOWN EFFECTS ON INDIA’S ECONOMIC. . .
efficiency in the stock market as a result of automated trading andsettlement may benefit a small section of the population (thoughthe indirect benefits of greater capital market efficiency may bebroader). The use of IT in banking may impact only the middleclasses. However, the computerisation of the Indian Railways’reservation system has had tremendous benefits for the masseswho use this mode of transportation (Singh, 2002).
Information processing may enhance efficiency in agriculture as wellas in manufacturing. While individual farmers cannot make ITinvestments, agricultural cooperatives can provide the institutionalframework that allows farmers to benefit. For example, Chakravarty(2000) gives the example of IT use at milk collection centres incooperative dairies. This permits faster and safer testing, betterquality control, quicker and more accurate payments to farmers andtime savings for farmers in their deliveries. The falling cost ofinformation processing means that such success stories canpotentially be widely replicated. The second impact is in thecommunication of information. Here there are a number ofsuccessful case studies. Farmers and fishermen can receive weatherforecasts, market price quotes, advice on farming practices andspecific training. Offers to buy or sell livestock, or other two-waycommunications are also possible. Some of this informationdissemination and exchange is best done through voice media, whileother types require the capabilities of the internet. Some evidencesuggests, not surprisingly, that richer farmers and fishermen, as wellas middlemen, are faster adopters of such technologies, but fallingaccess costs has helped to broaden the base of these benefits (TheEconomist, 2001).
3. ICT as a catalyser: Part of the discussion about the new economyis based on the claim that ICTs produced benefits go beyond thosepertaining to investors and owners. In fact, in addition to theirdirect (and remunerated) contribution to output growth, ICTsgenerate spillovers or free benefits that exceed the direct returns toICT capital. Such positive externalities are always characterised bya discrepancy between a private investor’s rate of return and the
40 INDIA EMERGING • VEENA JHA
rate of return for society as a whole. In other words, ICTequipment generates benefits above and beyond those reflected inits measured income share. Thus, as GPTs improve they spreadthroughout the economy, bringing about general productivity gains.The use of IT in rural banking and microfinance, through pilotschemes such as the InfoTech Smart Card project is encouraging.Handheld computers and smart cards can substantially reduce thecosts of making loans, as well as monitoring them. Reducing thesetransactions costs may turn out to be critical for the scalability andsustainability of microfinance schemes. These benefits could beclassified as indirect spillover effects (Singh, 2002).
Anecdotal Evidence on the WidesprAnecdotal Evidence on the WidesprAnecdotal Evidence on the WidesprAnecdotal Evidence on the WidesprAnecdotal Evidence on the Widespread Use of ICT in Indiaead Use of ICT in Indiaead Use of ICT in Indiaead Use of ICT in Indiaead Use of ICT in India
In a country like India, which has huge governance deficits, IT alsooffers a way of changing the way business can be done by governments. E-governance is at its initial stages in terms of governance but there arenumerous examples of successful pilot e-governance programmes (Singh,2003). These include:
• Computer-aided registration of land deeds and stamp duties inAndhra Pradesh, reducing reliance on brokers and possibilities forcorruption.
• Computerisation of rural local government offices in AndhraPradesh for delivery of statutory certificates of identity andlandholdings, substantially reducing delays.
• Computerised checkpoints for local entry taxes in Gujarat, withdata automatically sent to a central database, reducing opportunitiesfor local corruption.
• Consolidated bill payment sites in Kerala, allowing citizens to paybills under 17 different categories in one place, from electricity touniversity fees.
• E-mail requests for repairs to basic rural infrastructure such as handpumps, reducing reliance on erratic visits of government functionaries.

41ROLE OF ICTS AND ITS TRICKLE-DOWN EFFECTS ON INDIA’S ECONOMIC. . .
In addition to using internet directly, franchises of low-cost ruralinternet kiosks for accessing government services have been organised byDrishtee in Madhya Pradesh. It is important to note that once internetaccess is available, its benefits are not restricted to e-governance.Individuals can obtain market information, training, job information,advice on farming techniques, and so on, as discussed earlier in this section(Singh, 2003).
Another useful purpose served by IT has been the facilitation ofcollection of direct taxes in India. Direct tax collection has increased byover 50 per cent from 2006-2009 in India (World Bank, 2010). Part of thereason is the high rates of growth experienced by the Indian economy, butthe Department of Direct Taxation also claims that in part the convenienceof e-filing and e-payment of direct taxation has facilitated a higher taxcollection.
Leveraging ICT for Online Taxes and Levies
Direct taxes are made up of income taxes and corporate taxes, whichtogether contribute about 34 per cent of total government revenues (and amere 2.9 per cent of the GDP) (Rupanagunta, 2004). Traditionally, Indiahas had an extremely poor collection of direct taxes, not least due to thecomplicated and time-consuming process of tax collection. Indirect taxesincluding excise taxes and customs, together make up about 66 per cent ofthe total government revenue (and 5.7 per cent of the GDP) (Rupanagunta,2004).
A total savings of about 10 per cent of the cost of tax collection wasenvisaged through online tax payment. Similarly, in corporate taxes, it wasenvisaged to save about 30 per cent of the total cost, whereas for excise andcustoms duties savings were to be in the range of 20 per cent(Rupanagunta, 2004). Apart from cost savings, income tax collectionthrough online services has become much higher accounting for nearly 40per cent of total taxes in 2008 in comparison to 34 per cent in 2000 (WorldBank, 2010).

42 INDIA EMERGING • VEENA JHA
Box 1.1
E-Governance
Issuance of Unique Identification Numbers (UIN) to all the citizens: A UniqueIdentification Authority of India has been established recently with statutorypowers for creating a database of all the citizens and for issuance of UIN to them.This would help, inter alia, (a) in avoiding duplication of identification and willhelp in weeding out illegal immigrants; (b) in issuing a multi-purpose national IDcard, and (c) in targetting and monitoring of inclusion programmes of thegovernment through issuance of smart cards to intended beneficiaries.
National e-Governance Programme (NeGP): Ambitious programme ofGovernment of India with three pillars: state data centres (SDCs) as a centralrepository of state-level data; state-wide area networks (SWANs) for integration ofdifferent layers of state government and common services centres (CSCs) as one-stop front-end delivery points for a variety of citizen-centric services (Applicationforms, payment of utility bills etc.). Apart from this there are many Central andstate mission mode programmes (MMPs) which are sought to be implemented in atime-bound, mission-mode manner.
National Knowledge Network/Grid (Garuda Project): Interlinking of educationaland research institutes across India electronically for sharing of intellectualresources on one common platform.
Smart Card for Inclusion of Disadvantaged Sections: For e.g., BhamashahFinancial Inclusion Project of Government of Rajasthan which aims at opening no-frills bank account for 5 million below poverty line (BPL) families throughbiometric ID cards.
Source: Department of Information Technology and National Council of Applied EconomicResearch (2010).
All these add up to a savings potential of around US $10 billion on anannual basis. To put this in perspective, let’s assume that this would releaseUS $1 billion (10 per cent of the savings realised every year, after accountingfor the infrastructure and operating costs of such a system) (Author ’scalculations). This could provide health care to a million people in Indiaaccording to a World Bank survey (World Bank, 2010).
While anecdotal evidence on the use of ICT in various aspects of theIndian economy are several, it is important to model ICT as a GPT for theIndian economy.

43ROLE OF ICTS AND ITS TRICKLE-DOWN EFFECTS ON INDIA’S ECONOMIC. . .
II
Modelling ICT as a GPT
One central feature of a GPT (such as ICT) is that its impact onproductivity and hence performance is ‘indirect’ rather than direct. Morespecifically ICT increases the productivity of direct knowledgeaccumulation (e.g. investment in R&D), which would otherwise exhibitdecreasing returns. Thus for example, in India, the impact of ICT shouldbe felt on total factor productivity in states which have a higher exposure toICT. This implies that with given levels of capital and labour inputs, it is tobe expected that better networked states are likely to see higher impacts onper capita output. Thus, ICT enters as an input into the productionprocess. The regression analysis below shows this relation clearly. Whilecorrelation cannot be chosen as a measure of causality, in terms ofhighlighting the policy variable, this analysis provides adequate results.
Impact of Network Development upon OutputImpact of Network Development upon OutputImpact of Network Development upon OutputImpact of Network Development upon OutputImpact of Network Development upon Output
The objective of this regression is to look upon the possible impact ofICTs on gross output. The policy variable is network development, thedummy variable. An index of network development can be gauged from thee-readiness of states. The e-readiness index of a state is a composite indexwhich includes several variables besides ICT penetration and expenditure.For a comprehensive discussion of the e-readiness index see Appendix A-1.1. All states with average and above e-readiness have a dummy of 1,while those below that level have a dummy of 0 (See Appendix A-1.1). Itcan be seen from the regression result that, given the growth of labour andproductive capital, a state with better network development should bebetter off in terms of growth of gross output. For every 0.18 per centincrease in e-readiness across states, the increase in output per capita is 1per cent. This shows that a small improvement in e-readiness results in alarge improvement in output. However, e-readiness is a composite indexand states with a higher level of e-readiness are also those with a higherlevel of development (see section below on poverty and e-readiness).However, some of the backward states such as Bihar and Uttar Pradeshhave improved their e-readiness significantly over the period 2004-2008

44 INDIA EMERGING • VEENA JHA
and have also seen an improvement in their growth rates (DIT andNCAER, 2010). A surprising outlier is Rajasthan which has remainednearly stagnant in its position in the e-readiness index but has seen highrates of growth.
Table 1.1
Definitions
‘Pop’ Population of the state
‘GrOp’ Gross output
‘PrCap’ Productive capital
‘Lab’ Number of workers
‘Dum’ Dummy variable=1 if the state falls in the category of network developed asE-readiness; otherwise= 0
Lit Literacy rate
Table 1.2
Regressing Growth in Output Per Capita with Dummy of E-ReadinessDependent Variable: Log of (GrOp/Pop)
Explanatory Variables:
Log(PrCap/Pop) 0.74***(0.051)
Log(Lab/Pop) 0.39***(0.06)
Dum 0.18**(0.08)
Lit -0.69(0.42)
R-sqr 0.98
F-stat (4, 26) 583.93***
Observations 31

45ROLE OF ICTS AND ITS TRICKLE-DOWN EFFECTS ON INDIA’S ECONOMIC. . .
Table 1.3
Summary of Variables
Var: ‘GrOp/Pop’ No. of States Mean Std.
Aggregate 31 1.04 3.41
Network developed states 15 0.32 0.32
Network less-developed states 16 1.7 4.7
Var: ‘Lab/ Pop’ No. of States Mean Std
Aggregate 31 0.03 0.08
Network developed states 15 0.01 0.009
Network less-developed states 16 0.04 0.12
Var: ‘PrCap/Pop’ No. of States Mean Std
Aggregate 31 0.36 1.10
Network developed states 15 0.12 0.12
Network less-developed states 16 0.58 1.51
Var: ‘Lit’ No. of States Mean Std
Aggregate 31 0.69 0.09
Network developed states 15 0.72 0.09
Network less-developed states 16 0.66 0.09
The relationship between ICT and the structure of the economy iscrucial to understand the channels through which such an indirect effecttakes place as well as how strong such an impact will be. As the use of ICTtakes different intensities according to the sectors in which it is applied, agiven increase in ICT investment will generate a different impact accordingto the presence in the economy of sectors in which ICT can be bettercombined with other factors and/or in which organisational improvementscan be more easily introduced. For example business services are intensiveICT users, therefore, a widespread presence of such services in the economyenhances the impact of ICT on performance. Thus again in the Indian case,it is to be expected that higher the exposure to ITES in a state, the higherwould be the overall productivity of both agriculture and manufacturing aswell as services. At the same time, in these states the share of services in thestate domestic product (SDP) would be expected to be high.
While conjectures on the efficiency introduced by ICT in the operatingenvironment are high, a concrete example which illustrates the role of ICTis that of Reliance Industries. Reliance Industries, a firm mostly engaged inchemical production and distribution, is a company actively involved in

46 INDIA EMERGING • VEENA JHA
building a fiberoptic network linking major Indian cities. This company, inaddition, expects that the internet will become a primary mechanism toimprove operations, and it already has in place an internet-readycommunications and control system. But, much of the system today usesleased telephone lines, not yet the internet. For example, of the company’s20,000-odd customers around India, 3,000-4,000 are major buyers,accounting for perhaps 75 per cent or more of total sales. These majorcustomers for chemicals are now linked electronically to an internet-basedmarket exchange introduced by Reliance, one of several now existing in thecountry. In addition, through leased-line facilities, customers can processorders, and Reliance can deliver despatching details, better manageinventory, carry out invoicing, and provide technical service, all doneelectronically. This customer network will be transferred to the internet atthe earliest possible moment, since the internet should providesubstantially lower operational costs (Aisbett et al., 2008).
To provide some measure of the benefits already apparent from thissystem, Reliance has been able to reduce receivables from 310 days to 90days, only one area of savings. Cost improvements come primarily from ageneral tightening and acceleration of processing within the company andbetween the firm and its customers. Savings do not occur as a result ofreducing manpower. In addition, the speed of order delivery has beenimproved greatly and inventories reduced in a system that is nowintegrated into the firm’s overall management control function that linksnot only important customers but also over 50 of the company’s ownoperations. These results for Reliance are similar in nature to costreductions experienced by companies in industrial parts of the world, eventhough, thus far, the internet has not been much utilised. One mightanticipate even greater savings in India, as compared with moreindustrialised countries, since operational efficiency prior to theintroduction of electronic controls is likely to have been far lower thancomparable figures for companies in the developed world (Aisbett et al.,2008).
‘As an efficiency and productivity enhancer, the IT/ITES sector alsostimulates many other sectors,’ said Kiran Karnik, the past president ofNASSCOM. ‘Besides nurturing and encouraging start-up companies and

47ROLE OF ICTS AND ITS TRICKLE-DOWN EFFECTS ON INDIA’S ECONOMIC. . .
small and medium-scale enterprises, the sector has collectively taken somevery useful steps in areas of data security, certification, and promotion ofnew locations, creation of angel funds, mentoring for start-ups, as well asidentifying and promoting new areas for the industry ’s growth andstimulating the domestic market’ (Basu, 2008).
ICT and Poverty
Modelling ICT and PModelling ICT and PModelling ICT and PModelling ICT and PModelling ICT and Povertyovertyovertyovertyoverty
The effects of ICT on poverty alleviation can be examined on a macrobasis by examining the e-readiness of a state and its poverty rate. Using amultivariate regression analysis and the e-readiness, the significance ofnetwork development of states (e-readiness) upon their poverty level can beassessed. The information used is from 2000/2008. Thirty data points onIndian states have been identified. The dependent variable is proportion ofpeople below poverty level in that particular state. On the other hand, theexplanatory variables are growth of gross state domestic product, growth ofinformal sector assets and a dummy variable on the basis of networkdevelopment situation of the state. The policy variable is the dummyvariable on network development. Following the E-readiness Report 2008,the dummy is 1 if network development of the state is either ‘leaders’,‘aspiring leaders’, ‘expectants’. Otherwise 0, if the state is in the category of‘average achievers’, ‘below average achievers’ or ‘least achievers’.
The equation therefore used is:
Poverty of ith state= F(e-readiness of state i, GSDP of state i, assetstructure of state i)
The result indicates that irrespective of growth of GSDP and evengrowth of assets, a state, with better network development (when dummy isequal to 1), should have a lower proportion of poor people.
Both variables, i.e., dummy variable and asset-growth is significant at1 per cent level. The explanatory variables explain around 40 per cent oftotal variation. The root MSE reflects the presence of small residuals in thisregression.
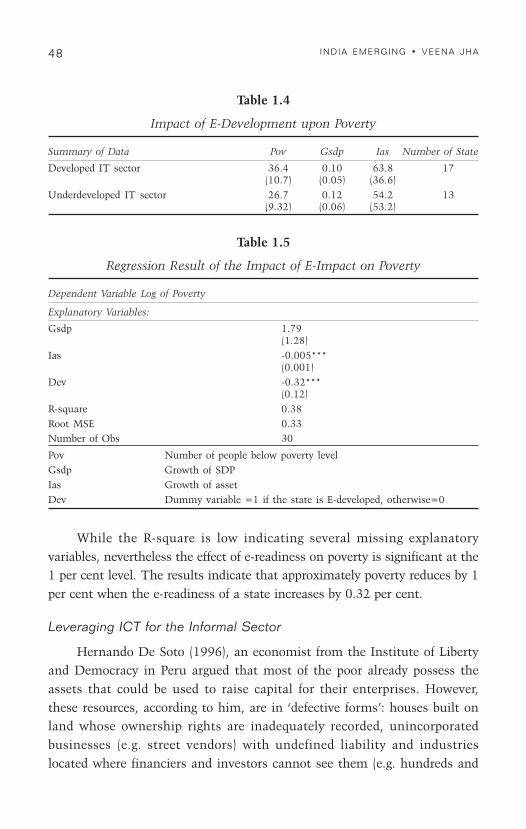
48 INDIA EMERGING • VEENA JHA
Table 1.4
Impact of E-Development upon Poverty
Summary of Data Pov Gsdp Ias Number of State
Developed IT sector 36.4 0.10 63.8 17(10.7) (0.05) (36.6)
Underdeveloped IT sector 26.7 0.12 54.2 13(9.32) (0.06) (53.2)
Table 1.5
Regression Result of the Impact of E-Impact on Poverty
Dependent Variable Log of Poverty
Explanatory Variables:
Gsdp 1.79(1.28)
Ias -0.005***(0.001)
Dev -0.32***(0.12)
R-square 0.38Root MSE 0.33Number of Obs 30
Pov Number of people below poverty levelGsdp Growth of SDPIas Growth of assetDev Dummy variable =1 if the state is E-developed, otherwise=0
While the R-square is low indicating several missing explanatoryvariables, nevertheless the effect of e-readiness on poverty is significant at the1 per cent level. The results indicate that approximately poverty reduces by 1per cent when the e-readiness of a state increases by 0.32 per cent.
Leveraging ICT for the Informal Sector
Hernando De Soto (1996), an economist from the Institute of Libertyand Democracy in Peru argued that most of the poor already possess theassets that could be used to raise capital for their enterprises. However,these resources, according to him, are in ‘defective forms’: houses built onland whose ownership rights are inadequately recorded, unincorporatedbusinesses (e.g. street vendors) with undefined liability and industrieslocated where financiers and investors cannot see them (e.g. hundreds and

49ROLE OF ICTS AND ITS TRICKLE-DOWN EFFECTS ON INDIA’S ECONOMIC. . .
thousands of village enterprises). Because the rights to these possessionsare not adequately documented, they cannot be traded outside of thenarrow local circles (where all transactions are based on trust), cannot beused as collateral for a loan and cannot be used as a share againstinvestment.
Can IT Help Capitalise these Assets?
Needless to say, creating a system to record these assets presents anenormous challenge in a country like India. This is where the power of ITcan be leveraged to organise information. For instance, capturing propertyownership in an urban area in a database would be the first step togenerating house ownership deeds. Once this is in place, a shopkeeper,armed with asset ownership documents for their house as well as the shop,can raise capital to expand their business. Likewise, in principle, in therural areas, a small farmer, with their ownership documents, can apply forloans at the local bank instead of having to resort to the localmoneylenders.
Here, it is important to recognise that capital formation is not justrestricted to supply of funds (as is normally thought). It is just as importantto provide the businesses the ways and means to absorb the funds. Intoday ’s India, small businesses obtain capital—but that is primarilythrough local lenders—at prohibitively high interest rates, which is in turn,a reflection of the risk level of the investment. By contrast, a loan backedby a properly documented asset as collateral, would significantly reduce riskand consequently, prove to be less of a burden on the borrower.
The following example shows an estimate of the level of capital‘locked’ in India. The rural areas used for productive purposes (croplandsand grasslands) in India total up to about 30 per cent of the total area (aconservative estimate, given that 60 per cent of India lives in rural areas).Assuming that 40 per cent of this land is used on an ‘informal’ basis—i.e.,no formal ownership deeds exist—(with 75 per cent being used for cropcultivation and 25 per cent for grasslands), approximately 30,000 hectaresare used for agriculture and 10,000 hectares are used as grasslands. Puttinga notional price of US $ 3/sq ft for croplands and US $1/sq ft for grasslands(in reality, the value would be much higher); there would be US $15 billioninformal assets in rural India (Rupanagunta, 2004).

50 INDIA EMERGING • VEENA JHA
In case of urban areas, the results are even starker. In India, around400 million people live in urban areas. Assuming an average occupancyrate of five people per house, there are around 80 million urban dwellings.Of these, around 85 per cent are ‘informal’ dwellings (built in an ‘extra-legal’ framework—i.e., in violation of land laws; without proper ownershipdocuments; in violation of legal requirements—which usually means thatthe dwelling is improperly valued). This is obvious to anyone who has beento any Indian town or city. Assuming an average urban dwelling size of 200sq ft, and putting a notional value of US $5/sq ft (it should be noted thatboth the dwelling size and the value would be higher than what has beenused here); there are US $68 billion informal sector assets in urban India.1
Formalising a mere 20 per cent of the informal assets would create thepotential of injecting over US $17 billion into the Indian economy.
Thus, this adds up to a whopping figure of US $83 billion of informalassets in India—assets which cannot be put to productive use because theGovernment of India does not have the necessary systems in place toformally capture this information. To put this in perspective, the total FDIto India in 2008 was a mere $15 billion.
However, it is necessary to sound a word of caution on the ICTeuphoria especially for grassroot project in India. The propositions listedbelow (Keniston, 2002) derive from an ongoing study of grassroot ICTprojects in India:
a) Projects may be more hyped up than is warranted and may oftenbe late.
b) Unexpected difficulties may arise. For example the computerisationof land records may be difficult because half of the records may belegally contested or in the names of dead people or be otherwiseineligible.
c) The goal of financial sustainability may be difficult to achieve.
d) IT should not be simply identified with computers and internet.Some of the most inventive uses of IT involve radio, television,and embedded chips, potentially useful satellite inventories, etc.
1. Calculations of the author.
51ROLE OF ICTS AND ITS TRICKLE-DOWN EFFECTS ON INDIA’S ECONOMIC. . .
The classic example is the use of automated butterfat assessmentequipment in Gujarat, which has radically simplified the process ofevaluating milk and paying dairy farmers.
e) Top-down projects simply do not work as they may involvecomprehensible level of technical detail and terminology, or in aliterary language that local people do not understand. Providinginformation in local languages has proved a challenge so far. Also,development of locally relevant content is essential.
f) E-governance has proved difficult and costly to implement and hasfaced resistance from middlemen.
g) E-commerce in terms of customer-to-business online buying withinIndia, is probably many years away for a majority of Indians.
h) Commercially funded ICT networks have considerable promise.Several examples were cited above.
i) While there are several grassroot projects in India, the agents arenot usually in touch with each other, rarely publish or writeanything about what they are doing, and—if they are publicofficials—are constantly transferred. There is little accumulation ofknowledge, not even the most preliminary kinds of on-the-siteevaluation. So, there is little possibility of learning from thesuccesses or failures of other projects.
Finally, there is the question of whether the IT and ITES sector offersthe most productive deployment of skilled human resources at the nationallevel. Many of the call centre and back office workers in India areoverqualified for their jobs. College graduates, chartered accountants,MBAs and engineers are at work answering customer questions during oddhours—the same jobs are held by high school graduates in the West.Although these jobs pay relatively high wages and provide employmentopportunities for new graduates, the opportunity costs of such employmentfrom a societal viewpoint may be high. There is evidence that the annualchurn rate is reaching 40-50 per cent for call centre jobs (Konana et al.,2004). There is increased dissatisfaction with the type of work and there isno clear path for personal development that matches the qualifications ofthe workers. These skilled employees may contribute more strongly to

52 INDIA EMERGING • VEENA JHA
economic development in a broad sense if they were encouraged to beentrepreneurs or focussed their energies on the infrastructure and coremanufacturing sectors.
The IT industry growth has shown an overwhelmingly urban bias.Much of the rural and small town India has been bypassed by this boom.Even within the urban centres, the growth has been largely restricted to thesmall segment of the population with college degrees, which itself comesfrom the middle and upper middle classes. To be sure, the very nature ofthe IT industry demands an urban concentration and job creation forcollege graduates.
At least in the short run, IT may not play a pivotal role in promotingan equitable development process. But it is indeed possible to harness thepower of technology to release resources, which can then be channelled intofinancing public welfare projects. IT is essentially an enabler of knowledgemanagement, i.e., effective capture and efficient dissemination ofinformation. While it might sound a little presumptuous to talk ofinformation organisation in a society which is still unable to provide basicpublic services to the population, there is growing awareness that IT can beleveraged to harness the ‘knowledge capital’ that abounds across thecountry. This in turn can play an important catalytic role in thedevelopment process.
III
Multiplier Effects of IT and ITES
Apart from directly contributing to the growth of the economy, the IT-ITES sector also generates ‘derived’ demand for a wide variety of goods andservices such as transport for ferrying employees from their workforce,onsite catering, security and health care services in a 24x7 businessenvironment through backward linkages. Further, it can also be arguedthat, to the extent that the IT-ITES sector is generating employment for alarge number at wages that they could not aspire to earn in any otheremployment avenue, it is adding significantly to aggregate disposableincome. This, in turn, stimulates consumer demand for a wide range ofgoods and services, which could not otherwise manifest (Gokarn et al.,2007).

53ROLE OF ICTS AND ITS TRICKLE-DOWN EFFECTS ON INDIA’S ECONOMIC. . .
FFFFFindings on Output and Employment Multipliersindings on Output and Employment Multipliersindings on Output and Employment Multipliersindings on Output and Employment Multipliersindings on Output and Employment Multipliers
In 2005-06, of the total turnover of US $30 billion, the IT-ITES sectorspent 46 per cent on salaries and wages, 28 per cent on non-wage operatingexpenses and had an operating margin of 26 per cent. A part of thisturnover got spent in the domestic economy, and through forward andbackward linkages affected other sectors as well. A study estimates that ofthe total turnover roughly half was spent in the domestic economy via non-wage operating expenses, capital expenditure and consumption spending byprofessionals. This spending, in turn, generated an additional output of US$15 billion via its direct and indirect backward linkages with other sectorsand induced effect of wages and salaries. In 2005-06, IT-ITES employeesspent US $6 billion on domestic consumption. Of the total, the maximumspending was housing related (26 per cent of gross income) followed by fooditems, durable goods and holidays. Consumption spending generated anadditional output of US $7 billion. Thus, the output multiplier works out toabout 2 (Gokarn et al., 2007).
IT-ITES spending on other sectors and its multiplier effect generatedadditional employment. While the IT-ITES sector provided directemployment to 1.3 million people, it created additional employment for5.2 million people. Thus, for each person employed in the IT-ITES sector,around four people were employed in rest of the economy. Among thevarious consumption categories, spending on housing/construction, fooditems, clothing, outdoor eating/holidays induce maximum employment.The above approach to the computation of output and employment effectsof IT-ITES activity would be perfectly valid in a scenario of unlimitedsupply of human capital. In the current scenario, this may not be areasonable assumption. It can be argued that large scale hiring by the IT-ITES sector is drawing people away from other employment opportunitiesby offering higher salaries. In other words, in the absence of the IT/ITESsector, these people would have still found employment given their skillsets, but perhaps not at the high salaries offered by the IT-ITES sector.Thus, the kick to the economy arises essentially from the differential betweenthe salary of an IT-ITES professional, and his salary in other avenues ofemployment.

54 INDIA EMERGING • VEENA JHA
The average salary of an IT-ITES professional was over US $15,000per annum in 2005-06. Based on this, two scenarios were created in aCRISIL-NASSCOM study (NASSCOM-CRISIL, 2007): in the first scenario,the difference between the wage rates of an IT-ITES professional and hissalary in other job avenues was estimated at US $5,000; in the secondscenario, this difference was US $2,500. Under these assumptions, theadditional employment generated was found to be 3.2-3.6 million. Withreference to these simulations, it needs to be emphasised that, if the supplyof human capital to the sector were, in fact, unlimited, the aggregateindirect impact would be larger, because it would not be coming at theexpense of activity in some other sector. Expanding the capacity of theeducational system, to provide the necessary skills, clearly has a role toplay here.
A survey by CRISIL of some of the service providers to the IT-ITESsector revealed that services such as catering, transport and housekeeping,security and technology had received a boost from the IT-ITES sector. IT-ITES was increasing its share in the turnover of these service providers.Further, all these services, require low skilled/educated workforce. Of thetotal workforce that provided these services to the IT-ITES sector, the shareof unskilled workers was 72-78 per cent. Thus, the IT-ITES sector providesemployment to low skilled/educated workers as well.
Much of the success achieved by the sector has been attributed to themeteoric growth in exports. Obviously, the backward and forward linkageswould be much higher if the IT sector had a significant domesticcomponent. While the domestic IT sector is not as large as exports, it isnevertheless becoming important.
Domestic IT SerDomestic IT SerDomestic IT SerDomestic IT SerDomestic IT Services Market Opportunityvices Market Opportunityvices Market Opportunityvices Market Opportunityvices Market Opportunity
Domestic demand for IT in India is witnessing a gradualtransformation from being predominantly hardware driven towards asolutions oriented approach—resulting in a growing emphasis on services.In fact, revenue growth in the services segment alone has reported fastergrowth than that for the overall domestic IT market (including hardware,software and services) over the past few years. As depicted in Figure 1.1,this trend is expected to continue over the forecast period.

55ROLE OF ICTS AND ITS TRICKLE-DOWN EFFECTS ON INDIA’S ECONOMIC. . .
Figure 1.1
Growth of IT Spending in India
Source: NASSCOM-IDC (2006).
The liberalisation of Indian economic policy, deregulation of keysectors and progressive moves towards further integrating India with theglobal economy has been a key driver of increased IT adoption in thecountry. This is best reflected in the fact that most indigeneous players intelecom and banking, two key sectors with significant multinationalcorporation (MNC) participation, have significantly upgraded their levels ofIT adoption to offer best-in-class services comparable to those offered bythe global competition and these two sectors together account forapproximately 35-40 per cent of the domestic spend on IT services.
Table 1.6
Five-Year Revenue Forecasts for Key Service Lines in the Domestic Market(INR million)
Breakups 2004 2005 2006 2007 2008 2009 CAGR(%)
IT consulting 4,784 5,669 6,775 7,774 9,109 10,674 17.4System integration 34,011 42,979 51,900 62,065 72,960 85,399 20.2Application development 13,997 17,115 19,852 22,586 25,113 27,924 14.8End-to-end outsourcing 6,328 8,221 10,247 12,343 14,344 16,850 21.6Discrete outsourcing 16,731 21,055 25,819 31,401 36,262 41,509 19.9Deploy and support 23,631 28,321 32,907 37,651 42,510 48,186 15.3IT education and training 4,126 4,879 5,609 6,534 7,260 8,067 14.3Grand total 103,606 128,239 153,109 180,354 207,559 238,607 18.2
Source: NASSCOM-IDC (2006).
100000
80000
60000
40000
20000
2003 2004
17.0
23.0 23.3 25
20
15
10
5
0
18.116.6
13.7
2005 2006 2007 2008 20090
Rs
cror
e 14.8
Others Hardware Software Services Growth
Per
cen
t

56 INDIA EMERGING • VEENA JHA
Similar competitive pressures in other more recently deregulatedservice sectors such as airlines and insurance, and the uptake in themanufacturing and industrial sectors; and the several large e-governanceinitiatives launched by the government under the National E-GovernancePlan (NEGP) are expected to provide sustained growth in domestic demandfor IT services over the next few years.
Box 1.2
According to Gartner ’s Senior Research Analyst ‘India’s domestic IT servicesmarket is expected to see a CAGR of 16 per cent by 2014, which would make thatmarket worth $13.6 billion.’
Further large government spending in areas such as e-governance is expected todrive IT services market in the country. Higher consumer spending would boosteconomic growth, which in turn is expected to increase the demand for IT services.
Source: “Domestic IT Spending to Drive IT Services Biz”, http://www.deccanherald.com/content/107218/domestic-spending-drive-services-biz.html
Systems integration and network integration make up a high growth-large size category within the IT services engagements. These services willcontinue to be prime drivers of the domestic IT services market in theenterprise segment due to the increasing growth in the enterpriseapplication implementation and increased demand for network integrationfrom telecom & banking verticals.
Figure 1.2
Domestic IT Services Revenues by Key Vertical Markets (2004)
Source: NASSCOM-IDC (2006).
Others8%
Financial services
31%
Retail and wholesale1%
Communications and education
17%
Government and education
14%
Manufacturing29%

57ROLE OF ICTS AND ITS TRICKLE-DOWN EFFECTS ON INDIA’S ECONOMIC. . .
The financial services, communications and media andmanufacturing verticals accounted for over 3/4th of the revenues earned byservice providers in the domestic IT services market in 2004.
It is estimated that in-house spending on IT services (including trainingcosts, salaries of in-house IT staff and associated overheads) still accounts formore than half of the corporate IT spend in India, while the outsourced/vendor addressed spends account for just 45 per cent of the total.
Domestic ITES-BPO Market Opportunity
ITES-BPO is a very nascent segment of the domestic market, drivenby voice-based services with customer care and sales and marketing activityaccounting for approximately 70 per cent of the total.
Table 1.7
Comparison of the Vendor Addressed Market and the In-HouseSpend by Key Services
(INR million)
Breakups 2004: 2005: Total Vendor AddressedVendor In-House Team Market Market as %
Addressed Addressed of Total MarketMarket Market
IT consulting 4,784 11,163 15,947 30System integration 34,011 34,011 68,022 50Application development 13,997 20,995 34,992 40End-to-end outsourcing 6,328 N.A. 6,328 100Discrete outsourcing 16,731 25,096 41,827 40Deploy and support 23,631 23,631 47,262 50IT education and training 4,126 9,628 13,754 30Grand total 103,608 124,524 228,132 45
Source: NASSCOM-IDC (2006).
Table 1.8
Domestic ITES-BPO Revenues(INR million)
2004 2005 2006
HR 2,428.9 4,412.5 8,019.5F&A 2,563.9 2,975.4 3,454.1Customer care 7,696.1 16,161.8 33,939.7Sales & marketing 8,465.2 12,019.6 17,756.4Other 2,059.2 2,449.4 2,914.6Total 23,213.3 38,018.6 66,084.4
Source: NASSCOM-IDC (2006).

58 INDIA EMERGING • VEENA JHA
Currently, banking and financial services and telecom verticalsaccount for over 70 per cent of the demand for ITES-BPO services in thedomestic market (See Table 1.9).
While cost savings have been the primary driver of offshoreoutsourcing, vendors do not have comparable differences in labour costs toleverage while serving the domestic market. As a result, the primarymotivation for the domestic market, in its early years of evolution were notcost savings but access to specialist skills and freeing client resources tofocus on the core business. Scalability and process efficiency is expected toreturn some degree of cost savings in the domestic market as well.However, this may not compare with the levels achieved by overseas (e.g.US/UK) clients.
Table 1.9
Domestic ITES-BPO Revenues by Vertical Market (2004)
Verticals % Share Typical Processes Outsourced(2004)
Banking and financial services 47.4 Customer support, marketing and sales,collections, billing, transaction processing,market analytics, HR
Telecom 24.1 Customer support, cross-selling, loanprocessing, claim processing, market analytics,data validation, HR
Manufacturing (customer 12.2 Customer support, sales and marketing,durables/automoblies) transportation, supply chain management,
accounts payable/receiveable
Others (IT-ITES, aviation, 16.4 HR, customer support, marketing and sales,hospitality, retail) billing, transaction processing, analytics, etc.
Source: NASSCOM-IDC (2006).
Effects of the Global Meltdown on India’s IT Sector
Given the large role of IT and ITES in the Indian economy includingin poverty alleviation, there is justifiable concern about the effects of globalmeltdown on the Indian economy. Much is being assumed on the possibleeffects of slowdown in the US economy on the IT and BPO industry.
The annual growth of the IT and ITES industry plunged to 6 per centin 2009-10, after recording a cumulative growth of 25-30 per cent duringthe previous four years. The industry returned to double-digit growth in

59ROLE OF ICTS AND ITS TRICKLE-DOWN EFFECTS ON INDIA’S ECONOMIC. . .
2010-11 due to renewed investments by global firms across verticals in ITinfrastructure, software and back office services.2
NASSCOM has projected $56-57 billion or 13-15 per cent year-on-year(YoY) growth from exports and 15-17 per cent YoY growth in domesticmarket in the fiscal year 2010-11.3 Sustaining growth in 2011 would dependon Europe’s recovery. Sovereign debt fallout in any country, as happened inthe case of Greece would have a domino effect on the global economy, whichin turn would impact the IT industry.4 The global financial crisis and techmeltdown however changed the strategy of the Indian IT industry.
To sustain the growth momentum and make optimal use of theirresources, even export-oriented firms like TCS, Infosys, Wipro and HCLturned to domestic market. As shown above, state-run organisations andgovernments across the country have decided to enhance their investmentsin IT infrastructure, products and services for the benefit of its people.
Buoyed by increased tech spending in the private and public sectors,the industry has been gearing up to offer its services in new areas such asengineering services and product development. The industry is thus usingits global presence to service the domestic market effectively. Whiledomestic market still accounts for only one-fourth of the total market, itsgrowth rate is higher than that of international markets.
With 450 delivery centres in 60 countries worldwide, the Indian ITindustry has an unparalleled global value chain. The industry has resumedenhancing its global workforce, hiring specialised talent in developedmarkets and building a truly global delivery model.5
However, hiring by the IT sector moved to fourth place in 2009 fromfirst place in 2005 in the Indian economy. Additional hiring by the ITsector was only 33,000 in 2009 compared to 60,000 in 2005.6 For raising
2. “Buoyant Indian IT Industry Rebounds but Remains Cautious”, 30 December 2010.http://economictimes.indiatimes.com/infotech/ites/buoyant-indian-it-industry-rebounds-but-remains-cautious/articleshow/7190235.cms
3. Ibid.4. Ibid.5. Ibid.6. “IT/ITes is no hot sector for job seekers post meltdown”, September 15, 2010, http:/
/www.hindustantimes.com/tabloid-news/sectorsbpos/IT-ITes-is-no-hot-sector-for-job-seekers-post-meltdown/Article1-600521.aspx

60 INDIA EMERGING • VEENA JHA
human capital, besides the big firms jointly offering about 100,000 jobs in2010/11 to build capacity in anticipation of better growth in (2011-12),small and medium business too have resumed hiring to meet the demandfor ICT services and products.7
As a top outsourcing destination and back office operations hub, Indiadominates the global IT services market with 51 per cent share (Nasscom,2010).
IV
Mobile Telephony and its Trickle Down
Earlier studies on economic growth and the increase in mobiletelephony (Waverman et al., 2005a) show that mobile telephony has apositive and significant impact on economic growth, and this impact maybe twice as large in developing countries compared to developed countries.This result is largely attributed to the fact that in developing countries thegrowth dividend is far larger because mobile phones provide, by and large,the main communications networks; hence they supplant the information-gathering role of fixed-line systems. It has been estimated that a mobilenetwork costs 50 per cent less per connection than fixed lines and can berolled out appreciably faster.8 The cost advantages of mobile phones as adevelopment tool consist not only of the lower costs per subscriber but alsothe smaller scale economies and greater modularity of mobile systems. Astudy by the London Business School has also found that, in a typicaldeveloping country, an increase of 10 mobile phones per 100 people wouldboost GDP growth by 0.6 percentage points (Waverman, 2005).
A study by Waverman et al. (2005b) shows that:
• Differences in the penetration and diffusion of mobile telephonyexplains some of the differences in growth rates betweendeveloping countries. If gaps in mobile telecoms penetration
7. Ibid.
8. “Africa: The Impact of Mobile Phones, Moving the Debate Forward”, The VodafonePolicy Paper Series 3, March 2005. http://mobileactive.org/files/file_uploads/AfricaImpactOfMobilePhones.pdf

61ROLE OF ICTS AND ITS TRICKLE-DOWN EFFECTS ON INDIA’S ECONOMIC. . .
between countries persist, then their results suggest that this gapwill feed into a significant difference in their growth rates infuture.
• As Romer (1986) and Barro (1991) hypothesised for human capitalstocks, there are also increasing returns to the endowment oftelecoms capital (as measured by the telecoms penetration rate).
• Given the speed with which mobile telecoms have spread indeveloping nations, it is unlikely that large gaps in penetration willpersist forever. However, differences in the speed of adoption willaffect the speed with which poor countries converge to richcountries’ level.
The main contribution of mobile telephony in alleviating poverty inIndia has been to extend connectivity to rural areas and for the urban poor.Focussing on extending telecommunications services to rural areas andurban slums should in principle help alleviate poverty, encourage economicand social growth and overcome a perceived ‘digital divide’. However,relatively little is known about how the poor benefit from moderntelecommunications services and what impact it is having on their livesand livelihoods.
To answer this question it is essential to ascertain the importance ofinformation in the livelihood opportunities for the poor. The next questionthat needs to be asked is whether mobile telephony is the most appropriateand effective delivery mechanism for that information? Indian telecommarket has been growing at approximately 30 per cent since 1995 and stillgrowing strong. The high growth of the Indian telecom market can mainly beattributed to mobile services which have grown by more than 117 per centduring the period 1995-2009. With additions of more than 14 millionsubscribers per month in the year 2009, the telecom subscriber basehad grown to 601 million in April 2010, second only to China(PricewaterhouseCoopers, 2010).
An examination of the perceived correlation between GDP per capitaand mobile penetration across Indian states would help to assess the outputeffects of mobiles and its operation as a GPT.

62 INDIA EMERGING • VEENA JHA
Mobiles as a GPTMobiles as a GPTMobiles as a GPTMobiles as a GPTMobiles as a GPT
Table 1.10
Analysis of the Impact of Density of Mobile Users upon Gross Output
Name of Variables:Short name VariablesPrc Productive capitalLab Number of employeesGOp Gross outputMous Density of mobile users, per 100*** Significant at 1 per cent level
The test design is to understand the impact of density of mobile usersupon gross output in the respective state. The policy variable here is thedensity of mobile users per 100 (Mous in the regression below). Themethodology used for examining the effects of mobile density on grossoutput is the use of panel data analysis (Table 1.14). Both fixed effects andrandom effects have been ascertained. The fixed effect model incorporatesstate-specific constants such as labour and productive capital. The randomeffect model assumes state-specific characters are random, rather thanfixed. In both models, the impact of ‘Mous’ on gross output in the state ispositive and significant at 1 per cent. However, following Hausmanspecification test, the fixed effect result is accepted, which is consistentwith the random effects. The other variables are also significant at 1 percent level. The F-test and Chi2 test indicate that the model is significant at1 per cent level, for fixed and as well as random effect, respectively.
Table 1.11
Summary of Variables
Variables Mean Std Dev
Prc 2941174 2995702Lab 416258 359985GOp 6400852 6918613Mous 3.53 6.20
In addition, Table 1.9 presents the picture of states regarding base andgrowth of density of mobile users. It can be seen that density of mobile usersin different states is quite diversified. From the table, we can differentiatestates, according to high-base—low-growth (e.g. Delhi), low-base—low-growth (Uttar Pradesh), and low-base—high-growth states (Assam, J&K).

63ROLE OF ICTS AND ITS TRICKLE-DOWN EFFECTS ON INDIA’S ECONOMIC. . .
Table 1.10 presents the differences between the states having higherand lower density mobile users. In each group there are nine states. It canbe seen that states having higher density in mobile users also have higherlevel of gross output, employees and productive capital and vice-versa.
Table 1.12
List of Average of Density of Mobile Users (per 100) in MajorStates during 2001 to 2004
States Average Density of Mobile Average Growth of DensityUsers, per 100 of Mobile Users
Andhra Pradesh 2.81 0.978Assam 0.25 33Bihar 0.56 1.24Delhi 22.5 0.744Gujarat 4.05 1.09Haryana 2.50 34Himachal Pradesh 2.42 1.51Jammu & Kashmir 0.50 66.3Karnataka 3.47 1.16Kerala 4.25 1.1Madhya Pradesh 1.13 0.97Maharashtra 4.25 1.11Orrisa 0.75 33.3Punjab 7.62 1.19Rajasthan 1.50 33.5Tamil Nadu 3.49 1.14Uttar Pradesh 0.01 0.0West Bengal 1.46 1.13
Source: LIRNEasia (2006).
Table 1.13
Average Difference between States Having Higher andLower Density of Mobile Users: ‘t’ Test
Variables Lower Density No. of Higher Density No. of ‘t’ TestStates States States States
Prc 1527059 9 4355289 9 -4.52***(199148.1) (593094.4)
Lab 211757 9 620758 9 -5.83***(32108) (62302)
GOp 3012378 9 9789326 9 -4.74***(458809) (135302)
Source: LIRNEasia (2006).

64 INDIA EMERGING • VEENA JHA
Table 1.14
Panel-Regression ResultsDependent Variable: Log of GOp
Explanatory Variables Fixed Effect Model Random Effect Model
Log of (Prc) 0.78*** 0.65***(0.11) (0.07)
Log of (Lab) 0.72*** 0.35***(0.25) (0.08)
Log of (Mous) 0.04*** 0.05***(0.01) (0.009)
R-sq within 0.84 0.83
F(3,51) 89.6*** -
Wald Chi2 (3) - 885.22***
Number of states 18 18
Hausman specification test 13.65***
Figures 1.3 and 1.4 present the picture that emerges from the aboveregression, i.e., as the linear predictive rate of mobile penetration increases,the gross output also increases, for that state.
Figure 1.3
Log of Gross Output versus Linear Prediction: For Year 2001
Jammu & Kashmir
BiharHimachal Pradesh
Assam
Delhi
Orissa
KeralaRajasthan
Madhya PradeshHaryana
PunjabWest Bengal
Uttar Pradesh
KarnatakaAndhra Pradesh
Tamil Nadu
GujaratMaharashtra
12
13
14
15
16
17
lgro
p1
10 12 14 16 18Linear prediction

65ROLE OF ICTS AND ITS TRICKLE-DOWN EFFECTS ON INDIA’S ECONOMIC. . .
Figure 1.4
Log of Gross Output versus Linear Prediction: For Year 2004
The effects of mobile penetration in high growth states is to beexpected, as all other factors go in their favour. Thus the effects of mobilegrowth rates on Maharashtra, Tamil Nadu, Karnataka or Andhra Pradeshare not surprising. However, the fact that Uttar Pradesh, Madhya Pradeshand Rajasthan show greater effects of mobile penetration on gross outputthan Delhi is an indication of the effects of mobile on gross output growth.Moreover, the effects of mobiles on gross output in Assam and Orissa, twoof the poorer states in India, are higher than that in Delhi in 2004. This isa reaffirmation of the impact that mobile penetration can have in low usagehigh mobile growth states. It also indicates that the potential of mobiles tocontribute to growth probably reaches a plateaux with a penetration of 97per cent as is the case with Delhi. It is possible that a major technologicalleap may be required at this level for mobile telephony to yield higher grossoutput benefits. It is also possible that at such high levels of mobile density,the quality of services start falling and service provision deteriorates. Thiscould in part account for the plateaux in the contribution of mobilepenetration to gross output growth in Delhi.
Another important observation from the above figure is that at lowerlevels of teledensity, the contribution of improved teledensity to outputincreases more than proportionately. The lowest levels of teledensity arethose of Bihar, Uttar Pradesh, Orissa and Assam and these states show
Jammu & Kashmir
BiharHimachal Pradesh
DelhiAssam Orissa
Kerala
Madhya Pradesh
RajasthanPunjab
HaryanaWest Bengal
Uttar Pradesh
KarnatakaAndhra Pradesh
Tamil Nadu
Gujarat
Maharashtra
13
14
15
16
17
lgro
p1
12 14 16 18Linear prediction
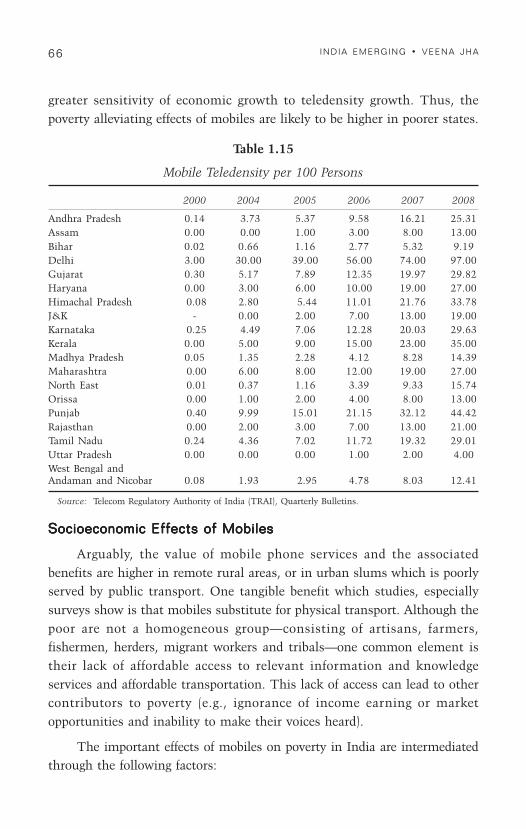
66 INDIA EMERGING • VEENA JHA
greater sensitivity of economic growth to teledensity growth. Thus, thepoverty alleviating effects of mobiles are likely to be higher in poorer states.
Table 1.15
Mobile Teledensity per 100 Persons
2000 2004 2005 2006 2007 2008
Andhra Pradesh 0.14 3.73 5.37 9.58 16.21 25.31Assam 0.00 0.00 1.00 3.00 8.00 13.00Bihar 0.02 0.66 1.16 2.77 5.32 9.19Delhi 3.00 30.00 39.00 56.00 74.00 97.00Gujarat 0.30 5.17 7.89 12.35 19.97 29.82Haryana 0.00 3.00 6.00 10.00 19.00 27.00Himachal Pradesh 0.08 2.80 5.44 11.01 21.76 33.78J&K - 0.00 2.00 7.00 13.00 19.00Karnataka 0.25 4.49 7.06 12.28 20.03 29.63Kerala 0.00 5.00 9.00 15.00 23.00 35.00Madhya Pradesh 0.05 1.35 2.28 4.12 8.28 14.39Maharashtra 0.00 6.00 8.00 12.00 19.00 27.00North East 0.01 0.37 1.16 3.39 9.33 15.74Orissa 0.00 1.00 2.00 4.00 8.00 13.00Punjab 0.40 9.99 15.01 21.15 32.12 44.42Rajasthan 0.00 2.00 3.00 7.00 13.00 21.00Tamil Nadu 0.24 4.36 7.02 11.72 19.32 29.01Uttar Pradesh 0.00 0.00 0.00 1.00 2.00 4.00West Bengal andAndaman and Nicobar 0.08 1.93 2.95 4.78 8.03 12.41
Source: Telecom Regulatory Authority of India (TRAI), Quarterly Bulletins.
Socioeconomic Effects of MobilesSocioeconomic Effects of MobilesSocioeconomic Effects of MobilesSocioeconomic Effects of MobilesSocioeconomic Effects of Mobiles
Arguably, the value of mobile phone services and the associatedbenefits are higher in remote rural areas, or in urban slums which is poorlyserved by public transport. One tangible benefit which studies, especiallysurveys show is that mobiles substitute for physical transport. Although thepoor are not a homogeneous group—consisting of artisans, farmers,fishermen, herders, migrant workers and tribals—one common element istheir lack of affordable access to relevant information and knowledgeservices and affordable transportation. This lack of access can lead to othercontributors to poverty (e.g., ignorance of income earning or marketopportunities and inability to make their voices heard).
The important effects of mobiles on poverty in India are intermediatedthrough the following factors:

67ROLE OF ICTS AND ITS TRICKLE-DOWN EFFECTS ON INDIA’S ECONOMIC. . .
a) Affordability (demand side): The Telecom Regulatory Authority ofIndia (TRAI) formulated policies which introduced competition inthe markets. These pricing models offer affordability and choice,even for very low-income customers (cheap handsets, microprepayments, top-up cards).
b) Affordability (supply side): Establishing mobile masts is a relativelyinexpensive way of serving large and remote rural areas. Thenumber of mobile towers established in the remotest locations hasshown an exponential growth in India.
c) Flexibility: It is not pricing models that are flexible—usages arealso. Mobiles can be used in the most remote areas. They can becharged at train and bus stations and car batteries can also be usedto charge them.
d) Low barriers to entry: Anyone can own a mobile. It has become themost easily accessible and ubiquitous communications device inrural areas. Easy availability of low priced new handsets with basicfeatures and emergence of secondary markets for used devices,whose prices are even lower, make them within reach for even thepoorest of the poor.
The growth of wireless phones from 2000-2008 has been phenomenalin India with the poorest states showing some of the highest growth (Table1.16). Prices declined sharply after 2004 because of the regulatoryframework and competition. The effective coverage of the network had alsoreached a state of maturity which could cover several more circles. Thusafter 2004, there has been a huge increase in most circles upwards of 500per cent.9 The highest increases were to be found in low mobile density,poor and most populous states. Thus Eastern and Western Uttar Pradesh,Bihar and Orissa saw the highest increases in mobile density over thisperiod. The effects on gross output growth in the case of Eastern andWestern Uttar Pradesh and Orissa have been higher than that of Bihar.This shows that while mobiles may increase productivity, other factorssuch as income-earning opportunities need to improve too. The increase inBihar probably is due to the high numbers of migrant labour who need tocommunicate with their hometowns and districts. While anecdotal
9. TRAI quarterly bulletins. Published by TRAI, New Delhi, India.

68 INDIA EMERGING • VEENA JHA
evidence on the productivity enhancing effects of mobiles can be foundfrom Kerala, Gujarat, Uttar Pradesh and Delhi, there is little anecdotalevidence from Bihar which indicates that income-earning opportunitiesmay not improve on account of access to mobile telephony. However, thereis a good body of anecdotal evidence which suggests that improvement inmobile networks has had a distinct impact on migration from Bihar to theservice sectors of the high growth states in India. For instance, thechauffeur networks in Delhi have benefitted from immediate access toinformation through mobiles and the numbers of Bihari chauffeurs haveincreased exponentially between 2004 and 2008.10
Table 1.16
Wireless Subscriber Base
Circle Mar-2008 Mar-2004 Mar-2000
Andhra Pradesh 20,577,632 2,911,760 105,469
Gujarat 16,968,200 2,731,856 146,175
Karnataka 17,043,556 2,455,317 127,967
Maharashtra 21,079,326 3,008,144 115,086
Tamil Nadu 18,284,050 2,103,772 90,956
Haryana 6,401,457 701,785 25,047
Kerala 11,698,216 1,681,648 106,560
Madhya Pradesh 13,192,338 1,154,014 40,544
Punjab 11,715,504 2,506,150 94,403
Rajasthan 13,586,738 917,867 20,025
Uttar Pradesh (E) 16,165,268 1,205,235 113,587
Uttar Pradesh (W) 12,887,001 1,283,705 55,950
West Bengal andAndaman & Nicobar 9,438,941 371,120 3,978
Assam 3,913,099 102,490 5,823
Bihar 11,509,688 763,048 21,901
Himachal Pradesh 2,299,811 178,835 5,048
J&K 2,201,912 47,219 -
North East 2,118,532 46,523 722
Orissa 5,180,156 398,296 9,139
Chennai 7,061,200 1,521,161 54,256
Delhi 16,280,448 4,438,309 332,330
Kolkata 7,844,469 1,286,034 90,036
Mumbai 13,631,670 3,805,705 319,309
Source: Telecom Regulatory Authority of India (TRAI), Quarterly Bulletins.
10. Author’s survey on the informal sector. See Annexure to Chapter 3.

69ROLE OF ICTS AND ITS TRICKLE-DOWN EFFECTS ON INDIA’S ECONOMIC. . .
One of the most important indicators of increased mobile usageamong the poor is reflected through increased rural teledensity. InSeptember 2008, rural teledensity in India was approximately 13 per cent,while urban was 73 per cent (PricewaterhouseCoopers, 2010). Thiscompares very favourably to less than 1 per cent rural teledensity in 2005.There is the myth that the rural poor are not able or not willing to pay formobile telecommunication services. Initially, this led to a tendency toinvest in the more affluent urban areas rather than poor rural areas butnow there are also growing rural networks. Second, there is the myth thatnatural barriers, such as lack of education or electricity, would preventmobile take-up. Strong growth in India, in spite of still prevalent difficultieswith low education, low access to electricity and low income levels has alsogone some way to refuting this theory.
Evidence from India through the increased rural teledensity indicatesthat the benefits outweigh the constraints. Yet what are these benefits?Benefits of mobile telephony have been divided into three categories in apaper by the World Bank (July 2008) (Bhavnani et al., 2008): (a) directbenefits, (b) indirect benefits, and (c) intangible benefits (e.g., disaster relief,local content, low education, social capital and cohesion).
DirDirDirDirDirect Benefitsect Benefitsect Benefitsect Benefitsect Benefits
Mobile telephony has a positive impact on the economic welfare inthe following direct ways: (a) by generating GDP, (b) by job generation (bothin the mobile industry and the wider economy), (c) productivity increases,and (d) taxation revenue (mobile operators are usually a sizeablecontributor).
Vodafone (2005) reported that, in a typical developing country, anincrease of 10 mobile phones per 100 people boosts GDP growth by 0.6 percent.11 Ovum (2006) reported that the mobile services industry contributed$7.8 billion towards GDP in India in 2004. Obviously its phenomenalgrowth since 2004 by nearly 500 per cent would imply that its GDPcontribution would be in the range of 35-40 billion dollars in 2008. Thiscompares very favourably with the revenue generation of the IT and ITES
11. http://www.telecomcircle.com/2009/01/impact-of-mobility-on-economic-growth-in-developing-countries/

70 INDIA EMERGING • VEENA JHA
sectors. Another economic impact is the employment generation of themobile telephony sector. Ovum (2006) found that the mobile telephonyindustry created about 3.6 million jobs in India, directly and indirectly.This figure is expected to increase by 30 per cent per year. This implies thatits employment in 2008 was likely to be in the range of about 6.2 million(PricewaterhouseCoopers, 2010). Again this compares very favourably withthe IT and ITES sector. Although the mobile operators themselves onlycreate limited employment, jobs they do create are highly paid and soughtafter, and there is a major knock-on effect in retail (through the sale ofairtime, handsets and SIM cards). Various measures and estimates ofproductivity gains are available in India. However, the nature of thisevidence is mostly anecdotal. Ovum (2006) reported that the mobiletelephony sector contributed Rs 145 billion ($3.6 billion) per year in importduties, licence fees, spectrum fees and taxation revenues in India. Deloitte(2007) estimated the overall taxation revenue, by segmenting the benefitinto taxation revenue from the mobile operators themselves, their supplierchain and other industry retailers. They found that in six countriesanalysed, the direct tax contributions from the mobile operatorsoutweighed those from indirect players, as government directly capturedrevenue from the operations of those companies (Deloitte, 2007). Onaverage, mobile operators contributed 26 per cent of total revenues in taxes.This rose to 29 per cent when regulatory fees were included though thisvaried considerably (Deloitte, 2007).
IndirIndirIndirIndirIndirect Benefitsect Benefitsect Benefitsect Benefitsect Benefits
In addition to revenue generation, the use of a mobile phone can itselfproduce follow-on economic and social benefit, e.g., enhance entrepreneurship,reduce information asymmetries and market inefficiencies and substitutetransportation (resulting in another knock-on effect).
A recent economic study carried out by World Resources Institute(WRI) and the International Finance Corporation (IFC) (WRI/IFC, 2007)found that even very poor families were buying cell phones and airtime,usually in the form of prepaid cards. Another finding was that as theirfamily’s income grew—from $1 per day to $4, for example—their spendingon ICT increased faster than spending in any other category, includingeducation, health and housing (WRI/IFC, 2007).

71ROLE OF ICTS AND ITS TRICKLE-DOWN EFFECTS ON INDIA’S ECONOMIC. . .
Due to the intangible nature of some of the benefits, these factors aredifficult to monetise. Deloitte (2007) used the consumer’s willingness to payand ‘consumer surplus’ as proxies to estimate the market value placed onsuch factors.12 Mobiles reduce the cost of running a business—and may evenenable a user to start one. Overall, there is a body of anecdotal evidence tosupport the theory that the use of a mobile phone is an invaluable enabler ofentrepreneurship and job search—not to mention the social benefits on theside. Over several years, research teams have spoken to: day labourers,farmers, prostitutes, rickshaw drivers, shopkeepers and all of them say moreor less the same thing: ‘their income gets a big boost when they have accessto a mobile’. Ownership of a mobile phone can itself be leveraged as a formof entrepreneurship: there are many examples of end users using the mobilephone: (a) for m-banking applications, (b) to make payments, and (c) transferresources to family back home by migrant labour (Bhavanani et al., 2008).
The use of mobile phones may reduce information asymmetries,enabling users to access arbitrage, market or trade opportunities that theyotherwise would have missed out on. Jensen (2007) in a study of fishermenin the Kerala state in India has shown that the use of mobile phones byfishermen in Kerala to arbitrage over price information from potentialbuyers and coordinate sales has helped them to increase incomes andreduce wastage. Since the use of mobile phones in 1997, there has beennoticeable impact on reduction in price variation (mean coefficient ofvariation declined from 60-70 per cent to 15 per cent), which ensured pricestability for the consumer and a nearly perfect spatial arbitrage replaced acollection of autarkic fishing markets (Jensen, 2007).
Surveys have found that phones were bought by the largest boats firstas they could get the largest possible arbitrage gains and could afford the$100 phones. This study concluded that the use of mobile phones: (a)increased consumer surplus (by an average of 6 per cent); (b) increased thefishermen’s profits (by an average of 8 per cent); (c) reduced price dispersion(by a decline of 4 per cent), and (d) reduced waste (which was averaging 5-8per cent of daily catch, before the use of mobile phones).13
12. http://www.deloi t te.com/assets/Dcom-UnitedStates/Local%20Assets/Documents/us_chs_OpportunitiesforHealthPlansinConsumerDrivenMarket.pdf
13. “India Second-Largest Wireless Market in the World”, 8th August 2008, http://www.siliconindia.com/shownews/India_secondlargest_wireless_market_in_the_world-nid-45326.html
http://www.siliconindia.com/shownews/India_secondlargest_wireless_market_in_the_world-nid-45326.html

72 INDIA EMERGING • VEENA JHA
One interesting side-effect of the use of mobiles is the reduction oftransportation costs: household expenditure dropped and consumer surplusincreased. Improvements in the information flows between buyers andsellers allow for the efficient trading of information without travelling. Thisis particularly significant in rural areas, where traders would have needed totravel to urban areas to check for demand and negotiate on price, thisbusiness is now conducted on the mobile. Traders are able to ensure demandexists for their products, before setting out on a journey. Moreover, in certaincircumstances, mobile phones can allow the ‘middle man’ to be cut out(Bhavanani et al., 2008).
The theory of consumer surplus takes the average revenue per user(ARPU)—at the time the mobile phone is purchased)—and assumes that itdoes not change over time, i.e., it is used as fixed proxy for the value theend user places on his/her mobile phone. By subtracting contemporaryARPU figures from historical ARPU figures (because, as subscriber levelsincrease, ARPU falls), the value ‘returned’ to the end user and presumablyreinjected into the economy as a whole, represents a so-called ‘consumersurplus’. The value of this consumer surplus can be considerable: in 2005,it was $37 billion for China and $4 billion for both India and thePhilippines. (These figures are approximate and conservative, because theydo not take into account advances in the coverage and quality of thenetwork.) (Enriquez et al., (2007).
Intangible BenefitsIntangible BenefitsIntangible BenefitsIntangible BenefitsIntangible Benefits
Mobile phones can also be a tool for: (a) aiding disaster relief, (b)enabling the dissemination of locally-generated and locally-relevanteducational and health information, and (c) promoting social capital andsocial cohesion. Mobiles were used by rescue teams in 2008 in Bihar tolocate flood victims and to guide them to safer locations. There areexamples of the use of mobiles to deliver health services in India.14
Mobile computing and wireless communication technologies provide anessential element of a comprehensive solution by expanding the size of thepopulation that can be reached, by improving the quality of the informationtransfer and data accuracy, and by creating a mode for timely communicationfor medical interventions and enhanced patient monitoring.
14. http://www.karmayog.org/biharfloods/biharfloods_18191.htm

73ROLE OF ICTS AND ITS TRICKLE-DOWN EFFECTS ON INDIA’S ECONOMIC. . .
A prominent NGO in India used hand-held mobile devices in thedetection and prevention of chronic kidney disease. Through mobiles theyhave created a flexible data collection solution with the potential to scale andinclude other co-morbid diseases. Second, they have reduced the transactioncosts and time required for field data to be communicated to specialists attertiary referral centres. Third, health care workers were able to cover largerpopulations than would otherwise be possible. Finally, timely communicationbetween specialist nephrologists and health care workers in the field allowedintensive management of chronic kidney disease (CKD) and relatedconditions.15
Mobile services are being used to disseminate locally-generated andlocally-relevant educational and health information, in order to target ruralcommunities, whose populations typically have low levels of education andincome and would not otherwise benefit from such information. There isevidence to suggest that this type of benefit could save lives in ruralcommunities (Sundar and Garg, 2005).
The formation of social capital or social cohesion could be one of themost important forms of intangible benefit of using mobile telephones. Itprovides an informal platform for cooperation between individuals throughthe exchange of information. Mobiles enable the sharing of information,development of trust and promote norms of reciprocity inherent in socialnetworks. Either way, economists are interested in social capital for itscontribution to productivity and spillover from the individual to the group:a network effect or social externality, and it is clearly an impact that mobilephones can provide. Studies from Gujarat indicate the importance of thisform of cohesion (Souter et al., 2005).
V
Conclusions and Recommendations
The ICT and mobile telephony sector account for roughly 10 to 15 percent of the GDP directly. Using output and employment multipliers theirshare to GDP nearly doubles. The ICT sector also accounts for over 25 per
15. Globalization, Crisis & Health Systems: Confronting Regional Pespectives, 2010.http://www.ghf10.org/ghf10/files/ghf10_final_programme.pdf
74 INDIA EMERGING • VEENA JHA
cent of export revenue and is an important earner of revenue. Itscapitalisation is also high and has thus resulted in an inflow of foreign equityin the sector. It is very competitive globally occupying about 51 per cent ofthe global market share. However, its employment potential is limited.Directly it employs less than 0.33 per cent of the labour force, thoughindirectly it employs over 1 per cent of the labour force. Most of theemployment is, however, in the formal private sector. Mobile telephonyemploys a slightly higher number over 2 per cent, but all in all employment inthis sector is miniscule in comparison to its share of GDP or exports (authors’calculations based on NASSCOM data). Given the limited employment bothdirectly and indirectly of the sector, the trickle-down effects of necessity wouldbe somewhat limited looking at the numbers.
Few ordinary Indians can be said to have been affected one way oranother by the software sector ’s astronomical growth and increasinginternational prominence. However, the common man has been affected bythe introduction of mobile telephony in India. Even in the case of ICT, abroader view of the sector in terms of its potential effects on the largereconomy should be taken. Some of these impacts are apparent already;others may take longer to come to fruition.
Aside from India’s very large informal sector, software development isprobably the only sector to have grown largely free of inhibitinggovernmental regulation or interference. In fact, Central and stategovernments have provided such incentives as tax exemptions, investmentconcessions and setting aside areas for technology parks, among othersteps, to encourage the sector’s growth. Nurtured by these incentives, thesector has provided the primary example in India of the growthpotentialities that can occur by allowing relatively unfettered entrepreneurialismto flourish. One consequence has been a commensurate growth in venturecapital availability, as investors see the chance of multiplying theirinvestments by a hopefully propitious selection of opportunities.
The example set by the software sector has not been lost ingovernment circles, where a similar growth pattern in a number of otherhigh technology areas is a fervent hope, if not quite yet an expectation.Plans that are afoot include the creation through private companies of afiberoptic ‘backbone’ linking the nation’s cities and towns, a rapid
75ROLE OF ICTS AND ITS TRICKLE-DOWN EFFECTS ON INDIA’S ECONOMIC. . .
expansion in the availability of fast internet connections, the building of asystem of ‘info-kiosks’ to bring internet availability even to rural areas, andan overall improvement in telephone service nationwide.
The hope is for India to become an international leader not only insoftware development, by now an accomplished fact, but to leapfrog manyother developing countries by establishing a world-class telecommunicationsinfrastructure and associated technology capabilities.
The fact that India is demonstrably competitive internationally in theproduction of sophisticated software brings other advantages to the country.Indian technological sophistication, though still narrowly defined, has begunto alter international perceptions of the country. Instead of viewing India as acountry burdened by decades of heavy-handed government regulation of theeconomy, foreigners now view the country somewhat more favourably,though not yet as a country where future growth will approximate that ofChina and several of the Southeast Asian countries.
Deficits of Indian infrastructure would cripple a country whosedevelopment hinges on manufacturing, it is less debilitating for one whosefuture is being driven by information and communication. The fact thatBangalore’s airport is antiquated and that it is hard to drive to its officeparks has not stopped Indian engineers telecommuting to the US insidespace-age buildings powered by privately run generators.
India does not even need to build telephone landlines to feed itssoftware habit. The wireless industry, powered by software, is doing the jobat warp speed. There are about 40 million Indian landline-phonesubscribers; the number of cellphone subscribers is already over 600million—and increasing at more than 10 million a month.
As the Indian economy further opens up, other ICT applicationsincluding manufacturing, travel and tourism, health care, entertainmentwill increasingly look towards IT to increase competitiveness. For both newand existing verticals, the small and medium business (SMB) segment willrepresent an important source of growth for the domestic IT servicesmarket. More focus should be given to the domestic market.
The convergence of mobile telephony and internet usage through newtechnologies is likely to lead to greater gains for India. However, a lot willdepend on the prices at which these technologies are available in the Indian
76 INDIA EMERGING • VEENA JHA
market. Economies of scale may generate great gains only if they areaffordable.
IT and mobile telephony have not yet started acting as a GPT,however, there are signs that their widespread usage has begun. While IT isexport oriented though with a growing share directed to domestic usage,mobiles are almost exclusively domestically oriented. The multiplier effectsof both are high as they employ young people with a high marginalpropensity to consume. When both start being used widely for improvingthe productivity of the economy its trickle down will accelerate. Thus whiletrickle down at this point of time has been limited, there is a high potentialfor improving its widespread usage and hence its trickle down.
To fully realise the potential of ICT and mobile telephony, educationalimprovements to support not only this sector but also other related sectors(telecom, internet, data processing, etc.) will be required. The immediateimpact can be seen in the expansion of technical colleges and universities aswell as more attention to lower-level training institutes. While not helpingdirectly with the more basic problems of illiteracy and inadequate primaryand secondary education, such moves certainly do support not only softwareproducers but also other technology-based sectors that have been receivingattention as sources of more general economic growth in India. It is alsonecessary to introduce computers at the primary level along with languagetraining. In a country like India where numeracy comes more easily thanliteracy, it would be of material interest to tap this advantage.

77ROLE OF ICTS AND ITS TRICKLE-DOWN EFFECTS ON INDIA’S ECONOMIC. . .
ReferencesAisbett, Janet, Greg Gibbon, Anthony J. Rodrigues, Joseph Kizza Migga, Ravi Nath,
Gerald R. Renardel (2008). Strengthening the Role of ICT in Development. VolumeIV. Kampala, Uganda: Fountain Publishers.
Barro, R.J. (1991). “Economic Growth in a Cross Section of Countries”, Quarterly Journalof Economics 106(2): 407-43.
Basu, Inderjit (2008). India’s IT Industry is Changing Lives. UPI correspondent. June 17.http://www.upiasia.com/Society_Culture/2008/06/17/indias_it_industry_is_changing_lives/5374/
Bhatnagar, Subhash and Robert Schware (2000). Information and CommunicationTechnology in Development: Cases from India. New Delhi: Sage Publications.
Bhavnani, Asheeta, Rowena Won-Wai Chiu, Subramaniam Janakiram, Peter Silarszky(TTL), Practice Leader: Deepak Bhatia (2008). The Role of Mobile Phones inSustainable Rural Poverty Reduction. ICT Policy Division, Global Information andCommunications Department, World Bank, http://siteresources.worldbank.org/EXTINFORMATIONANDCOMMUNICATIONANDTECHNOLOGIES/Resources/The_Role_of_Mobile_Phones_in_Sustainable_Rural_Poverty_Reduction_June_2008.pdf
Bresnahan, T.F. and M. Trajtenberg (1995). “General Purpose Technologies: Engines ofGrowth”, Journal of Econometrics 65: 83-108.
Bresnahan, T.F., E. Brynjolfsson and L.M. Hitt (2002). “Information Technology, WorkplaceOrganization, and the Demand for Skilled Labor: Firm-Level Evidence”, QuarterlyJournal of Economics 117: 339-76.
Brynjolfsson, E. and L.M. Hitt (2000). “Beyond Computation: Information Technology,Organizational Transformation and Business Performance”, Journal of EconomicPerspectives 14: 23-48.
Chakravarty, Rupak (2000). IT at Milk Collection Centers in Cooperative Dairies: TheNational Dairy Development Board Experience. http://unpan1.un.org/intradoc/groups/public/documents/APCITY/UNPAN019011.pdf
Deloitte & Touche LLP (2007). Economic Impact of Mobile in Bangladesh, Malaysia,Pakistan, Serbia, Thailand & Ukraine.
De Soto, Hernando (1996). “Securing Property Rights: The Foundation of Markets”, (aninterview). CIPE. Economic Reform Today 1.
Department of Information Technology (DIT) and National Council of Applied EconomicResearch (NCAER) (2010). India e-Readiness: Assessment Report 2008 for Statesand Union Territories. Released in January. http://www.mit.gov.in
Desai, Ashok V. (2000). “The Peril and the Promise: Broader Implications of the IndianPresence in Information Technologies”, Working Paper. August. CREDPR. StanfordUniversity.
Economist Intelligence Unit (2005). “The 2005 E-Readiness Rankings”, A White Paperfrom the Economist Intelligence Unit, written in Cooperation with the IBM Institutefor Business Value. http://graphics.eiu.com/files/ad_pdfs/2005Ereadiness_Ranking_WP.pdf
Enriquez, Luis, Stefan Schmitgen and George Sun (2007). The True Value of MobilePhones to Developing Markets. February. http://www.mckinseyquarterly.com
Gokarn, Subir, Dharmakirti Joshi, Vidya Mahambare, Pooja Mirchandani, Manoj Mohta,Kumar Subramaniam (2007). The Rising Tide: Employment and Output Linkages ofIT-ITES. February. http://www.nasscom.in/upload/51269/NASSCOM_CRISIL.pdf

78 INDIA EMERGING • VEENA JHA
Jensen, Robert (2007). “The Digital Provide: Information Technology, Market Performanceand Welfare in the South Indian Fisheries Sector”, The Quarterly Journal ofEconomics CXXII(3): 879 to 924.
Kapur, Devesh and Ravi Ramamurti (2001). “India’s Emerging Competitive Advantage inServices”, Academy of Management Executive 15(2): 20-31.
Keniston, Kenneth (2002). “Grassroots ICT Projects in India: Some PreliminaryHypotheses”, ASCI Journal of Management 31(1&2). http://web.mit.edu/~kken/Public/PDF/ASCI_Journal_Intro__ASCI_version_.pdf
Konana, Prabhudev, John. N. Dogett and Sridhar Balasubramanian (2004). ComparingIndia and China Growth Strategies: Chaotic Or Planned?. http://www.mccombs.utexas.edu/faculty/prabhudev.konana/indiachina.pdf; http://www.hinduonnet.com/thehindu/thscrip/print.pl?file=20050325003600400.htm&date=fl2206/&prd=fline&
Laursen, Keld, Valentina Meliciani and Ammon Salter (2002). The New Economy Meetsthe Old: The Importance of International ICT Knowledge-Flows for Market ShareDynamics. http://www.druid.dk/laursen/papers/gron.pdf
LIRNEasia (2006). Report on Workshop on ICT Indicators for Benchmarking Performancein Network and Services Development. March 1-3. Available at www.lirneasia.net
Milgrom, P. and J. Roberts (1990). “The Economics of Modern Manufacturing Technology,Strategy and Organization”, American Economic Review 80: 511-28.
NASSCOM (2010). IT-BPO Sector in India: Strategic Review 2010: Section-wise Report.http://www.nasscom.in
NASSCOM-CRISIL (2007). The Rising Tide: Employment and Output Linkages of IT-ITES.Mumbai: NASSCOM-CRISIL. http://www.nasscom.in/upload/51269/NASSCOM_CRISIL.pdf
NASSCOM-IDC (2006). Study on Domestic Services Market Opportunity. Published byNASSCOM, New Delhi, India. www.nasscom.in.
Ovum (2006). The Economic Benefit of Mobile Services in India. GSM Association AsiaPacific, January.
PricewaterhouseCoopers (2010). “Mobile-Broadband Outlook 2015”, Paper presented atICRIER seminar on Socio-Economic Impact of Mobile Phones on Indian Agriculture,February. http://www.pwc.com/in/en/publications/Mobile-Broadband-Outlook-2015.jhtml
Romer P.M. (1986). “Increasing Returns and Long-Run Growth”, Journal of PoliticalEconomy 94(5).
Rupanagunta, Krishna (2004). Infotech and Creating Resources. http://www.indiatogether.org/2004/feb/gov-itunlock.htm
Schreyer, Paul (2000). “Recent Developments in Information and CommunicationTechnologies and their Impact on the Brazilian Economy”, Paper Presented at theEastern Economic Association Conference. March. Boston, USA.
Singh, Nirvikar (2003). “India’s Information Technology Sector: What Contribution toBroader Economic Development”, OECD Technical Paper 207. http://www.oecd.org/dataoecd/59/12/2503442.pdf
————. (2002). Information Technology as an Engine of Broad-Based Growth in India.http://129.3.20.41/eps/dev/papers/0412/0412012.pdf
Souter, David, Nigel Scott, Christopher Garforth, Rekha Jain, Ophelia Mascarenhas andKevin McKemey (2005). “The Economic Impact of Elecommunications on RuralLivelihoods and Poverty Reduction: A Study of Rural Communities in India (Gujarat),

79ROLE OF ICTS AND ITS TRICKLE-DOWN EFFECTS ON INDIA’S ECONOMIC. . .
Mozambique and Tanzania”, Report of DFID KaR Project 8347. DFID. http://www.telafrica.org/R8347/files/pdfs/FinalReport.pdf
Sundar, Diatha Krishna and Shashank Garg (2005). M-Governance: A Framework forIndian Urban Local Bodies. http://www.m4life.org/proceedings/2005/PDF/41_R359SK.pdf
The Economist (2001). “Another Kind of Net Work: Mobile Phones in India”, The Economist59, March 3.
Waverman, Leonard (2005). The Impact of Telecoms on Economic Growth in DevelopingCountries. London Business School. Available at: http://web.si.umich.edu/tprc/
Waverman, Leonard, Meloria Meschi and Melvin Fuss (2005a). “The Impact of Telecoms onEconomic Growth in Developing Countries”, Working Paper: The Vodafone PolicyPaper Series 3, March 10-23.
————. (2005b). The Impact of Telecoms on Economic Growth in Developing Countries.http://web.si.umich.edu/tprc/papers/2005
World Bank (2010). India Economic Update. Economic Policy and Poverty Team: SouthAsia Region. http://siteresources.worldbank.org/INDIAEXTN/Resources/295583-268190137195/India_Economic_Update_June_23_2010.pdf
WRI/IFC (2007). The Next Four Billion, 2007. http://archive.wri.org/archive.cfm

80 INDIA EMERGING • VEENA JHA
Annexure A-1.1
e-Readiness Index
The framework used to determine e-Readiness is based on the following premise:
There are three important stakeholders to consider in the development and use of ICT:individuals, business and governments. The degree of usage of ICT by (and hence the impactof ICT on) the three stakeholders is linked to their degrees of readiness (or capability) to useand benefit from ICT. There is a general macroeconomic and regulatory environment for ICTin which the stakeholders play out their respective roles. The environment for ICT offered bythe concerned state governments, the readiness of the key stakeholders (individuals,businesses and government) to use ICT and finally the actual usage of ICT by these variousstakeholders comprises this index.
Identification of the levels of e-Readiness at the state level requires a three-step procedure.
1. Identification of appropriate measures of those characteristics.
2. Identification of the most important characteristics that represent e-Readiness.
3. A rating of states based on the Composite Index, which reflects the position of aparticular state, as indicated by the comparative position of importantcharacteristics identified in Step 2.
Box 1
e-Readiness of States
Using ICTs is not just a matter of installing hardware and buying relevant software.In order to reap its benefits, its users—government, businesses and citizens—mustbe e-ready i.e., be able to skillfully exploit the opportunities provided by ICTs. Overthe past decade or so, islands of e-governance initiatives in India at the national,state, district and even block level have emerged. These initiatives have helpedthese states gain a headstart in e-Readiness. Objective assessment of e-Readinesshelps states evolve proactive policy and robust ICT infrastructure.
The Department of Information Technology (DIT), Government of India, throughNational Council of Applied Economic Research (NCAER) conducts e-ReadinessAssessment and publishes the findings as e-Readiness Assessment Report. The valueof the e-Readiness Index at the state level reflects the capacity of a state to participatein the networked economy in relation to the country at large. The e-Readiness Indexdeveloped by DIT/NCAER is composed of variables that fall into three broadcategories: ‘environment’, ‘readiness’ and ‘usage’ as shown in Figure 1.

81ROLE OF ICTS AND ITS TRICKLE-DOWN EFFECTS ON INDIA’S ECONOMIC. . .
The final report of the survey on ‘E-Readiness Assessment of States in India’submitted by NCAER to DIT slotted states in five categories: leaders, aspiringleaders, expectants, average achievers, under achievers and laggards.
Andhra Pradesh, Karnataka, Maharashtra and Tamil Nadu are the four Indianstates that have emerged as leaders in terms of e-Readiness.
The states at the bottom of the list have been termed as ‘laggards’ and includeArunachal Pradesh, Assam, Bihar, Dadra & Nagar Haveli, Jammu & Kashmir,Jharkhand, Lakshadweep, Manipur, Nagaland and Sikkim.
Delhi, Chandigarh, Goa and Gujarat are ‘aspiring leaders’ and have been ranked atlevel two. The level three of ‘expectants’ include West Bengal, Uttar Pradesh andKerala while ‘average achievers’ (level 4) are Rajasthan, Punjab, Pondicherry,Madhya Pradesh and Haryana. The rest of the states: Chhattisgarh, Daman & Diu,Himachal Pradesh, Meghalaya, Mizoram, Orissa, Tripura and Uttaranchal havebeen termed ‘under achievers’ by the report.
The states have also been rated on seven parameters: network access, networklearning, network society, e-governance and network economy.
Delhi has been rated the best in terms of network access that includes indicatorslike teledensity, percentage of households with phones and cable TV, cellularphones, personal computer population, internet connections, length of optical fibrein operation and number of villages covered by village public telephones (VPTs).
Five states: Chandigarh, Maharashtra, Delhi, Karnataka and Tamil Nadu are on thetop in terms of network learning. Network learning is monitored in terms ofpercentage of colleges and schools with internet access, computer labs, universitiesoffering infotech courses, number of websites of schools and colleges, etc.
Karnataka and Chandigarh are also ahead of others in maintaining the networksociety, which is measured on number of online companies, local language websitesand interfaces, number of government websites and number of householdsaccessing internet as percentage of households with computers and phones. Thebest network policy is in place in Maharashtra, Chandigarh, Tamil Nadu,Karnataka, Goa and Gujarat. Network policy is evaluated on government’s effortsto address issues related to telecom, e-commerce taxation, intellectual property andpresence of an IT policy and cyber laws.
Market Environment
Political & Regulatory Environment
Infrastructure Environment
Individual Readiness
Business Readiness
Government Readiness
Individual Usage
Business Usage
Government Usage
Environment
Readiness
Usage
E-ReadinessIndex
Figure 1

82 INDIA EMERGING • VEENA JHA
The state of e-governance depends on the rural IT applications in agriculture,education, medicines, trade, initiative and success related to e-governance projectslike e-procurement, land registration, utility billing, etc. Karnataka, AndhraPradesh, Tamil Nadu and Gujarat are on the top in terms of e-governance.Interestingly, Maharashtra is alone on top in terms of network economy. The statesare rated on the basis of number of IT parks, floor area of IT parks, sales turnoverof IT companies in states and number of jobs that require infotech skills.
The e-Readiness report shows the state of ICT penetration and how ICT could beused to reduce poverty in a state. While this is the picture for India as a whole, atthe global level India’s ranking is still relatively low. This is because all thecomponents of a digital economy-infrastructure, security, transparency, innovationand skills—must be properly interlaced to ensure adequate e-readiness. These arestill in deficit in most emerging markets, but a few are world-class or near to it inselected areas, the best examples being Estonia (26th), Slovenia (27th) and theCzech Republic (29th) with their strong development of e-government services.India (49th) and China (54th) remain on the lower rungs of the e-Readiness ladder,but are making growing contributions to the global digital economy on the strengthof a strong ICT skills base (India) and a prodigious ICT manufacturing sector(China).
Table 1
E-Readiness at a Global Level
2005 e-Readiness 2004 Rank Country 2005 e-Readiness 2004 ScoreRank (of 65) Score (of 10)*
1 1 Denmark 8.74 8.28
2 6 US 8.73 8.04
3 3 Sweden 8.64 8.25
4 10 Switzerland 8.62 7.96
5 2 UK 8.54 8.27
6 (tie) 9 Hong Kong 8.32 7.97
6 (tie) 5 Finland 8.32 8.08
8 8 Netherlands 8.28 8.00
9 4 Norway 8.27 8.11
10 12 Australia 8.22 7.88
11 7 Singapore 8.18 8.02
12 (tie) 11 Canada 8.03 7.92
12 (tie) 13 Germany 8.03 7.83
14 12 Austria 8.01 7.68
15 16 Ireland 7.98 7.45
16 19 New Zealand 7.82 7.33
17 17 Belgium 7.71 7.41
18 14 S. Korea 7.66 7.73
19 18 France 7.61 7.34
20 22 Israel 7.45 7.06
contd...
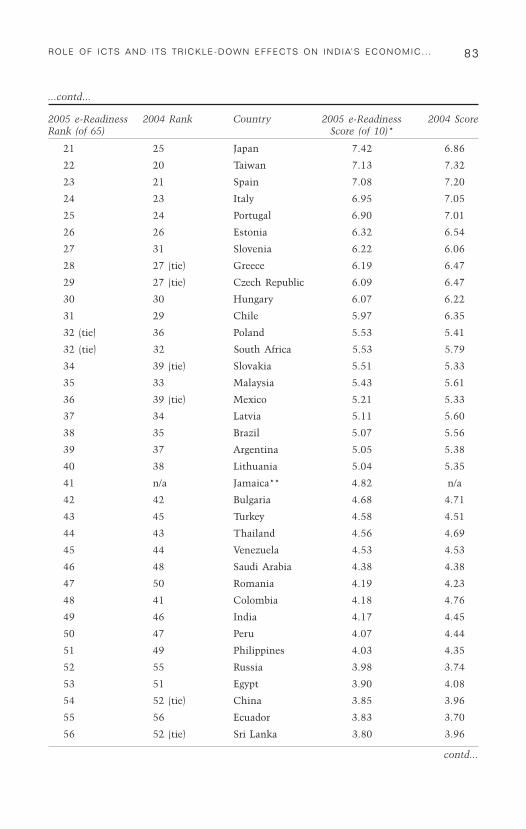
83ROLE OF ICTS AND ITS TRICKLE-DOWN EFFECTS ON INDIA’S ECONOMIC. . .
...contd...
2005 e-Readiness 2004 Rank Country 2005 e-Readiness 2004 ScoreRank (of 65) Score (of 10)*
21 25 Japan 7.42 6.86
22 20 Taiwan 7.13 7.32
23 21 Spain 7.08 7.20
24 23 Italy 6.95 7.05
25 24 Portugal 6.90 7.01
26 26 Estonia 6.32 6.54
27 31 Slovenia 6.22 6.06
28 27 (tie) Greece 6.19 6.47
29 27 (tie) Czech Republic 6.09 6.47
30 30 Hungary 6.07 6.22
31 29 Chile 5.97 6.35
32 (tie) 36 Poland 5.53 5.41
32 (tie) 32 South Africa 5.53 5.79
34 39 (tie) Slovakia 5.51 5.33
35 33 Malaysia 5.43 5.61
36 39 (tie) Mexico 5.21 5.33
37 34 Latvia 5.11 5.60
38 35 Brazil 5.07 5.56
39 37 Argentina 5.05 5.38
40 38 Lithuania 5.04 5.35
41 n/a Jamaica** 4.82 n/a
42 42 Bulgaria 4.68 4.71
43 45 Turkey 4.58 4.51
44 43 Thailand 4.56 4.69
45 44 Venezuela 4.53 4.53
46 48 Saudi Arabia 4.38 4.38
47 50 Romania 4.19 4.23
48 41 Colombia 4.18 4.76
49 46 India 4.17 4.45
50 47 Peru 4.07 4.44
51 49 Philippines 4.03 4.35
52 55 Russia 3.98 3.74
53 51 Egypt 3.90 4.08
54 52 (tie) China 3.85 3.96
55 56 Ecuador 3.83 3.70
56 52 (tie) Sri Lanka 3.80 3.96
contd...

84 INDIA EMERGING • VEENA JHA
...contd...
2005 e-Readiness 2004 Rank Country 2005 e-Readiness 2004 ScoreRank (of 65) Score (of 10)*
57 54 Ukraine 3.51 3.79
58 58 Nigeria 3.46 3.44
59 57 Iran 3.08 3.68
60 59 Indonesia 3.07 3.39
61 60 Vietnam 3.06 3.35
62 63 Kazakhstan 2.97 2.60
63 61 Algeria 2.94 2.63
64 62 Pakistan 2.93 2.61
65 64 Azerbaijan 2.72 2.43
Note: * Substantial differences between our 2005 and 2004 scores mainly reflect changes inmethodology.
** Jamaica is new to the annual rankings and was not ranked in 2004.
Source: Economist Intelligence Unit (2005).

InterInterInterInterInter-State Migration and-State Migration and-State Migration and-State Migration and-State Migration andTTTTTrickle-Down Effectrickle-Down Effectrickle-Down Effectrickle-Down Effectrickle-Down Effect
Introduction
India has seen many high growth spells between 1980-2010. During therelatively lower growth period between 1960-1980, most states grew slowlyaround the average all-India figure, but after 1980 some states grew muchmore rapidly than others. States like Karnataka, Andhra Pradesh, TamilNadu, Maharashtra and Gujarat grew at rates much higher than the nationalaverage, while the more populous states such as Bihar and Uttar Pradesh tillrecently fell well below the national average1 (Purfield, 2006). The differencein the rates of growth meant that opportunities for employment arose in thehigher growth states and inter-state migration therefore increasedsignificantly (by nearly 55 per cent) from the lower growth states to thehigher growth states.2 There was nearly a doubling of inter-state migrationinto Maharashtra, Delhi and West Bengal between 1991 and 2001.3
Potentially, inter-state migration could be an important agent of tricklingdown the benefits of growth from high to low growth states.
Inter-state migration has always been prevalent in the Indianeconomy. The difference that high growth rates have brought is that thenumber of destination states have increased. While earlier inter-statemigration was focussed on metros such as Calcutta, Delhi and Mumbai,high growth rates have increased the attraction of destinations such asJaipur, Bangalore, Pune and other such cities.4 The growth of secondary
22222
1. See Introduction for data on growth rates of different states of India.
2. Ibid.
3. Data highlights Tables D1. D2, D3 from the National Census of India 2001. http://www.censusindia.net
4. “More Migrations, New Destinations”. http://www.indiatogether.org/2009/aug/psa-behram.htm

86 INDIA EMERGING • VEENA JHA
cities which accompanied economic growth in India has meant that inter-state migration has become more widespread, offering greater opportunitiesfor trickle down.
India has 10 of the 30 fastest-growing urban areas in the world and,based on current trends, it is estimated that a massive 700 million people(roughly equivalent to the entire current population of Europe) will move tocities by 2050 (Goldman Sachs, 2007). This will have significantimplications for demand for urban infrastructure, real estate and services.At the same time urbanisation offers opportunities for bettering incomesand lifestyles.
While migration could potentially be an important process fortrickling down growth, it has also contributed positively to growth inGDP. During the high growth period of this century starting 2003, themovement of surplus labour from low-productivity agriculture to high-productivity industry and services contributed about 1 percentage point toannual GDP growth (Goldman Sachs, 2007). India is well-positioned toreap the benefits of an ‘urbanisation bonus,’ over the long term due to thecontinued movement of labour from rural agriculture to urban industryand services.
In contrast to this narrative, some studies based on the NSS Surveytend to underemphasise the importance of migration and may even drawthe conclusion that population mobility is decreasing. Kundu calculatesthat RU migration has declined by 1.5 percentage points, even allowing fora decline in the fertility rate, increases in urban boundaries and theemergence of new towns (Kundu, 2003). These results are in sharp contrastto the micro survey studies that show both an increase in remittances andin inter-state migration. In fact the micro studies emphasise the povertyalleviating aspects of inter-state migration, and show that migration maybe an important livelihood option for the poor (Deshingkar, 2004;Srivastava, 2003). The disjunct between micro and macro studies is in partexplained by the inability of conventional surveys, such as the NSS, onoccupation and residence to capture information related to temporarymovement and part-time occupations.
The crucial question is not about the volume of trends of migrationitself, but what kind of opportunities are available for what groups of

87INTER-STATE MIGRATION AND TRICKLE-DOWN EFFECT
people, and whether the type of migratory work allows the migrants andtheir families to improve their assets and ‘human capital’. Effects of out-migration depends to some extent on an ability to maintain labour inputsand to invest remittances productively. The issue of assets has been littleexplored in literature. This chapter particularly focusses on asset buildingby migrants along with other issues of remittance uses. The focus on assetbuilding can be explained by the fact that asset building reduces povertyespecially in the informal sector (see Chapter 3). As shown in chapter 3informal employment is dominant in the Indian economy, so it can beassumed that a large proportion of migrants go to the informal sector.Hence, asset building subsequent to migration would have an importantbearing on reducing poverty and would be a good measure of trickle downthrough migration.
Explanations on trickle down based on surveys may be regarded asanecdotal and therefore difficult to replicate in all states and all situations.This chapter thus explores some relationships between variables thatdirectly and indirectly contribute to trickle down at the macro level. Usinggrowth data from the CSO and the Census data on migration as well asother secondary sources of informal asset building such as that developedby Marjit and Maiti (2005), this chapter examines the effects of out-migration on asset building and remittances into states of origin. It alsoexamines the effects of out-migration on the convergence of inequality inincomes between states. Further through case studies based on interviewswith migrants across the major destination states, the chapter analyses themajor variables which determine asset growth in the states of origin as wellas consumption in the destination states. It looks at the role of variablessuch as education and gender in determining the effects of out-migration.The chapter starts with a brief review of the literature on migration inSection I. Section II examines whether migration behaviour in India isconsistent with economic theories of migration. Section III analyses theeffects of migration in India drawing upon secondary literature. Using aneconometric model, Section IV examines whether incomes, or povertybetween states has converged as a result of inter-state migration in theIndian context. Using a survey of about 200 migrants, Section V arrives atsome stylised facts about migrants and then using econometric techniquesevaluates the factors that could accelerate trickle down through migration.

88 INDIA EMERGING • VEENA JHA
Essentially the section examines the factors that lead to asset formation inmigrant families. Finally, the chapter concludes with policies that couldstrengthen trickle down through migration in the current growth dynamicsof the Indian economy (Section VI).
I
Theories of Migration
Early theories of migration were presaged on the assumption thatsurplus labour in agriculture in the rural areas would migrate to urbanareas in search of higher wages and higher productivity. In fact, mostdeveloped countries followed this pattern in their early stages ofdevelopment. Some authors, like Lewis (1954) and Fei and Ranis (1965),assumed that a reduction of the labour force in agriculture, because of thewidespread disguised unemployment, would not reduce agriculturalproduction. This was one of the first theories which recognised though notexplicitly the role of migration in trickling down the benefits of growth.However, Lewis (1954) did recognise that rural urban migration could causea worsening of conditions for labour in the initial stages.
Ravenstein (1889) propounded that the principal reason for migrationwas overpopulation and undeveloped resources in rural areas, thus,providing opportunities for higher wages in other areas such as urban areas.The Harris-Todaro (1970) model assumed that people will make rationaleconomic decisions to migrate from rural to urban areas based on expectedhigher income differentials. However, this theory assumed competitive andunsegmented homogeneous labour markets and no information asymmetries.This is certainly not the case in developing economies such as India.
Migration according to these early theories was explained in terms ofpush factors—conditions in the rural areas on account of drought, orfragmentation of land through population increase. This induced eitherindividuals or families or the skilled and able family members to leave theirhomes. In addition there are pull factors—the perceived better economiccircumstances in cities or other states that attract people to move there.General examples of push factors include drought, the loss of a job,political persecution, or even caste subjugation. Examples of pull factors

89INTER-STATE MIGRATION AND TRICKLE-DOWN EFFECT
include job opportunities, friends and family or a city lifestyle seen on thetelevision. In many ways, however, these factors work together. Forexample, a farmer in rural Bihar whose land is increasingly unproductivedue to its uneconomic size, would not be ‘pushed’ off his land and decide tomove to Delhi unless he was also aware of the presence of opportunities toimprove his economic situation there. In the context of urban growth,people often emphasise pull factors in that the city is seen as a magnet or aplace where people believe there are better opportunities, higher incomes,and better lifestyles.
Several other theories have advanced reasons which determine anindividual or a family’s decision to migrate. These factors typically includethe availability and remuneration of local jobs at destination, the existenceof local amenities, the cost and availability of public goods, or eveninstitutional factors such as better governance at destination areas (Lall etal., 2006). The absence of a rural credit market may also act as a pushfactor when migration of a family member is used to generate remittancesin order to overcome credit constraints and finance rural productiveinvestments (Kats and Stark, 1987). Of course, migration decision alsodepends on its monetary and non-monetary costs. Distance to potentialdestinations has been shown to deter migration (Schwarts, 1973;Greenwood et al., 1981). A few studies suggest that migration is facilitatedby the concentration of the migrant pool (of same origin) in the area ofdestination (Mora and Taylor, 2005).
Recent job-search models show that migration can improve jobmatches or be used as a way to circumvent rural constraints, such as creditmarket and insurance imperfections. Some empirical evidence shows thatinternal migration contributes to the development of rural areas throughremittances by enabling the financing of productive investment and byreducing poverty even though its effects on inequality are mixed. Moststudies show that, remittances are spent on both consumption andinvestment, enabling both short-term increases in the standard of livingand long-term development in rural areas. In urban areas, internalmigration does not necessarily cause massive unemployment as suggestedby Todarian models, and studies on the labour market assimilation ofmigrants indicate that migrants can catch up with natives under certaincircumstances. These elements support the view that migration can be

90 INDIA EMERGING • VEENA JHA
beneficial or at least can be turned into a beneficial phenomenon (Lall etal., 2006).
Remittances of migrants are used for a variety of purposes (Rapoportand Docquier, 2005). Remitting might serve to take care of the migrants’assets and relatives back home (Cox et al., 1998), to invest in one’s parentsto secure potential bequests (de la Brière et al., 2002), to insure one’sfamily against volatile incomes (Gubert, 2002), or to repay a loan (Ilahi andJafarey, 1999). Remitting can also be justified by sheer altruism or socialnorms (Asam and Gubert, 2002). Interestingly, remittances sent to ruralareas might benefit different populations depending on the context, whichimplies that remittances do not systematically benefit the poor or the rich.The diversity of contexts also explains that remittances serve a variety ofuses. They can be used for consumption (Banerjee, 1984), for housinginvestments when anticipating the event of return migration (Osili andPaulson, 2004), as well as capital expenditure (Lucas and Stark, 1985).
In developing countries, remittances to rural areas contribute to ruraldevelopment—both directly if used in education and productiveinvestments, and indirectly via higher consumption levels. But, on theother hand, internal migration from rural to urban areas can exert a lot ofpressure on cities who may not have the capacity to absorb large populationflows and to provide migrants with an adequate level of public goods. Thiscan lead to slum formation and in extreme cases to internal crime andunrest. Urbanisation may also lead to an unbalanced distribution of thepopulation and contribute to increasing disparities between rural and urbanareas.
The negative effects of migration and that it may be an undesirableoutcome is the premise of some modern theories on migration. It is arguedthat the public and private modern sectors are not keeping pace with jobcreation for an increasing labour force in urban areas, poor migrants andcommuters in the city tend to find work in the urban informal orunorganised sector. These activities generally involve petty business,services or non-farm labour including street vending, shoe shining, bicycle-riskshaw driving, loading and unloading, cleaning etc. Conventionaldevelopment theory conceptualises a dual labour market in urban areaswhere the informal sector is disadvantaged, poorly paid and unprotectedand where workers go if they are unable to find work in the superior, formal
91INTER-STATE MIGRATION AND TRICKLE-DOWN EFFECT
sector. The ‘over-urbanisation’ theory for instance, predicts that migrantssupply far more labour than the organised sector can absorb (Hoselits,1957). Labour absorption by the unorganised sector then leads to lowproductivity and limited prospects for exiting poverty. Thus, migrants maymove from one poor situation to another. The experience of several decadesin India has shown that most migrants never ‘graduate’ to the formalsector, by contrast with the oft-cited conceptualisation of Harris and Todaro(1970). There is usually marked occupational segmentation in the informalsector where workers in particular occupations tend to come from the sameareas of origin or ethnic communities (Breman, 1985).
Structuralists such as Breman (2003) maintain that migrants willalways remain underpaid and never be able to move out of a survivalsituation because most of the profits from their work are creamed off by theexploitative activities of middlemen and contractors. The Marxists accuseeconomists who view migration as voluntary as politically naïve becausethey refuse to recognise oppression and debt-bondage (Olsen and RamanaMurthy, 2000).
Myrdal (1957a) further advanced reasons why trickle down need nothappen through migration. He considered a type of multiplier-acceleratormechanism whereby supply and demand are no longer considered asindependent, but interact to produce cumulative movements away from theoriginal equilibrium, i.e., the cumulative expansion of the prosperousregion at the expense of backward region. ‘There is no tendency towardsautomatic self-stabilisation...(and) the system is constantly on the moveaway from such a situation’ (Myrdal, 1957b). For example the initial labourmigration from rural to urban areas reduces human capital and depressesdemand for goods, services and factors of production in rural areas. Thesame movements will stimulate business and the demand for products inurban areas, further increasing the demand for labour as well as attractingcapital to urban areas. These ‘backwash effects’ perpetuate or even worsendevelopment differentials between regions. These backwash effects may becountered by the beneficial spread or trickle-down effects—the favourableeffects on the backward regions of growth in the expanding regions. Thesepositive effects would be mediated not only through remittances of themigrants, but also through technology and knowledge spillover effects andthe increased demand for goods from rural areas from the increased realincome of the migrants in the urban areas. Myrdal (1957b), however,

92 INDIA EMERGING • VEENA JHA
considered these effects to be weak and outweighed by the strongerbackwash effects.
The gravitation towards a low level equilibrium was furtherstrengthened by the importance of the informal sector in developingcountries. Portes and Schauffler (1993) emphasised the importance of theinformal economy, not as a transitional stage in development, but as ameans of deliberately organising production and marketing while meetingthe challenges of global competition.
In several developing countries including India, concentration on themodern sector led to an increasing regional disparity, rural-urbanmigration, urban unemployment, a decrease in agricultural production andhindrance in industrial development because of a lack of purchasing powerin the rural areas. The anticipated trickle-down effects hardly everhappened at least till the 1990s. In praxis, development plans followingthis line of thinking led to failures like the early Indian developmentplanning. Therefore, other authors like Jorgenson (1961) and Lele andMellor (1981), emphasised the important role of agriculture at thebeginning of development, i.e., preceding or parallel to industrialdevelopment in order to provide enough internal resources for thedevelopment process. In fact the green revolution and the subsequentdevelopment in the 1980s in India was a testimony to this strategy.
The ‘backwash effects’ logic could be said to apply to inter-stateinequality in India. However, this does not explain why some states such asRajasthan which were at the bottom of the spectrum have worked their wayout of its low-level equilibrium. Even backward states such as Bihar andOrissa have improved their economic positions. It also does not explain whyrural-urban poverty differentials have been narrowing, while inter-statepoverty differentials at least for some states may be widening in India.
The important issue is what causes low-level equilibrium traps to breakand develop virtuous circles of growth. In the context of migration, thequestion that arises is when do incremental increases in migrant incomesand remittances reach a critical and irreversible stage. Is this similar toRostow’s takeoff when trickle-down effects of growth become self-generating?5
5. http://www.mtholyoke.edu/acad/intrel/ipe/rostow.htm

93INTER-STATE MIGRATION AND TRICKLE-DOWN EFFECT
The important variable that has been left out of Myrdal’s backwasheffects is land. In a land scarce country such as India which accounts for2.4 per cent of global land and over 15 per cent of global population, theopportunity cost of leaving land to low productivity uses in agriculture canbe very high. High growth rates have introduced income earningopportunities through alternative land uses. The role of this missingvariable is analysed in Section II. The section however begins with ananalysis of traditional push and pull factors in the context of India.
II
How do these Theories Apply to India
How High is InterHow High is InterHow High is InterHow High is InterHow High is Inter-State Migration in India-State Migration in India-State Migration in India-State Migration in India-State Migration in India
Studies on migration in India have not distinguished inter-statemigration from other forms of migration such as rural-urban or intra-state.This is because most studies on migration in India do not focus on thetrickle-down effects of growth. High rates of growth are a relatively recentphenomenon in India and studies which examine growth with equity havenot analysed the effects of inter-state migration on equity. There is also apaucity of data on inter-state migration. The most reliable data isunfortunately dated and relates to the last Census in 2001. However sincethe break in growth rates, i.e., its upward trend was already visible at the timeof the last Census, trends of migration are unlikely to have changed much.
Of the 1.02 billion people in India in 2001, roughly 307 million or 30per cent were reported to be migrants. This is higher than the 27 per centof the population which was listed as migrant in the 1991 Census. A backof the envelope calculation of the elasticity of inter-state migration to GDPshows that it was about 0.9 (calculated from the Census and CSO).6 Thisimplies that for every per cent increase in GDP, it is likely that inter-statemigration will increase by about 0.9 per cent. Extrapolating on this basis, itappears that inter-state migration would have increased by about 48 percent between 2001 and 2007. This could be explained by the fact thathigher growth rates in the some states have generated income-earning
6. Census (2001) and Economic Survey 2002. Published by the Planning Commission,Government of India.

94 INDIA EMERGING • VEENA JHA
opportunities leading to higher migration. It is to be noted that inter-statemigration has grown by over 50 per cent between 1991-2001, showingmuch higher growth rates than inter-district or intra-district migration.7
The highest proportion (36%) of inter-state migrants are in the agegroup of 35-59 years or the most productive period of their lifetime. This isfollowed by migrants in the age group of 25-34 which accounts for roughly25 per cent of total inter-state migration. The next age group is 15-24 whichaccounts for 15 per cent of the inter-state migrants. Thus, a majority ofinter-state migration is economic migration in the most productive agegroups.8
Rural to urban migration accounts for nearly 40 per cent of inter-satemigration. Another 27 per cent is urban to urban migration. The rest isrural-rural and urban-rural migration. The most popular destinations ofinter-state migration were Maharashtra, Delhi, Gujarat, Haryana andKarnataka in the decade between 1991-2001.9 West Bengal and Rajasthanare also significant destinations of inter-state migration. While one reasonfor migration before 1991 was natural calamities, i.e., distress migration,after 1991, work and employment along with business became veryimportant accounting for roughly 40 per cent of the total migration.10 Themajor destination states are precisely those which have shown the highestincrease in the state domestic product (SDP) with an average rate of growthexceeding 9 per cent during 1991-2001. States from which the maximumnumber of migrants came were Bihar and Uttar Pradesh, which areprecisely the states which have grown the slowest during the decade 1991-2001, again emphasising the importance of pull factors.11
This trend has been substantiated by other studies, which show thatrural migrants from Bihar to rural Punjab in the early 1990s, have nowchanged their migration destination to urban centres in Delhi, Maharashtra,Karnataka and even Rajasthan (Karan, 2003). Similarly, rural to ruralmigration from tribal Orissa in the 1980s has now shifted to urban centres
7. Census (2001).
8. Ibid.
9. Ibid.
10. Ibid.
11. Ibid.
95INTER-STATE MIGRATION AND TRICKLE-DOWN EFFECT
in Delhi, Kolkata and Mumbai (Jha, 2005). Remittances have also had apoverty reducing role in the decade between 1991-2001. Migrants had abetter diet, spend more on education and health than non-migrants. Theeffects of migration on inequality is mixed and contextual (Karan, 2003).
Anti-migration policies include restricted access to public services bybelow poverty line (BPL) cardholders to food, education and health care inthe destination cities. Rural employment programmes are also expected toreduce migration especially to urban areas. Regular slum clearances are alsoexpected to discourage migration. The recent slogan of ‘Maharashtra forMaharashtrians’ is the most regressive anti-migration political move.12
An Analysis of the Economic Conditions of theAn Analysis of the Economic Conditions of theAn Analysis of the Economic Conditions of theAn Analysis of the Economic Conditions of theAn Analysis of the Economic Conditions of theStates of Origin: The PStates of Origin: The PStates of Origin: The PStates of Origin: The PStates of Origin: The Push Fush Fush Fush Fush Factorsactorsactorsactorsactors13
Bihar was one of the slow growing states of India till 2005 and had aper capita income of about half the national average. A total of 30.6 percent lived below the poverty line against India’s average of 22.15 per cent in2005.
The rate of inter-state out-migration from the state increased by over132 per cent over the period 1991-2001. Roughly 80 per cent of the totalmigrants from Bihar were inter-state, and of the total labour force inter-state migrants accounted for roughly 8 to 10 per cent.14 As most inter-statemigrants captured by the Census from Bihar were of a long-term nature,their remittances would also have an important role to play in the economyof Bihar. The most significant effect of remittances from migrants may bereflected in the literacy rates in Bihar. The male literacy rate went up to60.32 per cent in 2001 from 51.47 per cent in 1991, while the femaleliteracy rate went up to 33.57 per cent in 2001 from 21.99 per cent in1991.15
12. “Raj Thackeray says his Struggle for a Maharashtra for Maharashtrians willContinue”, Saturday, February 9, 2008. http://www.thaindian.com/newsportal/india-news
13. The information in this section has been obtained from India Fact Sheet 2009.
14. Census (2001).
15. http://gov.bih.nic.in/Profile/CensusStats-03.htm

96 INDIA EMERGING • VEENA JHA
The economy was mainly based on agricultural and trading activities.The vast swath of extremely fertile land made it ideal for agriculture. Despitea number of rivers and good fertile soil, investment in irrigation and otheragriculture facilities has been grossly inadequate. Previously, there were a fewhalf-hearted attempts to industrialise the state: an oil refinery in Barauni, amotor scooter plant at Fatuha and a power plant at Muzaffarpur. However, nosustained effort had been made in this direction, and there was little successin its industrialisation. All these factors led to substantial out-migration fromBihar to other states during the 1990s.16
Uttar Pradesh (UP) has witnessed significant outflow of migrants toother states. In 2001 Census, 3.8 million migrated out of the state. Theratio of the two sexes among the out-migrants from the state is skewed infavour of males. The rate of inter-state out-migration increased by about 73per cent between 1991 and 2001. Of the total working population, inter-state migrants account for roughly 10 per cent.
Uttar Pradesh is also a predominantly agricultural economy, withagriculture accounting for roughly 73 per cent of the total employment and46 per cent of the state SDP. In the last decade, industrialisation andservices have also become important in the state economy. Nearly 40 percent of the total population of UP lives below the poverty line, whichaccounts for the high proportion of inter-state migration to high growthstates from UP.17
Orissa has abundant natural resources and a large coastline. Itcontains a fifth of India’s coal, a quarter of its iron ore, a third of its bauxitereserves and most of the chromite. Rourkela Steel Plant was the firstintegrated steel plant in the public sector in India. It receivedunprecedented investments in steel, aluminium, power, refineries andports. India’s topmost IT consulting firms, including Satyam ComputerServices, Tata Consultancy Services (TCS), MindTree Consulting,Hexaware Technologies, PricewaterhouseCoopers and Infosys have largebranches in Orissa. IBM, Syntel, Bosch and Wipro are setting updevelopment centres in Orissa. So far, two of the S&P CNX 500conglomerates have corporate offices in Orissa viz., National Aluminium
16. Ibid.
17. www.planningcommission.gov.in

97INTER-STATE MIGRATION AND TRICKLE-DOWN EFFECT
(2005 gross income Rs 51,162 million) and Tata Sponge Iron (2005 grossincome Rs 2,044 million).
The Central government has agreed to accord special economic zone(SEZ) status to eight sites in Orissa among which are Infocity atBhubaneswar and Paradip. Orissa has a population of 32 million.
These developments have slowed out-migration from Orissa tootherstates. Orissa no longer ranks among the top states which have highrates of out-migration.18
West Bengal had the third largest economy (2003–04) in India, with anet state domestic product (NSDP) of US $21.5 billion. During 2001–02,the state’s average SDP was more than 7.8 per cent—outperforming thenational GDP growth. The state has promoted foreign direct investment,which has mostly come in the software and electronics fields; Kolkata isbecoming a major hub for the information technology (IT) industry.However, the rapid industrialisation process has given rise to debate overland acquisition for industry in this agrarian state. NASSCOM–Gartnerranks West Bengal power infrastructure the best in the country. WestBengal’s SDP grew in 2004 with 12.7 per cent and in 2005 with 11.0 percent. The rate of out-migration from West Bengal slowed down between1991 and 2001.19
The other big source of out-migration is the northeast of India,especially Mizoram, Tripura and Nagaland. The great majority ofMizoram’s population comprises several ethnic tribes who are eitherculturally or linguistically linked. A significant proportion of the populationaccount for all kinds of migration as life in Mizoram is difficult.
Tripura’s GSDP for 2004 was estimated at $2.1 billion in currentprices. Agriculture and allied activities was the mainstay of the people ofTripura and provides employment to about 64 per cent of the population.There is a preponderance of food crop cultivation over cash crop cultivationin Tripura. At present about 62 per cent of the net sown area is under foodcrop cultivation. Paddy is the principal crop, followed by oilseed, pulses,
18. Census (2001).
19. Census (2001).

98 INDIA EMERGING • VEENA JHA
potato and sugarcane. Tea and rubber are the important cash crops of thestate.
Tripura ranks 22nd in the human resource development index and24th in the poverty index in India according to 1991 sources. The literacyrate of Tripura is 73.66 per cent, higher than the national rate of 65.20 percent. Out-migration from Tripura especially in the services sector tends tobe high.20
Agriculture is the most important economic activity in Nagaland, withmore than 90 per cent of the population employed; crops include rice, corn,millets, pulses, tobacco, oilseeds, sugarcane, potatoes and fibres. However,Nagaland still depends on the import of food supplies from other states.The widespread practice of jhum—clearing for cultivation—has led to soilerosion and loss of fertility, particularly in the eastern districts. Nagas out-migrate to several states of India and work in various capacities includingdomestic help.21
An Analysis of the Major Destination States:An Analysis of the Major Destination States:An Analysis of the Major Destination States:An Analysis of the Major Destination States:An Analysis of the Major Destination States:The PThe PThe PThe PThe Pull Full Full Full Full Factorsactorsactorsactorsactors
Maharashtra witnessed largest in-migration of population between1991-2001 from different states. The total number of in-migrants into thestate was 3.2 million. Out of 3.2 million in-migrants from other statesduring the past decade, 2.6 million (or 79.6 per cent) moved into urbanareas. Important states from where they migrated into Maharashtra wereUttar Pradesh (0.9 million), Karnataka (0.4 million), Madhya Pradesh (0.27million), Gujarat (0.24 million), Bihar (0.22 million) and Andhra Pradesh(0.19 million). Among inter-state male migrants, work/employment hasbeen cited as the primary reason for migration (e.g., Uttar Pradesh: 73.0per cent; Bihar: 79.1 per cent).22
Delhi, is the next in series, which attracted very high number ofmigrants from other states in the last decade. Total number of in-migrantsin Delhi between 1991-2001 years was 2.2 million. Major influx of
20. Census of India (2001).
21. http://www.mapsofindia.com
22. Census (2001): Tables D1, D2 and D3.

99INTER-STATE MIGRATION AND TRICKLE-DOWN EFFECT
population into Delhi was from Uttar Pradesh (0.88 million), Bihar (0.42million) and Haryana (0.17 million). Sex ratio of net migrants into Delhiwas only 673 females per 1,000 males. Migrants from all these states cited‘work/employment’ as the most important reason for migration during thelast decade.23
Punjab is another state with interesting migration profile. Though thetotal number of migrants from outside the state and outside the country are0.81 million and 0.02 million respectively, there is significant out-migration from the state (0.5 million). The number of male out-migrants isless than female out-migrants. As a result, the net migrant in to Punjab isonly 0.33 million, the sex ratio stacked highly in favour of males (313females per 1,000 males). States from where sizeable number of in-migrants came to Punjab are: Uttar Pradesh (0.24 million); Haryana (0.11million) and Bihar (0.14 million). Male in-migrants from Uttar Pradeshand Bihar cited ‘work/employment’ as the main reason for migration (72.1per cent and 82.2 per cent respectively).24
There are clearly multiple rationales for the use of migrant labour indestination areas. While shortages of local labour provides one importantrationale, virtually all available evidence shows that recruitment ofimmigrants is as much motivated by strategies of labour control and wagecost reduction (Singh and Iyer, 1985; Oberai and Singh, 1980).
The Missing Element in Migration Analysis:The Missing Element in Migration Analysis:The Missing Element in Migration Analysis:The Missing Element in Migration Analysis:The Missing Element in Migration Analysis:Land in IndiaLand in IndiaLand in IndiaLand in IndiaLand in India
Apart from these push and pull factors, one issue which is veryimportant for explaining migration in India relates to land use. AlthoughIndia occupies only 2.4 per cent of the world’s land area, it supports over15 per cent of the world’s population.25 This immediately puts it in thecategory of land-scarce countries. The imminent shift in land fromagriculture to urban use and industry constitutes an important source ofpotential productivity gain. Land is a critical input that is needed to keepthe development process moving, allowing for the shift of people from the
23. Ibid.
24. Ibid.
25. http://www.state.gov/r/pa/ei/bgn/3454.htm

100 INDIA EMERGING • VEENA JHA
rural to the urban sector. Access to land is needed for factories, housingprojects and to create tens of millions of jobs in construction in the short-run, as well as longer-run jobs. Witness the development of the NationalCapital Region around Delhi, the development of the Mumbai-Puneindustrial corridor, the development of peri-urban areas around Bangalore,Jaipur, Hyderabad, Lucknow and now even some of the lesser towns suchas Patna in Bihar (Shaw and Satish, 2005). While this move started duringthe 1980s, it accelerated in the high growth periods of 1990s and from2000 onwards. Land prices around towns have increased, rural landownershave often sold their land upto a 100 km radius from the metro cities. Thediscounted value of land price premiums is obviously much higher than astream of lifetime earnings from agriculture. However, wealth effects asmost economists know is not similar to income effect. Do these peoplewho sell their land then swell urban slums or do they participate in thehigher productivity uses of land?
When land moves from low-productivity agriculture to urban use andhigher productivity sectors, overall productivity improves. However, Indiawould need investments in agriculture to boost productivity, especially inrural connectivity, storage, etc., to improve the yield of remainingagricultural land. The creation of the new SEZs holds the potential oftransforming the productivity of agricultural land. For example aMaharastrian village decided to develop a SEZ from village land which hasceased to become productive.26 At the same time the protests, deaths andkilling at Nandigram in West Bengal when land had to be acquired forconstructing a SEZ shows that the population was resistant todispossession of land.27 So again there is likely to be a divergence in landuse patterns between rich and poor states.
Productivity gains for the economy tend to be a cumulative process.Higher productivity leads to more confidence and increased openness, whichmeans more technology and investment, and sustained productivity growth.The building of highways will not only lower costs for companies but alsoenable rural-urban migration, development of cities and the process of
26. SEZs and Land Acquisition: Factsheet for an Unconstitutional Economic Policy.http://www.sacw.net/Nation/sesland_eng.pdf
27. Ibid.

101INTER-STATE MIGRATION AND TRICKLE-DOWN EFFECT
moving land from agriculture to industry and services. These in turn attractmore investment through agglomeration effects, and thus sustain growth.However, not all states of India are likely to improve their productivitysimultaneously. Growth is likely to proceed in concentric circles around thehigh growth metros and high growth states. In these circumstances, inter-state migration becomes a viable option for spreading the benefits of growth.
In India, labour is nearly four times more productive in industry andsix times more productive in services than in agriculture, where there is asurplus of labour (Goldman Sachs, 2007). Indeed, economic theory tells usthat as labour moves from low-productivity sectors such as agriculture tohigh-productivity sectors such as industry or services, overall output mustimprove. Lewis (1954) had already established the notion of gains to labourproductivity in both sectors due to the movement of surplus labour fromagriculture to industry. The gain is relatively small as migration is still in itsinitial stages. Goldman Sachs (2007) estimates that the output gains due tolabour migration from agriculture to services and industry has contributedupwards of 0.9 percentage point to overall growth. The gains are roughlyequally split between agricultural labourers moving to industry and toservices.
Given that the movement from agriculture to other sectors (which inIndia’s case is roughly equivalent to the move from rural to urban areas) isstill in its initial phase, it is expected that the gains will continue toincrease for several decades. Indeed, agriculture still employs close to 60per cent of the labour force with negative marginal productivity (GoldmanSachs, 2007).
According to Goldman Sachs (2007) projections, another 140 millionrural dwellers will move to urban areas by 2020, while a massive 700million people will urbanise by 2050. This is because India’s urbanisationrate of 29 per cent is still very low compared to 81 per cent for SouthKorea, 67 per cent for Malaysia and 43 per cent for China. Rural-urbanmigration in India has the potential to accelerate to higher levels, asjudging by the experiences of other countries, migration tends to hastenafter a critical level of 25-30 per cent urbanisation is reached, and fastereconomic growth considerably increases the rate of migration.

102 INDIA EMERGING • VEENA JHA
The effects of land scarcity and falling agricultural productivity hasalso been reflected in the 2001 census. The rates of urbanisation in 2011stood at nearly 32 per cent of which a large proportion was accounted for bythe redesignation of rural land to urban land. This overall figure bearstestimony to the fact that rural land is being sold for urban usages.
III
Effects of Migration: ReviewingContrasting Views
One of the first studies to look at the effects of migration on equitywas a study by Bhanumurthy and Mitra (2003). This study decomposedchanges in poverty into a growth effect, an inequality effect and a migrationeffect for two periods: 1983-1993/94 and 1993/94-1999/2000. Thedecomposition analysis showed that rural-to-urban migration contributedto poverty reduction in rural areas by 2.6 per cent between 1983 and 1993-1994. Poverty in the urban sector increased during the same period, but bya smaller rate than the reduction of poverty in rural areas. Therefore, thenet poverty incidence for the country as a whole decreased over the periodstudied. Similar findings were reported for the 1993/94-1999/2000 period.Rural poverty declined by 1.64 per cent as a result of rural to urbanmigration, while urban poverty increased by 1.43 per cent. The first periodwas a higher growth period than the second one.
Older studies on migration (Ramana Murthy, 1991; Rao, 1994; Reddy,1990) emphasised the distress dimensions of migration, where it wasregarded as a means of survival in a situation of drought, crop failure andpoor terms of trade. Thus, push factors dominated migration.
Later research has shown that sending one or more persons to work ina distant location for part of the year has become a livelihood strategy formany rural households (Rao, 2001; Deshingkar, 2004). Village studies fromIndia conducted from 1995-2000 show a marked increase in temporarymigration. While some of these studies are based on surveys of villages(Singh and Karan, 2001; Karan, 2003; Dayal and Karan, 2003), others haveused recall to arrive at this conclusion (Rao, 2001; Dayal and Karan, 2003;Rogaly et al., 2001; Rafique and Rogaly, 2003).
103INTER-STATE MIGRATION AND TRICKLE-DOWN EFFECT
A major attraction for the poor working in the farm sector is the part-payment in cooked food. Although this has been perceived as exploitativeby some, the labourers themselves see it as an important way of coping andsurviving during economically lean times when casual work in the citiesmay be scarce. In fact rural to rural migration has resulted in a high level ofremittances to the state of origin, considerably alleviating poverty in thehouseholds which receive remittances. The same can be observed forhouseholds which send maids from the northeast, as consumption indestination states does not eat away a large part of the earnings of themigrants.28
In contrast to the trickle-down theory, studies have emphasised theabysmal living conditions of migrants in urban areas. Most migrants live inopen spaces or makeshift shelters in spite of the Contract Labour Act(1970) which stipulates that the contractor or employer should providesuitable accommodation (Ministry of Labour, 1991; NCRL, 2011). Foodcosts more for migrant workers who are not able to obtain temporary rationcards. Labourers working in harsh circumstances and living in unhygienicconditions suffer from serious occupational health problems and arevulnerable to disease. As there are no crèche facilities, children oftenaccompany their families to the workplace to be exposed to health hazards.They are also deprived of education: the schooling system at home does nottake into account their migration pattern and their temporary status in thedestination areas does not make them eligible for schooling there (Rogaly etal., 2001).
The effects of migration on the conditions of living in the rural areasaccording to different studies may also not be positive. Male out-migrationhas been seen to influence the participation of women in the directlyproductive sphere of the economy as workers and decision-makers andincrease the level of their interaction with the outside world. The impact ofmale migration can be especially adverse for girls, who often have to bearadditional domestic responsibilities and take care of younger siblings. Theabsence of male supervision further reduces their chances of acquiringeducation (Srivastava and Sasikumar, 2003).
28. Author’s own survey. See Section V for stylised facts from the survey.

104 INDIA EMERGING • VEENA JHA
Why does Migration TWhy does Migration TWhy does Migration TWhy does Migration TWhy does Migration Take Place at All?ake Place at All?ake Place at All?ake Place at All?ake Place at All?What is the Counterfactual?What is the Counterfactual?What is the Counterfactual?What is the Counterfactual?What is the Counterfactual?
Some studies do show that seasonal out-migration potentially has theeffect of smoothing out employment over the annual cycle. While rural out-migration could in theory cause a tightening of the labour market in somecircumstances, empirical evidence from out-migrant areas does not oftenattest to this (Connell et al., 1976; Srivastava, 1998). However there is alsoevidence that greater mobility of rural labour households has led to a lessisolated and more generalised agriculture labour market and an upwardpressure on wages (Bird and Deshingkar, 2008).
Field evidence right from the 1970s has established that the informalsector presents a strong pull in the process of migration and can in factreduce poverty (ILO, 1972). Harris (2004) cites the example of Bangalorewhere the urban slum and squatter population doubled from 1.12 millionin 1991 to 2.2 million in 1998/99, a period in which poverty in the state ofKarnataka, of which Bangalore is the capital, fell from 54 to 33 per cent.
Contrary to the expectations of earlier migration theories, a majority ofworkers never ‘graduate’ to formal sector employment but remain in theinformal sector. ‘In many economies, the character of the informal sector asdynamic and growing is sharply accentuated when juxtaposed against astagnant and shrinking formal sector ’ (Phillipson, 2004). Indeed severalobservers suggest that migrants have been able to escape poverty, even byremaining in the unorganised sector. A study of migrant labour in Delhislums showed that with experience, migrants were likely to move from lowincome, casual jobs to higher income, regular jobs (Gupta and Mitra, 2002).A study on West Bengal showed that migration was a way of accumulating auseful lump sum, rather than simply surviving (Rogaly and Coppard, 2003).Migration has allowed numerous lower caste people in Madhya Pradesh andAndhra Pradesh to break out of caste constraints (which are especially strongin rural areas of India), find new opportunities and escape poverty(Deshingkar and Start, 2003). Papola (1981) noted in the case of Ahmedabadcity in India that although a majority of the migrants were in the informalsector employment, their urban earnings after migration were double theirrural earnings. It has also been noted that urbanisation of the poor had the

105INTER-STATE MIGRATION AND TRICKLE-DOWN EFFECT
potential to bring many more of the poor to the locations most favourable toovercoming poverty (Harris, 2004).
The ‘pull’ of informal sector work in urban areas is partly explained bythe persistence of low wages in rural areas. In India nearly 40 per cent ofthe working population is employed as agricultural labourers (Shanmugamand Vijaylakshmy, 2005). Agricultural labourers are one of the mostdispossessed and socially and politically deprived groups. They are usuallyfrom the lower castes that were historically disadvantaged. Agriculturallabour contracts are verbal almost everywhere and the terms for thelabourer range from exploitative to remunerative. The strongestdeterminant of wages is agricultural productivity with high-productivitycrops offering the highest wages. However in low-productivity situations,wages are low and often lower than the statutory minimum because of themonopoly or monopsony power exercised by landlords and other locallypowerful people in controlling access to credit and employment andkeeping wages down. The poor are usually trapped in a situation ofpermanent debt and are in ‘interlocked’ trading arrangements where theysell (labour) cheaply and buy (credit, food etc.) expensively from theirpatrons. Owing to the highly seasonal nature of rainfed farming, mostlabourers traditionally do not earn enough throughout the year to escapedebt and do not have the capital, skill or connections to diversify into otheroccupations. Migration offers them an option to earn during the leanseason, escape local caste domination and save money.
Are Remittances used for Alleviating Poverty or forGenerating Income Earning Assets?
In some regions of the country, one-quarter to one-third of thehouseholds receive remittances. Field studies show that a majority ofseasonal migrants either remit or bring home savings. In many cases, asubstantial proportion of household cash income is attributed to migrantearnings (Haberfeld et al., 1999; Rogaly et al., 2001; Mosse et al., 2002).Moreover, it does appear that the income and consumption level of migranthouseholds is generally higher than that of similarly placed non-migrants(Sharma, 1997; Krishnaiah, 1997).
Remittances are mainly used for purposes like consumption,repayment of loans and meeting other social obligations. These constitute,

106 INDIA EMERGING • VEENA JHA
in effect the ‘first charge’ on migrant incomes. The evidence on investmentis, however, mixed. Investment by migrant households on housing, landand consumer durables is common and migrant income is also used tofinance working capital requirements in agriculture (de Haan et al., 2000).
The major category on which remittances are spent is the repayment ofdebts. In some cases, it was the primary reason for migration. Theseincluded borrowing for agricultural purposes, health, boring of wells,marriages and festivals. In the absence of formal institutional credit to caterto the varied needs of migrants, private moneylenders have been used, butare the last resort due to the steep price in terms of high interest rates(Krishnaiah, 1997; Rao, 1994; Ravinder, 1989; Reddy, 1990).
Remittances are also utilised for health: 42 per cent of the migrantsspent their earnings on health both at the destination and at the origin(Krishnaiah, 1997). The households utilised the remittances and tookfurther loans often falling into debt due to expenditure for health and as aresult of accidents at the workplace. As a result of the unhygienicconditions in which migrant workers are forced to live at the destination,they fall victim to all sorts of chronic diseases like diarrhoea, tuberculosis,jaundice and malaria. Their health is also affected by the poor quality food,the long working hours and the nature of their work, which often includesdoing demanding, heavy manual work. They are deprived of public healthfacilities at the destination due to their temporary status, and visitingprivate hospitals is expensive and therefore not affordable. They carry thesediseases with them when they return to the village (Krishnaiah, 1997).
Several households invest remittances in agricultural activities, whichinclude the purchase of land and agricultural inputs like seeds, fertilisersand digging wells. It can be seen clearly in the villages that in spite of theaccumulation of resources through long periods away, migrants whoinvested their remittances in agriculture-related activities still failed to getreturns due to continuous drought and other institutional factors. Thisclearly attests to the necessity in these cases of moving out of agriculture tonon-agricultural activities (Samal, 2006).
Remittances also went toward meeting the social expenditures of thehouseholds such as marriages and festivals. Remittances were sometimesinvested in house construction especially in the case of long-term migrants(Samal, 2006).

107INTER-STATE MIGRATION AND TRICKLE-DOWN EFFECT
Around 37 per cent of migrant households in particular areas investedtheir remittances in buying land and boring wells. A large number ofhouseholds also invested remittances in buying livestock and somemembers of the migrant households went into vegetable vending. In a fewinstances, migrants have invested their remittances in buying tractors forthe village, which they rent out, or auto rickshaws for local transportation,one migrant household has set up a small kirana (grocery) shop in thevillage. Many migrants have supplemented the lump sum amount ofremittances with additional loans from private companies to undertakeincome generating activities, like buying tractors (Samal, 2006).
On the significance of remittances, it was believed by many scholars fora long time that remittances form an insubstantial part of village income. Itwas estimated that remittances accounted for only 2-7 per cent of villageincomes, and less for poor labourers (Lipton, 1988; Connell et al., 1976).However, new evidence suggests that this is not necessarily the case.Deshingkar and Start’s (2003) research in unirrigated and forested villages ofMadhya Pradesh showed that migration earnings accounted for more thanhalf of the annual household earnings. In the more prosperous state ofAndhra Pradesh the overall contribution was much lower but in the villagethat was unirrigated and poor, migration remittances contributed to 51 percent of household earnings (Deshingkar and Start, 2003). Moreover,migration income was both from farm and non-farm sources and the relativeimportance of each depended on the particular skill base and historicalmigration pattern (Lakshmansamy, 1990). Recent research from Biharsuggests that migrant incomes contribute nearly 12 per cent of the state’sSDP (Gerry Rogers, 2012, Forthcoming paper for the Institute ofDevelopment Studies, Delhi).
Additional questions that arise with respect to migration is when andunder what circumstances are migrants likely to send higher remittances tothe states of origin. This has significant implications for trickle down ashigher the remittances, quicker the trickle-down effects of growth. Studieshave found that seasonal and contractual labourers make regular andsubstantially greater remittances than short-term migrants. The majority ofmembers (75%) migrating from 1990 onwards had not been able to savemuch due to the high cost of living at the destination. The hierarchy ofexpenses for migrants are food, rent for living and other expenses, such as

108 INDIA EMERGING • VEENA JHA
health. Other major determinants of remittances are the size of the household,number of dependents (elderly people and children) and purpose (clearingdebts, productive investment, consumption, among others). Large familiesusually send more members to urban areas to increase earning potential whilethe rest of the family take care of the household agricultural activities. Factorscontrolling the amount and duration of remittances are determined by theavailability of work and the financial necessities at home. The duration ofmigration also mattered as staying for long periods especially in places likeMumbai, Hyderabad and Bangalore enabled migrants to earn more(Deshingkar, 2004).
To sum up, the existing literature on migration in India shows that inmany cases it may alleviate poverty, but the overall picture is ambiguous.To obtain a wholistic and macro picture on the poverty alleviating results ofmigration other variables such as convergence of incomes should beexamined. In theory, inter-state migration should also contribute to theconvergence of state level rates of growth around the national average. Itshould also lead to a convergence in poverty rates which may be moresensitive to inter-state migration than per capita incomes. This is becausethe latter is particularly influenced by income inequalities. Moreover,poverty convergence is more likely to be sensitive to inter-state migrationbecause it is the poor who constitute the majority of the migrants. Thenext section examines this hypothesis with the help of Census and CSOdata bases as well as case studies conducted by the author.
IV
Convergence between States andWhether Inter-State Migration has a Role to Play
Views on convergence of growth rates between states differ. Furthereven studies which find that there has been convergence do not necessarilyexamine the role of inter-state migration in bringing this about. Some findevidence of convergence after controlling for initial economic conditions(Cashin and Sahay, 1996; Aiyar, 2001). Others find evidence of divergence(Rao et al., 1999; Bajpai and Sachs, 1996). Various studies have madeopposing claims of the effects of globalisation on convergence though few

109INTER-STATE MIGRATION AND TRICKLE-DOWN EFFECT
have conducted statistical tests. Bhattacharya and Saktivel (2004) andKumar (2004) assert that growth rates have diverged during the reformperiod, whereas Ahluwalia (2002) asserts that growth rates have converged.
One of the few studies which analyses the effects of inter-statemigration on convergence is by Cashin and Sahay (1996). The study claimsthat over 1961–1991, the dispersion of real per capita incomes across theIndian states had widened, except for the subperiods 1962–1968, 1972–1975, 1977–78 and 1980–1984. The dispersion of real per capita NDPacross the states narrowed between 1961 and 1971 owing to robust growthrates in initially poor states (Manipur, Kerala and Himachal Pradesh) andslow growth rates in initially rich states (Delhi, West Bengal andMaharashtra). However, in the 1971–1981 and 1981–1991 subperiods, theinitially poor states (Manipur, Bihar and Orissa in 1971; Bihar, Assam andOrissa in 1981) and the initially rich states (Delhi, Punjab and Haryana in1971; Delhi, Punjab and Maharashtra in 1981) had similar rates ofeconomic growth.
An important mechanism by which differences in cross-regional percapita incomes can be equalised within national economies is bypopulation movements from relatively poor to relatively rich states. Therelationship between the annual average net immigration rate between1961 and 1991 and real per capita income in 1961 was visibly positive,which is evidence in favour of the proposition that net immigration ispositively affected by cross-state differentials in per capita incomes (Cashinand Sahay, 1996).
Migration from poor to rich states should accelerate the speed ofconvergence of per capita incomes across the 20 states of India. Aftertaking into account exogeneous shocks and the effect of migration, theresults of this study yield the same rate of convergence (of about 1.5 percent per year) as when only exogeneous shocks were considered (Cashinand Sahay, 1996). This suggests that the process of migration has had littleeffect on the convergence of per capita incomes across the states of India.
The essential question that this chapter seeks to answer is whetherthe magnitude and effects of inter-state migration during the period of highgrowth following 1991 led to poverty convergence.

110 INDIA EMERGING • VEENA JHA
Three growth periods have been identified. The first is from 1980-1990. The second from 1990-1995 and the third from 1995-2000. Statedomestic product (SDP) data has been obtained from the Central StatisticalOffice (CSO). Migration data has been obtained from the Census and tothat extent it only captures permanent migration. However, if circularmigration or temporary migration were to be included, the correlationsobtained would be much more robust as it is estimated that temporarymigration accounts for the movement of about 10 million people on anannual basis (Banerjee, 2004).
Several relationships which examine the contribution of migration toconvergence have been examined. First of all the initial gap in the SDPfrom the national average was taken as an explanatory variable indetermining the convergence of per capita income. The assumption was:higher the initial state SDP, higher should be the convergence of per capitadomestic product with the national average. Secondly, the level of assetformation in the state of origin of the migrants was considered. Againeconomic logic dictates that higher is the asset formation in the state oforigin, higher should be convergence of per capita domestic product.Poverty level was taken as another explanatory variable. Again it isassumed that higher the poverty level in a state, lower will be itsconvergence from the all India average per capita income.
Data Sources: The data for state level per capita SDP and SDP wasbeen obtained from the CSO. The data for migration has been obtainedfrom the Census 2001, tables D1, D2, and D3. The data for poverty hasbeen obtained from the National Sample Surveys (NSS) at the state level.The data for asset formation refers to informal sector asset formation andhas been obtained from Marjit and Maiti’s (2005) paper on the informalsector.
The convergence variable was standardised by dividing with theoverall standard deviation. This was to reduce the importance of extremevalues in the data set and to normalise the series.

111INTER-STATE MIGRATION AND TRICKLE-DOWN EFFECT
Table 2.1
Abbreviation of Variables
GpDP Gap in the state domestic product from the national averageIas Growth of asset in the state of originPov Share of population below poverty levelDiAI Difference from All India per capita incomeRom Percentage of out-migrated people over state populationStd_ Standardised variableLn Log of variable*** Significant at 1 per cent** Significant at 5 per cent* Significant at 10 per centStandard deviations are in parenthesis
Table 2.2
Summary of Variables
Mean Median Std.
GpDP 0.11 0.10 0.05
Ias 58.44 46.26 46.32
Pov 32.18 34.75 11.1
DiAI -.00 2398 8972
Rom 0.03 0.02 0.03
Note: Thus, std DiAI= PCDP of ith state-AIPCDPStandard deviation
And
Std DiAI= F(Rom, pov, Ias, GpDP)
Table 2.3
Convergence of Per Capita Incomes across States
Dependent Variable: Std_ DiAIExplanatory Variables
Ln_Rom -0.60*** (0.21)
Pov 0.048*** (0.01)
R-sq 0.57
Adj-Rsq 0.53
Root MSE 0.68
No Obs 27
Of all the variables examined above, only inter-state migration and theinitial poverty level was found to satisfy statistical significance tests in
112 INDIA EMERGING • VEENA JHA
explaining convergence. The other variables were not found to be significant.The fact that the initial gap in SDP was not found to be significant isexplained by the fact that some of the most populous but poor statesnevertheless have high SDPs. These include Uttar Pradesh and West Bengal.Similarly asset formation in the state of origin was not found to play a majorrole in determining convergence because migrants may not be investing inassets in their home states, but on the other hand may be acquiring assets intheir state of destination. This is also supported by the fact that the Censusdata by and large captures permanent migration. The survey conducted bythe author and other surveys show that while permanent migrants sendremittances, they build assets in the state of destination.
The results of the above regressions show that migration contributes toconvergence both in terms of absolute values and in the standardisedvariable. The difference in the per capita product from the national averagedecreases with increasing out-migration rates. Moreover higher the initiallevels of poverty, higher is the divergence. This result does indicate that whilehigher poverty rates are associated with higher difference between the stateand the national average domestic product, inter-state migration acts as anintermediating variable leading to convergence in the SDP per capita to thenational average.
It should be understood that the empirical findings listed above areonly partial equilibrium results. At any point of time there may be manyother factors that could lead to divergence between per capita SDPs, such asland distribution, better focus of infrastructure in some states etc. What isimportant is to understand that the absence of inter-state migration wouldmake convergence difficult, i.e., the regression only establishes thecounterfactual. The absence of migration could lead to further divergence.
Apart from per capita incomes, to establish the trickle-down effects ofinter-state migration, it may be more useful to examine either povertyconvergence or human development value (HDV) convergence. This isbecause per capita income may be skewed by the higher income groups andneed not capture the effects of inter-state migration on the lowest incomegroups. Moreover, GSDP figures may not be reliable. For example, WestBengal emerges as the state that has the highest growth rate of GSDP atconstant 1993/94 prices of 7.05 per cent per year between 1993/94 and
113INTER-STATE MIGRATION AND TRICKLE-DOWN EFFECT
2004/05. Our knowledge of the Indian economy leads us to state that thisis not credible. It is true that the CSO makes some corrections on theGSDP data but the original data on production and prices reported bystatistical departments of states is not tampered with in any way. Not onlyare GSDP figures unreliable but they are also, strictly speaking, notcomparable across states.
Thus both from the view of equity as well as trickling down thebenefits to the poor, it may be better to look at poverty figures. Thedependent variables thus becomes a standardised poverty convergencevariable and a standardised human development index (HDI) variable. Toget robust results, the series on migration derived from the Census hasbeen extended to 2004-05. The method used to extend the series isdescribed below.
Methodology in ComputationMethodology in ComputationMethodology in ComputationMethodology in ComputationMethodology in Computation
First year-on-year percentage change in poverty level (Pov), humandevelopment value (HDV) and per capita income between 1990 and 2000 iscalculated at the all-India level using data from the Human DevelopmentReport of the UNDP, data on poverty from the NSS, and data on per capitaincome from the CSO. Next, overall elasticities are obtained by dividingpercentage change of HDV and percentage change in poverty by percentagechange of per capita income for each year. These are then averaged out toget a unique value for the entire period 1990-2000.
These elasticities are then multiplied with percentage change in SDPfor each year and each state for the period 1993-2004/05. This gives us thepercentage change in poverty and HDV, for each year for each of the 20states during the period 1993 to 2004/05. Next using the absolute value ofpoverty and HDV of 1993 (as a starting point ) each years Pov and HDV iscalculated for the years 1993-2004/05. Next for each year, the differencebetween state-level Pov and HDV, and all-state average, for each year iscalculated to give a measurement of convergence of these variables. Theseare used as dependent variables in this regression.
Using the elasticity estimates of the first equation, the series on out-migration is extended upto 2004/05. Using GSDP for each year for each

114 INDIA EMERGING • VEENA JHA
state, the estimated values of rate of out-migration are calculated for theentire period.
Regression of Convergence of Poverty andHDV and Growth of Informal Sector Wage
The first relationship that was measured was the correlation betweenpoverty and HDV. This was done to examine whether they were correlatedand if so both the variables would need to be examined separately indetermining the underlying chain of causation introduced by inter-statemigration. What is interesting is that the relationship between poverty andHDV works at lower rather than higher levels of poverty. Thus, if thepopulation below the poverty line is below 33 per cent, the correlationbetween HDV and poverty is very high, but becomes much lower whenpoverty is higher than 33 per cent. Thus for states like Bihar and UP, whichhave poverty levels well above 33 per cent, it is to be expected that HDVwould only be weakly correlated with poverty. This further emphasises theimportance of measuring the effects of inter-state migration on poverty andHDV separately.
Table 2.4
List of Abbreviations
Dpov Difference of percentage population below poverty line, between the state andall-India level. (state poverty – all-India level poverty).
DHdv Difference of human development value, between state and all-India level. (statehuman development value – all-India level value).
Ln_Rom Log of percentage of out-migration.Year Year is a time variable.Rom Rate of out-migration.Hdv Human development value.Pov Per cent of population below poverty line.CIfWg Growth in informal sector wage.*** Significance at 1 per cent.** Significance at 5 per cent.
Table 2.5
Correlation between HDV and Pov
In aggregate -0.58
If per cent of population below poverty line is above 33 per cent -0.13
If per cent of population below poverty line is below 33 per cent -0.79
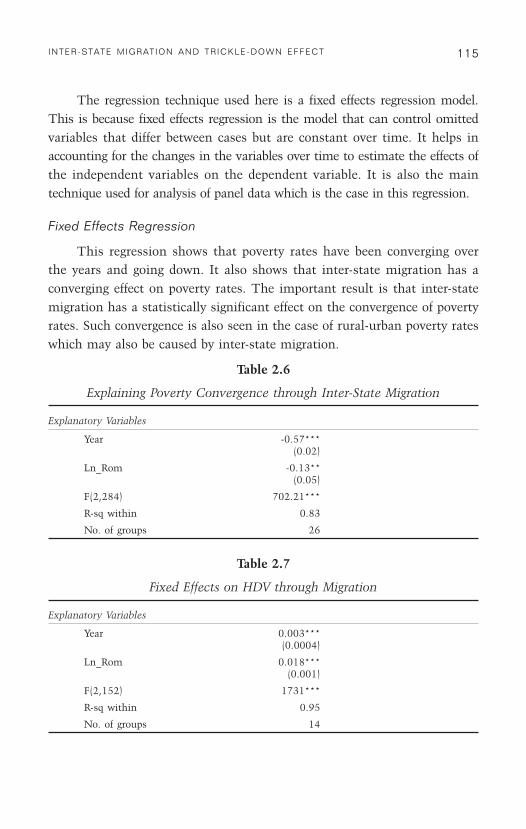
115INTER-STATE MIGRATION AND TRICKLE-DOWN EFFECT
The regression technique used here is a fixed effects regression model.This is because fixed effects regression is the model that can control omittedvariables that differ between cases but are constant over time. It helps inaccounting for the changes in the variables over time to estimate the effects ofthe independent variables on the dependent variable. It is also the maintechnique used for analysis of panel data which is the case in this regression.
Fixed Effects Regression
This regression shows that poverty rates have been converging overthe years and going down. It also shows that inter-state migration has aconverging effect on poverty rates. The important result is that inter-statemigration has a statistically significant effect on the convergence of povertyrates. Such convergence is also seen in the case of rural-urban poverty rateswhich may also be caused by inter-state migration.
Table 2.6
Explaining Poverty Convergence through Inter-State Migration
Explanatory Variables
Year -0.57***(0.02)
Ln_Rom -0.13**(0.05)
F(2,284) 702.21***
R-sq within 0.83
No. of groups 26
Table 2.7
Fixed Effects on HDV through Migration
Explanatory Variables
Year 0.003***(0.0004)
Ln_Rom 0.018***(0.001)
F(2,152) 1731***
R-sq within 0.95
No. of groups 14

116 INDIA EMERGING • VEENA JHA
The effect of inter-state migration on HDV is positive. Again HDV hasbeen increasing over time. This is the same trend as was the case withpoverty. Further as poverty reduces below 33 per cent, HDV increases morethan proportionately. Inter-state migration contributes to an increase in theabsolute value of HDI. No statistically significant relation was foundbetween convergence of HDI and inter-state migration. This could beexplained by the fact that at rates of poverty over 33 per cent whichaccounts for the poverty level in a number of poor states such as Bihar andUP, inter-state migration is the highest. Yet the correlation of the levels ofHDV would be weaker in these states, thus the effect on convergence wouldbe weak.
Table 2.8
Fixed Effects on Informal Sector Wages through Migration
Explanatory Variables
Ln_Rom 0.05***(0.01)
F(2,259) 20.02***
R-sq within 0.07
No. of groups 26
The contribution that inter-state migration makes to real informal wagegrowth is shown by the above regression. Each percentage increase in inter-state migration leads to an increase in real informal wages by 0.05 per cent.This however refers to the real informal wage in the state of origin, showinglabour market effects which arise locally when out-migration takes place.Thus, Lewisian effects are observed in the case of India. As inter-statemigration takes place mostly from states which have surplus agriculturallabour to states where industry and services are dominant, labour marketeffects can be observed both at the state of origin and the state of destination.
Table 2.9
Summary of Variables
Mean Median Std
Rom 8.3 1.07 60.5HDI 0.53 0.052 0.09Pov 27.3 27.3 10.06
117INTER-STATE MIGRATION AND TRICKLE-DOWN EFFECT
Lopes (2004) used a similar strategy and added a dynamic component.His results implied convergence in inequality over time, and a negativeeffect of initial GDP per capita on changes in inequality. This is consistentwith the results above. Other studies found that inequality converges fasterthan growth, meaning that a policy that affects both growth and inequalitymay have a stronger effect on inequality in the short run and a strongereffect on growth in the long run (Bourguignon, 2004).
More interesting than the convergence of growth results, however, arestudies on the convergence of both rural and urban poverty. Poverty trendsbetween rural and urban areas across India show that they are convergingand falling especially during the periods of high growth. This points to theimportance of inter-state and rural-urban migration in achieving theseresults. The HDI based on indicators such as per capita expenditure,headcount poverty ratio, literacy rate, formal education rate, infantmortality, life expectancy, access to safe water and housing show that overtime there has been convergence rather than divergence. They show thatinter-state disparities have not worsened during the periods of high growthbut have remained at the same level. This is despite the fact that HDI forhigh growth states has grown at faster rates than those of low growth statesand thus points to the importance of transfers through inter-statemigration from high growth states to low growth states (Siggel, 2010).
While these state-level results are interesting in themselves, it wouldbe important to examine the chain of causation which is possible only atthe micro level. This would require an examination of several explanatoryvariables which are best captured through a survey. To this effect, a surveyof migrants was conducted of over 193 migrants in destinations such asDelhi, Punjab, Uttarakhand, Andhra Pradesh and Karnataka. Thesemigrants were interviewed at different employment sites such asconstruction, homeworkers, hawkers, taxi drivers etc. While obviousshortcomings of a survey technique attend this survey, an extensivequestionnaire which included several aspects of migration was used forgroup discussions and interviews. The interviews used recall method tounderstand the trickle-down effects of migration.
118 INDIA EMERGING • VEENA JHA
V
Factors Determining Trickle-Downthrough Inter-State Migration: A CaseStudy-based Approach
Before analysing the regressions generated by the survey, it would beuseful to list some of the characteristics of the migrants surveyed. Thesurvey was conducted in several destination states of India and people werechosen in an ad hoc manner. The interviewers went to several sites wheremigrant workers predominate and the major issues covered by theinterviewers related to their income, living conditions, asset building,health expenditures etc., before and after migration. A copy of thequestionnaire is attached as Annexure A-2.1. The interviewees wererequested to recall expenditures on different items, poverty, unemployment,and other conditions deriving from migration. The case study was done bygiving special attention to completeness in observation, reconstruction andanalysis of the cases under study. It was done in a way that incorporatedthe views of the ‘actors’ in the case under study.
A frequent criticism of case study methodology is that its dependenceon a single case renders it incapable of providing a generalising conclusion.Some commentators have considered case methodology ‘microscopic’because it ‘lacked a sufficient number’ of cases (Yin, 1993). Others haveforcefully argued that the size of the sample does not transform a multiplecase study scenario into a macroscopic study (Hamel et al., 1993). The goalof the study should establish the parameters, and then should be applied toall research. In this way, even a single case could be considered acceptable,provided it met the established objective. Case study can be seen to satisfythe three tenets of the qualitative method: describing, understanding andexplaining. It is a fact that case studies do not need to have a minimumnumber of cases, or to randomly ‘select’ cases. The generalisation of resultsis made to theory and not to populations. Multiple cases strengthen theresults by replicating the pattern-matching, thus increasing confidence in therobustness of the theory.
The methodology that has been used is more in the nature ofexploratory case studies, where fieldwork and data collection have been

119INTER-STATE MIGRATION AND TRICKLE-DOWN EFFECT
undertaken prior to definition of the research questions and hypotheses.However, the framework of the study was created before the fieldwork.Survey questions were altered after a pilot of 50 interviews was conducted.Selecting cases, in this instance, migrants is a difficult process. Theselection of states and job sites was made on the basis of best availableopportunities to maximise what could be learned, knowing that time waslimited. Hence, the cases that were selected were easy and willing subjects.Basically the use of multivariate cases and techniques promoted an analysisof pattern matching with the overall picture which has been describedabove from the Census data and other secondary sources.
Some Stylised FSome Stylised FSome Stylised FSome Stylised FSome Stylised Facts that Emeracts that Emeracts that Emeracts that Emeracts that Emerged frged frged frged frged from the Surom the Surom the Surom the Surom the Surveysveysveysveysveys
All the people surveyed were economic migrants and were thuspredominantly male. They ranged between the ages of 15 and 40. Onlyabout 2 per cent of the people surveyed were above 40 and 1 per cent wereabove 50. Nearly 70 per cent of the migrants were from scheduled castes orother backward castes. However, even the higher castes were doing thesame work as those of the scheduled castes or the backward castes. Mosthad migrated because of the pull factor, i.e., work opportunities, though afew, about 5 per cent did state that their land had become unproductive orfamily quarrels had induced them to migrate.
Nearly 80 per cent of the migrants stated that they had no intentionof returning to the villages except for occasional visits, whereas the restwere seasonal or circular migrants. Nearly 60 per cent of the migrants hadcome from other service sectors, i.e., urban to urban whereas the rest wereprimarily occupied in agriculture before migration, rural to urban. Mosthave seen a large increase of nearly 50-200 per cent in incomes and some30 per cent had built assets subsequent to migration. Most migrants wereliving with dependents ranging between 4 and 11, and several families hadmore than one or two working members. Those who migrated alone weremore able to build assets in their native places. Most of the remittanceswere however used for food, education of children and for health purposes.
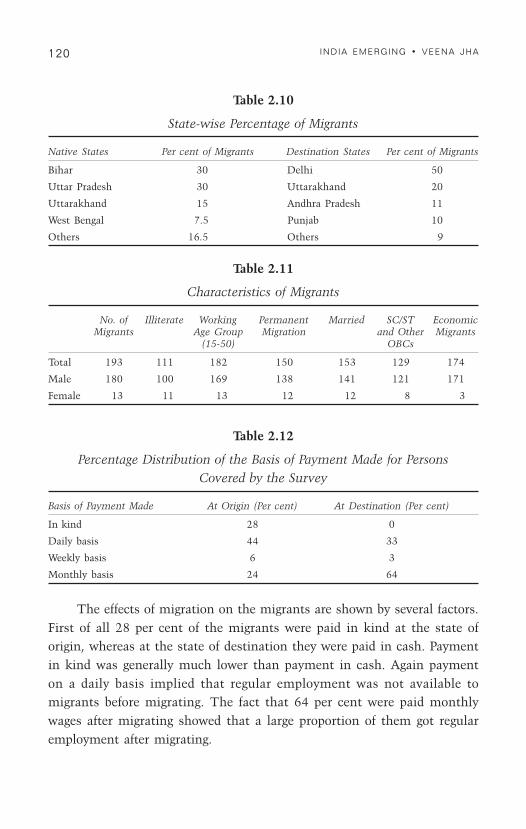
120 INDIA EMERGING • VEENA JHA
Table 2.10
State-wise Percentage of Migrants
Native States Per cent of Migrants Destination States Per cent of Migrants
Bihar 30 Delhi 50
Uttar Pradesh 30 Uttarakhand 20
Uttarakhand 15 Andhra Pradesh 11
West Bengal 7.5 Punjab 10
Others 16.5 Others 9
Table 2.11
Characteristics of Migrants
No. of Illiterate Working Permanent Married SC/ST EconomicMigrants Age Group Migration and Other Migrants
(15-50) OBCs
Total 193 111 182 150 153 129 174
Male 180 100 169 138 141 121 171
Female 13 11 13 12 12 8 3
Table 2.12
Percentage Distribution of the Basis of Payment Made for PersonsCovered by the Survey
Basis of Payment Made At Origin (Per cent) At Destination (Per cent)
In kind 28 0
Daily basis 44 33
Weekly basis 6 3
Monthly basis 24 64
The effects of migration on the migrants are shown by several factors.First of all 28 per cent of the migrants were paid in kind at the state oforigin, whereas at the state of destination they were paid in cash. Paymentin kind was generally much lower than payment in cash. Again paymenton a daily basis implied that regular employment was not available tomigrants before migrating. The fact that 64 per cent were paid monthlywages after migrating showed that a large proportion of them got regularemployment after migrating.

121INTER-STATE MIGRATION AND TRICKLE-DOWN EFFECT
Additionally, a large proportion of the migrant population was broughtabove the minimum wage level through inter-state migration. Where 51per cent of the population earned wages which were below the minimumlevel before migration, only 28 per cent earned wages which were below theminimum wage level after migration.
Table 2.13
Percentage Distribution of Persons brought above theMinimum Wage Level through Migration
Below Income Level of Rs 65 At or Above Income Level of Rs 65per day of Rs 2,000 per Month per day of Rs 2,000 per Month
At origin before migration 51% 49%
At destination after migration 28% 72%
Most of the migrants sent remittances and their remittances wereused intensively for meeting food needs of their families at their states oforigin. About 23 per cent of the migrants reported that their remittanceswere also used for education. About 30 per cent of the migrants reportedthat their remittances were used for health expenditures. Most remittances,however, appear to be used for meeting consumption deficits showing thelow initial incomes of migrants.
Table 2.14
Use of Remittances by Migrant Families
Use of the Remittance for Percentage of Migrants Reporting Use of Remittances
Food 94
Health 30
Education 23
Improving house 13
Asset building was, however, an important objective of migration.From the people surveyed, about 63 per cent built assets in their places oforigin and only 22 per cent built assets at their places of destination.Migrant remittances thus were important in determining asset building.

122 INDIA EMERGING • VEENA JHA
Table 2.15
Asset Building by Migrants
Proportion without Assets Proportion with Assetsbefore Migration after Migration
Assets in place of origin 37% 63%Assets in place of destination 78% 22%
RegrRegrRegrRegrRegression Results fression Results fression Results fression Results fression Results from Surom Surom Surom Surom Survey Analysisvey Analysisvey Analysisvey Analysisvey Analysis
As direct information was available on asset building either from theuse of remittance incomes or at the state of destination, the factors thatcontribute to asset building of the migrant could be examined. If the gapbetween the per capita income between the state of origin and the state ofdestination (DSDP) was high, the migrant was more likely to send higherlevels of remittances which was used for asset building. Thus, a positivecorrelation could be expected between DSDP and asset building. Similarly,younger people are likely to remit more and hence contribute to assetbuilding. The higher the level of education, the higher is the likely level ofremittances and the higher the asset building. Women and men may havedifferent patterns of remittances and hence different contributions to assetbuilding. Similarly, the higher the percentage increase in expenditurerelative to the state of origin, the lower would be the remittances and hencethe lower the asset building.
For examining these relationships a logit analysis was used. This isthe appropriate method to use when the sample is skewed. In thismultivariate analysis, the sample is extremely skewed as most wereilliterate and most were men.
Not all variables showed a statistically significant relationship. Theregression results showed that higher the gap between the per capitaincomes of the destination state and the state of origin, higher was themigrant likely to remit incomes for building assets. Women were morelikely to remit incomes for asset building and women from poorer stateswere even more likely to remit incomes for asset building.
The pattern of utilisation of remittances in the high growth period wasdifferent from the earlier studies which showed that payment of debt was themain motive for migration. In the sample surveyed, most migrants appear to

123INTER-STATE MIGRATION AND TRICKLE-DOWN EFFECT
move with a view to permanent settlement and for income earning purposes.There is also a relative breakdown of the link between rural areas, showingthat the safety net offered by rural presence is not valued as much as wasshown by the earlier literature. It also shows that migrants are moreconfident of their future in the place of destination than they were earlier,which could be a direct result of the opportunities brought about by growthin the place of destination.
Table 2.17
Logit Estimates of Asset Building with Remittances
Dependent variable: Asbk
Explanatory Variables
DSDP 2.82***(0.21)
Age -0.009(0.017)
Ed1 -0.08(0.86)
Ed2 -0.63(0.89)
Gen 23.6***(1.08)
Gensd -2.87***(0.22)
Chi2(6) 14.98**
Pseudo R2 0.07
No. of observations 149
Table 2.16
List of Abbreviations
DSDP Per cent gap in per capita NSDP between destination state and native state of the person.
Age Age of the person.
Ed1 =1 if education of the person is equal to 0; and 0 otherwise.
Ed2 =1 if education of the person is equal to 2, i.e., at least Tenth pass; and 0 otherwise.
Gen =1 if person is male; 0 otherwise.
Gensd Gen dummy multiplied by DSDP.
Asbk =1 if the person builds assets with remittances; 0 otherwise.
Exin Per cent change in consumption expenditure in destination state relative to native state.
For Logit model, number of positive response=60, negative response=89.

124 INDIA EMERGING • VEENA JHA
VI
Conclusions and Policy Recommendations
The push and pull factors for inter-state migration has changedconsiderably over the high growth period of the Indian economy. Inter-statemigration subsequent to 1991 may have had a role to play in both assetbuilding in the state of origin and in explaining the convergence of povertybetween states. The character of migration has changed to more permanentforms of migration, as migrants move with their families showing a higherlevel of urbanisation than in the past. Migrants also appear to value theirrural safety nets much less than in the past, showing confidence in thegrowth opportunities brought by migration. Urbanisation also appears tohave reached a critical point of above at 30 per cent, beyond which rates ofurbanisation are expected to grow much faster, judging by the experience ofother countries. Information from 2011 Census of India shows that thenatural migration has shown an increasing trend. Urbanisation in 2011crossed the 31 per cent level, largely on account of reclassification of ruralinto urban areas and migration.
The important contribution of migration to poverty alleviation needs tobe recognised. Migration permits the use of flexible labour policies whichwould help accelerate growth. But there is a need to build on the humanskills of migrants so that their remuneration and opportunities increase overtime. There is a need to support migrants by improving their access torenumerative work, schooling, health care, training, safe working conditionsand adequate housing. The training schemes outlined in chapter 3 wouldequally apply to migrants. Moreover, it is important that anti-migrationpolicies outlined above be stopped. Thus, the Federal or the Uniongovernment of India should put in place policies that do not discouragemigration and at the same time discourage regional factionalism.
Given that India is a land-scarce country, economic developmentwould involve several forms of urbanisation. As shown above, this wouldimprove productivity and reduce poverty. It is important to note that inIndia, there is a continuum in terms of population density from remotevillages to the large urban centres. The conventional dichotomy of ruralversus urban areas still seems to dominate development thinking and

125INTER-STATE MIGRATION AND TRICKLE-DOWN EFFECT
poverty research. Furthermore, migration patterns are seldom reflectedadequately in statistics on poverty and living conditions. Staticmeasurements of per capita or household income, consumption or otherindicators of well-being may conceal important cyclical patterns ofmovements of people and transfer of resources between households as wellas within families.
Policies in India should be more concerned with influencing thedirection of rural to urban migration flows—e.g. to particular areas—withthe implicit understanding that migration will occur anyway and thusshould be accommodated at as low a cost as possible. The idea is often toprevent massive inflows to large overcrowded cities while helping migrantsof rural origin to find a job in smaller or medium-sized cities. This isusually advocated through the decentralisation of infrastructure andactivities with a view to create new centres of growth that will be able toabsorb the rural population influx (Skeldon, 2003). With the benefit ofhindsight, industrial and urban decentralisation strategies have facedsignificant challenges in India but have become more successful in therecent past because of the software boom (Waddington, 2003). The softwareboom spread to secondary cities because of the presence of betterinfrastructure and the possibility to create infrastructure. The availability ofskilled manpower was also important though not all important.
Thus if programmes for the creation of secondary towns and cities areto be generalised, should potential migrants be trained before or aftermigrating? What is the best way to facilitate information sharing in ruralareas? How can potential migrants better choose where to migrate given theirqualifications and the distribution of job opportunities in urban areas?Should recruitment agencies, analogous to those that are often already activein the context of international migration, help rural dwellers secure a jobcontract before migrating to the city? What types of specific savings andcredit programmes could help workers finance migration costs? Thesequestions need to be answered by policy planners in directing the growth ofcities with different hierarchies. Urban structure and change are importantfor the socioeconomic development of India because they are related to theproduction and distribution of goods and services, the government’s capacityto provide public facilities and amenities, and the degree of crowding and
126 INDIA EMERGING • VEENA JHA
stress in the environment under which people live. In this light, policies toaffect or respond to urban structural change are also important.
Broadly, policies to influence urban structural change aim to achieve amore balanced pattern of urbanisation with a more clearly articulatedhierarchy of different size cities and towns, integrated spatial developmentand accelerated economic growth with equity. This has been noted byRodinelli and Cheema (1983) who state that, ‘experience with three decadesof development in Asia suggests that a broad spectrum of humansettlements—rural villages, market towns, small cities, intermediate regionalcentres, and large metropolitan areas—is needed to build strong internaleconomies…Cities of various sizes must be integrated with rural settlementsthrough physical, social, economic and political linkages that forge them intoa mutually sustaining network of production, exchange and consumptioncentres.’ They further added that ‘the objectives should be not so much toslow urbanisation as to develop more harmonious rural-urban linkage at theregional level, with the aim of an integrated economy where income andemployment growth in rural areas and neighbouring towns are mutuallysupportive and the benefits are not “creamed” off by a few metropolitanareas.’ The proliferation of smaller but economically important urbansettlements throughout India is a testimony to these trends. The 2011Census of India shows that reclassification of rural into urban areas is oneof the major factor contributing to increased urbanisation. Further urbanpopulation in the last decade grew by 91 million in comparison to 90.6million in rural areas. A village or other population unit is declared as townwhen its population crosses 5,000, when the percentage of male workers inagriculture falls below 25 per cent, and where population density is above400 per square kilometre (Census 2001). Thus government efforts shouldfocus on building infrastructure in small towns of India and road networkswhich would encourage this form of migration. Given that governmentefforts in delivering social justice has been abysmal (see Chapter 6), its effortsshould be focussed on building infrastructure, which has been relativelymore successful.
A burning question has been whether the government should in fact,intervene to affect urban structural change. Some theorists argue that aseconomic growth accelerates equity problems are ameliorated and spatialpolarisation is reversed automatically through internal migration (Mera,
127INTER-STATE MIGRATION AND TRICKLE-DOWN EFFECT
1975). But others point out that even if polarisation reversal ‘is bound tohappen eventually, it may not happen for a very long time and thecontinued polarisation in the meantime may conflict with national policyobjectives’ and that ‘developing country concern with inter-regional equity,national spatial integration and other spatial objectives will have a strongincentive to “nudge” polarisation reversal along with policy measures. Theproblems are when to intervene and how to intervene’ (Richardson, 1973).
It has been suggested that the prospects for decentralisation strategiesare increased if policies are implemented close to the time whenpolarisation reversal begins rather than when polarisation forces are stillstrong. The efficiency cost of premature intervention may be very high.Primacy reversal has been considered as having begun when the ‘backwash’effects of resource movements (including migration) into the core regionbegin to be outweighed by increasing spatial diffusion of technicalknowledge, by a rising demand for complementary goods produced inlagging regions; and by the setting up of branch plants made viable by theexpanding size of dispersed markets, lower input costs (especially oflabour), inter-regional transportation improvements and mobile externaleconomies (Richardson, 1993; 1981). India appears to have reached thisstage and therefore unlimited expenditure on infrastructure is called for onthe part of the government. This includes the kind of traininginfrastructure outlined in chapter 3.
It is not enough just to have a hierarchy of different-sized cities andtowns. Different components of the spatial system playing different andcrucial economic and social functions in the development process must belinked to each other through a network of physical (road and othertransportation and communication networks), economic (productionlinkages, market interaction patterns, capital and commodity flows, servicedelivery), technological, social and administrative interactions. Such linkagesare essential for generating and spreading economic growth, for helping tointegrate regional spatial systems into a strong national space economy, forcreating multiplier effects of further growth and change, and for building upthe potential for mutually beneficial economic interaction (Lim, 1987). Forexample, improved transportation between villages and towns could help toreorganise and expand periodic and regular markets which, in turn, couldchange the flow of economic and social interactions and the movement of

128 INDIA EMERGING • VEENA JHA
people and goods. Closer linkages among different-sized cities make it lessexpensive and more convenient to integrate technology and to distributeservices more widely. In the words of Renaud (1979: 113), ‘nationaleconomic planners must be made more aware that most of their decisionsare not spatially neutral, and physical planners must acknowledge the limitsplaced on their plans by the state of the national economy, if national spatialpolicies are to improve the national environment.’
In the context of India, this would involve some federal planning toallocate the most appropriate land to agriculture. For example, Bihar hasfertile agricultural land and no shortage of water. The Government shouldtherefore invest in improving agricultural productivity in Bihar to an extentthat it can feed a good part of India. The same applies to eastern UttarPradesh, Orissa and West Bengal. Arid parts of the country could be moreurbanised though water scarcity for human consumption would need to beaddressed. Building of infrastructure should be a priority both for theCentral and the state governments. This would decrease urbanovercrowding and help build a hierarchy of cities and townships.
ReferencesAhluwalia, Montek S. (2002). “Economic Reforms in India Since 1991: Has Gradualism
Worked?”, Journal of Economic Perspectives 16(3): 67-88, Summer.
Aiyar, S. (2001). “Growth Theory and Convergence across Indian States”, in Tim Callen,Patricia Reynolds and Christopher Towe (eds.), India at the Crossroads: SustainingGrowth and Reducing Poverty. Washington: International Monetary Fund. pp.143-69.
Asam, J.P. and F. Gubert (2002). “Those in Kayes: The Impact of Remittances on theirRecipients in Africa”, Mimeo, University of Toulouse.
Bajpai, N. and J. Sachs (1996). “Trends in Inter-State Inequalities of Income in India”,Development Discussion Paper No. 528, Harvard Institute for InternationalDevelopment.
Banerjee, Abhijit V. (2004). “Educational Policy and the Economics of the Family”, Journalof Development Economics 74(1): 3-32.
Banerjee, Biswajit (1984). “The Probability, Sise and Uses of Remittances from Urban toRural Areas in India”, Journal of Development Economics 16: 293–311.
Bhanumurthy, N.R and Arup Mitra (2003). Declining Poverty in India: A DecompositionAnalysis. No. 70/2003, http://www.iegindia.org/dispap.htm
Bhattacharya, B.B. and S. Sakthivel (2004). “Regional Growth and Disparity in India:Comparison of Pre- and Post-Reform Decades”, Economic and Political Weekly:1071-77, March 6.

129INTER-STATE MIGRATION AND TRICKLE-DOWN EFFECT
Bird, Kate and Priya Deshingkar (2008). “Circular Migration in India”, Policy Brief No. 4.Prepared for the World Development Report 2009, http://www.odi.org.uk/resources/download/2506.pdf
Bourguignon, F. (2004). “The Poverty-Growth-Inequality Triangle”, Mimeo, The World Bank.
Breman, J. (1985). Of Peasants, Migrants and Paupers, Rural Labour Circulation andCapitalistic Production in West India. Delhi, Bombay Calcutta, Madras: OxfordUniversity Press.
————. (2003). The Labouring Poor in India, Patterns of Exploitation, Subordination,and Exclusion. Oxford University Press.
Cashin, P. and R. Sahay (1996). “Internal Migration, Centre-State Grants, and EconomicGrowth in the States of India”, IMF Staff Papers 43(1): 123-71.
Census of India (2011). “Provisional Population Totals: India Census 2011”,www.censusindia.gov.in. Ministry of Home Affairs, Government of India.
Connell, J., B. Dasgupta, R. Laishley and M. Lipton (1976). Migration from Rural Areas:The Evidence from Village Studies. Delhi: Oxford University Press.
Cox, D., S. Eser and E. Jimenes (1998): “Motives for Private Transfers over the Life Cycle:An Analytical Framework and Evidence for Peru”, Journal of DevelopmentEconomics 55: 57-80.
Dayal, H. and A.K. Karan (2003). Labour Migration from Jharkhand. New Delhi: InstituteFor Human Development.
de Haan, Arjan, Karen Brock, Grace Carswell, Ngolo Coulibaly, Haileyesus Seba and KasiAli Toufique (2000). Migration and Livelihoods: Case Studies in Bangladesh,Ethiopia and Mali. Institute of Development Studies, University of Sussex, Brighton.
de la Brière, B., E. Sadoulet, A. de Janvry and S. Lambert (2002). “The Roles ofDestination, Gender, and Household Composition in Explaining Remittances: AnAnalysis for the Dominican Sierra”, Journal of Development Economics 68(2): 309-28.
Deshingkar, P. (2004). “Understanding the Implications of Migration for Pro-poorAgricultural Growth”, Paper prepared for the DAC POVNET Agriculture Task GroupMeeting, Helsinki, 17–18 June.
Deshingkar, P. and D. Start (2003). “Seasonal Migration for Livelihoods in India: Coping,Accumulation and Exclusion”, ODI Working Paper 220. http://www.odi.org.uk/publications/working_papers/wp220.pdf
DFID (2007). Moving Out of Poverty-Making Migration Work for Poor People. London,UK: DFID.
Fei, J.C.H. and G. Ranis (1965) Development of the Labor Surplus Economy. Homewood,IL: Richard D. Irwin Inc.
Goldman Sachs (2007). “India’s Rising Growth Potential”, Global Economics PaperNumber 152GS. January. Global Economic Website Economic Research from the GSInstitutional Portal at https://portal.gs.com
Greenwood, M.J., J.R. Ladman and B. Siegel (1981). “Long Term Trends in MigratoryBehaviour in a Developing Country: The Case of Mexico”, Demography 18: 369-89.
Gubert, F. (2002). “Do Migrants Insure those who Stay Behind? Evidence from the KayesArea”, Oxford Development Studies 30(3): 267-87.
Gupta, I. and A. Mitra (2002). “Rural Migrants and Labour Segmentation, Micro-levelEvidence from Delhi Slums”, Economic and Political Weekly: 163–68, January 12.

130 INDIA EMERGING • VEENA JHA
Haberfeld, Y., R.K. Menaria, B.B. Sahoo and R.N. Vyas (1999) “Seaosnal Migration ofRural Labour in India”, Population Research and Policy Review 18(4): 73–89.
Hamel, J., S. Dufour and D. Fortin (1993). Case Study Methods. Newbury Park, CA: SagePublications.
Harris, J.R. and M.P. Todaro (1970). “Migration, Unemployment and Development: A Two-Sector Analysis”, American Economic Review 60: 126-42.
Harris, N. (2004). The Impact of the Reform of International Trade on Urban and RuralChange. Draft Development Planning Unit, University College London. April.
Hoselits, Bert F. (1957). “Generative and Parasitic Cities,” Economic Development andCultural Change 3: 278–94.
Ilahi, N. and S. Jafarey (1999). “Guestworker Migration, Remittances and the ExtendedFamily: Evidence from Pakistan”, Journal of Development Economics 58: 485-512.
ILO (1972). Incomes, Employment and Equality in Kenya. Geneva: ILO. http://www.ilo.org.
Jha, V. (2005). “Migration of Orissa’s Tribal Women: A New Story of Exploitation”,Economic and Political Weekly, Commentary. April 9.
Jorgenson, Dale (1961). “The Development of a Dual Economy”, Economic Journal 71:309-34.
Karan, A. (2003). “Changing Patterns of Migration from Rural Bihar”, in G. Iyer (ed.),Migrant Labour and Human Rights in India. New Delhi: Kanishka Publishers. pp.102-39.
Kats, Eliakim and Oded Stark (1987). “Migration, Information and the Costs and Benefitsof signaling”, Regional Science and Urban Economics 17(3): 323-31, August. http://www.sciencedirect.com
Krishnaiah, M. (1997). “Rural Migrant Labour Systems in Semi-arid Areas: A Study of TowVillages in Andhra Pradesh”, The Indian Journal of Labour Economics 40(1).
Kumar, Nagesh (2000). “Economic Reforms and their Macro-Economic Impact”, Economicand Political Weekly: 803-12, March 4.
Kumar, Sanjay (2004). “Impact of Economic Reforms on the Indian Electorate”, Economicand Political Weekly: 1621–30 (April 17), (New Delhi).
Kundu, A. (2003). “Urbanisation and Urban Governance: Search for a Perspective beyondNeo-Liberalism”, Economic and Political Weekly 38(29), India.
Lakshmansamy, T. (1990). “Family Survival Strategy and Migration: An Analysis of Returnsto Migration”, The Indian Journal of Social Work 51(3): 473-85.
Lall, S.V., H. Selod and S. Shalisi (2006). “Rural Urban Migration in Developing Countries-A Survey of Theoretical Predictions and Empirical Findings”, World Bank PolicyResearch Working Paper 3915. May. Published by the World Bank.
Lele, Uma and John Mellor (1981). “Technological Change, Distributive Bias and LaborTransfer in a Two-Sector Economy”, Oxford Economic Papers 33(3): 426-41.
Lewis, W.A. (1954). “Economic Development with Unlimited Supplies of Labour”,Manchester School 22:139–91.
Lim, Lin Lean (1987). “Socio-economic Implications of Urban Structural Change”, The SianConference on Population and Development in Medium Sized Cities. http://www.auick.org/database/conf/conf1987/05/001.htm

131INTER-STATE MIGRATION AND TRICKLE-DOWN EFFECT
Lipton, M. (1988). “Rural Development and the Retention of the Rural Population in theCountryside of Developing Countries”, in J. Havet (ed)., Staying On: Retention andMigration in Peasant Societies. University of Ottawa Press.
Lopes, H. (2004). “Pro-poor-Pro-growth: Is there a Trade Off?”, The World Bank PolicyResearch Working Paper No. 3378.
Lucas, Robert E.B. and Oded Stark (1985). “Motivations to Remit: Evidence fromBotswana”, Journal of Political Economy 93: 901–18.
Marjit, Sugata and Dibyendu S. Maiti (2005). “Globalization, Reform and the InformalSector”, Working Papers RP2005/12. World Institute for Development EconomicResearch (UNU-WIDER).
Massey, Douglas S., Jorge Durand and Nolan J. Malone (2002). Beyond Smoke andMirrors: Mexican Immigration in an Era of Economic Integration. New York: RussellSage Foundation. p.133.
Ministry of Labour (1991). Report of the National Commission on Rural Labour (NCRL).Government of India.
Mera, K. (1975). Income Distribution and Regional Development. Tokyo: University ofTokyo Press.
Mora, J. and J. Taylor (2005). “Determination of Migration, Destination and Sector Choice:Disentangling Individual, Household and Community Effects”, Osden and Schiffs(eds.), Inernational Migration, Remittances and the Brain Drain. The World Bank andPalgrave Macmillan. pp.21-51.
Mosse, D., S. Gupta, M. Mehta, V. Shah, J. Rees and the KRIBP Project Team (2002).“Brokered Livelihoods: Debt, Labour Migration and Development in Tribal WesternIndia”, Journal of Development Studies 38(5): 59–87, June.
Myrdal, G. (1957a). Rich Lands and Poor. New York: Harper and Row.
———— . (1957b). Economic Theory and Underdeveloped Regions. Harper and Row.
NCRL (2001). Report of the National Commission on Migrant Labour. http://www.docstoc.com/docs/44225278/Bibliography-On-Migration
Oberai, A.S. and H.K.M. Singh (1980). "Migration, Remittances and Rural Development:Findings of a Case Study in the Indian Punjab", International Labour Review 119(2):229-41.
Olsen, W.K. and R.V. Ramana Murthy (2000). “Contract Labour and Bondage in AndhraPradesh (India)”, Journal of Social and Political Thought 1(2), June. http://www.yorku.ca/jspot/2/wkolsenrvramana.htm
Osili, Una Okonkwo and Anna Paulson (2004). “Prospects for Immigrant-Native WealthAssimilation: Evidence from Financial Market Participation”, Federal Reserve Bank ofChicago Working Paper WP 04-18.
Papola, T.S. (1981). Urban Informal Sector in a Developing Economy. Vikas PublishingHouse.
Phillipson, R. (2004). Rural-Urban Change & The Role Of Regional Policy Lessons FromEuropean Experience. A Report to the Department for International Development’sUrban and Rural Change Team. February.
Portes, Alejandro and Richard Schauffler (1993). “The Informal Economy in Latin America:Definition, Measurement and Policies”, Population and Development Review 19(1).
Purfield, Catriona (2006). “Mind the Gap: Is Economic Growth in India Leaving SomeStates Behind?”, IMF Working Paper No. 06/103. International Monetary Fund(IMF), April. http://papers.ssrn.com

132 INDIA EMERGING • VEENA JHA
Rafique, A. and B. Rogaly (2003). “Internal Seasonal Migration, Livelihoods andVulnerability in India: A Case Study”, Paper presented at Regional Conference onMigration Development and Propoor Policy Choices. June 22-24. Dhaka: Refugeeand Migratory Movements Research Unit.
Ramana Murthy, R.V. (1991). Seasonal Labour Migration in Semi-Arid Areas: A CaseStudy of Palamuuru Labour. M.Phil. Thesis. Hyderabad: Department of Economics,University of Hyderabad.
Rao, G.B. (2001). Household Coping/Survival Strategies in Drought-prone Regions: ACase Study of Anantapur District, Andhra Pradesh, India. SPWD-HyderabadCentre.
Rao, Usha (1994). Palamoor Labour: A Study of Migrant Labour in MahabubnagarDistrict. Hyderabad: C.D. Deshmukh Impart Centre, Council for Social Development.
Rao, M.G., R.T. Shand and K.P. Kalirajan (1999). “Convergence of Incomes across IndianStates: A Divergent View”, Economic and Political Weekly 34(13): 769-78.
Rapoport, Hillel and Frédéric Docquier (2005). “The Economics of Migrants’ Remittances”,Discussion Paper Series. Forschungsinstitut sur Sukunft der Arbeit, Institute for theStudy of Labor. March. http://ftp.isa.org
Ravinder, A. (1989). “Labour Migration: A Dimension of Poverty”. Unpublished Master ofPhilosophy dissertation. Hyderabad: Department of Economics, Osmania University.
Ravenstein, E. (1889). “The Laws of Migration: Second Paper”, Journal of the RoyalStatistical Society 52: 241-305. http://www.geog.ucsb.edu/~tobler/publications/pdf_docs/movement/migration/Ravenstein.pdf
Reddy, D. Narasimha (1990). Rural Migrant Labour in Andhra Pradesh. Report submittedto the National Commission on Rural Labour, Government of India.
Renaud, B. (1979). “National Urbanisation Policies in Developing Countries”, World BankStaff Working Paper No. 347, Washington D.C.: World Bank.
Richardson, H. (1973). The Economics of Urban Size. Farnborough, Hants: Saxon House.
————. (1981). “Defining Urban Population Distribution Goals in Development Planning”,in United Nations, Population Distribution Policies in Development Planning. NewYork: United Nations.
Richardson, N. (1993). “Efficiency and Welfare in LDC Mega-cities”, in J.D. Kasarda andA.M. Parnell (eds.), Third World Cities: Problems, Policies, and Prospects. BeverlyHills: Sage. pp.32-57.
Rodinelli, D. and D.S. Cheema (1983). “Implementing Decentralisation Policies”, in D.S.Cheema and D. Rodinelli (eds.), Decentralisation and Development. London: Sage.
Rogaly, B., J. Biswas, D. Coppard, A. Rafique, K. Rana and A. Sengupta (2001). “SeasonalMigration, Social Change and Migrants Rights, Lessons from West Bengal”,Economic and Political Weekly: 4547–59, December 8.
Rogaly, B. and D. Coppard (2003). “They used to Go to Eat, Now They Go to Earn: TheChanging Meanings of Seasonal Migration from Puruliya District in West Bengal”,Journal of Agrarian Change 3(3): 395, July.
Samal, Chandan K. (2006). “Remittances and Sustainable Livelihoods in Semi-arid Areas”,Asia-Pacific Development Journal 13(2), December.
Schwarts, A. (1973). “Interpreting the Effect of Distance on Migration”, Journal of PoliticalEconomy 81: 1153-69.
133INTER-STATE MIGRATION AND TRICKLE-DOWN EFFECT
Shanmugam, T.R. and K. Vijaylakshmy (2005). Determinants of Agricultural LabourParticipation in Organisation in India. http://www.agriculturaits.csu.cs, AgriculturaTropica et Subtropica 38(2).
Sharma, Alakh N. (1997). People on the Move: Nature and Implications of Migration in aBackward Economy. Delhi: Vikas.
Shaw, Annapurna and M.K. Satish (2005). “Metropolitan Restructuring in Post LiberalisedIndia: Separating the Global and the Local”, Presented at the 103rd Annual Meetingof the Association of American Geographers, Denver, CO. April 5–9. http://www.sciencedirect.com
Siggel, Eckhard (2010). Poverty Alleviation and Economic Reforms in India. Montreal,Canada: Department of Economics, Concordia University.
Singh, M. and A.K. Karan (2001). Rural Labour Migration From Bihar. New Delhi: Institutefor Human Development.
Singh, M. and G.K. Iyer (1985). “Migrant Labour in Rural Punjab”, in U. Patnaik and M.Dingwaney (eds.), Chains of Servitude: Bondage and Slaver y in India.sar.sagepub.com/content/29/1/19.refs
Skeldon, R. (2003). “Migration and Poverty”, Paper presented at the conference on AfricanMigration and Urbanisation in Comparative Perspective. Johannesburg, SouthAfrica, June 4-7.
Srivastava, R.S. (1998). “Migration and the Labour Market in India”, Indian Journal ofLabour Economics 41(4).
Srivastava, Ravi (2003). “An Overview of Migration in India, its Impacts and Key Issues,” inMigration Development Pro-Poor Policy Choices in Asia.
Srivastava, Ravi and S.K. Sasikumar (2003). An Overview of Migration in India, ItsImpacts and Key Issues. Report prepared for Department for InternationalDevelopment (DFID), U.K.
Stark, Oded and J. Edward Taylor (1991). “Relative Deprivation and Migration: Theory,Evidence, and Policy Implications”, Policy Research Working Paper Series 656. TheWorld Bank.
Waddington, C. (2003). “Livelihood Outcomes of Migration for Poor People”, Globalisationand Poverty Working Paper No. T1. Brighton: Research Centre on Migration,University of Sussex.
Yin, R. (1993). Applications of Case Study Research. Beverly Hills, CA: Sage Publishing.

134 INDIA EMERGING • VEENA JHA
Annexure A-2.1
Rural-Urban-Rural MigrationQuestionnaire
M/ F
Name: Gender:
Native state:
Bihar Orissa West Bengal Northeast
Destination state:
Delhi Mumbai Punjab Maharashtra Karnataka Andhra Pradesh
Age of the migrant: ———————————
Martial status:
Single Civil Marriage Customary Marriage Divorced
Education:
Illiterate Matriculation Higher Secondary Graduate Post Graduate
Religious affiliation:
Hindu Muslim Sikh Christian Buddhist Jain
Caste:
Scheduled Caste Scheduled Tribe Other Backward Classes Others
Reason for migration:
Education Work Marry Natural disaster Illness
Death of an earner Quarrel Unproductive land Other (specify)
Type of migration:
Seasonal (Harvest) Occasional (for construction Permanent activities, building roads etc.)
Sectoral shift in economic activity (from before migration to after migration):
Agri to agri Agri to manuf Agri to services
Manuf to agri Manuf to manuf Manuf to services
Services to agri Services to manuf Services to services
Sector of economic activity of the migrant (before migration):
Agriculture Allied activities (animal rearing, poultry, husbandry etc.)
Industry Services
Specify the occupation of the migrant (before migration): ————————————
Present sector of economic activity of the migrant:
Agriculture Allied activities (animal rearing, poultry, husbandry etc.)
Industry Services

135INTER-STATE MIGRATION AND TRICKLE-DOWN EFFECT
Specify the occupation of the migrant (after migration): —————————————
Employment status before migration:
Self-employed Industrial outworker Farmer
Civil servant Tertiary/services (specify)———————————
Employment status after migration:
Self-employed Industrial outworker Farmer
Civil servant Tertiary/services (specify)
The form of source of income of the migrant at the native place (before migration):
Cash Kind
If the migrant’s source of income (before migration) was in cash whether it was paid on:
Daily basis Weekly basis Monthly basis
Specify the amount Rs. ———————
Migrant’s source of income (after migration) in cash is paid on:
Daily basis Weekly basis Monthly basis
Specify the amount Rs. ———————
Asset holding (at native place):
No Yes
If yes, specify: —————————————
Do the migrant still avail benefits from the native holdings of assets?
No Yes
If yes, specify (whether in cash or kind): ———————————————
Asset Holding (at the destination state)
No Yes
If yes, specify: ——————————————
Dwelling place before migration:
Kuchcha (jhopadh) Pucca (hut) Rented (pucca) Spatial pucca self-owned
Dwelling place at the destination state (after migration)
Jhuggis (Slum) Rented Shared with others Own apartment Footpath
Members residing with the migrant (at the destination state):
Alone Two members
More than two (specify the number) ——————
Availability of infrastructure (at the destination state):
Electricity Water supply Transportation facility
Does the migrant support the household by sending or bringing back goods or money?
No Yes

136 INDIA EMERGING • VEENA JHA
If yes, specify the form of support (Cash/kind): ———————————
Daily working hours before migration (in hours):
< 8 8=<10 10=<12 12=<14 >14
Daily working hours after migration (in hours):
< 8 8=<10 10=<12 12=<14 >14
Monthly living expenditure of the migrant (in Rs.) after migration:
< 50 51-100 101-1000 1001-5000 5000
Where are the remittances mainly used?
Food Clothes Education Health
Repaying debt Improving house Inputs/tools Others (specify)
Does the migrant’s labour productivity increased?
No Yes
Who is then main beneficiary of the remittances?
Alone Spouse/partner Parents Others (specify)
Does the migrant get financial support from other members of the household aftermigration?
No Yes
If yes, mention the relationship with the migrant: ——————————
Monthly expenditure on consumption (in Rs.) or (calorie intake)* before migration:
For rural mass:
0-224 (1383) 225-254 (1609) 255-299 (1733)
300-339 (1868) 340-379 (1957) 380-419 (2054)
420-469 (2173) 470-524 (2289) 525-614 (2403)
615-774 (2581) 775-949 (2735) 950-more (3778)
For urban mass:
0-229 (1398) 300- 349 (1654) 350-424 (1729)
425-499 (1912) 500-574 (1968) 575-664 (2091)
665-774 (2187) 775-914 (2297) 915-1119 (2467)
1120-1499 (2536) 1500-1924 (2736) 1925-more (2938)
Monthly expenditure on consumption (in Rs.) or (calorie intake)* after migration:
For rural mass:
0-224 (1383) 225-254 (1609) 255-299 (1733)
300-339 (1868) 340-379 (1957) 380-419 (2054)
420-469 (2173) 470-524 (2289) 525-614 (2403)
615-774 (2581) 775-949 (2735) 950-more (3778)

137INTER-STATE MIGRATION AND TRICKLE-DOWN EFFECT
For urban mass:
0-229 (1398) 300-349 (1654) 350-424 (1729)
425-499 (1912) 500-574 (1968) 575-664 (2091)
665-774 (2187) 775-914 (2297) 915-1119 (2467)
1120-1499 (2536) 1500-1924 (2736) 1925-more (2938)
Note: * Figures in brackets are the calorie intake & other is the expenditure bracket for the migrant thatincurred on his consumption.
Source: Nutritional Intake in India, NSS 55th Round, Report No.471.

138 INDIA EMERGING • VEENA JHA
Annexure A-2.2
Data Sets for Regression Analysis of Section IV and V
States index time riw pov gpov ias gsdp
AP 1 1 -14.9383 28.91 -0.044093 -7.79 0.201333
AS 2 1 -12.5909 40.77 -0.047769 -6.83 0.127810
BH 3 1 -12.4796 62.22 0.001814 -16.84 0.132324
GJ 4 1 -8.01461 32.79 -0.034117 -3.72 0.165801
HY 5 1 -15.417 21.37 -0.046136 -2.32 0.175078
HP 6 1 -11.5206 16.4 -0.082434 16.63 0.170661
KA 7 1 -12.8237 38.24 -0.036012 -6.77 0.168655
KE 8 1 -14.8953 40.42 -0.037661 -18.85 0.150239
MP 9 1 -12.6123 49.78 -0.032372 -6.14 0.188344
MH 10 1 -6.4 49.78 -0.018193 0.8 0.188863
OR 11 1 -13.1553 65.28 -0.011393 -11.32 0.082931
PN 12 1 -15.1443 16.18 -0.026725 -12.21 0.163422
RJ 13 1 -15.4959 34.46 -0.013183 -8.27 0.223871
TN 14 1 -10.1074 51.66 -0.009521 -4.03 0.180432
TR 15 1 -14.3066 40.03 -0.049372 -3.16 0.132810
UP 16 1 -13.2014 47.07 -0.006727 -7.97 0.159215
WB 17 1 -11.2556 54.85 -0.015614 -4.83 0.123057
AN 18 1 -10.1074 52.13 -0.009894 -4.03 0.080536
CH 19 1 -15.1443 23.79 -0.021534 -12.21 0.163422
DN 20 1 -8.01461 15.67 -0.096460 -3.72 0.177562
DH 21 1 -13.2014 26.22 -0.035158 -7.97 0.137878
LA 22 1 -8.01461 42.36 -0.032929 -3.72 0.177562
PO 23 1 -8.01461 50.05 -0.010015 -3.72 0.098693
GO 24 1 -14.8953 18.9 -0.082057 -18.85 0.177562
JK 25 1 -15.1443 24.24 -0.062997 -12.21 0.065594
MA 26 1 -14.3066 37.02 -0.051811 -3.16 0.142556
ME 27 1 -14.3066 38.81 -0.049465 -3.16 0.188832
MI 28 1 -14.3066 36 -0.056331 -3.16 0.136637
NA 29 1 -14.3066 39.25 -0.049934 -3.16 0.187442
SI 30 1 -11.2556 39.71 -0.048249 -4.83 0.150807
AP 1 2 38.37914 25.86 -0.026374 -0.96 0.216029
AS 2 2 9.400387 36.21 -0.027961 -4.34 0.115929
BH 3 2 9.259229 52.13 -0.040541 -8.67 0.080175
GJ 4 2 5.856186 31.54 -0.009530 4.87 0.232823
HY 5 2 23.39205 16.64 -0.055334 2.7 0.161999
HP 6 2 -0.34082 15.45 -0.014481 -12.2 0.162883
contd...

139INTER-STATE MIGRATION AND TRICKLE-DOWN EFFECT
...contd...
States index time riw pov gpov ias gsdp
KA 7 2 21.54953 37.53 -0.004641 -2.62 0.210974
KE 8 2 12.55645 31.79 -0.053377 -2.29 0.248884
MP 9 2 22.41174 43.07 -0.033698 -2.45 0.121175
MH 10 2 9.7482 40.41 -0.047057 8.49 0.230346
OR 11 2 22.78583 55.58 -0.037147 12.01 0.229943
PN 12 2 12.20414 13.2 -0.046044 -3.63 0.179038
RJ 13 2 32.53101 35.15 0.005005 0.42 0.148023
TN 14 2 6.406688 43.39 -0.040021 3.84 0.229200
TR 15 2 14.89337 35.23 -0.029977 -0.001 0.101273
UP 16 2 18.00436 41.46 -0.029796 -0.19 0.135077
WB 17 2 11.41085 44.72 -0.046171 -2.77 0.157570
AN 18 2 14.62978 43.88 -0.039564 -2.26 0.182444
CH 19 2 19.21098 14.67 -0.095838 32.89 0.442705
DN 20 2 9.828439 67.11 0.820676 -5.65 0.247721
DH 21 2 13.26679 12.41 -0.131674 -3.47 0.193493
LA 22 2 -0.21334 34.95 -0.043732 -5.65 0.247721
PO 23 2 20.77112 41.46 -0.042907 -15.85 0.118688
GO 24 2 20.50309 24.52 0.074338 -8.18 0.247721
JK 25 2 20.71262 23.82 -0.004331 -8.18 0.136634
MA 26 2 24.9116 31.35 -0.038290 3.04 0.151482
ME 27 2 18.91503 33.92 -0.031499 15.74 0.127063
MI 28 2 19.93168 27.52 -0.058888 3.04 0.235049
NA 29 2 15.62657 34.43 -0.030700 -10.65 0.175258
SI 30 2 28.81384 36.06 -0.022979 36.85 0.141645
AP 1 3 0.351421 22.19 -0.023653 23.34 0.093771
AS 2 3 0.502013 40.86 0.021402 36.85 0.074589
BH 3 3 -0.91022 54.96 0.009047 13.12 0.104596
GJ 4 3 3.761828 24.21 -0.038733 33.1 0.071363
HY 5 3 -4.11872 25.05 0.084234 75.32 0.102168
HP 6 3 3.509483 28.44 0.140129 25.51 0.115610
KA 7 3 7.021524 33.16 -0.019406 50.75 0.119730
KE 8 3 2.686628 25.43 -0.033343 41.77 0.118458
MP 9 3 1.455013 42.52 -0.002128 34.05 0.083114
MH 10 3 5.247609 36.86 -0.014641 13.38 0.085707
OR 11 3 -2.38878 48.56 -0.021050 26.2 0.069233
PN 12 3 -1.06954 11.77 -0.018055 52.59 0.097347
RJ 13 3 -1.34439 27.41 -0.036699 18.82 0.094998
TN 14 3 14.13201 35.03 -0.032111 40.31 0.121940
contd...

140 INDIA EMERGING • VEENA JHA
...contd...
States index time riw pov gpov ias gsdp
TR 15 3 -5.45877 39.01 0.017882 35.92 0.119805
UP 16 3 -1.58454 40.85 -0.002452 53.23 0.096088
WB 17 3 -7.25447 35.66 -0.033765 95.83 0.143383
AN 18 3 3.202789 34.47 -0.035741 27.56 0.051537
CH 19 3 5.496664 11.35 -0.037718 141.1 0.152757
DN 20 3 -4.01589 50.84 -0.040406 60.08 0.2
DH 21 3 20.39249 14.69 0.030620 141.1 0.119136
LA 22 3 9.929694 25.04 -0.047257 185.73 0.2
PO 23 3 -3.96475 37.4 -0.016320 102 0.304352
GO 24 3 0.947838 14.92 -0.065252 102 0.2
JK 25 3 2.838103 25.17 0.009445 65.98 0.117049
MA 26 3 -4.18481 36.86 0.029292 -9.61 0.130763
ME 27 3 -5.28746 37.92 0.019654 65.98 0.088880
MI 28 3 -6.92451 25.66 -0.011264 115 0.021111
NA 29 3 -1.96228 37.92 0.016894 -9.61 0.011232
SI 30 3 -0.01264 41.43 0.024819 95.83 0.099966
AP 4 5.54216
AS 4 19.94701
BH 4 37.41843
GJ 4 9.471879
HY 4 33.07289
HP 4 24.55454
KA 4 13.43834
KE 4 21.20452
MP 4 13.11878
MH 4 11.28708
OR 4 33.1919
PN 4 44.061
RJ 4 33.03571
TN 4 11.49062
TR 4 45.36927
UP 4 26.79013
WB 4 15.29931
AN 4 2.910365
CH 4 12.4677
DN 4 37.7676
DH 4 12.10498
LA 4 7.832409
contd...

141INTER-STATE MIGRATION AND TRICKLE-DOWN EFFECT
...contd...
States index time riw pov gpov ias gsdp
PO 4 -18.5548
GO 4 23.74566
JK 4 33.64066
MA 4 26.83254
ME 4 33.57459
MI 4 24.69716
NA 4 25.16228
SI 4 42.15758
States index time 1st Period Poverty Rate
AP 1 1 39.31 28.91 -0.044093
AS 2 1 57.15 40.77 -0.047769
BH 3 1 61.55 62.22 0.001814
GJ 4 1 41.23 32.79 -0.034117
HY 5 1 29.55 21.37 -0.046136
HP 6 1 32.45 16.4 -0.082434
KA 7 1 48.78 38.24 -0.036012
KE 8 1 52.22 40.42 -0.037661
MP 9 1 61.78 49.78 -0.032372
MH 10 1 55.88 49.78 -0.018193
OR 11 1 70.07 65.28 -0.011393
PN 12 1 19.27 16.18 -0.026725
RJ 13 1 37.42 34.46 -0.013183
TN 14 1 54.79 51.66 -0.009521
TR 15 1 56.88 40.03 -0.049372
UP 16 1 49.05 47.07 -0.006727
WB 17 1 60.52 54.85 -0.015614
AN 18 1 55.42 52.13 -0.009894
CH 19 1 27.32 23.79 -0.021534
DN 20 1 37.2 15.67 -0.096460
DH 21 1 33.23 26.22 -0.035158
LA 22 1 52.79 42.36 -0.032929
PO 23 1 53.25 50.05 -0.010015
GO 24 1 37.23 18.9 -0.082057
JK 25 1 38.97 24.24 -0.062997
MA 26 1 53.72 37.02 -0.051811
ME 27 1 55.19 38.81 -0.049465
MI 28 1 54.38 36 -0.056331
NA 29 1 56.04 39.25 -0.049934
SI 30 1 55.89 39.71 -0.048249

142 INDIA EMERGING • VEENA JHA
1980 1985 1990 1st Period 1995 2nd Period 2000 3rd PeriodGrowth Rate Growth Rate Growth Rate
Andhra Pradesh 1467 2400 4816 0.201333 10018 0.216029 14715 0.093771
Assam 1329 2704 4432 0.127810 7001 0.115929 9612 0.074589
Bihar 1022 1785 2966 0.132324 4155 0.080175 6328 0.104596
Delhi 4145 6732 11373 0.137878 22376 0.193493 35705 0.119136
Goa 3200 4742 8952 0.177562 20040 0.247721 NA 0.2
Gujarat 2089 3468 6343 0.165801 13727 0.232823 18625 0.071363
Haryana 2437 4117 7721 0.175078 13975 0.161999 21114 0.102168
Himachal Pradesh 1820 2829 5243 0.170661 9513 0.162883 15012 0.115610
Jammu & Kashmir 2152 3482 4624 0.065594 7783 0.136634 12338 0.117049
Karnataka 1644 2699 4975 0.168655 10223 0.210974 16343 0.119730
Kerala 1835 2918 5110 0.150239 11469 0.248884 18262 0.118458
Madhya Pradesh 1609 2471 4798 0.188344 7705 0.121175 10907 0.083114
Maharashtra 2492 3915 7612 0.188863 16379 0.230346 23398 0.085707
Manipur 1396 2284 3912 0.142556 6875 0.151482 11370 0.130763
Meghalaya 1538 2543 4944 0.188832 8085 0.127063 11678 0.088880
Mizoram 1399 2885 4856 0.136637 10563 0.235049 11678 0.021111
Nagaland 1607 3042 5893 0.187442 11057 0.175258 11678 0.011232
Orissa 1352 2238 3166 0.082931 6806 0.229943 9162 0.069233
Punjab 2629 4500 8177 0.163422 15497 0.179038 23040 0.097347
Rajasthan 1424 2304 4883 0.223871 8497 0.148023 12533 0.094998
Sikkim 1545 2972 5213 0.150807 8905 0.141645 13356 0.099966
Tamil Nadu 1666 2913 5541 0.180432 11891 0.229200 19141 0.121940
Tripura 1645 2548 4240 0.132810 6387 0.101273 10213 0.119805
Uttar Pradesh 1402 2192 3937 0.159215 6596 0.135077 9765 0.096088
West Bengal 1925 3140 5072 0.123057 9068 0.157570 15569 0.143383
Andaman &Nicobar 4548 6936 9729 0.080536 18604 0.182444 23398 0.051537
Chandigarh NA 4500 8177 0.163422 26277 0.442705 46347 0.152757
Pondicherry 3201 5127 7657 0.098693 12201 0.118688 30768 0.304352

Part II

This page intentionally left blank

TTTTTrickling Down Grrickling Down Grrickling Down Grrickling Down Grrickling Down Growth throwth throwth throwth throwth throughoughoughoughoughthe Informal Sectorthe Informal Sectorthe Informal Sectorthe Informal Sectorthe Informal SectorCan Asset Formation Trickle Up Growth
India has experienced unprecedented high growth rates over the last 20years approaching double digit rates. Economic theory suggests that suchhigh growth rates should inevitably trickle down to the poor and povertywould eventually be ameliorated. However, poverty has been slow to declineand one of the reasons advanced for this slow progress on poverty is theoverwhelming size of the informal sector.1 Poverty is a key characteristic ofthe informal sector, and there appears to be a clear association between theincidence of poverty and participation in the informal sector. Measured onthe basis of consumption expenditure, evidence from India shows that 43per cent of informal sector participants were poor compared to only 6 percent in the formal sector (Pradhan et al., 1999). The Indian governmenthas recognised the critical role of the informal sector in alleviating povertyand constituted the National Commission on Enterprises in theUnorganised Sector (NCEUS) to study the conditions of the informalsector. The NCEUS has generated a large volume of data which has helpeddevelop a better understanding of the heterogeneity of the informal sector(NCEUS, 2009).
Economic logic suggests that India’s high growth rates would trickledown to the informal sector. However, the rates of poverty alleviation aredisappointing to say the least.2 To understand the diagnostics of slow povertyalleviation, it would be important to carefully analyse the effects of the highgrowth rates on the informal sector. Preliminary evidence suggests that thesize of the informal sector has remained stable over the last 30 years while
33333
1. Ninety-three per cent in terms of employment and over 60 per cent in terms ofoutput. National Commission for Enterprises in the Unorganised Sector (NCEUS)2009.
2. See Introduction to the book.

146 INDIA EMERGING • VEENA JHA
its share of output has declined (Bairagya, 2010). While this may suggest animpoverishment of the informal sector and of the majority of the populationof the country, it does not take account of the high growth rates and the factthat a declining share of a much larger GDP may still make the averageperson in the informal sector much better off than before. While the averageincomes by this simple mathematic may have risen in the informal sector, ofequal importance is the distributional effects of economic growth in theinformal sector. For poverty alleviation it is important that the poor do notget poorer in the informal sector. Moreover, within the informal sector it isimportant that there is upward mobility, i.e., the proportion of the poorshould be reduced incrementally with economic growth.
Given this background, this chapter analyses both the growth anddistributional consequences of high GDP growth rates on the informalsector. Section I begins with a review of literature on the informal sector indeveloping countries. This section thus contextualises the Indian informalsector not as an aberrant but as a part of development in a globalisingworld. Section II then goes on to examine the literature on growth and theinformal sector in India. This section uses data from secondary studies toexamine the effects of increase in informal sector wages and asset buildingon poverty. Using cross-sectional analysis across the different states ofIndia, and growth as a control variable, it tries to set out which variablei.e., increase in informal sector wages or asset building is crucial for povertyalleviation. It also clarifies whether the variable changes during a highgrowth phase in comparison to a low growth phase. Section III analyses thestructural changes in the composition of the informal sector during theperiod of high economic growth. The purpose of this section is to analysewhether there is upward mobility within the sector and to establish thatthe poor are not getting poorer with higher economic growth. It alsoprovides examples of grassroots capitalism as an example of theheterogeneity of the informal sector. Section IV identifies the catalysingvariables which accelerate asset formation or improve wages in theinformal sector during the high growth phase. The data for thiseconometric exercise has been generated through surveys conducted by theauthor. At the outset it must be stated that this chapter does not deny thepoverty of the informal sector in India, but rather seeks to examine thedynamism that the informal sector has generated in a rapidly growingIndia. Having identified the catalysing variables, Section V analyses

147TRICKLING DOWN GROWTH THROUGH THE INFORMAL SECTOR
government policy and actions which have addressed these catalysingvariables. It examines the shortcomings of some of these policies andmakes suggestions for their improvement. The chapter concludes withspecific recommendation on how government could promote thedynamism of the informal sector as an agent of trickle down. Thisdynamism if properly channelled would also trickle up growth.
I
Informal Sector in the Developing World
Theories on InformalismTheories on InformalismTheories on InformalismTheories on InformalismTheories on Informalism
Theories on the informal economy tend to be polarised. Some suggestthat it is a direct consequence of over-regulation by the state, or ofdraconian labour laws which have outlived their utility. In contrast, the‘marginalisation’ thesis sees the informal sector as a form of outmodedfeudalism confined to cities in developing societies, or as a central featureof economic development under contemporary capitalism and globalisation(Castells and Portes, 1989; Sassen, 1991; 1998). The narrative of informaleconomy as a site of exploitation has generated widespread discourse ofdualism, where its coexistence with a formal sector is considered intrinsicto modern globalisation. Prescriptions on the informal economy as aconsequence promote stronger regulations and tougher enforcementdesigned to minimise illegal activities (Portes and Schauffler, 1993).
The informal sector as a concept was first introduced by Hart (1971),according to Bekkers and Stoffers (1995). However, Kabra (1995) claimedthat the concept really built upon the earlier framework of the ‘unorganisedsector ’, which encompassed production units of small size, includinghandicrafts, which had a domestic or ‘unorganised character ’ and may alsobe part of the ‘non-monetary ’ sector of the economy.3 As claimed byBromley (1978), it may equally well be seen as a spin-off of the dualeconomy literature, originating with Lewis (1954) and Hirschman (1958),which conceptualised economic development as the emergence and growthof manufacturing sector (the ‘modern’ sector) through the absorption of
3. Report, 1951, by the Village Industries Commission, Government of India, On SmallScale Industries, http://www.indialabourarchives.org/sources/nmml2.htm
148 INDIA EMERGING • VEENA JHA
labour being freed from agriculture (the ‘traditional’ sector), due to themore efficient means of production in the former. Whereas the dualeconomy (the ‘modern-traditional’ dichotomy) literature mainly addressedthe sectoral differences in terms of the ‘technology’ applied, a somewhatlater related literature focussed more on the ‘organisation’ of the sectors(Sethuraman, 1976). The concept of the informal sector (IS) is a fuzzy one.Indeed Kabra (1995) states that some 30 terms including the survivalsector, non-structured sector and transitional activities have been and/orare currently used to describe the IS.
Irrespective of the definition or the constitution of the informal sector,the literature on informal economies pays special attention to the linkagesbetween formal and informal economies. There are three well-known schoolsof thought regarding the links between the informal and the formaleconomies: the proponents of these schools are referred to as, respectively,the dualists, the structuralists and the legalists. The stylised views of each ofthese schools can be summarised as follows. The dualists view the informaleconomy as a separate marginal sector—not directly linked to the formalsector—that provides income or a safety net for the poor (ILO, 1972). Theyargue that the informal economy exists or persists because economic growthor industrial development has failed, as yet, to absorb those who work in theinformal economy. The structuralists view the informal economy as beingsubordinated to the formal economy (Castells and Portes, 1989). They arguethat privileged capitalists in the formal economy seek to erode employmentrelations and subordinate those who work in the informal economy in orderto reduce their labour costs and increase their competitiveness. The legalistsview informal work arrangements—or, more specifically, unregisteredbusinesses—as a rational response to over-regulation by governmentbureaucracies (de Soto, 1989). They argue that those who run informalbusinesses do so to reduce their own costs and increase profits.
Each of these has a different perspective on how the informal andformal economies interact. The dualists argue that informal units andactivities have few (if any) linkages to the formal economy but, rather,operate as a distinct separate sector of the economy; and that informalworkers comprise the less-advantaged sector of a dualistic labour market(Lewis, 1954; Sethuraman, 1976; Tokman, 1978). Unlike the dualists,structuralists see the informal and formal economies as intrinsically linked.To increase competitiveness, firms in the formal economy are seen to
149TRICKLING DOWN GROWTH THROUGH THE INFORMAL SECTOR
reduce their input costs, including labour costs, by promoting informalproduction and employment relationships with subordinated economicunits and workers. According to structuralists, both informal enterprisesand informal wage workers are subordinated to the interests of providingcheap goods and services (Moser, 1978; Portes et al., 1989). The legalistsfocus on the relationship between informal entrepreneurs/enterprises andthe formal regulatory environment, not formal firms. But they acknowledgethat capitalist interests—what Hernando de Soto (1989) calls ‘mercantilist’interests—collude with government to set the bureaucratic ‘rules of thegame’.
FFFFFacts on Informalism in the Developing Wacts on Informalism in the Developing Wacts on Informalism in the Developing Wacts on Informalism in the Developing Wacts on Informalism in the Developing Worldorldorldorldorld
The informal economy consists of a range of informal enterprises andinformal jobs. Yet there are meaningful ways to classify its varioussegments, as follows:
1. Self-employment in informal enterprises: Workers in smallunregistered or unincorporated enterprises, including:
• employers;
• own account operators: both heads of family enterprises andsingle person;
• operators, and
• unpaid family workers.
2. Wage employment in informal jobs: Workers without workerbenefits or social protection who work for formal or informalfirms, for households or with no fixed employer, including:
• employees of informal enterprises,
• other informal wage workers such as:
– casual or day labourers,
– domestic workers,
– unregistered or undeclared workers and
– some temporary or part-time workers.
• industrial outworkers (also called home workers).
Informal employment broadly defined comprises one-half to three-quarters of non-agricultural employment in developing countries:

150 INDIA EMERGING • VEENA JHA
4. Women in the Informal Globalising Economy (WIEGO), http://www.wiego.org/main/ilocstats.html
5. Ibid.
6. Ibid.
7. Ibid.
8. Ibid.
specifically, 48 per cent in North Africa; 51 per cent in Latin America; 65per cent in Asia and 72 per cent in sub-Saharan Africa.4 The share ofinformal employment in non-agricultural employment is 78 per cent insub-Saharan Africa, excluding South Africa. South Asia’s share isconsiderably higher than 65 per cent judging by the share of Indianinformal employment.5
Some countries include informal employment in agriculture in theirestimates. This significantly increases the proportion of informalemployment: from 83 per cent of ‘non-agricultural’ employment to 93 percent of ‘total’ employment in India; from 55 to 62 per cent in Mexico andfrom 28 to 34 per cent in South Africa.6 Informal employment is generallya larger source of employment for women than for men in the developingworld. Other than in North Africa, where 43 per cent of women workersare in informal employment, 60 per cent or more of women non-agricultural workers in the developing world are informally employed. Insub-Saharan Africa, 84 per cent of women non-agricultural workers areinformally employed compared to 63 per cent of men; and in Latin America,the figures are 58 per cent of women in comparison to 48 per cent of men.In Asia, the proportion is 65 per cent for both women and men.7
As noted earlier, the informal economy comprises both self-employment in informal enterprises (i.e., small and/or unregistered) andwage-employment in informal jobs (i.e., without secure contracts, workerbenefits or social protection). In developing countries, ‘self-employment’comprises a greater share of informal employment outside of agriculture(and even more inside of agriculture) than wage employment: specifically,self-employment represents 70 per cent of informal employment in sub-Saharan Africa, 62 per cent in North Africa, 60 per cent in Latin Americaand 59 per cent in Asia.8 If South Africa is excluded, since black-ownedbusinesses prohibited during the Apartheid era have only recently been

151TRICKLING DOWN GROWTH THROUGH THE INFORMAL SECTOR
recognised and reported, the share of self-employment in informalemployment increases to 81 per cent in sub-Saharan Africa.9
Informal ‘wage’ employment is also significant in developingcountries, comprising 30 to 40 per cent of total informal employment(outside of agriculture).10 As noted earlier, informal wage employmentcomprises employees of informal enterprises as well as various types ofinformal wage workers who work for formal enterprises, households or nofixed employer (Chen et al., 2004).
Estimates concerning the income of informal producers have generallyrevealed that informal producers earn less than formal workers (Kelley,1994). The explanations put forward for these differences include formalsector unionisation and labour legislation (Mazumdar, 1975), labourheterogeneity and efficiency wage arguments (Bardhan, 1988). There aresignificant gaps in earnings within the informal economy: on average,employers have the highest earnings; followed by their employees and othermore ‘regular ’ informal wage workers; own account operators; ‘casual’informal wage workers and industrial outworkers.
Sethuraman (1997) reports that the majority of the working poor arein informal sector in Latin America (e.g., 66.2 per cent in Bolivia, 66.4 percent in Brazil, 87.1 per cent in Panama and 57.4 per cent in Venezuela).However, the association between poverty and participation in the informalsector does not hold uniformly across all types of workers. The self-employed, particularly microenterprise owners, are found to have averageearnings several times the minimum wage, leading to the possibleinference of a lower likelihood of poverty among them (Ñopo andValenzuela, 2007). Consequently, in many cases, it might be incorrect toclaim that poverty is a defining characteristic of the informal sector as awhole though on an average poverty is higher in the informal sector.
How do these stylised facts on the informal economy apply to India?Does the informal sector behave differently when the economy is growingrapidly and opportunities are being created in the formal sector? In arapidly globalising world, as was pointed out by de Soto (1989), would
9. Ibid.
10. Ibid.

152 INDIA EMERGING • VEENA JHA
formal sector growth attract more informal sector growth and perhaps anupward push of wages? Also given the heterogeneity of the informal sector,it is possible that there is upward mobility in jobs within the categories ofthe informal sector itself. This would undoubtedly have a positive effect onpoverty. Notwithstanding the standard literature on the informal economy,it is possible that in high growth economies the informal sector may play adynamic role in trickling up growth. To begin with, in India poverty ratiohas decreased with increased growth. Would this imply that the informalsector has become an effective trickle down and trickle up agent? Thesubsequent sections analyse the manner in which this may be happeningand what can be done to accelerate this trickle down.
Situating the Informal Sector in IndiaSituating the Informal Sector in IndiaSituating the Informal Sector in IndiaSituating the Informal Sector in IndiaSituating the Informal Sector in Indiain the Global Economyin the Global Economyin the Global Economyin the Global Economyin the Global Economy
There is no uniform definition of the informal sector in India.Productive institutional units characterised by a low level of organisationwith no access to formal credit, little or no division between labour andcapital, labour relations based on casual employment and/or socialrelationship, as opposed to formal contracts, labour-intensive technology,and low-skill labour are categorised as informal units. These units to alarge extent belong to the household sector and cannot be associated withother organisations (Sinha, 2002). The National Commission forEnterprises in the Unorganised Sector estimates suggest that the informalsector vary between 89 and 93 per cent of total employment (NCEUS,2009).
In the primary sector about 98-99 per cent of the workers wereinformally employed in 2005. In the secondary sector, the percentage ofinformal employment has increased from 85.56 per cent in 1999-2000 to89.39 per cent in 2004-05. In the tertiary sector also the informalemployment has increased from 75.83 per cent in 1999-2000 to 79.70 percent in 2004-05 (NCEUS, 2009).
In terms of GDP, the share of the formal sector in 2004-05 was only 4per cent in agriculture whereas 96 per cent was contributed by the informalsector (NCEUS, 2009). Thus, informal activities are mainly studied for thenon-agricultural sectors only. In the manufacturing sector, 60 per cent

153TRICKLING DOWN GROWTH THROUGH THE INFORMAL SECTOR
share in NDP is in the formal sector while 40 per cent share is contributedby the informal sector. In services, 53 per cent of the output comes fromthe formal sector while 47 per cent of the share is contributed by theinformal sector.11 Thus in terms of output, the share of the informal sectoris estimated to be between 50 and 60 per cent.12
However, the quality of employment is of vital importance indetermining the poverty status of the informal sector (Table 3.2). While thesefigures apply to the entire labour force, given that 93 per cent of the totalemployment is in the informal sector, they also indicate the quality ofemployment in the informal sector. It shows that the proportion ofunemployed, the severely unemployed and the underemployed have risensignificantly in the decade from 1993-94 and 2004-05. In fact it has beenmuch higher than the rate of growth of the labour force and the rate ofgrowth of workers, showing that a significant proportion of the increments inthe labour force are either unemployed or severely unemployed.
Table 3.1
Formal and Informal Employment in India(in million)
1983 1988 1993-94 1999-2000 2004-05
Estimated population 718 790 895 1004 1093
Labour force 309 334 392 406 —
Employed 303 324 374 397 457
Unemployed 6 9 7 10 —
Formally employed 24 26 27 35 39
Informally employed 279 299 347 362 423
Source: Various rounds of Employment-Unemployment Survey of NSSO, Expert committee of populationprojection, DGE&T and the National Commission for Enterprises in the Unorganised Sector(2008).13
11. “Delhi Group on Informal Sector and System of National Accounts”, Paper compiledby Ramesh Kolli, Deputy Director General, Central Statistical Organisation, Ministryof Statistics and Programme Implementation, India. From the documents availablewith the Delhi Group Secretariat, http://www.unescap.org/stat/apex/2/APEX2_S.5_India-SNA-informal.pdf
12. Ibid.
13. Adapted from Bairagya (2010).

154 INDIA EMERGING • VEENA JHA
Table 3.2
Estimates of Labour Force, Employment and Unemployment(in million)
1993-94 2004-05 Growth Rate (%)
Labour force 341.15 429.88 2.02Workers 326.97 401.13 1.88Unemployed 18.18 28.74 4.25Severely unemployed 18.08 28.65 4.27Strictly part-time workers 10.75 13.06 1.78Underemployed 5.54 9.57 5.10Current weekly status worker 342.92 423.36 1.93
Note: Severely unemployed refers to those reporting unemployment for 3.5 days or more of the week;Strictly part-time workers refers to persons who worked for 0.5 to 3 days in the week and are notavailable for work even for 0.5 days during rest of the week; underemployed refers to persons whoworked for 0.5 to 3 days in the week and are unemployed for at least 0.5 days in the week.
Source: NSSO 50th and 61st Round Survey on Employment-Unemployment. Computed by NCEUS.
The first question that needs to be asked in the context of the Indianinformal sector is why is it so large? Despite economic reforms, starting aformal business in India requires 11 procedures and 71 days (down from 89in 2009). In addition:
• dealing with licences requires 20 procedures and 270 days;
• export procedures take 36 days;
• import procedures take 43 days;
• there are 59 taxes, compliance with which takes about 264 hours, and
• overall, some 40 procedures and 425 days are required for acontract.
The ‘rigidity of employment’ index, which relates to difficulties inhiring and firing workers, ranks India 62nd on an index of 100—by far thehighest in the region. And while starting a business is obviously difficult,closing a business is likely to be even more so. According to this report,bankruptcy procedures take 10 years in India (World Bank Group, 2010;WEF, 2009).
The second question that arises is whether the formation of theinformal sector is a part of economic development and whether it wouldchange with high rates of growth. At the core of the debate on the Indianinformal economy is the oft-repeated question of whether and how to

155TRICKLING DOWN GROWTH THROUGH THE INFORMAL SECTOR
‘formalise’ the informal economy.14 However, it is not clear what is meantby ‘formalisation’. For the self-employed, policymakers often suggest thatformalisation could mean that informal enterprises should obtain a licence,register their accounts and pay taxes. But to the self-employed, and oftenthe poor, these represent the costs of entry into the formal economy. Theywould like to receive the benefits of operating formally in return for payingthese costs, including: efficient and effective electricity supply, security ofoperation, better freight and transportation for their products, effectivemarketing. The state is in no position to provide these facilities all ofwhich have to be provided by the enterprises themselves, and thus oftenthe cost of entry far exceeds the benefits of doing so.
For informal and casual workers, however, formalisation meansobtaining a formal wage job—or converting their current job into a formaljob—with secure contract, worker benefits and social protection. For them,it is a coveted situation with lower accountability and greater benefits. Forthe employers on the other hand, formalisation represents a situation ofrising costs, often falling productivity and lower competitiveness. In aglobalised open economy, competitiveness has become very important andthus the costs of formalising informal labour may be prohibitively high(Dreyer, 2009).
Taking into account the different meanings of formalisation, thefeasibility of formalising Indian informal economy is unclear. First,government would not be able to handle the volume of licence applicationsand tax forms if all informal businesses are formalised. Second, employerswould not in several cases be able to afford to offer incentives and benefitsthat formal sector receive. Third, while unemployment rates have been staticor declining in India, at this present time supply of unskilled labouroutweighs demand thus making high wage employment in the formal sectorunattractive for employers.15 Finally, available evidence suggests thatemployers are more inclined to convert formal jobs into informal jobs—rather than the other way around in a bid to remain competitive in the globaleconomy. The policy challenge is to decrease the costs of working informally
14. Statements of the Left Party, National Commission for Enterprises in theUnorganised Sector, Government of India, 2007, http://www.wsws.org/articles/2007/sep2007/indi-s15.shtml
15. http://www.ilo.org/employment/Areasofwork

156 INDIA EMERGING • VEENA JHA
and to increase the benefits of working formally. This can only take place inan incremental fashion given the magnitude of informality in the Indianeconomy.
The recent re-convergence of interest in the informal economy stemsfrom the recognition that the informal economy is growing; is a permanent,not a short-term phenomenon and is a feature of high growth and globalintegration of the Indian economy (NCEUS, 2007). For these reasons, theinformal economy has to be viewed as the base of the total Indian economy.
Economic relations—of production, distribution and employment—tendto fall at some point on a continuum between pure ‘formal’ relations (i.e.,regulated and protected with benefits) and pure ‘informal’ relations (i.e.,unregulated and unprotected with little or no benefits), with many categoriesin between. Depending on their circumstances, workers and entrepreneursare known to move with varying ease and speed from informal to formal, orto operate simultaneously at different points in the formal and informalsectors. Consider, for example, the self-employed garment maker whosupplements her earnings by stitching clothes under a subcontract or shiftsto working on a subcontract for a firm when her customers decide they preferready-made garments rather than tailor-made ones. Or consider the publicsector employee who has an informal job on the side.
Moreover, the formal and the informal sectors are often dynamicallylinked. For instance, many informal enterprises have production ordistribution relations with formal enterprises, supplying inputs, finishedgoods or services either through direct transactions or subcontractingarrangements. Also, many formal enterprises hire wage workers underinformal employment relations. For example, many part-time workers,temporary workers and homeworkers work for formal enterprises throughcontracting or subcontracting arrangements.
The Indian informal economy is consistent with their othercounterparts in the developing world. However, India has experienced highgrowth rates over the last 20 years and this should have changed thestructure, wages and the scale of the informal economy. The next sectionexamines the effects of growth on the informal sector of the economy.

157TRICKLING DOWN GROWTH THROUGH THE INFORMAL SECTOR
II
Growth, Poverty and the Informal Sector:Reviewing Contrasting Points of Viewson the Informal Economy in India
According to some economists such as Arup Mitra (2007), the labourabsorption capacity of the informal sector is much more than its formalcounterpart. The share of the informal sector is equally high in the stateswhich are highly industrialised in comparison to the states which areindustrially backward. Subcontracting and other indirect processes seem tobe generating employment in the informal sector in the industrialised states,whereas artisanal employment has been the major source of employment inbackward states. Both direct and indirect effects of industrial growth havebeen beneficial for living standards in the informal sector. On the whole, nostrong evidence is found to suggest any deterioration in the informal sectorliving conditions during the process of growth. It is however, not clearwhether the trickle-down effects are substantive (Mitra, 2007).
Given the dimension of informal labour markets in India, and the factthat the vast majority of poor, if not all, are actually unskilled workerswhether in agriculture or in urban informal sectors, changes in theunskilled real informal wage and real agricultural wages should reflect thetrickle-down effects of high growth. This hypothesis is further strengthenedby a study by Deaton and Drèze (2002) which reveals a negative correlationbetween real agricultural wages and rural poverty: -0.87 in 1993-94 and-0.91 in 1999-2000. Another study by Marjit et al. (2003) also observes anegative correlation between the real informal wage and rural poverty atthe state level in 1999-2000 estimated at -0.58 for the 30-day recall periodand -0.57 for 7-day recall period based on the Deaton and Drèze (2002)adjusted poverty estimates. (Poverty estimates in India are based on themoney value of the amount of calories consumed either for the 30 days orfor the 7 days preceding the survey. Benchmarks for minimum calorificconsumption for rural and urban areas have been established.)
The study by Marjit et al. (2003) further shows that the averageannual growth rate of real informal wage (RIW) across 14 states declinedbetween 1984-1989. This was the period of low GDP growth rates of only a

158 INDIA EMERGING • VEENA JHA
little over 3 per cent annually. However, during 1989-90 to 1994-95, therehave been complete reversals. Annual GDP growth rates increased quitesignificantly to a little over 5 per cent per annum, accompanied by anincrease in RIW over the period for all these states. This increase may beattributed to the growing economy which raised the demand for informalunskilled labour.
Another study by Acharya (2006) shows that the annual growth in realwage for unskilled agricultural workers and informal sector wages increasedsteadily during 1993-94 to 2004-05. Thus, both real informal andagricultural wages for unskilled workers increased on an average during thehigh growth periods resulting, of course, from increased demand forunskilled workers employed in informal sectors and agriculture. However,whether such improvements in wages are due to the composition effect orpure growth effects is an open question. Whatever the cause, the fact thatreal wages in the poorest sectors, i.e., informal and agriculture increasedduring the high growth periods makes a persuasive case for trickle-downeffects of growth through the informal sector.
Another study by Dasgupta and Singh (2006), using the data onregistered and unregistered manufacturing sector from the Ministry ofIndustry, shows that both registered and unregistered manufacturing arehighly positively related to state-GDP growth. The Beta coefficients forunregistered manufacturing are, if anything, greater than those forregistered manufacturing. However, this result may not be reliable as theequations for registered manufacturing do not pass the various diagnostictests. The equations for unregistered manufacturing do pass the diagnostictests. In economic terms, it is interesting that there should be a highlypositive correlation between unregistered manufacturing growth and state-GDP growth for both 1993-94 and 1999-2000. To the extent that un-registered manufacturing is representative of the informal sectormanufacturing economy, the evidence from this study suggests that theinformal sector is not just a residual sector but in fact it may be capable ofdynamic growth (Dasgupta and Singh, 2006).
Another paper by Bhattacharya (1996), of the Heriot-Watt University(Scotland), highlights the role of the informal sector in the Indian economy.The paper notes that it was the informal sector (I-sector) which accountedfor most of the increase in non-agricultural employment. Evidence further

159TRICKLING DOWN GROWTH THROUGH THE INFORMAL SECTOR
suggests that the I-sector was not a passive absorber of labour but adynamic sector responding successfully to changing demand in theeconomy and contributing significantly to income and output. Thisargument implies that the I-sector trickled up growth. The paper also offersa hypothesis that, simultaneously with these changes in economicstructure, there is likely to have occurred a change in the composition ofrural-urban migrants with the share of those who go to the I-sector andhave only I-sector jobs as their targets (usually members of the poorerhouseholds in the rural areas) increasing and that of those who go to theformal sector (usually well-educated members of the relatively well-to-dolandowning families in the rural areas) declining; further, migration by themembers of the poorer rural households is likely to have increased notbecause their rural income declined but because the informal sector incomeincreased.
Another study by Bosworth et al. (2007) shows that output growthsurged to 7 per cent per year during 1993-1999. During this period, formalemployment decreased whereas informal employment increased. There wasa particularly large jump in labour productivity—concentrated in services butevident in all sectors. It was associated with rises in both TFP and capitaldeepening. Output moderated somewhat during the period (1999-2004) withgrowth slowing in all sectors, in part due to the severe drought.Contributions from TFP and capital deepening slowed in both services andindustry. Notably, investment failed to keep up with the more rapidemployment growth, particularly in the informal sector. However, informalsector wages rose and at rates higher than the formal sector.
Effects of Informal Sector WEffects of Informal Sector WEffects of Informal Sector WEffects of Informal Sector WEffects of Informal Sector Wages andages andages andages andages andAssets on PAssets on PAssets on PAssets on PAssets on Povertyovertyovertyovertyoverty
While the theoretical and empirical justification for a strong inversecorrelation between poverty and informal sector wages is evident from thepreceding literature survey, the effects of economic growth on the informalsector is more nuanced. This section will empirically establish whetherinformal sector wages or informal sector asset formation had a significantcorrelation with poverty. It is expected that the correlation variable (i.e.,informal sector wages or asset formation with poverty) may change duringperiods of high growth rates. Two time periods with different levels of GDP

160 INDIA EMERGING • VEENA JHA
growth have been used in this analysis. The data has been used from apaper written by Marjit and Maiti (2005) for World Institute forDevelopment Economics Research (WIDER) on both informal sector assetformation and informal sector wages. The periods used are immediatelybefore economic reform, i.e., 1989/90 to 1994/95 and from 1994/95 to1999/2000. The latter was a higher growth period than the former. Usinggrowth rates across states as a control variable, the effects of informalsector asset formation and informal sector wages have been plotted on thelevels of poverty across states in Figures 3.1 and 3.2.16 (see Annexure A-3.1for the datasets used in the regression analysis.) As Figure 3.1 shows, theeffect of informal sector asset formation on poverty is higher in the highgrowth period rather than in the lower growth period. In the lower growthperiod the effects on poverty are higher with higher wages. Thus, usinggrowth as a control variable illustrates differential effects on inter-statepoverty between informal sector wages and informal sector asset formation.
Figure 3.1
1994/95 to 1999/2000 Poverty Reduction, Growth in Informal SectorWages and Informal Sector Asset Formation
The x-axis indicates the state for which the variables povertyreduction rates, growth in informal sector wages, and growth in informalsector asset formation are plotted. As can be seen from Figure 3.1, thehigher the asset formation for state, number 4 for example, the lower is the
200.00
150.00
100.00
50.00
0.00
-50.001 3 5 7 9 11 13 15 17 19 21 23 25 27 29
pd3pvrty pd3wages pd3asset
16. Economic Survey, 2005. http://exim.indiamart.com/economic-survey-2005-2006/

161TRICKLING DOWN GROWTH THROUGH THE INFORMAL SECTOR
level of poverty. This is despite the fact that level of informal sector wageswere more or less stable across states for this entire period. This impliedthat the growth rates in wages during this high growth phase was close to 0in most states. Despite this low growth in wage rates, the rate of growth ofasset formation in most states was well above 0. The levels of povertyreduction closely followed the curve for asset formation across states.
As can be seen from Figure 3.2, the higher the wages the lower thepoverty, with wages having a more decisive effect on poverty rather thanasset formation. For the period of lower growth rates, the curve on povertyreduction more closely follows the curve of growth rates of wages in theinformal sector. It is also to be noted that during the period of lowereconomic growth, the rate of asset formation is lower. This was despite thefact that except for a few states, wage increases were well above 0 in moststates in the lower growth phase.
Figure 3.2
1989/90 to 1994/95 Poverty Reduction, Growth in Informal Sector Wagesand Informal Sector Asset Formation
These correlations are further confirmed by the regression analysis forthe first period. A detailed explanation of the data sources are provided inAnnexure Tables. It is interesting to observe in the regression below thatthe rate of growth of assets has the most statistically significant effect onpoverty. The rate of growth of informal sector wages had a statisticallysignificant fixed effect. The rate of growth of the state domestic product(SDP) does not have a statistically significant effect on poverty. The
80.00
60.00
40.00
20.00
0.00
-20.00
-40.00
1 3 5 7 9 11 13 15 17 19 21 23 25 27 29
Pd2pvrty Pd2wages Pd2asset

162 INDIA EMERGING • VEENA JHA
elasticities with respect to asset formation and wages on poverty is muchhigher than with respect to SDP growth. Thus, every 0.3 per cent increasein informal sector assets and every 0.2 per cent increase in informal sectorwages, decreases poverty by 1 per cent whereas every 1.1 per cent rate ofgrowth of SDP reduces poverty by 1 per cent.
These results have significant policy implications. Government policyshould thus focus on supporting asset formation in the informal sector. It isalso important for the government to identify the variables that lead tohigher asset formation in the informal sector. Similarly, it is important toidentify the variables that could lead to higher wages. This is becausegovernance deficits (see Chapter 6) in transferring incomes to the poor orbuilding assets such as houses for the poor have led to poor outcomes.Thus, policy design has to take account of variables which lead to higherwages or higher levels of asset formation, as some of the identified variablesmay be easier to address through policy than others.
Table 3.3
Dependent Variable: Log (PPv) (For the Period 1984/85 to 2000/01)at 95 Per cent Level of Significance
Variables OLS Fixed Effect Random Effect FGLS
As/As -0.003*** -0.002*** -0.002*** -0.002***(0.001) (0.0006) (0.0006) (0.0003)
W/W -0.002 -0.003** -0.003* -0.004***(0.003) (0.001) (0.001) (0.0006)
Y/Y -1.06 0.244 -0.001 0.093(0.67) (0.456) (0.444) (0.223)
R-sq 0.11 - - -
F (3,86) 3.77*** - - -
R-sq-within - 0.19 - -
F(3,57) - 4.58*** - -
Wald chi2(3) - - 14.93*** 59.59***
Hausman test: chi2 (3) - 5.72 -
Auto correlation coeff. - - 0.722
No. of observations 90 90 90 90
Note: As/As: Growth rate of real informal sector real fixed asset; W/W: Growth rate of real informalwage; Y/Y: Growth rate of per capita domestic product; PPv: Percentage of population belowpoverty line; ***: Significance at 1 per cent; **: Significance at 5 per cent and *: Significance at 10per cent.

163TRICKLING DOWN GROWTH THROUGH THE INFORMAL SECTOR
III
Economic Growth and Structural Changesin the Indian Informal Sector17
The rates of growth of the Indian economy between 1993-94 and1999-2000 averaged about 4.5 per cent per capita, whereas the growth rateper capita between 1999-2000 to 2004-05 averaged about 7 per cent percapita. The distribution of employment is indicative of the trickle-downeffects of the high rates of growth. Throughout this period of high growth,there was a steady movement out of agriculture into non-agriculturalactivities in rural areas. During the first period with lower rates of growth,there was a decrease of over 5 per cent in households which were self-employed in the agricultural sector with a simultaneous increase of nearly1 per cent in the non-agricultural sector (NCEUS, 2007). Using theframework of stylised facts derived by Martha Chen, the decrease in self-employed in agriculture, and the increase in agricultural labour would beindicative of a decrease in the rate of increase of rural incomes. By contrast,the number of self-employed in the urban areas increased marginally by 1per cent, whereas the numbers of regularly employed fell by nearly 2 percent. The incidence of casual labour increased by about 1 per cent(NCEUS, 2007). Whether the gainers compensate the losers in a net sensewill depend on the wage rate increase in the informal sector whichaccording to the NSS has been steady (NCEUS, 2007). Thus in the firstperiod there should be an overall decrease in poverty, with urban povertyreducing at higher rates than rural poverty. In the second period bycontrast, the reverse should be expected, i.e., rural poverty should decreasefaster than urban poverty and in fact this is vindicated by NSS (NCEUS,2007). From 2000-2005, the rate of growth in the agriculture sector washigher which along with higher proportion of self-employed households isindicative of better poverty impacts in the rural areas. In fact, the share ofhouseholds in self-employment grew by 5.6 per cent just at par with thegrowth in their share in population. The decrease in agricultural labourboth in terms of households and in terms of population is indicative ofopportunities available elsewhere. The category of other labour, presumably
17. All the data used in this section unless otherwise specified has been obtained fromthe NCEUS report.
164 INDIA EMERGING • VEENA JHA
non-farm labour increased keeping pace with the population composition ofthis subsector.
The decline in share of ‘others’ in the labour force is outstripped bypopulation composition of this category in the second period indicating againthe relative importance of self-employment in rural areas. By contrast, theincrease in share of self-employed households in urban areas was lower byalmost one whole percentage point in comparison to their share in thepopulation. This is indicative of slower opportunity growth in this subsector.The decrease in regular wage or salaried employment has been lower duringthe higher growth period, with the decline being somewhat lower than thedecline in the share of population in urban areas. This would imply that thecreation of jobs during the period of high growth in the formal sector justoutstripped the increase in population though still declining marginally. Thedecline in the share of households and in population in the other categoriesare at par, again indicating the increase in opportunities elsewhere.
By all measures, it is the self-employed category which comprise overhalf the households in the rural sector and nearly 40 per cent of thehouseholds in the urban sector. Thus, it is this sector which is relativelyless poor which should be studied more carefully for examining theirpotential for trickle down. According to a recent survey by the GoI, over 74per cent of the self-employed category could be classified as poor andvulnerable, with an average expenditure of half a US$ per day per capita,whereas the rest would belong to middle and higher income groups. Thelatter comprises people with sufficient capital or skills such as professionallawyers, accountants etc. In the rural areas, only 1.1 per cent of the self-employed are landless, whereas nearly 55 per cent are small (1-2 ha of land)or medium and large landowners (over 2 ha of land). The rest have lessthan 1 ha of land. So by and large the self-employed do have some assets,though there is considerable variance in their level of assets. By contrast inthe urban areas nearly 14 per cent of the self-employed are landless andnearly 90 per cent have less than 1 ha of land. Only over 10 per cent of theself-employed are either small or medium and large landowners. Thechange in the trend of the self-employed in rural households is thereforeindicative of lower fragmentation of holdings and perhaps an exodus tourban areas. Both would be better for poverty alleviation in rural areas. Thesmaller landholdings in urban areas is indicative of the fact that skills such

165TRICKLING DOWN GROWTH THROUGH THE INFORMAL SECTOR
as education, rather than assets such as land may be better for the self-employed in urban areas in alleviating poverty.
Table 3.4
Distribution of Households by Type of Employment(All-India)
Household Type Households Population
1993-94 1999-2000 2004-05 1993-94 1999-2000 2004-05
RuralSelf-employed in:
Agriculture 378 327 359 424 371 398
Non-agriculture 127 134 158 131 139 167
Self-employed 505 461 517 554 509 565
Agricultural labour 303 322 258 275 301 241
Other labour 80 80 109 75 76 106
Rural labour 383 402 367 350 376 346
Others 112 137 116 95 114 88
All 1000 1000 1000 1000 1000 1000
Urban
Self-employed 337 344 375 388 393 433
Regular wage/salaried 434 417 413 428 402 396
Casual labour 132 140 118 129 141 118
Others 97 97 94 55 63 52
All 1000 1000 1000 1000 1000 1000
Source: NCEUS.
The education profile of the self-employed in the rural areas is alsomarginally better than that of the other categories. For example, the self-employed had a mean of 3.4 years of schooling in comparison to the othercategories which had a maximum (agricultural workers) of 2.8 years ofschooling. Both self-employed men and women had better schooling. In theurban areas too, self-employed men and women tend to be better educatedthan that of other unorganised sectors, with more than 60 per cent of themwith an education of over 8 years of schooling. Self-employed in urbanareas can be divided by categories of those who have physical assets, orthose who have human capital to those which have none. The lowestcategory of self-employed consists of rickshaw pullers, street vendors, beedirollers and the like with little access to any of these assets.
A poverty analysis of the different categories of informal workers alsoshows some interesting trends. The poverty levels of self-employed while

166 INDIA EMERGING • VEENA JHA
higher than regular workers in the rural areas was only marginally so. Thepoverty levels of casual workers was much higher by about 8 percentagepoints in comparison to the self-employed. Thus, a higher growth in theproportion of self-employed in comparison to others may be indicative oftrickle-down effects during high growth periods in agriculture. In addition, inthe urban areas the poverty incidence of self-employed is less than half thatof casual labour. Again the decrease in casual labour, accompanied by anincrease in self-employment would be evidence of trickle down in highergrowth periods. The fact that there is convergence between the poverty ratesof regular and self-employment in the urban areas may be an indication ofoutsourcing industrial activities to the informal sector. This does not meanthat the formal sector is being informalised (absolute numbers are more orless the same at slightly over 33 million workers between 2000-2005), butrather incremental gains in the formal sector are being made perhapsthrough outsourcing production to the informal sector (increase in formalsector employment of informal workers from 20 to 29 million during thisperiod) (NCEUS, 2007). This may also be an important source of trickledown through the informal sector. In fact, this trend towards strengtheningthe formal-informal sector linkage is clearly a response to maintainingcompetitiveness in the face of uncertainty brought about by globalisation.Whatever the reason, it has undoubtedly helped reduce poverty.
The occupational profile of informal sector workers in the self-employed category, both in the agricultural and non-agricultural sectorsalso shows their high sensitivity to growth. The occupational profile of theself-employed in the non-agricultural sector are primarily in production forwomen and trade and sales for men. The occupational profile of men andwomen are not very different in the self-employed category in rural areas,though women account for a higher proportion of producers in rural areas.In the casual work category, however, the occupational profile is reversed,with most men in production and women in services and production-related categories. The NCEUS has also pointed out that the scheduledcastes and tribes (SC/ST) are most vulnerable with a poverty incidence ofover 40 per cent which is much higher than that of the casual informallabour. A higher proportion of labour from the SC/STs were likely to becasual in both rural and urban areas, which also explains the higherincidence of poverty for this social group. However, given the decline in the
167TRICKLING DOWN GROWTH THROUGH THE INFORMAL SECTOR
proportion of casual labour households in both rural and urban areas in theperiod of high growth (2000-2005), it is likely that some of this populationis also getting into either regular employment or self-employment.
Analysing the SelfAnalysing the SelfAnalysing the SelfAnalysing the SelfAnalysing the Self-Employed in the Informal Sector-Employed in the Informal Sector-Employed in the Informal Sector-Employed in the Informal Sector-Employed in the Informal Sector
The self-employed which is the largest category of the informal sectorhas been further classified into three subcategories: (a) own accountenterprises (OAE) accounting for 46 per cent of the total informal sectorworkers and two-thirds of the category of self-employed, (b) unpaid familylabour, and (c) employers, i.e., those that hire at least 1 worker and up to10 workers. In addition, homeworkers are also included in the self-employed categories. The category of self-employed is not necessarily anduniformly poor.
The objective function of the OAE, in which can be subsumed unpaidfamily labour, is to maximise the value added irrespective of how manyfamily members are needed to work in this enterprise. About 37 per cent ofthese have assets of only Rs 5,000 (US $100) with a much higherconcentration in rural areas, where 43 per cent have assets of onlyRs 5,000 (US $100) in urban areas. Only 8 per cent of the rural OAE and17 per cent of the urban OAE have assets more than Rs 10,000 (US $200).The rest have assets between Rs 20,000 (US $400) and Rs 70,000 (US$1,400). Most use their fixed assets and only a small proportion hireassets. OAEs are concentrated in food processing, tobacco, textiles andwearing apparel, and in producing non-metallic products.
The gross value addition per worker in OAEs in rural areas is Rs 1,167(US $20) per month in comparison to the poverty line which is Rs 327 (US$8) per capita per month in rural households. In the urban areas the grossvalue addition per worker is Rs 2,175 (US $40) in comparison to the povertyline which is Rs 454 (US $9) per capita per month. This implies that if thereare two full-time workers in OAEs households, in both rural and urban areas,a significant proportion of the population in India would clear the povertyline. However, the notional number of workers per household in OAEs wasabout 1.89. Further about 57 per cent of the rural OAEs and 30 per cent ofthe urban OAEs have incomes below the notional minimum for sustainablelivelihoods (NCEUS, 2007).

168 INDIA EMERGING • VEENA JHA
Nearly 64 per cent of these enterprises believe they are stagnating, and10 per cent felt that they were contracting. However, 18 per cent felt thatthey were expanding. Surprisingly, a high 30 per cent of the enterprises feltthat they did not face any serious problems. Credit, infrastructure and lackof marketing facilities, as well as competition from large firms were theproblems identified by this sector. Considering that less than 10 per cent ofthe rural and less than 25 per cent of the urban OAEs are not registeredwith any type of agency, lack of access to credit is not surprising.
The second category of self-employed with hired workers employaround 26 per cent of the workers in the informal enterprises. The value ofassets with this group is an average of Rs 300,000 (US $8,500) and nearly43 per cent of such enterprises have assets exceeding Rs 100,000 (US$2,500). The gross value added per worker in these enterprises is around Rs26,303 (US $525) per annum in rural areas and around Rs 43,061 (US$800) per annum in urban areas. Obviously this is much above sustainablewage rates. About 50 per cent of the enterprises believe that they werestagnating and nearly 30 per cent believed they were expanding.Registration levels were also higher at nearly 43 per cent in rural areas andnearly 57 per cent in urban areas. Problems of credit were identified ascrucial in this subsector too.
The information on the status of enterprises in the informal sectorcollected in the survey of NSSO in 1999-2000 showed the owner ’simpression about the growth of his enterprise over the last three years.Over 20 per cent of the entrepreneurs felt that their business activitieshave expanded over the three years preceding the date of survey.However, about 10 per cent entrepreneurs felt that their business hasshrunk over the last three years. About 63 per cent of the entrepreneursfelt that their enterprises were stagnant while 7 per cent enterpriseswere started during the last three years only. Again this shows that innet terms informal enterprises have been doing better towards the endof the last century.
About 12 per cent of the self-employed workers are homeworkers. Thepercentage is much higher for women. In the manufacturing sector, 32 percent are homeworkers and among the women 50 per cent of thoseemployed are homeworkers. There are two kind of contracts for homeworkers,
169TRICKLING DOWN GROWTH THROUGH THE INFORMAL SECTOR
one which provides raw materials and the other which does not. In India,the predominant form of contracts, nearly 70 per cent, is of the first kind.This implies that the homeworker is dependent on the middleman orcontractor for raw materials and the status of a homeworker is closer to awage worker. The largest number of homeworkers are concentrated intobacco and the wearing apparel industry.
Generally homeworkers receive lower wages, though living at hometheir expenses are lower. On an average the homeworkers received about 50per cent of the minimum wage. Delayed payments, insufficient and lowquality of raw materials, health problems because of poor home conditionswere reported for this sector. The advantage of homeworkers who are onthe lower end of the value chain is that employers have no outlay forinfrastructure which would otherwise have been the case. Homeworkerscan also adjust their timing to suit their domestic activities.
While the self-employed are relatively better off than casual or in somecases even regular workers, their conditions of living generally tend to bepoor. They all share some common problems such as access to credit, poorliving conditions, poor buildup of human capital. Absence of education andhealth acts as a debilitating factor for securing a reasonable living.Therefore, policies have to focus both on promoting the sustainability ofsuch enterprises and to the provision of the labour involved in suchenterprises with a living wage.
Success Stories of the Informal EconomySuccess Stories of the Informal EconomySuccess Stories of the Informal EconomySuccess Stories of the Informal EconomySuccess Stories of the Informal Economy
The preceding sections have reflected the dynamism of the informaleconomy and also identified variables which could accelerate thisdynamism. While high growth rates have inevitably trickled down to theinformal economy, it is also true that the informal economy is poor on anaverage. The average picture as seen above has to be nuanced with the vastdifferences that exist within the informal economy. This section gives someexamples of how the informal economy has sought to make innovations toreach the poorest of the poor or what can be called ‘grassroots capitalism’.The section concludes with some recommendations on how theseexamples can be multiplied and their core strengthened.

170 INDIA EMERGING • VEENA JHA
Grassroots Capitalism
Anecdotal examples of ‘grassroots capitalism’ thriving in India is alsopresented in a paper by Mitra (2006). Operating from small workshops, theinformal sector can assemble a whole vehicle from scratch right under theroadside tree. In many parts of north India, these homemade vehicles arecalled jugaad, slang for ‘quick fix’. Delhi generally provides used car partslike gearboxes, radiators, wheels and steering wheels. The mechanics startwith an 8–12 horsepower agricultural diesel engine of the sort typicallyused to drive a water pump or other farm equipment. Then the chassis iswelded, the engine is mounted, and the gearbox is connected to power therear wheels. With a rudimentary bench as seat, the vehicle is ready to chugalong at around 20 kilometres an hour, carrying around 25 people. To saveon fuel, electric lights and horns are often eliminated. The vehicle costsfrom US $1,000 to US $2,000 (Mitra, 2006). Compare this to the price of abasic small car (800 cubic centimetres), which seats only four and costs US$5,000 (Mitra, 2006).
The competitive informal sector assemblers provide first-time buyersof personal computers (PC) the possibility of acquiring a locally assembledPC. The biggest advantage that the informal sector assemblers have is theirflexibility to assemble a PC tailored to the customer’s needs and financialconstraints. For almost every major component, they provide a range ofoptions, balancing quality and price. And, of course, they also provide on-site repair options.
Given the huge electricity deficits in India, local parallel gridsdeveloped by the informal sector are being run in many parts of urbanIndia. Shop owners have set up businesses along road without the sanctionof the civic administration. They collaborate to set up kerosene or dieselgenerator sets to supply lighting during the evening shopping hours.Typically, an informal sector entrepreneur wires 50 to 100 shops or vendorsin one neighbourhood or at an informal marketplace. The fee charged isusually based on the number of light bulbs that are connected for a certainnumber of hours each evening. While the cost of electricity is much higherthan it would be if it were available from the grid, the vendors have theflexibility to decide whether the benefits of attracting customers duringpeak shopping hours outweighs the costs of obtaining electricity.

171TRICKLING DOWN GROWTH THROUGH THE INFORMAL SECTOR
As can be expected, informal sector entrepreneurs have enterededucation in a big way too. India always had some of the world’s bestprivate schools, but what has not been appreciated is the scale ofeducational service provided by the informal sector. According to someestimates, about 50 per cent of the poorest children in urban India areattending private neighbourhood schools, some run by charitableorganisations and the majority run by local entrepreneurs. Tuition servicesto bring poor children upto grade level particularly in subjects such asenglish and mathematics is also available from the informal sector.
The Indian experience on the informal hawala system of internationalmoney transfers is also noteworthy. In Urdu, a language spoken primarilyby the Muslim population in India and Pakistan, hawala means ‘in the air.’In Arabic, it generally translates as ‘transfer.’ In other words, hawala is aninvisible transfer of money from one country to another. Hawala alsoleveraged the gap between official channels available and the needs of thepoor who have no bank accounts or other forms of assets to provide asguarantees to the formal banking systems. It has also served in times offoreign exchange crises to meet the needs of both the rich and the poor.
The informal sector has improvised to provide its own credit andsavings facilities. Popularly known in Delhi as Committees in the poorclasses, at almost every commercial complex in Delhi, people at the lowestincome levels have tried to band together in small groups, led by a reliablecoordinator. The members are typically 10 to 100 people working in thevicinity, or people who have known each other for a long time. They agreeon various savings schemes in which the members may put in, say, US $1a week or US $5 a month. The coordinator acts as a mobile bank, carryingthe cash in his pocket and ready to disburse a loan on the spot. Everymember has the opportunity to withdraw his contribution or to take a loan.The interest rate is determined by the members of the group themselvesand is typically 2 per cent–5 per cent per annum.
These are only a few examples of the all pervading spirit of enterprise,particularly among people at the bottom of the economic ladder, in Indiatoday. They exhibit an uncanny ability to identify an unmet need and thenfind a way to supply that demand. Relative lack of formal education andtraining, or of capital and technology, are not obstacles. Of course the

172 INDIA EMERGING • VEENA JHA
growth of these entrepreneurs has been much higher during the periods ofhigh growth on account of increased demand for these services. While dataon the growth of these services and goods are not systematic, anecdotalevidence suggests that this form of entrepreneurship may have grownsubstantially during the last 15 odd years.
So why are these examples of informal sector entrepreneurship notincreasing significantly despite India’s high growth rates. Some formalsector competitors complain that those who are involved in the largeinformal sector in India have an edge because they avoid paying taxes anddo not bear the full cost of economic regulations. On the other hand, thesingle biggest obstacle to the informal sector is its vulnerability to extortionfrom law enforcing agencies. Strictly enforcing some of the regulationswould gravely affect some of the poorest sections of society who areengaged in the whole range of informal economic activities. Politicalupheaval would inevitably follow. Because India is a democracy, itsgovernment has to maintain a balancing act. The other cost that theinformal sector has to bear because of its extra legal status is the inabilityto raise the capital necessary to expand businesses even if they arecompetitive and have successful products or services.
This inability to capitalise assets, and the consequent underutilisationof capital for economic development, has been well researched by Peruvianeconomist Hernando de Soto (2000) in his book The Mystery of Capital. Acorollary to this problem is the formal sector ’s difficulty in takingadvantage of successful informal sector players’ managerial and technicalexpertise by integrating them into their operations. This brief survey byBarun Mitra provides a glimpse of the culture of entrepreneurship thatprevails in India. If these grassroots capitalist entrepreneurs were freedfrom the shackles of bureaucratic economic regulations, they could welltake India to the top of the development ladder. It would not be too far-fetched to suggest that there is hardly any country in the world today whereinformal sector economic activity is as diverse and as widespread as it is inIndia. This activity is an unrealised potential just waiting to be harnessed.To multiply these examples of grassroots entrepreneurs, the governmenthas to promote certain catalysing variables that will allow informal sectorplayers to maximise their profit through asset building and incomes. Thenext section has identified these variables.

173TRICKLING DOWN GROWTH THROUGH THE INFORMAL SECTOR
IV
Factors that Determine Informal SectorAsset Building and Incomes
Given the crucial role of informal sector asset formation and incomesin alleviating poverty in India, a survey of about 500 informal sectorrespondents, most of them self-employed was conducted by the author. Forthe identification of the sectors from which respondents would be chosen,first of all the data on formal and informal sectors by enterprises wascollected. In the manufacturing sector, the subsectors in which formalfirms account for 80 per cent of the total output was first tabulated fromthe Annual Survey of Industries (See Annexure A-3.2a). This pertains tothe latest year for which information was available at the time of writing,i.e., 2003/04. A similar exercise was conducted for the services sector (seeAnnexure A-3.2b). From this list, in each item the data on the output ofthe top 500 firms was collected. Where the top 500 firms accounted for lessthan 25 per cent of total output, it was assumed that the majority of theproduction would be in the informal sector. These worked out to about 10subsectors, about 5 in manufacturing and 5 in services. From each of thesesubsectors, 50 respondents were chosen. The questionnaire used for theinterview is attached in Annexure A-3.3. The data generated by the surveysis presented in Annexure A-3.4 and Annexure A-3.5.
The survey showed the trickle-down effects through the informalsector during the high growth period, i.e., 2000-2007 was much higherthan the trickle-down during the lower growth period, i.e., 1994/95-2000.This is shown by the fact that the majority of the respondents irrespectiveof the subsector to which they belonged had higher incomes post-2000 thanpre-2000. The increase in incomes was higher in the manufacturing sectorthan in the services sector. The level of asset formation also in the informalsector was much higher during the high growth period than in the lowgrowth period. Interestingly, but logically, the number of dependents andthe number of working people in the family were closely associated withhigher levels of asset formation.

174 INDIA EMERGING • VEENA JHA
The equation used to estimate the correlation coefficients was asfollows:
Formation of Assets = f(health expenditure, transport expenditure,income, meals consumed, education, dependents, infrastructure)
Table 3.5
Abbreviations Used for Explanatory Variables
Linear Least Square Regression Explanatory Variables
LN_AST Logarithm of asset
Ln_HEE Logarithm of health expenditure
Ln_TRP Logarithm of transport
LN_INC Logarithm of income
Ln_DPE Logarithm of dependent
DM1 =1 if meal=0, & otherwise =0
DM2 =1 if meal=3, & otherwise =0
DE1 =1 if education=0, & otherwise =0
DE2 =1 if education=1, & otherwise =0
DE3 =1 if education=2, & otherwise =0
DF1 =1 if infrastructure=1, & otherwise =0
DF2 =1 if infrastructure=2, & otherwise =0
dT =1 if the time is before, & otherwise =0
The explanatory variables detailed above need to be explained. A rangeof dummies have been used. If a person eats at least one meal, DM1=1,otherwise it is 0. For DM2 to be 1, a person has to eat all his three meals,and for it to be 0, all other situations are covered, i.e., 0, 1 or 2 meals. Foreducation, three dummies have been used. DE1=1, if a person is literate andDE1=0 otherwise. DE2 is 1 if the person has finished high school, but 0otherwise. DE3 is 1 if the person has finished his university education and 0otherwise. Access to infrastructure again refers to either one type ofinfrastructure or two types of infrastructure. DF1 is 1 if the person has akuccha (made of mud) house but does not have a pucca house (made ofbricks and mortar, cement etc.). DF2 is 1, if the person has a pucca housebut no access to electricity. dT refers to whether the assets were acquiredbefore or after the high growth period. Thus, if the assets were acquired afterthe year 2000, dT=1, otherwise 0. Further the play of the explanatory

175TRICKLING DOWN GROWTH THROUGH THE INFORMAL SECTOR
variables would differ according to the subsector of employment of theinformal sector worker. The workers were thus classified in three categories:agriculture, manufacturing and services (see regression below). It isexpected that the returns to education would be higher in the industrialsector, for example in comparison to agriculture.
The summarised regression tables which have passed all thediagnostic tests for robust correlation are given below. Table 3.6 shows therole of different explanatory variables in explaining asset formation in theinformal sector both in the economy as a whole and in the separate sectors.The sample design took account of professions which dominate informalsector employment. Nevertheless the sample can at best be consideredrepresentative, not exhaustive.
The correlation for different variables in the high growth period isindicated by the variable XdT. The table indicates that both during thehigh growth and the low growth period, access to transport was critical indetermining the level of asset formation in the informal sector. Thecorrelation with health and number of dependents was relatively weaker.However, the correlation with transport expenditure held at the 1 per centlevel of significance. This is logical as those from the informal sector whoowned their own means of transport were more likely to build otherassets. In the lower growth period, the levels of education, the number ofmeals consumed, and access to infrastructure such as electricity, waterand sanitation were important for asset building. However the correlationwas negative, showing that for all sectors being educated could have anegative effect on asset building. This result on the face of it appearscounter-intuitive, but if we look at the informal sector activities ingeneral, formal education has little role in generating assets or income. Itis skill formation which is important in this sector and that may not berelated to formal education. In fact formal education could be adisincentive to skill formation, as people educated formally may considerinformal sector activities as 'beneath their touch'. Skill formation takesplace on the job which implies experience may be gained by people who havenot been to formal schools. There is a need therefore to meld skill formationwith formal schooling. Some suggestions for an effective school system havebeen developed in the last section.

176 INDIA EMERGING • VEENA JHA
Table 3.6
Regression Result from Survey Analysis
Dependent Variable: Ln_AST
Explanatory Variables Aggregate Study Agriculture Manufacturing Services
Ln_HEE 0.027 -0.093 -0.079 0.093*(0.038) (0.124) (0.08) (0.056)
Ln_TRP 0.177*** 0.400* 0.260*** 0.129(0.058) (0.232) (0.097) (0.086)
DM1 4.701*** 4.80 4.33*** 5.16***(0.716) (3.61) (1.16) (1.02)
DM2 0.601** -1.08 0.92** 0.775**(0.299) (1.57) (0.48) (0.408)
DE1 -2.912*** -0.07 -4.06*** -2.89***(0.508) (1.91) (1.16) (0.634)
DE2 -1.248** -1.65 -2.19** -0.856(0.511) (1.68) (1.17) (0.649)
DE3 -0.956** -3.27 -1.27 -1.09(0.528) (1.95) (1.17) (0.673)
DF1 -1.760*** - -1.91** -1.85(0.511) (0.88) (0.632)
DF2 -1.159*** -3.25 -0.599 -1.53(0.328) (1.95) (0.517) (0.445)
DM1× dT - - - -
DM2× dT 0.918** 0.955 1.08 0.646(0.459) (2.15) (0.839) (0.598)
DE1× dT 1.573 -0.252 1.77** 1.69**(0.535) (2.54) (1.00) (0.676)
DE2× dT 0.804 1.82 0.284 0.613(0.519) (1.96) (0.953) (0.692)
DE3× dT 0.927* 5.10 0.225 1.26*(0.540) (3.12) (0.863) (0.733)
DF1× dT 0.166 - 0.051 0.311(0.730) (1.28) (0.898)
DF2× dT 0.595 4.78 0.824 0.568(0.455) (3.28) (0.723) (0.621)
Ln_DPE 0.222 1.43 0.240 0.146(0.168) (1.20) (0.201) (0.320)
R-sq 0.417 0.57 0.47 0.42
F(16,483) 21.63*** - - -
F(14,23) - 2.21** - -
F(16,177) - - 9.91*** -
F(16,251) 11.76***
Root MSE 2.10 2.31 2.05
No. of observations 500 38 194 268

177TRICKLING DOWN GROWTH THROUGH THE INFORMAL SECTOR
Table 3.7
Linear Least Square Regression
Dependent Variable: Ln_INC
Explanatory Variables Aggregate Study Agriculture Manufacturing Services
Ln_HEE 0.041 -0.022 -0.036 0.087(0.069) (0.179) (0.136) (0.100)
Ln_TRP 0.547*** 0.363 0.749*** 0.452***(0.104) (0.334) (0.164) (0.154)
DM1 6.07*** 6.79 8.39 4.88***(1.29) (5.19) (1.97) (1.82)
DM2 -2.63*** -3.79* -3.20*** -1.48**(0.539) (2.25) (0.826) (0.72)
DE1 -361*** 4.60* -7.25*** -3.33***(0.914) (2.75) (1.98) (1.13)
DE2 -2.15** -1.03 -4.66 -1.27(0.920) (2.41) (1.99) (1.15)
DE3 -0.373 -1.98 -2.58 -0.668(0.951) (3.16) (2.00) (1.20)
DF1 2.32** - 1.57 2.18**(0.920) (1.49) (1.12)
DF2 0.163 -5.74** -0.528 0.958(0.591) (2.80) (0.878) (0.794)
DM1× dT - - - -
DM2× dT 3.62*** 7.48** 3.74*** 2.59**(0.827) (3.09) (1.42) (1.06)
DE1× dT 4.88*** -1.88 4.97*** 5.15***(0.963) (3.65) (1.69) (1.20)
DE2× dT 3.59*** 3.54 3.80** 2.90**(0.934) (2.81) (1.61) (1.23)
DE3× dT 1.67** 4.41 1.27 2.10*(0.973) (4.49) (1.46) (1.30)
DF1× dT -2.15* - -0.66 -2.16(1.31) (2.17) (1.60)
DF2× dT 0.076 5.80 0.559 -0.224(0.819) (4.72) (1.22) (1.10)
Ln_DPE 0.644** 0.201 -0.042 1.94(0.302) (1.72) (0.342) (0.57)
R-sq 0.48 0.79 0.62 0.42
F(16,483) 28.18*** - - -
F(14,23) - 6.43*** - -
F(16,177) - - 18.59*** -
F(16,251) - - - 11.35***
Root MSE 3.78 3.33 3.46 3.77
No. of observations 500 38 194 268

178 INDIA EMERGING • VEENA JHA
During the lower growth period, lack of access to infrastructure alsohad a negative effect on asset building. The negative correlation betweenliteracy, infrastructure and asset building was statistically significant.
During the high growth period, most of these variables were notstatistically significant in determining informal sector asset building.However, access to meals and primary education was significant at the 5per cent level in determining informal sector asset building. This wasespecially so for the manufacturing and services sector showing theimportance of basic level of schooling or literacy in these sectors. In theservices subsector, university education was positively correlated with assetbuilding though at a 10 per cent level of significance.
Informal sector incomes in the high growth period depended cruciallyon education, access to infrastructure and on the number of dependents.Education upto secondary level increased incomes. University educationdid not necessarily generate higher incomes. This could be because theincome group covered by the sample were all in the low income rangewhere university education may not be important. Predictably, the returnsto university education was significant in the services subsector. For bothmanufacturing and services, the returns to secondary education wassignificant and high. This implies that incomes increased when informalsector workers were educated upto the secondary level. In the agriculturesector, the correlation between education and income was not significant.Individuals who were able to eat three square meals also tend to havehigher incomes. This was particularly true in agriculture signifying thatbetter meals were associated with higher incomes. The most importantdeterminant, however, was access to infrastructure. Lack of infrastructureactually decreased incomes. This could be because the sample consisted ofa large number of home-based workers who could work longer hours if theyhad access to infrastructure such as electricity.
In the lower growth period, predictably education had a dampeningeffect on income. This negative correlation points to the very important roleplayed by the control variable, i.e., growth. Interpreted otherwise, theseresults imply that only with high growth would education lead to higherincomes in the informal sector. In periods of low growth, the higher thehealth expenditure, the lower the income particularly in agriculture and

179TRICKLING DOWN GROWTH THROUGH THE INFORMAL SECTOR
manufacturing. This implies that absenteeism on account of poor healthwould decrease incomes especially in periods of low growth when employmentcontracts are of a casual nature. Access to transport shown by the positivecorrelation with transport expenditure provides better access to incomes evenin low growth periods. Another significant relationship in low growth periodsis the negative and significant correlation between meals and income. Thisimplies that in low growth periods payment may often be in kind and lowercash payments may be disbursed. Access to infrastructure in periods of lowergrowth was important in raising incomes only in services. Low growth effectsdominated incomes in both agriculture and manufacturing, i.e., lack of accessto infrastructure continued to lower incomes.
These findings are of crucial importance as the policy implicationswould depend on whether the informal sector is operating in a high growthperiod or a low growth period. For protecting the informal sector assetbuilding and incomes, governments would have to design health insuranceschemes. Similarly, governments should increase their outlay oninfrastructure so that in a high growth period the informal sector canincrease both its incomes and asset building. As growth is likely to follow acyclical pattern, it is of crucial importance to focus on these two keyvariables. Transport has emerged as a variable of crucial importance indetermining asset formation and incomes in the informal sector. On thewhole, building of physical infrastructure should be the focus ofgovernment policy for alleviating poverty in the informal sector. Thisapplies particularly to the provision of public transport facilities andelectricity to the informal sector. An important variable whose effects onthe informal sector was somewhat nuanced was education. While literacyand primary education was of great importance in forming assets andincreasing incomes in the informal sector, its importance was lower in theagriculture sector. It is important, therefore, in agriculture to focus more onskill formation and much less on formal education. In the services sector,more emphasis needs to be placed on formal education. In the industrialsector, the target of the government should be to ensure at least secondaryeducation for informal sector participants along with vocational education.The government of India has recognised the importance of vocationaleducation and infrastructure building for the informal sector. A criticalassessment of these initiatives is carried out in the next section.

180 INDIA EMERGING • VEENA JHA
V
Initiatives of the Government of India forImproving Skill Development andInfrastructure of the Informal Economy
CurrCurrCurrCurrCurrent Initiatives in Tent Initiatives in Tent Initiatives in Tent Initiatives in Tent Initiatives in Training for the Informal,raining for the Informal,raining for the Informal,raining for the Informal,raining for the Informal,UnorUnorUnorUnorUnorganised Sectorganised Sectorganised Sectorganised Sectorganised Sector
Currently 'learning on the job' is the main method for skill acquisitionboth in the formal and unorganised sectors of the economy (King, 2007).Thus, interventions in skills development for the informal sector canscarcely avoid direct confrontation with this mainstream modality. One ofthe difficulties about the analysis of training in the informal sector is thatthere is not a single system of informal apprenticeship operating which canbe built upon, improved or formalised. The main training mechanism is'learning on the job', which does not sufficiently differentiate betweentraining in established traditions of craft apprenticeship and on the jobtraining in manufacturing, construction, services and agriculture. Chandra(2006) has argued that it should be possible to 'draw upon traditionalarrangements for skill building and strengthen them instead of dismissingthem as inadequate'. However, regarding the suggestions for developing and'incentivising' the system, all assume that the trainers and employers canbe persuaded to invest much more substantially in training theirapprentices to a higher level of skills, and to provide training allowances;whereas it could be argued that it is precisely the very low cost of thecurrent on the job training system that is so attractive to employers.Chandra notes that current training approaches can be highly exploitative:'In informal apprenticeship arrangements, the trainee may not be paid foryears and treated as unpaid worker.' He further notes that there is a needfor 'effective advocacy for training' and that there needs to be a'comprehensive strategy.' But, in a final comment, Chandra (2007) admitsthat there is a long way to go: 'This aspect [a comprehensive strategy]cannot be overemphasised, given that despite lip service for a long time,training for the informal economy remains a distant dream.'
The World Bank (2006a) has also given systematic attention to therole of vocational training in India, including the key role of training for the
181TRICKLING DOWN GROWTH THROUGH THE INFORMAL SECTOR
very large informal economy. What is surprising, however, is that despiteits very detailed analysis of India's employment challenge, there is littleattempt to connect the causes of the employment challenge to theparticular challenge of training effectively in the informal sector. It merelyacknowledges that non-government providers have proved to be moreeffective than the government, and that, rather than the governmentintervening in provision for the informal sector, an enabling environmentfor these non-public providers should be created. There is littleacknowledgement of the fact that labour regulations which haveencouraged dualism and informality would also discourage the privatesector from investing in training for the informal sector.
Historically, employers in India (both formal and informal) have paidscant attention to in-service training. The World Bank (2006b) suggeststhat in India no more than 7 per cent of employees get access to any kindof formal in-service training in a given year. The World Bank and theInformal Sector Task Force were both aware that, in respect of formal in-service training, India compares very poorly with other countries in SouthAsia (apart from Pakistan which is even lower), and the gap is very muchlarger when India is compared to Malaysia and China (World Bank, 2006b;NCEUS, 2005).
PPPPPolicies of the Government of India toolicies of the Government of India toolicies of the Government of India toolicies of the Government of India toolicies of the Government of India toImprImprImprImprImprove Skill Fove Skill Fove Skill Fove Skill Fove Skill Formationormationormationormationormation
The Government's main provision for vocational training, through theindustrial training institutes (ITIs), has almost no connection with theinformal economy, or of training for self-employment. Only 8-12 per cent ofITI graduates were running small businesses (ILO, 2001; 2003a; 2003b).The formal skill training system, because of its educational entryrequirements and long duration of courses, is basically not designed to offerskills to the less educated people (Planning Commission, 2006).
The Government of India recommended the 'Setting up of an ApexInstitute for Skill Building in Informal Sector'. This Apex Institute for SkillBuilding would be especially set up for testing and certifying in the area ofconstruction, brassware, glasswork, fishing, khadi etc., with a capacity andoutput of 250,000 (Planning Commission, 2006). There is no discussion of

182 INDIA EMERGING • VEENA JHA
the rather strange bed-fellows that are suggested for training in this ApexInstitute and so far no progress has been made on this front.
A more structured approach to skill development was in the initiativeto direct the NCEUS to set up a Task Force on Skill Formation in theInformal sector in 2005 (NCEUS, 2005). The Terms of Reference of theTask Force included an identification of the characteristics and specificitiesof skill formation, the adequacy of the existing training infrastructure foruse by the unorganised sector, the demand and supply of skills, bestpractice in NGO and government programmes for this sector, and even thedesign of 'a National Skill Development Initiative for the UnorganisedSector' (NCEUS, 2005). The Task Force did not, in fact, expect to becomeinvolved in a major independent initiative in infrastructure development,such as building skill centres. Rather, it saw its own niche as making use ofthe existing buildings of the Industrial Training Institutes, the privatetraining centres, especially the NGOs, and even the primary schools, inorder to mount their own short-term evening courses. These are likely tobe intensive short courses of 1 to 3 months, certified in an appropriatemanner. The model has not yet been finalised, but there is discussionabout a Rs 10,000 (US $200) package: Rs 3,000 (US $60) being allocated tothe trainers (e.g. the NGO or the instructors in the Training Institute); Rs1,000 (US $20) to the youth for their out of pocket expenses; and Rs 6,000(US $120) as an incentive to the possible employer or, in the case of self-employment, help with startup funding (NCEUS, 2005). This model wasgoing to be tried out with linked NGOs in some 10 small towns, but so farnothing has been put in place.
Suggestion for ImprSuggestion for ImprSuggestion for ImprSuggestion for ImprSuggestion for Improving Skilloving Skilloving Skilloving Skilloving SkillFFFFFormation in the Informal Sectorormation in the Informal Sectorormation in the Informal Sectorormation in the Informal Sectorormation in the Informal Sector
While on the job training may be the natural way to go and build onthe existing systems of informal training, it needs to be supplemented withsome formal schooling. This is to enable the informal sector participants tomove to other occupations should they desire to do so. The apprenticeshipsystem of the informal sector was normally based on family labour and it ispossible that there may be several members of the family, leading tounderemployment or that there may be talents (other than those of thefamily business) which some members of the family develop. The Swiss

183TRICKLING DOWN GROWTH THROUGH THE INFORMAL SECTOR
Schooling system is a good model which melds formal schooling with onthe job training. Nearly two-thirds of those entering upper-secondaryeducation, after nine years of schooling at age 13 or 14, enter thevocational education and training system in Switzerland. At this level,vocational education and training is mainly provided through the 'dualsystem'. Students spend some of their time in a vocational school; some oftheir time doing an apprenticeship at a host company; and for mostprogrammes, students attend industry courses at an industry trainingcentre to develop complementary practical skills relating to the occupationat hand. Common patterns are for students to spend one-two days perweek at the vocational school and three-four days doing the apprenticeshipat the host company; also they alternate between some weeks attendingclasses at the vocational school and some weeks attending industry coursesat an industry training centre. A different pattern is to begin theprogramme with most of the time devoted to in-school education andgradually diminishing the amount of in-school education in favour of morein-company training.
Switzerland draws a distinction between vocational education andtraining (VET) programmes at upper-secondary level, and professionaleducation and training (PET) programmes, which take place at tertiary Blevel. In 2007, more than half of the population aged 25-64 had a VET orPET qualification as their highest level of education. In addition,universities of applied sciences (Fachhochschulen) offer vocationaleducation at tertiary A level. Pathways enable people to shift from one partof the education system to another.18 The informal sector could be a part ofthe vocational training system where a substantial part of the trainingcould take place within the informal enterprise itself. This could becombined with the NCEUS Task Force recommendation of short vocationalcourses with appropriate certification.
InfrastructurInfrastructurInfrastructurInfrastructurInfrastructure Development Initiativese Development Initiativese Development Initiativese Development Initiativese Development Initiativesfor the Unorfor the Unorfor the Unorfor the Unorfor the Unorganised Sectorganised Sectorganised Sectorganised Sectorganised Sector
The Task Force for Micro, Small and Medium Enterprises (MSMEs)recommended a national programme for renewal of industrial infrastructure
18. http://www.oecd.org/dataoecd/12/5/42578681.pdf. Learning for Jobs OECDReview of Switzerland, 2009.

184 INDIA EMERGING • VEENA JHA
to upgrade infrastructure for existing industrial estates, such as roads,drainage, sewage, power distribution (within industrial areas), water supplydistribution, etc.19 This programme was to build on two Centralgovernment programmes addressing similar objectives—namely IndustrialInfrastructure Upgradation Scheme (IIUS), Department of Industrial Policyand Promotion and Integrated Infrastructural Development (IID) Scheme,Ministry of MSME. Given the different scales at which IIUS and IIDschemes operate, a practical distinction could be drawn between industrialestates (based on area), which may qualify for assistance under IIUS/IID.
The two programmes would require additional funding support toassume the character of a National Mission. The funding under theseschemes should be linked to certain reforms/measures to be taken by thestate governments/local bodies. These reforms/measures may include:
• As a long-term measure, the industrial estates should be entrustedwith the municipal functions including levy of taxes, responsibilityto maintain the infrastructure within the industrial estates, etc.
• The state governments would undertake to provide dedicated powersupply to the industrial estates. Alternatively, funding for commoncaptive power generation in industrial estates would be encouragedthrough subsidies given to the Special Purpose Vehicle (SPV)managing such facility.
• The state governments would formulate a policy for incentivisingprivate sector for setting up of new industrial estates.
Local bodies would earmark funds for industrial estates within theirbudgets. For this purpose, a tripartite agreement could be executed betweenthe state government, local body and the SPV, which would be a bodyconstituted by the occupants of the industrial estates.
A number of new industrial parks/areas were developed under variousprogrammes of different ministries, where there is no specific provision forlocating micro and small enterprises (MSEs). It may be made mandatory toearmark at least 40-45 per cent of available land for MSEs in such areas,given the existing and envisaged role of MSEs in the production chain.
19. http://msme.gov.in/PM_MSME_Task_Force_Jan2010.pdf

185TRICKLING DOWN GROWTH THROUGH THE INFORMAL SECTOR
Flatted factory complexes may be set up, particularly in and around largecities for MSEs. On similar lines, dormitories for industrial workers inindustrial estates may be set up on public private partnership (PPP) mode.Setting up of common facility services in the industrial estates/clustersshould be encouraged by providing adequate assistance under various on-going schemes of the ministry of MSE. There is a need to encourage settingup/earmarking of at least one industrial estate in each block for MSEs.
All these schemes were presaged on the relocation of the unorganisedsector enterprises to industrial estates. The informal sector is typicallydispersed and based on homeworkers. A large proportion of home-basedworkers are women who for cultural reasons among others are reluctant towork outside their homes. This is the main reason why most of theseinitiatives have not seen the light of the day. It is important to improveinfrastructure of the entire economy with the help of the informal sector.The informal sector has generated in many cases its own infrastructure andit is necessary to build on these initiatives of self-generation. Theseinformal initiatives could then be linked with formal initiatives. Forexample, while the generation of power could be the responsibility of thegovernment, its distribution could be left to the informal sector in ruraland urban slums. It is also important to ensure that infrastructure is fairlydecentralised and interest capture is prevented. In any case, buildinginfrastructure should be a priority of the government to ensure that its higheconomic growth rates are maintained. Some states such as Rajasthan haveseen a moderate degree of success in building roads while the hilly stateshave become self-sufficient in the generation of electricity. These modelsshould be spread to other states too.
VI
Conclusions and Policy Recommendations
The presence or absence of economic growth has a crucial effect onthe informal economy. In a rapidly growing India, informal enterprises arelikely to find greater opportunities for profitable investment than in astagnant one. As shown above, growth has trickled down to the informalsector as shown by the increase in the share of self-employed in the overall

186 INDIA EMERGING • VEENA JHA
informal economy. The self-employed have better incomes and betterconditions of living than casual workers and almost as much as regularworkers in many cases. However, the fact that the trickle down of growthhas been insufficient is shown by an average employment of 1.88 perfamily in the informal sector in self-employment. As shown above, anaverage employment of 2 would be required to alleviate poverty. This wouldrequire either higher growth rates or a more enabling environment for theinformal sector to generate jobs. It is the neglect of these factors—therelationship between micro and macro levels—which seems to explain whythe current interventions have failed to produce any visible impact on theinformal sector. The challenge is therefore how to create an ‘appropriate’macroeconomic environment so that the informal sector will have greateropportunities for participation in the market, both formal and informal.
Sustaining high growth rates is a precondition for the improvement ofincomes and asset building in the informal sector. Both have a decisiveeffect on poverty, though in the informal sector asset building has a morestatistically significant effect on poverty in periods of high growth. Hence inIndia's present growth environment, government policy should focus onfactors that are of importance in building assets in the informal sector.
The defining characteristic of the informal sector is that itsparticipants generate incomes for themselves by interacting with variousmarkets directly. Viewed in this perspective one can ask whether they canbe assisted in any way so that they can help themselves i.e., interact withmarkets more effectively, without necessarily depending on externalintermediaries. As shown by the above analysis, informal sector assetbuilding and incomes are particularly sensitive to easy access to transportfacilities and to infrastructure. Government policy should thus focus oninfrastructure building.
In providing better infrastructure, government could draw upon theentrepreneurial capacities of the informal sector. This would necessitate areorientation and restructuring of supply sources of infrastructure (i.e.,credit, training, technical know-how, information, electricity etc.). Whilemost of them are in the formal sector, linking them to their informalcounterpart would be a step in the right direction but poses a formidablechallenge. For instance it may involve privatisation of certain sources of

187TRICKLING DOWN GROWTH THROUGH THE INFORMAL SECTOR
supply, increasing the number of outlets from which the informal sectormay obtain its requirements and the creation of a competitive atmosphere.Improving access to infrastructure in cities likewise would entail a reviewof existing legislations regarding land use, ownership, tenure and rental,etc.; and regulations regarding supply of power, water, communicationfacilities, most of them under the control of urban authorities. It would beinteresting to examine possibilities of using the informal sector forprovisioning such public services as shown above in the section ongrassroots capitalism.
Education was also identified as an important factor in informal sectorincome generation and asset building. Formal education was found to beinadequate for the informal sector and may even have a negative effect ontheir income generation and asset building capacities. There is a need tobuild through appropriate interventions a market to provide training andinformation (as many NGOs have been doing already) to the informalsector. This has to be combined with formal education to providemaximum flexibility to informal sector participants. One good example ofsuch melding is the Swiss School system as shown above.
Another important issue is that while formalisation of the informalsector may not be a possibility, the existing formal institutions (and firms)such as commercial banks, technology and training institutions have failedto respond to the needs of the informal sector. This has led, as shownabove in the section on grassroots capitalism, to the creation of parallelstructures and mechanisms, be it for the delivery of credit, training,technology, information or other kinds of services. While this approach hasproved useful in reaching specific target groups and making resourcesaccessible to them, especially the poor, it may have also increased the riskof creating parallel economies and markets within the same society.
An alternative way to avoid parallel structures would be to establishlinkages between the informal and the formal institutions e.g., informalcredit organisations linked to formal financial institutions, informaltraining systems linked to formal training institutions and so on. Thepurpose of such linkages could be to help upgrade the informal systems in agradual manner. For instance, skills in the informal sector could beupgraded by strengthening the informal apprenticeship systems. In the case
188 INDIA EMERGING • VEENA JHA
of credit the formal banks can channel funds to the informal sector throughinformal credit mechanisms that already exist e.g., rotating credit andsavings associations at the community level, chit funds or the equivalentknown under various names in India such as ‘Committee’ as shown above.The scattered experiences show that it is possible to integrate the formaland informal support systems though it may not be easy. This remains amajor challenge in drawing effective strategies for this sector that requiresfurther exploration.
Creation of such an environment would seem easier when the Indianeconomy is growing rapidly; increased economic opportunities maygenerate less resistance from interest groups to bring about a change in theenvironment. It would, therefore, seem desirable that strategies to promoteincomes in the informal sector be accompanied by complementary policiesand measures to generate economic growth.
The organisation of informal sector enterprises could also serve as amechanism to overcome infrastructural constraints and market imperfections.The very fact that the informal sector, which accounts for over 90 per centof India's employment and over 50 per cent of GDP, is deprived of evenbasic infrastructure, should be a matter of policy concern. Though India isfaced with real constraints in terms of finance and space, the failure torecognise the role of infrastructure in raising productivity and incomes ofthose in this sector and to improve it can only be attributed to the absenceof organised pressure from below. The informal sector organisations couldalso help overcome certain market imperfections. One can cite a number ofexamples where informal producers have been able to improve theirincomes through collective action e.g., buying key raw materials directlyfrom the source without having to depend on intermediaries and thusbenefit from price discounts. In some cases they have successfullypersuaded the government to obtain access to certain production facilitiesthat are in the public sector. These organisations have also served in somecases as the channel for delivery of credit, inputs or services, includingelectricity. In these cases the costs of delivery are internalised i.e., borne bythe beneficiaries. This is most evident when the organisations take theform of cooperatives.
189TRICKLING DOWN GROWTH THROUGH THE INFORMAL SECTOR
To sum up, policy interventions by both the Government of India anddonors have been limited to addressing the micro aspect of informalenterprises. It was assumed that once the missing resources or inputs aremade available, those in this sector would automatically be able to avail theopportunities that become available in the development process andparticipate in it. But the evidence discussed above do not lend support to thisview. The regressions show that these interventions would only lead tohigher incomes and higher asset formation in the informal sector if andwhen the rates of growth of the economy are high. So the first and foremostrequirement to ensure that growth trickles down is to maintain a high rate ofgrowth in the Indian economy. Along with high growth rates it is necessaryto find mechanisms to link formal and informal mechanisms for skillgeneration and infrastructure provision. This implies that there should besome symmetry between the two sectors in terms of skill generation, accessto information on markets, technical know-how and credit.
ReferencesAcharya, Rajat (2006). “Trade Liberalisation, Poverty and Inequality in India”, INRM Policy
Brief No.10. http://www.adb.org/Documents
Bairagya, Indrajit (2010). “Liberalization, Informal Sector and Formal-Informal Sectors'Relationship: A Study of India”, Paper Prepared for the 31st General Conference ofThe International Association for Research in Income and Wealth. St. Gallen,Switzerland. August 22-28.
Bardhan, P. (1988). “Alternative Approaches to Development Economics”, in H. Cheneryand T.N. Srinivasan (eds.), The Handbook of Development Economics. Amsterdam:North Holland. pp.39-72.
Bekkers, Hans and Wim Stoffers (1995). “Measuring Informal Sector Employment inPakistan: Testing a New Methodology”, International Labour Review 134.
Bhattacharya, Prabir C. (1996). “The Role of the Informal Sector in StructuralTransformation: Some Indian Evidence”, Journal of International Studies 8. http://ideas.repec.org/a/wly/jintdv
Blunch, Niels-Hugo, Sudharshan Canagarajah and Dhushyanth Raju (2001). The InformalSector Revisited: A Synthesis Across Space and Time. Social Protection Unit,Human Development Network, The World Bank.
Bosworth, Barry, Susan M. Collins and Arvind Virmani (2007). “Sources of Growth in theIndian Economy”, NBER Working Paper No. 12901. February. NBER Program(s):IFM. http://www.nber.org/papers/w12901.pdf
Bromley, Ray (1978). “Organization, Regulation and Exploitation in the So-Called `UrbanInformal Sector’: The Street Traders of Cali, Colombia”, World Development 6(9/10).
Carr, Marilyn (ed.) (2004). Chains of Fortune: Linking Women Producers and Workerswith Global Markets. London: Commonwealth Secretariat.

190 INDIA EMERGING • VEENA JHA
Castells, Manuel and Alejandro Portes (1989). “World Underneath: The Origins, Dynamics,and Effects of the Informal Economy”, in Alejandro Portes, Manuel Castells andLauren A. Benton (eds.), The Informal Economy: Studies in Advanced and LessDeveloped Countries. Baltimore: The John Hopkin University Press.
Chandra, A. (2006) “Vocational Education and Training in India: A Perspective for Change”,Draft of October 30. New Delhi.
————. (2007). “Training for the Informal Economy in India”, in A. Chandra and M.Khanijo (eds.), Training for Informal Economy. New Delhi: Excel Books.
Charmes, J. (1990). “A Critical Review of Concepts, Definitions, and Studies in theInformal Sector”, in D. Turnham, B. Salomé and A. Schwarz (eds.), The InformalSector Revisited. Paris: OECD.
————. (2000). “The Contribution of Informal Sector to GDP in Developing Countries:Assesssment, Estimates, Methods, Orientations for the Future”, 4th Meeting of theDelhi Group on Informal Sector Statistics. Geneva. August 28-30.
Chen, Martha Alter, Joann Vanek and Marilyn Carr (2004). Mainstreaming InformalEmployment and Gender in Poverty Reduction: A Handbook for Policy-makers andOther Stakeholders. Commonwealth Secretariat, IDRC, WIEGO. Published by theCommonwealth Secretariat.
Dasgupta, Sukti and Ajit Singh (2006). “Manufacturing, Services and PrematureDeindustrialization in Developing Countries: A Kaldorian Analysis”, Working PapersRP2006/49. World Institute for Development Economic Research (UNU-WIDER).
de Soto, Hernando (1989). The Other Path: The Invisible Revolution in the Third World.New York: Harper & Row.
————. (2000). The Mystery of Capital: Why Capitalism Triumphs in the West and FailsEverywhere Else. Basic Books.
Deaton, Angus and Jean Drèze (2002). “Poverty and Inequality in India: A Reexamination”,Working Papers, Princeton Univeristy, Woodrow Wilson School of Public InternationalAffairs, Research Program on Development Studies. http://ideas.repec.org/s/pri/rpdevs.html
Dreyer, Iana (2009). “India Unbound: Growing Might—Preparing for the Next Stage ofGrowth: Deepening India's Integration in the World Economy”, in The India EconomyReview VI, March 31. The IIPM Thinktank. http://www.iipmthinktank.com/publications/archive/ier/ier-march-2009.pdf
Field, G. (1990). “Labor Market Modelling and the Urban Informal Sector: Theory andevidence”, in David Turnham, Bernard Salome and Antoine Schwarz (eds.), TheInformal Sector Revisited. Paris: OECD. pp.49-69.
Hart, K. (1971). “Small Scale Entrepreneurs in Ghana and Development Planning”, Journalof Development Planning, July.
Hirschman, Albert O. (1958). The Strategy of Economic Development. http://homepage.newschool.edu/het/profiles/hirschm.htm
International Labour Office (ILO) (1972). Employment, Incomes and Equality: A Strategyfor Increasing Productive Employment in Kenya. Geneva.
————. (2001). Training for Employment Promotion in Muktsar District, Punjab (V.Gasskov and M. Burns). New Delhi: ILO.
————. (2003a). Industrial Training Institutes of India: The Efficiency Study Report (V.Gasskov et al.). New Delhi: ILO.
————. (2003b) Industrial Training Institutes of India: The Efficiency Study Report. NewDelhi: ILO Office and Geneva: ILO.

191TRICKLING DOWN GROWTH THROUGH THE INFORMAL SECTOR
Kabra, K.N. (1995). “The Informal Sector: A Reappraisal”, Journal of Contemporary Asia25(2): 197-232.
Kantor, P., U. Rani and J. Unni (2006). “Decent Work Deficits in Informal Economy: Caseof Surat”, Economic and Political Weekly, May.
Kelley, B. (1994). “The Informal Sector and the Macroeconomy: A Computable GeneralEquilibrium Approach for Peru”, World Development 22(9): 1393-411.
King, Kenneth (2007). “Training in the Informal Sector of India: An Asian Driver?”, Paperdelivered at the national conference on Approaching Inclusive Growth through SkillsDevelopment. New Delhi: MHRD/Ministry of Labour and Employment, GTZ andUNESCO. February 12-13.
Lewis, Arthur (1954) Economic Development with Unlimited Supplies of Labor.Manchester School. http://homepage.newschool.edu/het/profiles/lewis.htm
Lubell, H. (1991). The Informal Sector in the 1980s and 1990s. Paris: OECD.
————. (1993). “The Informal Sector in Southeast Asia”, in Work Without Protections:Case Studies of the Informal Sector in Developing Countries. US Department of Labor.
Marjit, Sugata and Dibyendu S. Maiti (2005). “Globalization, Reform and the InformalSector”, Working Papers RP2005/12. World Institute for Development EconomicResearch (UNU-WIDER).
Marjit, Sugata, Saibal Kar and Punyabrata Sarkar (2003). “Trade Reform, Internal CapitalMobility and Informal Wage: Theory and Evidence”, April. http://website1.wider.unu.edu
Mazumdar, D. (1975). “The Urban Informal Sector”, Working Paper 211. Washington, DC:World Bank.
Mitra, Arup (2007). “Industry and Informal Sector in the Context of Globalisation”, Paperpresented on the seminar on India and Globalisation. http://www.ris.org.in/India_Globalisation_Industry and Informal sector Arup Mitra.pdf
Mitra, Barun (2006). “Grass Roots Capitalism Thrives in India”, in 2006 Index of EconomicFreedom. Washington, DC: The Heritage Foundation. http://www.strathmore.edu/essay/policy/intros/pre_97_mitra_capitalism_india.htm
Moser, Caroline O.N. (1978). “Informal Sector or Petty Commodity Production: Dualism orDependence in Urban Development?”, World Development 6(9/10): 1041, 64.
NCEUS (2009). The Challenge of Employment in Development in India: An InformalEconomy Perspective. NCEUS working draft for comments only. New Delhi.
————. (2007). Conditions of Work and Promotion of Livelihoods in the UnorganisedSector. New Delhi. http://nceus.gov.in/Condition_of_workers_ sep_2007.pdf
————. (2005). Constitution of Task Force on Skill Formation in the UnorganisedSector. Government of India. June 09.
Ñopo, Hugo and Patricio Valenzuela (2007). “Becoming an Entrepreneur”, DiscussionPaper No. 2716, Germany: Inter-American Development Bank, Institute for the Studyof Labour (IZA). March.
Planning Commission (2006). Report of the Working Group on Skills Development andVocational Training for the Next Five Year Plan, 2007-2012. New Delhi: Governmentof India. pp.27-28.
Portes, A. and J. Böröcz (1989). “Contemporary Immigration: Theoretical Perspectives onits Determinants and Modes of Incorporation”, International Migration Review 28(4):606-30.
Portes, A. and R. Schauffler (1993). “Competing Perspectives on the Latin AmericanInformal Sector”, Population and Development Review 19: 33-60.

192 INDIA EMERGING • VEENA JHA
Pradhan, Basant K., P.K. Roy and M.R. Saluja (1999). “Informal Sector in India: A Study ofHousehold Saving Behaviour”, Contribution of the Informal Sector to the Economy,Report no. 1. New Delhi: National Council of Applied Economic Research. August.
Quasem, M.A., A.H. Mondal and S. Mahmud (1998). “A Study of the Informal Sector inBangladesh”, Bangladesh Institute of Development Studies Research Report No.158.
Sassen, Saskia (1991). The Global City: New York, London, Tokyo. Princeton, NJ:Princeton University Press.
————. (1998). Globalization and Its Discontents: Essays on the New Mobility ofPeople and Money. New York: The New Press.
Sethuraman, S.V. (1976). “The Urban Informal Sector: Concept, Measurement and Policy”,International Labour Review 114(1): 69-81.
————. (1997). Urban Poverty and the Informal Sector: A Critical Assessment ofCurrent Strategies. Geneva: ILO.
————. (1998). “Gender, Informality, and Poverty: A Global Review”, Background Paperfor World Bank World Development Report 2000. Washington, D.C.
Sinha Anushree (2002). “Income Distribution and Employment”, Presented at the 14thInternational Input-Output Conference held in Montreal (October).
Tokman, V.E. (1978). “An Exploration into the Nature of Informal-Formal SectorRelationships”, World Development 6: 1065-75.
UN (2000). The World’s Women 2000: Trends and Statistics. New York: UN StatisticalDivision.
WEF (2009). India Competitiveness Report. http://www.slideshare.net/itsgowri/wef-india-competitiveness-report-2009
World Bank (2006a) India’s Employment Challenge: Creating Jobs, Helping Workers.Report No. 35772–IN. Washington: Poverty Reduction and Economic Management,South Asia, World Bank.
————. (2006b) Skills Development in India: The Vocational Education and TrainingSystem. Washington: Human Development Unit, South Asia Region, World Bank.
World Bank Group (2010). Doing Business, http://www.doingbusiness.org/economyrankings/
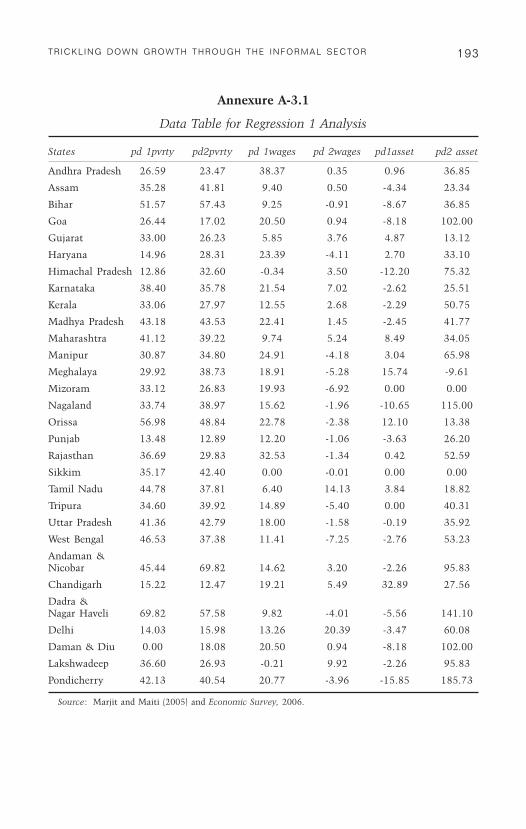
193TRICKLING DOWN GROWTH THROUGH THE INFORMAL SECTOR
Annexure A-3.1
Data Table for Regression 1 Analysis
States pd 1pvrty pd2pvrty pd 1wages pd 2wages pd1asset pd2 asset
Andhra Pradesh 26.59 23.47 38.37 0.35 0.96 36.85
Assam 35.28 41.81 9.40 0.50 -4.34 23.34
Bihar 51.57 57.43 9.25 -0.91 -8.67 36.85
Goa 26.44 17.02 20.50 0.94 -8.18 102.00
Gujarat 33.00 26.23 5.85 3.76 4.87 13.12
Haryana 14.96 28.31 23.39 -4.11 2.70 33.10
Himachal Pradesh 12.86 32.60 -0.34 3.50 -12.20 75.32
Karnataka 38.40 35.78 21.54 7.02 -2.62 25.51
Kerala 33.06 27.97 12.55 2.68 -2.29 50.75
Madhya Pradesh 43.18 43.53 22.41 1.45 -2.45 41.77
Maharashtra 41.12 39.22 9.74 5.24 8.49 34.05
Manipur 30.87 34.80 24.91 -4.18 3.04 65.98
Meghalaya 29.92 38.73 18.91 -5.28 15.74 -9.61
Mizoram 33.12 26.83 19.93 -6.92 0.00 0.00
Nagaland 33.74 38.97 15.62 -1.96 -10.65 115.00
Orissa 56.98 48.84 22.78 -2.38 12.10 13.38
Punjab 13.48 12.89 12.20 -1.06 -3.63 26.20
Rajasthan 36.69 29.83 32.53 -1.34 0.42 52.59
Sikkim 35.17 42.40 0.00 -0.01 0.00 0.00
Tamil Nadu 44.78 37.81 6.40 14.13 3.84 18.82
Tripura 34.60 39.92 14.89 -5.40 0.00 40.31
Uttar Pradesh 41.36 42.79 18.00 -1.58 -0.19 35.92
West Bengal 46.53 37.38 11.41 -7.25 -2.76 53.23
Andaman &Nicobar 45.44 69.82 14.62 3.20 -2.26 95.83
Chandigarh 15.22 12.47 19.21 5.49 32.89 27.56
Dadra &Nagar Haveli 69.82 57.58 9.82 -4.01 -5.56 141.10
Delhi 14.03 15.98 13.26 20.39 -3.47 60.08
Daman & Diu 0.00 18.08 20.50 0.94 -8.18 102.00
Lakshwadeep 36.60 26.93 -0.21 9.92 -2.26 95.83
Pondicherry 42.13 40.54 20.77 -3.96 -15.85 185.73
Source: Marjit and Maiti (2005) and Economic Survey, 2006.

194 INDIA EMERGING • VEENA JHA
Annexure A-3.2a
Sectors in Manufacturing where Formal Firms Account for80 Per cent of Total Output
(All figures in lakh)
Code Description Value of Output % Output
A.
1. Food & Beverages151 Food 5,687,680 4.42152 Dairy 2,151,018 1.67153 Grain mill 4,267,499 3.31154 Other food products 4,544,405 3.53155 Beverages 1,381,935 18,032,537 1.072. Textiles171 Textiles 7,900,393 6.14172 Other 937,890 8,838,283 0.733. Paper & Publishing210 Paper & paper products 2,053,396 1.60221 Publishing 678,954 2,732,350 0.534. Petroleum232 Petroleum 17,277,783 17,277,783 13.425. Chemicals241 Basic chemicals 9,051,155 7.03242 Other 8,311,694 17,362,849 6.466. Rubber & Tyres251 Rubber & tyres 1,632,558 1.27252 Plastic 2,497,277 4,129,835 1.947. Non-Metallic Minerals269 Non-metallic mineral 3,578,610 3,578,610 2.788. Steel & Metal271 Basic iron & steel 11,927,154 9.26272 Precious metals 3,061,365 2.38273 Casting of metals 914,685 0.71281 Metal products 1,003,906 0.78289 Fabricated metal products 2,037,708 18,944,818 1.589. Machinery291 General machinery 2,591,738 2.01292 Special machinery 2,360,971 1.83311 Electric motors 1,387,493 6,340,202 1.0810. Motor Vehicles & Accessories341 Motor vehicles 4,064,564 3.16342 Bodies of motor vehicles 122,276 0.09343 Accessories 2,837,548 7,024,388 2.20
Total of above (A) 104,261,655Total 128,738,002

195TRICKLING DOWN GROWTH THROUGH THE INFORMAL SECTOR
Add: Sectors where informal firms dominate
B.
160 Tobacco 1,207,516 0.94173 Fabrics 871,996 0.68181 Apparels 1,706,769 1.33182 Fur 13,899 0.01191 Leather 559,597 0.43192 Footwear 583,416 0.45201 Wood 52,301 0.04202 Wood plaiting materials 309,295 0.24222 Printing 393,661 0.31223 Reproduction 31,818 0.02231 Coal tar 568,917 0.44243 Manmade fibres 640,228 0.50293 Domestic appliances 518,872 0.40300 Office machines 682,484 0.53313 Wires & cables 763,193 0.59314 Batteries 275,511 0.21315 Lightening equipment 216,524 0.17319 Other electrical equipment 241,814 0.19321 Valves and tubes 680,468 0.53322 TV & radio 432,725 0.34323 Receivers of television & radio 1,725,831 1.34331 Medical instruments 703,989 0.55332 Optical instruments 58,636 0.05333 Watches & clocks 111,175 0.09351 Ships 252,843 0.20352 Railway locomotives 181,958 0.14353 Aircrafts 45,727 0.04359 Transport equipment 2,755,508 2.14361 Furniture 312,412 0.24369 N.E.C 2,144,245 1.67371 Recyclining metal waste 26,778 0.02372 Recyclining non-metal waste 9,017 0.01261 Glass 452,028 0.35Other Miscellaneous 3,335,702 2.59
Total of above (B) 22,866,853
Add: Industry items not belonging to the manufacturing sector:
C.
014 Agro-based services 963,431 0.75
142 Mining & quarrying 11,493 0.01
Total of above (C) 974,924
Grand Total (A+B+C) 128,738,002
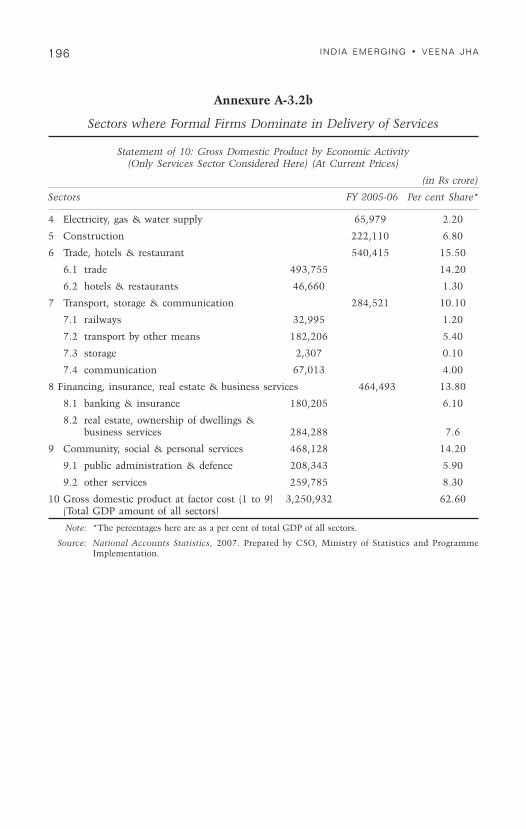
196 INDIA EMERGING • VEENA JHA
Annexure A-3.2b
Sectors where Formal Firms Dominate in Delivery of Services
Statement of 10: Gross Domestic Product by Economic Activity(Only Services Sector Considered Here) (At Current Prices)
(in Rs crore)
Sectors FY 2005-06 Per cent Share*
4 Electricity, gas & water supply 65,979 2.20
5 Construction 222,110 6.80
6 Trade, hotels & restaurant 540,415 15.50
6.1 trade 493,755 14.20
6.2 hotels & restaurants 46,660 1.30
7 Transport, storage & communication 284,521 10.10
7.1 railways 32,995 1.20
7.2 transport by other means 182,206 5.40
7.3 storage 2,307 0.10
7.4 communication 67,013 4.00
8 Financing, insurance, real estate & business services 464,493 13.80
8.1 banking & insurance 180,205 6.10
8.2 real estate, ownership of dwellings &business services 284,288 7.6
9 Community, social & personal services 468,128 14.20
9.1 public administration & defence 208,343 5.90
9.2 other services 259,785 8.30
10 Gross domestic product at factor cost (1 to 9) 3,250,932 62.60(Total GDP amount of all sectors)
Note: *The percentages here are as a per cent of total GDP of all sectors.
Source: National Accounts Statistics, 2007. Prepared by CSO, Ministry of Statistics and ProgrammeImplementation.
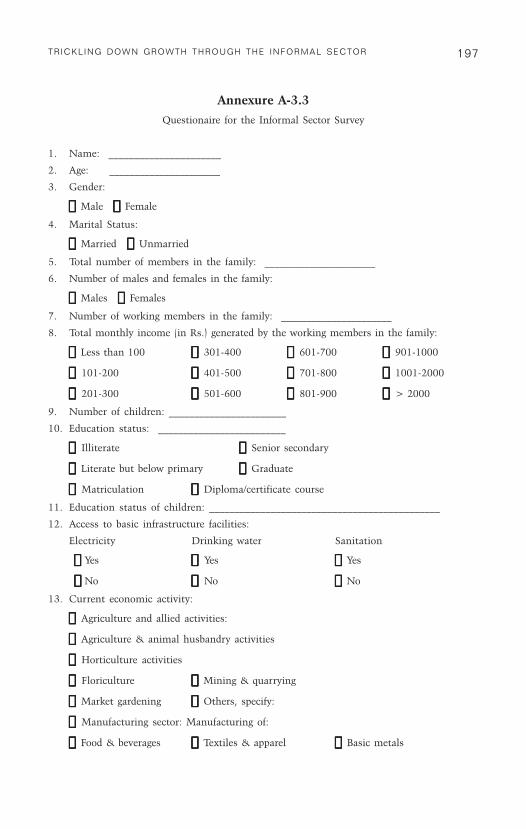
197TRICKLING DOWN GROWTH THROUGH THE INFORMAL SECTOR
Annexure A-3.3
Questionaire for the Informal Sector Survey
1. Name: ______________________
2. Age: ______________________
3. Gender:
Male Female
4. Marital Status:
Married Unmarried
5. Total number of members in the family: ______________________
6. Number of males and females in the family:
Males Females
7. Number of working members in the family: ______________________
8. Total monthly income (in Rs.) generated by the working members in the family:
Less than 100 301-400 601-700 901-1000
101-200 401-500 701-800 1001-2000
201-300 501-600 801-900 > 2000
9. Number of children: _______________________
10. Education status: _________________________
Illiterate Senior secondary
Literate but below primary Graduate
Matriculation Diploma/certificate course
11. Education status of children: _____________________________________________
12. Access to basic infrastructure facilities:
Electricity Drinking water Sanitation
Yes Yes Yes
No No No
13. Current economic activity:
Agriculture and allied activities:
Agriculture & animal husbandry activities
Horticulture activities
Floriculture Mining & quarrying
Market gardening Others, specify:
Manufacturing sector: Manufacturing of:
Food & beverages Textiles & apparel Basic metals
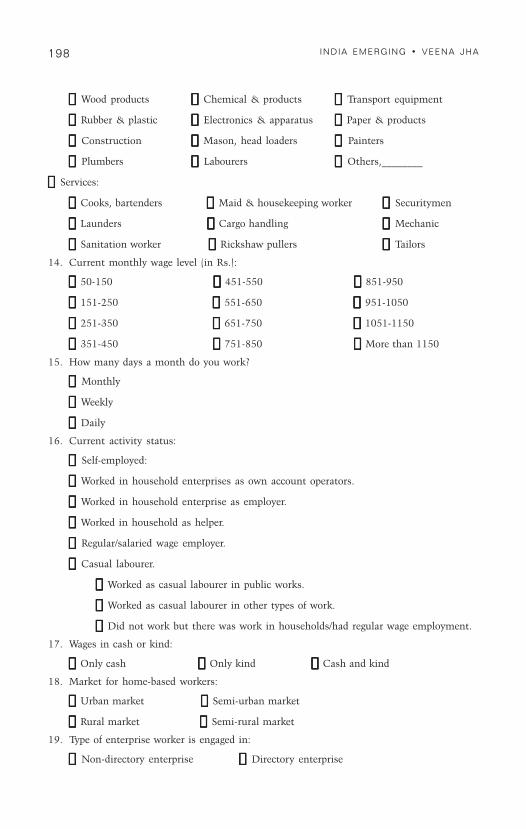
198 INDIA EMERGING • VEENA JHA
Wood products Chemical & products Transport equipment
Rubber & plastic Electronics & apparatus Paper & products
Construction Mason, head loaders Painters
Plumbers Labourers Others,________
Services:
Cooks, bartenders Maid & housekeeping worker Securitymen
Launders Cargo handling Mechanic
Sanitation worker Rickshaw pullers Tailors
14. Current monthly wage level (in Rs.):
50-150 451-550 851-950
151-250 551-650 951-1050
251-350 651-750 1051-1150
351-450 751-850 More than 1150
15. How many days a month do you work?
Monthly
Weekly
Daily
16. Current activity status:
Self-employed:
Worked in household enterprises as own account operators.
Worked in household enterprise as employer.
Worked in household as helper.
Regular/salaried wage employer.
Casual labourer.
Worked as casual labourer in public works.
Worked as casual labourer in other types of work.
Did not work but there was work in households/had regular wage employment.
17. Wages in cash or kind:
Only cash Only kind Cash and kind
18. Market for home-based workers:
Urban market Semi-urban market
Rural market Semi-rural market
19. Type of enterprise worker is engaged in:
Non-directory enterprise Directory enterprise

199TRICKLING DOWN GROWTH THROUGH THE INFORMAL SECTOR
Perennial enterprise Seasonal enterprise
Casual enterprise Household enterprise
20. Location of work/enterprise:
Owner's home Formal enterprise
Service outlet Market area
Footpath/street corner No fixed location
21. Number of years worked in the informal sector since 1991:
Less than 4 years 9-11 years
5-8 years 12-16 years
22. Work experience in the formal sector since 1991:
Zero years 9-11 years
Less than 4 years 12-15 years
5-8 years
23. Rate of job switch over since 1991:
Formal to informal
Less than a month 3-6 months More than one year
1-3 months 6 months-1 year
Informal to informal
Less than a month 3-6 months More than one year
1-3 months 6 months-1 year
24. Duration of the contract in the informal sector:
Weekly 3 month basis Yearly
Monthly 6 month basis
25. Does the worker engage himself/herself in subsidiary activity apart from the principalwork activity in the informal sector?
Yes No
If Yes, mention the occupation & duration of work: ________________________________
26. Reason for labour mobility:
To supplement income Not enough work & to supplement income
Not enough work Lack of job security
Work place too far Others, specify:
27. Presence of sub-contract type of work with the formal sector:
No contract Yes
28. Frequency of sub-contract in a 6 month period since 1991:
1-4 9-14 More than 20

200 INDIA EMERGING • VEENA JHA
5-9 15-20
29. Duration of contracts:
Less than a month 1-3 month basis
4-6 month basis More than 6 months
29. Consumption pattern of the informal workers:
Number of meals taken during a day
Quality of meals taken during a day (* enter the code)
* Code for assessing the quality of food intake:
Cod 1: inferior quality of food: rice, bajra, poor quality of wheat
Cod 2: medium quality of food: cereals, ghee, barley, millets, milk, vegetables.
Cod 3: medium to superior quality: meat, butter, vanaspati, fruits
Cod 4: superior quality: dry fruits, fruits, vegetables, pure ghee.
30. Amount of calorie intake on daily basis:
Less than 50 1001-1500 2501-3000
51- 500 1501-2000 3001-3500
501-1000 2001-2500 3501-4000
31. Asset building after joining work in the informal sector:
Kuccha house Pucca house TV
Motor vehicles Furniture Fridge
Others, specify:
32. Monthly living wage level:
Rs. 150-250 Rs. 251-350
Rs. 351-450 Rs. 451-550
More than Rs. 551, specify: _______________________________
33. Monthly health expenditure:
Less than 100 Rs. 101-200 Rs. 201-300
Rs. 301-400 Rs. 401-500 Rs. 501-600
Rs. 601-700 Rs. 701-800 Rs. 800 & above
34. Monthly transport expenditure:
Less than Rs.100 Rs. 101-200 Rs. 201-300
Rs. 301-400 Rs. 401-500 Rs. 501-600
Rs. 601-700 Rs. 701-800 Rs. 801 & above
35. Does the worker support the members of the family at the native place?
No Yes
If yes, specify the form (cash or kind): _________________________
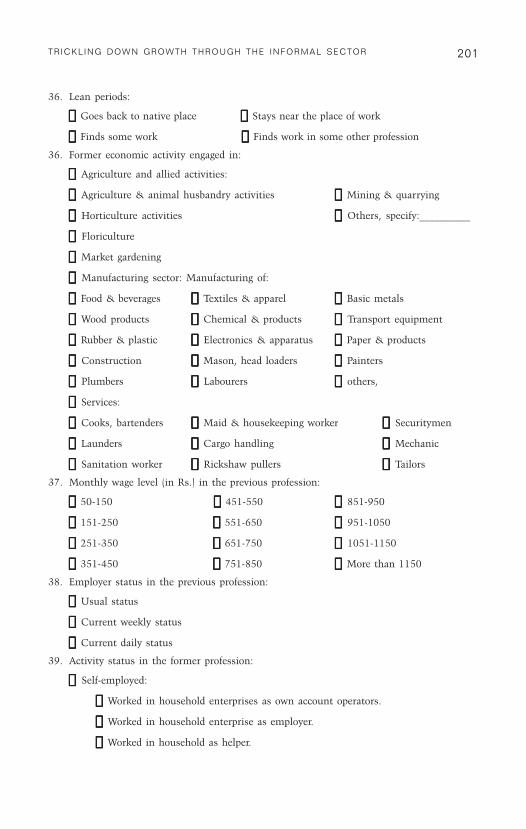
201TRICKLING DOWN GROWTH THROUGH THE INFORMAL SECTOR
36. Lean periods:
Goes back to native place Stays near the place of work
Finds some work Finds work in some other profession
36. Former economic activity engaged in:
Agriculture and allied activities:
Agriculture & animal husbandry activities Mining & quarrying
Horticulture activities Others, specify:__________
Floriculture
Market gardening
Manufacturing sector: Manufacturing of:
Food & beverages Textiles & apparel Basic metals
Wood products Chemical & products Transport equipment
Rubber & plastic Electronics & apparatus Paper & products
Construction Mason, head loaders Painters
Plumbers Labourers others,
Services:
Cooks, bartenders Maid & housekeeping worker Securitymen
Launders Cargo handling Mechanic
Sanitation worker Rickshaw pullers Tailors
37. Monthly wage level (in Rs.) in the previous profession:
50-150 451-550 851-950
151-250 551-650 951-1050
251-350 651-750 1051-1150
351-450 751-850 More than 1150
38. Employer status in the previous profession:
Usual status
Current weekly status
Current daily status
39. Activity status in the former profession:
Self-employed:
Worked in household enterprises as own account operators.
Worked in household enterprise as employer.
Worked in household as helper.

202 INDIA EMERGING • VEENA JHA
Regular/salaried wage employer
Casual labourer.
Worked as casual labourer in public works.
Worked as casual labourer in other types of work.
Did not work but there was work in households/had regular wage employment.
40. Asset building before joining work in the informal sector:
Kuccha house Pucca house TV
Motor vehicles Furniture Fridge
Others, specify: ______________________
41. Consumption pattern of the worker before entering in informal sector:
Number of meals taken during a day.
Quality of meals taken during a day (* enter the code).
* Code for assessing the quality of food intake:
Cod 1: inferior quality of food: rice, bajra, poor quality of wheat
Cod 2: medium quality of food: cereals, ghee, barley, millets, milk, vegetables.
Cod 3: medium to superior quality: meat, butter, vanaspati, fruits
Cod 4: superior quality: dry fruits, fruits, vegetables, pure ghee.
42. Amount of calorie intake on daily basis before joining informal sector:
Less than 50 1001-1500 2501-3000
51- 500 1501-2000 3001-3500
501-1000 2001-2500 3501-4000
43. Monthly health expenditure before getting employment in informal sector:
Less than 100 Rs. 101-200 Rs. 201-300
Rs. 301-400 Rs. 401-500 Rs. 501-600
Rs. 601-700 Rs. 701-800 Rs. 800 & above
44. Monthly transport expenditure before joining informal sector:
Less than Rs. 100 Rs. 101-200 Rs. 201-300
Rs. 301-400 Rs. 401-500 Rs. 501-600
Rs. 601-700 Rs. 701-800 Rs. 801 & above

20
3T
RIC
KL
ING
DO
WN
GR
OW
TH
TH
RO
UG
H T
HE
INF
OR
MA
L S
EC
TO
RAnnexure A-3.4
Summarised Results from Answers Obtained from the Questionire Survey
Employee Code 1 2 3 4 5 6 7 8 9 10
1 Dependents 4 7 3 14 6 7 5 3 6 9
2 Working members 1 3 2 4 1 2 2 1 2 4
3 Education status Illiterate BP G SS LBP LBP Illiterate LBP LBP LBPCode 0 1 3 2 1 1 0 1 1 1
4 Basic infrastructure EW EW ES DWES DWE WSP EDW PWS PWS PWSCode 2 2 2 3 2 3 2 3 3 3
5 Profession (current) (after) Labour Labour OoRS Cook Factory welder Labour Worker Worker Worker WorkerCategory (current) RPE SI Service outlet MH SI SI SI SI SI SI
6 Income monthly wage 50-150 > 1150 951-1050 951-1050 >1150 > 1150 > 1150 > 1150 > 1150 > 1150(in Rs) (after)Code (lower slab) 50 1150 951 951 1150 1150 1150 1150 1150 1150
7 Meals Consumption pattern (after)Code 1 3 2 3 2 3 2 3 3 2
8 Asset building (after) KH KH MV PH,F,TV KH,TV, KH PH PH,TV PH,TV KH,TVCode 0 0 1 3 2 0 1 2 2 1
9 Monthly health expenditure (after) < 100 < 100 201-300 < 100 101-200 101-200 201-300 < 100 101-200 < 100Code (lower slab) 0 0 201 0 101 101 201 0 101 0
10 Monthly transport expenditure (after) 401-500 < 100 <100 101-200 < 100 < 100 201-300 801 & above < 100 < 100Code (lower slab) 401 0 0 101 0 0 201 801 0 0
11 Income monthly wage (before) 50-150 351-400 > 1150 151-250Code (lower slab) 50 0 351 1150 0 0 0 0 151 0
12 Profession (before) Self-emp NWB TB F&B None None None None BM None
13 Asset building (before) KH None None None None None None KH,TV None NoneCode 0 0 0 0 0 0 0 1 0 0
14 Meals consumption pattern (before)Code 1 1 2 1 2 1 1 3 1 1
15 Monthly health expenditure (before) < 100 < 100 < 100 < 100 < 100 < 100 < 100 < 100 < 100 < 100Code (lower slab) 0 0 0 0 0 0 0 0 0 0
16 Monthly transport expenditure (before) 101-200 < 100 < 100 < 100 < 100 < 100 < 100 < 100 < 100 < 100Code (lower slab) 101 0 0 0 0 0 0 0 0 0
contd...
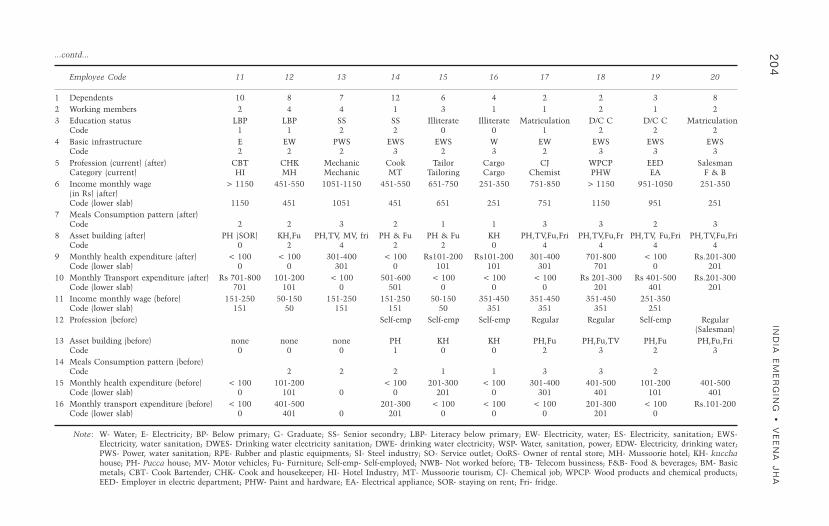
20
4IN
DIA
EM
ER
GIN
G •
VE
EN
A J
HA
...contd...
Employee Code 11 12 13 14 15 16 17 18 19 20
1 Dependents 10 8 7 12 6 4 2 2 3 82 Working members 2 4 4 1 3 1 1 2 1 23 Education status LBP LBP SS SS Illiterate Illiterate Matriculation D/C C D/C C Matriculation
Code 1 1 2 2 0 0 1 2 2 24 Basic infrastructure E EW PWS EWS EWS W EW EWS EWS EWS
Code 2 2 2 3 2 3 2 3 3 35 Profession (current) (after) CBT CHK Mechanic Cook Tailor Cargo CJ WPCP EED Salesman
Category (current) HI MH Mechanic MT Tailoring Cargo Chemist PHW EA F & B6 Income monthly wage > 1150 451-550 1051-1150 451-550 651-750 251-350 751-850 > 1150 951-1050 251-350
(in Rs) (after)Code (lower slab) 1150 451 1051 451 651 251 751 1150 951 251
7 Meals Consumption pattern (after)Code 2 2 3 2 1 1 3 3 2 3
8 Asset building (after) PH (SOR) KH,Fu PH,TV, MV, fri PH & Fu PH & Fu KH PH,TV,Fu,Fri PH,TV,Fu,Fr PH,TV, Fu,Fri PH,TV,Fu,FriCode 0 2 4 2 2 0 4 4 4 4
9 Monthly health expenditure (after) < 100 < 100 301-400 < 100 Rs101-200 Rs101-200 301-400 701-800 < 100 Rs.201-300Code (lower slab) 0 0 301 0 101 101 301 701 0 201
10 Monthly Transport expenditure (after) Rs 701-800 101-200 < 100 501-600 < 100 < 100 < 100 Rs 201-300 Rs 401-500 Rs.201-300Code (lower slab) 701 101 0 501 0 0 0 201 401 201
11 Income monthly wage (before) 151-250 50-150 151-250 151-250 50-150 351-450 351-450 351-450 251-350Code (lower slab) 151 50 151 151 50 351 351 351 251
12 Profession (before) Self-emp Self-emp Self-emp Regular Regular Self-emp Regular(Salesman)
13 Asset building (before) none none none PH KH KH PH,Fu PH,Fu,TV PH,Fu PH,Fu,FriCode 0 0 0 1 0 0 2 3 2 3
14 Meals Consumption pattern (before)Code 2 2 2 1 1 3 3 2
15 Monthly health expenditure (before) < 100 101-200 < 100 201-300 < 100 301-400 401-500 101-200 401-500Code (lower slab) 0 101 0 0 201 0 301 401 101 401
16 Monthly transport expenditure (before) < 100 401-500 201-300 < 100 < 100 < 100 201-300 < 100 Rs.101-200Code (lower slab) 0 401 0 201 0 0 0 201 0
Note: W- Water; E- Electricity; BP- Below primary; G- Graduate; SS- Senior secondry; LBP- Literacy below primary; EW- Electricity, water; ES- Electricity, sanitation; EWS-Electricity, water sanitation; DWES- Drinking water electricity sanitation; DWE- drinking water electricity; WSP- Water, sanitation, power; EDW- Electricity, drinking water;PWS- Power, water sanitation; RPE- Rubber and plastic equipments; SI- Steel industry; SO- Service outlet; OoRS- Owner of rental store; MH- Mussoorie hotel; KH- kucchahouse; PH- Pucca house; MV- Motor vehicles; Fu- Furniture; Self-emp- Self-employed; NWB- Not worked before; TB- Telecom bussiness; F&B- Food & beverages; BM- Basicmetals; CBT- Cook Bartender; CHK- Cook and housekeeper; HI- Hotel Industry; MT- Mussoorie tourism; CJ- Chemical job; WPCP- Wood products and chemical products;EED- Employer in electric department; PHW- Paint and hardware; EA- Electrical appliance; SOR- staying on rent; Fri- fridge.
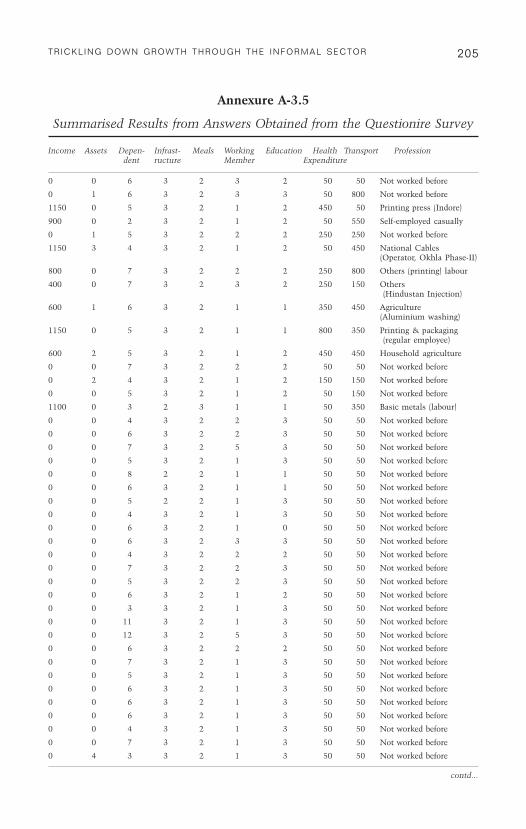
205TRICKLING DOWN GROWTH THROUGH THE INFORMAL SECTOR
Annexure A-3.5
Summarised Results from Answers Obtained from the Questionire Survey
Income Assets Depen- Infrast- Meals Working Education Health Transport Professiondent ructure Member Expenditure
0 0 6 3 2 3 2 50 50 Not worked before
0 1 6 3 2 3 3 50 800 Not worked before
1150 0 5 3 2 1 2 450 50 Printing press (Indore)
900 0 2 3 2 1 2 50 550 Self-employed casually
0 1 5 3 2 2 2 250 250 Not worked before
1150 3 4 3 2 1 2 50 450 National Cables(Operator, Okhla Phase-II)
800 0 7 3 2 2 2 250 800 Others (printing) labour
400 0 7 3 2 3 2 250 150 Others(Hindustan Injection)
600 1 6 3 2 1 1 350 450 Agriculture(Aluminium washing)
1150 0 5 3 2 1 1 800 350 Printing & packaging(regular employee)
600 2 5 3 2 1 2 450 450 Household agriculture
0 0 7 3 2 2 2 50 50 Not worked before
0 2 4 3 2 1 2 150 150 Not worked before
0 0 5 3 2 1 2 50 150 Not worked before
1100 0 3 2 3 1 1 50 350 Basic metals (labour)
0 0 4 3 2 2 3 50 50 Not worked before
0 0 6 3 2 2 3 50 50 Not worked before
0 0 7 3 2 5 3 50 50 Not worked before
0 0 5 3 2 1 3 50 50 Not worked before
0 0 8 2 2 1 1 50 50 Not worked before
0 0 6 3 2 1 1 50 50 Not worked before
0 0 5 2 2 1 3 50 50 Not worked before
0 0 4 3 2 1 3 50 50 Not worked before
0 0 6 3 2 1 0 50 50 Not worked before
0 0 6 3 2 3 3 50 50 Not worked before
0 0 4 3 2 2 2 50 50 Not worked before
0 0 7 3 2 2 3 50 50 Not worked before
0 0 5 3 2 2 3 50 50 Not worked before
0 0 6 3 2 1 2 50 50 Not worked before
0 0 3 3 2 1 3 50 50 Not worked before
0 0 11 3 2 1 3 50 50 Not worked before
0 0 12 3 2 5 3 50 50 Not worked before
0 0 6 3 2 2 2 50 50 Not worked before
0 0 7 3 2 1 3 50 50 Not worked before
0 0 5 3 2 1 3 50 50 Not worked before
0 0 6 3 2 1 3 50 50 Not worked before
0 0 6 3 2 1 3 50 50 Not worked before
0 0 6 3 2 1 3 50 50 Not worked before
0 0 4 3 2 1 3 50 50 Not worked before
0 0 7 3 2 1 3 50 50 Not worked before
0 4 3 3 2 1 3 50 50 Not worked before
contd...

206 INDIA EMERGING • VEENA JHA
...contd...
Income Assets Depen- Infrast- Meals Working Education Health Transport Professiondent ructure Member Expenditure
0 0 5 3 2 1 2 50 50 Not worked before
0 0 4 3 2 1 3 50 50 Not worked before
0 0 1 3 2 1 3 50 50 Not worked before
0 0 4 3 2 1 3 50 50 Not worked before
0 0 4 3 2 1 3 50 50 Not worked before
0 0 4 3 2 2 2 50 50 Not worked before
0 0 5 3 2 1 3 50 50 Not worked before
0 0 4 3 2 1 1 50 50 Not worked before
0 0 4 3 2 1 1 50 50 Not worked before
0 0 8 3 2 3 0 50 50 Not worked before
0 0 3 3 2 1 0 50 50 Not worked before
0 0 9 3 2 2 0 50 50 Not worked before
0 0 10 3 2 4 0 50 50 Not worked before
0 0 4 3 2 1 0 50 50 Not worked before
0 0 5 3 2 1 1 50 50 Not worked before
0 0 6 3 2 1 1 50 50 Not worked before
0 0 2 2 2 1 0 50 50 Not worked before
0 0 2 3 2 1 0 50 50 Not worked before
0 0 3 3 2 1 1 50 50 Not worked before
0 0 5 3 2 1 1 50 50 Not worked before
0 0 3 3 2 1 0 50 50 Not worked bfore
0 0 5 3 2 1 1 50 50 Not worked before
0 0 6 3 2 1 0 50 50 Not worked before
0 0 6 3 2 2 0 50 50 Not worked before
0 0 5 3 2 1 1 50 50 Not worked before
0 0 7 3 2 1 0 50 50 Not worked before
0 0 4 3 2 1 0 50 50 Not worked before
0 0 5 3 2 1 1 50 50 Not worked before
0 0 9 3 2 1 0 50 50 Not worked before
0 0 6 3 2 2 0 50 50 Not worked before
0 0 4 3 2 1 1 50 50 Not worked before
1150 1 2 3 3 1 0 350 50 Food & beverages(labour)
0 0 5 3 2 1 0 50 150 Not worked before
0 1 4 3 3 1 2 150 250 Not worked before
contd...

207TRICKLING DOWN GROWTH THROUGH THE INFORMAL SECTOR
...contd...
Income Assets Depen- Infrast- Meals Working Education Health Transport Professiondents ructure Member Expenditure
1100 0 6 3 2 3 2 150 150 Printing & packaging(labour)
1150 1 6 3 2 3 3 50 800 Printing & packaging(labour)
1150 0 5 3 2 1 2 450 550 Printing & packaging(labour)
1150 1 2 3 2 1 2 50 250 Printing (labour)
900 1 5 3 2 2 2 50 50 Printing (labour)
1150 0 4 3 2 1 2 800 550 Printing (labour)
500 0 7 3 2 2 2 150 800 Printing & packaging(labour)
500 0 7 3 2 3 2 450 250 Printing (labour)
900 1 6 3 2 1 1 350 450 Printing (regular)
1150 2 5 3 2 1 1 350 550 Printing & packaging(regular)
1150 3 5 3 2 1 2 450 550 Dhaba (self-employed)
1150 1 7 3 2 2 2 350 150 Tea stall (regular)
500 3 4 3 2 1 2 350 150 Printing (Regular)
1150 3 5 3 2 1 2 50 350 Packaging (Regular)
1150 0 3 2 3 1 1 150 50 Basic metals (Labour)
1150 5 4 3 3 2 3 50 800 Paper & products
1150 4 6 3 3 2 3 750 750 Paper & products (labour)
1150 3 7 3 3 5 3 550 650 Paper & products (labour)
1150 5 5 3 3 1 3 800 800 Paper & products (labour)
1150 1 8 2 3 1 1 350 150 Paper & products (labour)
1150 4 6 3 3 1 1 800 800 Paper & products (labour)
1150 3 5 2 3 1 3 250 450 Paper & products (labour)
1150 5 4 3 3 1 3 800 50 Paper & products (labour)
1150 4 6 3 3 1 0 50 50 Paper & products (labour)
1150 4 6 3 3 3 3 800 800 Paper & products (labour)
1150 4 4 3 3 2 2 750 450 Paper & products (labour)
1150 4 7 3 3 2 3 800 800 Paper & products (labour)
1150 4 5 3 3 2 3 750 750 Paper & products (labour)
1150 3 6 3 3 1 2 750 750 Paper & products (labour)
1150 0 3 3 2 1 3 50 50 Paper & products (labour)
1150 4 11 3 3 1 3 450 550 Paper & products (labour)
1150 4 12 3 3 5 3 750 800 Paper & products (labour)
1150 2 6 3 2 2 2 50 150 Paper & products (labour)
1150 0 7 3 2 1 3 450 450 Paper & products (labour)
1150 4 5 3 3 1 3 750 800 Paper & products (labour)
1150 4 6 3 2 1 3 800 800 Paper & products (labour)
1150 4 6 3 3 1 3 800 800 Paper & products (labour)
1150 4 6 3 3 1 3 50 50 Paper & products (labour)
1150 0 4 3 2 1 3 750 750 Food & beverages(household)
1150 4 7 3 3 1 3 750 750 Food & beverages(household)
contd...

208 INDIA EMERGING • VEENA JHA
...contd...
Income Assets Depen- Infrast- Meals Working Education Health Transport Professiondents ructure Member Expenditure
1150 4 3 3 2 1 3 750 800 Food & beverages(household)
1150 4 5 3 3 1 2 450 450 Food & beverages(household)
1150 4 4 3 3 1 3 350 350 Food & beverages(household)
1150 3 1 3 3 1 3 350 350 Food & beverages(household)
1150 4 4 3 3 1 3 350 350 Food & beverages(household)
1150 4 4 3 3 1 3 350 350 Food & beverages (labour)
1150 4 4 3 3 2 2 350 450 Food & beverages (labour)
1150 3 5 3 2 1 3 750 750 Food & beverages (labour)
1150 1 4 3 3 1 1 150 50 Food & beverages (labour)
1150 1 4 3 3 1 1 50 50 Food & beverages (labour)
1150 0 8 3 3 3 0 50 50 Food & beverages (labour)
1150 1 3 3 3 1 0 150 250 Food & beverages(household)
1150 1 9 3 3 2 0 250 50 Food & beverages(household)
1150 3 10 3 3 4 0 50 150 Food & beverages(household)
1150 1 4 3 3 1 0 250 250 Food & beverages(household)
1150 0 5 3 3 1 1 150 250 Food & beverages(household)
1150 0 6 3 3 1 1 50 50 Food & beverages(household)
1150 3 2 2 3 1 0 50 50 Food & beverages (labour)
1150 1 2 3 3 1 0 50 50 Food & beverages (labour)
1150 0 3 3 3 1 1 150 50 Food & beverages (labour)
1150 1 5 3 3 1 1 250 50 Food & beverages (labour)
1150 1 3 3 3 1 0 50 50 Food & beverages (labour)
1150 0 5 3 3 1 1 50 50 Food & beverages (labour)
1150 2 6 3 3 1 0 150 50 Food & beverages (labour)
1150 0 6 3 3 2 0 50 50 Food & beverages (labour)
1150 1 5 3 3 1 1 50 250 Food & beverages (labour)
1150 1 7 3 3 1 0 50 50 Food & beverages (labour)
1150 1 4 3 3 1 0 250 50 Food & beverages (labour)
1150 0 5 3 3 1 1 50 50 Food & beverages (labour)
1150 1 9 3 3 1 0 50 50 Food & beverages(household)
1150 0 6 3 3 2 0 50 50 Food & beverages(household)
1150 1 4 3 3 1 1 50 50 Food & beverages(household)
1150 1 2 3 3 1 0 550 50 Food & beverages (labour)
1150 2 5 3 2 1 0 50 350 Printing (regular)(employee)
1150 4 4 3 3 1 2 250 350 Textiles & apparel(supervisor)
contd...

209TRICKLING DOWN GROWTH THROUGH THE INFORMAL SECTOR
...contd...
Income Assets Depen- Infrast- Meals Working Education Health Transport Professiondents ructure Member Expenditure
0 0 8 3 2 2 0 50 50 Not worked before
1000 0 5 2 2 1 0 250 750 Others (printing) labour
0 0 4 3 2 1 2 250 450 Not worked before
1150 0 4 3 2 1 2 250 450 Others (HBT), services (operator)
1000 0 4 3 2 1 0 250 150 Others (hindustaninjection)
0 0 4 3 2 2 3 150 150 Not worked before
600 2 8 2 2 5 0 350 350 Household (agriculture)
1150 1 3 3 3 2 3 550 800 Household (agriculture)
0 0 5 3 2 1 3 50 50 Not worked before
0 0 4 3 2 2 3 50 50 Not worked before
0 0 5 3 2 2 3 50 50 Not worked before
0 0 5 3 2 1 3 50 50 Not worked before
0 0 10 0 2 1 3 50 50 Not worked before
0 0 10 3 2 1 3 50 50 Not worked before
0 0 5 3 2 1 2 50 50 Not worked before
0 0 10 3 2 5 0 50 50 Not worked before
0 0 6 3 2 1 3 50 50 Not worked before
0 0 6 3 2 1 3 50 50 Not worked before
0 0 5 3 2 1 3 50 50 Not worked before
0 0 7 3 2 1 3 50 50 Not worked before
0 0 5 3 2 2 3 50 50 Not worked before
0 0 5 3 2 2 2 50 50 Not worked before
0 0 6 3 2 3 3 50 50 Not worked before
contd...
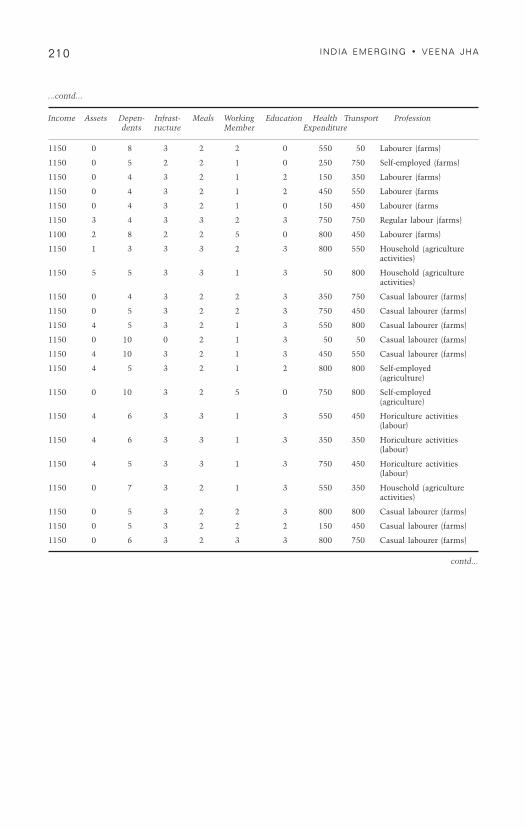
210 INDIA EMERGING • VEENA JHA
...contd...
Income Assets Depen- Infrast- Meals Working Education Health Transport Professiondents ructure Member Expenditure
1150 0 8 3 2 2 0 550 50 Labourer (farms)
1150 0 5 2 2 1 0 250 750 Self-employed (farms)
1150 0 4 3 2 1 2 150 350 Labourer (farms)
1150 0 4 3 2 1 2 450 550 Labourer (farms
1150 0 4 3 2 1 0 150 450 Labourer (farms
1150 3 4 3 3 2 3 750 750 Regular labour (farms)
1100 2 8 2 2 5 0 800 450 Labourer (farms)
1150 1 3 3 3 2 3 800 550 Household (agricultureactivities)
1150 5 5 3 3 1 3 50 800 Household (agricultureactivities)
1150 0 4 3 2 2 3 350 750 Casual labourer (farms)
1150 0 5 3 2 2 3 750 450 Casual labourer (farms)
1150 4 5 3 2 1 3 550 800 Casual labourer (farms)
1150 0 10 0 2 1 3 50 50 Casual labourer (farms)
1150 4 10 3 2 1 3 450 550 Casual labourer (farms)
1150 4 5 3 2 1 2 800 800 Self-employed(agriculture)
1150 0 10 3 2 5 0 750 800 Self-employed(agriculture)
1150 4 6 3 3 1 3 550 450 Horiculture activities(labour)
1150 4 6 3 3 1 3 350 350 Horiculture activities(labour)
1150 4 5 3 3 1 3 750 450 Horiculture activities(labour)
1150 0 7 3 2 1 3 550 350 Household (agricultureactivities)
1150 0 5 3 2 2 3 800 800 Casual labourer (farms)
1150 0 5 3 2 2 2 150 450 Casual labourer (farms)
1150 0 6 3 2 3 3 800 750 Casual labourer (farms)
contd...

211TRICKLING DOWN GROWTH THROUGH THE INFORMAL SECTOR
...contd...
Income Assets Depen- Infrast- Meals Working Education Health Transport Professiondents ructure Member Expenditure
1150 0 4 2 2 2 0 250 50 Services (rikshaw pullers)
1150 0 5 2 2 2 2 50 50 Services (rikshaw pullers)
1150 0 6 3 2 1 1 50 50 Services (cooks, bartenders)
0 0 5 3 2 1 1 50 50 Not worked before
0 0 7 3 2 2 2 50 50 Not worked before
0 0 5 3 2 2 3 50 50 Not worked before
0 0 3 3 2 2 2 50 50 Not worked before
0 0 5 3 2 1 3 50 50 Not worked before
0 0 4 3 2 2 3 50 50 Not worked before
0 0 4 3 2 2 3 50 50 Not worked before
0 0 7 3 2 1 3 50 50 Not worked before
0 0 4 3 2 1 3 50 50 Not worked before
0 0 3 3 2 2 2 50 50 Not worked before
1150 0 7 3 3 1 1 150 150 Services (cooks, bartenders)
700 0 4 2 2 1 2 250 150 Labourers (farms)
700 0 3 0 2 2 0 150 50 Household (agriculture)
0 0 3 3 2 3 3 50 50 Not worked before
0 0 5 3 2 2 3 50 50 Not worked before
0 0 8 3 2 1 2 50 50 Not worked before
0 0 5 3 2 1 3 50 50 Not worked before
0 0 5 3 2 1 1 50 50 Not worked before
0 0 5 3 2 2 2 50 50 Not worked before
0 0 5 3 2 1 3 50 50 Not worked before
0 0 6 3 2 2 3 50 50 Not worked before
0 0 4 3 2 2 3 50 50 Not worked before
0 0 3 3 2 1 2 50 50 Not worked before
0 0 3 3 2 2 3 50 50 Not worked before
0 0 4 3 2 1 2 50 50 Not worked before
0 0 2 3 2 2 2 150 150 Not worked before
1150 0 3 3 3 1 0 150 150 Mechanic (household)
0 0 6 3 2 2 2 50 50 Not worked before
1150 0 7 2 2 1 0 150 50 Rikshaw pullers (self-employed)
1150 0 7 2 2 3 2 150 50 Rikshaw pullers (self-employed)
500 0 1 2 2 1 0 250 50 Rikshaw pullers (self-employed)
0 0 5 3 2 2 0 50 50 Not worked before
1150 0 5 3 2 1 0 150 50 Cargo handling (self-employed)
0 0 5 3 2 2 2 50 50 Not worked before
1150 4 5 3 3 1 1 150 150 Tailors (regular/salariedwage employer)
1150 2 4 3 3 2 1 150 150 Tailors (regular/salariedwage employer)
contd...

212 INDIA EMERGING • VEENA JHA
...contd...
Income Assets Depen- Infrast- Meals Working Education Health Transport Professiondents ructure Member Expenditure
1150 1 3 2 3 1 0 150 150 Textiles & apparel (tailors)
1150 2 4 3 3 1 2 150 50 Textiles & apparel (tailors)
0 2 3 3 3 1 1 150 50 Not worked before
0 0 6 3 2 3 1 50 50 Not worked before
1150 1 5 3 3 1 1 250 50 Textiles & apparel (tailors)
0 1 4 3 3 1 2 150 250 Not worked before
0 1 13 3 3 5 2 150 50 Not worked before
0 1 4 3 3 1 1 150 150 Not worked before
1150 0 8 3 3 3 1 150 50 Textiles & apparel (tailors)
1150 2 4 3 3 1 0 150 150 Textiles & apparel (tailors)
0 3 4 3 3 2 2 250 450 Not worked before
0 2 5 3 3 2 2 150 150 Not worked before
600 1 6 2 2 6 0 50 50 Maid & housekeeping(worker)
100 1 3 2 2 1 1 50 50 Food & beverages (labour)
600 1 5 2 2 4 0 50 50 Maid & housekeeping(worker)
600 1 5 2 2 2 2 50 50 Maid & housekeeping(worker)
1100 1 5 3 2 2 1 250 250 Household
600 0 3 2 2 1 0 50 50 Sanitation worker
1150 2 5 3 2 3 1 350 350 Sanitation worker
1150 3 2 3 2 1 2 450 350 Bartenders
0 2 5 3 3 3 1 50 50 Not worked before
0 0 3 3 2 1 1 50 50 Not worked before
0 0 6 3 3 2 1 50 50 Not worked before
0 0 3 3 3 2 1 50 50 Not worked before
0 0 5 3 3 4 1 50 50 Not worked before
0 0 3 3 3 2 1 50 50 Not worked before
0 0 2 3 3 2 1 50 50 Not worked before
contd...

213TRICKLING DOWN GROWTH THROUGH THE INFORMAL SECTOR
...contd...
Income Assets Depen- Infrast- Meals Working Education Health Transport Professiondents ructure Member Expenditure
1150 0 4 2 2 2 0 250 50 Services (rikshaw pullers)
1150 0 5 2 2 2 2 250 50 Services (rikshaw pullers)
1150 2 6 3 3 1 1 450 250 Services (cooks, bartenders)
1150 1 5 3 3 1 1 450 250 Services (hotel-housekeeping)
1150 2 7 3 3 2 2 250 150 Services (housekeeping)
1150 2 5 3 3 2 3 250 550 Services (tour guide)
1150 1 3 3 3 2 2 250 150 Services (driver)
1150 2 5 3 3 1 3 550 250 Services (hotel-roomservice)
1150 0 4 3 3 2 3 150 150 Services (tour & travel)
1150 2 4 3 3 2 3 250 550 Services (tour operator)
1150 4 7 3 3 1 3 750 550 Services (hotel clerk cumcashier, room service)
1150 1 4 3 3 1 3 450 550 Services (hotel clerk/cashier, restaurant)
1150 0 3 3 3 2 2 450 250 Services (hotel industry-front office)
1150 1 7 3 3 1 1 450 450 Services (cooks, bartenders)
1150 1 4 2 2 1 2 250 50 Rikshaw pullers (self-employed)
1150 0 3 0 2 2 0 250 50 Rikshaw pullers (self-employed)
1150 2 3 3 3 3 3 450 250 Taxi driver (self-employed)
1150 1 5 3 3 2 3 250 450 Tour guide (self-employed)
1150 2 8 3 3 1 2 250 150 Hotel-housekeeping
1150 2 5 3 3 1 3 450 350 Hotel-housekeeping
1150 3 5 3 3 1 1 550 250 Hotel-taxi driver
1150 2 5 3 3 2 2 450 250 Travel & tour labour
1150 4 5 3 3 1 3 550 750 Travel & tour labour
1150 0 6 3 3 2 3 250 350 Hotel-store clerk
1150 0 4 3 3 2 3 250 450 Hotel-front office
1150 4 3 3 3 1 2 450 50 Hotel-office clerk/peon
1150 1 3 3 3 2 3 450 350 Hotel-front office
1150 3 4 3 3 1 2 750 250 Hotel-room service
1150 0 2 3 2 2 2 250 50 Hotel-room service
1150 1 3 3 2 1 0 150 150 Mechanic (services)
1150 4 6 3 2 2 2 150 150 Securitymen (services)
1150 0 7 2 3 1 0 150 50 Rikshaw pullers (self-employed)
1150 0 7 2 2 3 2 150 50 Rikshaw pullers (self-employed)
1150 0 1 2 2 1 0 250 50 Rikshaw pullers (self-employed)
1150 0 5 3 2 2 0 50 50 Cargo handling (self-employed)
1150 0 5 3 2 1 0 150 50 Cargo handling (self-employed)
contd...

214 INDIA EMERGING • VEENA JHA
...contd...
Income Assets Depen- Infrast- Meals Working Education Health Transport Professiondents ructure Member Expenditure
1150 0 5 3 3 2 2 250 50 Cargo handling (self-employed)
1150 4 5 3 3 1 1 250 150 Tailors (regular/salariedwage employer)
1150 2 4 3 3 2 1 150 50 Tailors (regular/salariedwage employer)
1150 1 3 2 3 1 0 150 50 Textiles & apparel (tailors)
1150 4 4 3 3 1 2 250 150 Textiles & apparel (tailors)
1150 3 3 3 3 1 1 250 150 Textiles & apparel (tailors)
1150 3 6 3 3 3 1 150 50 Textiles & apparel (tailors)
1150 2 5 3 3 1 1 250 150 Textiles & apparel (tailors)
1150 4 4 3 3 1 2 250 350 Textiles & apparel(supervisor)
1150 1 13 3 3 5 2 150 50 Textiles & apparel (tailors)
1150 4 4 3 3 1 1 150 150 Textiles & apparel (tailors)
1150 0 8 3 3 3 1 250 50 Textiles & apparel (tailors)
1150 3 4 3 3 1 0 250 250 Textiles & apparel (tailors)
1150 4 4 3 3 2 2 250 350 Cooks, bartenders
1150 4 5 3 3 2 2 250 350 Cooks, bartenders
1150 3 6 2 2 6 0 250 150 Maid & housekeepingworker
400 1 3 2 2 1 1 50 50 Maid & housekeepingworker
500 1 5 2 2 4 0 150 250 Maid & housekeepingworker
900 3 5 2 2 2 2 250 150 Maid & housekeepingworker
1150 2 5 3 2 2 1 250 50 Rikshaw pullers (self-employed)
1100 1 3 2 2 1 0 150 50 Rikshaw pullers (self-employed)
1150 2 5 3 2 3 1 250 350 Tailors (household)
1150 4 2 3 2 1 2 250 550 Tailors (household)
1150 2 5 3 3 3 1 50 50 Cook, bartender
1150 0 3 3 3 1 1 50 50 Cook, bartender
1150 1 6 3 3 2 1 50 50 Cook, bartender
1150 2 3 3 3 2 1 50 50 Cook, bartender
1150 2 5 3 3 4 1 50 50 Cook, bartender
1150 0 3 3 3 2 1 50 50 Cook, bartender
1150 0 2 3 3 2 1 50 50 Cook, bartender

TTTTTrickling Up Grrickling Up Grrickling Up Grrickling Up Grrickling Up Growth throwth throwth throwth throwth throughoughoughoughoughGender PGender PGender PGender PGender Parityarityarityarityarity
Introduction
The last three chapters have shown that economic growth trickled downalbeit slowly to the informal sector and the poor. The same trickle downeffects should be observed on gender disparities. Theoretically, rising incomeand falling poverty levels would in general reduce gender disparities ineducation, health and nutrition. Higher productivity and new jobopportunities brought about by rising income levels often reduce genderinequalities in employment. Higher income levels when accompanied bygovernment investment in the provision of basic water, energy andtransportation infrastructure help reduce gender disparities in workloads.
However, as shown below, gender disparities have not reducedsubstantially during the period of high growth in India. Because economicgrowth may not have been high enough or sustained enough to reducepoverty, active measures are needed to redress persistent gender disparitiesin the short to medium term. Empirical work in recent years has broughtout very clearly how the relative respect and regard for women's well-beingis strongly influenced by such variables as women's ability to earn anindependent income, to find employment outside the home, to haveownership rights and to have literacy and be educated participants indecisions within and outside the family. Indeed, even the survival ofdisadvantaged women compared to men in developing countries seems togo up sharply—and may even get eliminated—as progress is made in theseagency aspects. Progress in one area (that of being able to work outside thehousehold) seems to help to foster progress in others (in enhancing freedomfrom hunger, illness and relative deprivation).
44444
216 INDIA EMERGING • VEENA JHA
This chapter investigates a complex situation where increasingeconomic growth has been accompanied by deteriorating gender developmentindex for India. The different indicators of gender inequality show divergenttrends. These trends need to be investigated as policy responses wouldnecessarily need to take account of the factors that have led to thesedivergent trends. What is even more interesting is the reverse causation, i.e.,restoring gender parity has trickled up growth in the Indian economy. Whilethe effects of gender parity on economic growth may not be pronounced, thischapter shows that its effect on poverty reduction is much clearer. Section IIdocuments a literature review of economic growth and gender relationshipsand shows that causation either way may not be strong. However before doingso, the chapter tries to outline an operational concept of gender parity inSection I. Section III outlines India’s growth experience and gender equality.Section IV examines the correlations between gender equality and growth.Section V focusses on gender parity in education and health with growth.Before concluding in Section VII, Section VI discusses gender and poverty.
I
Operational Concepts of Gender Parity
The term gender equality has been defined in multiple ways in thedevelopment literature and has been the subject of great debate in the UN.It often means women having the same opportunities in life as men, forinstance equality of access to education and employment, which does notnecessarily lead to equality of outcomes. Three primary domains ofequality between men and women emerge:
1. capabilities,
2. access to resources and opportunities, and
3. agency or the ability to influence outcomes.
The capabilities domain refers to basic human abilities as measuredthrough education, health and nutrition. It is the most fundamental of allthe three domains and is necessary for achieving equality in the other twodomains. Access to resources and opportunities, the second domain, refersprimarily to equality in the opportunity to use or apply basic capabilities

217TRICKLING UP GROWTH THROUGH GENDER PARITY
through access to economic assets (such as land and property) andresources (such as income and employment). The third domain, agency, isthe defining element of the concept of empowerment and refers to theability to make choices and decisions that can alter outcomes. Genderequality in this domain can only result from an equalising in the balance ofpower between women and men in the household and societal institutions.
These three domains of equality are inter-related. Progress in any onedomain to the exclusion of the others is insufficient to meet the goal ofgender equality. While they are inter-related, the three domains are notnecessarily dependent on each other. So, for instance, illiterate women mayorganise, thereby building their agency to influence outcomes forthemselves and their households. Not surprisingly, women then use thatagency to demand capability (better health or education) and opportunity(access to decent work). Similarly, women with capabilities (as measured byeducation) may have no economic opportunity, as is evidenced in manyMiddle Eastern countries.
Explicit measures of gender inequalities are: sex ratio, literacy rates,health and nutrition indicators, wage differentials, ownership of land andproperty. The implicit measures of gender inequalities are those embeddedin relations of power and in hierarchies and are more difficult to measure.Located in the household, in custom, religion and culture, these intra-household inequalities result in unequal distribution of power, control overresources and decision-making, dependence rather than self-reliance,control rather than autonomy and unfair, unequal distribution of work,drudgery and even food. Current development debate has resulted intogeneration of meaningful indicators of women and development. In 2010,India ranked 134 out of 182 nations in terms of human development, butin gender development index (GDI) India's rank was 139 out of 155countries.1 Comparative data of 155 countries regarding gender-relateddevelopment index reveals that gender equality does not depend entirely onthe income level of society. The human development approach whichfocusses on demographic, health, education, employment and humanrights issues of women provides realistic insights to address women's
1. Human Development Report, published by the United Nations DevelopmentProgramme. Accessed from www.undp.org

218 INDIA EMERGING • VEENA JHA
concerns. Thus, gender sensitive human development ensures an inclusivegrowth. In other words, addressing gender disparities through positivemeasures would trickle up growth and more importantly reduce poverty.
II
Trickling Up Growth through Gender Parity
The effect on growth of increased gender equality of opportunity hasbeen examined extensively. Growth regressions have serious limitations,and those that use gender-disaggregated data are no exception. The mostimportant limitation is that of endogeneity: gender equality affects growth,but growth presumably also affects gender equality. Finding validinstrumental variables to correct for this endogeneity is challenging to saythe least. One empirical paper employing growth regressions explicitlyaddresses this simultaneity by instrumenting. In a cross-country panelregression of over 100 countries for the 1975-1990 period, Dollar and Gatti(1999) find that increases in per capita income are associated withincreases in gender equality along three dimensions: secondary schoolattainment, wage gaps and women in parliament. The effect of income ongender equality becomes stronger as countries move from low-middleincome to high income.
Economic growth appears to be positively correlated with genderequality. This latter finding is sensitive to changes in the length of theperiod over which per capita GDP growth rates are averaged and to onealternative measure of gender equality (the GDI-HDI ratio). When genderequality is measured by the gender empowerment measure (the GEM),however, the relationship is not statistically significant. (World Bank,2001). What is quite interesting is that the effects of gender parity ongrowth is much more evident than the reverse. This implies that restoringgender parity actually trickles up economic growth. There are severalaspects of gender parity, but some of the important ones which have helpedtrickle up growth are discussed below.
Gender PGender PGender PGender PGender Parity in Education and Grarity in Education and Grarity in Education and Grarity in Education and Grarity in Education and Growthowthowthowthowth
Equality of opportunity in education has received particular attention,for two simple reasons. First, education and, more broadly human capital,
219TRICKLING UP GROWTH THROUGH GENDER PARITY
is easily incorporated into two frequently-used econometric models ofeconomic growth: the augmented Solow model and endogeneous growthmodels. Second, educational inequalities are both easily measurable andthese measures are widely available.
The first generation of panel regression studies examining therelationship between gender disaggregated measures of educationalattainment and growth in per capita GDP find little difference between theeffect of male and female education. Two well-known studies (Barro, 1991;Barro and Lee, 1994) even find that base-period female educationalattainment is negatively related to subsequent rates of growth.
More recent studies have addressed the econometric and specificationproblems in this first generation of studies, and typically find a largerimpact of female education on growth than of male education on growth(Abu-Ghaida and Klasen, 2004). Dollar and Gatti (1999), for example, findthat negative returns to female education disappear once regional dummyvariables are included in the specification; they hypothesise that the earlierresult was driven by the low growth and high education for women thatcharacterised Latin America for the period of the study. Klasen (2002)estimates the effect of the gender gap in years of total schooling in the adultpopulation on per capita income growth, using cross-country and panelregressions for the 1960-1992 period for 109 industrial and developingcountries. He estimates both a structural model (which includes a directimpact of education on growth, an indirect effect via increased investment,an indirect effect via lower population growth, an indirect effect via theinteraction of population growth and investment, an indirect effect vialabour force growth and an indirect effect via the interaction of labour forcegrowth and investment) and a reduced form model. His findings arestriking: the direct and indirect effects of gender inequality in educationalattainment account for 0.95 percentage points of the 2.5 percentage pointgap in growth rates between South Asia and East Asia, 0.56 percentagepoints of the 3.3 percentage point gap between sub-Saharan Africa and EastAsia, and 0.85 percentage points of the 1.9 percentage point gap betweenthe Middle East/North Africa and East Asia.
What is the intuition behind these results? Klasen (2002) argues thatassuming that boys and girls have a similar distribution of innate abilities,
220 INDIA EMERGING • VEENA JHA
gender inequality in education implies that less able boys will have access toeducation. If human capital is some combination of innate ability andeducation, this means that the overall level of human capital in society willbe lower than it would be in the absence of gender inequality in education,and overall economic growth rates would suffer. A simulation assuming a 70-30 per cent male-female split of those children receiving education—asopposed to a 50-50 per cent split—leads to a decline of 12 per cent in averagehuman capital, assuming innate ability is normally distributed and assumingthat 50 per cent of all children go to school. Using the estimated relationshipbetween human capital and GDP growth from a well-known panel studyyields a 0.3 percentage point decline in annual growth (Klasen, 2002)through gender inequality.
Abu-Ghaida and Klasen (2004) project the costs of missing the UnitedNation's Millennium Development Goals (MDGs) in gender equity ongrowth for 25 countries. They find that more unequal countries wouldaverage 0.4 per cent per year higher growth during 2005-2015, if theyachieved the MDG gender equity goals in 2005.
Gender PGender PGender PGender PGender Parity in Employment and Grarity in Employment and Grarity in Employment and Grarity in Employment and Grarity in Employment and Growthowthowthowthowth
Inequalities in opportunities are not limited to education. Numerousstudies document large gaps in wages or hourly earnings between men andwomen, even after accounting for education and other forms of humancapital. The allocation of talent and entrepreneurial skills to productiveactivities is a powerful source of growth; conversely, if this talent isdedicated to rent-seeking behaviour, long-run growth will suffer (Murphy etal., 2001). An analogous argument can be applied to occupationalsegregation by gender: to the extent that the concentration of women inlow productivity occupations is non-voluntary, the misallocation of talentmay have large growth costs via efficiency losses.
Surprisingly, few studies have looked at the impact of occupationalsegregation on growth rates. Tzannatos (1999) using data from the 1980sfrom 11 Latin American and Caribbean countries, calculates the impact ofthe elimination of occupational differentials within industries on women'swages, men's wages and output. While men's wages fall by between 6 and13 per cent, women's wages rise by significantly more: from 24 to 96 per

221TRICKLING UP GROWTH THROUGH GENDER PARITY
cent. Output increases range from 2 to 9 per cent of GDP (Tzannatos,1999). Tzannatos (1999: 559) interprets these impacts as what ‘can happenin the long run when: a) women and men are equally endowed with humancapital; b) there is no employer discrimination; c) family constraints are nomore binding upon women than men; and d) the gender specific effects ofsocial norms and other institutional factors have withered away.’
Gender wage gaps per se have an ambiguous relationship with growthrates. On the one hand, one analysis based on panel data found that genderwage inequality in export-oriented middle income countries boostseconomic growth presumably via its effect on firm profits and investment(Seguino, 2000a). On the other hand, greater wage inequality may beassociated with lower aggregate saving in these countries, which is likely tohamper long-run growth rates (Seguino and Floro, 2003). Both these resultsshould be viewed as tentative and preliminary, given that the robustness ofthese results has not been tested with other model specifications and alarger sample of countries.
WWWWWomen's Agency and Socioeconomic Vomen's Agency and Socioeconomic Vomen's Agency and Socioeconomic Vomen's Agency and Socioeconomic Vomen's Agency and Socioeconomic Variablesariablesariablesariablesariables
Apart from the studies linking gender inequality to economic growth,there are a large number of studies that link gender inequality in educationto fertility and child mortality (e.g., Murthi et al., 1995; Summers, 1994;King and Hill, 1995). For example, Summers (1994) shows that femaleswith more than seven years of education have, on average, fewer (two)children in Africa than women with no education. King and Hill (1995)find a similar effect of female schooling on fertility. Over and above thisdirect effect, lower gender inequality in enrollments has an additionalnegative effect on the fertility rate. Countries with a female-maleenrollment ratio of less than 0.42 have, on average, 0.5 more children thancountries where the enrollment ratio is larger than 0.42 (in addition to thedirect impact of female enrollment on fertility). Similar linkages have beenfound between gender inequality in education and child mortality (Murthiet al., 1995; Summers, 1994). Thus, reduced gender bias in educationfurthers two very important development goals, namely reduced fertility andchild mortality, quite apart from its impact on economic growth (Sen, 1999).
The findings in the studies cited above are corroborated byinternational as well as national studies, and they demonstrate the
222 INDIA EMERGING • VEENA JHA
powerful role of women's agency and women's educational empowermentin reducing desired family size, fertility, population growth, child morbidity,child mortality and gender bias in child mortality, while at the same timeshowing that men's education mattered comparatively less to theseimportant social outcomes.
Sometimes referred to as the ‘good mother hypothesis’, the argumentis that income under women's control is more likely to be spent on child’swell-being than income under men's control. Female influence overhousehold consumption is of course directly linked to women's bargainingpower, proxied by various measures such as education, assets at marriage,spheres of decision-making, divorce law and relative status within thehousehold and society (Quisumbing, 2003). A number of studies showpositive correlations between women's bargaining power and children'seducation and health (Murthi et al., 1995; Quisumbing, 2003; Quisumbingand Maluccio, 2003; Schultz, 2001; World Bank, 2001). That womeninvest a greater proportion of their resources in the household is perhapsnot surprising, as women's spheres of influence do not often extend beyondthe household (World Bank, 2005).
Another link between gender equality and growth may be viadifferential marginal propensities to save, although the empirical evidenceon this score is relatively weak. Seguino and Floro (2003) and Stotsky(1997) note that women may have greater incentives to save than men,reflecting: i) women's role as ‘principal home builders’ (Stotsky's term); ii)the fact that men may have greater recourse to social insurance, thusreducing the need to save in order to smooth consumption expenditures;and iii) women's stronger bequest motives and intergenerational altruism.Seguino and Floro (2003), in a cross-country panel study of semi-industrialised countries, find that an increase in women's wage sharerelative to men is associated with increase in the domestic savings rate.
The positive externalities of gender norms also come up in studies ofcorruption and growth. Behavioural studies show that women tend to bemore trustworthy and public-spirited than men; higher proportions ofwomen in government or the labour force are negatively correlated withcorruption (Dollar et al., 2001; Swamy et al., 2001). Gender distribution ofincome also matters for aggregate savings. Using panel data for a set of semi-
223TRICKLING UP GROWTH THROUGH GENDER PARITY
industrialised countries between 1975 and 1995, Seguino and Floro (2003)test whether macroeconomic measures of female bargaining power—women's share of the wage bill and the gap between male and femaleeducational attainment—have an effect on aggregate savings. The hypothesisis that women differ from men in their propensities to save because of theirdiffering institutional positions: in the labour market, in the household, inthe community and in their access to state-provided social insurance. Theyfind that an increase in women's share of the wage bill is positively correlatedwith aggregate savings, though the gender education gap variable does notperform as consistently.
Lower fertility is also correlated with higher female labour forceparticipation and gender wage equity (Galor and Weil, 1996; World Bank,2001). The familiar logic is that as the opportunity costs of women's timeincreases, parents opt for more child quality over quantity. With womendoing most of the childcare, it is essential that the opportunity costs ofwomen's time increase relative to men's, as increases in male incomes willsimply raise the demand for children.
In sum, the evidence linking greater gender parity to growth is mixed.There are several cross-country growth regression studies that suggest thatgreater equality in access to education may pay growth dividends, butgrowth regressions suffer from several important weaknesses. Studies onthe effects of wage gaps on growth are more convincing. Studies need to becognisant of cultural aspects of gender inequalities. While the effects ofgender parity on growth is mixed, there is some literature on the indirecteffects of gender equality on growth that are transmitted via the impact ofgender equality on poverty alleviation.
In the context of the Indian experience, what is of more relevance isthe effect of gender parity on poverty alleviation. Given the increasinginequality associated with economic growth (see Introduction), it is ofutmost importance to examine the agencies that reduce poverty. Thischapter through statistical work and the underlying economic intuitiondelves into the relationship between poverty and gender parity. Howeverbefore doing so, it is worthwhile getting a state of play, i.e., what has beenthe result of India's growth experience on gender parity.

224 INDIA EMERGING • VEENA JHA
III
India's Growth Experience and Gender Equality
Overall labour participation levels in the Indian labour force have beenrelatively stable since the 1970s to about 1990, for both men and women,implying that employment rates were growing at the same level as thework- force. The growth effects on female labour force have been felt muchmore strongly from 2001-2007. Gender indicators have generally beenassumed to be not sensitive to economic growth, except in the organisedlabour sector as shown below. In fact, as the scatter in Figure 4.1 and Table4.1 suggests, female labour force participation rates increased significantlybut in the later periods of high growth.
Figure 4.1
Economic Growth and Female Labour Force Participation
Again as in the organised sector (see below), it can be observed fromFigure 4.1, that at rates of economic growth over 5 per cent, female labourforce participation responded positively to economic growth.
The employment situation in India, as revealed by the study of availabledata, suggests the presence of discrimination against women at all levels.This disparity is a source of some concern, for high labour participation ratesfor women have been shown to raise nutrition levels for their children, lowermortality rates and raise sex ratios by combating traditional male biases(Agnihotri and Neetha, 1997). Many have argued that the labour
Female LFPR
0 10 20 30 40 50
12
10
8
6
4
2
0
Eco
nom
ic g
row
th r
ate

225TRICKLING UP GROWTH THROUGH GENDER PARITY
participation of women is one of the most important indicators of women'sempowerment, access to resources and decision-making ability, and thusmust be made a central focus of policy. The score for female LFPR remainedstatic at 42 per cent and went down during periods of high growth, i.e., in2007/08.
However, as shown by Figure 4.1 and Table 4.1, the overall femaleparticipation rate increased at higher rates of growth. This shows theimportance of focussing policies on maintaining high rates of economicgrowth so that the organic changes accompanying growth can improve thelabour force participation rates for women.
Table 4.1
Economic Growth and Gender Indicators
Year Growth (Real Life Expectancy Maternal Literacy Women in Women inGDP at at Birth Mortality Rate Labour Parliament
Factor Cost) (Years) Rate per 15 Years Force (% of Seats(Financial 100,000 & Above (Rate % Occupied
Year Figures) Live (%age) of Total) by Women)
1990 5.3 59 340 29 34 7.91991 1.4 59.1 340 29 25.6 91992 5.4 59.3 550 34 25.6 81993 5.7 59.3 550 40 26 71994 6.4 59.9 550 40 29 71995 7.3 60.4 460 241996 8 60.7 570 36 31 81997 4.3 61.4 570 36.1 31 7.31998 6.7 61.8 570 37.7 31 7.31999 6.4 62.9 570 39.4 29 8.32000 4.4 63.3 410 43.5 41.8 8.92001 5.8 63.3 410 44.5 42 8.82002 3.8 63.8 540 45.4 42.1 8.92003 8.5 64 540 46.4 42.2 9.32004 7.5 64.4 540 46.4 42.4 9.32005 9.4 65 540 47.8 42.5 9.32006 9.6 65.3 540 47.8 34.0 9.22007-08 8.4 65.3 540 47.8 34.0 9.0
Sources: Human Development Report, various issues, Economic Survey of India, various issues, Ministryof Labour, Annual Reports.
But data on LFPR masks inherent inequalities. John and Lalita (1995)have effectively shown that LFPRs are additionally affected by caste andcommunal differences that interact with gender to influence employment

226 INDIA EMERGING • VEENA JHA
status. Dalit males and females are more likely to be concentrated in casualemployment. Dalit women are less likely than other groups to be involvedexclusively in domestic work, and thus actually have a higher LFPR thanother groups of women, though their employment may be concentrated inlow-paying casual labour. The gap between the LFPRs of Muslim womenand men was also found to be much higher than average, as was the casewith upper caste Hindu families. Such variation across groups indicatesthat the relationship between LFPRs and income must not be assumed, forno easy categorisation of this relationship exists. Intervention measures toaid any of these groups must take into account the particular characteristicsof their employment—such as heavy involvement of the Dalit communityin casual labour—to most effectively meet their needs. A greater detail ofgroup-differentiated data is, thus, critically needed.
Table 4.2
Labour Force Participation Rates
Year Rural Urban
Male Female Male Female
1977-78 63.7 30.5 60.1 17.11983 62.6 29.1 60.3 14.81987-88 61.4 29.2 59.6 14.61989-90 54.6 25.4 52.4 12.91990-91 54.9 24.3 53.2 13July-Dec. 1991 54.8 24.7 53.5 12.71992 55 25.3 52.6 13.4Jan-June 1993 61.7 27.9 59 13.31993-94 63 27.2 60.1 14.51994-95 55.3 23.8 53.4 11.7July 1995-June 1996a 55 23.6 54.4 11.1Jan-Dec 1997a 55 22.4 53.7 11.7Jan-June 1998a 54.3 21.2 53.4 10.81999-2000 53.3 23.5 53.9 12.6July 2000-June 2001* 54.08 22.25 58.8 12.05July 2001-June 2002* 53.8 24.6 57.1 11.5July-Dec. 2002* 54.7 21.6 55.16 12.6
Source: Indiastat.com
Socioeconomic factors are also important in determining women'sparticipation rate. Studies have found that a complex situation in which aU-curve of women's employment by education levels is caused by a mixtureof economic and cultural factors (Olsen and Mehta, 2005). Thus, labour
227TRICKLING UP GROWTH THROUGH GENDER PARITY
force participation is higher among illiterates than among the literatewomen. However, as women reach higher levels of education, theirparticipation in the labour force increases. The U-curve was explored insome detail using both descriptive and regression statistics. Rural/urban,religious and state differences in patterns of labour force participation wereconsidered. The typical scenario at the bottom of the U-curve was amongmiddle-class educated women. It was noted that the standard norms forhousewives are adapted for poor women, who often have a double or tripleburden of work, and for rich women who can employ others to assist themwhilst still being the manager of a household. The U-curve may explainthe criticality of higher growth rates which offer better employmentopportunities to women and hence increases the labour force participationof women. In fact, part of the rationale of the U-curve may also beexplained by the wage differentials which typically tends to be lower for theilliterate and at higher levels of qualification.
The most prominent feature that emerges from the study of LFPR offemales is the changing role of women in the micro and small enterprises(MSEs) in the post-reform period. There is now more active participation offemale workers even in the non-traditional sectors, and a more evendistribution of them both over different industrial activity groups andacross regions. However, the absolute numbers of female workers isincreasing in the urban areas but decreasing in the rural areas. The shareof hired workers within female workers has also increased marginally. Amajor development has been the drastic increase in the share of part-timeworkers within female workers at the cost of full-time female workers.There is thus a prominent trend towards change in the status of femaleworkers from fulltime to part-time which is a reflection of outrightcasualisation. This has serious policy implication in the sense that itbrings out the vulnerability of women in the labour market. Industrialactivity level study reveals that the share of women is increasing in the socalled non-traditional sectors like machinery & equipment etc., anddecreasing in the traditional sectors like tobacco & beverages, textiles, etc.,thereby making the distribution more even (indiastat.com).
Regional study shows that the southern states top the list regardingshare of women in total employment, while the shares are low in thenorthern and western states. Here also, the regional disparity is decreasing

228 INDIA EMERGING • VEENA JHA
over time. It is also observed that factors like incidence of poverty, femaleliteracy levels, female work participation rate and per capita state nationalproduct of the states are important factors affecting the magnitude andshare of women employment in the MSEs (indiastat.com).
Economic GrEconomic GrEconomic GrEconomic GrEconomic Growth and Fowth and Fowth and Fowth and Fowth and Female Employmentemale Employmentemale Employmentemale Employmentemale Employmentin the Orin the Orin the Orin the Orin the Organised Sectorganised Sectorganised Sectorganised Sectorganised Sector
Perhaps the most dramatic effect of economic growth on femaleemployment can be observed in the organised sector. While the organisedsector only accounts for 4 per cent of female labour force versus 10 per centfor men, this sector also has the highest employment growth rates forwomen: 3.6 per cent; for men: 2.5 per cent. High growth rates have,therefore, translated to more employment for women. Within this, 62 percent are employed within the public sector, making them more vulnerableto the effects of disinvestment in state-owned enterprises. What is alsoimportant to observe is that most of the increase in female employmenthas taken place at growth rates well above 5 per cent. For the organisedsector, there is a direct correlation between the increase in the economicgrowth rate and female employment: the higher the growth rate the greaterthe share of female employment.
Figure 4.2
Economic Growth and Female Labour Participationin the Organised Sector
Source: Indiastat.com
12
10
6
4
00 5 10
Economic growth
Lab
our
forc
e pa
rtic
ipat
ion
rat
es
LFP

229TRICKLING UP GROWTH THROUGH GENDER PARITY
India's overall index score on women's advancement (reflecting largelyorganised sector employment) decreased marginally to 37.8 in 2009 from39.4 in 2008. This was despite a slight increase in the number of womenper 100 men considering themselves to be in the managerial positions(rising from 9 women per 100 men in 2008 to 12 women per 100 men in2009). The drop was driven by the decrease in the proportion of women tomen perceiving themselves to be earning above median income. Thenumber of women per men dropped from 32 women per 100 men in 2008to 22 women per 100 men in 2009.2
Besley et al. (2004) provide an Indian case study that considers thecross-regional effects of gender gaps in access to managerial positions andgeneral employment on per capita income between 1961 and 1991. Theyfind that a 10 per cent increase in the female to male ratio of managersraises non-agricultural output by 2 per cent; a 10 per cent increase in thefemale share of the labour force raises overall output by 8 per cent.
Economic GrEconomic GrEconomic GrEconomic GrEconomic Growth and Fowth and Fowth and Fowth and Fowth and Female Employment in Agriculturemale Employment in Agriculturemale Employment in Agriculturemale Employment in Agriculturemale Employment in Agricultureeeee
The largest sector in the Indian economy in terms of employment isagriculture. Dalit and tribal women account for half of female agriculturallabourers and almost all of them are landless. Studies show a shift from farmto non-farm employment in the agricultural sector among men, but notamong women. This is to the disadvantage of women who: (a) lost out onhigher wages in the non-farm sector, and (b) bear the brunt of the stagnationin the agricultural farm sector (Papola, 1999). It also points to their relativelylower mobility within the rural labour market. Figure 4.3 shows that femalerural employment was generally found to be unresponsive to growth rates,even declining with higher growth rates. Growth rates (in employment andoverall) in the agricultural sector have been found to be stagnating averagingat around 2 per cent for the entire period from 1991-2007. This is the periodcovered by the scatter in Figure 4.3.
2. http://www.adb.org/documents/events/2009/poverty-social-development/growing-disparity-in-india-Kundu-paper.pdf
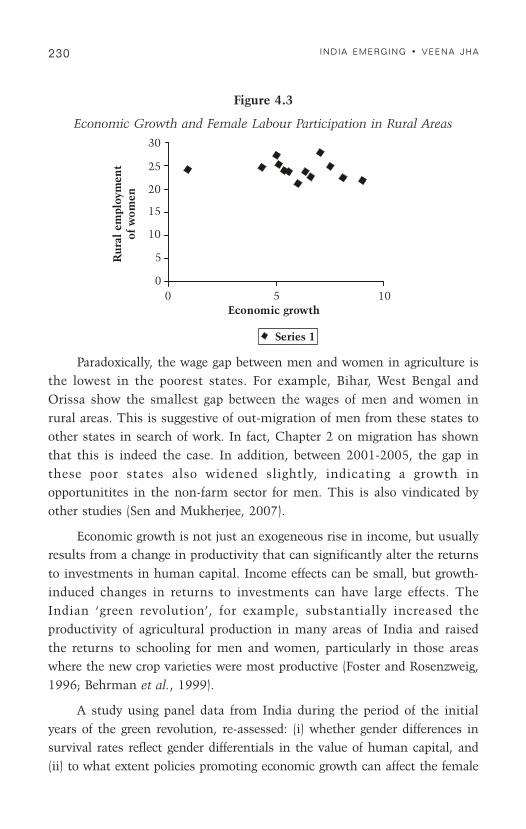
230 INDIA EMERGING • VEENA JHA
Figure 4.3
Economic Growth and Female Labour Participation in Rural Areas
Paradoxically, the wage gap between men and women in agriculture isthe lowest in the poorest states. For example, Bihar, West Bengal andOrissa show the smallest gap between the wages of men and women inrural areas. This is suggestive of out-migration of men from these states toother states in search of work. In fact, Chapter 2 on migration has shownthat this is indeed the case. In addition, between 2001-2005, the gap inthese poor states also widened slightly, indicating a growth inopportunitites in the non-farm sector for men. This is also vindicated byother studies (Sen and Mukherjee, 2007).
Economic growth is not just an exogeneous rise in income, but usuallyresults from a change in productivity that can significantly alter the returnsto investments in human capital. Income effects can be small, but growth-induced changes in returns to investments can have large effects. TheIndian ‘green revolution’, for example, substantially increased theproductivity of agricultural production in many areas of India and raisedthe returns to schooling for men and women, particularly in those areaswhere the new crop varieties were most productive (Foster and Rosenzweig,1996; Behrman et al., 1999).
A study using panel data from India during the period of the initialyears of the green revolution, re-assessed: (i) whether gender differences insurvival rates reflect gender differentials in the value of human capital, and(ii) to what extent policies promoting economic growth can affect the female
30
25
20
15
10
5
00 5 10
Economic growth
Series 1
Rur
al e
mpl
oym
ent
of w
omen
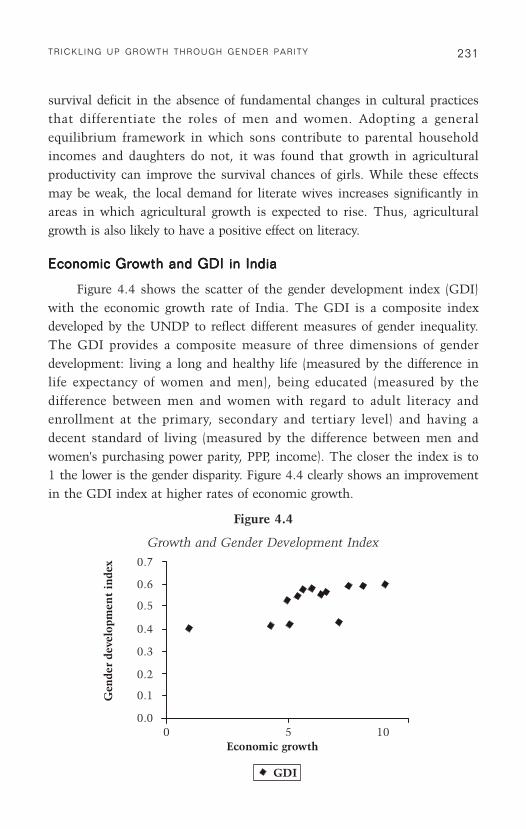
231TRICKLING UP GROWTH THROUGH GENDER PARITY
survival deficit in the absence of fundamental changes in cultural practicesthat differentiate the roles of men and women. Adopting a generalequilibrium framework in which sons contribute to parental householdincomes and daughters do not, it was found that growth in agriculturalproductivity can improve the survival chances of girls. While these effectsmay be weak, the local demand for literate wives increases significantly inareas in which agricultural growth is expected to rise. Thus, agriculturalgrowth is also likely to have a positive effect on literacy.
Economic Economic Economic Economic Economic GGGGGrrrrrowth and GDI in Indiaowth and GDI in Indiaowth and GDI in Indiaowth and GDI in Indiaowth and GDI in India
Figure 4.4 shows the scatter of the gender development index (GDI)with the economic growth rate of India. The GDI is a composite indexdeveloped by the UNDP to reflect different measures of gender inequality.The GDI provides a composite measure of three dimensions of genderdevelopment: living a long and healthy life (measured by the difference inlife expectancy of women and men), being educated (measured by thedifference between men and women with regard to adult literacy andenrollment at the primary, secondary and tertiary level) and having adecent standard of living (measured by the difference between men andwomen's purchasing power parity, PPP, income). The closer the index is to1 the lower is the gender disparity. Figure 4.4 clearly shows an improvementin the GDI index at higher rates of economic growth.
Figure 4.4
Growth and Gender Development Index
0 5 10Economic growth
GDI
Gen
der
deve
lopm
ent
inde
x 0.7
0.6
0.5
0.4
0.3
0.2
0.1
0.0

232 INDIA EMERGING • VEENA JHA
From Figure 4.4 it is clear that higher growth rates would generallytranslate to greater gender equality. Greater gender equality should in turnlead to poverty alleviation. While examining all these factors is beyond thescope of this chapter, empirical work on India for the high growth period isscarce. This chapter tries to examine some of the correlations betweengender equity and growth, narrowing on factors which matter most from apolicy point of view.
IV
Examining Correlations betweenGender Equality and Growth
To examine the complex correlations between economic growth andgender equality in India, a number of multiple regressions were carried out.These showed interesting correlations between different variables andhelped narrow the policy variables. Most of the data on gender indicatorswas available only till 2005, but as India's growth story is of more recentorigin, i.e., post-2005, the data was extrapolated to 2008. As is shown inTable 4.3 and from the multiple regressions below, social indicators for
Table 4.3
Definition of Variables
Var Name
PSDP Per capita state domestic product at 1993 constant prices
FeIN Number of females in unorganised sector
IHe Index of health of women
IEd Index of education of women
IEr Index of access of economic resources to women
Ca Capital asset
Abs(WD) Absolute value of wage difference between women and men
Pov Percentage of people below poverty line
S1 Composite index-1 (with: IHe, IEd)
F1 Composite index-1 (with: IHe, IEd and IEr)
*** Significant at 1 per cent level
** Significant at 5 per cent level
* Significant at 10 per cent level
NB Parenthesis contain the estimated standard error of estimates
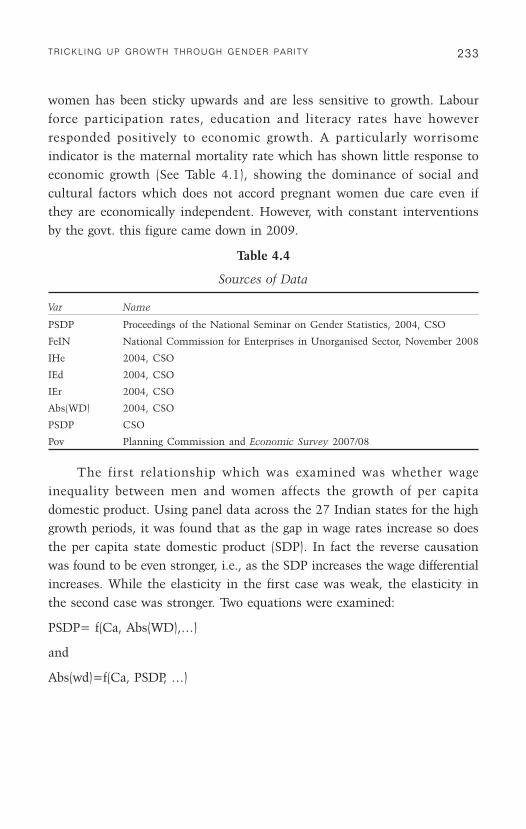
233TRICKLING UP GROWTH THROUGH GENDER PARITY
women has been sticky upwards and are less sensitive to growth. Labourforce participation rates, education and literacy rates have howeverresponded positively to economic growth. A particularly worrisomeindicator is the maternal mortality rate which has shown little response toeconomic growth (See Table 4.1), showing the dominance of social andcultural factors which does not accord pregnant women due care even ifthey are economically independent. However, with constant interventionsby the govt. this figure came down in 2009.
Table 4.4
Sources of Data
Var Name
PSDP Proceedings of the National Seminar on Gender Statistics, 2004, CSO
FeIN National Commission for Enterprises in Unorganised Sector, November 2008
IHe 2004, CSO
IEd 2004, CSO
IEr 2004, CSO
Abs(WD) 2004, CSO
PSDP CSO
Pov Planning Commission and Economic Survey 2007/08
The first relationship which was examined was whether wageinequality between men and women affects the growth of per capitadomestic product. Using panel data across the 27 Indian states for the highgrowth periods, it was found that as the gap in wage rates increase so doesthe per capita state domestic product (SDP). In fact the reverse causationwas found to be even stronger, i.e., as the SDP increases the wage differentialincreases. While the elasticity in the first case was weak, the elasticity inthe second case was stronger. Two equations were examined:
PSDP= f(Ca, Abs(WD),…)
and
Abs(wd)=f(Ca, PSDP, …)

234 INDIA EMERGING • VEENA JHA
Table 4.5
Regression Results
Dependent Var: Log (PSDP)
Explanatory Variables
Log(Ca) 0.008(0.048)
Log{Abs(WD)} 0.027**(0.011)
F (2,15) 3.17*
R-square 0.29
No. of observations 18
In the first scenario a relatively weaker correlation was observed thanin the second scenario. The R-square was also relatively weak pointing to anumber of missed variables. In the second case, the R-square grew strongerand the correlation coefficient more significant, pointing to the fact thathigher growth rates may actually exacerbate the wage differential betweenmen and women.
Table 4.6
**Reverse Regression
Dependent Var: Log{Abs(WD)}
Explanatory Variables
Log(Ca) 0.038(0.041)
Log (PSDP) 0.650***(0.200)
F (2,15) 6.73***
R-square 0.47
No. of observations 18
This ties up with earlier empirical findings (cited above) on theambiguous role of wage inequality on economic growth. The intuitionbehind the second stronger result lies in the fact that states whichexperienced high rates of growth particularly in the second half of the lastdecade were those which had high rates of growth in services and exportsectors. Hence, higher rates of growth increased the disparity in wagesbetween men and women.

235TRICKLING UP GROWTH THROUGH GENDER PARITY
A simple explanation for this phenomenon can be found by looking atthe data on wage differentials in agricultural activities in India acrossstates. The overall wage differentials in a state would normally beinfluenced more than proportionately by the wage differential inagriculture, as agriculture still accounts for a large share of employmentacross India. Paradoxically the poorer the state, the lower the wagedifference between men and women in agriculture, perhaps because of thesubstantial out-migration that takes place from poorer states such as Biharto richer states such as Maharashtra and Karnataka. In fact instead oftaking the absolute wage differential, if the wage differential is indexed, aweak inverse relationship with per capita SDP is observed.
Table 4.7
Wage Differentials in Agricultural Occupations between States
States February 2005
Men Women
Andhra Pradesh 46 37.92Assam 60.4 52Bihar 52.69 50.39Gujarat 53.64 52Haryana 87.57 73.83Himachal Pradesh @ -Jammu & Kashmir @ -Karnataka 52.84 41.13Kerala @ 101.65Madhya Pradesh 45.71 @Maharashtra 63.05 40.43Manipur 60 55Meghalaya @ @Orissa 49.17 46.33Punjab 87.83 @Rajasthan @ @Tamil Nadu 67.35 42.46Tripura 70 -Uttar Pradesh 56.78 51.5West Bengal 53.72 50.17India 60.46 50.97
Note: @ - No information provided.
Source: Indiastat.com
Wage differentials have been extensively documented in all sectors ofthe Indian economy. Within the workforce, two kinds of wage differentials

236 INDIA EMERGING • VEENA JHA
have been found to exist. In the informal sector—where most women areemployed—there is evidence of women directly being paid lower wagesthan men, especially in the agricultural labour sector and the urbaninformal labour sectors where little effective legislation exists as adisincentive for this practice. In the organised sector, where equalrenumeration laws are more directly enforceable, pure wage discrimination(differential pay for the same job) has not been found to exist. However,differential levels of education and differential returns to that educationimplies that women are usually less skilled than men and thus can attainonly lower level jobs even within the organised sector, leading to a highwage differential.
FeIN=F(PCSDP, …)
In fact the correlation between economic growth across sectors andinformal sector employment of women has been found to be negative. Thisis contrary to the findings of the informal sector in general, where informalemployment rises with growth in income. The simple explanation for thiscan be found in the increase in male non-agricultural employment over thehigh growth period and no commensurate increase in female non-agricultural employment. Part of the explanation may also lie in the U-curve, i.e., as the family becomes richer women devote their time tohousework. The elasticity with respect to growth in SDP and informalemployment amongst women is significantly negative.
Table 4.8
Regression Results
Dependent Variable: Log(FeIN)
Explanatory Variables
Log (PSDP) -2.23***
(0.729)
F (1,30) 9.37***
R-square 0.23
No. of observations 32

237TRICKLING UP GROWTH THROUGH GENDER PARITY
Table 4.9
Regression Results
Explanatory Variables
Log(Ca) 0.059(0.03)
Log(IHe) 0.46(0.467)
Log(IEd) 1.59**(0.64)
R-square 0.69
F (3,13) 10.10***
No. of observations 17
Education has been found to greatly influence wage differentials. Studiesfound that the female-male wage ratio in urban India was 0.59 for femaleilliterates and 0.82 for literates (Deshpande and Depshpande, 1992). Anotherstudy by Kingdom et al., however, found that even after controlling forgender, only 22 per cent of the gap in wages could be explained by the lack offemale education—78 per cent of the wage gap, thus, is due to differentialreturns to education. Barriers to education and employment of women mustbe studied, given that differential rates of return on education brings the levelof direct economic return of female education into question. It must also bekept in mind that different caste, religious and income groups will havewidely varying incentives to either educate, or conversely not educate, theirdaughters as opposed to their sons.
V
Examining Gender Parity in Education andHealth with Growth
A large body of microeconomic evidence shows that increases inwomen's education generally lead to increases in their labour forceparticipation as well as in their earnings. Educated women's greaterparticipation in labour market, work and their higher earnings are thoughtto be good for their own status (economic models say ‘bargaining power’)within the household and are good for their children because it appears thata greater proportion of women's income than men's is spent on child goods.

238 INDIA EMERGING • VEENA JHA
On the down side, it may be thought that educated women's greater labourforce participation takes them away from their children for longer periodsof time (than is the case with uneducated or less educated women) and thismay disadvantage educated women's children through neglect. At presentthis is a relatively unresearched issue. However, limited evidence suggeststhat children whose mothers work have just as good or better educationaloutcomes than children whose mothers do not work (Olsen and Mehta,2005).
How does economic growth affect education and health of women?Given the critical role of education and health in female LFPR, it isexpected that India's growth experience should have had a positive effect onboth these variables. Table 4.8 presents the regression results of per capitaSDP with the index of health of women and the index of education ofwomen. The index of education attainment compiled by the CSO includesthe female literacy rate and the percentage of girls between 6 and 17attending school. The index of nutrition and health includes a measure ofthe percentage of women with anaemia, the percentage of women withbody mass index below 18.5 and the female infant mortality rate (CSO,2004). The result indicates that the higher is the education for woman, thehigher will be the per capita income. This correlation is significant at the 5per cent level. However, the impact of the health index on incomes is lesssignificant. On the other hand, the correlation between education andhealth is very large, showing that educated women are more likely to behealthy than otherwise. From Table 4.10, it can be seen that thiscorrelation is 0.76, i.e., over three-quarters of the women who are educatedare also likely to be healthy. This shows that there is a high degree ofmulticollinearity between the health index and the education index forwomen in India. Multicollinearity could also explain in part the lack oftraction between the health index of women and incomes.
Table 4.10
Correlation Results
Variable Log(IHe) Log(IEd)
Log(IHe) 1.00Log(IEd) 0.76 1.00

239TRICKLING UP GROWTH THROUGH GENDER PARITY
In order to address the problem of multicollinearity, a compositeindex that can represent the impact of health and education wasconstructed. The eigenvalues that represent the composite component ofhealth and education are presented in Table 4.11. The eigenvalues reflectthe spread of the composite index. The first component was selected andthis composite index is called S1 which is the predicted composite indexwith log of health and log of education. Table 4.12 presents the regressionof log of per capita SDP on S1. The result indicates that the estimatedparameter of the composite index is positively significant. It reflects asituation where it could be said that the improvement of education offemale or/and their health should improve the per capita income. In otherwords, there is a positive significant impact of both health and educationon per capita SDP.
Table 4.11
Composite Component with Log(IHe), Log(IEd)Principle Component (Eigenvalues)
Variable Eigenvalues
1st component 1.76
2nd component 0.23
Principle Component (Eigenvectors)
Variable Eigenvalues
Log(IHe) 0.707
Log(IEd) 0.707
Table 4.12
Regression Results
Explanatory Variables
Log(Ca) 0.053(0.032)
S1 0.293***(0.054)
R-square 0.68
F (2,14) 15.17***
No. of observations 17
240 INDIA EMERGING • VEENA JHA
Thus as the health and education index of women improves, the percapita SDP goes up. The logical reasoning behind this correlation has to dowith the pattern of India's growth rate. India has seen a service-led growthwhich has shown increasing returns to education. Thus, states with higherlevels of literacy and particularly higher tertiary education for womenwould also be states which are growing relatively rapidly. On the otherhand, the low growth states have a higher participation of women inagriculture.
National income is growing, as is the urban organised sector. Femaleliteracy and health care indicators show vast improvements in the late1990s and the rising involvement of NGOs is raising the number ofsuccessful community-based programmes in social service sectors. Thenext decade, however, will be critical in terms of creating policy that istailored to the needs of specific communities in order to be most effectivein terms of delivering on the universal education objective. To attain suchpolicies with regards to gender and development, it is critical to understandthe gendered impact of economic policies and social policies. Thecorrelations above show the importance of education of women ingenerating the right growth impulses in the Indian economy.
VI
Gender and Poverty
While the effects of improved female health and education oneconomic growth has been shown to be positive, of greater importance arethe poverty-related outcomes. Though the measurement of poverty as apaucity of sufficient income has traditionally dominated academicthinking, discourses on the gendered experience of poverty seek to widenthis perspective. Though hard to empirically define and analyse, there existspecific processes and indicators—intra-household processes and incidencesof female headship in households, in particular—that indicate that menand women experience poverty differently, and use different methods tocope with that experience. Overall trends in poverty depend on the methodof analysis being used.
But as was shown above in the case of economic growth and genderinequality indicators, not all indicators of gender inequality would impact

241TRICKLING UP GROWTH THROUGH GENDER PARITY
significantly on poverty reduction. Three variables which could beimportant for gender development aspects could include health, educationand female labour force participation rates as shown above. The first twovariables were selected because it was found earlier that the income of thestate was particularly sensitive to these variables. Access to economicresources is another variable which has been introduced over here, as wageinequality was not found to be very sensitive to economic growth or percapita incomes. Access to economic resources reflects female labour forceparticipation rates over the age of 15 (CSO, 2004).
Table 4.13 presents the correlation between log of these threevariables, index of education, health and LFPR. It can be seen that thecorrelation between LFPR with the other two variables is quite weak. Inaddition, as before, the correlation between education and health is large.The correlation raises the possibility that a woman who is healthy andeducated may nevertheless not participate as an economic agent in thelabour force. This is consistent with the U-curve hypothesis observed foreducated women in India. A composite index that can be related withgender, however, should include all these three aspects. This is particularlytrue as with higher rates of growth, female LFPRs were seen to rise (seeTable 4.1).
Table 4.14a presents the eigenvalues of three composite indices. Thefirst composite index is selected. The first-index eigenvalue is 1.83. Table4.14b presents the eigenvectors. The coefficient on education and health islarge relative to access to resources. Table 4.15 presents the regressionresult of log of poverty on the composite index for gender. The coefficient isnegative and significant. It reflects that as the gender indicators improvethe proportion of people, who are below poverty line, would decrease.
Table 4.13
Correlation Results
Variable
Log(IEr) 1.00
Log(IEd) -0.09 1.00
Log(IHe) -0.23 0.76 1.00

242 INDIA EMERGING • VEENA JHA
Table 4.14
Composite Component with Log(IHe), Log(IEd) & Log(IEr)a. Principle Component (Eigenvalues)
Eigenvalues
1st component 1.83
2nd component 0.94
3rd component 0.21
b. Principle Component (Eigenvectors)
Variable 1st Component
Log(IHe) 0.69
Log(IEd) 0.66
Log(IEr) -0.26
Table 4.15
Regression Results
Explanatory Variables
Log(Ca) -0.030(0.037)
F1 -0.280***(0.078)
R-square 0.42
F (2,18) 6.6***
No. of observations 21
Thus improving health, education and LFPR of women has a significanteffect on poverty reduction. While this is an overall picture, it is important tosee the vulnerable groups among poor women, as policy must address suchgroups specifically. It was noted earlier that women and men face poverty indifferent ways. An increasing burden of poverty is thought to affect womenmore than men. Women suffer from biases in intra-household nutrition andresource allocation and thus have to bear the brunt of the reduced availabilityof resources. In addition, women are often not in positions to influence howearned income is spent. It has already been argued that several factors—stagnation in the agricultural sector and the shift to non-farm employment,rising rural poverty, marginalisation of female workers in manufacturingsector etc.—are leading to an increasing burden of poverty that is pushing
243TRICKLING UP GROWTH THROUGH GENDER PARITY
many women and children into informal sectors of the economy andpossibly increasing levels of female child labour.
The FThe FThe FThe FThe Feminine Feminine Feminine Feminine Feminine Face of Extrace of Extrace of Extrace of Extrace of Extreme Peme Peme Peme Peme Poverty in Indiaoverty in Indiaoverty in Indiaoverty in Indiaoverty in India
Female-Headed Households
Women's experience of poverty can be further exacerbated in the caseof female-headed households (FHHs). Studies estimate that between 30-35per cent of households are exclusively female-headed. The relationshipbetween the number of FHHs and female poverty is hard to ascertain—onecannot say which has a causal effect on the other. Indeed a correlationcannot be assumed, and when and where there is a correlation, it dependson such factors as why the household is female-headed. What one canargue, however, is that in the case of economic hardship, women in FHHshave few options of support without an economically supportive family.The lack of fair property and inheritance laws, microcredit facilities,alimony payments for divorcees, or pension payments for widows makesthe situation of these women even more precarious (Swarup et al., 1994).More data on FHHs, their prevalence amongst different income, religious,and caste groups and explanations of their regional disparity is needed inorder to understand the relationship between FHHs and poverty.
A recent study, however does show that FHHs were likely to be lesspoor than male-headed households (MHHs) especially in the rural areas. Inurban India, FHHs were more likely to be poorer than MHHs. This differentialincreased with higher growth rates (Gangopadhyay and Wadhwa, 2003).However, another study for rural Orissa found that at different levels ofpoverty more FHHs rather than MHHs were likely to be poor. On the basisof primary data collected, the paper suggests that poverty and femaleheadship were strongly linked in rural Orissa. For example, 12 per cent ofpeople living in MHHs are poor as compared with 33 per cent of peopleliving in FHHs. Thus, female headship can be a better targetting indicatorfor poverty alleviation in rural Orissa. The results further suggest that theuse of resources are significantly different between the two types ofhouseholds. Labour force participation data indicate that female heads aremore likely to work in the market place than women who are spouses ofmale heads of household. The differences are large: on average 74 per cent

244 INDIA EMERGING • VEENA JHA
versus 54 per cent. The comparison of household expenditures indicatesthat, FHHs spend relatively less on higher quality food items such as meat,vegetables, milk and other dairy products. However, there is some evidencethat they spend less on personal consumption such as alcoholic beverages.Overall, the differences are pronounced between these households. Finally,the findings show that children in FHHs are disadvantaged both in terms ofaccess to social services and actual welfare outcomes (Ganesh-Kumar et al.,2004).
Widows in Modern India
Eight per cent of Indian women are widowed, compared to only 2 percent of Indian men. This numerical disparity is attributed to a higherincidence of remarriage amongst the men. The plight of an estimated 33million widows in India is one of the most neglected aspects of gender anddevelopment studies of India. Mortality rates have been estimated to be 86per cent higher among elderly widows than married women of the sameage. Chen and Drèze (1992) and Drèze and Sen (1995) highlight the plightof widows by identifying the following major concerns:
(a) Violation of the legal rights of widows, especially in terms ofproperty and inheritance rights.
(b) Widows are expected to stay in the husband's village and face socialisolation. They have limited freedom to remarry.
(c) Given the fact that most widows are elderly and that the labourmarket is already highly segmented, few employment opportunitiesexist for widows.
(d) Barred from employment, most widows additionally get littleeconomic support from their families/communities. There is littleevidence to show that joint families care for widows—most staywith unmarried children or as dependents on adult sons.
In rural India, the plight of widows highlights existing inequities inthe ownership of land and the lack of any gender focus to the government'sland reform initiatives. Though it is estimated that 20 per cent of ruralhouseholds in India are de facto female-headed, few women own the title totheir land, and even fewer actually exercise control over it. Given thatwomen, lacking the option to seek non-farm employment (especially as

245TRICKLING UP GROWTH THROUGH GENDER PARITY
widows), are even more dependent on agriculture than men, transferringownership of actual assets to women needs to be made a priority for anyfuture policy undertakings.
Gendered experiences of poverty also assert the fact that simplytransferring income to the people living in poverty will not change biases ininter- and intra-household resource allocation. Intervention programmesmust thus focus on the empowerment of women themselves and enablethem to gain decision-making power.
From the above discussions, it is clear that socioeconomic biases arestill prevalent in the Indian economy and society. Although efforts arebeing taken by the Government to cope with this issue, still it has beenfound that to a large extent women have limited means to seekempowerment, for seeking ways to with their deprivation. While genderinequalities have shown some sensitivity to higher growth rates, theeconomic status of women could improve significantly if education andspecially vocational training were to be the focus of gender empowermentprogrammes. As the regressions above show, this is the single mostimportant variable which can lead to positive income and poverty impacts.
Several gender-related issues have to be solved by education, therebyleading to better employment opportunities. Programmes linked withempowerment and employment of women are increasingly focussing on thequality of education which would pave the way for the upliftment ofwomen, economically and socially, in the long run.
VII
Conclusions and Options
This chapter has attempted to distill the state of knowledge about thelinks between gender equality, on the one hand, and poverty reduction andeconomic growth on the other in India. The relationships are far fromsimple, and our knowledge is far from complete. At the macro level, therehas been significant work done exploring the links between gender equalityand economic growth. The simple scatter plots presented in this chapterhint at a positive relationship, as do (somewhat) more sophisticated panelregressions. Yet there is abundant reason to be skeptical of these results:

246 INDIA EMERGING • VEENA JHA
one should never take simple correlations very seriously, and panelregressions are plagued by a number of shortcomings especially thedifficulty of establishing causality.
With regard to the macro-level links between gender equality andpoverty reduction, the macro correlations are stronger than those for genderequality and growth and more robust to different measures of genderequality. Here, not surprisingly given the easier applicability of the conceptof poverty at the micro (household) level, there is more micro researchbuttressing this link. Ample evidence suggests that greater gender equalityin resources such as education, health and access to employment(economic resources) can reduce the likelihood of a household being poor.
While female labour force participation has increased with growth,this increase has been concentrated at higher education levels. Thissuggests that as economic opportunities increase, educated women aremore likely to enter the work force. The policy variable that has emerged ascrucially important from the above analysis is education. Education is seento affect both health and access to economic resources.
For policy purposes two factors stand out in the case of India. Onethat high growth rates will lead to better gender indicators and reducegender inequality. Hence, it is first of all crucially important to maintainhigh rates of economic growth. To accelerate the trickle-down effects ofgrowth on poverty, education and particularly vocational education ofwomen should be targetted by government policy.
247TRICKLING UP GROWTH THROUGH GENDER PARITY
ReferencesAbu-Ghaida, Dina and Stephan Klasen (2004). “The Costs of Missing the Millennium
Development Goal on Gender Equity”, World Development 32: 1075-107.
Agnihotri, Indu and N. Neetha (2007). “Data on Indian Women”, in National Conference onAll India Democratic Women’s Association (8th: Kolkata), Organised by All IndiaDemocratic Women’s Association, November 1-4, CD-759.5a. pp.22-31.
Anker, R. (1998). Gender and Jobs: Sex Segregation of Occupations in the World.Geneva: ILO.
Barro, R. and J. Lee (1995). “International Measures of Educational Achievement”,American Economic Review 86: 218-23.
Barro, R. and X. Sala-i-Martin (1995). Economic Growth. New York: McGraw-Hill.
Barro, Robert J. (1991). “Economic Growth in a Cross Section Countries”, QuarterlyJournal of Economics 106: 407-43.
Barro, Robert J. and J.W. Lee (1994). “Sources of Economic Growth”, Carnegie-Rochester Conference Series on Public Policy 40: 1-46.
Behrman, Jere R., Andrew D. Foster, Mark R. Rosenzweig and Prem Vashishtha (1999).“Female Schooling, Home Teaching, and Economic Growth”, Journal of PoliticalEconomy, August.
Bergmann, Barbara (1974). “Occupational Segregation, Wages and Profits WhenEmployers Discriminate by Race or Sex”, Eastern Economic Journal 1(2): 103-10.
Berik, Gunseli, Yana van der Meulen Rodgers and Joseph E. Zveglich Jr. (2004). “DoesTrade Promote Gender Wage Equity?”, in William Milberg (ed.), Labor and theGlobalization of Production: Causes and Consequences of Industrial Upgrading.London: Palgrave Macmillan.
Berik, Günseli, Yana van der Meulen Rodgers and Joseph E. Zveglich Jr. (2004).“International Trade and Gender Wage Discrimination: Evidence from East Asia”,Review of Development Economics 8(2), May.
Besley, T., R. Burgess and B. Esteve Volart (2004). Operationalising Pro-Poor Growth:India Case Study. Mimeographed, DFID.
Birdsall, Nancy, David Ross and Richard Sabot (1995). “Inequality and GrowthReconsidered: Lessons from East Asia”, The World Bank Economic Review 9(3):477-508.
Braunstein, Elissa (2007). “The Efficiency of Gender Equity in Economic Growth:Neoclassical and Feminist Approaches”, GEM-IWG Working Paper 07-4. March. TheInternational Working Group on Gender, Macroeconomics, and InternationalEconomics Working Paper Series GEM-IWG. www.genderandmacro.org
Central Statistical Organisation (2004). Annual Report. Delhi.
Chen, M., and J.P. Drèze. (1992). “Widows and Well-Being in Rural North India”, WorkingPaper #40. Development Research Program, London School of Economics.
Deshpande, S. and L.K. Deshpande (1992). “New Economic Policy and FemaleEmployment”, Economic and Political Weekly 27 (14).
Dollar, D., R. Fisman and R. Gatti (2001). “Are Women Really the "Fairer" Sex? Corruptionand Women in Government”, Journal of Economic Behavior & Organization 46: 423-29.

248 INDIA EMERGING • VEENA JHA
Dollar, David and Roberta Gatti (1999). “Gender Inequality, Income and Growth: Are GoodTimes Good for Women?”, Policy Research Report on Gender and DevelopmentWorking Paper Series No. 1. Washington, D.C.: World Bank.
Drèze, J. and A. Sen (1995). India Economic Development and Social Opportunity. NewDelhi: Oxford University Press.
Foster, Andrew D. and Mark R. Rosenzweig (1996). “Technical Change and Human CapitalReturns and Investments: Evidence from the Green Revolution”, American EconomicReview, September.
Galor, Oded and David N. Weil (1996). “The Gender Gap, Fertility, and Growth”, AmericanEconomic Review 86(3): 374-87.
Ganesh-Kumar, A., Srijit Mishra and Manoj Panda (2004). “Employment Guarantee forRural India”, Economic and Political Weekly: 5359-61. 18 December.
Gangopadhyay, S. and W. Wadhwa (2003). Are Indian Female Headed Households MoreVulnerable to Poverty. India Development Foundation.
John, M. with K. Lalita (1995). Background Report on Gender Issues in India. Bridge:Brighton. Available at: http://www.ids.ac.uk/bridge/
Kessel, Kitty Van. (2004). Women's Empowerment and Health. http://www.carped.org/index.php/Reports-and-Studies/womens-empowerment-a-health.html
King, E. and A. Hill (1995). Women's Education in Development Countries. Baltimore:Johns Hopkins Press.
Klasen, Stephan (1999). “Does Gender Inequality Reduce Growth and Development:Evidence from Cross Country Regressions”, Policy Research Support on Genderand Development, Working Paper Series No. 7. The World Bank DevelopmentResearch Group/Poverty Reduction and Economic Management Network
————. (2002). “Low Schooling for Girls, Slower Growth for all? Cross-country Evidenceon the Effect of Gender Inequality in Education on Economic Development”, WorldBank Economic Review 16: 345-73.
Lipton, Michael and Martin Ravallion (1995). “Poverty and Policy”, in Jere Behrman andT.N. Srinivasan (eds.), Handbook of Development Economics. Volume 3.Amsterdam: North-Holland.
Murphy, Kevin M., Andrei Shleifer and Robert W. Vishny (2001). “The Allocation of Talent:Implications for Growth”, Quarterly Journal of Economics 106: 503-30.
Murthi, Mamta, Anne-Catherine Guio and Jean Dreze (1995). “Mortality, Fertility, andGender Bias in India: A District-Level Analysis”, Population and DevelopmentReview 21(4): 745-82.
Olsen, W.K. and S. Mehta (2005). The Right to Work and Differentiation in India.Conference paper. Delhi: The Indian Society for Labour Economics.
Papola, T.S. (1999). “Scope for Economic Diversification”, News Letter. Kathmandu,Nepal: ICIMOD.
Quisumbing, Agnes R. (2003). “What Have We Learned from Research on IntrahouseholdAllocation?”, in Agnes R. Quisumbing (ed.), Household Decisions, Gender andDevelopment: A Synthesis of Recent Research. Washington, D.C.: InternationalFood Policy Research Institute.
Quisumbing, Agnes R. and John A. Maluccio (2003). “Resources at Marriage andIntrahousehold Allocation: Evidence from Bangladesh, Ethiopia, Indonesia, and SouthAfrica”, Oxford Bulletin of Economics and Statistics 65(3): 283-327.

249TRICKLING UP GROWTH THROUGH GENDER PARITY
Schultz, T. Paul (2001). Why Governments Should Investment More to Educate Girls. YaleUniversity. Manuscript.
Sen, A. (1999). Development as Freedom. New York: Knopf.
Sen, Survana and Ishita Mukherjee (2007). The Changing Status of Women in India: TheChallenges Ahead. Accessed from SSRN, http://papers.ssrn.com
Seguino, Stephanie (1997a). “Gender Wage Inequality and Export-Led Growth in SouthKorea”, Journal of Development Studies 34(2): 102-32.
————. (1997b). “Export-Led Growth and the Persistence of Gender Inequality in theNewly Industrialized Countries”, in Janet Rives and Mahmood Yousefi (eds.),Economic Dimensions of Gender Inequality: A Global Perspective. Westport, CT:Praeger. pp.11-33.
————. (2000a). “Gender Inequality and Economic Growth: A Cross-country Analysis”,World Development 28: 1211-30.
————. (2000b). “Accounting for Gender in Asian Economic Growth”, FeministEconomics 6(3): 27-58.
————. (2000c). “The Effects of Structural Change and Economic Liberalization onGender Wage Differentials in South Korea and Taiwan”, Cambridge Journal ofEconomics 24(4): 437-59.
————. (2006). Gender, Distribution, and Balance of Payments Constrained Growth inDeveloping Countries. University of Vermont.
Seguino, Stephanie and Maria Sagrario Floro (2003). “Does Gender have any Effect onAggregate Saving? An Empirical Analysis”, International Review of AppliedEconomics 17(2): 147-66.
Standing, Guy (1989). “Global Feminization through Flexible Labor”, World Development17(7): 1077-96.
————. (1999). “Global Feminization through Flexible Labor: A Theme Revisited”, WorldDevelopment 27(3): 583-602.
Stotsky, Janet G. (1997). “Gender Bias in Tax Systems”, Tax Notes International: 1913-23.June 9.
Summers, L. (1994). Investing in All the People. Washington DC: The World Bank.
Swamy, A., S. Knack, Y. Lee and O. Azfar (2001). “Gender and Corruption”, Journal ofDevelopment Economics 64: 25-55.
Swarup, H.L., Niroj Sinha, Chitra Ghosh and Pam Rajput (1994). “Women’s PoliticalEngagement in India”, in B. Nelson and N. Chowdhury (eds.), Women and PoliticsWorldwide. London: Yale University Press.
Tzannatos, Zafiris (1999). “Women and Labor Markets Changes in the Global Economy:Growth Helps, Inequalities Hurt and Public Policy Matters”, World Development 27:551-69.
World Bank (2001). Engendering Development through Gender Equality in Rights,Resources and Voice. Washington D. C.: World Bank.
————. (2005). World Development Report 2006: Equity and Development.Washington, D.C. and New York: World Bank and Oxford University Press.

This page intentionally left blank

Part III

This page intentionally left blank
Can PhilanthrCan PhilanthrCan PhilanthrCan PhilanthrCan Philanthropy Accelerateopy Accelerateopy Accelerateopy Accelerateopy AccelerateTTTTTrickle Downrickle Downrickle Downrickle Downrickle Down
Introduction
India has long established traditions of philanthropy. Prominent kings,merchants and agrarian families have been important philanthropists inIndian history. There are estimated to be hundreds of thousands ofphilanthropic non-profit and civil society organisations in India. CharitiesAid Foundation (India) under the auspices of the Planning Commission ofIndia has validated 1,350 voluntary organisations nationwide and believethat there may be up to 3 million more (Ambrose, 2005). Estimates of totalphilanthropic contributions range from roughly 0.6 per cent of GDP to 1 percent of GDP (Sheth, 2010). However, systematic data on philanthropy hasnot been collected though there are point sources obtained from surveysconducted by various sources such as Sampradan and the PlanningCommission. The terminology used by the surveys differ and hence thesepoint sources are not strictly comparable. The Planning Commission uses theterm voluntary sector which could be said to comprise not just philanthropists,but non-profit organisations (NPOs), non-governmental organisations (NGOs)and community-based organisations (CBOs). Others use terms such as thethird sector referring to the sector which is neither government nor private.
The liberalisation of the Indian economy and its aggressive new focuson manufacturing, services and technology has resulted in changes in termsof philanthropic funding and priorities by India’s wealthy individuals andcorporations, many of whom rank high amongst the globally wealthy. Thereare over 115,000 high net worth individuals in India today. Since 2000, thiselite group has grown an average of 11 per cent annually. Between 2006 and2007, the number of wealthy individuals in India surged by 23 per cent—possibly the highest growth rate in the world (Sheth, 2010). The collective
55555

254 INDIA EMERGING • VEENA JHA
wealth of these 100 richest Indians, which includes 52 billionaires as against27 a year ago, is 276 billion dollars which corresponds to almost one-fourthof the country’s GDP (Sheth, 2010). India’s youthful and cosmopolitanentrepreneurs and venture capitalists are investing and partnering in socialchange and community development, rather than merely donating funds forshort-term charitable relief. As with some other emerging economies, India’snew technologies and resources are being used to improve and transform thedaily lives of its poor and underprivileged communities.
Government policy on philanthropy or the voluntary sector as it iscalled by the Planning Commission recognises that it has contributedsignificantly to finding innovative solutions to poverty, deprivation,discrimination and exclusion, through means such as awareness raising,social mobilisation, service delivery, training, research and advocacy. It isalso felt that this sector acting as intermediaries may effectively link thecommon man to the government. Government policy recognises theimportant role that the voluntary sector has to play in various areas andaffirms the growing need for collaboration with philanthropists, as well asby the private sector, at the local, provincial and national levels.
Yet, philanthropy has not systematically addressed the country’s mostfundamental development problems. Philanthropy has provided charitablerelief to those in need, but addressed the underlying causes of poverty onlyto a limited extent. While many individuals, families and corporations givegenerously, many more need to become involved if philanthropy is to makea significant dent in India’s poverty levels. The prevailing mindset—thatgovernment should be the sole provider of social services needs to bechanged. Philanthropy needs to increase in scale and the third sector needsto be better organised.
This chapter is an overview of philanthropy in India, including itsearly traditions, more modern influences and the current landscape ofsocial sector investment by the voluntary sector. Throughout, it seeks toexamine whether and how philanthropy trickles down to the poor therebysupporting or accelerating a process of equitable social and economicdevelopment in India. The last section of the chapter offers somerecommendations and considerations for how to strengthen the nexusbetween philanthropy and equitable development.

255CAN PHILANTHROPY ACCELERATE TRICKLE DOWN
I
History of Philanthropic Traditions in India
Philanthropic activity in India has a very long tradition and history. RigVeda, an ancient Indian text makes ample references to charity as a duty andresponsibility of the citizen and the benefits that one earns through an act ofcharity (Rig Veda, 10 Mandala, Suktha: 6-47, 8-4-20, 13-2, 46-31, 10-17-1 to7).1 The concept of daana (giving) was essentially the root of the voluntary/non-profit sector. Charity inspired by religious beliefs and values continuedto remain popular and fairly widespread in pre-colonial India.
Historically, the concept of giving for charity was well established withindividuals offering alms for ascetics and the brahmins (Hindu priests).This practice arose from the belief that charitable activities lead to‘Nirvana’ or ensures that you are not born again. Religious obligationsencompass a duty to help the needy) (Dadrawala, 2001). All the majorreligious scriptures advocate and encourage charitable giving. The culturalroots of philanthropy in India are ancient and deep, and have given life tolong established traditions of philanthropic engagement, social service andvoluntary work. Religion has always played a major role in philanthropicgiving in India and continues to be a profound influence on giving.However various other factors—social, economic and political—haveaffected and accelerated the emergence of civil society in modern India andshaped the role and practice of philanthropy today.
The worthiness of social service was and is deeply engraved in India’ssocial consciousness; individual and unorganised giving have existed invarious forms from time immemorial. The concepts of daana (giving) anddakshina (alms) in Hinduism, bhiksha (alms) in Budhhism and zakaat(prescribed offerings) and sadaqaat (voluntary offerings) in Islam have beena part of Indian culture for many centuries (Dadrawala, 2001). With theadvent of Buddhism, through the order of monks (sanghas) and later withChristianity, philanthropy became an organised institutional concern. Thegospel of service was preached through the establishment of schools,hospitals, leper homes and homes for the aged and the needy.
1. Swami Dayanand Saraswati’s Introduction to the Vedas, Part 5, http://www.vjsingh.info/int5.html

256 INDIA EMERGING • VEENA JHA
Some form of philanthropy was ingrained in the joint family system ofhindu societies. As in several other societies, the relationships betweenindividuals and groups were established to ensure that the care of theunderprivileged and vulnerable members of family was entrusted to themore able family members. Society was built into social institutions andstructures which upheld the values of a joint family, i.e., families whereseveral nuclear units coexisted. Social and often family institutionsprovided mechanisms to help meet the needs of the old, the sick and thehandicapped, as well as other helpless sections of the community. Forexample, the joint family, caste members and community councils oftentook responsibility for individuals who needed support.
The contemporary non-government, non-profit and voluntary sectorin India owes its origin to Gandhian principles, philosophy and practices.Inspired by Gandhi, committed and charismatic individuals such asVinobha Bhave established village-oriented community organisationsthroughout the country (Dalal, 2006). These organisers guided, motivatedand assisted the community in addressing their economic and social needsand most importantly, in giving a voice to the unheard. Many of thesecommunity groups emerged as organised, informal representatives of thepeople who could challenge and confront the establishment (Desai, 1999).Subsequently, many developed into powerful and effective organisations,capable of delivering social services in an efficient and cost-effectivemanner.
Institutionalised philanthropy also gained momentum after theindustrialisation processes of the late 19th century. Gradually, corporategains began to trickle towards welfare and development. Several businesshouses that emerged during rapid industrialisation laid the foundation for aphilanthropic tradition that have been followed and strengthened bysucceeding generations. Notable among the pioneering efforts were theindustrial houses of Tata, Birla, Godrej, Mahindra, Shri Ram group and Bajaj.Several large landowners built schools and hospitals in their neighbourhoods.Noted social reformers such as Raja Ram Mohun Roy and the families ofRabindranath Tagore worked for social causes and donated a large share oftheir wealth too. The tradition of philanthropy became intricately wovenwith the tradition for social reform in the 19th century (Sharma, 2001).

257CAN PHILANTHROPY ACCELERATE TRICKLE DOWN
Development of the voluntary sector during the colonial phase, whichbegan during the late 18th century, is closely linked with the social reformand freedom movement. At the same time, the British colonialadministration also supported some religious and private organisationsengaged in providing social services (Asia Pacific Philanthropy Consortium,2001). The activities in the voluntary sector during the late 19th centuryand early 20th century were coloured by nationalist sentiments.Institutionalised philanthropy also received an impetus with the industrialrevolution in India, as corporate wealth began to be channelled towardswelfare and development work. It is possible that at this point of timecorporate welfare may have been an alternative to organised labour andtrade union movements which characterised post- independence India.Volunteerism also found a new meaning in the wake of India’s struggle forfreedom, with Mahatma Gandhi giving India a vision of swaraj (self-rule),ahimsa (non-violence) and seva (service) (Ibid).
The first 20 years of independence (often referred to as India’s era ofnation building) thus saw the three sectors—the state, the market and thevoluntary sector—join together to tackle the emerging tasks of nationbuilding, focussing on extension work in such areas as agriculture, health,community development (Charities Aid Foundation (CAF), 2003). This, infact, heralded the beginning of a much broader civil society participation innation-building.
Today, there are a wide range of actors and activities on India’sphilanthropic landscape. Yet philanthropy—as traditionally practiced byprivate trusts, family foundations, corporate donors and intermediaryagencies—has had only a limited impact on bridging the equity divide.While a variety of foundations and trusts have made strategic andsystematic investments in the social space, the inputs and supplementsprovided by the private sector have been minimal. However, the world ischanging rapidly, and so, too, is the situation in India.
Many trusts established by corporate leaders are increasingly strategicin addressing societal challenges. The information technology revolutionhas had a significant and positive impact on philanthropic investmenttrends. Diaspora philanthropy is significant, and has made particularlystrategic investments in education and the digital divide. There is the

258 INDIA EMERGING • VEENA JHA
beginning of a philanthropic infrastructure to support and nurturephilanthropic engagement. Increasingly, philanthropic and socialinvestment capital in India targets such areas as education, health care,population, gender issues, natural resource management, energy andenterprise development; many initiatives are focussed on rural India.
Organised philanthropy is part of the larger voluntary/non-profitsector that includes public charitable trusts, societies and NPOs defined as‘promoting commerce, art, science, religion, charity or any other usefulobject.’ The nature and character of NPOs or voluntary organisations (VOs)have undergone a noticeable change in the last decade and a half. A largenumber of organised, development-oriented, charitable and voluntaryinstitutions have emerged that are led by professionals, and employ full-time, paid staff, who are trained to meet the needs and demands of thesector more effectively. These voluntary organisations are not run for profit,whether personal or organisational. They may organise and implementprofit-earning programmes but the earnings are not disbursed to the members.
In the past 15 years, i.e., since liberalisation India has seen a surge involunteerism from both within and outside India. Several organisations inIndia accept international volunteers for short-term assignments.Employees of corporate houses are increasingly volunteering their time andskills towards strengthening programme and institutional capacities oforganisations.
In a societal context, voluntary organisations constitute the ‘thirdsector’, the first sector being the government and the second sector beingthe market or private business. The ‘third sector’ is also known as the‘independent sector’, which emphasises the important role VOs play as anindependent force outside the realm of government and private business(though, in financial terms, this sector depends heavily on both thegovernment and private business).
Development organisations today encompass a wide-ranging field ofactivities, including designing and implementing innovative programmes invarious sectors of development. Their activities also include work invarious areas of research, reporting, documentation and training to supportgrassroot initiatives, and also involve highly technical and technologicaloutputs.

259CAN PHILANTHROPY ACCELERATE TRICKLE DOWN
II
An Analysis of Philanthropic Point Sourcesof Information
NGOs in modern India have traditions that can be traced back to theideologies of the religious and reformist institutions such as theRamakrishna Mission, Mahatma Gandhi, Sarvodaya, Jesuit Missions andeven Marxism (Copal Partners, 2006). Most non-profit charities in Indiaare included within the NGO or the voluntary sector. However, thevoluntary sector need not only consist of philanthropic activity, it wouldalso include member-driven activities which is paid for by the membershipof the society.
What is the key factor that distinguishes an ordinary organisationfrom a ‘voluntary organisation’ in India? Largely, it is the significant inputthat volunteers give to the management and operation of the organisation.It is this factor that gives voluntary organisations the other commonly usedname ‘non-profit’ or ‘not-for-profit’ organisation. ‘Non-profit’ or ‘not-for-profit’ emphasises the fact that the organisation does not exist primarily togenerate profits for its owners, managers or members.
There are certain common factors (Asia Pacific PhilanthropyConsortium, 2001) that characterise VOs in India, which are typically:
• Formal: institutionalised, to some extent, registered, demonstratinga definite programme or aims and objects, as well as rules andregulations of governance.
• Private: institutionally separate from the government.
• Self-governing: not controlled by the government or any otheroutside entity.
• Not-for-profit: non-profit distributing.
• Voluntary: involving some meaningful degree of voluntaryparticipation, either in the actual conduct of the organisation’sactivities or in the management of its affairs.
• Non-religious: not primarily involved in the promotion of religiousworship or religious education.
260 INDIA EMERGING • VEENA JHA
• Non-political: not primarily involved in promoting candidates forelected office, etc.
KKKKKey Fey Fey Fey Fey Facts and Facts and Facts and Facts and Facts and Figurigurigurigurigureseseseses
The non-profit sector in India is quite widespread with huge scale interms of employment, revenue and types of activities. While there is noofficial, ongoing effort to maintain statistics on India’s non-profit sector,several independent NGOs have conducted surveys at different points oftime to estimate the size of this sector. Estimates range from as little as US$2 billion to over tens of billions of US$s (Sheth, 2010).
While there is no definitive study on the size of the sector, there areseveral estimates and projections. It is estimated that there are between 2-3million charities or NGOs in operation in India, but according to ArpanSheth, partner at Bain & Co., only 500 of them operate on a scale largeenough to be effective (income over US $100,000) (Sheth, 2010). The factorsthat have contributed to this astronomical increase in the number of NPOsin the last few decades include weakening government delivery systems,widespread poverty and deprivation and increasing inequity, rising awarenessand social concern about underdevelopment and inequity, and the influx ofincreased funding—both indigeneous and foreign—for developmentpurposes.
The Indian government may be the largest source of funding forcharities in India, and estimate their contribution at about $3 billion (Rs131 billion) (Copal Partners, 2006). This is mostly directed to foundationsand other NGOs for delivery of social services. Funding from the Indiandiaspora comprises just over $1.2 billion (Rs 55 billion), the second largestsource, and contributions from Indian corporations and individuals amountto around $447 million (Rs 20 billion) (Copal Partners, 2006). Mostindividual giving is directed towards religious institutions (temples,gurudwaras etc.), which are not technically qualified as charity. Individualand corporate giving tends to be higher during times of national calamities.
The Society for Participatory Research in Asia (PRIA) (2000; 2001;2002), a civil society organisation focussed on development issues,conducted studies between 2000 and 2002 to examine the state of thephilanthropy sector in India.
261CAN PHILANTHROPY ACCELERATE TRICKLE DOWN
Key findings from this report reveal the existence of a substantialcharity sector. The number of charities in India are estimated to be about1.2 million (some estimates suggest it to be as high as 4 million). About20,000 of them are fairly active in developmental work. The PRIA studyhad estimated the size at Rs 200 bn (US $ 4 bn) in 2002, of which foreigncontribution was Rs 50.5 billion (approx. US $1 billion). US contributionscomprise about Rs 14.9 billion (approx. US $ 270 million) while donationsfrom the UK and Germany have come in at around Rs 6.7 billion each(approx. US $1.2 million).
Fifty-three per cent of charities operate in rural areas. Nearly half ofthese charities may be unregistered. About 500 charities have annualincome above Rs 4.5 million (about US $100,000); most of others haveannual income less than Rs 450,000 (about US $10,000).
A large percentage of charities operating in India are involved in socialdevelopment, though many are associated with religious organisations.Religious organisations in India are also the largest recipients of donationsand have floated affiliated organisations to undertake developmentalactivities (29%). Other popular activities in the voluntary sector arecommunity/social service (22%), education (23%), promotion of sports &culture (19%) and health (7%). The formal voluntary sector incontemporary India is fairly vibrant.
The percentage of registered NPOs is highest in Maharashtra (74%)and lowest in Tamil Nadu (47%). An overwhelming majority of theseregistered NPOs are registered under Societies Registration Acts. Most ofthe unregistered NPOs are in rural areas. But even in urban Delhi, nearly30 per cent of NPOs are not legally incorporated. Informal and organisedcharacteristics of the NPOs are the most challenging realities today. IndianNPOs are essentially small: nearly three-fourth of all NPOs have onlyvolunteers or at most 1 paid staff. Only one in 12 NPOs (8.5%) employsmore then 10 paid staff.
Nearly 20 million persons work on a paid or volunteer basis in NPOs.This is 3.4 per cent of total adult population. As an illustration it can beobserved that:

262 INDIA EMERGING • VEENA JHA
• In Delhi, one out of every eight adult persons is working in a NPO.
• In West Bengal, 90 per cent of all the persons working in NPOs arevolunteers.
• Overall, volunteers are nearly five and a half times more than paidstaff in NPOs nationwide.
• Nationwide, NPOs have nearly 27 lakh (2.7 million) full-timeequivalent paid employees.
All these point to the vibrant and large NPO sector in India. Withgrowth in the decade 2000-2010, preliminary findings of the PlanningCommission suggest that this sector grew steadily.
How does it ComparHow does it ComparHow does it ComparHow does it ComparHow does it Compare Internationally?e Internationally?e Internationally?e Internationally?e Internationally?
Salamon et al. (2003) report that average for 22 countries (developed andLatin American) taken together shows the following patterns:
• Fifty-one per cent NPOs in India are self-generated versus 49 percent internationally.
• Seventeen per cent NPOs use private funds versus 11 per centinternationally.
• Thirty-two per cent NPOs use government funds versus 40 percent internationally.
Do FDo FDo FDo FDo Forororororeign Feign Feign Feign Feign Funds Matter for Indian NPOs?unds Matter for Indian NPOs?unds Matter for Indian NPOs?unds Matter for Indian NPOs?unds Matter for Indian NPOs?
The percentage of foreign funds in total receipts of NPOs during 1999-2000 was as follows:
• Nationwide, only 7.4 per cent of total receipts of NPOs are foreignfunds.
• Foreign funds constitute nearly one-eighth of total receipts forTamil Nadu and Delhi.
• Foreign funds as share of total receipts of NPOs in West Bengal areinsignificant.

263CAN PHILANTHROPY ACCELERATE TRICKLE DOWN
Who Gives FWho Gives FWho Gives FWho Gives FWho Gives Funds?unds?unds?unds?unds?
• Nationwide, more than 75 million households give for charitablecauses—nearly two-fifth (40.7%) of all households in India.
• Two-thirds (68%) of all givers live in rural areas.
• Nearly two million households give in Delhi—more than four-fifth(80.7%) of all households in Delhi.
• The pattern for Meghalaya and West Bengal shows that more thantwo-thirds of all households are givers (72.5% in Meghalaya and66.6% in West Bengal).
• Nearly a quarter of all households in Maharashtra give forcharitable causes.
• In Tamil Nadu, the giver households account for one-tenth of allhouseholds.
Economic PEconomic PEconomic PEconomic PEconomic Prrrrrofile of All Givers Pofile of All Givers Pofile of All Givers Pofile of All Givers Pofile of All Givers Prrrrresents anesents anesents anesents anesents anInterInterInterInterInteresting Pesting Pesting Pesting Pesting Picturicturicturicturictureeeee
• Nationwide, two-fifth of all givers are poor households (annualincome below Rs 25,000 (US $450).
• Only a small percentage of givers are from households whoseannual income is above income tax paying level (Rs 1 lakh (US$2,000) per annum).
• A majority of givers in Delhi and West Bengal are from poorhouseholds; nearly a third of all givers in Maharashtra are frompoor households.
And how much do Indians give to NPOs?And how much do Indians give to NPOs?And how much do Indians give to NPOs?And how much do Indians give to NPOs?And how much do Indians give to NPOs?
Average amounts per giver vary significantly across states and incomecategories:
• Poor in Delhi and Tamil Nadu (at Rs 553 and Rs 2,333 (betweenUS $10 and US $40) per annum per household) give more than themiddle income group (at Rs 470 (US $8) and Rs 1,039 (US $20)respectively).
• In West Bengal, Maharashtra and Meghalaya, middle income givergives substantially more per annum than the poor household

264 INDIA EMERGING • VEENA JHA
(Rs 445 versus Rs 200 (US $8 versus US $5) in West Bengal,Rs 849 versus Rs 245 (US $15 versus US $6) in Maharashtra andRs 758 versus Rs 272 (US $12 versus US $7) in Meghalaya).
• The richer households give substantially more in all the states—Delhi: Rs 1,402 (US $14); Meghalaya: Rs 3,770 (US $32); TamilNadu: Rs 7,515 (US $150); West Bengal: Rs 1,077 (US $20);Maharashtra: Rs 1,122 (US $22).
• Overall Indians give Rs 4,214 crore (US $1 billion) per year; nearly55 per cent of these resources go to individuals, balance toorganisations.
FFFFFundraising by Philanthrundraising by Philanthrundraising by Philanthrundraising by Philanthrundraising by Philanthropies, NGOs and NPOsopies, NGOs and NPOsopies, NGOs and NPOsopies, NGOs and NPOsopies, NGOs and NPOs
The only source of reliable data on foreign inflows (not diasporicflows) to NGOs in India are those maintained by the Home Ministry underthe statutory Foreign Contribution (Regulation) Act (FCRA). It isimpossible from this data to separate the fraction of FCRA fundsoriginating from the diaspora, from that emanating from other sources—namely international NGOs and non-diaspora foreign citizens.
Table 5.1
Trends of Foreign Contributions to Charities in India
Year Foreign Contribution ($million)
1991-92 3441992-93 4451993-94 8381994-95 5871995-96 13591996-97 7261997-98 5261998-99 6501999-2000 7342000-01 10082001-02 10822002-03 11212003-04 11342004-05 13902005-06 17512006-07 2731
Source: FCRA, Annual Report 2008. Government of India, Ministry of Home Affairs.

265CAN PHILANTHROPY ACCELERATE TRICKLE DOWN
Only about half the organisations registered, report their FCRAcontributions. This implies that the actual inflows are a lot higher thanthat suggested by the data above. More than 80 per cent of the FCRAdonations are from Christian organisations (Nayyar, 2010). This does notimply that other organisations are not sending money. In fact remittancesin 2010 totalled US $55 billion. Though data on FCRA contributions tocharities is not available for 2010, assuming a normal increase, it isunlikely to exceed US $4 billion in 2010. This implies that remittances byoverseas diaspora which also includes philanthropy among other purposeswas more than 12 times as much as FCRA contributions (Nayyar, 2010).
The Government of India is a major source of funding for NGOs.Their contribution was estimated at about $3 billion (Rs 131 billion) in2006. Funding from overseas for charities comprised just over $1.2 billion(Rs 55 billion), the second largest source, and contributions from Indiancorporations and individuals was around $447 million (Rs 20 billion) in2006 (Copal Partners, 2006). While more recent figures are not available itis unlikely that the composition of funding for charities would havechanged substantially.
The nature of issues addressed by the voluntary organisations andtheir scale and spread have changed considerably over the years; today theycover a wide spectrum of activities, ranging from basic social issues ofeducation, health and family welfare to emerging areas like environmentprotection, gender equality, wildlife protection and human rights. Theirchief strength lies in the fact that they work at the grassroot level and aredirectly involved with people in these areas.
The relationship between the NGO sector in India and thegovernment is one of collaboration more than competition. Thegovernment has set up Central and state welfare boards to promote andfund the sector and to provide technical support. From the very first five-year plan, budget allocations have been made for providing assistance tothe voluntary sector as policymakers have felt that this sector can deal withsocioeconomic problems that the state is unable to address effectively. Thegovernment also grants tax relief to individuals and organisations thatdonate to the voluntary sector.

266 INDIA EMERGING • VEENA JHA
The growth of the Indian voluntary sector—post-Independence—hasbeen significant, yet it remains somewhat vulnerable. Although there islimited data, it appears that one of its greatest vulnerabilities is itsdependence on funds from government and international aid agencies. Thepreferences of potential donors and the patterns of philanthropic givingsuggests that fundraisers and others who seek to encourage and promotemore philanthropy need to build greater understanding of motivations,practices and barriers into their approaches and strategies.
International FInternational FInternational FInternational FInternational Foundations and Charitiesoundations and Charitiesoundations and Charitiesoundations and Charitiesoundations and Charities
Many international foundations and charities provide funding fordevelopment activities in India. While some, e.g., the Ford Foundation, areexclusively grant-making, the majority—including ActionAid, CARE,Christian Children Fund, Oxfam (UK), Plan International, Save the ChildrenFund, World Vision, the Aga Khan Foundation, the InternationalDevelopment Research Centre (IDRC) from Canada and Charities AidFoundation also operate their own programmes. According to a study byCAF-India (2002), in 1997-98 ‘the total foreign funding was Rs 2,760 crore(US$0.7b) and is estimated to have touched Rs 4,000 crore (US$1b) in1999.’
The primary assumption underlying these agencies is that it is right toprovide financial assistance from financially more wealthy societies toassist with disaster situations and poverty in India. In some situations themotivation has been ‘charitable’ (for example Oxfam supporting reliefduring the Bihar famines of the mid-1950s); in other situations it has been‘political’ (for example much of USAID assistance could be categorised as‘political’). A third category is to sponsor research into social developmentas is done by the IDRC.
This international aid, mostly in the form of grants to voluntaryorganisations and the governments, has in general not taken into account‘indigeneous’ philanthropy—the assumption being that if the grant wouldnot be provided, the work would not be done. This would have been at leastpartly true. A consequence of this type of aid, presumably not foreseen, isthat it will gradually promote an ethos that the work and service to be donein India needed a grant from either the Indian government or from a foreignsource. This ethos could be counterproductive.

267CAN PHILANTHROPY ACCELERATE TRICKLE DOWN
Regranting OrRegranting OrRegranting OrRegranting OrRegranting Organisationsganisationsganisationsganisationsganisations
A fairly recent and promising development is the emergence of Indiandonor agencies that both raise and distribute (or ‘regrant’) funds locally toaddress a specific issue or vulnerable population. While data is limited, suchfocussed efforts appear to be successful both in stimulating philanthropy aswell as in addressing some of India’s most critical development and equitychallenges. Examples of regranting organisations include:
• HelpAge, registered in 1978 (with the support of ‘Help the Aged’ inthe UK), began work as an Indian agency with an Indian board topromote care of the aged in India.2 From the beginning efforts weremade to raise resources within India; this has continued andexpanded, with Indian resources being supplemented by resourcesfrom the international network of HelpAge members.
• In 1979, Child Rights and You (CRY) was formed by a small groupin Mumbai to raise resources to support work with children.3 Ithas grown into a nationally respected agency. Ninety per cent of itsresources are raised from public and corporate donations withinIndia; 10 per cent comes from the international non-residentIndian community mostly living in the USA.4
It is worth noting that several other international, national and localgroups have begun to successfully mobilise Indian philanthropy to supporttheir own work. Notable among these groups are Lok Kalyan Samiti in NewDelhi (an eye care programme), which raises all its resources within Indiathrough direct mail; the Hindu Mission Hospital in Chennai, which hasbuilt a very diversified system of local resource mobilisation to enable itshospital to expand and provide rural health care; and World Vision whichestablished a local affiliate with an Indian board and is actively raisingresources from fundraising programmes to seek individual, corporate andfoundation donations (Viswanath and Dadrawala, 2004).
2. http://www.helpageindia.org/faq.php
3. http://www.scribd.com/doc/36010999/Child-Relief-and-You-Cry-India-A-Case-Study
4. Ibid.
268 INDIA EMERGING • VEENA JHA
III
Models of Philanthropy in India
Giving in India is more often than not individual giving. Philanthropyis guided by the religious rules, regulations and demands of caste, clan,family and/or community. Giving is primarily directed towards religiousorganisations like temples and churches. However, giving to the needy hasalso occupied a significant place.
The propensity to give is a function of many factors. The greater thewealth the more is the philanthropic activity. However, the ability to givemust be distinguished from the ‘willingness to give’ and the presence ofdistribution channels that are able to translate a ‘latent willingness’ torealised flows. The willingness to give is a function of the relationshipbetween the philanthropist and his roots. Distribution channels affect boththe volume and purposes of philanthropy. High transaction costs, lowrecipient transparency and limited coordination mechanisms and lowsocial capital all adversely affect the volume of flows.
The principal distribution channels of philanthropy are:
1. informal family and personal networks or individual philanthropy,
2. religious charities,
3. diasporic philanthropy,
4. corporate philanthropy, and
5. international aid.
While the ethos of ‘giving’ in India is clearly ‘personal’, in contrastwith the institutionalised charitable giving practiced in the West, the lastdecade in particular has witnessed a trend towards more organisedcharitable giving.
Individual PhilanthrIndividual PhilanthrIndividual PhilanthrIndividual PhilanthrIndividual Philanthropyopyopyopyopy
Surveys conducted on the reasons for philanthropy suggests that themost important reason was a feeling of compassion (68%). The secondmost important reason was that the giver feels good (48%). Religious beliefsand practices (46%) are the third most important reason. Twenty-nine percent respondents donated because they believed in the cause of the
269CAN PHILANTHROPY ACCELERATE TRICKLE DOWN
organisation. The survey showed that for the donors reduction of taxes wasthe least important reason (Dadrawala, 2001).
Another study on individual giving in five southern cities (Dongre,2003) has also recorded a high incidence of giving, both in terms of sizeand frequency, among particular income groups. The study showed that asample of 200 individuals donated an amount of Rs 0.5 million in oneyear. The study indicates that in urban high salaried class giving hasbecome more rationalised and people are willing to give to big foundationsthat can channel the funds more effectively rather than to governmentaland religious institutions.
Besides giving in cash and kind, Indians contribute their time, labourand other capacities to charitable causes in society. For instance, membersof the Sikh community—irrespective of their social and economic status,volunteer at gurudwaras (Sikh temples) sweeping the floor, washing thedishes, polishing shoes, cooking food for devotees—the activities generallyconsidered menial otherwise. In India, philanthropy evolved more in termsof time and work, called ‘shram’. People did not have much money butwere willing to give their time and labour to good causes and for thebenefit of society. It is perceived that most of this time was contributed toreligious organisations like temples and churches (Dadrawala, 2001).
Voluntary organisations or the NPO sector in India clearly lack skills,methodology, and any strategic plan for tapping this very important source offunds. Many experts believe that, due to lack of transparency and accountability,voluntary organisations suffer from serious crises of credibility and this oftendeters individuals from contributing to welfare or developmental projects.Perhaps for these reasons, as well as lack of good communication, it hasbeen observed that some of the poorest states in India like Bihar, UttarPradesh, Madhya Pradesh and Rajasthan receive much less from varioussources (individual, corporate, local and foreign foundations) than TamilNadu, Karnataka and Kerala. This of course exacerbates existing inequalitybetween states as philanthropic non-state provision of basic services alsoconcentrates on states that are relatively better off.
In addition to this broad philanthropic participation, there are severalhighly prominent individual philanthropists in India. These individuals areimportant not just for their own significant philanthropic investments, but

270 INDIA EMERGING • VEENA JHA
for the attention they bring to philanthropy and the role they set for others.Because many of these individuals come from the corporate sector and/orhave established foundations or trusts, there activities are profiled in othersections. Nevertheless, it is certainly important to recognise them asindividuals, including: Ratan Tata, N.R. Narayana Murthy, Azeem Premji, K.V.Kamath, Rahul Bajaj, Anand Mahindra, K.M. Birla, Anji Reddy, DhirubhaiAmbani, Rajan Nanda, Jamshyd Godrej, Vikram Lal, Brijmohan Lal, M.V.Subbiah and Arun and Manju Bharat Ram (Viswanath and Dadrawala, 2004).
While charities are supposed to spend most of their revenues onprogramme expenditure, administrative costs and other overheads can besignificant, particularly fundraising costs, which can often comprise 10 percent of revenues.
Table 5.2
Indicative Economic Model for Charities
Gross income 100 per centFundraising cost 8 per cent-12 per centProgramme expenditure 60 per cent-85 per centAdministrative expenses 5 per cent-15 per centDepreciation 1 per cent-2 per centSurplus 0 per cent-15 per cent
Source: PRIA (2002).
Challenges for any charitable organisation include inefficient access tocapital, underscored by high fundraising costs—22 per cent to 43 per centin the US and around 25 per cent in the UK. Indian NGOs spend anaverage of 10 per cent to 12 per cent of revenue on fundraising. This is incontrast to the bloated fundraising models that a number of US and UKcharities have incurred. Nevertheless, even this low outlay is beyond thereach of most charities.
However, wealthy individuals in India give much less in charity thantheir counterparts in the US or UK. In fact, the wealthiest, or ‘upper class,’have the lowest level of giving at 1.6 per cent of household income. Thehigh class, which is ranked one level below the ‘upper class’ on the incomeand education scale, donates 2.1 per cent to charity. Even the middle classgives 1.9 per cent of household income to philanthropy (Sheth, 2010).
Further individual charities follow specific philosophies and there islittle pooling of funds. Individual and corporate donations make up only 10

271CAN PHILANTHROPY ACCELERATE TRICKLE DOWN
per cent of charitable giving in India. By contrast three-fourths or 75 percent of the funds in the US comes from individuals or corporations. Thebalance of the philanthropy comes from foreign organisations and thegovernment. In fact, nearly 65 per cent is donated by India’s Central andstate governments with a focus on disaster relief (Sheth, 2010). Diasporicphilanthropy and religious philanthropies are also important.
Religious PhilanthrReligious PhilanthrReligious PhilanthrReligious PhilanthrReligious Philanthropyopyopyopyopy
Funds available with religious trusts are generally earmarked for generalmaintenance of the associated place or places of religious worship, rituals,and other activities connected with the place of worship, most of which areameliorative, e.g., programmes for feeding the poor, religious discourses,devotional songs and dance programmes, etc. With few exceptions (e.g., ahandful of larger organisations) there are no reliable data or statistics on theuse of religious funds for development activities. In some ways, religiousphilanthropy offers stiff competition to the evolution and growth of secularorganised philanthropy. Substantial numbers of Indians in India andelsewhere are aware of the development activities of religious groups like theSwami Narayan Mandir, Sri Sathya Sai Central Trust, the RamakrishnaMission and the Chinmaya Mission, and support the activities of thesetrusts generously (Viswanath and Dadrawala, 2004).
Some temple trusts in the city of Mumbai are spending their funds foreducational purposes. Examples that immediately come to mind are theShree Mahalaxmi Temple Charitable Trust, Mumbadevi Temple Trust andthe Shree Siddhivinayak Ganapati Trust. In South India, TirupatiDevasthanam has also devoted some of its funds to secular activities such asestablishing colleges and hospitals.
There is some evidence that Indians residing outside India providesignificant support to religious philanthropic groups. For example, the SriSathya Sai Central Trust and the Ramakrishna Mission are preferred givingoptions for a number of non-resident Indians in the United States. In addition,a number of households (the female) in California’s Silicon Valley give to theRamakrishna Mission and the Chinmaya Mission, both renowned for theirwork in education. Religious sentiments are not of primary concern to thesehouseholds where the average income per household is over US $200,000.The brand identity of the two organisations vis-à-vis development work

272 INDIA EMERGING • VEENA JHA
influences and inspires women particularly to extend generous support.Members of the Indian diaspora in this region are articulate and informedand justify their giving by quoting examples of the exemplary developmentwork undertaken by several Trust, e.g., Sri Sathya Sai Central Trust’s waterproject in India, which is also one of the largest in Asia.
Indian Diasporic PhilanthrIndian Diasporic PhilanthrIndian Diasporic PhilanthrIndian Diasporic PhilanthrIndian Diasporic Philanthropyopyopyopyopy
It is estimated that between 1975-2000, $97 billion was received fromthe diaspora (Kapur, 2003). However, disaggregated data on contributions bynon-resident Indians (NRIs) is not available. Diasporic inflows can comethrough both formal and informal channels. There are reasons to believe thata greater fraction of diasporic inflows—especially from NRIs—comes throughinformal channels and is therefore largely undocumented. The potential sizeof diasporic philanthropy is an increasing function of the income/wealth of adiaspora and the propensity to give. In turn the total wealth of a diaspora isan increasing function of the size of the diaspora, its income and its vintage.Diasporic philanthropy focusses on those issue areas where affinities, self-interest and distribution channels are strongest. However, such an approachmay exacerbate inequities and even channel resources to causes withnegative welfare consequences. Thus to the extent that the diaspora (in theUS) comes from those geographical regions that are relatively richer(metropolitian cities, richer states like Kerala, Gujarat and Punjab), they aremore likely to channel resources to these areas exacerbating inequities.
Natural disasters: Diasporic philanthropy increases markedly when ashock occurs in the country of origin. Although most shocks are naturaldisasters, a similar response is likely in the case of (man-made) economicshocks. The Orissa cyclone of 1998, and the Maharashtra and Gujaratearthquakes of 2002 are examples where the Indian diaspora’s responsewas particularly salient (Kapur, 2003). The Report of High LevelCommittee on Indian Diaspora, Government of India (2001) observed that,‘Indian Diaspora has contributed in national crisis like the Kargil War, thecyclone in Orissa and the earthquakes in Maharashtra and Gujarat. It hasdonated generously to charities in India for reconstruction, disaster relief,rural development, literacy, child-care and women’s empowerment.’ TheIndian community in Kuwait contributed US $1 million and 11 containerscontaining relief material towards the PM’s Relief fund in the wake of the

273CAN PHILANTHROPY ACCELERATE TRICKLE DOWN
Gujarat earthquake. Contributions are made either on an individual basisor through religious groups, student organisations or other Indianassociations abroad. Donations and services have been received from allsections of the Indian diaspora, irrespective of income differentials (Ibid.).
Education: Another area where the diaspora is likely to be moreforthcoming is education. The examples of IIT Kharagpur, the oldest of IITs isinstructive. It has an alumni network of about 6,800 alumni. The IITFoundation, a non-profit organisation registered in the US, was the first ofsimilar organisations started in the case of individual IITs by its overseas alumni,specially in the US. Recently, it has launched Vision 2020, a $200 millioninitiative by 2020. As of 2001, the assets of the IIT (Kharagpur) Foundation was2.4 million dollars. Similar counterpart organisations have been created in India,reflecting the dialectic between the diaspora and India (Kapur, 2003). Toenhance research facilities at the IIT, two of its alumni donated US $6 millionas a ‘give back’ during its golden jubilee celebrations (Shourie, 2003).
Religious philanthropy: In recent years, diasporic financialcontributions to sectarian and religious groups has attracted attention.Sometimes this kind of philanthropy can be used to fuel extremistsentiments, e.g. funding for RSS or so called religious conversions tochristainity in the tribal belt (Sidel, 2003). Some also believe that suchfunding could cause some security concerns (Vishwanath, 2003).
India is motivated strongly by religious beliefs. Many secularorganisations lack the commitment that often underpins the work ofreligious organisations irrespective of the religion. The success of faith-based charities is a response to the failure of state to provide basic needs,especially education and health, to marginalised groups over the past 60years or so. The philanthropic community has not found a way to deal withthe negative externalities associated with religious philanthropy. Thecritical weakness is the protection offered to religious charities and placesof worship from public scrutiny. Unless this changes the potential for abusewill remain and indeed perhaps grow.
Corporate PhilanthrCorporate PhilanthrCorporate PhilanthrCorporate PhilanthrCorporate Philanthropyopyopyopyopy
According to a study of Indian companies with stated and unstatedpolicies on philanthropic activity, as many as 83 per cent of the surveyedcompanies saw themselves as major players in everything from rural

274 INDIA EMERGING • VEENA JHA
community development to running projects for the disabled, to upgradinginfrastructure facilities for the underprivileged (Dadrawala, 2001). Thefollowing are some of the reasons indicated by the survey companies foradopting a philanthropic policy (ActionAid India):
• Seventy per cent believe they have an obligation towards thesociety upon whose resources they are drawing;
• Fifty per cent felt concern for a specific group;
• Forty per cent felt concern for the underprivileged, and
• Twenty-three per cent cited benefits to the organisation.
Table 5.3
Diasporic Philanthropy and Religion(in per cent)
Buddhist Christian Hindu Muslim Sikh Other
Andhra Pradesh 0 92 3 3 0 2Arunachal Pradesh 14 29 57 0 0 0Assam 0 67 0 33 0 0Bihar 11 63 11 11 0 4Chandigarh 0 63 25 0 13 0Chhattisgarh 2 92 4 1 0 0Dadra & Nagar Haveli 0 100 0 0 0 0Delhi 3 74 10 6 1 6Gujarat 0 69 13 10 0 8Haryana 0 86 6 3 6 0Himachal Pradesh 66 28 0 3 3 0Jammu & Kashmir 29 57 7 7 0 0Jharkhand 1 88 7 2 0 2Karnataka 3 88 5 3 0 1Kerala 0 92 1 6 0 0Madhya Pradesh 0 92 4 2 0 0Maharashtra 2 85 4 6 0 4Manipur 0 94 3 2 0 1Meghalaya 0 96 3 0 0 1Mizoram 0 100 0 0 0 0Nagaland 0 100 0 0 0 0Orissa 3 78 17 0 0 2Pondicherry 5 90 0 5 0 0Punjab 0 90 1 0 6 3Rajasthan 0 76 13 11 0 0Tamil Nadu 0 83 4 2 0 11Tripura 0 80 20 0 0 0Uttar Pradesh 3 73 12 11 0 1Uttarakhand 13 60 23 0 0 4West Bengal 1 66 24 6 0 3Others 4 93 1 2 0 1Total 2 84 6 5 0.18 3
Source: Kapur (2003).

275CAN PHILANTHROPY ACCELERATE TRICKLE DOWN
According to the same survey, the following are some of the ‘benefits’perceived by the companies for being philanthropic:
• satisfaction in fulfilling social obligations (45%);
• improved credibility with the general public and the government(28%);
• builds confidence and pride in staff (19%), and
• tax benefits (9%).
Some of the factors influencing corporate giving in India include:
• Is the project for the community in which the industry operates?
• Is there scope for the company in projecting a ‘caring-sharing’image about itself?
• Is there any tax benefit?
• Is it a long-term investment for the company? (e.g. economicgrowth of the community leading to increased consumerism or abetter educated or technically skilled community leading to abetter work force for the company.)
• Is there a possible link between the company’s philosophy and goaland the project? (e.g., a pharmaceutical company supports acommunity health programme or a housing developmentcorporation supporting a project for low cost housing.)
The survey by ActionAid in 1999 explored the philanthropic practicesof 600 companies (ActionAid India, 2001). The survey found that 69 percent were involved in social development activities of some kind. Of these,17 per cent were working or had worked in partnerships with NGOs/developmental agencies. Another 14 per cent seemed positive aboutworking with the NGOs, while 31 per cent did not see any role for NGOsin their company’s social development activities. The report also noted thatmost companies (78%) provided monetary contributions, while some alsomade ‘in-kind’ contributions such as the use of company facilities.
Experts in India also suggest that voluntary organisations should lookbeyond large corporate houses to small traders, merchants, entrepreneursand professionals. Presently, corporate philanthropy in India is perceived to

276 INDIA EMERGING • VEENA JHA
have become sluggish with a recession afflicted market. Corporate giving inIndia during the year 2000 was estimated to be Rs 200 crore (US $0.5billion immediately after the recession). Some examples of importantcorporate philanthropy are listed below.
Tata Sons are considered leaders not only in their industrial endeavoursbut in philanthropic activity as well. The Tata Trusts control 65.8 per centof the shares of Tata Sons, the holding company of the group. The SirDorabji Tata Trust has promoted six pioneering institutions of nationalimportance. Four of these were established in Mumbai: the Tata Institute ofSocial Sciences (TISS), in 1936; the Tata Memorial Centre for CancerResearch and Treatment (TMC), in 1941; the Tata Institute ofFundamental Research (TIFR), in 1945, and the National Centre for thePerforming Arts (NCPA), in 1966.5
The Bajaj Group has also been a leader in corporate philanthropy inIndia working in the areas of the education of women, abolition of childmarriage, education, promotion of forestry and the popularisation of khadiand village industries. In 1942, The Jamnalal Bajaj Seva Trust was set upwith an initial corpus of Rs 500,000 (US $10,000); representing JamnalalBajaj’s entire share in the family wealth. After Jamnalal’s death, his wifealso surrendered her wealth for development and relief efforts.6
The Social Initiatives Group (SIG) of ICICI is a permanent and full-time group concentrating on development-related initiatives. Through theSIG, ICICI seeks to define and effectively fulfill its responsibilities as acorporate citizen. A particularly innovative ICICI-supported programme isthe new GIVE Online, promoted by Give Foundation, a not-for-profitorganisation whose mission is to help non-profit organisations raise fundsand promote greater accountability and transparency in the non-profitsector in India. This is a charity portal that allows people to donate online,with a high degree of personalisation and assurance.7 The ICICIFoundation established in early 2008 with a commitment of 1 per cent of
5. “Giving Journeys: Philanthropy & Indian Corporations”, July 15, 2010. AsianPhilanthropy Forum.mht. Mumbai: Centre for Advancement of Philanthropy.Philanthropy newsletter in December 2009.
6. Ibid.
7. www.icici.com

277CAN PHILANTHROPY ACCELERATE TRICKLE DOWN
ICICI Bank’s profit is today looking at education, health, financialinclusion, civil society and the environment.
The Citibank India Community Support Programme was launched inJune 1997 to focus on microcredit organisations working to empowerunderprivileged urban women through income generation. The programmeis based on the ‘Banking on Enterprise’ programme and builds onCitibank’s extensive experience in supporting NGOs that serve theunderprivileged across the world. The programme is based on thephilosophy of self-reliance and volunteerism. Citibank works with five localNGOs to implement the programme. Citibank India’s MicrocreditCommunity Support Programme has been acknowledged as a ‘uniqueexample of public-private partnership.’8
New Indian Corporate PhilanthrNew Indian Corporate PhilanthrNew Indian Corporate PhilanthrNew Indian Corporate PhilanthrNew Indian Corporate Philanthropyopyopyopyopy
In 1996, two of India’s flagship companies Infosys Technologies andDr Reddy’s Laboratories set up the Infosys Foundation and Dr Reddy’sFoundation respectively. While the latter known as the ‘Hyderabad’ modelworks in the areas of livelihoods, the former known as the ‘Bangalore’ modelfocusses on education, health care, rural development, arts and culture.9
In 2001, Azim Premji founder of Wipro established the Azim PremjiFoundation, a not-for-profit organisation that today reaches out to over 2.5million children in more than 20,000 schools across India. The foundationworks in partnership with government and other non-profit organisationswith a similar vision. In 2006, Bharti Foundation committed Rs 200 crore(US $40 million) to a corpus to open 500 primary and 50 senior secondary-cum-vocational training schools for underprivileged children across ruralIndia under its Satya Bharti School Programme.10
The aspiration of old and new companies to be active in thephilanthropy space is on the rise. Profits, government and big business willfind ways of optimising use of resources to build a more equitable world.However, they together with individual philanthropy only account for 10
8. www.gcweb.citibank.com9. Giving Journeys, n.5.
10. Ibid.

278 INDIA EMERGING • VEENA JHA
per cent of total philanthropic expenditure in India. The bulk, i.e., 75 percent of the expenditure by NGOs on social development is done by theGovernment of India (Sheth, 2010). In fact the 10 per cent spent by theprivate sector on philanthropy is a miniscule part of their wealth. Thecombined fortune of India’s 100 richest is $276 billion, almost one-fourththe country’s GDP in 2009 (Kamali, 2009).
Primary Education
The Premji Foundation has adopted 200 government-run schools inKarnataka and worked with the state government on improving primaryeducation in those schools. The Foundation is planning to expand itsprimary education programming to Andhra Pradesh and other states inwhich Wipro has strong professional and commercial links, in collaborationwith state education authorities.11 The Foundation, since its inception in2001, has been working in the area of elementary education with a view tobringing about systemic change in India’s 1.3 million government-runschools. The Foundation also focusses on working in rural areas, where amajority of these schools exist. The programmes of the Foundation hadalready touched over 25,000 schools and over 2.5 million children. The keyfocus of the University which has been set up by the Foundation is toprepare a large number of committed education and developmentprofessionals, who can significantly contribute to meeting the needs of thecountry.
Other IT successes such as Narayana Murthy of Infosys have providedsupport for computer science faculty at leading Indian engineering collegesand universities to understand IT trends. The corporation has alsocontributed to primary and secondary education. A ‘Catch-them-Young’programme ‘identifies bright high school students for short-durationcourses in programming fundamentals.’ A ‘Computers@Classrooms’programme provides used PCs and Microsoft-donated software to schools.And the ‘Rural Reach’ programme ‘aims to increase awareness ofcomputers among children in the semi-rural areas. Local languageinterfaces have been created using specialised software to make the learningexperience more meaningful.’
11. “How Premji’s Philantrophic Trust is Educating Children”, February 1, 2011. http://www.azimpremjifoundation.org/foundation-in-the-news.html

279CAN PHILANTHROPY ACCELERATE TRICKLE DOWN
Giving by the Indian diaspora community also frequently focusses onprimary education. In late 1999, for example, the Indian co-founder of UStechnology firm Exodus Communications, B.V. Jagadeesh, committed$1 million towards improvements in primary education in Bangalore, andother Indians in the diaspora have reportedly provided substantial resourcesfor primary education in Bangalore and other parts of India (Sidel, 2001).
Strengthening Higher Education
Philanthropic gifts to higher education in India by entrepreneurs basedwithin and outside India have garnered significant attention in recentyears. Infosys Technologies has made significant gifts to the IndianInstitute of Information Technology (IIIT-Bangalore) to establish aninformation technology library, and to engineering colleges and universitiesto upgrade the skills of computer science faculty (Sidel, 2001). Diasporaand domestic entrepreneurs have made substantial donations to the newIndian School of Business (ISB) in Hyderabad.
Infrastructure and Civic Development in Bangalore
The new wealthy in Bangalore have also committed funds and timefor infrastructure and civic development in Bangalore, not only in primaryeducation but in other areas of social services as well. Infosys and its keyexecutives have taken a leading role in the Bangalore Agenda Task Force,which brings together public and private actors to improve theinfrastructure of Bangalore for citizens and businesses, a private-publicpartnership that epitomises one of the goals of the Indian new economyphilanthropy. Nandan Nilekani and Infosys personnel (including NarayanaMurthy) have devoted substantial time to the work of the Task Force (Sidel,2011).
Infosys has donated corporate funds for Bangalore’s improvements,including a 1997 donation of funds for an ambulance and motorcycles forpolice traffic management. Nilekani and Sudha Murthy, Director of theInfosys Foundation (spouse of Narayana Murthy), have each committedextensive personal funds to improving sanitation and other civic amenitiesin Bangalore as part of the public-private partnership through the BangaloreTask Force. Other wealthy individuals and companies have also

280 INDIA EMERGING • VEENA JHA
contributed, both to the work of the Bangalore Agenda Task Force and forspecific civic amenities in Bangalore.
Rural Development
The Naandi Foundation in Hyderabad set up by IT billionaires inHyderabad provide support for lift irrigation projects, farmer managementof lift irrigation projects, construction of village sanitary facilities,promotion of self-reliance in tribal areas of Visakhapatnam district, andpromotion of science and environmental education in rural schools andcommunities. All are being implemented by well-known, Andhra-basedNGOs (Sidel, 2011).
Philanthropic projects include an Andhra-based agricultural trainingcentre, the KCK Raju Krishi Vigyana Kendra, a ‘young farmers developmentprogramme’ that seeks to train young resource people in improvingagricultural productivity, several adopted villages, most near Nagarjunaplants, and a green belt near its primary fertiliser and chemical productionfacilities.
Beyond these, other organisations concerned with the development ofphilanthropy in Hyderabad and Andhra Pradesh include the CooperativeDevelopment Foundation, which has convened regional and nationaldiscussions on the Societies Registration Acts that govern the formationand operation of many Indian non-profits organisations, and which seeksto support and promote the work of cooperatives.
Child Development
The Foundation for Human and Social Development of the DrReddy’s group—currently the most active corporate philanthropy andsocial responsibility programme in Andhra Pradesh, and one of the mostactive in India—supports a used clothes bank for poor families, initiated inHyderabad and planned for expansion to other major Indian cities,entrepreneurship training for rural women and street children (including aLivelihood Advancement Business School (LABS), a joint venture with thecity of Hyderabad and UNICEF), symposia and other activities on thesocial issue of children at risk, a Child and Police Programme (CAP)intended to reduce child labour, livelihood promotion and microcredit,vocational training, and other activities.

281CAN PHILANTHROPY ACCELERATE TRICKLE DOWN
The new Indian philanthropy seeks, at least in rhetorical terms, to beas socially innovative as its underlying corporate foundations have beeninnovative in the economic and technological arenas. But at least in its earlyyears, this new philanthropy was finding it more difficult to locate andpursue approaches to social innovation than it did in its core businesses.And the pro-state, anti-intermediary and anti-institutional focus of the newIndian philanthropists is under pressure as philanthropic donationsincrease and ways need to be found to evaluate and track grant-making.
IV
Intermediary Philanthropy Organisations
To take care of some of these problems, intermediary organisationssuch as community foundations are under discussion in Ahmedabad,Bangalore, Delhi and elsewhere. Several other intermediary organisationsto assist philanthropy especially corporate philanthropy has already beenestablished. Some examples include:
The Centre for Advancement of Philanthropy (CAP) was established inOctober 1986 to provide professional assistance to philanthropicorganisations in the area of charity laws, effective administration, financialmanagement, taxation, investments and resource mobilisation. The Centrealso undertakes research and critical appraisal of public policies affectingphilanthropy and serves as a clearing-house for information in the field.
The Sampradaan Indian Centre for Philanthropy (SICP), a nationalnon-profit organisation, founded in 1996, dedicated to promoting andstrengthening philanthropy in India. The organisation works to foster co-operation between the state, the corporate sector and civil societyorganisations. It promotes networking among donors and NGOs. Itsstrategic programme areas include networking and advocacy, research anddocumentation, communications, and the promotion of educationalmaterial and campaigns to promote giving.
The National Foundation for India (NFI), established as a non-profit,philanthropic, fundraising and grant-making foundation, supportsvoluntary action for national development. The mission is one ofstimulating and supporting the creative potential of people and community

282 INDIA EMERGING • VEENA JHA
organisations to build a prosperous, progressive and united India. TheFoundation aims to mobilise public opinion as well as resources forsupporting development action, and lays great stress on networkingbetween non-governmental social action groups, the media, the corporatesector and academic and research agencies, and on forging partnershipsbetween organisations sharing similar concerns.
Charities Aid Foundation (CAF) India, which seeks to help create asustainable voluntary sector through the development of resources thatreflect a trusted relationship and shared vision between donors and NGOs.CAF India has pioneered corporate community initiatives with severalcompanies and established payroll giving programmes through its offices inDelhi and Bangalore.
Partners in Change, a not-for-profit organisation that was initiated byActionAid in 1995 with support from the Department for InternationalDevelopment of the British government. Partners in Change seeks toincrease corporate involvement in addressing and remedying the challengesfaced by poor and marginalised communities.
Several other groups, including the United Way of Mumbai, theBusiness and Community Foundation, New Delhi, and the Confederationof Indian Industry (CII)-Social Development and Community AffairsCouncil are prominent intermediaries working to promote and raisecorporate-NGO interface.
V
Legal Provisions for Philanthropy
Charities can be formed in multiple ways and may be subject tovarious acts of legislation. Different legal provisions exist at the nationaland state level. Some states in India have enacted their own law to governcertain forms of charities. NPOs are not permitted to be involved in any‘political activity’. Bombay Public Trusts Act even puts ‘political education’outside the scope of ‘charitable purpose’. However, Section 20 of theSocieties Registration Act allows registration of a society whose object maybe ‘diffusion of political education’ (Agarwal and Dadrawala, 2002). India,being a secular state, does not allow distinction of caste, colour and creed

283CAN PHILANTHROPY ACCELERATE TRICKLE DOWN
in formation of a charity. However, it is possible to create a valid trust forthe benefit of a particular section of the community. Although, this kind oftrust would not enjoy income tax exemption.
As far as law is concerned, the various Trusts Acts, the SocietiesRegistration Act and the Income Tax Act do not mention voluntaryorganisations specifically, but only refer to 110 organisations of ‘CharitablePurpose’. A number of voluntary organisations, though forced to registerunder some of these rather archaic Acts, do not quite identify themselves as‘charitable’ or their work as being for ‘charitable purpose.’ This isparticularly the case with regard to modern development-orientedvoluntary organisations.
Religious trusts established for the benefit of a particular religiouscommunity are also not exempt from income tax. Some of the importantActs governing the charity sector in India are discussed below:
• Public Trusts Acts: Some states (Maharashtra, Gujarat, MadhyaPradesh etc.) have formed their own Public Trusts Acts, whichprimarily control the Public Trusts created in these states. Some ofthese states have also created a Charity Commissioner, whichoperates at state level. The states which do not have their ownlegislation mostly rely on the Indian Trusts Act, 1882, which is anational act and primarily deals with private trusts.
• The Registration of Societies Act, 1860: It is a Central Act butmodified versions operate at state level; ‘Registrar of Societies’ atstate level deals with the registered organisation.
• The Companies Act, 1956: It is a Central Act and Section 25 dealswith non-profit companies. ‘Registrar of Companies’ at state leveldeals with registered organisations under the Act.
• The Income Tax Act, 1961: A Central Act applicable uniformly toall states. It governs tax exempt status of charities as well asexemption available to donations to charities.
• The Foreign Contribution (Regulation) Act, 1975: Regulates receiptand spending of foreign funds. The Ministry of Home Affairshandles registration under this Act.

284 INDIA EMERGING • VEENA JHA
The government is increasingly looking at voluntary organisations toimplement social development projects. But the rules and regulationsgoverning the voluntary sector are not simplified enough to help themfunction effectively. In fact, there are many instances where, thegovernment machinery goes to scuttle the good work done by voluntaryorganisations. In the words of Amartya Sen, the relationship between thetwo is one of ‘cooperative conflict’ (Kothari, 2002).
The tax exemption given to corporate organisations for charitabledonations was curtailed by the Finance Act of 1983, which resulted in adecline in the corporate donations. As an alternate policy, the governmentestablished the National Fund for Rural Development to channel corporatefunding for development activities. Although, the provisions of taxexemptions to the corporate bodies, which contributed money to this fund,existed, the fund did not pick up due to a lack of patronage by thecorporate. Corporate houses preferred setting up their own trusts andvoluntary organisations to donate to and undertake development activities.
Through co-option, the state offered increased funding, allowed moreactivity areas in which the voluntary organisations could be involved andreduced bureaucratic hurdles. Through this, the voluntary organisationswould be dependent on the funding from the state, which would reduce thescope to criticise the state’s policies and action. These policies did have theirimpact and increasing number of voluntary organisations moved away from‘activism’ and adopted ‘development orientation’ with liberal funding bothfrom government as well as international funding agencies, which in manycases routed their resources through the Government of India.
Charity is a matter of state control, so different states in India havedifferent legislations (i.e., trusts or endowment Acts) to govern and regulatepublic charitable voluntary organisations, for example:
• Bombay Public Trusts Act in the state of Maharashtra regulates allpublic charitable trusts. The Act also operates in the state ofGujarat.
• Rajasthan has a Trusts Act of 1959, and Madhya Pradesh has itsown (1951) Act.

285CAN PHILANTHROPY ACCELERATE TRICKLE DOWN
• In certain southern states (e.g. Andhra Pradesh) there areEndowment Acts, whereas a number of southern, northern andnortheastern states in India do not have Public Trusts Act at all.
• The capital of India, New Delhi, does not have Trusts Act tospecifically cover the trusts formed for the public causes. In suchstates, NPOs are registered under the Societies Registration Act(passed by the concerned states) or Section 25 of the CompaniesAct, 1956 or under the Indian Trusts Act.
There is no single law catering to all NPOs in India. The multiplicityof legislations and the web of restrictive provisions in these laws is also anindication of state’s desire to regulate the activities of NPOs.
VI
Is Trickle Down Acceleratedthrough Philanthropy?
Using an econometric model to find out whether higher rates of growthis leading to higher philanthropy, it was found that the per capita incomes in2003/04 across states were affected positively by an aggregation of theprevious period’s income and philanthropy. In other words, the higher thelevel of philanthropy the higher is the trickle down. Interestingly, the initiallevels of per capita income has a much higher coefficient than philanthropy,but per capita philanthropy tends to be higher in the poorer states than inthe richer states. This shows that even though a per cent point increase inper capita philanthropy increases the per capita SDP only by 0.27 of 1 percent, poorer states with higher per capita philanthropy are likely to benefitmore. If such states also start growing at higher rates than the impact ofphilanthropy would be better through better initial conditions.
The trickle down is also affected by the past per capita SDP whichenters the equation with a negative sign. This implies that the positivetrickle-down effects of philanthropy is further heightened in low-incomestates as the higher the previous period’s income the lower is the incomeeffect in future periods in this equation. Thus, the trickle-down effects ofphilanthropy are likely to be positive and higher in low-income states.
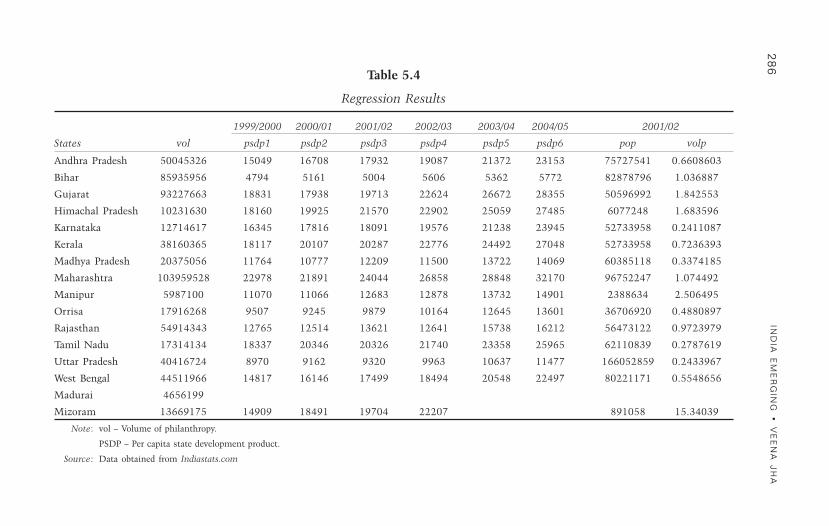
28
6IN
DIA
EM
ER
GIN
G •
VE
EN
A J
HA
Table 5.4
Regression Results
1999/2000 2000/01 2001/02 2002/03 2003/04 2004/05 2001/02
States vol psdp1 psdp2 psdp3 psdp4 psdp5 psdp6 pop volp
Andhra Pradesh 50045326 15049 16708 17932 19087 21372 23153 75727541 0.6608603
Bihar 85935956 4794 5161 5004 5606 5362 5772 82878796 1.036887
Gujarat 93227663 18831 17938 19713 22624 26672 28355 50596992 1.842553
Himachal Pradesh 10231630 18160 19925 21570 22902 25059 27485 6077248 1.683596
Karnataka 12714617 16345 17816 18091 19576 21238 23945 52733958 0.2411087
Kerala 38160365 18117 20107 20287 22776 24492 27048 52733958 0.7236393
Madhya Pradesh 20375056 11764 10777 12209 11500 13722 14069 60385118 0.3374185
Maharashtra 103959528 22978 21891 24044 26858 28848 32170 96752247 1.074492
Manipur 5987100 11070 11066 12683 12878 13732 14901 2388634 2.506495
Orrisa 17916268 9507 9245 9879 10164 12645 13601 36706920 0.4880897
Rajasthan 54914343 12765 12514 13621 12641 15738 16212 56473122 0.9723979
Tamil Nadu 17314134 18337 20346 20326 21740 23358 25965 62110839 0.2787619
Uttar Pradesh 40416724 8970 9162 9320 9963 10637 11477 166052859 0.2433967
West Bengal 44511966 14817 16146 17499 18494 20548 22497 80221171 0.5548656
Madurai 4656199
Mizoram 13669175 14909 18491 19704 22207 891058 15.34039
Note: vol – Volume of philanthropy.
PSDP – Per capita state development product.
Source: Data obtained from Indiastats.com

287CAN PHILANTHROPY ACCELERATE TRICKLE DOWN
Impact of PhilanthrImpact of PhilanthrImpact of PhilanthrImpact of PhilanthrImpact of Philanthropy on Health andopy on Health andopy on Health andopy on Health andopy on Health andEducation Sectors in IndiaEducation Sectors in IndiaEducation Sectors in IndiaEducation Sectors in IndiaEducation Sectors in India
The responsibility of providing education in India mainly rests withthe government. But the vastness of the universe to be covered has lefthuge space for non-profit sector to extend its support. All private, non-government educational institutions in India are run by NPOs, their role ismore pronounced in primary, secondary, adult education and literacyprogrammes.
Nearly 20 per cent of the children between 8-14 years attend a privateschool, or a NPO. The percentage of children attending philanthropicschools are much higher, closer to 50 per cent in the northeast, Punjab,Haryana and Kerala. In other states it is closer to 15 per cent, and is thelowest in West Bengal at 3 per cent (ASER Report, 2007). The quality ofeducation obtained in philanthropic schools is generally considered betterthan government schools.
The private sector plays a major role and accounts for about 80 per centof all primary health care and 40 per cent of tertiary medical care. However,because of lack of a nationwide system of registering either practitioners orinstitutions providing health care in the private and voluntary sectors, it isdifficult to accurately assess impact and extent of services.
Although many look to the government to improve infrastructure andimplement health care, many more turn to provide free clinics andemergency medical treatment. There are believed to be over 7,000 non-profit initiatives providing health care services—from implementingGovernment programmes to providing basic health care or else specific carefor diseases like leprosy and cancer. This excludes a host of rural-basedvoluntary organisations for whom conducting health awareness programmesis a common activity. The corporate sector has opened a number ofcharitable hospitals like the Escorts Heart Institute and Research Centre inNew Delhi, Lupin Human Welfare and Research programme which runs aneffective TB programme and Tata Memorial Hospital, a premier cancerhospital in Mumbai. Many religious institutions and mutts too havestarted hospitals, mostly incorporated as NPOs. Majority of theseinstitutions have a dual policy of collecting high fees from those who couldafford to do so and providing concessions or free medicines to theeconomically weaker groups.
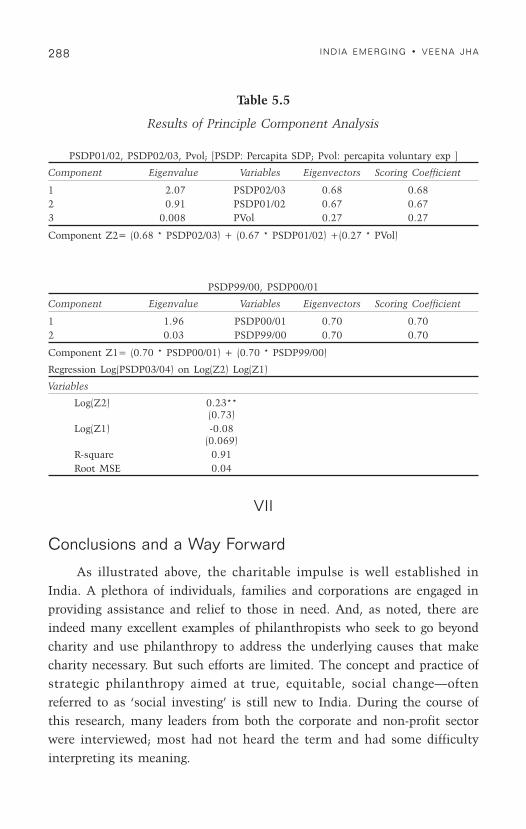
288 INDIA EMERGING • VEENA JHA
Table 5.5
Results of Principle Component Analysis
PSDP01/02, PSDP02/03, Pvol; [PSDP: Percapita SDP; Pvol: percapita voluntary exp ]
Component Eigenvalue Variables Eigenvectors Scoring Coefficient
1 2.07 PSDP02/03 0.68 0.682 0.91 PSDP01/02 0.67 0.673 0.008 PVol 0.27 0.27
Component Z2= (0.68 * PSDP02/03) + (0.67 * PSDP01/02) +(0.27 * PVol)
PSDP99/00, PSDP00/01
Component Eigenvalue Variables Eigenvectors Scoring Coefficient
1 1.96 PSDP00/01 0.70 0.702 0.03 PSDP99/00 0.70 0.70
Component Z1= (0.70 * PSDP00/01) + (0.70 * PSDP99/00)
Regression Log(PSDP03/04) on Log(Z2) Log(Z1)
Variables
Log(Z2) 0.23**(0.73)
Log(Z1) -0.08(0.069)
R-square 0.91Root MSE 0.04
VII
Conclusions and a Way Forward
As illustrated above, the charitable impulse is well established inIndia. A plethora of individuals, families and corporations are engaged inproviding assistance and relief to those in need. And, as noted, there areindeed many excellent examples of philanthropists who seek to go beyondcharity and use philanthropy to address the underlying causes that makecharity necessary. But such efforts are limited. The concept and practice ofstrategic philanthropy aimed at true, equitable, social change—oftenreferred to as ‘social investing’ is still new to India. During the course ofthis research, many leaders from both the corporate and non-profit sectorwere interviewed; most had not heard the term and had some difficultyinterpreting its meaning.

289CAN PHILANTHROPY ACCELERATE TRICKLE DOWN
The potential to promote more—and more strategic—social investmentin India is tremendous. Perhaps more than most other countries, India isready and fertile for the infusion of private funds into developmentinitiatives. The Government of India, more than ever before, is ready forpartnership and has, in fact, opened up key social sectors to third-sectorinvestment. The challenge before the voluntary sector is to evolvemechanisms and strategies for domestic philanthropy and socialinvestment. Communication and fundraising are two sides of a coin. Howeffectively the sector positions itself to attract private investment is thechallenge for this century. There are fairly diverse philanthropicorganisations that address social ills and are competent to championphilanthropic giving. These organisations will, however, need to lookkeenly at addressing issues of mistrust, accountability, transparency andgovernance—critical in hampering partnership and investments fordevelopment.
More specifically, the following obstacles and barriers need to beaddressed in order to promote social investing.
Knowledge and Information GapKnowledge and Information GapKnowledge and Information GapKnowledge and Information GapKnowledge and Information Gap
The single largest deterrent to promoting social investing is theexisting knowledge gap in philanthropy. Data on the sources, amounts,recipients and impact of philanthropy simply does not exist. By way ofexample, there is no study on the numbers, activities and contribution ofthe many family foundations and trusts in India. Without suchinformation, the ‘big philanthropists’ will continue to get the spotlight,perhaps overlooking the extensive contributions of others. And withoutsuch knowledge, it is difficult to effectively make a case for the potentialroles of private investing in the social space.
PhilanthrPhilanthrPhilanthrPhilanthrPhilanthropic Infrastructuropic Infrastructuropic Infrastructuropic Infrastructuropic Infrastructureeeee
With the exception of the Ford Foundation in India, Charities AidFoundation, the Sir Ratan Tata Trust and Sir Dorabji Tata Trust, feworganisations or funding agencies have invested in the promotion ofphilanthropy in India. Organisations promoted/funded by these agencieshave a long way to go before they can become sustainable. Establishing a newinstitution or developing the capacity of an existing organisation to support

290 INDIA EMERGING • VEENA JHA
philanthropy in ways similar to the Philanthropic Initiative in Boston orsimilar ‘one stop institutions’ is critical to the promotion of social investing.
In addition, there are too few (only a handful) of philanthropyprofessionals in India. While ‘Moving Away From Aid’ is the new mantraof the Indian Government, there are few ideas and resources to strengthenlocal resource mobilisation, skills and knowledge. A second tier of resourcepersons in philanthropy is virtually absent. For effective and sustainablesocial investment, an investment in building human resources/philanthropy professionals is critical.
LLLLLegal and Regulatoregal and Regulatoregal and Regulatoregal and Regulatoregal and Regulatory Changesy Changesy Changesy Changesy Changes
Two major issues facing NPOs in India are archaic laws and excessivegovernment control. Consistent efforts are needed to advocate for a moreenabling and encouraging legal environment.
Current laws—e.g., the Societies Registration Act (1860) and thePublic Trusts Act—date to 1860 and do not adequately cover organisationsworking in areas of developmental support and activities. Even the federalIncome Tax Act grants tax exemptions only to organisations having a‘charitable purpose’. Developmental organisations today undertake wide-ranging activities, including research, documentation and training as wellas the operation of development programmes. The Societies RegistrationAct, which was initially conceptualised in 1860 as a membership forum forprofessional and fraternal associations working in areas of literature,science, etc., is hardly a suitable choice for registering development-implementing agencies. As a result, organisations addressing the wide andvaried issues facing modern society experience considerable frustration.There is a need for a separate legislation under which voluntaryorganisations working in the field of development can register themselves.
In India today, excessive government oversight and bureaucraticrequirements also limits the effectiveness and efficiency of voluntaryorganisations. NPOs must register with and report to a number ofgovernment authorities. At the state level, the organisation has to registereither with the Office of the Charity Commissioner, the Registrar ofSocieties, or the Registrar of Companies. At the federal level, they mustregister with the income tax authorities and if they receive foreign

291CAN PHILANTHROPY ACCELERATE TRICKLE DOWN
contributions, then they must also register with the Home Ministry.Separate returns must be filed annually with all three authorities.
While a friendlier Foreign Exchange Management Act (FEMA) hasreplaced the Foreign Exchange (Regulation) Act (FERA) applicable tocommercial organisations, the Foreign Contribution (Regulation) Act orFC(R)A continues to be a ‘thorn in the flesh’ for most NPOs. There areendless delays in granting registration under the FC(R)A and organisationsthat are less than three years old are even refused registration. Even ‘priorpermission’ to receive foreign funds is often denied without ascribing anyreason.
In addition, while it is beyond the scope of this paper to review tax lawin detail, it is worth noting that the tax deductions for philanthropiccontributions are probably not sufficient to promote greater levels ofphilanthropy. For example, the tax rebate of 50 per cent is no longerattractive for corporate donors, especially since corporate taxes have beenreduced.
India’s economic and political liberalisation has opened doors forprivate participation in spheres hitherto the province of the state. Suchparticipation has brought a sea change in areas such as education and health.However, to tap these sources effectively government support will be crucial.
It must also be recognised that so far philanthropy has been directed tobetter governed states which have a good climate for investment. This mayhave exacerbated inter-state inequalities. It is necessary to direct policies thatwould target the states which are relatively worse off such as Bihar andOrissa, Madhya Pradesh and possibly West Bengal. This would requireorganisations which can deliver philanthropic outcomes in a positive andtransparent manner. Moreover, the use of philanthropic cover for terroristand anti-social activities also needs to be curbed. It must also be noted thatwhile corporate philanthropy, especially the new corporate philanthropy isdelivering better public services, it may also lead to rent- seeking behaviourfor commercial purposes by the corporate entities. Corporate philanthropyhas extended the reach of new IT firms much beyond that of mere business.Besides while partnership with the government is desirable, it may reducethe capacity of the third sector to raise issues about faulty government
292 INDIA EMERGING • VEENA JHA
practices and policies. On the other hand the third-sector risks becoming justanother wing of the government.
Strategic Diasporic PhilanthrStrategic Diasporic PhilanthrStrategic Diasporic PhilanthrStrategic Diasporic PhilanthrStrategic Diasporic Philanthropyopyopyopyopy
A critical weakness in diasporic philanthropy (even the newer andbetter endowed organisations) is a lack of a strategic view on how best toleverage the philanthropy. The example of Bangalore where the new high-tech philanthropy has been involved in augmenting municipal services is agood example in this regard. It is one thing to give money for the healthand education of slum children and quite another to give money to changethe book-keeping practices of Bangalore Development Authority from singleentry to double entry book-keeping and reforming property tax systems;and in this process sharply turning around the financial fortunes ofBangalore city. This strategic philanthropy has considerably increased thelocal government’s overall resources, thus augmenting resources for publicservices consumed by the poor. It must be re-emphasised that the greaterpart of public services for the poor still comes directly or indirectly from thestate. Consequently strategic investments by NGOs which reshape statepolicies, priorities and the quality and quantity of public expenditure canhave more far-reaching effects than what an NGO might do directly withthe same money.
However, one should be careful that attempts to strategically leveragediasporic philanthropy result in a broad increase in societal welfare and notan amplification of existing inequities. The strategic intervention shouldfocus particularly on those areas which extend the horizons (or equivalentlythe discount rate). The intervention of Rockefeller and Ford Foundation inthe 1950s and 1960s in agricultural research and scientific institution is acase in point. The returns were extremely high to Indian society as awhole. However, in recent years groups like the Ford Foundation have beenmore reluctant to support long-term institution building efforts specially inareas like scientific research (however, the Gates Foundation may be fillingthis gap). Funding for institution strengthening is also hard to come by. Itis much easier to persuade to give funds to a specific village or for theeducation of a specific child. It is much harder to do so to strengthen anorganisation so that it can hire better professionals who, in turn, canincrease the long-term effectiveness of the organisation.
293CAN PHILANTHROPY ACCELERATE TRICKLE DOWN
ReferencesActionAid India (2001). Changes (Special Issue by Partners in Change). October-December.
Agarwal, Sanjay and Noshir Dadrawala (2002). Philanthropy and Law in India. http://uttardayee.freewebspace.com/Handbooks/PALISA/3. per cent20India.pdf
AIESEC & Business and Community Foundation (1999). Corporate Social Responsibility:Initiatives and Future Challenges. Background note to national seminar. February.Delhi: AIESEC & Business and Community Foundation.
Ambrose, Natalie (2005). An Overview of Global Philanthropy. Council of Foundations.http://www.cof.org/files/Documents/Family_Foundations/Family-and-Global-Philanthropy/Overview-of-Global-Philanthropy-COF.pdf
ASER (2007). Annual Status of Education Report. Produced by Pratham. http://www.pratham.org.uk
Asia Pacific Philanthropy Consortium (2001). “Strengthening Philanthropy in the AsiaPacific: An Agenda for Action”, Background Paper: India. September. http://unpan1.un.org/intradoc/groups/public/documents/apcity/unpan005483.pdf
Business & Community Foundation (2000). Managing and Sustaining Partnerships forSustainable Development.
CAP (Center for the Advancement of Philanthropy) (1993). Philanthropy: Newsletter ofthe Center for Advancement of Philanthropy. No. 30.
————. (1994). Philanthropy: Newsletter of the Center for Advancement of Philanthropy34, 35 & 39.
————. (1995). Philanthropy: Newsletter of the Center for Advancement of Philanthropy 43.
————. (1998). Philanthropy: Newsletter of the Center for Advancement of Philanthropy. 56.
————. (1999). Philanthropy: Newsletter of the Center for Advancement of Philanthropy66, 67.
————. (2001). Philanthropy: Newsletter of the Center for Advancement of Philanthropy74, 75, 76, 77, 78 & 79.
————. (2001a). Laws Governing Voluntary Organisations in India.
————. (2002). Philanthropy: Newsletter of the Center for Advancement of Philanthropy80.
Charities Aid Foundation (CAF-India) (2000). Dimensions of Voluntary Sector in India:CAF’s Validated Database 2000. New Delhi: CAF-India.
————. (2002). CAF-India Annual Report. 2000-01. March. New Delhi: CAF-India.
————. (2003). Working with the Non-Profit Sector in India. New Delhi: CAF-India.
Chaturvedi, T.N. (2008). Voluntary Organizations and Development: Their Role andFunctions. Catalyst Resources in book edited by Noorjahan Bawa on non-governmental Organisation in Development: Theory and Practice, KanishkaPublications, India.
Cherian, Mathew (2002). Dimensions of Voluntary Sector in India. New Delhi: CharitiesAid Foundation-India.
CII (Confederation of Indian Industry) (2001). Corporate Social Responsibility in SouthAsia: Mapping the Ground. September. New Delhi: Confederation of Indian IndustryConference.
————. (2001a) Business as a Social Partner: A Compendium of Case Studies. VolumeIII. December. New Delhi: Confederation of Indian Industry.

294 INDIA EMERGING • VEENA JHA
Copal Partners (2006). India’s Charity Sector: An Overview and Analytical Approach.http://www.oneworldtrust.org/csoproject/images/documents/INDA5.pdf
Culshaw, Murray (1998) (Compiled). Profile 300: Selected Voluntary Organizations inIndia. Mumbai: Center for Advancement of Philanthropy.
————. (2002a). Growth of Fundraising in India: A Presentation. Agra: The ResourceAlliance Conference. March.
————. (2002b). International Support for Philanthropy in India: An Overview. CatalystResources. March.
Dadrawala, Noshir (1996). Management of Philanthropic Organizations. Bombay: Centerfor Advancement of Philanthropy.
————. (2001). “Strengthening Philanthropy in the Asia Pacific: An Agenda for Action”,Background Paper: India. Asia Pacific Philanthropy Consortium. Bali, Indonesia.September. http://www.asiapacificphilanthropy. org/files/backgrounder_ india.pdf
Dalal, Ajit K. (2006). “Psychosocial Interventions for Community Development”, in G.Misra (ed.), Psychology in India. Volume 3. New Delhi: Pearson. http://ipi.org.in/texts/ajit/dalal-psychosocial-interventions-for-community-development.pdf
Das, Gurcharan (2002a). The Elephant Paradigm: India Wrestles with Change. New Delhi:Penguin India.
————. (2002b). India Unabound. New Delhi: Penguin India.
Dasgupta, Sugata (1967). “The Professional Social Work Approach”, in Sugata Dasgupta(ed.). Towards a Philosophy of Social Work in India. New Delhi.
Desai, Chitra (1999). Gandhi’s Concept of Social Welfare. http://www.gandhi-manibhavan.org/activities/essay_socialwelfare.htm
Dongre, Yashavantha (2003). “Individual Giving as Rational Choice: A Study of High SalariedUrban Population in India”, Masayaki Deguchi (ed.), The Role of Volunteering and theNon-Profit Sector in Building Communities. Tokyo: Teansart. pp.135-146.
Donor Agency Network (1997). Report of the National Consultation of Donor Agencies.July. Bangalore: Donor Agency Network.
Drèze, Jean and Amartya Sen (1996). India: Economic Development and SocialOpportunity. New Delhi: Oxford University Press.
————. (2002). India: Development and Participation. New Delhi: Oxford University Press.
Gangadharan, Nalini (2002). Building an Enabling Environment for Local ResourceMobilisation: A Presentation. Agra: The Resource Alliance Conference, March.
Geithner, Peter F., Lincoln C. Chen M.D. and Paula D. Johnson (eds.) (2004). DiasporaPhilanthropy and Equitable Development in China and India. Harvard UniversityPress. http://www.globalenvision.org/library/5/819
Gore, M.S. (1989). “Historical Background of Social Work in India”, in Sumitra Gupta (ed.),Social Welfare in India..
Government of India (2002). National Human Development Report 2001. PlanningCommission. New Delhi: Oxford University Press.
Grand Metropolitan PLC. (1994). Grand Metropolitan: Community Involvement. GrandMetropolitan PLC.
High Level Committee on Indian Diaspora (2001). The Report of the High LevelCommittee on Indian Diaspora. New Delhi: Indian Council of World Affairs.
India Health Report 2003. New Delhi: Oxford University Press

295CAN PHILANTHROPY ACCELERATE TRICKLE DOWN
Johnson, Paula (2001). Global Social Investing: A Preliminary Overview. The PhilanthropyInitiative.
Kamali, N. (2009). “India’s 100 Richest”, http://www.forbes.com/2009/11/18/india-100-richest-india-billionaires-09-wealth-intro.html, 18 November 2009.
Kapur, Devesh (2003). “Indian Diasporic Philanthropy: Some Observations”, Papercommissioned by the Global Equity Initiative for the Diaspora Philanthropy to Chinaand India workshop. May.
Kothari, U. (2002). “Feminist and Postcolonial Challenges to Development”, in U. Kothariand M. Minogue (eds.), Development Theory and Practice: Critical Perspectives.Palgrave. pp.35–51.
Mahindra, Anand (2002). Business Today, Collector’s Edition. Volume II.
Lala, R.M. (1981). The Creation of Wealth. Bombay: India Book House.
————. (1998). The Heartbeat of a Trust. New Delhi: Tata McGraw-Hill.
Norton, Michael (1996). The Non-Profit Sector in India. Kent: Charities Aid Foundation-International
Nayyar, Sanjeev (2010). Do Foreign Contributions To India Impact National Security:FCRA Report 2007-08. April 13. Email: [email protected]. http://www. esamskriti.com/essay-chapters/Do-foreign-contributions-to-India-impact-national-Security-FCRA-Report-2007~2008-1.aspx
Norton, Michael and Murray Culshaw (2000). Getting Started in Fundraising. New Delhi:Sage Publications.
Oza, D.K. (1991). Voluntary Action and Gandhian Approach. New Delhi: National Book Trust.
Partners in Change (PIC)(2000). The Business of Social Responsibility: The Why, Whatand How of Corporate Social Responsibility in India. Harsh Shrivastava & ShankarVenkateswaran. Bangalore: Books for Change.
PRIA (2000). Defining the Sector in India: Voluntary, Civil or Non-profit. New Delhi:Society for Participatory Research in Asia.
————. (2001). Historical Background of the Non-Profit Sector in India. New Delhi:Society for Participatory Research in Asia.
————. (2002). Invisible, Yet Widespread: The Non-Profit Sector in India. New Delhi:Society for Participatory Research in Asia.
PWC and PIC (PricewaterhouseCoopers & Partners in Change) (1999). SocialResponsiveness Award: Documents for the Jury. PricewaterhouseCoopers &Partners in Change.
SAFRG (South Asian Fund Raising Group) (1997). Philanthropy in a Changing World: AReport. 9th South Asian Fund Raising Workshop. September. Hyderabad.
————. (2000). Resource Mobilization for Voluntary Organizations in India. June. SouthAsian Fund Raising Group.
Salamon, Lester M. and Helmut K. Anheier (1997). Defining the Non-Profit Sector: ACrossnational Analysis. Manchester: Manchester University Press.
Salamon, Lester M., S. Wojciech Sokolowski and Regina List (2003). Global Civil Society: AnOverview. Johns Hopkins Center for Civil Society Studies. p.22. www.jhu.edu/~ccss.
Sarwal, Tarun (2000). Mapping Exercise for the National Local Resource MobilizationNetwork. April.
Sen, Amartya (1999). Resources, Values and Development. New Delhi: Oxford UniversityPress.

296 INDIA EMERGING • VEENA JHA
————. (2000). Development as Freedom. New Delhi: Oxford University Press.
Sharma, Sanjay (2001). Famine, Philanthropy and the Colonial State: North India in theEarly Nineteenth Century. New Delhi: Oxford University Press.
Sheth, Arpan (2010). An Overview of Philanthropy in India. March 19. Bain and Company.
Shourie, Dharam (2003). “IIT gets $6 mn from its Alumni”, Press Trust of India. Sunday,January 19. http://www.expressindia.com/fullstory.php?newsid=18492
Shiveswarkar, Shymala (2002). Paper presented at the preparatory conference for theWorld Summit on Sustainable Development. 29 May. Bali.
————. (2004). Mapping for Diaspora Investment in the Social Development Sector inIndia. New Delhi: CAF India.
SICP (Sampradaan-Indian Center for Philanthropy) (1997a). “Charity for Social Changeand Development: Essays on Indian Philanthropy”, Occasional Paper No. 1. April.New Delhi: Sampradaan-Indian Center for Philanthropy.
————. (1997b). “Women and Philanthropy in India: Essays on Indian Philanthropy”,Occasional Paper No. 2. April. New Delhi: Sampradaan-Indian Center for Philanthropy.
————. (1998). Sir Ratan Tata Trust. (India Foundations Series). New Delhi: Sampradaan- Indian Center for Philanthropy.
————. (1999). K.K Birla Foundation. (India Foundations Series). New Delhi: Sampradaan- Indian Center for Philanthropy.
————. (2000a). Bombay Community Public Trust. (India Foundations Series). NewDelhi: Sampradaan-Indian Center for Philanthropy.
————. (2000b). Our Community Our Responsibility: An Introduction to CommunityFoundations. November. New Delhi: Sampradaan-Indian Center for Philanthropy.
————. (2000c). Population Foundation of India (India Foundations Series). New Delhi:Sampradaan-Indian Center for Philanthropy.
————. (2000d). Rashtriya Gramin Vikas Nidhi (India Foundations Series). New Delhi:Sampradaan-Indian Center for Philanthropy.
————. (2000e). “Religious Philanthropy and Organized Social Development Efforts in India”,Occasional Paper No. 3. July. New Delhi: Sampradaan-Indian Center for Philanthropy.
————. (2001a). Bhoruka Charitable Trust (India Foundations Series). New Delhi:Sampradaan-Indian Centre for Philanthropy.
————. (2001b). Directory of Donor Organization. 2nd edition. New Delhi: Sampradaan-Indian Center for Philanthropy.
————. (2001c). Investing in Ourselves: Giving and Fund Raising in India. New Delhi:Sampradaan-Indian Center for Philanthropy.
————. (2001d). National Foundation for India (India Foundations Series). New Delhi:Sampradaan-Indian Center for Philanthropy.
————. (2002). Sampradaan: Indian Center for Philanthropy Newsletter 24. January-February.
Sidel, Mark (2001). New Economy Philanthropy in the High Technology Communities ofBangalore and Hyderabad, India: Partnership with the State and the AmbiguousSearch for Social Innovation. University of Iowa College of Law and Obermann Centerfor Advanced Studies. http://www.rockarch.org/publications/conferences/sidel.pdf
————. (2003). Diaspora Philanthropy to India: A Perspective from the United States.Global Equity Initiative, Harvard University.

297CAN PHILANTHROPY ACCELERATE TRICKLE DOWN
SmithKline Beecham (1998) SmithKline Beecham and the World Health Organization toCollaborate in Seeking to Eliminate One of the World’s Greatest Scourges:Lymphatic Filariasis (Elephantiasis). 26 January. Press Release, London.
South Asian Fund Raising Group (2000). A Guide to Resource Mobilisation for VoluntaryOrganisations in India.
Social & Rural Research Institute (SRRI) (2000). Report on Survey on CorporateInvolvement in Social Development in India. Indian Market Research Bureau. NewDelhi: Partners in Change.
SRTT (Sir Ratan Tata Trust) (2001). Sir Ratan Tata Trust: Annual Report 2000-01. Mumbai:Sir Ratan Tata Trust.
Srivastava, H. and V. Shankar (2000). The Business of Social Responsibility: Partners-in-Change.
Sundar, Pushpa (2000). Beyond Business: From Merchant Charity to CorporateCitizenship. New Delhi: Tata McGraw-Hill.
Thapar, Romila (ed.) (2000). India: Another Millennium?. New Delhi: Viking.
Vaidyanathan, A. (2003). India’s Economic Reforms and Development. New Delhi:Academic Foundation.
Viswanath, Priya (1999). Scoping Study on Socially Responsible Business. Departmentfor International Development (DFID), UK.
————. (2002a). From Managing Investments and Assets in Financial Markets to SocialFund Management: Providing Leadership to the New United Way of Mumbai.Mumbai : Centre for Advancement of Philanthropy.
————. (2002b). “Sir Ratan Tata Trust: A Presentation”, Asia Confers2 CAFO: Givingwith a Difference in Asia. Hong Kong.
————. (2003). Diaspora Indians: On the Philanthropic Fast-Track. Mumbai: Centre forAdvancement of Philanthropy.
Viswanath, Priya and Noshir Dadrawala (2004). Philanthropy and Equity: The Case ofIndia. Global Equity Initiative, Harvard University. June. http://www.wingsweb.org/download/Phil_India_Case.pdf
Voluntary Action Network of India (2000). Social Action, An Indian Panorama.
World Bank (2000). India: Reducing Poverty, Accelerating Development. A World BankCountry Study. New Delhi: Oxford University Press.
Useful Websiteswww.cozUcare.orgwww.cozUcare.org/capwww.indev.nic.inwww.indev.nic.in/icpwww.propoor.orgwww.indianngos.comhttp://planningcommission.nic.in/www.accountaid.netwww.ngoresearch.orgwww.bcfindia.org

298 INDIA EMERGING • VEENA JHA
www.cafonline.org/cafindiawww.mssf.orgwww.nfidel.tripod.comhttp://actionaidindia.orgwww.cfar.umd.edu/~venue/NFIwww.pria.org/cgi-bin

Governance IssuesGovernance IssuesGovernance IssuesGovernance IssuesGovernance Issuesand Pand Pand Pand Pand Public Public Public Public Public Policyolicyolicyolicyolicyin Tin Tin Tin Tin Trickle Downrickle Downrickle Downrickle Downrickle Down
Despite the global economic crisis, there are grounds for optimism withregard to growth momentum and stability over the medium-term in India.The regular increase in gross domestic savings and total factor productivity(TFP) over the last 20 years1 indicate increasing level of potential output.There are discernible elements of self-sustaining and acceleratingcompetitive strengths, as evident from increasing global presence of Indiancorporates and interest of global companies (UNCTAD, 2009) in India. Thesavings and investments balance as well as the external sector reflect thestrength and the resilience in the Indian economy. However, the persistentfiscal and trade deficits over the past two years have weakened the capacityof the Indian economy to bear risks. The microstructural reformsundertaken in the real economy are bearing fruits in some states resultingin double-digit annual growth in their domestic product. Other states aretrying to follow the example of these growth pioneers.
There are certain ‘not easily quantifiable strengths’ which the Indianeconomy possesses. A vast pool of science and technology graduates and themillions of people who are familiar with the english language are sources ofstrength. The familiarity with multiple languages in India prepares its peopleto adapt better to multicultural situations, making it easier for them to fitinto international systems smoothly. The political climate is characterisedby, what may be termed as, political system stability. India will remain oneof the youngest countries in the world in the next few decades. This‘demographic dividend’ is seen as an inevitable advantage provided pre-
66666
1. Reserve Bank of India, Annual Report-2009-10. http://rbi.org.in/scripts/AnnualReportPublications.aspx

300 INDIA EMERGING • VEENA JHA
requisites such as skill upgradation and sound governance to realise it are putin place. In terms of business environment, the impressive growth coupledwith market orientation of the economy has been a bottom-up exercise witha very broad-based and growing entrepreneurial class, including in theinformal sector. However persistent inflation, especially the rise in prices offood and other essentials, over the past two years has diminished thecapacity of the Indian economy to trickle down growth.
For some, Indian economic progress signifies the beginnings of amajor economic powerhouse in the world. But this optimism over themedium-term has to be tempered by inadequate basic nutrition, cleanwater, safer sanitation, minimal housing, personal security and individualdignity for millions in India. The prospects for growth and stability in Indiaare great, but greater are the challenges in fulfilling the very basic objectivesof public policy (Reddy, 2003).
If we take a bird's eye view of the Indian economy, the unemploymentrate based on periodical surveys shows an increase both in the rural andurban areas over the last 15 years, with sharper increase in the rural areas,reflecting a slowdown in agriculture. However, this does not take intoaccount the growth in employment and wages in the informal sector as wasshown in Chapter 1. The result of this increase in informal employment hasbeen a decrease in poverty. While there has been a significant reduction inthe poverty ratio, the number of poor is still high. In addition, poverty lineshave been moved up to over US $2 a day. This would show no improvementin poverty rates as there is no retrospective correction for poverty rates of thepast years.2 Even if we ignore the controversy surrounding the estimates onthe poverty ratio, the high rate of inequality calculated at close to a Gini ofnearly 0.5 recently is a worrying phenomena (Himanshu, 2010). Naturally,the overarching priority for public policy is creating employment andreducing poverty and does not address directly the question of inequality. AsMichael Walton of the Kennedy School of Government argues, the realobstacles to growth in India will be structural inequalities that result fromthe inefficiency of institutions, particularly market and public institutions.Structural inequalities revolve around identity-based differences (such as
2. Economic Times, 12th October 2009. Published by the Times of India Group, NewDelhi, India.
301GOVERNANCE IS SUES AND PUBLIC POLICY IN TRICKLE DOWN
caste, religion), spatial inequalities (across states and even within states) andacross skills (Walton, Forthcoming). Public policy for reducing poverty inIndia range from public distribution of food grains, rural employmentguarantee schemes, education and health schemes. However, the success ofthese schemes has been mixed at best and certainly not in keeping with thevast expenditure on these schemes.
There is a growing recognition in India that governance reforms arecritical to strengthen state capacity and enable it to perform its core functionsof public service delivery. The development of physical infrastructure is alsoone of the core functions of the government. The task of improvinginstitutions of economic governance comprise, among others, many actionsessential for efficient functioning of markets. The business community has,therefore, a vital stake in improving and empowering public institutions. Thischapter explores governance issues associated with public policy aimed atpoverty reduction. These policies are variously described as provision of socialservices, provision of social amenities or the common minimum programmeof the Government of India. The question it seeks to answer is whethergovernance deficit should change the design of policy itself?
What is Good Governance?
Good governance can mean different things to different countries andcan have different implications for policy and administrative reforms(Jabeen, 2007). While the ideological and theoretical basis of diverse viewson governance is the same, they differ in their approach. Some focus on thenormative (Kaufmann and Paublo, 1999; HDC, 1999; World Bank, 1999)others on the descriptive aspects of governance (Hyden and Court, 2002;UNDP, 1997). To some process is more important while to others outcome.Some focus on rules while others are inclined to concentrate onimplementation of rules. The notion of good governance, as it is being usedin India draws basically on two distinct but overlapping views on governanceoriginating from the World Bank and the United Nations DevelopmentProgramme (UNDP).
The World Bank (1992) defines governance as ‘the manner in whichpower is exercised in the management of a country's economic and socialresources.’ It has identified three distinct aspects of governance: (1) the

302 INDIA EMERGING • VEENA JHA
form of the political regime; (2) the process by which authority is exercisedin the management of a country's economic and social resources fordevelopment; and (3) the capacity of governments to design, formulate, andimplement policies and discharge functions. Although the Bank identifiedpolitical, administrative and economic aspects of governance, it did notinclude the political aspects in its policies until recently. The World Bankhas its own methodology of assessing the quality of governance popularlyknown as Worldwide Governance Indicators (WGI). The six indicators usedin the latest governance assessment are: (1) voice and accountability, (2)political stability, (3) government effectiveness, (4) regulatory quality, (5)rule of law, and (6) control of corruption. These six dimensions cover thepolitical, economic and institutional aspects of governance. Theseindicators are normative and have a high association with democracy andeconomic development (Kaufmann and Kraay, 2007).
UNDP (1997) defines governance 'as the exercise of economic,political, and administrative authority to manage a country's affairs at alllevels.' It comprises mechanisms, processes and institutions through whichcitizens and groups articulate their interest, exercise their legal rights, meettheir obligations and mediate their differences. This definition clearlyidentifies three governance arenas: political, economic and administrative.In its Human Development Reports, UNDP's Human Development Centre(HDC) defined good governance from the standpoint of humandevelopment. According to this definition, good humane governance is onewhich promotes human development. Humane governance is measured bythe Human Governance Index (HGI), a composite measure of political,economic and civic governance.
The second extension of UNDP's view of governance has appeared inthe form of a working definition for the World Governance AssessmentProject (WGA). Drawing on the system perspective on politics (Easton,1965), Hyden and Court identified six dimensions of governance with sixcorresponding institutional arenas. While the governance dimensions aresocialising, aggregating, executive, managerial, regulatory and adjudicatory,the institutional arenas are civil society, political society, government,bureaucracy, economic society and judicial system. Good governancefocusses on the formal and informal rules in each governance arena. UnderWGA, quality of governance is assessed on the basis of six universally

303GOVERNANCE IS SUES AND PUBLIC POLICY IN TRICKLE DOWN
accepted values—accountability, transparency, participation, decency,fairness and efficiency—in each of the six governance arenas. The authorsclaim that this assessment approach provides a descriptive rather thannormative tool for assessing the quality of governance in a country withinits own institutional context.
Grindle (2004) has presented a strong case for good enoughgovernance as a goal of good governance. She argued that a generic notionof good governance has generated an ambitious reform agenda withoutaddressing basic questions such as what needs to be done, when it needs tobe done, and how it needs to be done. Good enough governance is defined'as a condition of minimally acceptable level of government performanceand civil society engagement that does not significantly hinder economicand political development and that permits poverty reduction initiatives togo forward' (Grindle, 2004: 526). She argues that this definition may servedeveloping countries better, even though it is imprecise.
Surveys on Good Governance in India
Because operating conditions in India are significantly different fromdeveloped countries it is often argued that governance concepts need to beadapted. Indigenisation does not mean rejection of the concept of goodgovernance, it means developing a strategy and viable action plan for goodgovernance suitable to the institutional context of India. Indian culturalcontext may best be characterised by one where merit is often sacrificed tonepotism popularly known as bhaichara.
In India, paying bribes for obtaining legal or illegal, formal or informallicences and certificates is a common phenomenon. The findings of a survey ongovernance in India quoted comments of an Indian elite that, 'right from birth todeath nothing happens without bribery and corruption. People can neither livenor die with dignity' (Court, 2001). The Bofors scandal in India involved twoformer prime ministers in corruption (Human Development Centre, 1999).
Several surveys have been conducted on governance in India. Some ofthe better known international surveys are summarised below:
1) The governance assessment conducted by the Dr Mahbub ul HaqHuman Development Centre using the HGI calculated governanceassessment for 58 countries on which data was available. According
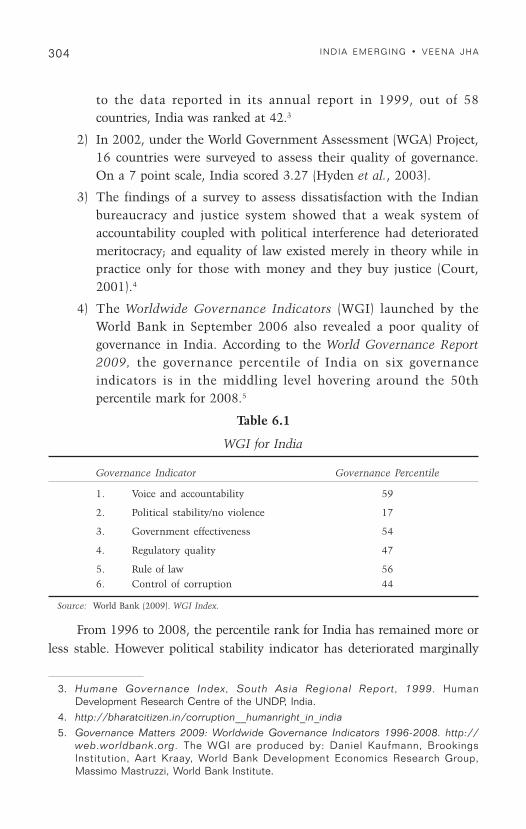
304 INDIA EMERGING • VEENA JHA
to the data reported in its annual report in 1999, out of 58countries, India was ranked at 42.3
2) In 2002, under the World Government Assessment (WGA) Project,16 countries were surveyed to assess their quality of governance.On a 7 point scale, India scored 3.27 (Hyden et al., 2003).
3) The findings of a survey to assess dissatisfaction with the Indianbureaucracy and justice system showed that a weak system ofaccountability coupled with political interference had deterioratedmeritocracy; and equality of law existed merely in theory while inpractice only for those with money and they buy justice (Court,2001).4
4) The Worldwide Governance Indicators (WGI) launched by theWorld Bank in September 2006 also revealed a poor quality ofgovernance in India. According to the World Governance Report2009, the governance percentile of India on six governanceindicators is in the middling level hovering around the 50thpercentile mark for 2008.5
Table 6.1
WGI for India
Governance Indicator Governance Percentile
1. Voice and accountability 59
2. Political stability/no violence 17
3. Government effectiveness 54
4. Regulatory quality 47
5. Rule of law 566. Control of corruption 44
Source: World Bank (2009). WGI Index.
From 1996 to 2008, the percentile rank for India has remained more orless stable. However political stability indicator has deteriorated marginally
3. Humane Governance Index, South Asia Regional Report, 1999. HumanDevelopment Research Centre of the UNDP, India.
4. http://bharatcitizen.in/corruption__humanright_in_india5. Governance Matters 2009: Worldwide Governance Indicators 1996-2008. http://
web.worldbank.org. The WGI are produced by: Daniel Kaufmann, BrookingsInstitution, Aart Kraay, World Bank Development Economics Research Group,Massimo Mastruzzi, World Bank Institute.

305GOVERNANCE IS SUES AND PUBLIC POLICY IN TRICKLE DOWN
over the 12 years, whereas control of corruption indicator has improvedmarginally. This indicates that India has not improved its governancesignificantly. On a scale of -2.5 to 2.5, India's average governance indicatoris -0.02 again indicating its middling level of governance.6
India ranked 72 among 180 nations in the year 2007 in terms ofcorruption index, according to Transparency International (TI). TI India'sIndia Corruption Study 2005 found that water was one of the publicservices, which is ridden with corrupt practices.7
With these middling scores on governance would India satisfy thecriteria for Grindle's definition of ‘good enough’ governance. It wouldappear from the above evidence that India does have a little above theminimum level of governance required to deliver social development.However, its governance deficits have to be judged against the criterion ofwhether it is good enough to trickle-down growth to the poorest of thepoor? The slow trickle down especially in comparison to similar countries(see Figure 6.1) shows that India needs much better governance forimplementing its trickle down policies. What is missing? Is it the lack ofwill or the ability of the Indian government to implement these policies. Is ita question of accountability and lack of institutions to hold the governmentaccountable. Besides the lack of will and ability of the government and civilsociety to monitor the effects of its own policies, there are other reasons whygovernment policies have not trickled down to the poor.
So What is Going Wrong in India?
For an economy which has grown at over 7 per cent over the last 15years (1994-2009), why has poverty reduction been so slow. CompareIndia's poverty reduction with that of Vietnam or China.8 India'sperformance seems abysmal. In fact Figure 6.1 compares India with othercountries in terms of human development indicators (HDI) over a period oftime. While the post-2005 high growth period is not captured by thisanalysis, the trend over time shows that HDI in India has been slow tomove upwards. From the various Human Development Reports of the
6. Ibid.7. www.transparency.org8. See Figure 6.1.
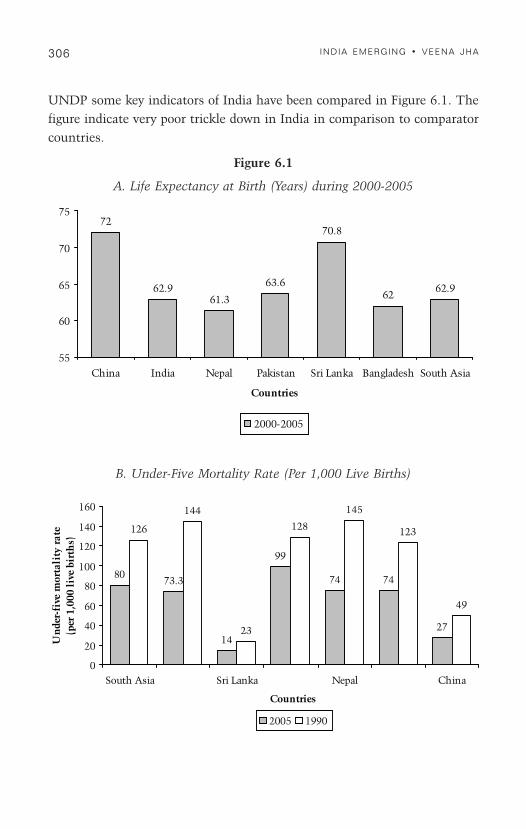
306 INDIA EMERGING • VEENA JHA
UNDP some key indicators of India have been compared in Figure 6.1. Thefigure indicate very poor trickle down in India in comparison to comparatorcountries.
Figure 6.1
A. Life Expectancy at Birth (Years) during 2000-2005
B. Under-Five Mortality Rate (Per 1,000 Live Births)
72
62.961.3
63.6
70.8
6262.9
55
60
65
70
75
China India Nepal Pakistan Sri Lanka Bangladesh South Asia
Countries
2000-2005
8073.3
14
99
74 74
27
126
144
23
128
145
123
49
0
20
40
60
80
100
120
140
160
South Asia Sri Lanka Nepal China
Countries
Un
der-
five
mor
tali
ty r
ate
(per
1,0
00 l
ive
birt
hs)
2005 1990
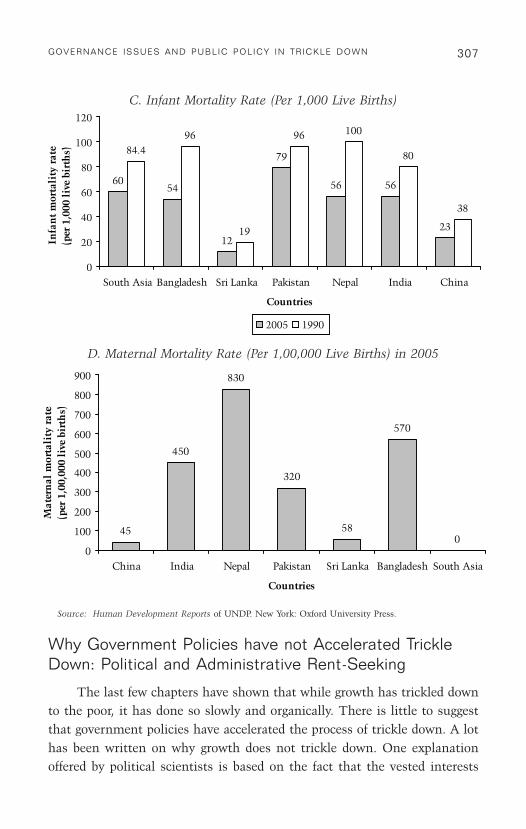
307GOVERNANCE IS SUES AND PUBLIC POLICY IN TRICKLE DOWN
C. Infant Mortality Rate (Per 1,000 Live Births)
D. Maternal Mortality Rate (Per 1,00,000 Live Births) in 2005
Source: Human Development Reports of UNDP. New York: Oxford University Press.
Why Government Policies have not Accelerated TrickleDown: Political and Administrative Rent-Seeking
The last few chapters have shown that while growth has trickled downto the poor, it has done so slowly and organically. There is little to suggestthat government policies have accelerated the process of trickle down. A lothas been written on why growth does not trickle down. One explanationoffered by political scientists is based on the fact that the vested interests
6054
12
79
56 56
23
84.496
19
96 100
80
38
0
20
40
60
80
100
120
South Asia Bangladesh Sri Lanka Pakistan Nepal India China
Countries
Infa
nt
mor
tali
ty r
ate
(per
1,0
00 l
ive
birt
hs)
2005 1990
45
450
830
320
58
570
00
100
200
300
400
500
600
700
800
900
China India Nepal Pakistan Sri Lanka Bangladesh South Asia
Countries
Mat
ern
al m
orta
lity
rat
e (p
er 1
,00,
000
live
bir
ths)
308 INDIA EMERGING • VEENA JHA
and the survival instinct of the ruling classes prompts them to increasetheir support base. This is mainly operationalised through theadministrative class by creating situations, which on the one hand, helppoliticians achieve their motives and two give a dominant position to them(the administrators) to wield massive administrative power. In essence,there exists a strong nexus between the rulers and the administrators andboth strive to exist for each other: politicians desire to hold and consolidatetheir power, while administrators seek to establish their supremeadministrative authority often holding even the politicians hostage. All thisis exhibited through what economists term the 'rent-seeking' and 'directlyunproductive profit-seeking' activities in the terminology of the 'NewPolitical Economy'. These activities seriously hamper the growth processand especially the trickle down, by dissipating the country's resources andnational income. A case study of India has estimated that the rent-seekinglosses to national income amount to between 30 per cent and 40 per centof India's gross national product (GNP) (Anand, 2010).
India has an administrative structure dominated by bureaucratschosen on the basis of a generalist examination (rank in that early entryexamination largely determines the career path of an officer no matter howwell or ill-suited s/he is in the various jobs s/he is scuttled around, each fora brief sojourn), and promotions are largely seniority-based not merit orperformance-based. There are no well-enforced norms and rules of workdiscipline, very few punishments for ineptitude or malfeasance, and thereare strong disincentives to take bold, risky decisions. Whether one likes itor not, the government will remain quite important in the Indian economyfor many years to come, and it is difficult to discuss the implementation ofeconomic reform without the necessary changes in public administrationincluding incentive reforms, accompanied by changes in informationsystems, organisational structure, budgeting and accounting systems, taskassignments and staffing policies. In these matters there is a lot to learnfrom the (successes and failures of) innovative administrative reformexperiments that have been carried out in many developing countries in thelast decade or so.
Lately, political parties have been using India's high GDP growth ratefor advertising their economic and political performance. This GDPobsession also leads to an attitude of easy tolerance of corruption. All anti-

309GOVERNANCE IS SUES AND PUBLIC POLICY IN TRICKLE DOWN
corruption measures are viewed as obstructions to development. After all,corruption in business circles has come to be known as the grease whichspeeds up commerce or as it is popularly known as 'speed money'. Thus ifyou give a contract for a bridge by taking a bribe, to a contractor who usessubstandard material, the collapse of the bridge after five years doesn'treduce GDP.
But there is an even more important reason why GDP growth cannot bean indicator of development, particularly the well-being of common citizensin the country. Growth in India has been achieved fastest in the sector whichis least material and most virtual. There are natural limits to land and wateravailability for agricultural growth. There are virtually no limits to thegrowth of the virtual industries like the financial markets industry, which isthe most rapidly growing industry currently in India. Thus a 10 per centspurt in the stock market which can be achieved by mutual fund operatorswithin a week, increases the market capitalisation and hence the virtualwealth of citizens by several percentage points. Similarly, many other high-end service industries like IT and insurance could also grow rapidly, thusfuelling rapid GDP growth. But the common people in the country canneither get jobs in these industries, nor do they have any use for theseservices. While there are some inevitable multiplier effects from even theseindustries (as shown in Chapter 1) their trickle-down effects would by theirvery nature be limited and is unlikely to touch poverty rates. Nevertheless asshown in the earlier chapters sustaining growth is the most important recipefor trickling down growth.
Liberals are skeptical about the usefulness of more spending by thegovernment on education and health as long as spending consists of a mereintensification of existing programmes. This is because there is now ampleevidence that existing programmes work pretty badly, as is borne out byevidence of absenteeism by health/education workers, the poor learningaccomplishments associated with Sarva Shiksha Abhiyaan (SSA), and othersuch programmes.9 Many liberals would support a view that moregovernment spending would help—or is essential for obtaining—betterhealth and education outcomes, as long as fundamental surgery is made to
9. Annual Status of Education Report (ASER), 2009. Published by Pratham. http://asercentre.org
310 INDIA EMERGING • VEENA JHA
the way in which programmes work—e.g., shifting from teachers as civilservants to vouchers.
However before judging the merits of any of these arguments, it isnecessary to make an objective evaluation of governance issues in delivery ofsocial services. To do this it is first of all necessary to examine the legalframework for the delivery of public services. This forms the first ring in thechain of economic governance.
The Legal Framework for Poverty Alleviation andGreater Accountability
The evolution of democracy in India, its impact on inequality andpoverty has been rather complex. In the history of western democracies,extension of franchise has been associated with welfare measures for thepoor. Democracy has clearly brought about a kind of social revolution inIndia. There is, however, a major disjunct between politics and economics inIndia. Hence, economic reform and reform of the ongoing political andadministrative processes has been slow.
The major political and administrative reform of the 1990s consisted ofdevolution of power to the local governments or village level panchayats.This was known as the policy of decentralisation. However decentralisationwas visualised as a means of delivery of welfare services, and panchayatshave had limited and varied degree of success in implementing welfareservices. This is because the quality of leadership in panchayats has beenvaried and corruption amongst them is also rampant.10
From the perspective of economic development at the grassroot level soas to emancipate and empower the poorer and marginal sections of thesociety, India has enacted the following laws:
a. Right to Information Act, 2005 for ensuring transparency andaccountability at governance level.11
10. “Empowering Panchayats for Actual Devolution of Power”, Information on this schemecan be obtained from http://www.mynews.in/News/Empowering_Panchayats_for_actual_devolution_of_power
11. Information on this Act can be obtained from http://righttoinformation.gov.in

311GOVERNANCE IS SUES AND PUBLIC POLICY IN TRICKLE DOWN
b. Right to Compulsory and Basic Education by implementation ofSarva Shiksha Abhiyan (SSA) and Mid-Day Meal (MDM) schemes.This became a full-fledged Act in 2009.12
c. Right to Food by proper running of the public distribution system(PDS) and the Integrated Child Development Scheme (ICDS).13
d. Right to Employment by enacting the National Rural EmploymentGuarantee Act (NREGA).14
e. Right to Self-governance by empowering the process ofdecentralisation and strengthening of the panchayati rajinstitutions (PRIs) and urban local bodies (ULBs).15
f. Right to Health by effective implementation of National RuralHealth Mission (NRHM).16
While these Acts would appear to provide an adequate legal basis forpoverty reduction and good governance it is critically important to examinethe implementation of these Acts. Another critical question is whetherthere is an adequate framework of resources of various kinds in India toimplement these Acts.
The Right to Information Act, 2005 was essential to check corruptionand ensure transparency in the implementation of various development-related schemes and programmes that are directly or indirectly intended toreduce poverty, ensure employment and expand livelihood opportunities.However, matters related to India's internal security and defence cannot bebrought within the purview of this Act. There is some ambiguity onwhether the administrative decisions of the Chief Justice of India areexempt from the RTI Act.17 The Department of Personnel and Training
12. Information on the Act and schemes can be obtained from http://www.education.nic.in/ssa
13. Information on these schemes can be obtained at http://wcd.nic.in/icds
14. Information under this scheme is available at http://nrega.nic.in/netnrega
15. “Empowering Panchayats for Actual Devolution of Power”, Information on this schemecan be obtained from http://www.mynews.in/News/Empowering_Panchayats_for_actual_devolution_of_power
16. Information on this scheme is available at http://www.mohfw.nic.in/nrhm.htm
17. Debate between the NGOs and the Government of India as reported in The Hindu,November 9, 2009.

312 INDIA EMERGING • VEENA JHA
(DoPT) is the nodal agency for the implementation of RTI Act. Even 'filenotings' can be disclosed to the general public under this Act. The RTI Actis useful to ensure freedom of expression, too. However, it is largely NGOsand media which have used the RTI so far. Cases of common citizensaccessing the RTI are few and far between. Essentially widespread recourseto the RTI to hold the government accountable for public delivery of socialservices can only take place through improvements in the education andawareness of the general public.
The Right to Compulsory and Basic Education became a full-fledged Actin 2009. Free and compulsory education to children belonging to the agegroup 0-14 years, including those below six years of age is provided underthis Act. This scheme is implemented with the mid-day meal which hasproved critical in reducing dropout rates especially among girl students,reducing the number of out-of-school children, providing employment towomen cooks who would serve meal to students, increasing cohesivenessamong students who would be eating together (via MDM scheme) despitecoming from diverse backgrounds, and preventing the curse of child labourwhen their poor parents do not have to worry about the cost of sending theirchildren for school education. The SSA is seen as a positive intervention tochange the fabric of Indian education. Yet there are hurdles that include: lackof infrastructure facilities in schools, lagging state of professionalism amongteachers, lack of training, opportunities and incentives for good teachers,discrimination against students coming from weaker sex and oppressedcommunities, redundant course content etc. It is difficult to implement theSSA and the MDM schemes effectively in such a big and diverse country likeIndia unless there is cooperation coming from the government and public atlarge. The SSA has been criticised from the perspective of quality educationtoo.
India had to enact its own Right to Food despite having a PDS.According to the National Family Health Survey (NFHS-3), more than athird (36%) of women have a body mass index below 18.5, indicating a highprevalence of nutritional deficiency.18 The anaemia situation has worsenedover time for Indian women.19 Indian women suffer from gender-based
18. http://www.nfhsindia.org/nfhs3.html
19. Ibid.
313GOVERNANCE IS SUES AND PUBLIC POLICY IN TRICKLE DOWN
norms and discrimination, which adversely affect their nutritional status.The importance of ICDS scheme to combat malnutrition and undernutritionamong women and children cannot be undermined. The PDS, which was amajor institution to ensure food, nutrition and livelihood security, has erodedovertime due to corruption, inefficiency, adoption of wrong policy choicesetc. At the international level, although India has become self-sufficient infood production, yet a large section of its population remains unfed. Due toearly weaning, children in the 0-6 years of age-group suffer from wasting andstunting. Leakages from ration shops owing to differences betweenadministered and market prices can be tackled by RTI activism. However, thelackadaisical attitude of the officialdom may not help India to reduce hungerby half by the year 2015, which is one of the Millennium DevelopmentGoals (MDGs).
The United Progressive Alliance (UPA) government, which startedwith the National Rural Employment Guarantee Act (NREGA) byimplementing it initially in 200 districts, faced criticisms that included:leakages and corruption in the scheme, a large chunk of the expenses beingsiphoned off for meeting material cost instead of labour cost, lack of co-ordination among Centre and states for regular release of funds, presence ofcorrupt actors at the village level etc. India had seen failure of food-for-workprogrammes in the past too before the enactment of the NREGA. It wasearlier thought that by providing 100 days of work to a person (one eachfrom a single household), during the lean seasons (i.e., between rabi andkharif), the livelihood security of those who are willing to do manual labourcan be ensured. It was speculated that the NREGA would help in stoppingdistress migration of labouring communities during lean seasons. TheNREGA was supposed to solve the problem of unemployment amidstincome-poor groups. However, in many states of India, the labourers arenot getting employment under NREGA despite demanding it, presently.Minimum wages are often not paid to the labourers. Non-payment ofunemployment compensation has become a regular feature of this scheme.In many parts of India, there are complaints of non-issuance of job cards.NREGA envisaged that rural infrastructure such as water bodies, schools,roads etc., could be constructed and maintained by employing the toilinglabouring classes, which would raise their purchasing power. This, in turn,
314 INDIA EMERGING • VEENA JHA
would lead to creation of 'effective demand' in rural India. However reportsshow that this did not happen.
The Right to Self-governance was essential to escape from bureaucraticcontrols and shackles, whereby villages would have more autonomy andpower in decision-making than before. The creation of proper rules andinstitutions for further decentralisation came into being in the early 1990s inthe form of 73rd and 74th amendments to the Constitution of India. In fact,decentralisation was a result of the decay of centralised planning system thatexisted during the Nehruvian era. Empowering the PRIs and ULBs isconsidered essential for proper implementation of government fundedprogrammes and schemes so that villagers and elected panchayat membershave the right to cross-check the official documents, which used to be underthe control of local administrative officers earlier. Strengthening of PRIs andULBs was envisaged to help in release of people's dissenting voices. The statein that case would then be leaning more towards listening to short creativestories rather than meta and grand narratives. Giving power to the local andelected bodies is now seen as a major policy instrument for ensuringgrassroot democracy. The rise of regional political parties and the evolutionof political and fiscal decentralisation are now essential features of Indiandemocracy. But it does not mean that decentralisation has been all the way apositive experience. The elected members of the local bodies turned out to becorrupt individuals in many cases. Women's and oppressed classes'representation in the elected local bodies have not been upto the mark. Manypanchayats in India practiced caste-based ostracism, and some even directlygot involved into honour killings, particularly from the North Indian belt.
The National Rural Health Mission (NRHM) is another flagshipprogramme of the UPA government to assure right to health for the Indiancitizens. After liberalisation of the Indian economy, one could observeprivatisation of health service delivery, which used to be costly and henceexcluded the poor. The accountability of the private sector to their clientshas been low. According to the Report of the Independent Commission onDevelopment and Health in India (ICDHI), there exist regional disparitiesin outcome indicators for health.20 India does not have enough doctors tocater the need of its rural population. Medical colleges are unevenly spread
20. See http://www.vhai.org/ceo/current_focus.php

315GOVERNANCE IS SUES AND PUBLIC POLICY IN TRICKLE DOWN
throughout India, which affect access to health care. Public health securityis lacking in India. Out-of-pocket expenses are too high, which adverselyaffect the poor. Expenditure on provision of public health is meagre. Thereis a need to think whether there can be alternative affordable mechanismsfor delivery of good quality health services for the public at large. TheNational Health Policy (NHP) 2002 in principle 'welcomes theparticipation of the private sector in all areas of health activities'—primary,secondary or tertiary. This stand contradicts the basic goal of NHP-1983,which aimed at providing 'universal, comprehensive primary health careservices, relevant to actual needs and priorities of the community'.Although health insurance schemes have cropped up in recent times, yetmajority of the population have little or no access to such schemes. Thecondition of public hospitals and health care centres is abysmal. Prevalence oflifestyle diseases is on the rise. Despite the Government of India'scommitment in providing ‘Health to All’ as mentioned in the Articles 21 and47 of the Indian Constitution, it has been alleged that increased privateexpenditure as compared to the public expenditure has adversely affectedthe poorer section's access to basic health services.21
The first question to be asked for the poor implementation of theseActs is whether funding for social services delivery is adequate. This issuehas been examined in the next section using the figures available from the2010/11 financial revenue and expenditure budget of the Government ofIndia.
Is Funding for Social Services Delivery Adequate?
Several studies point to the inadequacy of government spending onsocial services in India.22 According to the author's estimates, the totalexpenditure on public services accounts for no more than 6 per cent of theGDP and over 10 per cent of the total expenditure of the Government ofIndia in 2009-10.23
21. http://eindia2007.blogspot.com/2009/02/towards-good-governance-in-india_15.html
22. See articles at http://www.labourfile.or
23. http://www.indiabudget.nic.in

316 INDIA EMERGING • VEENA JHA
The total budget outlay in education as a proportion of GDP hasincreased only marginally from 3.88 per cent in 2009-10 to 4.5 per cent in2010-11, far from the 6 per cent allocation recommended in the KothariCommission 44 years ago.24 The enactment of the Right to Education Act2009 guarantees that education is now free and compulsory at theelementary stage. However, it is not so in government schools as parentsstill incur expenses on books, stationary and private coaching among othermiscellaneous expenses. The National Sample Survey (NSS) 64th round in2008 mentions the per capita out-of-pocket expenditure for a governmentschool education by an average parent to be Rs 1,243 (US $30) for theelementary level and Rs 2,597 (US $60) for the secondary/higher secondarylevel.25 So while the Union government continues to inject money into SSAyear after year, issues of implementation, service delivery and poorfinancial processes have marred its progress.
Health expenditure accounts for one per cent of GDP and private sectorcontrols the reins of health care service delivery. The Union government'sexpenditure on health has increased marginally from 2.1 per cent in 2009-10to 2.3 per cent in 2010-11.26 As a proportion of GDP, the combinedexpenditure of the Centre and states on health, which was around 1.02 percent in 2008-09, increased to 1.06 per cent in 2009-10.27 Another majorprogramme—the Janani Suraksha Yojana (JSY) which was started as a majorintervention under the reproductive and child health (RCH) programme, hasbenefitted 8.4 million women in 2008-09. With the objective of reducingmaternal and neonatal mortality in the country, JSY promotes institutionaldelivery among pregnant women from poor households. However, the totalnumber of women giving birth each year is estimated to be around 26 millionand hence the coverage of JSY is still very limited.28 In many cases privatefacilities have filled the gap. It is estimated that hospital assisted births nowcover over 80 per cent of the women in India, so by natural deduction most ofthe hospital assisted births are in the private sector hospitals.
24. Ibid.
25. Data obtained from the NSS, 64th round to be found at http://www.indiabudget.nic.in
26. http://www.indiabudget.nic.in
27. Calculated from data obtained from http://www.indiabudget.nic.in
28. http://www.observerindia.com

317GOVERNANCE IS SUES AND PUBLIC POLICY IN TRICKLE DOWN
After stagnating at 5.5 per cent of total Union governmentexpenditure, the total allocation on women as per the gender budgetingstatement has increased to 6.1 per cent in 2010. There has been a 50 percent increase in plan allocation for the Ministry of Women and ChildDevelopment. What remains disconcerting is that disbursements forseveral important schemes under the ministry, when added for the last fouryears, do not reach even 50 per cent of the proposed allocations for theEleventh Five Year Plan period.29
India has one of the poorest records on hunger and food security in theworld. It ranks 65th among 84 countries in the Global Hunger Index.30 Thepicture assumes graver overtones when seen in conjunction with spirallingfood prices. The Rashtriya Krishi Vikas Yojana (RKVY) launched in 2007aims to incentivise states to increase the share of investment in agriculture.
Targetted PDS like the Antyodaya Anna Yojana (AAY) aims atproviding subsidised food grains to the poorest of the poor families. But theallocation on food subsidy as percentage of GDP during 1990-91 to 2009-10 period hovers around less than one per cent and is on a decline since2003-04.31 Similarly, expenditure on food subsidy as a proportion ofcombined total expenditure of Centre and states taken together remainedbetween 2.5 to 3.5 per cent.32
In comparison to social services, nine per cent of the GDP allocation in2010 went to physical infrastructure.33 Its stated resolve to cross the 'doubledigit growth barrier', the Union Budget 2010-11 has gradually shifted thefocus from 'inclusive growth' to economic growth. This shows that thegovernment believes that growth will trickle down and places little relianceon its social delivery mechanisms to accelerate the process of trickle down.
How can we evaluate whether the budget allocations to social servicesis adequate? One measure of its adequacy is the outcome in terms of socialindicators. India ranks at an embarrassing 134th position (out of 182
29. Ibid.
30. http://www.ifpri.org/publication/2009-global-hunger-index
31. http://www.indiabudget.nic.in
32. Ibid.
33. Ibid.
318 INDIA EMERGING • VEENA JHA
countries) on the Human Development Index (HDI)—and seems to bemaintaining it (UNDP, 2009). Whatever India could achieve during the lastfive years in terms of human and social development is inadequate.However, in a large country such as India, it is expected that overallindicators would be slow to move. Do we indeed have pockets of excellenceand what is the analysis available to us for the evaluation of socialprogrammes in India. Often it is not just a question of overall budgetallocation but of better governance and management. It would beinstructive to analyse some of the third party evaluations of governmentprogrammes to obtain some decisive insights into areas of governancedeficit in the Indian economy.
Third Party Evaluations of the Various GovernmentProgrammes in India
Few studies have made a comprehensive assessment of all or mostpublic services in India. There are even fewer studies on the state of publicservices in the different states of India based on user feedback gatheredthrough a stratified random sample survey of households. In the developedcountries, there are some examples of governments seeking user feedbackon their services and programmes (Paul et al., 2004). In developingcountries, however, there are hardly any examples of governments adoptingthis approach. The few initiatives in developing countries have come fromcivil society organisations such as the Public Affairs centre (PAC) thatpioneered the 'report cards' on urban services (Goetz and Gaventa, 2001;Paul, 2002). PAC has used its report cards not only to create publicawareness, but also to advocate policy and governance reforms. In recentyears, several studies of social sector expenditure have been undertaken inIndia to assess impacts and outcomes (Dev and Mooij, 2002; Shariff andGhosh, 2002). One survey which dates back to 2004 has been based onuser feedback on five public services in India (Paul et al., 2004). The fiveservices included are drinking water, health facilities, road transport, PDSof food grains and primary school education. While this study dates back tothe early part of this decade, inter-state differences in accessing publicservices has not changed much.
319GOVERNANCE IS SUES AND PUBLIC POLICY IN TRICKLE DOWN
According to this survey, drinking water is accessible to 55 per cent ofIndian households within a distance of 100 metres from home (Paul et al.,2004). A quarter of all households depend on unprotected sources ofdrinking water. One-fourth of the users of public sources of water havereported frequent breakdowns of supply. Access to reliable drinking watersupply is thus a problem for a significant proportion of households (Paul etal., 2004). Public health facilities are accessible to over 40 per cent of thehouseholds within a distance of one kilometre. The presence of privatehealth facilities makes up for this limited access to some extent. Thepresence of doctors at public health facilities (a measure of quality andsupervision) leaves much to be desired. One-third of the patients did notfind a doctor present during their visits (Paul et al., 2004). Absence ofpaved roads in their village, was reported by nearly 60 per cent of allhouseholds. Both public and private buses are available in many states,though in some states there is a domination of either government orprivate bus transport (Paul et al., 2004). Government buses are rated quitelow on punctuality and frequency. PDS of food grains has wide coverageacross the country, with over 80 per cent of the households owning rationcards and 72 per cent using fair price shops at least once every two months.But only one-fourth of the cardholders reported regular availability of foodgrains in the shops. Display of prices was reported by less than 50 per cent.While the reach of the PDS network is wide, its effectiveness is greatly hurtby the high degree of unreliability and non-transparency associated withthe service (Paul et al., 2004). Government owned or supported primaryschools are available to nearly 80 per cent of the households within onekilometre of their homes. Awareness about the mid-day meal programme ishigh among households and most are beneficiaries of the scheme.Anganwadis (child crèche scheme for poor households) are accessible toover two-thirds of the eligible households, but only 30 per cent are regularusers of the service (Paul et al., 2004). A major reason for low use is thetime and cost of transporting children back and forth to avail of the service.Even when people give high marks for access to a service, they signal thatreliability and public satisfaction leave much to be desired. Nearly three-fourths of households consider PDS unreliable and their full satisfactionrating for this important service is indeed low. One-third of people attest tothe irregular availability of doctors in public health care facilities. Otherservices do not fare much better (Paul et al., 2004).
320 INDIA EMERGING • VEENA JHA
Of the 16 major states, the better performers are the southern andwestern states of Tamil Nadu, Maharashtra, Karnataka, Gujarat, AndhraPradesh and Kerala. At the other end of the spectrum are Assam, WestBengal, Orissa, Rajasthan and Bihar. In between are the remaining states,Haryana, Himachal Pradesh, Punjab, Madhya Pradesh and Uttar Pradesh.While many factors have contributed to the positioning of the states in thethree categories, the distinguishing feature of the first set is that, by andlarge these states have relatively high ratings in terms of both access andreliability in all services. The opposite is true for four out of five of thestates in the bottom category. The middle set includes states that for themost part are high on one attribute (i.e., access) but low on the other (i.e.,reliability) (Paul et al., 2004).
With respect to the striking inter-state disparities discussed above, itis well known that per capita expenditure on the social sector is lower inthe bottom five states than in the top six. Whether this means thatresource constraints are behind their poor record in the five services isnot clear. If access and use of services are lower in these states, the fundsthey require will also be smaller. The question is whether their ability toexpand and improve services has been limited by their inability tomobilise the needed resources. One possibility is that resources areavailable, but that the ability and will to plan and utilise them properlyleave much to be desired. It is also possible that increased financialallocations have been made to the bottom five states, but diversion ofresources to meet other priorities or leakages has made it difficult to usethem productively. Where the state is ineffective or non-responsive, civilsociety efforts could have played a role to demand better performance andaccountability. In the better performing states, there is much greater civilsociety involvement in service provision and increasing evidence ofalternative models of service delivery that have an influence on theresponsiveness of public service providers. It is possible that people'sability to articulate 'voice' of this type is also absent in the weaker states.If it is this kind of support and technical assistance that weaker statesneed in addition to funds, ways must be found to generate strategies tomeet those needs.

321GOVERNANCE IS SUES AND PUBLIC POLICY IN TRICKLE DOWN
Whether public services are reaching the poor and other disadvantagedgroups is a matter of great concern to most policymakers. Here again, onesees a mixed picture. Primary education and drinking water are twoservices that have done reasonably well in terms of access for the poor. Thepoor are worse off in terms of access with respect to the other threeservices. Despite the barriers to access, a larger proportion of the poor usemost of the services rather than other households, the singular exceptionbeing public transport. In terms of reliability and satisfaction, the poor givelower ratings to almost all the services across the country compared to non-poor households (Paul et al., 2004).
Village size also makes a difference when it comes to access toservices. Residents of the larger villages (A and B class) invariably reportgreater ease of access to all the five services. Drinking water shows the leastdisparity in terms of access. Use patterns, on the other hand, are moresimilar, which means that the poor walk long distances to avail of theservices. Clearly, longer distances mean that those living in the smallervillages and the poor incur additional costs that hurt their ability to earn alivelihood. Even more striking is the finding that the poor in the top sixstates are better served than even the non-poor in the bottom states in thefive areas! (Paul et al., 2004).
Third party surveys including the author's own surveys also confirmthe story above.34 The results of some of these surveys are summarisedbelow.
Nutrition Programmes
Despite impressive economic growth, India remains home to one-thirdof the world's undernourished children. From 1980-2005 real GDP per capitain India grew by 3.95 per cent per year, yet between 1992-2006, thepercentage of underweight infants under three in India only fell from 52 to46 per cent (Haddad and Zeitlyn, 2009). Economists argue that thisproblem reflects a failure in governance—it is difficult to hold nutritionservice providers accountable, nutrition practices exclude large groups ofindividuals and benefits often don't reach those who need them. They point
34. See Annexure A-6.1 for details of survey.
322 INDIA EMERGING • VEENA JHA
to the fact that although the Indian government's national Integrated ChildDevelopment Services (ICDS) plan has committed a four-fold increase ofapprox $250 million since 2008 to tackle malnutrition, this money will bewasted unless it is better targetted. This programme was implementedthrough the anganwadi scheme among other schemes. This scheme has beenevaluated by the author below.
Author Survey of the Anganwadi Scheme
This survey was conducted in the districts of Kishangarh and Ajmer tomake it consistent with the NREGA survey (see below). The state ofRajasthan has by and large enjoyed better governance than the rest. Thus ifan evaluation of schemes implemented by Rajasthan shows governancedeficits, the other states would be much worse off.
The survey showed that large families did not avail of the Anganwadischeme perhaps because the elder siblings looked after the younger oneswhen their mothers were out for work. It could also be attributed to the factthat a large number of the older children were out for work or hadmigrated. Generally government schemes were the source of information ofthe anganwadi scheme. The gram panchayat or local governanceinstitutions were only minimally important in obtaining information onthe schemes. Generally the families availing the scheme were happy with itas expressed by the satisfaction over the quality and quantity of food or thebehaviour of local teachers.
The average time saved by mothers varied between six and eight hoursfrom availing of the Anganwadi scheme. This time saved was used mostly(60%) in either household chores or in family schemes. Further dataprovided in the Annexure A-6.2 shows the overall satisfaction with theAnganwadi scheme. However, a small percentage of large families avail ofthe scheme so the overall satisfaction is reflected by a relatively smallpercentage of the eligible population.
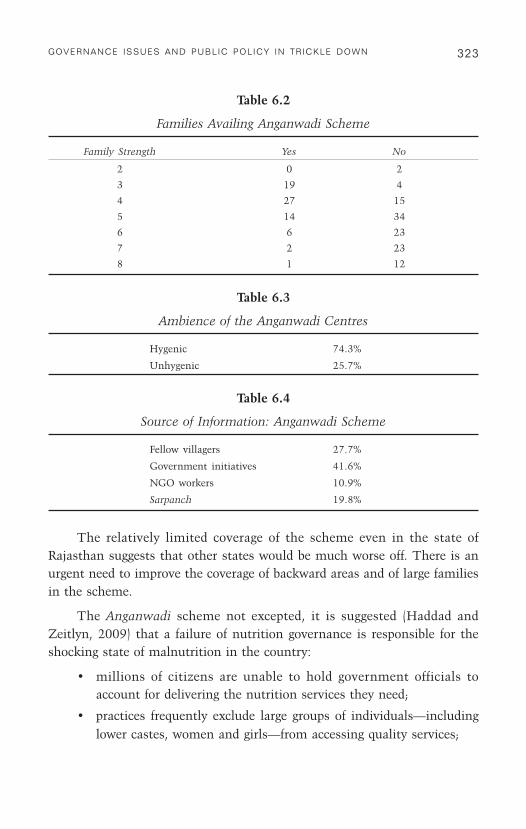
323GOVERNANCE IS SUES AND PUBLIC POLICY IN TRICKLE DOWN
Table 6.2
Families Availing Anganwadi Scheme
Family Strength Yes No
2 0 2
3 19 4
4 27 15
5 14 34
6 6 23
7 2 23
8 1 12
Table 6.3
Ambience of the Anganwadi Centres
Hygenic 74.3%
Unhygenic 25.7%
Table 6.4
Source of Information: Anganwadi Scheme
Fellow villagers 27.7%
Government initiatives 41.6%
NGO workers 10.9%
Sarpanch 19.8%
The relatively limited coverage of the scheme even in the state ofRajasthan suggests that other states would be much worse off. There is anurgent need to improve the coverage of backward areas and of large familiesin the scheme.
The Anganwadi scheme not excepted, it is suggested (Haddad andZeitlyn, 2009) that a failure of nutrition governance is responsible for theshocking state of malnutrition in the country:
• millions of citizens are unable to hold government officials toaccount for delivering the nutrition services they need;
• practices frequently exclude large groups of individuals—includinglower castes, women and girls—from accessing quality services;

324 INDIA EMERGING • VEENA JHA
• the benefits of economic growth have not trickled down to thepoor, whilst the wealthy are increasingly using private services.
Specific recommendations (Haddad and Zeitlyn, 2009) include:
• enabling communities to anonymously rate and publish the localprovision of nutrition services;
• creating new mechanisms that enable different Governmentdepartments to work together to deliver food, care and health incombinations that work;
• giving the Comptroller General and Auditor Office a bigger role inmonitoring Government action on nutrition;
• improving engagement by historically-excluded groups withnutrition programmes, in particular involving women from thesegroups in designing better outreach programmes;
• introducing simpler but more regular monitoring of nutrition statusso that civil society and the media can hold the Government andnon-state actors to account;
• developing new ways of thinking and conducting research on howto improve nutrition—so that it is not just seen as a technicalexercise, but also as an exercise in politics, governance and power.
National Rural Employment Guarantee Act (NREGA)
Studies on the evaluation of the NREGA are intended to assess theimpact on income-earning levels of each household, expenditure on food andnon-food items, household and cultivable assets creation by the beneficiaries.Studies also capture the impact of the scheme to arrest out-migration, viewsand feedback of the beneficiaries on various facets of implementation.
A study carried out in 20 districts targetted 300 beneficiaries fromeach district.35 The data pertains to the year 2006-07 during which periodthis scheme was launched in 200 districts in the first phase. By way ofopen-ended questionnaires, data on several variables were collected fromthese beneficiaries who are part of the NREG scheme. The study showed
35. Institute of Applied Manpower Research. All India Report on Evaluation of NREGA,http://planningcommission.gov.in/reports/genrep/rep_NREGA.pdf

325GOVERNANCE IS SUES AND PUBLIC POLICY IN TRICKLE DOWN
that female-headed household (HH) participation in the works is veryencouraging ranging from 12 to 52 per cent.36 Most beneficiaries got theirjob cards through gram sabha (GS) meetings and the rest by steps taken bygram panchayat (GP). Majority of the rural households agreed that therewas a transparent mechanism followed for issue of job cards. Enrollmentand registration under the scheme was an open-ended one, however, 15 percent of the respondents thought otherwise. Migrant families could notregister for job card.
Eighty per cent of the HHs did not get the work within the stipulated15 days time of demand for work in writing, neither were they paid anyunemployment allowance. All locally available communication modes wereutilised to spread awareness and information about the scheme. Only a smallfraction of HHs could utilise more than 35 days of work. The reason for non-utilisation of maximum permissible 100 days was late implementation ofthe scheme. NREG scheme stipulates at least one-third of the wageallocation i.e., person-days to women beneficiaries. It was found that onlyin 42 per cent households, women could share 1/3rd of the allocatedperson-days (wage days). In 22 per cent of the households, women couldnot utilise more than one-third of the utilised person-days in thehousehold. In most of the work sites, facilities like a shed to shelter fromthe sun, drinking water etc., were provided. Fourteen per cent of the HHsdid not agree that the names of workers, number of days and the amountwas read out at the work site as stipulated in the guidelines of the Act. Itwas found that more than half of the beneficiaries were agricultural andunskilled workers. The survey revealed that the number of familiesspending less on food had come down drastically where as there was anincrease in the number of families who were spending more on food andnon-food items.37
Only two per cent of the HHs opened bank accounts among thesurveyed beneficiaries. More than half of the HHs revealed that theypurchased livestock like sheep/goat etc., during the year. Four-fifths of theHHs did not have any outstanding loan. However, in the western region,nearly 60 per cent of the HHs had an outstanding loan either from bank or
36. Ibid.
37. Ibid.
326 INDIA EMERGING • VEENA JHA
local moneylender. 3.3 per cent of the beneficiaries bought a bicycle for thefirst time, 1.5 per cent of the beneficiaries did buy electric fans, or otherappliances, 3.2 per cent of the HHs purchased steel utensils etc., with theincome generated from the scheme.
One-fourth of the families surveyed opined that there is migrationfrom their respective village to towns/cities in search of job. Almost 50 percent of the HHs in western region expressed that migration is taking placefrom their villages. In the northeastern region, in the district of NorthLakhimpur, everyone agreed that there is migration from their villages.There is migration taking places from districts such as South Garo Hills(Meghalaya), Medak (AP), and Dahod (Gujarat) in addition to almost allthe districts from the eastern region. In some of these districts, the out-migration is to the extent of 40 per cent. Only 40 per cent agreed that thepanchayat was taking appropriate steps to create wage employment. In theeastern region 46 per cent did not express any confidence in theirrespective village panchayats about their efforts of checking out-migration.38 So in general, at the early stages of the scheme it had littleeffect on out-migration.
A report of the CAG shows that the government is aware of theseproblems and has taken corrective action.39 The Act was extended to theentire country and provided employment to 29.3 million householdsgenerating 10.93 million person-days of employment and reaching out tothe marginalised group as STs/SCs and women who constituted 54 per centand 49 per cent of the NREGA workforce respectively. Nearly two millionworks have been undertaken during 2008-09, of which 46 per cent relatedto water conservation.40
In 2007-08, more than 68 per cent of funds utilised were in the formof wages paid to the labourers. In 2008-09, 71 per cent of the funds hadbeen utilised in the form of wages.41
38. Ibid.
39. CAG reports on NREGA for 2008 and 2009 can be downloaded from http://icrindia.org/pdf/CAG_Draft_Report_NREGA_II.pdf. These are the reports usedhere.
40. Ibid.
41. Ibid.

327GOVERNANCE IS SUES AND PUBLIC POLICY IN TRICKLE DOWN
Minimum wages have shown remarkable upward trend after theimplementation of NREGA. It had risen in Maharashtra (from Rs 47 toRs 72), Uttar Pradesh (from Rs 58 to Rs 100), Bihar (from Rs 68 to Rs 81),Karnataka (from Rs 62 to Rs 74), West Bengal (from Rs 64 to Rs 75),Madhya Pradesh (from Rs 58 to Rs 85), Himachal Pradesh (from Rs 65 toRs 75), Nagaland (from Rs 66 to Rs 100), Jammu & Kashmir (from Rs 45to Rs 70), and Chhattisgarh (from Rs 58 to Rs 72.23). However, whetherthis wage increase was related to the overall levels of inflation in thecountry, to rising agricultural prices or to NREGA is difficult to judge.42
Another survey of NREGA conducted in 2008 involved nearly 40 percent of India's population and 62 per cent of the expenditure in 2007-08 onthis scheme. It covered nearly 100 randomly selected work sites spread oversix states and about 1,000 workers. Eighty-one per cent of the workers livedin kucha houses, 61 per cent were illiterate and 72 per cent had noelectricity. Thus, they covered the poorest households. This survey showedthat only 13 per cent of the respondents had secured 100 days of work asmandated by the Act in the preceding year. Of this the lowest was inChhattisgarh (1%), Bihar (2%), UP (3 per cent) and Jharkhand (7%).Rajasthan had the highest employment with 35 per cent securing 100 daysof work. The all-India average number of days secured under NREGA was16 with considerable inter-state variation. This could be hardly enough todent poverty in India. Only half of the sample workers were aware of theirentitlement to 100 days of work. However, half the respondents also feelthat NREGA had staved off hunger (69%) or avoided migration (59%),helped them to repay debt (32%) or avoided hazardous work (35%). Amajority of the workers (57%) used the money to buy medicines or treatillness (Drèze and Khera, 2009).
However, reports of rampant corruption under NREGA have also beenreceived. Master rolls were fudged, while wages of the fictitious workerswere siphoned off by middlemen or officials. Even bank accounts wereopened under fictitious names and money was transferred to the accountsof middlemen with the concurrence of the bank manager. However, it isdifficult to judge whether direct payment or payment through bankaccounts is more corrupt.
42. Ibid.

328 INDIA EMERGING • VEENA JHA
Author Survey of NREGA
As surveys had shown that the Rajasthan NREGA scheme had beenmost successful, the author conducted a survey spread over a couple ofmonths in Rajasthan in 2009.43 The results of Kishangarh and Ajmer aresummarised below. Of the people surveyed who availed of the scheme,roughly 71 per cent were men and 29 per cent women.
While the scheme was available at several locations, about 40 per centof the people surveyed did not avail of the scheme. While the reasons fornot doing so were not clearly expressed, several pointed to the inadequacyof the coverage of the schemes. Some also expressed the view that betterincomes were available to them elsewhere such as construction sites orstone mines.
Figure 6.2
Income Level versus Percentage of People Availing NREGA
The income levels of those who availed the scheme was in generalmuch lower than NREGA wages. The income levels of people indicated onthe x-axis was in terms of rupees per day.
43. For details of the survey see Annexure A-6.3.
9286
59
48
1319
13
00
10
20
30
40
50
60
70
80
90
100
25-40 40-60 60-75 75-90 90-110 110-130 130-150 150-200
Rs per day
Per
cen
t

329GOVERNANCE IS SUES AND PUBLIC POLICY IN TRICKLE DOWN
A little over half of the people surveyed were either happy with NREGAor found it satisfactory. Only 7 per cent considered it a bad scheme.
Figure 6.3
Working Conditions
Over half of the participants did not have any problems in getting ajob card, while 34 per cent of the participants did not consider it ofrelevance. Only a small percentage considered it a problem to get a jobcard. In fact a great majority expressed the view that it was easier to get ajob card after one job card had already been obtained.
A large percentage of the people surveyed expressed satisfaction withthe NREGA and did not face problems in drawing money. While the overalllevel of satisfaction with the scheme was high, at the level of detailsseveral cracks appeared. First of all the much touted state of Rajasthan hasclearly seen a lot of economic development in the recent past to suggestthat Central schemes are implemented with less corruption than in otherstates. This is shown by the fact that nearly 40 per cent of the peoplesurveyed did not avail of the scheme. Second, alternative employmentschemes at relatively high wages were already available in Rajasthan.Third, proximity to Delhi resulted in better awareness of such schemes andprivate investment in Rajasthan has been relatively high than in otherstates. The important question to ask is whether the experience with
Good21%
Satisfactory31%
Other44%
No comment4%
Bad7%
Not applicable37 %

330 INDIA EMERGING • VEENA JHA
NREGA can be replicated in other states. An important issue in thiscontext would be the improvement in governance in the poorer states suchas Bihar.
Figure 6.4
Problems Faced in Getting Job Card
Key findings of the National Tribunal on NREGA suggest that:44
1. Factual information about the programme appears lacking, not onlyamong the people but also among those who are responsible forimplementation.
2. There are tremendous hurdles faced at the first stage of registrationand acquiring of the job card itself. Proofs of identity and fees havebeen demanded for registration. There is also reluctance on behalfof NREGA workers to accept applications for work even after theindividual is registered.
3. Women-headed households and joint families are at a distinctdisadvantage in accessing the benefits of the scheme. Theprovision of work to one person of the household has been
44. For full details on the outcomes of the deliberations and surveys of the NationalTribunal on NREGA see http://www.elbag.org, Outcomes of the National Tribunal onNational Rural Employment Guarantee Act, India, Wada Na Todo Abhiyan, whichliterally means ‘Do not break your promises’.
Not applicable34%
No56%
Wait for few months
4%
Long wait2%
Other4%
Delay due to divided family issue
1%
Others (delay, wrong photograph)
3%

331GOVERNANCE IS SUES AND PUBLIC POLICY IN TRICKLE DOWN
interpreted to mean that it is applicable only to the male head ofthe household.
4. Even after the procurement of a receipt for the application forwork—work has not been made available in many instances, andthere are few reported cases where an individual has actuallyreceived the unemployment allowance.
5. There appears to be a lack of transparency in the allocation ofworks. In several instances, no reasonable explanation has beengiven for the selective distribution of works to certain hamletswithin the village, or specific individuals. Dalits, women, minoritygroups and persons with disabilities bear the brunt of this selectiveprocess of allocation.
6. Systems for measurement of work are inadequate and disparate.There is no distinction between skilled and unskilled work, andthe same wage is provided for both.
7. Facilities for shade, water, first aid and crèche are not beingprovided at the work site.
Figure 6.5
Problems Faced in Getting Job after Having Job Card
No problem84%
Long wait10%
Long job rotation policy
3%
No yearly offering
1% No comments2%

332 INDIA EMERGING • VEENA JHA
Sarva Shiksha Abhiyan (SSA)
The SSA was a scheme of the government to provide education to all.Reports of the outcome of these programmes are not very encouraging.Teacher's attendance, maintenance of hand pump, health service providerswere all very low. This was because teachers were not accountable to thelocal citizens whose children were studying in the school. Instead they wereaccountable to distant supervisors who may be staying very far from theschool (United Nations et al., 2007).
UNESCO's Global Monitoring Report 2009 is a severe indictment ofthe Indian government's commitment to education. India's publicinvestment in education is 3.3 per cent of its gross national product, lowerthan sub-Saharan Africa's median. But India would achieve a netenrollment rate of over 97 per cent by 2015 (UNESCO, 2009).
India is one of 17 countries in the world with the greatest number ofout-of-school children. UNESCO's Education For All (EFA) GlobalMonitoring Report 2009, released recently, says enrollment in secondaryeducation in India increased from 39 per cent in 1999 to 43 per cent in2006. Around 7.2 million Indian children are still out of school (UNESCO,2009).
On the positive side, the report says India is on track to achieving itsenrollment targets for elementary education, which will be cut to just600,000 in 2015. Since 2001, the government's flagship elementaryeducation programme, the SSA, has helped to bring some 20 millionchildren into school, most of whom are first-generation learners. The gendergap has reduced and more children are transitioning from primary to upperprimary school. Many of India's states are now either approaching universalprimary enrollment or have already achieved it. According to theGovernment, less than 5 million children between the ages of 6 and 14 nowremain out of school. The programme is now focussing on bringing thehardest-to-reach children into primary school, raising access to upperprimary education and improving retention and learning outcomes(UNESCO, 2009).
According to the 2001 national Census, India has a literacy rate of 65per cent. UNESCO's annual report suggests a further strengthening ofpolicy commitments towards quality education (UNESCO, 2009).

333GOVERNANCE IS SUES AND PUBLIC POLICY IN TRICKLE DOWN
The report highlights, among other things, the need to ensure thatchildren have basic literacy and numeric skills. This has been an area ofconcern for India. Fewer than half of the children in Grade 3 can readsimple text; only 58 per cent can subtract or divide (UNESCO, 2009).
Teacher absenteeism is another area of concern. The report finds thatcontrary to popular perception, absenteeism among teachers plagues bothprivate and government schools. It suggests greater commitment toreducing inequalities and sustained political leadership to reach educationtargets.
A look at the figures in year 2008, shows that 98 per cent of India'shabitation has primary schooling facility,45 while 90 per cent of Indianshave upper primary schooling facility. For every five primary schoolsthere are two secondary schools. Also in certain primary schools, thecurrent infrastructure is being upgraded to provide secondary schooleducation at the sites of primary school education. Over the years thegovernment has taken many steps to improve the education systemthrough various innovative steps, like public-private partnerships,NGO's involvement, pure private initiatives in the school educationsystem etc. Still the national average dropout rate between standard I toX is 62.69 per cent.46 This is a matter of grave concern because out ofevery 10 enrollments, six individuals (majority) are not able to finishtheir schooling.
Poor quality government schools are important factors in the growthof private players. In India, contract teachers (para-teachers) have been usedto increase the number of teachers in remote rural schools.
'As they are often less qualified and more inexperienced than civilservice teachers (trained teachers), the situation raises concerns aboutproviding teaching of equal quality to all areas' (UNESCO Report, 2009).
UNESCO identified a range of policies to remedy extreme inequality,including the removal of school fees for basic education, increased publicinvestment and incentives for girls, whilst warning against decentralisation
45. http://www.education.nic.in
46. Dongaonkar (2006), http://www.iau-aiu.net/conference

334 INDIA EMERGING • VEENA JHA
which often widens inequalities by reinforcing financing gaps between richand poor regions (UNESCO, 2009).
Achieving Gender Parity
Reports on the outcomes for women in relation to the NationalCommon Minimum Programme and its three flagship initiatives, namelythe National Rural Employment Guarantee Act (NREGA), the NationalRural Health Mission (NRHM) and the Sarva Shiksha Abhiyan (SSA) drawattention to the need for additional efforts to be made to ensure thatwomen are able to benefit from and participate in the national programmesfor livelihood, health and education (Wada Na Todo Abhiyan, 2007).
Amarjeet Kaur of the All India Trade Union Congress (AITUC) pointsout that although 96 per cent of working women in India belong to theinformal sector, the country still lacks social security legislation that canensure fair wages and safe working conditions for millions of women (WadaNa Todo Abhiyan, 2007).
Annie Raja of the National Federation of Indian Women (NFIW) notesthat despite the provision for 33 per cent preference for women workers inNREGA, field audits show that women are prevented from taking up workthrough the scheme, and paid lower wages for their work (Wada Na TodoAbhiyan, 2007).
Abhijit Das of the Centre for Health & Social Justice (CHSJ) andJashodhara Dasgupta of Sahayog adjudge that for the NRHM to achieve itsintended objective, the explicit recognition of gender disparity as adeterminant of health status and access to health care is imperative (WadaNa Todo Abhiyan, 2007).
Malini Ghose of Nirantar draws attention to the adverse impact ofprivatisation of education on women and girls, particularly from sociallydisadvantaged sections, and strongly recommends that the state shouldarrest its withdrawal from the education sector and the formal educationsystem should be strengthened not downsized (Wada Na Todo Abhiyan,2007).
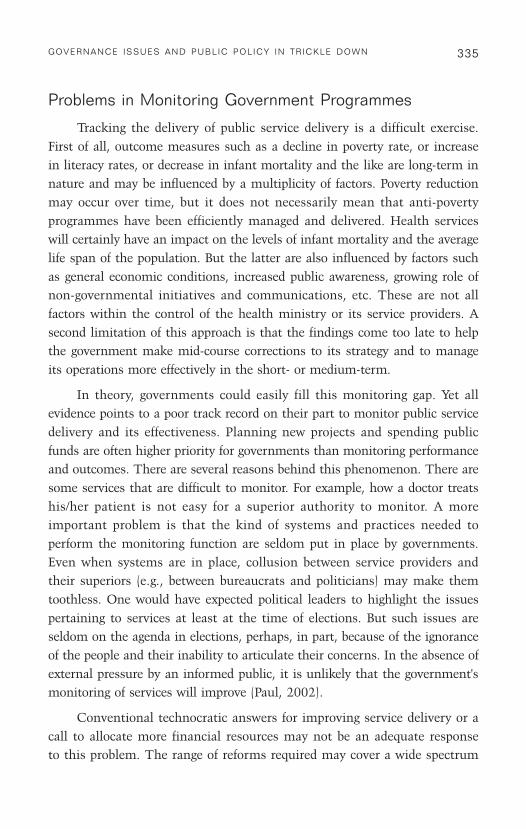
335GOVERNANCE IS SUES AND PUBLIC POLICY IN TRICKLE DOWN
Problems in Monitoring Government Programmes
Tracking the delivery of public service delivery is a difficult exercise.First of all, outcome measures such as a decline in poverty rate, or increasein literacy rates, or decrease in infant mortality and the like are long-term innature and may be influenced by a multiplicity of factors. Poverty reductionmay occur over time, but it does not necessarily mean that anti-povertyprogrammes have been efficiently managed and delivered. Health serviceswill certainly have an impact on the levels of infant mortality and the averagelife span of the population. But the latter are also influenced by factors suchas general economic conditions, increased public awareness, growing role ofnon-governmental initiatives and communications, etc. These are not allfactors within the control of the health ministry or its service providers. Asecond limitation of this approach is that the findings come too late to helpthe government make mid-course corrections to its strategy and to manageits operations more effectively in the short- or medium-term.
In theory, governments could easily fill this monitoring gap. Yet allevidence points to a poor track record on their part to monitor public servicedelivery and its effectiveness. Planning new projects and spending publicfunds are often higher priority for governments than monitoring performanceand outcomes. There are several reasons behind this phenomenon. There aresome services that are difficult to monitor. For example, how a doctor treatshis/her patient is not easy for a superior authority to monitor. A moreimportant problem is that the kind of systems and practices needed toperform the monitoring function are seldom put in place by governments.Even when systems are in place, collusion between service providers andtheir superiors (e.g., between bureaucrats and politicians) may make themtoothless. One would have expected political leaders to highlight the issuespertaining to services at least at the time of elections. But such issues areseldom on the agenda in elections, perhaps, in part, because of the ignoranceof the people and their inability to articulate their concerns. In the absence ofexternal pressure by an informed public, it is unlikely that the government'smonitoring of services will improve (Paul, 2002).
Conventional technocratic answers for improving service delivery or acall to allocate more financial resources may not be an adequate responseto this problem. The range of reforms required may cover a wide spectrum

336 INDIA EMERGING • VEENA JHA
—from political leadership and administrative structures and incentives toservice-specific changes including alternative delivery options.
Learning from Successful Examples ofSocial Service Delivery
The possibility of drawing lessons from success cases rather than thelarge legacy of failure has also been the subject of much debate in India.This may also help in specifying the type of reforms required. Newinformation about household level health and fertility through NFHS-3(National Family and Household Survey) suggests that health outcomes inIndia may be improving. In terms of methodology, NFHS is the besthousehold survey in India—it's the gold standard against which all surveyscompare themselves. The first survey was conducted in 1992-93, thesecond in 1998-99 and the third in 2005-06 (Gupta et al., 2006). Thequick summary is: that public health service delivery was terrible, but thehealth and fertility outcomes got tremendously better.
The percentage of infants dying before they attain the age of one hasdropped significantly in the last seven years in all five states surveyed.These include Punjab, Gujarat, Orissa, Maharashtra and Chhattisgarh. Ithas reduced in Punjab by 26 per cent, in Gujarat by 21 per cent, in Orissaby 20 per cent. When compared to the data from NFHS-1 carried out in1992-1993, Orissa, one of the poorest states in India in terms of per capitaincome, has witnessed a decline in infant mortality by 40 per cent.
For many years, the sense in India was that Kerala and Tamil Naduhad achieved replacement-level fertility (two children per woman) butfertility in the rest of the country remained stubbornly high. The NFHSfindings indicate that over the past 13 years, significant progress in fertilityhas taken place in all five states. Punjab and Maharashtra have achievedreplacement fertility. Women in Orissa, Chhattisgarh and Gujarat nowaverage 2.5 children each. The Indian average fertility rate according to the2011 Census was 2.6, which is 0.3 points above replacement rates.
Preliminary evidence as shown above indicates that the quality ofpublic health services has been worsening. As NFHS data shows,immunisation, which is largely done by the government, has worsened inGujarat, Punjab and Maharashtra in recent years. This information is in

337GOVERNANCE IS SUES AND PUBLIC POLICY IN TRICKLE DOWN
conformity with the data from the report on Reproductive and Child HealthProgramme of the World Bank which found that out of 274 districts in thecountry, child immunisation declined in 197 districts (Gupta et al., 2006).
Similarly, indicators of maternal health from the NFHS data showthat while antenatal care is now universal in all five states, only 55-75 percent of women are getting the recommended three antenatal visits.Moreover, the report on Reproductive and Child Health Programme foundthat the increase in in-hospital childbirth is caused by a rise in in-hospitalbirths in private hospitals. There has been a decline in in-hospital births inpublic hospitals. The data on antenatal care and assisted deliveries showedthat the percentage of deliveries assisted by health workers went up from39.6 per cent in 1998-99 to 47.5 in 2002-03, the percentage of womendelivering in public health facilities declined from 24 per cent to 18.5 percent. The increase took place in deliveries in the private sector, where theyrose steeply from 9.4 per cent to 21.5 per cent.47
Moreover, women in richer states were seen to be using public healthfacilities less and turning to private health. In Andhra Pradesh, thepercentage of women delivering in public institutions declined by 9.8 percent, in Kerala by 28.9 per cent, in Karnataka by 10.2 per cent, inMaharashtra by 9.1 per cent and in Tamil Nadu by 15.3 per cent. Further,the number of women who received postnatal care by public health workers(ANM) through home visits within two weeks of delivery also declinedfrom 14.1 per cent to 12.7 per cent. The Planning Commission's mid-termappraisal of the Tenth Plan observed that when people first seek treatment,an estimated 70-85 per cent visit a private sector provider for their healthcare needs.48
This result flies in the face of the two pet hypotheses cited above. Ifwe believe that the lot of poor people is not improving, then this evidenceis inconsistent with this position, because it suggests that poor people werea lot better off in 2005-06 when compared with 1998-99. If you believe thatgovernment spending and/or programme design is important, then thisevidence is inconsistent with this position: the NFHS (and other sources of
47. http://ajayshahblog.blogspot.com/2006/12/trickle-down-economics.html
48. Ibid.

338 INDIA EMERGING • VEENA JHA
evidence) show that the government system did badly, but that people gothealthier and had fewer kids anyway.
When people get richer, they buy better food, have better sanitationand cleanliness, more knowledge (e.g. education within the family), andservices of private doctors/hospitals. India has been experiencing powerfuleconomic growth, which is trickling down to poor people. So even thoughthe public health system is doing badly, health outcomes have improved,amongst poor people. These could be termed the trickle-down effects ofeconomic growth.
The orthodox view of public policy in India equates 'the health of thepublic' with the spending on and the design of 'public health programmes',and assumes that poor people are not sharing in economic growth. NFHS-3suggests that if you completely froze the spending on the Ministry ofHealth in nominal terms, and just had high GDP growth, you would mostlikely continue to get strong improvements in health outcomes.
Such an understanding—where health outcomes are not equated tothe public health system—is consistent with the history of health inEurope, where a great deal of improvements in health took place owing torising incomes feeding into nutrition, cleanliness and private purchases ofhealth services. Such an understanding is also consistent with analysis ofNFHS-1 and NFHS-2, where the basic story which emerges is that thepresence of a primary health centre does little for health (Dass, 2000).
Governance Indicators and Poverty Alleviation:A Business-based Approach
Following this argument, some argue that donors and governmentsshould provide loans at low interest rates directly to businesses that areprepared to invest in rural areas. Instead of trying to create entrepreneursout of poorly educated adults, the emphasis ought to be in generatingsustaining jobs in large numbers (George, 2006).
India's rural population is increasing by over 9 million annuallyaccording to the 2011 Census. Urban prosperity will not trickle down fastenough to reduce rural poverty. Government-run projects are not capable ofadding 600 million sustainable jobs. NGOs can at best lower the misery
339GOVERNANCE IS SUES AND PUBLIC POLICY IN TRICKLE DOWN
faced by the poor, but not much more. Only the private sector can producethe kind of vibrant economic activity that will generate sufficientemployment and higher income for the rural population.
Handouts will not solve poverty. The poor want jobs and notbenevolence. A market-based approach to poverty reduction will result inincome and wealth creation, and lay the groundwork for the next generationto avail of a wider range of opportunities with enhanced resources.
Business has been the greatest beneficiary of globalisation. The rapidexpansion of trade and cross-border capital flows made possible through theglobalisation have created unparalleled opportunities for growth andfinancing of business. Globalisation cannot work properly if the poor arenot made part of it. They need to be reassured that globalisation canbenefit them equally. The biggest business challenge of today is to bring thepoor into the market economy. It should be in the self-interest ofcorporations to do that as a matter of top priority. Business has to realisethat sharpening of the inequalities as a consequence of globalisation is thegreatest threat to the security and sustainability of their businesses (Mehra,2005).
Secondly, for the first time in human history business has the powerand technology to make a difference in human lives. It has a social cause tomake profits instead of the invisible hand of Adam Smith.
Thirdly and more importantly, businesses have to realise thatthroughout history businesses have expanded and multiplied only byreaching what C.K. Prahalad, the noted management guru called, 'thebottom of the pyramid.' (Prahalad, 2009). Both Microsoft and mobiletelephony that spawned some of the 21st century's most successfulbusinesses have proved the point. Microsoft succeeded because it aimed toreach every home. IBM failed because the vision of its founder ThomasWatson was 'there was to be a world market of just five computers.'Reliance Infocomm, a mobile phone operator in India received one millionapplications in the first 10 days when it offered a mobile phone for $10.India today has more mobile phones than landlines.
The success stories of Gramin Bank in Bangladesh, Casas Bahia inBrazil, Cemax in Mexico and ICICI Bank and Nirma in India show howaccessing the poor markets have transformed both these businesses and the

340 INDIA EMERGING • VEENA JHA
poor constituencies they served. ICICI Bank has developed a new model ofrelationship with its customers. It has no direct contact with its half amillion rural clients. It monitors their loans which are as little as sixdollars with instalments of 20 cents each month through self-help groupsformed by rural women. Cardiac care and cataract operations are reachingnew heights of process innovation in India. A cataract operation in AravindEye Hospital costs barely $50 including hospitalisation costs. Forty per centof the patients are treated free. Yet, the hospital is debt free and has areturn on capital of 120 to 130 per cent (Prahalad, 2009).
Another revolution has been brought by Unilever subsidiary in India,Hindustan Lever. They have created a distribution network of some 30,000women called ‘Shakti Ammas’ to distribute their products in remotevillages as direct-to consumer initiative targetted at individuals at thebottom of the pyramid. Training these women in entrepreneurial skills willhave a cascading effect on the rural economy. Scaling up this modelworldwide can have phenomenal results in alleviating poverty and bringingthe poor into the market economy (Prahalad, 2009).
What should be done to Stimulate the Private Sector toShare in the Delivery of Public Services
So what is stopping businesses from becoming a part of the povertyalleviation drive of India. There are complex answers to this simplequestion. Is it a simple case of passing the buck, i.e., business considersthat it is largely the government's role to alleviate poverty, whereas what itdoes is more in the nature of philanthropy and by no means a substitute forgovernment delivery of public services. If the government has becomeineffective in the delivery of public services, should not business step inand take a role in its own self-interest, i.e., that of generating consumers,an effective and productive labour force, and services which have intimatelinkages with the economy. The interesting question is why is this nothappening in a large enough scale to make a visible dent to poverty inIndia? The answer is in the lack of accountability in public service delivery.Lack of accountability applies to both the public and the private sector. Thepolity of India has to hold the government and the private sectorresponsible for public delivery of services and there has to be an objectiveevaluation of the money spent and the services delivered.

341GOVERNANCE IS SUES AND PUBLIC POLICY IN TRICKLE DOWN
Some insights into these issues can be found through an evaluation ofthe innovations made in service delivery in the last 20 years. A World Bankstudy has examined successful cases of public service delivery and hasnarrowed the range of reforms which could foster and multiply suchexamples (World Bank, 2006). The study identifies six categories of reformsto improve service delivery. These are: (1) fostering competition, (2)simplifying transactions, (3) restructuring agency processes, (4)decentralising management, (5) building political support for programmedelivery, and (6) strengthening accountability mechanisms.
Private players can complement government's delivery of socialservices. This was observed in all the five services as shown above (Paul etal., 2004). However, for private players to act efficiently, it is necessary forthe government to create a level playing field and effective conditions ofcompetition. The manifold increase in teledensity is a working example ofhow the government successfully levelled the playing field between its ownoperators and that of the private sector.49 Mobile telephone services are nowavailable even to the poor in India. While it may not be easy to extend thisexample to other sectors, it is nevertheless a telling success story in India.There may be some scope for its extension to the education sector wherestandards of service provision and monitoring can be laid down by aregulatory authority and both government and private service providers cancompete for provision of the service.
Another important experiment of the government was simplifyingaccess to government services. Telling examples in this field have been thesimplification of the system of payment of income taxes leading to amanifold increase in the collection of income tax, as well as reservation ofrail and flight tickets over the internet. Extension of this service to themaintenance of land records, paying house and land taxes and other formsof e-Seva can reduce corruption to a large extent (World Bank, 2006).Experiments with the use of internet for these purposes and digitisingdatabases on the poor in India are currently under way. The widespread useof internet for the delivery of social services may reduce corruption thoughnot eliminate it. In this context the role of the private sector in thedevelopment of databases will be of crucial importance.
49. See Chapter 4.

342 INDIA EMERGING • VEENA JHA
Changing agency processes and decentralisation are based on theinvolvement of the local community and end users of services which iscrucial to the delivery of public services. A good example of such a systemwas the Education Guarantee Scheme (EGS) of Madhya Pradesh in 1997(World Bank, 2006). The EGS scheme ensured that if the local polity or thepanchayat forwarded a list of at least 40 children without access to a schoolwithin walking distance, the state would ensure a functioning school within90 days. Under the programme, communities were expected to contributephysical space for a school, choose a teacher and supplement resources. Thegovernment bore the costs of teachers’ salaries, provided teaching andlearning materials as well as seed money for infrastructure, and tookresponsibility for teachers’ training. Parent-Teacher Associations (PTAs) werecharged with monitoring the functioning of EGS schools and reported tovillage education committees. In a short period of three years from July 1997to July 2000, the number of EGS schools rose to 26,571 (42 per cent of themin tribal areas), catering to some 1.2 million children of Madhya Pradesh(World Bank, 2006).
Madhya Pradesh's Rogi Kalyan Samiti (RKS) turned district hospitalsinto independent societies, which not only managed hospitals, but had thepower to levy user fees, solicit private donations, use vacant hospital landto generate more revenue, and outsource cleaning and other functions. RKSsocieties consisted of all important players locally including the collector,MLAs and NGOs. User fees collected by RKS societies were directedtowards funding maintenance and the cost of purchasing new equipmentfor the state's often dilapidated hospitals. The RKS model was popular withdoctors and staff because it made available equipment that might nototherwise be affordable given the high proportion of the budget spent onsalaries. By earmarking user fees for maintenance and equipment, RKSsocieties helped improve the productivity of salary expenditures by toppingthem off with necessary non-salary spending. The poor were exemptedfrom paying user fees on the basis of self-identification, rather than anyformal criteria. The Central government's National Rural Health Missionidentified the RKS model for replication across the country (World Bank,2006).

343GOVERNANCE IS SUES AND PUBLIC POLICY IN TRICKLE DOWN
Examples of improvement of accountability are few and far between.Madhya Pradesh also introduced a more decentralised system of teachermanagement to improve accountability. The state's unionised regular teacherswere declared a 'dying' cadre and no further recruitment was permitted to thecadre: regular teachers were recruited by the state government and could betransferred across districts. Panchayats had no role in hiring them and couldnot remove them in the event of non-performance or poor attendance. A newcategory of teachers, Shiksha Karmis (SKs), in 1996 at the primary schoollevel were to be recruited by block or janpad panchayats (JPs) for aprobationary period of three years. If after three years, the JP was notsatisfied with teacher’s performance, it could simply decline to confirm theteacher in the post; alternatively, the JP had the power to put offconfirmation by extending probation for another two years and revisit thedecision later (Ramachandran, 2003; Sharma, 2001). During probation, SKscould be removed by JPs for dereliction of duty with one month's notice.Panchayats, according to a government order issued in 1999, were also giventhe power to withhold salary payments for non-attendance for all primaryschool teachers. Preliminary results from ongoing research in AndhraPradesh suggest that even providing small monetary bonus payments (withan average annual bonus of around 3 per cent of annual pay) to teachers onthe basis of the average improvement in students’ performance onindependently administered tests led to large gains in students’ learningoutcomes. This programme was over 10 times more cost-effective inimproving learning than simply spending along existing patterns. It was alsopopular with teachers with over 85 per cent of them being in favour of theidea of bonus payments on the basis of performance (Muralidharan andSundararaman, 2009).
Another method of improving effectiveness of service delivery is tomodify the contractual structure of employment to make job renewal subjectto satisfactory performance as measured by both administrators and thecommunity that is being served. A good example is the use of contractteachers who are hired locally at the village level. Again, research shows thatcontract teachers are significantly less likely to be absent (15 per centcompared to 25 per cent) and are much more likely to be engaging inteaching activity even though they are paid only Rs 1,000 (US $25) a monthas opposed to an average of Rs 7,500 (US $190) a month for government-

344 INDIA EMERGING • VEENA JHA
employed teachers. The research also shows that providing schools withextra teachers on contract is a highly cost-effective way of improving learningoutcomes. The key features of this arrangement are that the teachers belongto the same local communities that they are serving, and that the renewal oftheir contract is subject to satisfactory performance (World Bank, 2006).
One response to the poor quality of public schools and clinics was theincreasing prevalence of private schools and clinics even in backward partsof the country. A key feature of private providers is the much higher level ofaccountability of their employees. For example, data shows that absentteachers in private schools were 175 times more likely to have action takenagainst them than absent teachers in government schools, though theirsalary levels were much lower (Muralidharan and Sundararaman, 2009).However, in terms of education outcomes a recent ASER report has shownthat there is little to choose between private and public schools (ASER,2009). Moreover, the problem from the point of view of social justice is thatthese facilities are only available to those who can afford to pay for them,which puts them out of the reach of the poor.
A promising way of addressing this problem is for the government todirectly provide health and education grants or vouchers to the poor, whichin turn would be redeemable at any recognised school or clinic (that would besubject to some basic regulation). The attractiveness of such a scheme is thatit harnesses the power of incentives and competition to ensure efficientproduction that is sensitive to what the users want while avoiding the biggestweakness of the market—which is that it only caters to those withpurchasing power. Such a scheme would be indifferent to whether theprovider was public or private, but would ensure that providers only getcompensated if their service is demanded by users. However, mechanismswill have to be devised for avoiding corruption in the distribution of thesevouchers and ensuring that it reaches only the poor and not the non-poor.Moreover, private service delivery will have to multiply manifold in scale andbe accessible to the poor in rural areas. If the distribution of vouchers is justand reaches the poor, an effective demand for these services would be createdin rural areas forcing the private sector to create facilities in these areas.
Tying the compensation of service providers to the satisfaction of users(as revealed by their use of the facility) can be a very effective way of

345GOVERNANCE IS SUES AND PUBLIC POLICY IN TRICKLE DOWN
improving the quality of basic services. Such a scheme can also be a highlyeffective way of targetting government support, since the amount of thegrant can be calibrated to an index of backwardness and funds can beeffectively targetted to the neediest segments of society.
The importance of political leadership in delivering inclusive growthcannot be overstressed in a country like India. Even poor states such as Bihar,Orissa and Madhya Pradesh have seen bouts of good performance on bothgrowth and inclusion front through dedicated political leadership. In fact,political leadership at the state level is of crucial importance in deliveringinclusive growth. Bihar's economic growth is higher than that of most statesbecause of the dedicated leadership of its chief minister over the last four years,2006-2010. Similarly, despite its abject poverty, Madhya Pradesh has greatstrides in the delivery of public services as shown above.
In conclusion, it is clear that improving the quality of health andeducation services for all Indians is a critical component of ensuring'inclusive growth'. While budgetary increases for health and education aredefinitely welcome, their effect will be magnified if accompanied bymeasures to improve the effectiveness of spending. In particular, the lack ofboth accountability and performance incentives for government employeesin health and education (as manifested by high rates of absence) is anenormous hurdle for effective service delivery.
Conclusions
India has made some strides in the area of good governance. Therehave been successful innovations in service delivery as shown above.Media, NGOs and international agencies have created a new level ofawareness and sensitivity to the epidemic evil of corruption. Free press inIndia does serve to report some of the heinous corruption cases.50 Severalreform initiatives in the wake of globalisation and emergingcommunication technologies, particularly e-Seva initiatives as shown abovehave also helped to improve governance. The rule of law is recognised as amajor governance issue by governments. Police and judicial reforms have
50. “President Patil Cautions against Corruption”, August 14, 2009. http://www.expressindia.com/latest-new

346 INDIA EMERGING • VEENA JHA
received new impetus. Core reforms in economic, political andadministrative arenas have also been introduced in the form of civil service,education, social sector, public-private partnership and gender reforms.India is putting more emphasis on training of civil servants to enhancetheir efficiency and effectiveness. The Indian state of Kerala also presents agood example of community and state partnership in the effectiveimplementation of poverty alleviation programmes at the local governmentlevel (Mohindra et al., 2008).
India has realised that its immense human capital would be wasted asa result of women not fully participating in the economic, political andadministrative arena (See Chapter 4). Gender empowerment is animportant component of economic, political and administrative reforms inIndia. Philanthropy, self-help, self-development and common poolresources have long been recognised as traditional and religious values inIndia (See Chapter 5). As was pointed out earlier, good governance couldchannel philanthropic impulses to the social sector in a coherent andorganised manner (See Chapter 5).
However there are several constraints to good governance in India aswas shown above. Primarily weak institutional norms for the efficient andeffective management for public service delivery is responsible for the slowtrickle down of Indian economic growth. Improving accountability tobeneficiaries in private and civil society organisations is vital for ensuringthat growth trickles down to the poor. A management system with internalaccountability in government, the private sector and civil societyorganisations constitutes the basics of any good governance agenda. Unlessthese organisations have strong control systems, they cannot contributeeffectively to good governance.
Due to massive inequalities in society and a small but growing middleclass, both bureaucracy and democracy strengthened traditional elites andcreated new elites. Inequalities in society are also reflected in the marketand civil society. Elitism exists not only in the public sector but is also seenin the realm of non-state actors. So what is the way out? Internal andexternal accountability in conjunction with sound competition policy andstrong regulation across the board through efficient and effectivemanagement systems and transparency in decision-making is the answer.

347GOVERNANCE IS SUES AND PUBLIC POLICY IN TRICKLE DOWN
Capacity for good governance is an issue not only for the state; the privatesector and civil society suffer with the same problem.
In view of the above, the concept of humane governance coupled withgood enough governance as discussed earlier has direct relevance to India(Grindle, 2004). Thus, good governance is good political, good economicand good civic governance which promotes human development. The ruleof law, provision of basic services and poverty reduction with theparticipation of the private sector and civil society should be taken onpriority basis. However, government still has to play a major and leadingrole in human development.
Implementation of policies is a major problem in India. It is lessrelated to capacity but more to political will at institutional andorganisational levels. Effective implementation begins from the formulationand design stage of policy, programme, or project; if it is based on wrongtheories or concepts poor implementation is the obvious result. It alsobecomes a problem if the implementation strategy is not built in theplanning of a project or policy. It is important that Indian states shouldlearn from each other by sharing successes and failures in order to improveimplementation.
The importance of e-governance for speedy, efficient and transparentdelivery of services at the doorsteps of citizens has grown over time.Computerisation of government offices has become part of e-governance.Booking of railway tickets has become easier due to e-governance. Social andpublic auditing of muster rolls in development-related schemes andprogrammes has become an empowering practice in some parts of thecountry. However, these schemes are all too inadequate and need tomultiply manifold if they are to impact poverty.
As long as significant poverty exists in India, and disparity betweenthe rich and the poor widens, private sector would need to make acontribution to solving the problem. A dialogue must begin between andamong business leaders on devising rules for business conduct in deprivedcommunities. The model must consider how poor people can be broughtinto the mainstream of consumers with sufficient purchasing power withina reasonable time period. Distribution of health and education vouchersshould be considered seriously by the Government of India.

348 INDIA EMERGING • VEENA JHA
To sum up, the process of reform must continue in India in aneffective framework of good governance. India has to find dynamic ways ofpublic-private partnerships in the delivery of social services. It has toundertake massive administrative and political reform to ensure highgrowth rates and inclusive growth. Inclusive growth is not automatic butsmall incremental changes and building on success cases of administrativeand political reform may be the way forward.
ReferencesAnand, Vinod (2010). Trickle-down versus Trickle-up. http://www.merinews.com/article
Court, J. (2001). “Assessing and Analyzing Governance in India: Evidence from a NewSurvey”, World Governance Assessment Project, Working Paper No. 1.
Dass, Purvi (2000). Global Democratic Governance: Role of Global Civil SocietyOrganisations. http://www.civicus.org/pg/world-democracy-day/1127-global-democratic-governance--role-of-global-civil-society-organisations
Dev, S. Mahendra and Jos Mooij (2002). “Social Sector Expenditures in the 1990’s:Analysis of Central and State Budgets”, Economic and Political Weekly 31(9): 853-66. March 2.
Dongaonkar, D. (2006). “Missing Links in Education System in India”. Obtained throughthe internet: http://www.dise.in
Drèze, Jean and Reetika Khera (2009). “The Battle for Employment Guarantee”, Frontline26(01). January 03-16. Publishers of The Hindu, India.
Easton, D. (1965). A Systems Analysis of Political Life. New York: Wiley.
George, Abraham M. (2006). Rural India Needs Corporate Investment: A New Approachto Poverty Reduction. December 29. http://www.tgfworld.org/Rural_India_Needs_Corporate_Investment.htm
Grindle, M. (2004). “Good Enough Governance: Poverty Reduction and Reform inDeveloping Countries”, Governance: An International Journal of PolicyAdministration and Institutions 17(4): 525-48.
Goetz, A.M. and J. Gaventa (2001). “Bringing Citizen Voice and Client Focus into ServiceDelivery”, IDS Working Paper 138. Brighton: Institute of Development Studies.
Gupta, Kamla, Sulabha Parasuraman, P. Arokiasamy, S.K. Singh and H. Lhungdim (2006).“Preliminary Findings from the Third National Family Health Survey”, Economic andPolitical Weekly, October 21.
Haddad, L. and S. Zeitlyn (2009). Lifting the Curse: Overcoming Persistent Undernutritionin India. http://www.ids.ac.uk
Himanshu (2010). Should we Worry about Inequality? http://www.livemint.com/2010
Human Development Centre (1999). Human Development Report. New York: OxfordUniversity Press.
Hyden, G. and J. Court (2002). “World Governance Survey”, Discussion Paper 1. Tokyo:United Nations University.

349GOVERNANCE IS SUES AND PUBLIC POLICY IN TRICKLE DOWN
Hyden, Goran, Julius Court and Ken Mease (2003). “Government and Governance in 16Developing Countries”, World Governance Survey Discussion Paper 6. July. London:Overseas Development Institute. http://www.odi.org.uk/resources/download
Jabeen, Nasira (2007). “Good or Good Enough Governance in South Asia: Constraintsand Possibilities”, Inaugural Address as Professor to the Prince Claus Chair inDevelopment and Equity 2006-07. April 2. Netherlands: Utrecht University. http://www.princeclauschair.nl
Kauffman, Daniel, Aart Kraay and Pablo Zoido-Lobaton (1999). “Governance Matters”,World Bank Policy Research Working Paper Series No. 2196. http://ideas.repec.org/p/wbk/wbrwps
Kaufmann, Daniel and Aart Kraay (2007). “Governance Matters VI: Governance Indicatorsfor 1996-2006”, World Bank Policy Research Working Paper No. 4280. TheBrookings Institution, World Bank-Development Research Group (DECRG),Massimo Mastruzzi, World Bank Institute. July.
Mehra, Madhav (2005). “Taking Corporate Governance Beyond the Boardroom”, Keynoteaddress at ICSA International: Making Poverty Alleviation a Business Issue.
Mohindra, K.S., Slim Haddad and D. Narayana (2008). “Can Microcredit Help Improve theHealth of Poor Women? Some Findings from a Cross-sectional Study in Kerala,India”, International Journal for Equity and Health 7: 2. Published on line at http://www.ncbi.nlm.nih.gov/pmc/articles
Muralidharan, K. and V. Sundararaman (2009). “Teacher Performance Pay: ExperimentalEvidence from India”, NBER Working Paper No.15323. September. http://www.nber.org/papers/w15323.pdf
Paul, Samuel (2002). Holding the State to Account: Citizen Monitoring in Action.Bangalore: Books for Change.
Paul, Samuel, Suresh Balakrishnan, K. Gopakumar, Sita Sekhar and M. Vivekananda(2004). “State of India’s Public Services: Benchmarks for the States”, Economic andPolitical Weekly 39(9): 920-933, February 28–March 5.
Prahalad, C.K. (2009). The Fortune at the Bottom of the Pyramid: Eradicating Povertythrough Profits. Wharton, USA: Wharton School Publishing.
Ramachandran, Vimala (2003). Lok Jumbish: Rajasthan People's Movement for Educationfor All. New Delhi: The World Bank, SASHD.
Reddy, Y.V. (2003). “Towards Globalization in the Financial Sector in India”, InauguralAddress by Dr Y V Reddy, Governor of the Reserve Bank of India, at the Twenty-FifthBank Economists’ Conference-2003. Mumbai. December 11. http://www.bis.org/review
Shariff, Abusaleh and Prabir Ghosh (2002). “State-Adjusted Public Expenditure on SocialSector and Poverty Alleviation Programmes”, Economic and Political Weekly 38(8),February 23.
Sharma, Amita (2000). Improving Primary Teacher Provision through Better Management:A Study of Madhya Pradesh. (Unpublished manuscript, 2000).
UNCTAD (2009). World Investment Report, 2009. Geneva, Switzerland: United NationsConference on Trade and Development.
UNDP (1997). Re-conceptualizing Governance. New York: UNDP. pp.2-3.
————. (2009). Human Development Report, 2009. New York: Oxford University Press.

350 INDIA EMERGING • VEENA JHA
UNESCO (2009). EFA Global Monitoring Report, 2009: Overcoming Inequality: WhyGovernance Matters. Oxford, U.K.: Oxford University Press. http://unesdoc.unesco.org
United Nations ESCAP, ADB and UNDP (2007). The Millenium Development Goals:Progress in Asia and the Pacific, Asia Pacific. MDG study series.
Walton, Michael (Forthcoming). “The Political Economy of India’s Malnutrition Puzzle”,Institute of Development Studies Bulletin.
Wada Na Todo Abhiyan (2007). Gender & Governance: Review of the Women's Agenda inthe National Common Minimum Programme . March. Delhi. http://www.wadanatodo.net/images/160407/GenderNCMP_Eng.pdf
World Bank (1992). Governance and Development. Washington D.C.: The World Bank.
————. (1999). World Development Report 1999-2000. New York: Oxford UniversityPress. pp.258-59.
————. (2006). Reforming Public Services in India: Drawing Lessons from SuccessStories. Prepared by the Poverty Reduction and Economic Management Sector Unit,South Asia, Report No. 35041-IN. Published by the World Bank.

351GOVERNANCE IS SUES AND PUBLIC POLICY IN TRICKLE DOWN
Annexure A-6.1
Common Questions
• Name of the family head:
• Occupation:
• Working members in the family:
• Annual income:
• Number of children in family:
• Which all schemes are being availed by the family?
1) ASHA
2) Anganwadi
3) NREGA
4) Smart Card
• Which scheme is the best scheme according to you and why?
• Which scheme is most easily available?
• Have you faced any difficulty in obtaining any schemes?
NREGA
• How many people from your family have been given employment under thisscheme?
• What is the monthly wage you get?
• What all documents need to be submitted?
• How many months it took you to get the job after the application were filled?
• Are you getting all the promised things?
Anganwadi
• Total number of kids at home?
• Do you know about Anganwadi?
• What do you know about Anaganwadi and where did you hear about it?
• How many kids are sent to Anganwadi?
• If none of the kids not sent, then why?
• Are they properly managed?
• Is the food quality available?
• How much food is available and how much is allocated by the government in valueterms?
• Is the place neat and clean?Are your children happy going there?
• Do you get free time by sending your children to Anganwadi?
• What do you do in this free time?
• Are you getting all the promised benefits?
ASHA
• Does your family avail the ASHA scheme?
• What benefits are given to you in the scheme?
• Are the medicines free of cost?
• If not then how much do you have to pay?

352 INDIA EMERGING • VEENA JHA
• How do you pay?
• Are the vaccinations free of cost?
• If not how much do you pay?
• What was promised to you for the scheme?
• Are you getting all the promised things?
• Which medicines and vaccinations are not available?
• Are the services available at time of emergency?
• How many dispensaries are there?
• How many doctors are there?
• How may support staff people are there?
• Is the place neat and clean?
• Are you getting all the promised benefits?
Smart Card
• How many days it took to obtain the Smart Card?
• What all papers you have to submit for obtaining the Smart Card?
• What was your annual saving before availing the Smart Card?
• What is your annual saving after availing the Smart Card?
• Have you purchased new durables after coming of Smart Card?
• Have you started using new items after the Smart Card?
• If yes, which all items?
• Is it easy to debit the Smart Card?

353GOVERNANCE IS SUES AND PUBLIC POLICY IN TRICKLE DOWN
Families Availing Anganwadi Scheme
Annexure A-6.2
Anganwadi Scheme(Rajasthan: Kishangarh + Ajmer)
0
10
20
30
40
50
60
1 2 3 4 5 6 7
Family Strength
Yes No
Figure 1
Source of Information: Anganwadi Scheme
Figure 2
27.7
41.6
10.9
19.8
0
10
20
30
40
50
Per
cen
t
Fellowvillagers
Governmentinitiatives
NGO workers SurpanchSurpanch

354 INDIA EMERGING • VEENA JHA
Figure 3
Average Time Saved by Mothers for Availing Anganwadi Scheme
Figure 4
Activities Performed Utilising the Saved Time
8 8 8 8
7 7
6
7 7
0
1
2
3
4
5
6
7
8
9
Cheeta
Khera
Chotidh
ani
Jajot
a
Kali D
unga
ri
Kalyan
pura
Moh
anpu
ra
Salem
abad
Sard
ar Si
ngh D
hani
Sursu
ra
Saved time (hours)
Industrial works7%NREGA scheme
49%
Assisting family works25%
Other26%
Household works19%
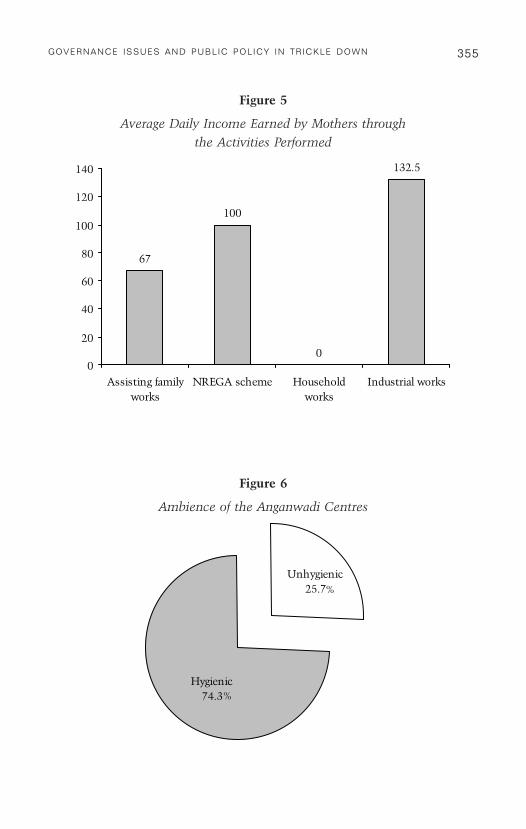
355GOVERNANCE IS SUES AND PUBLIC POLICY IN TRICKLE DOWN
Figure 5
Average Daily Income Earned by Mothers throughthe Activities Performed
67
100
0
132.5
0
20
40
60
80
100
120
140
Assisting familyworks
NREGA scheme Householdworks
Industrial works
Figure 6
Ambience of the Anganwadi Centres
Unhygienic25.7
Hygienic74.3
%
%

356 INDIA EMERGING • VEENA JHA
Figure 7
Quality of Food Served
Bad9%
Good51%
Poor1%
Satisfactory39%
Figure 8
Type of Food Served to Children
Rice19.8%
Panjiri26.7% Daliya
33.7%
Dal Water19.8%
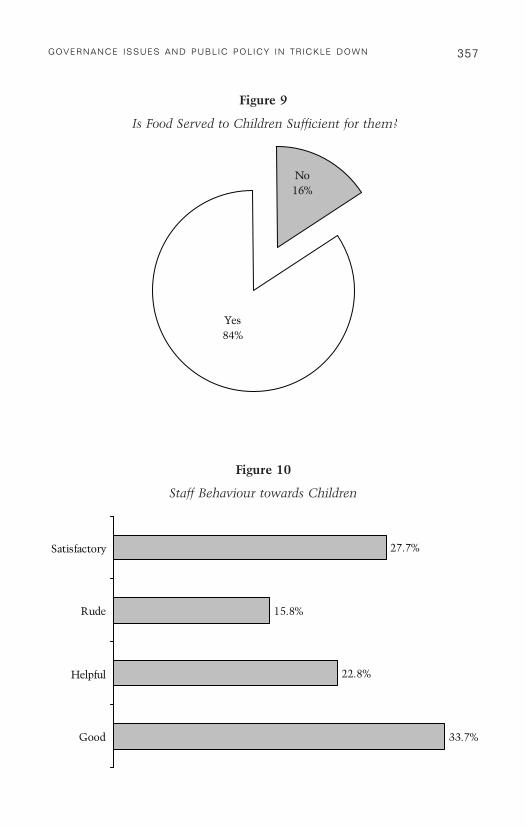
357GOVERNANCE IS SUES AND PUBLIC POLICY IN TRICKLE DOWN
No16%
Yes84%
Figure 9
Is Food Served to Children Sufficient for them?
Figure 10
Staff Behaviour towards Children
33.7%
22.8%
15.8%
27.7%
Good
Helpful
Rude
Satisfactory
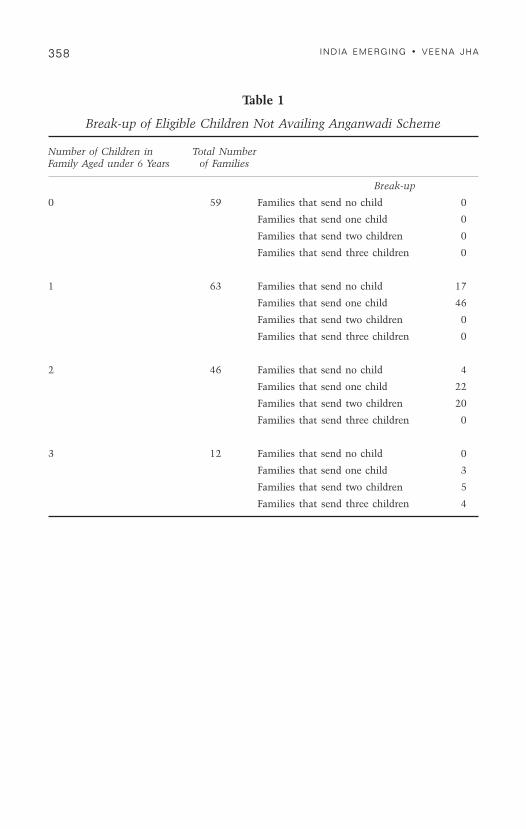
358 INDIA EMERGING • VEENA JHA
Table 1
Break-up of Eligible Children Not Availing Anganwadi Scheme
Number of Children in Total NumberFamily Aged under 6 Years of Families
Break-up
0 59 Families that send no child 0
Families that send one child 0
Families that send two children 0
Families that send three children 0
1 63 Families that send no child 17
Families that send one child 46
Families that send two children 0
Families that send three children 0
2 46 Families that send no child 4
Families that send one child 22
Families that send two children 20
Families that send three children 0
3 12 Families that send no child 0
Families that send one child 3
Families that send two children 5
Families that send three children 4

359GOVERNANCE IS SUES AND PUBLIC POLICY IN TRICKLE DOWN
Figure 11
Problems Faced in Availing Anganwadi Scheme
9.8
2
76.5
10.8
10
10
20
30
40
50
60
70
80
90
Additionalnutritious dietto be provided
Food qualityshould beimproved
No problem Insufficientstaff
Lack of toys
Per
cen
t
Series1

360 INDIA EMERGING • VEENA JHA
Annexure A-6.3
NREGA Scheme(Rajasthan: Kishangarh + Ajmer)
Figure 1
Gender Distribution
Female29%
Male71%
Figure 2
Marital Status
47
6
116
110
20
40
60
80
100
120
140
160
180
Married Unmarried
Cou
nt
Female Male
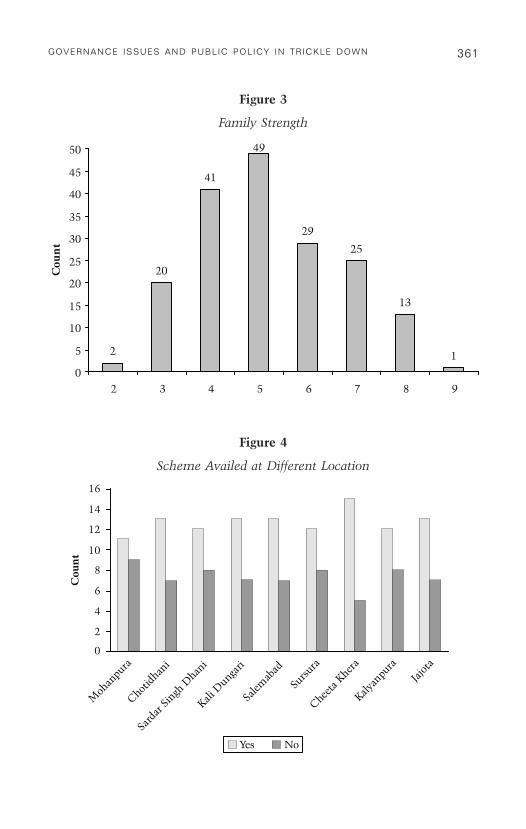
361GOVERNANCE IS SUES AND PUBLIC POLICY IN TRICKLE DOWN
Figure 3
Family Strength
Cou
nt
16
14
12
10
8
6
4
2
0
Moh
anpu
ra
Chotid
hani
Sard
arSi
ngh D
hani
KaliD
unga
ri
Salem
abad
Sursu
ra
Cheeta
Khe
ra
Kalyan
pura
Jajot
a
Yes No
Figure 4
Scheme Availed at Different Location
2
20
41
49
29
25
13
1
0
5
10
15
20
25
30
35
40
45
50
2 3 4 5 6 7 8 9
Cou
nt

362 INDIA EMERGING • VEENA JHA
Figure 5
Family Strength versus People Availing Scheme
9286%
5948
13 1319
0
25-40 40-60 60-75 75-90 90-110 110-130 130-150 150-200
Per
cen
t
86
Figure 6
Income Level versus Percentage of People Availing
0
10
20
30
40
50
60
70
80
90
100
1 11
3134
18
10
7
1
1 9
1015
11
156
0
2' 3' 4' 5' 6' 7' 8' 9'
Yes No
Per
cen
t

363GOVERNANCE IS SUES AND PUBLIC POLICY IN TRICKLE DOWN
Figure 7
Income Distribution versus Marital Status
Figure 8
Working Conditions
1
4
1517
31
11 10
200
24
1 1 1 1
25-40 40-60 60-75 75-90 90-110 110-130 130-150 150-200
Married Unmarried
Per
cen
t
Good21%
Satisfactory31%
Other44%
No comment4%
Bad7%
Not applicable37 %

364 INDIA EMERGING • VEENA JHA
Figure 9
Problem Faced in Getting Job Card
Figure 10
Problem Faced in Getting Job after Job Card
Not applicable34%
No56%
Wait for few months
4%
Long wait2%
Other4%
Delay due to divided family issue
1%
Others (delay, wrong photograph)
3%
Long wait10%
Long job rotation policy
3%
No yearly offering1% No comments
2%
No problem84%

365GOVERNANCE IS SUES AND PUBLIC POLICY IN TRICKLE DOWN
Figure 11
Problem Faced while Drawing Money
Figure 12
Problem Faced with NREGA Scheme
No problem88%
Absurd timings1%
No funds2%Money credit in two
months time4%
Delay in money5%
No comment1%
No problem88%
No special treatment of old
people1%
Still plenty are unemployed
3%
Lack of jobs4%
Underpayed3%

This page intentionally left blank
ConclusionsConclusionsConclusionsConclusionsConclusions
This book has established that high rates of growth in India have trickleddown in various ways to the poor. Whether this trickle down has been orwill be sufficient to get India out of poverty in the foreseeable future isanother question. Several commentators especially in India question thetrickle down hypothesis (Mazumdar, 2010). The World Bank's estimate ofpoverty for India has been revised upwards several times. The World Bankestimates India's poverty at 23.6 per cent in 2015. One of the few paperswhich have argued that India's poverty reduction has been even moreimpressive than China's is by Chandy and Gertz (2011) of the BrookingsInstitution in Massachusetts, USA. They argue that on account of Indiaand China's poverty reduction, the MDG goals have already been achievedin 2007 and would half further by 2015. They estimate India's poverty at 7per cent in 2015. These differing views can in part be attributed tochanging definition or method of measurement of poverty. Themeasurement of poverty is fraught with difficulties as the definition, therecall period and the benchmarks are constantly being revised upwards.This is justified in some senses as with high rates of growth, povertydefinitions today should include besides a minimum calorific consumption,also issues such as ability to spend on health and education.
While the different estimates of poverty show different levels ofpoverty, they all agree that poverty has decreased. This book has tried toestablish the trickle down hypothesis through different approaches insteadof just looking at the headcount ratio. However while the book argues thatpoverty has reduced because of high growth rates, it is still stark and glaringinequalities are evident in several sections of society. The emergence ofissues such as environmental problems and social tension are beyond thescope of this book, but these are the inevitable fallouts of inequalities ineconomies such as India. This is because the high rates of growth benefitmainly the rich and the educated while leaving the poor majority far
77777

368 INDIA EMERGING • VEENA JHA
behind. Another issue that the book has not tackled are themacroeconomic aspects such as exchange rates and inflation which couldaffect poverty adversely. Inflation, particularly food inflation, would have anegative effect on poverty. Inflation in food prices in India particularly after2008 has become a serious problem.
How Growth can Trickle Down
With all these caveats, the book has tried to go behind the numbers toget an idea of the agents and processes of trickle down that the high growthrates in India have generated. The natural starting point for the India storyis to focus on how this growth period was different from others and whatwere the main drivers of growth. The book begins with an examination ofthe information technology and telecommunications sector which has seengrowth rates upward of 20 per cent for nearly two decades. A back of theenvelop calculation shows that their contribution to growth rates wasnearly 2-3 per cent of the average 6 per cent growth rate over the last 20years. This shows that they accounted for nearly one-third to half of thetotal growth of the Indian economy. The ICT and mobile sector accountsfor over 10 per cent of India's GDP and over 30 per cent of India's exports.However the employment potential of this sector is limited, thus thespread effects of a large part of India's growth has been limited. Directlythis sector employs less than 0.33 per cent of the labour force, thoughindirectly it employs over 1 per cent of the labour force. Most of theemployment is, however, in the formal private sector. Mobile telephonyemploys a slightly higher number of over 2 per cent, but all in allemployment in this sector is miniscule in comparison to its share of GDPor exports. Given the limited employment both directly and indirectly ofthe sector, the trickle down effects of necessity would be somewhat limitedlooking at the numbers.
However, what the IT and telecommunications sector has doneindirectly is to change the perceptions of Indians about themselves. Theuse of ICT while relatively limited at present could become a significantagent of trickle down if it were to become a general purpose technology forthe Indian economy. Similarly while mobiles have improved India'sconnectivity drastically, there is only anecdotal evidence to suggest that it isused to improve productivity. While IT is largely export oriented, a growing

369CONCLUSIONS
share is now being directed to domestic needs. Mobiles are almostexclusively domestically oriented. The multiplier effects of both are high asthey employ young people with a high marginal propensity to consume.When both start being used widely for improving the productivity of theeconomy, its trickle down will accelerate.
To fully realise the potential of ICT and mobile telephony, educationalimprovements to support not only this sector but also other related sectors(telecom, internet, data processing, etc.) will be required. In short, the e-readiness of states should be improved to assimilate ICT inducedimprovements in governance which in turn would have a large impact onpoverty alleviation. In some sense, improving the e-readiness of stateswould also help to reduce inter-state disparities and the development ofmid-sized towns which is the focus of Chapter 2 on inter-state migration.
While the growth points of India have been focussed on some sectors,they have also been centred geographically. Thus, the states in the southand west of India have grown much more rapidly than those in the east.There is some indication that the states in the east are catching up but byand large there are huge disparities in the growth rates. One way oftrickling down the growth from higher growth states to lower growth statesis through inter-state migration. The important contribution of migrationto poverty alleviation has been recognised in this book. Migration permitsthe use of flexible labour policies which would help accelerate growth. Butthere is a need to build on the human skills of migrants so that theirremuneration and opportunities increase over time. There is a need tosupport migrants by improving their access to renumerative work,schooling, health care, training, safe working conditions and adequatehousing. The Union Government of India should put in place policies thatdo not discourage migration and at the same time discourage regionalfactionalism.
Given that India is a land-scarce country, economic developmentwould involve several forms of urbanisation. As shown in Chapter 2, thiswould improve productivity and reduce poverty. It is important to note thatin India, there is a continuum in terms of population density from remotevillages to the large urban centres. The conventional dichotomy of ruralversus urban areas still seems to dominate development thinking andpoverty research and may be less applicable to India. This continuum has

370 INDIA EMERGING • VEENA JHA
to be utilised to improve infrastructure and build mid-sized towns. There isa need to decentralise infrastructure and activities with a view to createnew centres of growth that will be able to absorb the rural populationinflux. Overall while some argue that providing rural employment mayhave stemmed migration, evidence on this issue is mixed at best. The bestpolicy for dealing with inter-state migration is to improve infrastructure sothat strains on overcrowded cities are alleviated. This policy is particularlyimportant as there are indications that rural-urban migration is nowacquiring a permanent characteristic and is becoming less seasonal innature.
How Growth can Trickle Up
While a lot has been made of trickling down growth, in India growthhas also trickled up from its vast informal sector. Growth has createdopportunities for the informal sector which is reflected through an increasein their employment, wages and reduction in poverty. The most importantfactor which has led to a decline in poverty through this sector has beenthrough the asset accumulation of this sector. It is important that whilemarkets determine wages and employment, government should becognisant of the need to devise policy instruments which will develop thecapacity of this sector to build assets. Informal sector assets do not merelycomprise physical assets but also human capacity development. The bookshows that informal sector asset building and incomes are particularlysensitive to easy access to transport facilities and to infrastructure.Government policy should thus focus on infrastructure building. Thiswould also tackle in part the problem of inter-state migration and genderinequity which is also discussed in the book.
The book shows that these interventions would only lead to higherincomes and higher asset formation in the informal sector if and when therates of growth of the economy are high. So the first and foremostrequirement to ensure that growth trickles down is to maintain a high rateof growth in the Indian economy. Along with high growth rates it isnecessary to find mechanisms to link formal and informal mechanisms forskill generation and infrastructure provision. This implies that thereshould be some symmetry between the two sectors in terms of skillgeneration, access to information on markets, technical know-how and

371CONCLUSIONS
credit. The informal sector can itself be used as a vehicle for the delivery ofthese services and innovative vocational education mechanisms have to befound to meld formal schooling with on the job training. The Swiss systemof education is one example given in the book for such training. It isimportant to get children trained in some vocations from the age of 12onwards. This could be combined with some formal schooling, otherwiseIndia is losing its youth to crime, illiteracy and social conflict. Training cantake place in the informal sector itself with incremental improvements inproductivity and innovation. An overall improvement in infrastructure andorganisation can create an enabling environment for credit and improveaccess to markets. It is important to understand that an overallimprovement in the economy in terms of infrastructure, training and creditwould have far greater effects on the informal sector than specific policieswhich target the sector. Both are needed but meshing the micro and macropolicies are critical in poverty alleviation through this sector.
The need to meld micro initiatives with overall macro improvementsin education and infrastructure would also help improve gender disparities.The book has explored the links between gender equality and economicgrowth in India. The simple scatter plots presented in this book hint at apositive relationship, as do (somewhat) more sophisticated panelregressions. Yet there is abundant reason to be sceptical of these results:one should never take simple correlations very seriously, and panelregressions are plagued by a number of shortcomings especially thedifficulty of establishing causality.
With regard to the macro-level links between gender equality andpoverty reduction, the macro correlations are stronger than those for genderequality and growth and more robust to different measures of genderequality. Here, not surprisingly given the easier applicability of the conceptof poverty at the micro (household) level, there is more micro researchbuttressing this link. Ample evidence suggests that greater gender equalityin resources such as education, health and access to employment(economic resources) can reduce the likelihood of a household being poor.
While female labour force participation has increased with growth,this increase has been concentrated at higher education levels. Thissuggests that as economic opportunities increase, educated women aremore likely to enter the work force. The policy variable that has emerged as

372 INDIA EMERGING • VEENA JHA
crucially important from the analysis in the book is education. Education isseen to affect both health and access to economic resources.
For policy purposes, two factors stand out in the case of India. Onethat high growth rates will lead to better gender indicators and reducegender inequality. Hence, it is first of all crucially important to maintainhigh rates of economic growth. To accelerate the trickle down effects ofgrowth on poverty, education and particularly vocational education ofwomen should be targetted by government policy. This would also be inkeeping with the cultural context of India where women may often preferhome-based employment. Hence, focussing on improving skills andeducation through the Swiss system of schooling as outlined above is anoption that should be explored.
How can Trickle Down and Trickle Up be Assisted
The book has clearly identified the need for two kinds of policies—thefirst relates to the building of key physical infrastructure and the second tohuman and social development. The responsibility for building both lieswith both the government and the NGOs. The book explores the role ofphilanthropy in delivering social services. While at this moment thegovernment spends roughly 8.3 per cent of the GDP on the social sector,private philanthropy accounts for less than 1 per cent of the GDP. However,the delivery of public services such as education was in general found to bemore effective from the private than the public sector. The differences were,however, not very high.
Nearly 20 per cent of the children aged between 8-14 years attend aprivate school, or a non-profit organisation. The percentage of childrenattending philanthropic schools are much higher, closer to 50 per cent inthe Northeast, Punjab, Haryana and Kerala. In other states it is closer to 15per cent, and is the lowest in West Bengal at 3 per cent. The quality ofeducation obtained in philanthropic schools is generally considered betterthan government schools.
The private sector plays a major role and accounts for about 80 percent of all primary health care and 40 per cent of tertiary medical care.However, because of lack of a nationwide system of registering either

373CONCLUSIONS
practitioners or institutions providing health care in the private and voluntarysectors, it is difficult to accurately assess the impact and extent of services.
Although many look to the government to improve infrastructure andimplement health care, many more turn to provide free clinics andemergency medical treatment. There are believed to be over 7,000 non-profit initiatives providing health care services—from implementinggovernment programmes to providing basic health care or else specific carefor diseases like leprosy and cancer. This excludes a host of rural-basedvoluntary organisations for whom conducting health awarenessprogrammes is a common activity. The corporate sector has opened anumber of charitable hospitals like the Escorts Heart Institute and ResearchCentre in New Delhi, Lupin Human Welfare and Research Foundationwhich runs an effective TB programme and Tata Memorial Hospital, apremier cancer hospital in Mumbai. Many religious institutions and muttstoo have started hospitals, mostly incorporated as not-for-profitorganisations. Majority of these institutions have a dual policy of collectinghigh fees from those who could afford and providing concessions or freemedicines to the economically weaker groups.
The potential to promote more—and more strategic—socialinvestment in India is tremendous. Perhaps more than most othercountries, India is ready and fertile for the infusion of private funds intodevelopment initiatives. The Government of India, more than ever before,is ready for partnership and has, in fact, opened up key social sectors tothird-sector investment. The challenge before the voluntary sector is toevolve mechanisms and strategies for domestic philanthropy and socialinvestment. Communication and fundraising are two sides of a coin. Howeffectively the sector positions itself to attract private investment is thechallenge for this century. There are fairly diverse philanthropicorganisations that address social ills and are competent to championphilanthropic giving. These organisations will, however, need to lookkeenly at addressing issues of mistrust, accountability, transparency andgovernance—critical in hampering partnership and investments fordevelopment.
On the part of the government too, there are several constraints togood governance in India. Primarily weak institutional norms for theefficient and effective management for public service delivery is responsible

374 INDIA EMERGING • VEENA JHA
for the slow trickle down of Indian economic growth. Improvingaccountability to beneficiaries in private and civil society organisations isvital for ensuring that growth trickles down to the poor. A managementsystem with internal accountability in government, the private sector andcivil society organisations constitutes the basics of any good governanceagenda. Unless these organisations have strong control systems, theycannot contribute effectively to good governance.
As long as significant poverty exists in India, and disparity betweenthe rich and the poor widens, private sector especially philanthropy wouldneed to make a contribution to solving the problem. A dialogue must beginbetween and among business leaders on devising rules for business conductin deprived communities. The model must consider how poor people canbe brought into the mainstream of consumers with sufficient purchasingpower within a reasonable time period. Distribution of health and educationvouchers should be considered seriously by the Government of India.
To sum up, the process of reform must continue in India in aneffective framework of good governance. India has to find dynamic ways ofpublic-private partnerships in the delivery of social services. It has toundertake massive administrative and political reforms to ensure highgrowth rates and inclusive growth. Inclusive growth is not automatic butsmall incremental changes and building on success cases of administrativeand political reform may be the way forward.
ReferencesChandy, Laurence and Geoffrey Gertz (2011). “Poverty in Numbers: The Changing State
of Global Poverty from 2005 to 2015”, Global Views, Policy Brief 2011/1.Brookings: Global Economy and Development.
Mazumdar, Surajit (2010). “On the Sustainability of India’s Non-Inclusive Growth”,Working Paper 2010/12. New Delhi: Institute for Studies in Industrial Development.
Related Documents