Time-resolved fluorescence of the bacteriophage T4 capsid protein gp23 Aike Stortelder a , Joost B. Buijs a , Jaap Bulthuis b , Saskia M. van der Vies c , Cees Gooijer a , Gert van der Zwan a, * a Department of Analytical Chemistry and Applied Spectroscopy, Faculty of Sciences, Vrije Universiteit, Laser Centre VU, De Boelelaan 1083, 1081 HV Amsterdam, The Netherlands b Department of Physical Chemistry, Faculty of Sciences, Vrije Universiteit, Laser Centre VU, De Boelelaan 1083, 1081 HV Amsterdam, The Netherlands c Department of Biochemistry and Molecular Biology, Faculty of Sciences, Vrije Universiteit, Laser Centre VU, De Boelelaan 1083, 1081 HV Amsterdam, The Netherlands Received 18 March 2004; received in revised form 10 August 2004; accepted 13 September 2004 Available online 11 November 2004 Abstract The time-resolved fluorescence properties of the bacteriophage T4 capsid protein gp23 are investigated. The structural charac- teristics of this protein are largely unknown and can be probed by recording time-resolved and decay-associated fluorescence spectra and intensity decay curves using a 200 ps-gated intensified CCD-camera. Spectral and decay data are recorded simultaneously, which makes data acquisition fast compared to time-correlated single-photon counting. A red-shift of the emission maximum within the first nanosecond of decay is observed, which can be explained by the different decay-associated spectra of fluorescence lifetimes of the protein in combination with dipolar relaxation. In addition, iodide quenching experiments are performed, to study the degree of exposure of the various tryptophan residues. A model for the origin of the observed lifetimes of 0.032 ± 0.003, 0.39 ± 0.06, 2.1 ± 0.1 and 6.8 ± 0.8 ns is presented: the 32 ps lifetime can be assigned to the emission of a buried tryptophan residue, the 0.4 and 2.1 ns lifetimes to two partly buried residues, and the 6.8 ns lifetime to a single tryptophan outside the bulk of the folded gp23. Ó 2004 Elsevier B.V. All rights reserved. Keywords: Time-resolved emission spectra; Fluorescence lifetimes; Decay-associated spectra; Fast-gated CCD; gp23; Gobal analysis; Fluorescence quenching 1. Introduction gp23 is the major capsid protein of the bacteriophage T4. It consists of 521 amino acids, including four trypt- ophan residues at positions 13, 247, 309 and 345. In vivo, gp23 is folded with assistance of the molecular chaperone complex GroEL–gp31 [1]. Chaperones are proteins that are indispensable for folding of many pro- teins. They stabilize the newly synthesized amino acid chain and thus prevent formation of a misfolded pro- tein. There are several chaperone systems that operate in different compartments of the cell [2]. The GroEL– GroES combination is present in bacteria. The bacteri- ophage T4 uses the GroEL–GroES chaperones to fold most of its structural elements. However, the main cap- sid protein gp23 needs a special co-chaperone with GroEL instead of GroES. This co-chaperone, denoted gp31, is encoded by T4 itself [1]. In the T4-head, 120 hexamers of gp23 are present, thus a total 720 gp23 mol- ecules [3]. This interesting folding pathway, which can 1011-1344/$ - see front matter Ó 2004 Elsevier B.V. All rights reserved. doi:10.1016/j.jphotobiol.2004.09.007 * Corresponding author. Tel.: +31 20 444 7635; fax: +31 20 444 7543. E-mail address: [email protected] (G. van der Zwan). www.elsevier.com/locate/jphotobiol Journal of Photochemistry and Photobiology B: Biology 78 (2005) 53–60

Welcome message from author
This document is posted to help you gain knowledge. Please leave a comment to let me know what you think about it! Share it to your friends and learn new things together.
Transcript
www.elsevier.com/locate/jphotobiol
Journal of Photochemistry and Photobiology B: Biology 78 (2005) 53–60
Time-resolved fluorescence of the bacteriophageT4 capsid protein gp23
Aike Stortelder a, Joost B. Buijs a, Jaap Bulthuis b, Saskia M. van der Vies c,Cees Gooijer a, Gert van der Zwan a,*
a Department of Analytical Chemistry and Applied Spectroscopy, Faculty of Sciences, Vrije Universiteit,
Laser Centre VU, De Boelelaan 1083, 1081 HV Amsterdam, The Netherlandsb Department of Physical Chemistry, Faculty of Sciences, Vrije Universiteit, Laser Centre VU,
De Boelelaan 1083, 1081 HV Amsterdam, The Netherlandsc Department of Biochemistry and Molecular Biology, Faculty of Sciences, Vrije Universiteit, Laser Centre VU,
De Boelelaan 1083, 1081 HV Amsterdam, The Netherlands
Received 18 March 2004; received in revised form 10 August 2004; accepted 13 September 2004
Available online 11 November 2004
Abstract
The time-resolved fluorescence properties of the bacteriophage T4 capsid protein gp23 are investigated. The structural charac-
teristics of this protein are largely unknown and can be probed by recording time-resolved and decay-associated fluorescence spectra
and intensity decay curves using a 200 ps-gated intensified CCD-camera. Spectral and decay data are recorded simultaneously,
which makes data acquisition fast compared to time-correlated single-photon counting. A red-shift of the emission maximum within
the first nanosecond of decay is observed, which can be explained by the different decay-associated spectra of fluorescence lifetimes
of the protein in combination with dipolar relaxation. In addition, iodide quenching experiments are performed, to study the degree
of exposure of the various tryptophan residues. A model for the origin of the observed lifetimes of 0.032 ± 0.003, 0.39 ± 0.06,
2.1 ± 0.1 and 6.8 ± 0.8 ns is presented: the 32 ps lifetime can be assigned to the emission of a buried tryptophan residue, the 0.4
and 2.1 ns lifetimes to two partly buried residues, and the 6.8 ns lifetime to a single tryptophan outside the bulk of the folded gp23.
� 2004 Elsevier B.V. All rights reserved.
Keywords: Time-resolved emission spectra; Fluorescence lifetimes; Decay-associated spectra; Fast-gated CCD; gp23; Gobal analysis; Fluorescence
quenching
1. Introduction
gp23 is the major capsid protein of the bacteriophage
T4. It consists of 521 amino acids, including four trypt-
ophan residues at positions 13, 247, 309 and 345. In
vivo, gp23 is folded with assistance of the molecular
chaperone complex GroEL–gp31 [1]. Chaperones are
proteins that are indispensable for folding of many pro-
1011-1344/$ - see front matter � 2004 Elsevier B.V. All rights reserved.
doi:10.1016/j.jphotobiol.2004.09.007
* Corresponding author. Tel.: +31 20 444 7635; fax: +31 20 444
7543.
E-mail address: [email protected] (G. van der Zwan).
teins. They stabilize the newly synthesized amino acid
chain and thus prevent formation of a misfolded pro-tein. There are several chaperone systems that operate
in different compartments of the cell [2]. The GroEL–
GroES combination is present in bacteria. The bacteri-
ophage T4 uses the GroEL–GroES chaperones to fold
most of its structural elements. However, the main cap-
sid protein gp23 needs a special co-chaperone with
GroEL instead of GroES. This co-chaperone, denoted
gp31, is encoded by T4 itself [1]. In the T4-head, 120hexamers of gp23 are present, thus a total 720 gp23 mol-
ecules [3]. This interesting folding pathway, which can

54 A. Stortelder et al. / Journal of Photochemistry and Photobiology B: Biology 78 (2005) 53–60
also be studied in vitro, is not yet well understood; the
same holds for most of the secondary and tertiary struc-
ture of gp23. In solution, gp23 can be present in several
forms: unfolded, as a monomer, as a hexamer or as lar-
ger ordered aggregates, so-called polyheads.
Conformational changes in proteins can be moni-tored using an intrinsic fluorescent probe, i.e. the amino
acid tryptophan [4–6]. The emission characteristics of
this amino acid are dependent on the microenvironment
[7]. Both lifetimes and emission wavelengths may change
when the conformation of (parts of) the protein changes.
In a polar environment, the emission maximum of trypt-
ophan is at about 350 nm. It shifts to shorter wave-
lengths of up to 305 nm in apolar surroundings, forexample if the tryptophan is located inside a protein
[8,9].
Tryptophan in water shows three fluorescence life-
times, around 0.5, 3 and 7–9 ns [10,11]. Under certain
conditions, a shorter lifetime of about 13 ps has also
been observed [12]. The emission spectrum associated
with the longer lifetime is shifted to longer wavelengths
by about 30 nm, compared to that of the shorter lifetime[13]. An explanation for this wavelength dependence and
for the multi-exponentiality of the decay is provided by
the tryptophan rotamer model [14], in which the wave-
length and lifetime of the indole emission are assumed
to be dependent on the distance between the amino
group and the indole ring [15,16]. In proteins, where tryp-
tophan residues experience a much more rigid environ-
ment because of the bulky amino acid chain, there stillseems to be enough space for the tryptophan residue
to adopt various conformations [17]. This leads to mul-
tiple lifetimes even in single tryptophan proteins [4]. Of
course, when multiple tryptophan residues are present,
the lifetime distribution becomes increasingly compli-
cated, and separate lifetimes cannot always be resolved
[18]. Lifetimes might change quite dramatically due to
the different quenching characteristics of amino acidssuch as tyrosine, histide or cysteine that surround the
tryptophan residue [19]. Also, lifetimes are influenced
by solvent that penetrates or is expelled from the protein
when its conformation changes. External quenchers
such as iodide and acrylamide are often used to probe
the surface residues of proteins [20,21], and can provide
information on the degree of exposure of the different
residues. Acrylamide is a neutral quencher, which maypenetrate into the protein bulk and also quench buried
residues to some extent. Iodide is negatively charged,
and will not enter the non-polar interior of the folded
protein and quenches only the exposed residues. An
electrostatic effect due to charged amino acids next to
tryptophan residues leading to over- or under-estima-
tion of the degree of quenching may be avoided by keep-
ing the ionic strength constant.gp23 contains four tryptophan residues, so that in
principle structural changes in this protein can be stud-
ied by monitoring the intrinsic tryptophan fluorescence
emission characteristics. Since three of these residues
are located close together in the amino acid sequence,
it seems not unreasonable to assume that they experi-
ence similar surroundings. The fourth tryptophan is lo-
cated in a part of the protein that can be cleaved off veryeasily [22], and is likely to be located outside of the bulk
of the folded protein.
The time-resolved fluorescence properties of both
monomeric and hexameric gp23 were studied using a re-
cently commercialized fast-gated charge-coupled device
(CCD) camera [10]. Until recently, available CCD cam-
eras were too slow for this purpose. With this 200 ps-
gated ICCD-camera, it was possible to directly recordtime-resolved emission spectra (TRES) with very good
spectral resolution and to resolve lifetimes on a sub-
nanosecond time-scale. Quenching of tryptophan fluo-
rescence by iodide was used to determine the degree of
exposure of the different lifetimes and, hence, to help
assign the observed lifetimes to the four tryptophan
residues.
2. Experimental
2.1. Setup
The setup consisted of a laser system combined with
an intensified CCD (ICCD)-camera detection and time-
resolved photon counting detection. The main part ofthe laser system is a Mira 900-P (Coherent, Santa Clara
CA, USA) laser, which emits 3 ps pulses at a repetition
rate of 76 MHz, pumped by an Innova-300 argon ion
laser (Coherent). The Mira 900-P is a mode-locked tita-
nium–sapphire laser, tunable from approximately 700
to 1000 nm. The laser emission is led through a pulse
picker (APE PulseSelect, Berlin, Germany), which re-
duced the repetition rate to 3.8 MHz to avoid doubleexcitation of molecules. A frequency tripler (Oplaz
Technologies fs-tripler, Chatsworth CA, USA) was
used to provide the used output wavelength of 291
nm. As the laser power was about 100 lW no signifi-
cant heating or photodegradation of the sample was ex-
pected. This light was used to excite the protein sample
in a cell with 1 cm pathlength (type 104F, Hellma
GmbH & Co KG, Mullheim, Germany). Fluorescenceemission was collected at 90� and dispersed by a spect-
rograph (TVC JarrellAsh Monospec 18, Grand Junc-
tion CO, USA). A WG-320 filter (Schott, Mainz,
Germany) was used to filter out laser scatter. Spectra
were recorded from 320 to 450 nm with an ICCD-
camera with ultrafast gate times (LaVision, Gottingen,
Germany). This system contains an image intensifier
that provides very good sensitivity and acts as an extre-mely fast shutter with a shortest gate time of 200 ps
FWHM. Validation of this camera using tryptophan

A. Stortelder et al. / Journal of Photochemistry and Photobiology B: Biology 78 (2005) 53–60 55
fluorescence as a model system has been described in
[10]. Detection was triggered by a reflection of the laser
beam on a photodiode. The intensity decay was re-
corded with 25 ps steps over a range of 10 ns, so per
decay curve 400 data points were collected. Image col-
lection and image processing was performed under con-trol of DaVis software v6.2 (LaVision).
For time-correlated single-photon counting (TCSPC)
experiments an SPC-630 (Becker & Hickl GmbH, Ber-
lin, Germany) system with a time-resolution of about
15 ps was used. A laser pulse focused on a photodiode
provided the synchronization signal. Fluorescence emis-
sion was detected by a photomultiplier tube after being
dispersed by a monochromator (TVC JarrellAsh Mono-spec 18, Grand Junction CO, USA). Decays were re-
corded at wavelengths between 330 and 440 nm in 10
nm steps. Quenching experiments were performed using
TCSPC detection at a single wavelength (342 nm).
2.2. Sample preparation
Samples of 1 lM purified gp23 were prepared (from96.6 lM stock solution) by dilution in a buffer contain-
ing 50 mM Tris pH 7.4, 10 mM KCl, 10 mM MgCl2 and
0.01% Tween 20. Experiments were performed at room
temperature and 4 �C. From size-exclusion chromatog-
raphy experiments, it was concluded that at room tem-
perature gp23 is mainly present in hexameric form,
whereas at 4 �C it is in monomeric form [23]. This was
confirmed by steady-state fluorescence anisotropy exper-iments: a higher anisotropy was found for gp23 at room
temperature than at 4 �C, indicating a slower rotation
and thus a larger complex.
For the quenching experiments, KI was added to ob-
tain final concentrations from 0.0 to 0.5 M. Appropriate
amounts of KCl were added to keep the total ionic
strength at 0.5 M. To avoid formation of I2 10 mM so-
dium isothiocyanate was added to the solution.
2.3. Data analysis
Fluorescence decay curves were analyzed using a glo-
bal fit procedure based on the Levenberg–Marquardt
algorithm. This procedure uses the gate function (ob-
tained by recording scattered laser-light) for deconvolu-
tion of the recorded decays and determination oflifetimes and wavelength dependent amplitudes. Life-
times are assumed to be constant for the decays in-
cluded, but with variable amplitudes. This assumption
is correct for proteins in many cases [24]. A maximum
number of four lifetimes is fitted simultaneously to the
array of experimental decays at different wavelengths,
to get a good fit. The goodness of fit was determined
on the basis of v2, residuals and correlation coefficients.A maximum of 12 decays were included in the global
lifetime analysis. The time-resolved fluorescence spectra
were plotted on a wavenumber scale and fitted to a com-
bination of Gaussian functions using Origin 7.0 (Origin-
Lab, Northampton MA, USA). This is justified, since
the shape of a fluorescence spectrum is dominated by
inhomogeneous band broadening [25,26]. The purpose
of this fit was simply to determine the emission maxima,and no physical meaning is ascribed to the individual
components.
3. Results
The fluorescence emission of a 1 lM solution of both
the monomeric and hexameric form of bacteriophage T4capsid protein gp23 was recorded using the fast-gated
ICCD-camera. Emission spectra and intensity decay
curves were measured simultaneously using a 300 ps
gate width. The three-dimensional plot in Fig. 1 illus-
trates the relation between time and spectral data: fluo-
rescence emission spectra along the x-axis, decay curves
along the y-axis.
Changes in the emission spectra of gp23 were moni-tored during the decay of fluorescence, and lifetimes
were determined. In addition, iodide quenching experi-
ments were performed to determine the degree of solvent
exposure of the tryptophan residues. An excitation
wavelength of 291 nm was chosen to avoid tyrosine
interference.
3.1. Time-resolved emission spectra
Fig. 1 shows TRES of hexameric gp23 along the x-
axis. The emission spectrum shifts to the red on a nano-
second time-scale. This is more clearly depicted in Fig. 2,
where the position of the emission maximum in time is
plotted. A large shift in the emission maximum is seen,
which starts already in the first nanosecond of decay.
A red-shift in the emission maximum of about 2 nmcan be seen even within the first 250 ps of decay (Fig.
2, left). This shift continues for another 2 nm in the de-
cay period up to 4 ns (Fig. 2, right). Dipolar relaxation
times of 1.0 ± 0.1 ns and 1.4 ± 0.2 ns were found for the
hexamer and the monomer, respectively. The somewhat
slower relaxation for the monomer is probably due to
the lower temperature at which the experiments were
done.The emission spectra were fitted to Gaussian func-
tions to determine the exact emission maximum. An
adequate fit of the spectra (320–450 nm) was obtained
with two Gaussian functions. Fitting with other func-
tions, such as stretched Gaussians, did not significantly
alter the results.
The TRES of gp23 were recorded at a concentration
of 1 lM, but a 10-fold lower concentration could also beused. However, under such conditions acquisition times
were very long, which gave rise to problems with laser

Fig. 2. Shift of the hexamer emission maximum with time (left: 0–250 ps, right: 250–4500 ps).
Fig. 1. Time-resolved emission of 1 lM of hexameric gp23 recorded with the fast-gated camera using a gate-width of 300 ps. On the time axis,
intensity decays can be seen; on the wavelength axis, emission spectra are shown.
56 A. Stortelder et al. / Journal of Photochemistry and Photobiology B: Biology 78 (2005) 53–60
and sample stability. The same problems occur when
using the minimum gate width of 200 ps (instead of
300 ps).
3.2. Fluorescence lifetimes
Along with TRES, intensity decay curves at different
wavelengths were recorded (seen in Fig. 1 along the y-
axis). Twelve decay curves were considered over the
range from 320 to 430 nm (each corresponding to 50
pixels, i.e. a spectral bandwidth of 7 nm). These 12 decay
curves were globally fitted to a sum of exponentials,using the procedures described in Section 2.3:
IðtÞ ¼X
iAiðkÞe
�tsi : ð1Þ
This approach yielded a good fit with four lifetimes
for data recorded with the ICCD-camera: for hexameric
gp23, these lifetimes are 0.032 ± 0.003, 0.39 ± 0.06,
2.1 ± 0.1 and 6.8 ± 0.8 ns, whereas for monomericgp23 we find 0.028 ± 0.005, 0.37 ± 0.07, 2.3 ± 0.1 and
5.6 ± 0.6 ns. The finding of the shortest (�30 ps) lifetime
was somewhat surprising: because a time-step of 25 ps
was used, this lifetime is based on a small number of
data points. However, the fit of the data improved sig-
nificantly when it was included. In addition, this 30 ps
lifetime, as well as the 0.4 and 2.1 ns lifetimes were, quite
satisfying, the same lifetimes as we obtained fromTCSPC experiments, occasionally performed to check
results found with the camera. The longest lifetimes
are for both hexameric and monomeric gp23 somewhat
A. Stortelder et al. / Journal of Photochemistry and Photobiology B: Biology 78 (2005) 53–60 57
different than that observed with TCSPC, in which we
found the longest lifetimes to be 5.3 and 6.1 ns, respec-
tively. This deviation may be attributed to the fact that
the decay period recorded with the camera is not longer
than 12 ns. For longer lifetimes this implies that the
intensity has not yet completely decayed to zero, whichmay cause the tail to be fitted less accurately. In the
TCSPC experiments such problems will not play a role,
since 50 ns periods of decay are recorded.
3.3. Decay-associated spectra
A decay-associated spectrum represents the emission
spectrum originating from one lifetime component.Although it is tempting to ascribe such a spectrum to
a single fluorophore, it can also come from a combina-
tion of fluorophores having quite similar lifetimes.
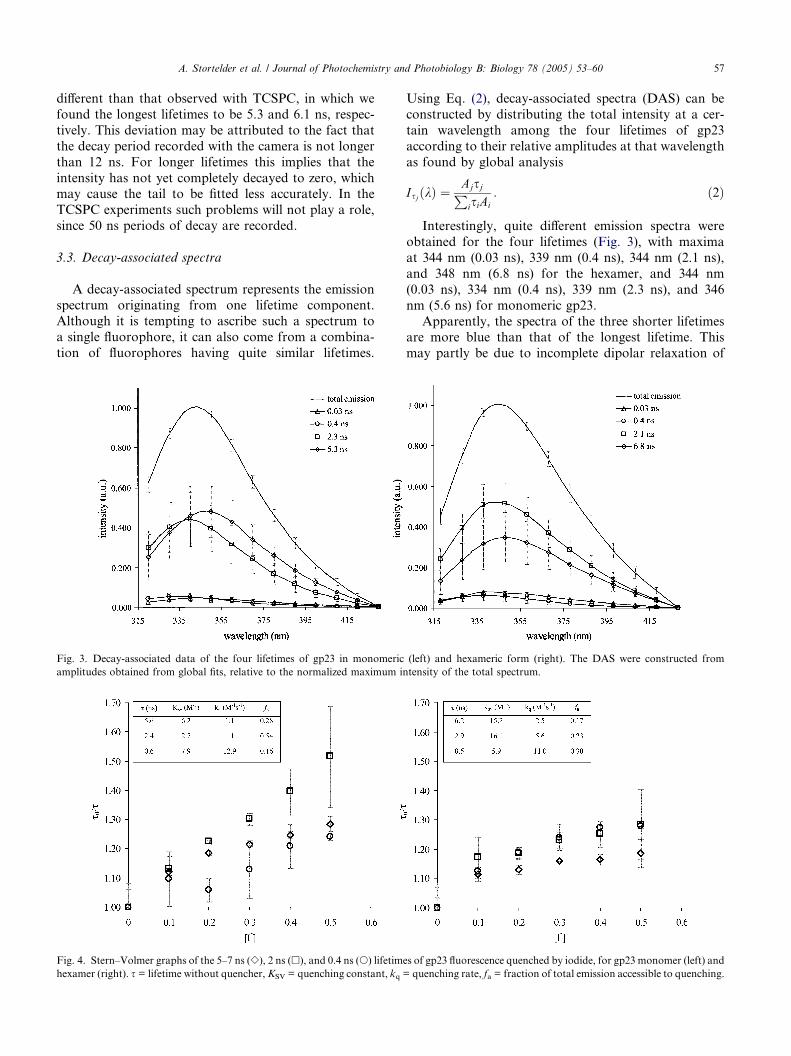
Fig. 3. Decay-associated data of the four lifetimes of gp23 in monomeric
amplitudes obtained from global fits, relative to the normalized maximum in
Fig. 4. Stern–Volmer graphs of the 5–7 ns (e), 2 ns (h), and 0.4 ns (s) lifetime
hexamer (right). s = lifetime without quencher,KSV = quenching constant, kq =
Using Eq. (2), decay-associated spectra (DAS) can be
constructed by distributing the total intensity at a cer-
tain wavelength among the four lifetimes of gp23
according to their relative amplitudes at that wavelength
as found by global analysis
IsjðkÞ ¼AjsjPisiAi
: ð2Þ
Interestingly, quite different emission spectra were
obtained for the four lifetimes (Fig. 3), with maxima
at 344 nm (0.03 ns), 339 nm (0.4 ns), 344 nm (2.1 ns),
and 348 nm (6.8 ns) for the hexamer, and 344 nm
(0.03 ns), 334 nm (0.4 ns), 339 nm (2.3 ns), and 346
nm (5.6 ns) for monomeric gp23.
Apparently, the spectra of the three shorter lifetimesare more blue than that of the longest lifetime. This
may partly be due to incomplete dipolar relaxation of
(left) and hexameric form (right). The DAS were constructed from
tensity of the total spectrum.
s of gp23 fluorescence quenched by iodide, for gp23 monomer (left) and
quenching rate, fa = fraction of total emission accessible to quenching.

58 A. Stortelder et al. / Journal of Photochemistry and Photobiology B: Biology 78 (2005) 53–60
the surroundings of the tryptophan residues [27]. This
would also explain the bluer DAS for the lifetimes in
monomeric gp23. Since the residues are likely to be more
exposed in the monomer, the spectra are expected to be
more red than in the hexamer. However, dipolar relaxa-
tion is slower at 4 �C, were the monomer is observed, sothe dipoles will not be completely relaxed and the spec-
tra will be less red-shifted. Noteworthy is that the DAS
of the 32 ps lifetime has a maximum at a longer wave-
length than the DAS corresponding to the 0.4 ns life-
time, indicating a more polar environment for this
residue.
3.4. Quenching with iodide
Changes in the fluorescence lifetimes of 1 lM solu-
tions of monomeric and hexameric gp23 due to addition
of an external quencher were studied using TCSPC
detection. Fig. 4 shows the Stern–Volmer plots of the
three longest lifetimes.
Large differences in quenching between the two con-
formations are seen for the 2 ns lifetime. The longestlifetime is also somewhat more quenched in the mono-
mer than in the hexamer, the change is not as much as
for the 2 ns lifetime. Quenching for the 0.4 ns lifetime
is similar in both forms. The quenching curves are slop-
ing downwards for hexameric gp23, showing that a sig-
nificant fraction of tryptophan emission will not be
quenched and thus comes from residues inaccessible to
iodide.
4. Discussion
The TRES showed a shift of about 4 nm in the first 4
ns of decay. This shift may be due to relaxation of the
protein environment around the tryptophan residues,
despite the fact that solvent relaxation around a fluoro-phore is usually a femto- to pico-second process. Only if
the solvent is very viscous will reorientation of the sol-
vent dipoles around the fluorophore be much slower
and therefore compatible with nanosecond experiments,
a situation that presumably applies for proteins [14]. In
proteins, the amino acid chain around the fluorescing
tryptophan residue behaves as a viscous solvent, and
will be slow in reorienting.For the observed lifetimes and DAS two possible
explanations are considered. The most obvious option
is to assume that each lifetime originates from one indi-
vidual tryptophan residue, an explanation in line with
the fact that four lifetimes were obtained
(0.032 ± 0.003, 0.39 ± 0.06, 2.1 ± 0.1 and 6.8 ± 0.8 ns
for hexameric gp23, 0.028 ± 0.005, 0.37 ± 0.07,
2.3 ± 0.1 and 5.6 ± 0.6 ns for monomeric gp23), whilegp23 contains four tryptophan residues. However, the
primary amino acid sequence of gp23 reveals three try-
ptophans located close together (at positions 247, 309
and 345) and might experience similar environments.
Thus, a 10- to 100-fold difference in fluorescence life-
times from these residues is not to be expected.
A second, more probable explanation can be pro-
posed. The longest (5–7 ns) lifetime may be attributedto the fourth tryptophan in gp23 at position 13, which
experiences a very different environment. It is located
in a part of the protein that is cleaved off after assembly
of the head-structure [19]. Therefore, it is probably lo-
cated in a flexible part of the chain outside the bulk of
the folded protein, which is not expected to change
much if monomers form a hexamer. This assumption
is confirmed by the quenching experiments, which showsimilar quenching for this lifetime for gp23 in mono-
meric and hexameric form. It is not quenched as much
as could be expected for an exposed tryptophan residue,
which probably means that there still is some degree of
folding in this tailing part of the protein, and since the
quenching rate is somewhat diferent in both cases, it
may also be partly shielded from the quencher in the
hexamer. This tryptophan residue will be more exposedto the solvent than the other tryptophan residues, and
hence will experience a more polar environment. This
is reflected in the DAS of the 5–7 ns lifetime, which
has a relatively red-shifted emission maximum, a shift
that will at least partly be due to spectral relaxation,
which is especially strong in polar surroundings [14].
If this interpretation is correct, the remaining life-
times of 30 ps, 0.4 ns and 2 ns originate from the com-bined emission of the three tryptophan residues on
positions 247, 309 and 345. The fact that the lifetimes
have similar emission maxima suggests that they arise
from fluorophores in the same environment. The relative
blue emission found for these lifetimes suggests a non-
polar environment, which is generally the case inside a
protein. Amino acids found in the vicinity of these try-
ptophans may quench the fluorescence [19], hence lead-ing to shorter fluorescence lifetimes than expected for
free tryptophan (or N-acetyl-tryptophan amide, which
is the actual residue [14]). This is also the reason why
the added intensity of the 30 ps, 0.4 ns and 2 ns DAS
is lower than three times that of the 5–7 ns DAS. The
assignment is confirmed, and can even be refined some-
what by taking into account the results of the quenching
experiments. The 2 ns lifetime is quenched to a large ex-tent in the monomer, whereas in the hexamer the
quenching is much less, indicating that this residue can
be found on the interaction surface of the different
monomers in a hexamer. The 0.4 ns lifetime is quenched
to similar extent in both forms of gp23, so its degree of
exposure is the same. This lifetime will originate from
residue(s) that are partially exposed, but are not on
the interaction surface of the monomers if they form ahexamer. The shortest (30 ps) lifetime is probably due
to a deeply buried tryptophan residue, quenched to a

A. Stortelder et al. / Journal of Photochemistry and Photobiology B: Biology 78 (2005) 53–60 59
large extent by close lying amino acids. This is sup-
ported by the DAS which show the same emission max-
imum for this lifetime in both forms of gp23, indicating
that its environment is the same in both cases. Its emis-
sion maximum is not as blue as could be expected, indi-
cating some kind of polar interaction with surroundingamino acids. Another indication that it is deeply buried
is that it is not quenched by iodide: the 30 ps lifetime had
to be included in fits of all decay curves, also those of
samples including 0.5 M iodide.
This assignment seems to indicate four different fluo-
rescence lifetimes for four different tryptophan residues.
However, as mentioned above, it is unlikely that exactly
one lifetime originates from one residue. Therefore, it islikely that each lifetime found is a mixture of lifetimes
from partly exposed residues that show multiple life-
times each, which cannot be mutually distinguished with
an exponential fit method.
Of course, it is obvious that additional fluorescence
experiments should be done to check the above assign-
ment. Such experiments could, for example, make use
of mutation of one (or several) tryptophan residues intophenylalanines, or be based on removing the tail con-
taining Trp-13.
5. Conclusions
Time-resolved fluorescence studies using a fast-gated
ICCD-camera provide adequate detailed information onthe bacteriophage T4 capsid protein gp23, using the
intrinsic fluorescence of its four tryptophan residues.
TRES show a shift of 4 nm within the first 4 ns of de-
cay. The observed shifts in emission maxima and the
red-shifted DAS were attributed to spectral relaxation
of the protein environment around the excited state try-
ptophan dipoles, with relaxation times of 1.0 ± 0.1 ns
and 1.4 ± 0.2 ns for the hexamer and the monomer,respectively.
The lifetimes obtained from global fitting procedures
are 0.032 ± 0.003, 0.4 ± 0.06, 2.1 ± 0.1 and 6.8 ± 0.8 ns
for the gp23 hexamer, and 0.028 ± 0.005, 0.37 ± 0.07,
2.3 ± 0.1 and 5.6 ± 0.6 ns for monomeric gp23. The 30
ps lifetime can be ascribed to a deeply buried tryptophan
residue; the 0.4 ns lifetime to a residue partly buried, and
not on the interaction surface of monomers in a hex-amer; the 2 ns lifetime to the combined emission of three
tryptophans that lie relatively close together in the ami-
no acid sequence of gp23; the 6.8 ns lifetime may be
attributed to the fourth tryptophan residue located far
away from the other three at position 13. This assign-
ment is only tentative. Further experiments, for instance
on single tryptophan mutants of gp23, are necessary to
achieve solid conclusions. However, the results obtainedso far are already useful for the study of the hexameriza-
tion equilibrium.
Acknowledgements
Purified gp23 was kindly provided by Patrick J. Bak-
kes and Els Kroezinga (Vrije Universiteit Amsterdam,
Department of Biochemistry and Molecular Biology).
References
[1] F.A. Eiserling, L.W. Black, Pathways in T4 morphogenesis, in:
J.D. Karam (Ed.), Molecular Biology of Bacteriophage T4,
ASM Press, 1994, pp. 209–212.
[2] F.U. Hartl, Molecular chaperones in cellular protein folding,
Nature 381 (1996) 571–580.
[3] N.H. Olson, M. Gingery, F.A. Eiserling, T.S. Baker, The structure
of isometric capsids of bacteriophage T4, Virology 279 (2001)
385–391.
[4] J.M. Beechem, L. Brand, Time-resolved fluorescence of proteins,
Annu. Rev. Biochem. 54 (1985) 43–71.
[5] M.R. Eftink, The use of fluorescence methods to monitor
unfolding transitions in proteins, Biochemistry Moscow 63
(1998) 276–284.
[6] Y. Engelborghs, Correlating protein structure and protein fluo-
rescence, J. Fluoresc. 13 (2003) 9–16.
[7] P. Callis, Molecular orbital theory of the 1Lb and the 1La states of
indole, J. Chem. Phys. 95 (1991) 4230–4240.
[8] J.T. Vivian, P. Callis, Mechanisms of tryptophan fluorescence
shifts in proteins, Biophys. J. 80 (2001) 2093–2109.
[9] J.R. Lakowicz, Protein fluorescence, Principles of Fluorescence
Spectroscopy, first ed., Plenum Press, New York, 1983, pp. 341–
379.
[10] A. Stortelder, J.B. Buijs, J. Bulthuis, C. Gooijer, G. van der
Zwan, A fast-gated intensified CCD-camera to record time-
resolved fluorescence spectra of tryptophan, Appl. Spectrosc. 58
(2004) 705–710.
[11] W.B. De Lauder, P. Wahl, pH dependence of the fluorescence
decay of tryptophan, Biochemistry 9 (1970) 2750–2754.
[12] O.F.A. Larsen, I.H.M. Van Stokkum, A. Pandit, R. Van
Grondelle, H. Van Amerongen, Ultrafast polarized fluorescence
measurements on tryptophan and a tryptophan-containing pep-
tide, J. Phys. Chem. B 107 (2003) 3080–3085.
[13] A.G. Szabo, D.M. Rayner, Fluorescence decay of tryptophan
conformers in aqueous solution, J. Am. Chem. Soc. 102 (1980)
554–563.
[14] J.R. Lakowicz, On spectral relaxation in proteins, Photochem.
Photobiol. 72 (2000) 421–437.
[15] Y. Engelborghs, The analysis of time resolved protein fluorescence
in multi-tryptophan proteins, Spectrochim. Acta 57 (2001) 2255–
2270.
[16] J.W. Petrich, M.C. Chang, D.B. McDonald, G.R. Fleming, On
the origin of nonexponential fluorescence decay in tryptophan and
its derivatives, J. Am. Chem. Soc. 105 (1983) 3824–3832.
[17] J.R. Lakowicz, B.P. Maliwal, H. Cherek, A. Balter, Rotational
freedom of tryptophan residues in proteins and peptides, Bio-
chemistry 22 (1983) 1741–1752.
[18] J.R. Alcala, E. Gratton, F.G. Prendergast, Fluorescence lifetime
distributions in proteins, Biophys. J. 51 (1987) 597–604.
[19] Y. Chen, M.D. Barkley, Toward understanding tryptophan
fluorescence in proteins, Biophys. J. 81 (1998) 1765–1775.
[20] J.R. Lakowicz, Quenching of fluorescence, Principles of Fluores-
cence Spectroscopy, first ed., Plenum Press, New York, 1983, pp.
257–295.
[21] M.R. Eftink, C.A. Ghiron, Exposure of tryptophanyl residues in
proteins. Quantitative determination by fluorescence quenching
studies, Biochemistry 15 (1976) 672–680.

60 A. Stortelder et al. / Journal of Photochemistry and Photobiology B: Biology 78 (2005) 53–60
[22] L.G. Aijrich, L.P. Kurochkina, V.V. Mesyanzhinov, Chaperonin-
mediated folding of bacteriophage T4 major capsid protein. II.
Production of gene product 23 deletion mutants, Biochemistry
Moscow 67 (2002) 815–821.
[23] P.J. Bakkes, personal communication.
[24] J.M. Beechem, Global analysis of biochemical and biophysical
data, Method Enzymol. 210 (1992) 37–55.
[25] R. Jankowiak, Fundamental aspects of fluorescence line-narrow-
ing spectroscopy. In: Shpol�skii Spectroscopy and Other Site-
Selection Methods, Chemical Analysis, first ed. vol. 156, Wiley,
New York, 2000, pp. 235–271.
[26] S.K. Pal, J. Peon, A.H. Zewail, Ultrafast surface hydration
dynamics and expression of protein functionality: a-chymotryp-
sin, Proc. Natl. Acad. Sci. 99 (2002) 15297–15302.
[27] G. Mei, A. Di Venere, A. Finazzi Agro, F. De Matteis, N.
Rosato, Dipolar relaxation times of tryptophan and tyrosine in
glycerol and proteins: a direct evaluation from their fluorescence
decays, J. Fluoresc. 13 (2003) 467–477.
Related Documents


![BACTERIOPHAGE-RESISTANT AND BACTERIOPHAGE-SENSITIVE ...halsmith/phagemutantsubmitted_2.pdf · BACTERIOPHAGE-RESISTANT AND BACTERIOPHAGE-SENSITIVE BACTERIA IN A CHEMOSTAT ... [22],](https://static.cupdf.com/doc/110x72/5b3839687f8b9a5a518d2ce1/bacteriophage-resistant-and-bacteriophage-sensitive-halsmithphagemutantsubmitted2pdf.jpg)


