The 12 th International Conference of International Association for Computer Methods and Advances in Geomechanics (IACMAG) 1-6 October, 2008 Goa, India Three-Dimensional Finite Element Simulations of Compression Tests on Bimrock M. Barbero, M. Bonini, M. Borri-Brunetto Department of Structural and Geotechnical Engineering, Politecnico di Torino, Italy Keywords: bimrock, melange, heterogeneous materials, numerical modelling ABSTRACT: The paper deals with the mechanical behaviour of “bimrock” (block in matrix rock), characterized by a heterogeneous structure, constituted by rock blocks included in a small-grained, well-cemented material (matrix) with lower mechanical characteristics. The bimrock is a very peculiar material that may give rise to serious problems in engineering applications. To properly model this kind of problems it is necessary to suitably characterize the bimrock. In order to contribute to the understanding of the bimrock mechanical behaviour and to individuate strength and deformability laws suitable for the bimrock as an equivalent continuum, as the problem is clearly three-dimensional, 3D numerical analyses have been carried out by using the finite element method implemented in the Adina code. Uniaxial and triaxial compression tests on bimrock laboratory samples are simulated. Different volumetric proportions of the blocks are considered. The numerical results show the influence of the volume proportion of the blocks on the strength and deformability of bimrock, confirming the results obtained with previous 2D analyses. Furthermore, the results suggest that the interfaces between the blocks and the matrix play an important role, and may have an influence on the mechanical behaviour of bimrock. 1 Introduction Bimrock, block in matrix rock, is characterized by a heterogeneous chaotic structure. It has been well defined by several Authors (Medley 1994, Lindquist 1994) as a material that is constituted by rock blocks, contained in a small-grained, well cemented matrix with lower mechanical characteristics. Bimrock, for its very peculiar composition, can give rise to serious problems during engineering works, such as in tunnelling or in slopes cutting. The main characteristics of a rock mass that can be classified as a typical bimrock are the following (Medley 2002): • The block size distribution is scale independent. • The ratio between the strength and the deformability of the blocks and the matrix is greater than 2. • The maximum and minimum sizes of the blocks are conventionally assumed to be 75% and 5% of the characteristic engineering length (tunnel diameter, thickness of a landslide, laboratory rock specimen diameter, etc.). In this range, the block size distribution is a power law with an exponent of –2.3. • The strength and the deformability of a bimrock depend on the volumetric proportion and orientation of the blocks. A previous work carried out by the Authors (Barbero et al., 2007) pointed up the three-dimensional nature of bimrock response to a compressive load history, suggesting the use of a 3D numerical model for analyzing the problem. To properly interpret the influence of the volumetric proportion of the blocks (BVP in the following) on the strength and deformability characteristics of bimrock, a three-dimensional numerical approach has been used in the present study. Bimrock has been simulated as an equivalent continuum. A number of three-dimensional bimrock specimens, with or without lateral confinement pressure, have been numerically tested using the finite element method, by means of the ADINA code. By using a procedure implemented in Matlab, spherical rock blocks are introduced in the volume of a cylindrical specimen, with a random process in which size and position are generated according to the statistical properties of their distributions, providing a domain constituted of matrix and rock blocks. This geometry is the base for generating the mesh to be analysed, after defining the material model 631

Welcome message from author
This document is posted to help you gain knowledge. Please leave a comment to let me know what you think about it! Share it to your friends and learn new things together.
Transcript
The 12th International Conference of International Association for Computer Methods and Advances in Geomechanics (IACMAG) 1-6 October, 2008 Goa, India
Three-Dimensional Finite Element Simulations of Compression Tests on Bimrock
M. Barbero, M. Bonini, M. Borri-Brunetto Department of Structural and Geotechnical Engineering, Politecnico di Torino, Italy
Keywords: bimrock, melange, heterogeneous materials, numerical modelling
ABSTRACT: The paper deals with the mechanical behaviour of “bimrock” (block in matrix rock), characterized by a heterogeneous structure, constituted by rock blocks included in a small-grained, well-cemented material (matrix) with lower mechanical characteristics. The bimrock is a very peculiar material that may give rise to serious problems in engineering applications. To properly model this kind of problems it is necessary to suitably characterize the bimrock. In order to contribute to the understanding of the bimrock mechanical behaviour and to individuate strength and deformability laws suitable for the bimrock as an equivalent continuum, as the problem is clearly three-dimensional, 3D numerical analyses have been carried out by using the finite element method implemented in the Adina code. Uniaxial and triaxial compression tests on bimrock laboratory samples are simulated. Different volumetric proportions of the blocks are considered. The numerical results show the influence of the volume proportion of the blocks on the strength and deformability of bimrock, confirming the results obtained with previous 2D analyses. Furthermore, the results suggest that the interfaces between the blocks and the matrix play an important role, and may have an influence on the mechanical behaviour of bimrock.
1 Introduction Bimrock, block in matrix rock, is characterized by a heterogeneous chaotic structure. It has been well defined by several Authors (Medley 1994, Lindquist 1994) as a material that is constituted by rock blocks, contained in a small-grained, well cemented matrix with lower mechanical characteristics. Bimrock, for its very peculiar composition, can give rise to serious problems during engineering works, such as in tunnelling or in slopes cutting. The main characteristics of a rock mass that can be classified as a typical bimrock are the following (Medley 2002):
• The block size distribution is scale independent. • The ratio between the strength and the deformability of the blocks and the matrix is greater than 2. • The maximum and minimum sizes of the blocks are conventionally assumed to be 75% and 5% of the
characteristic engineering length (tunnel diameter, thickness of a landslide, laboratory rock specimen diameter, etc.). In this range, the block size distribution is a power law with an exponent of –2.3.
• The strength and the deformability of a bimrock depend on the volumetric proportion and orientation of the blocks.
A previous work carried out by the Authors (Barbero et al., 2007) pointed up the three-dimensional nature of bimrock response to a compressive load history, suggesting the use of a 3D numerical model for analyzing the problem. To properly interpret the influence of the volumetric proportion of the blocks (BVP in the following) on the strength and deformability characteristics of bimrock, a three-dimensional numerical approach has been used in the present study. Bimrock has been simulated as an equivalent continuum. A number of three-dimensional bimrock specimens, with or without lateral confinement pressure, have been numerically tested using the finite element method, by means of the ADINA code. By using a procedure implemented in Matlab, spherical rock blocks are introduced in the volume of a cylindrical specimen, with a random process in which size and position are generated according to the statistical properties of their distributions, providing a domain constituted of matrix and rock blocks. This geometry is the base for generating the mesh to be analysed, after defining the material model
631
and the boundary conditions, with Adina.
2 Numerical simulations
2.1 Generation of the specimens The set of spherical inclusions incorporated in a cylindrical specimen has been generated by means of a computer code written in Matlab (The Mathworks, Inc.), which produces a sample that can be considered as an extraction from a population of spherical inclusions, with given statistical parameters. The probability density function for the diameter d of the inclusions, adopted in the paper, is a truncated power law, given by
qqq d
baqdf ++ −
−−= 11
1)( (1)
where q = –2.3, and a, b, are the minimum and maximum diameter, respectively. They have been chosen equal to 5% and 75% of the specimen diameter, according to the description given in the introduction. According to this assumption, the probability distribution reads as:
badadF ++
++
−−
−= 11
11
)( (2)
Once the input data are assigned, i.e., diameter and height of the specimen (0.10 and 0.05 m respectively), BVP and BVP tolerance, the inclusions are created inside the cylindrical volume, enforcing the requirements of non-interpenetration and the attainment of the prescribed BVP. The algorithm starts with the generation of a sample of spheres, according to the distribution defined by Eq. (2), up to the given BVP. Then, the position of each sphere is chosen at random inside the volume of the specimen, repeating the extraction until no inter-penetration with other spheres, or with the sample boundaries, is detected. More in details, to minimize the number of rejected trials, the addition of the spheres is made according to their size, from the largest to the smallest one, and, in order to ensure a convenient separation of the inclusions, which have to be completely embedded in the matrix material, a slightly enlarged radius is considered when verifying the possibility of insertion of a new sphere. The output of the generation procedure, for a given specimen, consists in a list that gives, for each sphere, the coordinates of the centre and the radius. The format of the file containing these data is compatible with the requirements of the pre-processor of the finite element code Adina (ADINA R&D, Inc.), which has been used for the numerical simulations. The construction of the finite element mesh follows two steps, using the three-dimensional solid modeller Adina-M:
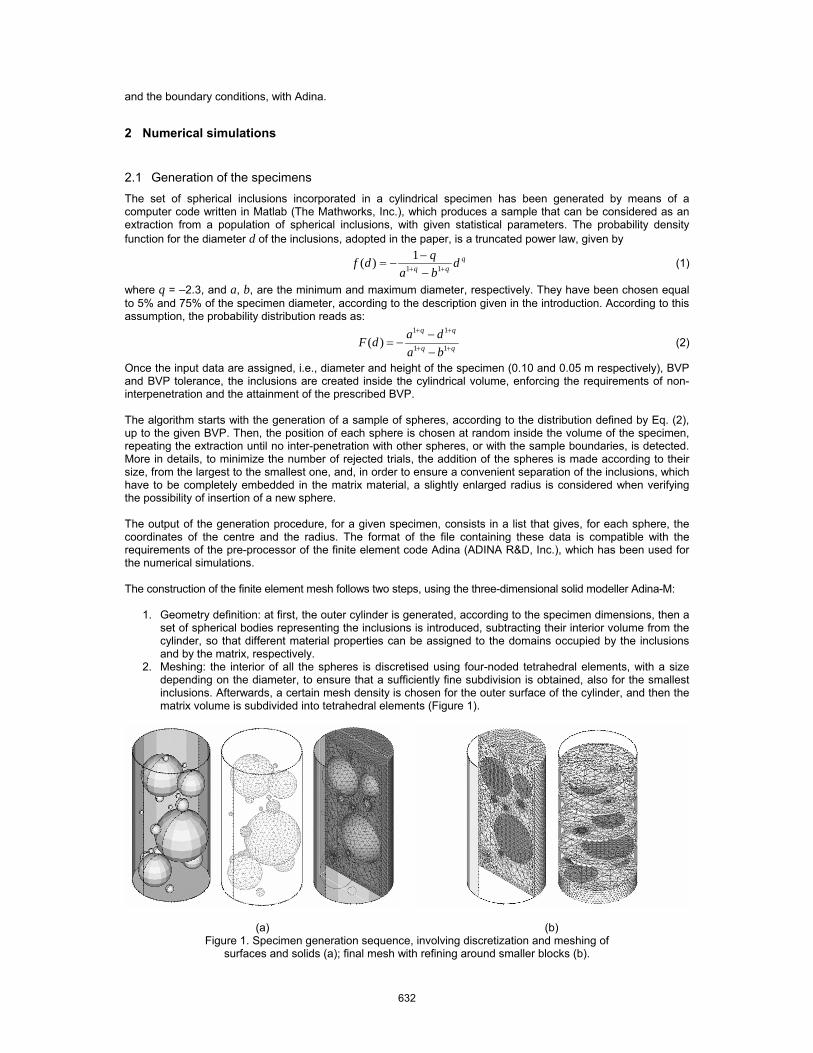
1. Geometry definition: at first, the outer cylinder is generated, according to the specimen dimensions, then a set of spherical bodies representing the inclusions is introduced, subtracting their interior volume from the cylinder, so that different material properties can be assigned to the domains occupied by the inclusions and by the matrix, respectively.
2. Meshing: the interior of all the spheres is discretised using four-noded tetrahedral elements, with a size depending on the diameter, to ensure that a sufficiently fine subdivision is obtained, also for the smallest inclusions. Afterwards, a certain mesh density is chosen for the outer surface of the cylinder, and then the matrix volume is subdivided into tetrahedral elements (Figure 1).
(a)
(b) Figure 1. Specimen generation sequence, involving discretization and meshing of
surfaces and solids (a); final mesh with refining around smaller blocks (b).
632
The numerical study has been conducted with the objective of reproducing an experimental campaign aimed at the determination of strength and deformability parameters of bimrock samples subjected to uniaxial and triaxial compression tests. A set of three specimens for any of the values BVP = 10%, 20%, 30%, and 40% has been generated. In the following, reference will be made to a given specimen with a code consisting of a two-digit number, indicating the BVP, a letter (a, b, c) referring to a particular inclusion placing, followed by other two digits, which refer to the lateral applied pressure (00, 05, 10, 20, corresponding to 0.0, 0.5, 1.0, and 2.0 MPa, respectively). For instance, specimen 40b05 is the second of the samples with BVP = 40%, tested at the confining pressure of 0.5 MPa. In addition to the specimens made of two materials, in order to assess the validity of the meshing procedure, also a homogeneous specimen consisting of inclusions made of the same matrix material has been tested. It has to be noted that, differently from real experimentation, a numerical test on a given specimen can be repeated at different confining pressures. For example, the only difference between tests 30a10 and 30a20 is the lateral pressure, being the set of inclusions in the samples exactly the same.
2.2 Numerical model In all the numerical tests, the bottom face of the specimen has been considered as fixed, while the nodes on the upper face are constrained to move in the vertical direction, according to a linear time history. The final displacement is attained through equal steps, each one corresponding to the axial strain increment Δε = 0.001. On the lateral surface, the normal pressure p has been applied, to simulate the confinement in a triaxial cell. The cases p = 0.0 (uniaxial compression), 0.5, 1.0, and 2.0 MPa have been considered. Both materials are described according to the Drucker-Prager elastic perfectly-plastic model, with associated flow rule. The yield function f is defined as follows:
kJJf D −+= 21α (3)
where J1 and J2 are the first stress invariant and the second deviatoric stress invariant, respectively, α and k are the Drucker-Prager parameters, which can be related to the Mohr-Coulomb parameters, c′ and φ′ by the expressions, valid in case of compression failure (Bathe, 1996, p. 604):
( ) ( )φ
φφ
φα′−
′′=
′−
′=
sin33cos6,
sin33sin2 ck (4)
The same values of the mechanical parameters used by Lindquist (1994) have been chosen for the numerical calculations, and are summarized in Table 1.
Table 1. Mechanical properties of the materials. E = Young’s modulus, ν = Poisson’s ratio, σc = uniaxial compressive strength, σt = tensile strength, φ′ = friction angle, c′ = cohesion.
E
[GPa] ν
[−] σc
[MPa] σt
[MPa] φ′
[deg] c′
[MPa] Matrix 2.5 0.25 7.12 0.712 24.7 2.28
Inclusions 5.0 0.25 12.68 1.268 38.3 3.07
3 Results
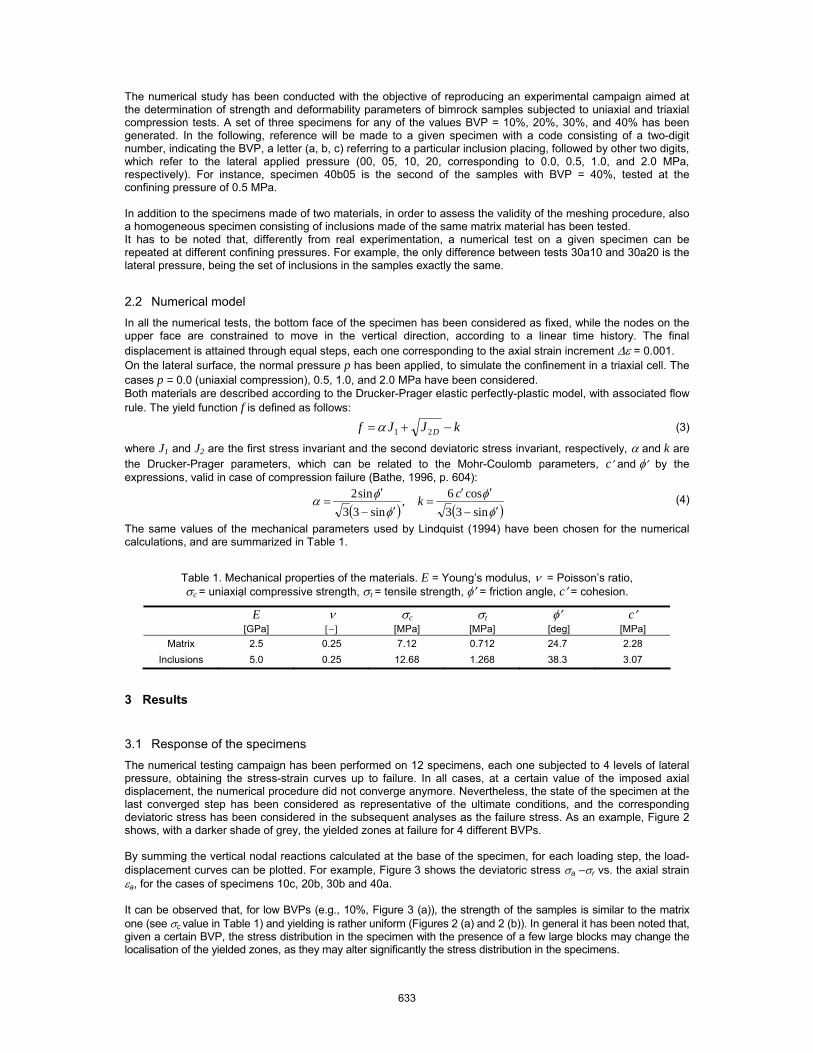
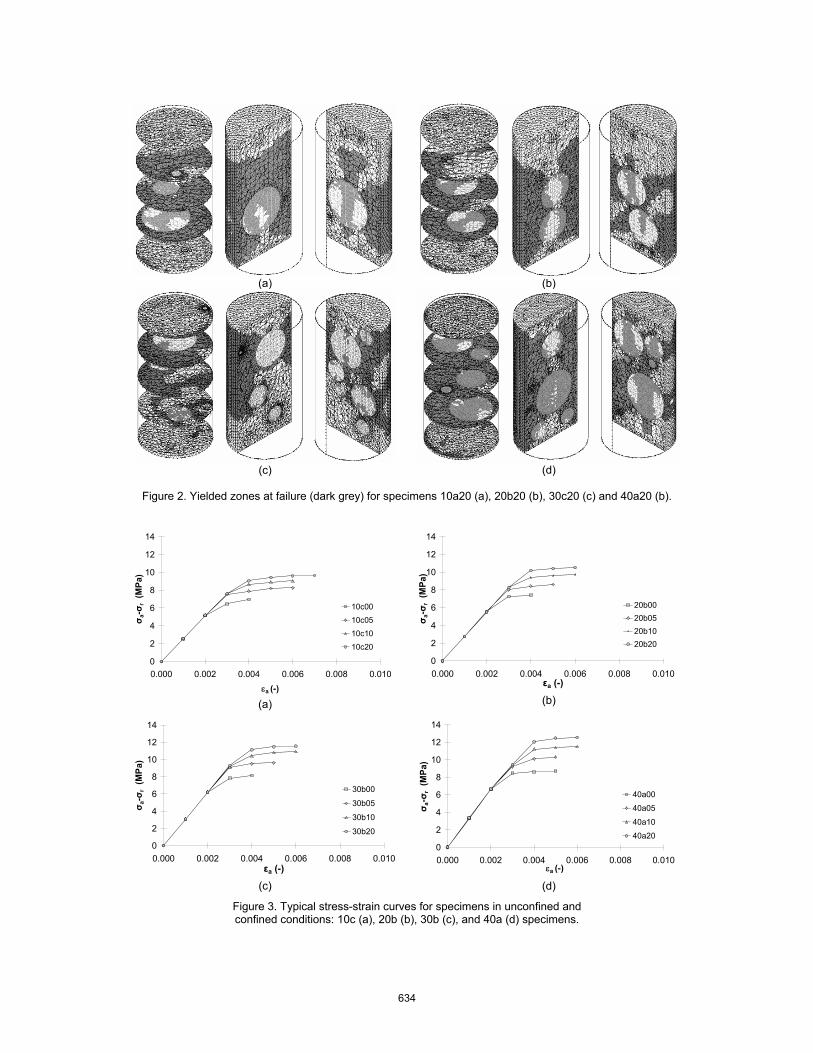
3.1 Response of the specimens The numerical testing campaign has been performed on 12 specimens, each one subjected to 4 levels of lateral pressure, obtaining the stress-strain curves up to failure. In all cases, at a certain value of the imposed axial displacement, the numerical procedure did not converge anymore. Nevertheless, the state of the specimen at the last converged step has been considered as representative of the ultimate conditions, and the corresponding deviatoric stress has been considered in the subsequent analyses as the failure stress. As an example, Figure 2 shows, with a darker shade of grey, the yielded zones at failure for 4 different BVPs. By summing the vertical nodal reactions calculated at the base of the specimen, for each loading step, the load-displacement curves can be plotted. For example, Figure 3 shows the deviatoric stress σa –σr vs. the axial strain εa, for the cases of specimens 10c, 20b, 30b and 40a. It can be observed that, for low BVPs (e.g., 10%, Figure 3 (a)), the strength of the samples is similar to the matrix one (see σc value in Table 1) and yielding is rather uniform (Figures 2 (a) and 2 (b)). In general it has been noted that, given a certain BVP, the stress distribution in the specimen with the presence of a few large blocks may change the localisation of the yielded zones, as they may alter significantly the stress distribution in the specimens.
633
(a)
(b)
(c)
(d)
Figure 2. Yielded zones at failure (dark grey) for specimens 10a20 (a), 20b20 (b), 30c20 (c) and 40a20 (b).
0
2
4
6
8
10
12
14
0.000 0.002 0.004 0.006 0.008 0.010εa (-)
σ a-σ
r (M
Pa)
10c0010c0510c1010c20
(a)
0
2
4
6
8
10
12
14
0.000 0.002 0.004 0.006 0.008 0.010εa (-)
σ a-σ
r (M
Pa)
20b0020b0520b1020b20
(b)
0
2
4
6
8
10
12
14
0.000 0.002 0.004 0.006 0.008 0.010εa (-)
σ a-σ
r (M
Pa)
30b00
30b05
30b10
30b20
(c)
0
2
4
6
8
10
12
14
0.000 0.002 0.004 0.006 0.008 0.010εa (-)
σ a-σ
r (M
Pa)
40a00
40a05
40a10
40a20
(d)
Figure 3. Typical stress-strain curves for specimens in unconfined and confined conditions: 10c (a), 20b (b), 30b (c), and 40a (d) specimens.
634
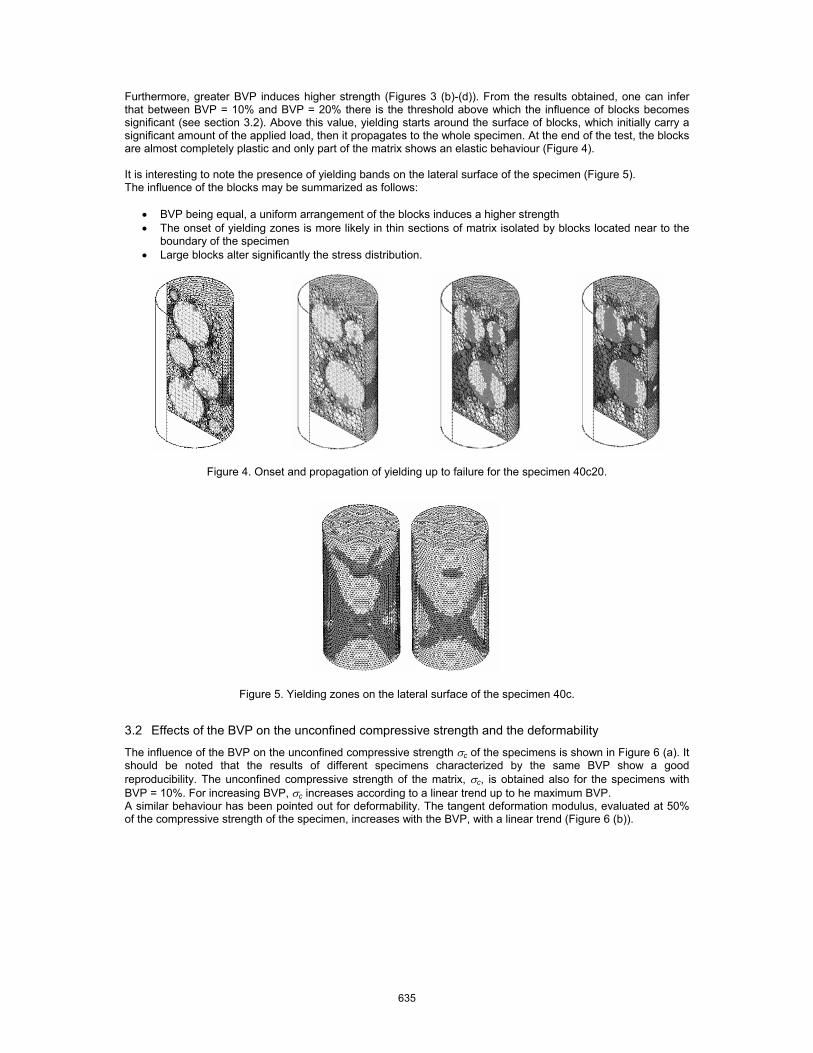
Furthermore, greater BVP induces higher strength (Figures 3 (b)-(d)). From the results obtained, one can infer that between BVP = 10% and BVP = 20% there is the threshold above which the influence of blocks becomes significant (see section 3.2). Above this value, yielding starts around the surface of blocks, which initially carry a significant amount of the applied load, then it propagates to the whole specimen. At the end of the test, the blocks are almost completely plastic and only part of the matrix shows an elastic behaviour (Figure 4). It is interesting to note the presence of yielding bands on the lateral surface of the specimen (Figure 5). The influence of the blocks may be summarized as follows:
• BVP being equal, a uniform arrangement of the blocks induces a higher strength • The onset of yielding zones is more likely in thin sections of matrix isolated by blocks located near to the
boundary of the specimen • Large blocks alter significantly the stress distribution.
Figure 4. Onset and propagation of yielding up to failure for the specimen 40c20.
Figure 5. Yielding zones on the lateral surface of the specimen 40c.
3.2 Effects of the BVP on the unconfined compressive strength and the deformability
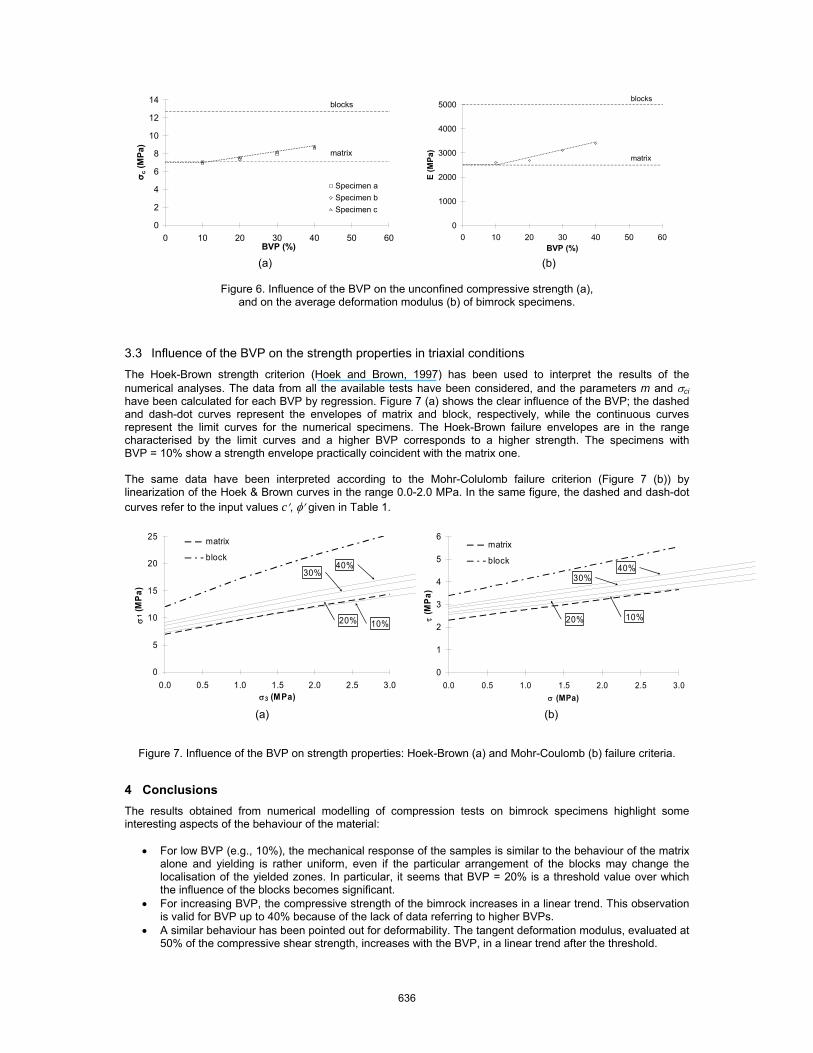
The influence of the BVP on the unconfined compressive strength σc of the specimens is shown in Figure 6 (a). It should be noted that the results of different specimens characterized by the same BVP show a good reproducibility. The unconfined compressive strength of the matrix, σc, is obtained also for the specimens with BVP = 10%. For increasing BVP, σc increases according to a linear trend up to he maximum BVP. A similar behaviour has been pointed out for deformability. The tangent deformation modulus, evaluated at 50% of the compressive strength of the specimen, increases with the BVP, with a linear trend (Figure 6 (b)).
635
0
2
4
6
8
10
12
14
0 10 20 30 40 50 60BVP (%)
σ c (M
Pa)
Specimen aSpecimen bSpecimen c
blocks
matrix
(a)
0
1000
2000
3000
4000
5000
0 10 20 30 40 50 60BVP (%)
E (M
Pa)
blocks
matrix
(b)
Figure 6. Influence of the BVP on the unconfined compressive strength (a), and on the average deformation modulus (b) of bimrock specimens.
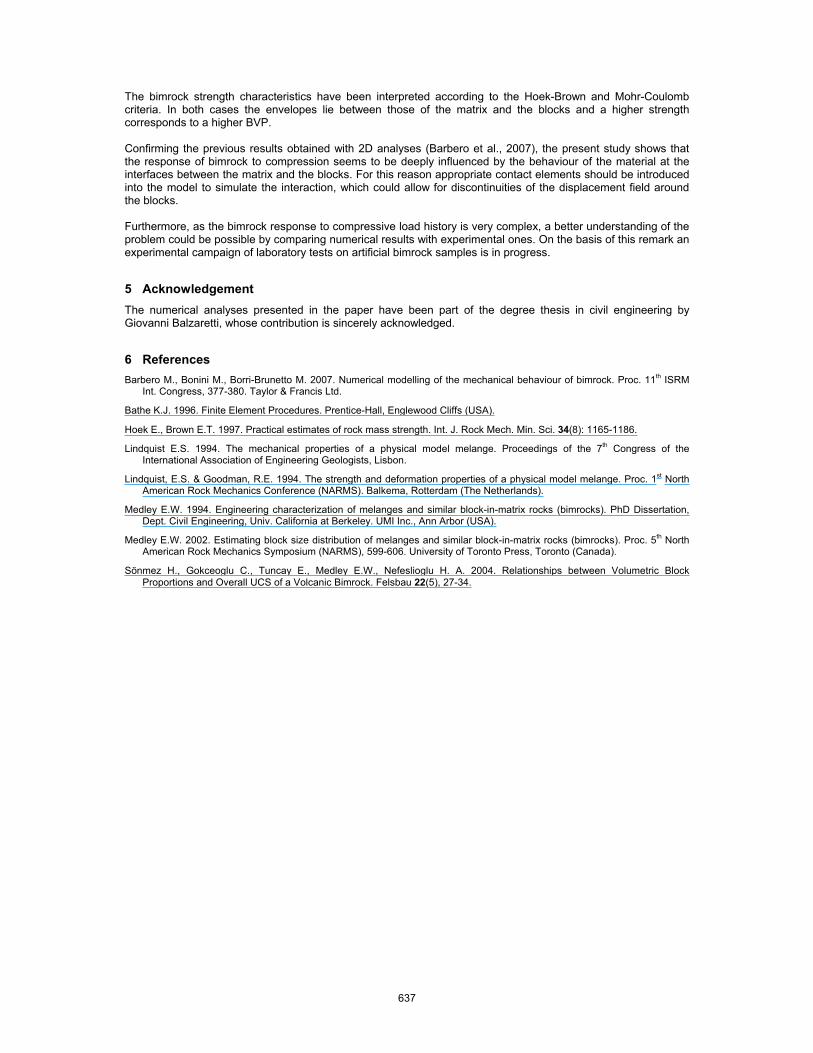
3.3 Influence of the BVP on the strength properties in triaxial conditions The Hoek-Brown strength criterion (Hoek and Brown, 1997) has been used to interpret the results of the numerical analyses. The data from all the available tests have been considered, and the parameters m and σci have been calculated for each BVP by regression. Figure 7 (a) shows the clear influence of the BVP; the dashed and dash-dot curves represent the envelopes of matrix and block, respectively, while the continuous curves represent the limit curves for the numerical specimens. The Hoek-Brown failure envelopes are in the range characterised by the limit curves and a higher BVP corresponds to a higher strength. The specimens with BVP = 10% show a strength envelope practically coincident with the matrix one. The same data have been interpreted according to the Mohr-Colulomb failure criterion (Figure 7 (b)) by linearization of the Hoek & Brown curves in the range 0.0-2.0 MPa. In the same figure, the dashed and dash-dot curves refer to the input values c′, φ′ given in Table 1.
0
5
10
15
20
25
0.0 0.5 1.0 1.5 2.0 2.5 3.0σ3 (MPa)
σ1 (
MPa
)
matrix
block
10%20%
30%40%
(a)
0
1
2
3
4
5
6
0.0 0.5 1.0 1.5 2.0 2.5 3.0σ (MPa)
τ (M
Pa)
matrix
block
10%20%
30%40%
(b)
Figure 7. Influence of the BVP on strength properties: Hoek-Brown (a) and Mohr-Coulomb (b) failure criteria.
4 Conclusions The results obtained from numerical modelling of compression tests on bimrock specimens highlight some interesting aspects of the behaviour of the material:
• For low BVP (e.g., 10%), the mechanical response of the samples is similar to the behaviour of the matrix alone and yielding is rather uniform, even if the particular arrangement of the blocks may change the localisation of the yielded zones. In particular, it seems that BVP = 20% is a threshold value over which the influence of the blocks becomes significant.
• For increasing BVP, the compressive strength of the bimrock increases in a linear trend. This observation is valid for BVP up to 40% because of the lack of data referring to higher BVPs.
• A similar behaviour has been pointed out for deformability. The tangent deformation modulus, evaluated at 50% of the compressive shear strength, increases with the BVP, in a linear trend after the threshold.
636
The bimrock strength characteristics have been interpreted according to the Hoek-Brown and Mohr-Coulomb criteria. In both cases the envelopes lie between those of the matrix and the blocks and a higher strength corresponds to a higher BVP. Confirming the previous results obtained with 2D analyses (Barbero et al., 2007), the present study shows that the response of bimrock to compression seems to be deeply influenced by the behaviour of the material at the interfaces between the matrix and the blocks. For this reason appropriate contact elements should be introduced into the model to simulate the interaction, which could allow for discontinuities of the displacement field around the blocks. Furthermore, as the bimrock response to compressive load history is very complex, a better understanding of the problem could be possible by comparing numerical results with experimental ones. On the basis of this remark an experimental campaign of laboratory tests on artificial bimrock samples is in progress.
5 Acknowledgement The numerical analyses presented in the paper have been part of the degree thesis in civil engineering by Giovanni Balzaretti, whose contribution is sincerely acknowledged.
6 References Barbero M., Bonini M., Borri-Brunetto M. 2007. Numerical modelling of the mechanical behaviour of bimrock. Proc. 11th ISRM
Int. Congress, 377-380. Taylor & Francis Ltd.
Bathe K.J. 1996. Finite Element Procedures. Prentice-Hall, Englewood Cliffs (USA).
Hoek E., Brown E.T. 1997. Practical estimates of rock mass strength. Int. J. Rock Mech. Min. Sci. 34(8): 1165-1186.
Lindquist E.S. 1994. The mechanical properties of a physical model melange. Proceedings of the 7th Congress of the International Association of Engineering Geologists, Lisbon.
Lindquist, E.S. & Goodman, R.E. 1994. The strength and deformation properties of a physical model melange. Proc. 1st North American Rock Mechanics Conference (NARMS). Balkema, Rotterdam (The Netherlands).
Medley E.W. 1994. Engineering characterization of melanges and similar block-in-matrix rocks (bimrocks). PhD Dissertation, Dept. Civil Engineering, Univ. California at Berkeley. UMI Inc., Ann Arbor (USA).
Medley E.W. 2002. Estimating block size distribution of melanges and similar block-in-matrix rocks (bimrocks). Proc. 5th North American Rock Mechanics Symposium (NARMS), 599-606. University of Toronto Press, Toronto (Canada).
Sönmez H., Gokceoglu C., Tuncay E., Medley E.W., Nefeslioglu H. A. 2004. Relationships between Volumetric Block Proportions and Overall UCS of a Volcanic Bimrock. Felsbau 22(5), 27-34.
637
Related Documents