August 2005 NASA/TM-2005-213907 7075-T6 and 2024-T351 Aluminum Alloy Fatigue Crack Growth Rate Data Scott C. Forth and Christopher W. Wright Langley Research Center, Hampton, Virginia William M. Johnston, Jr. Lockheed Martin Corporation, Hampton, Virginia https://ntrs.nasa.gov/search.jsp?R=20050215293 2019-08-08T21:04:37+00:00Z

Welcome message from author
This document is posted to help you gain knowledge. Please leave a comment to let me know what you think about it! Share it to your friends and learn new things together.
Transcript
August 2005
NASA/TM-2005-213907
7075-T6 and 2024-T351 Aluminum Alloy
Fatigue Crack Growth Rate Data
Scott C. Forth and Christopher W. Wright
Langley Research Center, Hampton, Virginia
William M. Johnston, Jr.
Lockheed Martin Corporation, Hampton, Virginia
https://ntrs.nasa.gov/search.jsp?R=20050215293 2019-08-08T21:04:37+00:00Z
The NASA STI Program Office . . . in Profile
Since its founding, NASA has been dedicated to the
advancement of aeronautics and space science. The
NASA Scientific and Technical Information (STI)
Program Office plays a key part in helping NASA
maintain this important role.
The NASA STI Program Office is operated by
Langley Research Center, the lead center for NASA’s
scientific and technical information. The NASA STI
Program Office provides access to the NASA STI
Database, the largest collection of aeronautical and
space science STI in the world. The Program Office is
also NASA’s institutional mechanism for
disseminating the results of its research and
development activities. These results are published by
NASA in the NASA STI Report Series, which
includes the following report types:
• TECHNICAL PUBLICATION. Reports of
completed research or a major significant phase
of research that present the results of NASA
programs and include extensive data or
theoretical analysis. Includes compilations of
significant scientific and technical data and
information deemed to be of continuing
reference value. NASA counterpart of peer-
reviewed formal professional papers, but having
less stringent limitations on manuscript length
and extent of graphic presentations.
• TECHNICAL MEMORANDUM. Scientific
and technical findings that are preliminary or of
specialized interest, e.g., quick release reports,
working papers, and bibliographies that contain
minimal annotation. Does not contain extensive
analysis.
• CONTRACTOR REPORT. Scientific and
technical findings by NASA-sponsored
contractors and grantees.
• CONFERENCE PUBLICATION. Collected
papers from scientific and technical
conferences, symposia, seminars, or other
meetings sponsored or co-sponsored by NASA.
• SPECIAL PUBLICATION. Scientific,
technical, or historical information from NASA
programs, projects, and missions, often
concerned with subjects having substantial
public interest.
• TECHNICAL TRANSLATION. English-
language translations of foreign scientific and
technical material pertinent to NASA’s mission.
Specialized services that complement the STI
Program Office’s diverse offerings include creating
custom thesauri, building customized databases,
organizing and publishing research results ... even
providing videos.
For more information about the NASA STI Program
Office, see the following:
• Access the NASA STI Program Home Page at
http://www.sti.nasa.gov
• E-mail your question via the Internet to
• Fax your question to the NASA STI Help Desk
at (301) 621-0134
• Phone the NASA STI Help Desk at
(301) 621-0390
• Write to:
NASA STI Help Desk
NASA Center for AeroSpace Information
7121 Standard Drive
Hanover, MD 21076-1320
National Aeronautics and
Space Administration
Langley Research Center
Hampton, Virginia 23681-2199
August 2005
NASA/TM-2005-213907
7075-T6 and 2024-T351 Aluminum Alloy
Fatigue Crack Growth Rate Data
Scott C. Forth and Christopher W. Wright
Langley Research Center, Hampton, Virginia
William M. Johnston, Jr.
Lockheed Martin Corporation, Hampton, Virginia
Available from:
NASA Center for AeroSpace Information (CASI) National Technical Information Service (NTIS)
7121 Standard Drive 5285 Port Royal Road
Hanover, MD 21076-1320 Springfield, VA 22161-2171
(301) 621-0390 (703) 605-6000
The use of trademarks or names of manufacturers in the report is for accurate reporting and does not
constitute an official endorsement, either expressed or implied, of such products or manufacturers by the
National Aeronautics and Space Administration.
Abstract
Experimental test procedures for the development of fatigue crack growth rate data has been standardized by the American Society for Testing and Materials. Over the past 30 years several gradual changes have been made to the standard without rigorous assessment of the affect these changes have on the precision or variability of the data generated. Therefore, the ASTM committee on fatigue crack growth has initiated an international round robin test program to assess the precision and variability of test results generated using the standard E647-00. Crack growth rate data presented in this report, in support of the ASTM round-robin, shows excellent precision and repeatability.
Introduction
The experimental test procedure for the development of fatigue crack growth rate data has been standardized by ASTM (American Society for Testing and Materials) in E647-00 “Standard Test Method for Measurement of Fatigue Crack Growth Rates.” The laboratory procedure first evolved in the early to mid 1970’s as a means to characterize the resistance of materials to cracking under cyclic loading conditions. Over the past 30 years several gradual changes have been made to the standard without rigorous assessment of the affect these changes have on the precision or variability of the data generated. Therefore, the ASTM committee on fatigue crack growth has initiated an international round robin test program to assess the precision and variability of test results generated using the standard E647-00. Test data in support of this ASTM round-robin presented in this report was generated at the National Aeronautics and Space Administration (NASA) Langley Research Center, Materials Characterization Laboratory in Hampton, Virginia USA.
Apparatus and Tests
The experiment section of this report is separated into two sections: laboratory equipment and specimen configuration. Testing was conducted in accordance with ASTM standard E647-00 “Standard Test Method for Measurement of Fatigue Crack Growth Rates.”
Laboratory Equipment
All experiments were conducted sequentially in a single servo-hydraulic loading frame of 100kN capacity. The load cell was calibrated using NIST traceable standard to within 2.0% of any displayed reading. The tests were conducted in force control using a digital controller. The digital controller scales the internal load range to the smallest usable range to ensure accurate control. The specimens were installed in hydraulically actuated grips with a grip pressure of 350 bar. Wedge grips were used and equipped with alignment tabs for positive specimen location with serrated jaws for anti-slip control. Strain gauged test bars of similar geometry to the actual test specimens were used to ensure test stand alignment to a total maximum bending strain (front to back + side to side) amplitude of 2.5% at 5 kips and 1.2% at 10 kips.
Visual measurements of the specimen crack length were taken as a straight-line distance normal to the loading axis using a floating optical microscope. The translation stage used to measure crack length was calibrated to 0.03 mm.
Specimen Configuration
Two aluminum alloys were chosen to be included in the round robin: 7075-T6 and 2024-T351. The specimens were machined into middle tension specimens, denoted M(T), prior to delivery to NASA Langley. The standard
2
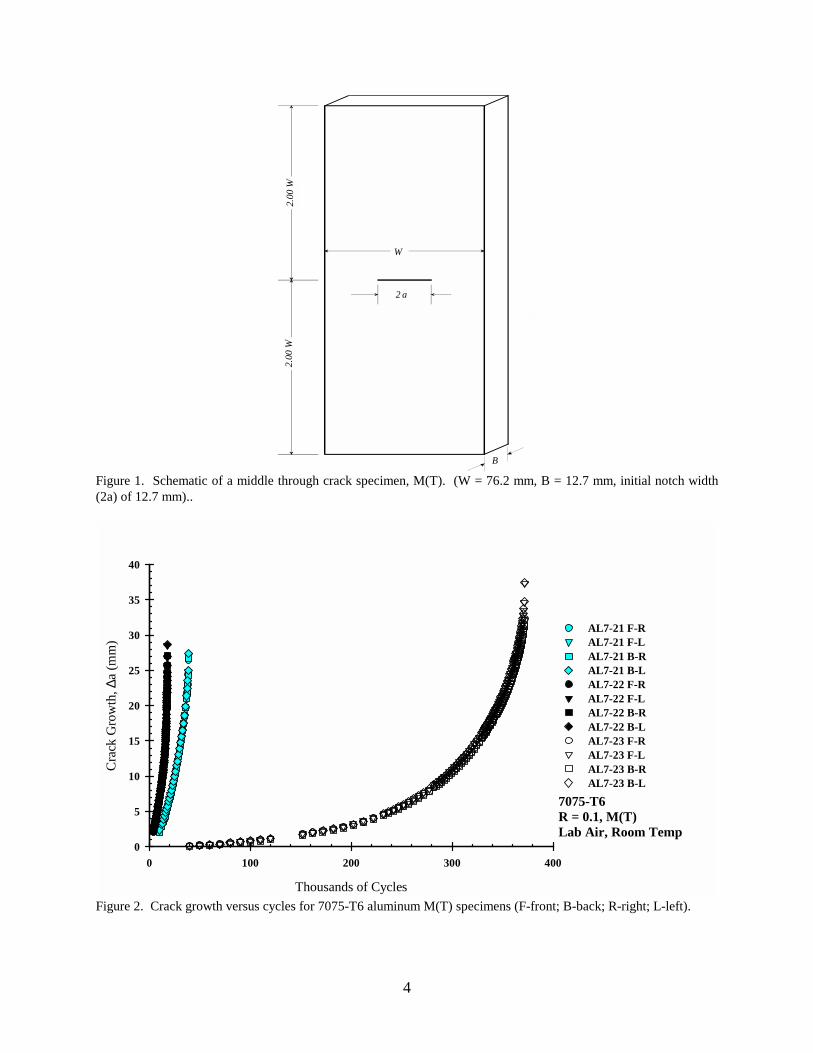
configuration for an M(T) specimen is presented in Figure 1. Actual specimen dimensions were measured prior to testing and are reported in Appendix A. The specimen surfaces were machined to a surface finish of 32 RMS or better and the area where crack growth was expected was hand polished to a surface finish better than 16 RMS. The hand-polishing was performed for easier detection of the crack using visual measurements.
Test Conditions
The fatigue crack growth testing was performed under constant amplitude force control. The applied force was introduced using a function generator producing a sine wave. The initial force level was chosen based on the desired crack growth rate range of the round robin (10-8 to 10-4 meters/cycle). The frequency of the applied loading was chosen to maintain the accuracy of controlling force to within 2%. The cyclic increment chosen to measure crack growth was determined through trial and error to achieve approximately 0.5 mm of growth on each side of the specimen between measurements. The average temperature and humidity during the testing program was 25 oC and 40 % respectively. Specific information on hold times, test frequency and test times can be found in Appendix A.
Results
The fatigue crack growth rate data generated for each aluminum alloy will be presented separately. The data collected during the test was crack length and cycle count. This data is collected and presented in tabular form in Appendix A. The stress intensity factor range, ∆K, is computed using the applied force, specimen dimensions and crack length defined by ASTM E647-00 as
2sec
2παπα
WBPK ∆=∆
where the applied force range is ∆P = Pmax – Pmin, B is the specimen thickness; W is the specimen
width; and α = 2a/W where a is the half crack length. The expression is valid for 2a/W < 0.95 with the implicit assumption that the test material is linear-elastic, isotropic, and homogeneous. The computed stress intensity factor range and fatigue crack growth rate were reduced using the guidelines of ASTM E 647-00 and are presented with the measured crack length and cycle count data in Appendix A.
All crack growth data that does not meet ASTM E 647-00 standards are documented and italicized in Appendix A, but not presented in the main text. One form of data rejection applicable to this program is from inelastic material response where data is rejected if:
( ) ( )YSBPaW σmax25.12 ≥−
where σYS is the 0.2% offset yield strength of material at the same temperature of the fatigue crack growth rate test. Two data points were rejected for the remaining ligament criterion. The other criterion for data rejection applicable to this program is crack symmetry where data is rejected if the crack length measurements referenced from the specimen center line differ more than 0.025W. None of the data generated was rejected for asymmetric crack growth.
7075-T6 Aluminum Data
The 7075-T6 material was provided by the Southwest Research Institute machined into specimens. No additional fabrication was performed by NASA Langley. Forty-four middle tension specimens were machined from a single 1.2 meter wide by 2.4 meter long by 3.175 millimeter thick sheet. The specimens were numbered AL-7-x where x = 1-44. The data presented in this report is for specimens AL-7-21, -22 and -23. Location of the specimens within the larger sheet was not provided. The supplied average material properties were σTS of 593 MPa, σYS of 524 MPa and elongation of 14%.
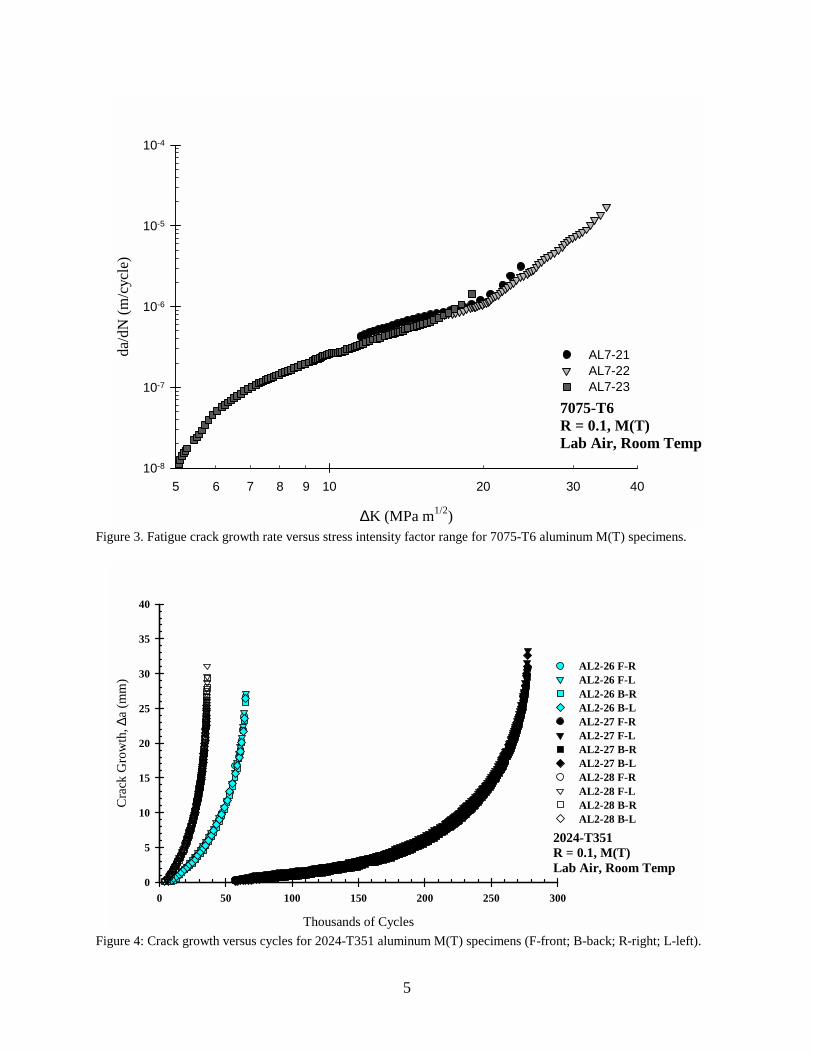
The maximum applied force was 19.02, 26.79 and 9.82 kilonewtons for specimens AL-7-21, -22 and -23 respectively. Figure 2 shows the
3
measured crack length versus cycle count for each test denoted in the legend by specimen number (AL7-x), front (F) or back (B) and left (L) or right (R) measurement. Figure 3 shows the computed fatigue crack growth rate versus stress intensity factor range for each test.
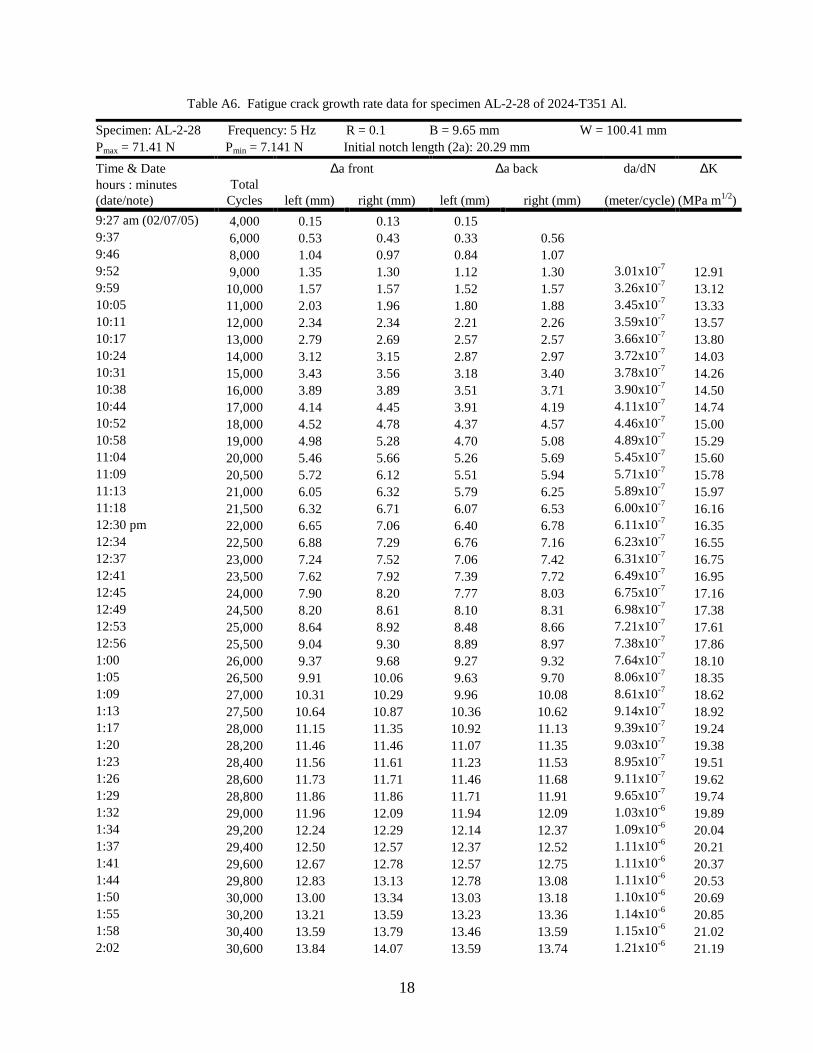
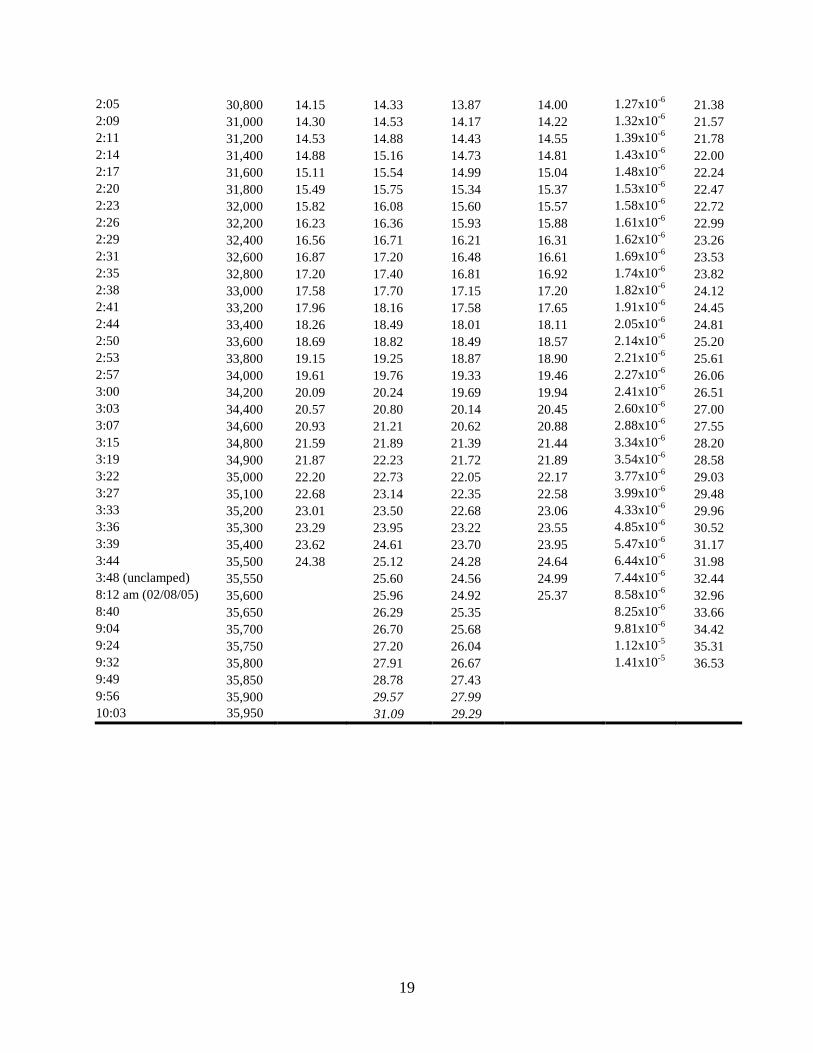
2024-T351 Aluminum Data
The 2024-T351 material was provided by the Southwest Research Institute machined into specimens. No additional fabrication was performed by NASA Langley. Thirty-two middle tension and sixty compact tension specimens were machined from a single 1.2 meter wide by 2.4 meter long by 9.525 millimeter thick sheet. The middle tension specimens were numbered AL-2-x where x = 1-32. The data presented in this report is for specimens AL-2-26, -27 and -28. Location of the specimens within the larger sheet was not provided. The supplied average material properties were σTS of 496 MPa, σYS of 386 MPa and elongation of 20%.
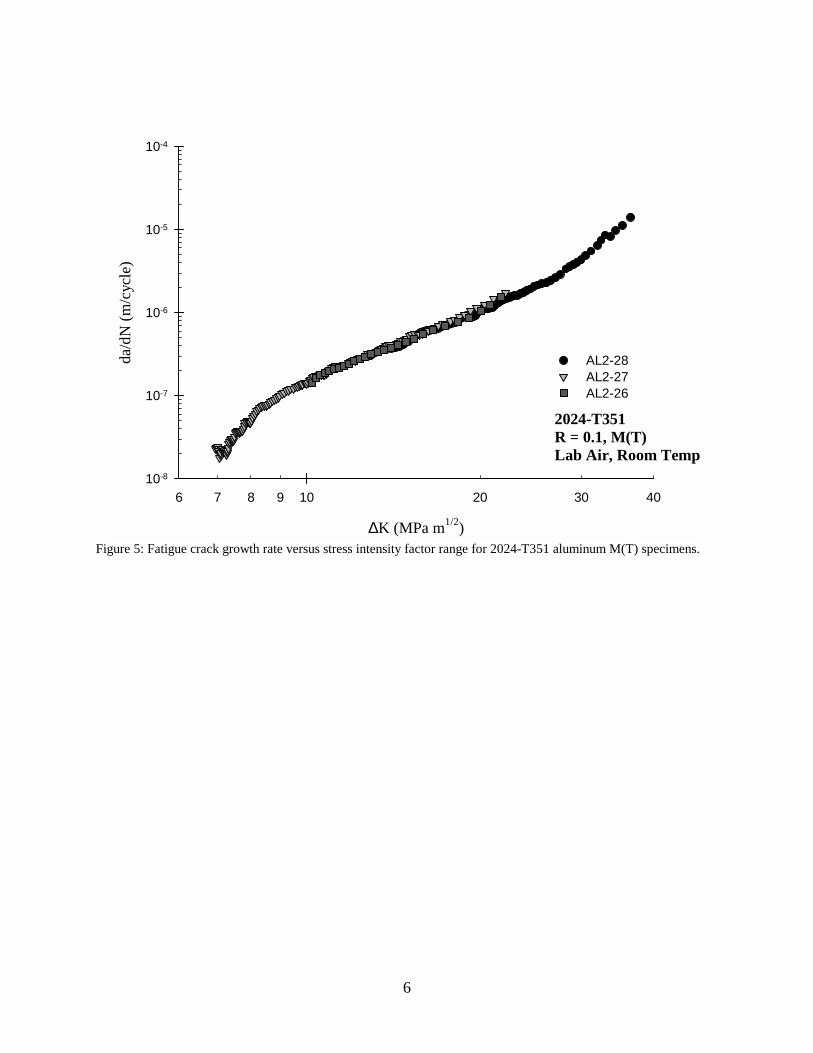
The maximum applied force was 57.05, 40.18 and 71.43 kilonewtons for specimens AL-2-26, -27 and -28 respectively. Figure 4 shows the measured crack length versus cycle count for each test denoted in the legend by specimen number (AL2-x), front (F) or back (B) and left (L) or right (R) measurement. Figure 5 shows the computed fatigue crack growth rate versus stress intensity factor range for each test.
Summary
Experimental fatigue crack growth rate data was generated according to the guidelines of ASTM standard E647-00 “Standard Test Method for Measurement of Fatigue Crack Growth Rates.” The testing was conducted in support of an ASTM round-robin on precision and variability. The crack growth rate data presented in this report for 7075-T6 and 2024-T351 aluminum alloys show excellent precision and repeatability.
4
W
B
2.0
0 W
2
.00
W
2 a
Figure 1. Schematic of a middle through crack specimen, M(T). (W = 76.2 mm, B = 12.7 mm, initial notch width (2a) of 12.7 mm)..
Thousands of Cycles
0 100 200 300 400
Cra
ck G
row
th, ∆
a (m
m)
0
5
10
15
20
25
30
35
40
AL7-21 F-RAL7-21 F-LAL7-21 B-RAL7-21 B-LAL7-22 F-RAL7-22 F-LAL7-22 B-RAL7-22 B-LAL7-23 F-RAL7-23 F-LAL7-23 B-RAL7-23 B-L
7075-T6R = 0.1, M(T)Lab Air, Room Temp
Figure 2. Crack growth versus cycles for 7075-T6 aluminum M(T) specimens (F-front; B-back; R-right; L-left).
5
∆K (MPa m1/2)
5 6 7 8 9 20 30 4010
da/d
N (m
/cyc
le)
10-8
10-7
10-6
10-5
10-4
AL7-21AL7-22AL7-23
7075-T6R = 0.1, M(T)Lab Air, Room Temp
Figure 3. Fatigue crack growth rate versus stress intensity factor range for 7075-T6 aluminum M(T) specimens.
Thousands of Cycles
0 50 100 150 200 250 300
Cra
ck G
row
th, ∆
a (m
m)
0
5
10
15
20
25
30
35
40
AL2-26 F-RAL2-26 F-LAL2-26 B-RAL2-26 B-LAL2-27 F-RAL2-27 F-LAL2-27 B-RAL2-27 B-LAL2-28 F-RAL2-28 F-LAL2-28 B-RAL2-28 B-L
2024-T351R = 0.1, M(T)Lab Air, Room Temp
Figure 4: Crack growth versus cycles for 2024-T351 aluminum M(T) specimens (F-front; B-back; R-right; L-left).
6
∆K (MPa m1/2)
6 7 8 9 20 30 4010
da/d
N (m
/cyc
le)
10-8
10-7
10-6
10-5
10-4
AL2-28AL2-27AL2-26
2024-T351R = 0.1, M(T)Lab Air, Room Temp
Figure 5: Fatigue crack growth rate versus stress intensity factor range for 2024-T351 aluminum M(T) specimens.
7
APPENDIX A
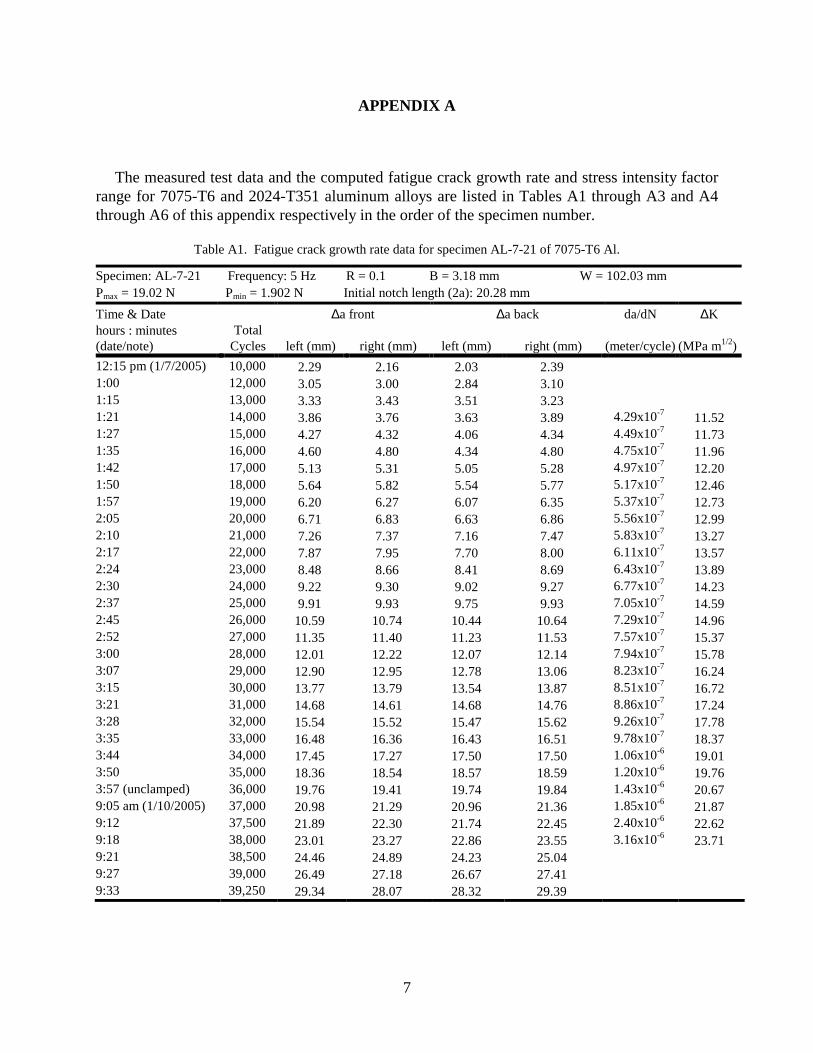
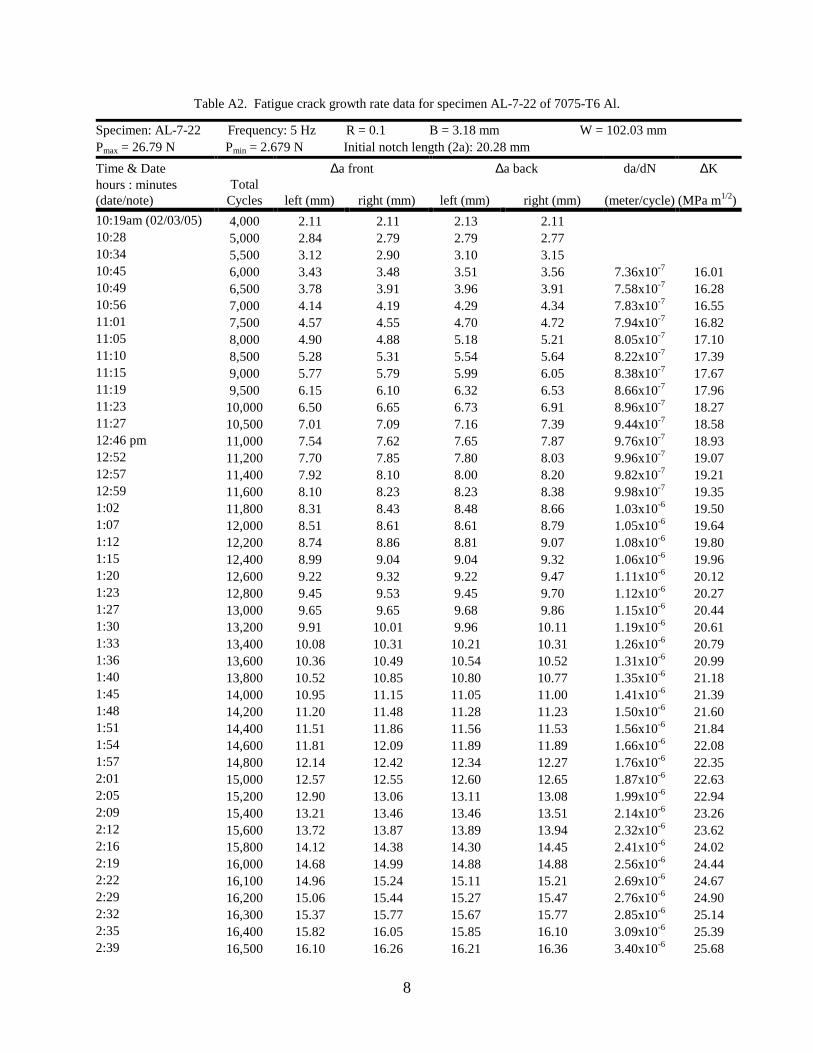
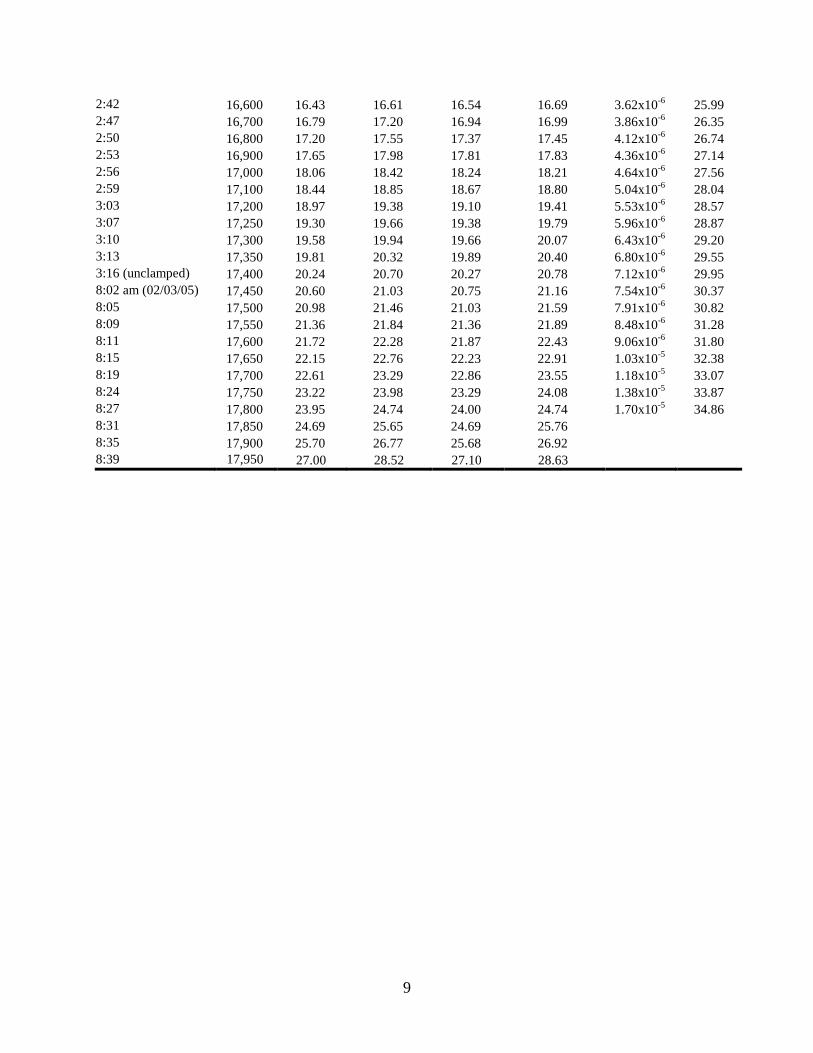
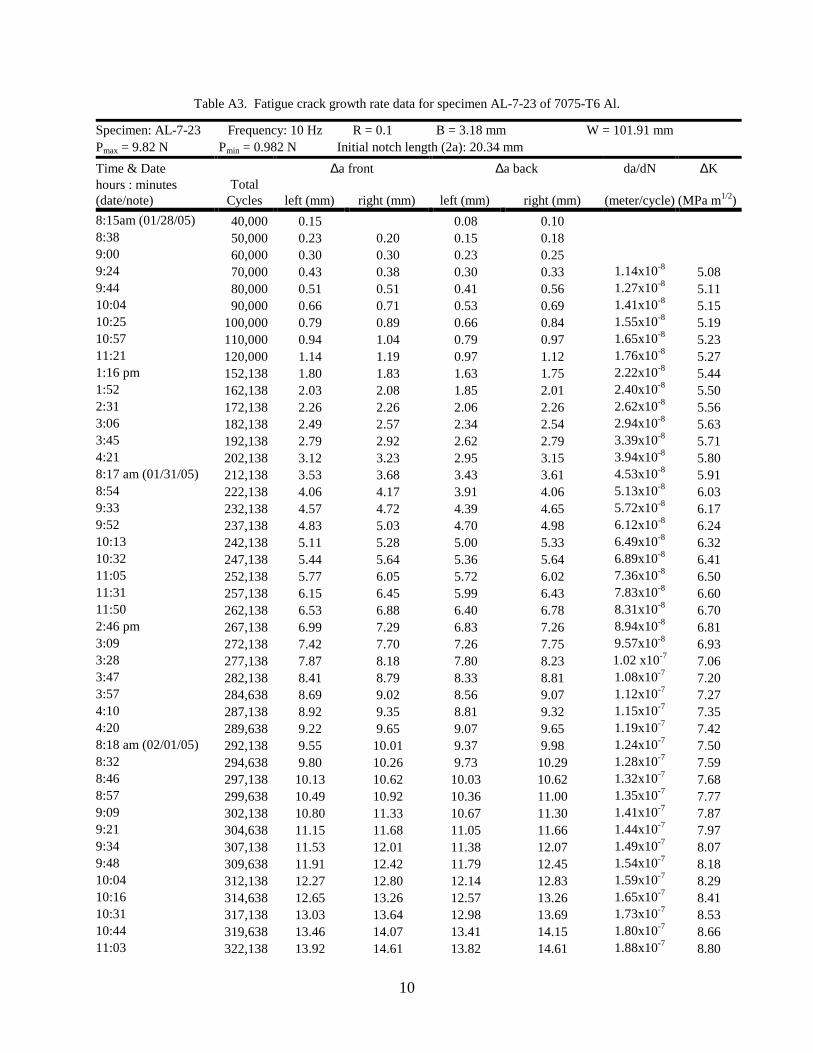
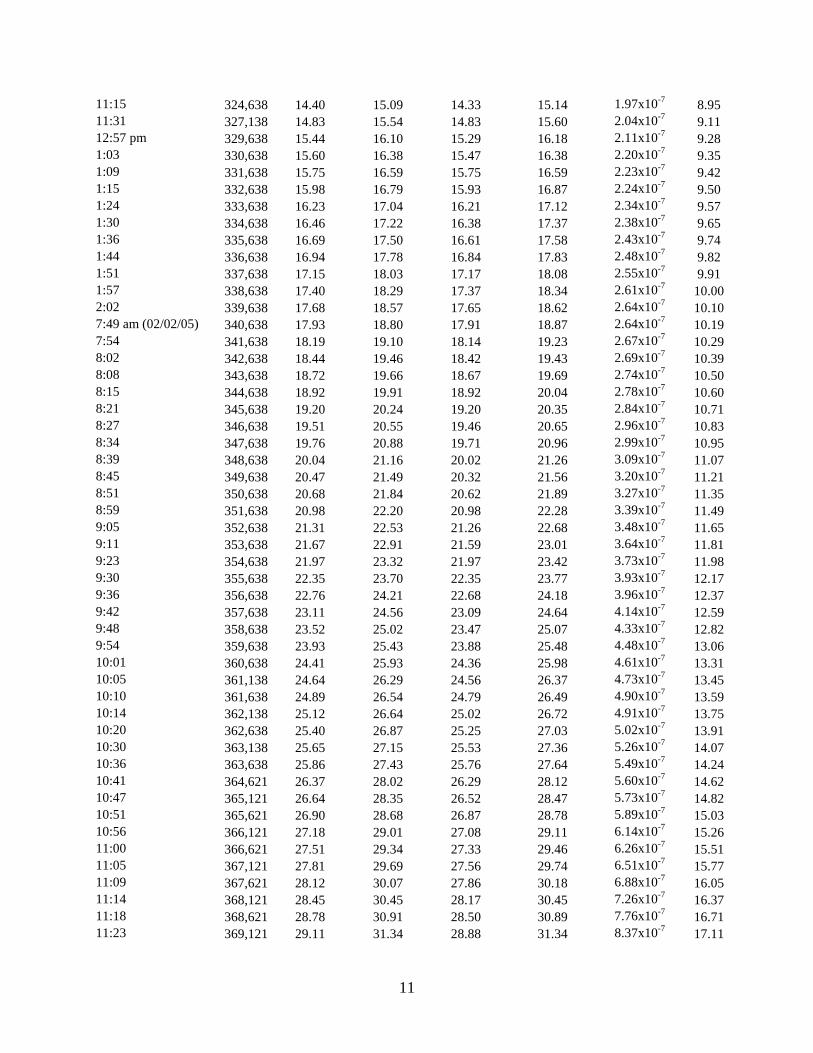
The measured test data and the computed fatigue crack growth rate and stress intensity factor range for 7075-T6 and 2024-T351 aluminum alloys are listed in Tables A1 through A3 and A4 through A6 of this appendix respectively in the order of the specimen number.
Table A1. Fatigue crack growth rate data for specimen AL-7-21 of 7075-T6 Al.
Specimen: AL-7-21 Frequency: 5 Hz R = 0.1 B = 3.18 mm W = 102.03 mm Pmax = 19.02 N Pmin = 1.902 N Initial notch length (2a): 20.28 mm Time & Date ∆a front ∆a back da/dN ∆K hours : minutes (date/note)
Total Cycles left (mm) right (mm) left (mm) right (mm) (meter/cycle) (MPa m1/2)
12:15 pm (1/7/2005) 10,000 2.29 2.16 2.03 2.39 1:00 12,000 3.05 3.00 2.84 3.10 1:15 13,000 3.33 3.43 3.51 3.23 1:21 14,000 3.86 3.76 3.63 3.89 4.29x10⁻⁷ 11.52 1:27 15,000 4.27 4.32 4.06 4.34 4.49x10⁻⁷ 11.73 1:35 16,000 4.60 4.80 4.34 4.80 4.75x10⁻⁷ 11.96 1:42 17,000 5.13 5.31 5.05 5.28 4.97x10⁻⁷ 12.20 1:50 18,000 5.64 5.82 5.54 5.77 5.17x10⁻⁷ 12.46 1:57 19,000 6.20 6.27 6.07 6.35 5.37x10⁻⁷ 12.73 2:05 20,000 6.71 6.83 6.63 6.86 5.56x10⁻⁷ 12.99 2:10 21,000 7.26 7.37 7.16 7.47 5.83x10⁻⁷ 13.27 2:17 22,000 7.87 7.95 7.70 8.00 6.11x10⁻⁷ 13.57 2:24 23,000 8.48 8.66 8.41 8.69 6.43x10⁻⁷ 13.89 2:30 24,000 9.22 9.30 9.02 9.27 6.77x10⁻⁷ 14.23 2:37 25,000 9.91 9.93 9.75 9.93 7.05x10⁻⁷ 14.59 2:45 26,000 10.59 10.74 10.44 10.64 7.29x10⁻⁷ 14.96 2:52 27,000 11.35 11.40 11.23 11.53 7.57x10⁻⁷ 15.37 3:00 28,000 12.01 12.22 12.07 12.14 7.94x10⁻⁷ 15.78 3:07 29,000 12.90 12.95 12.78 13.06 8.23x10⁻⁷ 16.24 3:15 30,000 13.77 13.79 13.54 13.87 8.51x10⁻⁷ 16.72 3:21 31,000 14.68 14.61 14.68 14.76 8.86x10⁻⁷ 17.24 3:28 32,000 15.54 15.52 15.47 15.62 9.26x10⁻⁷ 17.78 3:35 33,000 16.48 16.36 16.43 16.51 9.78x10⁻⁷ 18.37 3:44 34,000 17.45 17.27 17.50 17.50 1.06x10⁻⁶ 19.01 3:50 35,000 18.36 18.54 18.57 18.59 1.20x10⁻⁶ 19.76 3:57 (unclamped) 36,000 19.76 19.41 19.74 19.84 1.43x10⁻⁶ 20.67 9:05 am (1/10/2005) 37,000 20.98 21.29 20.96 21.36 1.85x10⁻⁶ 21.87 9:12 37,500 21.89 22.30 21.74 22.45 2.40x10⁻⁶ 22.62 9:18 38,000 23.01 23.27 22.86 23.55 3.16x10⁻⁶ 23.71 9:21 38,500 24.46 24.89 24.23 25.04 9:27 39,000 26.49 27.18 26.67 27.41 9:33 39,250 29.34 28.07 28.32 29.39
8
Table A2. Fatigue crack growth rate data for specimen AL-7-22 of 7075-T6 Al.
Specimen: AL-7-22 Frequency: 5 Hz R = 0.1 B = 3.18 mm W = 102.03 mm Pmax = 26.79 N Pmin = 2.679 N Initial notch length (2a): 20.28 mm Time & Date ∆a front ∆a back da/dN ∆K hours : minutes (date/note)
Total Cycles left (mm) right (mm) left (mm) right (mm) (meter/cycle) (MPa m1/2)
10:19am (02/03/05) 4,000 2.11 2.11 2.13 2.11 10:28 5,000 2.84 2.79 2.79 2.77 10:34 5,500 3.12 2.90 3.10 3.15 10:45 6,000 3.43 3.48 3.51 3.56 7.36x10⁻⁷ 16.01 10:49 6,500 3.78 3.91 3.96 3.91 7.58x10⁻⁷ 16.28 10:56 7,000 4.14 4.19 4.29 4.34 7.83x10⁻⁷ 16.55 11:01 7,500 4.57 4.55 4.70 4.72 7.94x10⁻⁷ 16.82 11:05 8,000 4.90 4.88 5.18 5.21 8.05x10⁻⁷ 17.10 11:10 8,500 5.28 5.31 5.54 5.64 8.22x10⁻⁷ 17.39 11:15 9,000 5.77 5.79 5.99 6.05 8.38x10⁻⁷ 17.67 11:19 9,500 6.15 6.10 6.32 6.53 8.66x10⁻⁷ 17.96 11:23 10,000 6.50 6.65 6.73 6.91 8.96x10⁻⁷ 18.27 11:27 10,500 7.01 7.09 7.16 7.39 9.44x10⁻⁷ 18.58 12:46 pm 11,000 7.54 7.62 7.65 7.87 9.76x10⁻⁷ 18.93 12:52 11,200 7.70 7.85 7.80 8.03 9.96x10⁻⁷ 19.07 12:57 11,400 7.92 8.10 8.00 8.20 9.82x10⁻⁷ 19.21 12:59 11,600 8.10 8.23 8.23 8.38 9.98x10⁻⁷ 19.35 1:02 11,800 8.31 8.43 8.48 8.66 1.03x10⁻⁶ 19.50 1:07 12,000 8.51 8.61 8.61 8.79 1.05x10⁻⁶ 19.64 1:12 12,200 8.74 8.86 8.81 9.07 1.08x10⁻⁶ 19.80 1:15 12,400 8.99 9.04 9.04 9.32 1.06x10⁻⁶ 19.96 1:20 12,600 9.22 9.32 9.22 9.47 1.11x10⁻⁶ 20.12 1:23 12,800 9.45 9.53 9.45 9.70 1.12x10⁻⁶ 20.27 1:27 13,000 9.65 9.65 9.68 9.86 1.15x10⁻⁶ 20.44 1:30 13,200 9.91 10.01 9.96 10.11 1.19x10⁻⁶ 20.61 1:33 13,400 10.08 10.31 10.21 10.31 1.26x10⁻⁶ 20.79 1:36 13,600 10.36 10.49 10.54 10.52 1.31x10⁻⁶ 20.99 1:40 13,800 10.52 10.85 10.80 10.77 1.35x10⁻⁶ 21.18 1:45 14,000 10.95 11.15 11.05 11.00 1.41x10⁻⁶ 21.39 1:48 14,200 11.20 11.48 11.28 11.23 1.50x10⁻⁶ 21.60 1:51 14,400 11.51 11.86 11.56 11.53 1.56x10⁻⁶ 21.84 1:54 14,600 11.81 12.09 11.89 11.89 1.66x10⁻⁶ 22.08 1:57 14,800 12.14 12.42 12.34 12.27 1.76x10⁻⁶ 22.35 2:01 15,000 12.57 12.55 12.60 12.65 1.87x10⁻⁶ 22.63 2:05 15,200 12.90 13.06 13.11 13.08 1.99x10⁻⁶ 22.94 2:09 15,400 13.21 13.46 13.46 13.51 2.14x10⁻⁶ 23.26 2:12 15,600 13.72 13.87 13.89 13.94 2.32x10⁻⁶ 23.62 2:16 15,800 14.12 14.38 14.30 14.45 2.41x10⁻⁶ 24.02 2:19 16,000 14.68 14.99 14.88 14.88 2.56x10⁻⁶ 24.44 2:22 16,100 14.96 15.24 15.11 15.21 2.69x10⁻⁶ 24.67 2:29 16,200 15.06 15.44 15.27 15.47 2.76x10⁻⁶ 24.90 2:32 16,300 15.37 15.77 15.67 15.77 2.85x10⁻⁶ 25.14 2:35 16,400 15.82 16.05 15.85 16.10 3.09x10⁻⁶ 25.39 2:39 16,500 16.10 16.26 16.21 16.36 3.40x10⁻⁶ 25.68
9
2:42 16,600 16.43 16.61 16.54 16.69 3.62x10⁻⁶ 25.99 2:47 16,700 16.79 17.20 16.94 16.99 3.86x10⁻⁶ 26.35 2:50 16,800 17.20 17.55 17.37 17.45 4.12x10⁻⁶ 26.74 2:53 16,900 17.65 17.98 17.81 17.83 4.36x10⁻⁶ 27.14 2:56 17,000 18.06 18.42 18.24 18.21 4.64x10⁻⁶ 27.56 2:59 17,100 18.44 18.85 18.67 18.80 5.04x10⁻⁶ 28.04 3:03 17,200 18.97 19.38 19.10 19.41 5.53x10⁻⁶ 28.57 3:07 17,250 19.30 19.66 19.38 19.79 5.96x10⁻⁶ 28.87 3:10 17,300 19.58 19.94 19.66 20.07 6.43x10⁻⁶ 29.20 3:13 17,350 19.81 20.32 19.89 20.40 6.80x10⁻⁶ 29.55 3:16 (unclamped) 17,400 20.24 20.70 20.27 20.78 7.12x10⁻⁶ 29.95 8:02 am (02/03/05) 17,450 20.60 21.03 20.75 21.16 7.54x10⁻⁶ 30.37 8:05 17,500 20.98 21.46 21.03 21.59 7.91x10⁻⁶ 30.82 8:09 17,550 21.36 21.84 21.36 21.89 8.48x10⁻⁶ 31.28 8:11 17,600 21.72 22.28 21.87 22.43 9.06x10⁻⁶ 31.80 8:15 17,650 22.15 22.76 22.23 22.91 1.03x10⁻⁵ 32.38 8:19 17,700 22.61 23.29 22.86 23.55 1.18x10⁻⁵ 33.07 8:24 17,750 23.22 23.98 23.29 24.08 1.38x10⁻⁵ 33.87 8:27 17,800 23.95 24.74 24.00 24.74 1.70x10⁻⁵ 34.86 8:31 17,850 24.69 25.65 24.69 25.76 8:35 17,900 25.70 26.77 25.68 26.92 8:39 17,950 27.00 28.52 27.10 28.63
10
Table A3. Fatigue crack growth rate data for specimen AL-7-23 of 7075-T6 Al.
Specimen: AL-7-23 Frequency: 10 Hz R = 0.1 B = 3.18 mm W = 101.91 mm Pmax = 9.82 N Pmin = 0.982 N Initial notch length (2a): 20.34 mm Time & Date ∆a front ∆a back da/dN ∆K hours : minutes (date/note)
Total Cycles left (mm) right (mm) left (mm) right (mm) (meter/cycle) (MPa m1/2)
8:15am (01/28/05) 40,000 0.15 0.08 0.10 8:38 50,000 0.23 0.20 0.15 0.18 9:00 60,000 0.30 0.30 0.23 0.25 9:24 70,000 0.43 0.38 0.30 0.33 1.14x10⁻⁸ 5.08 9:44 80,000 0.51 0.51 0.41 0.56 1.27x10⁻⁸ 5.11 10:04 90,000 0.66 0.71 0.53 0.69 1.41x10⁻⁸ 5.15 10:25 100,000 0.79 0.89 0.66 0.84 1.55x10⁻⁸ 5.19 10:57 110,000 0.94 1.04 0.79 0.97 1.65x10⁻⁸ 5.23 11:21 120,000 1.14 1.19 0.97 1.12 1.76x10⁻⁸ 5.27 1:16 pm 152,138 1.80 1.83 1.63 1.75 2.22x10⁻⁸ 5.44 1:52 162,138 2.03 2.08 1.85 2.01 2.40x10⁻⁸ 5.50 2:31 172,138 2.26 2.26 2.06 2.26 2.62x10⁻⁸ 5.56 3:06 182,138 2.49 2.57 2.34 2.54 2.94x10⁻⁸ 5.63 3:45 192,138 2.79 2.92 2.62 2.79 3.39x10⁻⁸ 5.71 4:21 202,138 3.12 3.23 2.95 3.15 3.94x10⁻⁸ 5.80 8:17 am (01/31/05) 212,138 3.53 3.68 3.43 3.61 4.53x10⁻⁸ 5.91 8:54 222,138 4.06 4.17 3.91 4.06 5.13x10⁻⁸ 6.03 9:33 232,138 4.57 4.72 4.39 4.65 5.72x10⁻⁸ 6.17 9:52 237,138 4.83 5.03 4.70 4.98 6.12x10⁻⁸ 6.24 10:13 242,138 5.11 5.28 5.00 5.33 6.49x10⁻⁸ 6.32 10:32 247,138 5.44 5.64 5.36 5.64 6.89x10⁻⁸ 6.41 11:05 252,138 5.77 6.05 5.72 6.02 7.36x10⁻⁸ 6.50 11:31 257,138 6.15 6.45 5.99 6.43 7.83x10⁻⁸ 6.60 11:50 262,138 6.53 6.88 6.40 6.78 8.31x10⁻⁸ 6.70 2:46 pm 267,138 6.99 7.29 6.83 7.26 8.94x10⁻⁸ 6.81 3:09 272,138 7.42 7.70 7.26 7.75 9.57x10⁻⁸ 6.93 3:28 277,138 7.87 8.18 7.80 8.23 1.02 x10⁻⁷ 7.06 3:47 282,138 8.41 8.79 8.33 8.81 1.08x10⁻⁷ 7.20 3:57 284,638 8.69 9.02 8.56 9.07 1.12x10⁻⁷ 7.27 4:10 287,138 8.92 9.35 8.81 9.32 1.15x10⁻⁷ 7.35 4:20 289,638 9.22 9.65 9.07 9.65 1.19x10⁻⁷ 7.42 8:18 am (02/01/05) 292,138 9.55 10.01 9.37 9.98 1.24x10⁻⁷ 7.50 8:32 294,638 9.80 10.26 9.73 10.29 1.28x10⁻⁷ 7.59 8:46 297,138 10.13 10.62 10.03 10.62 1.32x10⁻⁷ 7.68 8:57 299,638 10.49 10.92 10.36 11.00 1.35x10⁻⁷ 7.77 9:09 302,138 10.80 11.33 10.67 11.30 1.41x10⁻⁷ 7.87 9:21 304,638 11.15 11.68 11.05 11.66 1.44x10⁻⁷ 7.97 9:34 307,138 11.53 12.01 11.38 12.07 1.49x10⁻⁷ 8.07 9:48 309,638 11.91 12.42 11.79 12.45 1.54x10⁻⁷ 8.18 10:04 312,138 12.27 12.80 12.14 12.83 1.59x10⁻⁷ 8.29 10:16 314,638 12.65 13.26 12.57 13.26 1.65x10⁻⁷ 8.41 10:31 317,138 13.03 13.64 12.98 13.69 1.73x10⁻⁷ 8.53 10:44 319,638 13.46 14.07 13.41 14.15 1.80x10⁻⁷ 8.66 11:03 322,138 13.92 14.61 13.82 14.61 1.88x10⁻⁷ 8.80
11
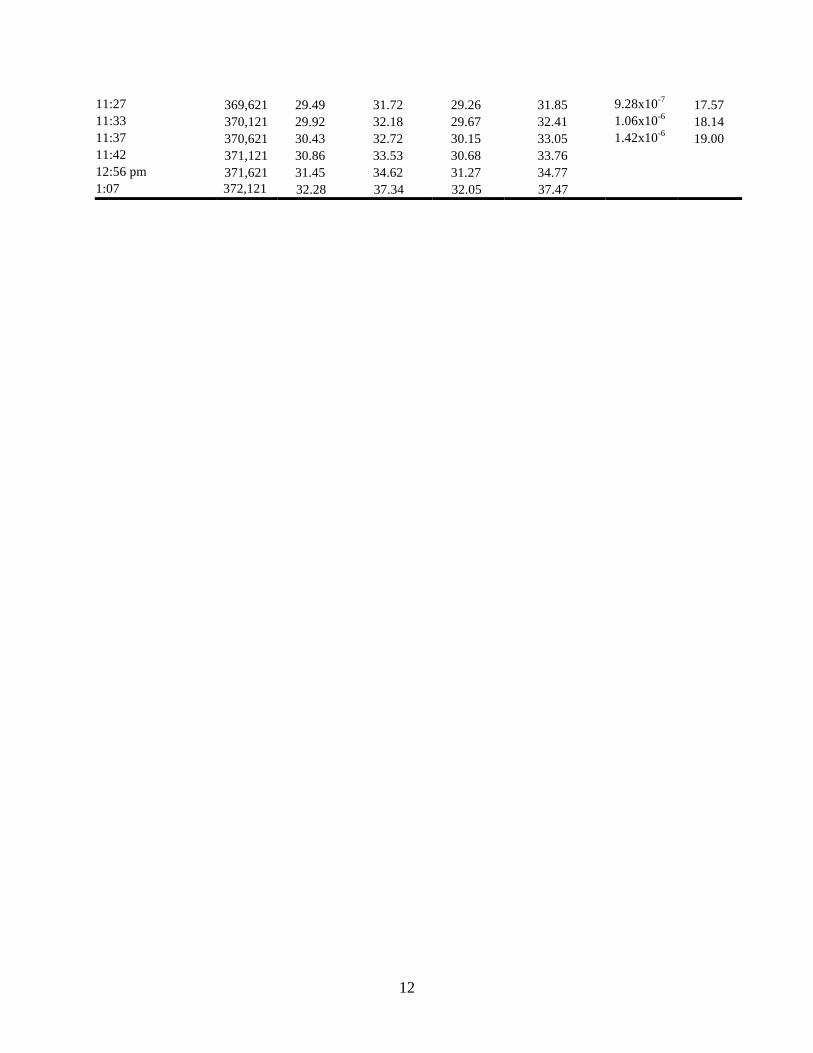
11:15 324,638 14.40 15.09 14.33 15.14 1.97x10⁻⁷ 8.95 11:31 327,138 14.83 15.54 14.83 15.60 2.04x10⁻⁷ 9.11 12:57 pm 329,638 15.44 16.10 15.29 16.18 2.11x10⁻⁷ 9.28 1:03 330,638 15.60 16.38 15.47 16.38 2.20x10⁻⁷ 9.35 1:09 331,638 15.75 16.59 15.75 16.59 2.23x10⁻⁷ 9.42 1:15 332,638 15.98 16.79 15.93 16.87 2.24x10⁻⁷ 9.50 1:24 333,638 16.23 17.04 16.21 17.12 2.34x10⁻⁷ 9.57 1:30 334,638 16.46 17.22 16.38 17.37 2.38x10⁻⁷ 9.65 1:36 335,638 16.69 17.50 16.61 17.58 2.43x10⁻⁷ 9.74 1:44 336,638 16.94 17.78 16.84 17.83 2.48x10⁻⁷ 9.82 1:51 337,638 17.15 18.03 17.17 18.08 2.55x10⁻⁷ 9.91 1:57 338,638 17.40 18.29 17.37 18.34 2.61x10⁻⁷ 10.00 2:02 339,638 17.68 18.57 17.65 18.62 2.64x10⁻⁷ 10.10 7:49 am (02/02/05) 340,638 17.93 18.80 17.91 18.87 2.64x10⁻⁷ 10.19 7:54 341,638 18.19 19.10 18.14 19.23 2.67x10⁻⁷ 10.29 8:02 342,638 18.44 19.46 18.42 19.43 2.69x10⁻⁷ 10.39 8:08 343,638 18.72 19.66 18.67 19.69 2.74x10⁻⁷ 10.50 8:15 344,638 18.92 19.91 18.92 20.04 2.78x10⁻⁷ 10.60 8:21 345,638 19.20 20.24 19.20 20.35 2.84x10⁻⁷ 10.71 8:27 346,638 19.51 20.55 19.46 20.65 2.96x10⁻⁷ 10.83 8:34 347,638 19.76 20.88 19.71 20.96 2.99x10⁻⁷ 10.95 8:39 348,638 20.04 21.16 20.02 21.26 3.09x10⁻⁷ 11.07 8:45 349,638 20.47 21.49 20.32 21.56 3.20x10⁻⁷ 11.21 8:51 350,638 20.68 21.84 20.62 21.89 3.27x10⁻⁷ 11.35 8:59 351,638 20.98 22.20 20.98 22.28 3.39x10⁻⁷ 11.49 9:05 352,638 21.31 22.53 21.26 22.68 3.48x10⁻⁷ 11.65 9:11 353,638 21.67 22.91 21.59 23.01 3.64x10⁻⁷ 11.81 9:23 354,638 21.97 23.32 21.97 23.42 3.73x10⁻⁷ 11.98 9:30 355,638 22.35 23.70 22.35 23.77 3.93x10⁻⁷ 12.17 9:36 356,638 22.76 24.21 22.68 24.18 3.96x10⁻⁷ 12.37 9:42 357,638 23.11 24.56 23.09 24.64 4.14x10⁻⁷ 12.59 9:48 358,638 23.52 25.02 23.47 25.07 4.33x10⁻⁷ 12.82 9:54 359,638 23.93 25.43 23.88 25.48 4.48x10⁻⁷ 13.06 10:01 360,638 24.41 25.93 24.36 25.98 4.61x10⁻⁷ 13.31 10:05 361,138 24.64 26.29 24.56 26.37 4.73x10⁻⁷ 13.45 10:10 361,638 24.89 26.54 24.79 26.49 4.90x10⁻⁷ 13.59 10:14 362,138 25.12 26.64 25.02 26.72 4.91x10⁻⁷ 13.75 10:20 362,638 25.40 26.87 25.25 27.03 5.02x10⁻⁷ 13.91 10:30 363,138 25.65 27.15 25.53 27.36 5.26x10⁻⁷ 14.07 10:36 363,638 25.86 27.43 25.76 27.64 5.49x10⁻⁷ 14.24 10:41 364,621 26.37 28.02 26.29 28.12 5.60x10⁻⁷ 14.62 10:47 365,121 26.64 28.35 26.52 28.47 5.73x10⁻⁷ 14.82 10:51 365,621 26.90 28.68 26.87 28.78 5.89x10⁻⁷ 15.03 10:56 366,121 27.18 29.01 27.08 29.11 6.14x10⁻⁷ 15.26 11:00 366,621 27.51 29.34 27.33 29.46 6.26x10⁻⁷ 15.51 11:05 367,121 27.81 29.69 27.56 29.74 6.51x10⁻⁷ 15.77 11:09 367,621 28.12 30.07 27.86 30.18 6.88x10⁻⁷ 16.05 11:14 368,121 28.45 30.45 28.17 30.45 7.26x10⁻⁷ 16.37 11:18 368,621 28.78 30.91 28.50 30.89 7.76x10⁻⁷ 16.71 11:23 369,121 29.11 31.34 28.88 31.34 8.37x10⁻⁷ 17.11
12
11:27 369,621 29.49 31.72 29.26 31.85 9.28x10⁻⁷ 17.57 11:33 370,121 29.92 32.18 29.67 32.41 1.06x10⁻⁶ 18.14 11:37 370,621 30.43 32.72 30.15 33.05 1.42x10⁻⁶ 19.00 11:42 371,121 30.86 33.53 30.68 33.76 12:56 pm 371,621 31.45 34.62 31.27 34.77 1:07 372,121 32.28 37.34 32.05 37.47
13
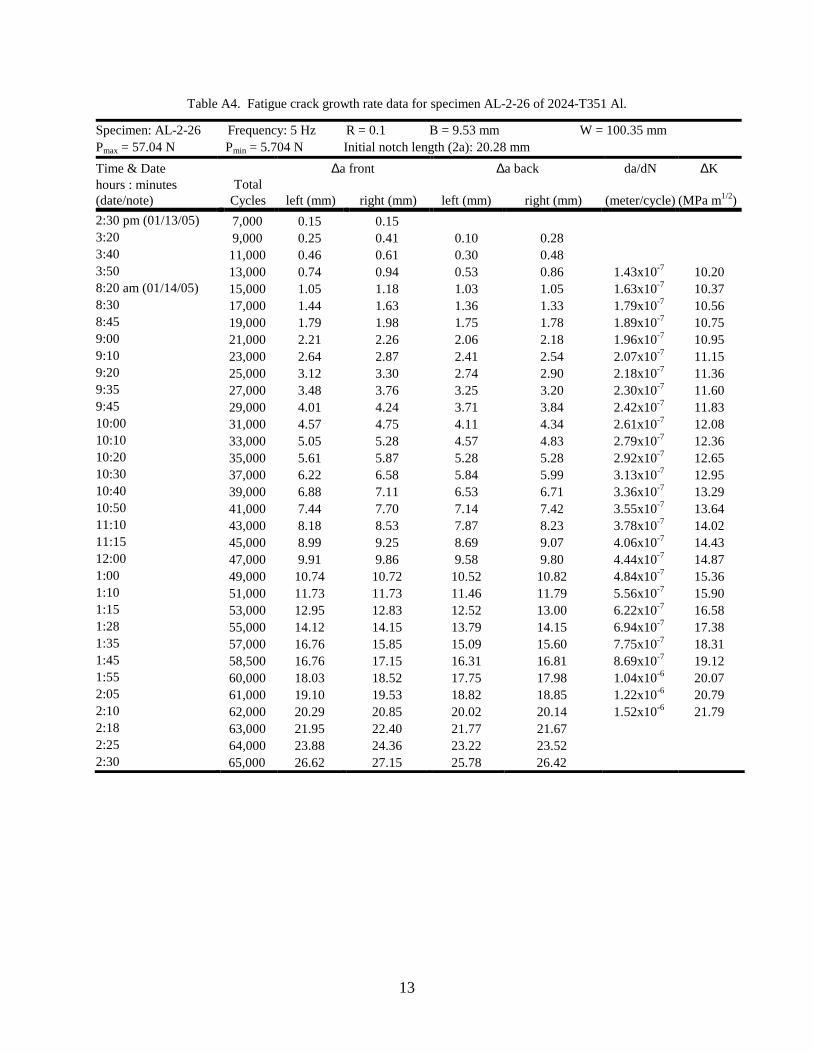
Table A4. Fatigue crack growth rate data for specimen AL-2-26 of 2024-T351 Al.
Specimen: AL-2-26 Frequency: 5 Hz R = 0.1 B = 9.53 mm W = 100.35 mm Pmax = 57.04 N Pmin = 5.704 N Initial notch length (2a): 20.28 mm Time & Date ∆a front ∆a back da/dN ∆K hours : minutes (date/note)
Total Cycles left (mm) right (mm) left (mm) right (mm) (meter/cycle) (MPa m1/2)
2:30 pm (01/13/05) 7,000 0.15 0.15 3:20 9,000 0.25 0.41 0.10 0.28 3:40 11,000 0.46 0.61 0.30 0.48 3:50 13,000 0.74 0.94 0.53 0.86 1.43x10⁻⁷ 10.20 8:20 am (01/14/05) 15,000 1.05 1.18 1.03 1.05 1.63x10⁻⁷ 10.37 8:30 17,000 1.44 1.63 1.36 1.33 1.79x10⁻⁷ 10.56 8:45 19,000 1.79 1.98 1.75 1.78 1.89x10⁻⁷ 10.75 9:00 21,000 2.21 2.26 2.06 2.18 1.96x10⁻⁷ 10.95 9:10 23,000 2.64 2.87 2.41 2.54 2.07x10⁻⁷ 11.15 9:20 25,000 3.12 3.30 2.74 2.90 2.18x10⁻⁷ 11.36 9:35 27,000 3.48 3.76 3.25 3.20 2.30x10⁻⁷ 11.60 9:45 29,000 4.01 4.24 3.71 3.84 2.42x10⁻⁷ 11.83 10:00 31,000 4.57 4.75 4.11 4.34 2.61x10⁻⁷ 12.08 10:10 33,000 5.05 5.28 4.57 4.83 2.79x10⁻⁷ 12.36 10:20 35,000 5.61 5.87 5.28 5.28 2.92x10⁻⁷ 12.65 10:30 37,000 6.22 6.58 5.84 5.99 3.13x10⁻⁷ 12.95 10:40 39,000 6.88 7.11 6.53 6.71 3.36x10⁻⁷ 13.29 10:50 41,000 7.44 7.70 7.14 7.42 3.55x10⁻⁷ 13.64 11:10 43,000 8.18 8.53 7.87 8.23 3.78x10⁻⁷ 14.02 11:15 45,000 8.99 9.25 8.69 9.07 4.06x10⁻⁷ 14.43 12:00 47,000 9.91 9.86 9.58 9.80 4.44x10⁻⁷ 14.87 1:00 49,000 10.74 10.72 10.52 10.82 4.84x10⁻⁷ 15.36 1:10 51,000 11.73 11.73 11.46 11.79 5.56x10⁻⁷ 15.90 1:15 53,000 12.95 12.83 12.52 13.00 6.22x10⁻⁷ 16.58 1:28 55,000 14.12 14.15 13.79 14.15 6.94x10⁻⁷ 17.38 1:35 57,000 16.76 15.85 15.09 15.60 7.75x10⁻⁷ 18.31 1:45 58,500 16.76 17.15 16.31 16.81 8.69x10⁻⁷ 19.12 1:55 60,000 18.03 18.52 17.75 17.98 1.04x10⁻⁶ 20.07 2:05 61,000 19.10 19.53 18.82 18.85 1.22x10⁻⁶ 20.79 2:10 62,000 20.29 20.85 20.02 20.14 1.52x10⁻⁶ 21.79 2:18 63,000 21.95 22.40 21.77 21.67 2:25 64,000 23.88 24.36 23.22 23.52 2:30 65,000 26.62 27.15 25.78 26.42
14
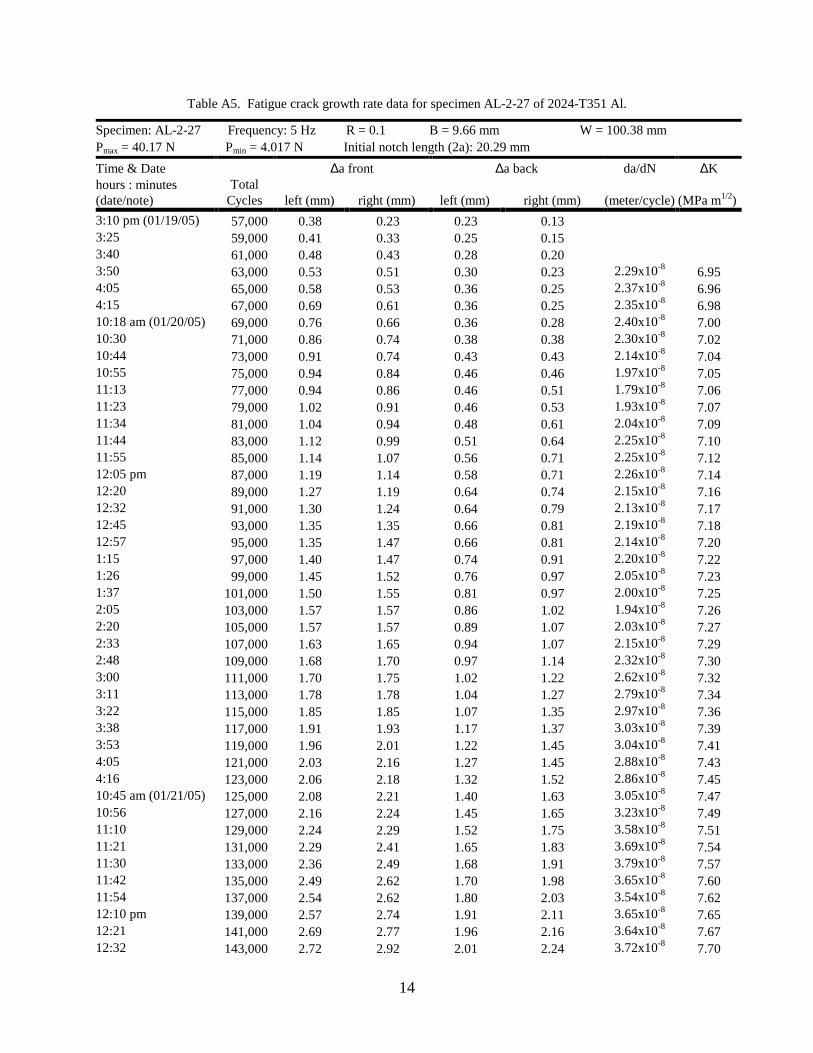
Table A5. Fatigue crack growth rate data for specimen AL-2-27 of 2024-T351 Al.
Specimen: AL-2-27 Frequency: 5 Hz R = 0.1 B = 9.66 mm W = 100.38 mm Pmax = 40.17 N Pmin = 4.017 N Initial notch length (2a): 20.29 mm Time & Date ∆a front ∆a back da/dN ∆K hours : minutes (date/note)
Total Cycles left (mm) right (mm) left (mm) right (mm) (meter/cycle) (MPa m1/2)
3:10 pm (01/19/05) 57,000 0.38 0.23 0.23 0.13 3:25 59,000 0.41 0.33 0.25 0.15 3:40 61,000 0.48 0.43 0.28 0.20 3:50 63,000 0.53 0.51 0.30 0.23 2.29x10⁻⁸ 6.95 4:05 65,000 0.58 0.53 0.36 0.25 2.37x10⁻⁸ 6.96 4:15 67,000 0.69 0.61 0.36 0.25 2.35x10⁻⁸ 6.98 10:18 am (01/20/05) 69,000 0.76 0.66 0.36 0.28 2.40x10⁻⁸ 7.00 10:30 71,000 0.86 0.74 0.38 0.38 2.30x10⁻⁸ 7.02 10:44 73,000 0.91 0.74 0.43 0.43 2.14x10⁻⁸ 7.04 10:55 75,000 0.94 0.84 0.46 0.46 1.97x10⁻⁸ 7.05 11:13 77,000 0.94 0.86 0.46 0.51 1.79x10⁻⁸ 7.06 11:23 79,000 1.02 0.91 0.46 0.53 1.93x10⁻⁸ 7.07 11:34 81,000 1.04 0.94 0.48 0.61 2.04x10⁻⁸ 7.09 11:44 83,000 1.12 0.99 0.51 0.64 2.25x10⁻⁸ 7.10 11:55 85,000 1.14 1.07 0.56 0.71 2.25x10⁻⁸ 7.12 12:05 pm 87,000 1.19 1.14 0.58 0.71 2.26x10⁻⁸ 7.14 12:20 89,000 1.27 1.19 0.64 0.74 2.15x10⁻⁸ 7.16 12:32 91,000 1.30 1.24 0.64 0.79 2.13x10⁻⁸ 7.17 12:45 93,000 1.35 1.35 0.66 0.81 2.19x10⁻⁸ 7.18 12:57 95,000 1.35 1.47 0.66 0.81 2.14x10⁻⁸ 7.20 1:15 97,000 1.40 1.47 0.74 0.91 2.20x10⁻⁸ 7.22 1:26 99,000 1.45 1.52 0.76 0.97 2.05x10⁻⁸ 7.23 1:37 101,000 1.50 1.55 0.81 0.97 2.00x10⁻⁸ 7.25 2:05 103,000 1.57 1.57 0.86 1.02 1.94x10⁻⁸ 7.26 2:20 105,000 1.57 1.57 0.89 1.07 2.03x10⁻⁸ 7.27 2:33 107,000 1.63 1.65 0.94 1.07 2.15x10⁻⁸ 7.29 2:48 109,000 1.68 1.70 0.97 1.14 2.32x10⁻⁸ 7.30 3:00 111,000 1.70 1.75 1.02 1.22 2.62x10⁻⁸ 7.32 3:11 113,000 1.78 1.78 1.04 1.27 2.79x10⁻⁸ 7.34 3:22 115,000 1.85 1.85 1.07 1.35 2.97x10⁻⁸ 7.36 3:38 117,000 1.91 1.93 1.17 1.37 3.03x10⁻⁸ 7.39 3:53 119,000 1.96 2.01 1.22 1.45 3.04x10⁻⁸ 7.41 4:05 121,000 2.03 2.16 1.27 1.45 2.88x10⁻⁸ 7.43 4:16 123,000 2.06 2.18 1.32 1.52 2.86x10⁻⁸ 7.45 10:45 am (01/21/05) 125,000 2.08 2.21 1.40 1.63 3.05x10⁻⁸ 7.47 10:56 127,000 2.16 2.24 1.45 1.65 3.23x10⁻⁸ 7.49 11:10 129,000 2.24 2.29 1.52 1.75 3.58x10⁻⁸ 7.51 11:21 131,000 2.29 2.41 1.65 1.83 3.69x10⁻⁸ 7.54 11:30 133,000 2.36 2.49 1.68 1.91 3.79x10⁻⁸ 7.57 11:42 135,000 2.49 2.62 1.70 1.98 3.65x10⁻⁸ 7.60 11:54 137,000 2.54 2.62 1.80 2.03 3.54x10⁻⁸ 7.62 12:10 pm 139,000 2.57 2.74 1.91 2.11 3.65x10⁻⁸ 7.65 12:21 141,000 2.69 2.77 1.96 2.16 3.64x10⁻⁸ 7.67 12:32 143,000 2.72 2.92 2.01 2.24 3.72x10⁻⁸ 7.70
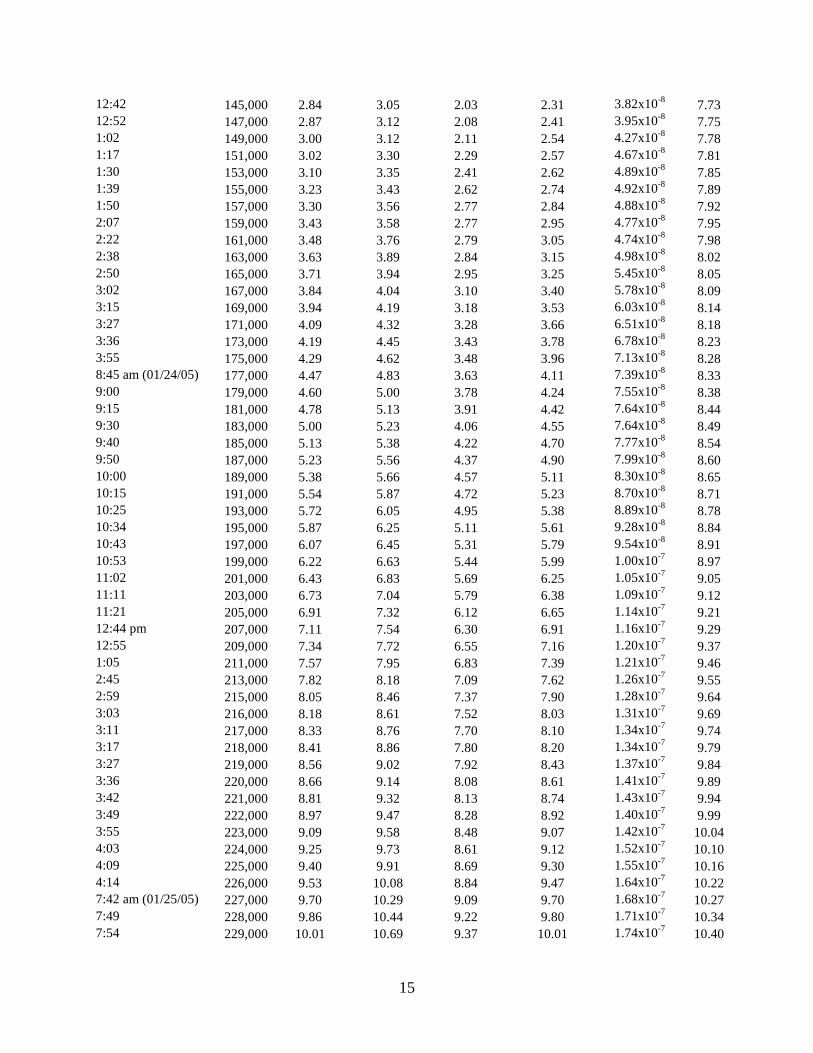
15
12:42 145,000 2.84 3.05 2.03 2.31 3.82x10⁻⁸ 7.73 12:52 147,000 2.87 3.12 2.08 2.41 3.95x10⁻⁸ 7.75 1:02 149,000 3.00 3.12 2.11 2.54 4.27x10⁻⁸ 7.78 1:17 151,000 3.02 3.30 2.29 2.57 4.67x10⁻⁸ 7.81 1:30 153,000 3.10 3.35 2.41 2.62 4.89x10⁻⁸ 7.85 1:39 155,000 3.23 3.43 2.62 2.74 4.92x10⁻⁸ 7.89 1:50 157,000 3.30 3.56 2.77 2.84 4.88x10⁻⁸ 7.92 2:07 159,000 3.43 3.58 2.77 2.95 4.77x10⁻⁸ 7.95 2:22 161,000 3.48 3.76 2.79 3.05 4.74x10⁻⁸ 7.98 2:38 163,000 3.63 3.89 2.84 3.15 4.98x10⁻⁸ 8.02 2:50 165,000 3.71 3.94 2.95 3.25 5.45x10⁻⁸ 8.05 3:02 167,000 3.84 4.04 3.10 3.40 5.78x10⁻⁸ 8.09 3:15 169,000 3.94 4.19 3.18 3.53 6.03x10⁻⁸ 8.14 3:27 171,000 4.09 4.32 3.28 3.66 6.51x10⁻⁸ 8.18 3:36 173,000 4.19 4.45 3.43 3.78 6.78x10⁻⁸ 8.23 3:55 175,000 4.29 4.62 3.48 3.96 7.13x10⁻⁸ 8.28 8:45 am (01/24/05) 177,000 4.47 4.83 3.63 4.11 7.39x10⁻⁸ 8.33 9:00 179,000 4.60 5.00 3.78 4.24 7.55x10⁻⁸ 8.38 9:15 181,000 4.78 5.13 3.91 4.42 7.64x10⁻⁸ 8.44 9:30 183,000 5.00 5.23 4.06 4.55 7.64x10⁻⁸ 8.49 9:40 185,000 5.13 5.38 4.22 4.70 7.77x10⁻⁸ 8.54 9:50 187,000 5.23 5.56 4.37 4.90 7.99x10⁻⁸ 8.60 10:00 189,000 5.38 5.66 4.57 5.11 8.30x10⁻⁸ 8.65 10:15 191,000 5.54 5.87 4.72 5.23 8.70x10⁻⁸ 8.71 10:25 193,000 5.72 6.05 4.95 5.38 8.89x10⁻⁸ 8.78 10:34 195,000 5.87 6.25 5.11 5.61 9.28x10⁻⁸ 8.84 10:43 197,000 6.07 6.45 5.31 5.79 9.54x10⁻⁸ 8.91 10:53 199,000 6.22 6.63 5.44 5.99 1.00x10⁻⁷ 8.97 11:02 201,000 6.43 6.83 5.69 6.25 1.05x10⁻⁷ 9.05 11:11 203,000 6.73 7.04 5.79 6.38 1.09x10⁻⁷ 9.12 11:21 205,000 6.91 7.32 6.12 6.65 1.14x10⁻⁷ 9.21 12:44 pm 207,000 7.11 7.54 6.30 6.91 1.16x10⁻⁷ 9.29 12:55 209,000 7.34 7.72 6.55 7.16 1.20x10⁻⁷ 9.37 1:05 211,000 7.57 7.95 6.83 7.39 1.21x10⁻⁷ 9.46 2:45 213,000 7.82 8.18 7.09 7.62 1.26x10⁻⁷ 9.55 2:59 215,000 8.05 8.46 7.37 7.90 1.28x10⁻⁷ 9.64 3:03 216,000 8.18 8.61 7.52 8.03 1.31x10⁻⁷ 9.69 3:11 217,000 8.33 8.76 7.70 8.10 1.34x10⁻⁷ 9.74 3:17 218,000 8.41 8.86 7.80 8.20 1.34x10⁻⁷ 9.79 3:27 219,000 8.56 9.02 7.92 8.43 1.37x10⁻⁷ 9.84 3:36 220,000 8.66 9.14 8.08 8.61 1.41x10⁻⁷ 9.89 3:42 221,000 8.81 9.32 8.13 8.74 1.43x10⁻⁷ 9.94 3:49 222,000 8.97 9.47 8.28 8.92 1.40x10⁻⁷ 9.99 3:55 223,000 9.09 9.58 8.48 9.07 1.42x10⁻⁷ 10.04 4:03 224,000 9.25 9.73 8.61 9.12 1.52x10⁻⁷ 10.10 4:09 225,000 9.40 9.91 8.69 9.30 1.55x10⁻⁷ 10.16 4:14 226,000 9.53 10.08 8.84 9.47 1.64x10⁻⁷ 10.22 7:42 am (01/25/05) 227,000 9.70 10.29 9.09 9.70 1.68x10⁻⁷ 10.27 7:49 228,000 9.86 10.44 9.22 9.80 1.71x10⁻⁷ 10.34 7:54 229,000 10.01 10.69 9.37 10.01 1.74x10⁻⁷ 10.40
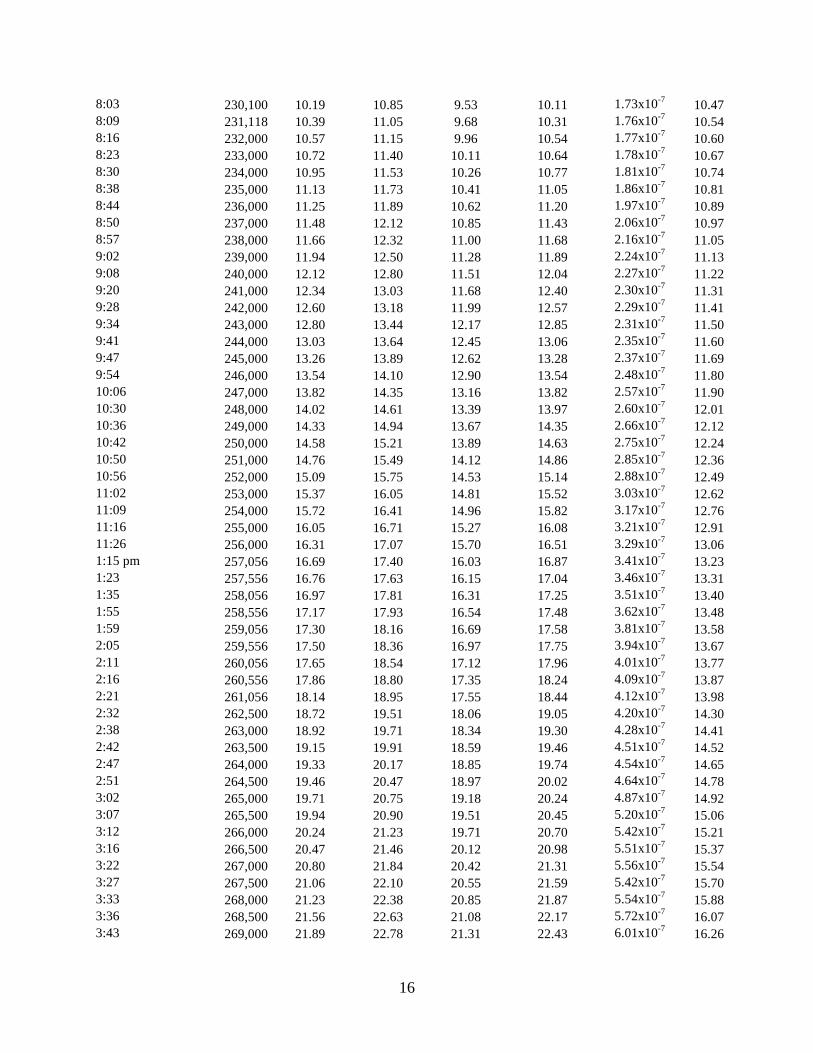
16
8:03 230,100 10.19 10.85 9.53 10.11 1.73x10⁻⁷ 10.47 8:09 231,118 10.39 11.05 9.68 10.31 1.76x10⁻⁷ 10.54 8:16 232,000 10.57 11.15 9.96 10.54 1.77x10⁻⁷ 10.60 8:23 233,000 10.72 11.40 10.11 10.64 1.78x10⁻⁷ 10.67 8:30 234,000 10.95 11.53 10.26 10.77 1.81x10⁻⁷ 10.74 8:38 235,000 11.13 11.73 10.41 11.05 1.86x10⁻⁷ 10.81 8:44 236,000 11.25 11.89 10.62 11.20 1.97x10⁻⁷ 10.89 8:50 237,000 11.48 12.12 10.85 11.43 2.06x10⁻⁷ 10.97 8:57 238,000 11.66 12.32 11.00 11.68 2.16x10⁻⁷ 11.05 9:02 239,000 11.94 12.50 11.28 11.89 2.24x10⁻⁷ 11.13 9:08 240,000 12.12 12.80 11.51 12.04 2.27x10⁻⁷ 11.22 9:20 241,000 12.34 13.03 11.68 12.40 2.30x10⁻⁷ 11.31 9:28 242,000 12.60 13.18 11.99 12.57 2.29x10⁻⁷ 11.41 9:34 243,000 12.80 13.44 12.17 12.85 2.31x10⁻⁷ 11.50 9:41 244,000 13.03 13.64 12.45 13.06 2.35x10⁻⁷ 11.60 9:47 245,000 13.26 13.89 12.62 13.28 2.37x10⁻⁷ 11.69 9:54 246,000 13.54 14.10 12.90 13.54 2.48x10⁻⁷ 11.80 10:06 247,000 13.82 14.35 13.16 13.82 2.57x10⁻⁷ 11.90 10:30 248,000 14.02 14.61 13.39 13.97 2.60x10⁻⁷ 12.01 10:36 249,000 14.33 14.94 13.67 14.35 2.66x10⁻⁷ 12.12 10:42 250,000 14.58 15.21 13.89 14.63 2.75x10⁻⁷ 12.24 10:50 251,000 14.76 15.49 14.12 14.86 2.85x10⁻⁷ 12.36 10:56 252,000 15.09 15.75 14.53 15.14 2.88x10⁻⁷ 12.49 11:02 253,000 15.37 16.05 14.81 15.52 3.03x10⁻⁷ 12.62 11:09 254,000 15.72 16.41 14.96 15.82 3.17x10⁻⁷ 12.76 11:16 255,000 16.05 16.71 15.27 16.08 3.21x10⁻⁷ 12.91 11:26 256,000 16.31 17.07 15.70 16.51 3.29x10⁻⁷ 13.06 1:15 pm 257,056 16.69 17.40 16.03 16.87 3.41x10⁻⁷ 13.23 1:23 257,556 16.76 17.63 16.15 17.04 3.46x10⁻⁷ 13.31 1:35 258,056 16.97 17.81 16.31 17.25 3.51x10⁻⁷ 13.40 1:55 258,556 17.17 17.93 16.54 17.48 3.62x10⁻⁷ 13.48 1:59 259,056 17.30 18.16 16.69 17.58 3.81x10⁻⁷ 13.58 2:05 259,556 17.50 18.36 16.97 17.75 3.94x10⁻⁷ 13.67 2:11 260,056 17.65 18.54 17.12 17.96 4.01x10⁻⁷ 13.77 2:16 260,556 17.86 18.80 17.35 18.24 4.09x10⁻⁷ 13.87 2:21 261,056 18.14 18.95 17.55 18.44 4.12x10⁻⁷ 13.98 2:32 262,500 18.72 19.51 18.06 19.05 4.20x10⁻⁷ 14.30 2:38 263,000 18.92 19.71 18.34 19.30 4.28x10⁻⁷ 14.41 2:42 263,500 19.15 19.91 18.59 19.46 4.51x10⁻⁷ 14.52 2:47 264,000 19.33 20.17 18.85 19.74 4.54x10⁻⁷ 14.65 2:51 264,500 19.46 20.47 18.97 20.02 4.64x10⁻⁷ 14.78 3:02 265,000 19.71 20.75 19.18 20.24 4.87x10⁻⁷ 14.92 3:07 265,500 19.94 20.90 19.51 20.45 5.20x10⁻⁷ 15.06 3:12 266,000 20.24 21.23 19.71 20.70 5.42x10⁻⁷ 15.21 3:16 266,500 20.47 21.46 20.12 20.98 5.51x10⁻⁷ 15.37 3:22 267,000 20.80 21.84 20.42 21.31 5.56x10⁻⁷ 15.54 3:27 267,500 21.06 22.10 20.55 21.59 5.42x10⁻⁷ 15.70 3:33 268,000 21.23 22.38 20.85 21.87 5.54x10⁻⁷ 15.88 3:36 268,500 21.56 22.63 21.08 22.17 5.72x10⁻⁷ 16.07 3:43 269,000 21.89 22.78 21.31 22.43 6.01x10⁻⁷ 16.26
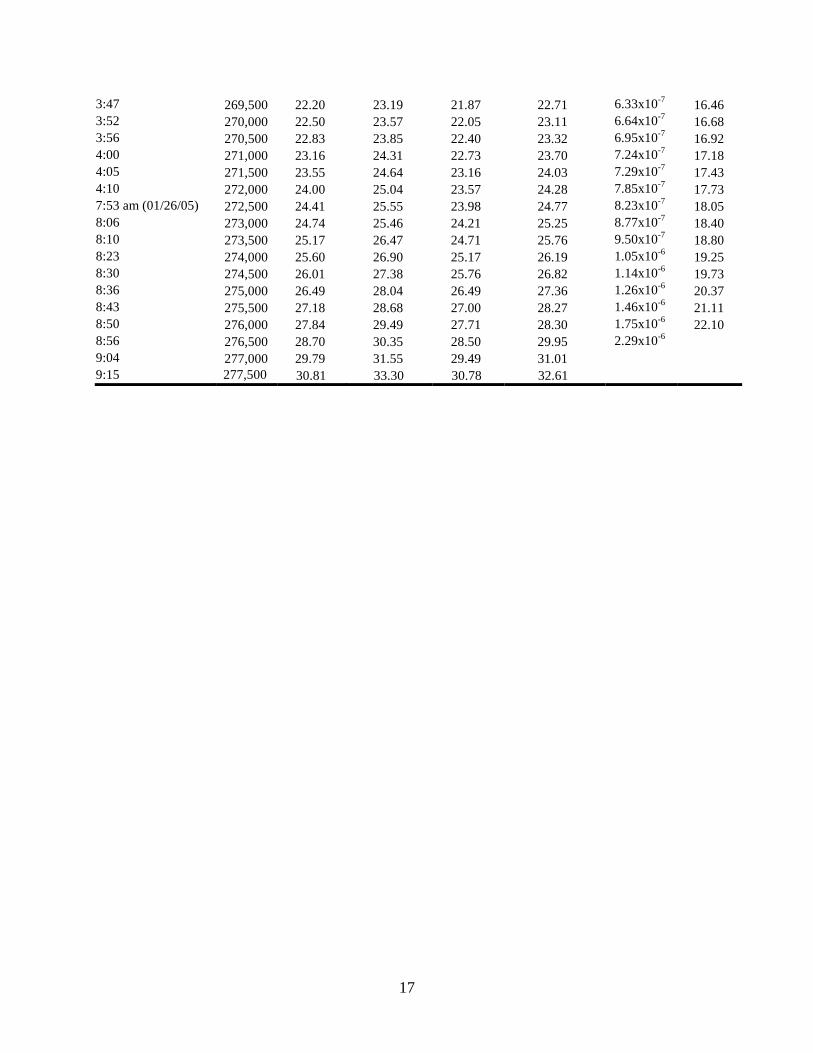
17
3:47 269,500 22.20 23.19 21.87 22.71 6.33x10⁻⁷ 16.46 3:52 270,000 22.50 23.57 22.05 23.11 6.64x10⁻⁷ 16.68 3:56 270,500 22.83 23.85 22.40 23.32 6.95x10⁻⁷ 16.92 4:00 271,000 23.16 24.31 22.73 23.70 7.24x10⁻⁷ 17.18 4:05 271,500 23.55 24.64 23.16 24.03 7.29x10⁻⁷ 17.43 4:10 272,000 24.00 25.04 23.57 24.28 7.85x10⁻⁷ 17.73 7:53 am (01/26/05) 272,500 24.41 25.55 23.98 24.77 8.23x10⁻⁷ 18.05 8:06 273,000 24.74 25.46 24.21 25.25 8.77x10⁻⁷ 18.40 8:10 273,500 25.17 26.47 24.71 25.76 9.50x10⁻⁷ 18.80 8:23 274,000 25.60 26.90 25.17 26.19 1.05x10⁻⁶ 19.25 8:30 274,500 26.01 27.38 25.76 26.82 1.14x10⁻⁶ 19.73 8:36 275,000 26.49 28.04 26.49 27.36 1.26x10⁻⁶ 20.37 8:43 275,500 27.18 28.68 27.00 28.27 1.46x10⁻⁶ 21.11 8:50 276,000 27.84 29.49 27.71 28.30 1.75x10⁻⁶ 22.10 8:56 276,500 28.70 30.35 28.50 29.95 2.29x10⁻⁶ 9:04 277,000 29.79 31.55 29.49 31.01 9:15 277,500 30.81 33.30 30.78 32.61
18
Table A6. Fatigue crack growth rate data for specimen AL-2-28 of 2024-T351 Al.
Specimen: AL-2-28 Frequency: 5 Hz R = 0.1 B = 9.65 mm W = 100.41 mm Pmax = 71.41 N Pmin = 7.141 N Initial notch length (2a): 20.29 mm Time & Date ∆a front ∆a back da/dN ∆K hours : minutes (date/note)
Total Cycles left (mm) right (mm) left (mm) right (mm) (meter/cycle) (MPa m1/2)
9:27 am (02/07/05) 4,000 0.15 0.13 0.15 9:37 6,000 0.53 0.43 0.33 0.56 9:46 8,000 1.04 0.97 0.84 1.07 9:52 9,000 1.35 1.30 1.12 1.30 3.01x10⁻⁷ 12.91 9:59 10,000 1.57 1.57 1.52 1.57 3.26x10⁻⁷ 13.12 10:05 11,000 2.03 1.96 1.80 1.88 3.45x10⁻⁷ 13.33 10:11 12,000 2.34 2.34 2.21 2.26 3.59x10⁻⁷ 13.57 10:17 13,000 2.79 2.69 2.57 2.57 3.66x10⁻⁷ 13.80 10:24 14,000 3.12 3.15 2.87 2.97 3.72x10⁻⁷ 14.03 10:31 15,000 3.43 3.56 3.18 3.40 3.78x10⁻⁷ 14.26 10:38 16,000 3.89 3.89 3.51 3.71 3.90x10⁻⁷ 14.50 10:44 17,000 4.14 4.45 3.91 4.19 4.11x10⁻⁷ 14.74 10:52 18,000 4.52 4.78 4.37 4.57 4.46x10⁻⁷ 15.00 10:58 19,000 4.98 5.28 4.70 5.08 4.89x10⁻⁷ 15.29 11:04 20,000 5.46 5.66 5.26 5.69 5.45x10⁻⁷ 15.60 11:09 20,500 5.72 6.12 5.51 5.94 5.71x10⁻⁷ 15.78 11:13 21,000 6.05 6.32 5.79 6.25 5.89x10⁻⁷ 15.97 11:18 21,500 6.32 6.71 6.07 6.53 6.00x10⁻⁷ 16.16 12:30 pm 22,000 6.65 7.06 6.40 6.78 6.11x10⁻⁷ 16.35 12:34 22,500 6.88 7.29 6.76 7.16 6.23x10⁻⁷ 16.55 12:37 23,000 7.24 7.52 7.06 7.42 6.31x10⁻⁷ 16.75 12:41 23,500 7.62 7.92 7.39 7.72 6.49x10⁻⁷ 16.95 12:45 24,000 7.90 8.20 7.77 8.03 6.75x10⁻⁷ 17.16 12:49 24,500 8.20 8.61 8.10 8.31 6.98x10⁻⁷ 17.38 12:53 25,000 8.64 8.92 8.48 8.66 7.21x10⁻⁷ 17.61 12:56 25,500 9.04 9.30 8.89 8.97 7.38x10⁻⁷ 17.86 1:00 26,000 9.37 9.68 9.27 9.32 7.64x10⁻⁷ 18.10 1:05 26,500 9.91 10.06 9.63 9.70 8.06x10⁻⁷ 18.35 1:09 27,000 10.31 10.29 9.96 10.08 8.61x10⁻⁷ 18.62 1:13 27,500 10.64 10.87 10.36 10.62 9.14x10⁻⁷ 18.92 1:17 28,000 11.15 11.35 10.92 11.13 9.39x10⁻⁷ 19.24 1:20 28,200 11.46 11.46 11.07 11.35 9.03x10⁻⁷ 19.38 1:23 28,400 11.56 11.61 11.23 11.53 8.95x10⁻⁷ 19.51 1:26 28,600 11.73 11.71 11.46 11.68 9.11x10⁻⁷ 19.62 1:29 28,800 11.86 11.86 11.71 11.91 9.65x10⁻⁷ 19.74 1:32 29,000 11.96 12.09 11.94 12.09 1.03x10⁻⁶ 19.89 1:34 29,200 12.24 12.29 12.14 12.37 1.09x10⁻⁶ 20.04 1:37 29,400 12.50 12.57 12.37 12.52 1.11x10⁻⁶ 20.21 1:41 29,600 12.67 12.78 12.57 12.75 1.11x10⁻⁶ 20.37 1:44 29,800 12.83 13.13 12.78 13.08 1.11x10⁻⁶ 20.53 1:50 30,000 13.00 13.34 13.03 13.18 1.10x10⁻⁶ 20.69 1:55 30,200 13.21 13.59 13.23 13.36 1.14x10⁻⁶ 20.85 1:58 30,400 13.59 13.79 13.46 13.59 1.15x10⁻⁶ 21.02 2:02 30,600 13.84 14.07 13.59 13.74 1.21x10⁻⁶ 21.19
19
2:05 30,800 14.15 14.33 13.87 14.00 1.27x10⁻⁶ 21.38 2:09 31,000 14.30 14.53 14.17 14.22 1.32x10⁻⁶ 21.57 2:11 31,200 14.53 14.88 14.43 14.55 1.39x10⁻⁶ 21.78 2:14 31,400 14.88 15.16 14.73 14.81 1.43x10⁻⁶ 22.00 2:17 31,600 15.11 15.54 14.99 15.04 1.48x10⁻⁶ 22.24 2:20 31,800 15.49 15.75 15.34 15.37 1.53x10⁻⁶ 22.47 2:23 32,000 15.82 16.08 15.60 15.57 1.58x10⁻⁶ 22.72 2:26 32,200 16.23 16.36 15.93 15.88 1.61x10⁻⁶ 22.99 2:29 32,400 16.56 16.71 16.21 16.31 1.62x10⁻⁶ 23.26 2:31 32,600 16.87 17.20 16.48 16.61 1.69x10⁻⁶ 23.53 2:35 32,800 17.20 17.40 16.81 16.92 1.74x10⁻⁶ 23.82 2:38 33,000 17.58 17.70 17.15 17.20 1.82x10⁻⁶ 24.12 2:41 33,200 17.96 18.16 17.58 17.65 1.91x10⁻⁶ 24.45 2:44 33,400 18.26 18.49 18.01 18.11 2.05x10⁻⁶ 24.81 2:50 33,600 18.69 18.82 18.49 18.57 2.14x10⁻⁶ 25.20 2:53 33,800 19.15 19.25 18.87 18.90 2.21x10⁻⁶ 25.61 2:57 34,000 19.61 19.76 19.33 19.46 2.27x10⁻⁶ 26.06 3:00 34,200 20.09 20.24 19.69 19.94 2.41x10⁻⁶ 26.51 3:03 34,400 20.57 20.80 20.14 20.45 2.60x10⁻⁶ 27.00 3:07 34,600 20.93 21.21 20.62 20.88 2.88x10⁻⁶ 27.55 3:15 34,800 21.59 21.89 21.39 21.44 3.34x10⁻⁶ 28.20 3:19 34,900 21.87 22.23 21.72 21.89 3.54x10⁻⁶ 28.58 3:22 35,000 22.20 22.73 22.05 22.17 3.77x10⁻⁶ 29.03 3:27 35,100 22.68 23.14 22.35 22.58 3.99x10⁻⁶ 29.48 3:33 35,200 23.01 23.50 22.68 23.06 4.33x10⁻⁶ 29.96 3:36 35,300 23.29 23.95 23.22 23.55 4.85x10⁻⁶ 30.52 3:39 35,400 23.62 24.61 23.70 23.95 5.47x10⁻⁶ 31.17 3:44 35,500 24.38 25.12 24.28 24.64 6.44x10⁻⁶ 31.98 3:48 (unclamped) 35,550 25.60 24.56 24.99 7.44x10⁻⁶ 32.44 8:12 am (02/08/05) 35,600 25.96 24.92 25.37 8.58x10⁻⁶ 32.96 8:40 35,650 26.29 25.35 8.25x10⁻⁶ 33.66 9:04 35,700 26.70 25.68 9.81x10⁻⁶ 34.42 9:24 35,750 27.20 26.04 1.12x10⁻⁵ 35.31 9:32 35,800 27.91 26.67 1.41x10⁻⁵ 36.53 9:49 35,850 28.78 27.43 9:56 35,900 29.57 27.99 10:03 35,950 31.09 29.29
REPORT DOCUMENTATION PAGE Form ApprovedOMB No. 0704-0188
2. REPORT TYPE
Technical Memorandum 4. TITLE AND SUBTITLE
7075-T6 and 2024-T351 Aluminum Alloy Fatigue Crack Growth Rate Data
5a. CONTRACT NUMBER
6. AUTHOR(S)
Forth, Scott C.; Wright, Christopher W.; and Johnston, William M., Jr.
7. PERFORMING ORGANIZATION NAME(S) AND ADDRESS(ES)
NASA Langley Research CenterHampton, VA 23681-2199
9. SPONSORING/MONITORING AGENCY NAME(S) AND ADDRESS(ES)
National Aeronautics and Space AdministrationWashington, DC 20546-0001
8. PERFORMING ORGANIZATION REPORT NUMBER
L-19163
10. SPONSOR/MONITOR'S ACRONYM(S)
NASA
13. SUPPLEMENTARY NOTESLangley Research Center: Forth and Wright; Lockheed Martin Corporation: JohnstonAn electronic version can be found at http://ntrs.nasa.gov
12. DISTRIBUTION/AVAILABILITY STATEMENTUnclassified - UnlimitedSubject Category 26Availability: NASA CASI (301) 621-0390
19a. NAME OF RESPONSIBLE PERSON
STI Help Desk (email: [email protected])
14. ABSTRACT
Experimental test procedures for the development of fatigue crack growth rate data has been standardized by the American Society for Testing and Materials. Over the past 30 years several gradual changes have been made to the standard without rigorous assessment of the affect these changes have on the precision or variability of the data generated. Therefore, the ASTM committee on fatigue crack growth has initiated an international round robin test program to assess the precision and variability of test results generated using the standard E647-00. Crack growth rate data presented in this report, in support of the ASTM roundrobin, shows excellent precision and repeatability.
15. SUBJECT TERMS
2024-T351; 7075-T6; Alloy; Aluminum; Crack; Fatigue; Growth; Data; Rate
18. NUMBER OF PAGES
24
19b. TELEPHONE NUMBER (Include area code)
(301) 621-0390
a. REPORT
U
c. THIS PAGE
U
b. ABSTRACT
U
17. LIMITATION OF ABSTRACT
UU
Prescribed by ANSI Std. Z39.18Standard Form 298 (Rev. 8-98)
3. DATES COVERED (From - To)
5b. GRANT NUMBER
5c. PROGRAM ELEMENT NUMBER
5d. PROJECT NUMBER
5e. TASK NUMBER
5f. WORK UNIT NUMBER
23-064-30-24
11. SPONSOR/MONITOR'S REPORT NUMBER(S)
NASA/TM-2005-213907
16. SECURITY CLASSIFICATION OF:
The public reporting burden for this collection of information is estimated to average 1 hour per response, including the time for reviewing instructions, searching existing data sources, gathering and maintaining the data needed, and completing and reviewing the collection of information. Send comments regarding this burden estimate or any other aspect of this collection of information, including suggestions for reducing this burden, to Department of Defense, Washington Headquarters Services, Directorate for Information Operations and Reports (0704-0188), 1215 Jefferson Davis Highway, Suite 1204, Arlington, VA 22202-4302. Respondents should be aware that notwithstanding any other provision of law, no person shall be subject to any penalty for failing to comply with a collection of information if it does not display a currently valid OMB control number.PLEASE DO NOT RETURN YOUR FORM TO THE ABOVE ADDRESS.
1. REPORT DATE (DD-MM-YYYY)
08 - 200501-
Related Documents