THREE ESSAYS IN EXECUTIVE COMPENSATION by RANDY EARL BEAVERS DOUGLAS O. COOK, COMMITTEE CO-CHAIR H. SHAWN MOBBS, COMMITTEE CO-CHAIR DAVID C. CICERO JUNSOO LEE THOMAS J. LOPEZ A DISSERTATION Submitted in partial fulfillment of the requirements for the degree of Doctor of Philosophy in the Department of Economics, Finance, and Legal Studies in the Graduate School of The University of Alabama TUSCALOOSA, ALABAMA 2015

Welcome message from author
This document is posted to help you gain knowledge. Please leave a comment to let me know what you think about it! Share it to your friends and learn new things together.
Transcript
THREE ESSAYS IN
EXECUTIVE
COMPENSATION
by
RANDY EARL BEAVERS
DOUGLAS O. COOK, COMMITTEE CO-CHAIR
H. SHAWN MOBBS, COMMITTEE CO-CHAIR
DAVID C. CICERO
JUNSOO LEE
THOMAS J. LOPEZ
A DISSERTATION
Submitted in partial fulfillment of the requirements
for the degree of Doctor of Philosophy
in the Department of Economics, Finance, and Legal Studies
in the Graduate School of
The University of Alabama
TUSCALOOSA, ALABAMA
2015

Copyright Randy Earl Beavers 2015
ALL RIGHTS RESERVED
ii
ABSTRACT
In essay one, we examine overconfident CEO-directors and find they attend more board
meetings, are more active in nominating committees, and have more independent directorships.
Attendance is higher when multiple overconfident directors are present on the board. When an
overconfident board selects a new CEO after a CEO turnover, they are more likely to appoint a
better prepared and more reputable CEO. Overconfident boards are also more likely to select an
overconfident CEO. We also find overconfident boards exacerbate the restrained use of debt when
an overconfident CEO is present, and we find evidence that the association between CEO-directors
and greater CEO pay is driven solely by overconfident CEO-directors on the board. This evidence
indicates overconfident CEO-directors exhibit significant influence on the board and over the
firm’s CEO.
In essay two, I analyze the CEO incentives of inside debt in the form of deferred equity
compensation in the context of M&A decisions. CEO inside debt holdings are negatively
associated with the likelihood of the firm engaging in an M&A. When firms with higher levels of
CEO inside debt decide to engage in an acquisition, those acquisitions are non-diversifying,
relatively smaller deals, and are paid using a greater portion of stock. The evidence indicates that
inside debt incentivizes CEOs to make less risky decisions for the benefit of debt holders and at
the expense of shareholders.
In essay three, I analyze both CEO inside debt and firm debt jointly to further investigate
compensation incentives of risky decision-making and the resulting financial policy decisions
concerning the debt structure of the firm. I find larger firms with high CEO inside debt tend to

iii
diversify, as calculated by the Herfindahl-Hirschman index of debt type usage. These types of
firms use a higher percentage of term loans and other debt but a lower percentage of drawn credit
lines and commercial loans. Larger firms with high CEO inside debt have lower interest rates on
these debt instruments and shorter maturities, suggesting a more conservative financing policy
with regards to debt.

iv
LIST OF ABBREVIATIONS, ACRONYMS, AND SYMBOLS
= Equal to
> Greater than
< Less than
CEO Chief Executive Officer
M&A Mergers and Acquisitions
P-value Chance an effect exists
R2 R-squared
SEC Securities and Exchange Commission
T-stat T-statistic from the Student’s t-distribution
Z-stat Z-statistic from the Normal distribution

v
ACKNOWLEDGMENTS
I thank seminar participants at the University of Alabama and across the nation for their
helpful suggestions and comments. I personally thank Shawn Mobbs, my dissertation chair, for
his long hours of advising and support throughout this process. I thank my committee, Doug
Cook, David Cicero, Junsoo Lee, and Tom Lopez for their contributions to this work and service
on my behalf.
I thank my family and friends for their love and support throughout this long process.
They are the reason why I chose to start this pursuit and was able to finish.
Finally, I thank my Lord and Savior Jesus Christ, who gives me the strength to do all
things for His glory.

vi
CONTENTS
ABSTRACT ................................................................................................ ii
LIST OF ABBREVIATIONS, ACRONYMS, AND SYMBOLS ............ iv
ACKNOWLEDGMENTS ...........................................................................v
LIST OF TABLES ................................................................................... viii
LIST OF FIGURES .....................................................................................x
1. INTRODUCTION ...................................................................................1
2. DIRECTOR OVERCONFIDENCE ........................................................3
2.1. Introduction ...........................................................................................3
2.2. Related Literature and Hypothesis ........................................................8
2.3. Sample Selection, Data Description, and Methodology .....................12
2.3.1. Sample Selection and Data Description ...........................................12
2.3.2. Research Design and Variable Definitions ......................................12
2.3.2.1. Dependent Variables .....................................................................12
2.3.2.2. Independent Variables of Interest .................................................13
2.3.2.3. Control Variables ..........................................................................13
2.4. Empirical Results ................................................................................14
2.4.1. Summary Statistics...........................................................................15
2.4.2. Director Level: CEO-Director Overconfidence ...............................20
2.4.3. Director Level: Multiple Overconfident Directors ..........................31
2.4.4. Firm Level: Board Overconfidence .................................................34
2.5. Robustness Checks..............................................................................43

vii
2.6. Other Tests ..........................................................................................43
2.7. Conclusion ..........................................................................................47
REFERENCES ..........................................................................................49
APPENDIX ................................................................................................55
3. CEO LONG-TERM INCENTIVE PAY IN
MERGERS & ACQUISITIONS............................................................57
3.1. Introduction .........................................................................................57
3.2. Literature Review and Hypothesis Development ...............................62
3.3. Data and Methodology ........................................................................65
3.4. Empirical Results ................................................................................78
3.5. Robustness ..........................................................................................88
3.6. Conclusion ..........................................................................................98
REFERENCES ........................................................................................101
APPENDIX ..............................................................................................106
4. CEO INSIDE DEBT AND FIRM DEBT ............................................109
4.1. Introduction .......................................................................................109
4.2. Literature Review and Hypothesis Development .............................113
4.3. Data and Methodology ......................................................................116
4.4. Empirical Results ..............................................................................125
4.5. Robustness ........................................................................................148
4.6. Conclusion ........................................................................................149
REFERENCES ........................................................................................150
APPENDIX ..............................................................................................153
5. CONCLUSION ....................................................................................155

viii
LIST OF TABLES
2.1 Independent Director-Level Summary Statistics .................................16
2.2 Firm-Level Summary Statistics ...........................................................21
2.3 Board Attendance.................................................................................23
2.4 Committee Participation ......................................................................26
2.5 Number of Independent Directorships .................................................32
2.6 Multiple Overconfident Directors’ Effect on Board Attendance .........35
2.7 Board CEO Selection Preferences .......................................................37
2.8 Propensity-Score Matching Model ......................................................39
2.9 Matched Sample Regressions of Board CEO Selection Preferences...42
2.10 Overconfidence and Net Debt Issues .................................................45
2.11 Overconfidence and Salary ................................................................46
3.1 Summary Statistics...............................................................................70
3.2 Merger Likelihood Association with CEO Inside Debt .......................79
3.3 Diversification and Acquirer Inside Debt ............................................84
3.4 Stock Payment in the Presence of CEO Inside Debt ...........................86
3.5 Deal Value in the Presence of Inside CEO Debt .................................89
3.6 Models with Inside Debt Indicators .....................................................92
3.7 Risk and Return from M&A ................................................................94

ix
3.8 Association between Acquisition Activity and Inside Debt ................96
3.9 Association between Capital Expenditures and Inside Debt ...............97
3.10 Effort and Inside Debt ........................................................................99
4.1 Summary Statistics.............................................................................120
4.2 Supply Side Factors of Debt Specialization.......................................124
4.3 Inside Debt Effect on Debt Specialization .........................................126
4.4 Inside Debt Effect on Commercial Paper Usage ...............................129
4.5 Inside Debt Effect on Drawn Credit Line Usage ...............................131
4.6 Inside Debt Effect on Term Loan Usage ...........................................134
4.7 Inside Debt Effect on Bond Usage.....................................................136
4.8 Inside Debt Effect on Commercial Loan Usage ................................141
4.9 Inside Debt Effect on Other Debt Usage ...........................................143
4.10 CEO Inside Debt and Debt Interest Rates ........................................146
4.11 CEO Inside Debt and Debt Maturity ...............................................147

x
LIST OF FIGURES
3.1 Number of Mergers by Year ................................................................77

1
CHAPTER 1
INTRODUCTION
This dissertation provides three essays in the executive compensation space. The first essay
relates director and board behavior with overconfidence, measured by the timing, exercise, and
purchase of options and stock, respectively. The second essay provides a link between long-term
incentive pay (deferred equity compensation) and the investment decision of a merger and
acquisition. The third essay discusses debt financing policy and the CEO’s inside debt, defined as
the total deferred compensation from bonus pay and future retirement payments from pension
plans.
The first paper discusses CEO-director overconfidence. CEOs tend to be overconfident
about their abilities in their main role. Does their overconfident behavior also influence their
actions outside their own firm? As directors they provide monitoring and advisory services for
shareholders of other public firms. In this paper we examine independent directors who are also
CEOs (CEO-directors) and specifically compare those CEO-directors who are overconfident with
those who are not (diffident).
The second paper shows a relationship between long-term incentive pay and mergers and
acquisitions. Long-term incentive payouts (LTIP) encompass 60% or more of a median S&P 500
CEO’s compensation package. These conditional company shares are distributed in two parts. The
CEO receives half of the shares immediately, followed by the remainder three years later. The
CEO receives this portion only if he remains with the company, and the company continues to
exist. One of the main differences between deferred equity compensation and pension plans is

2
what occurs in the event of bankruptcy. The CEO receives a percentage of his pension upon
company bankruptcy, but the deferred equity compensation value becomes zero since the
remaining portion of shares becomes worthless.
The third paper relates inside debt and debt financial policy. Structures of the firm and how
they translate to the real world have been of interest to academicians and regulators for years. I
exploit a new database, Capital IQ, to breakdown the components of total debt, into commercial
paper, drawn credit lines, senior and subordinated bonds and notes, term loans, and capital leases.
Another structure crucial to understanding firm decisions involves executive compensation.
Specifically, inside debt is of particular interest since the SEC mandated disclosure of this type of
compensation since 2006. Inside debt is the total pension value from defined benefit retirement
plans and deferred compensation from bonus payouts. For example, a CEO may receive a
$500,000 bonus, but she will not receive it immediately. She may receive it over 5 years, yielding
$100,000 a year. However, if she is fired before the five years is over, she will lose any
compensation due to her, similar to a bondholder whose firm has gone bankrupt.
The remainder of this dissertation is broken down by essay. Chapter 2 examines director
overconfidence. Chapter 3 discusses CEO long-term incentive pay in mergers and acquisitions.
Chapter 4 analyzes CEO inside debt and firm debt. Chapter 5 concludes.
3
CHAPTER TWO
DIRECTOR OVERCONFIDENCE
2.1. Introduction
Independent directors who are also the CEO of another firm, CEO-directors, are important
monitoring and advisory components of many public boards. Hallock (1997) finds interlocked
CEOs receive higher pay and lead larger firms. Fahlenbrach, Minton, and Pan (2011) find firms
with directors who are former CEOs have higher ROA. However, there can be important
differences among CEOs, which can impact their performance as directors. Recent research
reveals a difference in CEO overconfidence1 is associated with significant differences in an
executive’s decision making as a CEO (e.g. investment decisions, (Malmendier and Tate (2005));
equity issuance, (Malmendier, Tate, and Yan (2008)); and innovation (Hirshleifer and Teoh
(2012)). Because directors are appointed for their decision management skills (Fama and Jensen
(1983)) differences in overconfidence, which affects decision-making, can also be associated with
important differences in CEO-directors that can be vital to shareholders. In this paper, we examine
overconfident CEO-directors relative to other independent CEO-directors.
We start by identifying all independent CEO-directors in the Risk Metrics director database
for the years 1996 to 2011. Then we identify those CEO-directors who are overconfident following
Malmendier and Tate (2005)2 and define a board as being overconfident if at least one independent
1 We follow Malmendier and Tate (2005) in defining confidence versus optimism. Confidence refers to one’s own
abilities and personal outcomes. Optimism refers to outcomes beyond one’s control. Overestimation of these
outcomes leads to overconfidence and overoptimism, respectively. 2 A CEO is considered overconfident is at least one of the following three indicator variables is true: Holder67, where
the CEO holds an option with a moneyness of 67% or more after 5 years; Longholder, where the CEO holds an option
with a moneyness of 40% or more in its final year of expiration; or Net Buyer, where the CEO holds more company
stock than he did five years prior. We use this measure of overconfidence since it is not correlated with CEO market
timing. According to Malmendier and Tate (2005), less than half of overconfident CEOs beat the market by waiting

4
director is an overconfident CEO-director. At the director level we find evidence that
overconfident CEO-directors miss fewer meetings than other directors and exhibit a significantly
greater likelihood of serving on the nominating committee relative to other CEO-directors. This is
consistent with their overconfidence driving these directors to be more involved wherever they
serve. In addition, we find evidence that overconfident directors can have a positive influence on
other board members. Specifically, we find attendance is higher when multiple overconfident
directors are present on the board. Relatedly, we also find strong evidence of a greater demand for
these director’s services, as they serve on significantly more boards than other CEO-directors.
Next, we examine an important board level decision, CEO-selection3, and find
overconfident boards are more likely to select better known and more reputable CEOs. We find
overconfident CEO-directors are more likely to hire an insider, someone with prior experience as
a CEO or someone holding a directorship. In each case, there is more easily accessible information
on the new CEO making the hire less risky.
We also find overconfident boards are more likely to select an overconfident CEO. Given
the recent literature on overconfident CEOs, we examine whether overconfident boards
complement or substitute for overconfident CEOs. Malmendier et al. (2011) find overconfident
CEOs use less external financing relative to their peers. After controlling for a CEO’s
overconfidence, the board’s overconfidence, and the interaction between the two, we find
overconfident boards decrease external financing when an overconfident CEO is in power. Thus,
to exercise. The overconfident CEOs would have been better off exercising their options and investing the proceeds
in the S&P500. 3 See Mace (1971), Vancil (1987), Warner, Watts and Wruck (1988), Weisbach (1988), Yermack (1996), Denis, Denis
and Sarin (1997), Parrino (1997), Hermalin and Weisbach (2000), Huson, Parrino and Starks (2001), Dayha,
McConnell and Travlos (2002), Fee and Hadlock (2003), Huson, Malatesta and Parrino (2004), Adams, Hermalin and
Weisbach (2008), Mobbs (2012), and Mobbs and Raheja (2012).

5
overconfident boards with overconfident CEOs provide a complementary effect that can
exacerbate one potentially adverse effect of CEO overconfidence.
Finally, we extend early findings on CEO-directors and examine the association with CEO-
directors (Hallock (1997)) and firm CEO salary levels. Fahlenbrach et al. (2010) find CEOs receive
a higher salary if a CEO from another firm is on her company’s board. After distinguishing CEO-
directors based on their overconfidence, we find this effect primarily comes from overconfident
CEO-directors.
Endogeneity is mitigated since overconfidence is a trait, which may not be known by the
board at the time of the director’s nomination. In fact, Malmendier and Tate (2005) state
overconfidence is “harder to identify ex ante.” However, in our case, the overconfidence trait is
possibly revealed in the director’s actions where they serve as a CEO. The board nominating them
as a director therefore, may have observed the revelation of the overconfidence trait. Due to this
possibility, we take additional steps to address this possible endogeneity. Specifically, we use
propensity-score matching to test differences in similar firms whose main difference is the
presence of the overconfident CEO-director. This approach allows us to compare firms with an
overconfident director to firms that are similar in multiple dimensions except they do not have an
overconfident director.
In summary, our findings suggest overconfidence is associated with greater board activity
and diligence in CEO selections, both of which suggest overconfident CEO-directors can be
valuable board members. Our findings shed new light on the recent literature on executive
overconfidence and reveal one avenue in which overconfidence is valuable. This is important since
the prior literature is mixed as to whether overconfident CEOs are beneficial or detrimental to their
firms. For example, positive aspects of overconfidence include being more responsive to cash flow

6
(Malmendier and Tate (2005)), generating a potential higher return to shareholders (Goel and
Thakor (2008)), and exploiting innovation through research and development (Hirshleifer et al.
(2012)). Negative effects of overconfidence involve investment distortion (Malmendier and Tate
(2005), Goel and Thakor (2008)), engagement in value-destroying mergers and acquisitions
(Malmendier and Tate (2008)), contracts with high risk compensation incentives (Gervais et al.
(2011)), and suboptimal external financing (Malmendier and Tate (2011)).
These new insights also make several contributions to the corporate governance literature.
Prior studies, starting with the ground-breaking work of Malmendier and Tate (2005, 2008), have
gone in-depth with the agency conflicts of overconfidence and its effect on CEO behavior with the
firm. However, no empirical study has analyzed overconfident CEO-directors and their actions on
boards. Recent theoretical and empirical work has examined a board’s relation with an
overconfident CEO. Goel and Thakor (2005) provide a theoretical model showing boards fire
excessively diffident or overconfident CEOs. Goel and Thakor (2008) theoretically show CEOs
should be fired if they are extremely diffident or overconfident. Campbell et al. (2011) theoretically
show and find boards fire CEOs with extremely low or high optimism. Sironi and Suntheim (2012)
find active boards reduce bank firm risk during the financial crisis if their CEO was classified as
overconfident.
We also contribute to the literature on CEO-directors by finding significant differences in
CEO-directors based on whether or not they are overconfident. Hallock (1997) finds CEO-
directors manage larger firms and receive larger pay for directorship participation. Other studies
find firm value is enhanced with the addition of a CEO-director (Fahlenbrach et al. 2011) and is
diminished upon death or retirement (Nguyen and Nielsen (2010), Fracassi and Tate (2012)). Our

7
finding that overconfident CEO-directors are more active and in more demand than other CEO-
directors highlights new and important differences among CEO-directors.
Our findings also contribute to the recent literature that examines individual director
characteristics beyond their classification as independent. Recent literature has discovered
important differences among inside directors (Masulis and Mobbs (2011) and Mobbs (2013)) and
independent directors based on reputation (Masulis and Mobbs (2014a,b), busyness (Fich and
Shivdasani (2006)), financial expertise (DeFond, Hann, and Hu (2005)), and social ties to the CEO
(Hwang and Kim (2009)).
Finally, these findings contribute to the large psychology literature concerning
overconfidence4 by examining how individual overconfident directors act (Alicke (1995), Svenson
(1981), and Weinstein (1980)) and how they contribute to group decision making by the board of
directors. Our finding of higher board attendance among overconfident CEO-directors is consistent
with the psychology research which finds overconfident individuals like to be in control (Alicke
(1985)). In addition, our finding of overconfident CEO-directors making safer CEO decisions is
consistent with their being more risk-averse than anticipated (Moore (1977)), especially when the
outcome is out of their hands as is the case with the performance of a newly selected CEO.
Relatedly, our finding of overconfident boards preferring safer CEO choices is consistent with
Russo and Schoemaker (1992), who find groups of overconfident individuals make better
decisions than an overconfident individual.
Our findings contribute to the growing literature in executive overconfidence. Using a
tournament approach, Banerjee et al. (2014) find overconfident executives are more likely to be
4 The psychology literature measures overconfidence as extreme outliers from results of surveys about ratings,
questions, and decisions in experimental settings. In the finance literature, we are able to identify overconfidence
based on actual decisions about stock and option purchases and exercises, respectively.

8
promoted internally when the hiring company is large and less risky as measured by the standard
deviation of stock returns. They also find that newly selected overconfident CEOs improve
performance after their appointments. Using our director sample, we find overconfident boards are
more likely to select a new CEO who is overconfident. Our results complement their finding by
showing the board’s composition affects the likelihood that an overconfident executive is selected.
The remainder of the paper is organized as follows: In Section 2.2, we review the
relevant literature and develop the main testable hypotheses. We follow with a description of the
sample data and methodology employed in the analysis in Section 2.3. Section 2.4 presents and
discusses the results of our main empirical tests on the independent CEO-directors and boards.
We conduct a series of robustness checks in Section 2.5. Section 2.6 demonstrates how CEO-
director overconfidence affects prior results in the literature. Section 2.7 concludes.
2.2. Related Literature and Hypothesis
In addition to decisions within their own firm, many CEOs also serve as independent
directors in other firms (e.g. Hallock (1997), Fracassi and Tate (2012) and Fahlenbrach et al.
(2011)). While their responsibilities as a director are different from those as a CEO, their
personality traits, such as overconfidence, carry over and can influence their behavior as a
director.
Malmendier and Tate (2005) find overconfident CEOs exhibit distinctly different behavior
relative to other CEOs. For example, they find overconfident CEOs overinvest when retained
earnings are high and underinvest when external financing is necessary. Since their pioneering
work, additional research finds overconfident CEOs issue relatively less equity (Malmendier and
Tate 2011) and make value-destroying acquisitions (Malmendier and Tate 2008). Goel and
Thakor (2008) predict overconfident CEOs invest less in producing information, and excessively

9
overconfident managers overinvest in projects which lead to lower firm value. Other research
documents positive aspects of overconfident CEOs, which find they exploit growth
opportunities, achieve higher innovation (Hirshleifer, Low, and Teoh (2012)), exhibit more
conservative financing polices (Banerjee, Humphery-Jenner, and Nanda (2013)) and are less
likely to engage in large accounting changes when coming in as a new CEO (Burg, Pierk, and
Scheinart (2013)). As expected, excessive confidence in one’s own ability leads CEOs to make
significantly different decisions.
Prior research in the field of psychology reveals overconfidence is associated with an
individual’s belief they are better than the average person (e.g. Svenson (1981)) and have a
greater sense of and need for being in control (e.g. Weinstein (1980)). CEOs naturally have
control in their firm, by the nature of their title and their role as the voice of the company;
however, as a director they are a member of team of other directors. To the degree
overconfidence is a personality trait of the individual executive and not just a characteristic of
the CEO position, we expect overconfident CEO-directors to exhibit different actions compared
to other directors, especially other non-overconfident CEO-directors. Specifically, their desire
for greater control can drive them to take a more active role in board meetings. Sniezek and
Zarnoth (1997) find individuals with more confidence are indeed more active decision makers
in a group. Adams and Ferreira (2009) and Masulis and Mobbs (2014a) show board meeting
attendance and committee membership are associated with a director’s level of effort and
activity in a given directorship. Our first set of hypotheses concerning effort follow:
Hypothesis 1: Overconfident directors are more active in board meetings.
Hypothesis 1a: Overconfident directors miss fewer board meetings.

10
Hypothesis 1b: Overconfident directors are more likely to be involved in the
most active committees, such as the audit or nominating
committee.
To the degree overconfidence leads to a greater exertion of director effort and activity
their services are likely to be in greater demand by other boards as shareholders desire more
active directors. Moreover, overconfident directors can facilitate better board functionality.
According to Barney and Busenitz (1997), “Overconfidence may be particularly beneficial in
implementing a specific decision and persuading others to be enthusiastic about it as well.”
Finally, by serving with other directors in a group setting, the negative aspects associated with
overconfidence are mitigated (e.g. Moore (1997), Sniezek (1992), Weinstein (1980), Miller and
Ross (1975) and Russo and Schoemaker (1992)). As a result, the greater demand for their
director services will result in overconfident directors holding more outside directorships
relative to other CEO-directors, which leads to our next hypothesis.
Hypothesis 2: Overconfident directors are in greater demand for board seat positions.
CEO selection is arguably the most important decision boards have to make (e.g. Shleifer
and Vishny (1997)). A director’s overconfidence can influence his actions during the CEO
selection, which has important implications for shareholders since shareholders experience
negative consequences if directors make poor decisions based on irrational assessments of their
own abilities (e.g. Larwood and Whittaker (1977) and Moore (1977)). Because the literature on
overconfident CEOs clearly reveals significantly different decision making compared to non-
overconfident CEOs (e.g. Malmendier and Tate (2005), Goel and Thakor (2008), Hirschleifer
et al. (2012)), it follows that overconfident directors likely make significantly different decisions
compared to other directors. Moreover, because overconfident people make the decision for a
11
group; overconfident directors, in turn, will have greater influence on the board (Sniezek and
Zarnoth (1997)), which makes them an even more important director on the board.
We know from the psychology literature that overconfident individuals have more
certainty about their decisions and thus expect their actions to produce success (Miller and Ross
(1975)) and that overconfident managers quickly implement decisions, despite their reluctance
to incorporate new information (Barney and Busenitz (1997)). However, group decisions are less
overconfident than individual decisions (Russo and Schoemaker (1992)), thus serving on the
board of directors, rather than serving as the sole decision maker, can mitigate the likelihood of
poor choices arising from a CEO’s overconfidence. This idea aligns with the theoretical
prediction from Goel and Thakor (2008), who note overconfident CEOs invest less in gathering
information. Together, this prior research on overconfident decision making in a group setting
implies boards with an overconfident director are more inclined to make safer CEO choices that
require less effort to uncover additional information, such as insiders, same industry, etc. These
decisions require less information since these candidates are well-known relative to outsiders, or
those from a different industry, etc. Generally speaking, directors have greater confidence in
overconfident CEOs (Goel and Thakor (2005)), and they tend to promote overconfident
executives more often (Banerjee et al. (2014)). We expect overconfident directors to be even
more inclined to support executives who are overconfident like themselves (Sniezek and Zarnoth
(1997)). Thus, our final set of hypotheses about decision-making follows, where an
overconfident board has at least one overconfident CEO-director.
Hypothesis 3: Overconfident boards make safer CEO replacement decisions.
Hypothesis 3a: Overconfident boards prefer inside CEO replacements.
Hypothesis 3b: Overconfident boards prefer prior CEOs with greater
reputation.

12
Hypothesis 3c: Overconfident boards prefer prior CEOs similar in nature to
their composition, i.e. overconfident.
2.3. Sample Selection, Data Description, and Methodology
2.3.1. Sample Selection and Data Description
Our sample period is from 1996 to 2011. Data for our sample come from firm-years
and director-years common in the following databases: Center for Research in Securities Prices
(CRSP), Compustat, Execucomp, and Risk Metrics. Stock and accounting data for our sample
come from CRSP and Compustat, respectively. We collect data on CEO compensation from the
Execucomp database. Director data come from the Risk Metrics database. Because we are
interested in the monitoring role of the board, we focus on only the independent directors on
the board. Our final sample includes 114,052 independent director-year observations for
20,527 firm-years. Of these director observations, 17,776 are CEO-directors.
2.3.2. Research Design and Variable Definitions
We describe the empirical proxies employed in the analysis in this subsection. We then
define the control variables.
2.3.2.1. Dependent Variables
The dependent variables at the director level include board attendance, number of
independent directorships, directorships dropped, and committee participation. Board attendance
is measured by an indicator if the director attended less than 75% of all board meetings during a
year. The number of independent directorships is the count of directorships held, excluding the
directorship at the firm where the director is simultaneously the CEO. Directorships dropped is
one if the director’s number of independent directorships is less than the prior year or zero
otherwise. Committee participation is split into three indicators for membership on the audit,
compensation, and nominating committees, respectively.

13
The dependent variables at the firm level include CEO tenure, CEO overconfidence, firm
value, insider CEO, same-industry CEO, and the number of independent directorships. CEO
tenure is the length of time in years the director has served at the current firm as CEO. CEO
overconfidence is an indicator if the firm’s CEO is overconfident. Tobin’s Q is the sum of market
capitalization, short-term liabilities, and long-term liabilities over the sum of stockholder’s
equity, short-term liabilities, and long-term liabilities. Insider CEO is an indicator if the CEO
was an executive of the firm before becoming CEO within two years prior to his appointment.
Same-industry CEO indicates the CEO was employed within the same industry as the firm in
which he is now a CEO.
2.3.2.2. Independent Variables of Interest
We define overconfidence using the three measures used in Malmendier and Tate (2005,
2008). They are: holder67, longholder, and net buyer. Holder67 equals one if the CEO holds
options for more than five years with a moneyness of 67% or greater. Longholder equals one if
the CEO holds an option until the last year before expiration with moneyness of 40% or greater.
Net buyer equals one if the CEO holds relatively more stock when compared to his stock position
five years prior. At the director level, a CEO-director is considered overconfident if any of the
three indicators equals one5. At the firm level, a board is considered overconfident if any of its
CEO-directors are considered overconfident in that firm-year.
2.3.2.3. Control Variables
We use numerous control variables in our analysis to account for other boards, CEOs,
and firm characteristics. We also include industry dummies at the two-digit SIC level and year
5 We assume the character trait of overconfidence does not change once it is identified. Overconfidence changes
only if a catastrophic event occurs, such as the firing of a CEO.

14
dummies. The following is a brief description of the control variables in our dataset. These
variables are defined in the Appendix.
Board size is the number of directors on the board. Leverage is defined as total assets over
stockholder’s equity. Age is the age of the director in years. Percent ownership is the percentage
of shares owned relative to total firm shares. Female is an indicator if the director is a female.
Segments are the number of firm business segments. R&D / Assets are the research and
development expense scaled by firm assets as a measure of investment. Research and development
expense is set to zero if missing. Firm size is measured by the natural log of assets. Maximum
board tenure is the largest board tenure of a director on the current year’s board of directors. Audit
membership indicates if the director is a member on the audit committee. Compensation
membership indicates if the director is a member on the compensation committee. Nominating
membership indicates if the director is a member on the nomination committee. ROA is return on
asset defined as industry-adjusted net income scaled by total assets. Firm age is the number of
years the firm has had data available in Compustat. Service indicates if the firm has a Fama-French
industry code of 7, 11, 33, 34, or 44. Volatility is the standard deviation of monthly stock returns
from the previous three years. Manufacturing indicates if the firm has a Fama-French industry
code of 2-5, 8-10, 12-17, 19-26, 35, or 37-40. The Herfindahl index is the sum of squared
percentage of industry sales of all firms in the same industry. The homogeneity index is the Parrino
(1997) mean partial correlation proxy for industry similarity.
2.4. Empirical Results
In this section, we present summary statistics in Section 4.1 and examine CEO-director
overconfidence in Section 4.2. Finally, in Section 4.3, we examine board overconfidence.

15
2.4.1. Summary Statistics
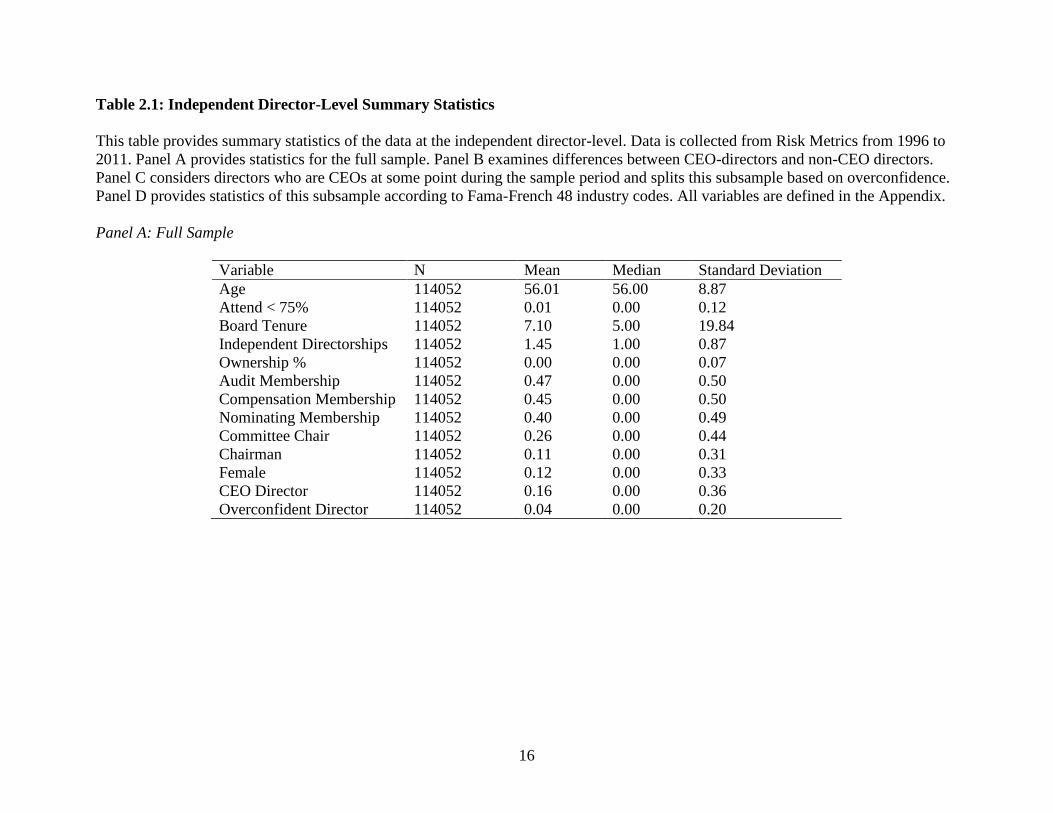
We begin with director-level summary statistics in Table 2.1. Panel A presents results for
the full sample of independent directors. The average director is 56 years old, has board tenure
of 7 years, and has 1.45 total directorships. The average independent director is also a member
of the audit, compensation and nominating committee 47%, 45%, and 40% of the time,
respectively. Twenty-six percent of these directors serve as a chairman on one of these
committees. Eleven percent of the directors serve as Chairman of the Board. Twelve percent are
female and 4% are overconfident.
Panel B considers the directors who are CEOs. CEO-directors comprise 16% of the
independent directors. CEO-directors are vastly different than non-CEO directors. CEO-directors
tend to be younger, attend more board meetings, have lower board tenure, and are more likely to
be Chairman.
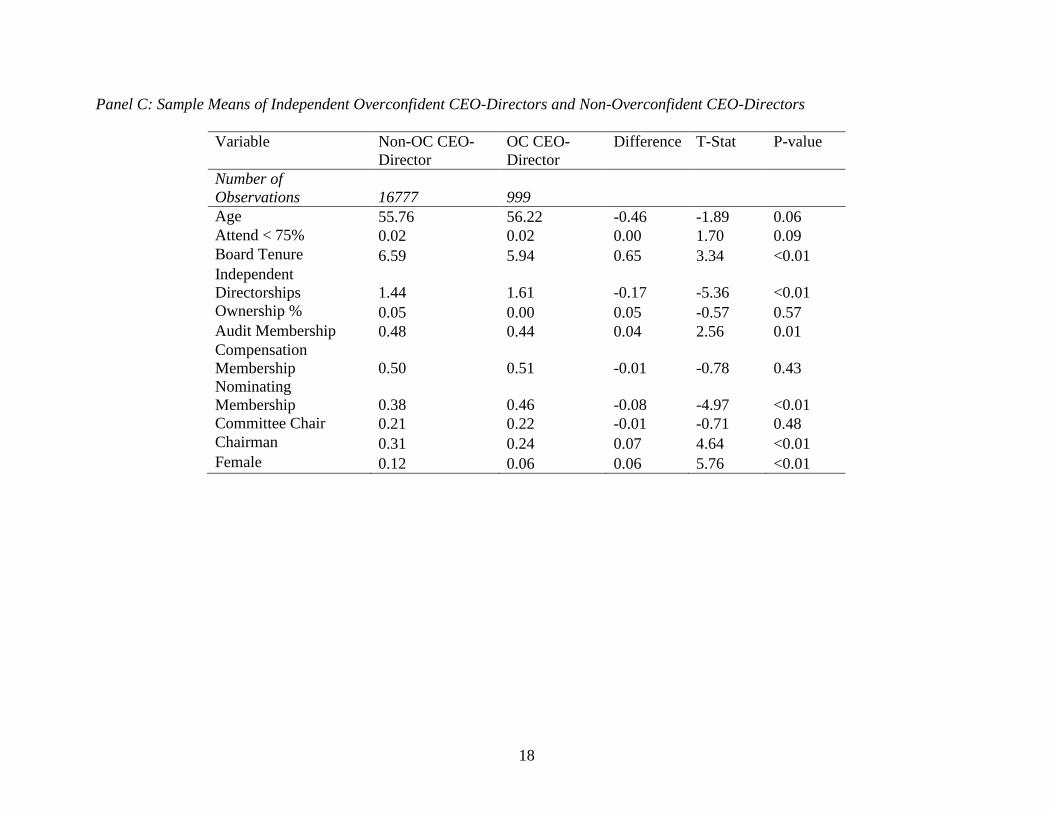
Panel C considers the overconfidence of CEO-directors. Of the CEO-directors, 6% are
considered overconfident. The differences between overconfident and diffident CEO-directors
are noticeable. Overconfident directors tends to be older, have more directorships, are more likely
to be members of the nominating committees, and are less likely to be female.
Panel D provides a breakdown of directorships and overconfidence by industry. Industries
with the largest amount of CEO-directors include chemicals, ship and railroad equipment,
business supplies, and shipping containers. Industries with the smallest amount of CEO-directors
include trading, tobacco products, and real estate. Industries with the largest amount of
overconfident CEO-directors include ship and railroad equipment, real estate, and mining.
According to our measurements of overconfidence, industries with no overconfident CEO-
directors include agriculture, candy and soda, beer and liquor, tobacco products,
16
Table 2.1: Independent Director-Level Summary Statistics
This table provides summary statistics of the data at the independent director-level. Data is collected from Risk Metrics from 1996 to
2011. Panel A provides statistics for the full sample. Panel B examines differences between CEO-directors and non-CEO directors.
Panel C considers directors who are CEOs at some point during the sample period and splits this subsample based on overconfidence.
Panel D provides statistics of this subsample according to Fama-French 48 industry codes. All variables are defined in the Appendix.
Panel A: Full Sample
Variable N Mean Median Standard Deviation
Age 114052 56.01 56.00 8.87
Attend < 75% 114052 0.01 0.00 0.12
Board Tenure 114052 7.10 5.00 19.84
Independent Directorships 114052 1.45 1.00 0.87
Ownership % 114052 0.00 0.00 0.07
Audit Membership 114052 0.47 0.00 0.50
Compensation Membership 114052 0.45 0.00 0.50
Nominating Membership 114052 0.40 0.00 0.49
Committee Chair 114052 0.26 0.00 0.44
Chairman 114052 0.11 0.00 0.31
Female 114052 0.12 0.00 0.33
CEO Director 114052 0.16 0.00 0.36
Overconfident Director 114052 0.04 0.00 0.20

17
Panel B: Sample Means of Independent CEO-Directors and Non-CEO Directors
Variable Non-CEO
Director
CEO-Director Difference T-Stat P-value
Number of
Observations 96276 17776
Age 56.05 55.78 0.27 3.66 <0.01
Attend < 75% 0.01 0.02 -0.01 -9.91 <0.01
Board Tenure 7.20 6.55 0.65 4.00 <0.01
Independent
Directorships 1.45 1.45 0.00 0.38 0.70
Ownership % 0.00 0.00 0.00 2.25 0.02
Audit Membership 0.47 0.48 -0.02 -3.96 <0.01
Compensation
Membership 0.44 0.50 -0.06 -15.19 <0.01
Nominating
Membership 0.40 0.39 0.01 2.91 <0.01
Committee Chair 0.27 0.21 0.06 16.77 <0.01
Chairman 0.07 0.31 -0.23 -65.72 <0.01
Female 0.12 0.11 0.01 3.70 <0.01
18
Panel C: Sample Means of Independent Overconfident CEO-Directors and Non-Overconfident CEO-Directors
Variable Non-OC CEO-
Director
OC CEO-
Director
Difference T-Stat P-value
Number of
Observations 16777 999
Age 55.76 56.22 -0.46 -1.89 0.06
Attend < 75% 0.02 0.02 0.00 1.70 0.09
Board Tenure 6.59 5.94 0.65 3.34 <0.01
Independent
Directorships 1.44 1.61 -0.17 -5.36 <0.01
Ownership % 0.05 0.00 0.05 -0.57 0.57
Audit Membership 0.48 0.44 0.04 2.56 0.01
Compensation
Membership 0.50 0.51 -0.01 -0.78 0.43
Nominating
Membership 0.38 0.46 -0.08 -4.97 <0.01
Committee Chair 0.21 0.22 -0.01 -0.71 0.48
Chairman 0.31 0.24 0.07 4.64 <0.01
Female 0.12 0.06 0.06 5.76 <0.01

19
Panel D: Directorships and Overconfidence by Industry
Industry N
CEO-
Director
OC
Director Industry N
CEO-
Director
OC
Director
Agriculture 38 0.32 0
Ship & Railroad
Equipment 37 0.68 0.3
Food Products 401 0.51 0.03 Defense 86 0.36 0.03
Candy & Soda 56 0.35 0 Precious Metals 38 0.76 0
Beer & Liquor 70 0.66 0 Mining 78 0.56 0.13
Tobacco Products 44 0.2 0 Coal 39 0.46 0
Recreation 106 0.39 0.01
Petroleum & Natural
Gas 790 0.46 0.03
Entertainment 139 0.21 0 Utilities 1267 0.46 0.03
Printing & Publishing 178 0.48 0.01 Communication 384 0.53 0.04
Consumer Goods 375 0.61 0.04 Personal Services 228 0.42 0.02
Apparel 296 0.34 0.04 Business Services 1855 0.37 0.02
Healthcare 308 0.3 0.01 Computers 660 0.39 0.02
Medical Equipment 544 0.38 0.02 Electronic Equipment 1240 0.36 0.03
Pharmaceutical Products 686 0.33 0.02
Measuring & Control
Equipment 434 0.45 0.01
Chemicals 585 0.69 0.05 Business Supplies 399 0.68 0.04
Rubber & Plastic
Products 111 0.52 0.06 Shipping Containers 95 0.68 0.01
Textiles 118 0.3 0.04 Transportation 539 0.42 0.03
Construction Materials 426 0.5 0.04 Wholesale 669 0.43 0.02
Construction 258 0.31 0.03 Retail 1342 0.39 0.03
Steel Works Etc. 341 0.51 0.05
Restaurants, Hotels, &
Motels 390 0.35 0.01
Fabricated Products 35 0.43 0 Banking 1417 0.4 0.03
Machinery 815 0.61 0.04 Insurance 923 0.42 0.05
Electrical Equipment 230 0.52 0.08 Real Estate 21 0.24 0.14
Automobiles & Trucks 364 0.49 0.04 Trading 712 0.16 0.03
Aircraft 154 0.75 0.06 Other 136 0.34 0.05

20
entertainment, fabricated products, precious metals, and coal. Due to the variation across industry,
we will include industry fixed effects or an industry homogeneity index (Parrino (1997)) in all
regressions.
Table 2.2 Panel A provides firm-level statistics. In our sample of 20,527 firm-years, the
average firm has assets of 15 billion, sales of 6 billion, a market cap of 8 billion, leverage of 0.19,
six business segments, and Tobin’s Q of 1.70. The average R&D investment level is around 3%.
ROA is slightly positive during the sample period. The average firm is 27 years old with 10
members of the board. 69% of the board directors are independent. Nineteen percent of the
boards and 2% of the CEOs are overconfident. Comparing to Malmendier and Tate (2005), they
find at least 13% of their CEOs are overconfident. These large differences are likely due to our
larger Execucomp sample from 1996 to 2011 versus their hand-collected sample of 477 large
U.S. companies from 1980 to 1994.
Table 2.2 Panel B splits the firms by board overconfidence. Overconfident boards manage
older firms with higher assets, sales, market cap, number of business segments, and ROA.
Investment is lower for overconfident boards, which have more independent members. Eight
percent of overconfident boards have an overconfident CEO.
2.4.2. Director Level: CEO-Director Overconfidence In this section, we examine CEO-director overconfidence on several dependent variables.
We employ the general model in equation (1) below to investigate the effect of independent
director overconfidence:
Dep Var = a0 + a1 (OC Director) + A2 (Controls) + ε (1)
Table 2.3 provides regressions of board attendance, where the dependent variable is an
indicator if the CEO-director attended less than 75% of board meetings. In Models 1 and 4 we

21
Table 2.2: Firm-Level Summary Statistics
This table provides summary statistics at the firm-level. Data is collected from Compustat from 1996 to 2011. Panel A describes the
full sample. Panel B splits the sample based on board overconfidence. All variables are defined in the Appendix.
Panel A: Full Sample
Variable N Mean Median Standard Deviation
Total Assets 20527 15007.08 1946.00 80645.26
Sales 20527 5806.32 1440.74 17420.35
Market Cap 20527 8091.58 1736.72 25061.67
Leverage 20527 0.19 0.16 0.17
Number of Segments 20527 6.02 3.00 5.63
Tobin’s Q 20527 1.70 1.29 1.58
R&D / Assets 20527 0.03 0.00 0.06
Stock Return 20527 0.53 0.00 13.83
ROA 20527 0.04 0.04 0.15
Firm Age 20527 26.81 22.00 16.59
Board Size 20527 9.52 9.00 2.79
% Independent 20527 0.69 0.71 0.17
Overconfident Board 20527 0.19 0.00 0.39
Overconfident Firm CEO 20527 0.02 0.00 0.12
% Director Ownership 20527 0.00 0.00 0.00

22
Panel B: Sample Means Split by Board Overconfidence
Variable Non-OC
Board
OC Board Difference T-Stat P-value
Number of Observations 16710 3817
Total Assets 10413.3 35117.6 -24704.3 -10.40 <0.01
Sales 4338.2 12233.4 -7895.2 -17.81 <0.01
Market Cap 6039.9 17073.2 -11033.2 -16.84 <0.01
Leverage 0.19 0.20 -0.01 -3.42 <0.01
Number of Segments 5.81 6.92 -1.11 -10.10 <0.01
Tobin’s Q 1.72 1.62 0.10 3.45 <0.01
R&D / Assets 0.03 0.02 0.01 6.55 <0.01
Stock Return 0.55 0.42 0.13 0.52 0.61
ROA 0.03 0.04 -0.01 -3.42 <0.01
Firm Age 24.99 34.76 -9.77 -31.16 <0.01
Board Size 9.24 10.73 -1.50 -29.64 <0.01
% Independent 0.67 0.77 -0.10 -32.79 <0.01
Overconfident CEO 0.00 0.08 -0.08 -18.18 <0.01
Overconfident Director Count 0.00 1.16 -1.14 -57.67 <0.01
% Director Ownership 0.00 0.00 0.00 5.48 <0.01

23
Table 2.3: Board Attendance
This table provides logistic regressions of board attendance. The dependent variable is an indicator if the director attended less than
75% of board meetings. Models 1-3 are for the full sample. Models 4 -6 only includes CEO-directors. The main independent variable
of interest is Overconfident Director, which indicates if the director is overconfident. All other controls are defined in the appendix.
All models use heteroskedastic-robust standard errors clustered by director in brackets. All models include industry-fixed effects at the
two-digit SIC level. Significance is indicated at the 10%, 5%, and 1% level by stars (*,**,***), respectively.
Model 1 Model 2 Model 3 Model 4 Model 5 Model 6
OC Director -0.546*** -0.585*** -0.570*** -0.481* -0.491* -0.474*
[0.169] [0.167] [0.167] [0.269] [0.268] [0.268]
CEO Director 0.760*** 0.733*** 0.752***
[0.065] [0.066] [0.067]
Busy 0.292*** 0.239*** 0.243*** 0.183 0.178 0.181
[0.083] [0.084] [0.084] [0.157] [0.157] [0.158]
Age 0 -0.001 -0.001 -0.017** -0.017** -0.018**
[0.004] [0.004] [0.004] [0.008] [0.008] [0.008]
Audit Membership -0.641*** -0.531*** -0.508*** -0.215* -0.193 -0.185
[0.062] [0.064] [0.064] [0.117] [0.120] [0.120]
Compensation Membership -0.381*** -0.269*** -0.253*** -0.073 -0.052 -0.042
[0.063] [0.068] [0.068] [0.118] [0.120] [0.121]
Nominating Membership -0.683*** -0.590*** -0.565*** -0.288** -0.270** -0.258**
[0.067] [0.073] [0.073] [0.113] [0.117] [0.119]
CEO Ownership -1.533 -0.717 -0.859 0.217 0.277 0.013
[1.452] [0.669] [0.784] [0.834] [0.731] [1.038]
Female -0.308*** -0.345*** -0.332*** -0.226 -0.238 -0.251
[0.099] [0.099] [0.099] [0.183] [0.182] [0.179]
Board Size 0.064*** 0.070*** 0.016 0.018
[0.010] [0.010] [0.020] [0.020]
Board Tenure -0.021*** -0.019*** -0.007 -0.006
[0.006] [0.006] [0.009] [0.009]
Leverage 0.642*** 0.952**
[0.209] [0.408]

24
Tobin's Q -0.009 -0.03
[0.028] [0.048]
Segments -0.020*** -0.011
[0.007] [0.015]
R&D / Assets 1.142*** -0.582
[0.360] [0.955]
ROA -0.224*** -0.206
[0.079] [0.174]
Constant -3.087*** -3.716*** -3.634*** -2.566*** -2.693*** -2.700***
[0.495] [0.538] [0.545] [0.629] [0.648] [0.680]
Observations 112007 112007 112004 16780 16780 16778
Pseudo R2 0.05 0.05 0.06 0.03 0.03 0.03
F-test of OC Director + CEO Director = 0 143.55*** 133.18*** 136.11***

25
include only director characteristics. In Models 2 and 5 we introduce additional board
characteristics and in models 3 and 6 we include firm characteristics. We find in the first three
models for the full sample that overconfidence leads directors to miss fewer board meetings.
Conversely, non-overconfident CEO-directors miss more meetings. In Models 1 and 2, the
coefficient for overconfident CEO-directors decreases from -0.55 to -0.59, respectively, as more
board controls are added. According to Model 3, the average overconfident CEO-director is 0.5%
more likely to attend 75% or more of the meetings. On average, the predicted likelihood of missing
75% or more of the meetings is 0.8%. Thus, this finding marginally contributes to our
understanding of board attendance.
We also find evidence consistent with prior studies that busy directors and directors who
are also a CEO in another firm miss significantly more meetings, consistent with their additional
responsibilities distracting them from their director responsibilities. However, when a CEO
director is also overconfident, our evidence suggests that these directors actually do not miss more
meeting as do other CEO-directors, but instead we find the opposite effect. We consider the
subsample of CEO-directors in the final three models. We continue to find evidence (at the 10%
level) that overconfident CEO-directors are less likely to miss board meetings relative to non-
overconfident CEO-directors. Thus, the overconfidence effect in the full sample is not being driven
by the non CEO-directors. This evidence reveals one important difference between overconfident
and non-overconfident directors is their level of activity on the board.
Next, we examine another measure of board involvement, committee membership. Table
2.4 provides logistic models of committee participation. Models 1-3 consider the full sample of
independent directors. Models 4-6 only consider CEO-directors. Models 1 and 4 only include

26
Table 2.4: Committee Participation
This table provides logistic regressions of committee participation. Panels A, B, and C provide regressions for audit committee
membership, compensation committee membership, and nominating committee membership, respectively. Models 1-3 use the full
sample. Models 4-6 restrict the sample to CEO-directors. The main independent variable of interest is Overconfident Director, which
indicates if the director is overconfident. All other controls are defined in the appendix. All models use heteroskedastic-robust
standard errors clustered by director in brackets. All models include industry-fixed effects at the two-digit SIC level. Significance is
indicated at the 10%, 5%, and 1% level by stars (*,**,***), respectively.
Panel A: Audit Committee Participation
Model 1 Model 2 Model 3 Model 4 Model 5 Model 6
OC Director -0.102** -0.026 -0.043 -0.104 -0.065 -0.064
[0.045] [0.046] [0.046] [0.094] [0.093] [0.094]
CEO Director 0.151*** 0.183*** 0.112***
[0.025] [0.025] [0.025]
Busy -0.169*** -0.077*** -0.104*** -0.209*** -0.139* -0.130*
[0.028] [0.028] [0.029] [0.072] [0.074] [0.074]
Age -0.007*** -0.001 0 -0.004 0.001 0.001
[0.001] [0.001] [0.001] [0.003] [0.003] [0.003]
CEO Ownership -0.726* -0.858 -0.97 -0.282 -0.598 -0.602
[0.434] [0.651] [0.902] [1.010] [1.807] [1.847]
Female -0.064** 0.007 -0.009 -0.055 0.002 0.009
[0.029] [0.030] [0.030] [0.070] [0.071] [0.071]
SOX 0.542*** 0.501*** 0.427*** -0.300*** -0.319*** -0.314***
[0.018] [0.018] [0.020] [0.040] [0.040] [0.042]
Board Size -0.126*** -0.132*** -0.115*** -0.111***
[0.004] [0.004] [0.010] [0.010]
Leverage -0.017 -0.151
[0.064] [0.150]
Tobin's Q 0.180*** 0.014
[0.010] [0.014]
Segment 0.025*** 0.005

27
[0.002] [0.004]
R&D / Assets -1.653*** -0.991**
[0.214] [0.448]
Log (Assets) 0.008 -0.029*
[0.007] [0.017]
ROA -0.476*** 0.14
[0.074] [0.122]
Constant 0.081 1.100*** 0.561*** -0.188 0.810* 1.021**
[0.228] [0.204] [0.214] [0.465] [0.432] [0.452]
Observations 112390 112390 112387 17562 17562 17560
Pseudo R2 0.02 0.04 0.05 0.02 0.03 0.04

28
Panel B: Compensation Committee Participation
Model 1 Model 2 Model 3 Model 4 Model 5 Model 6
OC Director 0.038 0.113** 0.119*** 0.063 0.09 0.092
[0.045] [0.045] [0.046] [0.093] [0.094] [0.095]
CEO Director 0.339*** 0.374*** 0.322***
[0.025] [0.025] [0.025]
Busy 0.108*** 0.203*** 0.203*** 0.146** 0.197*** 0.199***
[0.028] [0.029] [0.029] [0.069] [0.071] [0.071]
Age -0.002** 0.004*** 0.004*** -0.003 0.001 0.001
[0.001] [0.001] [0.001] [0.003] [0.003] [0.003]
CEO Ownership 0.255** 0.263*** 0.264*** -1.658 -2.373 -2.184
[0.106] [0.096] [0.088] [1.743] [2.147] [2.056]
Female -0.218*** -0.154*** -0.159*** -0.361*** -0.325*** -0.319***
[0.029] [0.029] [0.029] [0.072] [0.072] [0.072]
SOX 0.549*** 0.509*** 0.475*** -0.152*** -0.167*** -0.158***
[0.019] [0.019] [0.020] [0.040] [0.040] [0.042]
Board Size -0.121*** -0.115*** -0.081*** -0.078***
[0.004] [0.005] [0.009] [0.010]
Leverage -0.009 -0.237
[0.065] [0.150]
Tobin's Q 0.165*** 0.018
[0.010] [0.013]
Segment 0.021*** -0.002
[0.002] [0.004]
R&D / Assets -1.517*** 0.106
[0.243] [0.381]
Log (Assets) -0.031*** -0.01
[0.007] [0.017]
ROA -0.361*** 0.162
[0.062] [0.115]
Constant -0.629*** 0.329 0.09 0.032 0.764** 0.870**
[0.225] [0.241] [0.249] [0.346] [0.332] [0.353]
Observations 112390 112390 112387 17567 17567 17565
Pseudo R2 0.02 0.04 0.04 0.01 0.02 0.02

29
Panel C: Nominating Committee Participation
Model 1 Model 2 Model 3 Model 4 Model 5 Model 6
OC Director 0.078* 0.119** 0.095** 0.256*** 0.266*** 0.239***
[0.046] [0.046] [0.047] [0.090] [0.090] [0.090]
CEO Director 0.147*** 0.165*** 0.128***
[0.026] [0.026] [0.026]
Busy 0.262*** 0.313*** 0.285*** 0.482*** 0.501*** 0.477***
[0.030] [0.030] [0.031] [0.072] [0.072] [0.073]
Age 0.004*** 0.007*** 0.006*** 0.006** 0.007** 0.007**
[0.001] [0.001] [0.001] [0.003] [0.003] [0.003]
CEO Ownership 0.037 0.047 0.075 -1.068 -1.247 -0.831
[0.084] [0.084] [0.081] [1.265] [1.567] [1.001]
Female 0.088*** 0.125*** 0.110*** 0.114 0.129* 0.119*
[0.029] [0.030] [0.030] [0.071] [0.072] [0.072]
SOX 1.423*** 1.403*** 1.345*** 0.758*** 0.754*** 0.690***
[0.022] [0.023] [0.024] [0.044] [0.044] [0.047]
Board Size -0.068*** -0.079*** -0.030*** -0.047***
[0.004] [0.005] [0.009] [0.010]
Leverage 0.179*** -0.136
[0.067] [0.156]
Tobin's Q 0.081*** -0.023
[0.010] [0.016]
Segment 0.012*** 0.010**
[0.002] [0.004]
R&D / Assets -1.239*** -0.301
[0.223] [0.435]
Log (Assets) 0.029*** 0.043**
[0.008] [0.018]
ROA 0.134** 0.643***
[0.059] [0.210]
Constant -2.293*** -1.691*** -2.115*** -0.945*** -0.669* -0.917**
[0.225] [0.234] [0.239] [0.348] [0.363] [0.382]
Observations 112372 112372 112369 17562 17562 17560
Pseudo R2 0.07 0.08 0.08 0.04 0.04 0.04

30
director controls. Models 2 and 5 include board size, and Models 3 and 6 include all regressors,
including firm controls.
In Panel A the dependent variable is membership on the audit committee. We find a
negative but insignificant relationship between director overconfidence and audit committee
participation across all models. In Panel B we report results when the dependent variable equals
one if the director is a compensation committee member. We find some evidence of overconfident
directors being more likely to serve on the board’s compensation committee, specifically, in
models 2 and 3. In Panel C we report results for when the dependent variable equals one if the
independent director serves on the nominating committee. In all specification, we find a positive
and significant coefficient estimate for overconfident directors. This is an interesting result, given
the nominating committee’s role in effecting the future composition of the board and in selecting
important firm executives.
Turning to the other controls, we find CEO-Directors are more likely to participate in all
three of these key committees. Busy directors (Fich and Shivdasani (2006)) are less likely to
participate in audit committees but more likely to participate in compensation and nominating
committees. In addition, post-Sarbanes-Oxley, independent directors increase participation on all
three of these key committees. Thus far, the evidence in Tables 3 and 4 suggests that overconfident
directors are active on the boards where they serve as independent directors. They attend meetings
and participate in important committees. Thus, their greater effort can increase their value as
directors for shareholders in other firms. Next, we consider this hypothesis more directly by
examining the demand for their director services.

31
Table 2.5 provides Tobit1 regressions concerning the count of the number of independent
directorships held by the CEO-director in the current year. We modify the general equation (1) by
including additional controls: board tenure, and indicators for audit, compensation, and nomination
committee memberships. Models 1-3 consider the full sample; Models 4-6 only use the CEO-
director subsample. Models 1 and 4 only include director controls. Models 2 and 5 add board
controls, and Models 3, 6, and 7 include all regressors, including firm controls. In all specifications,
we find a statistically positive relationship between CEO-director overconfidence and the number
of independent directorships at the 1% level. This is consistent with overconfident CEO-directors
being more valuable in the director labor market, perhaps due to their reputation for being an active
participant on the boards where they serve. Model 7 includes a logistic regression with busy as the
dependent variable. We find statistically similar results. Generally, across all models, the number
of outside directorships is also higher for directors who are older, busy, members of the nominating
committee, females, on larger boards, and at larger firms. The number of outside directorships is
lower for directors at firms whose CEOs have lower ownership, after the Sarbanes-Oxley Act, and
for those with longer board tenures. We also test these using Poisson and OLS specifications and
find statistically similar results.
2.4.3. Director Level: Multiple Overconfident Directors
In the previous sections, the evidence indicates that overconfident directors behave
differently from other directors. In this section, we examine whether their overconfidence can affect
the actions of other directors on their board. Specifically, we examine director attendance when
there are multiple overconfident directors present. This aspect is important since group influence
increases as members’ confidence increases (Sniezek and Zarnoth (1997)). “Overconfidence may
1 We censor the lower limit at one since all directors in our sample have at least one directorship.

32
Table 2.5: Number of Independent Directorships
This table provides analysis of the number of independent directorships. For Tobit Models 1-6, the dependent variable is the number
of independent directorships held in the current year. The dependent variable in logistic Model 7 is “busy,” indicating if the director
has three or more independent directorships. Models 1-3 and Model 7 include the full sample. Models 4-6 only include CEO-directors.
The main independent variable of interest is Overconfident Director, which indicates if the director is overconfident. All other controls
are defined in the appendix. All models use heteroskedastic-robust standard errors clustered by director in brackets. All models
include industry-fixed effects at the two-digit SIC level. Significance is indicated at the 10%, 5%, and 1% level by stars (*,**,***),
respectively.
Model 1 Model 2 Model 3 Model 4 Model 5 Model 6 Model 7
OC Director 0.299*** 0.268*** 0.202*** 0.378*** 0.360*** 0.324*** 0.390***
[0.033] [0.033] [0.033] [0.065] [0.065] [0.066] [0.080]
CEO Director -0.003 -0.021 -0.060*** -0.293***
[0.019] [0.019] [0.019] [0.046]
Busy 3.342*** 3.303*** 3.225*** 3.408*** 3.383*** 3.318***
[0.034] [0.034] [0.033] [0.085] [0.085] [0.082]
Age 0.010*** 0.009*** 0.009*** 0.004* 0.003 0.002 0.019***
[0.001] [0.001] [0.001] [0.002] [0.002] [0.002] [0.002]
Audit Membership -0.048*** 0.012 0.005 -0.044 0.007 0.012 -0.043
[0.013] [0.013] [0.013] [0.033] [0.034] [0.033] [0.030]
Compensation Membership -0.048*** 0.015 0.019 0.055* 0.102*** 0.110*** 0.200***
[0.014] [0.014] [0.014] [0.033] [0.033] [0.033] [0.030]
Nominating Membership 0.097*** 0.139*** 0.130*** 0.055* 0.079** 0.070** 0.261***
[0.014] [0.014] [0.014] [0.033] [0.034] [0.033] [0.031]
CEO Ownership -2.523*** -1.749*** -1.040** -9.909** -7.859** -5.277* -3.713**
[0.656] [0.582] [0.446] [4.015] [3.385] [2.722] [1.837]
Female 0.211*** 0.178*** 0.143*** 0.165*** 0.138** 0.107* 0.512***
[0.024] [0.024] [0.024] [0.061] [0.061] [0.061] [0.053]
SOX -0.094*** -0.064*** -0.173*** -0.153*** -0.138*** -0.239*** -0.804***
[0.017] [0.017] [0.017] [0.034] [0.034] [0.036] [0.038]
Board Size 0.049*** 0.017*** 0.051*** 0.019*** 0.026***
[0.003] [0.003] [0.006] [0.007] [0.006]

33
Board Tenure -0.011*** -0.011*** -0.009*** -0.008*** -0.014***
[0.001] [0.001] [0.003] [0.003] [0.003]
Leverage 0.068 0.043 -0.032
[0.049] [0.122] [0.109]
Tobin's Q 0.012** -0.016 0.040***
[0.005] [0.011] [0.011]
Segments 0 -0.001 0.002
[0.001] [0.003] [0.003]
R&D / Assets 0.022 -0.042 -0.935**
[0.147] [0.334] [0.365]
Log (Assets) 0.133*** 0.139*** 0.353***
[0.006] [0.014] [0.013]
ROA -0.029 -0.135 -0.104
[0.038] [0.092] [0.088]
Constant -0.271 -0.757*** -1.702*** 0.294 -0.297 -1.289*** -6.978***
[0.207] [0.225] [0.247] [0.329] [0.310] [0.325] [0.354]
Observations 112390 112390 112387 17567 17567 17565 112164
Pseudo R2 0.25 0.26 0.26 0.25 0.26 0.26 0.09

34
be particularly beneficial in implementing a specific decision and persuading others to be
enthusiastic about it as well (Barney and Busenitz (1997)).”
We test this by using a multivariate conditional logistic model in order to incorporate firm
fixed effects since we are interested in the within firm variation in attendance conditioning on the
presence of multiple overconfident directors. As a result of the firm fixed effect we lose a large
number of observations of firms that do not experience any variation in the presence of multiple
overconfident directors. Table 2.6 reports the results with standard errors robust to
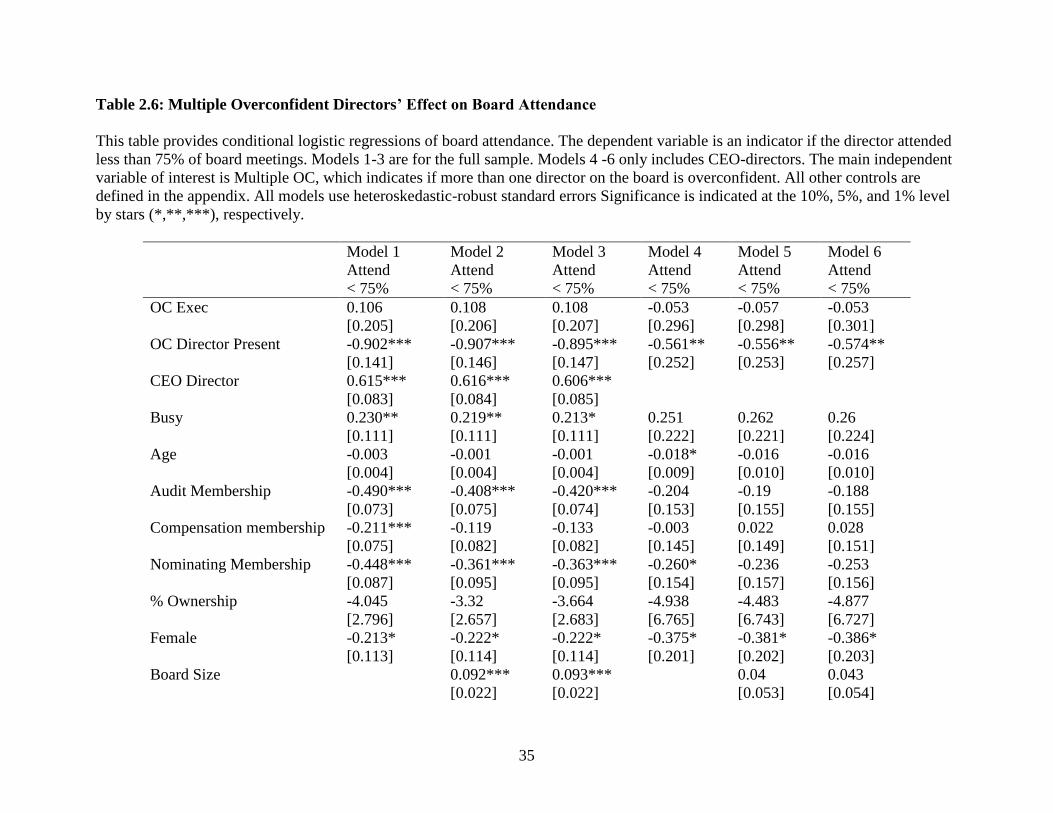
heteroskedasticity reported in parentheses. We find the group confidence effect is larger than the
individual’s own overconfidence. Multiple OC indicates if a director is serving on a board with
two or more overconfident directors. For all directors in the first three models, we find multiple
overconfident directors on the board contribute to higher attendance at the 1% level. Models 4
through 6 demonstrate the effect is statistically significant at the 10% level for the CEO-director
subsample. Thus, multiple overconfident directors are associated with greater attendance by other
directors within the firm. So, not only are overconfident directors less likely to miss meetings, the
other members of their board are also less likely to miss meetings, relative to when there is only
one or no overconfident directors on the board.
2.4.4. Firm Level: Board Overconfidence
In this section we aggregate our overconfidence director measure to the board level and
examine important board decisions. Our primary measure is an indicator variable that equals one
if the board has at least one overconfident director and zero otherwise. Given the previous finding
that overconfident directors are more likely to serve on the nominating committee, we start by
examining one of the most important board functions: selecting a CEO following a CEO turnover
event. We report several univariate analyses results in Table 2.7. There are a total of 2,578
35
Table 2.6: Multiple Overconfident Directors’ Effect on Board Attendance
This table provides conditional logistic regressions of board attendance. The dependent variable is an indicator if the director attended
less than 75% of board meetings. Models 1-3 are for the full sample. Models 4 -6 only includes CEO-directors. The main independent
variable of interest is Multiple OC, which indicates if more than one director on the board is overconfident. All other controls are
defined in the appendix. All models use heteroskedastic-robust standard errors Significance is indicated at the 10%, 5%, and 1% level
by stars (*,**,***), respectively.
Model 1 Model 2 Model 3 Model 4 Model 5 Model 6
Attend
< 75%
Attend
< 75%
Attend
< 75%
Attend
< 75%
Attend
< 75%
Attend
< 75%
OC Exec 0.106 0.108 0.108 -0.053 -0.057 -0.053
[0.205] [0.206] [0.207] [0.296] [0.298] [0.301]
OC Director Present -0.902*** -0.907*** -0.895*** -0.561** -0.556** -0.574**
[0.141] [0.146] [0.147] [0.252] [0.253] [0.257]
CEO Director 0.615*** 0.616*** 0.606***
[0.083] [0.084] [0.085]
Busy 0.230** 0.219** 0.213* 0.251 0.262 0.26
[0.111] [0.111] [0.111] [0.222] [0.221] [0.224]
Age -0.003 -0.001 -0.001 -0.018* -0.016 -0.016
[0.004] [0.004] [0.004] [0.009] [0.010] [0.010]
Audit Membership -0.490*** -0.408*** -0.420*** -0.204 -0.19 -0.188
[0.073] [0.075] [0.074] [0.153] [0.155] [0.155]
Compensation membership -0.211*** -0.119 -0.133 -0.003 0.022 0.028
[0.075] [0.082] [0.082] [0.145] [0.149] [0.151]
Nominating Membership -0.448*** -0.361*** -0.363*** -0.260* -0.236 -0.253
[0.087] [0.095] [0.095] [0.154] [0.157] [0.156]
% Ownership -4.045 -3.32 -3.664 -4.938 -4.483 -4.877
[2.796] [2.657] [2.683] [6.765] [6.743] [6.727]
Female -0.213* -0.222* -0.222* -0.375* -0.381* -0.386*
[0.113] [0.114] [0.114] [0.201] [0.202] [0.203]
Board Size 0.092*** 0.093*** 0.04 0.043
[0.022] [0.022] [0.053] [0.054]

36
Board Tenure -0.020*** -0.021*** -0.012 -0.011
[0.007] [0.008] [0.013] [0.013]
Leverage 0.549 0.887
[0.539] [1.027]
Tobin's Q 0.065 0.132*
[0.042] [0.071]
Segment -0.005 0.028
[0.014] [0.032]
R&D / Assets 0.603 -4.469
[0.948] [3.305]
ROA 0.055 0.251
[0.543] [1.021]
Observations 38715 38715 38709 4053 4053 4053
Pseudo R2 0.03 0.03 0.04 0.01 0.01 0.02

37
Table 2.7: Board CEO Selection Preferences
This table provides univariate analysis of a subsample of CEO turnovers split by board overconfidence during our sample period. The
means of each variable given the full sample of firms, full subsample of turnovers, and the subsample split by board overconfidence
are below. All variables are defined in the Appendix.
Variable Full Sample CEO
Turnover
Sample
Non-OC
Board
OC Board Difference T-stat P-value
Number of Observations 20527 2578 2128 450
CEO Turnover 0.126 1.00
New CEO Characteristics
Age 53.78 50.67 50.61 50.94 -.034 -0.51 0.61
Prior CEO Experience 0.112 0.123 0.094 0.256 -0.161 -7.48 <0.01
Number of Independent Directorships 1.39 1.43 1.37 1.71 -0.34 -6.26 <0.01
Same Industry (4-digit SIC) 0.07 0.07 0.06 0.09 -0.03 -2.13 0.03
Insider 0.22 0.24 0.21 0.38 -0.17 -6.89 <0.01
Overconfident CEO 0.02 0.01 0.00 0.06 -0.06 -5.41 <0.01

38
turnover events in our sample period from 1996 to 2011. We find overconfident boards tend to
replace the CEO with one who has prior CEO experience, more independent directorships (a
reputation proxy), from the same industry (at the 4-digit SIC level), is a company insider, and is
overconfident.
To test this in a multivariate setting, we use propensity-score matching (PSM) to address
any potential endogeneity concerns. Firms may pick overconfident directors for a specific
reason, which would affect outcomes we observe. In a perfect world, we could test the same firm
with and without an overconfident CEO-director. Since this is not possible, we use the PSM
method in order to account for other factors contributing to picking an overconfident director and
match each firm with an overconfident board (treatment firm) to a control firm that is as similar
to the treatment firm as possible but without an overconfident board. We take from the previous
literature on determinants of an overconfident CEO (Hirschleifer et al. (2011)) to provide insight
into selection of overconfident directors. We also draw from other studies on determinants of
board composition (e.g. Fahlenbrach et al. (2010)). Specifically, we include presence in an
innovative industry, firm leverage, firm value, acquisition activity, and accounting measures,
including intangible issues, assets, research and development expenses, capital expenditures,
sales growth, return on assets, stock return, leverage, Tobin’s Q, and acquisition activity.
Table 2.8 provides the results using our full and matched samples. Models 1 and 4
include board controls. Models 2 and 6 include CEO duality as Chairman; Models 3 and 6
include all regressors, including firm and overconfident CEO-correlated regressors. We find
significance for several controls throughout the full sample. Overconfident boards are more
likely as the percentages of CEO-directors, insiders, and former-CEO directors are higher.
Overconfident boards are also highly correlated with larger boards, larger and older firms, higher

39
Table 2.8: Propensity-Score Matching Model
This table provides the model used to generate propensity scores. The treatment is Overconfident Board, indicating if at least one
member of the Board of Directors is an overconfident independent CEO Director. Models 1-3 are for the full sample. Model 4-6 are
for the matched sample. Acq / assets is the cash flow from acquisitions scaled by assets. Intangible is the intangible assets scaled by
assets. Innovative indicates if a firm is an industry with two-digit SIC 10, 13, 16, 25, 48, or 50. All other controls are defined in the
appendix. Significance is indicated at the 10%, 5%, and 1% level by stars (*,**,***), respectively.
Model 1 Model 2 Model 3 Model 4 Model 5 Model 6
Full
Sample
Full
Sample
Full
Sample
Matched
Sample
Matched
Sample
Matched
Sample
% CEO Director 5.182*** 5.151*** 4.344*** 0.184 0.183 0.107
[0.224] [0.224] [0.232] [0.249] [0.249] [0.254]
% Insider 2.413*** 2.414*** 2.131*** -0.154 -0.153 -0.213
[0.130] [0.130] [0.135] [0.158] [0.158] [0.161]
% Former CEO Director 1.543*** 1.526*** 1.194*** 0.008 0.007 -0.007
[0.333] [0.333] [0.340] [0.377] [0.377] [0.379]
Board Size 0.187*** 0.186*** 0.084*** -0.012 -0.012 -0.023**
[0.007] [0.007] [0.009] [0.008] [0.008] [0.010]
CEO Director Left 0.149 0.139 0.161 11.768 11.766 12.648
[0.689] [0.692] [0.816] [340.482] [340.484] [527.062]
Former CEO Director Left 0.066 0.057 0.113 11.73 11.728 12.612
[0.689] [0.692] [0.816] [340.482] [340.484] [527.062]
Board Member Left -0.033 -0.024 -0.105 -11.763 -11.761 -12.647
[0.688] [0.691] [0.816] [340.482] [340.484] [527.062]
Inside Director Left 0.089 0.081 0.122 11.765 11.764 12.646
[0.688] [0.692] [0.816] [340.482] [340.484] [527.062]
Other Director Left 0 -0.009 0.055 11.736 11.734 12.619
[0.688] [0.692] [0.816] [340.482] [340.484] [527.062]
Chairman 0.120*** 0.046 0.005 -0.015
[0.040] [0.041] [0.047] [0.048]
Log (CEO Age) -0.114*** 0.056*
[0.026] [0.029]

40
Log (Assets) 0.227*** 0.018
[0.016] [0.018]
Log (Firm Age) 0.355*** 0.076*
[0.036] [0.042]
R&D / Assets 1.297*** -0.519
[0.400] [0.394]
Capital Expenditures 0.053 0.124
[0.402] [0.509]
Sales Growth -0.334*** -0.091
[0.093] [0.099]
ROA 0.979*** -0.01
[0.241] [0.302]
Stock Return 0 -0.001
[0.001] [0.002]
Dividend Payer 0.117** 0.002
[0.054] [0.065]
Blockholder -0.519* -0.14
[0.302] [0.382]
Leverage -0.004 0.086
[0.135] [0.164]
Tobin's Q -0.002 0.024
[0.020] [0.026]
ACQ / Assets -0.633 0.445
[0.397] [0.487]
Intangible 0.590*** 0.1
[0.128] [0.144]
Innovative 0.001 -0.110*
[0.059] [0.067]
Constant -3.132*** -3.171*** -4.592*** 0.114 0.113 -0.348
[0.098] [0.099] [0.211] [0.110] [0.112] [0.237]
Observations 20392 20392 20390 7540 7540 7540
Pseudo R2 0.16 0.16 0.18 0 0 0
41
investment and return, firms who pay dividends, and firms with a larger percentage of intangible
assets. Overconfident boards are less likely with older CEOs, lower sales, and if a large
blockholder exists. The Psuedo-R2 of Model 3 for the full sample is 18%, which is much larger
than 0% for Model 6 for the matched sample. Also, very few controls are significant or have
meaningful coefficient estimates in Model 6. Thus, our model sufficiently matches propensity
scores of boards treated by overconfidence.
We now use this matched sample to examine the characteristics of the new CEO selected
in a multivariate setting. We employ a model similar to Mobbs and Raheja (2012), who model
CEO selection outcomes among firm executives. Specifically, our model is as follows:
Dep Var = a0 + a1 (OC Boardt-1) + a2 (Log(Assets t-1)) + a3 (Log(Segments t-1)) + a4
(Log(Firm Age t-1)) + a5 (Service t-1) + a6 (Volatility t-1) + a1 ( Manufacturing t-1) + a2
( Homogeneity Index t-1) + a3 (Herfindahl Index t-1) + ε (2)
Table 2.9 reports the results for each tests of the new CEO characteristics we examine. We
find the results hold as before except for same industry. Overconfident boards find a new CEO
who has prior CEO experience, a higher reputation (as measured by her number of independent
directorships), is a company insider, and who is overconfident. These results are consistent with
overconfident directors seeking CEOs candidates who have greater available information about
their ability, which makes the decision less risky. This is consistent with their investing less in
gathering information (Goel and Thakor (2008)), but want to make successful choices (Miller and
Ross (1975)) for the new CEO. Finally, these findings contribute to the recent findings by
Banerjee et al. (2014) that overconfident executives are more likely to be selected as CEO, by
uncovering the role of overconfident board members in the selection of an overconfident CEO.

42
Table 2.9: Matched Sample Regressions of Board CEO Selection Preferences
This table provides CEO turnover regressions using a matched sample with propensity-score matching using the model in Table 2.7. The top of each column lists
the dependent variable of interest. All variables are defined in the appendix. All independent variables are lagged. All models use heteroskedastic-robust standard
errors clustered by firm in brackets. All models include year dummies. Significance is indicated at the 10%, 5%, and 1% level by stars (*,**,***), respectively.
Age Prior CEO Ind Directorships Same Industry Insider OC CEO
OC Board -0.127 0.772*** 0.480** 0.53 0.420** 1.776***
[1.116] [0.256] [0.192] [0.347] [0.208] [0.525]
Log (Assets) 0.885*** 0.041 0.347*** 0.249*** 0.079 -0.192
[0.313] [0.066] [0.061] [0.077] [0.059] [0.148]
Log (Segments) 0.634 -0.057 -0.176* -0.01 -0.152 0.239
[0.538] [0.124] [0.096] [0.139] [0.103] [0.205]
Log (Firm Age) -1.03 0.600** -0.053 0.228 0.498** -0.387
[1.191] [0.291] [0.181] [0.329] [0.213] [0.390]
Service -2.449 0.461 -0.727** 0.347 0.218 -0.289
[1.903] [0.401] [0.317] [0.433] [0.315] [0.717]
Volatility -8.445 -3.387 -3.311 0.041 -1.324 -3.151
[10.207] [2.219] [2.044] [3.619] [1.842] [3.043]
Manufacturing 0.848 0.464 0.387 -0.254 0.278 0.264
[1.156] [0.297] [0.236] [0.389] [0.238] [0.432]
Homogeneity Index -5.166 11.553 23.147 41.983 -7.915 -147.485
[80.985] [22.764] [16.038] [25.827] [19.409] [226.115]
Herfindahl Index -1.383 -2.915 -1.933 -1.536 -0.14 -4.255
[1.231] [2.615] [1.370] [2.083] [0.396] [8.954]
% Independent 0.33 -0.03 -0.686 -2.162** -1.644** -2.394*
[3.761] [0.848] [0.725] [0.974] [0.704] [1.247]
Constant 46.603*** -3.876*** -1.342 -4.114*** -1.752** 0.359
[6.253] [1.247] [0.858] [1.349] [0.888] [1.982]
Observations 753 753 753 753 753 753
R2/Pseudo R2 0.02 0.07 0.05 0.05 0.04 0.12

43
2.5. Robustness Checks
Throughout the robustness analysis our models incorporate heteroskedastic-robust
standard errors clustered by director or firm. All regressions include year-fixed effects or an
indicator for years after the Sarbanes-Oxley regulation and industry-fixed effects (at the two-
digit SIC level) or controls for industry characteristics using the Herfindahl index and
homogeneity index.
All models use the lag of board overconfidence to ensure there are no endogenous effects
due to the positive correlation between overconfident boards and overconfident CEOs. Unlike
the CEO-director trait of overconfidence, boards can swap from overconfident to diffident. Thus,
the overconfident board measure can be endogenous due to dependence on prior years, but
endogeneity is nonexistent for the fixed effect of CEO-director overconfidence.
In all models we run regressions analyzing the results using only CEO-directors. This
reduces our sample by over half in all models. All models are robust to this restriction except
for Table 2.3 with respect to board attendance.
We consider CEO-director firm effects, such as CEO tenure, firm size, firm age,
Herfindahl index, homogeneity index, volatility, and segments, in the director-level models.
We find statistical significance in all models and the same conclusions. We consider firm size
decile dummies to replace the size variable, Log (Assets), for the turnover models. We find
similar statistical results for all regressions.
2.6. Other Tests
Next, we analyze a firm’s net debt issues, known to be associated with an overconfident
CEO to determine whether overconfident boards mitigate or enhance this association. We also

44
examine the positive relation between CEO-directors and CEO pay to see to what degree, if any,
overconfident CEO-directors contribute to these findings.
Following Malmendier and Tate (2011), we test the effect of board overconfidence on
a company’s net debt issues, defined as the difference between long-term debt issues and long-
term debt reduction, scaled by total assets. Model 1 of Table 2.10 replicates Model 6 from Table
5 in Malmendier and Tate (2011). In our sample, we find no relationship between a CEO who
is overconfident and the company’s net debt issues. Model 2 utilizes our new variable of OC
Board, where we find a statistically negative relationship at the 5% level, suggesting
overconfident boards mitigate the overall use of company debt. Model 3 considers both
overconfident CEOs and overconfident boards. Separately, overconfident CEOs and
overconfident boards use more external financing, but companies with both overconfident
CEOs and overconfident boards use less external financing, which suggests a lack of monitoring
effect to reduce firm value by increasing firm risk through potentially suboptimal financing
decisions. This is consistent with the idea of group shift, whereby one individual can lead a
group to make the same decision as he would without group consideration (Ambrus et al.
(2009)).
Following Fahlenbrach et al. (2011), we test the effect of board overconfidence on CEO
compensation. Specifically, we look at the CEO’s salary. Model 1 of Table 2.11 replicates
Model 3 of Table 7 in Fahlenbrach et al. (2011). We find similar results since companies pay
the CEO more if a CEO-director sits on the board. Model 2 decomposes CEO-directors into
those who are overconfident and those who are not. The coefficient estimate for CEO-director
presence is still positive it is no longer significant. However, the coefficient estimate for the
presence of an overconfident CEO-director is positive and significant at the 1% level.

45
Table 2.10: Overconfidence and Net Debt Issues
This table provides the effects of overconfidence on net net debt issues, defined as long-term
debt issues less long-term debt reduction, scaled by total assets. All variables are defined in the
Appendix. All controls are lagged. Standard errors in brackets are robust to heteroskedasticity
and clustered by firm. All models include year and industry dummies. Significance is indicated
at the 10%, 5%, and 1% level by stars (*,**,***), respectively.
Model 1 Model 2 Model 3
OC CEO 0.002 -0.049**
[0.004] [0.025]
OC Board -0.003** -0.004***
[0.001] [0.001]
OC CEO * OC Board 0.055**
[0.025]
Vested Options -0.000** 0 0
[0.000] [0.000] [0.000]
Stock Ownership -0.003 -0.006 -0.005
[0.009] [0.009] [0.009]
Book Leverage 0.008*** 0.008*** 0.008***
[0.003] [0.003] [0.003]
OC CEO * NFD 0.061 0.063 0.063
[0.050] [0.050] [0.052]
Vested * NFD -0.000*** -0.000*** -0.000***
[0.000] [0.000] [0.000]
Leverage * NFD 0.004 0.004 0.004
[0.003] [0.003] [0.003]
Ownership * NFD 0.048 0.047 0.048
[0.040] [0.039] [0.040]
Constant 0.027** 0.027** 0.027**
[0.013] [0.013] [0.013]
Observations 20380 20380 20380
R2 0.031 0.031 0.032

46
Table 2.11: Overconfidence and Salary
This table provides analysis of the effects of overconfidence on the CEO’s salary. All other
variables are defined in the appendix. All independent variables are lagged. All models use
heteroskedastic-robust standard errors clustered by firm in brackets. All models include year-
and industry-fixed effects. Significance is indicated at the 10%, 5%, and 1% level by stars
(*,**,***), respectively.
Model 1 Model 2
CEO Director 17.651**
[7.349]
Non-OC CEO Director 9.052
[7.723]
OC CEO Director 34.404***
[9.784]
Insider 12.888 11.622
[7.861] [7.797]
CEO Director * Interlocking -57.591*** -53.966**
[21.098] [21.054]
Board Size 8.361*** 7.997***
[2.511] [2.522]
Size 138.154*** 136.945***
[5.534] [5.634]
ROA 10.314 11.039
[24.787] [24.816]
Stock Return -0.398** -0.395**
[0.190] [0.190]
Tobin's Q -3.102 -3.097
[2.473] [2.474]
Volatility -111.852* -108.635*
[63.593] [63.235]
CEO Tenure 3.208*** 3.321***
[0.668] [0.664]
OC CEO 54.076 41.579
[34.391] [34.271]
Constant -298.668*** -286.926***
[73.162] [73.625]
Observations 20380 20380
R2 0.461 0.462
F-test of Non-OC CEO Director and OC CEO Director 6.27***

47
the CEO more if a CEO-director sits on the board. Model 2 decomposes CEO-directors into
those who are overconfident and those who are not. The coefficient estimate for CEO-director
presence is still positive it is no longer significant. However, the coefficient estimate for the
presence of an overconfident CEO-director is positive and significant at the 1% level.
Moreover, the coefficient estimate is 280% larger than the coefficient estimate for non-
overconfident CEO-director presence and an unreported F-Test of the difference in these two
coefficient estimates reveals they are statistically different at the 1% level. Thus, while
overconfident directors are more active directors, the evidence here suggests they do pay their
CEO a larger salary, which is consistent the CEO receiving greater compensation for being
subject to more stringent monitoring.
2.7. Conclusion
Prior research has focused on the CEO’s overconfidence and firm decisions involving this
position and has found overconfident CEOs behave much differently than the average CEO.
Because CEOs often serve as directors in other firms, it is important to understand how their
overconfidence could potentially affect board decision making. We explore this question by
analyzing the overconfident CEO-director’s. Specifically, we examine director activity, and we
consider the board decision of hiring a new CEO.
At the director level we find evidence that overconfident CEO-directors are more involved
on their boards compared to other CEO-directors as indicated through higher board attendance and
a significantly greater likelihood of their serving on the nominating committee.
Relatedly, we find strong evidence the director services of overconfident CEO-directors are in
greater demand than other CEO-directors as evident by their holding significantly more
48
directorships. These findings reveal that overconfidence drives directors to be more involved
wherever they serve.
At the board level we find overconfident boards are more likely to hire more reputable and
overconfident CEO replacements. We also find overconfident boards prefer an inside CEO over
an outside CEO. Because directors have more information over insiders relative to outsiders this
finding is consistent with overconfident boards maintaining more control over key board decisions
such as the selectin of a new CEO.
Finally, we find overconfident boards mitigate the overconfident CEO effect documented
in prior literature of using less debt and that overconfident CEO-directors compensate CEOs with
a higher salary, which is an extension of the prior research on CEO-directors. Overall, we
highlight overconfidence not only affects CEO decisions but board decisions too; thus,
overconfidence is another important director trait for shareholders to consider when determining
who sits on the board and for researchers to consider in conducting corporate governance analysis
and studies of the director labor market.
49
REFERENCES
ADAMS, R., HERMALIN, B.E. and WEISBACH, M.S., 2008. The role of boards of directors
in corporate governance: A conceptual framework and survey, .
AHMED, A.S. and DUELLMAN, S., 2013. Managerial Overconfidence and Accounting
Conservatism. Journal of Accounting Research, 51(1), pp. 1-30.
ALICKE, M.D., 1985. Global self-evaluation as determined by the desirability and
controllability of trait adjectives. Journal of personality and social psychology, 49(6), pp. 1621-
1630.
ALICKE, M.D., KLOTZ, M.L., BREITENBECHER, D.L., YURAK, T.J. and VREDENBURG,
D.S., 1995. Personal contact, individuation, and the better-than-average effect. Journal of
personality and social psychology, 68(5), pp. 804-825.
AMBRUS, A., GREINER, B., PATHAK, P., 2009. Group versus individual decision-making: Is
there a shift?. Working paper.
ANDERSON, C., BRION, S., MOORE, D.A. and KENNEDY, J.A., 2012. A status-
enhancement account of overconfidence. Journal of personality and social psychology, 103(4),
pp. 718-735.
BANERJEE, S., DAI, L., HUMPHERY-JENNER, M. and NANDA, V., Executive Confidence
and New CEO Selection.
BANERJEE, S., HUMPHERY-JENNER, M. and NANDA, V., Harnessing CEO
Overconfidence.
BILLETT, M.T. and QIAN, Y., 2008. Are Overconfident CEOs Born or Made? Evidence of
Self-Attribution Bias from Frequent Acquirers. Management Science, 54(6), pp. 1037-1051.
BLACK, B.(.1.). and KIM, W.(.2.)., 2012. The effect of board structure on firm value: A
multiple identification strategies approach using Korean data. Journal of Financial Economics,
104(1), pp. 203-226.
BRICKLEY, J.A., COLES, J.L. and TERRY, R.L., 1994. Outside directors and the adoption of
poison pills. Journal of Financial Economics, 35(3), pp. 371-390.
BURG, V., PIERK, J. and SCHEINERT, T., 2013. Managerial Overconfidence and Accounting
Behavior following CEO Turnover. Available at SSRN 2244870, .

50
BUSENITZ, L.W. and BARNEY, J.B., 1997. Differences between entrepreneurs and managers
in large organizations: Biases and heuristics in strategic decision-making. Journal of business
venturing, 12(1), pp. 9-30.
BYRD, J.W. and HICKMAN, K.A., 1992. Do outside directors monitor managers? Journal of
Financial Economics, 32(2), pp. 195-221.
CHEN, C.X., GORES, T. and NASEV, J., 2013. Managerial overconfidence and cost stickiness.
Available at SSRN 2208622, .
COVAL, J.D.(.1.). and THAKOR, A.V.(.2.)., 2005. Financial intermediation as a beliefs-bridge
between optimists and pessimists. Journal of Financial Economics, 75(3), pp. 535-569.
DAHYA, J., MCCONNELL, J.J. and TRAVLOS, N.G., 2002. The Cadbury committee,
corporate performance, and top management turnover. The Journal of Finance, 57(1), pp. 461-
483.
DEFOND, M.L., HANN, R.N. and HU, X., 2005. Does the market value financial expertise on
audit committees of boards of directors? Journal of accounting research, 43(2), pp. 153-193.
DENIS, D.J., DENIS, D.K. and SARIN, A., 1997. Ownership structure and top executive
turnover. Journal of Financial Economics, 45(2), pp. 193-221.
DENIS, D.J. and SARIN, A., 1999. Ownership and board structures in publicly traded
corporations. Journal of Financial Economics, 52(2), pp. 187-223.
DESAI, M.A.(.1.)., DYCK, A.(.2.). and ZINGALES, L.(.3.)., 2007. Theft and taxes. Journal of
Financial Economics, 84(3), pp. 591-623.
DUCHIN, R., MATSUSAKA, J.G. and OZBAS, O., 2010. When are outside directors effective?
Journal of Financial Economics, 96(2), pp. 195-214.
FAHLENBRACH, R.(.1.)., LOW, A.(.2.). and STULZ, R.M. ( 3,4,5 ), 2010. Why do firms
appoint CEOs as outside directors? Journal of Financial Economics, 97(1), pp. 12-32.
FAHLENBRACH, R., MINTON, B.A. and PAN, C.H., 2011. Former CEO Directors: Lingering
CEOs or Valuable Resources? Review of Financial Studies, 24(10), pp. 3486-3518.
FALEYE, O.(.1.)., HOITASH, U.(.1.). and HOITASH, R.(.2.)., 2011. The costs of intense board
monitoring. Journal of Financial Economics, 101(1), pp. 160-181.
FEE, C.E. and HADLOCK, C.J., 2004. Management turnover across the corporate hierarchy.
Journal of Accounting and Economics, 37(1), pp. 3-38.
FICH, E.M. and SHIVDASANI, A., 2006. Are Busy Boards Effective Monitors? Journal of
Finance, 61(2), pp. 689-724.
51
FRACASSI, C. and TATE, G., 2012. External Networking and Internal Firm Governance.
Journal of Finance, 67(1), pp. 153-194.
GERVAIS, S., HEATON, J.B. and ODEAN, T., 2011. Overconfidence, Compensation
Contracts, and Capital Budgeting. Journal of Finance, 66(5), pp. 1735-1777.
GOEL, A.M. and THAKOR, A.V., 2008. Overconfidence, CEO Selection, and Corporate
Governance. Journal of Finance, 63(6), pp. 2737-2784.
GRINBLATT, M. and KELOHARJU, M., 2009. Sensation Seeking, Overconfidence, and
Trading Activity. Journal of Finance, 64(2), pp. 549-578.
HALLOCK, K.F., 1997. Reciprocally Interlocking Boards of Directors and Executive
Compensation. Journal of Financial & Quantitative Analysis, 32(3), pp. 331-344.
HARFORD, J., 2003. Takeover bids and target directors’ incentives: the impact of a bid on
directors’ wealth and board seats. Journal of Financial Economics, 69(1), pp. 51.
HERMALIN, B.E. and WEISBACH, M.S., 2001. Boards of directors as an endogenously
determined institution: A survey of the economic literature, .
HERZEL, L., 1990. Corporate governance through statistical eyes. Journal of Financial
Economics, 27(2), pp. 581-593.
HIRSHLEIFER, D., LOW, A. and TEOH, S.H., 2012. Are Overconfident CEOs Better
Innovators? Journal of Finance, 67(4), pp. 1457-1498.
HOECHLE, D. ( 1,2 ), SCHMID, M.(.3.)., WALTER, I.(.4.). and YERMACK, D.(.4.)., 2012.
How much of the diversification discount can be explained by poor corporate governance?
Journal of Financial Economics, 103(1), pp. 41-60.
HUANG, J. and KISGEN, D.J., 2013. Gender and corporate finance: Are male executives
overconfident relative to female executives? Journal of Financial Economics, 108(3), pp. 822-
839.
HUSON, M.R., MALATESTA, P.H. and PARRINO, R., 2004. Managerial succession and firm
performance. Journal of Financial Economics, 74(2), pp. 237-275.
HUSON, M.R., PARRINO, R. and STARKS, L.T., 2001. Internal monitoring mechanisms and
CEO turnover: A long‐term perspective. The Journal of Finance, 56(6), pp. 2265-2297.
HWANG, B. and KIM, S., 2009. It pays to have friends. Journal of Financial Economics, 93(1),
pp. 138-158.
KIDD, J.B., 1970. The utilization of subjective probabilities in production planning. Acta
Psychologica, 34, pp. 338-347.

52
KO, K.J. and (JAMES) HUANG, Z., 2007. Arrogance can be a virtue: Overconfidence,
information acquisition, and market efficiency. Journal of Financial Economics, 84(2), pp. 529-
560.
KOGAN, S., 2009. Distinguishing the Effect of Overconfidence from Rational Best-Response on
Information Aggregation. Review of Financial Studies, 22(5), pp. 1889-1914.
LARWOOD, L. and WHITTAKER, W., 1977. Managerial Myopia: Self-Serving Biases in
Organizational Planning. Journal of Applied Psychology, 62(2), pp. 194-198.
LINCK, J.S.(.1.)., NETTER, J.M.(.1.). and YANG, T.(.2.)., 2008. The determinants of board
structure. Journal of Financial Economics, 87(2), pp. 308-328.
LUBLIN, J.S., 2013. More Boards Recruit Ex-CEOs. Wall Street Journal - Eastern Edition,
262(121), pp. B8-B8.
MACE, M.L., 1971. Directors: Myth and reality.
MALMENDIER, U.(.1.). and TATE, G.(.2.)., 2008. Who makes acquisitions? CEO
overconfidence and the market's reaction. Journal of Financial Economics, 89(1), pp. 20-43.
MALMENDIER, U. and TATE, G., 2005. CEO Overconfidence and Corporate Investment.
Journal of Finance, 60(6), pp. 2661-2700.
MALMENDIER, U., TATE, G. and YAN, J., 2011. Overconfidence and Early-Life Experiences:
The Effect of Managerial Traits on Corporate Financial Policies. Journal of Finance, 66(5), pp.
1687-1733.
MASULIS, R.W. and MOBBS, S., 2014. Independent director incentives: Where do talented
directors spend their limited time and energy? Journal of Financial Economics, 111(2), pp. 406-
429.
MASULIS, R.W. and MOBBS, S., 2011. Are All Inside Directors the Same? Evidence from the
External Directorship Market. Journal of Finance, 66(3), pp. 823-872.
MEHRAN, H., 1995. Executive compensation structure, ownership, and firm performance.
Journal of Financial Economics, 38(2), pp. 163-184.
MILLER, D.T. and ROSS, M., 1975. Self-serving biases in the attribution of causality: Fact or
fiction? Psychological bulletin, 82(2), pp. 213-225.
MOBBS, S.(.1.). and RAHEJA, C.G. ( 2,3 ), 2012. Internal managerial promotions: Insider
incentives and CEO succession. Journal of Corporate Finance, 18(5), pp. 1337-1353.

53
MOBBS, S., 2013. CEOs Under Fire: The Effects of Competition from Inside Directors on
Forced CEO Turnover and CEO Compensation. Journal of Financial & Quantitative Analysis,
48(3), pp. 669-698.
MOORE, P.G., 1977. The Manager's Struggles with Uncertainty. Journal of the Royal Statistical
Society.Series A (General), (2), pp. 129.
NGUYEN, B.D.(.1.). and NIELSEN, K.M.(.2.)., 2010. The value of independent directors:
Evidence from sudden deaths. Journal of Financial Economics, 98(3), pp. 550-567.
OTTO, C.A., 2009. CEO optimism and incentive compensation, .
PARRINO, R., 1997. CEO turnover and outside succession a cross-sectional analysis. Journal of
Financial Economics, 46(2), pp. 165-197.
PENG, L.(.1.). and XIONG, W. ( 2,3 ), 2006. Investor attention, overconfidence and category
learning. Journal of Financial Economics, 80(3), pp. 563-602.
ROSENSTEIN, S. and WYATT, J.G., 1990. Outside directors, board independence, and
shareholder wealth. Journal of Financial Economics, 26(2), pp. 175-191.
RUSSO, J.E. and SCHOEMAKER, P.J.H., 1992. Managing Overconfidence. Sloan management
review, 33(2), pp. 7-17.
SCHRAND, C.M.(.1.). and ZECHMAN, S.L.C.(.2.)., 2012. Executive overconfidence and the
slippery slope to financial misreporting. Journal of Accounting and Economics, 53(1-2), pp. 311-
329.
SHLEIFER, A. and VISHNY, R.W., 1997. A Survey of Corporate Governance. Journal of
Finance, 52(2), pp. 737-783.
SHUE, K., 2013. Executive Networks and Firm Policies: Evidence from the Random
Assignment of MBA Peers. Review of Financial Studies, 26(6), pp. 1401-1442.
SNIEZEK, J.A., 1992. Groups under Uncertainty: An Examination of Confidence in Group
Decision Making. Organizational Behavior & Human Decision Processes, 52(1), pp. 124-155.
STATMAN, M., THORLEY, S. and VURKINK, K., 2006. Investor Overconfidence and Trading
Volume. Review of Financial Studies, 19(4), pp. 1531-1565.
SVENSON, O., 1981. Are we all less risky and more skillful than our fellow drivers? Acta
Psychologica, 47(2), pp. 143-148.
TUFANO, P. and SEVICK, M., 1997. Board structure and fee-setting in the U.S. mutual fund
industry. Journal of Financial Economics, 46(3), pp. 321-355.

54
VAN NUYS, K., 1993. Corporate Governance through the Proxy Process: Evidence from the
1989 Honeywell Proxy Solicitation. Journal of Financial Economics, 34(1), pp. 101-132.
VANCIL, R.F., 1987. Passing the baton: Managing the process of CEO succession. Harvard
Business School Press Boston, MA.
WARNER, J.B., WATTS, R.L. and WRUCK, K.H., 1988. Stock prices and top management
changes. Journal of Financial Economics, 20, pp. 461-492.
WEINSTEIN, N.D., 1980. Unrealistic optimism about future life events. Journal of personality
and social psychology, 39(5), pp. 806.
WEISBACH, M.S., 1988. Outside directors and CEO turnover. Journal of Financial Economics,
20, pp. 431-460.
WINTOKI, M.B., LINCK, J.S. and NETTER, J.M., 2012. Endogeneity and the dynamics of
internal corporate governance. Journal of Financial Economics, 105(3), pp. 581-606.
YERMACK, D., 1996. Higher market valuation of companies with a small board of directors.
Journal of Financial Economics, 40(2), pp. 185-211.
YIM, S., 2013. The acquisitiveness of youth: CEO age and acquisition behavior. Journal of
Financial Economics, 108(1), pp. 250-273.
ZARNOTH, P. and SNIEZEK, J.A., 1997. The Social Influence of Confidence in Group
Decision Making. Journal of experimental social psychology, 33(4), pp. 345-366.

55
APPENDIX
Variable Definition
Director Level
Age Age of a director in years
Attend < 75% Indicator variable if a director attended less than 75% of the
board meetings
Board Tenure Time in years a director has remained on the board
Independent Directorships Number of independent outside directorships held by a director
Ownership % Number of shares owned / common shares outstanding
Audit Membership Indicator variable if a director is a member of the audit
committee
Compensation Membership Indicator variable if a director is a member of the compensation
committee
Nominating Membership Indicator variable if a director is a member of the nomination
committee
Chairman Indicator variable if a director is Chairman of the board
Female Indicator variable if a director is Female
Committee Chair Indicator variable if a director is a Chairman of the audit
committee or compensation committee or nomination
committee
CEO Tenure Time in years a director has been the CEO
OC Director Indicator variable if the Director is labeled overconfident at
least once by one of the three overconfidence measures by
Malmendier and Tate (2005, 2008)
Busy Indicator variable if the Director has three or more independent
directorships (Fich and Shivdasani (2006))
SOX Indicator if the year is after 2001 when the Sarbanes-Oxley Act
took effect
CEO Director Indicator variable if the Director is a CEO of a firm elsewhere
% CEO Director Percentage of board members who are CEOs elsewhere
% Insider Percentage of board members who are linked to or employed by
the firm
% Former CEO Director Percentage of board members who used to be CEOs at the firm
CEO Director Left Indicator if a CEO director left in the current year
Board Member Left Indicator if an independent director left in the current year
Inside Director Left Indicator if a director who employed by or linked to the firm
left in the current year
Other Director Left Indicator if any other type of director left in the current year

56
Variable Definition
Firm Level
Log (Assets) Natural log of total assets
Sales Net sale turnover
Market Cap Common shares outstanding x fiscal year-end stock price
Leverage Total assets / stockholder’s equity
Number of Segments Total number of Segments
Tobin’s Q (Market cap + short-term liabilities + long-term liabilities) /
(stockholder’s equity + short-term liabilities + long-term
liabilities)
R&D / Assets Research and development expense / total assets
Board Size Total number of Directors on the board
Board Independence % Percentage of board Directors independent of the firm
CEO Tenure Length of time in years a director has remained as CEO
Overconfident Board Indicator variable if at least 1 board Directors is overconfident
Stock Return (Fiscal end-of-year stock price / Previous fiscal end-of-year
stock price) – 1
ROA Industry-adjusted net income / total assets
Firm Age Age of the firm according to number of years data has been
available in Compustat
% Director Ownership Percentage of shares the Board of Directors owns of the firm
Service Indicator if the Fama-French industry code is 7, 11, 33, 34, or
44
Volatility Standard deviation of monthly stock returns from the previous
three years
Manufacturing Indicator if the Fama-French industry code is 2-5, 8-10, 12-17,
19-26, 35, or 37-40
Herfindahl Index Sum of squared percentage of industry sales of all industry
firms
Homogeneity Index Mean partial correlation proxy for industry similarity (Parrino
1997)
Capital Expenditures Capex scaled by assets
Sales Growth Percentage change in sales from the current year to the previous
year
Dividend Payer Indicates if the firm pays cash dividends
Blockholder Indicates if an institution owns more than 10% of the
company’s stock
ACQ / Assets Cash flow from acquisitions scaled by total assets
Intangible Amount of intangible assets scaled by total assets
Innovative Indicator if a firm is an industry with two-digit SIC 10 (metal,
mining), 13 (oil & gas extraction), 16 (heavy construction,
except building), 25 (furniture and fixtures), 48
(communications), or 50 (wholesale trade – durable goods)
from Hirshleifer and Teoh (2011)

57
CHAPTER THREE
CEO LONG-TERM INCENTIVE PAY IN MERGERS AND ACQUISITIONS
3.1. Introduction
CEO inside debt is a major component of a firm’s executive pay package. Companies pay
managers fixed sums of cash in the future with financial instruments such as pensions7. Accounting
for both the debt and equity components of executive compensation in a manner similar to the
firm’s capital structure was mentioned by Jensen and Meckling (1976), in their analysis of the
firm’s financing of assets with debt and equity. Since then however, the CEO compensation
literature has mainly focused on the equity-based incentives and until recently has not empirically
examined CEO debt compensation in the form of deferred compensation and pensions.
The recent empirical (Sundaram and Yermack (2007), Wei and Yermack (2011), and
Cassell et al. (2012)) and theoretical (Edmans and Liu (2011)) research finds inside debt
incentivizes CEOs to choose less risky investments. This paper expands the literature of executive
compensation by analyzing domestic merger and acquisition (M&A) activity and CEO inside debt
in the form of deferred compensation payments and pensions. I focus on CEO compensation versus
all other employees in this paper since the CEO is most likely to propose and ultimately engage in
a large investment such as an M&A (Lehn and Zhao, 2006).
Long-term incentive payouts (LTIP) encompass 60% or more of a median S&P 500 CEO’s
compensation package. These conditional company shares are distributed in two parts. The CEO
7 A case study on the compensation of Jack Welch of General Electric is demonstrated by Sundaram and Yermack
(2007).

58
receives half of the shares immediately, followed by the remainder three years later. The CEO
receives this portion only if he remains with the company, and the company continues to exist.
One of the main differences between deferred equity compensation and pension plans is what
occurs in the event of bankruptcy. The CEO receives a percentage of his pension upon company
bankruptcy, but the deferred equity compensation value becomes zero since the remaining portion
of shares becomes worthless8.
Wei and Yermack (2011) analyze the market reactions to inside debt and find that after
SEC disclosure reform occurred in 2007, firm risk is reduced, and firm value decreases as inside
debt becomes substantially large. Cassell et al. (2012) empirically study how CEO inside debt
affects investment decisions. They find CEOs with high inside debt choose less risky investments,
like capital expenditures rather than R&D, and financial policies.
To gain further insight as to how inside debt can affect CEO investment and financing
policy, I analyze the significant investment decisions reflected in domestic M&A9 transactions
from 1996 to 2005 for a total of 17,668 firm-year observations. Specifically, I study the likelihood
of making an acquisition along with various aspects of the investment decision such as
diversification, payment, and relative deal value to better understand the role of inside debt on the
decision-making process of a CEO.
First, I study the likelihood of a CEO engaging in a merger or acquisition. Since debt-based
compensation incentivizes the CEO to take less risk (Cassell et al. 2012) and if mergers and
8 For further information about long-term incentive pay (LTIP), go to investopedia.com, execcomp.org, and wrds-
web.wharton.upeen.edu/wrds/. 9 There are other working papers on this topic. Phan (2012) finds a negative relation between M&A propensity and
inside debt as well as less risky merger decisions. Liu, Mauer, and Zhang (2012) find CEOs with inside debt above
the optimal level engage in value-destroying diversifying M&A, which brings the inside debt ratio closer to an
optimal level. Lin, Officer, and Shen (2013) find CEOs with high inside debt tend overpay in vertical M&A. These
papers use data after 2006, whereas this paper focuses on M&A during the last two merger waves and before the
financial crisis. Details on the data construction are described in Section 3.

59
acquisitions tend to be particularly risky (as defined by a higher standard deviation of firm stock
returns after the transaction (Roll 1986)), a CEO would be less likely to engage in such an
investment the higher is their debt component of compensation. However, if some mergers can
reduce the risk of the firm (Agrawal and Mandelker (1987)), then greater CEO inside debt may be
associated with more of these types of acquisitions. Consistent with the former I find that the
likelihood of a firm to invest via an M&A in a given year and the number of transactions in a given
firm-year is significantly and negatively associated with CEO inside debt holdings.
Second, for the firms that do decide to make acquisitions, I study the types of firms are
targeted by the acquirer to see if these acquisitions are more likely to be risk reducing ((Agrawal
and Mandelker (1987)). Morck, Shleifer, and Vishny (1990) find returns to bidding shareholders
are lower when firms diversify, consistent with lowering firm risk. However, diversification can
also introduce integration risk (Larsson and Finkelstein (1999) and Hakkinen et al. (2004)). On the
other hand, acquisitions within the firm’s own industry likely involve lower integration risk given
the greater familiarity with their business. Moreover, acquiring a firm within the industry can
increase the market share of the combined firm, which reduces competition risk in the future and
increases the long-run viability of the firm. An acquisition of this nature will lower the chance of
firm bankruptcy and increase the likelihood of the CEO’s deferred compensation will be paid in
the future. On the other hand, the firm may decide to engage in a diversifying M&A despite the
integration risk, because it is only a short-term concern, especially if the firm has more cash
available (Harford 1999). I find firms with higher inside debt are less likely to choose a
diversifying target firm10.
10 Cassell et al. (2012) use an entropy measure of industry segment sales for their diversification measure. I am able
to directly test diversification by the type of M&A the acquiring firm chooses to invest.

60
Third, I study how CEO inside debt impacts the CEO’s choice of deal size. Larger targets
can help the CEO to increase the overall value of the firm to a point where his future compensation
is no longer in jeopardy. However, larger deals can be more risky. Morellec and Zhdanov (2005)
find returns to bidders can be negative if there is competition and uncertainty over synergy. I
examine the target size using the reported value of the deal according to SDC Platinum and find
that as inside debt increases, firms target relatively smaller firms. This is consistent with greater
inside debt providing incentives for CEOs to take on safe acquisitions that can be integrated into
the firm with little integration risk.
Finally, I examine whether debt in the CEO’s compensation structure affects their decision
on how to pay for acquisitions. Firms who obtain a controlling position via stock can reduce the
debt-to-equity ratio of the firm, which reduces firm risk. Alternatively, acquiring with cash, which
is often associated with an increase in debt, can increase bankruptcy risk. Thus, the CEO can be
influenced by the inside debt in his/her own compensation and the use of stock is more preferred
as the CEOs inside debt compensation increases. Indeed, I find the portion of stock used to pay
for the target is positive associated with CEO inside debt.
These findings contribute to the literature in several ways. First, I further extend the
literature on the use of CEO inside debt in executive compensation (see Sundaram and Yermack
(2007) and Wei and Yermack (2011)). CEO inside debt is becoming a larger portion of
compensation, which makes it important to better understand how it incentives CEOs and their
risk taking actions. Second, I extend the definition of investing activities outside the scope of R&D
and working capital (see Agrawal and Mandelker (1987), Rauh (2006), and Cassell et al. (2012))
by using another type of investment: M&A, which provides additional data and a more in-depth
look at specific decisions a CEO can make. Finally, I tie together CEO incentives in M&A (see

61
Harford (2004) and Lehn and Zhao (2006)) by using CEO inside debt versus stock (see Core and
Guay, 1999). The relative proportion of stock options and inside debt used to pay the CEO will
affect his incentives and decision-making on important M&A decisions.
This paper differs from Cassell et al. (2012) in several ways. I analyze M&A, an investment
whose riskiness is circumstantial. This provides more detail concerning specific decisions
regarding an investment than analyzing accounting variables and their respective associations and
correlations with inside debt. The data I use are during the period before the financial crisis and
encompass two merger waves. During the financial crisis many companies invested little due to a
lack of opportunities. Moreover, our measures of inside debt differ. I specifically look at the inside
debt vehicle of deferred compensation with respect to equity received from long-term incentive
plans, whereas Cassell et al. (2012) and Phan (2013) study the combination of deferred
compensation from bonuses, pension plans, and expected future cash compensation, which is
available after 2006. In addition, unlike Cassell et al. (2012), I also investigate the types of
decisions made with an M&A. While Phan (2013) also studies M&A, the sample period is mostly
during the financial crisis. During the financial crisis, acquisitions were either very successful or
led to company failure, creating a survivorship bias both during and post-financial crisis. Since my
sample stops in 2005 and the sample in Phan (2013) includes the financial crisis period, a structural
break exists between the time periods of interest in our papers.
The paper is organized as follows. Section 2 provides an extensive review of the literature
and generates testable hypotheses. Section 3 explains the dataset and methodology. Section 4
discusses the empirical results. Section 5 provides further exploration of risk, robustness, and
returns. Section 6 concludes. The appendix contains a reference guide of descriptions for the
variables used in this paper.

62
3.2. Literature Review and Hypothesis Development
The literature on executive compensation has largely concentrated on equity holdings. Pay-
for-performance incentives align managerial interests with shareholders (Jensen and Murphy
(1990), Mehran (1995)). However, in recent years, the literature has expanded to include CEO
debt holdings, such as deferred compensation and pensions, otherwise known as inside debt.
Edmans and Liu (2010) point out that a CEO compensation scheme contains both equity and debt
and therefore it is important to recognize the incentives arising from the debt component of their
compensation. Consequently, a manager’s personal leverage, defined as debt over equity holdings,
can greatly affect firm risk. For example, empirically, Rauh (2006) finds firms with large defined
benefit pension obligations are constrained and choose to invest less due to this extensive debt
burden. The resulting reduction in investments implies the firm has fewer opportunities to fail;
thus, firm risk is reduced.
Cassell et al. (2012) expands the literature by focusing on CEO decisions concerning
investments and financing. They find that large debt holdings by the CEO will lead him to reduce
firm risk for two reasons. First, if the CEO’s inside debt is greater than the CEO’s equity holdings,
the CEO has a reduced incentive to increase wealth via stocks and stock options. Since the CEO
can increase stock value by taking on higher risk in order to reap higher returns, when inside debt
is greater than the equity incentives, the CEO has incentive to reduce risk rather than increase it.
Second, increasing deferred compensation increases the incentive for the CEO to make decisions
which will make the firm last after his retirement or departure in order for him to be fully
compensated in later periods. Thus, the CEO will make decisions to reduce the likelihood of
bankruptcy and to increase the long-run viability of the firm. Consistent with this, Cassell et al.
(2012) find increases in CEO inside debt reduce stock return volatility, a measure of firm risk.

63
Mergers and Acquisitions represent a specific firm investment that can be risk increasing11 (Roll
1986). If greater inside debt predisposes a CEO to avoid risky firm investments, then the CEO can
view the M&A as too risky, despite the potential of it yielding positive NPV.
Hypothesis 1a: CEO inside debt holdings are negatively associated with the likelihood of
an M&A.
Another risk-based explanation for an M&A decision is the co-insurance effect, where one
combined firm is better than two separate entities in the eyes of bondholders who are concerned
with default. Levy and Sarnat (1970) find diversification can reduce lender risk and enhance firm
value through reduced financing costs of the new conglomerate. Lewellen (1971) finds
conglomeration may occur if market undervaluation or a sub-optimal capital structure exists.
Overall firm value is enhanced if additional borrowing capacity is created. Higgins and Schall
(1975) find tax incentives allow the increase in debt value following a merger to counteract the
decrease in equity value; thus, the net effect on firm value is positive. Finally, Agrawal and
Mandelker (1987) find evidence that M&A events are risk reducing when the ratio of executive
stock and options to total compensation is lower. Thus, if these factors dominate CEO decision
making then we have the following hypothesis.
Hypothesis 1b: CEO inside debt holdings are positively associated with the likelihood of
an M&A.
Cassell et al. (2012) examine specific investment and financing decisions and find
increasing inside debt reduces the more risky R&D investment and increases the less risky capital
expenditures. Similarly, CEOs that do engage in M&A can choose acquisitions that are less risky.
One way CEOs can reduce risk is by diversification (i.e. operate in different industries). For
11 See Agrawal, Jaffe, and Mandelker (1992), Anderson and Mandelker (1993), Asquith (1983), Langetieg (1978),
Loughran and Vijh (1997), Malatesta (1983), and Mitchell and Stafford (1998).

64
example, suppose a firm is undiversified. If the firm product fails in the market, this leads to the
ultimate collapse and bankruptcy of the firm. Now suppose a firm is diversified in multiple
markets. If one product fails, the losses sustained by one industry will be mitigated by other
markets breaking even or generating profits. Thus, diversification is negatively associated with
bankruptcy exposure. Indeed, Cassell et al. (2012) find increasing inside debt subsequently leads
to higher diversification as measured by the entropy of sales. In addition, they also find that firms
with higher inside debt tend to increase working capital and decrease financial leverage. In terms
of M&A decisions, Harford (1999) finds firms with more cash are more likely to attempt a
diversifying M&A and Liu et al. (2013) finds a positive relationship between inside debt and cash
holdings. Thus, one proposition is CEOs with high levels of inside debt have incentives to engage
in a diversifying M&A.
Hypothesis 2a: When firms with increasing levels of CEO inside debt decide to engage in
an acquisition, those acquisitions are more likely to be diversifying.
Alternatively, the CEO of acquiring firms can target similar firms in the same industry with
the intention to reduce risk by reducing market competition or to further enhance the company’s
current operations. Morck, Shleifer, and Vishny (1990) find returns to bidding shareholders are
lower when firms diversify due to the reduction in risk. Firms deciding to branch out into other
industries take on integration risk and increase the risk of potential failure if the venture does not
work well with the current synergies of the firm. Conversely, future firm performance as measured
by stock returns is higher for firms who have a within-industry acquisition (Uysal 2011). Thus, the
CEO will choose targets that can be more easily integrated and that can enhance the current
operations of the company in the context of the acquiring firm’s current industry. This will lower

65
the chance of firm bankruptcy and increase the likelihood his deferred compensation will be paid
in the future.
Hypothesis 2b: When firms with increasing levels of CEO inside debt decide to engage in
an acquisition, those acquisitions are less likely to be diversifying.
Liquidity in the form of cash needs to be readily available for firms, especially for those
with large debt obligations in the form of deferred compensation and pensions for executives.
Thus, paying with cash or incurring additional debt to acquire a target is less attractive for CEOs
with high inside debt and thus they likely prefer to acquire with stock in order to reduce the debt-
to-equity ratio of the firm. This is an additional incentive for stock acquisitions beyond the stock
being undervalued relative to the bidder (Shleifer and Vishny, 2003). Not incurring debt and
acquiring with stock provides the firm with more liquidity and a potentially better credit rating,
which reduces bankruptcy risk.
Hypothesis 3: The acquisition payment in stock increases as CEO inside debt increases.
Finally, the target firm size is also related to integration risk as smaller firms are easier to
integrate than are larger firms. This immediate short-term risk may drive CEOs to choose a smaller
target so as to not jeopardize the livelihood of the firm, since acquiring a larger firm can lead to
long-run sustainability concerns if integration fails.
Hypothesis 4: CEO inside debt is negatively associated with relative acquiring deal values.
3.3. Data and Methodology
Executive compensation is obtained from Execucomp12. The data is screened for only
CEOs using the ceoann variable. Company financials are from the CRSP/Compustat merged
12 The security of the CEO debt (i.e. is the pension funded or guaranteed) is not considered here. This may affect the
CEO’s riskiness if the debt is guaranteed, irrespective of the firm’s future existence. If this were the case, it would be
easier to take greater risk on the equity side. This would increase instead of mitigate the agency cost of debt, which is
one reason to defer compensation. Secured debt would bias against my finding significant results.

66
database provided by WRDS. Merger and acquisition data are from Thomson Reuters SDC
Platinum. Governance and board controls are from Risk Metrics. The following restrictions
minimize the dataset. The transactions are domestic (U.S.) only. The announcement date must
occur between 1996 and 2005. The acquirer must have public status. The deal must be completed
and unconditional. The percent of shares owned before (after) the transaction must be less than
(equal to) 50% (100%). The percent of shares the acquirer seeks to own must be equal to 100%.
The deal value must be greater than 10 million. Two-digit SIC codes 49 (utilities) and 60-67
(financial firms) are excluded due to government regulation restrictions. The final sample results
in 17,668 firm-year observations with 3,872 merger or acquisition transactions.
I test the theory of Edmans and Liu (2011), who argue inside debt increases lead to
conservative decisions, and build on the hypothesis of Jensen and Meckling (1976) that firms
should finance the CEO in the same manner as the firm in order to properly align incentives and
reduce agency costs. The main independent variables of interest are the log of CEO to firm
debt/equity ratio (CEO RDE) and the log of CEO relative incentive ratio (CEO RIR). In theory,
both CEO RDE and CEO RIR would be optimal at one. CEO RDE is the ratio of the CEO’s inside
debt to the firm’s debt, where the CEO has debt in the form of pension benefits and deferred
compensation and equity in the form of stock and stock options (valued by Black-Scholes (1973)),
and the firm has current and long-term debt and equity valued by the market. This is equal to
[(CEO IDH / CEO EH)/(FD / FE)], where CEO IDH is the aggregated present value of pension
benefits and deferred compensation, CEO EH is the value of stock (fiscal year-end stock price
multiplied by the number of shares held (including restricted)) and stock options (Black-Scholes
valuation of the newly granted, exercisable, and unexercisable tranches), FD is total current

67
liabilities and long-term debt13, and FE is the current number of shares outstanding multiplied by
the fiscal-year end stock price. The formula is:
𝑙𝑡𝑖𝑝𝑠ℎ𝑟𝑜𝑤𝑛𝑒𝑥𝑐𝑙𝑜𝑝𝑡𝑠
∗ 𝑝𝑟𝑐𝑐𝑓 + (𝑜𝑝𝑡𝑒𝑥𝑒𝑟𝑣𝑎𝑙+ 𝑜𝑝𝑡𝑢𝑛𝑒𝑥𝑒𝑥𝑒𝑟𝑒𝑠𝑡𝑣𝑎𝑙
+ 𝑜𝑝𝑡𝑢𝑛𝑒𝑥𝑢𝑛𝑒𝑥𝑒𝑟𝑒𝑠𝑡𝑣𝑎𝑙)
𝑑𝑙𝑡𝑡 + 𝑑𝑙𝑐𝑐𝑠ℎ𝑜 ∗ 𝑝𝑟𝑐𝑐𝑓
(1)
CEO RIR is the ratio of the CEO relative incentive ratio established by Wei and Yermack (2011),
where the CEO has debt in the form of pension benefits and deferred compensation and equity in
the form of stock and stock options (valued according to option delta by exercisability tranches by
Black-Scholes (1973) as defined below) and the firm has current liabilities and long-term debt and
equity options (valued by total employee options, the average outstanding exercise price, and
assumed expiration of 4 years).
𝑂𝑝𝑡𝑖𝑜𝑛 𝑉𝑎𝑙𝑢𝑒 = 𝑆𝑒−𝑑𝑇𝑁(𝑍) − 𝑋𝑒−𝑟𝑡𝑁 (𝑍 − 𝜎𝑇12) (2)
𝑍 =ln (
𝑆𝑋) + 𝑇(𝑟 − 𝑑 +
𝜎2
2 )
𝜎𝑇12
(3)
where N is the cumulative normal distribution function, S is the underlying stock price, X is the
option exercise price, 𝜎 is the expected stock-return volatility over the option life, r is the natural
logarithm of the risk-free rate, T is the time-to-maturity in years, and d is the natural logarithm of
the dividend yield. I follow Core and Guay (2002) in estimating T and X. Unexercised
unexercisable (exercisable) options have T-1 (T-3) fewer years than previously granted options. If
no options are granted in the previous year than T=9 (T=6) for unexercisable (exercisable) options.
The exercise price is calculated as the difference between the end-of-year stock price and the
13 Some firms do not have debt (see Agrawal and Nagarajan (1990)). I initialize such cases to zero. This is not an issue
for equity since our sample contains public firms in the S&P 1500.

68
average value (i.e. realizable value of previously granted options divided by the number of options
unexercised). The formula for CEO RIR is:
𝑙𝑡𝑖𝑝𝑠ℎ𝑟𝑜𝑤𝑛𝑒𝑥𝑐𝑙𝑜𝑝𝑡𝑠
∗ 𝑝𝑟𝑐𝑐𝑓 + ∑ 𝑑𝑒𝑙𝑡𝑎𝑖 ∗ 𝑜𝑝𝑡𝑖𝑜𝑛 𝑡𝑦𝑝𝑒𝑖31
𝑑𝑙𝑡𝑡 + 𝑑𝑙𝑐𝑜𝑝𝑡𝑜𝑠𝑒𝑦 ∗ 𝑜𝑝𝑡𝑝𝑟𝑐𝑏𝑦
(4)
I use several controls for both the CEO and the firm. Morse, Nanda, and Seru (2010) find
powerful CEOs rig their incentive contracts. Malmendier, Tate, and Yan (2011) find CEO
attributes and types of compensation affect the financial decisions they make. Thus, CEO controls
are essential to the executive compensation analysis. Control variables specific to the CEO include
age, a gender indicator if the CEO is male, an indicator if the CEO was the Chairman of the Board,
the length of tenure the CEO has with the current firm, and the percent of shares the CEO owns
(excluding options) relative to the entire market.
Carlson and Lazrak (2010) find a positive association between manager’s pay sensitivity
in the form of cash to stock and the firm’s leverage ratios. Harford and Li (2007) find CEO wealth
becomes insensitive to poor performance after a merger if board governance is weak. Control
variables specific to the firm include a measure of size via the natural logarithm of assets, leverage
defined as total firm debt scaled by total firm assets, contemporaneous and the lag of total
shareholder return (including dividends), the G-index as a measure of governance (Gompers, Ishii,
and Metrick (2003)), the age of the firm according to its IPO date, the board size, and the
percentage of board members classified as independent from the firm14. I use Fama- French 48
14 CEOs can set up their compensation packages. Conservative CEOs may select conservative packages including
high amounts of deferred compensation for their future consumption. However, after SOX in 2002, the oversight
committee for a CEO’s compensation must have independent directors, and the CEO is not allowed to be on the
compensation committee. Firms listed on securities exchanges, such as NYSE and NASDAQ, must meet this
requirement. See http://nasdaq.cchwallstreet.com/NASDAQ/Main/ for further information.

69
industry classifications from Kenneth French’s website15 and year fixed effects to account for
industry differences in valuation dispersion and merger waves (Shleifer and Vishny, 2003).
Finally, merger variables include the value of the deal completed between the acquirer and
target, the percentages of stock and cash used in the transaction, an indicator if the transaction is a
merger of equals, an indicator if the target firm is private, public, or a subsidiary, interactions
among public status and if the deal was completed completely in cash, an indicator if there were
multiple bidders, an indicator if the target firm has defensive provisions, an indicator if a tender
offer is made, and an indicator if the M&A was unsolicited . The summary statistics are provided
in Table 3.1.
Panel A describes the whole sample of 17,668 firm-year observations. CEO RDE averages
–2.721, which is higher than the CEO RIR mean of –7.499. The means of the variables of interest
are lower than the values reported in Cassell et al. (2012) due to variable calculations over several
market highs and lows versus the market’s record high in 2006 used by Cassell et al. Firm reporting
requirements for inside CEO debt did not become fully regulated until after the defined benefit
crisis in 200316 and the SEC disclosure requirement came into effect in 200717. There are slightly
fewer observations for the CEO RIR since the calculation requires more data to calculate the
option value using CEO delta. The average CEO age is 56 years old, with the youngest in the
sample at 32 and the oldest at 91 years. 98.5% of the CEOs in our sample are male. 67% of CEOs
also serve as Chairman of the Board. The mean and median firm tenure of the CEO is 8 and 7
years, respectively. The average CEO owns 3% of the company’s total shares (excluding options).
15 http://mba.tuck.dartmouth.edu/pages/faculty/ken.french/data_library.html 16 One of the major firms involved was United Airlines. The firm’s bankruptcy quickly eroded defined benefit plan
values of most employees. The U.S. Senate used this occurrence to have a hearing and begin the process of regulation.
See http://www.finance.senate.gov/library/hearings/. 17 Regulation S-K states how companies report pension valuations. See
http://www.sec.gov/divisions/corpfin/guidance/execcomp402interp.htm.
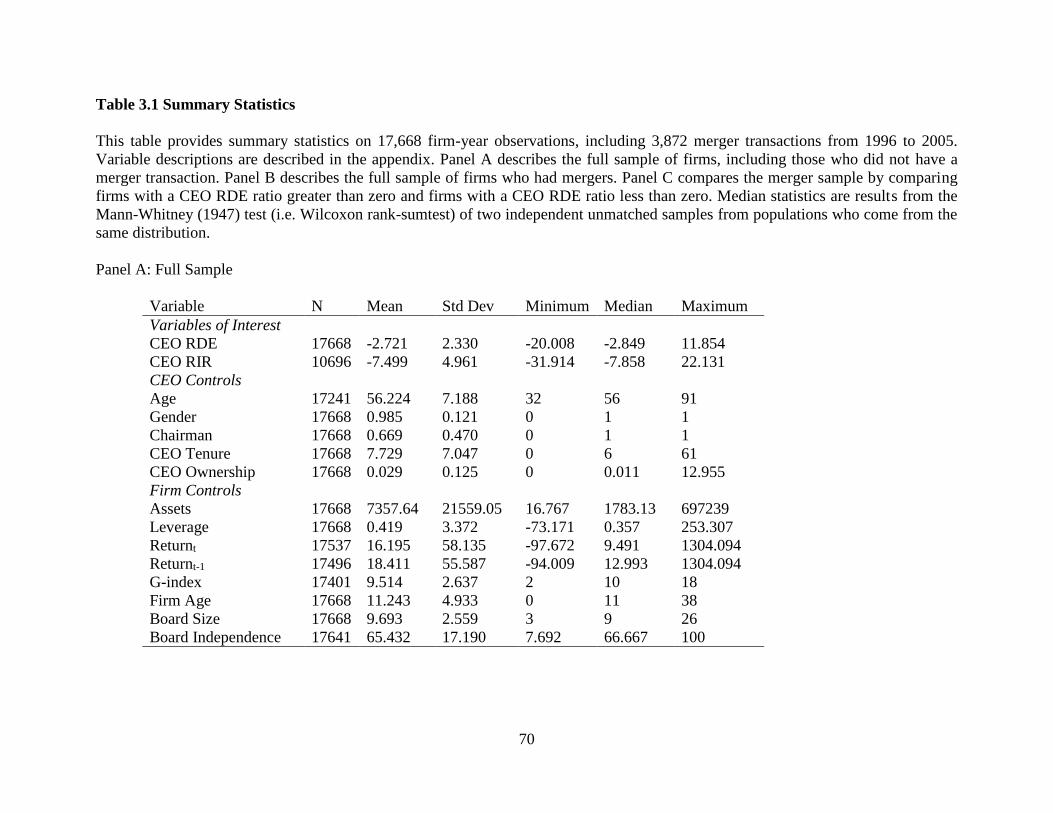
70
Table 3.1 Summary Statistics
This table provides summary statistics on 17,668 firm-year observations, including 3,872 merger transactions from 1996 to 2005.
Variable descriptions are described in the appendix. Panel A describes the full sample of firms, including those who did not have a
merger transaction. Panel B describes the full sample of firms who had mergers. Panel C compares the merger sample by comparing
firms with a CEO RDE ratio greater than zero and firms with a CEO RDE ratio less than zero. Median statistics are results from the
Mann-Whitney (1947) test (i.e. Wilcoxon rank-sumtest) of two independent unmatched samples from populations who come from the
same distribution.
Panel A: Full Sample
Variable N Mean Std Dev Minimum Median Maximum
Variables of Interest
CEO RDE 17668 -2.721 2.330 -20.008 -2.849 11.854
CEO RIR 10696 -7.499 4.961 -31.914 -7.858 22.131
CEO Controls
Age 17241 56.224 7.188 32 56 91
Gender 17668 0.985 0.121 0 1 1
Chairman 17668 0.669 0.470 0 1 1
CEO Tenure 17668 7.729 7.047 0 6 61
CEO Ownership 17668 0.029 0.125 0 0.011 12.955
Firm Controls
Assets 17668 7357.64 21559.05 16.767 1783.13 697239
Leverage 17668 0.419 3.372 -73.171 0.357 253.307
Returnt 17537 16.195 58.135 -97.672 9.491 1304.094
Returnt-1 17496 18.411 55.587 -94.009 12.993 1304.094
G-index 17401 9.514 2.637 2 10 18
Firm Age 17668 11.243 4.933 0 11 38
Board Size 17668 9.693 2.559 3 9 26
Board Independence 17641 65.432 17.190 7.692 66.667 100
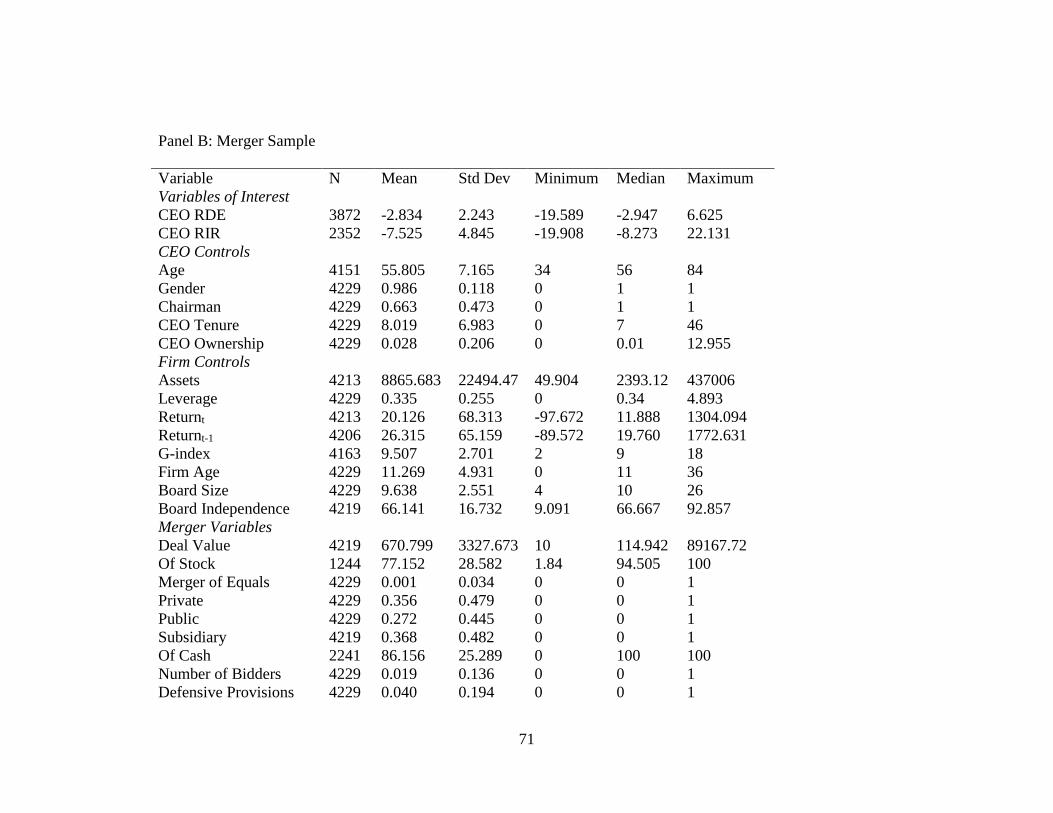
71
Panel B: Merger Sample
Variable N Mean Std Dev Minimum Median Maximum
Variables of Interest
CEO RDE 3872 -2.834 2.243 -19.589 -2.947 6.625
CEO RIR 2352 -7.525 4.845 -19.908 -8.273 22.131
CEO Controls
Age 4151 55.805 7.165 34 56 84
Gender 4229 0.986 0.118 0 1 1
Chairman 4229 0.663 0.473 0 1 1
CEO Tenure 4229 8.019 6.983 0 7 46
CEO Ownership 4229 0.028 0.206 0 0.01 12.955
Firm Controls
Assets 4213 8865.683 22494.47 49.904 2393.12 437006
Leverage 4229 0.335 0.255 0 0.34 4.893
Returnt 4213 20.126 68.313 -97.672 11.888 1304.094
Returnt-1 4206 26.315 65.159 -89.572 19.760 1772.631
G-index 4163 9.507 2.701 2 9 18
Firm Age 4229 11.269 4.931 0 11 36
Board Size 4229 9.638 2.551 4 10 26
Board Independence 4219 66.141 16.732 9.091 66.667 92.857
Merger Variables
Deal Value 4219 670.799 3327.673 10 114.942 89167.72
Of Stock 1244 77.152 28.582 1.84 94.505 100
Merger of Equals 4229 0.001 0.034 0 0 1
Private 4229 0.356 0.479 0 0 1
Public 4229 0.272 0.445 0 0 1
Subsidiary 4219 0.368 0.482 0 0 1
Of Cash 2241 86.156 25.289 0 100 100
Number of Bidders 4229 0.019 0.136 0 0 1
Defensive Provisions 4229 0.040 0.194 0 0 1

72
Tender Offer 4229 0.080 0.271 0 0 1
Hostile 4229 0.019 0.135 0 0 1
Public * Cash 4229 0.085 0.278 0 0 1
Public * Stock 4229 0.073 0.260 0 0 1
Private * Cash 4229 0.118 0.323 0 0 1
Private * Stock 4229 0.060 0.238 0 0 1
Subsidiary * Cash 4229 0.154 0.361 0 0 1
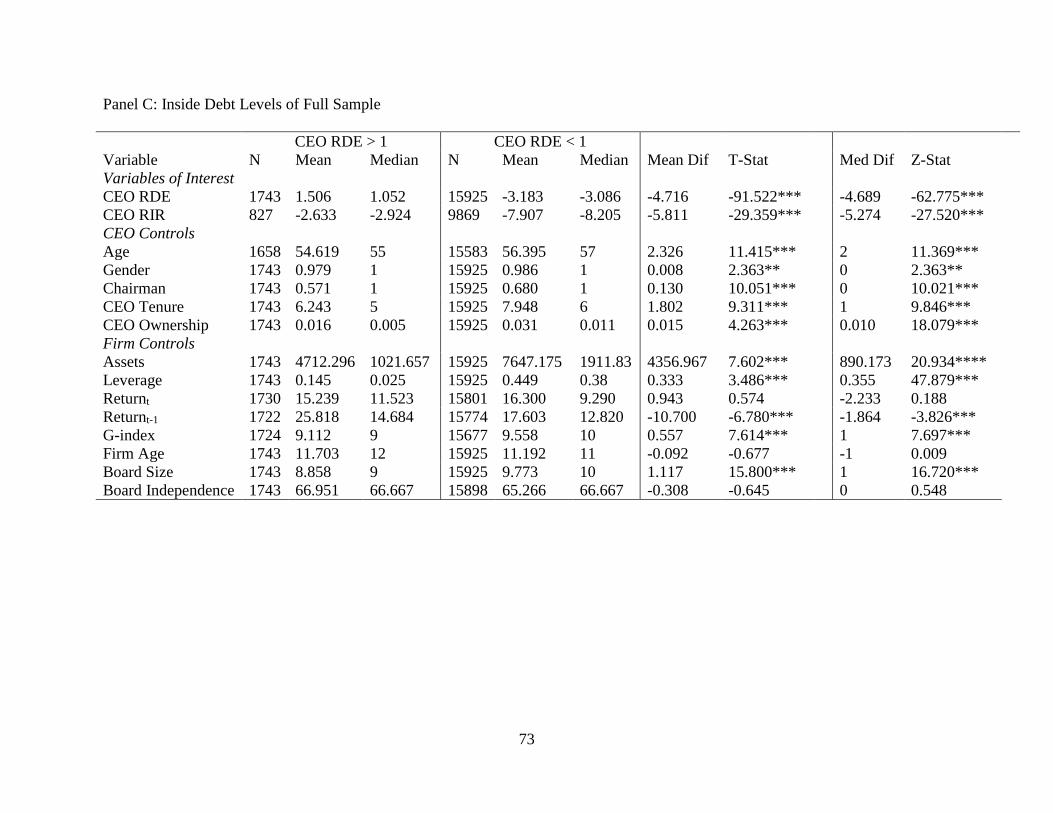
73
Panel C: Inside Debt Levels of Full Sample
CEO RDE > 1 CEO RDE < 1
Variable N Mean Median N Mean Median Mean Dif T-Stat Med Dif Z-Stat
Variables of Interest
CEO RDE 1743 1.506 1.052 15925 -3.183 -3.086 -4.716 -91.522*** -4.689 -62.775***
CEO RIR 827 -2.633 -2.924 9869 -7.907 -8.205 -5.811 -29.359*** -5.274 -27.520***
CEO Controls
Age 1658 54.619 55 15583 56.395 57 2.326 11.415*** 2 11.369***
Gender 1743 0.979 1 15925 0.986 1 0.008 2.363** 0 2.363**
Chairman 1743 0.571 1 15925 0.680 1 0.130 10.051*** 0 10.021***
CEO Tenure 1743 6.243 5 15925 7.948 6 1.802 9.311*** 1 9.846***
CEO Ownership 1743 0.016 0.005 15925 0.031 0.011 0.015 4.263*** 0.010 18.079***
Firm Controls
Assets 1743 4712.296 1021.657 15925 7647.175 1911.83 4356.967 7.602*** 890.173 20.934****
Leverage 1743 0.145 0.025 15925 0.449 0.38 0.333 3.486*** 0.355 47.879***
Returnt 1730 15.239 11.523 15801 16.300 9.290 0.943 0.574 -2.233 0.188
Returnt-1 1722 25.818 14.684 15774 17.603 12.820 -10.700 -6.780*** -1.864 -3.826***
G-index 1724 9.112 9 15677 9.558 10 0.557 7.614*** 1 7.697***
Firm Age 1743 11.703 12 15925 11.192 11 -0.092 -0.677 -1 0.009
Board Size 1743 8.858 9 15925 9.773 10 1.117 15.800*** 1 16.720***
Board Independence 1743 66.951 66.667 15898 65.266 66.667 -0.308 -0.645 0 0.548

74
Panel D: Inside Debt Levels of Merger Sample
CEO RDE > 1 CEO RDE < 1
Variable N Mean Median N Mean Median Mean Dif T-Stat Med Dif Z-Stat
Variables of Interest
CEO RDE 345 1.590 1.208 3527 -3.256 -3.189 -4.913 -44.765*** -4.397 -27.899***
CEO RIR 149 -3.931 -4.504 2213 -7.751 -8.639 -3.837 -7.447*** -3.247 -8.115***
CEO Controls
Age 330 53.545 53.500 3471 56.344 56 3.276 7.262*** 2.5 7.894***
Gender 345 0.994 1 3527 0.985 1 -0.015 -2.049** 0 -2.048**
Chairman 345 0.565 1 3527 0.688 1 0.143 4.953*** 0 4.937***
CEO Tenure 345 6.371 6 3527 8.212 7 1.916 4.414*** 1 4.110***
CEO Ownership 345 0.012 0.004 3527 0.03 0.011 0.017 1.268 0.013 8.602***
Firm Controls
Assets 345 6901.98 2092.187 3527 9640.868 2850.500 4721.872 3.233*** 758.313 7.432***
Leverage 345 0.127 0.015 3527 0.388 0.378 0.291 20.038*** 0.363 21.257***
Returnt 345 7.302 5.059 3527 20.806 12.599 14.824 3.472*** 7.540 3.722***
Returnt-1 343 27.332 22.386 3506 24.790 19.678 -6.396 -1.870* -2.708 -2.660**
G-index 344 9.070 9 3467 9.692 10 0.740 4.401*** 1 4.690***
Firm Age 345 12.829 13 3527 11.120 11 -1.286 -4.214*** -2 -3.504***
Board Size 345 9.252 9 3527 9.892 10 0.843 5.381*** 1 6.300***
Board Independence 345 67.110 66.667 3517 66.122 69.231 0.601 0.573 2.564 0.968
Merger Variables
Deal Value 345 1234.125 80.000 3527 640.886 121.637 0.037 1.337 41.637 1.690*
Of Stock 345 24.677 0 3527 21.647 0 -7.684 -3.231*** 0 -2.892***
Merger of Equals 345 0.003 0 3527 0.001 0 0.001 0.498 0 0.498
Private 345 0.443 0 3527 0.334 0 -0.164 -5.605*** 0 -5.582***
Public 345 0.264 0 3527 0.276 0 0.027 0.977 0 0.977
Subsidiary 345 0.293 0 3527 0.386 0 0.133 4.422*** 0 4.412***
Of Cash 345 53.048 77.780 3527 44.862 22.680 -3.144 -1.086 -55.100 -0.947
Number of Bidders 345 0.029 0 3527 0.018 0 -0.014 -1.612 0 -1.611
Defensive Provisions 345 0.017 0 3527 0.039 0 0.020 1.622* 0 1.621*

75
Tender Offer 345 0.093 0 3527 0.081 0 -0.009 -0.514 0 0.607
Hostile 345 0.014 0 3527 0.019 0 0.002 0.226 0 0.226
Public * Cash 345 0.130 0 3527 0.083 0 -0.022 -1.260 0 -1.260
Public * Stock 345 0.061 0 3527 0.070 0 -0.003 0.178 0 0.178
Private * Cash 345 0.148 0 3527 0.110 0 -0.043 -2.190** 0 -2.189**
Private * Stock 345 0.136 0 3527 0.048 0 -0.117 -8.117*** 0 -8.046***
Subsidiary * Cash 345 0.168 0 3527 0.157 0 -0.009 -0.403 0 0.403
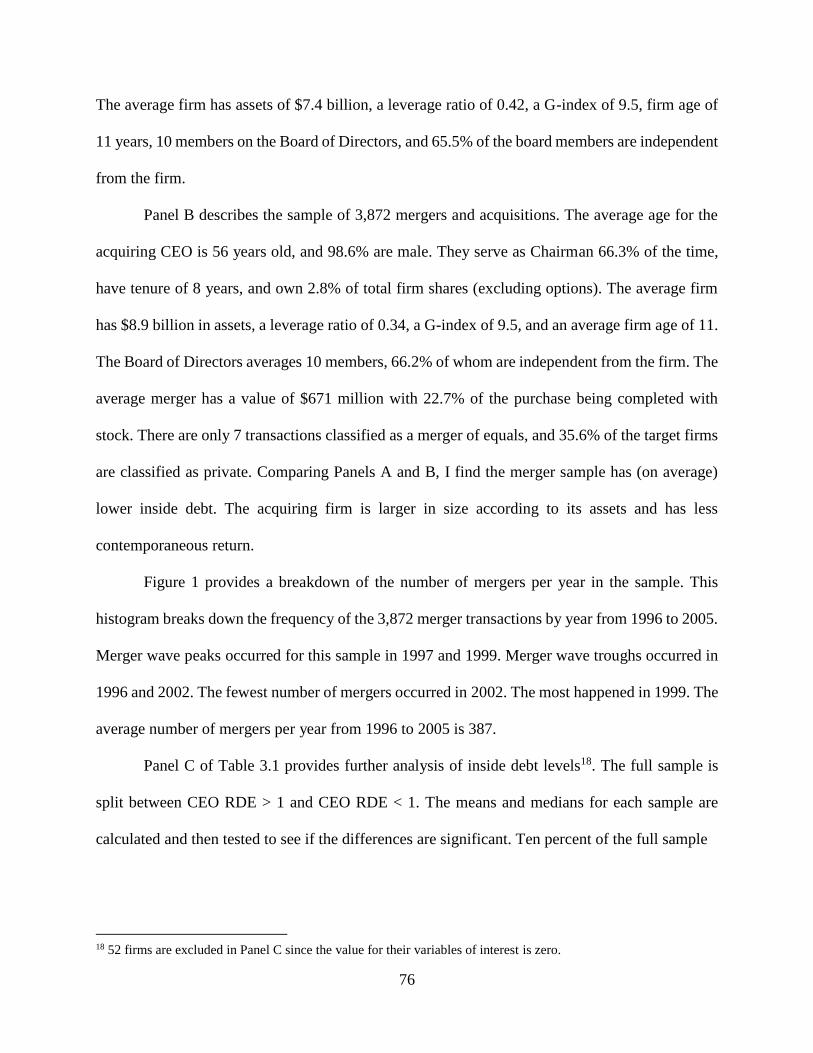
76
The average firm has assets of $7.4 billion, a leverage ratio of 0.42, a G-index of 9.5, firm age of
11 years, 10 members on the Board of Directors, and 65.5% of the board members are independent
from the firm.
Panel B describes the sample of 3,872 mergers and acquisitions. The average age for the
acquiring CEO is 56 years old, and 98.6% are male. They serve as Chairman 66.3% of the time,
have tenure of 8 years, and own 2.8% of total firm shares (excluding options). The average firm
has $8.9 billion in assets, a leverage ratio of 0.34, a G-index of 9.5, and an average firm age of 11.
The Board of Directors averages 10 members, 66.2% of whom are independent from the firm. The
average merger has a value of $671 million with 22.7% of the purchase being completed with
stock. There are only 7 transactions classified as a merger of equals, and 35.6% of the target firms
are classified as private. Comparing Panels A and B, I find the merger sample has (on average)
lower inside debt. The acquiring firm is larger in size according to its assets and has less
contemporaneous return.
Figure 1 provides a breakdown of the number of mergers per year in the sample. This
histogram breaks down the frequency of the 3,872 merger transactions by year from 1996 to 2005.
Merger wave peaks occurred for this sample in 1997 and 1999. Merger wave troughs occurred in
1996 and 2002. The fewest number of mergers occurred in 2002. The most happened in 1999. The
average number of mergers per year from 1996 to 2005 is 387.
Panel C of Table 3.1 provides further analysis of inside debt levels18. The full sample is
split between CEO RDE > 1 and CEO RDE < 1. The means and medians for each sample are
calculated and then tested to see if the differences are significant. Ten percent of the full sample
18 52 firms are excluded in Panel C since the value for their variables of interest is zero.

77
Figure 3.1: Number of Mergers by Year
This histogram breaks down the frequency of the 3,872 merger transactions by year from
1996 to 2005. Merger wave peaks occurred for this sample in 1997 and 1999. Merger wave
troughs occurred in 1996 and 2002. The fewest number of mergers occurred in 2002. The most
happened in 1999. The average number of mergers per year from 1996 to 2005 is 387.
has high inside CEO debt. High inside debt firms have a CEO who is younger, less likely to be
male, less likely to be Chairman, has less tenure, and owns less company stock. Higher inside debt
firms have fewer assets, less leverage19, a smaller G-index, and smaller board size. The T-Statistics
for the differences in the sample means is highly significant for all variables except
contemporaneous return. The Z-Statistics for the differences in the sample medians using the
Mann-Whitney (1947) statistic are significant for all variables where the T-statistics were
significant.
Panel D of Table 3.1 provides a breakdown of acquirers who have a high amount of CEO
inside debt versus those with a low amount. The results are similar to Panel C. Contemporaneous
19 This may be due to a mechanical relationship between inside debt and leverage.

78
return is higher for firms with lower levels of inside debt. With respect to the merger variables,
high inside debt firms have higher deal values, are more likely to engage in private or subsidiary
deals, use more cash, and have fewer defensive provisions.
3.4. Empirical Results
I begin by analyzing the association between inside debt and the probability of an M&A.
Table 3.2 analyzes the likelihood of a merger in the presence of inside debt. All analyses calculate
standard errors with a robust heteroskedasticity covariance matrix and firm clustering. In each
panel, I report models using both measures of CEO inside debt first with only CEO controls,
second with only firm controls and then third both CEO and firm controls. Panel A contains logistic
regressions of the full sample, where the dependent variable is an indicator if a merger occurred in
the year. CEO RDE has a consistent and statistically negative coefficient in all models, which
means higher CEO inside debt is associated with a lower probability of the firm initiating an
acquisition. CEO RDE goes from -0.043 with only firm controls to -0.052 in the models with CEO
controls only and both CEO and firm controls, respectively. CEO RIR is negative but statistically
insignificant in all models. CEO RIR goes from -0.012 with only CEO controls to -0.004 with only
firm controls to -0.008 with both firm and CEO controls. The coefficient on Model 5 is interpreted
as a 1% increase in the standard deviation of the log of CEO RDE decreases the M&A propensity
by 12.5%. Other controls indicate larger firms tend to acquire or merge less often than smaller size
firms. Firms with higher shareholder returns in the current or previous year are more likely to
acquire. Firms with more independent boards are more likely to engage in an M&A. In the full
model with CEO RDE, 8% of the variation is explained with the model.

79
Table 3.2: Merger Likelihood Association with CEO Inside Debt
This table provides analysis on the likelihood of a merger given the presence of CEO inside debt. Panel A
provides logistic regression analysis. The dependent variable is an indicator if a merger transaction occurred with
the firm in a given year. Panel B provides Poisson regression analysis of the full sample. Panel C provides Poisson
regression analysis of the merger sample. The dependent variable in Panels B and C is a count of mergers by the
firm over the sample period from 1996 to 2005. See the appendix for variable definitions. Industry controls are
also provided using the Fama-French 48 industry classifications. Year fixed effects are included in all models. All
errors in brackets are clustered by firm. Significance is depicted by *, **, and *** at the 10%, 5%, and 1% levels,
respectively.
Panel A: Logistic Models of Merger Likelihood
Variable Model 1 Model 2 Model 3 Model 4 Model 5 Model 6
Variables of
Interest
CEO RDE -0.054*** -0.043** -0.052**
[0.021] [0.021] [0.024]
CEO RIR -0.012 -0.004 -0.008
[0.013] [0.013] [0.014]
CEO Controls
Age -0.002 0.008 -0.004 0.007
[0.007] [0.009] [0.008] [0.010]
Gender 0.042 0.054 0.081 0.049
[0.224] [0.269] [0.231] [0.292]
Chairman 0.043 -0.074 -0.152 -0.25
[0.112] [0.150] [0.113] [0.164]
CEO Tenure 0.004 0.005 0.007 0.009
[0.005] [0.006] [0.005] [0.006]
CEO Ownership -0.407 -1.552 -0.092 -0.66
[1.056] [1.149] [0.343] [0.638]
Firm Controls
Log (Assets) 0.309*** 0.317*** 0.320*** 0.329***
[0.041] [0.054] [0.040] [0.050]
Leveraget-1 -0.806*** -1.000*** -0.798** -1.010***
[0.311] [0.289] [0.323] [0.290]
Returnt 0.001 0 0.001 0
[0.001] [0.001] [0.001] [0.002]
Returnt-1 0.002*** 0.006*** 0.002*** 0.006***
[0.001] [0.001] [0.001] [0.001]
G-Index 0.019 0.033* 0.023 0.034*
[0.015] [0.019] [0.015] [0.020]
Firm Age -0.001 -0.002 -0.002 -0.005
[0.009] [0.010] [0.009] [0.011]
Board Size -0.037* -0.037 -0.038* -0.045
[0.021] [0.028] [0.022] [0.027]
Board
Independence 0.001 0 0.001 0.001
[0.003] [0.004] [0.003] [0.004]
Constant -1.864*** -0.983 -3.485*** -2.184*** -3.416*** -2.551**
[0.671] [1.058] [0.566] [0.816] [0.717] [1.106]
Pseudo R2 0.04 0.05 0.06 0.08 0.07 0.08
Observations 16252 9882 16178 9857 15798 9665

80
Panel B: Poisson Models of Merger Count from Full Sample
Variable Model 1 Model 2 Model 3 Model 4 Model 5 Model 6
Variables of
Interest
CEO RDE -0.045*** -0.022 -0.025*
[0.015] [0.014] [0.015]
CEO RIR -0.007 0.004 0.001
[0.009] [0.009] [0.010]
CEO Controls
Age 0 0.008 -0.002 0.006
[0.005] [0.007] [0.005] [0.007]
Gender 0.059 0.039 0.154 0.123
[0.170] [0.189] [0.182] [0.216]
Chairman 0.038 -0.059 -0.088 -0.18
[0.083] [0.108] [0.084] [0.114]
CEO Tenure 0.005 0.004 0.007** 0.006
[0.004] [0.005] [0.003] [0.005]
CEO Ownership -0.302 -1.169 -0.022 -0.398
[0.751] [0.828] [0.192] [0.465]
Firm Controls
Log (Assets) 0.218*** 0.211*** 0.225*** 0.216***
[0.028] [0.038] [0.028] [0.036]
Leveraget-1 -0.027*** -0.029*** -0.027*** -0.027***
[0.005] [0.006] [0.006] [0.006]
Returnt 0.001 0 0.001 0
[0.001] [0.001] [0.001] [0.001]
Returnt-1 0.002*** 0.003*** 0.002*** 0.003***
[0.000] [0.001] [0.000] [0.001]
G-Index 0.012 0.017 0.015 0.017
[0.010] [0.014] [0.010] [0.014]
Firm Age -0.003 -0.002 -0.005 -0.004
[0.007] [0.007] [0.007] [0.007]
Board Size -0.031** -0.023 -0.030* -0.028
[0.015] [0.020] [0.016] [0.019]
Board
Independence -0.001 -0.001 -0.001 -0.001
[0.002] [0.003] [0.002] [0.003]
Constant -2.107*** -1.379* -3.159*** -2.118*** -3.258*** -2.570***
[0.519] [0.744] [0.455] [0.517] [0.545] [0.739]
Pseudo R2 0.03 0.03 0.05 0.05 0.05 0.05
Observations 16318 9949 16243 9923 15863 9731

81
Panel C: Poisson Models of Merger Count from Merger Sample
Variable Model 1 Model 2 Model 3 Model 4 Model 5 Model 6
Variables of
Interest
CEO RDE -0.007** -0.006*** -0.004**
[0.003] [0.002] [0.002]
CEO RIR 0.001 0 0
[0.001] [0.001] [0.001]
CEO Controls
Age 0.002* 0.002 0.002* 0.001
[0.001] [0.001] [0.001] [0.001]
Gender 0.032* 0.001 0.029 0.005
[0.019] [0.005] [0.019] [0.009]
Chairman 0.001 -0.008 0.007 0.001
[0.009] [0.010] [0.007] [0.008]
CEO Tenure 0.002* 0 0.001* 0
[0.001] [0.001] [0.001] [0.001]
CEO Ownership -0.001 0.103 0 0.053
[0.005] [0.100] [0.005] [0.076]
Firm Controls
Log (Assets) 0.001 -0.009 0.001 -0.008*
[0.004] [0.005] [0.004] [0.005]
Leveraget-1 0 0.001 0 0.001
[0.000] [0.001] [0.000] [0.001]
Returnt 0.001** 0.000* 0.001** 0.000*
[0.000] [0.000] [0.000] [0.000]
Returnt-1 0 0 0 0
[0.000] [0.000] [0.000] [0.000]
G-Index 0 -0.004** 0 -0.004**
[0.002] [0.002] [0.002] [0.002]
Firm Age -0.001 -0.001 -0.002* -0.001
[0.001] [0.001] [0.001] [0.001]
Board Size -0.001 0.004 -0.001 0.004
[0.003] [0.002] [0.002] [0.002]
Board
Independence -0.001*** -0.001** -0.001*** -0.001**
[0.000] [0.000] [0.000] [0.000]
Constant -0.181** -0.105 0.04 0.107* -0.099 -0.008
[0.090] [0.088] [0.039] [0.057] [0.079] [0.091]
Pseudo R2 0 0 0 0 0 0
Observations 3607 2216 3584 2192 3519 2167

82
The next two panels analyze the number of acquisitions taking place in a given firm-year
in the 11-year period. Panel B displays Poisson regressions using the full sample, where the
dependent variable is a count of mergers for the particular firm in a given year. CEO RDE is
negative and significant in all models. CEO RIR remains insignificant. I now find larger firms tend
to have more mergers than smaller firms. Small firms are less likely to survive as time progresses,
either through bankruptcy or becoming a target itself. Lagged leverage is negative and significant,
meaning firms with higher leverage tend to have fewer mergers. Lagged return remains positive
and significant. Larger boards tend to govern in a manner which reduces the total count of mergers.
The full models yield the highest amount of explanatory power with a Pseudo-R2 of 5%.
Panel C provides an additional robustness check of Panel B using only the merger sample.
I find similar results. CEO RDE is negative and significant in all models. Thus, I find merger count
declines as inside debt increases in the presence of the other controls. Note the significance of the
controls has declined sharply in comparison to Panels A and B. CEO age and tenure are positively
associated with M&A count at the 10% level. Size is negative and statistically significant at the
10% level. Firms with higher contemporaneous return, a lower g-index, higher board size, and
lower board independence are likely to have more mergers take place over the sample period. The
results from this analysis are consistent with H120.
The next series of tests analyze specific merger decisions. The dependent variable is an
indicator of diversification using two- digit SIC codes. If the acquiring firm and target firm have a
20 In unreported results, I test the full sample with a zero-inflated Poisson (ZIP) model and find similar results.

83
different two-digit SIC code, the indicator becomes a one, zero otherwise. Independent variables
are inside debt measures and controls pertaining to the CEO, firm, and the merger itself. Table 3.3
presents logistic regressions of diversification.The Pseudo-R2 of all regressions falls between 13%
and 23%. I find CEO RIR is negative and statistically significant at the 1% level for all models,
which is consistent with H2b21. A one-percent increase in CEO RIR decreases the likelihood of
diversification by 6.4%. Thus, firms who pay their CEOs with more inside debt tend to err on the
side of synergy versus diversification in improving the firm through M&A investment. Firms with
CEOs who have lower tenure and more ownership tend to diversify more. Firms with higher lagged
leverage, a higher g-index, and more members on the board tend to choose targets with a different
two-digit SIC. Acquirers tend to use less cash for diversifying mergers, and they choose
subsidiaries to gain diversification benefits.
The next merger decision involves the proportion of acquisition payment in stock. Table
3.4 analyzes inside debt on the firm’s decisions of how to pay for the merger or acquisition using
double-sided censored22 Tobit regressions since some firms cannot use stock due to a low supply
or other firm constraints. In this analysis, I do not include proportions of stock and cash or
interactions between them and the public status indicators due to multicollinearity concerns. In
the full specifications, I find both CEO RDE and CEO RIR are statistically positive and
significant at the 1% level. A one-standard deviation increase in CEO RDE (CEO RIR) increases
21 In unreported results, I test diversification using other measures, such as Fama-French 12 and 48 industry
classifications, as well as one-digit, three-digit, and four-digit SIC codes. I find similar results for CEO RDE using
FF12 and CEO RIR using FF48, one-digit, three-digit, and four-digit SIC codes. 22 The upper and lower limits are 100% and 0%, respectively.

84
Table 3.3: Diversification and Acquirer Inside Debt
This table provides analysis of logistic models on the diversification choice of a target given the
presence of CEO inside debt. The dependent variable is an indicator if the acquirer and target
have a different Fama-French 12 industry classification. See the appendix for variable
definitions. Year and industry controls using the Fama-French 48 industry classifications are
included in all models. All errors in brackets are clustered by firm. Significance is depicted by
*, **, and *** at the 10%, 5%, and 1% levels, respectively.
Variable Model 1 Model 2 Model 3 Model 4 Model 5 Model 6
Variables of Interest
CEO RDE -0.014 -0.017 -0.012
[0.043] [0.039] [0.040]
CEO RIR -0.073*** -0.097*** -0.075***
[0.026] [0.029] [0.028]
CEO Controls
Age -0.006 -0.007 -0.013 -0.009
[0.011] [0.015] [0.011] [0.015]
Gender 0.958** 0.888* 0.607 0.271
[0.421] [0.501] [0.499] [0.594]
Chairman 0.327* 0.244 0.275 0.194
[0.183] [0.247] [0.193] [0.260]
CEO Tenure -0.023** -0.038*** -0.026** -0.042***
[0.011] [0.013] [0.010] [0.012]
CEO Ownership 1.472 6.094** 2.844* 9.210***
[1.248] [2.545] [1.501] [3.108]
Firm Controls
Log (Assets) 0.096 0.002 0.089 0.018
[0.073] [0.090] [0.071] [0.090]
Leveraget-1 0.022 0.059** 0.022 0.058**
[0.018] [0.027] [0.018] [0.028]
Returnt 0.003 0.003 0.003 0.002
[0.002] [0.004] [0.002] [0.004]
Returnt-1 0 0 0 0
[0.002] [0.003] [0.001] [0.003]
G-Index 0.043* 0.029 0.041* 0.03
[0.023] [0.031] [0.023] [0.031]
Firm Age -0.002 -0.001 0.004 0.011
[0.015] [0.016] [0.015] [0.017]
Board Size 0.084** 0.05 0.094** 0.072
[0.041] [0.051] [0.042] [0.052]

85
Board Independence 0.003 0.007 0.002 0.008
[0.004] [0.007] [0.005] [0.007]
Merger Controls
Private 1.16 1.48 1.255 1.202
[1.016] [1.315] [1.041] [1.203]
Public 1.017 1.34 1.123 1.098
[0.953] [1.229] [0.984] [1.115]
Subsidiary 0.83 1.24 0.951 1.015
[1.014] [1.297] [1.038] [1.181]
Of Stock 0.003 0.003 0.003 0.003
[0.004] [0.007] [0.004] [0.007]
Of Cash 0.005 0.009 0.005 0.009
[0.004] [0.006] [0.004] [0.006]
Number of Bidders -1.672** -2.014** -1.712** -2.056**
[0.665] [0.788] [0.677] [0.817]
Defensive Provisions 0.098 0.828 0.112 0.848
[0.407] [0.542] [0.397] [0.530]
Tender 0.303 0.188 0.309 0.21
[0.437] [0.531] [0.442] [0.546]
Hostile 1.525** 2.618*** 1.627** 2.703***
[0.664] [0.779] [0.676] [0.805]
Public * Cash 0.095 -0.128 0.051 -0.119
[0.445] [0.577] [0.453] [0.586]
Public * Stock -0.317 0.293 -0.267 0.402
[0.465] [0.614] [0.464] [0.614]
Private * Cash 0.333 0.201 0.36 0.25
[0.401] [0.557] [0.406] [0.559]
Private * Stock 0.354 0.398 0.366 0.432
[0.544] [0.758] [0.538] [0.765]
Subsidiary * Cash 0.384 0.291 0.302 0.261
[0.411] [0.533] [0.408] [0.529]
Constant 13.680*** 11.534*** 11.028*** 9.837*** 9.629*** 8.327***
[0.178] [1.683] [1.386] [1.786] [1.618] [2.199]
Pseudo R2 0.13 0.18 0.17 0.22 0.17 0.23
Observations 3607 2216 3584 2192 3519 2167

86
Table 3.4: Stock Payment in the Presence of CEO Inside Debt
This table provides analysis of Tobit models on the proportion of stock used in making a payment for the merger given the
presence of CEO inside debt in the sample period from 1996 to 2006. The dependent variable is the percentage of stock used as payment
in the merger transaction. Merger controls include if the transaction is considered a merger of equals and an indicator if the target firm
is private. See the appendix for variable definitions. Industry controls are also provided using the Fama-French 48 industry
classifications. Year fixed effects are included in all models. All errors in brackets are clustered by firm. Significance is depicted by
*,**, and *** at the 10%, 5%, and 1% levels, respectively.
Variable Model 1 Model 2 Model 3 Model 4 Model 5 Model 6
Variables of Interest
CEO RDE 7.692*** 3.720*** 6.235***
[1.018] [0.816] [0.866]
CEO RIR -1.047** 1.179*** 1.106***
[0.469] [0.407] [0.394]
CEO Controls
Age -1.386*** -0.452*** 0.632*** 0.834***
[0.091] [0.100] [0.082] [0.087]
Gender -4.88 -26.363*** 13.580*** 1.883
[5.136] [5.765] [4.669] [5.033]
Chairman -10.682** -17.706*** -17.794*** -36.054***
[4.569] [5.263] [3.937] [4.320]
CEO Tenure 0.835*** 0.851** 0.911*** 0.765***
[0.295] [0.351] [0.245] [0.287]
CEO Ownership -7.407* -88.602** 9.999*** 194.970***
[4.141] [43.550] [2.136] [26.808]
Firm Controls
Log (Assets) -13.571*** -1.431** -13.545*** 0.505
[0.542] [0.560] [0.562] [0.563]
Leveraget-1 20.947** 4.215 21.206** 4.622
[8.270] [3.246] [8.433] [4.365]
Returnt -0.053*** -0.003 -0.045*** 0.02
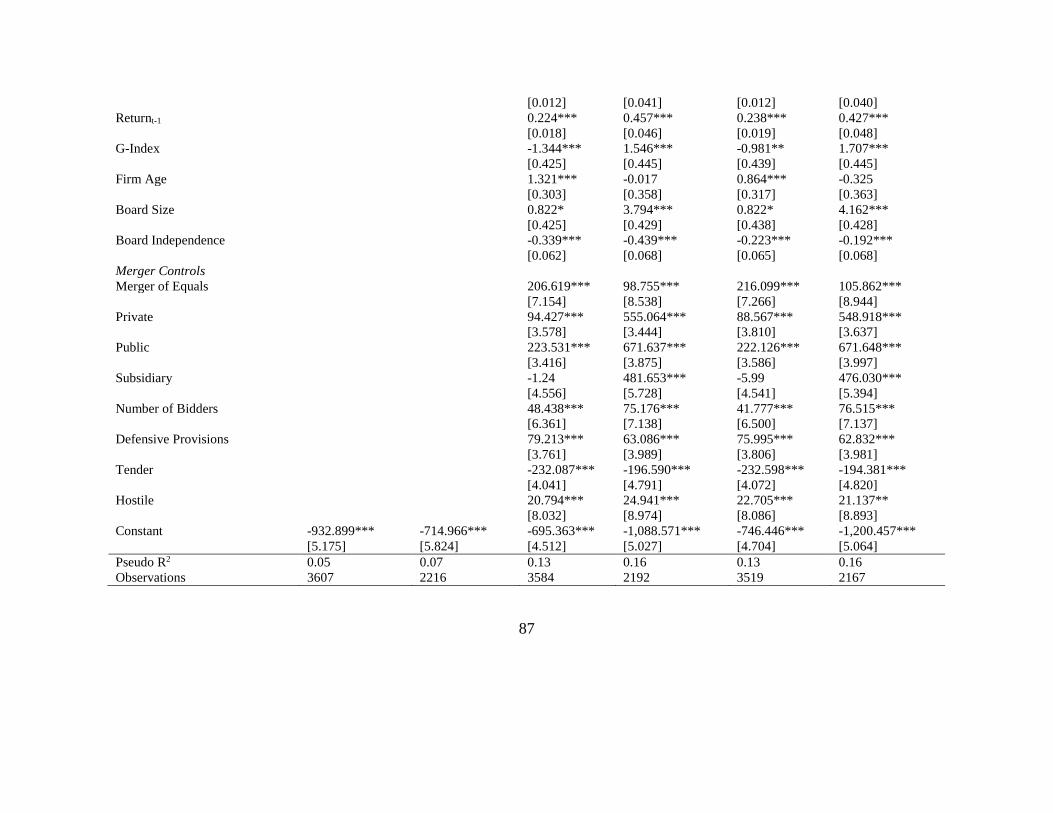
87
[0.012] [0.041] [0.012] [0.040]
Returnt-1 0.224*** 0.457*** 0.238*** 0.427***
[0.018] [0.046] [0.019] [0.048]
G-Index -1.344*** 1.546*** -0.981** 1.707***
[0.425] [0.445] [0.439] [0.445]
Firm Age 1.321*** -0.017 0.864*** -0.325
[0.303] [0.358] [0.317] [0.363]
Board Size 0.822* 3.794*** 0.822* 4.162***
[0.425] [0.429] [0.438] [0.428]
Board Independence -0.339*** -0.439*** -0.223*** -0.192***
[0.062] [0.068] [0.065] [0.068]
Merger Controls
Merger of Equals 206.619*** 98.755*** 216.099*** 105.862***
[7.154] [8.538] [7.266] [8.944]
Private 94.427*** 555.064*** 88.567*** 548.918***
[3.578] [3.444] [3.810] [3.637]
Public 223.531*** 671.637*** 222.126*** 671.648***
[3.416] [3.875] [3.586] [3.997]
Subsidiary -1.24 481.653*** -5.99 476.030***
[4.556] [5.728] [4.541] [5.394]
Number of Bidders 48.438*** 75.176*** 41.777*** 76.515***
[6.361] [7.138] [6.500] [7.137]
Defensive Provisions 79.213*** 63.086*** 75.995*** 62.832***
[3.761] [3.989] [3.806] [3.981]
Tender -232.087*** -196.590*** -232.598*** -194.381***
[4.041] [4.791] [4.072] [4.820]
Hostile 20.794*** 24.941*** 22.705*** 21.137**
[8.032] [8.974] [8.086] [8.893]
Constant -932.899*** -714.966*** -695.363*** -1,088.571*** -746.446*** -1,200.457***
[5.175] [5.824] [4.512] [5.027] [4.704] [5.064]
Pseudo R2 0.05 0.07 0.13 0.16 0.13 0.16
Observations 3607 2216 3584 2192 3519 2167

88
the proportion of stock used by 12.2% (5.2%). With respect to the full models, CEOs are more
likely to use stock if they are older, male, not the Chairman, have more tenure, and own more stock
in the company. Firms are more likely to use stock to pay for an M&A if lagged leverage is higher,
contemporaneous return is lower, lagged return is higher, board size is larger, and board
independence is lower. Acquisitions are more likely to have stock payments if the M&A is a
merger of equal, has more bidders and defensive provisions, and is considered hostile. Stock is
used to acquire private and subsidiary targets, whereas cash is preferred for public acquisitions.
Finally, I analyze how relative deal value is affected by inside CEO debt. Table 3.5 models CEO
inside debt on deal value scaled by the acquirer’s market value to measure the size effect in the
presence of inside debt. Using OLS, the full model of CEO RDE explains 28% of the variation. I
find CEO RDE is negative and significant in all models, which is consistent with H4b.
According to model 5, a 1% increase in CEO RDE decreases relative deal value by 1.5%. A one-
standard deviation increase in CEO RDE decreases relative deal value by 3.4%. Older CEOs
tend to choose lower-sized targets. Firms with larger size, lower contemporaneous return, and
lower board size engage in relatively smaller deals. Mergers are larger if it is considered a
merger of equals, has fewer bidders, is not a tender offer, and is considered hostile. Targets are
larger if stock is used more relative to cash. Private cash deals are relatively smaller by 30%.
3.5. Robustness
First, I analyze the level of inside debt. As demonstrated in the summary statistics, CEO
RDE has a widely skewed distribution, which is true of most components of executive
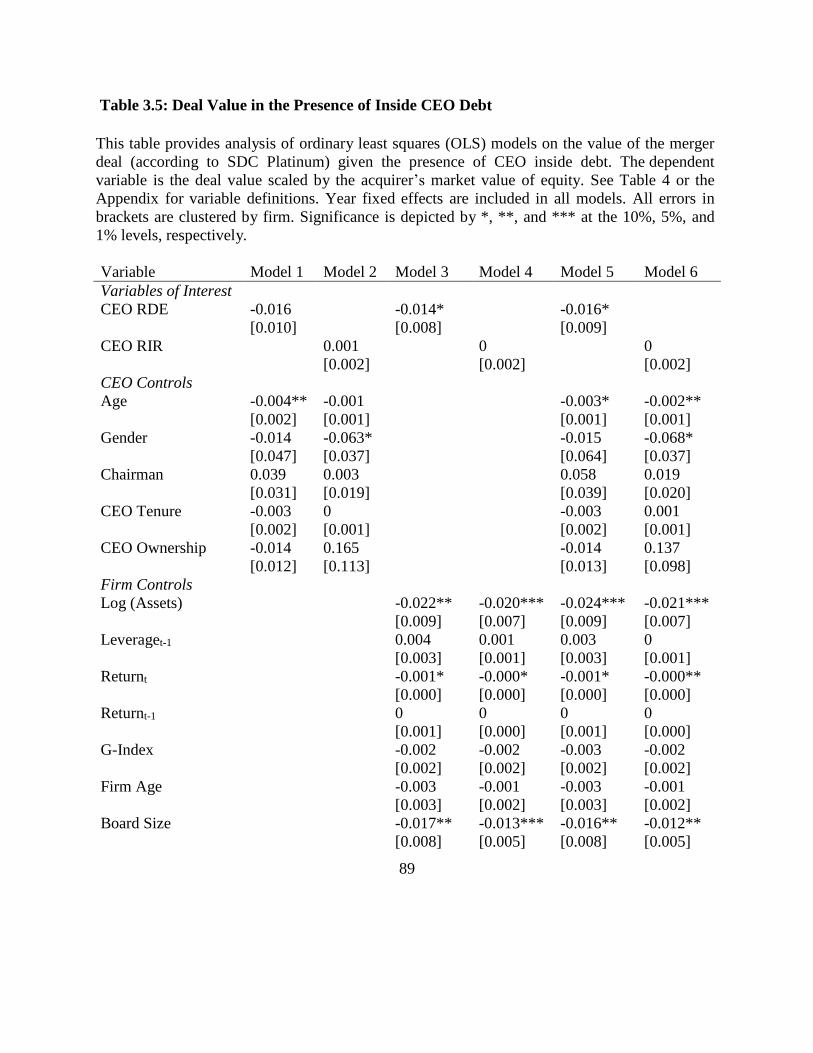
89
Table 3.5: Deal Value in the Presence of Inside CEO Debt
This table provides analysis of ordinary least squares (OLS) models on the value of the merger
deal (according to SDC Platinum) given the presence of CEO inside debt. The dependent
variable is the deal value scaled by the acquirer’s market value of equity. See Table 4 or the
Appendix for variable definitions. Year fixed effects are included in all models. All errors in
brackets are clustered by firm. Significance is depicted by *, **, and *** at the 10%, 5%, and
1% levels, respectively.
Variable Model 1 Model 2 Model 3 Model 4 Model 5 Model 6
Variables of Interest
CEO RDE -0.016 -0.014* -0.016*
[0.010] [0.008] [0.009]
CEO RIR 0.001 0 0
[0.002] [0.002] [0.002]
CEO Controls
Age -0.004** -0.001 -0.003* -0.002**
[0.002] [0.001] [0.001] [0.001]
Gender -0.014 -0.063* -0.015 -0.068*
[0.047] [0.037] [0.064] [0.037]
Chairman 0.039 0.003 0.058 0.019
[0.031] [0.019] [0.039] [0.020]
CEO Tenure -0.003 0 -0.003 0.001
[0.002] [0.001] [0.002] [0.001]
CEO Ownership -0.014 0.165 -0.014 0.137
[0.012] [0.113] [0.013] [0.098]
Firm Controls
Log (Assets) -0.022** -0.020*** -0.024*** -0.021***
[0.009] [0.007] [0.009] [0.007]
Leveraget-1 0.004 0.001 0.003 0
[0.003] [0.001] [0.003] [0.001]
Returnt -0.001* -0.000* -0.001* -0.000**
[0.000] [0.000] [0.000] [0.000]
Returnt-1 0 0 0 0
[0.001] [0.000] [0.001] [0.000]
G-Index -0.002 -0.002 -0.003 -0.002
[0.002] [0.002] [0.002] [0.002]
Firm Age -0.003 -0.001 -0.003 -0.001
[0.003] [0.002] [0.003] [0.002]
Board Size -0.017** -0.013*** -0.016** -0.012**
[0.008] [0.005] [0.008] [0.005]

90
Board Independence -0.001 -0.001 -0.002 -0.001*
[0.001] [0.000] [0.001] [0.000]
Merger Controls
Merger of Equals 0.976*** 0.721*** 0.966*** 0.729***
[0.321] [0.066] [0.342] [0.065]
Private -0.185*** -0.226** -0.179** -0.226**
[0.064] [0.102] [0.073] [0.103]
Public 0.029 0.024 0.029 0.02
[0.070] [0.106] [0.079] [0.107]
Subsidiary -0.127* -0.176* -0.117 -0.176*
[0.069] [0.103] [0.080] [0.104]
Of Stock 0.001*** 0.001 0.001*** 0.001
[0.000] [0.000] [0.000] [0.000]
Of Cash 0.001*** 0.001* 0.001*** 0.001**
[0.000] [0.000] [0.000] [0.000]
Number of Bidders 0.047 0.064 0.06 0.064
[0.058] [0.067] [0.056] [0.068]
Defensive Provisions -0.12 0.008 -0.117 0.004
[0.104] [0.039] [0.102] [0.039]
Tender 0.006 0.034 0.016 0.044
[0.042] [0.050] [0.040] [0.049]
Hostile 0.056 0.063 0.061 0.068
[0.064] [0.071] [0.063] [0.072]
Public * Cash -0.218*** -0.257*** -0.234*** -0.275***
[0.053] [0.056] [0.052] [0.058]
Public * Stock -0.04 -0.238*** -0.034 -0.233***
[0.171] [0.052] [0.171] [0.052]
Private * Cash -0.049 -0.033 -0.057 -0.047
[0.041] [0.034] [0.043] [0.034]
Private * Stock -0.133*** -0.073 -0.129*** -0.071
[0.050] [0.049] [0.049] [0.050]
Subsidiary * Cash -0.091** -0.069* -0.106*** -0.087**
[0.037] [0.037] [0.036] [0.037]
Constant 0.438** 0.205** 0.703*** 0.628*** 0.913*** 0.753***
[0.188] [0.086] [0.180] [0.112] [0.239] [0.146]
R2 3607 2216 3584 2192 3519 2167
Observations 0.04 0.09 0.11 0.27 0.12 0.28
91
compensation. To circumvent this, I analyze the indicator of log (RDE) > 023. The results of the
models are shown in Table 3.6 and reveal continued evidence in support of H1 and H3a. In results
not shown, I also tested the difference in the CEO and firm debt-to-equity ratios. I find the
hypotheses hold in all models pertaining to the merger only data24. I also test lags of inside debt
with respect to the models. I find the first lag of CEO RDE is robust only in the case of using more
stock to pay for M&A. The first and second lags of CEO RIR are robust in the cases of
diversification and stock payment. I also directly tests levels of inside debt not scaled by firm debt
and find no significant results.
Furthermore, I consider changes in firm risk after an M&A. Table 3.7 provides results
about volatilities of firms sorted by high and low levels of inside debt. Volatility is calculated as
the standard deviation of daily stock returns from the 70 trading days to 10 trading days before the
M&A and from 10 trading days to 70 trading days after the M&A. Volatility difference is
calculated as the difference between Volatility Before and Volatility After. I find firm risk before
the merger is higher for the firm who pays the CEO with high levels of inside debt. After the
merger event, the volatility after is lower, yielding a positive and significant difference, suggesting
CEOs with high levels of inside debt engage in M&A in order to lower risk. For firms with low
levels of inside debt, the opposite occurs. Firm risk increases after the M&A.
I also consider returns to investigate if long-term incentives affect M&A outcomes. I test
three-day and five-day cumulative abnormal returns (CARs) using the Fama-French three factor
23 This is the same measure used by Cassell et al. (2012), except I use the logarithmic transformation. Ln(1) = 0. 24 I would like to thank an anonymous seminar participant for this suggestion.
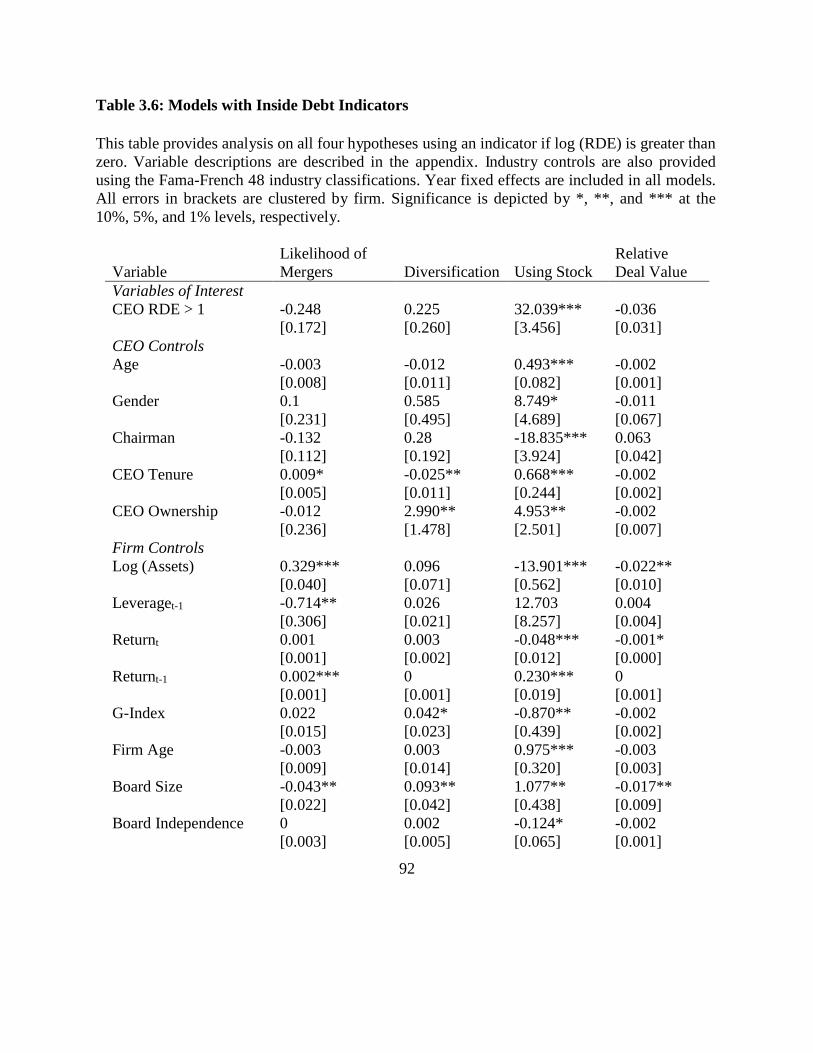
92
Table 3.6: Models with Inside Debt Indicators
This table provides analysis on all four hypotheses using an indicator if log (RDE) is greater than
zero. Variable descriptions are described in the appendix. Industry controls are also provided
using the Fama-French 48 industry classifications. Year fixed effects are included in all models.
All errors in brackets are clustered by firm. Significance is depicted by *, **, and *** at the
10%, 5%, and 1% levels, respectively.
Variable
Likelihood of
Mergers Diversification Using Stock
Relative
Deal Value
Variables of Interest
CEO RDE > 1 -0.248 0.225 32.039*** -0.036
[0.172] [0.260] [3.456] [0.031]
CEO Controls
Age -0.003 -0.012 0.493*** -0.002
[0.008] [0.011] [0.082] [0.001]
Gender 0.1 0.585 8.749* -0.011
[0.231] [0.495] [4.689] [0.067]
Chairman -0.132 0.28 -18.835*** 0.063
[0.112] [0.192] [3.924] [0.042]
CEO Tenure 0.009* -0.025** 0.668*** -0.002
[0.005] [0.011] [0.244] [0.002]
CEO Ownership -0.012 2.990** 4.953** -0.002
[0.236] [1.478] [2.501] [0.007]
Firm Controls
Log (Assets) 0.329*** 0.096 -13.901*** -0.022**
[0.040] [0.071] [0.562] [0.010]
Leveraget-1 -0.714** 0.026 12.703 0.004
[0.306] [0.021] [8.257] [0.004]
Returnt 0.001 0.003 -0.048*** -0.001*
[0.001] [0.002] [0.012] [0.000]
Returnt-1 0.002*** 0 0.230*** 0
[0.001] [0.001] [0.019] [0.001]
G-Index 0.022 0.042* -0.870** -0.002
[0.015] [0.023] [0.439] [0.002]
Firm Age -0.003 0.003 0.975*** -0.003
[0.009] [0.014] [0.320] [0.003]
Board Size -0.043** 0.093** 1.077** -0.017**
[0.022] [0.042] [0.438] [0.009]
Board Independence 0 0.002 -0.124* -0.002
[0.003] [0.005] [0.065] [0.001]

93
Merger Controls
Merger of Equals 218.559*** 0.974***
[7.467] [0.346]
Private 1.233 91.842*** -0.189***
[1.034] [3.958] [0.068]
Public 1.102 226.415*** 0.017
[0.976] [3.578] [0.073]
Subsidiary 0.925 -2.99 -0.127*
[1.031] [4.497] [0.073]
Of Stock 0.003 0.001***
[0.004] [0.000]
Of Cash 0.005 0.001***
[0.004] [0.000]
Number of Bidders -1.752** 47.069*** 0.048
[0.687] [6.361] [0.057]
Defensive Provisions 0.129 76.441*** -0.116
[0.397] [3.804] [0.102]
Tender 0.291 -232.401*** 0.011
[0.439] [4.092] [0.041]
Hostile 1.656** 19.292** 0.067
[0.684] [8.007] [0.062]
Public * Cash 0.036 -0.235***
[0.451] [0.053]
Public * Stock -0.287 -0.045
[0.466] [0.166]
Private * Cash 0.349 -0.058
[0.405] [0.043]
Private * Stock 0.327 -0.148***
[0.539] [0.052]
Subsidiary * Cash 0.298 -0.109***
[0.407] [0.037]
Constant -3.248*** 11.320*** -760.288*** 0.944***
[0.726] [1.477] [4.723] [0.254]
Pseudo R2 0.07 0.18 0.13
R2 0.11
Observations 15798 3459 3519 3519

94
Table 3.7: Risk and Return from M&A
This table provides t-tests and rank sum tests between volatility differences before and after the M&A through sorting by high and low
CEO RDE. Volatility before is the standard deviation of stock returns from 70 trading days before to 10 trading days before the M&A.
Volatility after is the standard deviation of stock returns from 10 trading days after to 70 trading days after the M&A. Volatility
difference is the difference between volatility before and volatility after. CARs are generated using a Fama-French three factor model
including momentum for data 120 days before to 5 days before an M&A. CAR(-1,1) is the sum of the cumulative abnormal returns
one day before through one day after the M&A. CAR(-2,2) is the sum of the cumulative abnormal returns two days before through
two days after the M&A.
CEO RDE > 1 CEO RDE < 1
Variable N Mean Median N Mean Median Mean Dif T-Stat Med Dif Z-Stat
Volatility
Before
345 0.319 0.03 3527 0.049 0.02 -0.270 -6.866*** -0.01 -3.287***
Volatility
After
345 0.054 0.03 3527 0.149 0.02 0.095 0.700 -0.01 -3.662***
Volatility
Difference
345 0.264 0.00 3527 -0.100 0.00 0.364 -2.583*** -0.00 -6.632***
CAR ( -1,1) 345 -0.866 -1.00 3527 -0.892 -1.00 0.026 -0.948 0.00 -1.831*
CAR (-2,2) 345 -0.866 -1.00 3527 -0.893 -1.00 0.027 -0.936 0.00 -1.808*

95
model with momentum to generate returns and use the initial merger announcement date as the
event date. I use data starting four months from the merger announcement to five trading days
before the announcement to generate the model. I find no statistical relationship between inside
debt and acquirer CARs.
The next robustness test concerns the first hypothesis of M&A propensity. Selection bias
may have occurred due to the limiting constraints of the M&A analyzed. Thus, I gather data from
Compustat concerning the value of acquisitions on the balance sheet. I use this as a dependent
variable and run OLS regressions in Table 3.8. I find CEO RDE and acquisitions have a negative
and statistically significant relationship at the 1% level, consistent with the primary results that
firms with higher inside debt have a lower M&A propensity.
I also directly test the relationship between inside debt and capital expenditures. Cassell et
al. (2012) cite the relationship should be negative but use R&D expenditure to test the hypothesis.
Coles et al. (2006) find a negative relationship between managerial risk-taking and capital
expenditures since investment in PP&E has a relatively lower risk than R&D. Table 3.9 presents
the results. I also control for the CEO Vega/Delta, which is the Core and Guay (2002) ratio of the
sensitivity of stock price volatility to the sensitivity of stock price. I find a positive association
between inside debt and capital expenditures with respect to CEO RIR and CEO RIRCA. The first
two models show a positive and statistically significant relationship between capital expenditures
and CEO Vega/Delta, but its magnitude is economically insignificant. For all models I find male
CEOs and firms with a lower G-index invest more in less risky capital expenditures.
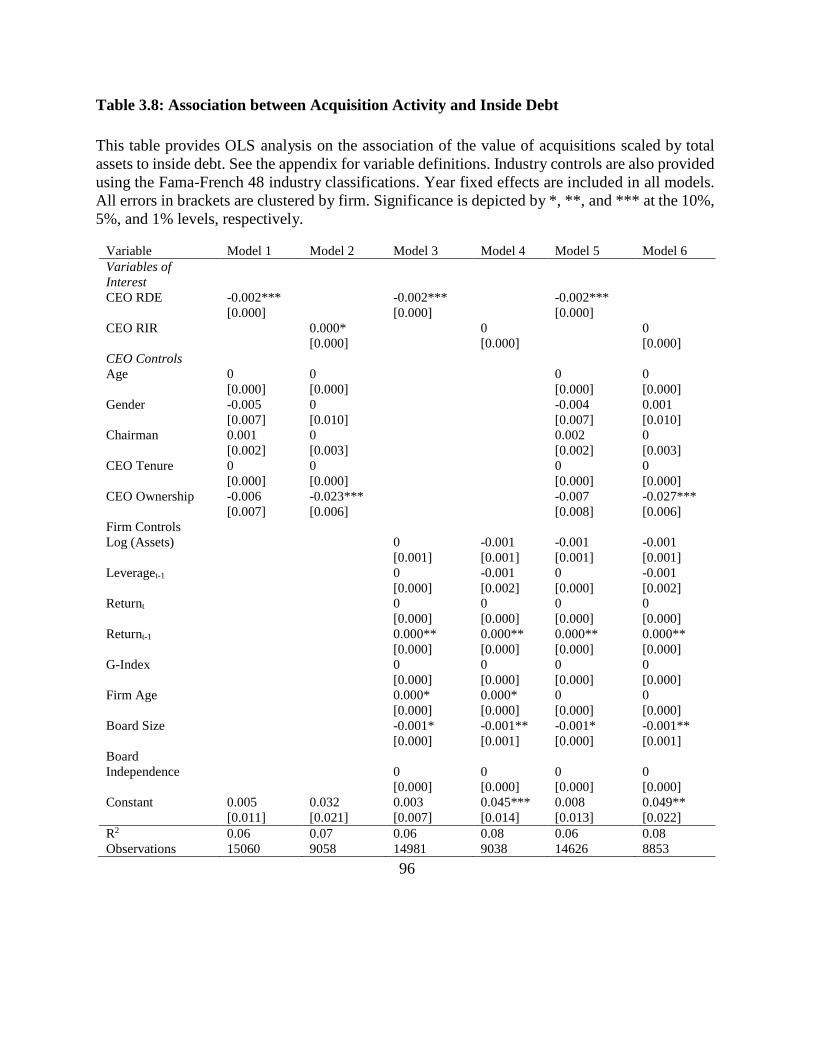
96
Table 3.8: Association between Acquisition Activity and Inside Debt
This table provides OLS analysis on the association of the value of acquisitions scaled by total
assets to inside debt. See the appendix for variable definitions. Industry controls are also provided
using the Fama-French 48 industry classifications. Year fixed effects are included in all models.
All errors in brackets are clustered by firm. Significance is depicted by *, **, and *** at the 10%,
5%, and 1% levels, respectively.
Variable Model 1 Model 2 Model 3 Model 4 Model 5 Model 6
Variables of
Interest
CEO RDE -0.002*** -0.002*** -0.002***
[0.000] [0.000] [0.000]
CEO RIR 0.000* 0 0
[0.000] [0.000] [0.000]
CEO Controls
Age 0 0 0 0
[0.000] [0.000] [0.000] [0.000]
Gender -0.005 0 -0.004 0.001
[0.007] [0.010] [0.007] [0.010]
Chairman 0.001 0 0.002 0
[0.002] [0.003] [0.002] [0.003]
CEO Tenure 0 0 0 0
[0.000] [0.000] [0.000] [0.000]
CEO Ownership -0.006 -0.023*** -0.007 -0.027***
[0.007] [0.006] [0.008] [0.006]
Firm Controls
Log (Assets) 0 -0.001 -0.001 -0.001
[0.001] [0.001] [0.001] [0.001]
Leveraget-1 0 -0.001 0 -0.001
[0.000] [0.002] [0.000] [0.002]
Returnt 0 0 0 0
[0.000] [0.000] [0.000] [0.000]
Returnt-1 0.000** 0.000** 0.000** 0.000**
[0.000] [0.000] [0.000] [0.000]
G-Index 0 0 0 0
[0.000] [0.000] [0.000] [0.000]
Firm Age 0.000* 0.000* 0 0
[0.000] [0.000] [0.000] [0.000]
Board Size -0.001* -0.001** -0.001* -0.001**
[0.000] [0.001] [0.000] [0.001]
Board
Independence 0 0 0 0
[0.000] [0.000] [0.000] [0.000]
Constant 0.005 0.032 0.003 0.045*** 0.008 0.049**
[0.011] [0.021] [0.007] [0.014] [0.013] [0.022]
R2 0.06 0.07 0.06 0.08 0.06 0.08
Observations 15060 9058 14981 9038 14626 8853

97
Table 3.9: Association between Capital Expenditures and Inside Debt
This table provides OLS analysis on the association of the value of capital expenditures scaled
by total assets to inside debt. CEO Vega/Delta is the Core and Guay (2002) ratio of the sensitivity
of stock price volatility to the sensitivity of stock price. See the appendix for variable definitions.
Industry controls are also provided using the Fama-French 48 industry classifications. Year fixed
effects are included in all models. All errors in brackets are clustered by firm. Significance is
depicted by *, **, and *** at the 10%, 5%, and 1% levels, respectively.
Model 1 Model 2 Model 3 Model 4
Variables of Interest
CEO RDE 0
[0.000]
CEO RDE > 1 -0.002
[0.003]
CEO RIR 0.001*
[0.000]
CEO RIRCA 0.001*
[0.000]
CEO Controls
CEO Vega/Delta 0.000*** 0.000*** 0 0
[0.000] [0.000] [0.000] [0.000]
CEO Age 0 0 0 0
[0.000] [0.000] [0.000] [0.000]
Gender 0.014*** 0.014*** 0.008* 0.008*
[0.004] [0.004] [0.005] [0.005]
Chairman -0.002 -0.003 0.001 0.001
[0.003] [0.003] [0.003] [0.003]
CEO Tenure 0 0 0 0
[0.000] [0.000] [0.000] [0.000]
CEO Ownership 0.004 0.003 0.01 0.01
[0.004] [0.004] [0.009] [0.009]
Firm Controls
Log (Assets) -0.003** -0.003** -0.002 -0.002
[0.001] [0.001] [0.001] [0.001]
Leveraget-1 0 0 0 0
[0.000] [0.000] [0.000] [0.000]
Returnt 0 0 0 0
[0.000] [0.000] [0.000] [0.000]
Returnt-1 0.000*** 0.000*** 0.000** 0.000**
[0.000] [0.000] [0.000] [0.000]

98
G-Index -0.001*** -0.001*** -0.001*** -0.001***
[0.000] [0.000] [0.000] [0.000]
Firm Age -0.001** -0.001** 0 0
[0.000] [0.000] [0.000] [0.000]
Board Size 0 0 0 0
[0.001] [0.001] [0.001] [0.001]
Board Independence 0 0 0 0
[0.000] [0.000] [0.000] [0.000]
Constant 0.161*** 0.161*** 0.089*** 0.086***
[0.035] [0.036] [0.031] [0.031]
Observations 15393 15393 9429 9429
R2 0.4 0.4 0.36 0.36
One concern is the CEO effort level. I use wealth-performance sensitivity (WPS) since this
measure is independent of firm size and shows the relationship between utility and performance.
I use the scaled WPS, defined as the dollar change in CEO wealth per 100% change in firm value
scaled by annual flow compensation (Edmans et al. 2009). Table 3.10 shows statistical differences
between the medians only. CEOs with high inside debt have a lower scaled WPS in both the full
sample and merger sample. Given the insignificant correlations in both samples are -0.01 for the
full sample and -0.016 for the merger sample, I conclude effort, proxied by scaled WPS, has no
effect on the debt incentive structure of the CEO.
3.6. Conclusion
Pensions and deferred compensation incentivize CEOs to take into consideration the long-
term effects of their decisions. Using measures similar to the firm’s debt-to-equity ratio, I find
CEOs who are paid with relatively more debt than the firm uses tend to act safely and choose to
engage in fewer M&A, which are deemed risky investments. When CEOs do decide to choose this
investment channel, the investments they make tend to be risk reducing. They pick smaller target

99
Table 3.10: Effort and Inside Debt
This table provides t-tests and rank sum tests between effort levels through sorting by high and low CEO RDE. Effort is measured
with the Edmans et al. (2009) scaled wealth-performance sensitivity (WPS), calculated as the dollar change in CEO wealth per 100%
change in firm value scaled by annual flow compensation.
CEO RDE > 1 CEO RDE < 1
Variable N Mean Median N Mean Median Mean Dif T-Stat Med Dif Z-Stat
Scaled WPS Full Sample 1743 8.890 4.22 15925 96.562 6.71 87.67 1.284 2.49 19.736***
Scaled WPS Merger Sample 345 11.62 4.36 3527 297.274 7.57 285.612 0.943 3.19 8.840***

100
firms in the same industry as their firm. They use a higher proportion of stock and less cash for
these deals. These findings suggest the optimal CEO debt-to-equity ratio with respect to his
compensation should be close to one in order to mitigate agency conflicts between bondholders
and stockholders. Greater inside debt incentivizes CEOs to make less risky decisions which can
benefit bondholders over shareholders. Future research can investigate CEO inside debt effects
on other issues of investment and financing.

101
REFERENCES
AGRAWAL, A., JAFFE, J.F. and MANDELKER, G.N., 1992. The Post-Merger Performance of
Acquiring Firms: A Re-examination of an Anomaly. Journal of Finance, 47(4), pp. 1605-1621.
AGRAWAL, A. and MANDELKER, G.N., 1987. Managerial Incentives and Corporate
Investment and Financing Decisions. Journal of Finance, 42(4), pp. 823-837.
AGRAWAL, A. and NAGARAJAN, N.J., 1990. Corporate Capital Structure, Agency Costs, and
Ownership Control: The Case of All-Equity Firms. Journal of Finance, 45(4), pp. 1325-1331.
ALTMAN, E.I., 1968. Financial Ratios, Discriminant Analysis and the Prediction of Corporate
Bankruptcy. Journal of Finance, 23(4), pp. 589.
ANDERSON, C. and MANDELKER, G., 1993. Long run return anomalies and the book-to-
market effect: evidence on mergers and IPOs. Unpublished Working Paper, .
ASQUITH, P., 1983. Merger bids, uncertainty, and stockholder returns. Journal of Financial
Economics, 11(1-4), pp. 51-83.
BLACK, F. and SCHOLES, M., 1973. Pricing of options and corporate liabilities. Journal of
Political Economy, 81, pp. 637-654.
CARLSON, M.(.1.). and LAZRAK, A.(.2.)., 2010. Leverage choice and credit spreads when
managers risk shift. Journal of Finance, 65(6), pp. 2323-2362.
CASSELL, C.A., HUANG, S.X., MANUEL SANCHEZ, J. and STUART, M.D., 2012. Seeking
safety: The relation between CEO inside debt holdings and the riskiness of firm investment and
financial policies. Journal of Financial Economics, 103(3), pp. 588-610.
COLES, J.L., DANIEL, N.D. and NAVEEN, L., 2006. Managerial incentives and risk-taking.
Journal of Financial Economics, 79(2), pp. 431-468.
CORE, J. and GUAY, W., 2002. Estimating the value of employee stock option portfolios and
their sensitivities to price and volatility. Journal of Accounting Research, 40(3), pp. 613-630.
CORE, J. and GUAY, W., 1999. The use of equity grants to manage optimal equity incentive
levels. Journal of Accounting and Economics, 28(2), pp. 151-184.
102
EDMANS, A.(.1.)., GABAIX, X.(.2.). and LANDIER, A.(.2.)., 2009. A multiplicative model of
optimal CEO incentives in market equilibrium. Review of Financial Studies, 22(12), pp. 4881-
4917.
EDMANS, A. and LIU, Q., 2011. Inside debt. Review of Finance, 15(1), pp. 75-102.
FRANKS, J.(.1.)., HARRIS, R.(.2.). and TITMAN, S.(.3.)., 1991. The postmerger share-price
performance of acquiring firms. Journal of Financial Economics, 29(1), pp. 81-96.
GOMPERS, P., ISHII, J. and METRICK, A., 2003. Corporate Governance and Equity Prices.
The Quarterly Journal of Economics, (1), pp. 107.
GRANT, J.(.1.)., MARKARIAN, G.(.2.). and PARBONETTI, A.(.3.)., 2009. CEO risk-related
incentives and income smoothing. Contemporary Accounting Research, 26(4), pp. 1029-1065.
GUAY, W.R., 1999. The sensitivity of CEO wealth to equity risk: An analysis of the magnitude
and determinants. Journal of Financial Economics, 53(1), pp. 43-71.
HAKKINEN, L., NORMAN, A., HILMOLA, O. P., & OJALA, L. (2004). Logistics integration
in horizontal mergers and acquisitions. The International Journal of Logistics
Management, 15(1), 27-42.
HARFORD, J., 2005. What drives merger waves? Journal of Financial Economics, 77(3), pp.
529-560.
HARFORD, J.(.1.). and LI, K.(.2.)., 2007. Decoupling CEO wealth and firm performance: The
case of acquiring CEOs. Journal of Finance, 62(2), pp. 917-949.
HARFORD, J., 1999. Corporate Cash Reserves and Acquisitions. Journal of Finance, 54(6), pp.
1969-1997.
HIGGINS, R.C. and SCHALL, L.D., 1975. Corporate Bankruptcy and Conglomerate Merger.
Journal of Finance, 30(1), pp. 93.
JENSEN, M.C. and MECKLING, W.H., 1976. Theory of the firm: Managerial behavior, agency
costs and ownership structure. Journal of Financial Economics, 3(4), pp. 305-360.
JENSEN, M.C. and MURPHY, K.J., 1990. Performance Pay and Top-Management Incentives.
Journal of Political Economy, 98(2), pp. 225-264.
103
LANGETIEG, T.C., 1978. An application of a three-factor performance index to measure
stockholder gains from merger. Journal of Financial Economics, 6(4), pp. 365-383.
LARSSON, R. AND FINKELSTEIN, S. 1999. Integrating strategic, organizational, and human
resource perspectives on mergers and acquisitions: a case survey of synergy realization.
Organization Science, 10(1), pp. 1-26.
LEHN, K.M. and ZHAO, M., 2006. CEO Turnover after Acquisitions: Are Bad Bidders Fired?
Journal of Finance, 61(4), pp. 1759-1811.
LEVY, H. and SARNAT, M., 1970. Diversification, Portfolio Analysis and the Uneasy Case for
Conglomerate Mergers. Journal of Finance, 25(4), pp. 795.
LEWELLEN, W.G., 1971. A Pure Financial Rationale for the Conglomerate Merger. Journal of
Finance, 26(2), pp. 521.
LIN, C., OFFICER, M. and SHEN, B., 2013. Managerial risk aversion and vertical integration.
LIU, Y., MAUER, D.C. and ZHANG, Y., 2012. Merger Decisions and Inside Debt. Available at
SSRN 2170895, .
LIU, Y.(.1.)., MAUER, D.C.(.2.). and ZHANG, Y.(.3.)., 2014. Firm cash holdings and CEO
inside debt. Journal of Banking and Finance, 42(1), pp. 83-100.
LOUGHRAN, T. and VIJH, A.M., 1997. Do long‐term shareholders benefit from corporate
acquisitions? The Journal of Finance, 52(5), pp. 1765-1790.
MALATESTA, P.H. and PEARSON, K., 1900. The Wealth Effect of Merger Activity and the
Objective Functions of Merging Firms.
MALMENDIER, U., TATE, G. and YAN, J., 2011. Overconfidence and Early-Life Experiences:
The Effect of Managerial Traits on Corporate Financial Policies. Journal of Finance, 66(5), pp.
1687-1733.
MANN, H.B. and WHITNEY, D.R., 1947. On a Test of Whether one of Two Random Variables
is Stochastically Larger than the Other. The Annals of Mathematical Statistics, (1), pp. 50.
MEHRAN, H., 1995. Executive compensation structure, ownership, and firm performance.
Journal of Financial Economics, 38(2), pp. 163-184.

104
MITCHELL, M.L. and STAFFORD, E., 2000. Managerial Decisions and Long-Term Stock
Price Performance. Journal of Business, 73(3), pp. 287.
MORCK, R., SHLEIFER, A. and VISHNY, R.W., 1990. Do Managerial Objectives Drive Bad
Acquisitions? Journal of Finance, 45(1), pp. 31-48.
MORELLEC, E. ( 1,2,3 ) and ZHDANOV, A.(.4.)., 2005. The dynamics of mergers and
acquisitions. Journal of Financial Economics, 77(3), pp. 649-672.
MORSE, A., NANDA, V. and SERU, A., 2011. Are Incentive Contracts Rigged by Powerful
CEOs? Journal of Finance, 66(5), pp. 1779-1821.
PEARSON, K., 1900. X. On the criterion that a given system of deviations from the probable in
the case of a correlated system of variables is such that it can be reasonably supposed to have
arisen from random sampling. The London, Edinburgh, and Dublin Philosophical Magazine and
Journal of Science, 50(302), pp. 157-175.
PHAN, H., 2012. Inside Debt and Mergers and Acquisitions. Available at SSRN 1991568, .
RAGHAVENDRA RAU, P. ( 1 ) and VERMAELEN, T. ( 2,3 ), 1998. Glamour, value and the
post-acquisition performance of acquiring firms. Journal of Financial Economics, 49(2), pp.
223-253.
RAUH, J.D., 2006. Investment and Financing Constraints: Evidence from the Funding of
Corporate Pension Plans. Journal of Finance, 61(1), pp. 33-71.
ROLL, R., 1986. The Hubris Hypothesis of Corporate Takeovers. Journal of Business, 59(2), pp.
197-216.
SHLEIFER, A.(.1.). and VISHNY, R.W.(.2.)., 2003. Stock market driven acquisitions. Journal
of Financial Economics, 70(3), pp. 295-311.
SUNDARAM, R.K. and YERMACK, D.L., 2007. Pay Me Later: Inside Debt and Its Role in
Managerial Compensation. Journal of Finance, 62(4), pp. 1551-1588.
UYSAL, V.B., 2011. Deviation from the Target Capital Structure and Acquisition Choices.
Journal of Financial Economics, 102(3), pp. 602-620.
WEI, C. and YERMACK, D., 2011. Investor Reactions to CEOs' Inside Debt Incentives. Review
of Financial Studies, 24(11), pp. 3813-3840.

105
YATES, F., 1934. Contingency Tables Involving Small Numbers and the χ2 Test. Blackwell
Publishing; Royal Statistical Society.

106
APPENDIX
Variable Description
Age age of the CEO
Gender indicator if the CEO is male
Log (Assets) Natural log of the total assets of the acquiring firm
CEO RDE 𝑙𝑡𝑖𝑝
𝑠ℎ𝑟𝑜𝑤𝑛𝑒𝑥𝑐𝑙𝑜𝑝𝑡𝑠∗ 𝑝𝑟𝑐𝑐𝑓 + (𝑜𝑝𝑡𝑒𝑥𝑒𝑟𝑣𝑎𝑙
+ 𝑜𝑝𝑡𝑢𝑛𝑒𝑥𝑒𝑥𝑒𝑟𝑒𝑠𝑡𝑣𝑎𝑙+ 𝑜𝑝𝑡𝑢𝑛𝑒𝑥𝑢𝑛𝑒𝑥𝑒𝑟𝑒𝑠𝑡𝑣𝑎𝑙
)
𝑑𝑙𝑡𝑡 + 𝑑𝑙𝑐𝑐𝑠ℎ𝑜 ∗ 𝑝𝑟𝑐𝑐𝑓
Natural log of the CEO’s inside debt to the firm’s debt established by Cassell et
al. (2012), where the CEO has debt in the form of pension benefits and deferred
compensation and equity in the form of stock and stock options (valued by Black-
Scholes (1973) and the firm has current liabilities and long-term debt and equity
valued as the total number of common shares outstanding multiplied by the
current market price at the end of the fiscal-year
CEO RIR 𝑙𝑡𝑖𝑝𝑠ℎ𝑟𝑜𝑤𝑛𝑒𝑥𝑐𝑙𝑜𝑝𝑡𝑠
∗ 𝑝𝑟𝑐𝑐𝑓 + ∑ 𝑑𝑒𝑙𝑡𝑎𝑖 ∗ 𝑜𝑝𝑡𝑖𝑜𝑛 𝑡𝑦𝑝𝑒𝑖31
𝑑𝑙𝑡𝑡 + 𝑑𝑙𝑐𝑜𝑝𝑡𝑜𝑠𝑒𝑦 ∗ 𝑜𝑝𝑡𝑝𝑟𝑐𝑏𝑦
Natural log of the CEO relative incentive ratio established by Wei and Yermack
(2011), where the CEO has debt in the form of pension benefits and deferred
compensation and equity in the form of stock and stock options (valued according
to option delta by exercisability tranches using Black-Scholes (1973)) and the firm
has current and long-term debt and equity options (valued by total employee
options, the average outstanding exercise price, and assumed expiration of 4
years). I = 1 to 3 for each type of option (exercised, unexercised exercisable, and
unexercised unexercisable), optosey is the total number of employee options, and
optprcby is the average exercise price.
Of Stock Amount the acquirer pays for the target in stock

107
Of Cash Amount the acquirer pays for the target in cash
Merger of
Equals
Indicates if the transaction is a merger of equals
Private Indicates if the target firm is private
Public Indicates if the target firm is public
Subsidiary Indicates if the target firm is a subsidiary
Numbid Indicates if the number of bidders is greater than one
Defenseprov Indicates if the target had defensive provisions against takeover
Tender Indicates if there was a tender offer
Hostile Indicates if the M&A was unsolicited
Publiccash Indicates if the target was public and the deal was paid for completely in cash
Publicstock Indicates if the target was public and the deal was paid for completely in stock
Privatecash Indicates if the target was private and the deal was paid for completely in cash
Privatestock Indicates if the target was private and the deal was paid for completely in stock
Subcash Indicates if the target was a subsidiary and the deal was paid for completely in
cash
G-index G-index from Gompers, Ishii, and Metrick (2003)
CEO
Ownership
Percentage of shares owned (excluding options) by the CEO
Firm Age Age of the firm in years as calculated from the IPO date
CEO Tenure CEO length of employment in years with the current firm
Returnt Total shareholder return for year t (including dividends)
Chairman Indicates if the CEO is also the Chairman of the Board of Directors

108
Leverage (dltt + dlc) / at
Board Size Total number of persons on the Board of Directors
Board
Independence
Percentage of board directors independent of the firm
Acquisitions Aqc / at
109
CHAPTER FOUR
CEO INSIDE DEBT AND FIRM DEBT
4.1. Introduction
Firm capital structure and CEO compensation structure have been of interest to
academicians and regulators for years. Until recently, capital structure has been analyzed in the
context of total debt and total equity. New studies by Rauh (2006) and Colla et al. (2013) exploit
a new database, Capital IQ, to breakdown the components of total debt, into commercial paper,
drawn credit lines, senior and subordinated bonds and notes, term loans, and capital leases. This
greater insight into firm capital structure can also provide additional insight into CEO
compensation structure since modeling executive compensation similar to the firm’s financing of
assets with debt and equity has important implications for the alignment of manager incentives
with stakeholders (Jensen and Meckling (1976)).
Data limitations have made joint analysis of firm capital and CEO compensation structures
difficult. However, the Capital IQ database, starting in 2001, provides details of debt capital
structure, such as types and term structures of debt instruments. Colla et al. (2013) demonstrate
how to use this new data in their seminal work on debt specialization25. Similarly, Execucomp
provides new details about executive pensions, starting in 2006, after new regulations from the
SEC required further disclosure. Cassell et al. (2012) show how to use this new data to calculate
measures of CEO inside debt, defined as the sum of pensions and deferred compensation.
25 Specialization means the firm uses one or a few specific types of debt instruments.

110
With these data several recent studies have uncovered important new insights. For
example, Wei and Yermack (2011) find that after the Securities and Exchange Commission (SEC)
mandated pension reporting in 2006, firm risk and equity value declined as inside debt increased.
In addition, Cassell et al. (2012) find that CEOs with high inside debt choose safe investments,
such as capital expenditures over research and development (R&D) and higher working capital.
This paper extends the literature by analyzing the various components of a firm’s total debt and
the new data on CEO’s compensation structure using data from 2006 to 2011. Specifically, using
Capital IQ, I breakdown the specific components of short-term and long-term debt to determine
what types of debt instruments are preferred among CEOs with greater incentives to cater to debt
holders. Doing so provides greater insight into how CEO incentives affect important financial
policy decisions, such as specialization, maturity, and yields.
These new data provide opportunities to address several different questions related to
compensation incentives. Jensen and Mecking (1976) argue that agency cost of debt could be
completely eliminated if the CEO’s compensation contract is set so his debt to equity ratio equals
the debt to equity ratio of the firm so the owner-manager has no incentive to favor either security
holder. However, inside debt above the optimal level will incentivize management to cater more
to debt holder interests at the expense of shareholders26. Similarly, more recent studies argue that
greater long-term debt in the CEO’s compensation contract should lead to more conservative debt
choices for the firm. For example, Edmans and Liu (2011) argue that long-term debt is more
expensive over time and thus more firm short-term debt will be preferred to maintain a lower
probability of default for the firm. Empirically, Cassell et al. (2012) find evidence that inside debt
26 CEOs may create credit default swaps on their pension obligations to ensure their claims are senior, and the
lenders may subordinate in the case of default. I would like to thank an anonymous seminar participant for this
comment.

111
is positively correlated with safer firm debt decisions. Similar questions yet to be addressed
empirically include: Is short-term debt or long-term debt used more? How does inside debt relate
to debt holder concerns over yield and maturity? Answering these questions is essential to fully
understanding the financial policy implications of incentivizing a CEO with more inside debt.
First, I analyze inside debt as another supply-side factor of debt specialization since firms
have to compensate staff, especially the CEO, for their use of human capital. Using the Herfindahl-
Hirschman index of type usage, I find firms who pay the CEO with more inside debt relative to
other compensation tend to specialize the firm’s capital structure more often than other firms. This
is especially true for firms with 90% or more of their debt structure based on a specific class of
debt. However, when I consider the interaction between inside debt and firm size (a proxy for
information asymmetry), I find larger firms with larger amounts of CEO inside debt diversify their
debt holdings27.
Second, I examine the relation between inside debt and the various components of total
debt and the probabilities and usage of each type of debt. Firms with high CEO inside debt are
more likely to use commercial paper, senior bonds, and commercial loans; have a higher
percentage of debt from drawn credit lines, and have a lower percentage of term loans; however,
larger firms with high CEO inside debt are less likely to use commercial paper and senior bonds,
have a lower percentage of debt from drawn credit lines and commercial loans, and have a higher
percentage of debt from term loans.
Finally, I consider specific components of debt important to debt holders, namely, interest
rates and maturity. Since higher inside debt compensation is associated with CEOs making safer
27 I would like to thank my discussant Emilia Garcia-Appendini at the 2014 IBEFA conference in Denver, CO for
this suggestion.
112
decisions (Cassell et al. (2012)), CEO’s with higher debt compensation might be expected to make
bonds less risky and thus warranting a lower rate. However, after controlling for factors related to
bankruptcy, such as profitability and cash flow volatility, I find firms with higher inside debt tend
to reward debt holders, on average, with higher interest rates and longer issue maturities. Higher
inside debt, especially above the firm’s debt-to-equity ratio, incentivizes the CEO to cater more to
the needs and desires of debt holders and less to stockholders and debt holders tend to prefer higher
interest payments, just as shareholders prefer higher dividends. In addition, longer maturities are
preferred for investors concerned about retirement and Sundaram and Yermack (2007) find CEOs
with higher inside debt are also concerned with longer time horizons. However, the effect is the
opposite for larger firms with large CEO inside debt holdings. One explanation for this can be
asymmetry. In smaller firms the issuance of long-term securities is more of a signal of
sustainability, and this signal is more believable the more inside debt the CEO has, whereas in
larger firms the long term sustainability of the firm is less of a concern; thus, there is no need to
signal and thus the CEO makes conservative safe decisions.
This paper contributes to the literature in several ways. First, I provide another variable to
consider with supply-side effect analysis of debt specialization with inside debt. Second, I provide
a benchmark for future analysis of specific debt instruments left unexplored, including total trust-
preferred stock, a component of “other” debt. Third, I demonstrate that structures of inside debt
and firm debt are interrelated. Finally, the evidence here provides regulatory authorities with
further evidence on how CEO inside debt affects financial decision-making.
This paper is organized as follows. Section 4.2 provides a literature review. Section 4.3
explains the dataset and methodology. Section 4.4 interprets the results. Section 4.5 discusses
robustness. Section 4.6 concludes.
113
4.2. Literature Review and Hypothesis Development
Jensen and Meckling (1976)) argue that firms should match debt and equity incentives of
the firm and CEO in order to mitigate agency costs. However, only recently has the literature on
executive compensation expanded from primarily stocks and stock options to include the overall
compensation structure; specifically, it has started to analyze CEO inside debt holdings, such as
pensions and deferred payments. For example, Sundaram and Yermack (2007) use IRS filings for
pension data and find inside debt increases as CEOs age, and higher inside debt incentivizes CEOs
to manage firms more conservatively. Similarly, Edmans and Liu (2011) find that as a manager’s
debt-to-equity ratio relative to the firm’s debt-to-equity ratio decreases, firm risk increases. Rauh
(2006) finds firms with large pension obligations are financially constrained and invest less. Thus,
prior literature reveals that CEO compensation incentives affect firm investment and firm risk.
Cassell et al. (2012) find that large CEO inside debt holdings are negatively associated with
risky investing and financial policies at the balance sheet level. They argue that CEOs want to
reduce bankruptcy risk to preserve firm value. However, that value can be skewed toward debt
holders. White (2012) finds that CEOs with higher inside debt are less likely to issue large
dividends. Furthermore, Liu et al. (2014) find that CEO inside debt is positively associated with
firm cash holdings. Though they find that this relationship deteriorates during credit events, and
the overall cash value declines as CEO inside debt increases. In sum, these findings reveal that
CEO inside debt can have significant effects on the firm’s balance sheet.
Debt heterogeneity can provide additional understanding of the firm’s capital structure and
previous literature reveals significant heterogeneity. For example, Rauh and Sufi (2010) find that
low-credit-quality firms are more likely to use debt with various types of covenants. Rauh and Sufi
(2012)) find that cross-sectionally, the capital structure of other firms producing similar output is

114
related to assets used in the production process. Colla et al. (2013) finds that debt diversification
occurs for large rated firms, but small unrated firms tend to specialize. Denis and McKeon (2012)
find that firms increase leverage with debt for operations, not for large equity payouts. They also
find that debt is reduced if a financial surplus occurs, but debt is further increased upon a deficit.
Hackbarth and Mauer (2012) find that financially unconstrained firms with few growth
opportunities prefer senior debt, but constrained firms, irrespective of growth opportunities, prefer
junior debt; lower-rated firms diversify across debt classes. Since firms with high CEO inside debt
are larger, older, unconstrained firms (Sundaram and Yermack (2007)), these firms are expected
to engage in debt diversification.
Hypothesis 1a: There is a negative relationship between CEO inside debt and firm debt
specialization.
A different perspective considers the safer financing decisions of a CEO paid with inside
debt (Cassell et al. 2012). Engaging in debt diversification involves many credit holders, which
increases agency costs. Thus, the CEO would opt to choose fewer agents to prevent increasing the
agency cost of debt (Jensen and Meckling (1976)). Moreover, conflicts of interest among many
different debt holders can affect capital structure depending on the various claimants and their
seniority. For example, firms in financial distress expect no help from short-term investors but can
receive support from long-term investors with subordinate claims (Berglof and Von Thadden
(1994)). During a credit event, bank debt is almost always moved to senior due to conflicts from
legal contesting (Welch (1997)). In addition, the free-rider concern (Holmstrom (1982)) also
makes having multiple creditors challenging. Finally, firm characteristics also influence debt
choices. Hackbarth and Mauer (2012) find that large financially unconstrained companies with
low growth prefer senior debt; small financially constrained companies prefer junior debt and

115
lower rated companies debt diversify. Since inside debt is widely used in larger companies
(Sundaram and Yermack (2007)), I expect CEOs with larger inside debt holdings to prefer a
specialized debt capital structure.
Hypothesis 1b: There is a positive relationship between CEO inside debt and firm debt
specialization.
High inside debt firms have loans characterized by lower interest rates and fewer covenants
(Anantharaman et al. 2013). Other debt instruments have this same characteristic. Hypothesis 2a:
There is a negative relationship between inside debt and issue interest rates.
Alternatively, paying the CEO with relatively more debt than equity will incentivize him
to cater to debt holders at the expense of shareholders (Jensen and Meckling (1976), Edmans and
Liu (2011)). This catering would increase debt interest payments, lowering net income and payouts
to shareholders. Also, higher interest rates mean a lower price on debt for investors due to the
discounted present value of cash flows and additional riskiness of receiving cash flows from higher
interest payments.
Hypothesis 2b: There is a positive relationship between inside debt and issue interest rates.
Edmans and Liu (2011) argue that higher inside debt reduces the probability of default and
since Diamond (1991) finds better credit is associated with short-term debt, it follows that firms
with higher inside debt prefer short-term debt. Moreover, Hart and Moore (1994) show short-term
debt is preferred for assets like working capital and Cassell (2012) find a positive relation with
inside debt and working capital. Finally, Anantharaman and Lee (2014) find that CEOs with higher
wealth sensitivity shift risks more with pensions, which implies that risk-shifting will be more
prevalent among CEOs with high inside debt; which in turn will lead to lower issue maturities.
Hypothesis 3a: There is a negative relationship between inside debt and issue maturities.

116
However, CEOs with higher levels of inside debt are conflicted: CEOs are incentivized to
cater more towards debt holders who are concerned about credit risk and bankruptcy, but CEOs
have compensation contingent on firm performance. Firms may signal their high quality to the
market by issuing longer maturities in order to curtail the trade-off between maturity and risk and
the issue of market overvaluation (Flannery (1986)). From the lender viewpoint, a firm with more
debt and higher seniority ranking of CEO pay28 makes the company a more risky prospect
(Anantharaman et al. (2013)). Therefore, a contract with more debt may arise from the firm’s
standpoint through the channel of longer maturities29; i.e., the firm pays for a longer period of time
to compensate the lender for additional risk.
Hypothesis 3b: There is a positive relationship between inside debt and issue maturities.
4.3. Data and Methodology
Debt data comes from Capital IQ. Financial information is from CRSP and Compustat.
Executive compensation data comes from ExecuComp. Following Cassell et al. (2012), the dataset
begins in 2006, since the Pension Protection Act of 200630 required companies to start reporting
pension values, and ends in 2001. Financials and utilities are excluded from the analysis due to
major differences in government regulation from other companies. Full details of variable
definitions are provided in the Appendix.
I follow Cassell et al. (2012) and define four measures of CEO inside debt. The first is the
CEO to firm debt/equity ratio (CEO RDE). Previous theory has constructed this variable in a
manner so the optimal value is one, which indicates that the firm incentivize the CEO through both
28 CEO inside debt compensation is relatively smaller in value than an outside debt instrument, but the seniority
ranking of the inside debt may be an issue for potential lenders. 29 Instruments with longer maturities provide more versatility for lenders who wish to securitize the instrument or
use it for duration matching. 30 For further information about the act, see http://www.gpo.gov/fdsys/pkg/PLAW-109publ280/pdf/PLAW-
109publ280.pdf.
117
inside debt and inside equity in the same fashion as the firm’s assets are financed with debt and
equity (Edmans and Liu (2011)). CEO RDE is the natural log of the CEO’s inside debt to the firm’s
debt, where the CEO has debt in the form of pension benefits and deferred compensation and
equity in the form of stock and stock options. This is equal to [(CEO IDH / CEO EH)/(FD / FE)],
where CEO IDH is the aggregated present value of pension benefits and deferred (long-term)
compensation, CEO EH is the value of stock and stock options (reported by the firm), FD is total
current liabilities and long-term debt, and FE is the reported stockholders’ equity. The second
measure of CEO inside debt is an indicator variable if CEO RDE > 131. This variable indicates the
firm does not have a theoretically optimal compensation structure. The firm has aligned interests
more in favor of the debt holders rather than the current private stockholders and potentially future
public stockholders.
The other two inside debt variables involve CEO incentives. I calculate the CEO relative
incentive ratio (CEO RIR) using the same methodology for CEO RDE except the option value is
calculated using Black-Scholes (1973) delta valuations for each type of option (exercised,
unexercised, exercisable, and unexercised unexercisable). I also calculate FE using employee
options and the average exercise price. The final inside debt variable uses CEO RIR but adjusts
for future cash compensation (CEO RIRCA). This is calculated using the CEO expected decision
horizon, which takes differences between the industry medians of tenure and age and sums them
together. If this is equal or less than zero, the cash compensation for the current fiscal year is used.
Otherwise, the cash compensation is multiplied by the expected decision horizon and added to
deferred compensation and pension values.
31 This is the inside debt calculation before the transformation with the natural log is taken.

118
The debt variables from Capital IQ follow Colla et al. (2013). The seven types of debt
considered are commercial paper (CP), drawn credit lines (DC), term loans (TL), bonds and notes
broken into categories of senior (SBN) and subordinated (SUB), capital leases (CL), and other
debt including total trust-preferred stock (OTHER). Unlike Colla et al. (2013), I do not use the
total adjustment variable. I found the debt variables from Capital IQ and Compustat were
incompatible. Therefore, I calculate percentages using the debt data from Capital IQ only in order
to facilitate a direct comparison32. These percentages are then used to calculate EXCL90, which is
an indicator variable if a firm has more than 90% of debt in one type, and HHI, which is the
Herfindahl-Hirschman index of debt type usage. Other variables calculated from Capital IQ
include interest, defined as the natural log of the weighted average interest rate at issuance on all
debt issues for each fiscal year, and maturity, defined as the natural log of the weighted average
length of time to maturity at issuance on all debt issues for each fiscal year.
I follow Colla et al. (2013) and define the following controls for supply-side factors.
Profitability is operating income before depreciation scaled by total assets. Tangibility is net
property, plant, and equipment scaled by total assets. MB is the market value of equity, defined as
the stock price at the end of the fiscal year multiplied by the common shares used to calculate
earnings per share, plus the market value of debt, defined as the sum of debt in current liabilities,
long-term debt, and preferred stock liquidating value less deferred taxes and investment tax credit,
scaled by total assets. Size is the natural log of total assets. Dividend Payer indicates if a firm has
positive common stock dividends. RD expenses is defined as research and development expenses
scaled by total assets. Unrated indicates if the firm is not rated by S&P. CF volatility is the standard
32 For instance, I take a random sample of three companies to determine how to adjust debt to correctly yield total
debt from Compustat. In two of the three cases, a multiplier of ten works. In another case, a value of 100,000 is
necessary. Thus, to avoid over manipulating and imputing the data, I use the totals found in Capital IQ to calculate
necessary variables and values from Compustat to compute financial and compensation variables.

119
deviation of quarterly operating income over the previous 12 quarters scaled by total assets. To
prevent the influence of outliers, all inside debt variables and CF volatility are Winsorized by 1%
at both tails. Summary statistics are provided in Table 4.1.
Comparing the sample to Colla et al. (2013), I find my sample has slightly higher
percentages of HHI and EXCL90. As reported in Table 4.1 Panel A, dividend paying firms occur
more often in my sample at 66% versus 34.2% for Colla’s sample. Measures of tangibility and
market-to-book are slightly lower than their sample. Percentages of commercial paper, drawn
credit lines, and other debt are higher in my sample, whereas term loans, subordinated bonds and
notes, and commercial loans are slightly lower than their sample. Comparing the inside debt
variables to Cassell et al. (2012), whose sample is in the midst of the financial crisis from 2006 to
2008, I find the inside debt variables have lower means and medians. 28% of my sample has inside
debt at a level above the theoretical optimum (CEO RDE > 1).
Table 4.1 Panel B shows differences in firms with high or low CEO inside debt as defined
by CEO RDE > 1 or CEO RDE < 1, respectively. Firms with high CEO inside debt use more
commercial paper, senior bonds, credit lines, and other debt. Firms with low CEO inside debt use
more term loans and subordinated bonds. Firms with high CEO inside debt have lower maturities
than low CEO inside debt firms. Low CEO inside debt firms are more likely to be unrated than
high CEO inside debt firms. High CEO inside debt firms are characterized by higher profitability,
tangibility, market-to-book, and size relative to low CEO inside debt firms. High CEO inside debt
firms pay a dividend more often than low CEO inside debt firms. Panel C of Table 4.1 shows
similar differences with medians.
Table 4.1 Panel D summarizes the means of four categories based on high and low inside

120
Table 4.1: Summary Statistics
This table provided summary statistics of the data. Data is collected from Capital IQ from 2006
to 2011. Panel A provides statistics for the full sample. Panel B examines mean differences
between high and low levels of CEO inside debt according to CEO RDE > 1. Panel C examines
median differences using Wilcoxon tests. Panel D splits the sample into four groups based on
CEO RDE and an indicator if total book leverage is greater than one. All variables are defined in
the Appendix.
Panel A: Full Sample
Variable N Mean Standard
Deviation
Variable N Mean Standard
Deviation
Dependent
Variables
Variables of
Interest
HHI 3725 0.562 0.267 CEO RDE 3725 -1.257 3.259
EXCL90 3725 0.248 0.432 CEO RDE > 1 3725 0.281 0.450
CP 3725 0.186 0.389 CEO RIR 3725 -2.726 3.573
DC 3725 0.803 0.398 CEO RIRCA 3725 -1.908 3.359
TL
3725 0.470 0.499
Independent
Variables
SBN 3725 0.748 0.434 PROFITABILITY 3723 0.132 0.095
SUB 3725 0.186 0.389 TANGIBILITY 3694 0.255 0.233
CL 3725 0.410 0.492 MB 3725 1.307 1.024
OTHER 3725 0.530 0.499 SIZE 3725 8.168 1.645
PERCP
3718 0.025 0.078
DIVIDEND
PAYER
3725 0.659 0.474
PERDC 3718 0.323 0.334 RD EXPENSES 3725 0.018 0.042
PERTL 3718 0.118 0.222 UNRATED 3725 0.394 0.489
PERSBN 3718 0.388 0.340 CF VOLATILITY 3725 0.017 0.055
PERSUB 3718 0.047 0.153
PERCL 3718 0.023 0.115
PEROTHER 3718 0.077 0.171
INTEREST 864 -0.670 1.157
MATURITY 3573 6.016 1.147

121
Panel B: Sample Means of Firms Split by High and Low CEO Inside Debt
Variable CEO RDE < 1 CEO RDE > 1 Difference T-Stat P-value
Number of Observations 2670 1048
HHI 0.561 0.566 -0.005 -0.555 0.579
EXCL90 0.251 0.238 0.014 0.878 0.380
CP 0.153 0.270 -0.117 -8.349 0.000
DC 0.809 0.789 0.020 1.354 0.176
TL 0.490 0.420 0.070 3.870 0.000
SBN 0.723 0.814 -0.091 -5.787 0.000
SUB 0.212 0.119 0.093 6.588 0.000
CL 0.395 0.448 -0.053 -2.942 0.003
OTHER 0.513 0.573 -0.061 -3.335 0.001
PERCP 0.019 0.041 -0.021 -7.541 0.000
PERDC 0.326 0.315 0.011 0.933 0.351
PERTL 0.134 0.077 0.057 7.103 0.000
PERSBN 0.363 0.450 -0.087 -7.072 0.000
PERSUB 0.054 0.029 0.025 4.532 0.000
PERCL 0.024 0.020 0.003 0.791 0.429
PEROTHER 0.080 0.068 0.011 1.849 0.065
INTEREST -0.703 -0.604 -0.099 -0.867 0.386
MATURITY 6.081 5.85 0.231 5.439 0.000
PROFITABILITY 0.129 0.142 -0.013 -3.844 0.000
TANGIBILITY 0.250 0.268 -0.018 -2.076 0.000
MB 1.288 1.355 -0.066 -1.783 0.075
SIZE 8.111 8.311 -0.200 -3.337 0.001
DIVIDEND PAYER 0.606 0.794 -0.188 -11.035 0.000
RD EXPENSES 0.018 0.018 0.000 0.255 0.799
UNRATED 0.407 0.359 0.048 2.721 0.002
CF VOLATILITY 0.018 0.015 0.003 1.552 0.121

122
Panel C: Sample Medians of Firms Split by High and Low CEO Inside Debt
Variable CEO RDE < 1 CEO RDE > 1 Difference Z-Stat P-value
Number of Observations 2670 1048
HHI 0.482 0.506 -0.024 -0.709 0.478
EXCL90 0.000 0.000 0.000 0.878 0.380
CP 0.000 0.000 0.000 -8.273 0.000
DC 1.000 1.000 0.000 1.354 0.176
TL 0.000 0.000 0.000 3.862 0.000
SBN 1.000 1.000 0.000 -5.762 0.000
SUB 0.000 0.000 0.000 6.551 0.000
CL 0.000 0.000 0.000 -2.939 0.003
OTHER 1.000 1.000 0.000 -3.331 0.001
PERCP 0.000 0.000 0.000 -8.466 0.000
PERDC 0.211 0.200 -0.011 1.186 0.236
PERTL 0.000 0.000 0.000 6.138 0.000
PERSBN 0.323 0.493 -0.170 -7.229 0.000
PERSUB 0.000 0.000 0.000 6.609 0.000
PERCL 0.000 0.000 0.000 -2.841 0.005
PEROTHER 0.000 0.001 -0.001 -2.108 0.035
INTEREST -0.350 -0.396 -0.046 -0.319 0.750
MATURITY 6.354 6.179 0.175 5.551 0.000
PROFITABILITY 0.123 0.138 -0.015 -4.341 0.000
TANGIBILITY 0.171 0.196 -0.025 -4.266 0.000
MB 1.002 1.109 -0.107 -3.527 0.000
SIZE 7.963 8.176 -0.213 -3.704 0.000
DIVIDEND PAYER 1.000 1.000 0.000 -10.861 0.000
RD EXPENSES 0.000 0.003 -0.003 -7.782 0.000
UNRATED 0.000 0.000 0.000 2.718 0.007
CF VOLATILITY 0.008 0.008 0.000 2.328 0.020

123
Panel D: Sample Means of Firms Split by CEO Inside Debt and Firm Leverage
Variable CEO RDE < 1
Leverage < 1
CEO RDE < 1
Leverage > 1
CEO RDE > 1
Leverage < 1
CEO RDE > 1
Leverage > 1
Number of Observations 2598 79 1033 15
HHI 0.564 0.450 0.569 0.569
EXCL90 0.255 0.127 0.238 0.200
CP 0.152 0.190 0.270 0.267
DC 0.807 0.861 0.789 0.800
TL 0.483 0.709 0.419 0.467
SBN 0.208 0.354 0.119 0.133
SUB 0.208 0.354 0.119 0.133
CL 0.388 0.620 0.446 0.533
OTHER 0.513 0.506 0.574 0.533
PERCP 0.019 0.033 0.041 0.019
PERDC 0.332 0.147 0.316 0.234
PERTL 0.131 0.219 0.077 0.055
PERSBN 0.361 0.444 0.449 0.540
PERSUB 0.053 0.080 0.028 0.081
PERCL 0.024 0.014 0.021 0.002
PEROTHER 0.080 0.062 0.068 0.069
INTEREST -0.717 -0.423 -0.600 -1.173
MATURITY 6.092 5.731 5.858 5.349
PROFITABILITY 0.127 0.190 0.141 0.193
TANGIBILITY 0.250 0.264 0.269 0.195
MB 1.269 1.918 1.343 2.152
SIZE 8.123 8.314 7.735 8.116
DIVIDEND PAYER 0.614 0.354 0.798 0.533
RD EXPENSES 0.018 0.018 0.018 0.026
UNRATED 0.414 0.190 0.361 0.200
CF VOLATILITY 0.017 0.025 0.014 0.045
debt and leverage, where leverage is defined by an indicator if total book leverage is greater than
one. All cases demonstrate a difference between high and low inside debt based on the CEO RDE
> 1 indicator variable. Major differences between the two subgroups should bias against finding
significant results in later tables.
To further compare my results with Colla et al. (2013), I replicate their Table 8, in Table
4.2 here. They regress supply-side factors on the debt specialization variables of interest (HHI
and EXCL90). Similar to their results, I find size is negative and significant. I find market-to-
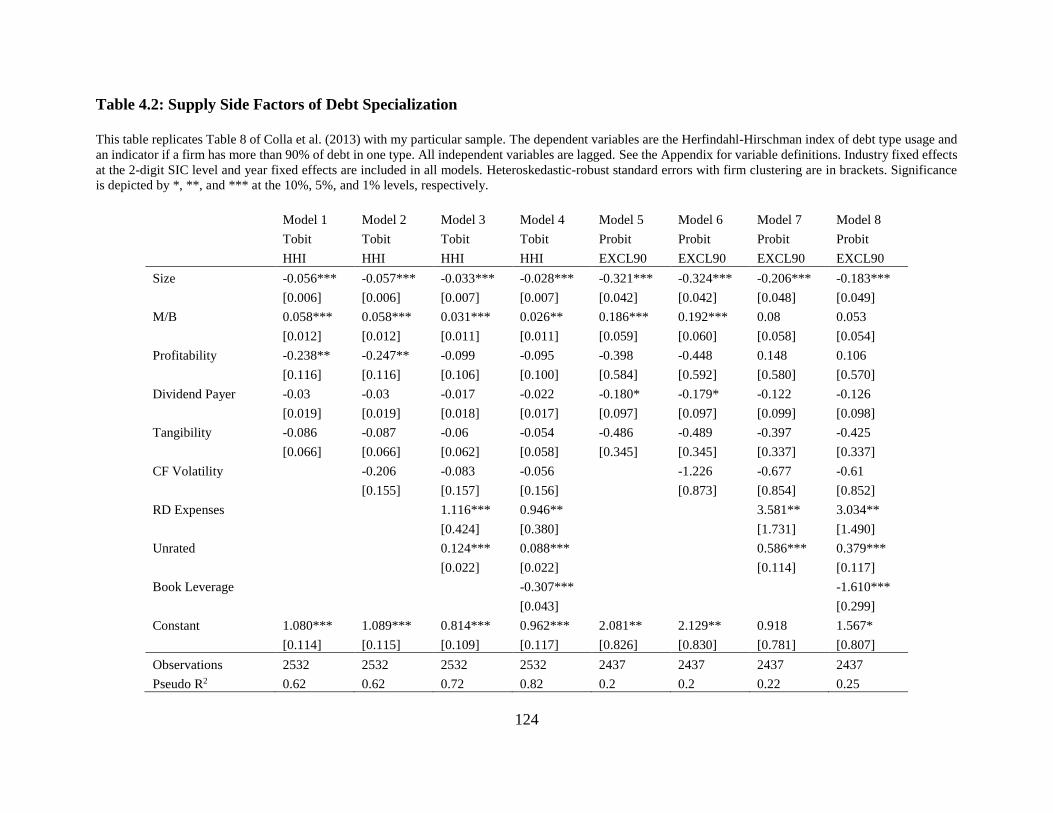
124
Table 4.2: Supply Side Factors of Debt Specialization
This table replicates Table 8 of Colla et al. (2013) with my particular sample. The dependent variables are the Herfindahl-Hirschman index of debt type usage and
an indicator if a firm has more than 90% of debt in one type. All independent variables are lagged. See the Appendix for variable definitions. Industry fixed effects
at the 2-digit SIC level and year fixed effects are included in all models. Heteroskedastic-robust standard errors with firm clustering are in brackets. Significance
is depicted by *, **, and *** at the 10%, 5%, and 1% levels, respectively.
Model 1 Model 2 Model 3 Model 4 Model 5 Model 6 Model 7 Model 8
Tobit Tobit Tobit Tobit Probit Probit Probit Probit
HHI HHI HHI HHI EXCL90 EXCL90 EXCL90 EXCL90
Size -0.056*** -0.057*** -0.033*** -0.028*** -0.321*** -0.324*** -0.206*** -0.183***
[0.006] [0.006] [0.007] [0.007] [0.042] [0.042] [0.048] [0.049]
M/B 0.058*** 0.058*** 0.031*** 0.026** 0.186*** 0.192*** 0.08 0.053
[0.012] [0.012] [0.011] [0.011] [0.059] [0.060] [0.058] [0.054]
Profitability -0.238** -0.247** -0.099 -0.095 -0.398 -0.448 0.148 0.106
[0.116] [0.116] [0.106] [0.100] [0.584] [0.592] [0.580] [0.570]
Dividend Payer -0.03 -0.03 -0.017 -0.022 -0.180* -0.179* -0.122 -0.126
[0.019] [0.019] [0.018] [0.017] [0.097] [0.097] [0.099] [0.098]
Tangibility -0.086 -0.087 -0.06 -0.054 -0.486 -0.489 -0.397 -0.425
[0.066] [0.066] [0.062] [0.058] [0.345] [0.345] [0.337] [0.337]
CF Volatility -0.206 -0.083 -0.056 -1.226 -0.677 -0.61
[0.155] [0.157] [0.156] [0.873] [0.854] [0.852]
RD Expenses 1.116*** 0.946** 3.581** 3.034**
[0.424] [0.380] [1.731] [1.490]
Unrated 0.124*** 0.088*** 0.586*** 0.379***
[0.022] [0.022] [0.114] [0.117]
Book Leverage -0.307*** -1.610***
[0.043] [0.299]
Constant 1.080*** 1.089*** 0.814*** 0.962*** 2.081** 2.129** 0.918 1.567*
[0.114] [0.115] [0.109] [0.117] [0.826] [0.830] [0.781] [0.807]
Observations 2532 2532 2532 2532 2437 2437 2437 2437
Pseudo R2 0.62 0.62 0.72 0.82 0.2 0.2 0.22 0.25
125
book is only significant in the first three models. R&D expenses is positive and significant in this
analysis. Differing results may be due to a lack of a constant in their models, which I include in
all my specifications, and the sample periods are different. My sample includes years just before,
during, and after the Great Recession.
For the following results in Section 4, all models include year and industry fixed effects
at the 2-digit SIC level. Firm-clustered standard errors robust to heteroskedasticity are included
below all coefficients. All independent variables are lagged to reduce endogeneity concerns.
Tobit models are double-censored, i.e., there is a lower limit set to zero and an upper bound set
to one for all proportional variables of interest and HHI. The next section details analysis of
inside debt and specialization using the measures of Colla et al. (2013). Then, I break down the
HHI into its seven components for individual analysis of each debt type. Finally, I conclude with
remarks and analysis on the associations between inside debt and debt characteristics of interest
rates and maturity.
4.4. Empirical Results
After analyzing the original specification of (Colla et. al (2013)) in Table 4.2, now I
introduce a control for CEO inside debt in the regressions in Table 4.3. Three of the four
measures of inside debt are positive and statistically significant in their specifications. Six of the
models have significance at the 1% level. Thus, firms with higher CEO inside debt specialize
their debt structures. Larger firms debt diversify, which confirms previous findings (Colla et. al
(2013)). Market-to-book is significant only in the Tobit regressions. RD Expenses, Unrated, and
Book Leverage have statistically significant coefficients consistent with previous literature. All
models also include an interaction term between the inside debt variable of interest and size, a

126
Table 4.3: Inside Debt Effect on Debt Specialization
This table provides analysis of debt specialization given the presence of CEO inside debt. The dependent variables are the Herfindahl-
Hirschman index of debt type usage and an indicator if a firm has more than 90% of debt in one type. The other panels contain dependent
variables of the relative percentage of the debt instrument used or an indicator if the firm uses the debt instrument type in question. All
controls are lagged. See the Appendix for variable definitions. Industry fixed effects at the 2-digit SIC level and year fixed effects are
included in all models. Heteroskedastic-robust standard errors with firm clustering are in brackets. Significance is depicted by *, **, and
*** at the 10%, 5%, and 1% levels, respectively.
Model 1 Model 2 Model 3 Model 4 Model 5 Model 6 Model 7 Model 8
Tobit Tobit Tobit Tobit Probit Probit Probit Probit
HHI HHI HHI HHI EXCL90 EXCL90 EXCL90 EXCL90
CEO RDE 0.039*** 0.202***
[0.010] [0.077]
CEO RDE > 1 0.001 -0.244
[0.087] [0.525]
CEO RIR 0.032*** 0.259***
[0.009] [0.060]
CEO RIRCA 0.033*** 0.276***
[0.010] [0.061]
Size -0.034*** -0.030*** -0.047*** -0.045*** -0.196*** -0.209*** -0.306*** -0.303***
[0.007] [0.007] [0.009] [0.008] [0.050] [0.054] [0.055] [0.053]
CEO RDE * Size -0.004*** -0.018**
[0.001] [0.008]
CEO RDE > 1 *
Size 0.003 0.057
[0.010] [0.066]
CEO RIR * Size -0.004*** -0.032***
[0.001] [0.007]
CEO RIRCA * Size -0.004*** -0.035***
[0.001] [0.007]
CEO Vega/Delta 0.014 -0.015 -0.019 -0.024 -0.046 -0.35 -0.507 -0.641
[0.019] [0.018] [0.025] [0.026] [0.089] [0.408] [0.654] [0.726]

127
M/B 0.024** 0.025** 0.023** 0.024** 0.049 0.051 0.037 0.042
[0.011] [0.011] [0.011] [0.011] [0.054] [0.054] [0.056] [0.056]
Profitability -0.103 -0.106 -0.073 -0.073 0.026 0.05 0.297 0.307
[0.104] [0.101] [0.100] [0.100] [0.609] [0.583] [0.584] [0.580]
Dividend Payer -0.019 -0.026 -0.018 -0.019 -0.125 -0.15 -0.12 -0.126
[0.017] [0.017] [0.017] [0.017] [0.098] [0.100] [0.099] [0.100]
Tangibility -0.06 -0.048 -0.062 -0.06 -0.425 -0.387 -0.505 -0.503
[0.057] [0.057] [0.057] [0.057] [0.338] [0.337] [0.340] [0.340]
CF Volatility -0.024 -0.051 -0.065 -0.057 -0.381 -0.627 -0.553 -0.499
[0.153] [0.159] [0.165] [0.165] [0.906] [0.887] [0.886] [0.900]
RD Expenses 0.935** 0.957** 0.967** 0.940** 3.062** 3.180** 3.190** 3.006**
[0.368] [0.376] [0.376] [0.373] [1.479] [1.491] [1.509] [1.482]
Unrated 0.082*** 0.088*** 0.078*** 0.078*** 0.358*** 0.368*** 0.321*** 0.309***
[0.021] [0.021] [0.022] [0.022] [0.116] [0.116] [0.118] [0.119]
Book Leverage -0.282*** -0.303*** -0.284*** -0.289*** -1.426*** -1.585*** -1.439*** -1.506***
[0.042] [0.043] [0.044] [0.044] [0.297] [0.298] [0.306] [0.304]
Constant 1.002*** 0.974*** 1.051*** 1.029*** 1.581* 1.751** 2.198*** 2.121***
[0.120] [0.127] [0.114] [0.112] [0.812] [0.883] [0.806] [0.819]
Observations 2532 2532 2532 2532 2437 2437 2437 2437
Pseudo R2 0.85 0.83 0.84 0.84 0.26 0.25 0.26 0.27

128
proxy for information asymmetry. In six of the eight models I find a negative coefficient and
statistically significance at the 1% level. This suggests larger firms with large CEO inside debt
holdings diversify their debt instruments. The negative sign suggests that firm size diminishes
the RDE effect; thus the CEO inside debt incentive is most effective in smaller firms.
Table 4.4 analyzes commercial paper usage. Interestingly, in model 1 I find firms who
pay their CEOs above the optimal ratio of one use a higher percentage of commercial paper.
Also in Model 2, I find the interaction term between inside debt and firm size is negative,
suggesting larger firms who pay the CEO well above the optimal ratio use a lower percentage of
commercial paper. Models 3 and 4 show the opposite. This suggests a conservative debt policy
unless the CEO is incentivized to cater more to credit holders. CEOs with a high Vega-to-delta
ratio have a negative association with commercial paper usage. Larger firms with a higher
market-to-book ratio, higher profitability, and pay dividends use more commercial paper. Firms
with higher cash flow volatility or are unrated use a lower percentage of commercial paper.
Models 5 through 8 analyze the likelihood of using commercial paper. Firms with higher
inside debt and large firms have a higher likelihood of using commercial paper, but the
interaction between inside debt and size is negative, suggesting information asymmetry mitigates
this effect. With regards to the other controls, similar coefficients and significance as in models 1
through 4 are demonstrated throughout.
Table 4.5 investigates drawn credit lines. Models 1 and 2 show significance at the 1%
level for firm size, suggesting larger firms use a lower percentage of drawn credit lines.
According to Models 3 and 4, firms with higher inside debt incentives use a higher percentage of
drawn credit lines. Larger firms use less, and the interaction between size and inside debt is also
negative. Firms with higher R&D and leverage use a lower percentage of drawn credit. Unrated
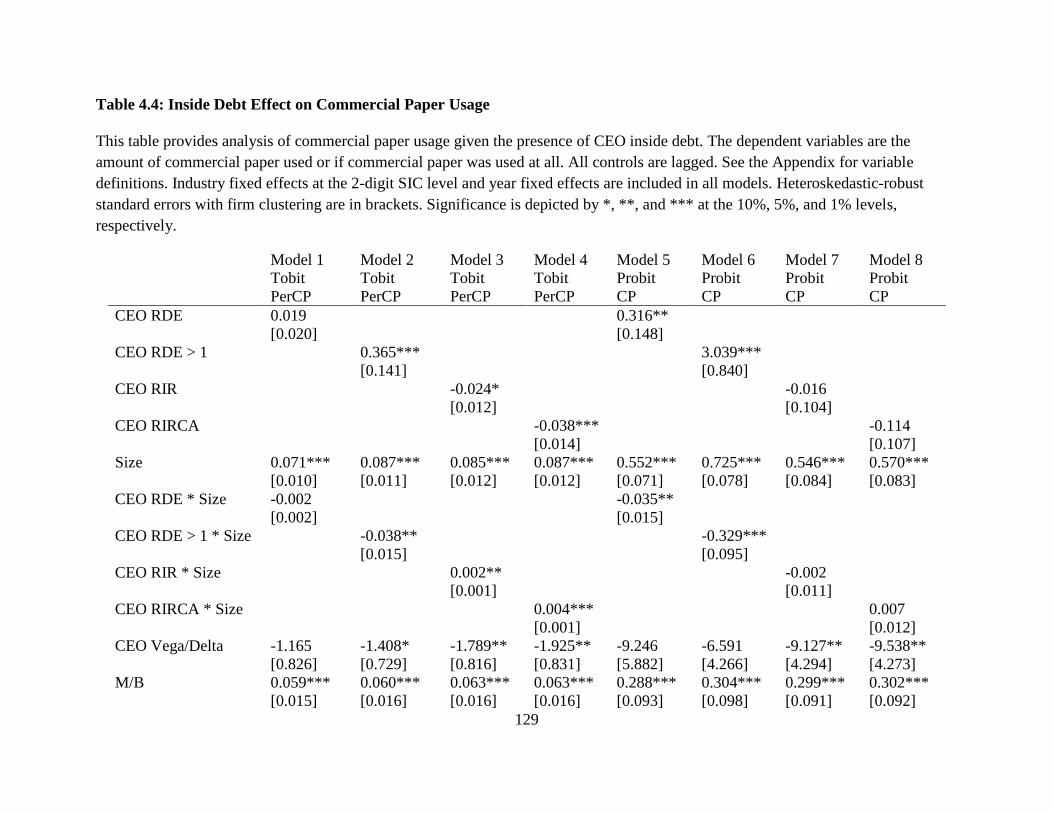
129
Table 4.4: Inside Debt Effect on Commercial Paper Usage
This table provides analysis of commercial paper usage given the presence of CEO inside debt. The dependent variables are the
amount of commercial paper used or if commercial paper was used at all. All controls are lagged. See the Appendix for variable
definitions. Industry fixed effects at the 2-digit SIC level and year fixed effects are included in all models. Heteroskedastic-robust
standard errors with firm clustering are in brackets. Significance is depicted by *, **, and *** at the 10%, 5%, and 1% levels,
respectively.
Model 1 Model 2 Model 3 Model 4 Model 5 Model 6 Model 7 Model 8
Tobit Tobit Tobit Tobit Probit Probit Probit Probit
PerCP PerCP PerCP PerCP CP CP CP CP
CEO RDE 0.019 0.316**
[0.020] [0.148]
CEO RDE > 1 0.365*** 3.039***
[0.141] [0.840]
CEO RIR -0.024* -0.016
[0.012] [0.104]
CEO RIRCA -0.038*** -0.114
[0.014] [0.107]
Size 0.071*** 0.087*** 0.085*** 0.087*** 0.552*** 0.725*** 0.546*** 0.570***
[0.010] [0.011] [0.012] [0.012] [0.071] [0.078] [0.084] [0.083]
CEO RDE * Size -0.002 -0.035**
[0.002] [0.015]
CEO RDE > 1 * Size -0.038** -0.329***
[0.015] [0.095]
CEO RIR * Size 0.002** -0.002
[0.001] [0.011]
CEO RIRCA * Size 0.004*** 0.007
[0.001] [0.012]
CEO Vega/Delta -1.165 -1.408* -1.789** -1.925** -9.246 -6.591 -9.127** -9.538**
[0.826] [0.729] [0.816] [0.831] [5.882] [4.266] [4.294] [4.273]
M/B 0.059*** 0.060*** 0.063*** 0.063*** 0.288*** 0.304*** 0.299*** 0.302***
[0.015] [0.016] [0.016] [0.016] [0.093] [0.098] [0.091] [0.092]

130
Profitability 0.396** 0.392** 0.422** 0.442** 2.243** 2.243** 2.338** 2.479**
[0.169] [0.169] [0.172] [0.173] [1.095] [1.124] [1.094] [1.111]
Dividend Payer 0.155*** 0.150*** 0.152*** 0.152*** 0.810*** 0.797*** 0.799*** 0.786***
[0.034] [0.033] [0.034] [0.034] [0.185] [0.186] [0.181] [0.183]
Tangibility -0.016 -0.013 -0.005 0.002 0.313 0.306 0.337 0.373
[0.098] [0.093] [0.099] [0.100] [0.620] [0.604] [0.618] [0.623]
CF Volatility -1.774** -1.942** -1.728** -1.691* -9.563* -10.483* -8.637* -8.377*
[0.870] [0.924] [0.864] [0.864] [5.360] [5.755] [5.023] [4.982]
RD Expenses -0.785 -0.792 -0.883 -0.88 -3.925 -4.368 -4.324 -4.461
[0.537] [0.527] [0.548] [0.542] [3.032] [3.113] [3.005] [3.022]
Unrated -0.128*** -0.127*** -0.110** -0.105** -0.575** -0.554** -0.513** -0.495*
[0.046] [0.046] [0.046] [0.046] [0.252] [0.259] [0.258] [0.259]
Book Leverage 0.034 0.037 0.015 0.008 0.296 0.313 0.11 0.05
[0.066] [0.067] [0.065] [0.064] [0.400] [0.398] [0.395] [0.390]
Constant -1.062*** -1.250*** -1.172*** -1.170*** -6.938*** -8.824*** -6.868*** -7.071***
[0.139] [0.160] [0.144] [0.141] [1.018] [1.194] [1.061] [1.040]
Observations 2531 2531 2531 2531 2286 2286 2286 2286
Pseudo R2 0.64 0.65 0.64 0.64 0.4 0.41 0.4 0.4

131
Table 4.5: Inside Debt Effect on Drawn Credit Line Usage
This table provides analysis of drawn credit line usage given the presence of CEO inside debt. The dependent variables are the amount
of drawn credit lines or if drawn credit lines were used at all. All controls are lagged. See the Appendix for variable definitions.
Industry fixed effects at the 2-digit SIC level and year fixed effects are included in all models. Heteroskedastic-robust standard errors
with firm clustering are in brackets. Significance is depicted by *, **, and *** at the 10%, 5%, and 1% levels, respectively.
Model 1 Model 2 Model 3 Model 4 Model 5 Model 6 Model 7 Model 8
Tobit Tobit Tobit Tobit Probit Probit Probit Probit
PerDC PerDC PerDC PerDC DC DC DC DC
CEO RDE 0.017 -0.004
[0.014] [0.098]
CEO RDE > 1 0.087 0.085
[0.131] [0.536]
CEO RIR 0.043*** 0.004
[0.012] [0.063]
CEO RIRCA 0.045*** 0.018
[0.013] [0.066]
Size -0.061*** -0.054*** -0.075*** -0.070*** -0.112** -0.086* -0.097* -0.092*
[0.009] [0.010] [0.011] [0.011] [0.044] [0.045] [0.050] [0.048]
CEO RDE * Size -0.002 -0.007
[0.001] [0.011]
CEO RDE > 1 * Size -0.013 -0.042
[0.015] [0.063]
CEO RIR * Size -0.004*** 0
[0.001] [0.007]
CEO RIRCA * Size -0.005*** -0.001
[0.001] [0.007]
CEO Vega/Delta 0.003 0.008 0.012 0.007 0.299 2.574 3.211 3.314
[0.017] [0.020] [0.018] [0.017] [0.589] [1.695] [2.002] [2.066]
M/B 0.005 0.006 0.001 0.003 -0.09 -0.093 -0.100* -0.098
[0.016] [0.016] [0.016] [0.016] [0.059] [0.060] [0.060] [0.060]
Profitability 0.188 0.187 0.198 0.185 0.873 0.762 0.661 0.633

132
[0.148] [0.147] [0.148] [0.147] [0.698] [0.681] [0.673] [0.675]
Dividend Payer 0.012 0.015 0.017 0.017 0.072 0.116 0.072 0.075
[0.024] [0.024] [0.024] [0.024] [0.110] [0.111] [0.109] [0.110]
Tangibility -0.003 -0.001 -0.01 -0.008 0.452 0.427 0.441 0.434
[0.083] [0.083] [0.083] [0.082] [0.410] [0.406] [0.408] [0.406]
CF Volatility -0.147 -0.158 -0.193 -0.19 -1.408 -1.226 -1.182 -1.222
[0.202] [0.205] [0.206] [0.208] [0.986] [0.981] [0.982] [0.974]
RD Expenses -1.423*** -1.432*** -1.381*** -1.417*** -4.933** -4.979** -4.777** -4.762**
[0.501] [0.499] [0.506] [0.512] [2.221] [2.249] [2.231] [2.239]
Unrated 0.149*** 0.149*** 0.135*** 0.134*** -0.008 -0.022 -0.029 -0.037
[0.028] [0.028] [0.029] [0.028] [0.127] [0.125] [0.127] [0.128]
Book Leverage -0.427*** -0.434*** -0.387*** -0.389*** 0.277 0.371 0.424 0.454
[0.051] [0.052] [0.052] [0.053] [0.289] [0.284] [0.290] [0.291]
Constant 0.892*** 0.826*** 0.966*** 0.922*** 0.996 0.732 0.846 0.809
[0.134] [0.141] [0.156] [0.155] [0.785] [0.816] [0.798] [0.789]
Observations 2531 2531 2531 2531 2371 2371 2371 2371
Pseudo R2 0.4 0.4 0.4 0.4 0.18 0.17 0.17 0.17
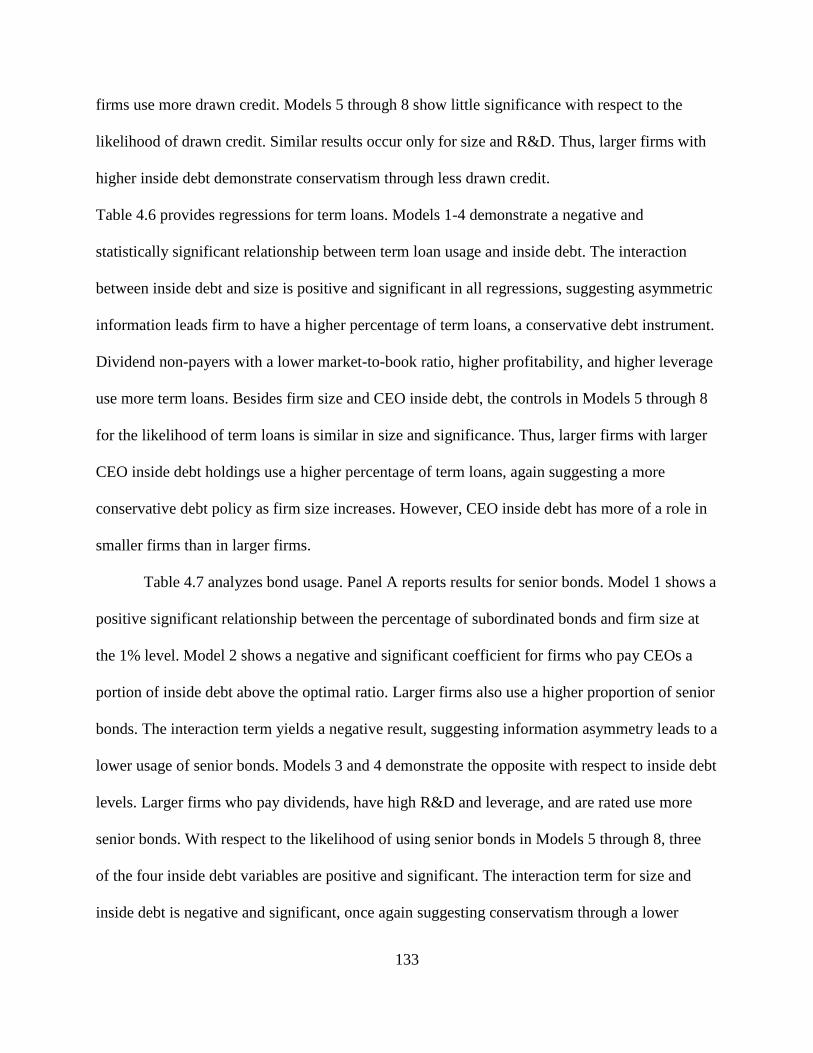
133
firms use more drawn credit. Models 5 through 8 show little significance with respect to the
likelihood of drawn credit. Similar results occur only for size and R&D. Thus, larger firms with
higher inside debt demonstrate conservatism through less drawn credit.
Table 4.6 provides regressions for term loans. Models 1-4 demonstrate a negative and
statistically significant relationship between term loan usage and inside debt. The interaction
between inside debt and size is positive and significant in all regressions, suggesting asymmetric
information leads firm to have a higher percentage of term loans, a conservative debt instrument.
Dividend non-payers with a lower market-to-book ratio, higher profitability, and higher leverage
use more term loans. Besides firm size and CEO inside debt, the controls in Models 5 through 8
for the likelihood of term loans is similar in size and significance. Thus, larger firms with larger
CEO inside debt holdings use a higher percentage of term loans, again suggesting a more
conservative debt policy as firm size increases. However, CEO inside debt has more of a role in
smaller firms than in larger firms.
Table 4.7 analyzes bond usage. Panel A reports results for senior bonds. Model 1 shows a
positive significant relationship between the percentage of subordinated bonds and firm size at
the 1% level. Model 2 shows a negative and significant coefficient for firms who pay CEOs a
portion of inside debt above the optimal ratio. Larger firms also use a higher proportion of senior
bonds. The interaction term yields a negative result, suggesting information asymmetry leads to a
lower usage of senior bonds. Models 3 and 4 demonstrate the opposite with respect to inside debt
levels. Larger firms who pay dividends, have high R&D and leverage, and are rated use more
senior bonds. With respect to the likelihood of using senior bonds in Models 5 through 8, three
of the four inside debt variables are positive and significant. The interaction term for size and
inside debt is negative and significant, once again suggesting conservatism through a lower

134
Table 4.6: Inside Debt Effect on Term Loan Usage
This table provides analysis of term loan usage given the presence of CEO inside debt. The dependent variables are the amount of
term loans used or if term loans were used at all. All controls are lagged. See the Appendix for variable definitions. Industry fixed
effects at the 2-digit SIC level and year fixed effects are included in all models. Heteroskedastic-robust standard errors with firm
clustering are in brackets. Significance is depicted by *, **, and *** at the 10%, 5%, and 1% levels, respectively.
Model 1 Model 2 Model 3 Model 4 Model 5 Model 6 Model 7 Model 8
Tobit Tobit Tobit Tobit Probit Probit Probit Probit
PerTL PerTL PerTL PerTL TL TL TL TL
CEO RDE -0.031* -0.081
[0.017] [0.064]
CEO RDE > 1 -0.348*** -0.737
[0.132] [0.518]
CEO RIR -0.034*** -0.019
[0.012] [0.060]
CEO RIRCA -0.030** -0.007
[0.013] [0.062]
Size -0.015 -0.029*** -0.005 -0.01 0.079* 0.049 0.071 0.069
[0.010] [0.010] [0.013] [0.013] [0.043] [0.044] [0.052] [0.050]
CEO RDE * Size 0.003* 0.008
[0.002] [0.007]
CEO RDE > 1 * Size 0.036** 0.07
[0.015] [0.062]
CEO RIR * Size 0.004*** 0.002
[0.001] [0.007]
CEO RIRCA * Size 0.003** 0.001
[0.001] [0.007]
CEO Vega/Delta 0.019 0.032 0.033 0.038 0.283 0.382 0.392 0.413
[0.030] [0.025] [0.029] [0.028] [0.204] [0.285] [0.308] [0.336]
M/B -0.039** -0.040** -0.037** -0.039** -0.126** -0.128** -0.128** -0.130**
[0.017] [0.016] [0.017] [0.017] [0.064] [0.063] [0.064] [0.064]
Profitability 0.302* 0.314* 0.289* 0.300* 1.177** 1.211** 1.171** 1.169**

135
[0.170] [0.166] [0.169] [0.169] [0.594] [0.589] [0.589] [0.590]
Dividend Payer -0.106*** -0.095*** -0.109*** -0.108*** -0.368*** -0.337*** -0.364*** -0.363***
[0.028] [0.028] [0.028] [0.028] [0.103] [0.103] [0.103] [0.103]
Tangibility -0.086 -0.101 -0.081 -0.084 -0.013 -0.062 -0.024 -0.028
[0.104] [0.103] [0.104] [0.103] [0.374] [0.371] [0.371] [0.370]
CF Volatility -0.048 -0.019 0.026 0.013 -0.596 -0.535 -0.481 -0.51
[0.265] [0.263] [0.275] [0.275] [0.955] [0.955] [0.976] [0.974]
RD Expenses -0.683 -0.684 -0.727* -0.694 -2.943* -2.988* -2.967* -2.940*
[0.439] [0.436] [0.441] [0.437] [1.734] [1.734] [1.746] [1.742]
Unrated 0.024 0.02 0.031 0.029 0.03 0.019 0.024 0.02
[0.034] [0.034] [0.035] [0.035] [0.128] [0.128] [0.131] [0.130]
Book Leverage 0.395*** 0.400*** 0.375*** 0.384*** 1.539*** 1.553*** 1.556*** 1.576***
[0.061] [0.060] [0.063] [0.063] [0.264] [0.262] [0.274] [0.271]
Constant -0.143 0.014 -0.165 -0.124 -1.698** -1.378* -1.624** -1.615**
[0.170] [0.176] [0.189] [0.187] [0.766] [0.780] [0.789] [0.780]
Observations 2531 2531 2531 2531 2447 2447 2447 2447
Pseudo R2 0.32 0.32 0.32 0.32 0.19 0.19 0.19 0.19

136
Table 4.7: Inside Debt Effect on Bond Usage
This table provides analysis of bond usage given the presence of CEO inside debt. Panel A provides analysis for senior bonds. Panel B
provides analysis for subordinated bonds. The dependent variables are the amount of bonds used or if bonds were used at all. All
controls are lagged. See the Appendix for variable definitions. Industry fixed effects at the 2-digit SIC level and year fixed effects are
included in all models. Heteroskedastic-robust standard errors with firm clustering are in brackets. Significance is depicted by *, **,
and *** at the 10%, 5%, and 1% levels, respectively.
Panel A: Senior Bonds
Model 1 Model 2 Model 3 Model 4 Model 5 Model 6 Model 7 Model 8
Tobit Tobit Tobit Tobit Probit Probit Probit Probit
PerSBN PerSBN PerSBN PerSBN SBN SBN SBN SBN
CEO RDE -0.001 0.193
[0.019] [0.160]
CEO RDE > 1 0.273** 1.469**
[0.139] [0.698]
CEO RIR -0.034** 0.184*
[0.015] [0.109]
CEO RIRCA -0.043*** 0.217*
[0.017] [0.122]
Size 0.057*** 0.064*** 0.064*** 0.063*** 0.467*** 0.533*** 0.425*** 0.431***
[0.012] [0.013] [0.015] [0.014] [0.072] [0.075] [0.080] [0.079]
CEO RDE * Size 0 -0.029
[0.002] [0.022]
CEO RDE > 1 * Size -0.029* -0.180*
[0.015] [0.094]
CEO RIR * Size 0.003* -0.029**
[0.002] [0.014]
CEO RIRCA * Size 0.004** -0.037**
[0.002] [0.016]
CEO Vega/Delta 0.01 0.012 -0.002 0.004 -1.378 -0.156 -1.112 -1.282
[0.035] [0.034] [0.034] [0.034] [3.302] [2.429] [2.558] [2.583]
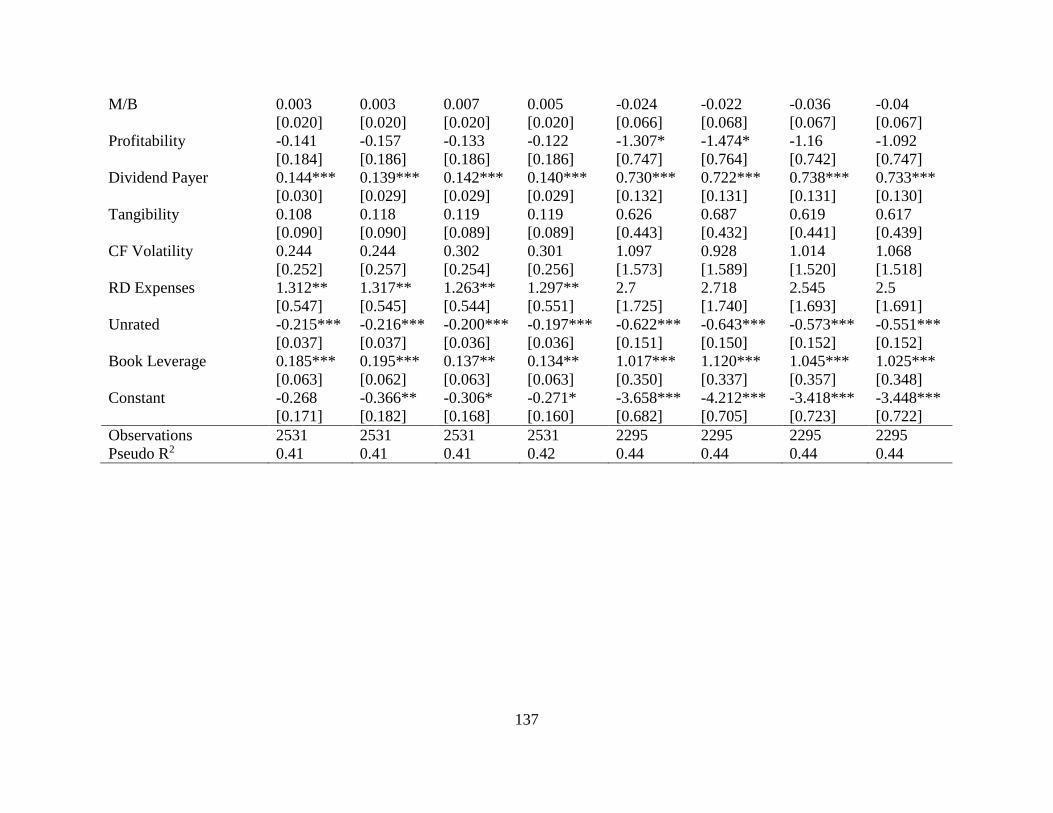
137
M/B 0.003 0.003 0.007 0.005 -0.024 -0.022 -0.036 -0.04
[0.020] [0.020] [0.020] [0.020] [0.066] [0.068] [0.067] [0.067]
Profitability -0.141 -0.157 -0.133 -0.122 -1.307* -1.474* -1.16 -1.092
[0.184] [0.186] [0.186] [0.186] [0.747] [0.764] [0.742] [0.747]
Dividend Payer 0.144*** 0.139*** 0.142*** 0.140*** 0.730*** 0.722*** 0.738*** 0.733***
[0.030] [0.029] [0.029] [0.029] [0.132] [0.131] [0.131] [0.130]
Tangibility 0.108 0.118 0.119 0.119 0.626 0.687 0.619 0.617
[0.090] [0.090] [0.089] [0.089] [0.443] [0.432] [0.441] [0.439]
CF Volatility 0.244 0.244 0.302 0.301 1.097 0.928 1.014 1.068
[0.252] [0.257] [0.254] [0.256] [1.573] [1.589] [1.520] [1.518]
RD Expenses 1.312** 1.317** 1.263** 1.297** 2.7 2.718 2.545 2.5
[0.547] [0.545] [0.544] [0.551] [1.725] [1.740] [1.693] [1.691]
Unrated -0.215*** -0.216*** -0.200*** -0.197*** -0.622*** -0.643*** -0.573*** -0.551***
[0.037] [0.037] [0.036] [0.036] [0.151] [0.150] [0.152] [0.152]
Book Leverage 0.185*** 0.195*** 0.137** 0.134** 1.017*** 1.120*** 1.045*** 1.025***
[0.063] [0.062] [0.063] [0.063] [0.350] [0.337] [0.357] [0.348]
Constant -0.268 -0.366** -0.306* -0.271* -3.658*** -4.212*** -3.418*** -3.448***
[0.171] [0.182] [0.168] [0.160] [0.682] [0.705] [0.723] [0.722]
Observations 2531 2531 2531 2531 2295 2295 2295 2295
Pseudo R2 0.41 0.41 0.41 0.42 0.44 0.44 0.44 0.44

138
Panel B: Subordinated Bonds
Model 1 Model 2 Model 3 Model 4 Model 5 Model 6 Model 7 Model 8
Tobit Tobit Tobit Tobit Probit Probit Probit Probit
PerSUB PerSUB PerSUB PerSUB SUB SUB SUB SUB
CEO RDE -0.006 0.009
[0.029] [0.088]
CEO RDE > 1 -0.316 -0.579
[0.284] [0.699]
CEO RIR 0.022 0.079
[0.026] [0.083]
CEO RIRCA 0.022 0.075
[0.027] [0.083]
Size -0.018 -0.02 -0.038 -0.037 0.011 0.017 -0.066 -0.062
[0.021] [0.019] [0.027] [0.026] [0.058] [0.055] [0.071] [0.067]
CEO RDE * Size 0 -0.004
[0.003] [0.009]
CEO RDE > 1 * Size 0.023 0.03
[0.032] [0.083]
CEO RIR * Size -0.003 -0.012
[0.003] [0.009]
CEO RIRCA * Size -0.003 -0.013
[0.003] [0.009]
CEO Vega/Delta -0.095* -0.055 -0.073 -0.077 -0.322* -0.2 -0.280* -0.291*
[0.053] [0.051] [0.048] [0.048] [0.172] [0.135] [0.149] [0.154]
M/B -0.100*** -0.100*** -0.104*** -0.104*** -0.205** -0.204** -0.210** -0.211**
[0.038] [0.038] [0.038] [0.038] [0.085] [0.084] [0.084] [0.084]
Profitability -0.214 -0.183 -0.205 -0.2 -0.942 -0.867 -0.897 -0.875
[0.276] [0.273] [0.274] [0.274] [0.713] [0.708] [0.707] [0.709]
Dividend Payer -0.273*** -0.253*** -0.263*** -0.266*** -0.624*** -0.572*** -0.594*** -0.607***
[0.054] [0.054] [0.053] [0.054] [0.129] [0.130] [0.127] [0.128]
Tangibility -0.072 -0.087 -0.072 -0.071 0.003 -0.033 0.007 0.012
[0.207] [0.205] [0.209] [0.210] [0.536] [0.535] [0.536] [0.537]

139
CF Volatility -0.513 -0.536 -0.486 -0.474 -1.551 -1.628 -1.338 -1.299
[0.720] [0.707] [0.693] [0.691] [1.944] [1.911] [1.843] [1.831]
RD Expenses 1.907** 1.866** 1.913** 1.894** 2.816* 2.697 2.775* 2.7
[0.760] [0.754] [0.758] [0.759] [1.667] [1.658] [1.673] [1.684]
Unrated -0.267*** -0.272*** -0.280*** -0.279*** -0.698*** -0.712*** -0.728*** -0.724***
[0.066] [0.065] [0.068] [0.069] [0.179] [0.178] [0.185] [0.187]
Book Leverage
0.197*
0.196*
0.213*
0.209*
0.732**
0.726**
0.720**
0.704**
[0.119] [0.117] [0.121] [0.122] [0.313] [0.311] [0.314] [0.314]
Constant 0.167 0.207 0.257 0.242 0.011 -0.007 0.413 0.375
[0.309] [0.296] [0.309] [0.299] [0.915] [0.902] [0.906] [0.886]
Observations 2531 2531 2531 2531 2257 2257 2257 2257
Pseudo R2 0.26 0.27 0.26 0.26 0.21 0.22 0.21 0.22

140
usage of senior bonds. The controls are statistically significant with the same sign across all
models. Thus, a lower likelihood and usage of bonds is demonstrated for larger firms who pay
the CEO with a disproportionate amount of inside debt.
Panel B of Table 4.7 provides results for subordinated bonds. With respect to inside debt
and size, there are no statistically significant results. From the controls I find unrated non-
dividend payers with a lower market-to-book ratio and higher R&D and leverage have a higher
percentage and likelihood of subordinated bonds, suggesting a capital structure heavily using
debt.
Table 4.8 provides analysis of commercial loans. Models 1 and 2 show no significance
among CEO RDE, firm size, and their interaction, respectively. CEO RIR and CEO RIRCA are
positive and statistically significant in Models 3 and 4, respectively. The interaction term
between these inside debt variables and size is negative and statistically significant, suggesting
asymmetric information leads larger firms with high inside debt to use a lower percentage of
commercial loans. Non-dividend payers with low profitability and low cash flow volatility use
more commercial loans. Thus, a conservative debt policy emerges through a lower usage of
commercial loans.
Table 4.9 provides results of other debt, which includes trust preferred stock. In Models 1
and 5, CEO RDE is negative and significant, suggesting a higher level of inside debt leads to a
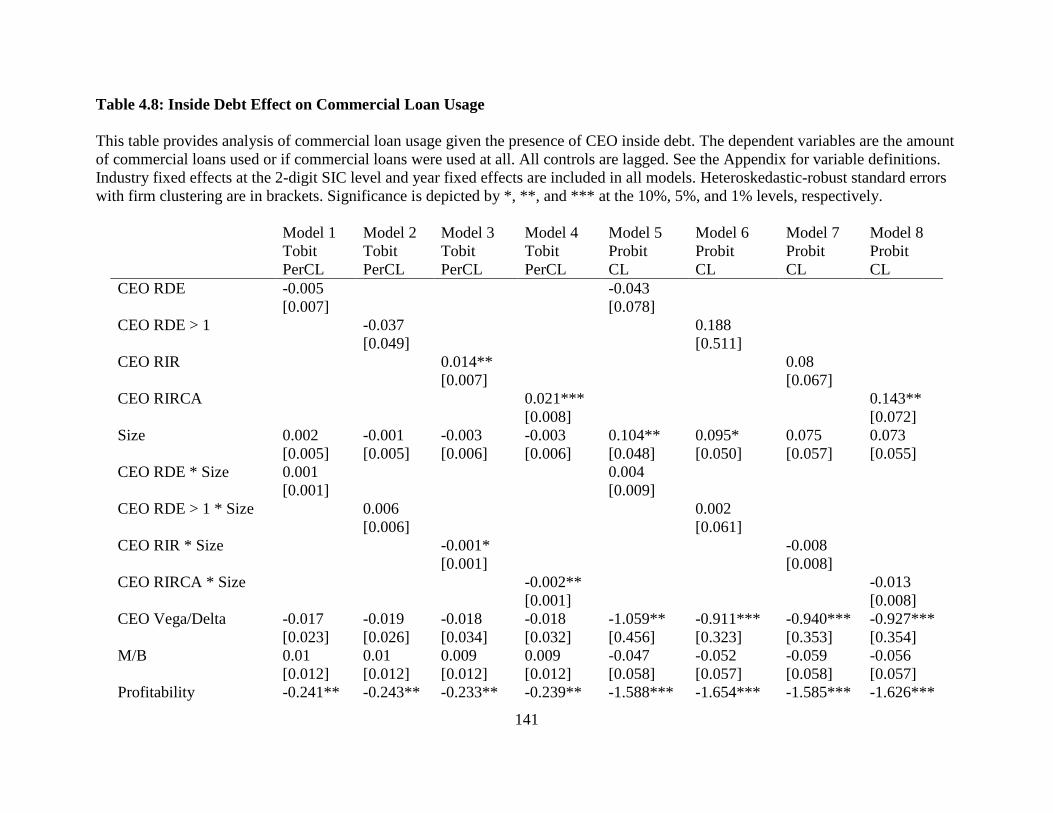
141
Table 4.8: Inside Debt Effect on Commercial Loan Usage
This table provides analysis of commercial loan usage given the presence of CEO inside debt. The dependent variables are the amount
of commercial loans used or if commercial loans were used at all. All controls are lagged. See the Appendix for variable definitions.
Industry fixed effects at the 2-digit SIC level and year fixed effects are included in all models. Heteroskedastic-robust standard errors
with firm clustering are in brackets. Significance is depicted by *, **, and *** at the 10%, 5%, and 1% levels, respectively.
Model 1 Model 2 Model 3 Model 4 Model 5 Model 6 Model 7 Model 8
Tobit Tobit Tobit Tobit Probit Probit Probit Probit
PerCL PerCL PerCL PerCL CL CL CL CL
CEO RDE -0.005 -0.043
[0.007] [0.078]
CEO RDE > 1 -0.037 0.188
[0.049] [0.511]
CEO RIR 0.014** 0.08
[0.007] [0.067]
CEO RIRCA 0.021*** 0.143**
[0.008] [0.072]
Size 0.002 -0.001 -0.003 -0.003 0.104** 0.095* 0.075 0.073
[0.005] [0.005] [0.006] [0.006] [0.048] [0.050] [0.057] [0.055]
CEO RDE * Size 0.001 0.004
[0.001] [0.009]
CEO RDE > 1 * Size 0.006 0.002
[0.006] [0.061]
CEO RIR * Size -0.001* -0.008
[0.001] [0.008]
CEO RIRCA * Size -0.002** -0.013
[0.001] [0.008]
CEO Vega/Delta -0.017 -0.019 -0.018 -0.018 -1.059** -0.911*** -0.940*** -0.927***
[0.023] [0.026] [0.034] [0.032] [0.456] [0.323] [0.353] [0.354]
M/B 0.01 0.01 0.009 0.009 -0.047 -0.052 -0.059 -0.056
[0.012] [0.012] [0.012] [0.012] [0.058] [0.057] [0.058] [0.057]
Profitability -0.241** -0.243** -0.233** -0.239** -1.588*** -1.654*** -1.585*** -1.626***

142
[0.098] [0.098] [0.098] [0.098] [0.567] [0.569] [0.571] [0.572]
Dividend Payer -0.024* -0.026* -0.023* -0.022* -0.215* -0.242** -0.204* -0.197*
[0.014] [0.014] [0.013] [0.013] [0.114] [0.115] [0.114] [0.113]
Tangibility 0.067* 0.068* 0.062 0.061 0.593 0.623 0.56 0.546
[0.039] [0.039] [0.039] [0.039] [0.400] [0.404] [0.401] [0.400]
CF Volatility -0.451** -0.442** -0.459*** -0.465*** -3.391** -3.258** -3.442** -3.509**
[0.176] [0.179] [0.174] [0.173] [1.468] [1.499] [1.473] [1.468]
RD Expenses -0.1 -0.093 -0.092 -0.104 -0.675 -0.613 -0.572 -0.639
[0.227] [0.227] [0.226] [0.227] [1.615] [1.635] [1.612] [1.629]
Unrated -0.008 -0.009 -0.013 -0.016 -0.165 -0.176 -0.2 -0.22
[0.015] [0.015] [0.015] [0.015] [0.141] [0.141] [0.143] [0.143]
Book Leverage -0.035 -0.032 -0.017 -0.011 0.4 0.467* 0.542* 0.604**
[0.033] [0.033] [0.033] [0.032] [0.280] [0.274] [0.288] [0.286]
Constant -0.092 -0.063 -0.06 -0.075 -1.705** -1.664* -1.570* -1.651*
[0.076] [0.081] [0.088] [0.090] [0.863] [0.877] [0.910] [0.937]
Observations 2531 2531 2531 2531 2458 2458 2458 2458
Pseudo R2 0.67 0.68 0.68 0.7 0.16 0.16 0.16 0.16

143
Table 4.9: Inside Debt Effect on Other Debt Usage
This table provides analysis of other debt usage given the presence of CEO inside debt. The dependent variables are the amount of
other debt used or if other debt was used at all. All controls are lagged. See the Appendix for variable definitions. Industry fixed
effects at the 2-digit SIC level and year fixed effects are included in all models. Heteroskedastic-robust standard errors with firm
clustering are in brackets. Significance is depicted by *, **, and *** at the 10%, 5%, and 1% levels, respectively.
Model 1 Model 2 Model 3 Model 4 Model 5 Model 6 Model 7 Model 8
Tobit Tobit Tobit Tobit Probit Probit Probit Probit
PerOTHER PerOTHER PerOTHER PerOTHER OTHER OTHER OTHER OTHER
CEO RDE -0.017* -0.152**
[0.010] [0.072]
CEO RDE > 1 0.06 1.153**
[0.076] [0.537]
CEO RIR -0.008 -0.02
[0.009] [0.092]
CEO RIRCA -0.008 -0.019
[0.009] [0.092]
Size 0.058*** 0.056*** 0.067*** 0.066*** 0.421*** 0.452*** 0.422*** 0.426***
[0.008] [0.007] [0.009] [0.009] [0.056] [0.054] [0.060] [0.055]
CEO RDE * Size 0.002* 0.017**
[0.001] [0.008]
CEO RDE > 1 * Size -0.005 -0.142**
[0.009] [0.067]
CEO RIR * Size 0.002 0.004
[0.001] [0.011]
CEO RIRCA * Size 0.002 0.005
[0.001] [0.011]
CEO Vega/Delta 0.012 0.012 0.020** 0.020** 0.444 0.973* 1.030* 1.045*
[0.008] [0.012] [0.009] [0.008] [0.343] [0.578] [0.600] [0.595]
M/B -0.008 -0.008 -0.008 -0.007 -0.067 -0.068 -0.072 -0.07
[0.010] [0.010] [0.010] [0.010] [0.067] [0.066] [0.067] [0.067]
Profitability -0.132 -0.131 -0.146 -0.15 -0.532 -0.565 -0.595 -0.617

144
[0.098] [0.096] [0.098] [0.099] [0.624] [0.621] [0.615] [0.616]
Dividend Payer -0.019 -0.021 -0.02 -0.018 0.025 0.02 0.026 0.029
[0.018] [0.018] [0.018] [0.018] [0.108] [0.110] [0.108] [0.108]
Tangibility 0.032 0.033 0.03 0.03 -0.203 -0.241 -0.24 -0.241
[0.054] [0.054] [0.055] [0.055] [0.378] [0.384] [0.382] [0.383]
CF Volatility 0.183 0.192 0.171 0.17 0.162 0.291 0.213 0.204
[0.156] [0.156] [0.164] [0.164] [0.943] [1.024] [1.000] [1.003]
RD Expenses -0.621** -0.607** -0.612** -0.606** -5.690*** -5.887*** -5.680*** -5.691***
[0.263] [0.262] [0.264] [0.264] [1.762] [1.768] [1.770] [1.771]
Unrated 0.031 0.03 0.031 0.031 -0.157 -0.153 -0.161 -0.16
[0.022] [0.022] [0.022] [0.022] [0.131] [0.130] [0.131] [0.131]
Book Leverage 0.148*** 0.155*** 0.163*** 0.163*** 0.503* 0.589** 0.610** 0.621**
[0.045] [0.044] [0.046] [0.046] [0.285] [0.278] [0.293] [0.289]
Constant -0.580*** -0.570*** -0.618*** -0.616*** -3.123*** -3.401*** -3.152*** -3.196***
[0.115] [0.114] [0.111] [0.109] [0.603] [0.611] [0.618] [0.598]
Observations 2531 2531 2531 2531 2473 2473 2473 2473
Pseudo R2 0.77 0.77 0.78 0.78 0.26 0.26 0.26 0.26

145
lower usage and likelihood of other debt. The interaction between CEO RDE and firm size is
positive and significant in both models, suggesting asymmetric information leads larger firms
with higher levels of CEO inside debt to diversify by using other types of debt. CEOs with a
larger Vega-to-delta ratio have a positive association with other debt. Firms with lower research
and development expenses and higher book leverage have a higher usage and likelihood of other
debt. Future research can delve more into the components of other debt to see if items like trust
preferred stock have an effect on a firm’s financial policy.
Two other topics of interest related to debt instruments are interest rates and maturity.
Table 4.10 provides results concerning debt interest rates33. Model 1 has no significance among
CEO RDE, firm size, and their interaction, respectively. In model 2, for firms who pay their
CEOs with more debt than what is theoretically optimal (CEO RDE > 1), I find a significant
positive association with higher interest rates at a 5% level. A statistically weaker result is
demonstrated with CEO RIR and CEO RIRCA in Models 3 and 4, respectively. The interaction
between inside debt and size is negative and significant in three models, suggesting larger firms
who incentivize CEOs with relatively more inside debt have a lower weighted average cost of
debt capital. Firms with a high market-to-book ratio, lower profitability, and lower cash flow
volatility have higher interest rates.
Maturity is analyzed in Table 4.11. Models 1 and 2 show a significant negative
relationship between average debt maturity and firm size at the 5% level. I find higher inside
debt is positively related to higher maturity of debt issues in Models 3 and 4 with CEO RIR and
CEO RIRCA, respectively. This effect is significant at the 1% level for the level of inside debt
33 The data for this regression is 80% smaller compared to other models due to the lack of interest rate data available
in Capital IQ.

146
Table 4.10: CEO Inside Debt and Debt Interest Rates
This table provides OLS regressions of interest rates on debt given the presence of CEO inside
debt. The dependent variable is the natural log of the weighted average interest rate on all debt
issues. See the Appendix for variable definitions. All controls are lagged. Industry fixed effects at
the 2-digit SIC level and year fixed effects are included in all models. Heteroskedastic-robust
standard errors with firm clustering are in brackets. Significance is depicted by *, **, and *** at
the 10%, 5%, and 1% levels, respectively.
Model 1 Model 2 Model 3 Model 4
OLS OLS OLS OLS
Interest Interest Interest Interest
CEO RDE 0.178
[0.141]
CEO RDE > 1 2.651**
[1.122]
CEO RIR 0.286*
[0.160]
CEO RIRCA 0.340*
[0.194]
Size 0.029 0.119 -0.072 -0.069
[0.082] [0.082] [0.116] [0.111]
CEO RDE * Size -0.014
[0.012]
CEO RDE > 1 * Size -0.249**
[0.124]
CEO RIR * Size -0.025*
[0.014]
CEO RIRCA * Size -0.031*
[0.017]
CEO Vega/Delta 0.166 0.19 0.118 0.145
[0.223] [0.230] [0.230] [0.227]
M/B 32.217** 18.647** 22.209** 21.624**
[14.479] [9.045] [9.290] [9.404]
Profitability -3.747** -3.837** -3.782** -4.052**
[1.828] [1.861] [1.880] [1.893]
Dividend Payer 0.043 -0.038 0.141 0.168
[0.328] [0.325] [0.322] [0.337]
Tangibility 0.921 1.021 0.849 0.913
[0.681] [0.695] [0.689] [0.693]
CF Volatility -5.222** -5.440** -6.410** -6.362**
[2.183] [2.100] [2.478] [2.481]
RD Expenses -5.044 -5.426 -4.272 -4.263
[4.898] [4.754] [4.865] [4.900]
Unrated -0.333 -0.267 -0.451 -0.432
[0.274] [0.277] [0.288] [0.286]
Book Leverage 0.564 0.648 1.003* 1.086*
[0.549] [0.533] [0.581] [0.625]
Constant -0.005 -0.681 0.589 0.507
[0.777] [0.797] [0.941] [0.903]
Observations 590 590 590 590
R2 0.32 0.33 0.33 0.33

147
Table 4.11: CEO Inside Debt and Debt Maturity
This table provides OLS regressions of debt maturity given the presence of CEO inside debt. The dependent variable
is the natural log of the weighted average length of time to maturity on all debt issues. See the Appendix for variable
definitions. All variables are lagged. Industry fixed effects at the 2-digit SIC level and year fixed effects are included
in all models. Heteroskedastic-robust standard errors with firm clustering are in brackets. Significance is depicted by
*, **, and *** at the 10%, 5%, and 1% levels, respectively.
Model 1 Model 2 Model 3 Model 4
OLS OLS OLS OLS
Maturity Maturity Maturity Maturity
CEO RDE -0.021
[0.042]
CEO RDE > 1 -0.539
[0.396]
CEO RIR 0.079**
[0.034]
CEO RIRCA 0.105***
[0.037]
Size -0.072** -0.088** -0.099** -0.093**
[0.034] [0.035] [0.042] [0.039]
CEO RDE * Size 0.002
[0.005]
CEO RDE > 1 * Size 0.053
[0.044]
CEO RIR * Size -0.007**
[0.004]
CEO RIRCA * Size -0.010**
[0.004]
CEO Vega/Delta 0.04 0.037 0.031 0.036
[0.050] [0.049] [0.050] [0.049]
M/B -0.005 0.018 0.042 0.032
[0.062] [0.065] [0.063] [0.063]
Profitability 0.742 0.765 0.74 0.692
[0.531] [0.530] [0.532] [0.530]
Dividend Payer -0.004 0.015 0.007 0.012
[0.076] [0.078] [0.076] [0.076]
Tangibility 0.218 0.193 0.19 0.187
[0.223] [0.219] [0.221] [0.220]
CF Volatility 0.158 0.185 0.071 0.056
[0.476] [0.481] [0.484] [0.481]
RD Expenses -3.588** -3.602** -3.533** -3.598**
[1.533] [1.534] [1.559] [1.559]
Unrated 0.365*** 0.360*** 0.329*** 0.319***
[0.092] [0.092] [0.096] [0.096]
Book Leverage -0.394** -0.394*** -0.275* -0.258
[0.153] [0.150] [0.165] [0.162]
Constant 5.546*** 5.672*** 5.787*** 5.749***
[0.271] [0.263] [0.309] [0.293]
Observations 2451 2451 2451 2451
R2 0.19 0.19 0.19 0.2

148
incentives after adjusting for cash compensation, and it is significant at the 5% level for inside
debt incentives only. Thus, firms with higher inside debt are more likely to have longer maturity
on their debt issues. Thus, I conclude CEOs paid with higher amounts of inside debt cater, on
average, to debt holders through the channels of yield and maturity. However, once one
considers size, the effect is mitigated. Size is negative and significant at the 5% level in all
specifications. Models 3 and 4 show the interaction between inside debt and size is negative and
significant, suggesting firms with higher asymmetric information utilize it to achieve shorter
maturities on the debt portion of their capital structure. Unrated firms with lower R&D and lower
leverage have longer maturities.
4.5. Robustness
Cassell et al. (2012) and Cen (2011) test for the endogeneity of inside debt using IVs
such as industry medians of inside debt, tax status, executive personal wealth, and state tax rate. I
run instrumental variable (IV) regressions for Table 4.2. In the first stage I include the industry
median of inside debt, CEO age, an indicator if the CEO is new, total assets, market-to-book
ratio, an indicator if the firm has a positive tax carry-forward, and the state tax rate. I then use the
predicted value of the inside debt variables in the second stage where all controls are used. In
unreported results, I am unable to reject the null from the Wald test of exogeneity, suggesting my
previous models are preferred over IV regressions. I also use panel techniques to show the results
are further robust to model specification. In unreported results, I use Tobit and Probit random
effects and OLS fixed effects and find similar results to the main findings.
Another concern is the calculation of the inside debt ratio. Is the CEO leverage or firm
leverage driving the results? In unreported results, I test all regressions by including a leverage

149
indicator if it is greater than one. Only one model has both CEO RDE > 1 and Leverage > 1 as
significant, but the magnitude, direction, and significance are the same for both.
4.6. Conclusion
Both CEO compensation structure and firm capital structure are important factors in other
firm decisions. Companies who pay CEOs later use a few specific types of debt holdings. These
firms are more likely to use a small portion commercial paper and term loans together, but they
are less likely to combine drawn credit lines, term loans, or senior bonds with subordinated bonds.
These companies tend to use more capital leasing but less term loans or bonds, regardless of
seniority. These firms tend to pay higher interest rates and have debt outstanding for longer periods
of time. Future research can further breakdown the structure of CEO compensation and debt along
with equity.

150
REFERENCES
AGRAWAL, A. and MANDELKER, G.N., 1987. Managerial Incentives and Corporate
Investment and Financing Decisions. Journal of Finance, 42(4), pp. 823-837.
ANANTHARAMAN, D., FANG, V.W. and GONG, G., 2013. Inside debt and the design of
corporate debt contracts. Management Science, .
ANANTHARAMAN, D. and LEE, Y.G., 2014. Managerial risk taking incentives and corporate
pension policy. Journal of Financial Economics, 111(2), pp. 328-351.
BELKHIR, M. and BOUBAKER, S., 2013. CEO inside debt and hedging decisions: Lessons
from the US banking industry. Journal of International Financial Markets, Institutions and
Money, 24, pp. 223-246.
BENNETT, R.L., GUNTAY, L. and UNAL, H., 2012. Inside Debt, Bank Default Risk and
Performance during the Crisis. FDIC Center for Financial Research Working Paper, (2012-3),.
BERGLOF, E. and VON THADDEN, E.L., 1994. Short-term versus long-term interests: Capital
structure with multiple investors. The Quarterly Journal of Economics, 109(4), pp. 1055-1084.
BLACK, F. and SCHOLES, M., 1973. The pricing of options and corporate liabilities. The
journal of political economy, , pp. 637-654.
BRIS, A. and WELCH, I., 2005. The Optimal Concentration of Creditors. Journal of Finance,
60(5), pp. 2193-2212.
CASSELL, C.A., HUANG, S.X., MANUEL SANCHEZ, J. and STUART, M.D., 2012. Seeking
safety: The relation between CEO inside debt holdings and the riskiness of firm investment and
financial policies. Journal of Financial Economics, 103(3), pp. 588-610.
COLLA, P., IPPOLITO, F. and LI, K., 2013. Debt Specialization. Journal of Finance, 68(5), pp.
2117-2141.
CRONQVIST, H., MAKHIJA, A.K. and YONKER, S.E., 2012. Behavioral consistency in
corporate finance: CEO personal and corporate leverage. Journal of Financial Economics,
103(1), pp. 20-40.
DENIS, D.J. and MCKEON, S.B., 2012. Debt financing and financial flexibility evidence from
proactive leverage increases. Review of Financial Studies, 25(6), pp. 1897-1929.
DIAMOND, D.W., 1991. Debt Maturity Structure and Liquidity Risk. Quarterly Journal of
Economics, 106(3), pp. 709-737.

151
DOWNING, C. and OLINER, S., 2007. The term structure of commercial paper rates. Journal of
Financial Economics, 83(1), pp. 59-86.
DUCHIN, R., OZBAS, O. and SENSOY, B.A., 2010. Costly external finance, corporate
investment, and the subprime mortgage credit crisis. Journal of Financial Economics, 97(3), pp.
418-435.
EDMANS, A. and LIU, Q., 2011. Inside debt. Review of Finance, 15(1), pp. 75-102.
FLANNERY, M.J., 1986. Asymmetric Information and Risky Debt Maturity Choice. Journal of
Finance, 41(1), pp. 19-37.
FRANCIS, B. and YILMAZ, G., 2012. Inside Debt and Stock Price Performance. Available at
SSRN 2021396, .
GATEV, E. and STRAHAN, P.E., 2006. Banks' advantage in hedging liquidity risk: Theory and
evidence from the commercial paper market. The Journal of Finance, 61(2), pp. 867-892.
GRIFFITHS, M.D., KOTOMIN, V. and WINTERS, D.B., 2011. The Federal Reserve and the
2007–2009 financial crisis: Treating a virus with antibiotics? Evidence from the commercial
paper market. Financial Review, 46(4), pp. 541-567.
HACKBARTH, D. and MAUER, D.C., 2012. Optimal priority structure, capital structure, and
investment. Review of Financial Studies, 25(3), pp. 747-796.
HART, O. and MOORE, J., 1994. A Theory of Debt Based on the Inalienability of Human
Capital. Quarterly Journal of Economics, 109(4), pp. 841-879.
HOLMSTROM, B., 1982. Moral hazard in teams. Bell Journal of Economics, 13(2), pp. 324-
340.
JENSEN, M.C. and MECKLING, W.H., 1976. Theory of the firm: Managerial behavior, agency
costs and ownership structure. Journal of Financial Economics, 3(4), pp. 305-360.
JOHN, K., RAVID, S.A. and REISEL, N., 2010. The notching rule for subordinated debt and the
information content of debt rating. Financial Management, 39(2), pp. 489-513.
LIU, Y.(.1.)., MAUER, D.C.(.2.). and ZHANG, Y.(.3.)., 2014. Firm cash holdings and CEO
inside debt. Journal of Banking and Finance, 42(1), pp. 83-100.
RAUH, J.D. and SUFI, A., 2012. Explaining corporate capital structure: Product markets, leases,
and asset similarity. Review of Finance, 16(1), pp. 115-155.
RAUH, J.D. and SUFI, A., 2010. Capital structure and debt structure. Review of Financial
Studies, 23(12), pp. 4242-4280.
152
RAUH, J.D., 2006. Investment and Financing Constraints: Evidence from the Funding of
Corporate Pension Plans. Journal of Finance, 61(1), pp. 33-71.
SUNDARAM, R.K. and YERMACK, D.L., 2007. Pay Me Later: Inside Debt and Its Role in
Managerial Compensation. Journal of Finance, 62(4), pp. 1551-1588.
WEI, C. and YERMACK, D., 2011. Investor Reactions to CEOs' Inside Debt Incentives. Review
of Financial Studies, 24(11), pp. 3813-3840.
WELCH, I., 1997. Why is bank debt senior? A theory of asymmetry and claim priority based on
influence costs. Review of Financial Studies, 10(4), pp. 1203.
WHITE, R., 2012. Inside Debt and Firm Dividend Policy. Available at SSRN 2054787, .

153
APPENDIX
VARIABLE Definition
HHI Herfindahl-Hirschman index of debt type usage
EXCL90 Colla et al. (2013) indicator if a firm has more than 90% of debt
in one type
CP Commercial paper
DC Drawn credit line
TL Term loans
SBN Senior bonds and notes
SUB Subordinated bonds and notes
CL Capital leases
OTHER Other debt and total trust-preferred stock
PERCP Percentage of commercial paper used by the firm
PERDC Percentage of drawn credit line used by the firm
PERTL Percentage of term loans used by the firm
PERSBN Percentage of senior bonds and notes used by the firm
PERSUB Percentage of subordinated bonds and notes used by the firm
PERCL Percentage of capital leases used by the firm
PEROTHER Percentage of other debt and total trust-preferred stock
used by the firm
INTEREST Natural log of the weighted average interest rate on all debt
issues
MATURITY Natural log of the weighted average length of time to maturity
on all debt issues
CEO RDE 𝑝𝑒𝑛𝑠𝑖𝑜𝑛𝑣𝑎𝑙𝑢𝑒𝑡𝑜𝑡+ 𝑑𝑒𝑓𝑒𝑟𝑏𝑎𝑙𝑎𝑛𝑐𝑒𝑡𝑜𝑡
𝑠ℎ𝑟𝑜𝑤𝑛𝑒𝑥𝑐𝑙𝑜𝑝𝑡𝑠∗ 𝑝𝑟𝑐𝑐𝑓 + (𝑜𝑝𝑡𝑒𝑥𝑒𝑟𝑣𝑎𝑙
+ 𝑜𝑝𝑡𝑢𝑛𝑒𝑥𝑒𝑥𝑒𝑟𝑒𝑠𝑡𝑣𝑎𝑙+ 𝑜𝑝𝑡𝑢𝑛𝑒𝑥𝑢𝑛𝑒𝑥𝑒𝑟𝑒𝑠𝑡𝑣𝑎𝑙
)
𝑑𝑙𝑡𝑡 + 𝑑𝑙𝑐𝑐𝑠ℎ𝑜 ∗ 𝑝𝑟𝑐𝑐𝑓
CEO RDE > 1 Natural log of the CEO’s inside debt to the firm’s debt
established by Cassell et al. (2012), where the CEO has debt in
the form of pension benefits and deferred compensation and
equity in the form of stock and stock options (valued by Black-
Scholes (1973) and the firm has current liabilities and long-term
debt and equity valued as the total number of common shares
outstanding multiplied by the current market price at the end of
the fiscal-year

154
CEO RIR 𝑝𝑒𝑛𝑠𝑖𝑜𝑛𝑣𝑎𝑙𝑢𝑒𝑡𝑜𝑡+ 𝑑𝑒𝑓𝑒𝑟_𝑏𝑎𝑙𝑎𝑛𝑐𝑒𝑡𝑜𝑡
𝑠ℎ𝑟𝑜𝑤𝑛𝑒𝑥𝑐𝑙𝑜𝑝𝑡𝑠∗ 𝑝𝑟𝑐𝑐𝑓 + ∑ 𝑑𝑒𝑙𝑡𝑎𝑖 ∗ 𝑜𝑝𝑡𝑖𝑜𝑛 𝑡𝑦𝑝𝑒𝑖
31
𝑑𝑙𝑡𝑡 + 𝑑𝑙𝑐𝑜𝑝𝑡𝑜𝑠𝑒𝑦 ∗ 𝑜𝑝𝑡𝑝𝑟𝑐𝑏𝑦
Natural log of the CEO relative incentive ratio established by
Wei and Yermack (2011), where the CEO has debt in the form
of pension benefits and deferred compensation and equity in the
form of stock and stock options (valued according to option
delta by exercisability tranches using Black-Scholes (1973))
and the firm has current and long-term debt and equity options
(valued by total employee options, the average outstanding
exercise price, and assumed expiration of 4 years). I = 1 to 3 for
each type of option (exercised, unexercised exercisable, and
unexercised unexercisable), optosey is the total number of
employee options, and optprcby is the average exercise price.
CEO RIRCA CEO RIR adjusted to include the present value of expected
future cash compensation, which is computed by estimating the
CEO expected decision horizon (Industry median tenure – CEO
tenure + industry median age – CEO age) x the current level of
cash compensation, with pensions and deferred compensation
as inside debt
Profitability Operating income before depreciation / total assets
Tangibility Net property, plant, and equipment / total assets
M/B (Stock price x Common shares used to calculate earnings per
share + debt in current liabilities + long-term debt + preferred
stock liquidating value – deferred taxes and investment tax
credit) / total assets
Size Natural log of total assets
Dividend Payer Indicator if common stock dividends are positive
RD Expenses Research and development expenses / total assets
Unrated Indicator if the firm is not rated by S&P
CF Volatility Standard deviation of quarterly operating income over previous
12 quarters / total assets
Book Leverage Assets less equity scaled by assets
155
CHAPTER 5
CONCLUSION
Does executive compensation matter in incentivizing CEOs to achieve firm goals? We
find that the answer is still affirmative. We find CEOs who wait on exercising their stock options
or who buy more of their own company’s stock contribute to higher participation in directorships
and board committees outside of their own firms, and they tend to pick CEOs similar in nature to
themselves and pay them more. CEOs who have a higher proportion of their compensation
coming from stocks and stock options that are granted but cannot be exercised until three to five
years later exhibit more conservative behavior with regards to investment, specifically, a merger
or acquisition. CEOs with higher long-term incentive pay are less likely to merge or acquire
another company, but if they do, the company is more likely to be a relative smaller company in
the same industry. To mitigate liquidity concerns, they acquire this firm with stock. Another type
of compensation a company may use to suggest more conservative behavior is inside debt, or
deferred and retirement compensation from defined benefit plans. With respect to financial
policy, larger firms who pay CEOs with more inside debt have a diversified debt capital structure
that pays, on average, lower yields for shorter maturities.
Overall, we suggest overconfidence affects many business decisions from the top down;
overconfidence is more popular in the business community and can lead to riskier decision-
making with regards to CEO pay and quicker decisions after a CEO turnover. Long-term incentive
payouts and inside debt can potentially mitigate the potential of a CEO’s overconfidence by
forcing him to be more conservative; otherwise, he will not receive the full package of

156
compensation benefits. Thus, the amount and types of compensation incentives should be
considered by investors making decisions about bond and stock purchases and for researchers to
consider in corporate finance.
Related Documents