Proceedings of the International Multiconference on ISBN 978-83-60810-22-4 Computer Science and Information Technology, pp. 435 – 440 ISSN 1896-7094 Abstract—In craniofacial rectification process, most physi- cians conduct surgical planning through the patient’s two-di- mensional cephalometry. Three-dimensional models, however, can present more reliable and instructional results, and can help evaluate craniofacial features from different angles and curve surfaces. This study focuses on reconstruction and adjustment of the three-dimensional model for patients with cleft lips and palate, and to establish soft-to-hard tissue relativity model in Le Fort I maxillary osteotomy. We proposed the spatial transformation-calibration and modeling (STCM) method to predict change of soft tissues after Le Fort I maxillary osteotomy. The preliminary case studies were done by using two data sets to help the physicians and the patients further their understanding of current conditions and approximate profiles after the forthcoming surgical operations I. INTRODUCTION uman face is a sophisticate and physiologically multi- functional part of anatomy through which people usually perceive and obtain first-sight impression [1]. The needs for facial surgery are not only a quest for perfection, but also in major part for establishment of self-esteem by corrective operations, e.g., orthognathic surgery, to rectify defects. Most of current clinical practices lack three- dimensional perspectives of the patient in that the craniofacial physicians employ the cephalometry to assess features, e.g., craniofacial surface and bones. Cephalometry is used to depict the craniofacial morphology of a side, frontal or lateral. The inherent limitation of cephalometry is its two-dimensionality: the facial entirety cannot be perceived as a whole, however, and mental reconstruction must be rendered. Besides, a two-dimensional feature on a cephalometric view can be misleading. For example, with inadvertent orientation adjustment of the cephalometric view, one may find varied pro-nasal points, which should be unique and define the front-most point of the lateral view of a face. H Cleft lip and palate is the most common inborn craniofa- cial defect. It happens in about every 500 to 600 newly born babies in Asia. Le Fort I is a major operation procedure to rectify such abnormality. It is important in clinical practices * To whom correspondence may address. to accurately predict the changes of soft tissue for both the physician and the patient. A three-dimensional modeling system can help. In this work, we further the studies in the relativity of soft-and-hard tissues, with emphasis in maxilla and mandible areas of the face. We incorporate the feature- based soft-tissue reconstruction into the developed three-di- mensional modeling system. M. S. Su et al . employed two orthogonal two- dimensional images to reconstruct the three-dimensional facial model [2]-[3]. The promising approach produces merely desirable results due to its limited three-dimensional information from two orthogonal views. In related studies of three-dimensional calibration, O. Burgert et al . employed the distraction and symmetry method to transform an asymmetric face to a symmetric face [4]. The proposed distraction process included: (1) pulling and dragging the mandible progressively; (2) removing (or filling missing) tissues and bones. The proposed symmetry process is to determine the mid-face plane and perform mirroring. Although the symmetry process can be used to estimate the degree of the defects, it is not realistic to assume that all people’s face conforms to symmetry [5]. In this paper, we propose a spatial transformation- calibration and modeling (STCM) method, which the user can adjust the feature points of the face and perform planning of the craniofacial surgery. The developed system can automatically determine estimated results of the Le Fort I osteotomy by using the soft-to-hard tissue correspondence derived from the statistical data proposed in Ref. [5]-[6]. Approximate profiles of the craniofacial rectification are then computed accordingly. The remainder of the paper is structured as below. In Section II , we shall deliberate the proposed STCM, as well as the soft-to-hard tissue correlation. The experimental protocol and preliminary results of our study is presented in Section III . Section IV gives the concluding remarks of this paper. II.METHOD In the following, Section II - II states the 3D craniofacial model and the corresponding pre-processing: hard and soft tissue segmentation; Section II - II explains proposed 435 Three-Dimensional Model Reconstruction for Cleft Lip and Palate Surgery Chun-Fu Wang Dept. of Computer Sci & Information Engineering Chang Gung University 259 Wen-Hwa 1st Road, Kwei-Shan Tao-Yuan, Taiwan. Email: [email protected] Shu-Yen Wan* Dept. of Information Management Chang Gung University Chang Gung Bioinformatics Center 259 Wen-Hwa 1st Road, Kwei-Shan Tao- Yuan,Taiwan. Email: [email protected]

Welcome message from author
This document is posted to help you gain knowledge. Please leave a comment to let me know what you think about it! Share it to your friends and learn new things together.
Transcript

Proceedings of the International Multiconference on ISBN 978-83-60810-22-4 Computer Science and Information Technology, pp. 435 – 440 ISSN 1896-7094
Abstract—In craniofacial rectification process, most physi-cians conduct surgical planning through the patient’s two-di-mensional cephalometry. Three-dimensional models, however, can present more reliable and instructional results, and can help evaluate craniofacial features from different angles and curve surfaces. This study focuses on reconstruction and adjustment of the three-dimensional model for patients with cleft lips and palate, and to establish soft-to-hard tissue relativity model in Le Fort I maxillary osteotomy. We proposed the spatial transformation-calibration and modeling (STCM) method to predict change of soft tissues after Le Fort I maxillary osteotomy. The preliminary case studies were done by using two data sets to help the physicians and the patients further their understanding of current conditions and approximate profiles after the forthcoming surgical operations
I. INTRODUCTION
uman face is a sophisticate and physiologically multi-functional part of anatomy through which people
usually perceive and obtain first-sight impression [1]. The needs for facial surgery are not only a quest for perfection, but also in major part for establishment of self-esteem by corrective operations, e.g., orthognathic surgery, to rectify defects. Most of current clinical practices lack three-dimensional perspectives of the patient in that the craniofacial physicians employ the cephalometry to assess features, e.g., craniofacial surface and bones. Cephalometry is used to depict the craniofacial morphology of a side, frontal or lateral. The inherent limitation of cephalometry is its two-dimensionality: the facial entirety cannot be perceived as a whole, however, and mental reconstruction must be rendered. Besides, a two-dimensional feature on a cephalometric view can be misleading. For example, with inadvertent orientation adjustment of the cephalometric view, one may find varied pro-nasal points, which should be unique and define the front-most point of the lateral view of a face.
H
Cleft lip and palate is the most common inborn craniofa-cial defect. It happens in about every 500 to 600 newly born babies in Asia. Le Fort I is a major operation procedure to rectify such abnormality. It is important in clinical practices
* To whom correspondence may address.
to accurately predict the changes of soft tissue for both the physician and the patient. A three-dimensional modeling system can help. In this work, we further the studies in the relativity of soft-and-hard tissues, with emphasis in maxilla and mandible areas of the face. We incorporate the feature-based soft-tissue reconstruction into the developed three-di-mensional modeling system.
M. S. Su et al . employed two orthogonal two-dimensional images to reconstruct the three-dimensional facial model [2]-[3]. The promising approach produces merely desirable results due to its limited three-dimensional information from two orthogonal views. In related studies of three-dimensional calibration, O. Burgert et al . employed the distraction and symmetry method to transform an asymmetric face to a symmetric face [4]. The proposed distraction process included: (1) pulling and dragging the mandible progressively; (2) removing (or filling missing) tissues and bones. The proposed symmetry process is to determine the mid-face plane and perform mirroring. Although the symmetry process can be used to estimate the degree of the defects, it is not realistic to assume that all people’s face conforms to symmetry [5].
In this paper, we propose a spatial transformation-calibration and modeling (STCM) method, which the user can adjust the feature points of the face and perform planning of the craniofacial surgery. The developed system can automatically determine estimated results of the Le Fort I osteotomy by using the soft-to-hard tissue correspondence derived from the statistical data proposed in Ref. [5]-[6]. Approximate profiles of the craniofacial rectification are then computed accordingly.
The remainder of the paper is structured as below. In Section II , we shall deliberate the proposed STCM, as well as the soft-to-hard tissue correlation. The experimental protocol and preliminary results of our study is presented in Section III . Section IV gives the concluding remarks of this paper.
II.METHOD
In the following, Section II - II states the 3D craniofacial model and the corresponding pre-processing: hard and soft tissue segmentation; Section II - II explains proposed
435
Three-Dimensional Model Reconstruction for Cleft Lip and Palate Surgery
Chun-Fu WangDept. of Computer Sci & Information Engineering
Chang Gung University259 Wen-Hwa 1st Road, Kwei-Shan Tao-Yuan, Taiwan.
Email: [email protected]
Shu-Yen Wan*Dept. of Information Management
Chang Gung UniversityChang Gung Bioinformatics Center
259 Wen-Hwa 1st Road, Kwei-Shan Tao-Yuan,Taiwan.
Email: [email protected]
436 PROCEEDINGS OF THE IMCSIT. VOLUME 4, 2009
STCM, Section II - II describes the proposed soft-to-hard tissue reconstruction.
A semi-automatic manipulation process of the 3D cranio-facial model is as shown in Fig. 1 . 3D Craniofacial Model and Segmentation
The input of the three-dimensional craniofacial model is a sequence of two-dimensional image slices captured by using such techniques as computed tomography (or CT) or magnetic resonance imaging (or MRI). Volume rendering is employed to construct the 3D model and visualize the head as a whole [7]-[9]. The segmentation of the hard tissues (e.g., skull and bones) from the soft tissues (e.g., skin) is described as follows. We denote the image as I , f x as the intensity (or gray level) of a point at location x, where the point can be defined in 1-, 2-, or 3-dimensions. T f x is the spatial segmentation results of point x.
A traditional threshold-based segmentation method can be represented as below:
T f x ={1, if τmin
≤ f x ≤τmax
0, otherwise (1)
[ τ min , τmax ] defines the desired range of the region(s) of interest (or ROIs), which is a collection of points with T f x =1 .
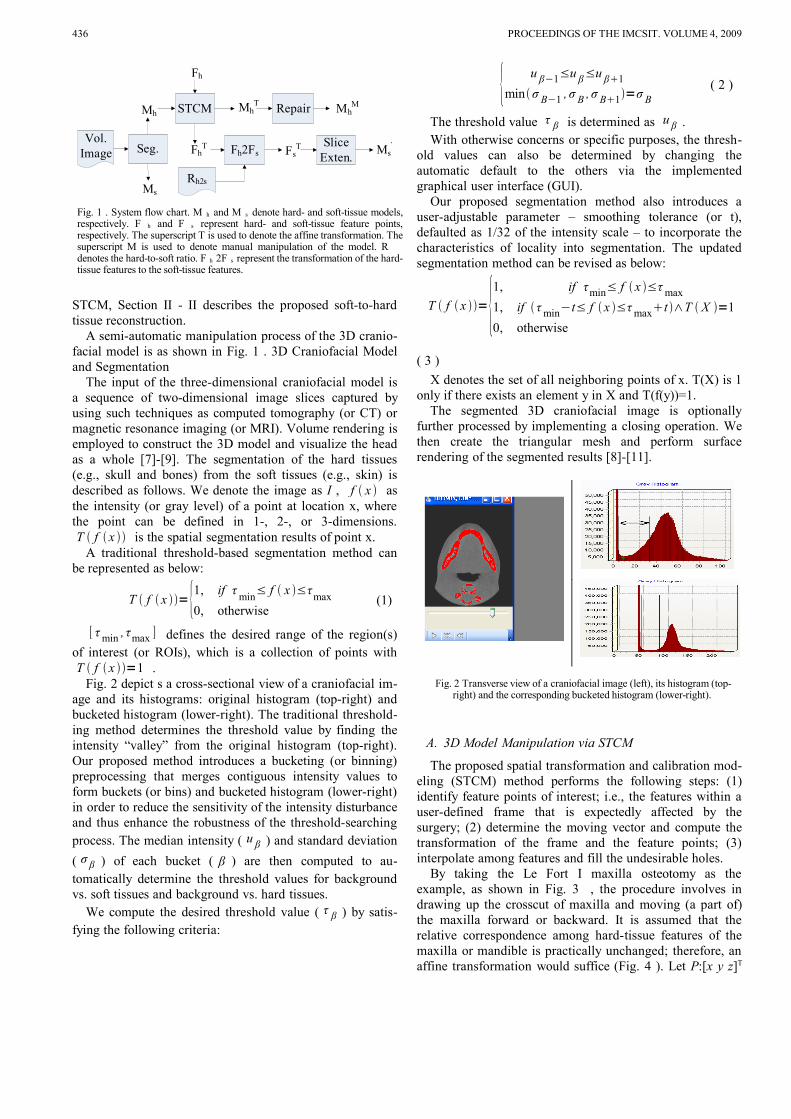
Fig. 2 depict s a cross-sectional view of a craniofacial im-age and its histograms: original histogram (top-right) and bucketed histogram (lower-right). The traditional threshold-ing method determines the threshold value by finding the intensity “valley” from the original histogram (top-right). Our proposed method introduces a bucketing (or binning) preprocessing that merges contiguous intensity values to form buckets (or bins) and bucketed histogram (lower-right) in order to reduce the sensitivity of the intensity disturbance and thus enhance the robustness of the threshold-searching process. The median intensity ( u β ) and standard deviation
( σ β ) of each bucket ( β ) are then computed to au-tomatically determine the threshold values for background vs. soft tissues and background vs. hard tissues.
We compute the desired threshold value ( τ β ) by satis-fying the following criteria:
{ u β−1≤u β≤u β1
minσ B−1 , σ B , σ B1=σ B ( 2 )
The threshold value τ β is determined as u β . With otherwise concerns or specific purposes, the thresh-
old values can also be determined by changing the automatic default to the others via the implemented graphical user interface (GUI).
Our proposed segmentation method also introduces a user-adjustable parameter – smoothing tolerance (or t), defaulted as 1/32 of the intensity scale – to incorporate the characteristics of locality into segmentation. The updated segmentation method can be revised as below:
T f x ={1, if τmin≤ f x ≤τ max
1, if τ min−t≤ f x ≤τ maxt ∧T X =1
0, otherwise
( 3 )
X denotes the set of all neighboring points of x. T(X) is 1 only if there exists an element y in X and T(f(y))=1.
The segmented 3D craniofacial image is optionally further processed by implementing a closing operation. We then create the triangular mesh and perform surface rendering of the segmented results [8]-[11].
Fig. 2 Transverse view of a craniofacial image (left), its histogram (top-right) and the corresponding bucketed histogram (lower-right).
A. 3D Model Manipulation via STCM
The proposed spatial transformation and calibration mod-eling (STCM) method performs the following steps: (1) identify feature points of interest; i.e., the features within a user-defined frame that is expectedly affected by the surgery; (2) determine the moving vector and compute the transformation of the frame and the feature points; (3) interpolate among features and fill the undesirable holes.
By taking the Le Fort I maxilla osteotomy as the example, as shown in Fig. 3 , the procedure involves in drawing up the crosscut of maxilla and moving (a part of) the maxilla forward or backward. It is assumed that the relative correspondence among hard-tissue features of the maxilla or mandible is practically unchanged; therefore, an affine transformation would suffice (Fig. 4 ). Let P:[x y z]T
Vol. Image Seg.
Mh
Ms
MhT Mh
MSTCM Repair
FsT
Fh
FhT Slice
Exten.Ms
TFh2Fs
Rh2s
Fig. 1 . System flow chart. M h and M s denote hard- and soft-tissue models, respectively. F h and F s represent hard- and soft-tissue feature points, respectively. The superscript T is used to denote the affine transformation. The superscript M is used to denote manual manipulation of the model. R denotes the hard-to-soft ratio. F h 2F s represent the transformation of the hard-tissue features to the soft-tissue features.

CHUN-FU WANG ET. AL.: THREE-DIMENSIONAL MODEL RECONSTRUCTION FOR CLEFT LIP AND PALATE SURGERY 437
denotes the original location of a feature, P’:[x’ y’ z’]T the transformed location of the feature. Assume the movement of the hard tissue involves a translation vector [p q r]T and rotations about the x-, y-, z-axes with θ, φ, ω degrees, respectively. The relation between of the original P and the transformed P’ can be described as a combination of homogeneous affine transformations:
P '=[x 'y 'z '1]=R
xR
yRT
z[
xyz1]=R
x R
yRT
zP (
4 )
R x represents the rotation matrix about x-axis; R y repre-sents the rotation matrix about y-axis; RT z represents the rotation matrix about z -axis with the additional translation transformation.
Rx=[
1 0 0 00 cosθ −sin θ 00 sin θ cosθ 00 0 0 1
] ( 5 )
Ry=[
cos φ 0 sin φ 00 1 0 0
−sin φ 0 cos φ 00 0 0 1
] ( 6 )
RTz=[
cos ω −sin ω 0 psin ω cos ω 0 q
0 0 1 r0 0 0 1
] ( 7 )
Fig. 3 Le Fort I maxilla Osteotomy.
Fig. 4 . Transformations of an individual feature point vs. feature points contained in a user-defined frame. The correlations among fea-
ture points are assumed unchanged.
The feature points contained in the user-defined frame preserve spatial correlations after surgery. Hence, taking a set of feature points into consideration, eq. ( 4 ) can be fur-ther revised as:
F '=Rx R y RT z F ( 8 )
F’ denotes the transformation of F , which is a homoge-neous matrix of feature points, in which each column repre-sents a feature point.
After the STCM process, the transformed frame may leave gaps that do not exist in the originally attached structures. We perform interpolation, frame extension and overlay with the original structures and thus achieve gap removal. In our implemented system, the gap removal process can also be done by manually manipulating the interactive drawing and erasing tools.
TABLE 1. Soft to hard tissue ratios
M. Ewing et al
(1993)
A . Waheidi et al
(1998)
M axilla(horizontal)
ProN:UIT 0.36:1 0.33:1SubN:UIT 0.33:1SLS:UIT 0.52:1SubN:A 0.63:1LS:UIT 0.66:1 0.57:1
BUL:UIT 0.61:1M axilla( Vertical )
ProN:UIT vertical nomeaning
0.12:1
SubN:UIT 0.10:1SLS:UIT 0.19:1LS:UIT 0.44:1
BUL:UIT 0.48:1M andible
Pg(s):Pg(horizontal)
1.1:1 (forward)1:1(backward)2.1:1 (vertical)

438 PROCEEDINGS OF THE IMCSIT. VOLUME 4, 2009
Fig. 5 Soft and hard tissue feature points .
B. Soft Tissue Reconstruction
To address the soft-to-hard tissue change with respect to the surgery, we adopt the reference data proposed by M. Ewing et al [5] and A. Waheidi et al [6]. The maxilla data were extracted from the work of A. Waheidi et al, and the mandible data were extracted from the work of M. Ewing et al .; the compiled results are as shown in Table 1. The acronyms and feature points mentioned in the table can be referred to in Fig. 5 .
After the STCM process, we compute the displacement of hard tissue in horizontal and vertical direction. The corre-sponding feature points of soft tissue after the transformation can, thus, be represented as below:
FsT= F
hT−F
h×R
h2sF
s ( 9 )
R h2s is ratio of hard to soft tissue. After obtain predictive feature points of soft tissue, made the other facial surface do equivalent transformation on same cross section (x-y plane) of feature points, and use interpolation do advance transfor-mation gradually between cross sections of feature points. Therefore we get predictive approximately facial profile, doctor can estimates the accuracy of soft to hard tissue ra-tios, patients and family members can see generally appear-ance after surgical operation.
III. RESULTS
The threshold value of soft tissue is considered as the lowest-possible gray value that is greater than the gray value corresponding to the peak, i.e., background, of the histogram as shown, for example, in Fig. 2 . Here we obtain τs_min =8, and the constructed three-dimensional model is shown as Fig. 6 , where Fig. 6 (a) depicts the contour view of the head and Fig. 6 (b) illustrates its mesh view.
With the tolerance We compare results with tolerance and not, then use hard tissue as example, like Fig. 7 and Fig. 8 . Comparing τh_min = 85 and th_min = 0 in Fig. 7 , τ h_min
= 93 and th_min = 27 in Fig. 8 , we can find out the results in Fig. 8 has fewer noises and it can constructs more complete model in three-dimension. Therefore we can get better result in conscientious threshold value and relax tolerance value.
STCM can represents in Fig. 9 , frames a subspace of hard tissue in three-dimension, does maxilla forward and mandible backward like Fig. 9 (a), we can keep locus of transformation and repair with draw pen and eraser like Fig. 9 (b), make three-dimensional model more completely.
Fig. 6 . Reconstruction of the soft-tissues. (a)Contour view. (b)Mesh view.
Fig. 7 Hard tissue reconstruction for only threshold value. (a)Frontal view (b) Lateral view
Fig. 8 Hard tissue reconstruction for both threshold and tolerance value. (a)Frontal view (b) Lateral view
When maxilla goes forward calibration, hard tissue move more than soft tissue from soft to hard ratios ( Table 1 ), hence the lips become thinner after operation, like Fig. 10 (a), thick curve represents before operation, thin curve represents after operation. M. Ewing proposed maxilla goes forward calibration need greater than 4 mm at least, otherwise soft tissue not match changes of ratios. But we consider that maxilla transformation must have upper condition, or else hard tissue will beyond the soft tissue when hard tissue goes forward so much. Fig. 10 (b) is use as lines represents Fig. 10 (a), so we can express the upper condition of transformation as below:
DhD sT l ( 10 )
D is transformation distances, index s and h is soft and hard tissue. T l is thickness of lip, T l T is thickness of lip after transformation. Then D s = F s T - F s and D h = F h T - F h
through equation (9), the upper condition of hard tissue transformation can express as below:

CHUN-FU WANG ET. AL.: THREE-DIMENSIONAL MODEL RECONSTRUCTION FOR CLEFT LIP AND PALATE SURGERY 439
Dh
T l
1−Rh2s ( 11 )
From equation (10), if we know original thickness of lip before operation, we can do upper restriction of hard tissue transformation.
Fig. 9 Space transformation calibration method. (a)Translate marked space. (b) Keep locus and repair model with draw pen and eraser.
Fig. 10 : Soft and hard tissue estimate between calibration before and af-ter. (a) Curve view (b) Line view
Fig. 11 Feature point before surgical and after surgical. (a)Hard tissue changes and feature points. (b)Soft tissue feature points.
From STCM, we obtain translation distances of horizontal and vertical direction, and get corresponding feature points position of soft tissue through soft to hard tissue ratios (Table 1), finally show in three-dimensional model, like Fig. 11 . Green feature points is before calibration, purple feature points is after STCM。
But feature points expression is not easy to see changes after surgical operation, so made the other points on same cross section do same transformation, and use interpolation method let cross sections between feature points do vertical and horizontal approximately transformation, then we can acquire rough profile of face after surgical ( Fig. 12 ). Doc-tor can evaluates the accuracy of soft to hard tissue ratios,
and that patients and family members can observe changes after surgical operation.
Fig. 12 Soft tissue prediction. (a)Frontal view. (b)Lateral view.
IV. CONCLUSION
In three-dimensional model reconstruction, this study uses threshold value with tolerance segmentation method, due to threshold-based have high performance, and join to tolerance can construct more completely model in three-di-mension.
In three-dimensional model calibration, we use STCM adjust maxilla or mandible. Although this method can match osteotomies, but still have a lot of improvements. We can use an intersection points of mesh do pull and drag op-erations to modify model in three-dimension in the future, or another adjust methods. If we combine with hardware operations, use sensor simulates surgical operation, and show correspond results in the monitor, it feels more sense of reality.
In surgical prediction, the data of soft to hard tissue ra-tios still not completely, doctors will collect more data of soft to hard tissue ratios at different part in the future, then predictive model of soft tissue will more conform the situa-tion after operation, and it can not only establish statistical data, but also do prediction before operation.
ACKNOWLEDGMENTS
This work was partially supported by National Science Council (NSC), Taiwan, R.O.C. grants NSC–96–2221–E- 182-042 and NSC-97-2221-E-182-037-MY3. Thanks are also to Dr. Wen-Chin Ko, and Dr. B. H of the Craniofacial Center of the Chang Gung Memorial Hospital for providing craniofacial images and professional assistance.
REFERENCES
[1] John G. Clement and Murray K. Marks, “Computer-Graphic Facial Reconstruction,” Elsevier Academic Press, Burlington, 2005.
[2] L.G. Farkas, “Anthropometry of the Head and Face in Medicine,” El-sevier, 1981.
[3] M. S. Su, C. Y. Chen and K. Y. Cheng, “The Reconstruction of 3D Head Model from Two Orthogonal-View 2D Face Images.” National Computer Symposium 2001, Taiwan, D320-D329, 2001.
[4] O. Burgert, T. Salb, T. Gockel, R. Dillmann, S. Hassfeld, J. Brief, R. Krempien, S. Walz and J. Mühling, “A System for Facial Reconstruction using Distraction and Symmetry Consideration,” International Congress Series, Computer Assisted Radiology and Surgery, vol. 1230, pp. 62-67, June 2001
[5] M. Ewing and R. B. Ross, “Soft Tissue Response to Orthognathic Surgery in Persons,” The Cleft palate-craniofacial journal, 1991.
[6] A. Waheidi and Harradine, “Soft Tissue Profile Changes in Patients with Cleft Lip and Palate Following Maxillary Osteotomies,” Cleft Palate-Craniofacial Journal, vol. 35 No. 6, November 1998.

440 PROCEEDINGS OF THE IMCSIT. VOLUME 4, 2009
[7] R. C. Gonzalez and R. E. Woods, “Digital Image Processing,” Reading, MA: Prentice-Hall , 2002.
[8] W. Schroeder, K. Martin and B. Lorensen, “The Visualization Toolkit: An Object-Oriented Approach To 3-D Graphics,” Prentice-Hall, Englewood Cliffs, NJ , 1996.
[9] W. Schroeder, “The VTK User’s Guide,” Kitware, Inc . May, 2001. [10] C. Y. Liao, “Facial Modeling and Animation based on Muscle and
Skull”, Master thesis, Computer Science and Information Engineering Dept., Univ. of Tsing-Hua, Hisn-Chu, Taiwan, 2002.
[11] Y. C. Yu and John y. Chiang, “Human Facial Animation Based on Real Image Sequence,” Master thesis, Computer Science and Information
Engineering Dept., Univ. of Sun Yat-sen, Kaohsiung, Taiwan, May, 2002.
[12] S. Avidan and A. Shamir, “Seam Carving for Content-Aware Image Resizing,” ACM Transactions on Graphics, vol. 26, no. 3, Siggraph, 2007.
[13] Y. T. Chen and C. S. Chen, “Fast Human Detection Using a Novel Boosted Cascading Structure With Meta Stages,” IEEE Transactions on image processing, vol. 17, no. 8, August, 2008.
[14] Q. Zhang and I. Couloigner, “Accurate Centerline Detection and Line Width Estimation of Thick Lines Using the Radon Transform,” IEEE Transactions on image processing, vol. 16, no. 2, February 2007.
Related Documents