[Classification: Protected] 02 August 2022 THREAT PREVENTION R81.10 Best Practices

Welcome message from author
This document is posted to help you gain knowledge. Please leave a comment to let me know what you think about it! Share it to your friends and learn new things together.
Transcript
[Classification:Protected]
02 August 2022
THREAT PREVENTION
R81.10
Best Practices
Check Point Copyright Notice© 2021 Check Point Software Technologies Ltd.
All rights reserved. This product and related documentation are protected by copyright and distributed underlicensing restricting their use, copying, distribution, and decompilation. No part of this product or relateddocumentation may be reproduced in any form or by any means without prior written authorization of CheckPoint. While every precaution has been taken in the preparation of this book, Check Point assumes noresponsibility for errors or omissions. This publication and features described herein are subject to changewithout notice.
RESTRICTED RIGHTS LEGEND:
Use, duplication, or disclosure by the government is subject to restrictions as set forth in subparagraph (c)(1)(ii) of the Rights in Technical Data and Computer Software clause at DFARS 252.227-7013 and FAR52.227-19.
TRADEMARKS:
Refer to the Copyright page for a list of our trademarks.
Refer to the Third Party copyright notices for a list of relevant copyrights and third-party licenses.
Important Information
Threat Prevention R81.10 Best Practices | 3
Important Information
Latest SoftwareWe recommend that you install the most recent software release to stay up-to-date with thelatest functional improvements, stability fixes, security enhancements and protection againstnew and evolving attacks.
CertificationsFor third party independent certification of Check Point products, see the Check PointCertifications page.
Check Point R81.10For more about this release, see the R81.10 home page.
Latest Version of this Document in EnglishOpen the latest version of this document in a Web browser.Download the latest version of this document in PDF format.
FeedbackCheck Point is engaged in a continuous effort to improve its documentation.Please help us by sending your comments.
Important Information
Threat Prevention R81.10 Best Practices | 4
Revision History
Date Description
14 June 2022 In the HTML version, added glossary terms in the text
06 July 2021 First release of this document
Table of Contents
Threat Prevention R81.10 Best Practices | 5
Table of ContentsThreat Prevention Best Practices 8
Cyber Attack View - Gateway 9
Main Screen - SmartConsole 9
Main Screen - SmartView 10
Default Query 11
Default widgets 12
Editing the View and Widgets 12
Working with Widgets 15
Infected Hosts 16
Description 16
Drill-Down View 16
Available Widgets 17
Widget Query 18
Best Practices 18
Timeline of Infected Hosts 19
Description 19
Widget Query 19
Attacks Allowed By Policy 20
Users that Received Malicious Emails (Attacks Allowed By Policy) 21
Description 21
Drill-Down View 21
Available Widgets 21
Widget Query 22
Best Practices 23
Hosts that Downloaded Malicious Files (Attacks Allowed By Policy) 23
Description 23
Drill-Down View 23
Available Widgets 25
Widget Query 25
Best Practices 25
Directly Targeted Hosts (Attacks Allowed By Policy) 26
Description 26
Drill-Down View 26
Table of Contents
Threat Prevention R81.10 Best Practices | 6
Available Widgets 27
Widget Query 27
Best Practices 29
Host Scanned by Attackers (Attacks Allowed By Policy) 30
Description 30
Drill-Down View 31
Available Widgets 31
Widget Query 32
Best Practices 32
Hosts that Accessed Malicious Sites (Attacks Allowed By Policy) 32
Description 32
Drill-Down View 33
Available Widgets 33
Widget Query 34
Best Practices 34
Attacks Prevented By Policy 34
Users that Received Malicious Emails (Prevented Attacks) 35
Description 35
Drill-Down View 36
Available Widgets 37
Widget Query 38
Best Practices 38
Hosts that Downloaded Malicious Files (Prevented Attacks) 38
Description 38
Drill-Down View 39
Available Widgets 39
Widget Query 40
Best Practices 40
Directly Targeted Hosts (Prevented Attacks) 40
Description 40
Drill-Down View 41
Available Widgets 42
Widget Query 42
Best Practices 43
Host Scanned by Attackers (Prevented Attacks) 43
Table of Contents
Threat Prevention R81.10 Best Practices | 7
Description 43
Drill-Down View 44
Available Widgets 44
Widget Query 45
Best Practices 45
Hosts that Accessed Malicious Sites (Prevented Attacks) 45
Description 45
Drill-Down View 46
Available Widgets 46
Widget Query 47
Best Practices 47
SandBlast Threat Emulation 47
Description 47
Drill-Down View 48
Available Widgets 48
Widget Query 49
Cyber Attack Timeline 49
Description 49
Widget Query 50
MITRE ATT&CK 51
Configuring Threat Emulation Logs with MITRE ATT&CK Data 51
MITRE Logs 52
MITRE ATT&CK in SmartView 53
MITRE ATT&CK Best Practices 54
Log Fields 56
Appendix 68
Threat Prevention Best Practices
Threat Prevention R81.10 Best Practices | 8
Threat Prevention Best PracticesThis chapter explains the best way to investigate Threat Prevention attacks in your organization.
In a threat investigation, you need to be able to identify significant events generated by your ThreatPrevention environment and understand their meaning.
Cyber Attack View - Gateway
Threat Prevention R81.10 Best Practices | 9
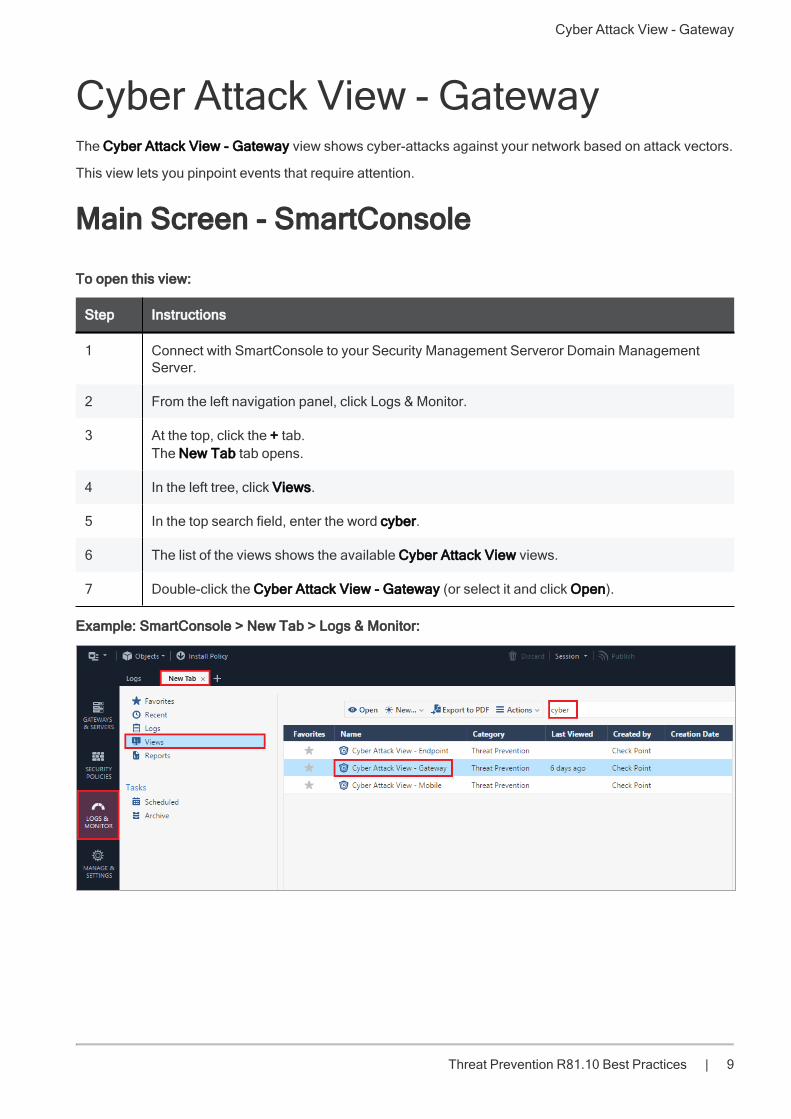
Cyber Attack View - GatewayThe Cyber Attack View - Gateway view shows cyber-attacks against your network based on attack vectors.
This view lets you pinpoint events that require attention.
Main Screen - SmartConsole
To open this view:
Step Instructions
1 Connect with SmartConsole to your Security Management Serveror Domain ManagementServer.
2 From the left navigation panel, click Logs & Monitor.
3 At the top, click the + tab.The New Tab tab opens.
4 In the left tree, click Views.
5 In the top search field, enter the word cyber.
6 The list of the views shows the available Cyber Attack View views.
7 Double-click the Cyber Attack View - Gateway (or select it and click Open).
Example: SmartConsole > New Tab > Logs & Monitor:
Cyber Attack View - Gateway
Threat Prevention R81.10 Best Practices | 10
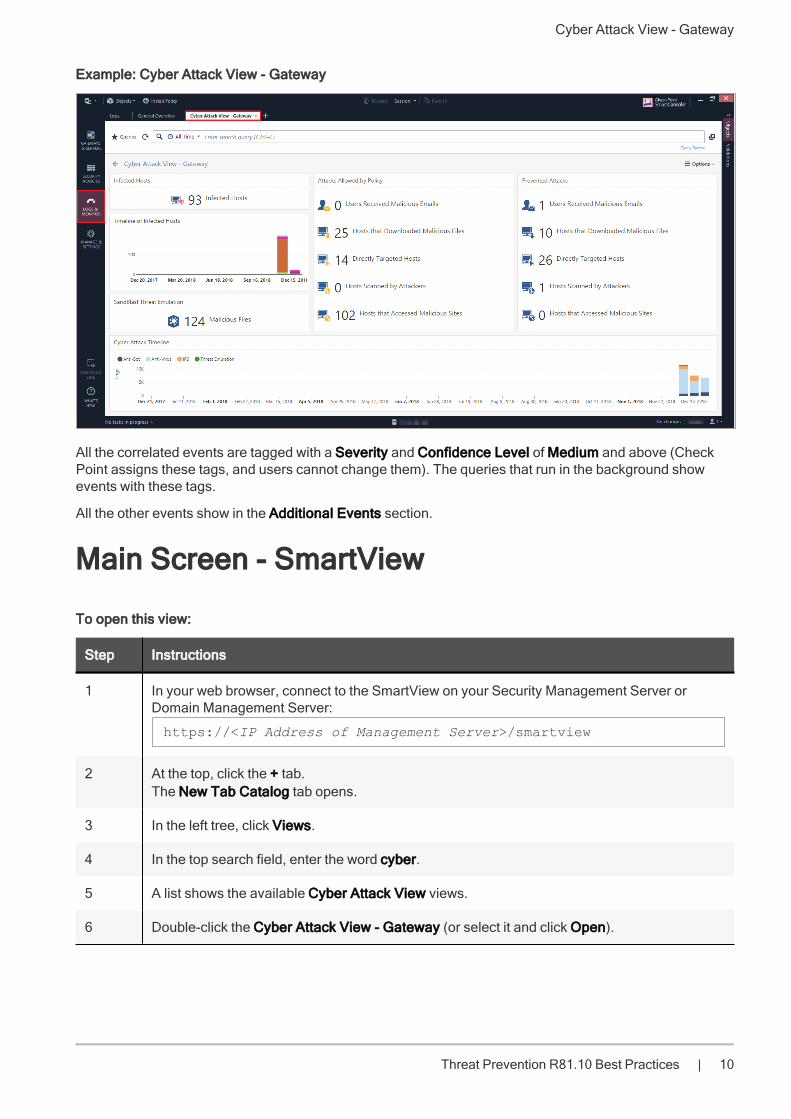
Example: Cyber Attack View - Gateway
All the correlated events are tagged with a Severity and Confidence Level of Medium and above (CheckPoint assigns these tags, and users cannot change them). The queries that run in the background showevents with these tags.
All the other events show in the Additional Events section.
Main Screen - SmartView
To open this view:
Step Instructions
1 In your web browser, connect to the SmartView on your Security Management Server orDomain Management Server:
https://<IP Address of Management Server>/smartview
2 At the top, click the + tab.The New Tab Catalog tab opens.
3 In the left tree, click Views.
4 In the top search field, enter the word cyber.
5 A list shows the available Cyber Attack View views.
6 Double-click the Cyber Attack View - Gateway (or select it and click Open).
Cyber Attack View - Gateway
Threat Prevention R81.10 Best Practices | 11
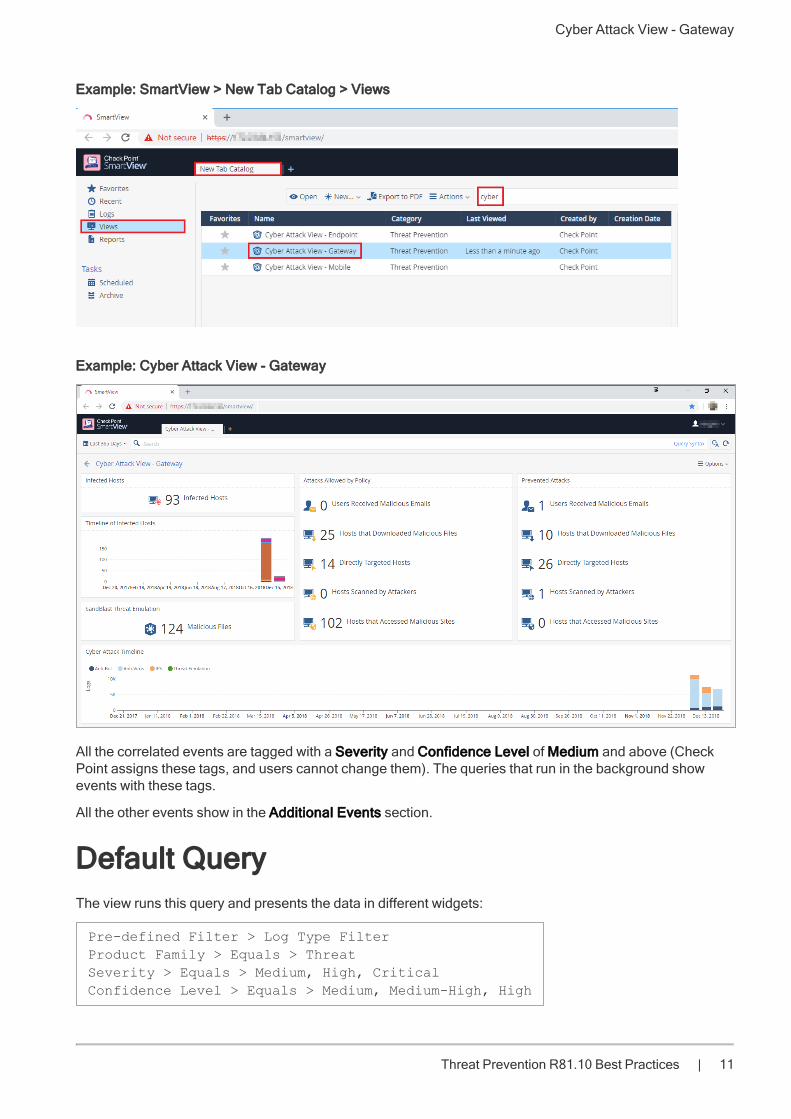
Example: SmartView > New Tab Catalog > Views
Example: Cyber Attack View - Gateway
All the correlated events are tagged with a Severity and Confidence Level of Medium and above (CheckPoint assigns these tags, and users cannot change them). The queries that run in the background showevents with these tags.
All the other events show in the Additional Events section.
Default QueryThe view runs this query and presents the data in different widgets:
Pre-defined Filter > Log Type FilterProduct Family > Equals > ThreatSeverity > Equals > Medium, High, CriticalConfidence Level > Equals > Medium, Medium-High, High
Cyber Attack View - Gateway
Threat Prevention R81.10 Best Practices | 12
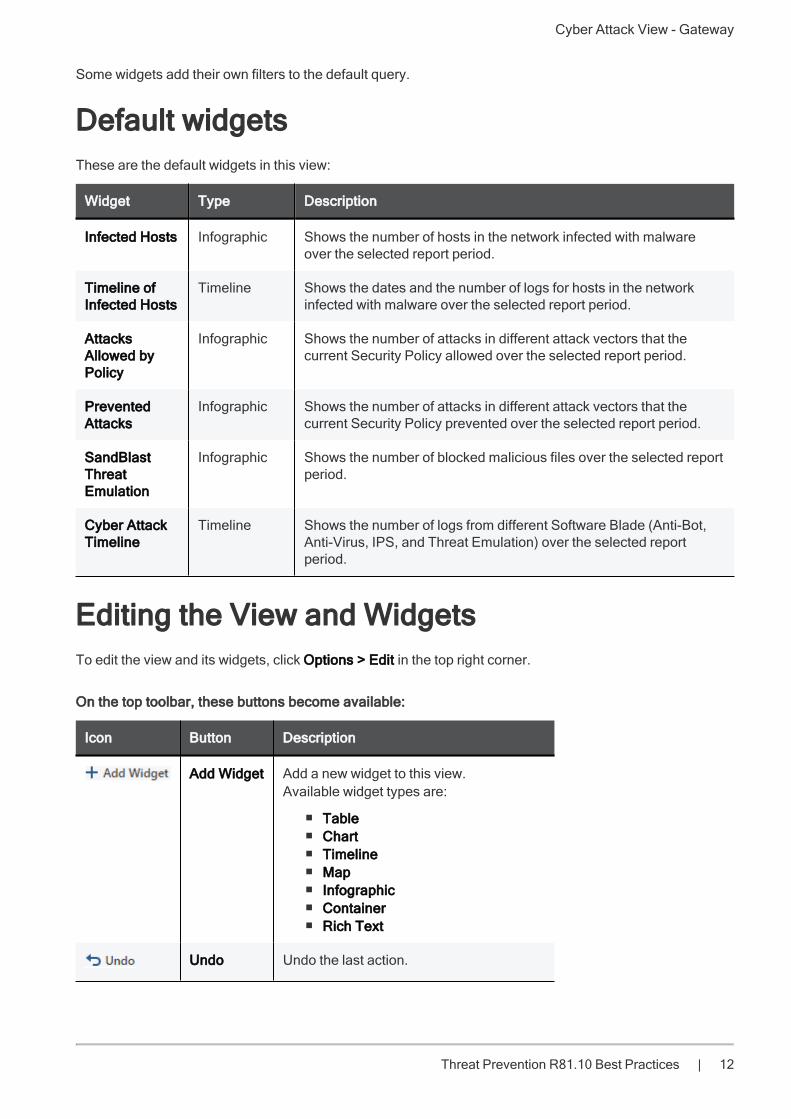
Some widgets add their own filters to the default query.
Default widgetsThese are the default widgets in this view:
Widget Type Description
Infected Hosts Infographic Shows the number of hosts in the network infected with malwareover the selected report period.
Timeline ofInfected Hosts
Timeline Shows the dates and the number of logs for hosts in the networkinfected with malware over the selected report period.
AttacksAllowed byPolicy
Infographic Shows the number of attacks in different attack vectors that thecurrent Security Policy allowed over the selected report period.
PreventedAttacks
Infographic Shows the number of attacks in different attack vectors that thecurrent Security Policy prevented over the selected report period.
SandBlastThreatEmulation
Infographic Shows the number of blocked malicious files over the selected reportperiod.
Cyber AttackTimeline
Timeline Shows the number of logs from different Software Blade (Anti-Bot,Anti-Virus, IPS, and Threat Emulation) over the selected reportperiod.
Editing the View and WidgetsTo edit the view and its widgets, click Options > Edit in the top right corner.
On the top toolbar, these buttons become available:
Icon Button Description
Add Widget Add a new widget to this view.Available widget types are:
n Tablen Chartn Timelinen Mapn Infographicn Containern Rich Text
Undo Undo the last action.
Cyber Attack View - Gateway
Threat Prevention R81.10 Best Practices | 13
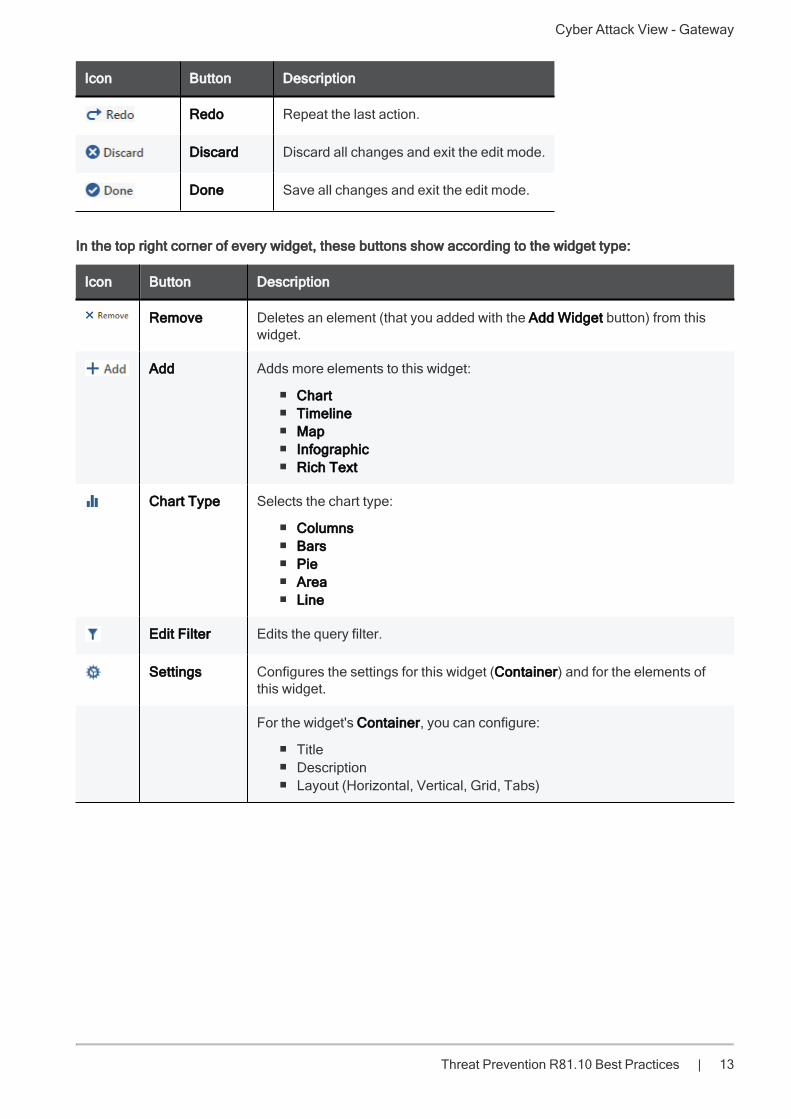
Icon Button Description
Redo Repeat the last action.
Discard Discard all changes and exit the edit mode.
Done Save all changes and exit the edit mode.
In the top right corner of every widget, these buttons show according to the widget type:
Icon Button Description
Remove Deletes an element (that you added with the Add Widget button) from thiswidget.
Add Adds more elements to this widget:
n Chartn Timelinen Mapn Infographicn Rich Text
Chart Type Selects the chart type:
n Columnsn Barsn Pien Arean Line
Edit Filter Edits the query filter.
Settings Configures the settings for this widget (Container) and for the elements ofthis widget.
For the widget's Container, you can configure:
n Titlen Descriptionn Layout (Horizontal, Vertical, Grid, Tabs)
Cyber Attack View - Gateway
Threat Prevention R81.10 Best Practices | 14
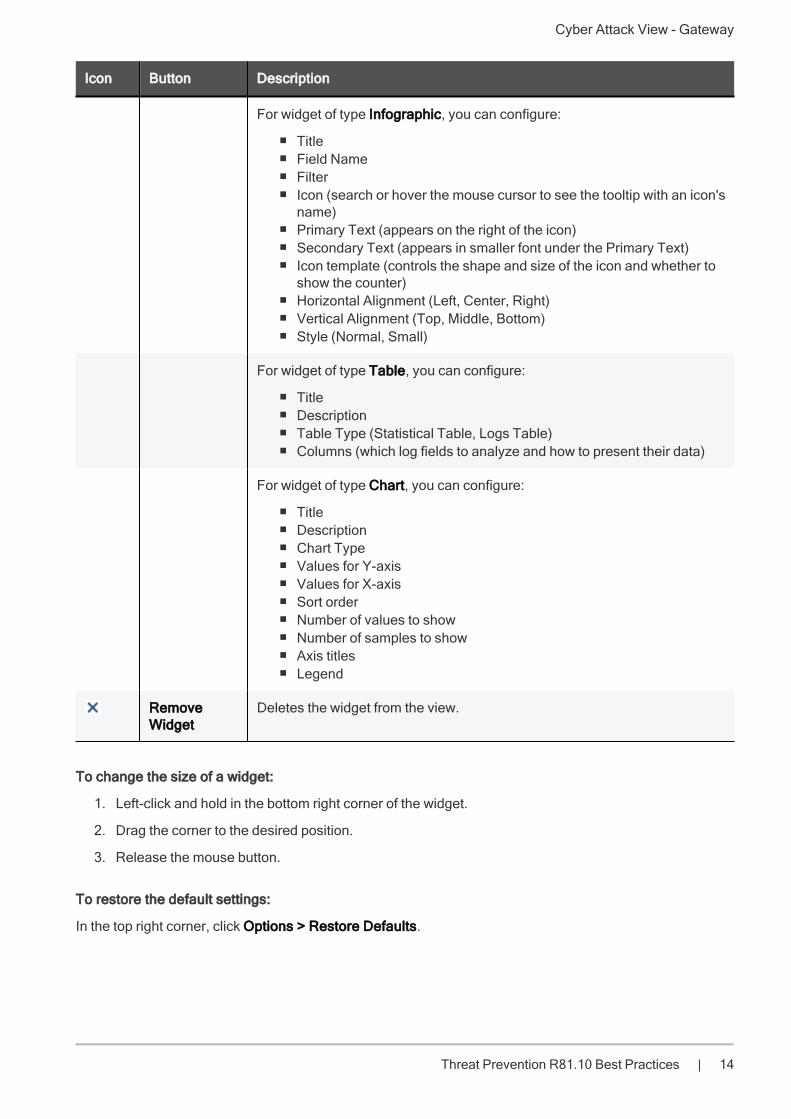
Icon Button Description
For widget of type Infographic, you can configure:
n Titlen Field Namen Filtern Icon (search or hover the mouse cursor to see the tooltip with an icon's
name)n Primary Text (appears on the right of the icon)n Secondary Text (appears in smaller font under the Primary Text)n Icon template (controls the shape and size of the icon and whether to
show the counter)n Horizontal Alignment (Left, Center, Right)n Vertical Alignment (Top, Middle, Bottom)n Style (Normal, Small)
For widget of type Table, you can configure:
n Titlen Descriptionn Table Type (Statistical Table, Logs Table)n Columns (which log fields to analyze and how to present their data)
For widget of type Chart, you can configure:
n Titlen Descriptionn Chart Typen Values for Y-axisn Values for X-axisn Sort ordern Number of values to shown Number of samples to shown Axis titlesn Legend
RemoveWidget
Deletes the widget from the view.
To change the size of a widget:
1. Left-click and hold in the bottom right corner of the widget.
2. Drag the corner to the desired position.
3. Release the mouse button.
To restore the default settings:
In the top right corner, click Options > Restore Defaults.
Cyber Attack View - Gateway
Threat Prevention R81.10 Best Practices | 15
Working with Widgets
Working with widgets of type Infographic
n Double-click anywhere on the headline or the icon.
n Right-click anywhere on the headline or the matching icon and click Drill Down.
Working with widgets of type Table:
n Click once on the column header to sort in ascending or descending order.
n Hover the mouse cursor over a value to see a full-text tooltip.
n To open the next drill-down level, you can:
l Double-click on a row inside the table.
l Right-click on a row inside the table and click Drill Down.
n To filter the applicable logs only for a specific value, right-click on the value inside the table and clickFilter: "<VALUE>".
n To filter a specific value out of the applicable logs, right-click on the value inside the table and clickFilter Out: "<VALUE>".
Working with widgets of type Chart:
n Hover the mouse cursor over the chart area to see a full-text tooltip.
n To open the next drill-down level, you can:
l Double-click on a chart bar inside the graph.
l Right-click on a chart bar inside the graph and click Drill Down.
n To filter the applicable logs only for a specific value, right-click on the value inside the table and clickFilter: "<VALUE>".
n To filter a specific value out of the applicable logs, right-click on the value inside the table and clickFilter Out: "<VALUE>".
Working with widgets of type Timeline:
n Hover the mouse cursor over the chart area to see a full-text tooltip.
n To open the next drill-down level, you can:
l Double-click on a chart bar inside the graph.
l Right-click on a chart bar inside the graph and click Drill Down.
n In the legend, you can:
l Double-click on a specific category to show only its data on the graph
l Single-click on a specific category to remove its data from the graph
l Single-click on the same specific category to show its data again on the graph
Cyber Attack View - Gateway
Threat Prevention R81.10 Best Practices | 16
If you disabled two or more specific categories in the legend, then to enable all categories again:
l Single-click on each disabled category until the legend shows all categories as enabled
l Double-click a specific category to show only its data on the graph and then single-click on thesame specific category
Working with widgets of type Map:
n Hover the mouse cursor over the circled country to see a full-text tooltip.
n To open the next drill-down level, you can:
l Double-click on a circled country inside the map.
l Right-click on a circled country inside the map and click Drill Down.
n To filter the applicable logs only for a specific value, right-click on the circled country and click Filter:"<VALUE>".
n To filter a specific value out of the applicable logs, right-click on the circled country and click FilterOut: "<VALUE>".
Infected Hosts
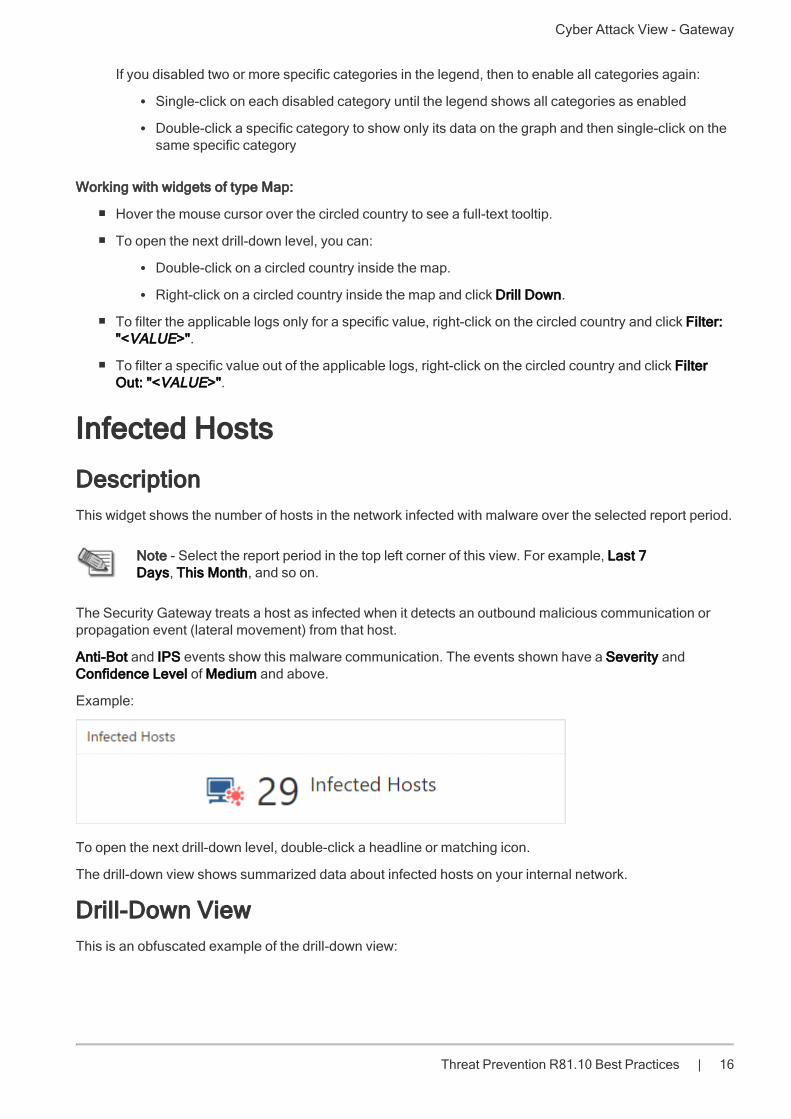
DescriptionThis widget shows the number of hosts in the network infected with malware over the selected report period.
Note - Select the report period in the top left corner of this view. For example, Last 7Days, This Month, and so on.
The Security Gateway treats a host as infected when it detects an outbound malicious communication orpropagation event (lateral movement) from that host.
Anti-Bot and IPS events show this malware communication. The events shown have a Severity andConfidence Level of Medium and above.
Example:
To open the next drill-down level, double-click a headline or matching icon.
The drill-down view shows summarized data about infected hosts on your internal network.
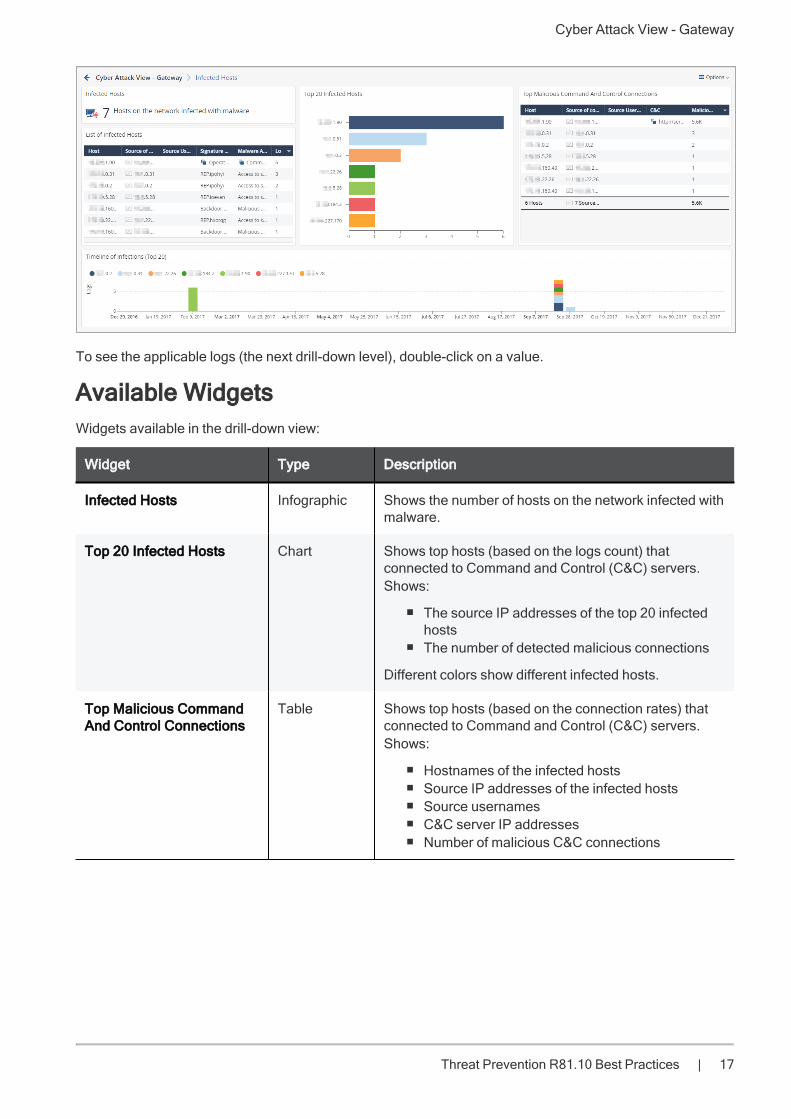
Drill-Down ViewThis is an obfuscated example of the drill-down view:
Cyber Attack View - Gateway
Threat Prevention R81.10 Best Practices | 17
To see the applicable logs (the next drill-down level), double-click on a value.
Available WidgetsWidgets available in the drill-down view:
Widget Type Description
Infected Hosts Infographic Shows the number of hosts on the network infected withmalware.
Top 20 Infected Hosts Chart Shows top hosts (based on the logs count) thatconnected to Command and Control (C&C) servers.Shows:
n The source IP addresses of the top 20 infectedhosts
n The number of detected malicious connections
Different colors show different infected hosts.
Top Malicious CommandAnd Control Connections
Table Shows top hosts (based on the connection rates) thatconnected to Command and Control (C&C) servers.Shows:
n Hostnames of the infected hostsn Source IP addresses of the infected hostsn Source usernamesn C&C server IP addressesn Number of malicious C&C connections
Cyber Attack View - Gateway
Threat Prevention R81.10 Best Practices | 18
Widget Type Description
List of Infected Hosts Table Shows the list of infected hosts.Shows:
n Hostnames of the infected hostsn Source IP addresses of the infected hostsn Source usernamesn Signature names of the detected malware (based
on Check Point ThreatWiki and Check PointResearch)
n Malware actionn Number of logs
Timeline of Infections (Top20)
Timeline Shows the timeline of malicious connections toCommand and Control (C&C) servers across allinfected hosts.Shows:
n Source IP addresses of the top 20 infected hostsn Number of logs for the top 20 infected hostsn Dates and times
Different colors show different infected hosts.
Widget QueryIn addition to the "Default Query" on page 11, the widget runs this query:
(blade:Anti-Bot AND severity:(Medium OR High OR Critical) AND confidence_level:(Medium OR Medium-High OR High) NOT "Mail analysis") OR (blade:IPSAND "Malware Traffic")
Best Practices1. To see which internal hosts initiate the most malicious connections with Command and Control (C&C)
servers:
n Examine the Top Malicious Command And Control Connections.
n Examine the Threat Prevention logs from the Security Gateway about the internal hosts thatinitiate the most malicious connections with C&C servers. To do so, double-click the host entry.In the Threat Prevention logs, examine the Suppressed Logs column (see "Log Fields" onpage 56).
2. For every infected host, query for its IP address to see all threat events related to that host.
This lets you better understand the malicious behavior of the infected host.
To query an IP address for all related threat events:
a. Right-click an IP address.
b. In the context menu, click Filter: "<IP Address>"
c. At the top, click Cyber Attack View - Gateway.
Cyber Attack View - Gateway
Threat Prevention R81.10 Best Practices | 19
3. If you configured the Anti-Bot Software Blade based on Check Point recommendations, the SecurityGateway generates both Detect and Prevent logs.
The Anti-Bot Detect logs do not mean that the Security Gateway allowed malicious connections.
The Anti-Bot can generate the Detect logs, if you enabled the DNS trap feature.
For more information, see:
n sk74060: Anti-Virus Malware DNS Trap feature
n sk74120: Why Anti-Bot and Anti-Virus connections may be allowed even in Prevent mode
Timeline of Infected Hosts
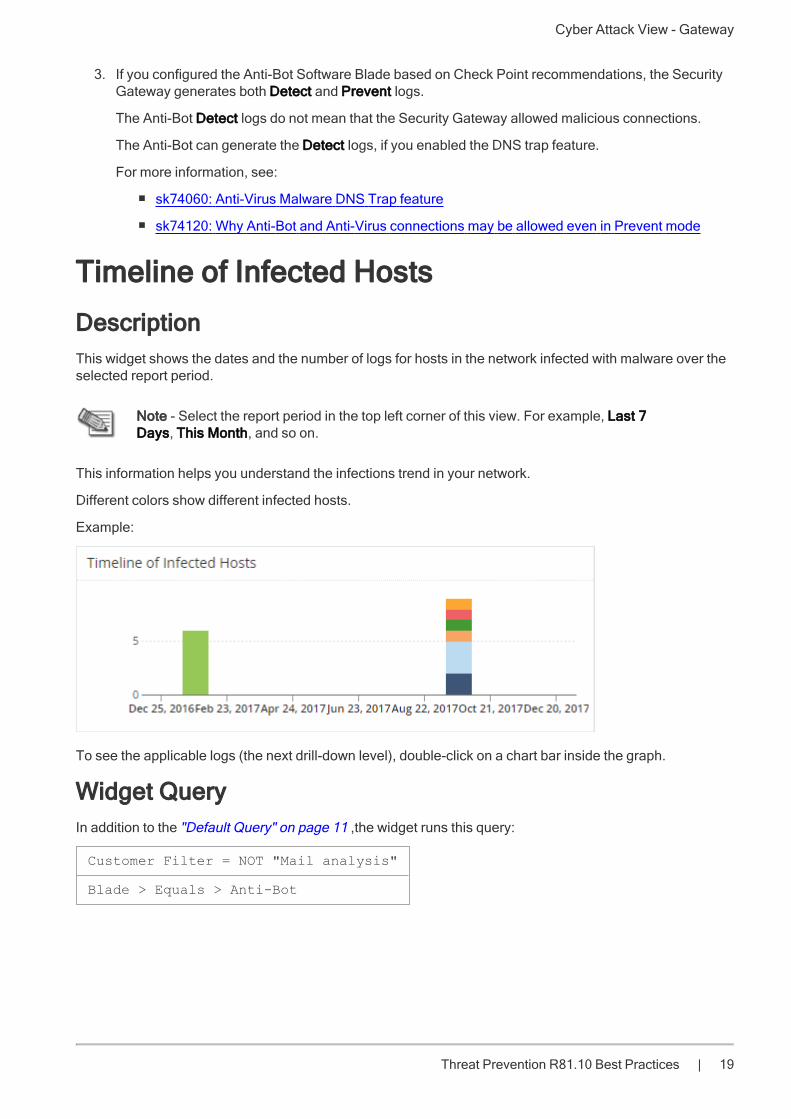
DescriptionThis widget shows the dates and the number of logs for hosts in the network infected with malware over theselected report period.
Note - Select the report period in the top left corner of this view. For example, Last 7Days, This Month, and so on.
This information helps you understand the infections trend in your network.
Different colors show different infected hosts.
Example:
To see the applicable logs (the next drill-down level), double-click on a chart bar inside the graph.
Widget QueryIn addition to the "Default Query" on page 11 ,the widget runs this query:
Customer Filter = NOT "Mail analysis"
Blade > Equals > Anti-Bot

Cyber Attack View - Gateway
Threat Prevention R81.10 Best Practices | 20
Attacks Allowed By PolicyThis widget shows the number of attacks using different attack vectors that the current Security Policyallowed (because it was not configured to prevent them) over the selected report period.
Note - Select the report period in the top left corner of this view. For example, Last 7Days, This Month, and so on.
Understand the different vectors and types of attacks to improve your network protection.
Example:
To open the next drill-down level, double-click a headline or matching icon. See the sections below.
Widget Query:
In addition to the "Default Query" on page 11, the widget runs this query:
Action > Equals > Bypass,Detect
Action > Equals > Bypass,Detect
Cyber Attack View - Gateway
Threat Prevention R81.10 Best Practices | 21
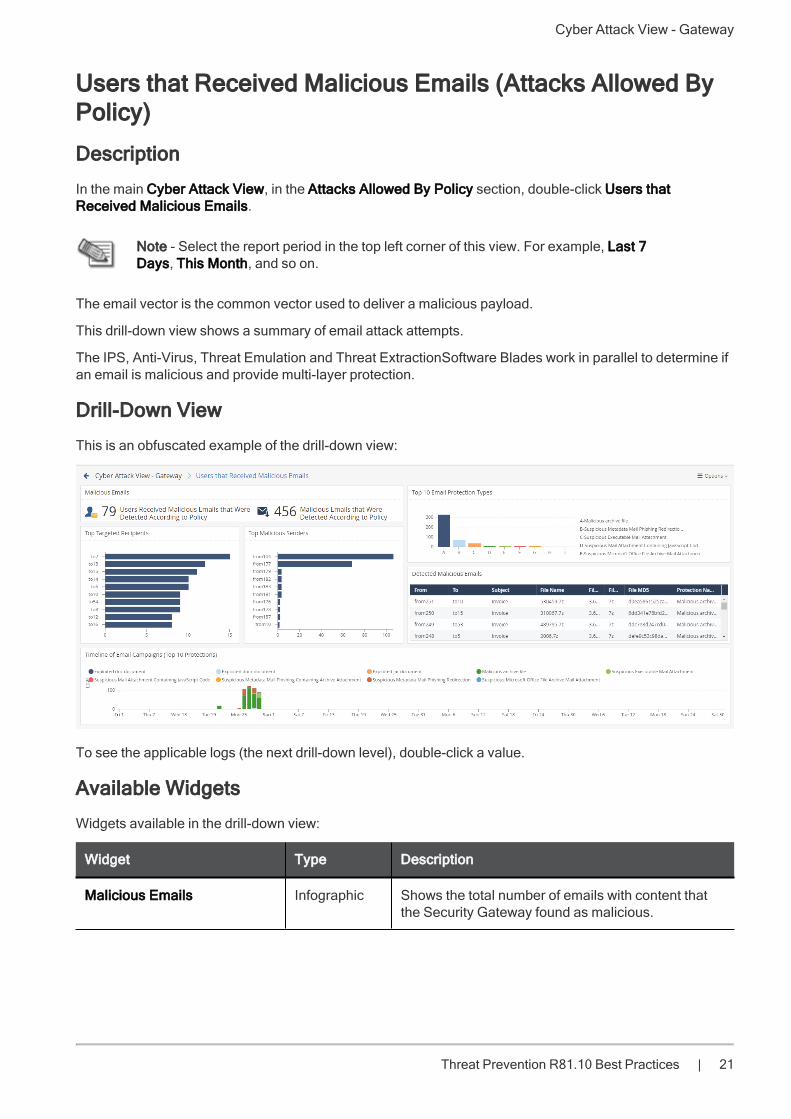
Users that Received Malicious Emails (Attacks Allowed ByPolicy)
Description
In the main Cyber Attack View, in the Attacks Allowed By Policy section, double-click Users thatReceived Malicious Emails.
Note - Select the report period in the top left corner of this view. For example, Last 7Days, This Month, and so on.
The email vector is the common vector used to deliver a malicious payload.
This drill-down view shows a summary of email attack attempts.
The IPS, Anti-Virus, Threat Emulation and Threat ExtractionSoftware Blades work in parallel to determine ifan email is malicious and provide multi-layer protection.
Drill-Down View
This is an obfuscated example of the drill-down view:
To see the applicable logs (the next drill-down level), double-click a value.
Available Widgets
Widgets available in the drill-down view:
Widget Type Description
Malicious Emails Infographic Shows the total number of emails with content thatthe Security Gateway found as malicious.
Cyber Attack View - Gateway
Threat Prevention R81.10 Best Practices | 22
Widget Type Description
Top 10 Email ProtectionTypes
Chart Shows top Check Point protections that foundmalicious emails.Shows:
n The names of the top protections on (from allthe Software Blades) that found maliciousemails.
n The number of malicious emails the topprotections found.
Different colors show different protection types.
Top Targeted Recipients Chart Shows the recipients of malicious emails sorted bythe number of emails they received.Shows:
n Users, who received the largest number ofmalicious emails.
n The number of malicious emails they received.
Different colors show different recipients.
Top Malicious Senders Chart Shows the senders of malicious emails sorted by thenumber of emails they sent.Shows:
n Users, who sent the largest number ofmalicious emails.
n The number of malicious emails they sent.
Different colors show different senders.
Detected Malicious Emails Table Shows malicious emails.Shows this information about the detected maliciousemails:
n Fromn Ton Subjectn File Namen File Sizen File MD5n Protection Name
Timeline of Email Campaigns(Top 10 Protections)
Timeline Shows the number of detected malicious emails andtheir timeline.The timeline is divided into different protection types.Different colors show different campaigns.
Widget Query
In addition to the "Default Query" on page 11, the widget runs this query:
Calculated Service > Equals > SMTP
Cyber Attack View - Gateway
Threat Prevention R81.10 Best Practices | 23
Custom Filter = ((blade:ips AND ("Adobe Reader Violation" OR "ContentProtection Violation" OR "Mail Content Protection Violation" OR "SMTPProtection Violation" OR "Phishing Enforcement Protection" OR "Adobe FlashProtection Violation")) OR (blade:"Threat Emulation") OR (blade:Anti-Virus) OR (blade:"Threat Extraction" AND content_risk ("Medium" OR "High" OR"Critical"))) AND service:("pop3" OR "smtp" OR "imap")
Best Practices
Best practices against malicious emails:
n Examine the Detected Malicious Emails to see the number of emails with malicious content that thecurrent Security Policydetected, but did not prevent.
n Examine the Top 10 Email Protection Types to see the top attack types.
Pay attention to protections configured to work in Detect mode instead of Prevent mode. Fine-tuneyour email policy accordingly.
n In the Threat Prevention logs from the Security Gateway, examine the Description field (see "LogFields" on page 56) to see if the Anti-Virus Software Blade work is in the Background or Hold mode.
To do so, in the Detected Malicious Emails, double-click on one of the counters > open the log >refer to the Description field.
In addition, read sk74120: Why Anti-Bot and Anti-Virus connections may be allowed even in Preventmode.
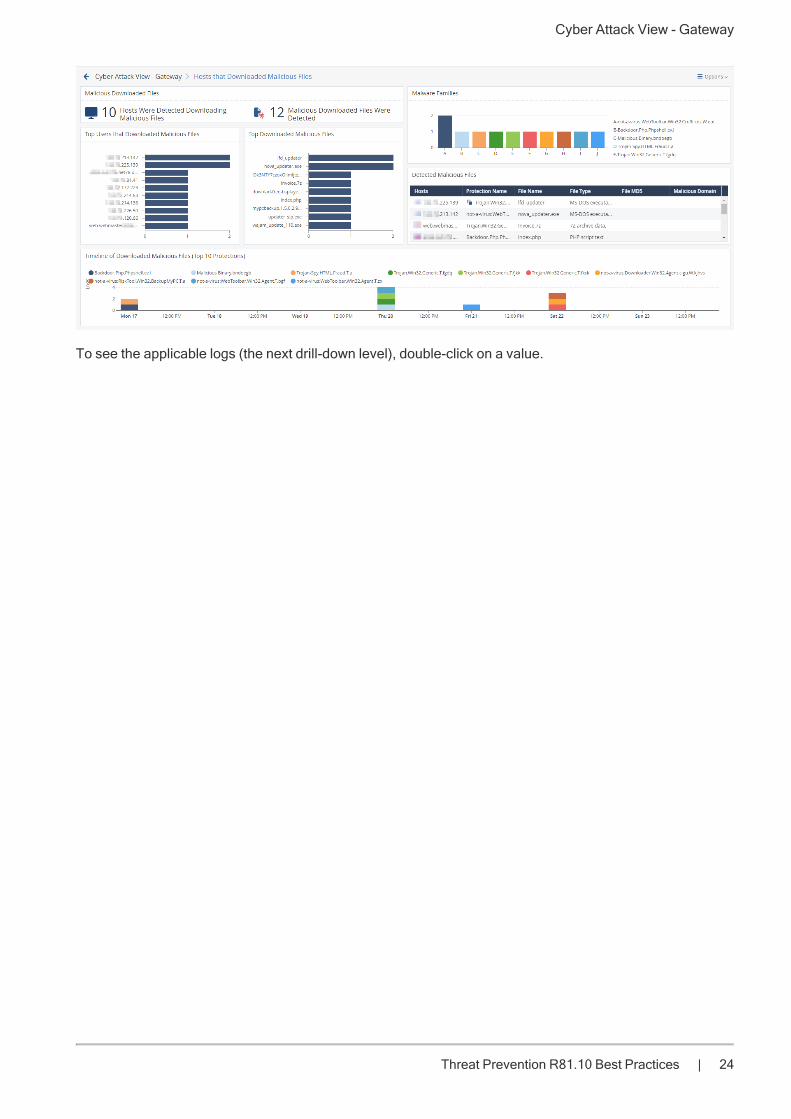
Hosts that Downloaded Malicious Files (Attacks Allowed ByPolicy)
Description
In the main Cyber Attack View, in the Attacks Allowed By Policy section, double-click Hosts thatDownloaded Malicious Files.
Note - Select the report period in the top left corner of this view. For example, Last 7Days, This Month, and so on.
This drill-down view shows a summary of attacks that used malicious files.
This drill-down view shows all the malicious files caught by Check Point Threat Prevention's multi-layerprotections.
Drill-Down View
This is an obfuscated example of the drill-down view:
Cyber Attack View - Gateway
Threat Prevention R81.10 Best Practices | 24
To see the applicable logs (the next drill-down level), double-click on a value.
Cyber Attack View - Gateway
Threat Prevention R81.10 Best Practices | 25
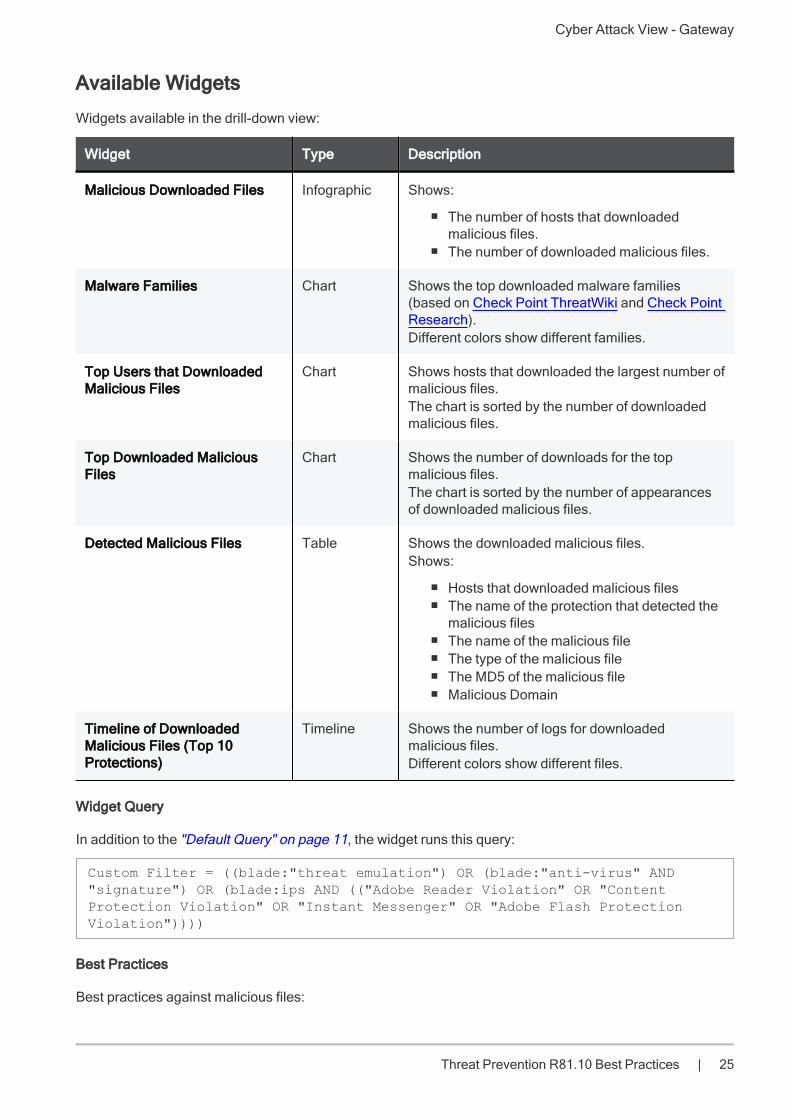
Available Widgets
Widgets available in the drill-down view:
Widget Type Description
Malicious Downloaded Files Infographic Shows:
n The number of hosts that downloadedmalicious files.
n The number of downloaded malicious files.
Malware Families Chart Shows the top downloaded malware families(based on Check Point ThreatWiki and Check PointResearch).Different colors show different families.
Top Users that DownloadedMalicious Files
Chart Shows hosts that downloaded the largest number ofmalicious files.The chart is sorted by the number of downloadedmalicious files.
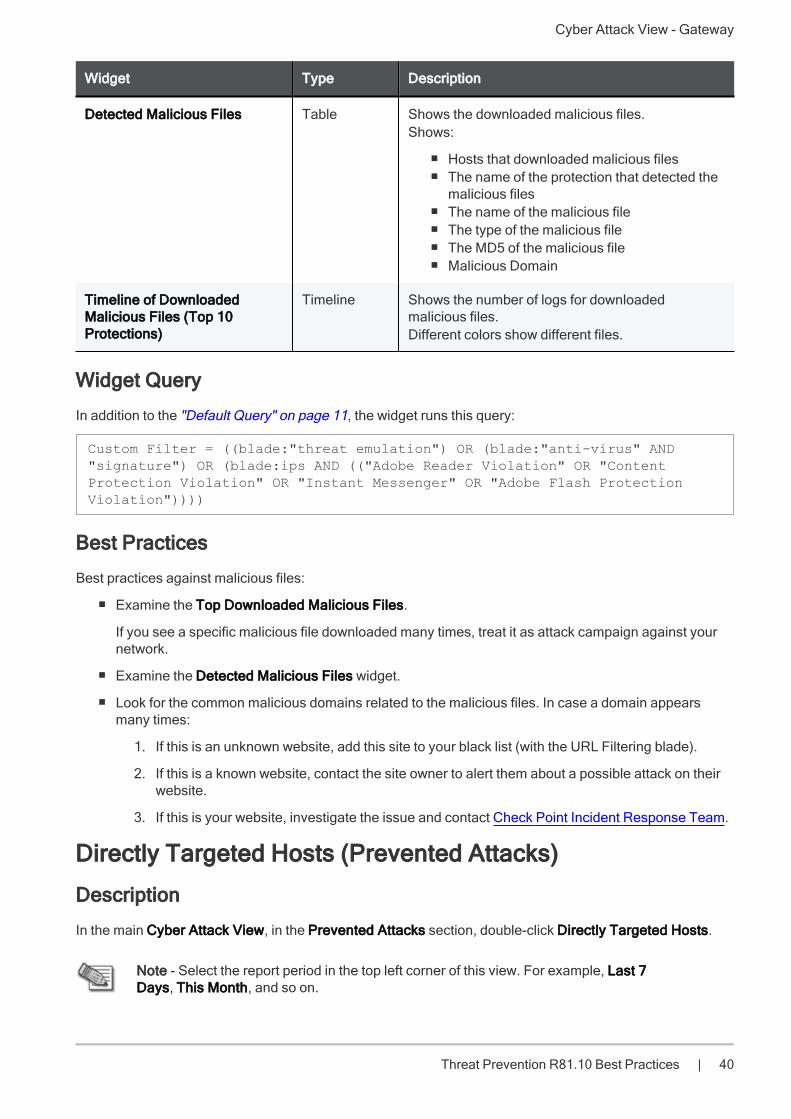
Top Downloaded MaliciousFiles
Chart Shows the number of downloads for the topmalicious files.The chart is sorted by the number of appearancesof downloaded malicious files.
Detected Malicious Files Table Shows the downloaded malicious files.Shows:
n Hosts that downloaded malicious filesn The name of the protection that detected the
malicious filesn The name of the malicious filen The type of the malicious filen The MD5 of the malicious filen Malicious Domain
Timeline of DownloadedMalicious Files (Top 10Protections)
Timeline Shows the number of logs for downloadedmalicious files.Different colors show different files.
Widget Query
In addition to the "Default Query" on page 11, the widget runs this query:
Custom Filter = ((blade:"threat emulation") OR (blade:"anti-virus" AND"signature") OR (blade:ips AND (("Adobe Reader Violation" OR "ContentProtection Violation" OR "Instant Messenger" OR "Adobe Flash ProtectionViolation"))))
Best Practices
Best practices against malicious files:
Cyber Attack View - Gateway
Threat Prevention R81.10 Best Practices | 26
n In the Attacks Allowed By Policy section, click Hosts that Downloaded Malicious Files.
1. In the Malicious Downloaded Files widget, double-click the Hosts Were DetectedDownloading Malicious Files infographic.
2. Locate events from the IPS Software Blade only.
3. Examine the IPS protections currently configured in Detect mode and decide if you can changethem to Prevent mode.
To configure IPS protections in SmartConsole: From the left navigation panel, click SecurityPolicies > click the Threat Prevention section > at the bottom, click IPS Protections > edit theapplicable IPS protection > install the Threat Prevention Policy.
n In the Threat Prevention logs from the Security Gateway, examine the Description field (see "LogFields" on page 56) to see if the Anti-Virus Software Blade work is in the Background or Hold mode.
In addition, read sk74120: Why Anti-Bot and Anti-Virus connections may be allowed even in Preventmode.
Directly Targeted Hosts (Attacks Allowed By Policy)
Description
In the main Cyber Attack View, in the Attacks Allowed By Policy section, double-click Directly TargetedHosts.
Note - Select the report period in the top left corner of this view. For example, Last 7Days, This Month, and so on.
This drill-down view shows a summary of network and hosts exploit attempts.
Host exploit attempts generate the majority of Threat Preventionevents.
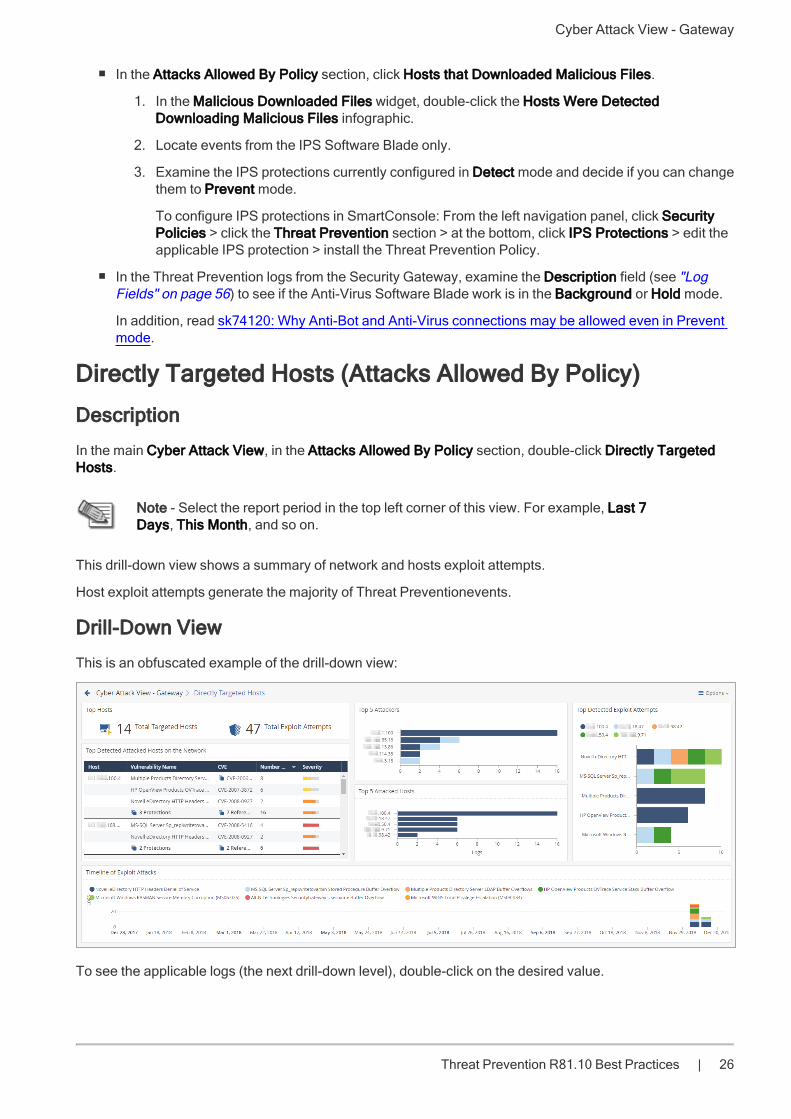
Drill-Down View
This is an obfuscated example of the drill-down view:
To see the applicable logs (the next drill-down level), double-click on the desired value.
Cyber Attack View - Gateway
Threat Prevention R81.10 Best Practices | 27
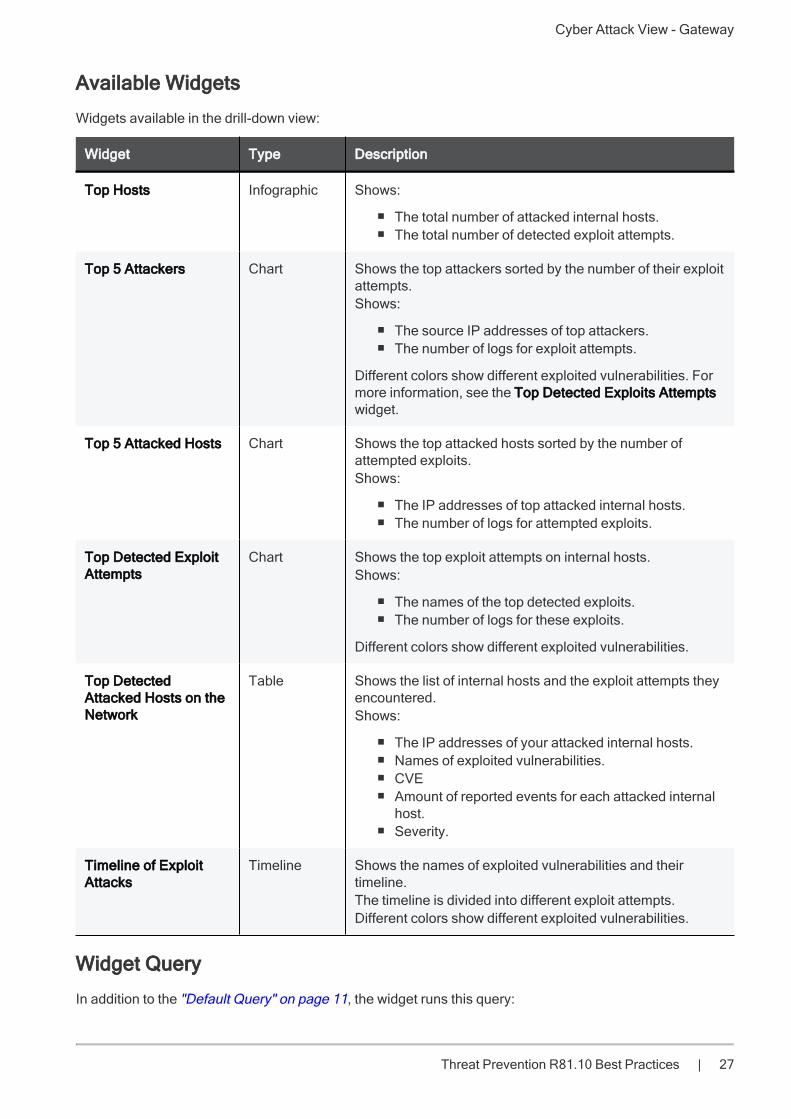
Available Widgets
Widgets available in the drill-down view:
Widget Type Description
Top Hosts Infographic Shows:
n The total number of attacked internal hosts.n The total number of detected exploit attempts.
Top 5 Attackers Chart Shows the top attackers sorted by the number of their exploitattempts.Shows:
n The source IP addresses of top attackers.n The number of logs for exploit attempts.
Different colors show different exploited vulnerabilities. Formore information, see the Top Detected Exploits Attemptswidget.
Top 5 Attacked Hosts Chart Shows the top attacked hosts sorted by the number ofattempted exploits.Shows:
n The IP addresses of top attacked internal hosts.n The number of logs for attempted exploits.
Top Detected ExploitAttempts
Chart Shows the top exploit attempts on internal hosts.Shows:
n The names of the top detected exploits.n The number of logs for these exploits.
Different colors show different exploited vulnerabilities.
Top DetectedAttacked Hosts on theNetwork
Table Shows the list of internal hosts and the exploit attempts theyencountered.Shows:
n The IP addresses of your attacked internal hosts.n Names of exploited vulnerabilities.n CVEn Amount of reported events for each attacked internal
host.n Severity.
Timeline of ExploitAttacks
Timeline Shows the names of exploited vulnerabilities and theirtimeline.The timeline is divided into different exploit attempts.Different colors show different exploited vulnerabilities.
Widget Query
In addition to the "Default Query" on page 11, the widget runs this query:

Cyber Attack View - Gateway
Threat Prevention R81.10 Best Practices | 28
Custom Filter = blade:IPS NOT ("SMTP" OR "Adobe Reader Violation" OR"Content Protection Violation" OR "Mail Content Protection Violation" OR"SMTP Protection Violation" OR "Phishing Enforcement Protection" OR "AdobeFlash Protection Violation" OR "Adobe Reader Violation" OR "ContentProtection Violation" OR "Instant Messenger" OR "Adobe Flash ProtectionViolation" OR "Scanner Enforcement Violation" OR "Port Scan" OR "NovellNMAP Protocol Violation" OR "Adobe Flash Protection Violation" OR "AdobeShockwave Protection Violation" OR "Web Client Enforcement Violation" OR"Exploit Kit")
Cyber Attack View - Gateway
Threat Prevention R81.10 Best Practices | 29
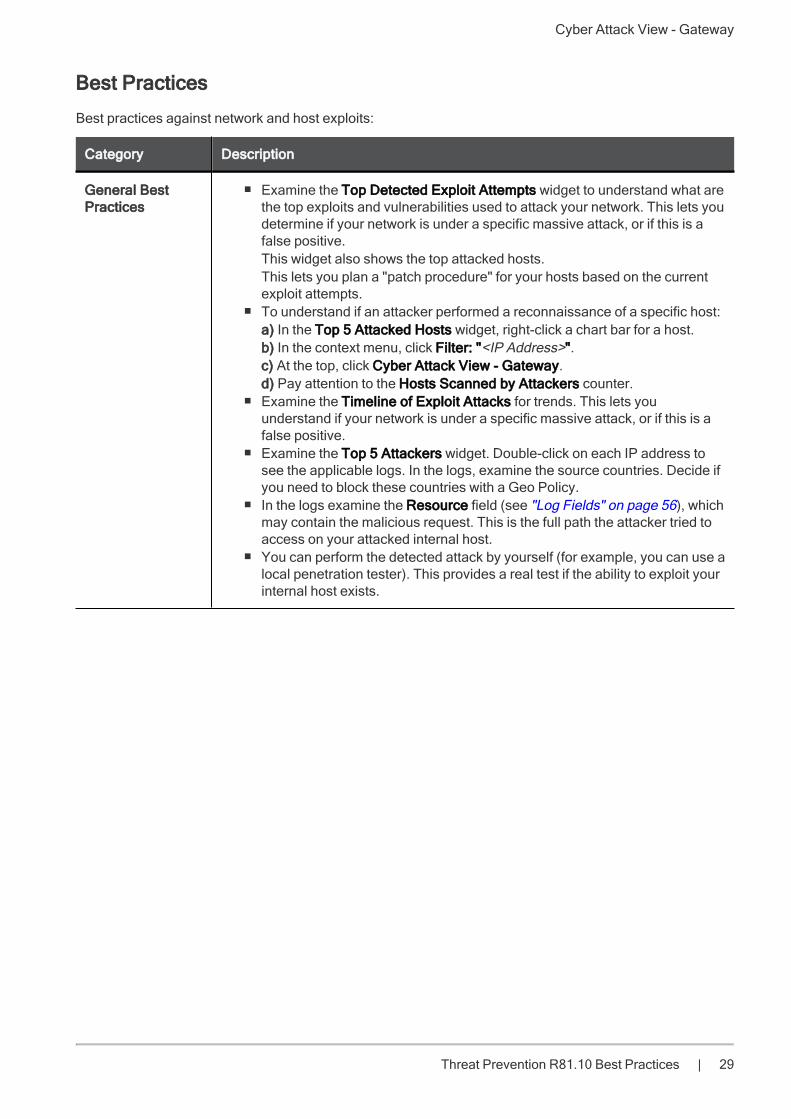
Best Practices
Best practices against network and host exploits:
Category Description
General BestPractices
n Examine the Top Detected Exploit Attempts widget to understand what arethe top exploits and vulnerabilities used to attack your network. This lets youdetermine if your network is under a specific massive attack, or if this is afalse positive.This widget also shows the top attacked hosts.This lets you plan a "patch procedure" for your hosts based on the currentexploit attempts.
n To understand if an attacker performed a reconnaissance of a specific host:a) In the Top 5 Attacked Hosts widget, right-click a chart bar for a host.b) In the context menu, click Filter: "<IP Address>".c) At the top, click Cyber Attack View - Gateway.d) Pay attention to the Hosts Scanned by Attackers counter.
n Examine the Timeline of Exploit Attacks for trends. This lets youunderstand if your network is under a specific massive attack, or if this is afalse positive.
n Examine the Top 5 Attackers widget. Double-click on each IP address tosee the applicable logs. In the logs, examine the source countries. Decide ifyou need to block these countries with a Geo Policy.
n In the logs examine the Resource field (see "Log Fields" on page 56), whichmay contain the malicious request. This is the full path the attacker tried toaccess on your attacked internal host.
n You can perform the detected attack by yourself (for example, you can use alocal penetration tester). This provides a real test if the ability to exploit yourinternal host exists.

Cyber Attack View - Gateway
Threat Prevention R81.10 Best Practices | 30
Category Description
Best Practices forevents that theSecurity Gatewaydetected, but didnot prevent
n Schedule SmartView to send an email with data regarding DirectlyTargeted Hosts attacks in your network.This is one of the most important steps to avoid exploits.This important email will expose incomplete or insecure securityconfigurations.
n Examine the current IPS configuration in SmartConsole and change theapplicable settings to increase the security.
n Examine the Top 5 Attacked Hosts and Top Detected Exploit Attemptswidgets to find vulnerable internal hosts. Examine if there is a correlationbetween the software type and software version of the attacked internalhosts and the exploit attempt. Connect to the attacked internal hosts anddetermine if the exploit was successful.
n For the attacked internal hosts, examine:l Time of the detected events.l Time the attacked internal hosts sent their traffic.l Amount of traffic the attacked internal hosts sent.l Geo location of the destination IP addresses, to which the attackedinternal hosts sent their traffic.
l Protocol and port the attacked internal hosts used to send their traffic.l Reputation of the destination IP addresses and domains, to which theattacked internal hosts sent their traffic. If you enable the Anti-BotSoftware Blade on the Security Gateway, the logs can showconnections with Command and Control (C&C) servers from yournetwork.
Host Scanned by Attackers (Attacks Allowed By Policy)Description
In the main Cyber Attack View, in the Attacks Allowed By Policy section, click Host Scanned byAttackers.
This drill-down view shows the scanned hosts on your internal network.
Network scanners are common. Expect to see many events related to this stage of an attack.
Cyber Attack View - Gateway
Threat Prevention R81.10 Best Practices | 31
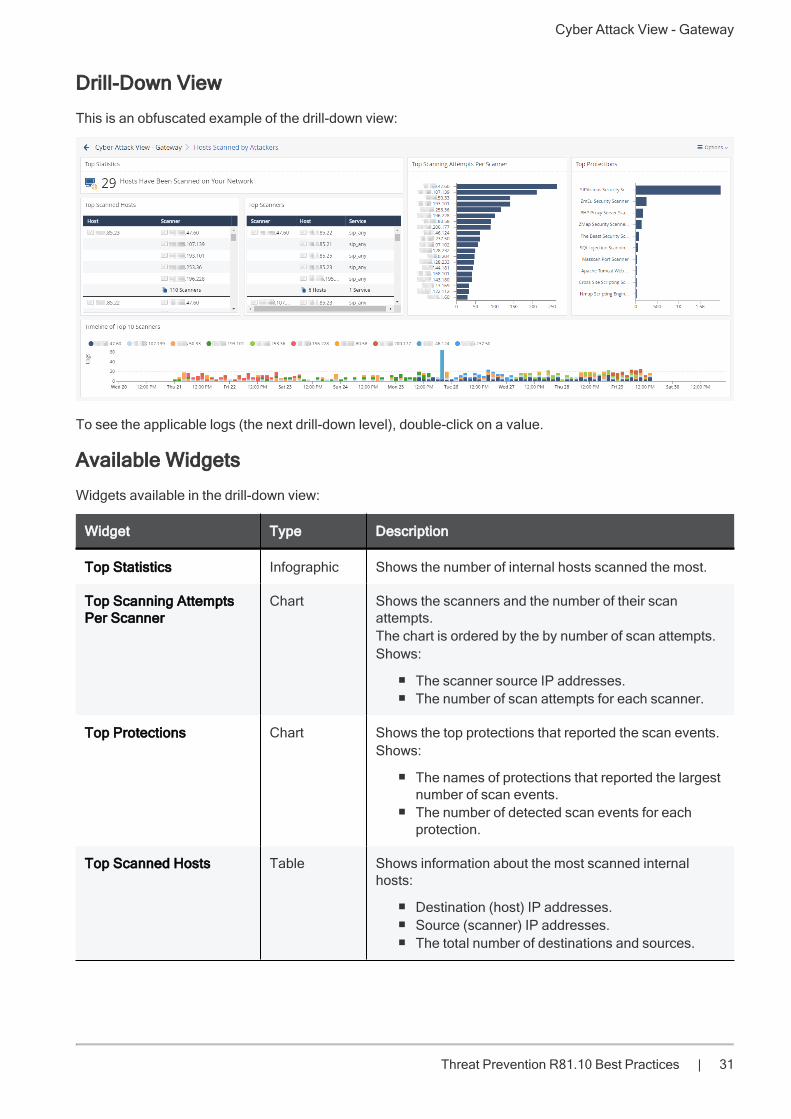
Drill-Down View
This is an obfuscated example of the drill-down view:
To see the applicable logs (the next drill-down level), double-click on a value.
Available Widgets
Widgets available in the drill-down view:
Widget Type Description
Top Statistics Infographic Shows the number of internal hosts scanned the most.
Top Scanning AttemptsPer Scanner
Chart Shows the scanners and the number of their scanattempts.The chart is ordered by the by number of scan attempts.Shows:
n The scanner source IP addresses.n The number of scan attempts for each scanner.
Top Protections Chart Shows the top protections that reported the scan events.Shows:
n The names of protections that reported the largestnumber of scan events.
n The number of detected scan events for eachprotection.
Top Scanned Hosts Table Shows information about the most scanned internalhosts:
n Destination (host) IP addresses.n Source (scanner) IP addresses.n The total number of destinations and sources.
Cyber Attack View - Gateway
Threat Prevention R81.10 Best Practices | 32
Widget Type Description
Top Scanners Table Shows information about the scanners:
n Source (scanner) IP address.n Destination (host) IP addresses and total number
of scanned destinations.n Check Point services, to which these scan
attempts matched (Protocols and Ports).
Timeline of Top 10Scanners
Timeline Shows the number of scanned hosts for each detectedscanner and their timeline.Different colors show different scanners.
Widget Query
In addition to the "Default Query" on page 11, the widget runs this query:
Custom Filter = "Scanner Enforcement Violation" OR "Port Scan" OR "NovellNMAP Protocol Violation"
Best Practices
Best practices against network reconnaissance attempts:
1. Find the hosts that are able to connect to external networks through the Security Gateway.
Configure the applicable Access Control rules for hosts that you do not want to connect to externalnetworks.
2. If you use your own vulnerability scanner, you have two options:
n Add an exception to your policy, so that the Security Gateway does not enforce protectionsagainst this scanner.
n If you still want the Security Gateway to report events generated by your scanner, then run anexplicit query that excludes your scanner and shows only the external scanners.
3. Use logs generated by scanning events to determine if new hosts on the network are connecting tothe outside world.
Hosts that Accessed Malicious Sites (Attacks Allowed ByPolicy)
Description
In the main Cyber Attack View, in the Attacks Allowed By Policy section, double-click Hosts thatAccessed Malicious Sites.
The drill-down view summarizes access attempts to malicious sites from the internal network.
Cyber Attack View - Gateway
Threat Prevention R81.10 Best Practices | 33
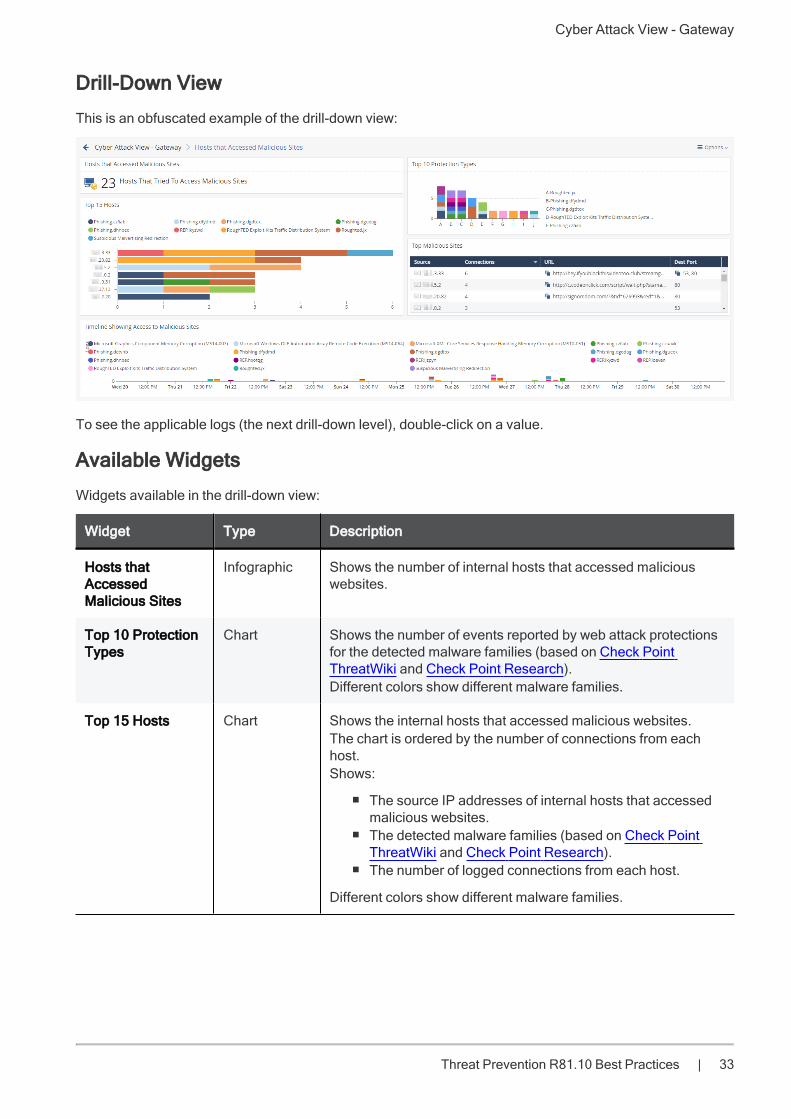
Drill-Down View
This is an obfuscated example of the drill-down view:
To see the applicable logs (the next drill-down level), double-click on a value.
Available Widgets
Widgets available in the drill-down view:
Widget Type Description
Hosts thatAccessedMalicious Sites
Infographic Shows the number of internal hosts that accessed maliciouswebsites.
Top 10 ProtectionTypes
Chart Shows the number of events reported by web attack protectionsfor the detected malware families (based on Check PointThreatWiki and Check Point Research).Different colors show different malware families.
Top 15 Hosts Chart Shows the internal hosts that accessed malicious websites.The chart is ordered by the number of connections from eachhost.Shows:
n The source IP addresses of internal hosts that accessedmalicious websites.
n The detected malware families (based on Check PointThreatWiki and Check Point Research).
n The number of logged connections from each host.
Different colors show different malware families.

Cyber Attack View - Gateway
Threat Prevention R81.10 Best Practices | 34
Widget Type Description
Top MaliciousSites
Table Shows the information about malicious websites.Shows:
n The source IP addresses of internal hosts.n The number of logged connections from each host.n URLs of malicious sites.n Destination ports of malicious sites.
Timeline ShowingAccess toMalicious Sites
Timeline Shows the detected malware families and their timeline.The timeline is divided into protection types.Different colors show different malware families.
Widget Query
In addition to the "Default Query" on page 11, the widget runs this query:
Custom Filter = ((blade:IPS AND ("Adobe Flash Protection Violation" OR"Adobe Shockwave Protection Violation" OR "Web Client EnforcementViolation" OR "Exploit Kit")) OR (blade:Anti-Virus AND ("URL Reputation" OR"DNS Reputation")))
Calculated Service > Not equals > smtp
Best Practices
Best practices against malicious sites:
n Examine the Threat Prevention logs to determine how much data (if at all) your internal hosts sent toand received from malicious websites.
If these logs show extremely low, or zero, amount of data, read sk74120: Why Anti-Bot and Anti-Virusconnections may be allowed even in Prevent mode.
n In the Threat Prevention logs from the Security Gateway, examine the Description field (see "LogFields" on page 56) to see if the Anti-Virus Software Blade work is in the Background or Hold mode.
In addition, read sk74120: Why Anti-Bot and Anti-Virus connections may be allowed even in Preventmode.
Attacks Prevented By PolicyThis widget shows the number of attacks using different attack vectors that the Security Policy preventedover the selected report period.
Note - Select the report period in the top left corner of this view. For example, Last 7Days, This Month, and so on.
Cyber Attack View - Gateway
Threat Prevention R81.10 Best Practices | 35
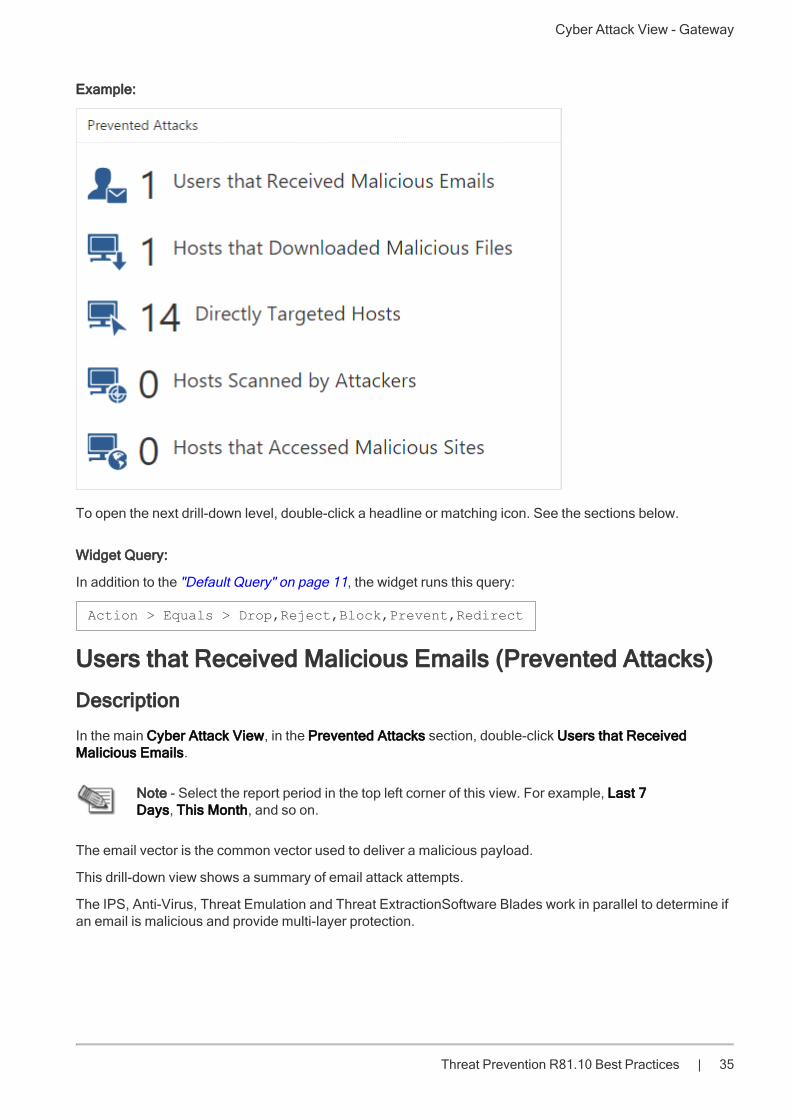
Example:
To open the next drill-down level, double-click a headline or matching icon. See the sections below.
Widget Query:
In addition to the "Default Query" on page 11, the widget runs this query:
Action > Equals > Drop,Reject,Block,Prevent,Redirect
Users that Received Malicious Emails (Prevented Attacks)
Description
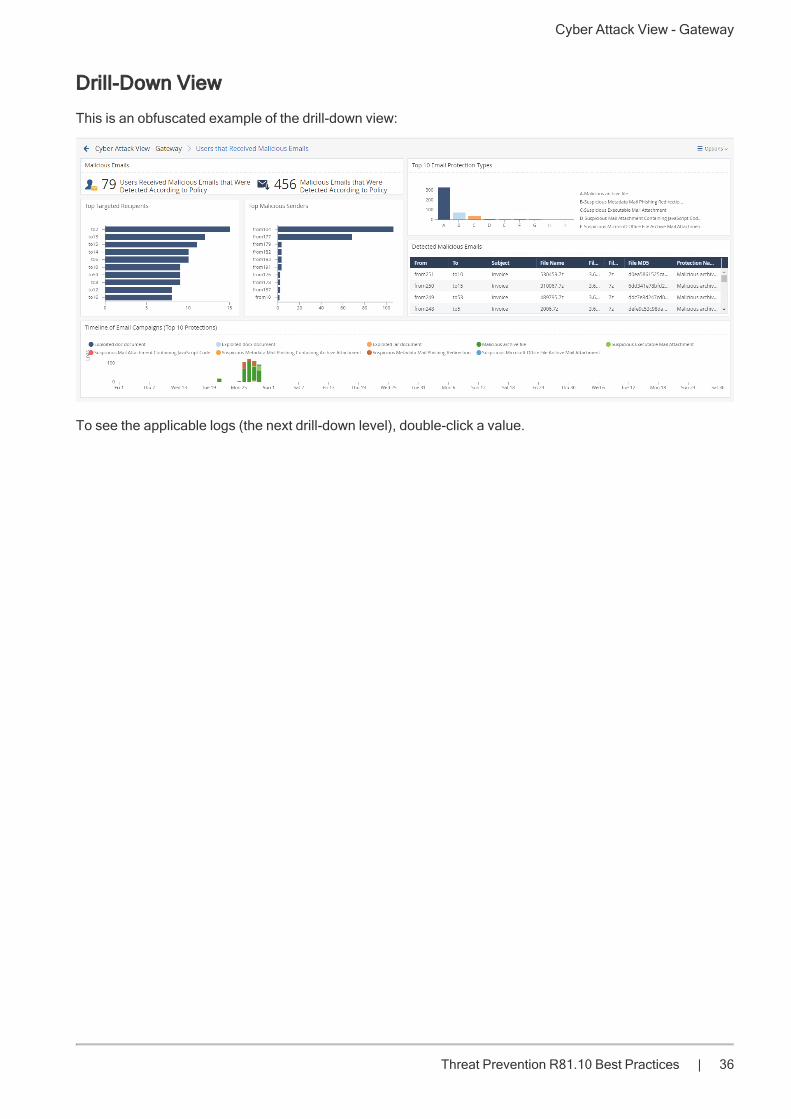
In the main Cyber Attack View, in the Prevented Attacks section, double-click Users that ReceivedMalicious Emails.
Note - Select the report period in the top left corner of this view. For example, Last 7Days, This Month, and so on.
The email vector is the common vector used to deliver a malicious payload.
This drill-down view shows a summary of email attack attempts.
The IPS, Anti-Virus, Threat Emulation and Threat ExtractionSoftware Blades work in parallel to determine ifan email is malicious and provide multi-layer protection.
Cyber Attack View - Gateway
Threat Prevention R81.10 Best Practices | 36
Drill-Down View
This is an obfuscated example of the drill-down view:
To see the applicable logs (the next drill-down level), double-click a value.
Cyber Attack View - Gateway
Threat Prevention R81.10 Best Practices | 37
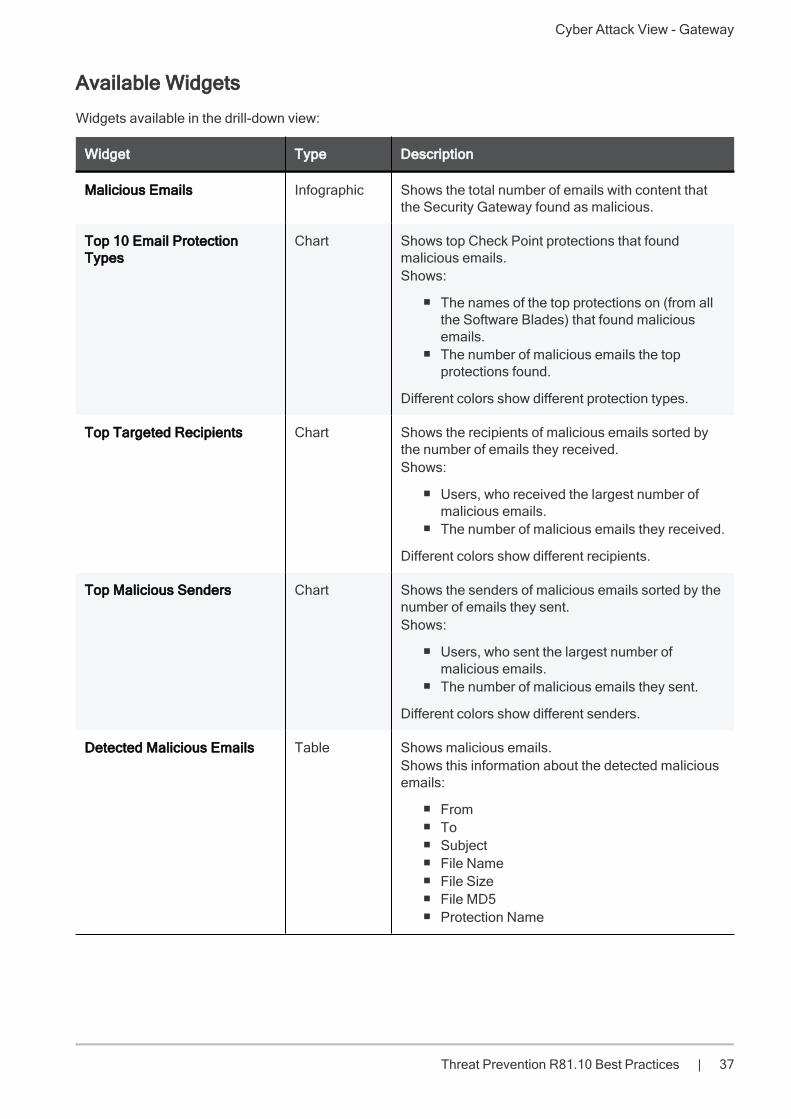
Available Widgets
Widgets available in the drill-down view:
Widget Type Description
Malicious Emails Infographic Shows the total number of emails with content thatthe Security Gateway found as malicious.
Top 10 Email ProtectionTypes
Chart Shows top Check Point protections that foundmalicious emails.Shows:
n The names of the top protections on (from allthe Software Blades) that found maliciousemails.
n The number of malicious emails the topprotections found.
Different colors show different protection types.
Top Targeted Recipients Chart Shows the recipients of malicious emails sorted bythe number of emails they received.Shows:
n Users, who received the largest number ofmalicious emails.
n The number of malicious emails they received.
Different colors show different recipients.
Top Malicious Senders Chart Shows the senders of malicious emails sorted by thenumber of emails they sent.Shows:
n Users, who sent the largest number ofmalicious emails.
n The number of malicious emails they sent.
Different colors show different senders.
Detected Malicious Emails Table Shows malicious emails.Shows this information about the detected maliciousemails:
n Fromn Ton Subjectn File Namen File Sizen File MD5n Protection Name
Cyber Attack View - Gateway
Threat Prevention R81.10 Best Practices | 38
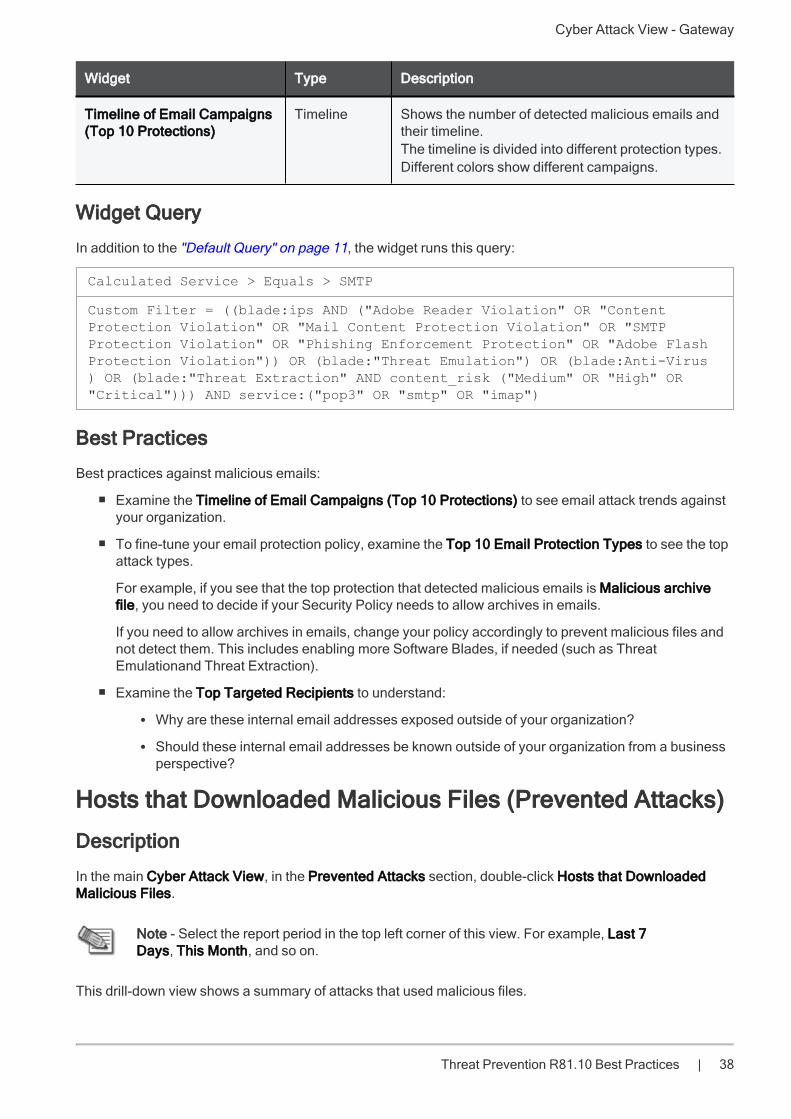
Widget Type Description
Timeline of Email Campaigns(Top 10 Protections)
Timeline Shows the number of detected malicious emails andtheir timeline.The timeline is divided into different protection types.Different colors show different campaigns.
Widget Query
In addition to the "Default Query" on page 11, the widget runs this query:
Calculated Service > Equals > SMTP
Custom Filter = ((blade:ips AND ("Adobe Reader Violation" OR "ContentProtection Violation" OR "Mail Content Protection Violation" OR "SMTPProtection Violation" OR "Phishing Enforcement Protection" OR "Adobe FlashProtection Violation")) OR (blade:"Threat Emulation") OR (blade:Anti-Virus) OR (blade:"Threat Extraction" AND content_risk ("Medium" OR "High" OR"Critical"))) AND service:("pop3" OR "smtp" OR "imap")
Best Practices
Best practices against malicious emails:
n Examine the Timeline of Email Campaigns (Top 10 Protections) to see email attack trends againstyour organization.
n To fine-tune your email protection policy, examine the Top 10 Email Protection Types to see the topattack types.
For example, if you see that the top protection that detected malicious emails is Malicious archivefile, you need to decide if your Security Policy needs to allow archives in emails.
If you need to allow archives in emails, change your policy accordingly to prevent malicious files andnot detect them. This includes enabling more Software Blades, if needed (such as ThreatEmulationand Threat Extraction).
n Examine the Top Targeted Recipients to understand:
l Why are these internal email addresses exposed outside of your organization?
l Should these internal email addresses be known outside of your organization from a businessperspective?
Hosts that Downloaded Malicious Files (Prevented Attacks)
Description
In the main Cyber Attack View, in the Prevented Attacks section, double-click Hosts that DownloadedMalicious Files.
Note - Select the report period in the top left corner of this view. For example, Last 7Days, This Month, and so on.
This drill-down view shows a summary of attacks that used malicious files.
Cyber Attack View - Gateway
Threat Prevention R81.10 Best Practices | 39
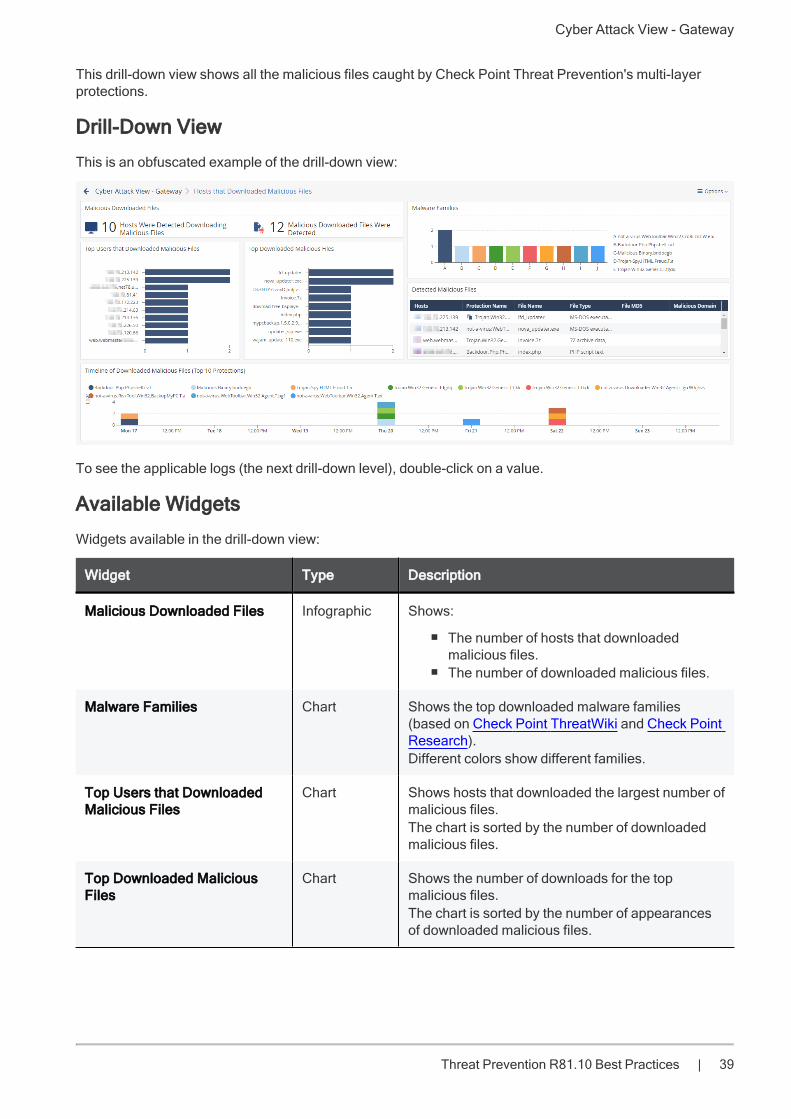
This drill-down view shows all the malicious files caught by Check Point Threat Prevention's multi-layerprotections.
Drill-Down View
This is an obfuscated example of the drill-down view:
To see the applicable logs (the next drill-down level), double-click on a value.
Available Widgets
Widgets available in the drill-down view:
Widget Type Description
Malicious Downloaded Files Infographic Shows:
n The number of hosts that downloadedmalicious files.
n The number of downloaded malicious files.
Malware Families Chart Shows the top downloaded malware families(based on Check Point ThreatWiki and Check PointResearch).Different colors show different families.
Top Users that DownloadedMalicious Files
Chart Shows hosts that downloaded the largest number ofmalicious files.The chart is sorted by the number of downloadedmalicious files.
Top Downloaded MaliciousFiles
Chart Shows the number of downloads for the topmalicious files.The chart is sorted by the number of appearancesof downloaded malicious files.
Cyber Attack View - Gateway
Threat Prevention R81.10 Best Practices | 40
Widget Type Description
Detected Malicious Files Table Shows the downloaded malicious files.Shows:
n Hosts that downloaded malicious filesn The name of the protection that detected the
malicious filesn The name of the malicious filen The type of the malicious filen The MD5 of the malicious filen Malicious Domain
Timeline of DownloadedMalicious Files (Top 10Protections)
Timeline Shows the number of logs for downloadedmalicious files.Different colors show different files.
Widget Query
In addition to the "Default Query" on page 11, the widget runs this query:
Custom Filter = ((blade:"threat emulation") OR (blade:"anti-virus" AND"signature") OR (blade:ips AND (("Adobe Reader Violation" OR "ContentProtection Violation" OR "Instant Messenger" OR "Adobe Flash ProtectionViolation"))))
Best Practices
Best practices against malicious files:
n Examine the Top Downloaded Malicious Files.
If you see a specific malicious file downloaded many times, treat it as attack campaign against yournetwork.
n Examine the Detected Malicious Files widget.
n Look for the common malicious domains related to the malicious files. In case a domain appearsmany times:
1. If this is an unknown website, add this site to your black list (with the URL Filtering blade).
2. If this is a known website, contact the site owner to alert them about a possible attack on theirwebsite.
3. If this is your website, investigate the issue and contact Check Point Incident Response Team.
Directly Targeted Hosts (Prevented Attacks)
Description
In the main Cyber Attack View, in the Prevented Attacks section, double-click Directly Targeted Hosts.
Note - Select the report period in the top left corner of this view. For example, Last 7Days, This Month, and so on.
Cyber Attack View - Gateway
Threat Prevention R81.10 Best Practices | 41
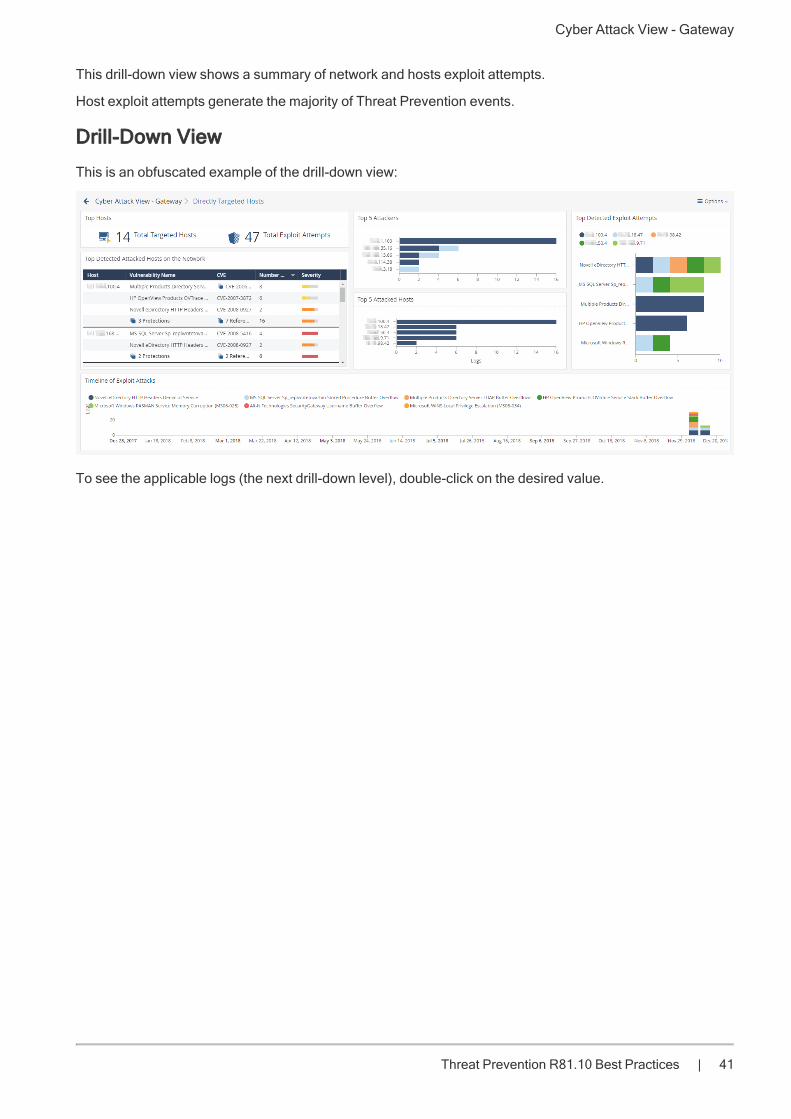
This drill-down view shows a summary of network and hosts exploit attempts.
Host exploit attempts generate the majority of Threat Prevention events.
Drill-Down View
This is an obfuscated example of the drill-down view:
To see the applicable logs (the next drill-down level), double-click on the desired value.

Cyber Attack View - Gateway
Threat Prevention R81.10 Best Practices | 42
Available Widgets
Widgets available in the drill-down view:
Widget Type Description
Top Hosts Infographic Shows:
n The total number of attacked internal hosts.n The total number of detected exploit attempts.
Top 5 Attackers Chart Shows the top attackers sorted by the number of their exploitattempts.Shows:
n The source IP addresses of top attackers.n The number of logs for exploit attempts.
Different colors show different exploited vulnerabilities. Formore information, see the Top Detected Exploits Attemptswidget.
Top 5 Attacked Hosts Chart Shows the top attacked hosts sorted by the number ofattempted exploits.Shows:
n The IP addresses of top attacked internal hosts.n The number of logs for attempted exploits.
Top Detected ExploitAttempts
Chart Shows the top exploit attempts on internal hosts.Shows:
n The names of the top detected exploits.n The number of logs for these exploits.
Different colors show different exploited vulnerabilities.
Top DetectedAttacked Hosts on theNetwork
Table Shows the list of internal hosts and the exploit attempts theyencountered.Shows:
n The IP addresses of your attacked internal hosts.n Names of exploited vulnerabilities.n CVEn Amount of reported events for each attacked internal
host.n Severity.
Timeline of ExploitAttacks
Timeline Shows the names of exploited vulnerabilities and theirtimeline.The timeline is divided into different exploit attempts.Different colors show different exploited vulnerabilities.
Widget Query
In addition to the "Default Query" on page 11, the widget runs this query:

Cyber Attack View - Gateway
Threat Prevention R81.10 Best Practices | 43
Custom Filter = blade:IPS NOT ("SMTP" OR "Adobe Reader Violation" OR"Content Protection Violation" OR "Mail Content Protection Violation" OR"SMTP Protection Violation" OR "Phishing Enforcement Protection" OR "AdobeFlash Protection Violation" OR "Adobe Reader Violation" OR "ContentProtection Violation" OR "Instant Messenger" OR "Adobe Flash ProtectionViolation" OR "Scanner Enforcement Violation" OR "Port Scan" OR "NovellNMAP Protocol Violation" OR "Adobe Flash Protection Violation" OR "AdobeShockwave Protection Violation" OR "Web Client Enforcement Violation" OR"Exploit Kit")
Best Practices
Best practices against network and host exploits:
Category Description
General BestPractices
n Examine the Top Detected Exploit Attempts widget to understand whatare the top exploits and vulnerabilities used to attack your network. Thislets you determine if your network is under a specific massive attack, or ifthis is a false positive.This widget also shows the top attacked hosts.This lets you plan a "patch procedure" for your hosts based on the currentexploit attempts.
n To understand if an attacker performed a reconnaissance of a specifichost:a) In the Top 5 Attacked Hosts widget, right-click a chart bar for a host.b) In the context menu, click Filter: "<IP Address>".c) At the top, click Cyber Attack View - Gateway.d) Pay attention to the Hosts Scanned by Attackers counter.
n Examine the Timeline of Exploit Attacks for trends. This lets youunderstand if your network is under a specific massive attack, or if this is afalse positive.
n Examine the Top 5 Attackers widget. Double-click on each IP address tosee the applicable logs. In the logs, examine the source countries. Decideif you need to block these countries with a Geo Policy.
n In the logs examine the Resource field (see "Log Fields" on page 56),which may contain the malicious request. This is the full path the attackertried to access on your attacked internal host.
n You can perform the detected attack by yourself (for example, you can usea local penetration tester). This provides a real test if the ability to exploityour internal host exists.
Best Practices forevents that theSecurity Gatewayprevented
n Examine the Top Detected Exploit Attempts to determine if the SecurityGateway prevented an attack campaign against you network.
n Examine (once a month) what are the top exploit attempts against yournetwork. The Check Point Security CheckUp report uses the same queriesand shows a full list of attacks and assets in your organization.
Host Scanned by Attackers (Prevented Attacks)
Description
In the main Cyber Attack View, in the Prevented Attacks section, click Host Scanned by Attackers.
Cyber Attack View - Gateway
Threat Prevention R81.10 Best Practices | 44
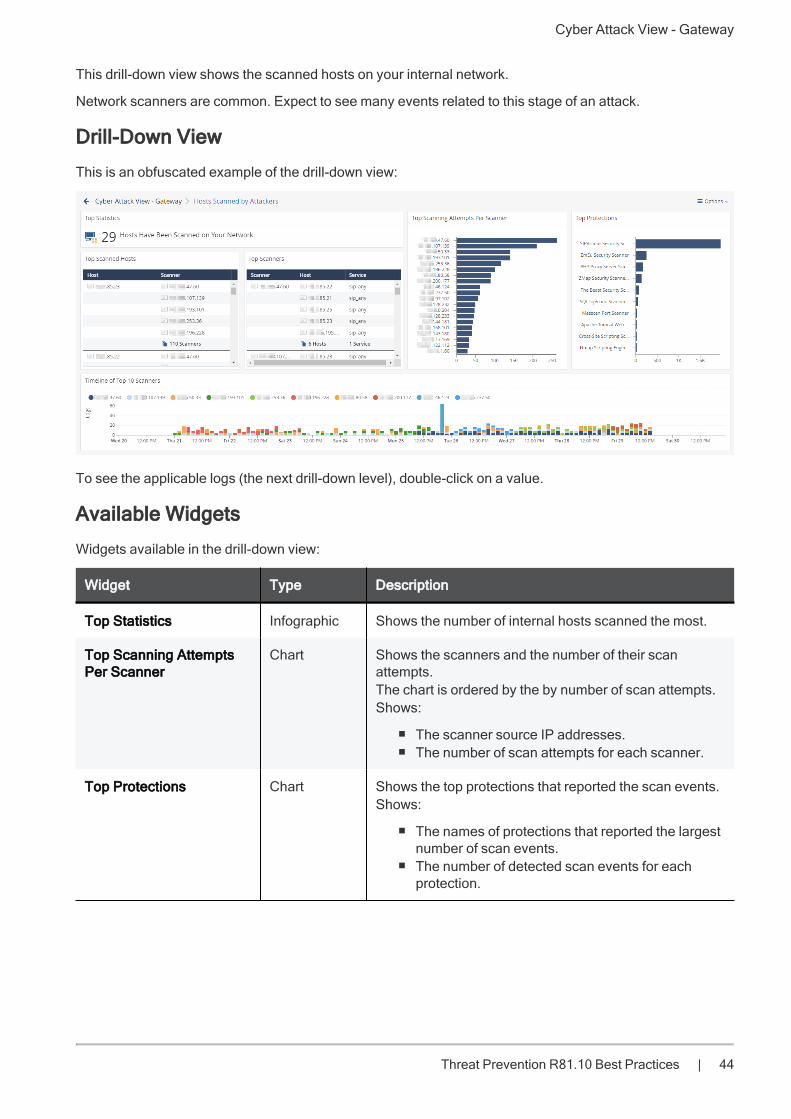
This drill-down view shows the scanned hosts on your internal network.
Network scanners are common. Expect to see many events related to this stage of an attack.
Drill-Down View
This is an obfuscated example of the drill-down view:
To see the applicable logs (the next drill-down level), double-click on a value.
Available Widgets
Widgets available in the drill-down view:
Widget Type Description
Top Statistics Infographic Shows the number of internal hosts scanned the most.
Top Scanning AttemptsPer Scanner
Chart Shows the scanners and the number of their scanattempts.The chart is ordered by the by number of scan attempts.Shows:
n The scanner source IP addresses.n The number of scan attempts for each scanner.
Top Protections Chart Shows the top protections that reported the scan events.Shows:
n The names of protections that reported the largestnumber of scan events.
n The number of detected scan events for eachprotection.
Cyber Attack View - Gateway
Threat Prevention R81.10 Best Practices | 45
Widget Type Description
Top Scanned Hosts Table Shows information about the most scanned internalhosts:
n Destination (host) IP addresses.n Source (scanner) IP addresses.n The total number of destinations and sources.
Top Scanners Table Shows information about the scanners:
n Source (scanner) IP address.n Destination (host) IP addresses and total number
of scanned destinations.n Check Point services, to which these scan
attempts matched (Protocols and Ports).
Timeline of Top 10Scanners
Timeline Shows the number of scanned hosts for each detectedscanner and their timeline.Different colors show different scanners.
Widget Query
In addition to the "Default Query" on page 11, the widget runs this query:
Custom Filter = "Scanner Enforcement Violation" OR "Port Scan" OR "NovellNMAP Protocol Violation"
Best Practices
Best practices against network reconnaissance attempts:
1. Find the hosts that are able to connect to external networks through the Security Gateway.
Configure the applicable Access Control rules for hosts that you do not want to connect to externalnetworks.
2. If you use your own vulnerability scanner, you have two options:
n Add an exception to your policy, so that the Security Gateway does not enforce protectionsagainst this scanner.
n If you still want the Security Gateway to report events generated by your scanner, then run anexplicit query that excludes your scanner and shows only the external scanners.
3. Use logs generated by scanning events to determine if new hosts on the network are connecting tothe outside world.
Hosts that Accessed Malicious Sites (Prevented Attacks)
Description
In the main Cyber Attack View, in the Prevented Attacks section, double-click Hosts that AccessedMalicious Sites.
The drill-down view summarizes access attempts to malicious sites from the internal network.

Cyber Attack View - Gateway
Threat Prevention R81.10 Best Practices | 46
Drill-Down View
This is an obfuscated example of the drill-down view:
To see the applicable logs (the next drill-down level), double-click on a value.
Available Widgets
Widgets available in the drill-down view:
Widget Type Description
Hosts thatAccessedMalicious Sites
Infographic Shows the number of internal hosts that accessed maliciouswebsites.
Top 10 ProtectionTypes
Chart Shows the number of events reported by web attack protectionsfor the detected malware families (based on Check PointThreatWiki and Check Point Research).Different colors show different malware families.
Top 15 Hosts Chart Shows the internal hosts that accessed malicious websites.The chart is ordered by the number of connections from eachhost.Shows:
n The source IP addresses of internal hosts that accessedmalicious websites.
n The detected malware families (based on Check PointThreatWiki and Check Point Research).
n The number of logged connections from each host.
Different colors show different malware families.
Cyber Attack View - Gateway
Threat Prevention R81.10 Best Practices | 47
Widget Type Description
Top MaliciousSites
Table Shows the information about malicious websites.Shows:
n The source IP addresses of internal hosts.n The number of logged connections from each host.n URLs of malicious sites.n Destination ports of malicious sites.
Timeline ShowingAccess toMalicious Sites
Timeline Shows the detected malware families and their timeline.The timeline is divided into protection types.Different colors show different malware families.
Widget Query
In addition to the "Default Query" on page 11, the widget runs this query:
Custom Filter = ((blade:IPS AND ("Adobe Flash Protection Violation" OR"Adobe Shockwave Protection Violation" OR "Web Client EnforcementViolation" OR "Exploit Kit")) OR (blade:Anti-Virus AND ("URL Reputation" OR"DNS Reputation")))
Calculated Service > Not equals > smtp
Best Practices
Best practices against malicious sites:
n Examine the Top 15 Hosts to determine if these hosts are at risk and if you need to clean andreconfigure them.
n Examine the Top 10 Protection Types to understand if the websites your internal hosts accessed arecompromised.
SandBlast Threat Emulation
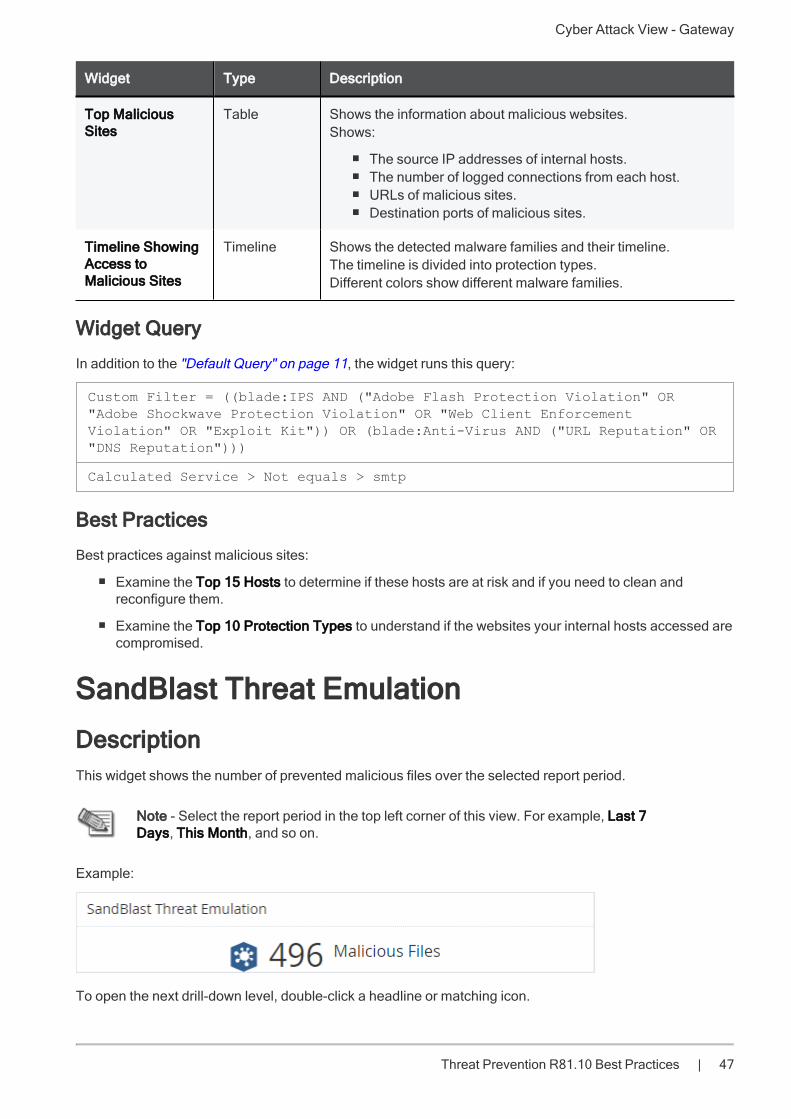
DescriptionThis widget shows the number of prevented malicious files over the selected report period.
Note - Select the report period in the top left corner of this view. For example, Last 7Days, This Month, and so on.
Example:
To open the next drill-down level, double-click a headline or matching icon.
Cyber Attack View - Gateway
Threat Prevention R81.10 Best Practices | 48
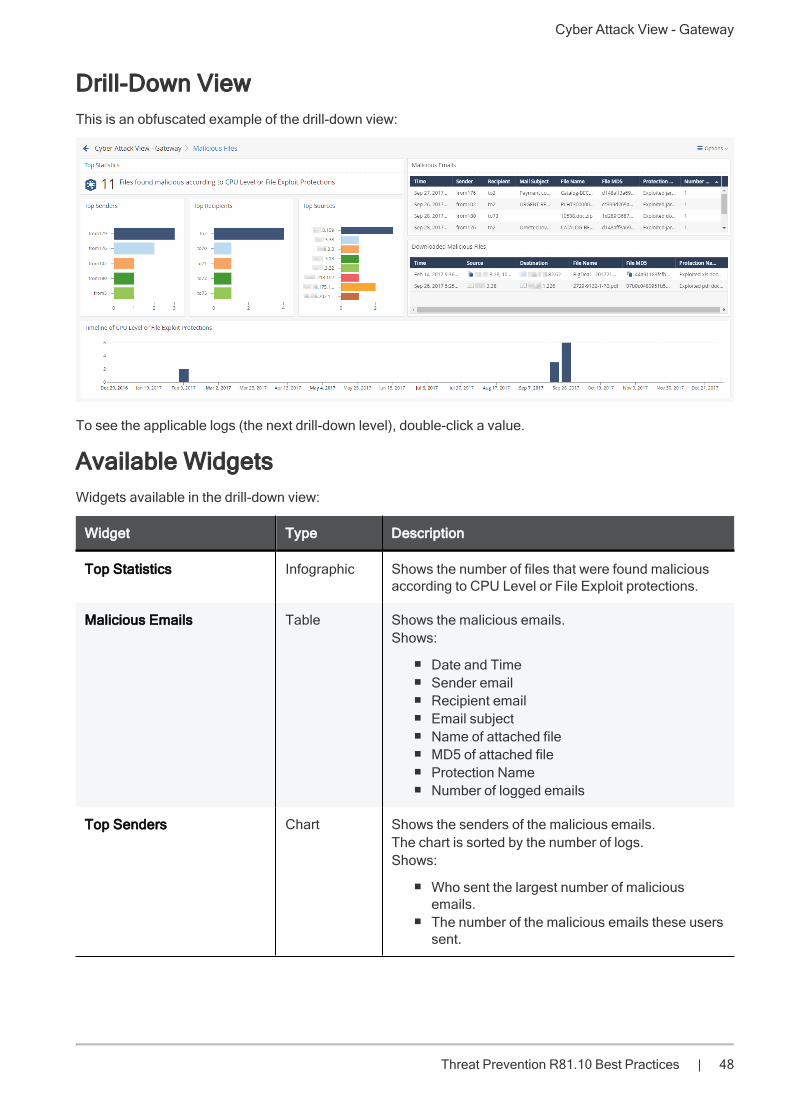
Drill-Down ViewThis is an obfuscated example of the drill-down view:
To see the applicable logs (the next drill-down level), double-click a value.
Available WidgetsWidgets available in the drill-down view:
Widget Type Description
Top Statistics Infographic Shows the number of files that were found maliciousaccording to CPU Level or File Exploit protections.
Malicious Emails Table Shows the malicious emails.Shows:
n Date and Timen Sender emailn Recipient emailn Email subjectn Name of attached filen MD5 of attached filen Protection Namen Number of logged emails
Top Senders Chart Shows the senders of the malicious emails.The chart is sorted by the number of logs.Shows:
n Who sent the largest number of maliciousemails.
n The number of the malicious emails these userssent.
Cyber Attack View - Gateway
Threat Prevention R81.10 Best Practices | 49
Widget Type Description
Top Recipients Chart Shows the recipients of the malicious emails.The chart is sorted by the number of logs.Shows:
n Who received the largest number of maliciousemails.
n The number of the malicious emails these usersreceived.
Top Sources Chart Shows the source hosts of the malicious emails.The chart is sorted by the sources that sent the largestnumber of malicious emails.Shows:
n Hosts that sent the largest number of maliciousemails.
n The number of the malicious emails these hostssent.
Downloaded Malicious Files Table Shows the information about the detected maliciousemails:
n Fromn Ton Subjectn File Namen File Sizen File MD5n Protection Name
Timeline of CPU Level andFile Exploit Protections
Timeline Shows number of protection logs and their timeline.
Widget QueryIn addition to the "Default Query" on page 11, the widget runs this query:
Custom Filter = "*CPU-Level Detection Event*" OR Exploited
Blade > Equals > Threat Emulation
Product Family > Equals > Threat
Cyber Attack Timeline
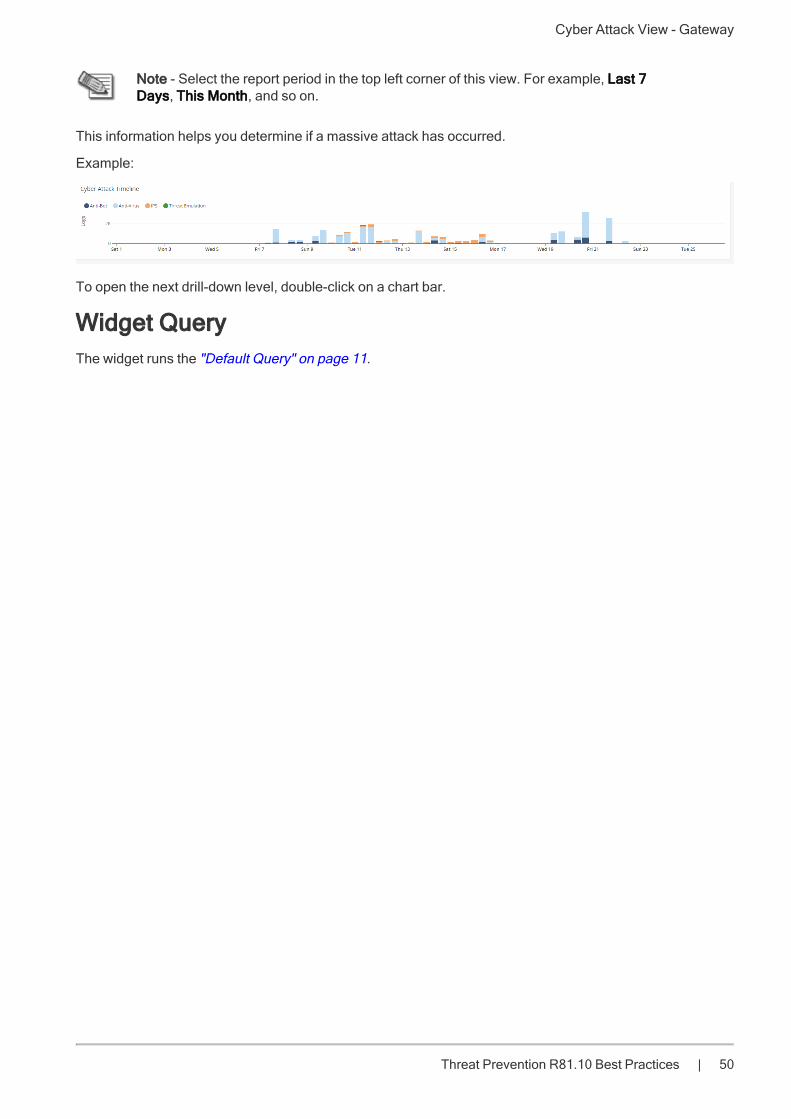
DescriptionThis widget shows the number of logs from different Software Blade (Anti-Bot, Anti-Virus, IPS, and ThreatEmulation) over the selected report period.
Cyber Attack View - Gateway
Threat Prevention R81.10 Best Practices | 50
Note - Select the report period in the top left corner of this view. For example, Last 7Days, This Month, and so on.
This information helps you determine if a massive attack has occurred.
Example:
To open the next drill-down level, double-click on a chart bar.
Widget QueryThe widget runs the "Default Query" on page 11.
Cyber Attack View - Gateway
Threat Prevention R81.10 Best Practices | 51
MITRE ATT&CKMITRE ATT&CK is a knowledge base used for the development of threat models and methodologies for theglobal cybersecurity community.
MITRE ATT&CK lets Check Point customers review the security incidents in their network in a way thatexposes the top techniques and tactics used by attackers against their network.
For each malicious file that is found, Threat Emulation (SandBlast technology) adds the techniques andtactics that were used in the attack to the relevant log.
Note - The Threat Emulation blade must be enabled if you want to add MITRE ATT&CKinformation to the logs.
Configuring Threat Emulation Logs with MITREATT&CK Data
1. Open SmartConsole.
2. In the Gateways & Servers view, enable the Threat Emulation blade on the relevant SecurityGateway.
3. Select the Security Gateway, click Actions > Open Shell.
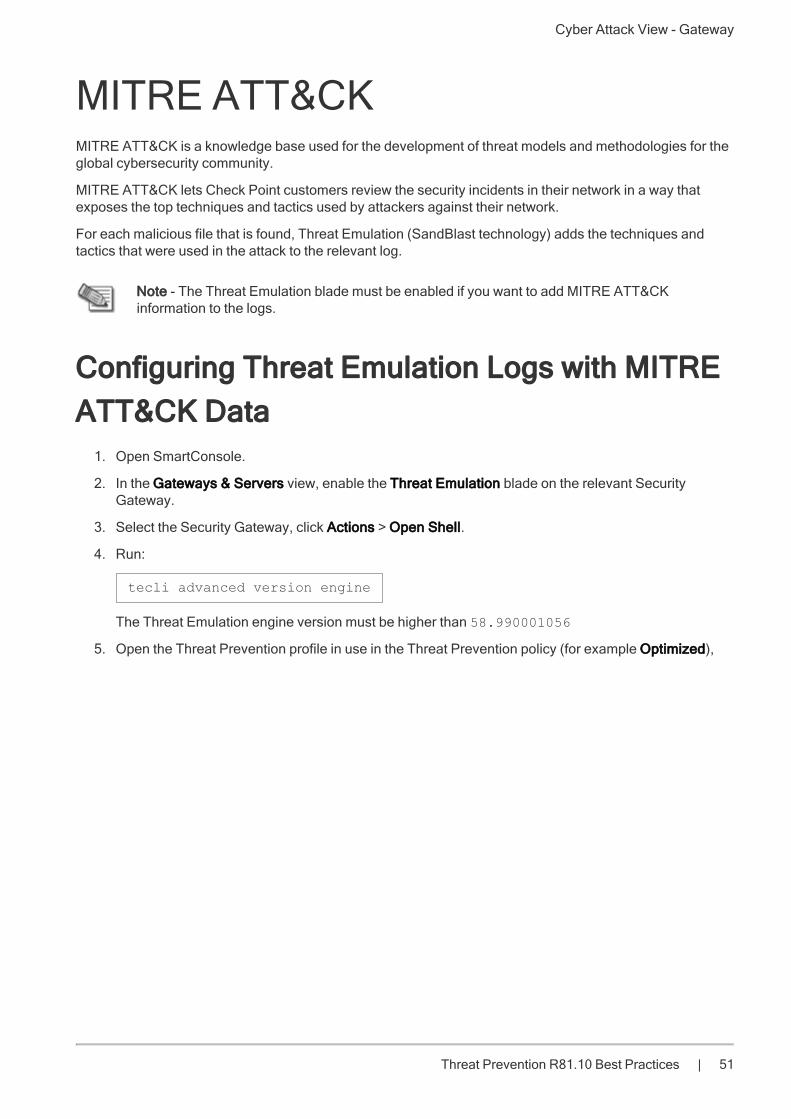
4. Run:
tecli advanced version engine
The Threat Emulation engine version must be higher than 58.990001056
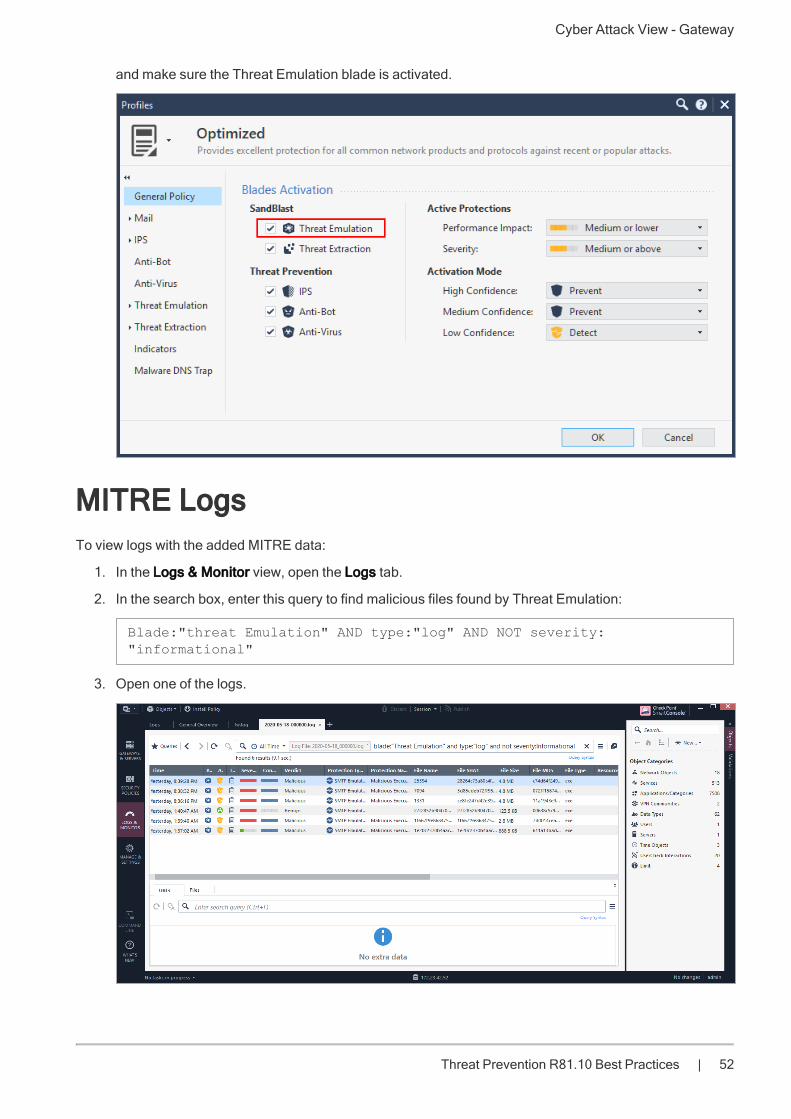
5. Open the Threat Prevention profile in use in the Threat Prevention policy (for example Optimized),
Cyber Attack View - Gateway
Threat Prevention R81.10 Best Practices | 52
and make sure the Threat Emulation blade is activated.
MITRE LogsTo view logs with the added MITRE data:
1. In the Logs & Monitor view, open the Logs tab.
2. In the search box, enter this query to find malicious files found by Threat Emulation:
Blade:"threat Emulation" AND type:"log" AND NOT severity:"informational"
3. Open one of the logs.
Cyber Attack View - Gateway
Threat Prevention R81.10 Best Practices | 53
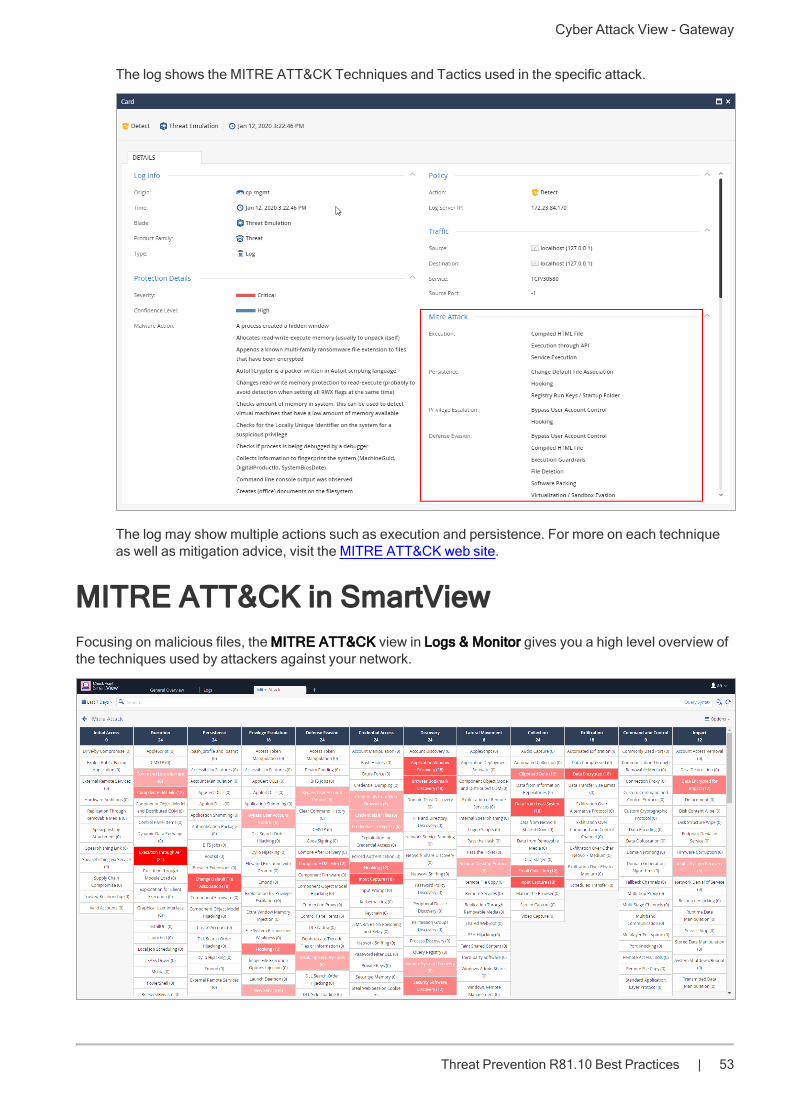
The log shows the MITRE ATT&CK Techniques and Tactics used in the specific attack.
The log may show multiple actions such as execution and persistence. For more on each techniqueas well as mitigation advice, visit the MITRE ATT&CK web site.
MITRE ATT&CK in SmartViewFocusing on malicious files, the MITRE ATT&CK view in Logs & Monitor gives you a high level overview ofthe techniques used by attackers against your network.
Cyber Attack View - Gateway
Threat Prevention R81.10 Best Practices | 54
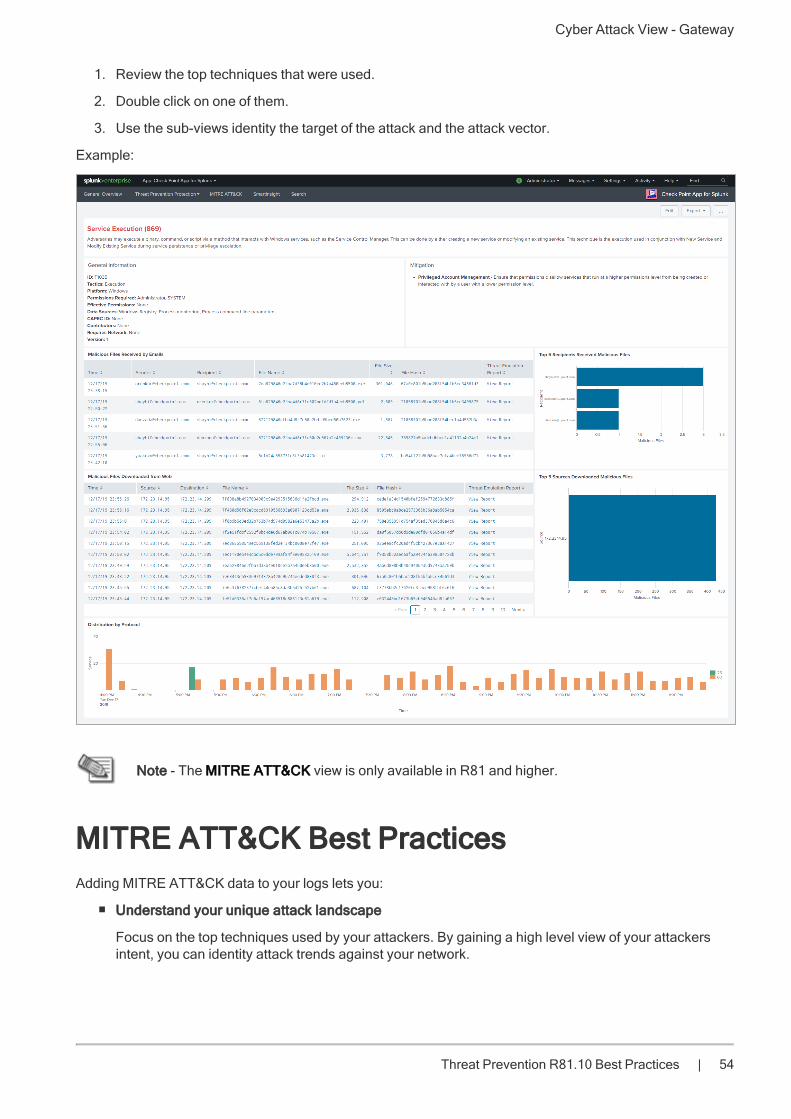
1. Review the top techniques that were used.
2. Double click on one of them.
3. Use the sub-views identity the target of the attack and the attack vector.
Example:
Note - The MITRE ATT&CK view is only available in R81 and higher.
MITRE ATT&CK Best PracticesAdding MITRE ATT&CK data to your logs lets you:
n Understand your unique attack landscape
Focus on the top techniques used by your attackers. By gaining a high level view of your attackersintent, you can identity attack trends against your network.
Cyber Attack View - Gateway
Threat Prevention R81.10 Best Practices | 55
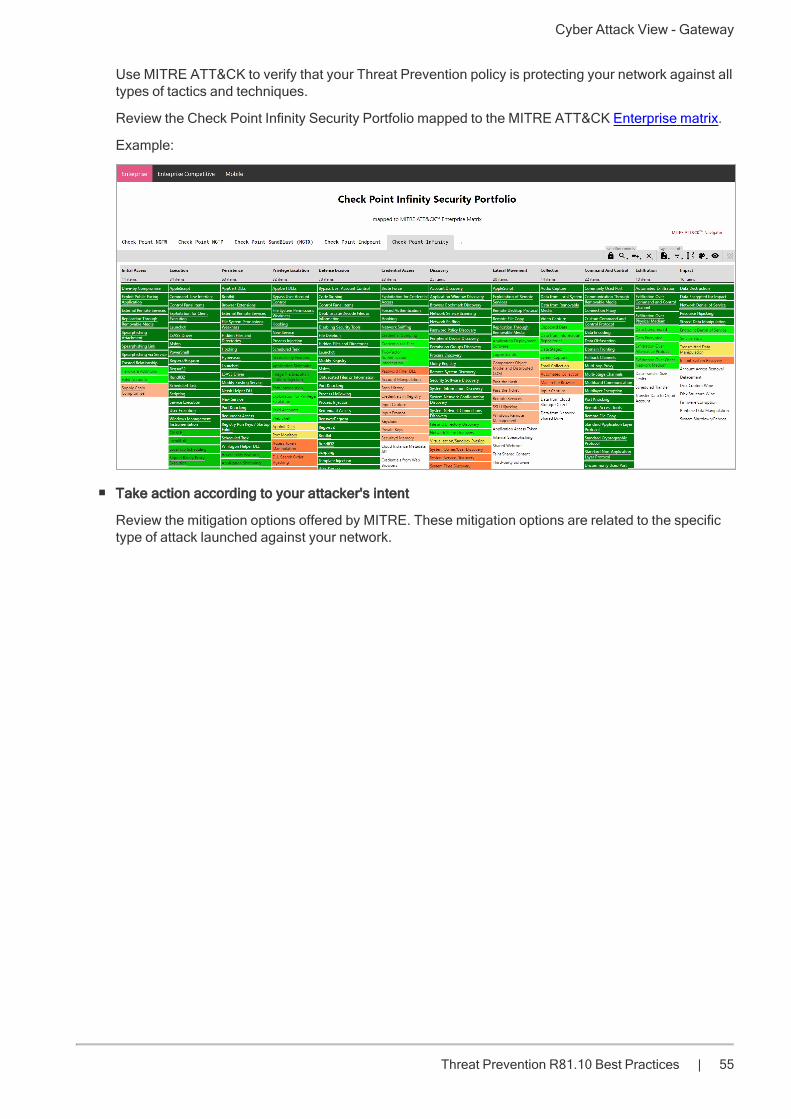
Use MITRE ATT&CK to verify that your Threat Prevention policy is protecting your network against alltypes of tactics and techniques.
Review the Check Point Infinity Security Portfolio mapped to the MITRE ATT&CK Enterprise matrix.
Example:
n Take action according to your attacker's intent
Review the mitigation options offered by MITRE. These mitigation options are related to the specifictype of attack launched against your network.
Log Fields
Threat Prevention R81.10 Best Practices | 56
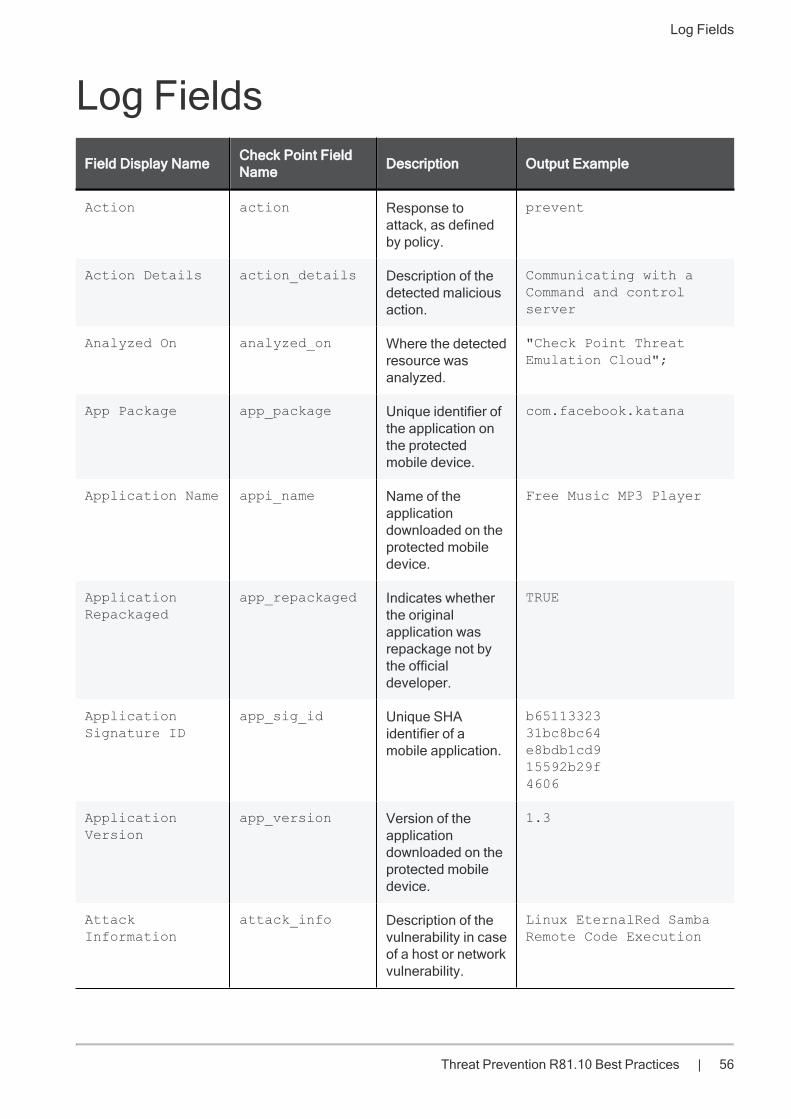
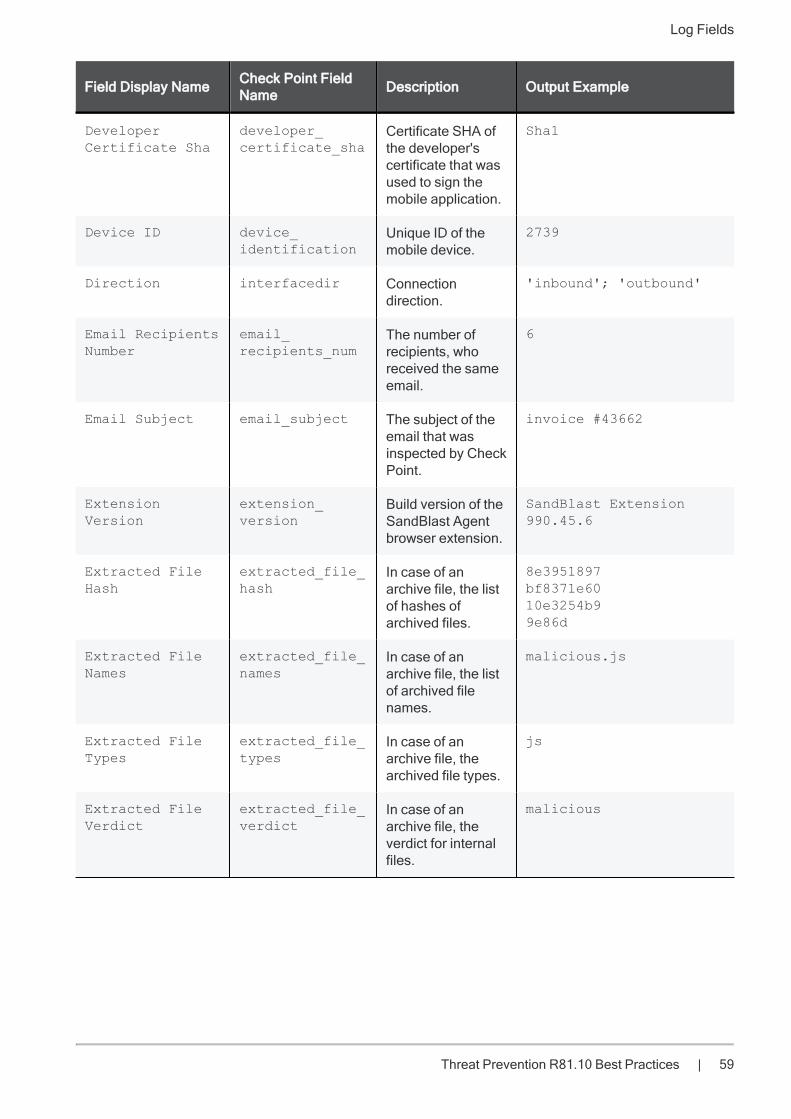
Log FieldsField Display Name Check Point Field
Name Description Output Example
Action action Response toattack, as definedby policy.
prevent
Action Details action_details Description of thedetected maliciousaction.
Communicating with aCommand and controlserver
Analyzed On analyzed_on Where the detectedresource wasanalyzed.
"Check Point ThreatEmulation Cloud";
App Package app_package Unique identifier ofthe application onthe protectedmobile device.
com.facebook.katana
Application Name appi_name Name of theapplicationdownloaded on theprotected mobiledevice.
Free Music MP3 Player
ApplicationRepackaged
app_repackaged Indicates whetherthe originalapplication wasrepackage not bythe officialdeveloper.
TRUE
ApplicationSignature ID
app_sig_id Unique SHAidentifier of amobile application.
b6511332331bc8bc64e8bdb1cd915592b29f4606
ApplicationVersion
app_version Version of theapplicationdownloaded on theprotected mobiledevice.
1.3
AttackInformation
attack_info Description of thevulnerability in caseof a host or networkvulnerability.
Linux EternalRed SambaRemote Code Execution
Log Fields
Threat Prevention R81.10 Best Practices | 57
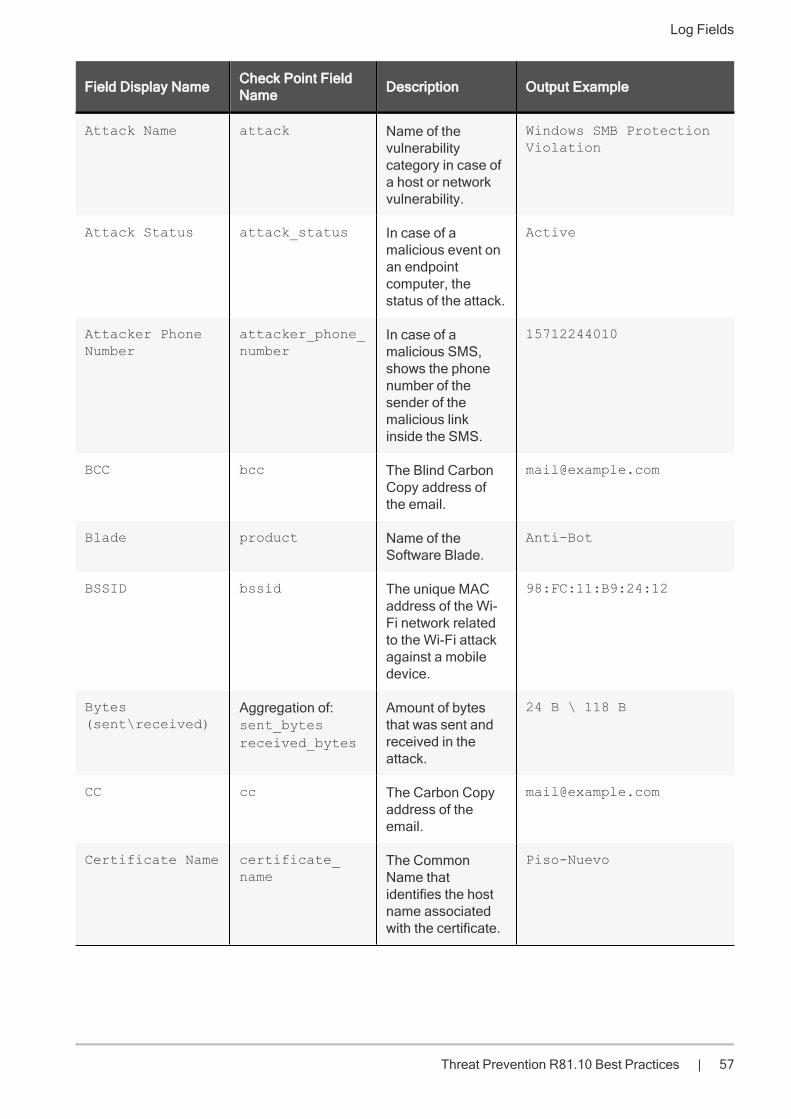
Field Display Name Check Point FieldName Description Output Example
Attack Name attack Name of thevulnerabilitycategory in case ofa host or networkvulnerability.
Windows SMB ProtectionViolation
Attack Status attack_status In case of amalicious event onan endpointcomputer, thestatus of the attack.
Active
Attacker PhoneNumber
attacker_phone_number
In case of amalicious SMS,shows the phonenumber of thesender of themalicious linkinside the SMS.
15712244010
BCC bcc The Blind CarbonCopy address ofthe email.
Blade product Name of theSoftware Blade.
Anti-Bot
BSSID bssid The unique MACaddress of the Wi-Fi network relatedto the Wi-Fi attackagainst a mobiledevice.
98:FC:11:B9:24:12
Bytes(sent\received)
Aggregation of:sent_bytesreceived_bytes
Amount of bytesthat was sent andreceived in theattack.
24 B \ 118 B
CC cc The Carbon Copyaddress of theemail.
Certificate Name certificate_name
The CommonName thatidentifies the hostname associatedwith the certificate.
Piso-Nuevo
Log Fields
Threat Prevention R81.10 Best Practices | 58
Field Display Name Check Point FieldName Description Output Example
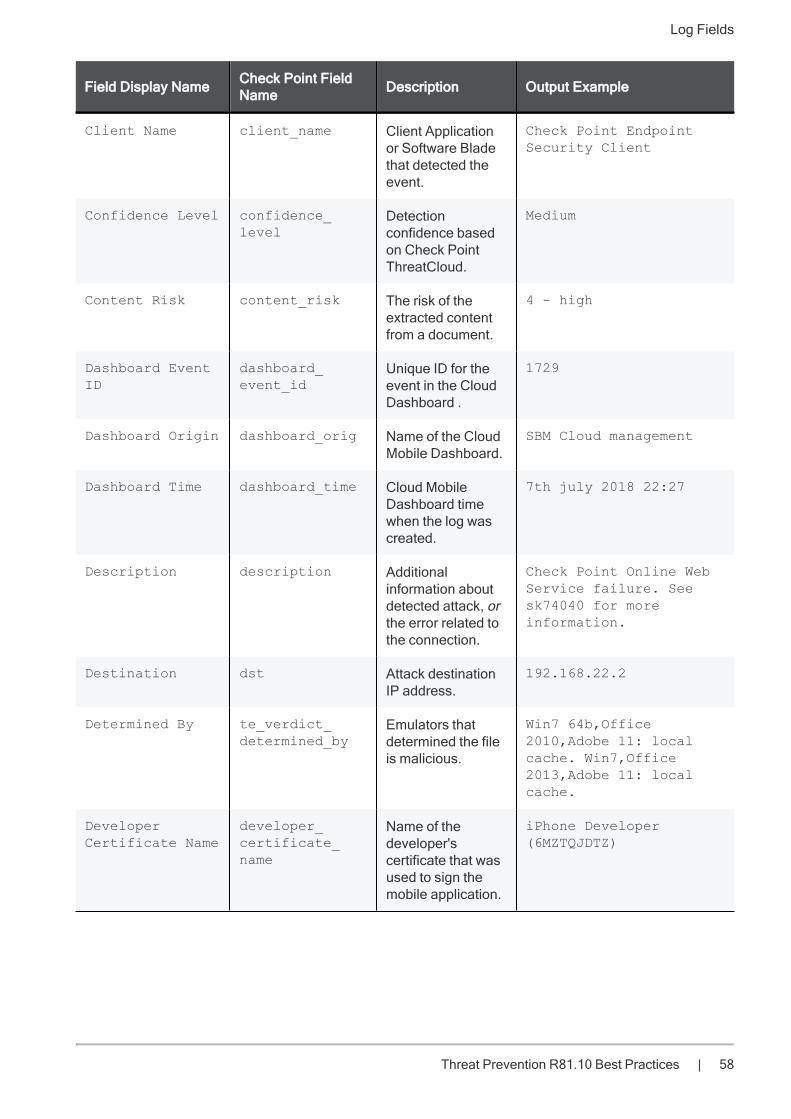
Client Name client_name Client Applicationor Software Bladethat detected theevent.
Check Point EndpointSecurity Client
Confidence Level confidence_level
Detectionconfidence basedon Check PointThreatCloud.
Medium
Content Risk content_risk The risk of theextracted contentfrom a document.
4 - high
Dashboard EventID
dashboard_event_id
Unique ID for theevent in the CloudDashboard .
1729
Dashboard Origin dashboard_orig Name of the CloudMobile Dashboard.
SBM Cloud management
Dashboard Time dashboard_time Cloud MobileDashboard timewhen the log wascreated.
7th july 2018 22:27
Description description Additionalinformation aboutdetected attack, orthe error related tothe connection.
Check Point Online WebService failure. Seesk74040 for moreinformation.
Destination dst Attack destinationIP address.
192.168.22.2
Determined By te_verdict_determined_by
Emulators thatdetermined the fileis malicious.
Win7 64b,Office2010,Adobe 11: localcache. Win7,Office2013,Adobe 11: localcache.
DeveloperCertificate Name
developer_certificate_name
Name of thedeveloper'scertificate that wasused to sign themobile application.
iPhone Developer(6MZTQJDTZ)
Log Fields
Threat Prevention R81.10 Best Practices | 59
Field Display Name Check Point FieldName Description Output Example
DeveloperCertificate Sha
developer_certificate_sha
Certificate SHA ofthe developer'scertificate that wasused to sign themobile application.
Sha1
Device ID device_identification
Unique ID of themobile device.
2739
Direction interfacedir Connectiondirection.
'inbound'; 'outbound'
Email RecipientsNumber
email_recipients_num
The number ofrecipients, whoreceived the sameemail.
6
Email Subject email_subject The subject of theemail that wasinspected by CheckPoint.
invoice #43662
ExtensionVersion
extension_version
Build version of theSandBlast Agentbrowser extension.
SandBlast Extension990.45.6
Extracted FileHash
extracted_file_hash
In case of anarchive file, the listof hashes ofarchived files.
8e3951897bf8371e6010e3254b99e86d
Extracted FileNames
extracted_file_names
In case of anarchive file, the listof archived filenames.
malicious.js
Extracted FileTypes
extracted_file_types
In case of anarchive file, thearchived file types.
js
Extracted FileVerdict
extracted_file_verdict
In case of anarchive file, theverdict for internalfiles.
malicious
Log Fields
Threat Prevention R81.10 Best Practices | 60
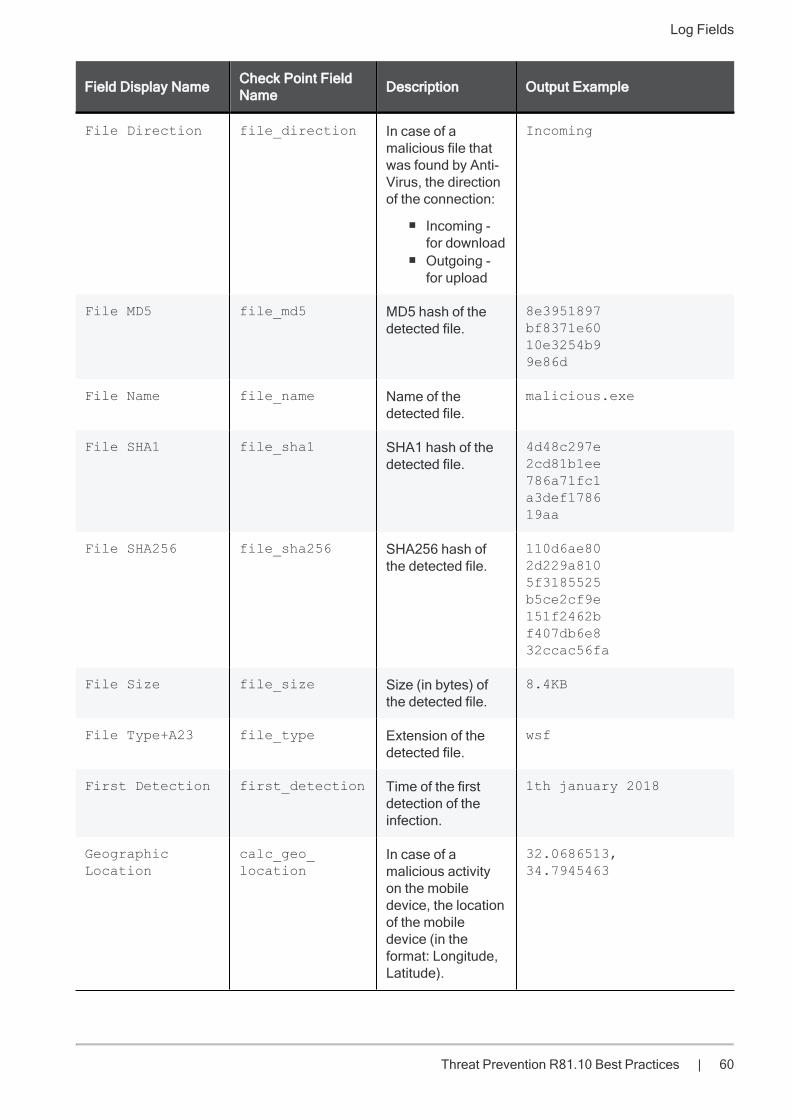
Field Display Name Check Point FieldName Description Output Example
File Direction file_direction In case of amalicious file thatwas found by Anti-Virus, the directionof the connection:
n Incoming -for download
n Outgoing -for upload
Incoming
File MD5 file_md5 MD5 hash of thedetected file.
8e3951897bf8371e6010e3254b99e86d
File Name file_name Name of thedetected file.
malicious.exe
File SHA1 file_sha1 SHA1 hash of thedetected file.
4d48c297e2cd81b1ee786a71fc1a3def178619aa
File SHA256 file_sha256 SHA256 hash ofthe detected file.
110d6ae802d229a8105f3185525b5ce2cf9e151f2462bf407db6e832ccac56fa
File Size file_size Size (in bytes) ofthe detected file.
8.4KB
File Type+A23 file_type Extension of thedetected file.
wsf
First Detection first_detection Time of the firstdetection of theinfection.
1th january 2018
GeographicLocation
calc_geo_location
In case of amalicious activityon the mobiledevice, the locationof the mobiledevice (in theformat: Longitude,Latitude).
32.0686513,34.7945463
Log Fields
Threat Prevention R81.10 Best Practices | 61
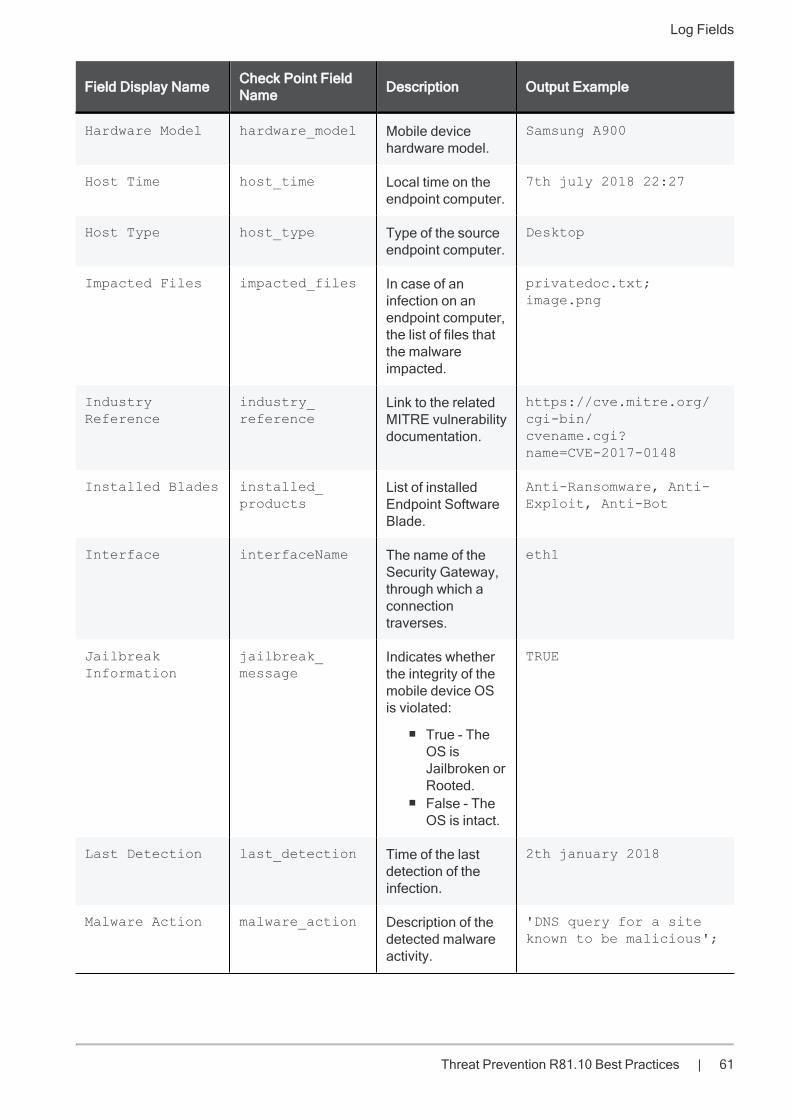
Field Display Name Check Point FieldName Description Output Example
Hardware Model hardware_model Mobile devicehardware model.
Samsung A900
Host Time host_time Local time on theendpoint computer.
7th july 2018 22:27
Host Type host_type Type of the sourceendpoint computer.
Desktop
Impacted Files impacted_files In case of aninfection on anendpoint computer,the list of files thatthe malwareimpacted.
privatedoc.txt;image.png
IndustryReference
industry_reference
Link to the relatedMITRE vulnerabilitydocumentation.
https://cve.mitre.org/cgi-bin/cvename.cgi?name=CVE-2017-0148
Installed Blades installed_products
List of installedEndpoint SoftwareBlade.
Anti-Ransomware, Anti-Exploit, Anti-Bot
Interface interfaceName The name of theSecurity Gateway,through which aconnectiontraverses.
eth1
JailbreakInformation
jailbreak_message
Indicates whetherthe integrity of themobile device OSis violated:
n True - TheOS isJailbroken orRooted.
n False - TheOS is intact.
TRUE
Last Detection last_detection Time of the lastdetection of theinfection.
2th january 2018
Malware Action malware_action Description of thedetected malwareactivity.
'DNS query for a siteknown to be malicious';

Log Fields
Threat Prevention R81.10 Best Practices | 62
Field Display Name Check Point FieldName Description Output Example
Malware Family malware_family Name of themalware related tothe malicious IOC.
Locky
MDM ID mdm_id Mobile Device IDon the MDMsystem.
4718
NetworkCertificate
network_certificate
Public key of thecertificate that wasused for SSLinterception.
example.com
Not VulnerableOS
emulated_on Emulators that didnot found the filemalicious.
Win7 64b,Office2010,Adobe 11
Origin orig Name of the firstSecurity Gatewaythat reported thisevent.
My_GW
OS Name os_name Name of the OSinstalled on thesource endpointcomputer.
Windows 7 ProfessionalN Edition
OS Version os_version Build version of theOS installed on thesource endpointcomputer.
6.1-7601-SP1.0-SMP
Packet Capture packet_capture Link to the PCAPtraffic capture filewith the recordedmaliciousconnection.
Parent ProcessMD5
parent_process_md5
MD5 hash of theparent process ofthe process thattriggered theattack.
d41d8cd98f00b204e9800998ecf8427e
Parent ProcessName
parent_process_name
Name of the parentprocess of theprocess thattriggered theattack.
cmd.exe
Log Fields
Threat Prevention R81.10 Best Practices | 63
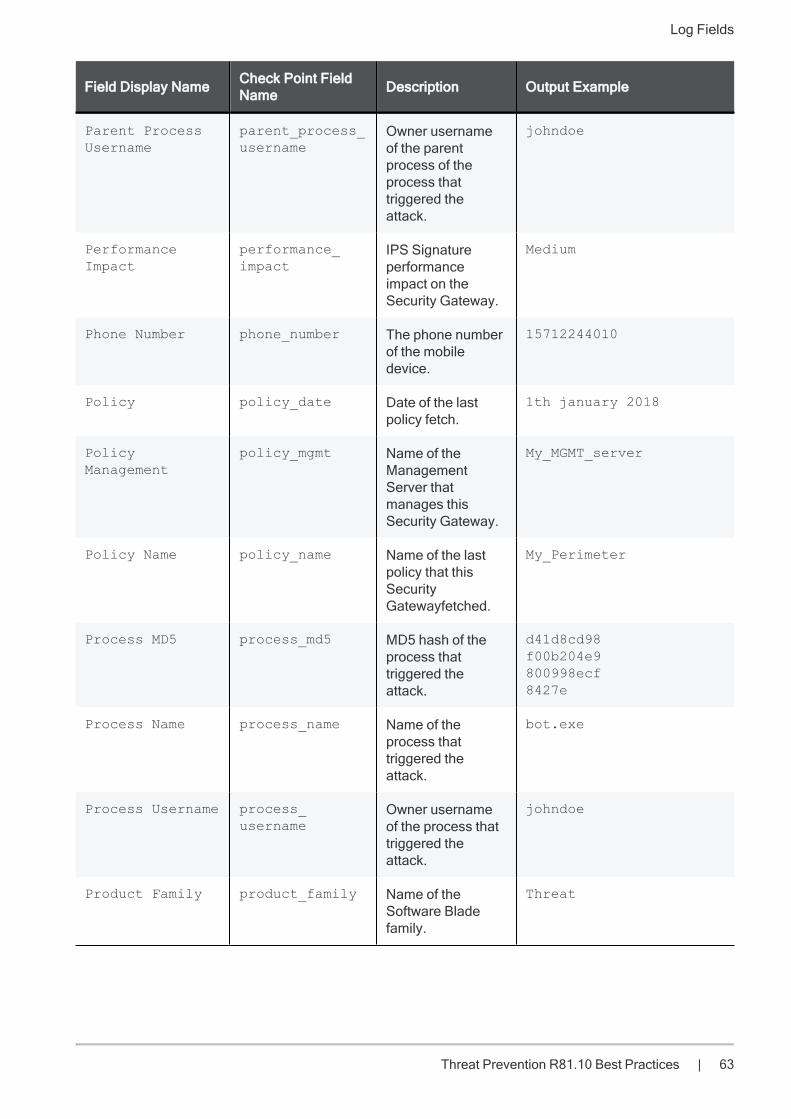
Field Display Name Check Point FieldName Description Output Example
Parent ProcessUsername
parent_process_username
Owner usernameof the parentprocess of theprocess thattriggered theattack.
johndoe
PerformanceImpact
performance_impact
IPS Signatureperformanceimpact on theSecurity Gateway.
Medium
Phone Number phone_number The phone numberof the mobiledevice.
15712244010
Policy policy_date Date of the lastpolicy fetch.
1th january 2018
PolicyManagement
policy_mgmt Name of theManagementServer thatmanages thisSecurity Gateway.
My_MGMT_server
Policy Name policy_name Name of the lastpolicy that thisSecurityGatewayfetched.
My_Perimeter
Process MD5 process_md5 MD5 hash of theprocess thattriggered theattack.
d41d8cd98f00b204e9800998ecf8427e
Process Name process_name Name of theprocess thattriggered theattack.
bot.exe
Process Username process_username
Owner usernameof the process thattriggered theattack.
johndoe
Product Family product_family Name of theSoftware Bladefamily.
Threat
Log Fields
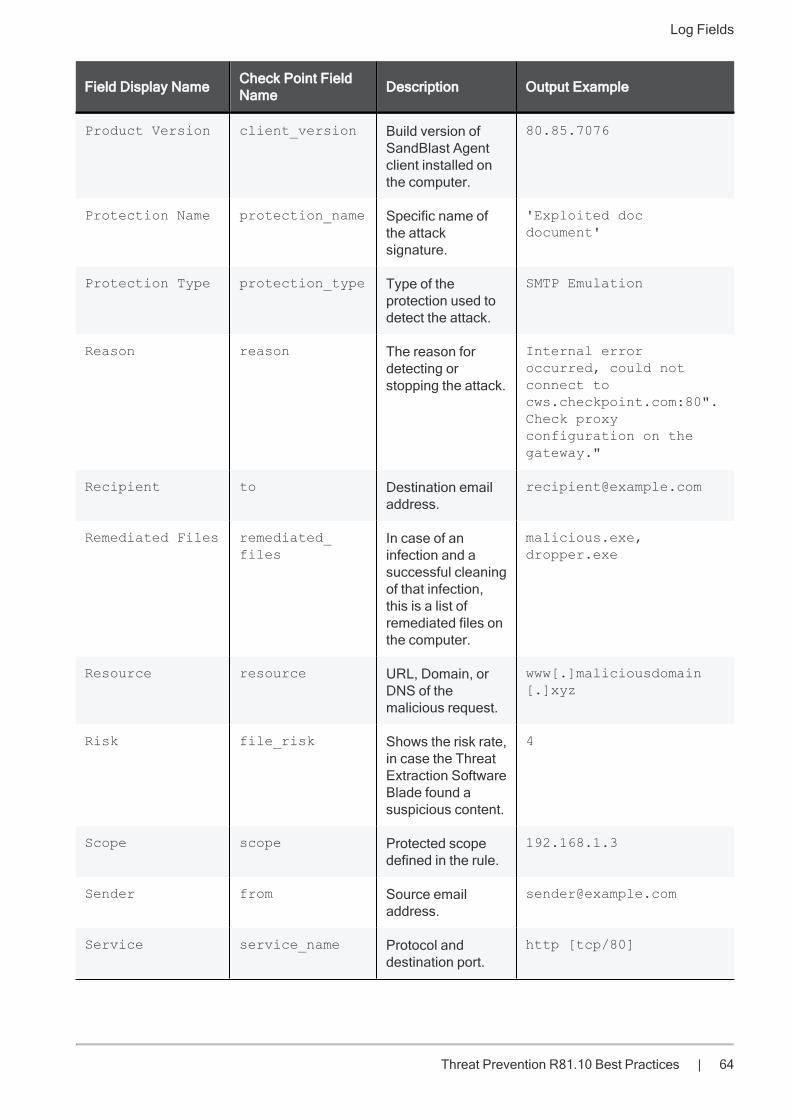
Threat Prevention R81.10 Best Practices | 64
Field Display Name Check Point FieldName Description Output Example
Product Version client_version Build version ofSandBlast Agentclient installed onthe computer.
80.85.7076
Protection Name protection_name Specific name ofthe attacksignature.
'Exploited docdocument'
Protection Type protection_type Type of theprotection used todetect the attack.
SMTP Emulation
Reason reason The reason fordetecting orstopping the attack.
Internal erroroccurred, could notconnect tocws.checkpoint.com:80".Check proxyconfiguration on thegateway."
Recipient to Destination emailaddress.
Remediated Files remediated_files
In case of aninfection and asuccessful cleaningof that infection,this is a list ofremediated files onthe computer.
malicious.exe,dropper.exe
Resource resource URL, Domain, orDNS of themalicious request.
www[.]maliciousdomain[.]xyz
Risk file_risk Shows the risk rate,in case the ThreatExtraction SoftwareBlade found asuspicious content.
4
Scope scope Protected scopedefined in the rule.
192.168.1.3
Sender from Source emailaddress.
Service service_name Protocol anddestination port.
http [tcp/80]

Log Fields
Threat Prevention R81.10 Best Practices | 65
Field Display Name Check Point FieldName Description Output Example
Severity severity Incident severitylevel based onCheck PointThreatCloud.
High
Source src Attack source IPaddress.
91.2.22.28
Source IP-phone src_phone_number
The phone numberof the sourcemobile device.
15712244010
Source Port s_port Source port of theconnection.
35125
SSID ssid The name of theWi-Fi network, incase a suspiciousor malicious eventwas found inSandBlast Mobile.
Airport_Free_Wifi
Subject subject The subject of theemail that wasinspected by CheckPoint.
invoice #43662
Suppressed logs suppressed_logs Shows the numberof maliciousconnectionattempts in a burst.Burst - A series ofrepeatedconnectionattempts within avery short timeperiod.The attemptedconnections mustall have the same:
n Sourcen Destinationn Protocol
72
SuspiciousContent
scrubbed_content
Shows the contentthat ThreatExtraction SoftwareBlade removed.
Embedded Objects:
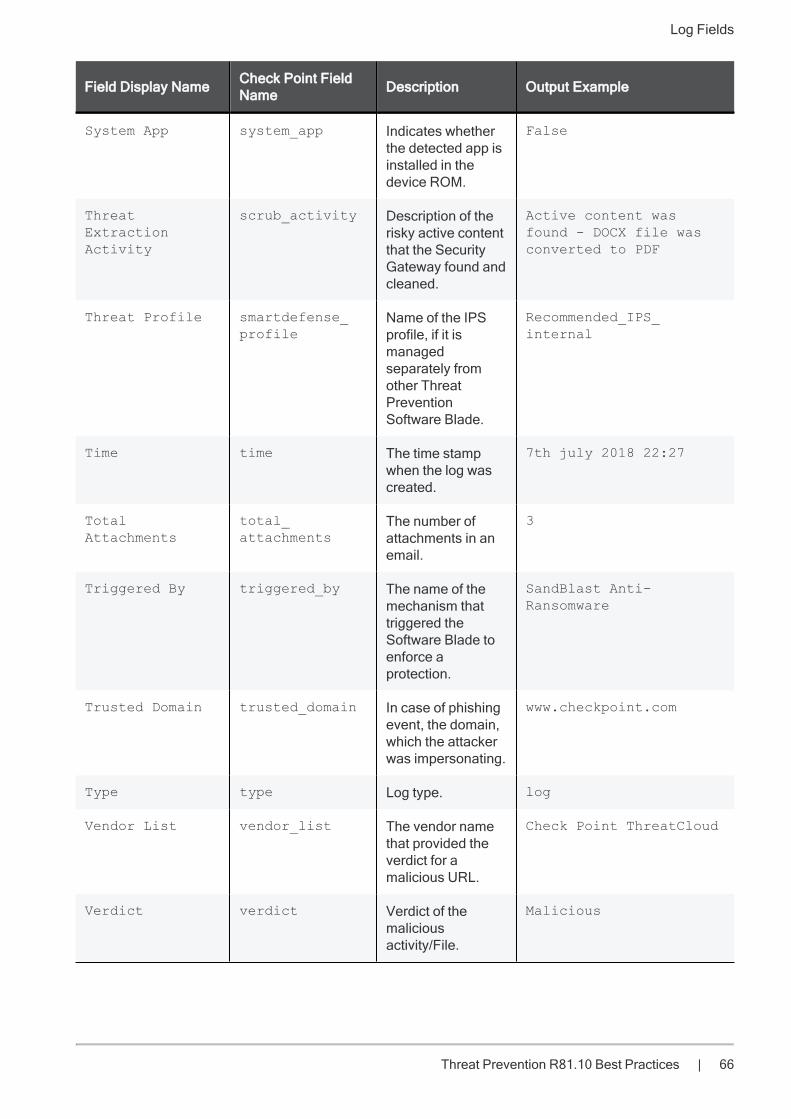
Log Fields
Threat Prevention R81.10 Best Practices | 66
Field Display Name Check Point FieldName Description Output Example
System App system_app Indicates whetherthe detected app isinstalled in thedevice ROM.
False
ThreatExtractionActivity
scrub_activity Description of therisky active contentthat the SecurityGateway found andcleaned.
Active content wasfound - DOCX file wasconverted to PDF
Threat Profile smartdefense_profile
Name of the IPSprofile, if it ismanagedseparately fromother ThreatPreventionSoftware Blade.
Recommended_IPS_internal
Time time The time stampwhen the log wascreated.
7th july 2018 22:27
TotalAttachments
total_attachments
The number ofattachments in anemail.
3
Triggered By triggered_by The name of themechanism thattriggered theSoftware Blade toenforce aprotection.
SandBlast Anti-Ransomware
Trusted Domain trusted_domain In case of phishingevent, the domain,which the attackerwas impersonating.
www.checkpoint.com
Type type Log type. log
Vendor List vendor_list The vendor namethat provided theverdict for amalicious URL.
Check Point ThreatCloud
Verdict verdict Verdict of themaliciousactivity/File.
Malicious
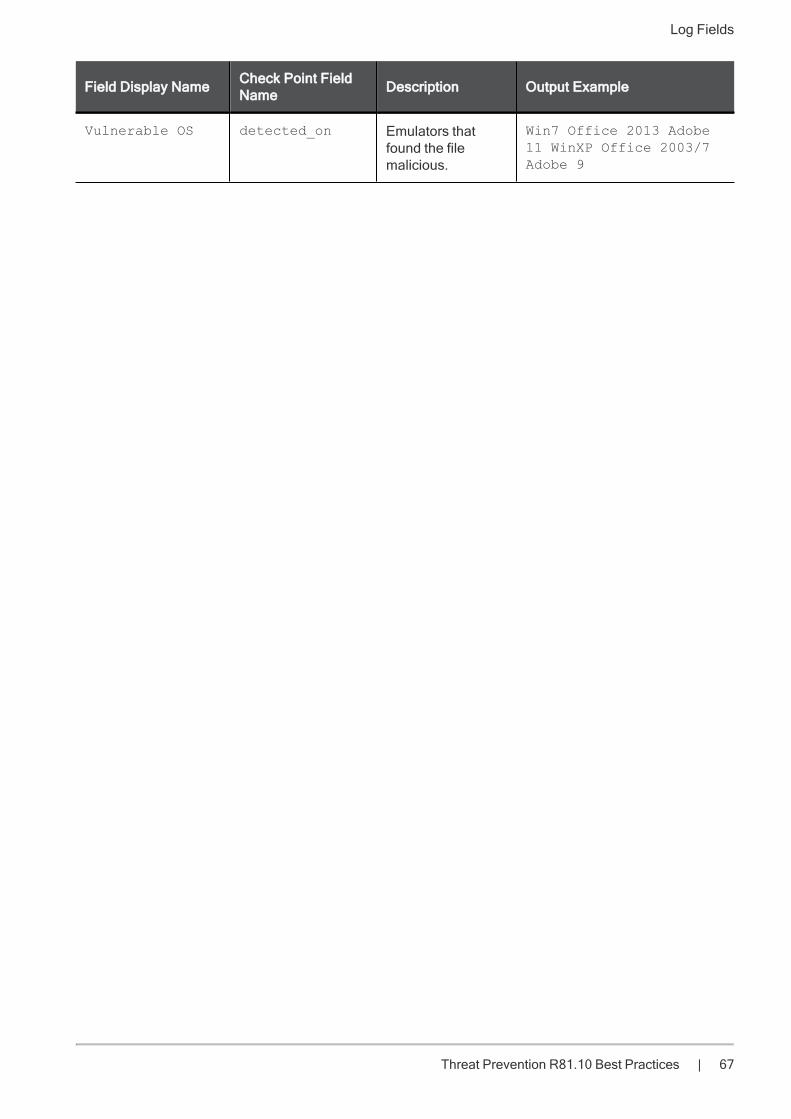
Log Fields
Threat Prevention R81.10 Best Practices | 67
Field Display Name Check Point FieldName Description Output Example
Vulnerable OS detected_on Emulators thatfound the filemalicious.
Win7 Office 2013 Adobe11 WinXP Office 2003/7Adobe 9
Appendix
Threat Prevention R81.10 Best Practices | 68
AppendixTechTalk on Check Point CheckMates Community that demonstrates how to leverage SmartEvent toimprove visibility of security events occurring in your Check Point environment:
Security Visibility Best Practices with SmartEvent
Related Documents