SORMA WEST 2008 Seung Man Yun , Chang Hwy Lim, Min Kook Cho, Ho Kyung Kim * School of Mechanical Engineering, Pusan National University, Busan 609-735, Republic of Korea Thorsten Graeve Rad-icon Imaging Corp., Belick street, Santa Clara, CA 95045-2404, USA

Welcome message from author
This document is posted to help you gain knowledge. Please leave a comment to let me know what you think about it! Share it to your friends and learn new things together.
Transcript

SORMA WEST 2008
Seung Man Yun, Chang Hwy Lim, Min Kook Cho, Ho Kyung Kim*
School of Mechanical Engineering, Pusan National University, Busan 609-735, Republic of Korea
Thorsten GraeveRad-icon Imaging Corp., Belick street, Santa Clara, CA 95045-2404, USA

SORMA WEST, June 2-5, 2008, Berkeley, CA, USA
Motivation & Objective
Experimental
Image data analysis
Modeling
Monte Carlo simulation
Results
Conclusion
Contents
2
SORMA WEST, June 2-5, 2008, Berkeley, CA, USA
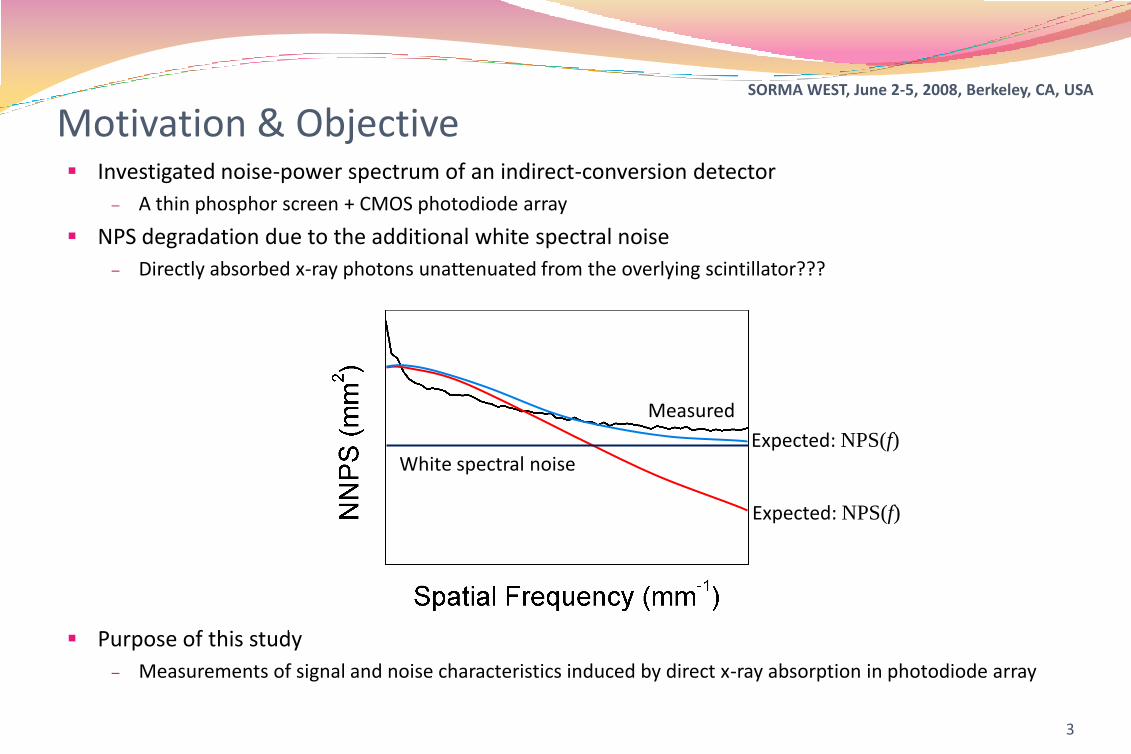
Motivation & Objective Investigated noise-power spectrum of an indirect-conversion detector
– A thin phosphor screen + CMOS photodiode array
NPS degradation due to the additional white spectral noise
– Directly absorbed x-ray photons unattenuated from the overlying scintillator???
Purpose of this study
– Measurements of signal and noise characteristics induced by direct x-ray absorption in photodiode array
3
Expected: NPS(f)
Measured
White spectral noiseExpected: NPS(f)

SORMA WEST, June 2-5, 2008, Berkeley, CA, USA
Experimental (1/3) Detector preparation
– Photodiode arrays manufactured by CMOS process (Rad-icon Imaging Corp., USA)
4
RadEyeTM
Phosphor screenRad-icon RadEye1TM
Array format 512 × 1024 pixels
Pixel pitch 48 mm
Field of view 25 × 50 mm2
Dynamic range 85 dB (>14 bits)
ADC bit-depth 12 bits
Pixel fill factor 0.87
Saturation 2,800,000 electrons
Dark current (each pixel) < 104 electrons/sec
Read Noise (at 1 fps) < 200 electrons
SORMA WEST, June 2-5, 2008, Berkeley, CA, USA
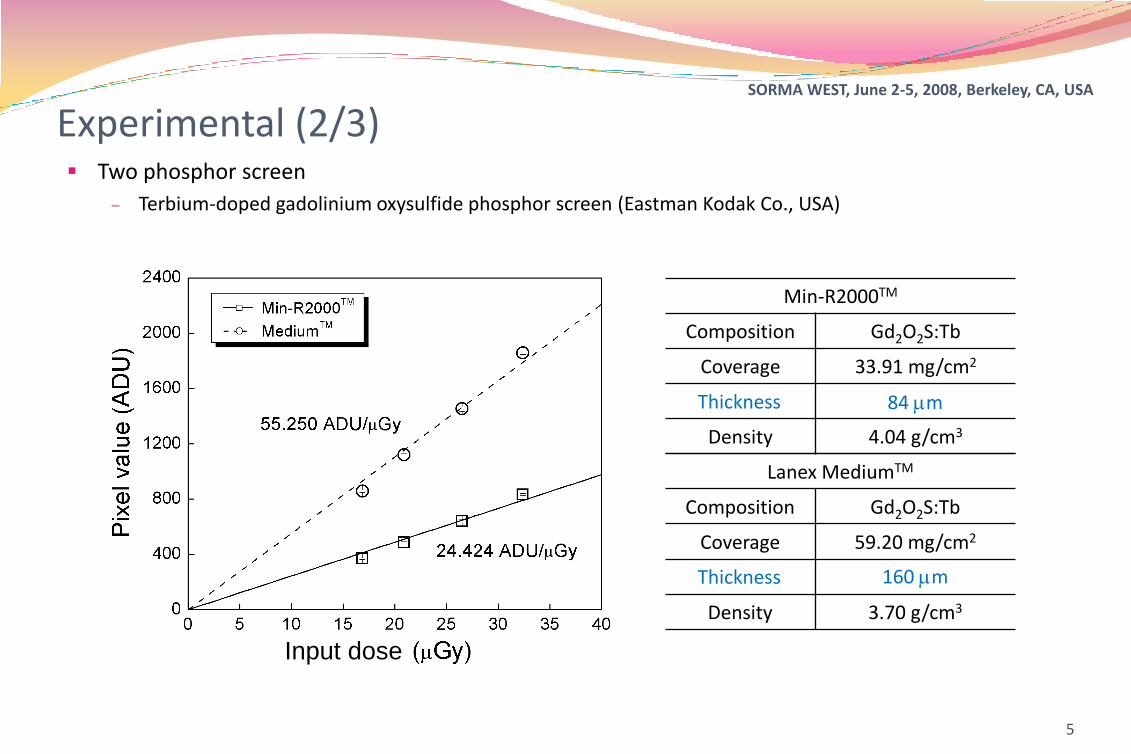
Experimental (2/3) Two phosphor screen
– Terbium-doped gadolinium oxysulfide phosphor screen (Eastman Kodak Co., USA)
5
Min-R2000TM
Composition Gd2O2S:Tb
Coverage 33.91 mg/cm2
Thickness 84 mm
Density 4.04 g/cm3
Lanex MediumTM
Composition Gd2O2S:Tb
Coverage 59.20 mg/cm2
Thickness 160 mm
Density 3.70 g/cm3
Thickness
Thickness
84 mm
160 mm
Input dose
SORMA WEST, June 2-5, 2008, Berkeley, CA, USA
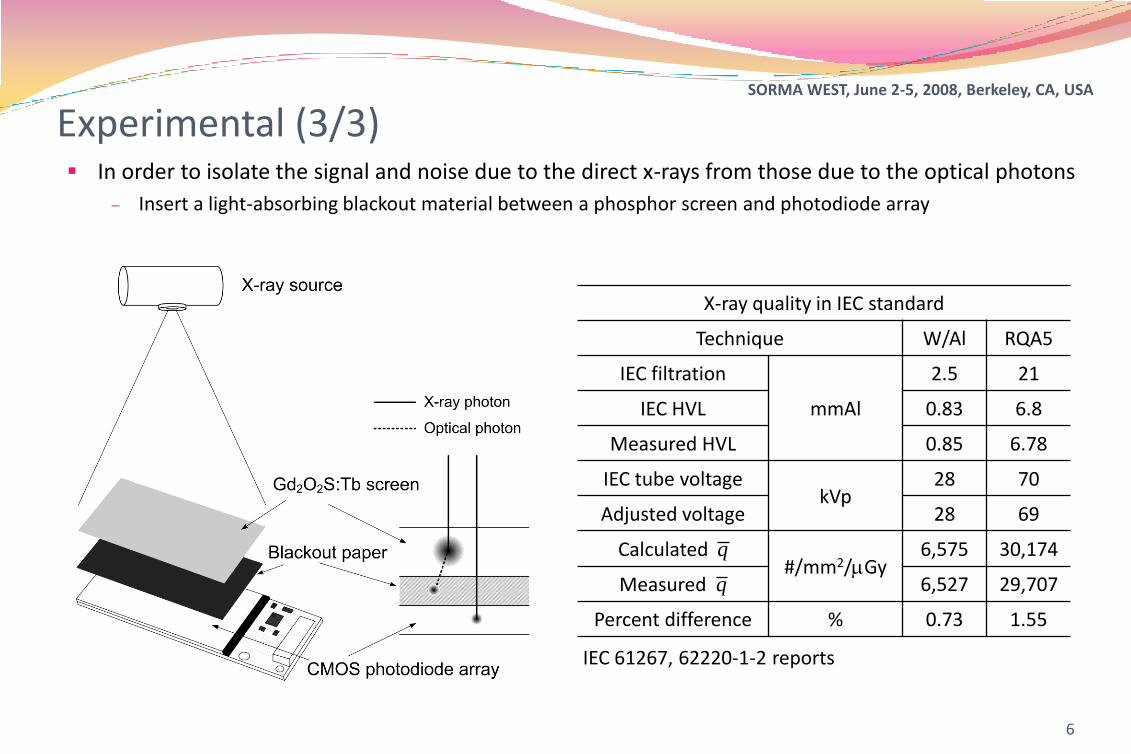
X-ray quality in IEC standard
Technique W/Al RQA5
IEC filtration
mmAl
2.5 21
IEC HVL 0.83 6.8
Measured HVL 0.85 6.78
IEC tube voltagekVp
28 70
Adjusted voltage 28 69
Calculated q#/mm2/mGy
6,575 30,174
Measured q 6,527 29,707
Percent difference % 0.73 1.55
In order to isolate the signal and noise due to the direct x-rays from those due to the optical photons
– Insert a light-absorbing blackout material between a phosphor screen and photodiode array
Experimental (3/3)
6
IEC 61267, 62220-1-2 reports
SORMA WEST, June 2-5, 2008, Berkeley, CA, USA
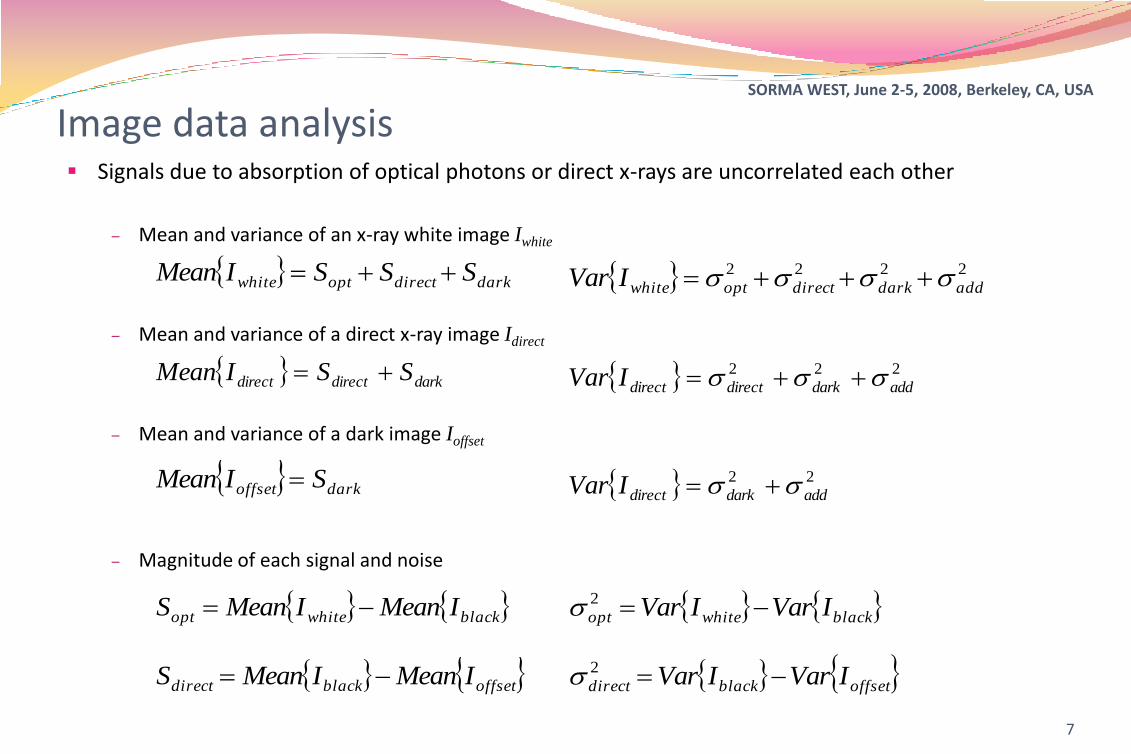
Image data analysis Signals due to absorption of optical photons or direct x-rays are uncorrelated each other
– Mean and variance of an x-ray white image Iwhite
– Mean and variance of a direct x-ray image Idirect
– Mean and variance of a dark image Ioffset
– Magnitude of each signal and noise
7
darkdirectoptwhite SSSIMean
blackwhiteopt IMeanIMeanS
offsetblackdirect IMeanIMeanS
2222
adddarkdirectoptwhiteIVar
blackwhiteopt IVarIVar 2
offsetblackdirect IVarIVar 2
darkdirectdirect SSIMean 222
adddarkdirectdirectIVar
darkoffset SIMean 22
adddarkdirectIVar
SORMA WEST, June 2-5, 2008, Berkeley, CA, USA
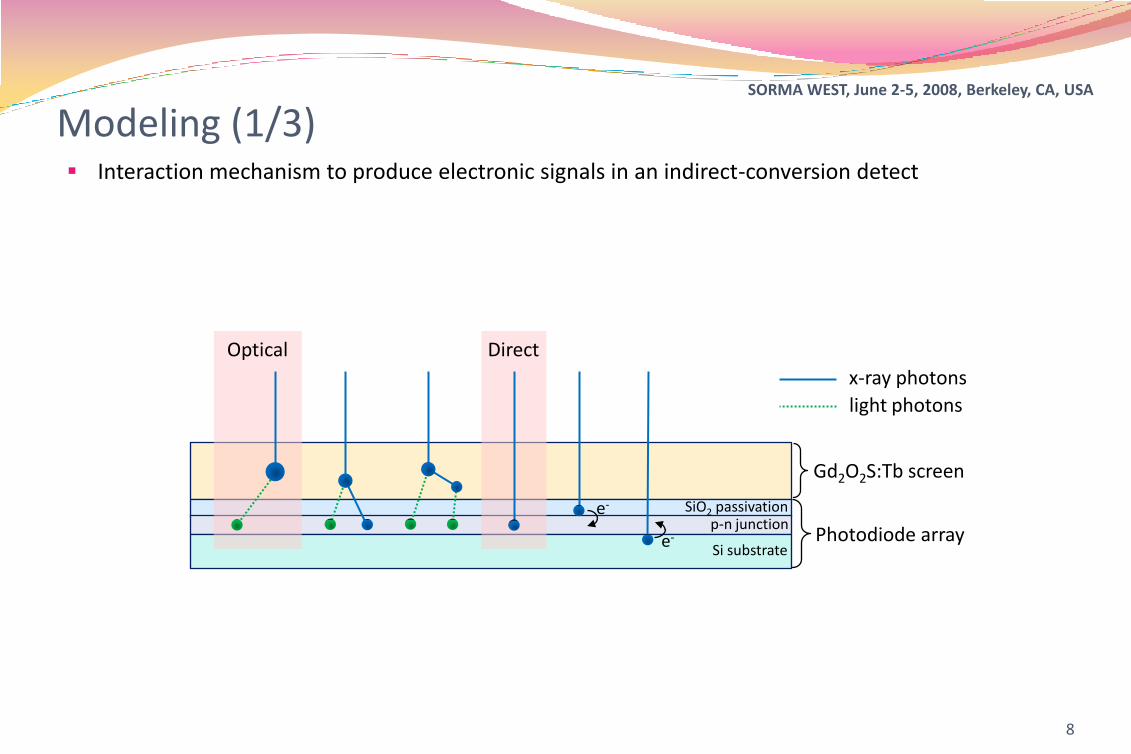
Interaction mechanism to produce electronic signals in an indirect-conversion detect
Modeling (1/3)
8
Optical Direct
Gd2O2S:Tb screen
Photodiode array
e-
e-
x-ray photons
light photons
SiO2 passivationp-n junction
Si substrate

SORMA WEST, June 2-5, 2008, Berkeley, CA, USA
Modeling signal and noise characteristics using the cascaded linear-systems theory
Modeling (2/3)
9
Cascaded model due to the optical photon
Cascaded model due to the direct x-ray absorption
H. K. Kim, "Generalized cascaded model to assess noise transfer in scintillator-based x-ray imaging detectors," Appl. Phys. Lett., vol. 89, iss. 23, pp. 233504-1–233504-3, 2006.

SORMA WEST, June 2-5, 2008, Berkeley, CA, USA
Cascaded model due to the optical photon
Cascaded model due to the direct x-ray absorption
Modeling (3/3)
10
pdscnscnopt aqn γβα2
pdpdscndirect aqn βα)α1(2
1
βγ1γβαδ 22
scn
scnpdpdscnscnopt
Iaq
pd
pdpdscn
directI
aq 22
2β)αα(1
δ
Notations
n mean number of electrons
d2 Variance
q average incident x-ray fluence
a photodiode aperture size
a quantum absorption efficiency
b mean gain of secondary quanta
gpd quantum efficiency of photodiode
I Swank or statistical factor
scn in phosphor screen
pd in photodiode array
SORMA WEST, June 2-5, 2008, Berkeley, CA, USA
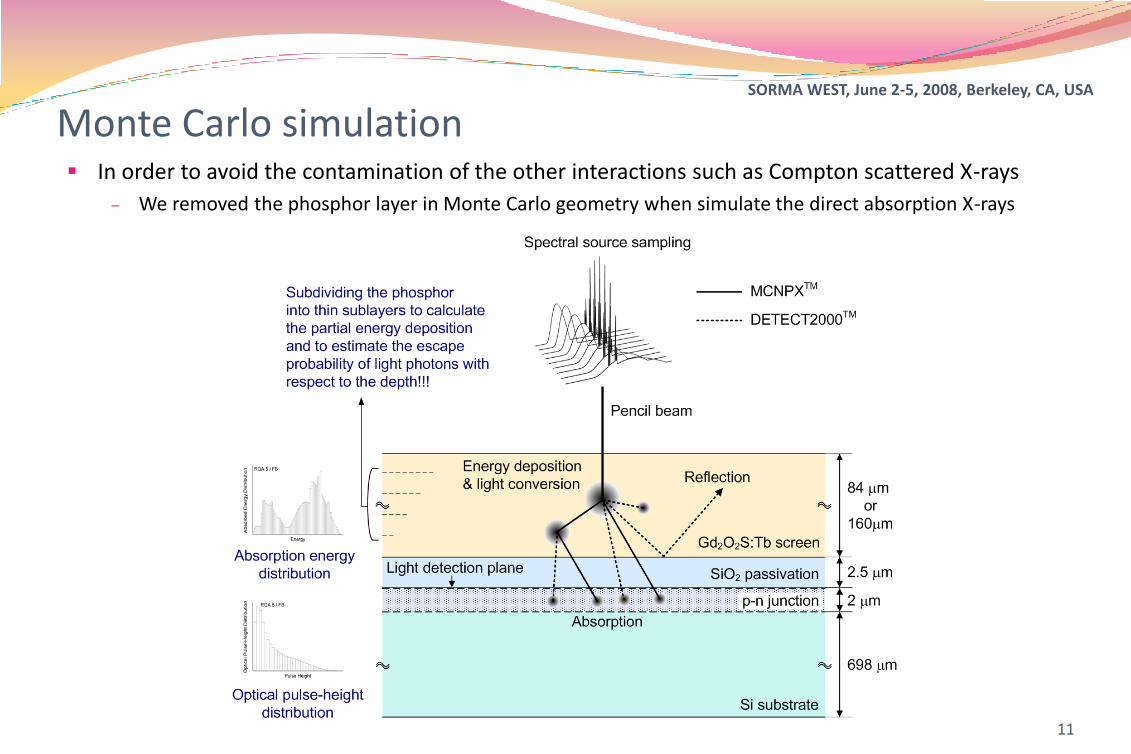
Monte Carlo simulation In order to avoid the contamination of the other interactions such as Compton scattered X-rays
– We removed the phosphor layer in Monte Carlo geometry when simulate the direct absorption X-rays
11
SORMA WEST, June 2-5, 2008, Berkeley, CA, USA
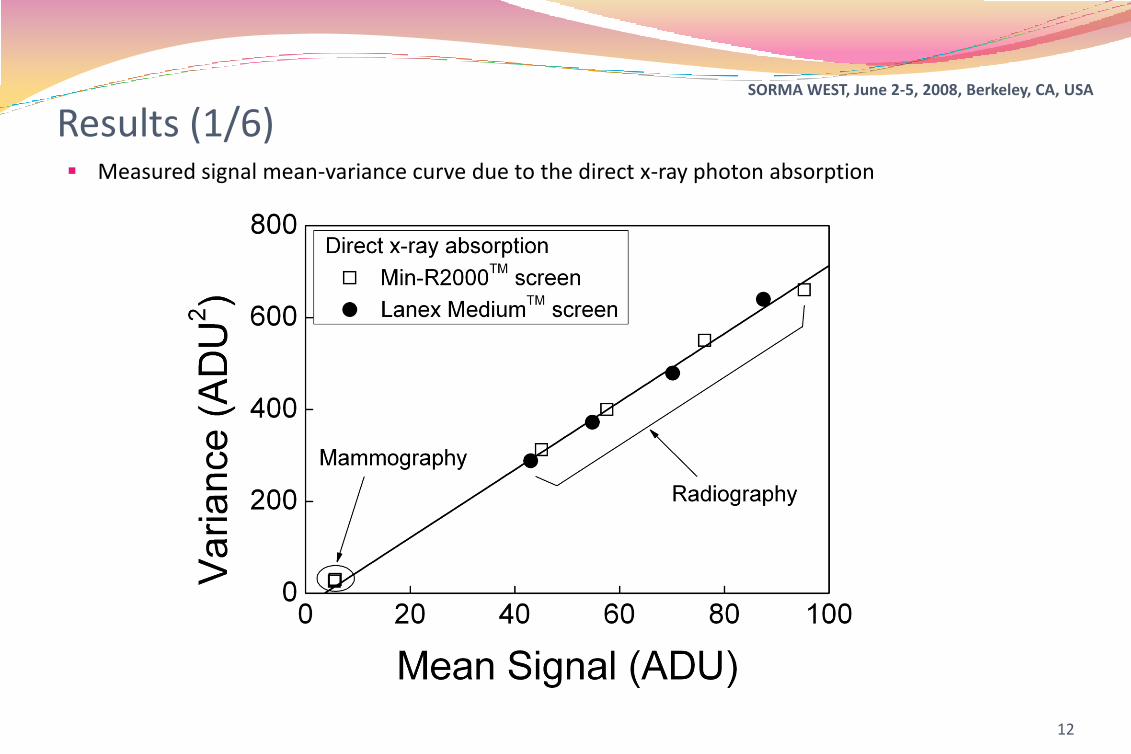
Results (1/6) Measured signal mean-variance curve due to the direct x-ray photon absorption
12
SORMA WEST, June 2-5, 2008, Berkeley, CA, USA
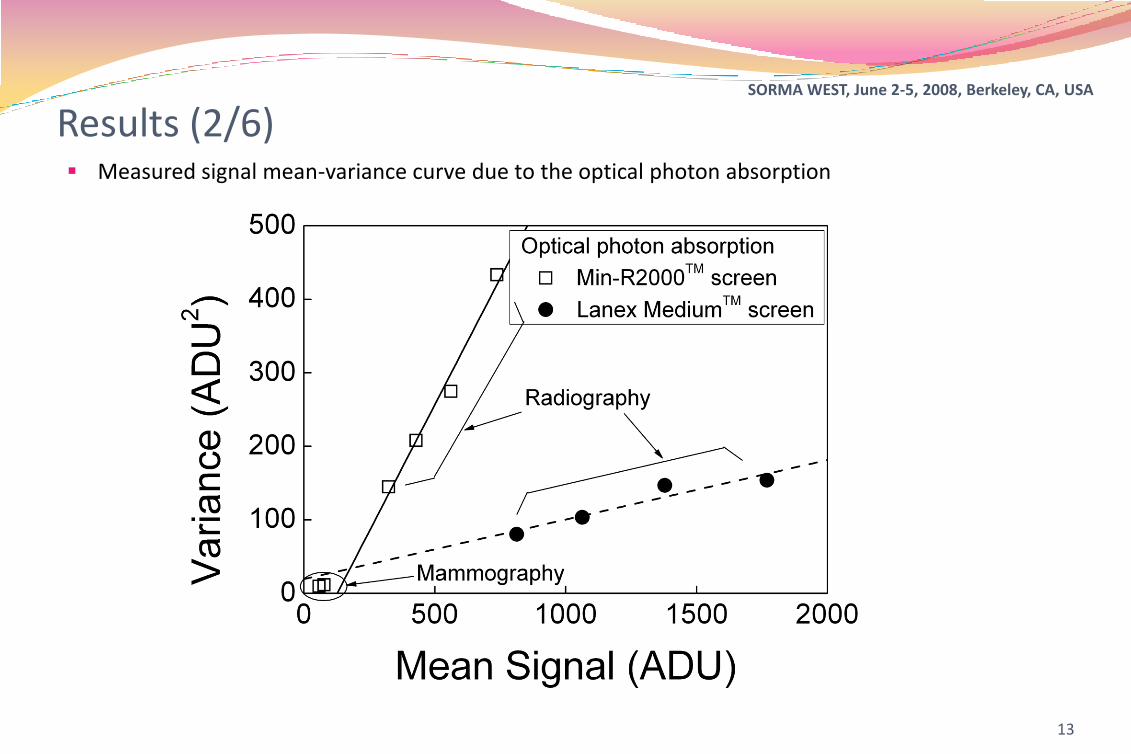
Results (2/6) Measured signal mean-variance curve due to the optical photon absorption
13
SORMA WEST, June 2-5, 2008, Berkeley, CA, USA
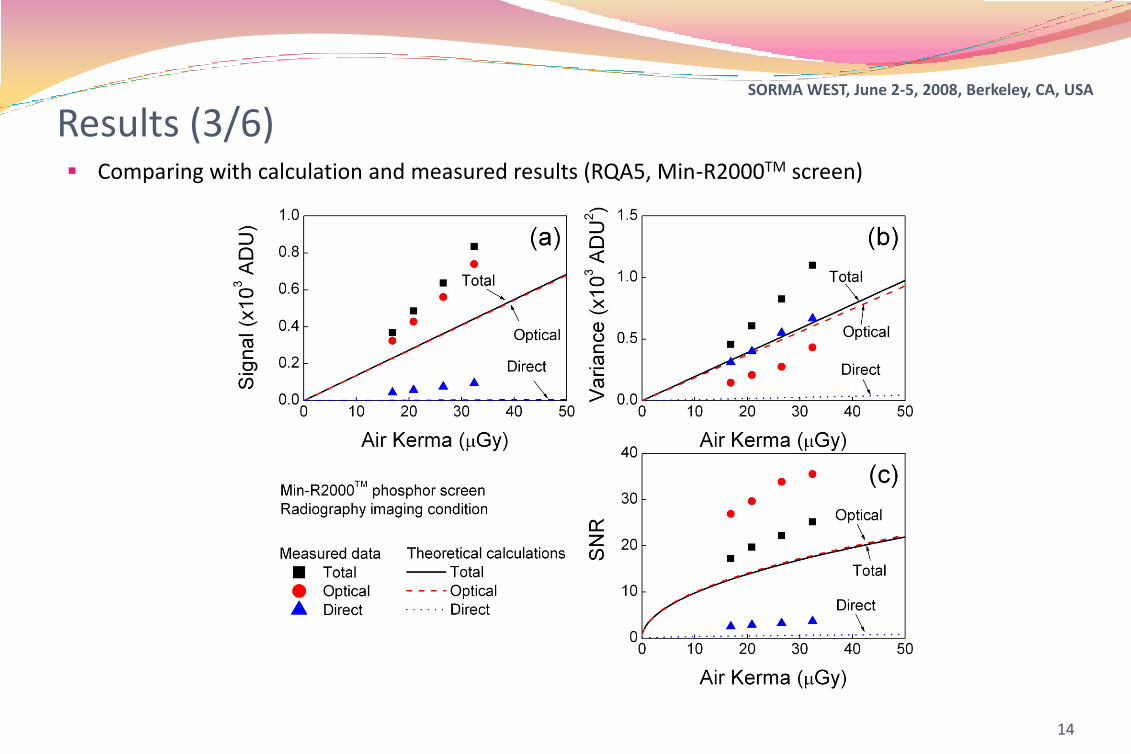
Results (3/6) Comparing with calculation and measured results (RQA5, Min-R2000TM screen)
14
SORMA WEST, June 2-5, 2008, Berkeley, CA, USA
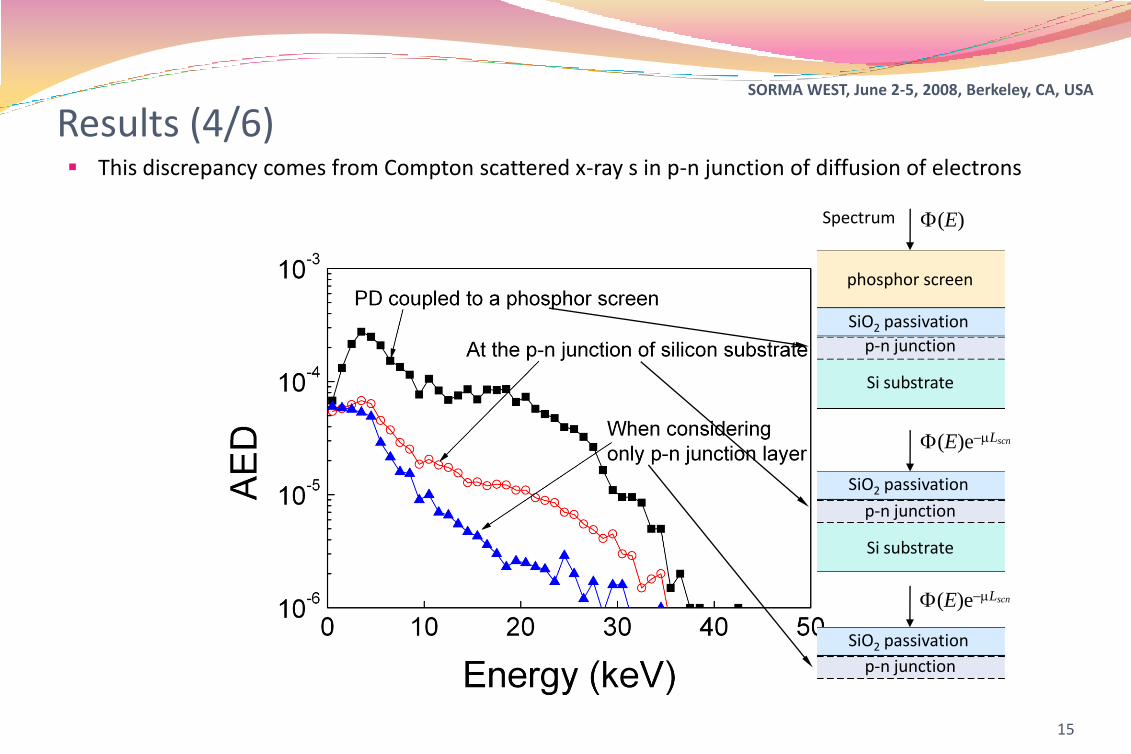
Results (4/6) This discrepancy comes from Compton scattered x-ray s in p-n junction of diffusion of electrons
15
phosphor screen
SiO2 passivation
p-n junction
Si substrate
SiO2 passivation
p-n junction
Si substrate
SiO2 passivation
p-n junction
Spectrum F(E)
F(E)emLscn
F(E)emLscn
SORMA WEST, June 2-5, 2008, Berkeley, CA, USA
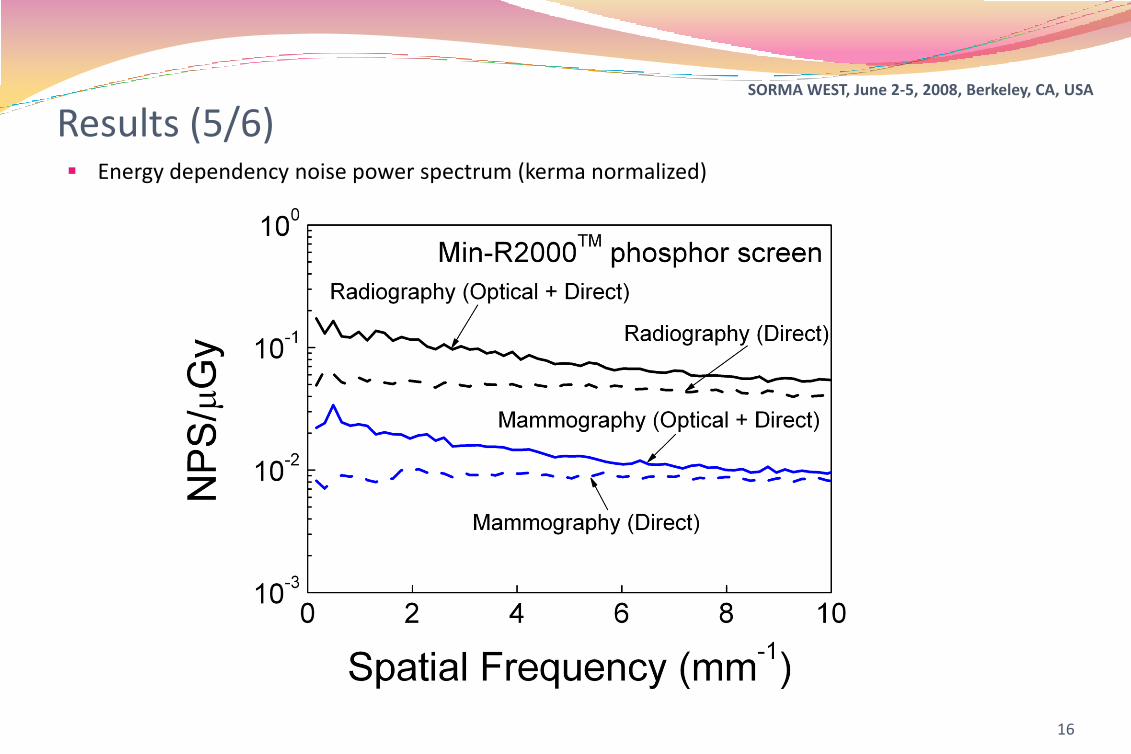
Results (5/6) Energy dependency noise power spectrum (kerma normalized)
16
SORMA WEST, June 2-5, 2008, Berkeley, CA, USA
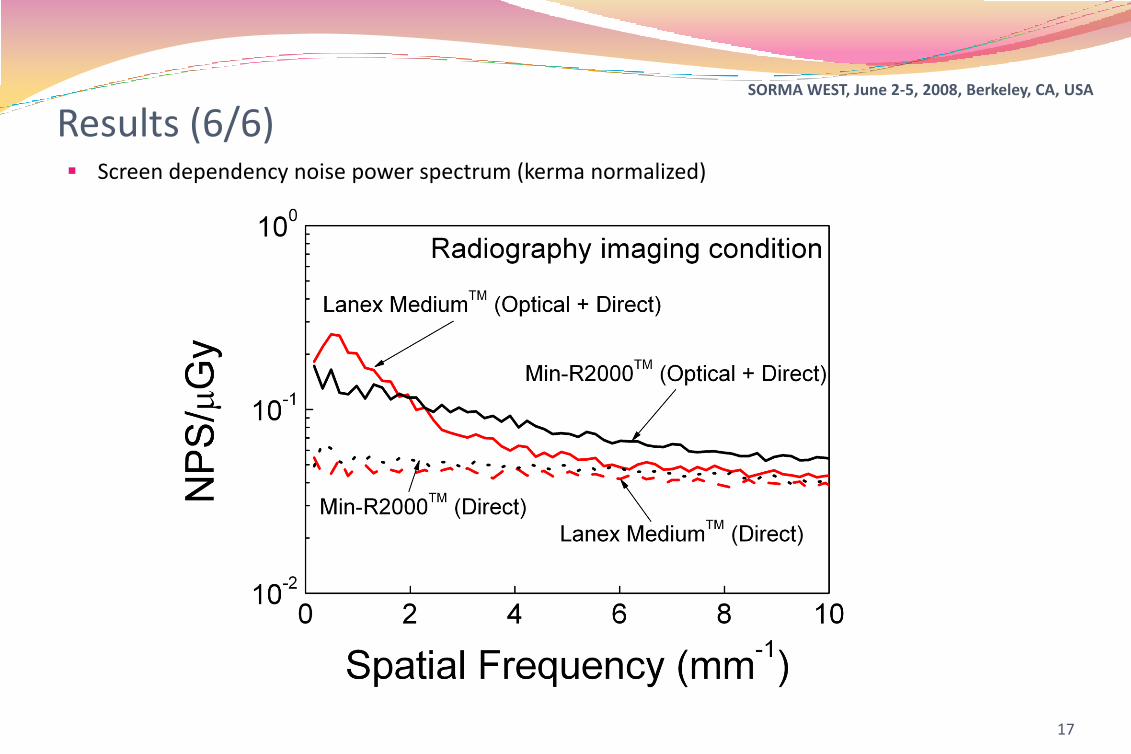
Results (6/6) Screen dependency noise power spectrum (kerma normalized)
17
SORMA WEST, June 2-5, 2008, Berkeley, CA, USA
Conclusion
From the measurement results
– Although the magnitude of direct signal is small, but its variance is considerably large
– It gives rise to the reduction of signal-to-noise ratio
From the theoretical estimation
– The effect of direct x-ray absorption is negligible in radiographic imaging condition
Main cause of the degradation in noise characteristics and thus the reduction of SNR is not by the direct x-rays but by the other sources
– such as the Compton scattered x-rays from a phosphor screen
It should be noted that the magnitude of signal and noise due to the direct x-ray absorption is considerable in mammographic imaging condition (PE is dominant process in this condition)
18

SORMA WEST, June 2-5, 2008, Berkeley, CA, USA
Fin.
19

SORMA WEST, June 2-5, 2008, Berkeley, CA, USA
Results (1/6)
20
Measured signal and noise magnitudes with respect to the optical and direct x-ray photons
X-rayquality
Phosphorscreen
Kerma(mGy)
Signal (ADU) Variance (ADU2)
optical direct optical direct
W/Al Min-R20008.8 58.328 ± 0.448 5.495 ± 0.280 9.772 ± 2.198 23.580 ± 1.248
11.2 77.116 ± 0.502 5.649 ± 0.195 11.474 ± 1.660 30.391 ± 1.102
Slope (ADU/mGy or ADU2/mGy) 6.728 ± 0.190 0.565 ± 0.087 1.061 ± 0.057 2.686 ± 0.024
RQA5 Min-R2000
16.9 323.851 ± 8.554 45.081 ± 3.594 144.770 ± 20.694 312.464 ± 19.120
20.9 428.108 ± 5.038 57.548 ± 2.950 207.951 ± 9.270 400.229 ± 10.165
26.5 561.390 ± 15.065 76.220 ± 1.186 274.729 ± 22.456 550.722 ± 18.609
32.4 737.061 ± 8.939 95.273 ± 1.312 433.184 ± 10.615 660.602 ± 14.136
Slope (ADU/mGy or ADU2/mGy) 20.921 ± 1.510 2.813 ± 0.122 10.568 ± 2.012 19.772 ± 1.099
RQA5 Medium
16.9 813.002 ± 9.988 43.005 ± 0.356 80.226 ± 10.357 288.343 ± 4.900
20.9 1063.376 ± 8.598 54.812 ± 0.412 103.279 ± 13.148 372.294 ± 4.920
26.5 1378.908 ± 19.373 70.117 ± 0.681 146.894 ± 6.326 479.240 ± 11.816
32.4 1769.243 ± 13.073 87.467 ± 1.179 153.691 ± 22.018 639.821 ± 19.715
Slope (ADU/mGy or ADU2/mGy) 51.485 ± 2.710 2.631 ± 0.064 4.953 ± 0.423 18.213 ± 1.159
SORMA WEST, June 2-5, 2008, Berkeley, CA, USA
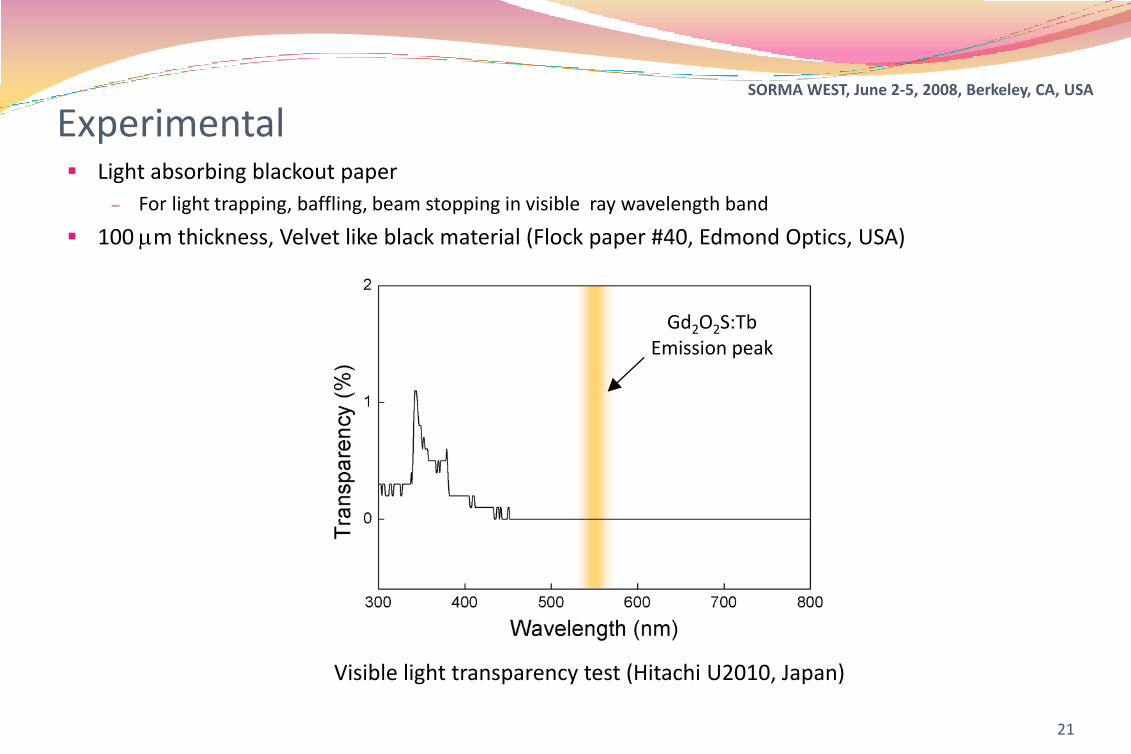
Light absorbing blackout paper
– For light trapping, baffling, beam stopping in visible ray wavelength band
100 mm thickness, Velvet like black material (Flock paper #40, Edmond Optics, USA)
Experimental
21
Visible light transparency test (Hitachi U2010, Japan)
Gd2O2S:TbEmission peak
Related Documents