Received October 19, 2010 / Accepted November 10, 2010 J. Technol. Manag. Innov. 2010, Volume 5, Issue 4 _________________________________________________________________________________ ISSN: 0718-2724. (http://www.jotmi.org) Journal of Technology Management & Innovation © Universidad Alberto Hurtado, Facultad de Economía y Negocios Third-Generation Display Technology: Nominally Transparent Material Charles Willow 1 Abstract Display technology is reshaping the consumer, business, government, and even not-for-profit markets in the midst of the digital convergence, coupled with recent smart phones led by Apple, Inc. First-Generation (1G) display technology was dominated by the Cathode Ray Tubes, followed by Liquid Crystal Display and Plasma in 2G. A radically innovative shift as a disruptive technology is expected to follow in 3G to utilize virtually any transparent material, which wirelessly connects to portable access points. This paper studies the feasibility of the 3G Display Technology (DT) with Technology S-Curves, and presents possible business models and technology strategies which may be generated from it. Additional subsets of business models may be derived for a wide range of industry applications. Keywords: display technology; sisruptive technology; radical innovation; technology S-Curve; business model; technology strategy; Liquid Crystal Display; Light Emitting Diode; plasma display; wireless network; access point; glass technology; management of technology; management information systems. 1 Management Information Systems & Management of Technology. Department of Management and Marketing. Leon Hess Business School. The Monmouth University. 400 Cedar Avenue, West Long Branch, NJ 07764-1898, USA. Tel.: (732) 571-3664, Fax: (732) 263-5128. E-mail: [email protected]

Welcome message from author
This document is posted to help you gain knowledge. Please leave a comment to let me know what you think about it! Share it to your friends and learn new things together.
Transcript

Received October 19, 2010 / Accepted November 10, 2010 J. Technol. Manag. Innov. 2010, Volume 5, Issue 4
_________________________________________________________________________________
ISSN: 0718-2724. (http://www.jotmi.org) Journal of Technology Management & Innovation © Universidad Alberto Hurtado, Facultad de Economía y Negocios
Third-Generation Display Technology: Nominally Transparent Material
Charles Willow1
Abstract
Display technology is reshaping the consumer, business, government, and even not-for-profit markets in the midst of the digital convergence, coupled with recent smart phones led by Apple, Inc.
First-Generation (1G) display technology was dominated by the Cathode Ray Tubes, followed by Liquid Crystal Display and Plasma in 2G. A radically innovative shift as a disruptive technology is expected to follow in 3G to utilize virtually any transparent material, which wirelessly connects to portable access points.
This paper studies the feasibility of the 3G Display Technology (DT) with Technology S-Curves, and presents possible business models and technology strategies which may be generated from it. Additional subsets of business models may be derived for a wide range of industry applications.
Keywords: display technology; sisruptive technology; radical innovation; technology S-Curve; business model; technology strategy; Liquid Crystal Display; Light Emitting Diode; plasma display; wireless network; access point; glass technology; management of technology; management information systems.
1 Management Information Systems & Management of Technology. Department of Management and Marketing. Leon Hess Business School. The Monmouth University. 400 Cedar Avenue, West Long Branch, NJ 07764-1898, USA. Tel.: (732) 571-3664, Fax: (732) 263-5128. E-mail: [email protected]
J. Technol. Manag. Innov. 2010, Volume 5, Issue 4
ISSN: 0718-2724. (http://www.jotmi.org) 109 Journal of Technology Management & Innovation © Universidad Alberto Hurtado, Facultad de Economía y Negocios
I. Introduction
Technology, by far, has been one of the major drivers for reshaping the value blueprint (i.e. business model) of corporate businesses. Since the early 1990’s, virtual technology, led primarily by Information Technology (IT) has produced a major impact on many businesses, until recently hybrid technology such as Bio Technology (BT) has rapidly replaced the IT in terms of business-model demographics. Engineering-oriented tangible technology culminated from the post-World War II to the 80’s.
Today, considerable proportion of the business profits are accrued from a number of embedded technologies, in which a clear borderline of the three major technologies aforementioned no longer exists. For example, the automobile industry is no longer restricted to the confines of the tangible mechanical technology. Instead, it strives to improve its market value of its product by coupling it with virtual IT. Embedded automobile technologies, comprising Unmanned Intelligent Vehicles (UIV), Collision Warning System (CWS), Intelligent Parking System (IPS), Blind-spot Monitoring System (BMS), and Anti-lock Brake System
(ABS) (viz. mechatronics and IT) are quickly becoming the norm.
The (business) rationale behind seeking embedded technology is to maximize the profit by building complex value chains of different technologies simultaneously. Moreover, many embedded technologies themselves at times undergo a series of disruptive changes either through supply-driven technology push or consumer-driven demand pull. Technology disruption occurs, when, despite its inferior performance on focal attributes in the beginning, the new technology eventually in the long run displaces the mainstream technology from the mainstream market (Adner, 2001, 2002; Adner et al., 2005). A technology, thus, may be disruptive in the uni-dimensional hyperplane of a performance attribute when component innovation (Christensen, 1992a) takes place, or when multi-dimensional hyplanes of performance attributes are associated within the architectural innovation (Christensen, 1992b).
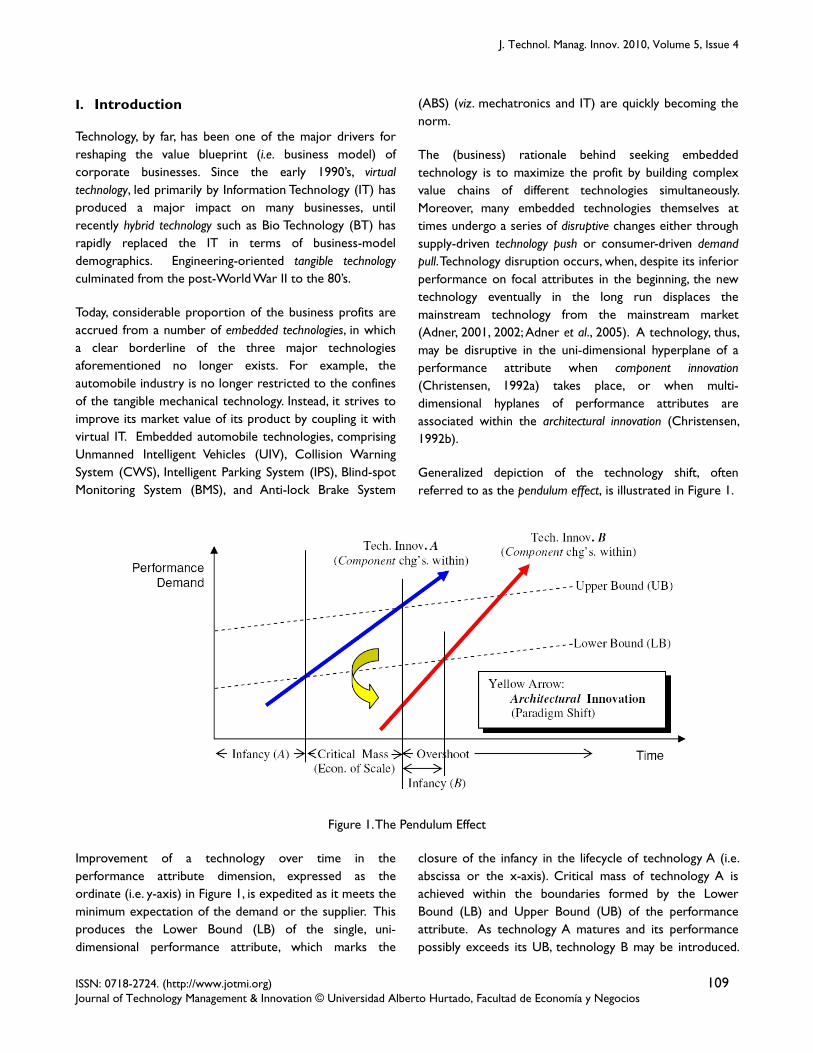
Generalized depiction of the technology shift, often referred to as the pendulum effect, is illustrated in Figure 1.
Figure 1. The Pendulum Effect
Improvement of a technology over time in the performance attribute dimension, expressed as the ordinate (i.e. y-axis) in Figure 1, is expedited as it meets the minimum expectation of the demand or the supplier. This produces the Lower Bound (LB) of the single, uni-dimensional performance attribute, which marks the
closure of the infancy in the lifecycle of technology A (i.e. abscissa or the x-axis). Critical mass of technology A is achieved within the boundaries formed by the Lower Bound (LB) and Upper Bound (UB) of the performance attribute. As technology A matures and its performance possibly exceeds its UB, technology B may be introduced.
J. Technol. Manag. Innov. 2010, Volume 5, Issue 4
ISSN: 0718-2724. (http://www.jotmi.org) 110 Journal of Technology Management & Innovation © Universidad Alberto Hurtado, Facultad de Economía y Negocios
The entire process closely resembles the repeated movements of the pendulum to and fro, until the technology completely retires from the market.
In Figure 1, if technology B displaces technology A, then B is specified as disruptive. Notice, however, that both technologies A and B were bound to a uni-dimension of its performance attribute, implying the shift – whether or not it was disruptive – was a result of a classical component-
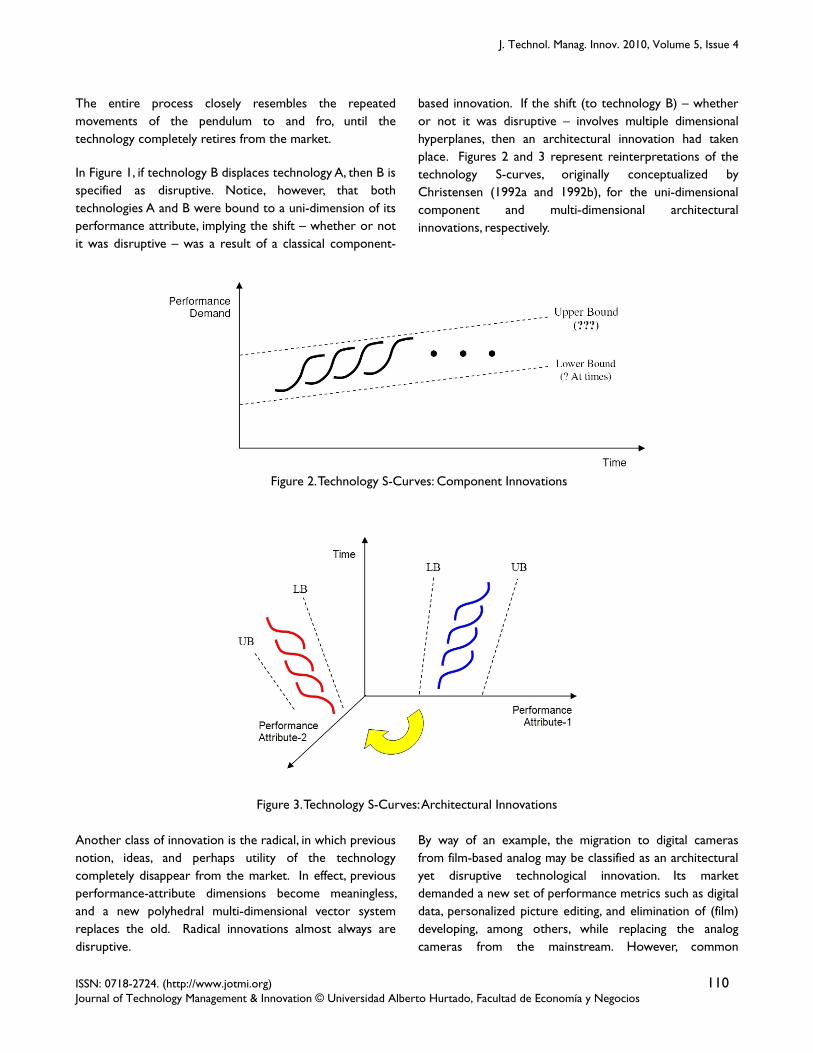
based innovation. If the shift (to technology B) – whether or not it was disruptive – involves multiple dimensional hyperplanes, then an architectural innovation had taken place. Figures 2 and 3 represent reinterpretations of the technology S-curves, originally conceptualized by Christensen (1992a and 1992b), for the uni-dimensional component and multi-dimensional architectural innovations, respectively.
Figure 2. Technology S-Curves: Component Innovations
Figure 3. Technology S-Curves: Architectural Innovations
Another class of innovation is the radical, in which previous notion, ideas, and perhaps utility of the technology completely disappear from the market. In effect, previous performance-attribute dimensions become meaningless, and a new polyhedral multi-dimensional vector system replaces the old. Radical innovations almost always are disruptive.
By way of an example, the migration to digital cameras from film-based analog may be classified as an architectural yet disruptive technological innovation. Its market demanded a new set of performance metrics such as digital data, personalized picture editing, and elimination of (film) developing, among others, while replacing the analog cameras from the mainstream. However, common

J. Technol. Manag. Innov. 2010, Volume 5, Issue 4
ISSN: 0718-2724. (http://www.jotmi.org) 111 Journal of Technology Management & Innovation © Universidad Alberto Hurtado, Facultad de Economía y Negocios
(performance/functional) attributes comprised of picture taking, personal pleasure, etc. remained intact. That is, displacement of the general as well as conceptual utility of the camera for consumers was not brought forth by the technological shift. Further, a considerable number of consumers, nevertheless, prefer the film-based analog camera. Examples of component innovations for the digital camera include the enhancement of pixel matrices as well as their quality, data compression ratio, portability, water proofs, durability, power consumption, and so forth.
Radical innovation, on the other hand, might revolutionize the complete set of consumer utility for a technology. For example, there are a plethora of portable storage device options for Information Technology (IT), ranging from
widely popular USB stick/jump drives to passport-sized Hard Drive Disks (HDD). A radical innovation (for data storage device) is on-going at present, in which its market is encroached by a disruptive technology, namely the networked Virtual Drives (VD). In effect, the notion of carrying a physical storage device is being rapidly displaced by information networks.
Thus far, technological innovations relative to a single functional attribute have been discussed. In practice, however, an array of performance attributes for a piece of technology may be associated (i.e. iterative). Embedded technologies, therefore, present the management (of technology) with additional dimensions of complications (i.e. recursive), as illustrated in Figure 4.
Figure 4. Technology S-Curves: Embedded Technologies
Three separate (pieces of) technology X, Y, and Z, at a time instant, t, or during comparable time segment tj – ti , where j > i, are necessary to complete an innovation for an embedded technology. Notice component-based innovations were assumed in Figure 4 for technologies X, Y, and Z to simplify the depiction. Had architectural innovations been included in one or more of the three technologies, the magnitude of the dimensional increase in the attribute vector(s) (i.e. iterative recursions) might have
led Figure 4 to be illustrated in a series of its decompositions in multiple figures.
The objective of this paper is to complete a feasibility study of an emergent embedded technology (viz. mechanical, electrical, electronic, chemical, and IT) governing Information Display Devices with technology S-curves. A brief chronology of the Display Technology (DT) follows:

J. Technol. Manag. Innov. 2010, Volume 5, Issue 4
ISSN: 0718-2724. (http://www.jotmi.org) 112 Journal of Technology Management & Innovation © Universidad Alberto Hurtado, Facultad de Economía y Negocios
• Generation I (1G): Cathode Ray Tubes • Generation II (2G): Liquid Crystal Display and Plasma
General consensus of the DT research community is that Generation III (3G) will be radically innovative in that it will allow the consumer to utilize virtually any transparent material, which wirelessly connects with portable access points. As a consequence, possible applications may be boundless, encompassing windshields and passenger windows of transportation vehicles, glass ceilings of buildings, and/or regular glass panels at residence. Many subsets of technology strategies and business models are expected to be derived from this exercise, applicable to a wide range of industries, organizations, and even societies. From the long-term strategic management and economics standpoint, price elasticity of such technology applications with potential price discrimination might be another interesting topical subject for research.
This paper is organized as follows. Relevant literature review appears in section II. Necessary technological subsets of the embedded technology, third-generation display (3GD), are discussed in Section III. Section IV follows to illustrate its feasibility analysis with technology S-curve exercises. Conclusions and future research extensions close this paper in section V.
II. Review of Literature
A number of challenges imposed on Management of Technology (MoT) in the 21-st century include: innovation, strategic timing, resource, and Research and Development (R&D) management. Among others, the focus of this paper is the first two, namely the management of technological innovation and strategy.
Radically innovative technology is perhaps most difficult to manage. As emphasized in section I, it often entails disruptive ramifications involving its entire value chain (viz. market, end users, and supply). Disruptiveness of technology was well defined by Adner (2001 and 2002) and Adner et al. (2005) with accurate mathematical design formulations. Further, Ganguly et al. (2010) has proposed a set of metrics for indentifying the disruptiveness of an innovation. However, theoretically sound as it may be, their metric system may not be generalized to a wide range of technological innovations, frequently associated with original and/or unique concepts and (performance)
attributes. Impact of this limitation may be minimized by reliability measures, as suggested by Govindarajan et al. (2006). Another contribution to determining the technological disruptiveness was made by Dahlin et al. (2005), in which measurements and a series of analyses for the degree of disruptiveness were discussed. A brief overview of disruptiveness disseminating from both angles of technology push and demand pull was the topical agenda in Walsh et al. (2000).
Market strategies for disruptive innovations were studied in: Anderson et al. (2002), Druehl et al. (2008), Gilbert (2003), Hauser et al. (2006), Kassicieh et al. (2002), Keller (2005), Khurana et al. (1997), Kim et al. (2004), Kostoff et al. (2004), Krishnan et al. (2005), Linton (2002), Lyytinen et al. (2003), Moorthy et al. (1992), Rao et al. (2006), Schmidt et al. (2005), Sood et al. (2005), Walsh et al. (2002), and Zeithaml (1988).
Papers with specific focus on R&D management are: Carrillo (2005), Chan (2006), Cohen et al. (2000), Day et al. (2000), Eisenhardt et al. (1995), Griffin (1993), Henderson (1993), Krishnan et al. (2001), Loch et al. (1996), Mallick et al. (2005), Meyer et al. (1995), Mishra et al. (2002), Pae et al. (2003), Souza (2004), Takeuchi et al. (1986), Winter (2003), and Zirger et al. (1990).
Technology S-curves, originally conceptualized by Christensen (1992a and 1992b) have become a framework for strategically managing a gamut of both various and analogous technologies. However, similar to other (strategic) design methods, it is an incomplete and imperfect framework, not without shortcomings. In particular, multiple estimations for parameters of the S-curves may often be observed. For example, the marketing department might under-estimate the upper bound of a performance attribute, whereas the same might be over-estimated by the R&D project team. As a consequence, the problem of timely determination of the optimal design amongst candidates may plague the management. In such instances, the ISDM © by Willow (2007) may provide the resolution to this problem.
III. Third Generation Display Technology
Third Generation Display (3GD) is an embedded technology, which requires a number of interactions among its backbone technologies. Glass, plastic, chemical, electrical circuit, electronics, information, and possibly the nano
J. Technol. Manag. Innov. 2010, Volume 5, Issue 4
ISSN: 0718-2724. (http://www.jotmi.org) 113 Journal of Technology Management & Innovation © Universidad Alberto Hurtado, Facultad de Economía y Negocios
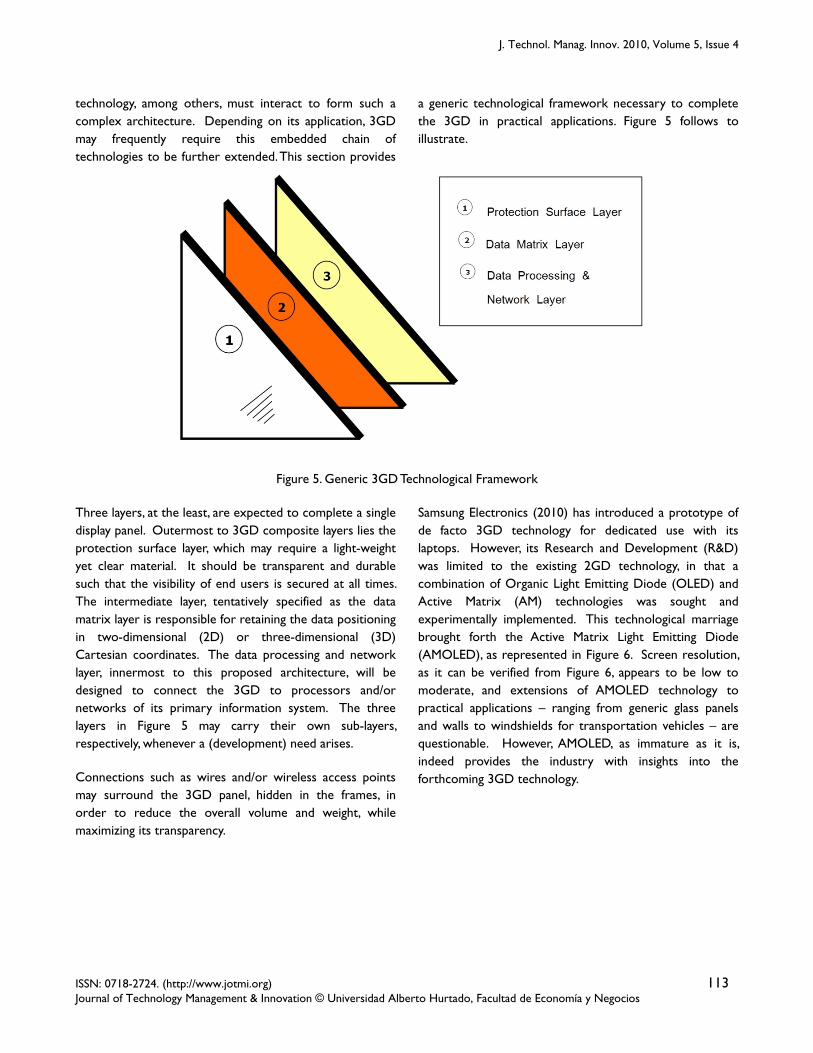
technology, among others, must interact to form such a complex architecture. Depending on its application, 3GD may frequently require this embedded chain of technologies to be further extended. This section provides
a generic technological framework necessary to complete the 3GD in practical applications. Figure 5 follows to illustrate.
Figure 5. Generic 3GD Technological Framework
Three layers, at the least, are expected to complete a single display panel. Outermost to 3GD composite layers lies the protection surface layer, which may require a light-weight yet clear material. It should be transparent and durable such that the visibility of end users is secured at all times. The intermediate layer, tentatively specified as the data matrix layer is responsible for retaining the data positioning in two-dimensional (2D) or three-dimensional (3D) Cartesian coordinates. The data processing and network layer, innermost to this proposed architecture, will be designed to connect the 3GD to processors and/or networks of its primary information system. The three layers in Figure 5 may carry their own sub-layers, respectively, whenever a (development) need arises.
Connections such as wires and/or wireless access points may surround the 3GD panel, hidden in the frames, in order to reduce the overall volume and weight, while maximizing its transparency.
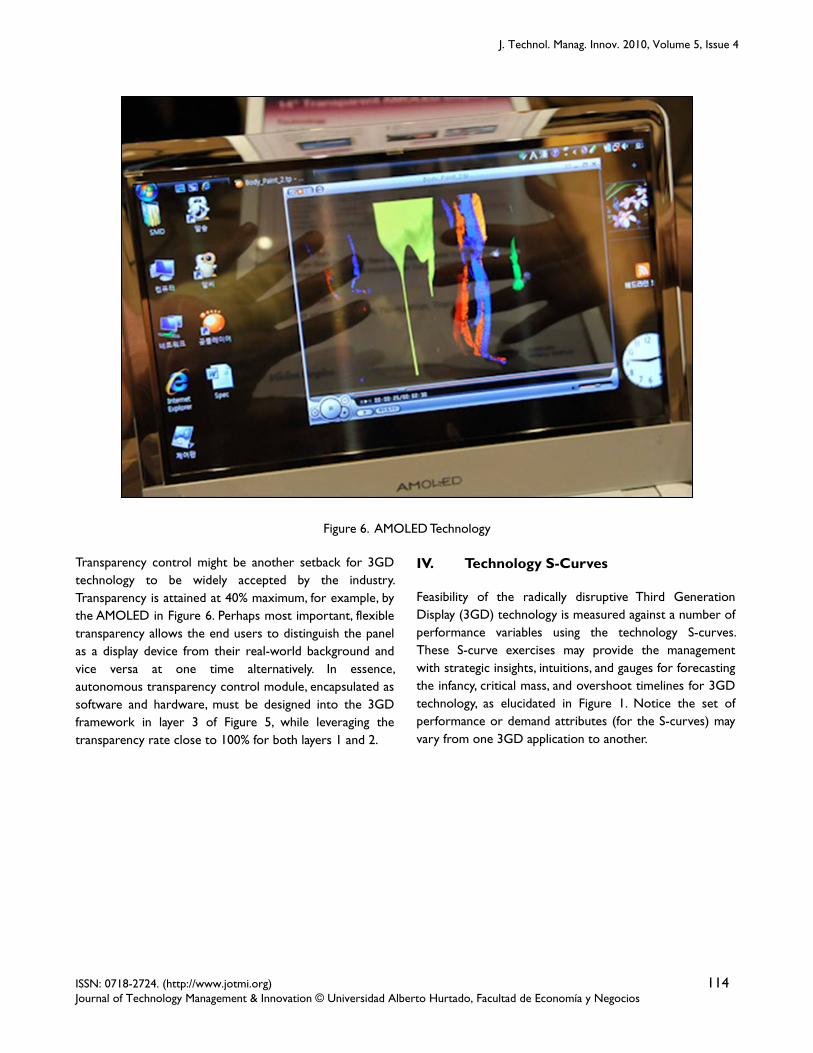
Samsung Electronics (2010) has introduced a prototype of de facto 3GD technology for dedicated use with its laptops. However, its Research and Development (R&D) was limited to the existing 2GD technology, in that a combination of Organic Light Emitting Diode (OLED) and Active Matrix (AM) technologies was sought and experimentally implemented. This technological marriage brought forth the Active Matrix Light Emitting Diode (AMOLED), as represented in Figure 6. Screen resolution, as it can be verified from Figure 6, appears to be low to moderate, and extensions of AMOLED technology to practical applications – ranging from generic glass panels and walls to windshields for transportation vehicles – are questionable. However, AMOLED, as immature as it is, indeed provides the industry with insights into the forthcoming 3GD technology.
J. Technol. Manag. Innov. 2010, Volume 5, Issue 4
ISSN: 0718-2724. (http://www.jotmi.org) 114 Journal of Technology Management & Innovation © Universidad Alberto Hurtado, Facultad de Economía y Negocios
Figure 6. AMOLED Technology
Transparency control might be another setback for 3GD technology to be widely accepted by the industry. Transparency is attained at 40% maximum, for example, by the AMOLED in Figure 6. Perhaps most important, flexible transparency allows the end users to distinguish the panel as a display device from their real-world background and vice versa at one time alternatively. In essence, autonomous transparency control module, encapsulated as software and hardware, must be designed into the 3GD framework in layer 3 of Figure 5, while leveraging the transparency rate close to 100% for both layers 1 and 2.
IV. Technology S-Curves
Feasibility of the radically disruptive Third Generation Display (3GD) technology is measured against a number of performance variables using the technology S-curves. These S-curve exercises may provide the management with strategic insights, intuitions, and gauges for forecasting the infancy, critical mass, and overshoot timelines for 3GD technology, as elucidated in Figure 1. Notice the set of performance or demand attributes (for the S-curves) may vary from one 3GD application to another.
J. Technol. Manag. Innov. 2010, Volume 5, Issue 4
ISSN: 0718-2724. (http://www.jotmi.org) 115 Journal of Technology Management & Innovation © Universidad Alberto Hurtado, Facultad de Economía y Negocios
(a) Screen Size (b) Transparency
(c) Weight (d) Strength
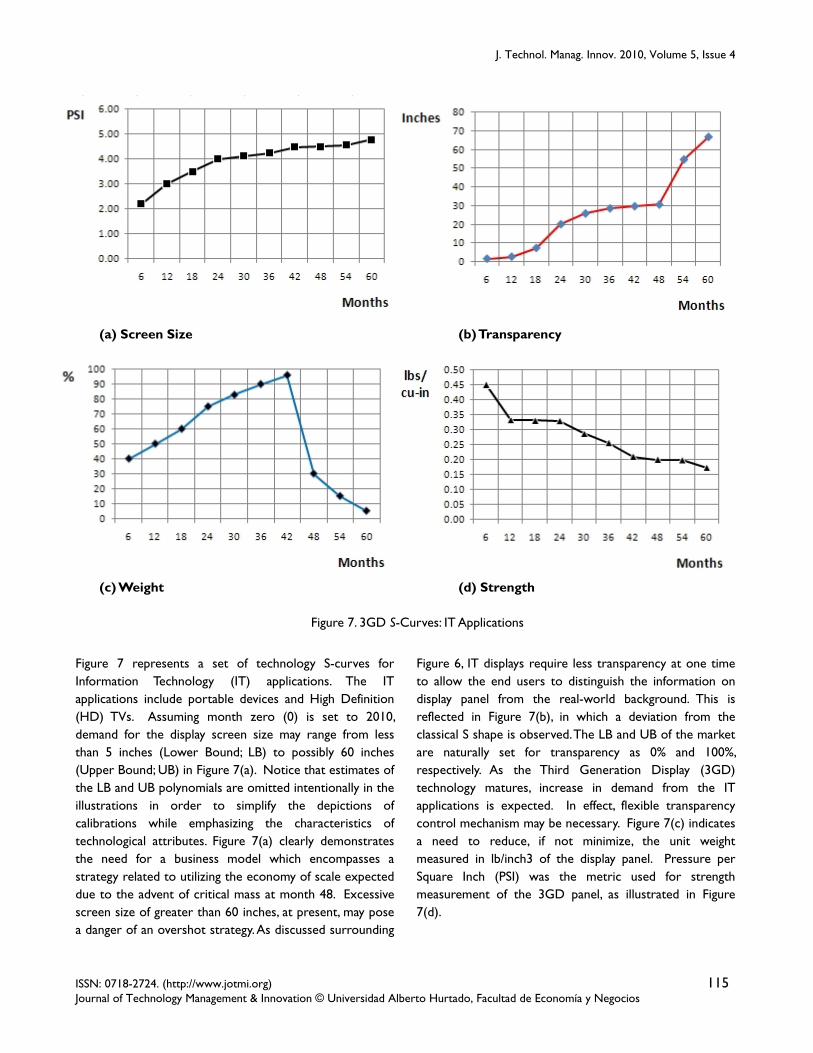
Figure 7. 3GD S-Curves: IT Applications Figure 7 represents a set of technology S-curves for Information Technology (IT) applications. The IT applications include portable devices and High Definition (HD) TVs. Assuming month zero (0) is set to 2010, demand for the display screen size may range from less than 5 inches (Lower Bound; LB) to possibly 60 inches (Upper Bound; UB) in Figure 7(a). Notice that estimates of the LB and UB polynomials are omitted intentionally in the illustrations in order to simplify the depictions of calibrations while emphasizing the characteristics of technological attributes. Figure 7(a) clearly demonstrates the need for a business model which encompasses a strategy related to utilizing the economy of scale expected due to the advent of critical mass at month 48. Excessive screen size of greater than 60 inches, at present, may pose a danger of an overshot strategy. As discussed surrounding
Figure 6, IT displays require less transparency at one time to allow the end users to distinguish the information on display panel from the real-world background. This is reflected in Figure 7(b), in which a deviation from the classical S shape is observed. The LB and UB of the market are naturally set for transparency as 0% and 100%, respectively. As the Third Generation Display (3GD) technology matures, increase in demand from the IT applications is expected. In effect, flexible transparency control mechanism may be necessary. Figure 7(c) indicates a need to reduce, if not minimize, the unit weight measured in lb/inch3 of the display panel. Pressure per Square Inch (PSI) was the metric used for strength measurement of the 3GD panel, as illustrated in Figure 7(d).
J. Technol. Manag. Innov. 2010, Volume 5, Issue 4
ISSN: 0718-2724. (http://www.jotmi.org) 116 Journal of Technology Management & Innovation © Universidad Alberto Hurtado, Facultad de Economía y Negocios
(a) Screen Size (b) Weight
(c) Strength (d) Water Proof Rate
(e) Durability (1-10ys) (f) Heat Resistance
Figure 8. 3GD S-Curves: Vehicle and General-Purpose Windows
J. Technol. Manag. Innov. 2010, Volume 5, Issue 4
ISSN: 0718-2724. (http://www.jotmi.org) 117 Journal of Technology Management & Innovation © Universidad Alberto Hurtado, Facultad de Economía y Negocios
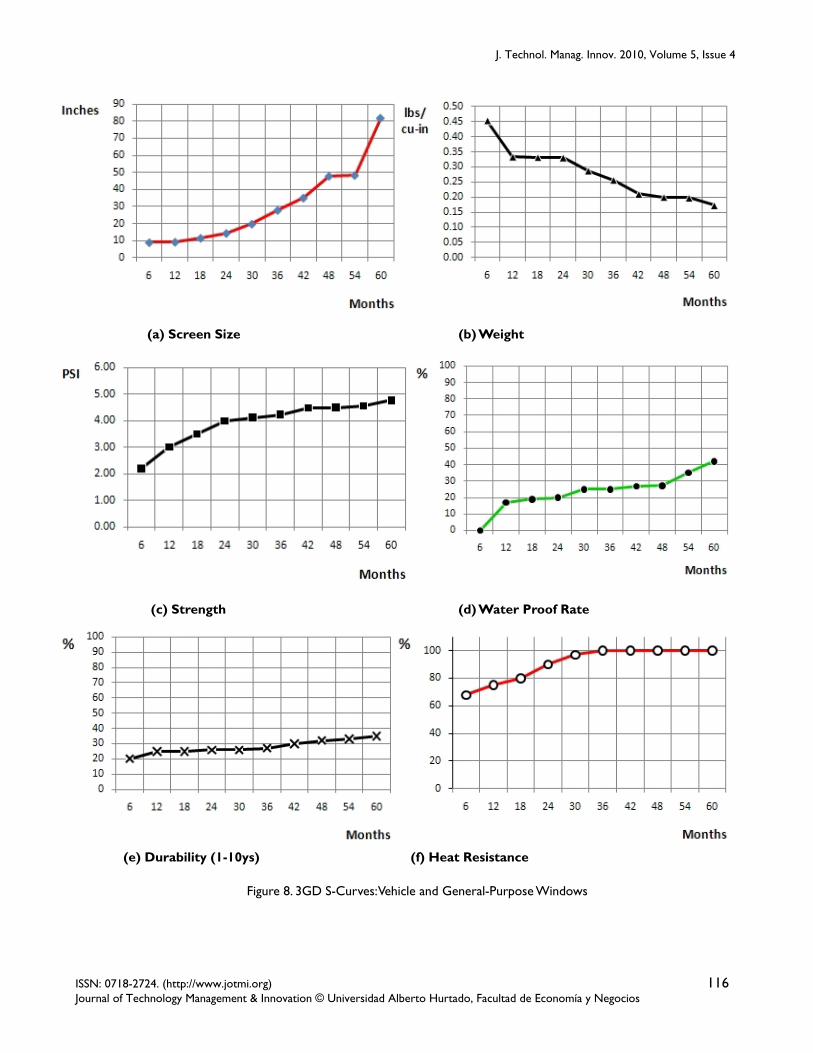
Application extensions of the 3GD technology to generic purposes comprised of wind shields and passenger windows of transportation vehicles and residential glass panels are summarized in Figure 8 with technology S-curves. Greater screen size will be required to meet the specifications for the alternative application, as evident in Figure 8(a). Market demand for (reduced) unit weight as well as (increased) unit strength is expected to remain intact from one application to another, as highlighted in Figures 8(b) and 8(c), respectively. Further, the transparency requirement may not undergo a drastic change. Figures 8(d) through 8(f), however, provide some interesting insights, relative to Figure 7. These attributes are a set of essential requirements to meet the common ordinance of construction for real-estate properties in many townships, counties, and/or provinces/states in the global market.
In addition to the technology S-curves, the Integrated Systems Design Methodology (ISDM) © by Willow (2007) might provide the researchers with alternative apparatus governing their management of technology and/or building strategies for useful classes of disruptive technologies.
V. Conclusions and Future Research
Display technology is reshaping the consumer, business, government, and even not-for-profit markets in the midst of the digital convergence, coupled with recent smart phones led by Apple, Inc. First-Generation (1G) display technology was dominated by the Cathode Ray Tubes, followed by Liquid Crystal Display and Plasma in 2G. A radically innovative shift as a disruptive technology is expected to follow in 3G to utilize virtually any transparent material, which (wirelessly) connects to (portable) access points whenever necessary.
In this paper, possible market introduction of the 3G Display (3GD) technology was assessed with technology S-Curve strategy exercises. Two major applications of this infant 3GD technology were selected: display panels for Information Technology (IT) and glass panels for residence and vehicles. The extent of this radically disruptive technology is boundless, if successfully adopted, for the market.
Future research should be geared toward building and deriving additional subsets of business models for 3GD technology for a wide range of industry applications. In
parallel, a series of research with emphasis on seeking comparative analyses between the technology S-curves and alternative tools such as the ISDM © by Willow (2007) are deemed productive.
Acknowledgments
This paper was generously funded by the 2009 Mini-Sabbatical Grant from Monmouth University, West Long Branch, NJ 07764-1898, U. S. A.
The author wishes to extend his gratification to the anonymous reviewers for their time, assistance, and patience.
As always, this paper is dedicated to his little precocious son, Ocean D. Willow – the Infant Maestro of life-time joy.
References
ACS, Z., Anselin, L., Varga, A. (2002). Patents and Innovation Counts as Measures of Regional Production of New Knowledge. Research Policy, 31(7), pp. 1069-1085.
ADNER, R. (2001). Demand Heterogeneity and Technology Evolution: Implications for Product and Process Innovation. Management Science, 47 (5), pp. 611-628.
ADNER, R. (2002). When are Technologies Disruptive? A Demand-based View of the Emergence of Competition. Strategic Management Journal, 23 (8), pp. 667-688, August,.
ADNER, R. Zemsky, P. (2005). Disruptive Technologies and the Emergence of Competition. RAND Journal of Economics, 36 (2), pp. 229-254,.
ANDERSON, E. G., Parker, G. G. (2002). “The Effect of Learning on the Make/Buy Decision,” Productions and Operations Management, 11 (3), pp. 313-339.
APPLEGATE, L. M., Austin, R. D., Soule, D. L. (2009) Corporate Information Strategy and Management: 8 Ed., McGraw-Hill Publishing.
BURGELMAN, R. A., Christensen, C. M., Wheelwright, S. C. (2009). Strategic Management of Technology and Innovation: 5 Ed., McGraw-Hill Publishing.
J. Technol. Manag. Innov. 2010, Volume 5, Issue 4
ISSN: 0718-2724. (http://www.jotmi.org) 118 Journal of Technology Management & Innovation © Universidad Alberto Hurtado, Facultad de Economía y Negocios
CARRILLO, J. E. (2005). “Industry Clockspeed and the Pace of New Product Development,” Productions and Operations Management, 14 (2), pp. 125-141, Summer.
CHAN, S. (2006). “Strategy Development for Anticipating and Handling a Disruptive Technology,” Journal of the American College of Radiology, 3 (10), pp. 778-786, October.
CHRISTENSEN, C. M. (1992a). “Exploring the Limits of the Technology S-Curve. Part I: Component Technologies,” Productions and Operations Management, 1(4), pp. 334-357.
CHRISTENSEN, C. M. (1992b). “Exploring the Limits of the Technology S-Curve. Part II: Architectural Technologies,” Productions and Operations Management, 1(4), pp. 358-366.
CHRISTENSEN, C. M., Raynor, M. E. (2004). The Innovator’s Solution: Creating and Sustaining Successful Growth, Harvard Business School Press.
COHEN, M. A., Eliashberg, J., Ho, T. H. (2000). “An Analysis of Several New Product Performance Metrics,” Manufacturing and Service Operations Management, 2 (4), pp. 337-349.
DAY, G. S. Schoemaker, P. J. H. (2000), “Avoiding the Pitfalls of Emerging Technologies,” California Management Review, 42 (2), pp. 8-33, Winter.
DAHLIN, K. B. Behrens, D. M. (2005), “When is an Invention really Radical? Defining and Measuring Technological Radicalness,” Research Policy, 34 (5), pp. 717-737.
DANEELS, E. (2004). “Disruptive Technology Reconsidered: A Critique and Research Agenda,” Journal of Product Innovation Management, 21(4), pp. 246-259, July.
DRUEHL, C. T., Schmidt, G. M. (2008) “A Strategy for Opening a New Market and Encroaching on the Lower End of the Existing Market,” Productions and Operations Management, 17 (1), pp. 44-60, January-February.
EISENHARDT, K. M., Tabrizi, B. N. (1995). “Accelerating Adaptive Process: Product Innovation in the Global Computer Industry,” Administrative Science Quarterly, 40 (1), pp. 84-110.
GANGULY, A., Nilchiani, R., Farr, J.V. (2010). “Defining a Set of Metrics to Evaluate the Potential Disruptiveness of a
Technology,” Engineering Management Journal, 22 (1), pp. 34-44, March.
GATIGNON, H., Tushman, M. L., Smith, W., Anderson, P. (2002), “A Structural Approach to Assessing Innovation: Construct Development of Innovation Locus, Type, and Characteristics,” Management Science, 48 (9), pp. 1103-1122.
GILBERT, C. (2003). “The Disruption Opportunity,” MIT Sloan Management Review, 44 (4), pp. 27-32, Summer.
GOVINDARAJAN, V. , Praveen, K. K. (2006), “Disruptiveness of Innovations: Measurement and an Assessment of Reliability and Validity,” Strategic Management Journal, 27 (2), pp. 189-199, February.
GRIFFIN, A. (1993). “Metrics for Measuring Product Development Cycle Time,” Journal of Product Innovation Management, 10 (2), pp. 112-125.
HAUSER, J., Tellis, G. J., Griffin, A. (2006). “Research on Innovation: A Review and Agenda for Marketing Science,” Marketing Science, 25 (6), pp. 687-717.
HENDERSON, R. M. (1993). “Underinvestment and Incompetence as Responses to Radical Innovation: Evidence from the Photolithographic Alignment Equipment Industry,” RAND Journal of Economics, 24 (3), pp. 248-270.
HENDERSON, R. M. (2006). “The Innovator’s Dilemma as a Problem of Organizational Competence,” Journal of Product Innovation Management, 23 (1), pp. 5-11.
HULTINK, E. J., Robben, H. S. J. (1995). “Measuring New Product Success: Differences that Time Perspective makes,” Journal of Product Innovation Management, 12 (5), pp. 392-405.
KASSICIEH, S. K., Walsh, S. T., Cummings, J. C., McWhorter, J., Romig, A. D., Williams, W. D. (2002). “Factors Differentiating the Commercialization of Disruptive and Sustaining Technologies,” IEEE Transactions on Engineering Management, 49 (4), pp. 375-387, November.
KELLER, E. D. W. (2005). Anatomy of Disruptive Technologies: Analyses and Comparison, Doctoral Dissertation, Kent State University Graduate School of Business.
J. Technol. Manag. Innov. 2010, Volume 5, Issue 4
ISSN: 0718-2724. (http://www.jotmi.org) 119 Journal of Technology Management & Innovation © Universidad Alberto Hurtado, Facultad de Economía y Negocios
KHURANA, A. Rosenthal, S. R. (1997). “Integrating the Fuzzy Front End of New Product Development,” IEEE Engineering Management Review, 25 (4), pp. 35-49.
KIM, W. C., Mauborgne, R. (2004). “Blue Ocean Strategy” Harvard Business Review, 82 (10), pp. 76-84, October.
KOSTOFF, R. N., Boylan, R., Simmons, G. R. (2004), “Disruptive Technology Roadmaps,” Technological Forecasting and Social Change, 71 (1-2), pp. 141-159, January-February.
KRISHNAN, V., Loch, C. H. (2005). “A Retrospective Look at Production and Operations Management Articles on New Product Development,” Productions and Operations Management, 14 (4), pp. 433-441, Winter.
KRISHNAN, V., Ulrich, K. T. (2001). “Product Development Decisions: A Review of the Literature,” Management Science, 47 (1), pp. 1-21.
LINTON, J. D. (2002). “Forecasting the Market Diffusion of Disruptive and Discontinuous Innovation,” IEEE Transactions on Engineering Management, 49 (4), pp. 365-374, November.
LOCH, C. H., Stein, L., Terwisch, C. (1996). “Measuring Development Performance in Electronics Industry,” Journal of Product Innovation Management, 13 (1), pp. 3-20.
LYYTINEN, K. Rose, G. M. (2003). “The Disruptive Nature of Information Technology Innovations: The Case of Internet Computing in Systems Development Organizations,” MIS Quarterly, 27 (4), pp. 557-595, December.
MAHAJAN, V., Muller, E., Wind, Y. (2000) New Product Diffusion Models, Kluwer Academic Press, Boston, MA,
MALLICK, D. N. Schroeder, R. G. (2005). “An Integrated Framework for Measuring Product Development Performance in High Technology Industries,” Productions and Operations Management, 14 (2), pp. 142-158, Summer.
MEYER, M. H., Utterback, J. M. (1995). “Product Development Cycle Time and Commercial Success,” IEEE Transactions on Engineering Management, 42 (4), pp. 297-303.
MISHRA, S., Desmukh, S. G., Vrat, P. (2002). “Matching of Technological Forecasting Technique to a Technology,” Technological Forecasting and Social Change, 69 (1), pp. 1-27.
MOORTHY, K. S., Png, I. P. L. (1992). “Market Segmentation Cannibalization and the Timing of Product Introductions,” Management Science, 38 (3), pp. 345-359.
PAE, J. H., Lehmann, D. R. (2003) “Multigeneration Innovation Diffusion: The Impact of Intergeneration Time,” Journal of the Academy of Marketing Science, 31 (1), pp. 36-45.
RAMDAS, K. (2003). “Managing Product Variety: An Integrative Review and Research Directions,” Productions and Operations Management, 12 (1), pp. 79-101.
RAO, B., Angelov, B., Nov, O. (2006). “Fusion of Disruptive Technologies: The Lesson from the Skype Case,” European Management Journal, 24 (2-3), pp. 174-188, April-June.
REITZIG, M. (2003). “What determines Patent Value? Insights from the Semiconductor Industry,” Research Policy, 32 (1), pp. 13-26.
SAMSUNG ELECTRONICS (2010). Transparent AMOLED Technology for Laptops and Notebook Computers, http://www.youtube.com/watch?v=FoK9XlZNz0I, January.
SCHILLING, M. A. (2008). Strategic Management of Technological Innovation: 2 Ed., McGraw-Hill Publishing.
SCHMIDT, G. M., Druehl, C. T. (2005). “Changes in Product Attributes and Costs as Drivers of New Product Diffusion and Substitution,” Productions and Operations Management, 14 (3), pp. 272-285, Fall.
SOOD, A., Tellis, G. J. (2005). “Technological Evolution and Radical Innovation,” Journal of Marketing, 69 (3), pp. 152-168, July.
SOUZA, G., Bayus, B. L., Wagner, H. M. (2004). “New-Product Strategy and Industry Clockspeed,” Management Science, 50, (4), pp. 537-549.
TAKEUCHI, H., Nonaka, I. (1986). “The New Product Development Game,” Harvard Business Review, 64 (1), pp. 137-146, January-February.
VAN DEN BULTE, C. (2000). “New Product Diffusion Acceleration: Measurement and Analysis,” Marketing Science, 19 (4), pp. 366-380.
J. Technol. Manag. Innov. 2010, Volume 5, Issue 4
ISSN: 0718-2724. (http://www.jotmi.org) 120 Journal of Technology Management & Innovation © Universidad Alberto Hurtado, Facultad de Economía y Negocios
WALSH, S. T., Linton, J. D. (2000). “Infrastructure for Emergent Industries based on Discontinuous Innovation,” Engineering Management Journal, 12 (2), pp. 23-31, June.
WALSH, S. T., Kirchhoff, B. A., Newbert, S. (2002), “Differentiating Market Strategies for Disruptive Technologies,” IEEE Transactions on Engineering Management, 49 (4), pp. 341-351, November.
WILLOW, C. C. (2007). “Qualitative Decision Making with Integrated Systems Design Methodology,” Journal of Engineering and Technology Management, 24 (3), pp. 262-286, September.
WINTER, S. G. (2003). “Understanding Dynamic Capabilities,” Strategic Management Journal, 24 (10), pp. 991-995.
ZEITHAML, V. A. (1988). “Consumer Perceptions of Price, Quality, and Value: A Means-End Model and Synthesis of Evidence,” Journal of Marketing, 52 (3), pp. 2-22.
ZIRGER, B. J., Maidique, M. (1990). “A Model of New Product Development: An Empirical Test,” Management Science, 36 (7), pp. 867-883.
Related Documents