Welcome message from author
This document is posted to help you gain knowledge. Please leave a comment to let me know what you think about it! Share it to your friends and learn new things together.
Transcript

a
Acknowledgements
I am most grateful to my dear and sweet wife, Mrs. Naomi Mensah and our lovely little
daughter, Odelia Afia Nhyria Mensah for their incredible love, understanding, encouragement
and support. You two gave me hope and the inspiration to carry on when the going got tough
and rough.
I would like to thank my supervisor, Professor Øystein Myrland his for valuable contribution,
support, guidance and especially his patience with me throughout the writing process.
I thank, the Norwegian State Educational Loan Fund for the financial support.
I would like to express my deepest gratitude to my parents for the investment they have made
in my education.
I thank my Programme Coordinator, Lecturers, colleagues and friends at the University of
Tromsø for making my stay here in Tromsø a pleasant and a memorable one.
Last but not least, I sincerely appreciate the immense contribution of the leadership and
members of Tromsø Kristent Felleskap to my spiritual life and growth during my stay in
Tromsø.
To God be the glory.
b
Table of Contents Abstract ..............................................................................................................................................1
1: Introduction ................................................................................................................................2
2: Background ................................................................................................................................6
2.1 The Ghanaian Tuna Fishery .......................................................................................................6
2.1.1 Brief History ......................................................................................................................6
2.1.2 Producers ...........................................................................................................................6
2.1.3 Production ..........................................................................................................................7
2.1.4 Processing and Markets ......................................................................................................9
2.1.5 Employment .......................................................................................................................9
2.1.6 Governance and Management .............................................................................................9
2.2 EU Import Market Situation .................................................................................................... 11
2.3 Import Policies: Tariff Measures ............................................................................................. 12
2.3.1 ACP-EU Partnership Agreement ....................................................................................... 12
2.3.2 Generalized System of Preferences (GSP) regime ............................................................. 13
2.3.3 WTO Negotiations............................................................................................................ 14
2.4 Import Policies: Non-Tariff Measures ...................................................................................... 14
3: Theoretical Framework ............................................................................................................. 17
3.1The Revealed Comparative Advantage (RCA) .......................................................................... 17
3.2 Market Share Index ................................................................................................................. 24
3.3 Constant Market Share (CMS) Model ...................................................................................... 25
3.4 Determinants ........................................................................................................................... 27
4: Data .......................................................................................................................................... 29
4.1 Product.................................................................................................................................... 29
4.2 Price........................................................................................................................................ 30
4.3 Exchange rate .......................................................................................................................... 30
4.4 Policy Effect (WTO mediation) ............................................................................................... 31
c
4.5 Descriptive Statistics ............................................................................................................... 32
5: Results and Discussion .............................................................................................................. 34
5.1 Specialization .......................................................................................................................... 34
5.2 Competitiveness ...................................................................................................................... 39
5.3 Constant Market Share (CMS) analysis ................................................................................... 44
5.4 Regression analysis ................................................................................................................. 48
6: Conclusion ................................................................................................................................ 50
References ........................................................................................................................................ 53
Appendix 1 ......................................................................................................................................... I
Appendix 2 .........................................................................................................................................II
Appendix 3 ........................................................................................................................................III
d
List of Figures
Figures Page
Figure 1: Total tuna production in MT: Ghana and East Atlantic (1989-2009) 7
Figure 2: Ghana’s percentage share of total tuna production in the East Atlantic 1989-2009 8
Figure 3: Most significant fish and fish products imported into EU (value terms) 2008 11
Figure 4: The decomposition of changes in export (CMS Model) 25
Figure 5: Ratio of Ghanaian export price of canned tuna to the export prices of competitor
countries, 1999-2009 33
Figure 6: Revealed Comparative Advantage (RCA) from 1999 – 2009 36
Figure 7: Relative growth in revealed comparative advantage (RCA) 1999=100 37
Figure 8: Revealed Symmetric Comparative Advantage (RSCA) from 1999 – 2009 38
Figure 9: Market Share (Value) of canned tuna exporting countries to the EU-27: 1999
– 2009 40
Figure 10: Relative growth in Market Share (Value) 1999=100 42
Figure 11: Market Share (quantity) of canned tuna exporting countries to the EU-27: 1999 –
2009 43
e
List of Tables
Tables Page
Table 1: Total production of tuna in East Atlantic and Ghana (1989 -2009) in MT I
Table 2: CN codes for canned tuna products. 29
Table 3: Annual import value of canned to the EU-27: (1989 -2009) in Euro currency. II
Table 4: Annual import quantity of canned to the EU-27: (1989 -2009) in (1000 kg). III
Table 5: Descriptive Statistics of annual import of canned to the EU-27: (1989 -2009) 32
Table 6: Revealed comparative advantage (RCA) from 1999 – 2009 36
Table 7: Relative growth in revealed comparative advantage (RCA) 1999=100 37
Table 8: Revealed symmetric comparative advantage (RSCA) from 1999 – 2009 38
Table 9: Market Share (Value) of canned tuna exporting countries to the EU-27: 1999 –
2009 39
Table 10: Average Market Share (Value), 1999 -2001, 2002 - 2005 and 2006-2009 40
Table 11: Relative growth in Market Share (Value) 1999=100 41
Table 12: Market Share (quantity) of canned tuna exporting countries to the EU-27: 1999 –
2009 42
Table 13: CMS decomposition procedure 44
Table 14: Results of CMS decomposition of the change in export value 46
Table 15: Results of the regression analysis 49
1
Abstract
The tuna fishery is an important sector in Ghana. In 2009, total landing of tuna in Ghana
represented about 24% of total catches in the East Atlantic. Canned tuna is Ghana’s most
important non-traditional export commodity in terms of foreign exchange earnings. The main
focus of this thesis is to analyze the performance of Ghanaian canned tuna export to the EU -
27 market. Performance is measured in terms of Ghana’s competitiveness relative to the
performance of other exporting countries; namely, Cote d’ Ivoire, Ecuador, Madagascar and
Thailand. The competing countries are all leading exporters of canned tuna and were chosen
to reflect regional balance and different trading and tariff systems in the EU market.
The performance indicators employed for the study are two measures of specialization; the
Revealed Comparative Advantage (RCA) and the Revealed Symmetry Comparative
Advantage (RSCA) and a measure of competitiveness, the Market Share (MS) Index using
yearly data from 1999 -2009. To infer competitiveness from the changes in export value over
time, a first- level Constant Market Share (CMS) analysis was used to decompose the changes
in export value into a structural effect, competitive effect and second-order effect. To augment
this technique, an empirical analysis on the determinants of the Ghana’s canned tuna export
was conducted using the Armington trade model by OLS regression on monthly data from
January 1999 – December 2009, with quantity market share as the dependent variable. The
results of the indices of specialization, shows that, Ghana has comparative advantage in the
export of canned tuna to the EU -27 throughout the study period. In terms of competitiveness,
Ghana’s market share value has declined over the study period. Judging by the operational
definition of competitiveness, Ghana has been less competitive. The CMS decomposition of
changes in export values indicates that the changes in export value of Ghana can be attributed
to structural effect (growth of the market) mainly. The results of the regression analysis
indicate that, price ratio, the level of specialization and trade policy effect have statistically
significant effect on the quantity market share of Ghana.
Keywords:
Revealed comparative advantage, market share, specialization, competitiveness, constant
market share, determinants, canned tuna, Ghana
2
1: Introduction
Fish is one of the most traded food commodities in the world. International trade in fish and
fishery products has continued to grow over the last few years. Total world import of fish
stood at a whopping US$89.6 billion in 2006, a 10% increase from the previous year and 57%
since 1996. The EU, USA and Japan markets alone accounted for about 72% of the total
import value. The value of import by the EU, increased by a significant 12% in 2006 (FAO,
2009). Developing countries have continued to be important supply source in the global fish
trade. In 2006, more than half of the total value of import by these developed markets came
from developing countries.
This situation has arisen because local fishery productions in these developed countries are
not enough to meet the growing demand, as a result, there is an increasing reliance on imports
and aquaculture. In 2007, the value of imported fish and fishery products into the EU market
stood at €16 billion. This accounts for more than 60% of the EU’s fish consumption. The bulk
of these imports has been high-value species. The major products imported in terms of value
were Pacific salmon, frozen shrimps and canned tuna. Canned tuna imports constitute about
7% in value terms of the total fish and fishery products imported into the EU market
following fresh or chilled pacific salmon and frozen shrimp which have 8% apiece. Ghana has
consistently being ranked among the leading exporters of canned tuna to the EU.
The importance of the fishery sector to the economy of Ghana is not in question. The sector
plays a key role in the economy of Ghana, contributing about 3% to GDP. Fish and fishery
products are Ghana’s leading non-traditional export commodity with tuna being the most
dominant. The importance of the tuna fishery and its allied businesses like the canneries has
not been lost on successive governments. Over the years, the government has embarked on
projects and programs aimed at modernizing the tuna fishery sector and building a sustainable
tuna supply chain, from the fisher to the markets. This is to enable the sector to take
advantage of the thriving world market for tuna in the bid to increase employment, improve
the livelihood of fishing communities and contribute to economic growth via export revenues.
Export contributes in no small way to the economic growth of a country. It fosters better
3
capacity utilization, technology improvements, and economies of scale (Feder, 1982). It
allows for building foreign exchange reserves which are necessary for local currency
stabilization and economic growth.
In light of the growing demand for canned tuna, changing trade conditions, health and safety
standards, and investment into the sector by government, what has been the performance of
Ghanaian canned tuna export to the EU? In other words, how did the performance of
Ghanaian canned tuna export to the EU measured up to the performance of competitor
countries? The answer to this question is the thrust of this study. The primary objective of this
thesis is to analyze Ghana’s performance in terms of its competitiveness in canned tuna export
to the EU market relative to competitor countries. This study will examine canned tuna
product form because it is the main form of tuna products exported in terms of both value and
volume. Ghana’s performance will be compared to the performance of other exporting
countries like Cote d’Ivoire, Ecuador, Madagascar and Thailand. The selection of these
countries is to reflect regional balance and the different trading and tariff systems in the EU
market. Cote d’Ivoire, a neighboring West African country, like Ghana, exports canned tuna
to the EU under the ACP-EU preferential trade agreement. Madagascar as well exports under
the same agreement. Ecuador, a Latin American country exports under the General System of
Preferences (GSP)+ regime. Thailand an Asian exporter, until July 2003, when a reduced
tariff quota for canned tuna was opened for Thailand and the Philippines did not have
preferential access treatment.
The justification of such a study lies in the fact that, trade performance analysis is a key and
integral part of strategic market research and planning. Strategic market research enables the
benchmarking of national and sectoral trade performance and the identification of priority
products and markets for trade development (Magagane et al, 2008). Because foreign markets
tend to be more diverse and in some cases unpredictable compared to domestic markets, a
clear understanding of export performance becomes imperative (Sousa, 2004). Such
knowledge is of essential interest to governmental or policy makers, business and corporate
managers and market analyst or researchers (Katsikeas et al. 2000). From the public policy
maker’s standpoint, a clear understanding of the construct will enable formulation of
4
appropriate policies, setting of priorities in terms of products, sectors and trading partners in
order to provide adequate trade support to industry and carry out effective trade promotion
and development. At the micro or firm level, managers will be interested in research on
export performance because it is considered as an apparatus for increasing sales revenue,
growth, survival and reinforcing competitive edge (Samiee and Walters, 1990). It is against
this backdrop that this study is imperative.
Export performance has received considerable attention in the literature lately; however there
is a lack of consensus on conceptualization and operationalization of the construct
(Diamantopoulous, 1999; Cavusgil and Zou, 1994; Shoham, 1998). Several methods and
indicators are available for studying and analyzing export performance. The choice of
indicator will be influenced by data availability and scope of the analysis i.e. whether the
analysis is at the firm (micro) or national (macro) level.
In this study, the analysis is based on trade data over the period 1999 to 2009. Performance is
analyzed through the estimation of the following indicators; specialization and
competitiveness. Specialization refers to focusing on goods in which a country has some
advantage whereas, competitiveness is the ability of a product to achieve and maintain a
certain market share.
The analysis of specialization as a performance indicator will be based on the Revealed
Comparative Advantage (RCA) and the Revealed Symmetry Comparative Advantage (RSCA)
indices. On the other hand, the reference methodology for measuring competitiveness is the
Market Share (MS) index. In addition to the RCA, RSCA and MS indices, a first-level
Constant Market Share (CMS) analysis is carried out to decompose the changes in export
value into structural, competitive and second-order effects, in order to infer competitiveness.
An empirical analysis on the determinants of the Ghana canned tuna export is also conducted
using the Armington trade model by OLS regression method on monthly data from January
1999 – December 2009, with quantity market share as the dependent variable.
5
Secondary data was used for the study. EU import and export data were extracted from the
Eurostat statistical database. The region or market under consideration for this study is the
EU-27 Market. The product form was chosen because it is the main form of fishery product
exported.
The study is organized as follows;
The second chapter deals with background information about the Ghanaian tuna fishery with
highlights on the history, production, contribution to the economy, markets and management
and the EU import market with emphasis on tariff and non-tariff measures employed by the
market.
The third chapter will consider the theoretical framework and a review of the various methods
of export performance measurement as well as a detailed description of the indicators used for
the analysis.
The fourth chapter provides the empirical results and a discussion of the results.
The final chapter presents conclusion of the study.
6
2: Background
2.1 The Ghanaian Tuna Fishery
2.1.1 Brief History
The fishing industry in Ghana dates back several years even before Ghana attained
independence in 1957 by the people living along the coast. The Gulf of Guinea which bounds
Ghana on the south supported a thriving fishing industry. The fishery started with very crude
and inefficient harvest technology. From the mainly traditional use of hand dugout canoes the
fishery has evolved into a multi fleet industry with a blend of both traditional and modern
harvest technology.
The tuna fishery started round about 1959, a couple of years after independence. The tuna
industry was birthed as a result of collaboration between the government of Ghana and Star
Kist International of the USA. Actual exploitation of the resource started with the Japanese
bait boats. Since then, the fishery has developed with the growth of infrastructure such as cold
stores, processing plants etc at the main landing port of Tema.
2.1.2 Producers
The Ghanaian tuna fishery is based on the exploitation of three main species, namely,
Skipjack (Katsuwonus pelamis), Yellowfin (Thunnus albacares) and the Bigeye (Thunnus
obesus). It is a bait boat and purse-seine fishery. Presently there are a number of bait boats
and purse-seiners operating in the fishery. The purse-seiners are operated by commercial or
industrial fishing companies whereas the bait boat fleets has some level of artisanal
participation. There about 45 tuna commercial fishing vessels operating in the fishery. Of
these, 10 are purse-seiners. The vessels are operated by about 19 fishing companies. The
companies form the Ghana Tuna Association (GTA). The vessels are mostly beneficially
7
owned or controlled on joint venture basis with Ghanaians having at least 50% of the shares
as required by law, the Fisheries Act 625 of 2002.
2.1.3 Production
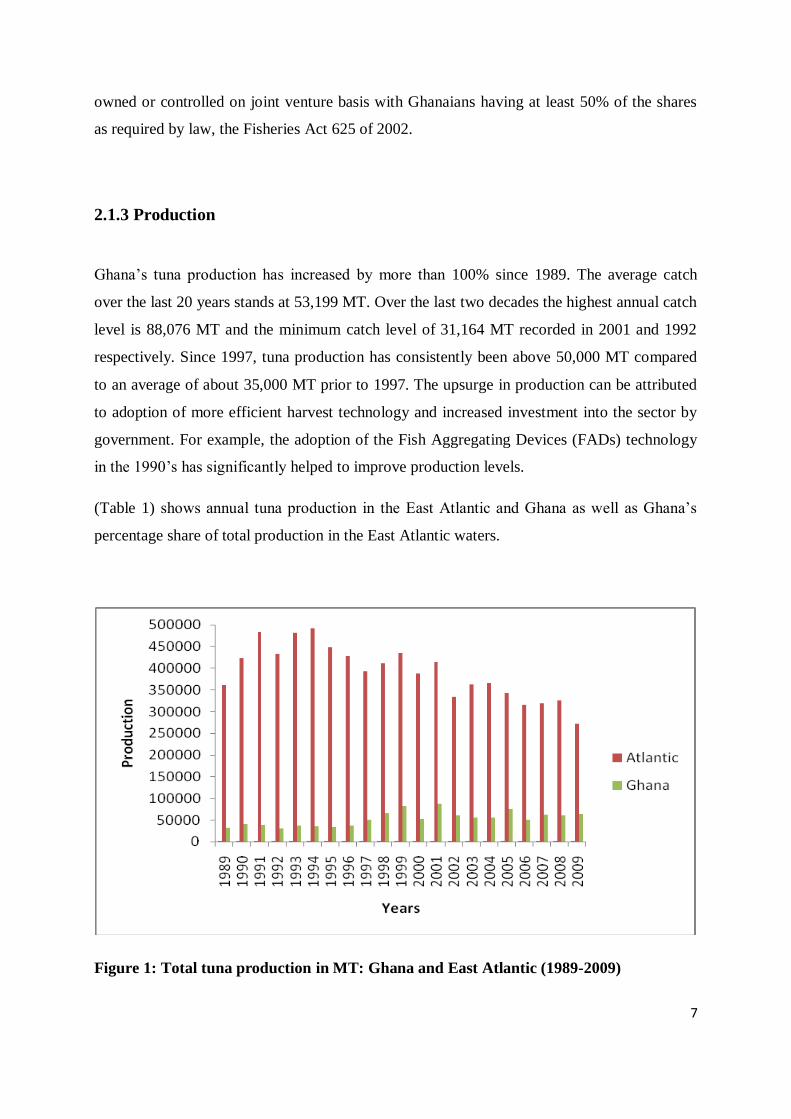
Ghana’s tuna production has increased by more than 100% since 1989. The average catch
over the last 20 years stands at 53,199 MT. Over the last two decades the highest annual catch
level is 88,076 MT and the minimum catch level of 31,164 MT recorded in 2001 and 1992
respectively. Since 1997, tuna production has consistently been above 50,000 MT compared
to an average of about 35,000 MT prior to 1997. The upsurge in production can be attributed
to adoption of more efficient harvest technology and increased investment into the sector by
government. For example, the adoption of the Fish Aggregating Devices (FADs) technology
in the 1990’s has significantly helped to improve production levels.
(Table 1) shows annual tuna production in the East Atlantic and Ghana as well as Ghana’s
percentage share of total production in the East Atlantic waters.
Figure 1: Total tuna production in MT: Ghana and East Atlantic (1989-2009)
8
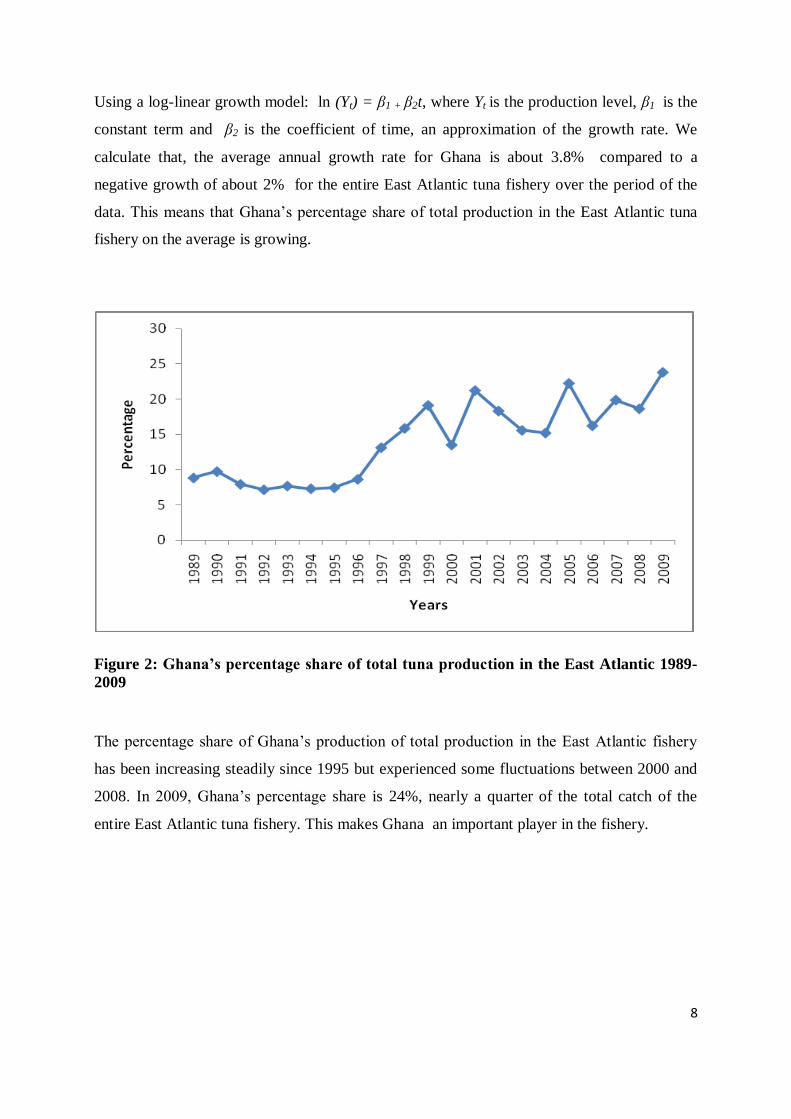
Using a log-linear growth model: ln (Yt) = β1 + β2t, where Yt is the production level, β1 is the
constant term and β2 is the coefficient of time, an approximation of the growth rate. We
calculate that, the average annual growth rate for Ghana is about 3.8% compared to a
negative growth of about 2% for the entire East Atlantic tuna fishery over the period of the
data. This means that Ghana’s percentage share of total production in the East Atlantic tuna
fishery on the average is growing.
Figure 2: Ghana’s percentage share of total tuna production in the East Atlantic 1989-
2009
The percentage share of Ghana’s production of total production in the East Atlantic fishery
has been increasing steadily since 1995 but experienced some fluctuations between 2000 and
2008. In 2009, Ghana’s percentage share is 24%, nearly a quarter of the total catch of the
entire East Atlantic tuna fishery. This makes Ghana an important player in the fishery.
9
2.1.4 Processing and Markets
The main landing site for tuna is the Tema Harbour. Bulk of the total landings is sold to the
tuna canneries and factories for processing into canned tuna products and lions for the export
market, mainly, the EU, USA and the Economic Community of West African States
(ECOWAS) markets. The Fisheries Act 625 law requires that at least 10% of tuna landings be
sold on the domestic market. Usually, undersized catches are sold on the local market. Frozen
low value tuna is imported to augment supply on the domestic market. In 2002, Ghana
imported about 21,000 tons of Yellowfin tuna amounting to $ 12 million (Lem, 2004).
Currently, there are about five tuna processing factories, all operating in and around Tema.
The three main tuna processing factories are, the Pioneer Food Cannery Ltd (PFC) a
subsidiary of Heinz USA and the Ghana Agro Food Company Ltd (GAFCO), joint venture
between the government of Ghana, Industrie-Bau Nord (IBN AG) and a local institutional
partner and Myroc Food Processing Company Ltd.
2.1.5 Employment
The sector employs thousands of persons both on onboard vessels as well as shore-based
processing plants and auxiliary business activities. By law, as stipulated in the Fisheries Act
625, at least 75% of officers and crew employed by owners of industrial or semi-industrial
fishing vessels must be Ghanaians. Several hundreds are also employed in land based
activities such as handling and storage. The canneries and processing plants are also key
sector employers. All together, the tuna fishing industry provides employment for several
thousands of people.
2.1.6 Governance and Management
The national fisheries policy framework of Ghana is provided by the law, the Fisheries Act
625 of 2002. The Act provides for the regulation and management of fisheries, regarding the
development of the fishing industry and the sustainable exploitation of fishery and aquatic
10
resources. The Act establishes the Fisheries Commission, the regulatory fishery body. The
object and function of the commission include:
1. Regulation and management of the utilization of fishery resource and policy co-
ordination
2. Preparation and continual review of fisheries management and development plans
3. Conflict resolution
4. Monitoring, control and surveillance
5. Research and stock assessment
6. Ensuring sustainable exploitation of fishery resource
Management of the tuna fishery is done by Marine Fisheries Research Division (MFRD) of
the Fisheries Commission. The MFRD, work within the ambit of the broader objectives and
functions of the Fisheries Commission. Among other things, MFRD monitor the marine
environment and how changes in the environment is impacting on the fishery, conducts stock
assessment and scientific research and provide information required for the preparation of the
fisheries management plans for marine fish stocks. They also collaborate with international
organizations in the management of shared fish resources. Management of the tuna fishery is
mainly by effort control, in the way of licensing. All fishing vessels are required to get a
license of operation from the Fisheries Commission before they participate in the fishery.
There are some restrictions on the type of gear or technology used in the harvest process. For
example, a moratorium has been placed on the use of fish aggregating devices (FADs).
Due to the highly migratory nature of tuna stocks and vessels, management of the stock
requires both domestic and international management. In terms of international cooperation,
Ghana is a member of the International Commission for the Conservation of the Atlantic Tuna
(ICCAT). ICCAT is responsible for the conservation and sustainable management of tuna and
tuna-likes species in the Atlantic Ocean and neighboring seas. The organization was
established in 1966 in Rio de Janeiro, Brazil following the preparation, adoption and signing
of the international convention for the conservation of Atlantic Tunas at a Conference of
Plenipotentiaries. Currently, there are 48 contracting parties in the Commission. The core
11
function of the Commission is research with main focus on the effects of fishing on stock
abundance and ensuring the sustainability of the stock.
2.2 EU Import Market Situation
The EU continues to rely on imported fish and fishery products to meet its growing demand.
Considerable portion of total world’s export of fish and seafood products ends up on the EU
market. The European Union is the world’s largest importer of fish and seafood products.
Import regulations are harmonized in that; same rules apply in all EU countries. In 2007, the
EU imported €16 billion worth of fish and fishery products to augment domestic supply. This
accounts for more than 60% of its fish consumption (www. ec.europa.eu/trade, visited
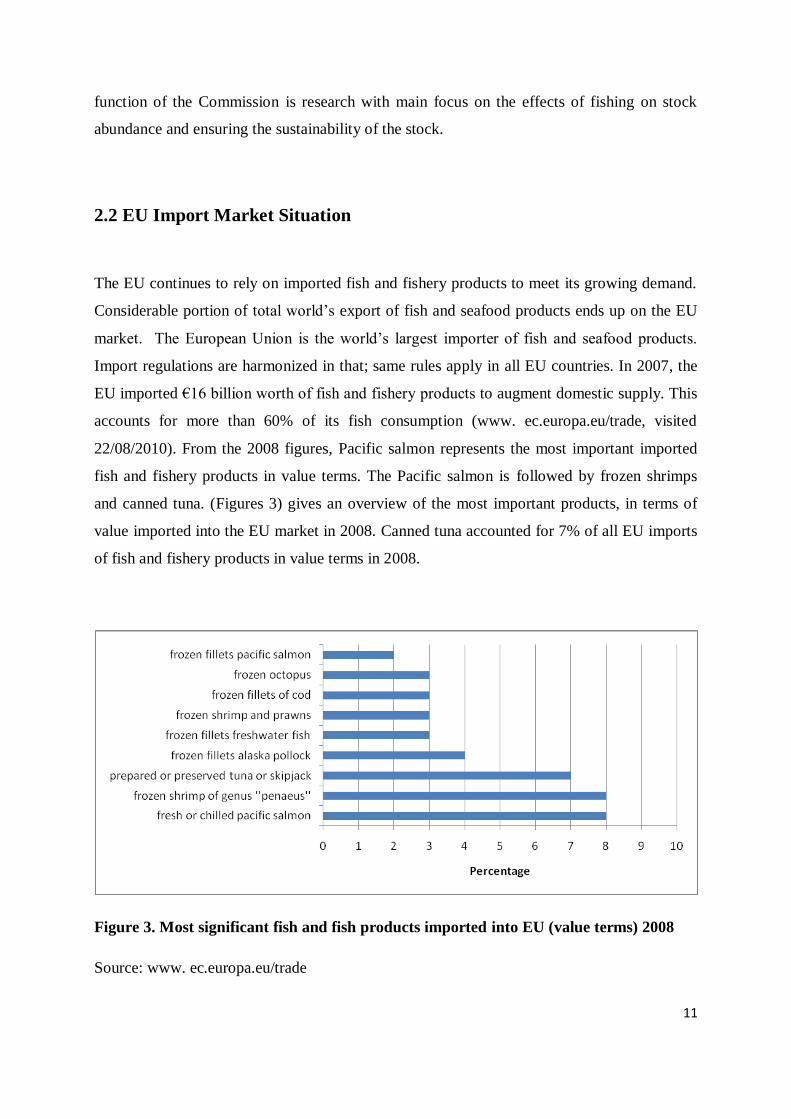
22/08/2010). From the 2008 figures, Pacific salmon represents the most important imported
fish and fishery products in value terms. The Pacific salmon is followed by frozen shrimps
and canned tuna. (Figures 3) gives an overview of the most important products, in terms of
value imported into the EU market in 2008. Canned tuna accounted for 7% of all EU imports
of fish and fishery products in value terms in 2008.
Figure 3. Most significant fish and fish products imported into EU (value terms) 2008
Source: www. ec.europa.eu/trade
12
2.3 Import Policies: Tariff Measures
Canned tuna and tuna loins (a semi-processed product for use in canning) attracts a Most
Favoured Nation (MFN) import duty rate of 24%. On the other hand, the community has
suspended tariffs on imports of unprocessed tuna destined for the processing industry of the
EU community. This is part of efforts to guarantee adequate supply of raw material for the
sector. The canning industry located mainly in Spain, France and Italy provides a major
source of employment and revenue especially in coastal communities. In 2004, the
community passed regulation (Council Regulation (EC) No 379/2004) opening and providing
for the running of autonomous tariff quota for certain fishery products for the period 2004-
2006. Tuna loins for processing had an annual quota of 4,000 tonnes at quota duty of 6%.
This quota was doubled in 2007 and increased to 9,000 tonnes and 10,000 tonnes in 2008 and
2009 respectively.
However, major exporting countries of these products have continued to benefit from
unrestricted duty-free access to the EU market under the various tariff preferences schemes,
chiefly, the Africa, Caribbean and Pacific (ACP) states tariff preferences or through the
Generalized System of Preferences (GSP)+ regime. The duty free access to the EU market is
in consideration of the substantial investments in tuna canning made by some EU countries in
certain ACP and Latin American countries (http://ec.europa.eu/trade, visited on 23/08/2010).
2.3.1 ACP-EU Partnership Agreement
The ACP comprise of 79 member states. The Economic Partnership Agreement (EPA)
between the ACP and EU- the ACP-EU Partnership Agreement dates back to the year 2000
with the signing of the Cotonou Agreement. From 1975, when the ACP group of countries
was formed to 2000 when the Cotonou Agreement was signed, economic relations between
the ACP and European Community were regulated by the Lomé Conventions (Lomé I - Lomé
IV). Significant advances in the global economy as well as changes in the socio-eco-political
landscape of ACP countries brought to the fore the need to have a second look at ACP-EU
economic relations thus the birth of the ACP-EU Partnership Agreement. The principal aim of
13
the new EPA is to help ACP countries integrate into the global economy, share and benefit
from the prospects of globalization. The partnership agreement is expected to promote and
boost trade between the ACP countries and the EU. The increased trade is expected to deliver
a number of benefits to both consumers and producers in Europe and ACP countries. A wider
market translates into more sales for producers which in turn will generate employment and
income thereby reducing poverty. The EU consumers stand to benefit from increased
competition resulting from enhanced trade in the EU market by way of declining average
price and wider range of goods to choose from. It is worthy to note that 6 out of the 10 top
canned tuna exporting countries into the EU market are members of the ACP group. Ghana,
Cote d’Ivoire, Madagascar, Mauritius, Papua New Guinea and Seychelles all six countries are
among the top ten exporters of canned tuna to the EU are signatories to the ACP-EU
Partnership Agreement and as such enjoy zero and unreciprocated tariff on fish and fishery
products exported to the EU. The export performance of these countries hinges on, to a very
large extent the preferential access enjoyed under the Agreement.
2.3.2 Generalized System of Preferences (GSP) regime
The GSP is an EU trade arrangement through which 176 developing countries are provided
with preferential access to the EU market. The incentive is in the form of unreciprocal
reduced tariffs for goods exported into the EU market. The principal objective of this tariff
measure is poverty reduction and providing the impetus for sustainable development and good
governance. GSP has three variant preference regimes, namely
The standard GSP, offers preferential access to 176 beneficiaries countries and
territories
The Everything But Arms (EBA) incentive, provides duty-free, quota-free access for
all goods for the 49 Least Developed Countries (LDCs)
The GSP+, provides further tariff reductions to support vulnerable developing
countries. Beneficiary countries as a requirement must have ratified and implemented
27 given international conventions. The conventions cover issues on human and
labour rights, sustainable development, and good governance.
14
Under the GSP+, countries are considered vulnerable on the basis of its size or the scope of
diversification in its exports. Limited diversification in this context is defined as meaning that
more than 75% of total GSP-covered export to the EU is represented by the 5 leading
categories of its GSP- covered export of the beneficiary country. Additionally, GSP- covered
imports from the beneficiary country must also equates to less than 1% of total EU imports
under GSP.
Canned tuna and tuna loins exporting beneficiary countries under the GSP+ regime are
located in Latin America (http://ec.europa.eu/trade visited on 28/08/2010). Ecuador and
Guatemala both leading canned tuna exporting countries are beneficiaries under GSP+
incentive.
2.3.3 WTO Negotiations
The preferential access treatment enjoyed by countries under the ACP-EU and the GSP
regimes and the repeated concerns raised by the Philippines and Thailand both major canned
tuna exporting countries, led to World Trade Organization (WTO) mediation between the EU
on one hand and the Philippines and Thailand on the other hand. Subsequent to the mediation,
a reduced tariff quota for canned tuna was opened in July 2003 for Thailand and the
Philippines. The EU opened a quota of 25,000 tonnes at 12% duty, a 50% reduction of the
MFN rate of 24%. The quota was revised up to 25,750 tonnes on 1 July 2004.
2.4 Import Policies: Non-Tariff Measures
Non- tariff measures raises grave concern for many fish and fish product exporting countries
because of its potential to impede market access. This is because of the complex and stringent
nature of the requirements these exporting countries must satisfy in order to access the EU
market. Limited capacity in terms of financial, human and technical competence of these
countries further aggravates the problem (Doherty, 2010). The increasing requirements and
15
standards are driven by growing health and safety concerns by consumers. In a speech at the
Conference on EU Exports and Sanitary and Phytosanitary Measures, Brussels 27 May 2005,
Peter Mandelson, the EU Trade Commissioner pointed out that ‘‘the future challenges in
trade policy will not be in the field of traditional tariffs, but in the so-called non-tariff barriers
to trade, to which the question of standards is crucial’’. Mould (2005) posits that, several
millions of dollars of potential trade may be lost through the imposition of these measures.
Notwithstanding the preferential access treatment Ghana’s tuna export enjoys under the ACP-
EU Agreement, the sector like that of many other ACP countries is under intense strain to
meet the ever increasing health and safety standards imposed by these measures, and as such
not benefiting fully from the potential gains it could enjoy under the Agreement. Two
agreements on non-tariff measures are of paramount importance to the sector, namely, The
WTO Agreement on the Application of Sanitary and Phytosanitary Measures (SPS
Agreement) and the Agreement on Technical Barriers to Trade (TBT Agreement).
The SPS Agreement established in the Uruguay Round defines sanitary and phytosanitary
measures to include ‘‘all relevant laws, decrees, regulations, requirements and procedures
including, inter alia, end product criteria; processes and production methods; testing,
inspection, certification and approval procedures; quarantine treatments including relevant
requirements associated with the transport of animals or plants, or with the materials
necessary for their survival during transport; provisions on relevant statistical methods,
sampling procedures and methods of risk assessment; and packaging and labeling
requirements directly related to food safety’’.
Under the Agreement the WTO recognizes the sovereign right of member states to set their
own food safety and health standards; however the SPS measures must be science-based. The
nature and scale of the potential risk must be unambiguous and the SPS measure must be
proportionate to the perceived risk. The measures should not ‘‘arbitrarily or unjustifiably
discriminate between Members where identical or similar conditions prevail, including
between their own territory and that of other Members. Sanitary and phytosanitary measures
16
shall not be applied in a manner which would constitute a disguised restriction on
international trade.’’
On the other hand, TBT Agreement seeks to ensure that, the preparation, adoption and
application of technical regulations and standards by governments that define product
characteristics, such as its packaging, labeling, design or use for the purpose of pursuing
legitimate public policy objectives for example human health and safety, fauna and flora life,
environment, consumer protection from deceptive practices, or national security concerns do
not result in unjustifiable and unnecessary obstruction to international trade.
The increasing use of these non-tariff barriers coupled with other issues like the application of
complex rules of origin and eco-labeling poses a serious challenge to the growth of Ghana’s
tuna export and can eventually impair the competitiveness of Ghana’s tuna exports. To
address the challenges posed, the government of Ghana with the support of donor partners
like the EU has invested substantially in institutional capacity building to ensure fish export
meets the health, safety and quality standards of the EU. The Ghana Standard Board (GSB),
the elected Competent Authority (CA) to undertake standard developments and harmonization
and fish inspection and quality certification for exports has been resourced and equipped to
ensure Ghana fish meets the export market requirements. Additionally, the government with
the support of donors has put in place measures to ensure compliance with Hazard Analysis
Critical Control Point (HACCP).
17
3: Theoretical Framework
3.1The Revealed Comparative Advantage (RCA)
The theory of comparative advantage was first introduced by David Ricardo to explain the
underpinnings of international trade. According to Ricardo (1817), ‘‘comparative’’ rather than
‘‘absolute’’ advantages provide the impetus for international trade as advanced by John Stuart
Mill and Adam Smith earlier on. Mill and Smith posited that, a country will export a good
when it is the lowest cost producer of that good. The Ricardian Model however explains that,
countries can still benefit from international trade through specialization in production of
goods where it has comparative advantage even though the country has absolute advantage in
all goods or can produce all goods more efficiently than other countries and that comparative
advantage stems from differences in technology across countries.
The theory of international trade was taken a step further by the works of Heckscher and
Ohlin (1991). The Heckscher-Ohlin (H-O) theory emphasizes and attributes comparative
advantage to differences in factor endowment and cost differences in factor prices across
countries (Leamer 1995; Ruffin 1988; Leishman et al, 1999). By implication, a country will
export goods which are relatively intensive in the utilization of a factor which the country is
relatively well endowed (Leishman et al, 1999).
Leung and Cai (2005) argues that comparative advantage can be obtained either through an
increase in benefit gained by the production activity or a reduction in its opportunity cost.
This implies that, comparative advantage is dependent on both demand-side factors
(consumer preference) and supply-side factors (largely, factor endowment and technologies).
18
Comparative advantage has both equilibrium and a dynamic aspect. Thus, comparative
advantage can be analyzed from these two perspectives. The equilibrium aspect defines
equilibrium specialization patterns in the long run, whereas from the dynamic standpoint, the
concept of comparative advantage shows the latent changes in specialization and trade
patterns. These two aspects of comparative advantage provide valuable information on a
country’s most advantageous trade pattern in the long run, and also point out a country’s
short-term development priorities (Leung and Cai, 2005). A clear distinction between these
two aspects is very important because each has a different policy implication. The decision to
increase specialization or not will be influenced by a whether comparative advantage is
viewed from the equilibrium or dynamic spectacle (Cai et al, 2009; Leung and Cai, 2005).
From the dynamic point of view if ‘‘an autarky country has comparative advantage in one
good it implies that under free trade this country has tendency to increase specialization in
that goods and export it’’ (Leung and Cai, 2005). On the other hand, if the country’s actual
specialization level is already optimal ‘‘then an attempt to further increase specialization
could be counterproductive’’ (Cai et al, 2009).
Furthermore, comparative advantage can be employed both as a descriptive (or positive) and
prescriptive (or normative) concepts. While the former provides ‘‘a basic explanation of the
international pattern of specialization in production and trade’’, the latter offer ‘‘guidelines for
government policies on resources allocation and trade’’ (UNIDO, 1986) as quoted by Leung
and Cai (2005).
There are two complementary approaches in comparative advantage analysis provided by the
economic literature (Cai et al., 2009; Leung and Cai, 2005). These are; the Domestic
Resource Cost (DRC) or the Benefits- Costs (BC) approach and the Revealed Comparative
Advantage (RCA) approach.
The DRC/BC approach uses social profitability to determine comparative advantage. A
country’s comparative advantage is measured by the DRC ratio. A lower ratio indicates more
19
efficient utilization of domestic resources and greater profitability, ¨thus, a greater advantage
(Cai et al., 2009; Leung and Cai, 2005). This approach is more data demanding and
particularly not useful for international trade analysis.
De Benedictis and Tamberi (2001), notes that, countries will specialize in and be net exporters
of goods in which they have comparative advantage under free trade conditions. The
theoretical implication is that, under relatively general conditions, the observation of the
difference between autarkic and free trade relative prices should identify goods or sector in
which a country has a comparative advantage. A positive sign is indicative of comparative
advantage in the production and export of that particular commodity, whereas, a negative sign
will indicate comparative disadvantage (Deardorff, 1980).
However, relative autarky prices are unobservable variables (De Benedictis and Tamberi,
2001; Balance, Forstner and Murray 1987) and post- trade prices are also influenced by trade
flows (Balance, Forstner and Murray 1987). Therefore, prices cannot be used directly to
identify true comparative advantage. To circumvent this challenge, comparative advantage
pattern is ascribed using information on post-trade variables for example, production, imports,
exports and consumption (De Benedictis and Tamberi, 2001; Balance, Forstner and Murray
1987).
The RCA approach uses ex post trade patterns to determine or identify sectors which a
country has a comparative advantage. Balance, Forstner and Murray (1987), notes that,
economic conditions (EC) in various trading countries determine the international pattern of
comparative advantage (CA). The patterns of comparative advantage, in turn, influence the
pattern of international trade, production and consumption (TPC) among countries. Indices to
‘reveal’ comparative advantages (revealed comparative advantage) can be constructed from
TPC variables.
20
Balance, Forstner and Murray (1987) adds that, although in a real world situation (many
countries, products and factors), the clear-cut application of this model to determine the
relationship between CA and TPC will not be possible, indices based on real world post- trade
observations may ‘‘reveal’’ much about the underlying pattern of comparative advantage.
Several methods or techniques for calculating RCA has been suggested in the literature
employing different combinations of the variables (production, imports, exports and
consumption) to infer comparative advantage.
A widely used method is the Balassa RCA index also known as the Balassa Index. The Index
measures the relative advantage or disadvantage of a country in a product or group of
products as evidenced by the export structure or ‘‘revealed’’ by observed trade flows. It
measures normalized export shares vis-à-vis to export of the same industry by other countries.
It ‘‘reveals’’ the comparative advantage or disadvantage of a country rather than establishing
the causal sources of the advantage or disadvantage.
The Balassa index (BI) introduced by Balassa (1965) is defined as this:
(1) w
ik
X
X
X
XRCA
wk
i
ik
Where
RCAik = revealed comparative advantage index of country i in exporting product k,
Xik = country i’s export value of product k,
Xi = total export value of country i,
Xwk = total world’s export value of product k,
Xw = total world’s export value.
In this study, k = canned tuna and i = Ghana and competitor countries.
21
The RCA index compares the national export structure (the numerator) to the world’s export
structure (the denominator). The index takes any positive value, and if the value of RCA is
greater than 1, it implies that the country in question has comparative advantage with regard
to exporting the particular product. Likewise, if the value of RCA is less than 1, it may be said
the country has comparative disadvantage in exporting the given product. Balance, Forstner
and Murray (1987) provide three ways in which the RCA indices can be interpreted. Firstly,
the index quantifies the commodity-specific degree of comparative advantage enjoyed by one
country with reference to any other countries or set of countries. Secondly, the index provides
commodity-specific rankings of countries based on the value of the index. Thirdly, the index
provides a demarcation between countries that reveal comparative advantage in a particular
commodity or sector and those countries that do not. Balance, Forstner and Murray (1987)
refer to these three alternate interpretations as cardinal, ordinal and dichotomous measures
respectively.
De Benedictis and Tamberi (2001) demonstrated that, interpreting the Balassa Index in a
cardinal way allows for the preservation of the raw export data information content and offers
possibility of both rankings and demarcation interpretation values but present some problems.
Two of these problems are asymmetry (variability of the upper bound) and across-time
ranking (variability of the mean value). Asymmetry means that, the values of RCA ranges
from 1 to infinity for products in which a country has a revealed comparative advantage but
only from zero to 1 for product in which a country has a comparative disadvantage (Iapadre,
2001). Others have criticized the Balassa Index that it produces biased results due to the
exclusion of imports in the model. To address these and other shortcomings, alternative
normalization of the index has been proposed.
Dalum, Laursen and Villumsen (1998) and Laursen (1998) proposes a different normalization
called the revealed symmetric comparative advantage (RSCA) index:
(2) 1
1
ik
ik
RCA
RCARSCA
22
The RSCA is an approximation of the log transformation of the Balassa Index. This
normalization makes the index symmetric with values ranging from -1 to 1. A country has
comparative advantage in a particular sector, if 0 < RSCA < +1, while it has comparative
disadvantage if -1 < RSCA < 0.
Vollrath (1991) proposes three alternative specification of the revealed comparative analysis.
These are the relative trade advantage (RTA), the logarithm of the relative export advantage
(ln RXA) and the revealed competitiveness (RC).
The relative trade advantage (RTA) is calculated as the difference between relative export
advantage (RXA) and relative import advantage (RMA). RXA is equivalent to the BI. The
RTA can be expressed as follows:
(3) RTA = RXA – RMA
Where
wX
X
X
XRCARXA
wk
i
ik
and
wM
M
M
MRMA
wk
i
ik
Therefore,
(4) ww M
M
M
M
X
X
X
XRTA
wk
i
ikwk
i
ik
23
The second alternate RCA definition is the logarithm of the relative export advantage (RXA),
specified as;
(5) ln (RXA).
The third measure, the revealed competitiveness (RC) is defined as the difference between the
logarithm of the RXA and the logarithm of the RMA, given as:
(6) RC = ln (RXA) – ln (RMA)
Given the varied and alternate measures of the RCA suggested in the literature, the
consistency of these measures has been questioned. Balance, Forstner and Murray (1987)
examined the empirical consistency among alternative RCA indices. Correlation coefficients
for alternative pairs of RCA indices were compared for examining the consistency among
cardinal RCA measures. The results of the calculations show that alternative specifications of
RCA indices give values that are highly inconsistent. Consequently, the choice of RCA index
as a cardinal measure might be highly sensitive to the particular index used. Rank correlation
coefficients were calculated to determine whether pairs of RCA indices give a consistent
ranking of countries by the degree of comparative advantage. The results indicate a high
degree of consistency among the net export indices and a moderate level of consistency with
the others. The consistency tests for RCA indices as dichotomous measures reveal a generally
high level of consistency.
Considering the limitations of the index, it is important that policy makers make cautious
interpretation of the RCA indices. The analysis of the statistical characteristics of the RCA
index can provide very useful information on the state and dynamics of a country’s advantage
in international trade (De Benedicts and Tamberi, 2001). More so, it is important to note that,
government policies and interventions like import restriction, export subsidies and other
protectionist measures might distort the true reflection of comparative advantage or
disadvantage revealed (Ferto and Hubbard, 2003).
24
Despite the limitations of the RCA index, it still can be useful in providing a systematic
framework for comparing specialization patterns across countries. This information can offer
invaluable insight into trade experiences of countries at advanced stages and which will help
in trade development strategies formulation (Leung and Cai, 2005). Taking into consideration
the limitations and the problems presented when using the RCA as a cardinal measure of
comparative advantage, the study focuses on the ordinal trends of revealed comparative
advantage.
3.2 Market Share Index
The competitiveness and competitive position of a product on the market is amply reflected in
the product’s market share. This index measures the ability of an exporting country to
increase its market share in the target market with respect to countries exporting the same
product to the same target market. The index is measured by the following formula:
(7) 100*
i
ikik M
XMS
Where
MSik = is market share of product k by country i in the target market,
Xik = the total export of good k by country i to the target market
Mk = the total import of product k by area or region constituting the target market
Even though, changes in the market share are not totally attributable to changes in
competitiveness, the index nevertheless provides an accepted indication of the exporting
country’s or region’s competitiveness in relation to the export market (Chen and Duan, 2001).
The main advantage of this index is that is it easy to calculate and perceive. It provides simple
but useful information for evaluating the international competitiveness of a country or a
firm.
25
3.3 Constant Market Share (CMS) Model
To infer competitiveness from changes in exports, the CMS model is applied. The CMS
analysis, also called the ‘‘shift-share’’ analysis, is used to decompose the changes in export
value. The model was first applied to the study of international trade by Tyszynski (1951).
The model is used to identify factors or components that could cause changes in a country’s
export share overtime. The CMS analysis can be applied as a descriptive or diagnostic tool
(Ahmadi-Esfahani, 2006). The basic model provides a two-level decomposition of changes in
export. Chen and Duan (2001) explains, in the first level, the CMS model decomposes the
changes in export into three factors: changes in export related to changes in the export market
(structural effect), changes in exports due to changes in competitiveness of the exporting
country (competitive effect) and change in export as a result of the combined effect of
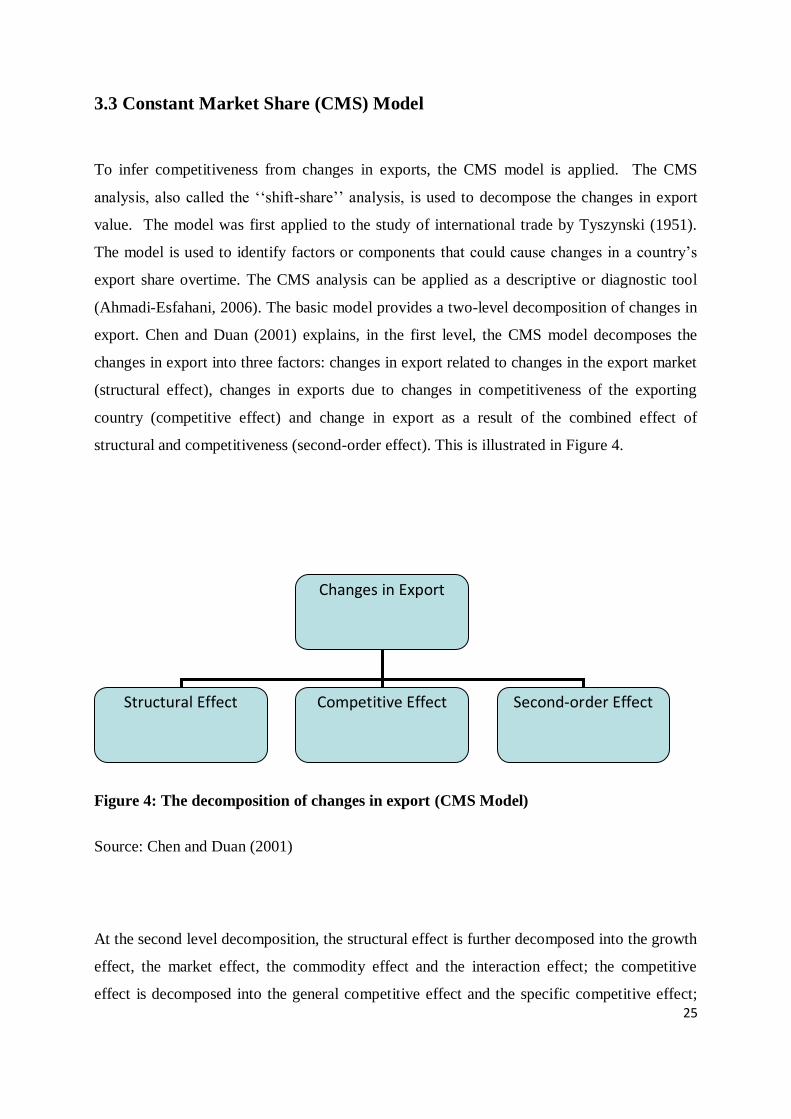
structural and competitiveness (second-order effect). This is illustrated in Figure 4.
Figure 4: The decomposition of changes in export (CMS Model)
Source: Chen and Duan (2001)
At the second level decomposition, the structural effect is further decomposed into the growth
effect, the market effect, the commodity effect and the interaction effect; the competitive
effect is decomposed into the general competitive effect and the specific competitive effect;
Changes in Export
Structural Effect Competitive Effect Second-order Effect
26
and the second-order effect is broken into the pure second-order effect and the dynamic
structural effect. This study will be restricted to the first level of CMS analysis.
The first-level CMS analysis in this study uses a version provided by Chen and Duan (2001).
(8) Δq = i j
sijo
ΔQij + i j
Qijo Δsij +
i j
Δsij ΔQij
Structural Effect Competitive Effect Second- order Effect
Where,
q = exporting country’s export (value)
Sij = exporting country’s market share of product i market j
Qij = total import of product i by market j
Δ = change in the two periods,
The superscript 0 represent the base year.
Merkies and van der Meer (1988) related the CMS method to a two-stage homethetic demand
model. They derived that the, competitiveness term is a supply term and the structural or
market term as a demand term.
Houston (1967), Richardson (1971a) and Richardson (1971b) have questioned the theoretical
foundation and policy relevance of the CMS technique but De Lomabaerde (1995) argues
that, the practical usefulness of the CMS technique far outweigh the points raised by critics of
the method. The main advantage of the CMS method is that, it presents a very simplified
method for examining export growth.
27
3.4 Determinants
An empirical analysis of the factors that affect the market share of Ghana is conducted using
the Armington trade model. The trade model developed by Armington (1969) distinguishes
commodities by country of origin and import demand is determined in a two-step procedure.
Such that, for example, Ghanaian canned tuna is distinguished from canned tuna imported
from Thailand and the two products would represent two imperfectly substitutable products
on EU market.
The basic assumptions underlying the Armington model are; separability between different
import sources and homotheticity of import demands. The implications of weak separability
relate to the potential substitution effect among commodity groups (Alston et al. 1990). Thus,
the elasticity of substitution between two competing products on a market, are the same and
constant. The assumption of homotheticity implies that the market share of a country is
independent of group expenditure. As a result, all expenditure elasticities are identical and
unitary and a country’s import market shares vary only in response to relative price changes.
The model is specified either in the quantity market share or expenditure market share form.
In this study, the quantity market share form is adopted. The model is specified as:
(9) qi/Q = biσ (pi/P)
-σ i = 1, 2,……..,m
Where:
m
ni iqQ is total import for commodity in question
q = the quantity imported from country i
P= import price index
m
i i Qq1
pi)/( , is the trade weighted price of the commodity
σ = the targets market elasticity of substitution for the commodity in question
b = country specific parameter
qi/Q = Mi, the quantity market share of the commodity from country i the destination market
28
Equation (9) can be specified in log-linear functional form as:
(10) ln Mi = α –σ ln (pi/P), the variable α is the constant term.
The Armington model has received a barrage of criticism in recent years (Davies and Kruse,
1993; Alston et al. 1990; Winter, 1984). Alston et al. (1990) and Winter (1984) tested the
separability and homotheticity assumptions of the Armington model. The empirical results
rejected the assumptions in both cases. Winter (1984) advocates for the adoption of more
sophisticated models such as the AIDS model (Deaton and Muellbauer, 1980), which allows
for greater generality and flexibility in factoring in the expenditure and substitution effects on
demand even if separable import allocation models are to be used. However, Alston et al.
(1990) argues that, the use of such parametrically more generous specification (such as the
AIDS model) amounts to taken on an increased risk of getting the wrong signs in exchange
for the mains advantages the Armington model offers. They further argue that, the
misspecification of the AIDS is also possible.
Notwithstanding, the criticism of the Armington model, it presents a useful tool for trade
modeling. The main advantage of the model is it’s relatively ease of use and few parameters
to be estimated, while at the same time maintaining compatibility with demand theory (Alston
et al. 1990). The linear form of the model allows for modifications to the basic form to
account for other factors such exchange rate, trend, dummy variables etc. The extensive
application of model to international agricultural markets and adoption in Computable
General equilibrium (CGE) models stems from the plausible and statistically significant
parameter estimates the model often gives (Alston et al. 1990).
29
4: Data
The main data source for this thesis is the Eurostat database. For the index calculations and
the analysis of specialization and competitiveness, yearly data on import values and quantity
of canned tuna as well total imports (all products) into the EU-27 for the period of 1999-
2009 were extracted. However, for the regression analysis to determine the factors influencing
Ghana’s market share, monthly rather than yearly observations covering the same period
(1999 - 2009) were used. This is to avoid the problems associated with a small degree of
freedom. The dataset for the regression analysis has 132 observations.
4.1 Product
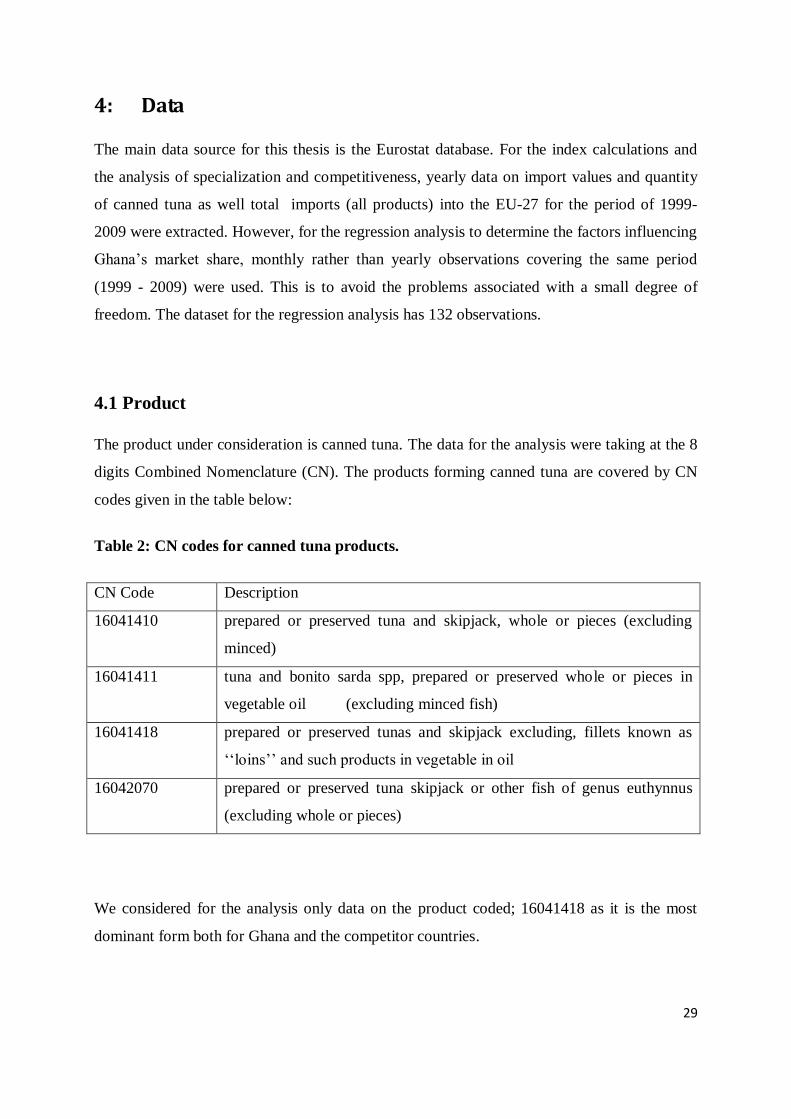
The product under consideration is canned tuna. The data for the analysis were taking at the 8
digits Combined Nomenclature (CN). The products forming canned tuna are covered by CN
codes given in the table below:
Table 2: CN codes for canned tuna products.
CN Code Description
16041410 prepared or preserved tuna and skipjack, whole or pieces (excluding
minced)
16041411 tuna and bonito sarda spp, prepared or preserved whole or pieces in
vegetable oil (excluding minced fish)
16041418 prepared or preserved tunas and skipjack excluding, fillets known as
‘‘loins’’ and such products in vegetable in oil
16042070 prepared or preserved tuna skipjack or other fish of genus euthynnus
(excluding whole or pieces)
We considered for the analysis only data on the product coded; 16041418 as it is the most
dominant form both for Ghana and the competitor countries.
30
4.2 Price
Dataset on prices were constructed by dividing the value of import by the quantity imported
derived from the eurostat database, in a euro per 100 kg unit of measurement. We include in
the regression model, relative price index as an explanatory variable.
4.3 Exchange rate
Theoretically we know that, the currency depreciation of the domestic currency (appreciation
of the foreign currency against the local currency) makes domestic products cheaper relative
to its competitors in the international market. This will increase foreign demand resulting in
increased export market share, ceteris paribus. By implication, a depreciation of the Ghana
cedi relative to its competitors is expected to increase the competitiveness of Ghanaian canned
tuna export in the EU market. In line with this theory, bilateral exchange rate variable was
included in the model as an explanatory variable for changes in Ghana’s market share.
Historical data on the exchange rate between the Euro currency (EUR) and the Ghanaian
Cedis (GHS) were obtained from www.oanda.com, an internet - based forex trading and
currency information service. Monthly average Euro/ Cedi (EUR/GHS) inter-bank exchange
rates were obtained. Figures for the Ghana cedi (GHC) prior July, 2007 were divided by
10,000 in order to have amounts equivalent to the new Ghana cedi (GHS).1
1 The Bank of Ghana re-denominated cedi currency in July 2007. The new currency numeraire was set at 10,000
old Ghana cedi (10,000 GHC) to 1 new Ghana cedi (1 GHS)
31
4.4 Policy Effect (WTO mediation)
Trade analyst have suggested that opening of reduced tariff quota for Philippines and
Thailand in July 2003 following the WTO mediation between the EU and the two countries
could impact negatively upon the competitive advantage of ACP exporting countries by
eroding the gains of the preferential access treatment enjoyed under ACP- EU partnership
agreement. These sentiments are aptly captured in the resolution passed by ACP-EU Joint
Parliamentary Assembly in April 2003. Part of which reads ‘‘having regard to the mediation
within the WTO regarding a reduction in customs duties for canned tuna exported by
Thailand and the Philippines and the mediators' proposal which has been forwarded to the
European Commission calls on the EU to’’ among other things ‘‘refrain adopting the
mediators proposal’’
This assertion is empirically tested by including a dummy variable as an explanatory factor
for changes in Ghana’s market share to capture the effect of this policy. The dummy variable
takes the value of zero (0) for the period prior to July 2003 and 1 thereafter. A method
proposed by Halvorsen and Palmquist (1980) was used to interpret the effect of the dummy
variable. The percentage effect on the dependent by the factor represented by the dummy
variable is given as 100*g = 100 *{exp(c) - 1} where the relative effect on the dependent
variable is g = exp(c) – 1 and c is the coefficient of the dummy variable obtained from the
regression results.
32
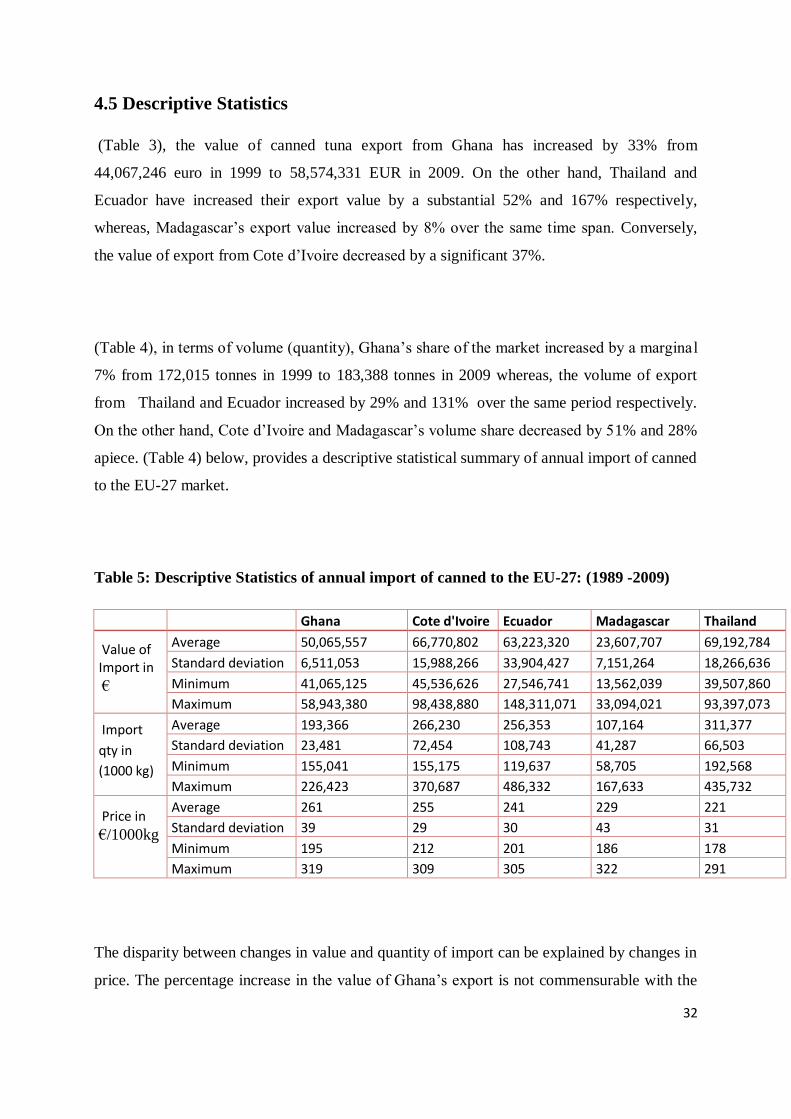
4.5 Descriptive Statistics
(Table 3), the value of canned tuna export from Ghana has increased by 33% from
44,067,246 euro in 1999 to 58,574,331 EUR in 2009. On the other hand, Thailand and
Ecuador have increased their export value by a substantial 52% and 167% respectively,
whereas, Madagascar’s export value increased by 8% over the same time span. Conversely,
the value of export from Cote d’Ivoire decreased by a significant 37%.
(Table 4), in terms of volume (quantity), Ghana’s share of the market increased by a margina l
7% from 172,015 tonnes in 1999 to 183,388 tonnes in 2009 whereas, the volume of export
from Thailand and Ecuador increased by 29% and 131% over the same period respectively.
On the other hand, Cote d’Ivoire and Madagascar’s volume share decreased by 51% and 28%
apiece. (Table 4) below, provides a descriptive statistical summary of annual import of canned
to the EU-27 market.
Table 5: Descriptive Statistics of annual import of canned to the EU-27: (1989 -2009)
Ghana Cote d'Ivoire Ecuador Madagascar Thailand
Value of Import in
€
Average 50,065,557 66,770,802 63,223,320 23,607,707 69,192,784
Standard deviation 6,511,053 15,988,266 33,904,427 7,151,264 18,266,636
Minimum 41,065,125 45,536,626 27,546,741 13,562,039 39,507,860
Maximum 58,943,380 98,438,880 148,311,071 33,094,021 93,397,073
Import
qty in
(1000 kg)
Average 193,366 266,230 256,353 107,164 311,377
Standard deviation 23,481 72,454 108,743 41,287 66,503
Minimum 155,041 155,175 119,637 58,705 192,568
Maximum 226,423 370,687 486,332 167,633 435,732
Price in
€/1000kg
Average 261 255 241 229 221
Standard deviation 39 29 30 43 31
Minimum 195 212 201 186 178
Maximum 319 309 305 322 291
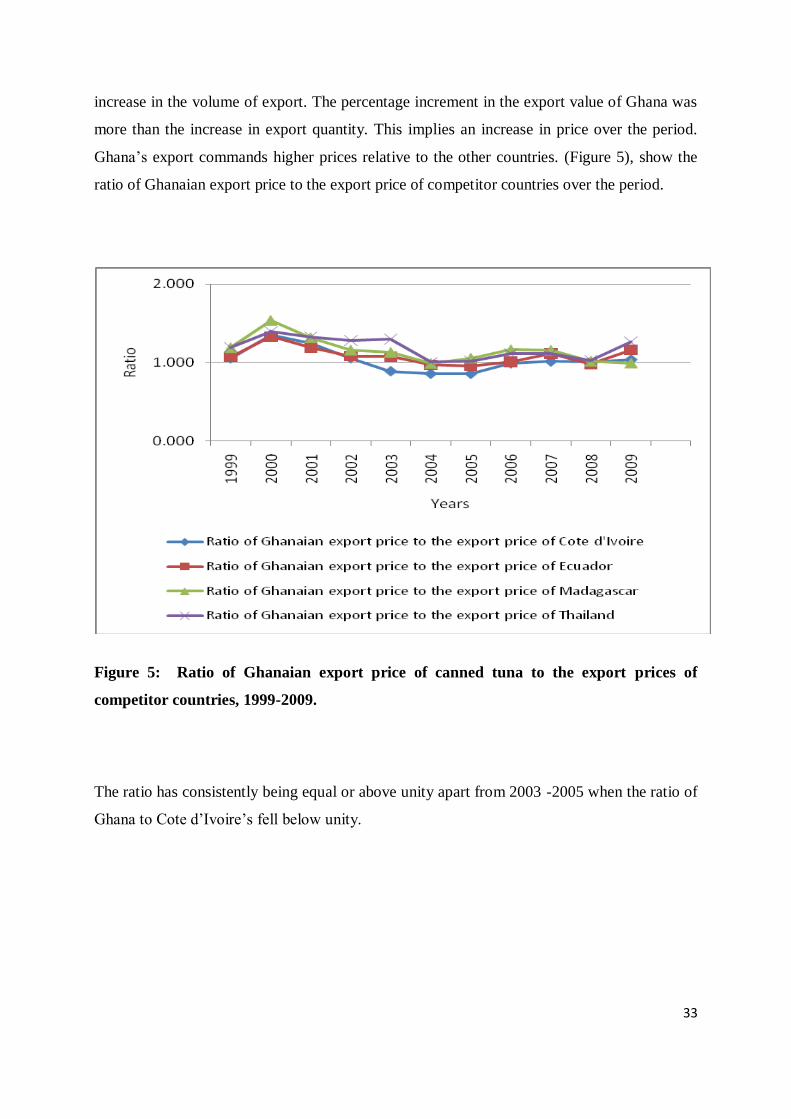
The disparity between changes in value and quantity of import can be explained by changes in
price. The percentage increase in the value of Ghana’s export is not commensurable with the
33
increase in the volume of export. The percentage increment in the export value of Ghana was
more than the increase in export quantity. This implies an increase in price over the period.
Ghana’s export commands higher prices relative to the other countries. (Figure 5), show the
ratio of Ghanaian export price to the export price of competitor countries over the period.
Figure 5: Ratio of Ghanaian export price of canned tuna to the export prices of
competitor countries, 1999-2009.
The ratio has consistently being equal or above unity apart from 2003 -2005 when the ratio of
Ghana to Cote d’Ivoire’s fell below unity.

34
5: Results and Discussion
5.1 Specialization
The results of the RCA analysis (Table 6 and Figure 6) shows that based on the dichotomous
interpretation of the RCA index, Ghana as well as the other competitor countries have a RCA
greater than 1; therefore have a comparative advantage in the export of canned tuna in all the
period under study. Ghana made impressive stride in the growth of its RCA index from 1999
to 2001 coinciding with a similar trend in its market share over the same period before
declining in 2002. Incidentally, Ghana’s lost 3.8% of its market share at the same time that the
RCA dropped. Ecuador experienced a similar trend in its RCA index growth. Cote d’ Ivoire,
Madagascar and Thailand on the other hand, experienced unstable trend of their RCA indices
over the same period.
In terms of the ordinal interpretation of the RCA, Ghana ranked first, with an average RCA
index of 92.15 over the period 1999-2001. Cote d’Ivoire, Madagascar, Ecuador and Thailand
ranked, second, third, fourth and fifth with RCA of 72.59, 61.27, 60.81 and 8.59 respectively
over the same period.
Over the period 2002- 2005, Ghana’s RCA index made a steady increase from 74.4 in 2002 to
109.45 in 2005. Ecuador enjoyed a consistent increase in its RCA index, moving from 63.85
in 2002 to 108.61 in 2005. Cote d’Ivoire and Thailand experienced unstable trend,
nevertheless, Thailand’s RCA index increased from 8.99 in 2002 to 13.47 in 2005 but that of
Cote d’Ivoire declined. Madagascar made an impressive gain in its RCA index, taking an
‘‘Olympic jump’’ from 94.12 in 2002 to 163.56 in 2005.
In terms of ranking, Ghana dropped to the second position with an average RCA index of
90.68 following first placed Madagascar with 124.97. Ecuador, Cote d’Ivoire and Thailand
ranked third, fourth and fifth with 84.87, 59 and 8.91 respectively. Between the two periods
35
(1999- 2001 and 2002-2005), the RCA index of Ghana and Cote d’Ivoire declined whiles the
index of Madagascar, Ecuador and Thailand increased.
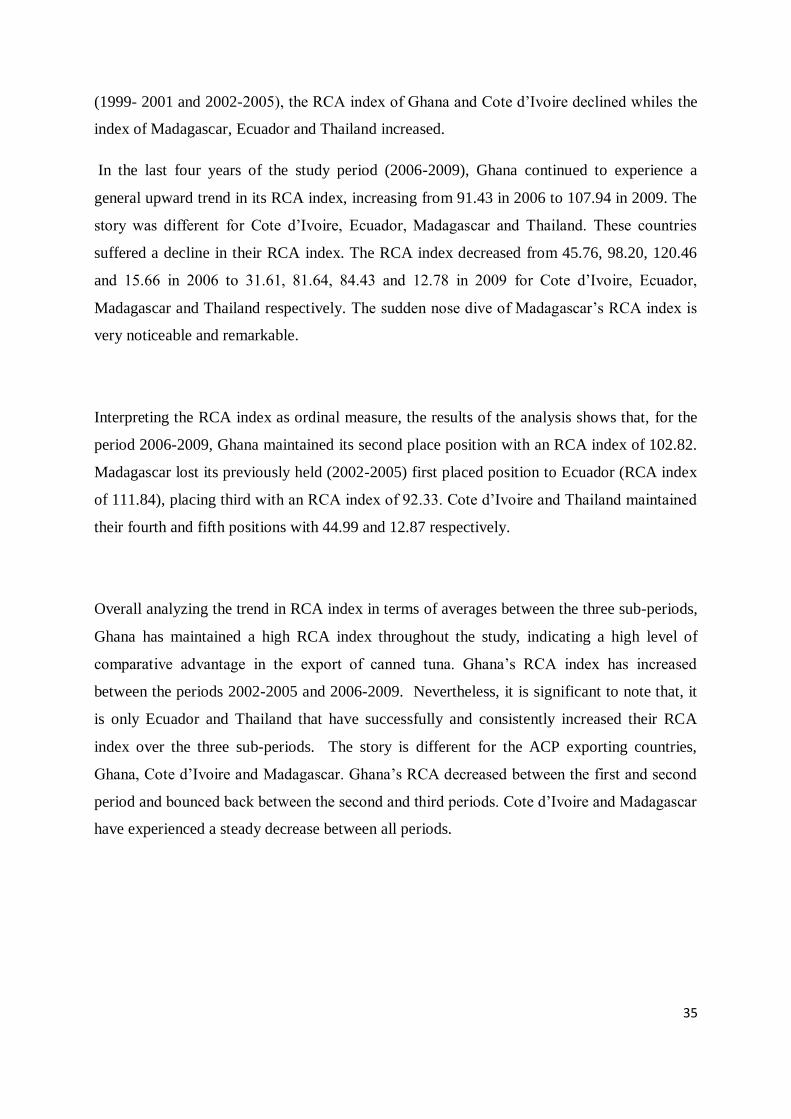
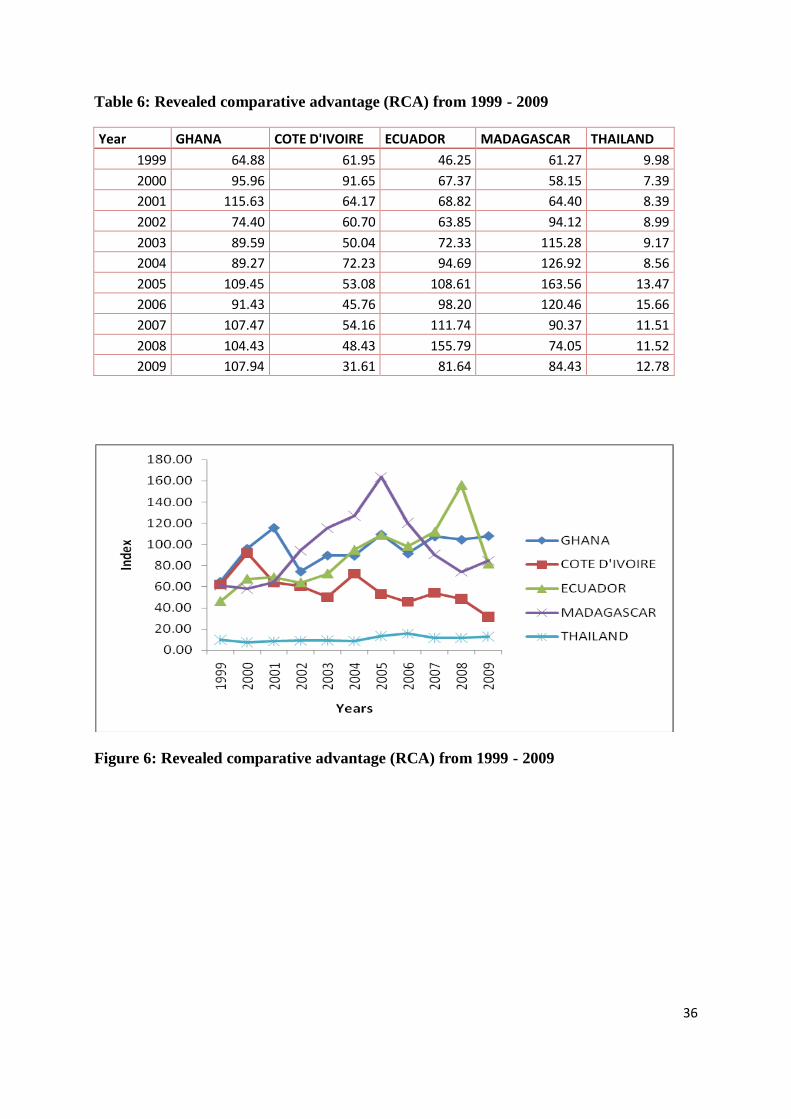
In the last four years of the study period (2006-2009), Ghana continued to experience a
general upward trend in its RCA index, increasing from 91.43 in 2006 to 107.94 in 2009. The
story was different for Cote d’Ivoire, Ecuador, Madagascar and Thailand. These countries
suffered a decline in their RCA index. The RCA index decreased from 45.76, 98.20, 120.46
and 15.66 in 2006 to 31.61, 81.64, 84.43 and 12.78 in 2009 for Cote d’Ivoire, Ecuador,
Madagascar and Thailand respectively. The sudden nose dive of Madagascar’s RCA index is
very noticeable and remarkable.
Interpreting the RCA index as ordinal measure, the results of the analysis shows that, for the
period 2006-2009, Ghana maintained its second place position with an RCA index of 102.82.
Madagascar lost its previously held (2002-2005) first placed position to Ecuador (RCA index
of 111.84), placing third with an RCA index of 92.33. Cote d’Ivoire and Thailand maintained
their fourth and fifth positions with 44.99 and 12.87 respectively.
Overall analyzing the trend in RCA index in terms of averages between the three sub-periods,
Ghana has maintained a high RCA index throughout the study, indicating a high level of
comparative advantage in the export of canned tuna. Ghana’s RCA index has increased
between the periods 2002-2005 and 2006-2009. Nevertheless, it is significant to note that, it
is only Ecuador and Thailand that have successfully and consistently increased their RCA
index over the three sub-periods. The story is different for the ACP exporting countries,
Ghana, Cote d’Ivoire and Madagascar. Ghana’s RCA decreased between the first and second
period and bounced back between the second and third periods. Cote d’Ivoire and Madagascar
have experienced a steady decrease between all periods.
36
Table 6: Revealed comparative advantage (RCA) from 1999 - 2009
Year GHANA COTE D'IVOIRE ECUADOR MADAGASCAR THAILAND
1999 64.88 61.95 46.25 61.27 9.98
2000 95.96 91.65 67.37 58.15 7.39
2001 115.63 64.17 68.82 64.40 8.39
2002 74.40 60.70 63.85 94.12 8.99
2003 89.59 50.04 72.33 115.28 9.17
2004 89.27 72.23 94.69 126.92 8.56
2005 109.45 53.08 108.61 163.56 13.47
2006 91.43 45.76 98.20 120.46 15.66
2007 107.47 54.16 111.74 90.37 11.51
2008 104.43 48.43 155.79 74.05 11.52
2009 107.94 31.61 81.64 84.43 12.78
Figure 6: Revealed comparative advantage (RCA) from 1999 - 2009
37
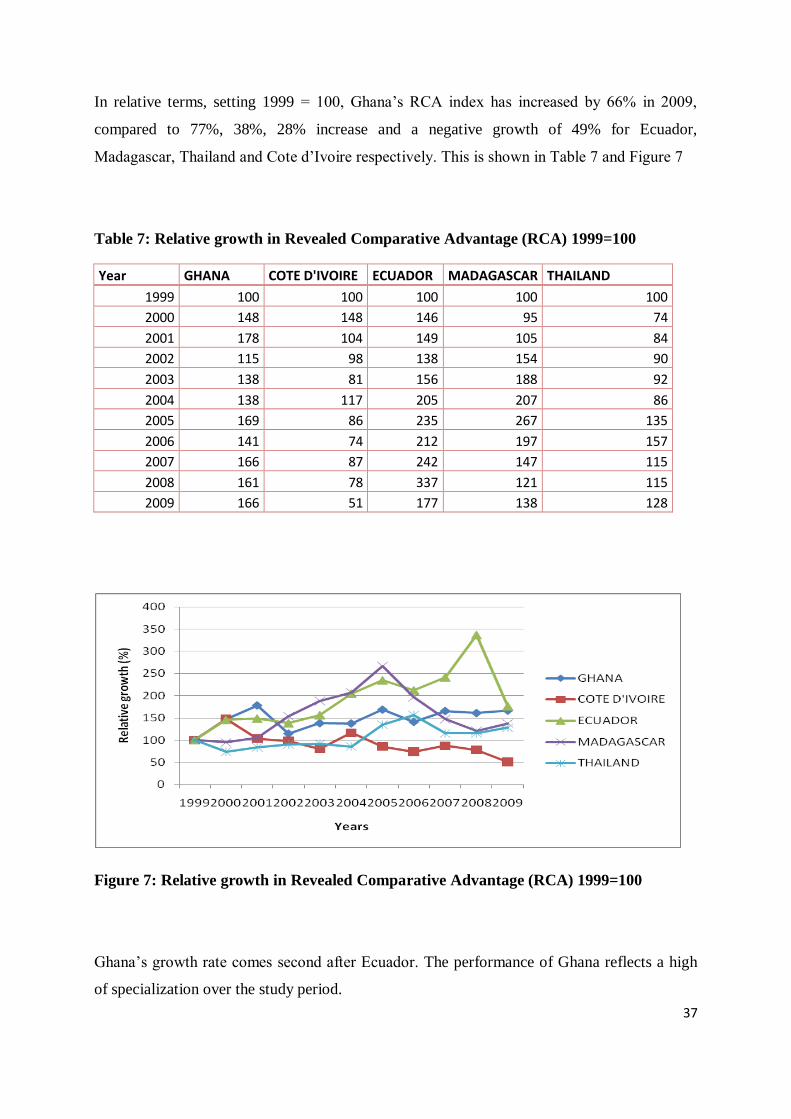
In relative terms, setting 1999 = 100, Ghana’s RCA index has increased by 66% in 2009,
compared to 77%, 38%, 28% increase and a negative growth of 49% for Ecuador,
Madagascar, Thailand and Cote d’Ivoire respectively. This is shown in Table 7 and Figure 7
Table 7: Relative growth in Revealed Comparative Advantage (RCA) 1999=100
Year GHANA COTE D'IVOIRE ECUADOR MADAGASCAR THAILAND
1999 100 100 100 100 100
2000 148 148 146 95 74
2001 178 104 149 105 84
2002 115 98 138 154 90
2003 138 81 156 188 92
2004 138 117 205 207 86
2005 169 86 235 267 135
2006 141 74 212 197 157
2007 166 87 242 147 115
2008 161 78 337 121 115
2009 166 51 177 138 128
Figure 7: Relative growth in Revealed Comparative Advantage (RCA) 1999=100
Ghana’s growth rate comes second after Ecuador. The performance of Ghana reflects a high
of specialization over the study period.
38
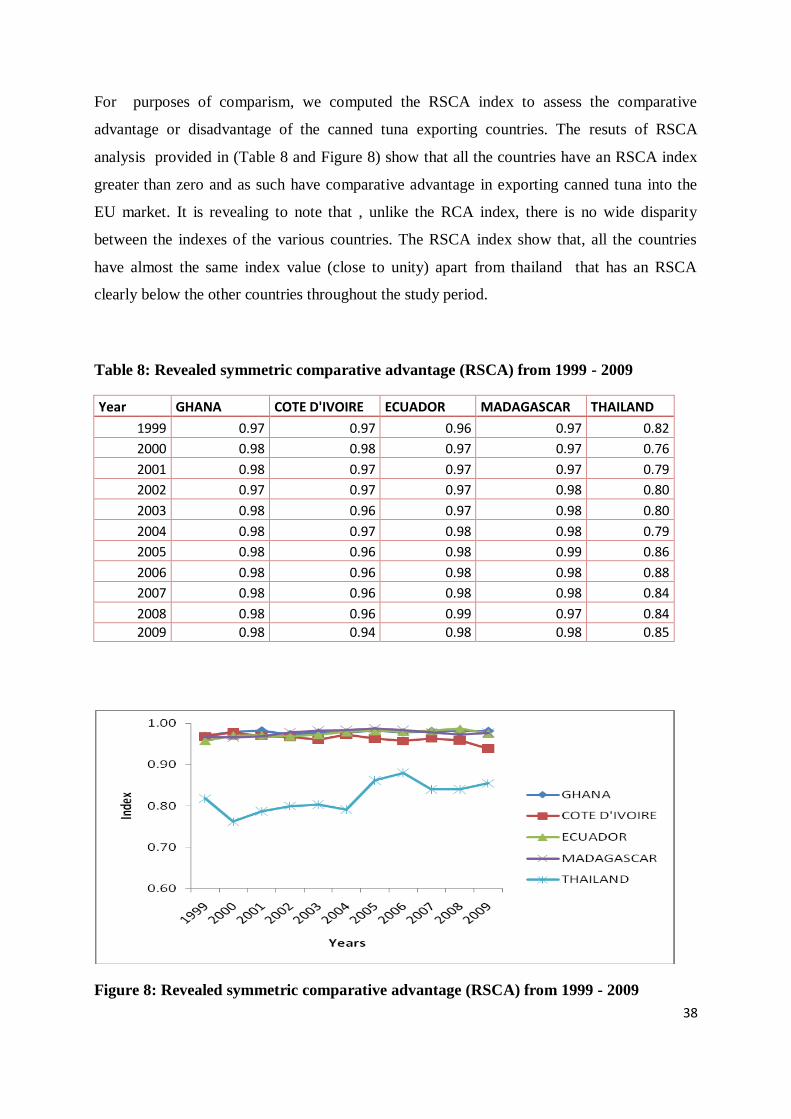
For purposes of comparism, we computed the RSCA index to assess the comparative
advantage or disadvantage of the canned tuna exporting countries. The resuts of RSCA
analysis provided in (Table 8 and Figure 8) show that all the countries have an RSCA index
greater than zero and as such have comparative advantage in exporting canned tuna into the
EU market. It is revealing to note that , unlike the RCA index, there is no wide disparity
between the indexes of the various countries. The RSCA index show that, all the countries
have almost the same index value (close to unity) apart from thailand that has an RSCA
clearly below the other countries throughout the study period.
Table 8: Revealed symmetric comparative advantage (RSCA) from 1999 - 2009
Year GHANA COTE D'IVOIRE ECUADOR MADAGASCAR THAILAND
1999 0.97 0.97 0.96 0.97 0.82
2000 0.98 0.98 0.97 0.97 0.76
2001 0.98 0.97 0.97 0.97 0.79
2002 0.97 0.97 0.97 0.98 0.80
2003 0.98 0.96 0.97 0.98 0.80
2004 0.98 0.97 0.98 0.98 0.79
2005 0.98 0.96 0.98 0.99 0.86
2006 0.98 0.96 0.98 0.98 0.88
2007 0.98 0.96 0.98 0.98 0.84
2008 0.98 0.96 0.99 0.97 0.84
2009 0.98 0.94 0.98 0.98 0.85
Figure 8: Revealed symmetric comparative advantage (RSCA) from 1999 - 2009
39
5.2 Competitiveness
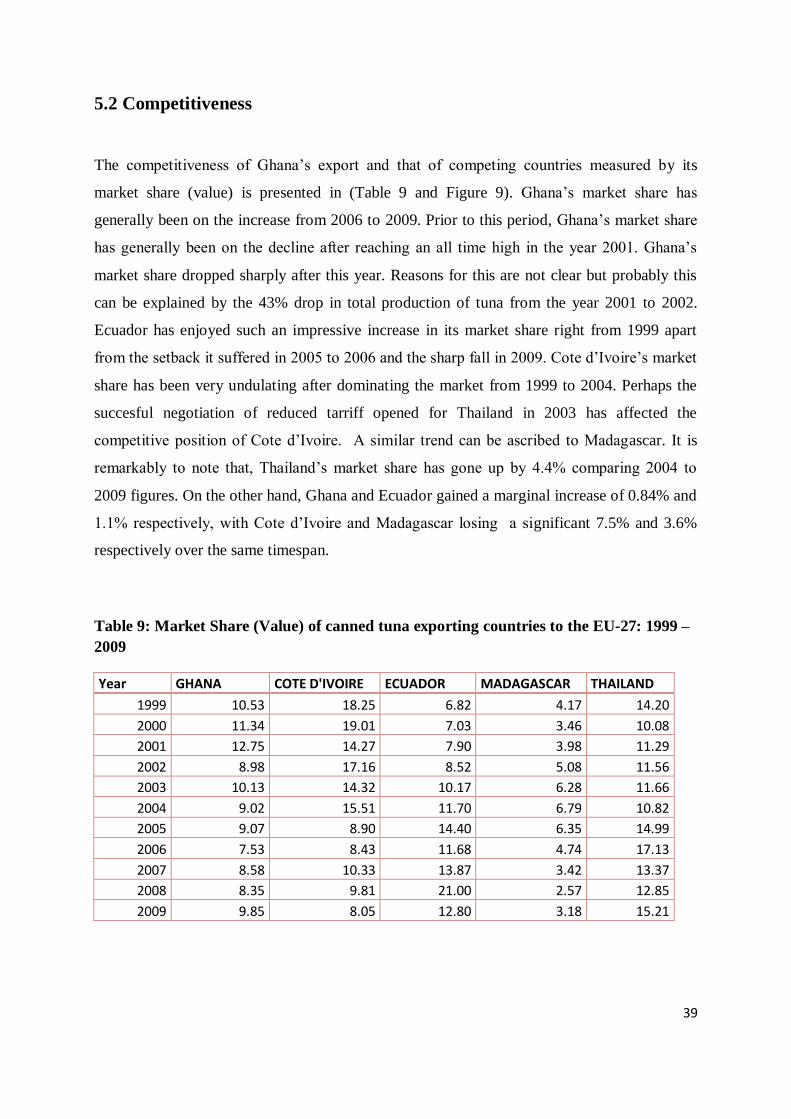
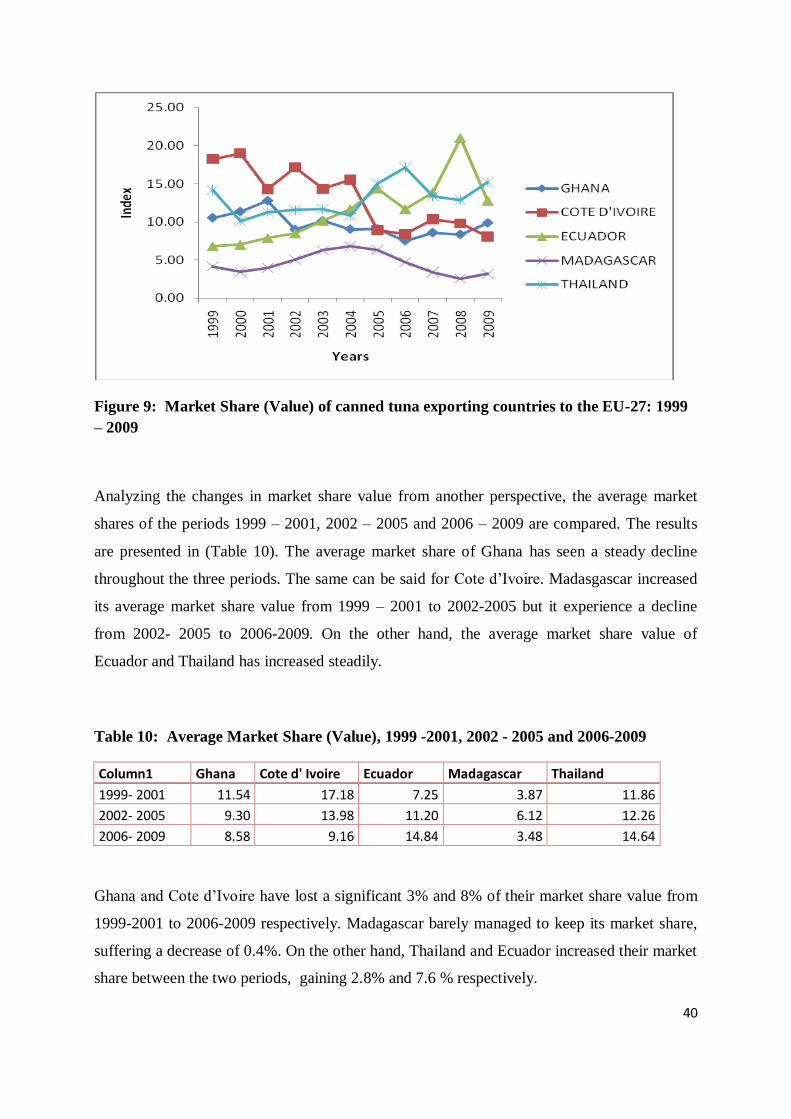
The competitiveness of Ghana’s export and that of competing countries measured by its
market share (value) is presented in (Table 9 and Figure 9). Ghana’s market share has
generally been on the increase from 2006 to 2009. Prior to this period, Ghana’s market share
has generally been on the decline after reaching an all time high in the year 2001. Ghana’s
market share dropped sharply after this year. Reasons for this are not clear but probably this
can be explained by the 43% drop in total production of tuna from the year 2001 to 2002.
Ecuador has enjoyed such an impressive increase in its market share right from 1999 apart
from the setback it suffered in 2005 to 2006 and the sharp fall in 2009. Cote d’Ivoire’s market
share has been very undulating after dominating the market from 1999 to 2004. Perhaps the
succesful negotiation of reduced tarriff opened for Thailand in 2003 has affected the
competitive position of Cote d’Ivoire. A similar trend can be ascribed to Madagascar. It is
remarkably to note that, Thailand’s market share has gone up by 4.4% comparing 2004 to
2009 figures. On the other hand, Ghana and Ecuador gained a marginal increase of 0.84% and
1.1% respectively, with Cote d’Ivoire and Madagascar losing a significant 7.5% and 3.6%
respectively over the same timespan.
Table 9: Market Share (Value) of canned tuna exporting countries to the EU-27: 1999 –
2009
Year GHANA COTE D'IVOIRE ECUADOR MADAGASCAR THAILAND
1999 10.53 18.25 6.82 4.17 14.20
2000 11.34 19.01 7.03 3.46 10.08
2001 12.75 14.27 7.90 3.98 11.29
2002 8.98 17.16 8.52 5.08 11.56
2003 10.13 14.32 10.17 6.28 11.66
2004 9.02 15.51 11.70 6.79 10.82
2005 9.07 8.90 14.40 6.35 14.99
2006 7.53 8.43 11.68 4.74 17.13
2007 8.58 10.33 13.87 3.42 13.37
2008 8.35 9.81 21.00 2.57 12.85
2009 9.85 8.05 12.80 3.18 15.21
40
Figure 9: Market Share (Value) of canned tuna exporting countries to the EU-27: 1999
– 2009
Analyzing the changes in market share value from another perspective, the average market
shares of the periods 1999 – 2001, 2002 – 2005 and 2006 – 2009 are compared. The results
are presented in (Table 10). The average market share of Ghana has seen a steady decline
throughout the three periods. The same can be said for Cote d’Ivoire. Madasgascar increased
its average market share value from 1999 – 2001 to 2002-2005 but it experience a decline
from 2002- 2005 to 2006-2009. On the other hand, the average market share value of
Ecuador and Thailand has increased steadily.
Table 10: Average Market Share (Value), 1999 -2001, 2002 - 2005 and 2006-2009
Column1 Ghana Cote d' Ivoire Ecuador Madagascar Thailand
1999- 2001 11.54 17.18 7.25 3.87 11.86
2002- 2005 9.30 13.98 11.20 6.12 12.26
2006- 2009 8.58 9.16 14.84 3.48 14.64
Ghana and Cote d’Ivoire have lost a significant 3% and 8% of their market share value from
1999-2001 to 2006-2009 respectively. Madagascar barely managed to keep its market share,
suffering a decrease of 0.4%. On the other hand, Thailand and Ecuador increased their market
share between the two periods, gaining 2.8% and 7.6 % respectively.
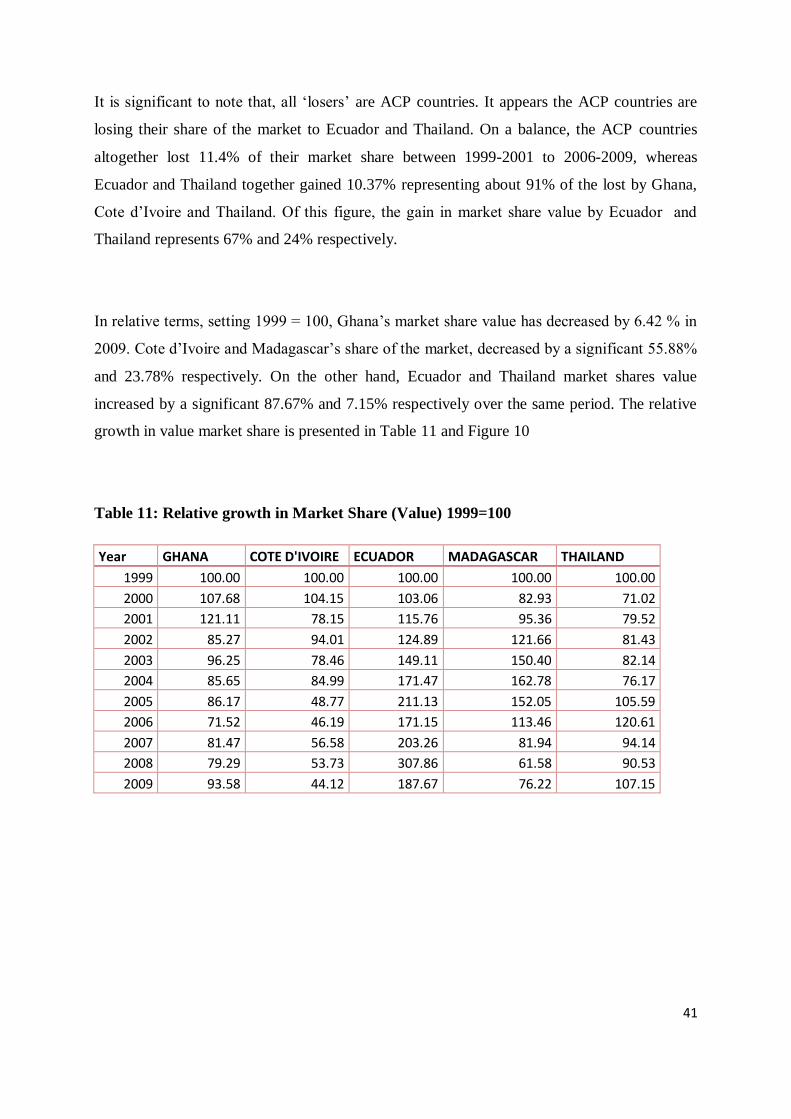
41
It is significant to note that, all ‘losers’ are ACP countries. It appears the ACP countries are
losing their share of the market to Ecuador and Thailand. On a balance, the ACP countries
altogether lost 11.4% of their market share between 1999-2001 to 2006-2009, whereas
Ecuador and Thailand together gained 10.37% representing about 91% of the lost by Ghana,
Cote d’Ivoire and Thailand. Of this figure, the gain in market share value by Ecuador and
Thailand represents 67% and 24% respectively.
In relative terms, setting 1999 = 100, Ghana’s market share value has decreased by 6.42 % in
2009. Cote d’Ivoire and Madagascar’s share of the market, decreased by a significant 55.88%
and 23.78% respectively. On the other hand, Ecuador and Thailand market shares value
increased by a significant 87.67% and 7.15% respectively over the same period. The relative
growth in value market share is presented in Table 11 and Figure 10
Table 11: Relative growth in Market Share (Value) 1999=100
Year GHANA COTE D'IVOIRE ECUADOR MADAGASCAR THAILAND
1999 100.00 100.00 100.00 100.00 100.00
2000 107.68 104.15 103.06 82.93 71.02
2001 121.11 78.15 115.76 95.36 79.52
2002 85.27 94.01 124.89 121.66 81.43
2003 96.25 78.46 149.11 150.40 82.14
2004 85.65 84.99 171.47 162.78 76.17
2005 86.17 48.77 211.13 152.05 105.59
2006 71.52 46.19 171.15 113.46 120.61
2007 81.47 56.58 203.26 81.94 94.14
2008 79.29 53.73 307.86 61.58 90.53
2009 93.58 44.12 187.67 76.22 107.15
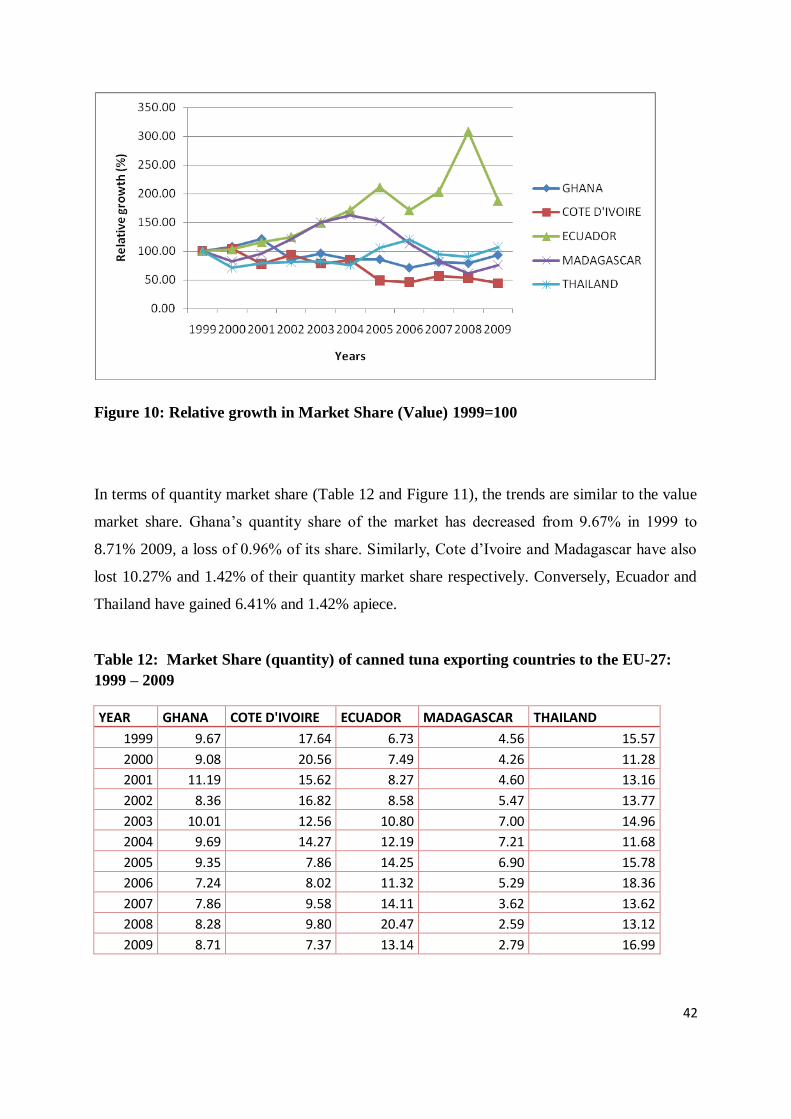
42
Figure 10: Relative growth in Market Share (Value) 1999=100
In terms of quantity market share (Table 12 and Figure 11), the trends are similar to the value
market share. Ghana’s quantity share of the market has decreased from 9.67% in 1999 to
8.71% 2009, a loss of 0.96% of its share. Similarly, Cote d’Ivoire and Madagascar have also
lost 10.27% and 1.42% of their quantity market share respectively. Conversely, Ecuador and
Thailand have gained 6.41% and 1.42% apiece.
Table 12: Market Share (quantity) of canned tuna exporting countries to the EU-27:
1999 – 2009
YEAR GHANA COTE D'IVOIRE ECUADOR MADAGASCAR THAILAND
1999 9.67 17.64 6.73 4.56 15.57
2000 9.08 20.56 7.49 4.26 11.28
2001 11.19 15.62 8.27 4.60 13.16
2002 8.36 16.82 8.58 5.47 13.77
2003 10.01 12.56 10.80 7.00 14.96
2004 9.69 14.27 12.19 7.21 11.68
2005 9.35 7.86 14.25 6.90 15.78
2006 7.24 8.02 11.32 5.29 18.36
2007 7.86 9.58 14.11 3.62 13.62
2008 8.28 9.80 20.47 2.59 13.12
2009 8.71 7.37 13.14 2.79 16.99
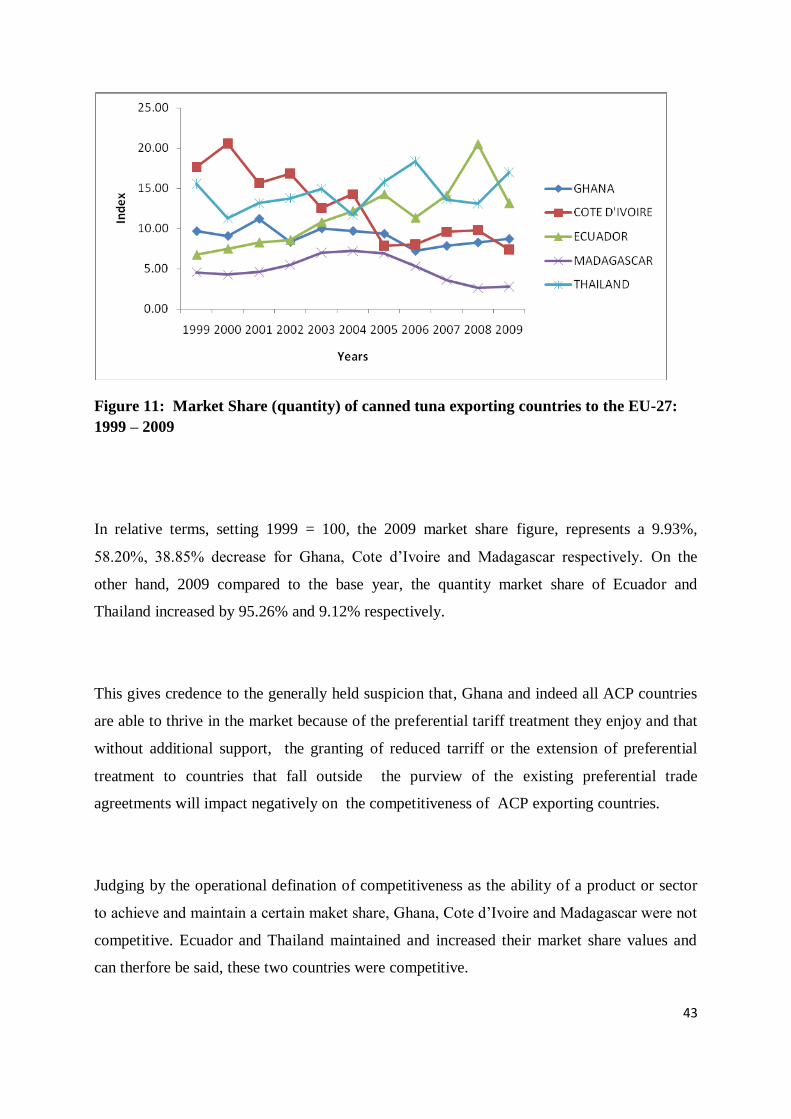
43
Figure 11: Market Share (quantity) of canned tuna exporting countries to the EU-27:
1999 – 2009
In relative terms, setting 1999 = 100, the 2009 market share figure, represents a 9.93%,
58.20%, 38.85% decrease for Ghana, Cote d’Ivoire and Madagascar respectively. On the
other hand, 2009 compared to the base year, the quantity market share of Ecuador and
Thailand increased by 95.26% and 9.12% respectively.
This gives credence to the generally held suspicion that, Ghana and indeed all ACP countries
are able to thrive in the market because of the preferential tariff treatment they enjoy and that
without additional support, the granting of reduced tarriff or the extension of preferential
treatment to countries that fall outside the purview of the existing preferential trade
agreetments will impact negatively on the competitiveness of ACP exporting countries.
Judging by the operational defination of competitiveness as the ability of a product or sector
to achieve and maintain a certain maket share, Ghana, Cote d’Ivoire and Madagascar were not
competitive. Ecuador and Thailand maintained and increased their market share values and
can therfore be said, these two countries were competitive.
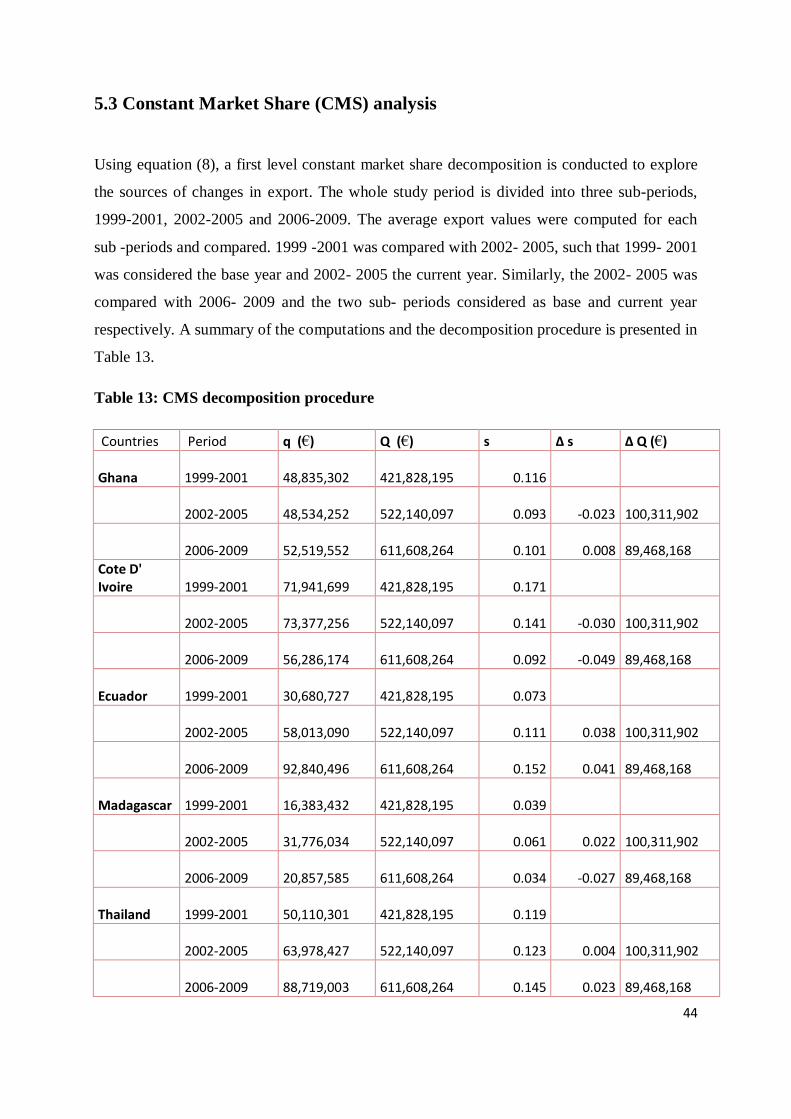
44
5.3 Constant Market Share (CMS) analysis
Using equation (8), a first level constant market share decomposition is conducted to explore
the sources of changes in export. The whole study period is divided into three sub-periods,
1999-2001, 2002-2005 and 2006-2009. The average export values were computed for each
sub -periods and compared. 1999 -2001 was compared with 2002- 2005, such that 1999- 2001
was considered the base year and 2002- 2005 the current year. Similarly, the 2002- 2005 was
compared with 2006- 2009 and the two sub- periods considered as base and current year
respectively. A summary of the computations and the decomposition procedure is presented in
Table 13.
Table 13: CMS decomposition procedure
Countries Period q (€) Q (€) s ∆ s ∆ Q (€)
Ghana 1999-2001 48,835,302
421,828,195 0.116
2002-2005 48,534,252
522,140,097 0.093 -0.023
100,311,902
2006-2009 52,519,552
611,608,264 0.101 0.008
89,468,168
Cote D' Ivoire 1999-2001
71,941,699
421,828,195 0.171
2002-2005 73,377,256
522,140,097 0.141 -0.030
100,311,902
2006-2009 56,286,174
611,608,264 0.092 -0.049
89,468,168
Ecuador 1999-2001 30,680,727
421,828,195 0.073
2002-2005 58,013,090
522,140,097 0.111 0.038
100,311,902
2006-2009 92,840,496
611,608,264 0.152 0.041
89,468,168
Madagascar 1999-2001 16,383,432
421,828,195 0.039
2002-2005 31,776,034
522,140,097 0.061 0.022
100,311,902
2006-2009 20,857,585
611,608,264 0.034 -0.027
89,468,168
Thailand 1999-2001 50,110,301
421,828,195 0.119
2002-2005 63,978,427
522,140,097 0.123 0.004
100,311,902
2006-2009 88,719,003
611,608,264 0.145 0.023
89,468,168
45
The results of the CMS decomposition of the change in export values to the EU-27 from 1999
to 2009 for Ghana and the competitor countries are provided in Table 14. Between the first
two sub-periods, 1999- 2001 and 2002- 2005, all countries except Ghana increased their
export values with Ecuador being the largest gainer. Ghana lost about 300, 000 euro of its
export value, which equated to 2% decrease in its market share. Cote d’Ivoire, Ecuador,
Madagascar, and Thailand increased their export value by 1.4 million, 27.3 million, 15.3
million and 13.8 million euro respectively. In contrast, the EU- market value increased by
over 100 million euro over the same period. The first level CMS decomposition show that, the
contribution of structural effect to the increase in export value was 1191%, 26%, 86% and
25.3% for Cote d’ Ivoire, Ecuador, Thailand and Madagascar respectively. The contribution
of structural effect to the changes in Ghana’s export value was positive, however the gains
from the growth of the market was offset by the negative effects of the other components.
In terms of competitiveness, the contribution of the competitive effect to the increase in
export was positive for Ecuador, Thailand and Madagascar, while for Cote d’Ivoire it
contributed negatively. Madagascar was the strongest competitor with 60.3% of the increase
in export value attributed to competitive effect, followed by Ecuador and Thailand with
59.2% and 11% respectively. On the other hand, the competitive effect contributed massively
(3197%) to the decrease in Ghana’s export value. In actual terms, Ghana’s export value was
reduced by over 9.6 million euro due to the negative competitive effect.
Over all, between the two sub-periods (1999-2001 and 2002-2005) Ghana made a poor
showing in terms competitiveness compared to the other countries. Reasons for this are not
obvious, but the effects of exchange rate movements cannot be ruled out.
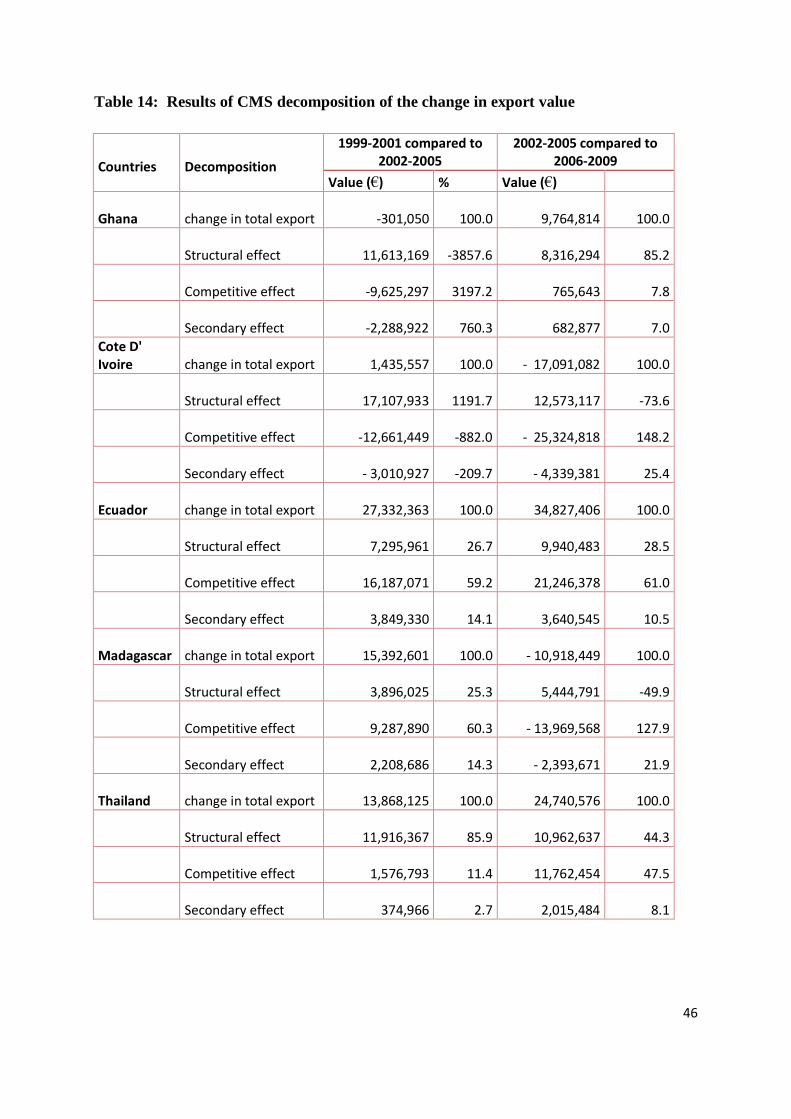
46
Table 14: Results of CMS decomposition of the change in export value
Countries
Decomposition
1999-2001 compared to 2002-2005
2002-2005 compared to 2006-2009
Value (€) % Value (€)
Ghana change in total export -301,050 100.0
9,764,814 100.0
Structural effect 11,613,169 -3857.6
8,316,294 85.2
Competitive effect -9,625,297 3197.2
765,643 7.8
Secondary effect -2,288,922 760.3
682,877 7.0
Cote D' Ivoire change in total export 1,435,557 100.0 - 17,091,082 100.0
Structural effect 17,107,933 1191.7
12,573,117 -73.6
Competitive effect -12,661,449 -882.0
- 25,324,818 148.2
Secondary effect - 3,010,927 -209.7
- 4,339,381 25.4
Ecuador change in total export 27,332,363 100.0
34,827,406 100.0
Structural effect 7,295,961 26.7
9,940,483 28.5
Competitive effect 16,187,071 59.2
21,246,378 61.0
Secondary effect 3,849,330 14.1
3,640,545 10.5
Madagascar change in total export 15,392,601 100.0
- 10,918,449 100.0
Structural effect 3,896,025 25.3
5,444,791 -49.9
Competitive effect 9,287,890 60.3
- 13,969,568 127.9
Secondary effect 2,208,686 14.3
- 2,393,671 21.9
Thailand change in total export 13,868,125 100.0
24,740,576 100.0
Structural effect 11,916,367 85.9
10,962,637 44.3
Competitive effect 1,576,793 11.4
11,762,454 47.5
Secondary effect 374,966 2.7
2,015,484 8.1
47
Between the second sub-period (2002- 2005) and the third sub-period (2006- 2009), the
results of the CMS decomposition indicates that, Ghana, Ecuador and Thailand increased their
export values, whiles the export values of Cote d’ Ivoire and Madagascar declined. It is
remarkably that Ghana came from a negative position in the previous period to increase its
export share. The increase in export value yielded a marginal 0.7% increase in its market
share lagging behind Ecuador and Thailand with 4% and 2.3% respectively. On the other
hand, Cote d’ Ivoire and Madagascar failed to increase their export and consequently suffered
a decrease of 4.9% and 2.7% apiece.
Structural effect contributed to the increased in export by 85.2% and 28.5% and 44.3% for
Ghana, Ecuador and Thailand respectively. It is clear that, the increase in Ghana’s export was
due mainly to the growth of the market. The contribution of the competitive effect to the
increase in export was 7.8%, 61% and 47.5% for Ghana, Ecuador and Thailand respectively.
Although, the competitiveness of Ghana has improved, the changes in export are still mainly
due to structural effect and it can therefore be said that, it is less competitive compared to
countries like Ecuador and Thailand. It is insightful to note that; generally, ACP exporting
countries have been less competitive compared to Ecuador and Thailand. Thailand has
improved significantly on its competitiveness, from 11% between the first and second sub-
periods to 47.5% between the second and third sub-periods. It is striking to note that, even in
periods before the opening of the reduced tariff quota for Thailand and Philippines, Thailand
had been competitive on the market.
On the contrary, Madagascar, a previously strong competitor has lost out on its
competitiveness, Cote d’ Ivoire’s story is no different and Ghana has barely managed to
increased it export value and competitiveness.
48
5.4 Regression analysis
We conduct an empirical analysis on the determinants of the Ghana canned tuna export using
the quantity market share as the dependent variable. The Armington model provided in
equation (9) is transformed into a log-linear functional form and estimated using the OLS.
The model was estimated using the following extended form:
(10) ln MS = β0 + β1 ln (pi/P) + β2 lnER + β3 lnRCA + β4 DUM + ε
Where, MS is the Ghana’s market share (quantity), β0 is the constant term, β1 is the
coefficient of price ratio, β2 is the coefficient of exchange rate (EUR/GHS), β3 is the
coefficient of the RCA index of Ghana, and β4 is the coefficient of the dummy variable to
capture the effect of the opening of reduced tariff quota in July 2003 for Thailand and
Philippines (The dummy variable takes the value of zero (0) for the period prior to July 2003
and 1 thereafter) and ε is the error- term.
A prior, a negative relationship between quantity market share and the price ratio, a negative
relationship between market share and exchange rate (strengthening of local currency verses
Euro currency) and a positive relationship with level of specialization (measured by the RCA)
is expected. Data Shortage of monthly total tuna landings led to the omission of total landings
as an explanatory variable. A 5% significance level is used to determine whether a coefficient
is statistically significant.
The results of the regression analysis presented in (Table 15), indicates a high coefficient of
determination (R2). About 72% of the total variation in Ghana’s market share can be attributed
to the variations in the explanatory variable and 28% to random variations. The Durbin-
Watson (DW) statistics indicates the absence of autocorrelation in the model.
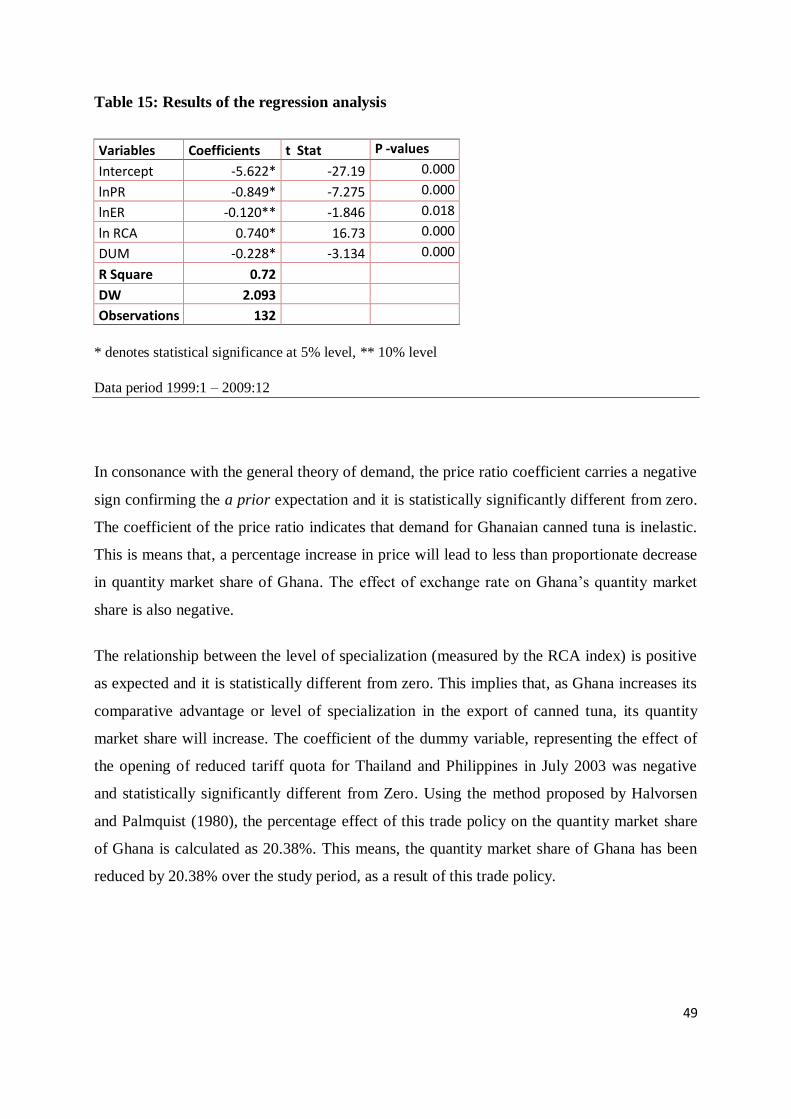
49
Table 15: Results of the regression analysis
Variables Coefficients t Stat P -values
Intercept -5.622* -27.19 0.000
lnPR -0.849* -7.275 0.000
lnER -0.120** -1.846 0.018
ln RCA 0.740* 16.73 0.000
DUM -0.228* -3.134 0.000
R Square 0.72
DW 2.093
Observations 132
* denotes statistical significance at 5% level, ** 10% level
Data period 1999:1 – 2009:12
In consonance with the general theory of demand, the price ratio coefficient carries a negative
sign confirming the a prior expectation and it is statistically significantly different from zero.
The coefficient of the price ratio indicates that demand for Ghanaian canned tuna is inelastic.
This is means that, a percentage increase in price will lead to less than proportionate decrease
in quantity market share of Ghana. The effect of exchange rate on Ghana’s quantity market
share is also negative.
The relationship between the level of specialization (measured by the RCA index) is positive
as expected and it is statistically different from zero. This implies that, as Ghana increases its
comparative advantage or level of specialization in the export of canned tuna, its quantity
market share will increase. The coefficient of the dummy variable, representing the effect of
the opening of reduced tariff quota for Thailand and Philippines in July 2003 was negative
and statistically significantly different from Zero. Using the method proposed by Halvorsen
and Palmquist (1980), the percentage effect of this trade policy on the quantity market share
of Ghana is calculated as 20.38%. This means, the quantity market share of Ghana has been
reduced by 20.38% over the study period, as a result of this trade policy.
50
6: Conclusion
The performance of Ghanaian canned tuna export has been examined in the EU-27 market
during the period 1999-2009. The analysis was on based upon the indices of specialization
and competitiveness. Ghana’s performance was compared to the performance of Cote
d’Ivoire, Ecuador, Madagascar and Thailand. The Constant Market Share (CMS) model was
used to decompose the changes in export value. The Armington trade model is applied to
determine the specific variables the affect the quantity market share of Ghana.
Results of the analysis have shown that, based on the RCA and RSCA indices, Ghana has a
high level of specialization or comparative advantage in the export of canned tuna to the EU
market. Similarly, all the competitor countries also have comparative advantage in the export
of canned tuna. Based on the RCA analysis, the period 1999-2001 witnessed the best
performance of Ghana in terms of ranking. Ghana witnessed a consistent increase in its RCA
index over this period and was ranked first with an average RCA index of 92.15. Comparing
1999-2001 to 2002-2005, Ghana’s RCA index decreased to an average of 90.68 but bounced
back in 2006-2009 with an average of 102.82. In the periods 2002-2005 and 2006-2009
Ghana was ranked second. Overall, Ghana has performed well, increasing its average RCA
index of 92.15 in 1999 -2001 to 102.82 in 2006- 2009. In relative terms, Ghana’s RCA index
has increased by 66%, 2009 compared to 1999 (base year). A key observation made here is
that, it is only the non-ACP exporting countries (Ecuador and Thailand) that have witnessed
consistent increase in their RCA index over the three sub-periods.
On examining the competitiveness of Ghana’s canned tuna export, the market share index has
illustrated that, Ghana has been less competitive compared to Ecuador and Thailand. Ghana’s
value market share has experienced a steady decline. Ghana has lost a significant 3% of its
market share between 1999-2001 to 2006-2009. Cote d’Ivoire and Madagascar have also lost
8% and 0.4% of their market shares over the same period respectively. On the other hand,
Ecuador and Thailand have gained 7.6% and 2.8% respectively and have being consistent in
increasing their market shares between all periods. As per the operational definition of
51
competitiveness, Ghana can be said to uncompetitive in the export of canned tuna. Again, it is
striking to note that the all ‘‘losers’’ are ACP exporting countries.
To buttress the point on Ghana’s uncompetitiveness, the CMS analysis shows that changes in
the export values of Ghana can be attributed mainly to structural effects (growth of the
market) and not to increased competitiveness. Between 2002-2005 and 2006-2009, the
increase in Ghana’s export value was 9.7 million euro. Of this increase, 85.2% can be
attributed to structural effect (growth of the market) and only 7.8% to competitive effect. On
the contrast, competitive effect contributed 61% and 47.5% to the increase in the export value
of Ecuador and Thailand respectively over the same period. Clearly, Ghana’s competitiveness
in the export of canned tuna does not measure up to the performance of Ecuador and
Thailand. For Cote d’Ivoire and Madagascar the contribution of competitive effect over this
period was negative. Once again, Ecuador and Thailand have proved to be the strongest
contenders compared to the ACP countries.
The results of the linear regression analysis indicate a negative and statistically significant
relationship between the price ratio of Ghana and its quantity market share. The demand for
Ghanaian canned tuna is inelastic. A 1% increase in price will lead to 0.85% decrease in
quantity market share. The results also indicate a positive and significant relationship between
the level of specialization (measured by the RCA index) and quantity market share. A 1%
increase in RCA index will increase the quantity market share of Ghana by 0.74%. The effect
of trade policy (the opening of reduced quota tariff for Thailand and Philippines in July 2003)
was negative and significant on the quantity market share of Ghana. The percentage effect of
the trade policy on the quantity market share of Ghana was a negative 20.38%. Similarly, the
effect of bilateral exchange rate on the quantity market share of Ghana was negative and
statistically significant at 10% level. By implication, a 1% appreciation in the value of the
Ghana cedi against the Euro will decrease the quantity market share of Ghana by 0.12%. In
terms of the level of impact by the explanatory variables on the quantity market share of
Ghana, price is most important followed by the level of specialization (RCA). Future
research should include tuna landings to capture the effect of local production on export.
52
This study has shown that, although Ghana has exhibited a high level of performance in terms
of specialization it has failed to measure up in terms of competitiveness relative to the
performance of especially Ecuador and Thailand. Both domestic and international market and
trade policy factors could be the culprit. Overall, the ACP countries have being less
competitive. The call for additional governmental and international support for countries
exporting canned tuna under ACP-EU Partnership Agreement especially in the period after
the granting of reduced tariff quota for Thailand and Philippines is in the right direction.
Ghana and the other ACP countries should collectively through the ACP secretariat bargain
for additional support to stem the losses from the preference erosion.
Ghana has a lot of to learn from Ecuador and Thailand as far competitiveness in exporting
canned tuna is concerned. It will be interesting for future research to look at country–specific
factor that has affected the competitiveness of these countries. A comparative study in this
regard will be useful.
53
References
Ahmadi-Esfahani, F. Z. (2006). Constant Market Shares Analysis: Uses, Limitations and
Prospects The Australian Journal of Agricultural and Resource Economics, 50, 510-526.
Alston, J. M., Carter, C. A., Green, R., & Pick, D. (1990). Whither Armington Trade Models.
American Journal of Agricultural Economics, 72, 455-467.
Armington, P. S. (1969). A Theory of Demand for Products Distinguished by Place of
Production. IMF Staff Papers, 16, 159-176.
Balassa, B. (1965). Trade Liberalisation and Revealed Comparative Advantage. Manchester
School of Economics and Social Studies, 32, 99-123
Ballance, R. H., Forstner, H., & Murray, T. (1987). Consistency Tests of Alternative
Measures of Comparative Advantage. Review of Economics and Statistics, 69(1), 157-161
Cai, J., Leug, P., & Hishamunda, N. (2009). Assessment of Comparative Advantage in
Aquaculture; Framework and Application on Selected Species in Developing Countries. FAO
Technical Paper, 528.
Cavusgil, S. T., & Zou, S. (1994). Marketing Strategy-Performance Relationships: An
Investigation of the Empirical Link in Export Market Ventures. Journal of Marketing, 58, 1-
21.
Chen, K., & Duan, Y. (2001). Competitiveness of Canadian Agri-food Exports Against
Competitors in Asia: 1980-97. Project Report 01-01, AARI Project(99M431).
Dalum, B., Laursen, K., & Villumsen, G. (1998). Structural Change in OECD Export
Specialisation Patterns: De-specialisation and Stickiness. International Review of Applied
Economics, 12, 447-467.
Davis, G., & Kruse, N. (1993). Consistent estimation of Armington Demand Models.
American Journal of Agricultural Economics, 75, 719-723.
De Benedictis, L., & Tamberi, M. (2001). A Note on the Balassa index of Revealed
Comparative Advantage. Working Papers 158, Dipartimento di Economia, Universita’
Politecnica delle Marche (I).
De Lombaerde, P. (1995). A Note on Shift-Share Analysis in Terms of Market Shares.
Kasetsart J. (Soc. Sci), 16, 88-91.
54
Deardorff, A. V. (1980). The General Validity of the Law of Comparative Advantage. The
Journal of Political Economy, 88(5), 941-957.
Deaton, A. S., & Muellbauer, J. (1980). An almost ideal demand system. American Economic
Review, 70(3), 12-326.
Diamantopoulos, A. (1999). Viewpoint: export performance measurement: reflective versus
formative indicators. International Marketing Review, 16(6), 444-457.
Doherty, M. (2010). The Importance of Sanitary and Phytosanitary Measures to Fisheries
Negotiations in Economic Partnership Agreements. vol. ICTSD Series on Fisheries, Trade
and Sustainable Development, Paper No. 7: International Centre for Trade and Sustainable
Development, Geneva, Switzerland.
FAO (2009). State of the World Fisheries and Aquaculture 2008. Food and Agriculture
Organization of the United Nations. Rome, Italy.
Feder, G. (1982). On Exports and Economic Growth. Journal of Development Economics, 12,
59-73.
Ferto, I., & Hubbard, L. J. (2003). Revealed Comparative Advantage and Competitiveness in
Hungarian Agri–Food Sectors. The World Economy, 26(2), 247-259.
Halvorsen, R., & Palmquist, R. (1980). The interpretation of dummy variables in semi-
logarithmicequations. American Economic Review, 70, 474-475.
Heckscher, E. F., & Ohlin, B., eds (1991). Heckscher-Ohlin Trade Theory. Cambridge, Mass.:
MIT Press.
Houston, D. B. (1967). The Shift and Share Analysis of Regional Growth: A Crtitque.
Southern Economic Journal, 33(4), 577-581.
Iapadre, L. (2001). Measuring International Specialization. International Advances in
Economic Research, 7(2), 173-183.
Katsikeas, C. S., Leonidou, L. C., & Morgan, N. A. (2000). Firm-level Export Performance
Assessment: Review, Evaluation, and Development. Journal of the Academy of Marketing
Science, 28(4), 493-511.
Laursen, K. (1998). Revealed Comparative Advantage and the Alternatives as Measures of
International Specialization. Danish Research Unit for Industrial Dynamics,, Working Paper
No. 98-30, .
Leamer, E. E. (1995). The Heckscher-Ohlin Model in Theory and Practice. Princeton Studies
in International Finance, 77.
55
Leishman, D., Menkhaus, D. J., & Whipplee, G. D. (1999). Revealed Comparative Advantage
and the Measurement of International Competitiveness for Agricultural Commodities: an
Empirical Analysis of Wool Exporters. In: Western Agricultural Economics Association
Annual Meeting, July 11-13. Fargo ND.
Lem, A. (2004). A global Overview of fish trade – An introduction. In: FAO Fisheries
Industries Division, Regional Workshop, 31st August- 3rd September. Accra, Ghana.
Leung, P., & Cai, J. (2005). A Review of Comparative Advantage Assessment Approaches in
Relation to Aquaculture Development. College ofTropical Agriculture and Human Resources,
University of Hawaii at Manoa.
Magagane, L., Muronga, F., Verster.J., & Steenkamp, E. (2008). Market Research on South
African Agricultural Exports. Department of Agriculture, Directorate International Trade:
Sub-directorate Trade Research.
Mandelson, P. (2005). EU Exports and Sanitary and Phytosanitary Measures., Conference on
EU Exports and Sanitary and Phytosanitary Measures, 27 May 2005. Brussels.
Merkies, A. H. Q. M., & Van der Meer, T. (1988). A Theoretical Foundation for Constant
Market Share Analysis. empec, 13, 65-80.
Mold, A. (2005). Non-Tariff Barriers – Their Prevalence and Relevance for African
Countries. Economic Commission for Africa, ATPC Work in Progress No. 25.
Ricardo, D. (1817). On the Principles of Political Economy and Taxation. John Murray,
London.
.
Richardson, J. D. (1971). Some Sensitivity Tests for a ''Constant-Market-Share'' Analysis of
Export Growth. The Review of Economics and Statistics, 53(3), 300-304.
Richardson, J. D. (1971b). Constant-Market-Share Analysis of Export Growth. Journal of
International Economies, 1, 227-239.
Ruffin, R. J. (1988). The Missing Link: The Ricardian Approach to the Factor Endowments
Theory of Trade. The American Economic Review, 78(4), 759-772.
Samiee, S., & Walters, P. G. P. (1990). Influence of firm size on export planning and
Performance. Journal of Business Research, 20, 235-248.
Shoham, A. (1998). Export Performance: a conceptualization and empirical assessment.
Journal of International Marketing, 6(3), 59-81.
56
Sousa, C. M. P. (2004). Export Performance Measurement: An Evaluation of the Empirical
Research in the Literature. Academy of Marketing Science Review, 2004 No. 09.
Tyszynski, H. (1951). World Trade in Manufactured Commodities, 1899–1950. The
Manchester School of Economic Social Studies, 19, 272-304.
Vollrath, T. L. (1991). A Theoretical Evaluation of Alternative Trade Intensity Measures of
Revealed Comparative Advantage. Weltwirtschaftliches Archiv.
Winters, L. A. (1984). Separability and the specification of foreign trade functions. Journal of
International Economies, 17, 239-263.
Websites
www.iccat.org
http://ec.europa.eu/trade
www.oanda.com
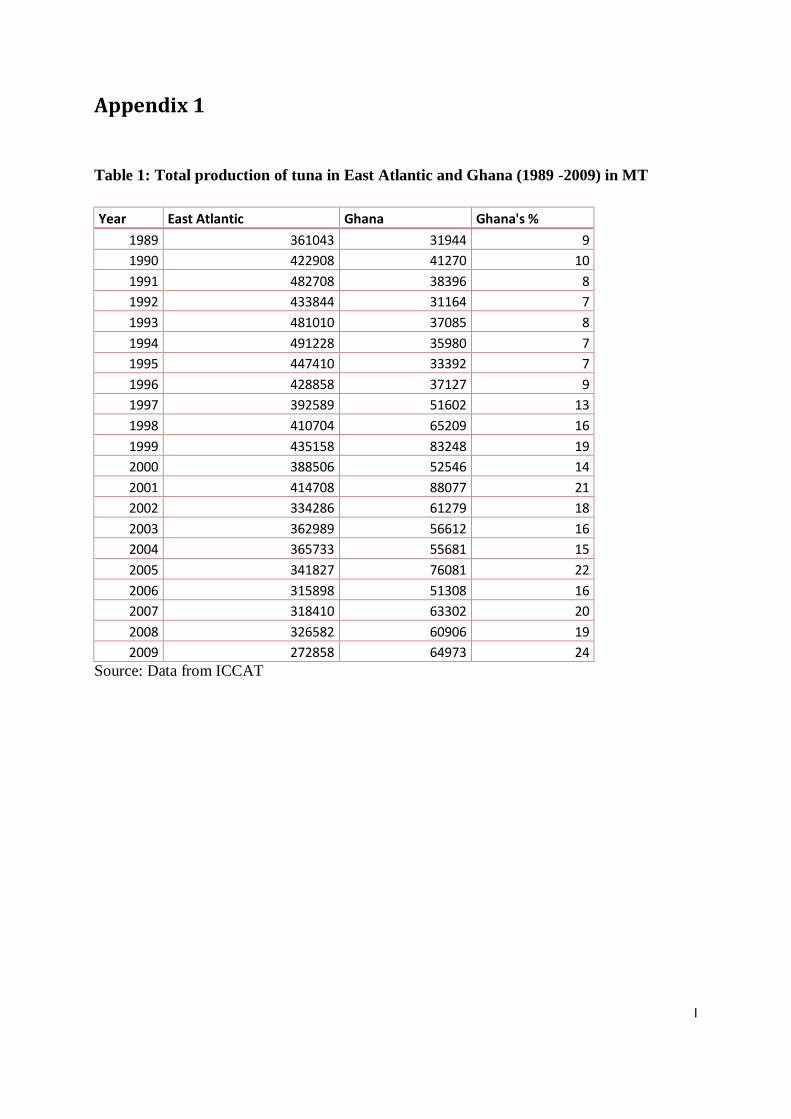
I
Appendix 1
Table 1: Total production of tuna in East Atlantic and Ghana (1989 -2009) in MT
Year East Atlantic Ghana Ghana's %
1989 361043 31944 9
1990 422908 41270 10
1991 482708 38396 8
1992 433844 31164 7
1993 481010 37085 8
1994 491228 35980 7
1995 447410 33392 7
1996 428858 37127 9
1997 392589 51602 13
1998 410704 65209 16
1999 435158 83248 19
2000 388506 52546 14
2001 414708 88077 21
2002 334286 61279 18
2003 362989 56612 16
2004 365733 55681 15
2005 341827 76081 22
2006 315898 51308 16
2007 318410 63302 20
2008 326582 60906 19
2009 272858 64973 24
Source: Data from ICCAT
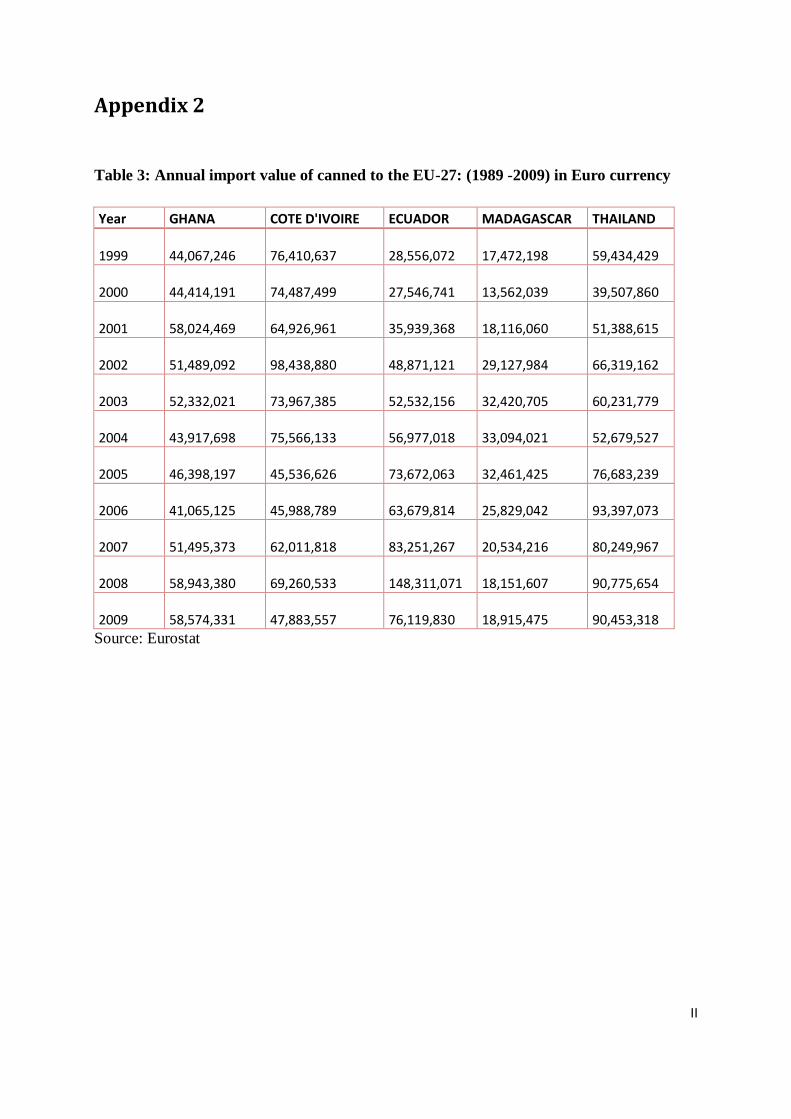
II
Appendix 2
Table 3: Annual import value of canned to the EU-27: (1989 -2009) in Euro currency
Year GHANA COTE D'IVOIRE ECUADOR MADAGASCAR THAILAND
1999 44,067,246
76,410,637
28,556,072
17,472,198
59,434,429
2000 44,414,191
74,487,499
27,546,741
13,562,039
39,507,860
2001 58,024,469
64,926,961
35,939,368
18,116,060
51,388,615
2002 51,489,092
98,438,880
48,871,121
29,127,984
66,319,162
2003 52,332,021
73,967,385
52,532,156
32,420,705
60,231,779
2004 43,917,698
75,566,133
56,977,018
33,094,021
52,679,527
2005 46,398,197
45,536,626
73,672,063
32,461,425
76,683,239
2006 41,065,125
45,988,789
63,679,814
25,829,042
93,397,073
2007 51,495,373
62,011,818
83,251,267
20,534,216
80,249,967
2008 58,943,380
69,260,533
148,311,071
18,151,607
90,775,654
2009 58,574,331
47,883,557
76,119,830
18,915,475
90,453,318
Source: Eurostat
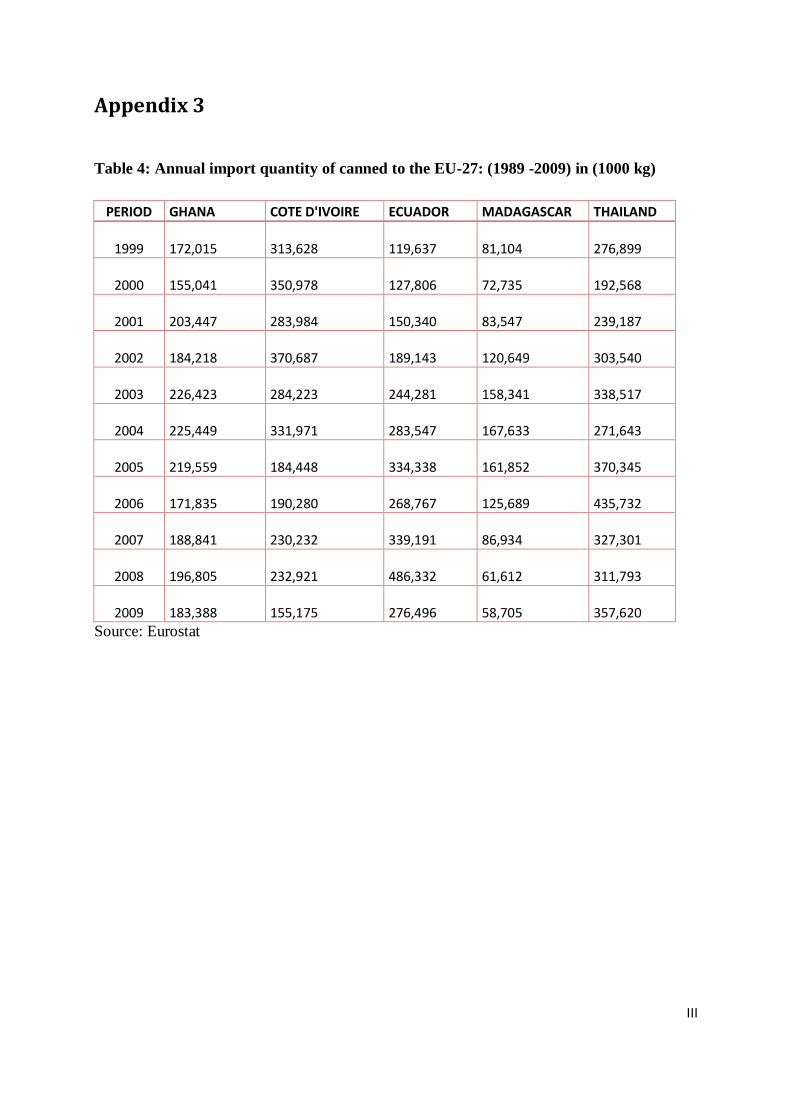
III
Appendix 3
Table 4: Annual import quantity of canned to the EU-27: (1989 -2009) in (1000 kg)
PERIOD GHANA COTE D'IVOIRE ECUADOR MADAGASCAR THAILAND
1999 172,015
313,628
119,637
81,104
276,899
2000 155,041
350,978
127,806
72,735
192,568
2001 203,447
283,984
150,340
83,547
239,187
2002 184,218
370,687
189,143
120,649
303,540
2003 226,423
284,223
244,281
158,341
338,517
2004 225,449
331,971
283,547
167,633
271,643
2005 219,559
184,448
334,338
161,852
370,345
2006 171,835
190,280
268,767
125,689
435,732
2007 188,841
230,232
339,191
86,934
327,301
2008 196,805
232,921
486,332
61,612
311,793
2009 183,388
155,175
276,496
58,705
357,620
Source: Eurostat
Related Documents