Faculty of Health Sciences Department of Community Medicine Physical Activity and Body Composition in Norwegian Adolescents Results from The Tromsø Study: Fit Futures Nils Abel Aars A dissertation for the degree of Philosophiae Doctor – October 2020

Welcome message from author
This document is posted to help you gain knowledge. Please leave a comment to let me know what you think about it! Share it to your friends and learn new things together.
Transcript
Faculty of Health Sciences
Department of Community Medicine
Physical Activity and Body Composition in Norwegian Adolescents
Results from The Tromsø Study: Fit Futures
Nils Abel Aars
A dissertation for the degree of Philosophiae Doctor – October 2020


Physical Activity and Body Composition in Norwegian Adolescents.
Results from The Tromsø Study: Fit Futures
Nils Abel Aars
Faculty of Health Sciences,
Department of Community Medicine,
UiT – The Arctic University of Norway.
Nordland Hospital, Bodø
October 2020


Acknowledgements
This project was funded by the University in Tromsø – The Arctic University of Norway, but
would not have come about without the extensive work of the Fit Futures steering
committees, the staff at the Clinical Research Unit at the University Hospital of North
Norway and of course all the participants in both Fit Futures Cohort Studies. I am humble and
grateful for their cooperation.
The position as a PhD candidate has presented me with the opportunity of gaining knowledge
within a research field I have always found interesting, and which was highly relevant for me
as a physiotherapist. I had not held this position for long when I came to realize that taking a
PhD is an education in itself. The learning curve has been steep, and periods of anxiety and
stress have been plentiful– something which I suspect is common feelings for most Ph.D.
students. Thankfully, I’ve had some fantastic help. I owe a lot to my supervisor Sameline
Grimsgaard and co-supervisor Bjarne K. Jacobsen. Thank you for your guidance and
contributions, for your input and discussions, and for calming my nerves at times when I
thought I had made some grave mistake (which turned out to be nothing).
For the five years in which I’ve held this position (adjusted for two periods of paternity
leave), I have resided in Bodø. It has been a challenge being separated from the research
community in Tromsø and my co-authors, and at times this has impacted the effectiveness of
my work: the opportunity to ask a colleague a quick question has been substituted by a day of
trial and error to find the correct answer. At least some lessons have been learned. The
possibility to work from Bodø would not have been possible without great help from Petter
Øien at Nordlandssykehuset. I owe him many thanks for providing me a workplace and for
opening doors for me here in Bodø. Thanks also to all the Ph.D. students in Bodø I’ve come
to know, and for inspiring days at the office. You have all made my time as a Ph.D. student
much more fun than I could otherwise have hoped to expect.
I would also like to extend my gratitude to Sigurd Beldo in Alta and Elin Evensen in Tromsø
for all their help, input and discussions. The possibility to discuss overlapping projects and
specific details with them has been vital for my completion of this thesis.
I owe my parents great thanks. To my mother, Marianne: thank you for good discussions and
all your support during these years. To my father, Jan Abel: thank you for suggesting this
career path for me in the first place, and for all your academic advice, support and
consultations.
For me, writing a Ph.D. has at times involved a lot of travelling to Tromsø for supervision,
Ph.D. courses and teaching duties. In my absence, my fantastic wife Guro has shown great
patience and has taken care of our four kids without any casualties. Despite all my travels for
work, I have always been allowed further leave of absence for hunting, fishing or lumberjack
trips with friends, even during the most hectic periods. Thank you!
Nils Abel Aars, Bodø, October 2020
Contents
Acknowledgements
Summary
Norsk sammenfatning
List of papers
Abbreviations
Contents
1. Introduction ............................................................................................................................ 1
1.1 Background ...................................................................................................................... 1
1.2 Body composition ............................................................................................................ 3
1.2.1 Measurement of body composition ........................................................................... 3
1.2.2 Body composition in adolescents .............................................................................. 9
1.3 Physical activity ............................................................................................................... 9
1.3.1 Measuring physical activity .................................................................................... 10
1.3.2 Physical activity in adolescence .............................................................................. 12
1.4 The association between physical activity and body composition ................................. 13
1.5 Adolescents and pubertal development .......................................................................... 15
1.6 Societal and clinical implications ................................................................................... 17
2.0 Aims, objectives and hypothesis ........................................................................................ 18
3.0 Methods and materials ....................................................................................................... 19
3.1 Study population ............................................................................................................ 19
3.2 Measurements ................................................................................................................. 22
3.3 Variables ......................................................................................................................... 23
3.3.1 Self-reported physical activity................................................................................. 23
3.3.2 Objectively measured physical activity ................................................................... 24
3.3.3 Outcome variables ................................................................................................... 27
3.3.4 Other variables ........................................................................................................ 28
3.4 Ethical considerations .................................................................................................... 32
3.5 Statistical methods .......................................................................................................... 33
4.0 Results and summary of papers .......................................................................................... 36
4.1 Paper I ............................................................................................................................ 36
4.2 Paper II ........................................................................................................................... 37
4.3 Paper III .......................................................................................................................... 38
5.0 Methodological considerations .......................................................................................... 39
5.1 Study design ................................................................................................................... 39
5.2 Validity of measurements ............................................................................................... 40
5.2.1 Validity of physical activity measurements ............................................................ 40
5.2.2 Validity of body composition measures .................................................................. 45
5.3 Statistical procedures and adjustments ........................................................................... 47
5.3.1 Validity of covariates .............................................................................................. 50
5.4 Sensitivity analyses and generalizability of results ........................................................ 54
6.0 Discussion of main findings ............................................................................................... 58
6.1 The cross-sectional association between physical activity and body composition. ....... 58
6.2 The association between physical activity and changes in body composition ............... 60
6.3 Discussion of the association between physical activity and adiposity ......................... 64
6.3.1 Energy balance and the obesogenic environment ................................................... 64
6.3.2 Displacement of physical activity ........................................................................... 66
6.3.3 Population versus high-risk strategy ....................................................................... 67
6.4 Perspectives on future research ...................................................................................... 69
7.0 Conclusions ........................................................................................................................ 70
8.0 Implications for public health ............................................................................................ 71
References ................................................................................................................................ 73
Papers I-III
Appendices
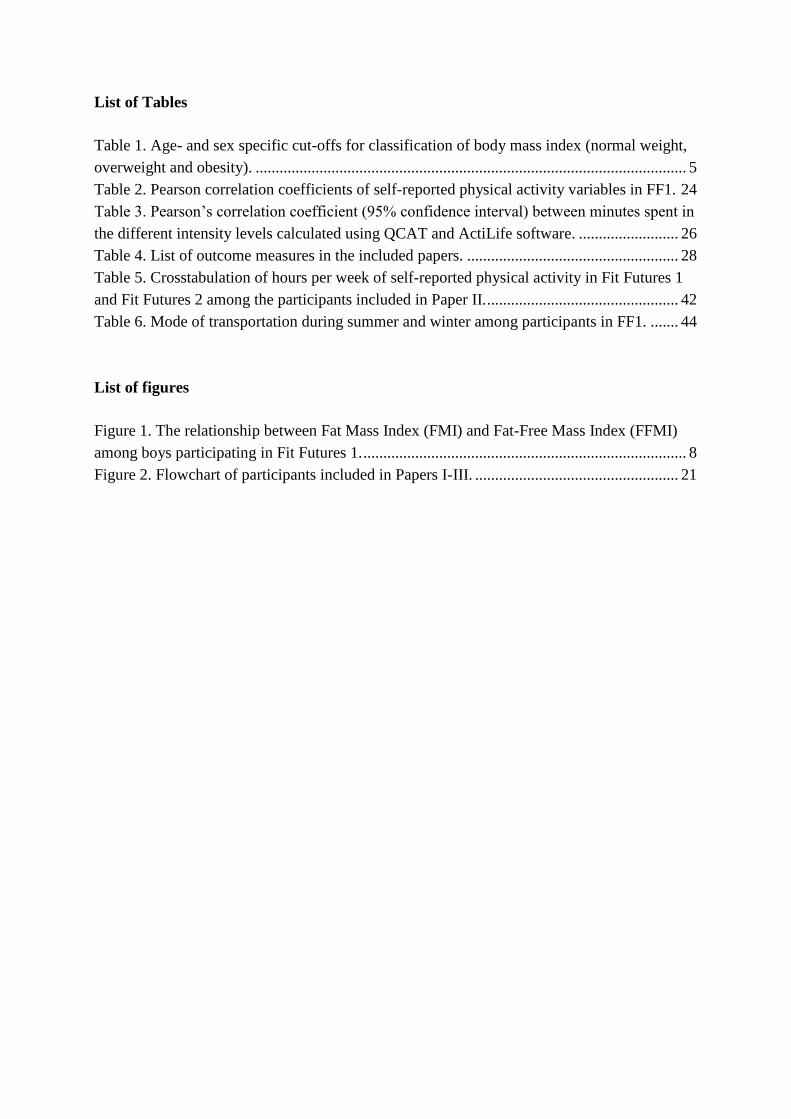
List of Tables
Table 1. Age- and sex specific cut-offs for classification of body mass index (normal weight,
overweight and obesity). ............................................................................................................ 5
Table 2. Pearson correlation coefficients of self-reported physical activity variables in FF1. 24
Table 3. Pearson’s correlation coefficient (95% confidence interval) between minutes spent in
the different intensity levels calculated using QCAT and ActiLife software. ......................... 26
Table 4. List of outcome measures in the included papers. ..................................................... 28
Table 5. Crosstabulation of hours per week of self-reported physical activity in Fit Futures 1
and Fit Futures 2 among the participants included in Paper II. ................................................ 42
Table 6. Mode of transportation during summer and winter among participants in FF1. ....... 44
List of figures
Figure 1. The relationship between Fat Mass Index (FMI) and Fat-Free Mass Index (FFMI)
among boys participating in Fit Futures 1. ................................................................................. 8
Figure 2. Flowchart of participants included in Papers I-III. ................................................... 21

Summary
Background:
Physical activity is recognized as important in the prevention of numerous health problems
across all age-groups, but its relationship with adiposity during adolescence has been debated.
Conflicting evidence has been reported, which might be a reflection of the array of available
measures of both physical activity and adiposity. It is clear that volume of physical activity
declines with age during childhood and adolescence, and thus a less stable habit than in
adults. The decline in physical activity coincides with age-related increases in body mass
index (BMI). Determining a cause- and effect relationship in adolescent populations has
nevertheless proven difficult, perhaps especially so because an increase in most measures of
body composition are natural during growth spurts.
Objectives:
Our objective was to ascertain whether an association between physical activity and body
composition exists in a cohort of Norwegian adolescents, and to determine how level of
physical activity in the first year of upper secondary high school, or change in physical
activity between baseline and follow-up, was associated with changes in body composition
over two years of follow-up.
Methods:
To meet our objectives we used data from The Fit Futures Cohort Study. The study contains
data from two surveys, performed in 2010-11 (FF1) and again in 2012-13 (FF2). All students
in their first (FF1) and last (FF2) year of upper secondary high school in the neighboring
counties of Tromsø and Balsfjord were invited to attend a clinical examination and answer a
questionnaire. Of the invited, there were 1,038 (FF1) and 870 (FF2) students participating
from the eight different upper secondary high schools. Trained research nurses performed all
clinical measurements at the Clinical Research Unit at the University Hospital of North
Norway. Participants underwent a low radiation Dual Energy X-Ray Absorptiometry (DXA)
scan, which produced the estimates of fat mass, lean mass and appendicular lean mass (sum of
lean mass in the four extremities) used to calculate Fat Mass Index (FMI), Lean Mass Index
(LMI) and appendicular Lean Mass Index (aLMI). These measures, in addition to BMI and
waist circumference, represent the outcomes in the present thesis. Data on physical activity
was gathered from questionnaires and accelerometers. The raw data from the accelerometers
were processed into physical activity variables using software developed at the UiT.
Results:
We found evidence to suggest a cross-sectional association between self-reported physical
activity and tissue-specific measures of body composition, but not with BMI. The associations
between fat mass index and lean mass index with physical activity were inverse to another,
meaning that a high BMI could be the result of either high fat- or high lean mass. With the
exception of waist circumference in boys, self-reported activity was not associated with
changes in either measure of body composition between FF1 and FF2. Similarly, objectively
measured physical activity did not predict changes in body composition for either sex, except
an association between time spent in sedentary- and light physical activity and changes in
indices of lean mass in girls. We observed an association between changes in level of self-
reported activity and changes in some measures of body composition for both sexes. This
confirms how physical activity is subject to change during adolescence, and that there are
potential positive health gains of increasing activity or remaining physically active during this
period of life.
Conclusion

We found cross-sectional associations between self-reported physical activity and measures of
body composition, but only minor longitudinal effects of baseline physical activity on two-
year changes in body composition. Changes in level of self-reported physical activity between
baseline and two-year follow-up was associated with changes in some indices of body
composition. Studying a population that is subject to natural growth, parallel to undergoing
substantial changes in lifestyle, is challenging. These changes create uncertainty and variation
around the exposure and the outcome, despite the robust nature of the measurements included,
which in turn might explain the absence of clear associations of greater magnitude.
Norsk sammenfatning
Bakgrunn
Fysisk aktivitet er anerkjent som en viktig faktor i forebyggingen av en rekke helseproblemer
over alle aldersgrupper, men sammenhengen med overvekt i ungdomsårene er gjenstand for
diskusjon. Motstridende resultater har blitt rapportert, hvilket kan reflektere det tilgjengelige
antallet av metoder for å måle henholdsvis fysisk aktivitet og overvekt. At volumet av fysisk
aktivitet reduseres med økende alder gjennom barne- og ungdomsårene er velkjent, og det er
derfor en mindre stabil faktor av livsstil enn blant voksne. Reduksjonen av fysisk aktivitet
sammenfaller med alders-relaterte økninger i kroppsmasseindeks (KMI). Det har vist seg
utfordrende å påvise hva som er årsak og virkning i denne assosiasjonen blant ungdom,
hvilket kanskje kan skyldes at en økning i de fleste mål på kroppssammensetning er naturlig i
vekstfasen.
Mål
Målet med avhandlingen var å avdekke hvorvidt det er en sammenheng mellom fysisk
aktivitet og kroppssammensetning i en gruppe av norske ungdommer, og i hvilken grad nivået
av fysisk aktivitet på første året av videregående skole, eller endring i fysisk aktivitet mellom
først- og siste året på videregående skole, påvirker endringer i kroppssammensetning over to
års oppfølging.
Metode
Vi brukte data fra Tromsøundersøkelsens ungdomskohort, Fit Futures. Fit Futures ble
gjennomført i 2010-11 (FF1) og igjen i 2012-13 (FF2), og inviterte alle elever i deres første
(FF1) og siste (FF2) år av videregående skole i nabokommunene Tromsø og Balsfjord til å
delta i en klinisk undersøkelse og til å fylle ut et spørreskjema. Av de inviterte deltok 1,038
(FF1) og 870 (FF2) elever fra de åtte videregående skolene. Alle kliniske målinger ble utført
av forskningssykepleiere ved Klinisk Forskningsavdeling på Universitetssykehuset i Nord-
Norge (UNN). Deltakerne gjennomgikk en lavdose røntgen måling (DXA) som produserte
estimater på fettmasse, magermasse (kroppsmasse minus fett- og beinmasse) og appendikulær
magermasse (summen av magermasse i ekstremitetene), hvilket ble brukt i beregningen av
fettmasseindeks (FMI), magermasseindeks (LMI) og appendikulær magermasseindeks
(aLMI). Disse målene, i tillegg til KMI og midjeomkrets, representerer endepunktene i
avhandlingen. Data på fysisk aktivitet ble innhentet ved bruk av spørreskjema og
akselerometer. Rådataene fra akselerometrene ble prosessert til fysisk aktivitetsvariabler ved
bruk av programvare utviklet ved UiT.
Resultat
Resultatene tyder på en sammenheng mellom selvrapportert fysisk aktivitet og de vevs-
spesifikke målene på kroppssammensetning, men ikke med KMI, i Fit Futures 1.
Assosiasjonene mellom fysisk aktivitet og henholdsvis FMI og LMI var inverse, hvilket tilser
at en høy KMI kan være forklart av enten høy fettmasse eller høy magermasse. Med unntak
av midjeomkrets blant gutter var selvrapportert fysisk aktivitet i FF1 ikke assosiert med
endringer i målene på kroppssammensetning mellom FF1 og FF2. Fysisk aktivitet målt med
akselerometer predikerte heller ikke endring i noen av utfallsmålene, med unntak av tid
tilbrakt i sedat- og lett fysisk aktivitet som var assosiert med indeksene på magermasse blant
jenter. Vi observerte en assosiasjon mellom endringer i selvrapportert fysisk aktivitet mellom
FF1 og FF2 og endringer i noen av målene på kroppssammensetning for begge kjønn. Dette
bekrefter hvordan fysisk aktivitet er i endring gjennom ungdomsårene, og at det er potensielle
positive effekter av å øke aktiviteten eller forbli fysisk aktiv gjennom denne perioden av livet.
Konklusjon

Vi fant assosiasjoner mellom fysisk aktivitet og kroppssammensetning på tverrsnittsnivå, men
observerte mindre effekt av fysisk aktivitet under første året av videregående skole på
endringer i kroppssammensetning over en to-års periode. Det er utfordringer knyttet til å
studere en gruppe som gjennomgår naturlige endringer i kroppssammensetning, parallelt med
substansielle endringer i livsstil. Disse endringene skaper usikkerhet og variasjon omkring
målingene, på tross av at målemetodene for kroppssammensetning i utgangspunktet er
robuste, og kan være en potensiell forklaring på fraværet av tydelige og sterke assosiasjoner.
List of papers
This thesis is based on three papers, which in the following text are referred to as Paper I,
Paper II and Paper III.
Paper I
Aars, N.A., Jacobsen, B.K., Furberg, A.‐S. and Grimsgaard, S. (2019). Self‐reported physical
activity during leisure time was favourably associated with body composition in Norwegian
adolescents. Acta Paediatr, 108: 1122-1127. doi:10.1111/apa.14660
Paper II
Aars, N.A., Jacobsen, B.K., Morseth, B., Emaus, N. and Grimsgaard, S. (2019). Longitudinal
changes in body composition and waist circumference by self-reported levels of physical
activity in leisure among adolescents: the Tromsø study, Fit Futures. BMC Sports Sci Med
Rehabil 11, 37. doi:10.1186/s13102-019-0150-8
Paper III
Aars. N.A., Beldo S, Jacobsen, B.K., Horsch, A., Morseth, B., Emaus, N., Furberg, A.S. and
Grimsgaard, S. (2020). Association between objectively measured physical activity and
longitudinal changes in body composition in adolescents: the Tromsø study fit futures cohort.
BMJ Open 2020;10:e036991. doi: 10.1136/bmjopen-2020-036991
Abbreviations
aLMI: appendicular Lean Mass Index
BMI: Body Mass Index
COPD: Chronic Obstructive Pulmonary Disease
CPM: Counts Per Minutes
DALY: Disability-Adjusted Life Year
DXA: Dual energy X-ray Absorptiometry
EAT: Exercise Activity Thermogenesis
FF1: Fit Futures 1 (2010-11)
FF2: Fit Futures 2 (2012-13)
FFMI: Fat-Free Mass Index
FMI: Fat Mass Index
INT$: International Dollars
IOTF: International Obesity Task Force
IPAQ: International Physical Activity Questionnaire
LMI: Lean Mass Index
NEAT: Non-Exercise Activity Thermogenesis
MI: Multiple Imputation
MVPA: Moderate-to-Vigorous Physical Activity
PDS: Pubertal Development Scale
PHV: Peak Height Velocity
QCAT: Quality Control & Analysis Tool
SAT: Subcutaneous Adipose Tissue
SD: Standard Deviation
SES: Socio-Economic Status
SF: Skinfold Thickness
SGPALS: Saltin-Grimby Physical Activity Level Scale
VAT: Visceral Adipose Tissue
VMU: Vector Magnitude Unit
WHO: World Health Organization
1
1. Introduction
In simple terms, overweight and obesity is the result of a sustained positive energy balance,
wherein consumption of energy exceeds its expenditure [1, 2]. Physical activity is a logical
remedy in both the treatment and prevention of excess adiposity because of its potential effect
on the expenditure part of the energy balance equation, and recommended as part of a
multidisciplinary approach to overweight and obesity management [3]. A core belief within
the field of public health is that prevention is superior to treatment in terms of cost-efficiency
and potential health gains for populations [4]. By that logic, prevention of overweight and
obesity has considerable potential [2], despite being a complex and challenging endeavor [5].
Because the prevalence of overweight and obesity often increases with age [6, 7], and because
overweight and obesity tracks from adolescence into adulthood [8], understanding the
relationship between overweight and obesity and one of its potential remedies, physical
activity, in younger age-groups is of particular importance.
1.1 Background
In adults (aged 18 and above), overweight is commonly defined as a Body Mass Index (BMI)
greater than- or equal to 25.0 [1], and the prevalence has increased in adolescent populations
of western countries [7]. Presently 15-20% of Europeans in their late adolescence are
classified as overweight [9-11]. The prevalence of obesity (BMI ≥ 30.0) has shown a similar
pattern [7], with around 6% of European adolescents being classified as obese, albeit with
substantial differences between- and within countries [10, 11]. These numbers may be an
underestimate of the magnitude of the problem, because BMI fails to identify a substantial
number of children and adolescents with excess body fat [12, 13]. Physical activity during
adolescence is associated with self-reported health [14] and adolescents with overweight or
obesity have lower health-related quality of life than their normal-weight peers [15]. Also,

2
adolescent BMI is predictive of adult mortality [16, 17]. Because weight status tracks from
childhood and adolescence into adulthood, early intervention has potential for substantial
benefits as overweight and obesity in adulthood is an established risk factor for numerous
diseases and illnesses, including musculoskeletal pain, type 2 diabetes, osteoarthritis,
hypertension, cardiovascular disease and several forms of cancer [1, 18-20].
Physical activity is a behavior that tends to decline in volume with age [21], with a rapid
decline observed in adolescents [22, 23]. In Norway, it is estimated that 40% of girls and 51%
of boys aged 15 years meet the governmental recommendation of ≥ 60 minutes per day in
Moderate-to-Vigorous Physical Activity (MVPA) [24]. Objective measurements of physical
activity in European adolescents show substantial variation between countries, with between
0 – 60% of adolescents meeting the governmental recommendations [25]. The variation is
likely due to different methods of assessment or cut-offs used to define MVPA, but also
cultural differences or potential variation in the amount of mandatory physical activity in
schools. Both total physical activity and MVPA declines during adolescence [26, 27].
Adolescents constitute an age group that differs in character from children and adults.
Substantial changes in body composition takes place naturally as a result of pubertal
development during this phase, with considerable differences between sexes [28, 29]. Thus, in
longitudinal studies, it is a challenge to separate unhealthy gains from naturally occurring
changes [30]. Physical activity during adolescence is influenced by peers, parents, schools
and communities [31-33], which in turn can affect the behavior of the individual either
positively or negatively. The influence of the societies in which people reside must also be
taken into account, with Western countries in particular often indirectly promoting an inactive
lifestyle [34, 35]. This obesogenic environment affects both the present and future health of
adolescents, since adult lifestyle habits are partly developed in adolescence [36, 37].
3
Many cross-sectional studies to date indicate an association between low physical activity and
excess adiposity [38], but due to the nature of such study designs, no conclusions can be made
as to a causal relationship. This means longitudinal studies are warranted [38], and less is
known about the longitudinal relationship between physical activity and changes in body
composition [39, 40]. Furthermore, studies on these associations have typically been limited
by inadequate measures of both exposure and outcome, resulting in imprecise estimates of an
association [41]. There has been a lack of studies of the relationship between physical activity
and measures of body composition in Norwegian adolescents [42].
1.2 Body composition
In this thesis, body composition is referred to as any clinical- or scientific measure seeking to
quantify the stature, mass and different types of tissue of the human body. First, a detailed
description of some of the most common methods to assess body composition is provided,
with particular focus on those used in the included papers and thesis. Second, a section on the
specific aspects of body composition in adolescents is given.
1.2.1 Measurement of body composition
The measurement of body composition, anthropometry and stature has been widely adopted
as a means of quantifying the bodily components of individuals and populations, and to
various ends. In the 20th century, clinicians, researchers and insurance companies noted an
association between higher scores of various measures of anthropometry and body
composition and morbidity and mortality [43]. While excess adiposity is one of the primary
drivers of these associations, it is not so straightforward to measure directly. However,
adipose tissue is reflected in other measures of body composition. Body weight is one such
measure, which is likely to be higher in overweight- and obese individuals, but body weight is
generally not a sufficient measure of adiposity without considering body height. Because
4
body weight increases with body height, taller individuals will have higher body weight than
individuals of smaller stature, all else being equal. The simplest measure of weight in relation
to height is calculated as weight in kilograms divided by height in meters squared, and is
known as BMI. This measure adjusts bodyweight for height, and is therefore commonly used
to assess weight status, especially because of its ease of application. Both height and weight
can be measured with high precision in a variety of settings, and may also be calculated using
self-reported data, but with less precision [44]. Using established cut-offs, BMI can then be
used to classify individuals as underweight, normal weight, overweight or obese, with further
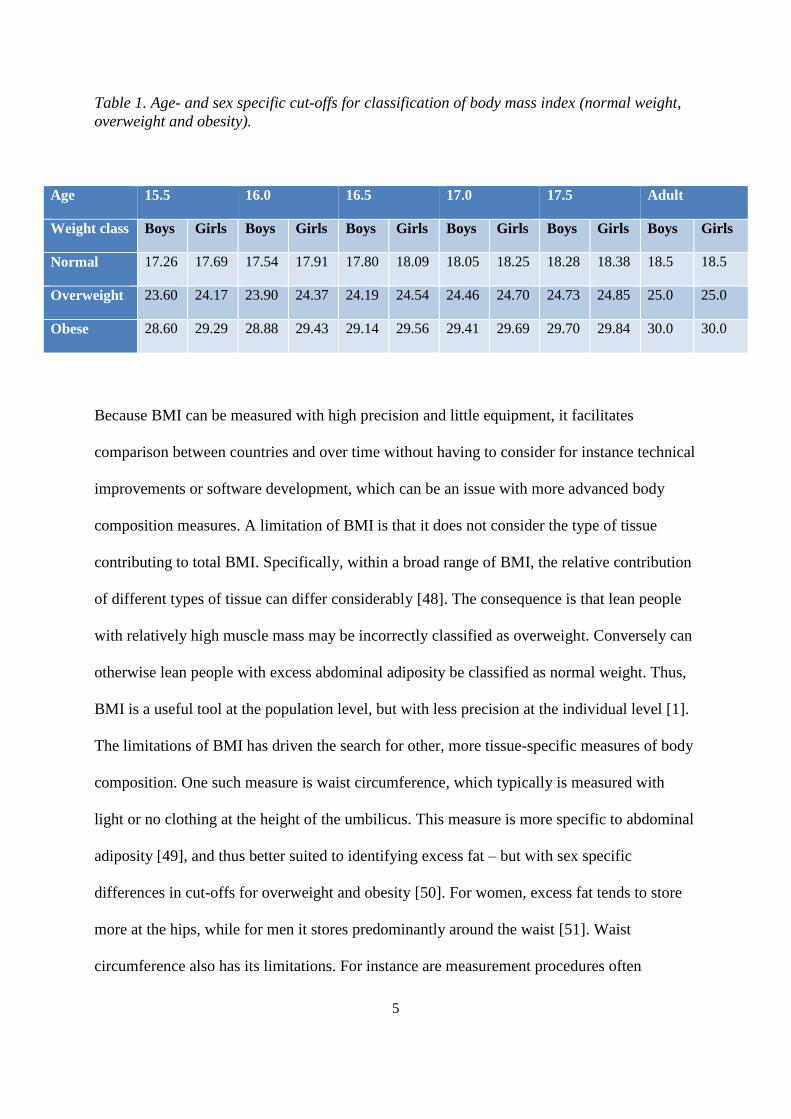
sub-classifications within each category [45]. Because BMI naturally increases with age
during childhood and adolescence, age- and sex specific cut-offs have been developed in
order to correctly classify the weight status of individuals in this age group [46, 47]. These
cut-offs have been developed by the International Obesity Task Force (IOTF), based on large
amounts of data from several different countries, and enables researchers and health officials
to monitor the prevalence of overweight and obesity from childhood through adolescence and
into adulthood. Table 1 illustrates the age- and sex specific cut-offs used in the present thesis
that correspond to the adult classifications as underweight (< 18.5 kg/m2), normal weight
(18.5 – 24.9 kg/m2), overweight (25.0 – 29.9 kg/m2) and obese (≥ 30.0 kg/m2).
5
Table 1. Age- and sex specific cut-offs for classification of body mass index (normal weight,
overweight and obesity).
Because BMI can be measured with high precision and little equipment, it facilitates
comparison between countries and over time without having to consider for instance technical
improvements or software development, which can be an issue with more advanced body
composition measures. A limitation of BMI is that it does not consider the type of tissue
contributing to total BMI. Specifically, within a broad range of BMI, the relative contribution
of different types of tissue can differ considerably [48]. The consequence is that lean people
with relatively high muscle mass may be incorrectly classified as overweight. Conversely can
otherwise lean people with excess abdominal adiposity be classified as normal weight. Thus,
BMI is a useful tool at the population level, but with less precision at the individual level [1].
The limitations of BMI has driven the search for other, more tissue-specific measures of body
composition. One such measure is waist circumference, which typically is measured with
light or no clothing at the height of the umbilicus. This measure is more specific to abdominal
adiposity [49], and thus better suited to identifying excess fat – but with sex specific
differences in cut-offs for overweight and obesity [50]. For women, excess fat tends to store
more at the hips, while for men it stores predominantly around the waist [51]. Waist
circumference also has its limitations. For instance are measurement procedures often
Age 15.5 16.0 16.5 17.0 17.5 Adult
Weight class Boys Girls Boys Girls Boys Girls Boys Girls Boys Girls Boys Girls
Normal 17.26 17.69 17.54 17.91 17.80 18.09 18.05 18.25 18.28 18.38 18.5 18.5
Overweight 23.60 24.17 23.90 24.37 24.19 24.54 24.46 24.70 24.73 24.85 25.0 25.0
Obese 28.60 29.29 28.88 29.43 29.14 29.56 29.41 29.69 29.70 29.84 30.0 30.0

6
different between studies, thus limiting comparison [52]. Furthermore, the individual may
hold in their abdomen upon measurement, thus biasing the estimate, and interrater reliability
has also been shown to vary [52]. Despite such limitations, waist circumference is widely
used, and is included as a component in the diagnosis of metabolic syndrome [53].
Two other prevalent tissue-specific measures of body composition are skinfold thickness (SF)
and bioelectrical impedance analysis. Skinfold thickness is given in millimeters and enables a
calculation of % body fat using different equations. The merits of this measure include low
costs and easy application, which explains its extensive use in epidemiological studies [54].
Although adolescent %SF body fat has been found superior to adolescent BMI in predicting
adult body fat [55], there are no established cut-offs for defining overweight and obesity by
this measure [54]. Bioelectric impedance analysis applies the known properties of resistance
to electric current in different types of tissue, and together with height and weight enables a
calculation of fat- and fat-free mass using validated equations [56]. Although bioelectric
impedance is a recognized measure of body composition and in prevalent use, it is considered
less precise than some of the alternatives due to assumptions (for instance concerning
hydration status) [56].
The four-compartment model is considered the gold standard for tissue-specific measurement
of body composition [48]. In this model, different advanced methods are used to measure
body mass, total body water, body volume and bone mineral [56]. For the correct estimation
of body composition, a high degree of precision and validity of measurement techniques is
required for each of the four components. This makes the four-compartment model labor-
intensive and costly, and thus unsuited for wide application in population studies.
7
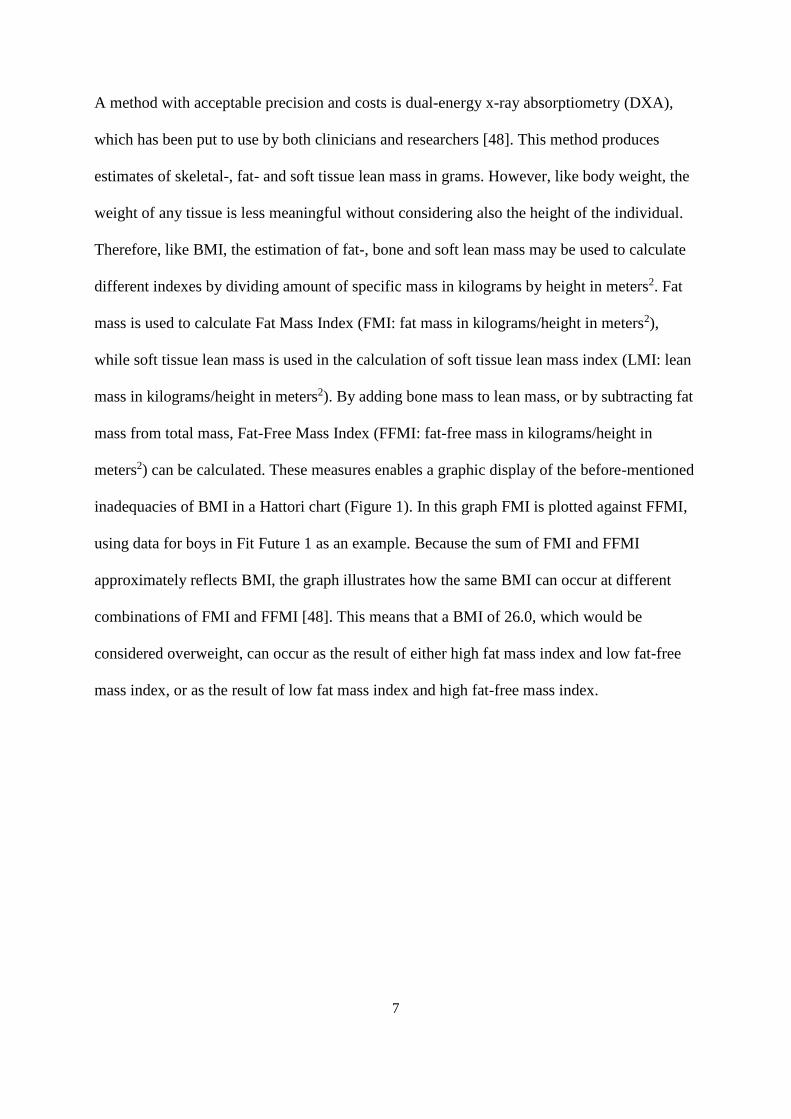
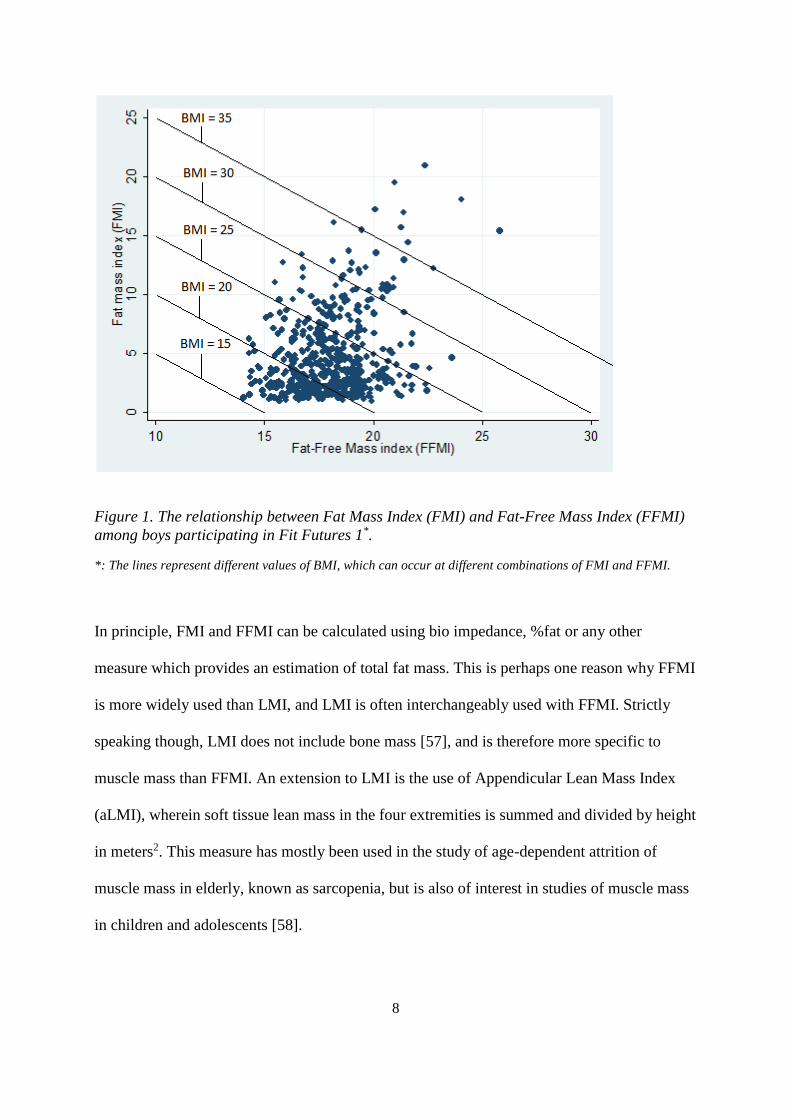
A method with acceptable precision and costs is dual-energy x-ray absorptiometry (DXA),
which has been put to use by both clinicians and researchers [48]. This method produces
estimates of skeletal-, fat- and soft tissue lean mass in grams. However, like body weight, the
weight of any tissue is less meaningful without considering also the height of the individual.
Therefore, like BMI, the estimation of fat-, bone and soft lean mass may be used to calculate
different indexes by dividing amount of specific mass in kilograms by height in meters2. Fat
mass is used to calculate Fat Mass Index (FMI: fat mass in kilograms/height in meters2),
while soft tissue lean mass is used in the calculation of soft tissue lean mass index (LMI: lean
mass in kilograms/height in meters2). By adding bone mass to lean mass, or by subtracting fat
mass from total mass, Fat-Free Mass Index (FFMI: fat-free mass in kilograms/height in
meters2) can be calculated. These measures enables a graphic display of the before-mentioned
inadequacies of BMI in a Hattori chart (Figure 1). In this graph FMI is plotted against FFMI,
using data for boys in Fit Future 1 as an example. Because the sum of FMI and FFMI
approximately reflects BMI, the graph illustrates how the same BMI can occur at different
combinations of FMI and FFMI [48]. This means that a BMI of 26.0, which would be
considered overweight, can occur as the result of either high fat mass index and low fat-free
mass index, or as the result of low fat mass index and high fat-free mass index.
8
Figure 1. The relationship between Fat Mass Index (FMI) and Fat-Free Mass Index (FFMI)
among boys participating in Fit Futures 1*.
*: The lines represent different values of BMI, which can occur at different combinations of FMI and FFMI.
In principle, FMI and FFMI can be calculated using bio impedance, %fat or any other
measure which provides an estimation of total fat mass. This is perhaps one reason why FFMI
is more widely used than LMI, and LMI is often interchangeably used with FFMI. Strictly
speaking though, LMI does not include bone mass [57], and is therefore more specific to
muscle mass than FFMI. An extension to LMI is the use of Appendicular Lean Mass Index
(aLMI), wherein soft tissue lean mass in the four extremities is summed and divided by height
in meters2. This measure has mostly been used in the study of age-dependent attrition of
muscle mass in elderly, known as sarcopenia, but is also of interest in studies of muscle mass
in children and adolescents [58].

9
1.2.2 Body composition in adolescents
The combined prevalence of overweight and obesity in European adolescents is in the range
of 22-25% [10]. This figure has risen steadily over the last decades, but now appears to have
levelled somewhat in Western countries [59]. However, evidence suggests that there are
differences according to socioeconomic status (SES), with an increase observed in groups of
children and adolescents with lower socioeconomic position [60, 61]. It is estimated that if the
trends of the 2000’s continue, the prevalence of global obesity in children and adolescents
will exceed the prevalence of underweight [7].
Because they are in a phase of growth, changes in body composition are natural in healthy
adolescents. For researchers, such natural changes in growth must be taken into account when
interpreting research findings within this age group. In boys, increases in indices of muscle
mass are expected, with sex hormones leading to substantial increases in lean mass up to the
point of Peak Height Velocity (PHV) – the point in life where natural growth peaks and is
subsequently reduced [62]. Conversely, in girls, pubertal development incurs a period of fat
mass accrual [54]. This is often attributed to a physiological preparation for child bearing,
wherein a certain level of surplus energy is required to conceive a child and nurture a new-
born [63]. The substantial differences between sexes in adolescent body composition is an
argument supporting sex-specific presentation of study results [64].
1.3 Physical activity
The World Health Organization defines physical activity as “any bodily movement produced
by skeletal muscles that require energy expenditure” [65]. However, physical activity may be
defined in a number of ways, each depending on what aspect or domain of physical activity
that is of interest. The focus in the present thesis has been on physical activity during leisure
time or outside of school hours. First a section on the measurement of physical activity is
10
given, after which a discussion of the specific traits of physical activity during adolescence is
provided.
1.3.1 Measuring physical activity
There are numerous methods available for measuring physical activity, with the historically
most common being through self-report [66]. Questionnaires are inexpensive and easy to use,
and has thus been applied in both population studies and in the clinic [67]. A number of
questionnaires have been developed and validated, typically against direct observation,
activity diary or doubly labelled water [66, 67]. In the Tromsø Study, the Saltin-Grimby
Physical Activity Level Scale (SGPALS) [68] has been used multiple times [69], and was also
included in the Fit Futures studies (Appendices 1&2). One of the most commonly used
questionnaires in physical activity epidemiology research is the International Physical
Activity Questionnaire (IPAQ), which was developed for use in adults and covers several
domains of physical activity [70]. Different modified versions of the IPAQ for studies of
adolescents have been developed and validated against accelerometry [71] and doubly
labelled water [72]. Regardless of which questionnaire is used, concerns have been raised on
the reproducibility and validity of self-reported physical activity [67], with recall bias and
social desirability bias highlighted as prevalent sources of error [73]. Furthermore, concepts
such as intensity and physical activity is perhaps neither fully understood by participants, nor
precisely defined in questionnaires [74]. Also, the common exaggeration of self-reported
physical activity may dilute associations with different health outcomes [75]. Despite these
limitations, self-report instruments form the basis for the current guidelines [76] and, as of
date, is the only means of comparing physical activity levels globally [77]. Furthermore, self-
reported physical activity provides the opportunity of investigating specific types or domains
of physical activity, and yields valid estimates of total amount of physical activity [78].

11
In an attempt to overcome the limitations of self-reported physical activity, objective
measures such as accelerometers, have been developed and are now widely used in studies of
physical activity [79]. An accelerometer is a small electronic device, worn by a participant at
the hip or wrist, which registers acceleration of the body across 1-3 axes. This provides a
measurement of counts (acceleration of the body) per minute (CPM), which can be translated
to minutes spent in different intensities of physical activity using different cut-offs [80]. The
cut-offs are typically developed in laboratory settings, in which CPM is registered while for
instance walking/running on a treadmill and simultaneously measuring energy expenditure
[81, 82]. Although widely used and considered superior to self-reported physical activity,
there are limitations associated with accelerometer devices [82]. For instance is the ability of
accelerometers to register non-ambulatory activities such as cycling or swimming not
satisfactory [82]. Furthermore, different manufacturers use different software and different
algorithms, thus affecting the opportunities for comparison of activity measured using
different devices [80]. Lastly, accelerometers collect raw data, which does not directly
translate to variables for data analyses. Physical activity variables are created by applying
algorithms to remove noise and to separate inactivity from non-wear time, with differences
between manufacturers and updates in software and models [80].
Because different cut-offs for CPM are used to classify the intensity of physical activity, there
is substantial variation in the reported compliance with guidelines for MVPA [25]. As such,
CPM is perhaps better suited for making comparisons between studies, but CPM is also
affected by for instance wear-time definitions: if a period of sedentary activity is interpreted
as non-wear time by the software it is excluded, and CPM is consequently inflated as the
remaining counts is averaged over shorter time and not including the period of lower
intensity. Another matter to consider is the individual perception of a given intensity of

12
activity. What may be considered as moderate physical activity by a fit individual may be
perceived as very strenuous activity by a less fit individual [83]. Thus, the actual effort of for
instance 30 minutes of moderate activity may be substantially different between two
individuals which differ in terms of physiological fitness. In such cases the difference in
relative and absolute intensity may yield conflicting results when comparing self-report to
device-based measurements [84].
1.3.2 Physical activity in adolescence
Physical activity in adolescence differs in character from that of children or adults. In
children, physical activity is often characterized by free-play activities, but this type of
physical activity declines with age, leading to a drop in total activity if replaced by sedentary
behavior rather than structured physical activity [85]. In many adolescents, participation in
organized sports represents a large share of total physical activity, but many quit and for a
variety of reasons [86, 87]. Physical activity declines with age in both children [88] and
adolescents [89], and is often substituted by increases in sedentary time [90]. The prevalence
of physical inactivity in European adolescents is high [91], and it is estimated that less than
50% of adolescents meet the recommended 1 hour per day in MVPA [25]. This number
should be interpreted with caution, as different measurement instruments and cut-offs produce
large variation in the estimate. In a study by Van Hecke et al [25], the authors noted a
difference of 150 minutes per day in MVPA in Portuguese children in two different studies,
even though the same dataset was used in both studies [92, 93]. The difference was attributed
to the different cut-offs used for classification of intensity, and illustrates the problem with
lack of agreement on best cut-offs.
Determinants of physical activity during adolescence include factors such as SES, support
from parents and peers, neighborhood environment, enjoyment of activity and self-efficacy

13
[32, 94-96]. In children and adolescents, habits change over shorter time than in adults. In
adults, physical activity is a relatively stable habit between 25-65 years of age [23], with
significant reductions at transition phases such as having children, relocation, retirement or
with morbidity [31, 97]. In adolescence, changes can occur in both directions over relatively
short time, but with a general pattern of decline. Thus, it remains questionable whether
present level of physical activity is representative of future activity over the short term,
because of change in habits during follow-up [78, 98]. The consequence, in analytic studies,
may be regression dilution bias, wherein a true association is lost in the noise introduced by
inaccurate measurement of the exposure variable [39].
1.4 The association between physical activity and body composition
In the discussion of causes of obesity, the debate has often been between whether physical
inactivity or overfeeding is the most important contributor. This is logical, as a sustained
positive energy balance is a prerequisite for excess adiposity [99]. However, behind inactivity
and overfeeding lies a complex system of underlying factors such as genetic disposition and
societal structures. The project report from the United Kingdom Government’s Foresight
Programme includes a map of these factors, which show the complexities of how overweight
and obesity develops [100]. It is evident from this map that it is not a matter of either/or, but
that all these factors contribute substantially and to various degree to the development of
excess adiposity in both populations and individuals.
Despite these complex relationships, physical activity is an established remedy in both the
prevention and treatment of excess adiposity [101], possibly because it is modifiable by the
individual [38]. However, physical activity as a habit is in part a product of the environment
in which an individual resides. Most inhabitants of Western societies are not required to be
physically active at high levels in their daily lives [91, 102], with for instance labor saving

14
devices affecting the amount of low intensity activity performed during household chores
[103]. Studies of physical activity and body composition are therefore, in some respects,
comparing little physical activity to a little less physical activity. The evolutionary drive of
humans to rest when possible and consume food when it is abundant are traits which have
negative consequences in the developed world [34, 104], as humans have been required to be
physically active to a greater extent than in the present era [105]. Relevant to this issue,
studies suggest genetic predisposition interacts with the obesogenic environment [106, 107],
and the higher BMI in older than younger birth cohorts [108] may be explained by less
lifetime exposure to environmental obesogenic factors.
While the cause of obesity is a complex matter, physical activity still has a direct effect on
both muscular- and adipose tissue [51, 109]. Regular exercise increases fat mobilization,
meaning that the ability to recruit energy from fat depots is improved [109]. Also, because
lean mass is the primary driver of resting metabolic rate [110], higher lean mass will be
associated with higher energy expenditure. Furthermore, high levels of physical activity has
been identified as a key factor in maintaining new body weight after weight loss in formerly
obese adults [111], but with less conclusive evidence in adolescents [112]. Still, the effects of
physical activity in weight loss interventions are mixed [101, 113]. Some have attributed this
to the dose of physical activity being too low, or to displacement of other physical activity,
leading to only a moderate increase in total activity [109]. If an intervention aimed at
increasing active commuting displaces evening walks, rather than TV-viewing, it is not
surprising if the intervention is unsuccessful. Of particular relevance to studies of adolescent
populations, is that body composition in adolescents is more heterogeneous than in adults,
meaning that larger samples are needed to detect relatively smaller differences in body
composition between different levels of physical activity [114].

15
1.5 Adolescents and pubertal development
The results of studies on adolescent populations must be interpreted in light of the bodily
changes that takes place as a result of puberty. Adolescence constitutes a period of life where
substantial changes in body composition, anthropometry and stature takes place in a short
time. A challenge when looking at changes in body composition during this period is
therefore to separate natural from unhealthy weight gain [30]. Because adolescents in general
will increase in body height, body weight and waist circumference as an effect of natural
growth, researchers are posed with the challenge of determining which- and how much of
these gains are unhealthy. Because for instance BMI will increase during growth, the IOTF
have developed age- and sex-specific cut-offs which correspond to the adult classifications of
underweight, normal weight, overweight or obese.
A factor to consider in application of these cut-offs, is early maturation. In the early maturing
16-year old, healthy body composition may (by logic of established cut-offs) be higher than
the chronological age would suggest is appropriate. This would wrongfully classify the
adolescent as overweight, despite having a BMI below the adult classification of 25.0. As
such, pubertal development has the potential to impact weight classification.
At birth, there is little difference in body composition between boys and girls, but with age
and pubertal development sexual dimorphism increases as a result of hormones. Girls start
their adolescent growth spurt in both height and weight approximately 2 years earlier than
boys, and also stop growing in stature earlier (around 16 years of age) than boys [115].
During this growth spurt, increases in height and weight accelerate compared to that of
childhood. Boys generally become taller than girls, which is a result of boys experiencing 2
years more of pre-pubertal growth [115]. In this regard, age at PHV is used as an indicator of
maturity [116]. Height is relatively constant after adult stature is reached, whereas weight, fat
16
mass and fat-free mass can be reduced or increased during adulthood. There are considerable
differences in fat- and fat-free mass between the adolescent sexes. Girls reach their adult
values of fat-free mass around the age of 15-16 years, whereas boys continue to increase in
this parameter up to the age of 19-20 years [30]. Boys have around 50% more fat-free mass
than girls in late adolescence, and girls have around 50% more fat mass than boys. While
boys experience increases in both fat- and fat-free mass, the increase in fat-free mass is
relatively higher, meaning that percent fat decreases. Conversely, for girls, increases in fat
mass surpass that of fat-free mass, and percent fat therefore increases [115].
There are several ways to measure pubertal development in the individual. Both skeletal age
and age at PHV may be used [116], but these necessitate annual x-rays of the hand or annual
measurements of growth, respectively, requiring more resources and thus are not extensively
used in large-scale population studies. The Tanner stages is considered the gold standard for
measuring pubertal development [116], wherein the development of for instance pubic hair,
breasts, genitalia and testicular volume is assessed and categorized according to development.
This may be considered intrusive to use in population studies, and therefore self-report
measures are more commonly used in such settings. In girls, age at menarche is a frequently
used indicator, but changes in body composition occur also before this point [115]. In boys,
questionnaire data on pubertal development are common indicators. One such instrument is
the Pubertal Development Scale (PDS), which has acceptable validity and consists of
questions on the development of secondary sex characteristics such as deepening of the voice
and pubic-, body- and facial hair [116].
Given these natural changes to body composition, it is clear that boys will experience
increases in lean mass independent of physical activity. Conversely, girls can expect increases
in fat mass despite being physically active. This does not mean that level of physical activity
17
is a negligible factor in the development of fat- and lean mass, but that during this period of
life, the hormonal influence on these tissues may be more important than that of physical
activity [30]. However, as habits developed during adolescence influence habits in adulthood
[36, 37], a behavior such as physical activity will affect body composition over time.
1.6 Societal and clinical implications
Overweight and obesity have a large economic- and societal impact on many countries, with
higher lifetime utilization of healthcare in those with excess adiposity [117]. Obesity is
estimated to account for between 0.7% and 2.8% of the total expenditure on healthcare in
different countries [118]. The costs of overweight to the healthcare system is apparent from as
early as the age of 4 [119]. The societal costs go beyond the direct costs of increased
healthcare utilization, because of the associated productivity loss of obesity [120]. This
productivity loss, and excess utilization of healthcare associated with obesity, will inevitably
be higher in individuals suffering from obesity from an early age. Physical inactivity also has
substantial economic- and societal costs worldwide, with an estimated 53.8 billion
international dollars (INT$) in direct costs to the healthcare system and 13.4 million
Disability Adjusted Life Years (DALY’s) lost as a result [121]. The clinical implications of
low levels of physical activity [122] and excess adiposity [123] in adults are well
documented, with even modest reductions in adiposity [124] or increases in physical activity
[125] having positive health effects. In adolescents, physical activity positively affects insulin
resistance [126], self-esteem and mental health [36]. Chronic disease morbidity is less
prevalent in adolescents than in adults [36], and as such the effect of physical activity during
adolescence on health outcomes may be more apparent later in life through the pathway of
established habits.
18
Whether overweight and obesity is associated with physical inactivity or not, is to some
extent of less importance in this respect, since each in their own have negative effects on
population health and induce societal costs. Consequently, reducing levels of excess adiposity
and increasing physical activity in the population will, independently, be favorable for
population health. Nevertheless, a causal relationship between the two would provide
evidence for larger health returns for an activity-focused approach to weight management, as
there are considerable health gains associated with physical activity [36, 77, 122, 127, 128].
In this respect, physical activity as a remedy for excess adiposity can provide positive health
effects beyond weight reduction.
2.0 Aims, objectives and hypothesis
At present there is a lack of knowledge on how physical activity affects body composition in
adolescents. While cross-sectional studies are prevalent, less is known about how physical
activity affects changes in body composition, both internationally [39, 40] and in Norway
[42]. Studies addressing the relationship between the two are warranted [38] and required to
reduce the burden of physical inactivity and excess adiposity in populations and individuals.
In the present thesis, the main objective was to investigate the association between physical
activity and body composition in a cohort of Norwegian adolescents, the Fit Futures cohort
study conducted first time in 2010-11 and repeated in 2012-13, including both cross-sectional
and longitudinal analyses and using different measures of physical activity. The three papers
address the specific hypotheses:
I. Is there a cross-sectional association between self-reported physical activity
and four different indices of body composition?
19
II. Is there an association between self-reported physical activity at baseline or
change in self-reported physical activity between baseline and follow-up and
changes in four different indices of body composition?
III. Is there an association between different measures of objectively measured
physical activity at baseline and changes in five indices of body composition?
We hypothesized that physical activity was associated with all measures of body composition,
and that the magnitude of the associations would be higher for the more specific measures.
3.0 Methods and materials
3.1 Study population
The Fit Futures study is part of the Tromsø Study, which is a repeated population based health
study of the adult population in the municipality of Tromsø, northern Norway. The first
Tromsø study was performed in 1974, and since then six studies have been performed with
the most recent one in 2015-16 [129, 130]. Because the Tromsø study only invites adults, a
youth cohort study, the Fit Futures Study (FF1), was initiated in 2010-11. A follow-up study
was performed in 2012-13 (FF2). The Fit Futures study was funded by UiT - The Arctic
University of Norway, the University Hospital of North Norway and the Norwegian Institute
of Public Health.
The first study (FF1) invited all students in their first year of upper secondary high school in
the neighboring municipalities of Tromsø and Balsfjord to participate in a health examination
and to answer a questionnaire (Appendix 1). The study invited 1,117 students from eight
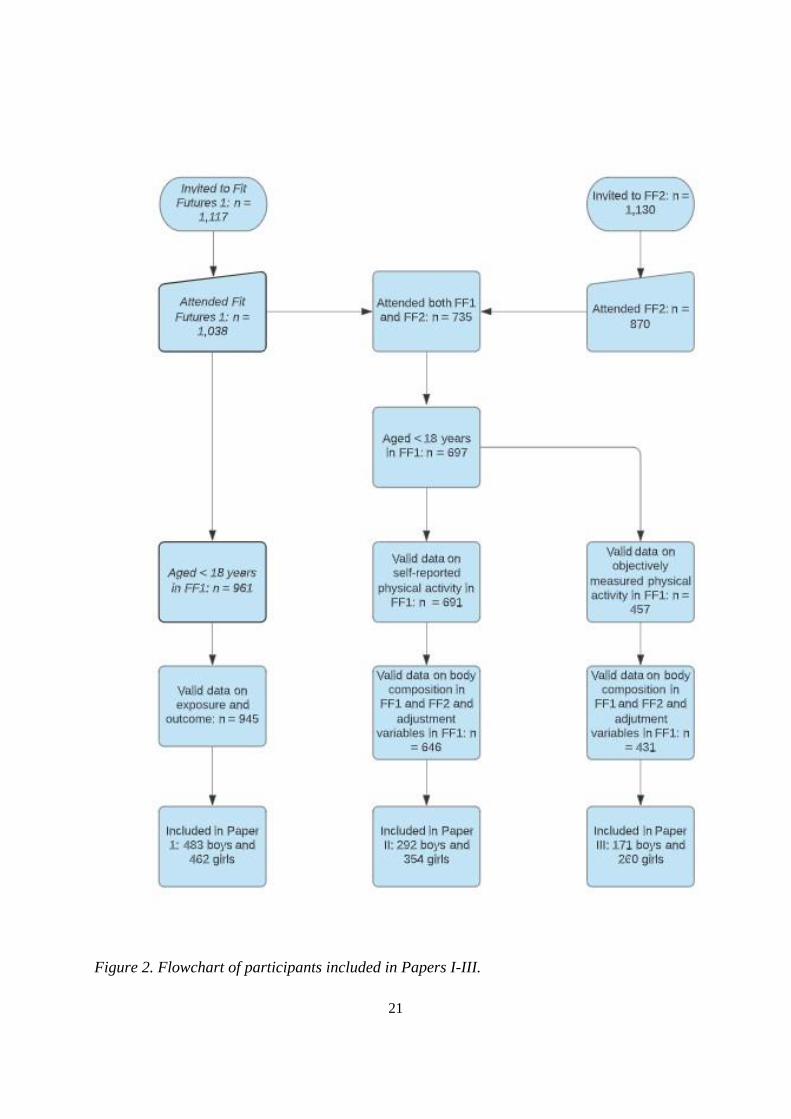
different schools, with 1,038 attending (93%). The second study (FF2) invited all students in
20
their last year of upper secondary high school in the same schools and all those which had
attended FF1, but had left school or started vocational training. In total, 1,130 students were
invited, out of which 870 participated (77% participation rate). Of the 870 participants, 132
individuals had not attended FF1. Enrollment in the studies went in sequence according to
school affiliation. Students were granted leave of absence from school to attend the clinical
examination and to answer the questionnaire at the Clinical Research Unit at the University
Hospital of North Norway. All measurements and examinations were performed by trained
research nurses. Written, informed consent was obtained from all participants, and those
under the age of 16 at the time of enrollment brought written, informed consent from their
parent or legal guardian. In the present thesis we included only those under the age of 18 at
the time of FF1 (n = 961). The flow charts for the participants included in the three papers are
given in Figure 2.
21
Figure 2. Flowchart of participants included in Papers I-III.
22
3.2 Measurements
Relevant to this thesis, the questionnaires used in the studies comprised questions on physical
activity, screentime, demographic factors, parental education, psychosocial and health
subjects (Appendices 1 and 2). While the questionnaire included several questions concerning
the consumption and frequency of meals and of different types of foods, snacks and drinks, it
did not include a validated global instrument for dietary habits such as a food frequency
questionnaire. Both boys and girls were asked questions on pubertal development, and girls
were also asked about age at menarche. Questions concerning puberty in boys were included
36 days after the data collection had commenced, and thus there were 102 boys with missing
data on these variables in FF1.
The clinical examination included, inter alia, measurements of body weight in kg (measured
to the nearest 100g) wearing light clothing, and body height in cm (measured to the nearest
0.1cm) on a Jenix DS 102 automatic electronic scale/stadiometer (Dong Sahn Jenix, Seoul,
Korea). Waist circumference was measured to the nearest centimeter at the height of the
umbilicus upon expiration. Following standardized procedures, all measurements and clinical
examinations were performed by trained research nurses.
Fat mass, soft tissue lean mass and appendicular soft tissue lean mass were measured in
grams using whole-body dual energy X-ray absorptiometry (DXA) (GE Lunar Prodigy, Lunar
Corporation, Madison, WI, USA). Fat mass comprises all fat, while soft tissue lean mass
comprises all bodily tissue except fat- and skeletal mass. Appendicular lean mass comprises
the soft tissue lean mass of the extremities.

23
3.3 Variables
3.3.1 Self-reported physical activity
There were several questions on frequency, type and duration of physical activity in the Fit
Futures studies (see Appendix 1), but a validated questionnaire for physical activity such as
the IPAQ was not included. However, many of the questions were similar in wording as
questions included in larger physical activity questionnaire batteries.
For the purpose of Paper I and Paper II, the primary exposure was hours of physical activity
during leisure time. This was based on the question “Are you physically active outside school
hours? Yes/No”. Those answering “No” were labelled as physically inactive. Those
answering “Yes” were asked “How many hours per week are you physically active outside of
school hours?”. This question was used in the Health Behavior in School Children study
where it was validated as part of a larger instrument for an adolescent population [131]. There
are six response categories, from none to more than 7 hours per week. Those reporting
“None” when answering this question were also labelled as physically inactive. “About half
an hour” and “About 1 to 1.5 hours” were combined, while the other responses were kept
unaltered. Together they formed the physical activity variable used in the analyses included in
Paper I and Paper II.
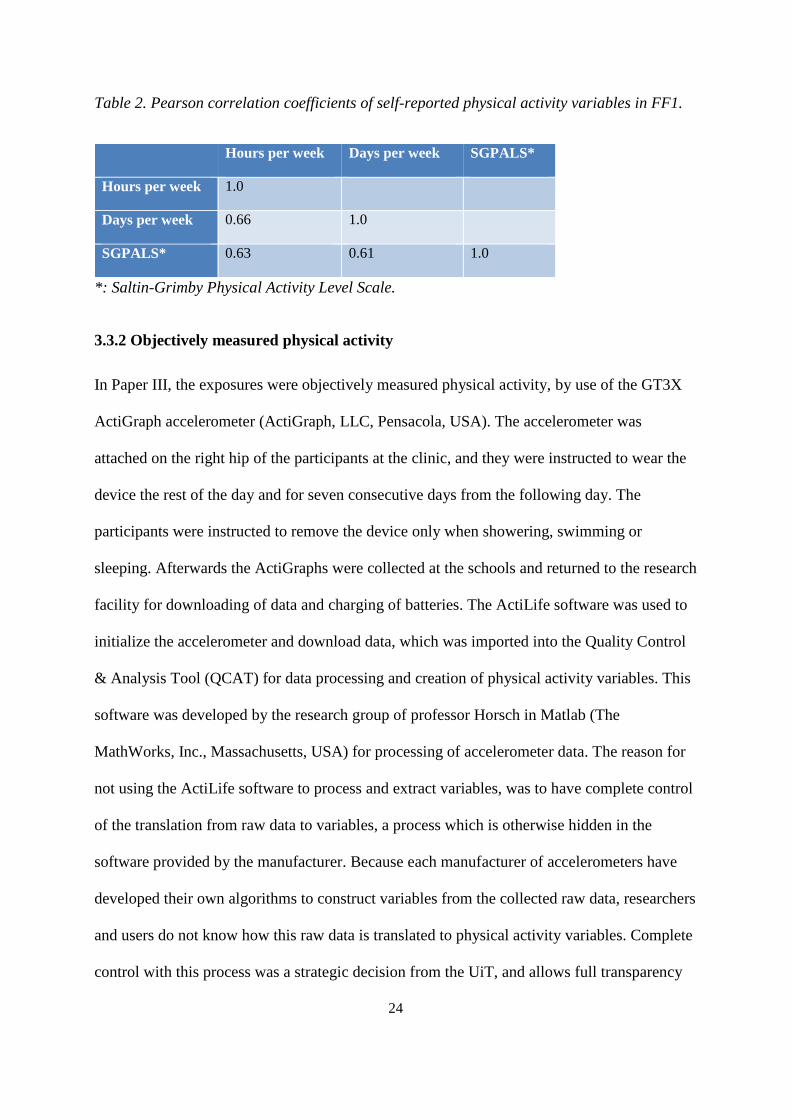
The available questions concerning physical activity from the questionnaires were
substantially correlated (see Appendix 1 and Table 2). Norwegian adolescents are more
physically active on weekdays than weekends [132], and therefore we considered the number
of hours of physical activity per week as a good measure of total self-reported activity.
24
Table 2. Pearson correlation coefficients of self-reported physical activity variables in FF1.
Hours per week Days per week SGPALS*
Hours per week 1.0
Days per week 0.66 1.0
SGPALS* 0.63 0.61 1.0
*: Saltin-Grimby Physical Activity Level Scale.
3.3.2 Objectively measured physical activity
In Paper III, the exposures were objectively measured physical activity, by use of the GT3X
ActiGraph accelerometer (ActiGraph, LLC, Pensacola, USA). The accelerometer was
attached on the right hip of the participants at the clinic, and they were instructed to wear the
device the rest of the day and for seven consecutive days from the following day. The
participants were instructed to remove the device only when showering, swimming or
sleeping. Afterwards the ActiGraphs were collected at the schools and returned to the research
facility for downloading of data and charging of batteries. The ActiLife software was used to
initialize the accelerometer and download data, which was imported into the Quality Control
& Analysis Tool (QCAT) for data processing and creation of physical activity variables. This
software was developed by the research group of professor Horsch in Matlab (The
MathWorks, Inc., Massachusetts, USA) for processing of accelerometer data. The reason for
not using the ActiLife software to process and extract variables, was to have complete control
of the translation from raw data to variables, a process which is otherwise hidden in the
software provided by the manufacturer. Because each manufacturer of accelerometers have
developed their own algorithms to construct variables from the collected raw data, researchers
and users do not know how this raw data is translated to physical activity variables. Complete
control with this process was a strategic decision from the UiT, and allows full transparency
25
of the construction of physical activity variables. There are plans to make the code behind
QCAT publicly available as open source code in the near future [133].
For the data collection, the accelerometer was set in raw data mode, with a sampling
frequency of 30 Hertz and with normal filtering epochs of 10 seconds. Data collection was
initiated at 14:00 hours the first day, and concluded at 23:58 on the 8th day of measurement.
We excluded data from the first day of measurement to reduce reactivity bias, wherein
awareness of being monitored can affect the amount of physical activity performed [134]. The
criteria for a valid measurement of physical activity was wear time of ≥ four consecutive
days, with ≥ ten hours wear time per day. This has been demonstrated as representative of
activity over a full week [135]. The triaxial algorithm developed by Hecht et al. was used to
calculate wear time [136]. In this algorithm, a minute of collected data was considered as
wear time if either the value of the vector magnitude unit (VMU) was > 5 VMU counts per
minute (CPM) and there were at least 2 minutes >5 VMU CPM during the time span of 20
minutes before and / or after this epoch, or its value did not exceed 5 VMU CPM, but both on
the preceding, and on the following 20 minutes there were 2 or more minutes >5 VMU CPM.
There are limitations associated with all interval-based algorithms used in the calculation of
wear time [133], and altering the parameters of an algorithm can affect the performance and
precision considerably [137]. Although the Hecht algorithm was initially developed and
validated for patients with Chronic Obstructive Pulmonary Disease (COPD), its performance
was similar to those of other alternatives [137]. Furthermore, it had already been put to use in
other cohort studies by some of the QCAT software developers [138], and thus it was
reasonable to build upon previous work. Minutes per day in sedentary (0 – 99 CPM), light
(100 – 1951 CPM), moderate (1952 – 5723 CPM) and vigorous (≥ 5724 CPM) physical
activity was determined using the cut-offs developed by Freedson [81]. These cut-offs are

26
widely used, but developed for adult- rather than adolescent populations, except the cut-off
for sedentary which was validated in adolescent girls [139]. Despite this, the Freedson cut-
offs were selected as they enabled comparison between the FF1 and FF2 (and in the future –
FF3) cohorts. Furthermore, the acceleration of an adolescent body resembles more that of an
adult than a child, and in the European Youth Heart Study the cut-off for MVPA was set at
2000 CPM – close to the Freedson cut-off at 1952 CPM [140]. In a study from 2019,
Henriksen et al. showed that the intensity levels developed using QCAT correlated strongly
with those from the ActiLife software [141] (Table 3).
Table 3. Pearson’s correlation coefficient (95% confidence interval) between minutes spent in
the different intensity levels calculated using QCAT and ActiLife software*.
Variable Pearson’s r
Steps 1.00
Sedentary 0.61 (0.39. 0.76)
Light 0.98 (0.96, 0.99)
Moderate 0.94 (0.89, 0.96)
Vigorous 0.99 (0.99, 0.99)
MVPA 0.96 (0.92, 0.98)
*: Adapted with permission from Henriksen et al [141].
The device collected data in both uniaxial- and triaxial mode, but at the time of writing Paper
III, only the uniaxial data had been processed and therefore available for analyses. Uniaxial
data recorded from the GT3X correlate well with uniaxial data recorded from previous
ActiGraph models [142].

27
3.3.3 Outcome variables
The primary outcome variables included in this thesis are listed in Table 4. Body mass index
was computed as weight in kilograms/height in meters2. We applied the IOTF body mass
index reference values for adolescent populations to classify participants as either
underweight, normal weight, overweight or obese in FF1, using age in half years. The
classification terms for categories of body mass index correspond to the adult classifications
[46, 47]. In FF2, all included participants were aged ≥ 17.75 years, and thus BMI was not
adjusted for age in the classification of weight status in this survey.
Waist circumference was measured to the nearest cm at the height of the umbilicus after
expiration. We classified participants to be abdominally normal weight, overweight or obese
depending on age, using age in half years and the Norwegian reference values [143].
Abdominal obesity was defined as waist circumference at or above the 95th percentile in
Norway [143].
We used DXA estimates of fat mass and soft tissue lean mass in grams to calculate Fat Mass
Index (FMI, fat mass in kilograms/height in meters2) and Lean Mass Index (LMI, lean mass
in kilograms/height in meters2). Region-specific estimates of lean mass in grams were used to
calculate appendicular lean mass index (aLMI), which is the sum of lean mass in all four
extremities divided by height in meters2.

28
Table 4. List of outcome measures in the included papers.
Outcome Paper I Paper II Paper III
Body Mass Index (BMI) X X X
Waist Circumference (WC) X X X
Fat Mass Index (FMI) X X X
Lean Mass Index (LMI) X X X
Appendicular Lean Mass Index (aLMI) X
Appendicular LMI was included in Paper III only. The reason was that we only became aware
of the possibility of including this outcome after Paper I had been published and Paper II
submitted.
3.3.4 Other variables
From the literature we identified multiple variables that could confound an association
between physical activity and body composition. The following variables were either
included, or given consideration for inclusion, in the analyses.
Age
Age is an important confounder in the relationship between physical activity and body
composition. Although different from biological age, the two are evidently closely related. In
all analyses we opted to exclude those aged ≥18 years of age. The reason is that these
participants would likely have a body composition resembling more that of adults and
physical activity habits different from adolescents, despite attending upper secondary high
school. Thus, within the included sample, age differed between 15.5 years and 17.5 years at
the time of FF1. Within a period such as adolescence, 2 years constitute a substantial share.
29
However, because all participants attended first year of upper secondary high school, and
because those aged ≥ 18 years were excluded from the analyses, age showed little variation
(Mean age in FF1: 16.1, SD: 0.4 (girls)/0.5 (boys)).
Age was reported in years by respondents. Age in months was included in the data file and
computed by subtracting date of birth from date of attendance. Age in half-years was used in
the calculation of age-adjusted classifications of weight status.
Screentime on weekdays
In all three papers we adjusted for sedentary time as self-reported screentime on weekdays.
There were 7 response alternatives, ranging from “none” to “10 hours or more”. In Paper I the
alternatives were not altered, whereas in Papers II and III we merged some of the categories,
creating a variable with 5 different response categories.
Dietary habits
In the questionnaires there were several questions on nutrition, dietary habits, frequency and
type of meals, snacks or beverages consumed, but these were not part of a validated
instrument to assess dietary habits. In all three papers we opted to adjust for frequency of
breakfast consumption, on the presumption that this is an indication of healthy meal habits
[144].
Study specialization
In the papers we intended to adjust for parental level of education as a measure of SES.
However, around one third of participants had answered “don’t know” to this question. Not
knowing is arguably something qualitatively different from any specified level of education.
We therefore opted to adjust for study specialization as a measure of SES. Study

30
specialization was associated with not knowing parental education, with significantly more
among those studying vocational subjects than general- or sports reporting “don’t know”.
The question on study specialization had three possible responses; “general subjects”,
“sports” or “vocational subjects”. Since the aim was to adjust for any socioeconomic
differences between the different specializations, we merged “general subjects” and “sports”
in Paper I, thus creating a dichotomous variable – study specialization. This was based on the
observation that those attending sports or general subjects were similar in terms of level of
parental education. In Papers II and III, we did not create a dichotomous variable, but used the
categorical variable in its original format, acknowledging that study specialization is not
merely a measure of SES but also associated with for instance participation in organized
sports [145].
Time between measurements
Within the period that constitute adolescence, time is the most important factor in the
development of body composition. Time between measurements was computed by
subtracting the date of attendance in FF2 from date of attendance in FF1. Due to the design of
the Fit Futures Studies, with rolling attendance, time between measurements among those
included in Paper II ranged from 573 to 981 days with a mean of 736 and a standard deviation
of 77. This means that the time available for both increases in body composition and positive
or negative effects of low/high physical activity could differ substantially between
individuals.
Device wear time
The precision of accelerometers in determining actual physical activity is dependent upon
compliance from the user. Typically, a minimum of 10 hours per day over ≥ 3 or ≥ 4 days is
31
considered the minimum to get a valid estimate of physical activity [135]. The latter was also
the minimum requirement in the Fit Futures studies. Thus, in our data, device wear time had a
theoretical range of 10-24 hours per day. Actual mean wear time per day ranged from 10.6 –
18.6 hours in Paper III. As noted previously, the raw data from the accelerometer is
categorized into four different levels of intensity, with the majority of hours spent wearing the
device falling into the categories sedentary- or light. This is natural, all the while the majority
of humans waking hours are spent in these intensities [146]. However, this means that more
hours of wear time may collect more hours of sedentary- or light activity [147], and thus
adjustment for wear time was appropriate.
Seasonal variation
Physical activity varies according to season and time of year [148, 149]. In the present study,
those taking sports specialization attended the survey in January. This is a time which
normally is associated with less physical activity than during the summer months. A
difference in level of activity between seasons would likely be the result of differences
between schools or study specializations, rather than season itself, and thus we did not
attempt to adjust- or stratify according to seasonal variation.
Pubertal development
Puberty and maturation are important factors to consider when studying physical activity and
body composition in adolescents [22, 150]. In the present study questionnaire data on pubertal
development existed for both boys and girls, in the form of the PDS (boys) and age at
menarche (girls). However, there was a substantial number (n = 121) of missing data on PDS
among boys in FF1. The reason was that the questions on PDS were included in the
questionnaire on the 25th of October 2010, which was 36 days after the first participants had
32
attended (20th September 2010). This left us with three options on how to handle maturation
in boys; either perform complete case analyses, in which case a number of participants would
be excluded (101/483 in Paper I), perform multiple imputation (MI), or not include PDS in
the models. We considered MI to be slightly problematic, in part due to the study design with
rolling attendance by schools. This design meant that the data from which imputation would
be based would come from other schools, which could differ according to factors such as
study specialization, demographics etc. Furthermore, the imputation in participants with
missing pubertal data would have been based on data from those attending FF1 between 0-7
months later, at which point puberty may have reached later stages than what was the reality
for those with missing data on puberty. As a result, we did not adjust for PDS and performed
instead sensitivity analyses wherein the analyses were repeated in those with complete data on
PDS only. Because we lacked data on boys, we did not include maturation in girls either,
despite that data on age at menarche for the most part was available. As for boys, the analyses
were repeated for girls with adjustment for maturation in complete case analyses.
3.4 Ethical considerations
The Regional Committee of Medical and Health Research Ethics (Rec North) approved Fit
Futures 1 (2009/1282), Fit Futures 2 (2011/1702) and the present study (2014/1666)
(Appendix 3). Both Fit Futures 1 (27.07.2010 (Ref. 07/00886-7/CGN)) and Fit Futures 2
(31.10.2012 (Ref. 07/00886-15/EOL)) were approved by the Norwegian Data Inspectorate.
All participants received information about the purpose of the study in advance, and had the
possibility to decline to take part in any specific measurement such as DXA or blood samples.
In cases where the participants were aged <16 years, consent was obtained from the parent or
legal guardian.
33
The present study, as well as both Fit Futures studies, were performed in accordance with the
Helsinki Declaration [151], the Vancouver rules for co-authorship [152] and the Norwegian
Health Research Act [153].
3.5 Statistical methods
All statistical analyses were performed using STATA, version 14 (StataCorp, Texas, USA).
The level of significance was set at p < 0.05. All results were presented sex-specific, as
decided a-priori. Descriptive statistics was used to determine means of continuous variables
(with standard deviation (SD), while percentages (with number of subjects) was presented for
categorical variables. We assessed normality of dependent variables by visual inspection of
histograms. Multicollinearity was assessed by the variance inflation- and tolerance statistic,
and model residuals were visually inspected in plots. The assumptions were considered met in
all papers. We did not put emphasis on r-square or the r-square change associated with
inclusion of a new variable in the model, as the objectives were not to build the best model for
predicting outcomes, but to assess to what degree physical activity was associated with
outcomes – adjusted for known confounders.
In Paper I we used linear regression to present estimates of body mass index, waist
circumference, fat mass index and lean mass index, with 95% CIs, across the levels of
physical activity, with crude and adjusted p-values for linear trend. The measure of physical
activity chosen as the exposure was hours per week of physical activity outside school hours,
coded to reflect the number of hours they represented. In the crude analysis we assessed the
linear relationship between the physical activity variable and the body composition variables.
In the second analyses we adjusted for screentime on weekdays, age in half-years, regularity
of eating breakfast and study specialization.
34
In Paper II the associations between baseline physical activity and longitudinal changes in
BMI, waist circumference, FMI and LMI were assessed using linear regression. The outcome
variables were computed by subtracting the baseline measurement from the follow-up
measurement of the respective body composition parameter. The same physical activity
exposure as in Paper I was used, with a slight modification of how “2-3 hours” was coded. In
Paper I this was coded as “3”, whereas in Paper II, this was coded as “2.5” to more accurately
reflect the number of hours represented. The associations with changes in activity status were
assessed by analysis of covariance. Change in physical activity between baseline and follow-
up was determined by creating a dichotomous variable (active/inactive) based on the variable
of hours per week of physical activity outside of school. Being physically active was defined
as ≥ 2 hours per week. By combining the variable from FF1 and FF2, four different
combinations were possible: active/active (consistently active), active/inactive (quitters),
inactive/inactive (consistently inactive) and inactive/active (adopters). The consistently
inactive were set as the reference category in the primary analyses, with a secondary analyses
performed wherein those quitting were set as reference. In all analyses we adjusted for the
baseline values of outcome. In the final adjusted models we also included baseline
measurements of sedentary behavior (screentime), study specialization, regularity of eating
breakfast and age in half years, in addition to the time between baseline and follow-up. We
presented adjusted beta coefficients for change in outcome at each level of physical activity at
baseline or change in activity status.
In Paper III the sex-specific difference in body composition between baseline and follow-up
was tested using a paired samples t-test. The difference in physical activity between sexes was
tested using a two-sample t-test, while sex differences in categories of minutes spent in
MVPA was tested using a chi-square test. Difference in linear trend across categories of
35
minutes spent in MVPA was tested using STATA’s non-parametric test for trend, developed
by Cuzick [154]. Linear regression was used to determine how baseline physical activity is
associated with change in body composition, i.e. the change in BMI, waist circumference,
FMI, LMI and aLMI between surveys, computed by subtracting the baseline measurement
from the follow-up measurement. We used three different predictors of change in body
composition, performing three sets of analyses, with first; minutes per day spent in sedentary
activity, second; minutes per day spent in light activity, and third; minutes per day spent in
MVPA. The continuous variables sedentary- and light activity were divided by 30 and the
continuous variable MVPA by 15 before inclusion in the models, thus presenting the beta
coefficient for change in outcome per 30 minutes of sedentary- or light activity, or per 15
minutes of MVPA, with 95% confidence intervals and a p-value. This was judged to be easier
interpreted to the reader than presenting the beta coefficients for one unit change in the
exposure variables. In model 1 we adjusted for the baseline measurement of the outcome. In
the adjusted models (models 2) we also included time between measurements and baseline
values of device wear time, age in half years and questionnaire data on screentime on
weekdays, study specialization and regularity of eating breakfast. In the analyses of
sedentary- and light activity we also adjusted for minutes spent in MVPA. In a subset of
analyses we repeated the analyses, adjusting also for self-reported pubertal status measured by
either pubertal development scale (boys) or age at menarche (girls). These analyses included
the 143 boys and 258 girls with valid data on pubertal status.
36
4.0 Results and summary of papers
4.1 Paper I
The association between self-reported physical activity and body composition in adolescents
has seen conflicting results, particularly because of a reliance on body mass index as the
measure of body composition. In this paper we therefore aimed to examine the cross-sectional
association between self-reported physical activity during leisure time and four measures of
body composition, thus avoiding a reliance on a single measure of body composition which
may also be unreliable.
Out of 961 eligible participants, there were 23.5% of boys and 20.5% of girls with overweight
or obesity, as determined by the IOTF cut-offs. According to the Norwegian reference
standard for waist circumference, there were 39.9% of boys and 55.9% of girls with
abdominal overweight or obesity. More than 30% reported that they were not physically
active outside school hours. Roughly 40% of both boys and girls reported being active more
than 4 hours per week. Higher number of hours of physical activity was significantly and
linearly associated with a lower fat mass index (p = 0.004) and higher lean mass index (p <
0.001) in boys. For girls the same association was observed (p = 0.03 and p < 0.001,
respectively), but extended also to a lower waist circumference with higher level of activity (p
= 0.04). There was no association between physical activity and body mass index in either
sex.
We concluded that higher physical activity is associated with two complementary measures of
body composition in this cohort of Norwegian adolescents, which in turn can explain why no
association was observed with body mass index.

37
4.2 Paper II
The causal association between self-reported physical activity and changes in body
composition in adolescents is disputed, illustrating a need for longitudinal studies which
enable research on cause and effect. In Paper II we aimed to examine the relationship between
self-reported physical activity in the first year of upper secondary high school and changes in
four measures of body composition between first- and last year of upper secondary high
school. Furthermore, we aimed to investigate whether change in level of physical activity
between baseline and follow-up predicted changes in body composition.
There were 646 participants eligible for inclusion in the analyses. The proportion of
adolescents classified as active in leisure time (active ≥ 2 hours per week) decreased by 6%-
points in boys and 12.2%-points in girls. While both sexes experienced a mean increase in the
included measures of body composition, the level of self-reported physical activity at baseline
was not a significant predictor of these changes. One exception was the adjusted change in
waist circumference in boys, which declined with higher activity (p = 0.05), and the
statistically significant increase in both waist circumference and fat mass index in the most
active girls. In boys, change in level of physical activity between baseline and follow-up was
associated with changes in fat mass index (p < 0.01), with adopters and the consistently active
increasing significantly less than the consistently inactive. Change in level of physical activity
also predicted change in lean mass index in girls, with those adopting activity or remaining
physically active having increases in lean mass index relative to those quitting activity
between baseline and follow-up.
We concluded that change in the level of self-reported physical activity was associated with
changes in fat mass index in boys and lean mass index in girls, and thus it appears that there
are favorable consequences of remaining active or adopting activity during adolescence. A

38
possible explanation for the difference between sexes may be the sexual dimorphism in body
composition during adolescence, which occurs as a result of sexual hormones, and means that
the relative increases in both fat- and lean mass index are to some extent biologically
determined and therefore independent of physical activity. The fact that baseline level of
physical activity to little extent predicted changes in the included measures of body
composition may be explained by the analyses of change in physical activity, which illustrates
that substantial changes in habitual physical activity takes place during adolescence.
4.3 Paper III
Physical activity may be measured in several different ways, and self-reported physical
activity does perhaps not capture the true level of physical activity. Therefore, in Paper III we
explored whether objectively measured physical activity was associated with changes in five
different measures of body composition.
There were significant differences between the sexes in counts per minute and minutes spent
in MVPA at baseline. Time spent in sedentary-, light- or moderate-to-vigorous physical
activity did not predict changes in either measure of body composition in boys. In girls,
minutes spent in sedentary- and light physical activity was significantly associated with
changes in indices of lean mass. More time in sedentary activity predicted lower lean mass
indexes, while more time in light activity predicted higher lean mass indexes.
We concluded that there appears to be a relationship between sedentary activity and low
intensity physical activity and changes in indices of lean mass in girls, but not boys. Time
spent in MVPA was not associated with change in either sex. The results are similar to some
of the findings in Paper II, but we were not able to assess the possible impact of changes in
objectively assessed physical activity.

39
5.0 Methodological considerations
The main objective of this thesis has been to investigate the association between physical
activity and body composition in a cohort of Norwegian adolescents. Given the complexities
of this field of research, it was always beyond the scope of a single thesis to provide a definite
account of the relationship between physical activity and body composition in adolescents in
general. We believe the results add to the body of knowledge within the field, and provide
insight into how some measures of physical activity affect both general and specific measures
of body composition. The results should nevertheless be interpreted with caution, and in light
of the strengths and limitations of the study as a whole. This warrants a discussion of
methodological considerations and sources of potential bias and confounding before
proceeding to discussion of results.
5.1 Study design
There is an established cross-sectional association between physical activity and body
composition in adolescents [38], where lower levels of physical activity are associated with
for instance higher BMI. By design such studies cannot ascertain the direction of an
association. This highlights a need for longitudinal studies, and previous research applying
such designs have not been conclusive [155]. The present thesis included both cross-sectional
and longitudinal analyses. While longitudinal studies in principle are better suited to
determine causality, individuals may have, and report, high levels of physical activity because
they try to lose weight, or they may have low (or high) body weight because of high activity.
The problem of reverse causality therefore applies also to longitudinal studies, as overweight
adolescents for instance may avoid engaging in physical activity on account of feeling inferior
relative to their active peers [78, 156]. There is no straight-forward answer to this problem. In
other fields of research the scientist aims to have control over every aspect of the research

40
setting, and thus may isolate the exposure and exclude the effect of potential mediating
factors. This is not possible in the case of physical activity epidemiology. There has been
numerous intervention studies, wherein overweight subjects are assigned controlled physical
activity exposure, and with various degrees of success [64, 157]. In contrast, it is problematic
to assign normal weight subjects to gain weight, live with excess weight for some time, and
then assign them to exercise – especially so for child- and adolescent populations. In real-life
settings, individuals are exposed to numerous factors, which in their own regard or in
interaction with others, have an effect on both physical activity and body composition [100].
Furthermore, changes to physical activity behavior can occur over both the short- and long
term, and be caused by life-defining events such as transition to higher education [158] or
becoming pregnant [159], or less visible factors such as changes in motivation [160]. Because
of these issues, whether overweight precedes or succeeds physical activity is difficult to
determine even in longitudinal studies [161]. In this regard, it should also be noted that the
effects of a negative behavior such as physical inactivity takes time to manifest itself in
excess adiposity. In the present study, follow-up time was around 2 years, but this may not be
enough time to detect such changes given the influence of maturation on body composition.
5.2 Validity of measurements
The results of any research is dependent on how exposures and outcomes are measured.
Considering physical activity and body composition, there are several issues concerning
measurement which may have affected the results presented in this thesis.
5.2.1 Validity of physical activity measurements
In general, questionnaire data are prone to bias, and there is no exception to questionnaires on
physical activity [162]. Informants may exaggerate or underestimate, for many different

41
reasons, and it is therefore not certain that the respondent is as active as they say. Perhaps
more relevant to this thesis is the diversity in motives for being physically active [32, 33].
This means that an individual with excess adiposity, however measured, can report a high
level of physical activity if they currently wish to reduce body weight. Another individual
with the same body composition may choose not to engage in physical activity for fear of
stigmatization, and will perhaps seek other methods for weight loss than physical activity
[78]. A question on motivation or reason for engaging in physical activity may be the solution
to this particular problem, but reverse causality can still be a potential problem.
An underlying assumption behind using baseline exposure as a predictor for change in body
composition is that the level of physical activity reported remains consistent over the study
period. There is no guarantee that this assumption holds. This is particularly relevant since
adolescence is a period of life where many people make changes to their activity habits. In
fact, in Paper II, only 40% of participants reported the same number of hours of activity in
FF2 as in FF1 (Table 5). This comes in addition to those who in FF1 had recently changed
their physical activity levels – of which there is no information. In Table 5 the self-reported
level of hours of physical activity in FF1 and FF2 is presented, with the associated non-
weighted and weighted Kappa values. In the calculation of weighted Kappa, we assigned the
default weights (wgt) included in the STATA package (which, for a 6-level variable
represents a reduction factor in weight of 0.2 per level). The non-weighted Kappa was 0.224,
and the weighted Kappa was 0.356, indicating that the agreement between self-reported
activity in the two surveys represents “fair agreement”, as suggested by Landis & Koch [163].
These are nevertheless Kappa values in the lower spectrum, something which implies that
there are substantial changes in behavior between the surveys, in line with the known decline
in activity throughout adolescence [164].

42
Table 5. Crosstabulation of hours per week of self-reported physical activity in Fit Futures 1
and Fit Futures 2 among the participants included in Paper II*.
Fit Futures 2
Fit Futures 1 None 0.5 hrs 1 – 1.5 hrs 2 – 3 hrs 4 – 6 hrs ≥ 7 hrs Total
None 108 4 22 18 23 6 181
0.5 hrs 3 1 0 0 2 1 7
1 – 1.5 hrs 22 0 4 8 12 2 48
2 – 3 hrs 53 1 15 26 24 7 126
4 – 6 hrs 36 1 10 25 58 32 162
≥ 7 hrs 9 0 7 13 23 55 107
Total 231 7 58 90 142 103 631
* Kappa: 0.224, weighted Kappa: 0.356.
A possible solution to the problem of lack of consistency in habits throughout follow-up
could be the inclusion of a question on past activity in addition to present activity, and to
adjust for this variable in the analyses. This could eliminate some of the effect of past activity
habits (if they differ from present levels) on present body composition and on the potential
future increase in adiposity. Given the changing nature of adolescence, this may be
appropriate in future studies, but was not an option here as the data collection was completed
when this thesis was planned. Another solution might be to use change in activity from FF1 to
FF2 as exposure, rather than baseline physical activity – an approach used in Paper II. A
problem with this approach is that with only two measurements, it is not possible to determine
when the increase or reduction of activity actually occurred. The individual may have
changed their level of activity anytime during the study period, which again raises the
problem of validity of the exposure. Further complicating the matter is the fact that
adolescents (and particularly adolescent boys) increase their resting metabolic rate as a result

43
of growth [78]. This means that the lower energy expenditure associated with a reduction in
physical activity may be compensated through natural changes in energy expenditure or
because of energy required for growth [78]. As a result, the boy who at baseline reports being
inactive may not necessarily gain any more weight than his active peer, if maturation works
favorably for him in terms of energy expenditure. Therefore energy expenditure as a result of
factors other than physical activity may confound the association between level of physical
activity and changes in adiposity [165].
A challenge associated with questionnaire data on physical activity is whether the questions
pick up any meaningful difference in activity between participants. In other words, does the
question truly separate the active from the inactive? One could hypothesize that leisure time
activity (outside of school) may not constitute the biggest contributor to total activity during a
regular day. For adolescents, transportation to school and friends, hiking or outdoors
activities, other activities of daily living, as well as mandatory physical education in school
hours can all contribute to total activity. In 2010 in Norway, mandatory physical education
was 2 hours per week in upper secondary high school. This is not particularly high, but in FF1
around 60% of participants reported being physically active 3 hours or less per week outside
of school. For them, 2 hours of physical education in school would amount to a substantial
share of total activity. Regarding transportation, we had data on transportation to school, but
not otherwise in leisure time. Still, in Paper I the vast majority either travelled by bus or was
transported by car to school (Table 6). In any case it is likely that distance from home to
school is a better predictor of mode of transportation than preference for activity. Active
transportation to friends in the vicinity of home might contribute to more walking or bicycling
than transportation to school, but no such data was available.
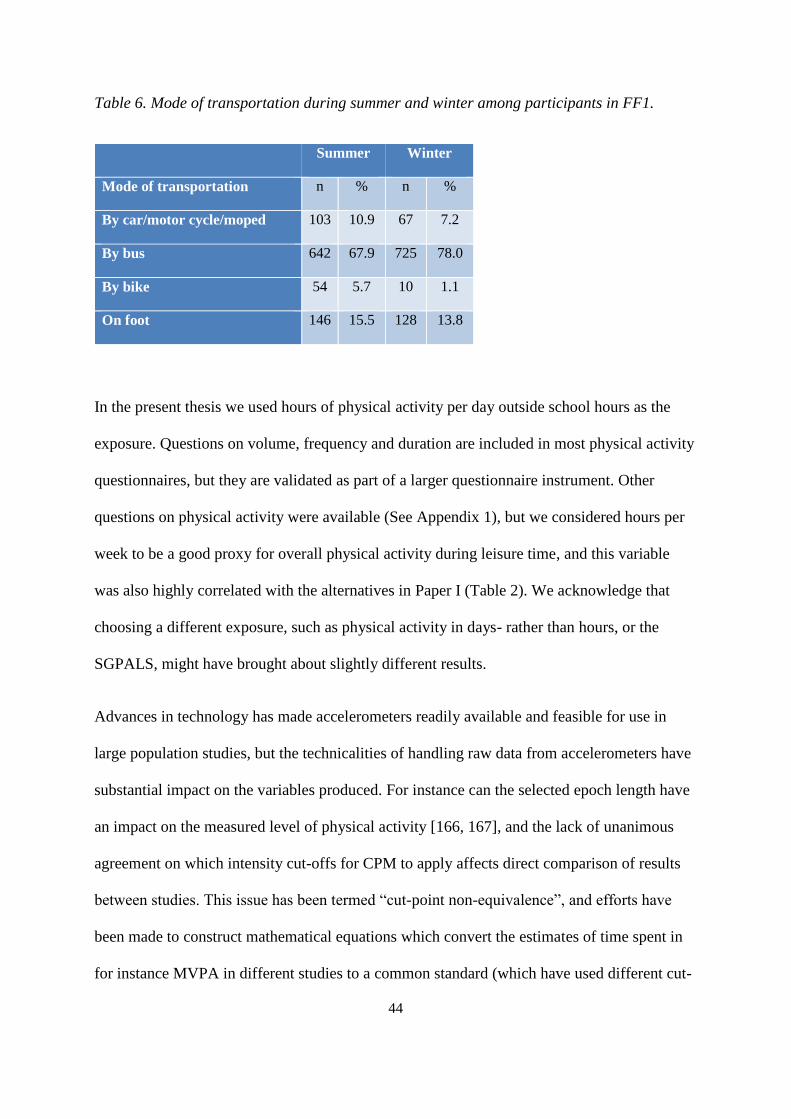
44
Table 6. Mode of transportation during summer and winter among participants in FF1.
Summer Winter
Mode of transportation n % n %
By car/motor cycle/moped 103 10.9 67 7.2
By bus 642 67.9 725 78.0
By bike 54 5.7 10 1.1
On foot 146 15.5 128 13.8
In the present thesis we used hours of physical activity per day outside school hours as the
exposure. Questions on volume, frequency and duration are included in most physical activity
questionnaires, but they are validated as part of a larger questionnaire instrument. Other
questions on physical activity were available (See Appendix 1), but we considered hours per
week to be a good proxy for overall physical activity during leisure time, and this variable
was also highly correlated with the alternatives in Paper I (Table 2). We acknowledge that
choosing a different exposure, such as physical activity in days- rather than hours, or the
SGPALS, might have brought about slightly different results.
Advances in technology has made accelerometers readily available and feasible for use in
large population studies, but the technicalities of handling raw data from accelerometers have
substantial impact on the variables produced. For instance can the selected epoch length have
an impact on the measured level of physical activity [166, 167], and the lack of unanimous
agreement on which intensity cut-offs for CPM to apply affects direct comparison of results
between studies. This issue has been termed “cut-point non-equivalence”, and efforts have
been made to construct mathematical equations which convert the estimates of time spent in
for instance MVPA in different studies to a common standard (which have used different cut-
45
offs), enabling comparison [168, 169]. Furthermore, the algorithms chosen to determine wear-
time represents a trade-off between the quality of data and the number of participants with
valid data [170]. Because stricter criteria for wear-time might omit periods of what is actually
sedentary behavior, the result could be that more participants with overweight or obesity are
excluded from the analysis [170].
At present, the WHO guidelines for time spent in MVPA in adults state that the activity
should occur in bouts of minimum 10 minutes to be valid [76], but recently the United States
guidelines for physical activity was updated to not require 10-minute bouts [171]. The
consequence is that more adults appear to reach the goals of 22 minutes of MVPA per
weekday, as short periods of higher intensity physical activity now is included [133]. This
may explain why self-reported level of MVPA tends to be higher than what has been
measured objectively, as people may include such shorter periods of high intensity physical
activity in their total estimates [133]. These considerations on accelerometer data handling
apply also to the present thesis, as the selected cut-offs, epoch lengths and wear-time
definitions would have produced slightly different estimates of physical activity than what
would have been the case if other criteria were used. This also illustrates that objective
measurement of physical activity is bound by subjective judgement when it comes to the
process of analyzing the data. As such, referring to accelerometers as “device-based methods
of assessment” rather than “objectively measured” may be a more accurate choice of words.
5.2.2 Validity of body composition measures
In the present thesis we included four (five) different measures of body composition. As there
are known limitations associated with BMI, both in general and in adolescents specifically,
using this measure alone would be insufficient for the purpose of the study. This measure was
included for sake of comparison with other studies, and to investigate how the association

46
between physical activity and BMI compared to the association with the other included
outcomes. For the same reason waist circumference was also included as an outcome, as this
is a prevalent measure of body composition and included as a component in the metabolic
syndrome [53].
We consider the DXA measurements to be of high quality compared to the alternatives,
despite the inherent limitations of this instrument also. Lohman et al. have described the
different body composition assessment methods as either “reference”, “laboratory” or “field”,
with each category assigned a typical error [56]. Reference techniques (the gold standard)
have a typical error of 1-2%, but are costly and requires highly skilled technicians and
advanced equipment. Laboratory methods include DXA, and has an error of 2-3%. On
average, the sum of bone-, fat- and soft tissue lean mass as derived by DXA, differs from that
measured on a scale weight by around 1 kilogram [56]. DXA has good ability to determine
bone- and lean mass, but is slightly less precise in determining fat mass (3%) – particularly in
very lean or very obese people [56]. Furthermore, the precision of DXA varies between
manufacturers and software, to such extent that care should be taken in comparing estimates
of fat mass performed using different equipment. The estimates of fat- and lean mass are
furthermore based on algorithms built into the software of manufacturers, which is considered
the intellectual capital of producers and thus not readily available to researchers [56].
In the present thesis we used lean mass index as one of the outcomes. In the literature, lean
mass index is often interchangeably used with fat-free mass index, and frequently includes
skeletal mass. We did not include skeletal mass in the lean mass index, but when comparing
results with other studies the reader should be aware that lean mass index then could include
bone mass. We considered our definition of lean mass index (comprising only soft tissue lean
mass) to be more specific to muscular tissue than FFMI, but as lean mass is associated with

47
skeletal mass [172, 173] the difference in magnitude of an association with FFMI would
likely be small.
Lastly, fat mass index is not the most specific measure of fat available from DXA
measurements, as DXA provides options of assessing amount of region-specific adipose
tissue. Abdominal fat consists of visceral adipose tissue (VAT) and sub-cutaneous adipose
tissue (SAT), of which the former is considered more hazardous to health [174] and
considered as an important risk factor for cardiovascular disease [175]. This measure was not
available at the time of writing the included papers, and has been validated in adults [174,
176], but not adolescents. Associations with physical activity would still be of interest, and
may have provided different results than what we observed with FMI.
In conclusion, although a valid technique for estimation of body composition, different
measurements performed by DXA should be compared in light of the population under study,
the definitions used, the software version applied and the manufacturer of the apparatus. This
means that other studies, using different software versions or equipment from different DXA
manufacturers, might have found slightly different associations from what we observed. Also,
it should be noted that associations between physical activity and BMI might be different, had
BMI been self-reported rather than measured. Considering waist circumference, different
methods of assessment (placement of measuring band on abdomen) in other studies might
restrict comparison with our results [52].
5.3 Statistical procedures and adjustments
As a general principle, the statistical methods chosen should reflect the research question. We
were interested in the linear associations between the exposure and the outcome, in which
48
case linear regression is appropriate if the assumptions are met. These were generally met, but
some issues warrant further discussion and clarification.
In Paper I, one of the dependent variables, Fat Mass Index, appeared right skewed, and log-
transformation of this variable was considered. This did not alter the association with physical
activity, and FMI was therefore included in its original form for ease of interpretation. Also,
in Paper I physical activity was coded to reflect the number of hours they represented, but due
to a mistake in the coding of variable, the category “about 2-3 hours” was coded as “3”, rather
than “2.5”. In the writing of this thesis, the analyses were repeated with the same procedures
regarding this issue as in Paper II and III, but this did not substantially influence the results
and the reported associations remained. In Paper II, this category of physical activity was
coded as “2.5”.
In the case of Paper II, we were interested in whether change in a dichotomous variable was
associated with changes in body composition. To this end we combined the dichotomous
variables in FF1 and FF2, giving four possible combinations. Based on the questionnaire data,
an individual was classified as physically active if he/she reported being physically active ≥ 2
hours per week outside of school. This may appear an arbitrary cut-point to categorize people
as active or not, as it does not imply for instance fulfilment of recommendations for physical
activity. However, the objective was to separate the active from the inactive, and the two
categories which were combined spanned 0 - 1.5 hours weekly activity and therefore
constitute little physical activity over the course of one week.
In analyses of accelerometry-derived physical activity, the variables used are typically
minutes spent in different intensities of physical activity. Due to the closed structure of the
derived variables, wherein only 24 hours of the day is available, this can cause problems with
49
multicollinearity in regression analyses because the number of minutes spent in a given
intensity can in theory be derived from the minutes spent in the other intensities. This would
depend on wear time being 24 hours, but in Paper III mean wear time was 14 hours and no
participants exceeded 18.6 hours. Other methods exist to overcome the limitation of
multicollinearity, but are still in their early development. Aadland et al.[177] suggest that the
evidence base for physical activity requirements is not flawed, but that linear regression
currently is the second-best option for analyzing accelerometer data. They argue that future
studies should apply multivariate pattern analysis without transformation of physical activity
data. This method handles collinear variables, and may provide more robust results than
multiple regression. In Paper III, multicollinearity did not appear to be a problem, based on
evaluation of the variance inflation factor and tolerance statistic. Regarding the previously
noted translation of raw accelerometer data to physical activity variables, this was handled in-
house and using software developed at UiT – The Arctic University of Norway. Although
prevalent cut-offs were applied, we do not know whether results would have been replicated
using ActiLife software instead. However, the study by Henriksen et al. [141] showed that
estimates of intensities of physical activity by QCAT was strongly correlated with those from
the ActiLife software (≥ 0.94), with the exception of sedentary time, where the correlation
was lower at 0.61 (Table 3).
The association between physical activity and body composition could be assessed using
categories of weight class (based on BMI) as the outcome, but to our mind, this provides
limited information, as even small differences in BMI can affect which category of BMI an
individual is assigned. Furthermore, given the influence of biological age, individuals may be
wrongfully classified as normal weight or overweight which may affect results in a relatively
small sample such as ours. The size of the sample is particularly important in the study of
50
body composition in adolescents, because this age group shows more heterogeneity in body
composition than adults. As a result, larger samples are necessary to detect differences in
body composition between levels of physical activity [114]. In the present thesis, study
samples ranged from 431 in Paper III to 945 in Paper I, which means that there may not have
been statistical power to detect small differences between subgroups that could have been
meaningful on a population level, despite being too small for any clinical relevance to the
individual.
The precision of measurements of body composition and physical activity must also be
considered, and in light of the statistical methods applied. When the more precise measure
(body composition) is used as the outcome and the less precise measure (physical activity) is
used as the exposure, the magnitude of effect is attenuated because of measurement error in
the exposure. In contrast, the precise measure (body composition) predicts physical activity
(outcome) [155]. Reverse causation (whether higher adiposity predicts changes in physical
activity) was not investigated in the present thesis, but could arguably have shed some more
light on the relationship between these two.
5.3.1 Validity of covariates
The advantages of multiple regression analyses include the possibility of adjusting for
potential confounders, meaning that the effect of an exposure on an outcome can be assessed
while holding the effect of the confounders equal. After exploring the literature and
investigating which options were available in our dataset, we included in the analyses a set of
variables known to affect the association between physical activity and body composition.
The use of some of these variables, and also some not included, deserve a further discussion.
51
Screentime
Screentime is a widely used proxy for sedentary behavior, but not necessarily the best proxy
of sedentary time (the very active participants also have a high amount of screentime).
However, screentime is also associated with increased consumption of energy-dense foods
and snacking [178, 179], which is a confounder in the association between sedentary time and
adiposity. The amount of screentime was also the only viable option for sedentary time
among the questions included in the surveys. The latter years has seen an increased focus on
sitting time, rather than screentime per se. This is perhaps a consequence of screentime as a
behavior in adolescents having changed with the increased use of mobile phones [180]. When
the first Fit Futures study was conducted, mobile phones were not used to this end in the same
degree as today, and therefore not included in the question as an example of a screentime
device. Thus, screentime as understood in the questionnaire is likely a better indicator of
sedentary behavior than screentime as understood today, since mobile phones are presently
used for multimedia purposes to a greater extent than before.
Screentime was included as a confounder in all three papers, but was handled differently in
Paper I than in Papers II & III. In Paper I, screentime was included in the models in its
original format, but in Papers II and III this variable was coded to more correctly reflect the
number of hours they represented. Furthermore, some of the response categories were
merged, creating a variable with 5 rather than 7 possible alternatives.
Breakfast consumption
Breakfast consumption is a frequently used indicator of healthy meal patterns, but it has been
proposed that the association between frequency of breakfast consumption and obesity is a
spurious one [181]. Diet is in any case an important confounder in the relationship between
52
physical activity and body composition, but the Fit Futures Study did not include a validated
food frequency questionnaire or similar. Other options were available, such as frequency of
consumption of chocolate/sweets, sugar sweetened beverages, consumption of dinner etc., but
frequency of breakfast consumption was nevertheless chosen as this is a prevalent indicator of
dietary habits which is associated with obesity in children and adolescents [144].
Socioeconomic status
A limitation in the papers is the apparent lack of adjustment for SES. The most prevalent
indicator of SES in adolescents is parental level of education or parental occupation. Because
there were a considerable number of participants reporting “don’t know” on these questions,
these data could not be included without significantly reducing the number of participants
eligible for analyses. Reassuringly though, studies have shown that study specialization is
correlated with parental education, and inclusion of this variable in the model therefore likely
adjusts for some of the variance in SES [182, 183]. Because the categories “general subjects”
and “sports” were merged in Paper I, we have explored whether keeping them as individual
categories in the models would have an impact on the results. For boys, the overall
significance and associations remained, whereas for girls, the association between physical
activity and waist circumference (p = 0.052) and with FMI (p = 0.072) no longer remained
significant.
Baseline values of outcome
In Papers II and III we adjusted for baseline values of the outcome in all prospective analyses.
Some have suggested that adjustment for baseline measure of the outcome is problematic, but
according to a recent systematic review it is recommended in this particular case, as baseline
measure of the outcome is the strongest confounder in prospective analyses [184]. This is

53
because physical activity may have different effects on future body composition depending on
current body composition [41]. As far as we have observed in the literature, both options are
prevalent, but to our mind it seemed natural to adjust for the starting point. Considering floor-
and ceiling effects, those with for instance a low initial lean- or fat mass, have more potential
for increases over the course of follow-up, which would otherwise be lost information had
this not been adjusted for.
Puberty
In adolescents, pubertal development can influence both level of physical activity and
measures of body composition [22, 62, 115, 150, 185]. Pubertal development also has a
potential influence on participation in organized sports. In Norway, and many other countries,
participation in sports is organized according to birth cohorts, meaning that boys and girls
practice and compete with children and adolescents born the same year. In sports, this can
naturally favor those who experience early maturation, as they develop muscular tissue and
physique earlier than their slower maturing peers. This can lead to situations where the more
physically developed subconsciously is favored or experience success, and as such
maturational status can potentially have a direct impact on the level of physical activity in an
individual [115]. In the analyses of the relationship between physical activity and body
composition, it would therefore seem appropriate to adjust for the influence of pubertal
development.
In complete case analyses, adjusting for PDS made no change to the overall conclusions or
level of significance in either of the three included papers. This could be a result of the PDS
score not differentiating much in a population with a mean age of 16, and where 82% of boys
in Paper I with valid data had reached the PDS stage “underway” or “complete”. Multiple
imputation of maturation was considered, but this was judged to be somewhat problematic
54
because MI uses the information available in complete cases to predict the missing value
based on the observed data [186]. The problem in this situation was that puberty is not
something fixed, but a physiological factor in constant development until completion. This
means that participants attending the examination in for instance March 2011 would have
matured physiologically more than participants had in September 2010. In MI the results from
examinations later on would be used to estimate the PDS score at an earlier time point – when
PDS levels perhaps were lower. Another reason is that the gold standard for measuring
maturation in boys it not PDS, but the Tanner Stages [116], and this was not performed in the
Fit Futures. Other studies using data from Fit Futures have performed MI, and considered that
the assumptions for imputation of the included variables were met [187, 188]. We
acknowledge that we might be wrong in our judgement, and that MI could have been an
appropriate method of handling missing data on pubertal maturation in this case. However, as
the results did not change with adjustment for maturation in neither boys nor girls in complete
case analyses in all three papers, we consider our results valid despite lack of adjustment for
this important confounder, and higher sample size was therefore prioritized.
5.4 Sensitivity analyses and generalizability of results
The validity of the results of any study depends, among other things, on how representative
the sample is of its source population. The Fit Futures Cohort Studies invited all students
attending first- and last year, respectively, of upper secondary high school in two
municipalities in Northern Norway, and participation was high. As more than 90% of 16-18
year olds in Norway attended upper secondary high school in 2010 [189], this means that
those attending the Fit Futures surveys could be expected to be quite representative of its
source population: youth residing in Tromsø and Balsfjord. However, due to strategic
decisions and inclusion criteria, not all participants were included in the analyses in the
55
different papers of the present thesis. This can lead to selection bias and affect the
generalizability of results, and must be explored. The sensitivity analyses conducted for
Papers II and III include only those under the age of 18 years at the time of FF1.
Paper I
Of the 1,038 participants in FF1, there were 77 participants aged 18 years or older. These
were excluded from all analyses, as this group would be aged higher than the age period
which is considered to constitute adolescence. In both boys and girls, the group of excluded
participants had significantly higher mean values of all included measures of body
composition than those under the age of 18. This is as expected, given the natural increases in
these measures in the immediate years following adolescence. Furthermore, among the
excluded participants, 95% of boys and 100% of girls attended vocational programs.
Paper II
Of the 961 individuals which attended FF1 and were under the age of 18 at that time, we
included 292 boys and 354 girls with valid baseline data on physical activity, body
composition and adjustment variables and follow-up data on body composition. This sample
differed slightly from those without data on body composition at follow-up, with for instance
more boys than girls lost to follow-up (200 boys vs. 115 girls). There were no significant
differences in measures of baseline body composition between these two groups among boys,
whereas girls lost to follow-up had slightly higher BMI (23.0 vs. 22.2, p = 0.03), waist
circumference (79.4 vs. 76.6, p < 0.01) and FMI (8.2 vs. 7.3, p < 0.01). The amount of
physical activity differed significantly, with both boys and girls lost to follow-up being less
active. Regarding study specialization, more of those choosing vocational subjects were lost
to follow-up than those choosing sports- or general subjects for both sexes.
56
Paper III
In Paper III we included 171 boys and 260 girls with valid data on objectively measured
physical activity, baseline- and follow-up data on body composition and complete data on
variables used in the regression analyses. Significantly more boys than girls were lost to
follow-up (321 vs. 209, p < 0.001). With the exception of baseline FMI (4.9 vs. 4.2, p = 0.02
(boys) and 7.8 vs. 7.3, p = 0.05 (girls)), there were no significant differences in baseline body
composition between those included and those lost to follow-up for either sex. In girls, but not
boys, those lost to follow-up had slightly less light- (222.1 vs. 236.2, p = 0.02) and moderate-
to-vigorous physical activity (37.4 vs. 43.1, p = 0.03). For both sexes, among those lost to
follow-up, there were more students choosing vocational subjects and fewer students
choosing general subjects, whereas the proportion choosing sports were similar.
It has been proposed that wear time criteria for accelerometers might exclude more
overweight/obese participants, if this group has larger amounts of very sedentary time, which
then becomes wrongly classified as non-wear time [170]. In Paper III, there were 643
participants with valid follow-up data on body composition and adjustment variables, out of
which 212 were lacking valid data on objectively measured physical activity at baseline. This
group of participants did not differ significantly in any measure of baseline body composition,
except FMI in boys which was significantly higher in those without a measurement of
physical activity (5.0 vs. 4.2, p = 0.02).
In summary, the sample invited to attend the Fit Futures surveys could be expected to be quite
representative of its source population. However, the sample actually included in the analyses,
particularly in Paper II and Paper III, differed slightly from those lost to follow-up or those
with missing data. The included sample was slightly more physically active at baseline, and

57
had lower levels of adiposity according to some measures. More students attending vocational
programs were lost to follow-up than those attending general- or sports programs, with the
former also associated with having parents with lower level of education. If participants lost
to follow-up were less physically active at baseline, they may in theory also have increased
more in measures of adiposity during the study period, potentially confirming our hypothesis
if they could be included. This remains speculation, but we must acknowledge that the
reported associations may have differed slightly if data were available from those lost to
follow-up or excluded from the analyses, and that the generalizability of results perhaps does
not extend to all subgroups.
Considering generalizability of results to adolescents in Norway or the rest of Europe, some
environmental factors should be mentioned. While the sample included in Fit Futures 1 were
comparable to other Norwegian data in terms of weight status [24, 190, 191], they resided in
the north of Norway. Arguably, adolescents living in this part of Norway are exposed to other
environmental factors than adolescents growing up in larger cities and further south. These
factors include longer winters, more snow, polar nights during two winter months and
midnight sun during two summer months. This may affect the types- and volume of physical
activity performed, which may have an impact on the associations reported. However,
according to national data on 15-year olds physical activity there were no differences in
counts per minute between the regions in Norway [192]. According to national data from
2019, the number of 15-year olds meeting guidelines on MVPA was considerably higher
(40% of girls and 51% of boys) than we observed in the present thesis [24]. Whether this
difference represents actual difference in level of physical activity, or is a result of the minor
difference in age or handling of accelerometer variables is unknown.

58
6.0 Discussion of main findings
The three papers included in this doctoral thesis have sought to investigate the associations
between physical activity and body composition. To this end we have determined: i) that there
is an association between self-reported physical activity during leisure and tissue-specific
measures of body composition on a cross sectional level; ii) that self-reported physical
activity was not associated with changes in body composition (except waist circumference in
boys) over two years of follow up, but that changes in level of activity was associated with
changes in lean mass in girls and fat mass in boys, and iii) objectively measured physical
activity was not associated with changes in body composition in boys, but time spent in
sedentary- and light activity was associated with changes in indices of lean mass in girls.
These results add to the body of knowledge within the field, and using outcome measures that
are more robust than those commonly reported.
6.1 The cross-sectional association between physical activity and body composition.
In Paper I we observed significant associations between self-reported level of physical
activity and fat mass index and lean mass index in both boys and girls, and a significant
association with waist circumference in girls. With higher levels of physical activity, lower
levels of fat mass index and higher levels of lean mass index was observed, which potentially
explains why there was no association with BMI as this measure does not separate fat- from
lean mass. Lack of an association between self-reported physical activity and BMI has been
observed previously [193], whereas associations with weight status (categories of BMI)
appears to be more common [194, 195].
The results in Paper I complement each other, and shows how physical activity is inversely
associated with different types of bodily tissue. Similar inverse associations between physical
activity and lean body mass and fat mass have been reported in Swedish adolescents [196,
59
197]. The prevalence of abdominal overweight and obesity (as measured by waist
circumference, using Norwegian adolescent reference standards [143]) was substantially
higher than the prevalence of overweight and obesity as measured using the BMI cut-offs
proposed by IOTF [46, 47]. In a longitudinal study of British youth, the increase in waist
circumference surpassed that of BMI, with the authors concluding that the prevalence of
obesity as determined by BMI systematically underestimated the actual presence of obesity
[198]. In a study of Norwegian 11-year olds, a similar discrepancy between overweight and
obesity as determined by cut-offs for waist circumference or BMI was noted [199]. This study
was performed before the Norwegian age-specific cut-offs for waist circumference had been
published [143], and therefore used available cut-offs developed in Dutch children [200].
In girls, but not boys, physical activity was associated with waist circumference in Paper I,
with more hours of physical activity associated with a lower waist circumference. Because
girls mature earlier and accrue more fat mass during adolescence than boys, this cross-
sectional association is potentially explained by waist circumference in girls having advanced
more towards adult values than in boys. It is plausible that the physiological effects of
physical activity on muscular- and adipose tissue are present in a cross-sectional study, but
whether such associations are present over time is less certain given the natural changes in
body composition in this age-group.
In recent years, the use of objective measures of physical activity has surpassed that of self-
reported measures in epidemiological studies. Systematic reviews of the association between
physical activity and weight status show conflicting results, but include studies using different
measures of physical activity and different indices of body composition [201, 202].
Furthermore, in the included studies, the measure of adiposity has for the most part been BMI
60
or categories of BMI, which is slightly problematic as physical activity has opposite effects
on the different tissues of the human body.
In summary, the results of Paper I demonstrate that physical activity is associated with tissue-
specific measures of body composition in Norwegian adolescents, and is an argument for why
more specific measures than BMI are needed to study the association between physical
activity and adiposity. The inability to ascertain a causal relationship between physical
activity and body composition, and the limitations of self-reported physical activity, warrants
Paper II and Paper III.
6.2 The association between physical activity and changes in body composition
In Paper II, we drew upon the results in Paper I by assessing whether self-reported physical
activity in Fit Futures 1 predicted changes in measures of body composition between Fit
Futures 1 and Fit Futures 2. Our hypothesis was that higher level of physical activity at
baseline would protect against increases in unhealthy measures of body composition.
However, the results from this part of Paper II did not support this hypothesis and suggest that
changes in body composition was mainly independent of the level of self-reported physical
activity at baseline. The exception was a significant adjusted linear trend in waist
circumference in boys and an increase in waist circumference and fat mass index in the most
active girls (≥7 hours per week of leisure time physical activity), which was significantly
higher than in the girls who were inactive at baseline. Similar results have been observed
previously [165]. This apparently paradoxical association could possibly be explained by a
reduction in physical activity between baseline and follow-up in the most active girls, but this
was not the case.
Change in level of physical activity from baseline to follow-up was a significant predictor of
changes in fat mass index in boys and lean mass index in girls. In a study of slightly younger
61
adolescents in Brazil, change in self-reported physical activity between ages 11- and 13
predicted changes in fat mass index, but not lean mass index [203]. As these participants were
younger, and the study was performed in a different cultural- and socioeconomic setting, one
would anticipate slightly different findings than those of Paper II. In our study we observed
that the consistently inactive did not differ significantly in terms of changes to body
composition from those consistently active (except waist circumference and FMI in boys). In
general, for these two groups, physical activity has less potential to affect changes to body
composition because the habit remains unchanged. This can be considered as floor- and
ceiling effects of physical activity, and means that the greatest potential for activity-related
changes in adiposity occurs in groups who make changes to this habit. In boys, those who
increased their level of physical activity between surveys experienced a reduction in FMI and
had the highest increase in LMI (although not significantly different from the reference),
indicating that positive changes in physical activity is potentially favorable for body
composition. Lack of an apparent association with BMI is likely explained by the inability of
this measure to separate lean- from fat mass. The consistent, but not statistically significant,
pattern of the largest increases in BMI, waist circumference (not in boys) and FMI occurring
in those quitting activity would suggest negative effects of reducing activity during this period
of life. Whether such changes result in significant differences over time must be investigated
in follow-up studies of the same cohort, but is nevertheless of concern given both the secular-
and longitudinal reduction in physical activity in adolescents [204]. In the epidemiology of
physical activity and body composition, the possible bidirectional associations must be
considered in the interpretation of results, as these apply both to cross-sectional and
longitudinal study designs. It is not certain that excess adiposity succeeds inactivity, as the
opposite is also plausible with overweight individuals avoiding activity for instance on
account of feeling inferior relative to their active peers [78, 156]. In this regard, change in
62
physical activity may be a more valuable predictor of changes in body composition, given the
lack of consistency in physical activity habits during adolescence. However, a systematic
review noted little evidence for a relationship between changes in objectively measured
sedentary behavior and changes in adiposity [40]. It would nevertheless be of interest to
investigate which factors are associated with remaining physically active, increasing level of
physical activity and quitting physical activity during adolescence. This was not an aim in
Paper II, but previous research has identified sports participation, parental level of education,
parental level of physical activity [205], having physically active friends and support from
friends [206] as significant factors in remaining- or becoming physically active. These issues
deserves further exploration, and may explain why some adolescents remain active while
others do not.
In Paper III we investigated the association between objectively measured physical activity
and changes in body composition, this time expanding the outcomes by including change in
appendicular lean mass index. In general, we did not observe substantial evidence for a
prospective association with changes in either outcome between baseline- and follow-up. The
exception was time spent in sedentary- and light activity, which predicted small but
significant changes in lean mass index and appendicular lean mass index in girls. Time spent
in MVPA was not associated with changes in body composition, a finding which in part is
confirmed in a recent systematic review [184], but where MVPA was found significantly
associated with clustering of cardio metabolic risk factors. In a prospective study of British 12
year-olds, time spent in MVPA significantly predicted fat mass at age 14, but this study did
not adjust for baseline fat mass [207]. There are good reasons for why time spent in MVPA
could be expected to affect changes in adiposity in adolescents, and while systematic reviews
generally conclude that physical activity does not predict adiposity, the evidence is mixed [79,
63
113, 155]. In the analyses of sedentary- and light activity, adjustment for time spent in MVPA
did not substantially attenuate the associations with outcomes, but research has shown that
being highly sedentary does not exclude a high volume of MVPA [55]. It has previously been
suggested that the vigorous part of MVPA could be diluted because of epoch settings [167],
wherein short bursts of vigorous activity are averaged over the selected epoch periods
together with otherwise moderate, light or even sedentary intensities. This was most likely not
the case in the present study, as the data was collected in 10-second epochs – meaning that
time spent in different intensities stem from the average intensities of 10-second periods
during wear time. Furthermore, epoch settings is perhaps an even more important
consideration in accelerometer studies of children, where activity is more sporadic and in
bursts rather than dedicated time for exercise.
The results in Paper III are supported, and may be explained, by findings in Paper II.
However, in Paper II the exposure was hours per week of physical activity outside of school,
whereas in Paper III the exposure was the mean time spent in different intensities of physical
activity during the day as a whole. Thus, the two exposures measured slightly different
aspects of physical activity, and are therefore not directly comparable. The self-reported level
of physical activity used in the present thesis and the measures of objectively measured
physical activity were nevertheless highly correlated. These particular results are included in a
manuscript scheduled for submission to a journal in early 2021, and indicate that the
hierarchy of the self-reported hours of physical activity during leisure time is reflected in the
time spent in different objectively measured intensities in this particular cohort.
The results of both Paper II and Paper III conform to the findings of systematic reviews which
found physical activity is not an important predictor of change in adiposity in adolescents [79,
113, 155]. One prospective study ascribed this to body composition showing more tracking
64
than physical activity [208], which again implies that changes in habits play a role in this
relationship. The findings in the present thesis suggests that a baseline measurement of
physical activity in adolescents is perhaps less predictive of changes in body composition than
changes in behavior itself. However, physical activity undoubtedly has physiological effects
on body composition. The results must therefore be interpreted in light of two important traits
of adolescence: i) the natural changes in body composition, and ii) the prevalent reduction in
physical activity and changes to this habit that occur during this period.
6.3 Discussion of the association between physical activity and adiposity
6.3.1 Energy balance and the obesogenic environment
In considering the development of overweight and obesity, an understanding of the human
physiology is necessary. Through natural selection and evolutionary processes, humans are
highly adapted to conserving energy [34]. This is not specific to humans, as several other
species rely on an ability to fill up energy stores when food is abundant and to conserve
energy for times when the availability of food is limited. Furthermore, the human body is well
adapted for energy-efficient locomotion, thus giving us a potential to walk long distances
while expending relatively little energy [209]. The consequence, from a mathematical point of
view, is that a relatively low mass of energy-dense food may take a long duration of relatively
high-intensity activity to reach an equilibrium. In light of this, studies have shown that weight
maintenance might be easier at high- than low energy flux [210-212]. In terms of efficiency,
caloric restriction produces more weight loss in shorter time than increased calorie
expenditure, but commonly advocates larger reductions in caloric intake than the usual goals
for caloric expenditure in physical activity interventions [213]. While a diet-induced 500
calorie deficit is quite feasible, a substantial amount of physical activity is required to achieve
the same deficit [214] and this has proven difficult to adhere to [215, 216]. However, the
65
weight lost from calorie restriction is difficult to maintain [217]. A potential explanation
might be that a strategy of caloric restriction for weight loss requires refraining from foods
that are very appealing to most of us, and for long periods. Furthermore, the human body
reacts rationally to calorie restriction. The dominant source of energy expenditure in humans
is the basal metabolic rate, which is largely a product of the amount of lean mass in an
individual [218]. By increasing energy expenditure through physical activity, there is
potential for sustained weight loss because of the energy expenditure associated with
increased physical activity, but also because of any increased lean mass and thus increased
basal metabolic rate [210]. The human physiology exerts substantial pressure to regain weight
lost [219], but the effects of these incentives to increase weight might be deterred by a
simultaneous increase in energy expenditure. This allows for the individual to increase energy
consumption after a diet has ended, while achieving energy balance at higher energy flux
[217]– at which it is easier to maintain weight than at lower energy flux [210].
However, upholding changes to lifestyle is difficult over the long-term. In two school-based
intervention studies [220, 221], the positive effects of physical activity on BMI had
diminished at long term follow-up. This exemplifies the difficulties of maintaining habits
once an intervention has ended, and illustrates why considerable resources must be devoted to
follow-up should an intervention prove efficient.
The observed decline in level of physical activity from childhood/adolescence to adulthood
are in some ways accepted and expected, given the different guidelines for level of physical
activity between the two age groups. As such, the age of 18 years is a crude point at which
recommended level of physical activity changes substantially, and it would be arbitrary to
expect a sudden drop in physical activity corresponding to guidelines at this given age. As a
result of the substantial changes that occur in both habits and body composition during

66
adolescence, the association between physical activity and unhealthy weight gain is perhaps
less apparent than in adults, and excessive energy intake may instead be the main driver of
overweight and obesity in youth [184]. Natural, hormonally driven physiological changes
may produce a situation where the amount of physical activity becomes relatively less
significant on changes in body composition. This is not to say that physical activity is not
important, but that it takes time (beyond adolescence) for a persistent low level of physical
activity to manifest in fat mass accrual beyond that which is naturally expected. This is in
contrast to for instance middle-aged adults, where the negative effects of sedentary behavior
can have accumulated over decades [222]. Furthermore, physical activity is undertaken for a
multitude of purposes; for transport, recreation, exercise, occupation and during activities of
daily living. In the obesogenic environment there is less need to be physically active for many
of these purposes, and the responsibility for low levels of physical activity in the population
therefore lies not with individuals alone, but also on the societal structures that promote
sedentariness. Evidence suggests that use of domestic labor saving devices has increased over
the past decades [103]. In the same period there has been reductions in the amount of active
transportation [223, 224] and occupational physical activity [69, 225]. While these transitions
are the result of individual choices, the environment in which choices are made have changed
and present individuals with a wide range of tempting energy saving options.
6.3.2 Displacement of physical activity
In most adults, the energy expelled through physical activity amounts to 15-30% of total
energy expenditure [51], but physical activity can be divided into Non-Exercise Activity
Thermogenesis (NEAT) and Exercise Activity Thermogenesis (EAT). In any study of
physical activity and health outcomes, one should consider not only the isolated effect of
exercise itself (EAT), but also what the exercise displaces. In a fixed time frame of 24 hours,
67
of which approximately 8 hours is bound to sleep, any individual has 16 hours at disposal in
their daily lives. The positive health effects of increasing time for exercise, may be limited by
a simultaneous reduction in other activities than sedentary time [226]. However, a systematic
review provided little evidence for displacement between sedentary behavior and physical
activity [55]. In adolescents, a high level of sedentary time can occur also among those with a
high level of MVPA [227]. This is not surprising, since adolescents are seated for the better
part of school hours and sedentary activities are prevalent during leisure time. Indeed, in those
meeting the MVPA guidelines in FF1, 67% had 2 or more hours per day of screentime outside
of school. One might hypothesize that, in active adolescents, the amount of higher intensity
activity does not displace sedentary time, but light activity such as passive- rather than active
transportation to the gym or to practice. Similarly, in intervention studies, lack of an effect
may be attributed to the intervention displacing activity of equal intensity [228]. In any case,
as time is finite and restricted to 24 hours per day, it is obvious that different activities
compete with each other. Preference for one activity over another naturally displaces the latter
if they compete for the same time, but not if they are mutually exclusive. For instance, sleep
is less likely to be displaced by exercise than by time spent playing computer games or other
sedentary behavior [229], and the difference in energy expenditure between sleep and
sedentary activities is negligible compared to that of sleep and vigorous exercise. Despite the
logical mathematical association between adiposity and energy expenditure, in real world
settings the relationship is not straightforward, and the association is perhaps more correct in
theory than in practice.
6.3.3 Population versus high-risk strategy
For a continuous variable associated with mortality, such as BMI, the prevalence of people at
risk of for instance cardiovascular disease will differ substantially according to where the cut-
68
point for risk is set. Furthermore, according to Geoffrey Rose, the tails of the distribution of a
variable, be it blood pressure, BMI, cholesterol etc., could be predicted by the mean of the
same variable [4]. This implies that in a population with a mean BMI of 24, more people will
be at risk for disease (as defined by a BMI > 25), than in a population with a mean BMI of 22.
Rose argues that focusing on lowering the mean will be more effective than the strategy of
focusing on the high-risk groups, i.e. the tails of the distribution.
Conversely, considering physical activity, a strategy of increasing the general level of
physical activity in the population in order to prevent obesity may prove more efficient than
getting the already obese to exercise. The latter point is particularly relevant, considering that
no countries so far have experienced significant public health achievements concerning
obesity prevention on a population level [230]. This is in contrast to for instance smoking
cessation or infectious diseases, where many countries have delivered results in the latter
decades [230]. One exception stems from Cuba, which experienced societal changes in the
aftermath of the dissolution of the Soviet Union and the trade embargoes from the United
States in the early 1990’s. The consequences of less availability of fuel for transportation and
lower food availability included an increase in the proportion of physically active adults (from
30% to 67%) and a 1,036 kcal reduction in per capita energy intake per day [231]. Faced with
lack of mechanized transportation options, the Cuban government imported over one million
bicycles. The mean BMI declined by 1.5 units, and the prevalence of obesity halved [231].
This so called “special period” in Cuba affected the entire population, and so was not a “high-
risk” strategy targeting the obese alone. Therefore, the Cuban case is one of few examples of
a population strategy, although unintended, for overweight and obesity, and thus confirms the
theories of Geoffrey Rose [232]. Accordingly, implementation of population strategies to
overweight and obesity may have considerable potential.
69
6.4 Perspectives on future research
The discussion of how physical activity may affect body composition in adolescence calls for
further research, particularly using longitudinal data. Researchers interested in examining
these associations should seek to employ validated and robust data on pubertal status and
dietary habits, as these are two major confounders in the development of excess adiposity
during adolescence. Furthermore, given that physical activity is a habit in constant decline
throughout both childhood and adolescence, future cohort studies would benefit from
including data on: past levels of physical activity; the motivational aspects of engaging in
physical activity; barriers and promotors of physical activity, and; the different arenas in
which physical activity is conducted. Because people engage in physical activity for various
reasons, such aspects would be of high value in designing interventions and prevention
strategies for a successful halt to the obesity epidemic. Understanding these complex patterns,
and why some remain physically active while others do not, require data and research using
both quantitative and qualitative methods. As a consequence of the variability of physical
activity during adolescence, future research should seek to gather data on both exposure
(physical activity) and outcome (body composition) at several time points during the study
period.
Because excess adiposity is the result of prolonged calorie surplus [2] a lag-effect may be
present, in which low levels of physical activity need time to manifest in excess adiposity.
This may be particularly true for adolescent populations, where sex-hormones drive changes
in both fat- and lean mass. This could potentially deter increases in fat mass which would
otherwise be associated with caloric surplus, simply as an effect of increased resting
metabolic rate because of natural increases in lean mass. The consequence is that low levels
of physical activity perhaps does not lead to development of excess adiposity during a limited

70
time frame of two years. Currently there are plans for a third Fit Futures survey, starting in
late 2020 or early 2021. Data from this survey will enable researchers to assess how low
levels of physical activity during upper secondary high school is associated with increases in
body composition up to young adulthood. This is a research area of great potential, because
the transition from adolescence to adulthood is also associated with substantial changes in
lifestyle [158]. To what extent lifestyle habits persist into adulthood are important areas of
research to assess the long-term efficacy of interventions and behavioral policies during
adolescence.
7.0 Conclusions
This thesis has demonstrated that the included measures of physical activity is consistently
unrelated to body mass index. At the cross-sectional level, both fat- and lean mass indexes
were linearly associated with self-reported physical activity for both sexes: fat mass index
was reduced and lean mass index increased with higher levels of physical activity.
These associations did generally not remain in longitudinal analyses, with a lack of clear
linear associations between self-reported physical activity at baseline and changes in body
composition. Changes in self-reported physical activity between the two surveys did however
predict changes in fat mass index in boys and lean mass index in girls. The latter finding may
partly explain why a baseline measurement of physical activity was not associated with
changes in body composition.
In girls, objectively measured sedentary- and light physical activity was associated with
changes in indices of lean mass: higher amount of sedentary time predicted lower increases in
71
indices of lean mass, and conversely did more time in light activity predict higher increases.
No significant associations were observed in boys.
In conclusion, there is only minor evidence for a prospective association between physical
activity and changes in body composition over two years of follow-up in Norwegian
adolescents, whereas changes in physical activity during follow-up appears to be associated
with changes in some of the indices of body composition.
8.0 Implications for public health
This thesis has shown that the level of physical activity in Norwegian adolescents is lower
than desired, but perhaps not lower than expected. In the field of public health the merit of a
preventive measure is judged by its efficacy and its cost-efficiency, but a key assumption for
its effective application is that the population for which the measure is intended complies. For
physical activity, the problem lies perhaps not in costs or effectiveness, but in compliance
among groups at risk of disease. Given the breadth of morbidity for which physical activity is
a remedy or a preventive measure, these groups include much of the population. However,
whether physical activity is part of the solution for reducing excess adiposity is not a
prerequisite for action. Because inactivity takes time to manifest itself in excess adiposity, the
link between reduced activity and weight gain may not be that apparent to adolescents. The
positive effect of physical activity on future health may not be a sufficient argument for this
age group [233], as adolescents likely emphasize or perceive the health effects of physical
activity differently from adults [14, 234]. Individuals who put less emphasis on potential
health benefits in the distant future may be less inclined to be physically active for health
purposes, or to avoid consumption of sweets because the immediate gratification outweighs

72
the possible future health rewards associated with restraint [235]. For adolescents the period
of life where the negative health effects of a sedentary lifestyle occur are less proximal than in
adults. This is a challenge when promoting physical activity to adolescents, and means that
health officials may have more success with other arguments than those of increased life
expectancy or better health in the distant future. The health benefits of physical activity may
therefore be a better selling point to those individuals where lifelong effects of inactivity has
manifested itself in health problems or adiposity. From a public health perspective, physical
activity should be encouraged at all ages, but for the individual the reasons- and possibilities
for engaging in physical activity are subject to variation, and may partly explain why an
association with changes in body composition is less apparent in adolescents.

73
References
1. World Health Organization. Obesity and Overweight Fact Sheet. 2020 [cited 2020 1
June]. Available from: https://www.who.int/news-room/fact-sheets/detail/obesity-
and-overweight
2. Gortmaker SL, Swinburn BA, Levy D, Carter R, Mabry PL, Finegood DT et al.
Changing the future of obesity: science, policy, and action. Lancet.
2011;378(9793):838-47. doi:10.1016/s0140-6736(11)60815-5.
3. Semlitsch T, Stigler FL, Jeitler K, Horvath K, Siebenhofer A. Management of
overweight and obesity in primary care-A systematic overview of international
evidence-based guidelines. Obes Rev. 2019;20(9):1218-30. doi:10.1111/obr.12889.
4. Rose G. Rose's Strategy of Preventive Medicine. USA: Oxford University Press;
1992.
5. Kumanyika SK, Obarzanek E, Stettler N, Bell R, Field AE, Fortmann SP et al.
Population-based prevention of obesity: the need for comprehensive promotion of
healthful eating, physical activity, and energy balance: a scientific statement from
American Heart Association Council on Epidemiology and Prevention,
Interdisciplinary Committee for Prevention (formerly the expert panel on population
and prevention science). Circulation. 2008;118(4):428-64.
doi:10.1161/circulationaha.108.189702.
6. Ng M, Fleming T, Robinson M, Thomson B, Graetz N, Margono C et al. Global,
regional, and national prevalence of overweight and obesity in children and adults
during 1980-2013: a systematic analysis for the Global Burden of Disease Study
2013. Lancet. 2014;384(9945):766-81. doi:10.1016/S0140-6736(14)60460-8.
7. NCD Risck Factor Collaboration (NCD-RisC). Worldwide trends in body-mass
index, underweight, overweight, and obesity from 1975 to 2016: a pooled analysis
of 2416 population-based measurement studies in 128.9 million children,
adolescents, and adults. Lancet. 2017. doi:10.1016/S0140-6736(17)32129-3.
8. Singh AS, Mulder C, Twisk JW, van Mechelen W, Chinapaw MJ. Tracking of
childhood overweight into adulthood: a systematic review of the literature. Obes
Rev. 2008;9(5):474-88. doi:10.1111/j.1467-789X.2008.00475.x.
74
9. Vanhelst J, Baudelet JB, Fardy PS, Beghin L, Mikulovic J, Ulmer Z. Prevalence of
overweight, obesity, underweight and normal weight in French youth from 2009 to
2013. Public Health Nutr. 2017;20(6):959-64. doi:10.1017/S1368980016003244.
10. Bibiloni Mdel M, Pons A, Tur JA. Prevalence of overweight and obesity in
adolescents: a systematic review. ISRN Obes. 2013;2013:392747.
doi:10.1155/2013/392747.
11. Garrido-Miguel M, Cavero-Redondo I, Alvarez-Bueno C, Rodriguez-Artalejo F,
Moreno LA, Ruiz JR et al. Prevalence and Trends of Overweight and Obesity in
European Children From 1999 to 2016: A Systematic Review and Meta-analysis.
JAMA Pediatr. 2019:e192430. doi:10.1001/jamapediatrics.2019.2430.
12. Reilly JJ, Kelly J, Wilson DC. Accuracy of simple clinical and epidemiological
definitions of childhood obesity: systematic review and evidence appraisal. Obes
Rev. 2010;11(9):645-55. doi:10.1111/j.1467-789X.2009.00709.x.
13. Javed A, Jumean M, Murad MH, Okorodudu D, Kumar S, Somers VK et al.
Diagnostic performance of body mass index to identify obesity as defined by body
adiposity in children and adolescents: a systematic review and meta-analysis. Pediatr
Obes. 2015;10(3):234-44. doi:10.1111/ijpo.242.
14. Granger E, Di Nardo F, Harrison A, Patterson L, Holmes R, Verma A. A systematic
review of the relationship of physical activity and health status in adolescents. Eur J
Public Health. 2017;27(suppl_2):100-6. doi:10.1093/eurpub/ckw187.
15. Keating CL, Moodie ML, Swinburn BA. The health-related quality of life of
overweight and obese adolescents--a study measuring body mass index and
adolescent-reported perceptions. Int J Pediatr Obes. 2011;6(5-6):434-41.
doi:10.3109/17477166.2011.590197.
16. Engeland A, Bjørge T, Søgaard AJ, Tverdal A. Body mass index in adolescence in
relation to total mortality: 32-year follow-up of 227,000 Norwegian boys and girls.
Am J Epidemiol. 2003;157(6):517-23. doi:10.1093/aje/kwf219.
17. Engeland A, Bjørge T, Tverdal A, Søgaard AJ. Obesity in adolescence and
adulthood and the risk of adult mortality. Epidemiology. 2004;15(1):79-85.
doi:10.1097/01.ede.0000100148.40711.59.
18. Umer A, Kelley GA, Cottrell LE, Giacobbi P, Jr., Innes KE, Lilly CL. Childhood
obesity and adult cardiovascular disease risk factors: a systematic review with meta-
analysis. BMC Public Health. 2017;17(1):683. doi:10.1186/s12889-017-4691-z.

75
19. Twig G, Yaniv G, Levine H, Leiba A, Goldberger N, Derazne E et al. Body-Mass
Index in 2.3 Million Adolescents and Cardiovascular Death in Adulthood. N Engl J
Med. 2016;374(25):2430-40. doi:10.1056/NEJMoa1503840.
20. Richardson TG, Sanderson E, Elsworth B, Tilling K, Davey Smith G. Use of genetic
variation to separate the effects of early and later life adiposity on disease risk:
mendelian randomisation study. BMJ. 2020;369:m1203. doi:10.1136/bmj.m1203.
21. Hansen BH, Kolle E, Steene-Johannessen J, Dalene KE, Ekelund U, Anderssen SA.
Monitoring population levels of physical activity and sedentary time in Norway
across the lifespan. Scand J Med Sci Sports. 2019;29(1):105-12.
doi:10.1111/sms.13314.
22. Telama R, Yang X. Decline of physical activity from youth to young adulthood in
Finland. Med Sci Sports Exerc. 2000;32(9):1617-22.
23. Caspersen CJ, Pereira MA, Curran KM. Changes in physical activity patterns in the
United States, by sex and cross-sectional age. Med Sci Sports Exerc.
2000;32(9):1601-9.
24. Steene-Johannessen J, Andersen SA, Bratteteig M, Dalhaug EM, Andersen ID,
Andersen OK et al. Kartlegging av fysisk aktivitet, sedat tid og fysisk form blant
barn og unge 2018 (ungKan3). Oslo: Norwegian School of Sport Sciences, 2019.
25. Van Hecke L, Loyen A, Verloigne M, van der Ploeg HP, Lakerveld J, Brug J et al.
Variation in population levels of physical activity in European children and
adolescents according to cross-European studies: a systematic literature review
within DEDIPAC. Int J Behav Nutr Phys Act. 2016;13:70. doi:10.1186/s12966-016-
0396-4.
26. Dumith SC, Gigante DP, Domingues MR, Kohl 3rd HW. Physical activity change
during adolescence: a systematic review and a pooled analysis. Int J Epidemiol.
2011;40(3):685-98. doi:10.1093/ije/dyq272.
27. Collings PJ, Wijndaele K, Corder K, Westgate K, Ridgway CL, Sharp SJ et al.
Magnitude and determinants of change in objectively-measured physical activity,
sedentary time and sleep duration from ages 15 to 17.5y in UK adolescents: the
ROOTS study. Int J Behav Nutr Phys Act. 2015;12:61. doi:10.1186/s12966-015-
0222-4.
28. Guo SS, Chumlea WC, Roche AF, Siervogel RM. Age- and maturity-related
changes in body composition during adolescence into adulthood: the Fels
76
Longitudinal Study. Int J Obes Relat Metab Disord. 1997;21(12):1167-75.
doi:10.1038/sj.ijo.0800531.
29. Siervogel RM, Demerath EW, Schubert C, Remsberg KE, Chumlea WC, Sun S et
al. Puberty and body composition. Horm Res. 2003;60(Suppl 1):36-45.
doi:10.1159/000071224.
30. Baxter-Jones AD, Eisenmann JC, Mirwald RL, Faulkner RA, Bailey DA. The
influence of physical activity on lean mass accrual during adolescence: a
longitudinal analysis. J Appl Physiol (1985). 2008;105(2):734-41.
doi:10.1152/japplphysiol.00869.2007.
31. Varma VR, Dey D, Leroux A, Di J, Urbanek J, Xiao L et al. Re-evaluating the effect
of age on physical activity over the lifespan. Prev Med. 2017;101:102-8.
doi:10.1016/j.ypmed.2017.05.030.
32. Bauman AE, Reis RS, Sallis JF, Wells JC, Loos RJ, Martin BW et al. Correlates of
physical activity: why are some people physically active and others not? Lancet.
2012;380(9838):258-71. doi:10.1016/S0140-6736(12)60735-1.
33. Sand A-S, Emaus N, Lian OS. Motivation and obstacles for weight management
among young women – a qualitative study with a public health focus - the Tromsø
study: Fit Futures. BMC Public Health. 2017;17(1):417. doi:10.1186/s12889-017-
4321-9.
34. Wells JC. The evolution of human fatness and susceptibility to obesity: an
ethological approach. Biol Rev Camb Philos Soc. 2006;81(2):183-205.
doi:10.1017/S1464793105006974.
35. Hallal PC, Andersen LB, Bull FC, Guthold R, Haskell W, Ekelund U et al. Global
physical activity levels: surveillance progress, pitfalls, and prospects. Lancet.
2012;380(9838):247-57. doi:10.1016/S0140-6736(12)60646-1.
36. Hallal PC, Victora CG, Azevedo MR, Wells JC. Adolescent physical activity and
health: a systematic review. Sports Med. 2006;36(12):1019-30.
doi:10.2165/00007256-200636120-00003.
37. Telama R, Yang X, Viikari J, Välimäki I, Wanne O, Raitakari O. Physical activity
from childhood to adulthood: a 21-year tracking study. Am J Prev Med.
2005;28(3):267-73. doi:10.1016/j.amepre.2004.12.003.

77
38. Jimenéz-Pavón D, Kelly J, Reilly JJ. Associations between objectively measured
habitual physical activity and adiposity in children and adolescents: Systematic
review. Int J Pediatr Obes. 2010;5(1):3-18. doi:10.3109/17477160903067601.
39. van Sluijs EM, Sharp SJ, Ambrosini GL, Cassidy A, Griffin SJ, Ekelund U. The
independent prospective associations of activity intensity and dietary energy density
with adiposity in young adolescents. Br J Nutr. 2016;115(5):921-9.
doi:10.1017/S0007114515005097.
40. Tanaka C, Reilly JJ, Huang WY. Longitudinal changes in objectively measured
sedentary behaviour and their relationship with adiposity in children and
adolescents: systematic review and evidence appraisal. Obes Rev. 2014;15(10):791-
803. doi:10.1111/obr.12195.
41. Reichert FF, Baptista Menezes AM, Wells JC, Carvalho Dumith S, Hallal PC.
Physical activity as a predictor of adolescent body fatness: a systematic review.
Sports Med. 2009;39(4):279-94. doi:10.2165/00007256-200939040-00002.
42. Norwegian Institute of Public Health. Folkehelserapporten 2014. Oslo, Norway:
2014.
43. Nuttall FQ. Body Mass Index: Obesity, BMI, and Health: A Critical Review. Nutr
Today. 2015;50(3):117-28. doi:10.1097/NT.0000000000000092.
44. Connor Gorber S, Tremblay M, Moher D, Gorber B. A comparison of direct vs. self-
report measures for assessing height, weight and body mass index: a systematic
review. Obes Rev. 2007;8(4):307-26. doi:10.1111/j.1467-789X.2007.00347.x.
45. Obesity: preventing and managing the global epidemic. Report of a WHO
consultation. World Health Organ Tech Rep Ser. 2000;894:i-xii, 1-253.
46. Cole TJ, Bellizzi MC, Flegal KM, Dietz WH. Establishing a standard definition for
child overweight and obesity worldwide: international survey. BMJ.
2000;320(7244):1240-3.
47. Cole TJ, Flegal KM, Nicholls D, Jackson AA. Body mass index cut offs to define
thinness in children and adolescents: international survey. BMJ.
2007;335(7612):194. doi:10.1136/bmj.39238.399444.55.
48. Wells JC. Toward body composition reference data for infants, children, and
adolescents. Adv Nutr. 2014;5(3):320S-9S. doi:10.3945/an.113.005371.
49. Taylor RW, Jones IE, Williams SM, Goulding A. Evaluation of waist
circumference, waist-to-hip ratio, and the conicity index as screening tools for high

78
trunk fat mass, as measured by dual-energy X-ray absorptiometry, in children aged
3-19 y. Am J Clin Nutr. 2000;72(2):490-5. doi:10.1093/ajcn/72.2.490.
50. Lean ME, Han TS, Morrison CE. Waist circumference as a measure for indicating
need for weight management. BMJ. 1995;311(6998):158-61.
doi:10.1136/bmj.311.6998.158.
51. Kenney WL, Wilmore JH, Costill DL. Physiology of sport and exercise. Seventh
edition. Champaign, IL: Human Kinetics; 2020.
52. World Health Organization. Waist Circumference and Waist–Hip Ratio: Report of a
WHO Expert Consultation. Geneva: 2008.
53. Cornier M-A, Dabelea D, Hernandez TL, Lindstrom RC, Steig AJ, Stob NR et al.
The Metabolic Syndrome. Endocr Rev. 2008;29(7):777-822. doi:10.1210/er.2008-
0024 %J Endocrine Reviews.
54. Wohlfahrt-Veje C, Tinggaard J, Winther K, Mouritsen A, Hagen CP, Mieritz MG et
al. Body fat throughout childhood in 2647 healthy Danish children: agreement of
BMI, waist circumference, skinfolds with dual X-ray absorptiometry. Eur J Clin
Nutr. 2014;68(6):664-70. doi:10.1038/ejcn.2013.282.
55. Pearson N, Braithwaite RE, Biddle SJ, van Sluijs EM, Atkin AJ. Associations
between sedentary behaviour and physical activity in children and adolescents: a
meta-analysis. Obes Rev. 2014;15(8):666-75. doi:10.1111/obr.12188.
56. Lohman TG, Milliken LA, editors. ACSM's body composition assessment.
Champaign, IL: Human Kinetics; 2020.
57. Weber DR, Moore RH, Leonard MB, Zemel BS. Fat and lean BMI reference curves
in children and adolescents and their utility in identifying excess adiposity compared
with BMI and percentage body fat. Am J Clin Nutr. 2013;98(1):49-56.
doi:10.3945/ajcn.112.053611.
58. Goulding A, Taylor RW, Grant AM, Jones S, Taylor BJ, Williams SM.
Relationships of appendicular LMI and total body LMI to bone mass and physical
activity levels in a birth cohort of New Zealand five-year olds. Bone.
2009;45(3):455-9. doi:10.1016/j.bone.2009.05.007.
59. Rokholm B, Baker JL, Sørensen TI. The levelling off of the obesity epidemic since
the year 1999--a review of evidence and perspectives. Obes Rev. 2010;11(12):835-
46. doi:10.1111/j.1467-789X.2010.00810.x.
79
60. Chung A, Backholer K, Wong E, Palermo C, Keating C, Peeters A. Trends in child
and adolescent obesity prevalence in economically advanced countries according to
socioeconomic position: a systematic review. Obes Rev. 2016;17(3):276-95.
doi:10.1111/obr.12360.
61. Due P, Damsgaard MT, Rasmussen M, Holstein BE, Wardle J, Merlo J et al.
Socioeconomic position, macroeconomic environment and overweight among
adolescents in 35 countries. Int J Obes (Lond). 2009;33(10):1084-93.
doi:10.1038/ijo.2009.128.
62. Rogol AD, Clark PA, Roemmich JN. Growth and pubertal development in children
and adolescents: effects of diet and physical activity. Am J Clin Nutr. 2000;72(2
Suppl):521S-8S. doi:10.1093/ajcn/72.2.521S.
63. Kaplowitz PB. Link between body fat and the timing of puberty. Pediatrics.
2008;121 Suppl 3:S208-17. doi:10.1542/peds.2007-1813F.
64. Atlantis E, Barnes EH, Singh MA. Efficacy of exercise for treating overweight in
children and adolescents: a systematic review. Int J Obes (Lond). 2006;30(7):1027-
40. doi:10.1038/sj.ijo.0803286.
65. World Health O. Physical activity fact sheet. 2018. [cited 2020 27 Aug] Available
from: https://www.who.int/news-room/fact-sheets/detail/physical-activity.
66. Sallis JF, Saelens BE. Assessment of physical activity by self-report: status,
limitations, and future directions. Res Q Exerc Sport. 2000;71 Suppl 2:1-14.
doi:10.1080/02701367.2000.11082780.
67. Chinapaw MJ, Mokkink LB, van Poppel MN, van Mechelen W, Terwee CB.
Physical activity questionnaires for youth: a systematic review of measurement
properties. Sports Med. 2010;40(7):539-63. doi:10.2165/11530770-000000000-
00000.
68. Grimby G, Börjesson M, Jonsdottir IH, Schnohr P, Thelle DS, Saltin B. The
“Saltin–Grimby Physical Activity Level Scale” and its application to health
research. Scand J Med Sci Sports. 2015;25(S4):119-25. doi:10.1111/sms.12611.
69. Morseth B, Jacobsen BK, Emaus N, Wilsgaard T, Jørgensen L. Secular trends and
correlates of physical activity: The Tromsø Study 1979-2008. BMC Public Health.
2016;16(1):1215. doi:10.1186/s12889-016-3886-z.

80
70. Craig CL, Marshall AL, Sjöström M, Bauman AE, Booth ML, Ainsworth BE et al.
International physical activity questionnaire: 12-country reliability and validity. Med
Sci Sports Exerc. 2003;35(8):1381-95. doi:10.1249/01.Mss.0000078924.61453.Fb.
71. Hagströmer M, Bergman P, De Bourdeaudhuij I, Ortega FB, Ruiz JR, Manios Y et
al. Concurrent validity of a modified version of the International Physical Activity
Questionnaire (IPAQ-A) in European adolescents: The HELENA Study. Int J
Obes(Lond). 2008;32(5):S42-S8. doi:10.1038/ijo.2008.182.
72. Arvidsson D, Slinde F, Hulthèn L. Physical activity questionnaire for adolescents
validated against doubly labelled water. Eur J Clin Nutr. 2005;59(3):376-83.
doi:10.1038/sj.ejcn.1602084.
73. Adams SA, Matthews CE, Ebbeling CB, Moore CG, Cunningham JE, Fulton J et al.
The effect of social desirability and social approval on self-reports of physical
activity. Am J Epidemiol. 2005;161(4):389-98. doi:10.1093/aje/kwi054.
74. Rangul V, Holmen TL, Kurtze N, Cuypers K, Midthjell K. Reliability and validity
of two frequently used self-administered physical activity questionnaires in
adolescents. BMC Med Res Methodol. 2008;8:47. doi:10.1186/1471-2288-8-47.
75. Jones PR, Ekelund U. Physical Activity in the Prevention of Weight Gain: the
Impact of Measurement and Interpretation of Associations. Curr Obes Rep.
2019;8(2):66-76. doi:10.1007/s13679-019-00337-1.
76. World Health Organization. Global recommendations on physical activity for health.
Geneva: World Health Organization; 2010.
77. Guthold R, Stevens GA, Riley LM, Bull FC. Worldwide trends in insufficient
physical activity from 2001 to 2016: a pooled analysis of 358 population-based
surveys with 1.9 million participants. Lancet Glob Health. 2018;6(10):e1077-e86.
doi:10.1016/s2214-109x(18)30357-7.
78. Must A, Tybor DJ. Physical activity and sedentary behavior: a review of
longitudinal studies of weight and adiposity in youth. Int J Obes (Lond). 2005;29
Suppl 2:S84-96.
79. Wilks DC, Besson H, Lindroos AK, Ekelund U. Objectively measured physical
activity and obesity prevention in children, adolescents and adults: a systematic
review of prospective studies. Obes Rev. 2011;12(5):e119-29. doi:10.1111/j.1467-
789X.2010.00775.x.
81
80. Migueles JH, Cadenas-Sanchez C, Ekelund U, Nyström CD, Mora-Gonzalez J, Löf
M et al. Accelerometer Data Collection and Processing Criteria to Assess Physical
Activity and Other Outcomes: A Systematic Review and Practical Considerations.
Sports Med. 2017;47(9):1821-45. doi:10.1007/s40279-017-0716-0.
81. Freedson PS, Melanson E, Sirard J. Calibration of the Computer Science and
Applications, Inc. accelerometer. Med Sci Sports Exerc. 1998;30(5):777-81.
82. Corder K, Brage S, Ekelund U. Accelerometers and pedometers: methodology and
clinical application. Curr Opin Clin Nutr Metab Care. 2007;10(5):597-603. doi:
10.1097/MCO.0b013e328285d883.
83. Dyrstad SM, Hansen BH, Holme IM, Anderssen SA. Comparison of self-reported
versus accelerometer-measured physical activity. Med Sci Sports Exerc.
2014;46(1):99-106. doi:10.1249/MSS.0b013e3182a0595f.
84. Troiano RP, Gabriel KKP, Welk GJ, Owen N, Sternfeld B. Reported Physical
Activity and Sedentary Behavior: Why Do You Ask? J Phys Act Health.
2012;9(s1):S68. doi:10.1123/jpah.9.s1.s68.
85. Jago R, Salway R, Lawlor DA, Emm-Collison L, Heron J, Thompson JL et al.
Profiles of children's physical activity and sedentary behaviour between age 6 and 9:
a latent profile and transition analysis. Int J Behav Nutr Phys Act. 2018;15(1):103.
doi:10.1186/s12966-018-0735-8.
86. Deelen I, Ettema D, Kamphuis CBM. Time-use and environmental determinants of
dropout from organized youth football and tennis. BMC Public Health.
2018;18(1):1022. doi:10.1186/s12889-018-5919-2.
87. Persson M, Espedalen LE, Stefansen K, Strandbu Å. Opting out of youth sports:
how can we understand the social processes involved? Sport Educ Soc. 2019:1-13.
doi:10.1080/13573322.2019.1663811.
88. Jago R, Solomon-Moore E, Macdonald-Wallis C, Sebire SJ, Thompson JL, Lawlor
DA. Change in children's physical activity and sedentary time between Year 1 and
Year 4 of primary school in the B-PROACT1V cohort. Int J Behav Nutr Phys Act.
2017;14(1):33. doi:10.1186/s12966-017-0492-0.
89. Cooper AR, Goodman A, Page AS, Sherar LB, Esliger DW, van Sluijs EMF et al.
Objectively measured physical activity and sedentary time in youth: the
International children's accelerometry database (ICAD). Int J Behav Nutr Phys Act.
2015;12. doi:10.1186/s12966-015-0274-5.
82
90. Pearson N, Haycraft E, J PJ, Atkin AJ. Sedentary behaviour across the primary-
secondary school transition: A systematic review. Prev Med. 2017;94:40-7.
doi:10.1016/j.ypmed.2016.11.010.
91. Verloigne M, Loyen A, Van Hecke L, Lakerveld J, Hendriksen I, De
Bourdheaudhuij I et al. Variation in population levels of sedentary time in European
children and adolescents according to cross-European studies: a systematic literature
review within DEDIPAC. Int J Behav Nutr Phys Act. 2016;13:69.
doi:10.1186/s12966-016-0395-5.
92. Ekelund U, Luan J, Sherar LB, Esliger DW, Griew P, Cooper A et al. Moderate to
vigorous physical activity and sedentary time and cardiometabolic risk factors in
children and adolescents. JAMA. 2012;307(7):704-12. doi:10.1001/jama.2012.156.
93. Riddoch CJ, Andersen LB, Wedderkopp N, Harro M, Klasson-Heggebø L, Sardinha
LB et al. Physical activity levels and patterns of 9-and 15-yr-old European children.
Med Sci Sports Exerc. 2004;36(1):86-92.
doi:10.1249/01.Mss.0000106174.43932.92.
94. Manz K, Krug S, Schienkiewitz A, Finger JD. Determinants of organised sports
participation patterns during the transition from childhood to adolescence in
Germany: results of a nationwide cohort study. BMC Public Health. 2016;16:939.
doi:10.1186/s12889-016-3615-7.
95. Dishman RK, Dowda M, McIver KL, Saunders RP, Pate RR. Naturally-occurring
changes in social-cognitive factors modify change in physical activity during early
adolescence. PLoS One. 2017;12(2):e0172040. doi:10.1371/journal.pone.0172040.
96. Dishman RK, McIver KL, Dowda M, Saunders RP, Pate RR. Self-efficacy, beliefs,
and goals: Moderation of declining physical activity during adolescence. Health
Psychol. 2019;38(6):483-93. doi:10.1037/hea0000734.
97. Corder K, Winpenny E, Love R, Brown HE, White M, Sluijs EV. Change in
physical activity from adolescence to early adulthood: a systematic review and
meta-analysis of longitudinal cohort studies. Br J Sports Med. 2019;53(8):496-503.
doi:10.1136/bjsports-2016-097330.
98. O'Loughlin J, Gray-Donald K, Paradis G, Meshefedjian G. One- and two-year
predictors of excess weight gain among elementary schoolchildren in multiethnic,
low-income, inner-city neighborhoods. Am J Epidemiol. 2000;152(8):739-46.
83
99. Hall KD, Sacks G, Chandramohan D, Chow CC, Wang YC, Gortmaker SL et al.
Quantification of the effect of energy imbalance on bodyweight. Lancet.
2011;378(9793):826-37. doi:Doi 10.1016/S0140-6736(11)60812-X.
100. Butland B, Jebb S, Kopelman P, McPherson K, Thomas S, Mardell J et al. Tackling
obesities: future choices-project report. London: Department of Innovation,
Universities and Skills; 2007.
101. Al-Khudairy L, Loveman E, Colquitt JL, Mead E, Johnson RE, Fraser H et al. Diet,
physical activity and behavioural interventions for the treatment of overweight or
obese adolescents aged 12 to 17 years. Cochrane Database Syst Rev.
2017;6:CD012691. doi:10.1002/14651858.CD012691.
102. Loyen A, Verloigne M, Van Hecke L, Hendriksen I, Lakerveld J, Steene-
Johannessen J et al. Variation in population levels of sedentary time in European
adults according to cross-European studies: a systematic literature review within
DEDIPAC. Int J Behav Nutr Phys Act. 2016;13:71. doi:10.1186/s12966-016-0397-
3.
103. Lanningham-Foster L, Nysse LJ, Levine JA. Labor saved, calories lost: the energetic
impact of domestic labor-saving devices. Obes Res. 2003;11(10):1178-81.
doi:10.1038/oby.2003.162.
104. Lightfoot JT. Why control activity? Evolutionary selection pressures affecting the
development of physical activity genetic and biological regulation. Biomed Res Int.
2013;2013:821678. doi:10.1155/2013/821678.
105. Eaton SB, Eaton SB. An evolutionary perspective on human physical activity:
implications for health. Comp Biochem Physiol A Mol Integr Physiol.
2003;136(1):153-9.
106. Walter S, Mejía-Guevara I, Estrada K, Liu SY, Glymour MM. Association of a
Genetic Risk Score With Body Mass Index Across Different Birth Cohorts. JAMA.
2016;316(1):63-9. doi:10.1001/jama.2016.8729.
107. Brandkvist M, Bjørngaard JH, Ødegård RA, Åsvold BO, Sund ER, Vie GÅ.
Quantifying the impact of genes on body mass index during the obesity epidemic:
longitudinal findings from the HUNT Study. BMJ. 2019;366:l4067.
doi:10.1136/bmj.l4067.

84
108. Jacobsen BK, Aars NA. Changes in body mass index and the prevalence of obesity
during 1994-2008: repeated cross-sectional surveys and longitudinal analyses. The
Tromsø Study. BMJ Open. 2015;5(6):e007859. doi:10.1136/bmjopen-2015-007859.
109. Thompson D, Karpe F, Lafontan M, Frayn K. Physical activity and exercise in the
regulation of human adipose tissue physiology. Physiol Rev. 2012;92(1):157-91.
doi:10.1152/physrev.00012.2011.
110. McMurray RG, Soares J, Caspersen CJ, McCurdy T. Examining variations of
resting metabolic rate of adults: a public health perspective. Med Sci Sports Exerc.
2014;46(7):1352-8. doi:10.1249/MSS.0000000000000232.
111. Hill JO, Wyatt HR, Peters JC. Energy balance and obesity. Circulation.
2012;126(1):126-32. doi:10.1161/circulationaha.111.087213.
112. Butryn ML, Wadden TA, Rukstalis MR, Bishop-Gilyard C, Xanthopoulos MS,
Louden D et al. Maintenance of weight loss in adolescents: current status and future
directions. J Obes. 2010;2010:789280. doi:10.1155/2010/789280.
113. Wareham NJ, van Sluijs EM, Ekelund U. Physical activity and obesity prevention: a
review of the current evidence. Proc Nutr Soc. 2005;64(2):229-47.
doi:10.1079/pns2005423.
114. Atkin AJ, Biddle SJH, Broyles ST, Chinapaw M, Ekelund U, Esliger DW et al.
Harmonising data on the correlates of physical activity and sedentary behaviour in
young people: Methods and lessons learnt from the international Children’s
Accelerometry database (ICAD). Int J Behav Nutr Phy Act. 2017;14(1):174.
doi:10.1186/s12966-017-0631-7.
115. Malina RM, Bouchard C, Bar-Or O. Growth, maturation, and physical activity. 2nd
ed. Champaign, Ill. ; Leeds: Human Kinetics; 2004.
116. Dorn LD, Dahl RE, Woodward HR, Biro F. Defining the Boundaries of Early
Adolescence: A User's Guide to Assessing Pubertal Status and Pubertal Timing in
Research With Adolescents. Appl Dev Sci. 2006;10(1):30-56.
doi:10.1207/s1532480xads1001_3.
117. Edwards CH, Aas E, Kinge JM. Body mass index and lifetime healthcare utilization.
BMC Health Serv Res. 2019;19(1):696. doi:10.1186/s12913-019-4577-0.
118. Withrow D, Alter DA. The economic burden of obesity worldwide: a systematic
review of the direct costs of obesity. Obes Rev. 2011;12(2):131-41.
doi:10.1111/j.1467-789X.2009.00712.x.
85
119. Au N. The health care cost implications of overweight and obesity during childhood.
Health Serv Res. 2012;47(2):655-76. doi:10.1111/j.1475-6773.2011.01326.x.
120. Goettler A, Grosse A, Sonntag D. Productivity loss due to overweight and obesity: a
systematic review of indirect costs. BMJ Open. 2017;7(10):e014632.
doi:10.1136/bmjopen-2016-014632 %J
121. Ding D, Lawson KD, Kolbe-Alexander TL, Finkelstein EA, Katzmarzyk PT, van
Mechelen W et al. The economic burden of physical inactivity: a global analysis of
major non-communicable diseases. Lancet. 2016;388(10051):1311-24.
doi:10.1016/S0140-6736(16)30383-X.
122. Lee IM, Shiroma EJ, Lobelo F, Puska P, Blair SN, Katzmarzyk PT et al. Effect of
physical inactivity on major non-communicable diseases worldwide: an analysis of
burden of disease and life expectancy. Lancet. 2012;380(9838):219-29.
doi:10.1016/S0140-6736(12)61031-9.
123. Guh DP, Zhang W, Bansback N, Amarsi Z, Birmingham CL, Anis AH. The
incidence of co-morbidities related to obesity and overweight: A systematic review
and meta-analysis. BMC Public Health. 2009;9(1):88. doi:10.1186/1471-2458-9-88.
124. Ryan DH, Yockey SR. Weight Loss and Improvement in Comorbidity: Differences
at 5%, 10%, 15%, and Over. Curr Obes Rep. 2017;6(2):187-94.
doi:10.1007/s13679-017-0262-y.
125. Leskinen T, Stenholm S, Heinonen OJ, Pulakka A, Aalto V, Kivimäki M et al.
Change in physical activity and accumulation of cardiometabolic risk factors. Prev
Med. 2018;112:31-7. doi:10.1016/j.ypmed.2018.03.020.
126. Wennlöf AH, Yngve A, Nilsson TK, Sjöström M. Serum lipids, glucose and insulin
levels in healthy schoolchildren aged 9 and 15 years from central Sweden:
Reference values in relation to biological, social and lifestyle factors. Scand J Clin
Lab Invest. 2005;65(1):65-76. doi:10.1080/00365510410003110.
127. Lear SA, Hu W, Rangarajan S, Gasevic D, Leong D, Iqbal R et al. The effect of
physical activity on mortality and cardiovascular disease in 130 000 people from 17
high-income, middle-income, and low-income countries: the PURE study. Lancet.
2017;390(10113):2643-54. doi:10.1016/s0140-6736(17)31634-3.
128. 2018 Physical Activity Guidelines Advisory Committee. 2018 Physical Activity
Guidelines Advisory Committee Scientific Report. Washington, DC: U.S.
Department of Health and Human Services, 2018.

86
129. The Tromsø Study. [cited 2020 21 July]
https://en.uit.no/forskning/forskningsgrupper/gruppe?p_document_id=453582.
130. Jacobsen BK, Eggen AE, Mathiesen EB, Wilsgaard T, Njølstad I. Cohort profile: the
Tromsø Study. Int J Epidemiol. 2012;41(4):961-7. doi:10.1093/ije/dyr049.
131. Booth ML, Okely AD, Chey T, Bauman A. The reliability and validity of the
physical activity questions in the WHO health behaviour in schoolchildren (HBSC)
survey: a population study. Br J Sports Med. 2001;35(4):263-7.
132. Klasson-Heggebø L, Anderssen SA. Gender and age differences in relation to the
recommendations of physical activity among Norwegian children and youth. Scand
J Med Sci Sports. 2003;13(5):293-8. doi:10.1034/j.1600-0838.2003.00337.x.
133. Sagelv EH, Ekelund U, Pedersen S, Brage S, Hansen BH, Johansson J et al. Physical
activity levels in adults and elderly from triaxial and uniaxial accelerometry. The
Tromsø Study. PLoS One. 2019;14(12):e0225670.
doi:10.1371/journal.pone.0225670.
134. Mattocks C, Ness A, Leary S, Tilling K, Blair SN, Shield J et al. Use of
accelerometers in a large field-based study of children: protocols, design issues, and
effects on precision. J Phys Act Health. 2008;5 Suppl 1:S98-111.
doi:10.1123/jpah.5.s1.s98.
135. Trost SG, Pate RR, Freedson PS, Sallis JF, Taylor WC. Using objective physical
activity measures with youth: how many days of monitoring are needed? Med Sci
Sports Exerc. 2000;32(2):426-31.
136. Hecht A, Ma S, Porszasz J, Casaburi R, Network CCR. Methodology for using long-
term accelerometry monitoring to describe daily activity patterns in COPD. COPD.
2009;6(2):121-9. doi:10.1080/15412550902755044.
137. Syed S, Morseth B, Hopstock LA, Horsch A. Evaluating the performance of raw and
epoch non-wear algorithms using multiple accelerometers and electrocardiogram
recordings. Sci Rep. 2020;10(1):5866. doi:10.1038/s41598-020-62821-2.
138. Ortlieb S, Dias A, Gorzelniak L, Nowak D, Karrasch S, Peters A et al. Exploring
patterns of accelerometry-assessed physical activity in elderly people. Int J Behav
Nutr Phys Act. 2014;11(1):28. doi:10.1186/1479-5868-11-28.
139. Treuth MS, Schmitz K, Catellier DJ, McMurray RG, Murray DM, Almeida MJ et al.
Defining accelerometer thresholds for activity intensities in adolescent girls. Med
Sci Sports Exerc. 2004;36(7):1259-66.
87
140. Andersen LB, Harro M, Sardinha LB, Froberg K, Ekelund U, Brage S et al. Physical
activity and clustered cardiovascular risk in children: a cross-sectional study (The
European Youth Heart Study). Lancet. 2006;368(9532):299-304.
doi:10.1016/s0140-6736(06)69075-2.
141. Henriksen A, Grimsgaard S, Horsch A, Hartvigsen G, Hopstock L. Validity of the
Polar M430 Activity Monitor in Free-Living Conditions: Validation Study. JMIR
Form Res. 2019;3(3):e14438. doi:10.2196/14438.
142. Sasaki JE, John D, Freedson PS. Validation and comparison of ActiGraph activity
monitors. J Sci Med Sport. 2011;14(5):411-6. doi:10.1016/j.jsams.2011.04.003.
143. Brannsether B, Roelants M, Bjerknes R, Jùlìusson PB. Waist circumference and
waist-to-height ratio in Norwegian children 4-18 years of age: reference values and
cut-off levels. Acta Paediatr. 2011;100(12):1576-82. doi:10.1111/j.1651-
2227.2011.02370.x.
144. Monzani A, Ricotti R, Caputo M, Solito A, Archero F, Bellone S et al. A Systematic
Review of the Association of Skipping Breakfast with Weight and Cardiometabolic
Risk Factors in Children and Adolescents. What Should We Better Investigate in the
Future? Nutrients. 2019;11(2). doi:10.3390/nu11020387.
145. Andersen PL, Bakken A. Social class differences in youths’ participation in
organized sports: What are the mechanisms? Int Rev Sociol Sport. 2019;54(8):921-
37. doi:10.1177/1012690218764626.
146. Hamilton MT, Healy GN, Dunstan DW, Zderic TW, Owen N. Too Little Exercise
and Too Much Sitting: Inactivity Physiology and the Need for New
Recommendations on Sedentary Behavior. Curr Cardiovasc Risk Rep.
2008;2(4):292-8. doi:10.1007/s12170-008-0054-8.
147. Kwon S, Andersen LB, Grøntved A, Kolle E, Cardon G, Davey R et al. A closer
look at the relationship among accelerometer-based physical activity metrics: ICAD
pooled data. Int J Behav Nutr Phys Act. 2019;16(1):40. doi:10.1186/s12966-019-
0801-x.
148. Kolle E, Steene-Johannessen J, Andersen LB, Anderssen SA. Seasonal variation in
objectively assessed physical activity among children and adolescents in Norway: a
cross-sectional study. Int J Behav Nutr Phys Act. 2009;6(1):36. doi:10.1186/1479-
5868-6-36.
88
149. Aadland E, Andersen LB, Ekelund U, Anderssen SA, Resaland GK. Reproducibility
of domain-specific physical activity over two seasons in children. BMC Public
Health. 2018;18(1):821. doi:10.1186/s12889-018-5743-8.
150. Benedet J, da Silva Lopes A, Adami F, de Fragas Hinnig P, de Vasconcelos Fde A.
Association of sexual maturation with excess body weight and height in children
and adolescents. BMC Pediatr. 2014;14:72. doi:10.1186/1471-2431-14-72.
151. World Medical Association (WMA). Declaration of Helsinki - Ethical Principles
for Medical Research Involving Human Subjects. Bulletin of the World Health
Organization. 2001;79(4):373-4.
152. International Committee of Medical Journal Editors. Recommendations for the
Conduct, Reporting, Editing and Publication of Scholarly Work in Medical Journals.
2019. [cited 2020 13 May]. Available from:
http://www.icmje.org/recommendations/
153. Lov om medisinsk og helsefaglig forskning (helseforskningsloven). 2009. [cited
2020 27 May]. Available from: https://lovdata.no/dokument/NL/lov/2008-06-20-44
154. Cuzick J. A Wilcoxon-type test for trend. Stat Med. 1985;4(1):87-90.
155. Ekelund U, Hildebrand M, Collings PJ. Physical activity, sedentary time and
adiposity during the first two decades of life. Proc Nutr Soc. 2014;73(2):319-29.
doi:10.1017/S0029665114000019.
156. Laxer RE, Cooke M, Dubin JA, Brownson RC, Chaurasia A, Leatherdale ST.
Behavioural patterns only predict concurrent BMI status and not BMI trajectories in
a sample of youth in Ontario, Canada. PLoS One. 2018;13(1):e0190405.
doi:10.1371/journal.pone.0190405.
157. Brown T, Moore TH, Hooper L, Gao Y, Zayegh A, Ijaz S et al. Interventions for
preventing obesity in children. Cochrane Database Syst Rev. 2019;7:Cd001871.
doi:10.1002/14651858.CD001871.pub4.
158. Deforche B, Van Dyck D, Deliens T, De Bourdeaudhuij I. Changes in weight,
physical activity, sedentary behaviour and dietary intake during the transition to
higher education: a prospective study. Int J Behav Nutr Phys Act. 2015;12:16.
doi:10.1186/s12966-015-0173-9.
159. Condello G, Puggina A, Aleksovska K, Buck C, Burns C, Cardon G et al.
Behavioral determinants of physical activity across the life course: a "DEterminants
89
of DIet and Physical ACtivity" (DEDIPAC) umbrella systematic literature review.
Int J Behav Nutr Phys Act. 2017;14(1):58. doi:10.1186/s12966-017-0510-2.
160. Owen KB, Smith J, Lubans DR, Ng JYY, Lonsdale C. Self-determined motivation
and physical activity in children and adolescents: A systematic review and meta-
analysis. Prev Med. 2014;67:270-9. doi:10.1016/j.ypmed.2014.07.033.
161. Ekelund U, Brage S, Besson H, Sharp S, Wareham NJ. Time spent being sedentary
and weight gain in healthy adults: reverse or bidirectional causality? Am J Clin
Nutr. 2008;88(3):612-7. doi:10.1093/ajcn/88.3.612.
162. Shephard RJ. Limits to the measurement of habitual physical activity by
questionnaires. Br J Sports Med. 2003;37(3):197-206; discussion
163. Landis JR, Koch GG. The measurement of observer agreement for categorical data.
Biometrics. 1977;33(1):159-74.
164. Dishman RK, Heath G, Lee IM. Physical activity epidemiology. 2nd ed.
Champaign, IL: Human Kinetics; 2013.
165. Kettaneh A, Oppert JM, Heude B, Deschamps V, Borys JM, Lommez A et al.
Changes in physical activity explain paradoxical relationship between baseline
physical activity and adiposity changes in adolescent girls: the FLVS II study. Int J
Obes (Lond). 2005;29(6):586-93. doi:10.1038/sj.ijo.0802992.
166. Logan GR, Duncan S, Harris NK, Hinckson EA, Schofield G. Adolescent physical
activity levels: discrepancies with accelerometer data analysis. J Sports Sci.
2016;34(21):2047-53. doi:10.1080/02640414.2016.1150599.
167. Aadland E, Andersen LB, Anderssen SA, Resaland GK, Kvalheim OM.
Accelerometer epoch setting is decisive for associations between physical activity
and metabolic health in children. J Sports Sci. 2020;38(3):256-63.
doi:10.1080/02640414.2019.1693320.
168. Brazendale K, Beets MW, Bornstein DB, Moore JB, Pate RR, Weaver RG et al.
Equating accelerometer estimates among youth: The Rosetta Stone 2. J Sci Med
Sport. 2016;19(3):242-9. doi:10.1016/j.jsams.2015.02.006.
169. Bornstein DB, Beets MW, Byun W, Welk G, Bottai M, Dowda M et al. Equating
accelerometer estimates of moderate-to-vigorous physical activity: in search of the
Rosetta Stone. J Sci Med Sport. 2011;14(5):404-10.
doi:10.1016/j.jsams.2011.03.013.

90
170. Toftager M, Kristensen PL, Oliver M, Duncan S, Christiansen LB, Boyle E et al.
Accelerometer data reduction in adolescents: effects on sample retention and bias.
Int J Behav Nutr Phys Act. 2013;10:140. doi:10.1186/1479-5868-10-140.
171. Piercy KL, Troiano RP, Ballard RM, Carlson SA, Fulton JE, Galuska DA et al. The
Physical Activity Guidelines for Americans. JAMA. 2018;320(19):2020-8.
doi:10.1001/jama.2018.14854.
172. Winther A, Jørgensen L, Ahmed LA, Christoffersen T, Furberg AS, Grimnes G et
al. Bone mineral density at the hip and its relation to fat mass and lean mass in
adolescents: the Tromsø Study, Fit Futures. BMC Musculoskelet Disord.
2018;19(1):21. doi:10.1186/s12891-018-1933-x.
173. Hage RPE, Courteix D, Benhamou C-L, Jacob C, Jaffré C. Relative importance of
lean and fat mass on bone mineral density in a group of adolescent girls and boys.
Eur J Appl Physiol. 2009;105(5):759-64. doi:10.1007/s00421-008-0959-4.
174. Kaul S, Rothney MP, Peters DM, Wacker WK, Davis CE, Shapiro MD et al. Dual-
energy X-ray absorptiometry for quantification of visceral fat. Obesity (Silver
Spring). 2012;20(6):1313-8. doi:10.1038/oby.2011.393.
175. Bastien M, Poirier P, Lemieux I, Després J-P. Overview of Epidemiology and
Contribution of Obesity to Cardiovascular Disease. Prog Cardiovasc Dis.
2014;56(4):369-81. doi:10.1016/j.pcad.2013.10.016.
176. Meredith-Jones K, Haszard J, Stanger N, Taylor R. Precision of DXA-Derived
Visceral Fat Measurements in a Large Sample of Adults of Varying Body Size.
Obesity (Silver Spring). 2018;26(3):505-12. doi:10.1002/oby.22108.
177. Aadland E, Kvalheim OM, Anderssen SA, Resaland GK, Andersen LB.
Multicollinear physical activity accelerometry data and associations to
cardiometabolic health: challenges, pitfalls, and potential solutions. Int J Behav Nutr
Phys Act. 2019;16(1):74. doi:10.1186/s12966-019-0836-z.
178. Pearson N, Biddle SJH, Griffiths P, Johnston JP, Haycraft E. Clustering and
correlates of screen-time and eating behaviours among young children. BMC Public
Health. 2018;18(1):753. doi:10.1186/s12889-018-5698-9.
179. Börnhorst C, Wijnhoven TMA, Kunešová M, Yngve A, Rito AI, Lissner L et al.
WHO European Childhood Obesity Surveillance Initiative: associations between
sleep duration, screen time and food consumption frequencies. BMC Public Health.
2015;15(1):442. doi:10.1186/s12889-015-1793-3.
91
180. Auhuber L, Vogel M, Grafe N, Kiess W, Poulain T. Leisure Activities of Healthy
Children and Adolescents. Int J Environ Res Public Health. 2019;16(12).
doi:10.3390/ijerph16122078.
181. Brown AW, Bohan Brown MM, Allison DB. Belief beyond the evidence: using the
proposed effect of breakfast on obesity to show 2 practices that distort scientific
evidence. Am J Clin Nutr. 2013;98(5):1298-308. doi:10.3945/ajcn.113.064410.
182. Friestad C, Klepp KI. Socioeconomic status and health behaviour patterns through
adolescence: results from a prospective cohort study in Norway. Eur J Public
Health. 2006;16(1):41-7. doi:10.1093/eurpub/cki051.
183. Hagquist CE. Health inequalities among adolescents: the impact of academic
orientation and parents' education. Eur J Public Health. 2007;17(1):21-6.
doi:10.1093/eurpub/ckl087.
184. Skrede T, Steene-Johannessen J, Anderssen SA, Resaland GK, Ekelund U. The
prospective association between objectively measured sedentary time, moderate-to-
vigorous physical activity and cardiometabolic risk factors in youth: a systematic
review and meta-analysis. Obes Rev. 2019;20(1):55-74. doi:10.1111/obr.12758.
185. Sandhu J, Ben-Shlomo Y, Cole TJ, Holly J, Davey Smith G. The impact of
childhood body mass index on timing of puberty, adult stature and obesity: a follow-
up study based on adolescent anthropometry recorded at Christ's Hospital (1936-
1964). Int J Obes (Lond). 2006;30(1):14-22. doi:10.1038/sj.ijo.0803156.
186. Sterne JAC, White IR, Carlin JB, Spratt M, Royston P, Kenward MG et al. Multiple
imputation for missing data in epidemiological and clinical research: potential and
pitfalls. BMJ. 2009;338:b2393. doi:10.1136/bmj.b2393 %J BMJ.
187. Opdal IM, Morseth B, Handegård B-H, Lillevoll KR, Nilsen W, Nielsen C et al. Is
change in mental distress among adolescents predicted by sedentary behaviour or
screen time? Results from the longitudinal population study The Tromsø Study: Fit
Futures. BMJ Open. 2020;10(2):e035549. doi:10.1136/bmjopen-2019-035549.
188. Evensen E, Skeie G, Wilsgaard T, Christoffersen T, Dennison E, Furberg A-S et al.
How Is Adolescent Bone Mass and Density Influenced by Early Life Body Size and
Growth? The Tromsø Study: Fit Futures-A Longitudinal Cohort Study From
Norway. JBMR Plus. 2018;2(5):268-80. doi:10.1002/jbm4.10049.
189. Statistisk Sentralbyrå [Statistics Norway], Videregående utdanning. [Cited 2020 24
July]. Available from: https://www.ssb.no/statbank/list/vgu.
92
190. Stensland SØ, Thoresen S, Wentzel-Larsen T, Dyb G. Interpersonal violence and
overweight in adolescents: the HUNT Study. Scand J Public Health. 2015;43(1):18-
26. doi:10.1177/1403494814556176.
191. Bjørnelv S, Lydersen S, Mykletun A, Holmen TL. Changes in BMI-distribution
from 1966-69 to 1995-97 in adolescents. The Young-HUNT study, Norway. BMC
Public Health. 2007;7:279. doi:10.1186/1471-2458-7-279.
192. Kolle E SJ, Hansen BH, Anderssen SA. Fysisk aktivitet blant 6-, 9- og 15-åringer i
Norge. Resultater fra en kartlegging i 2011. Oslo, Norway: The Norwegian
Directorate of Health. 2012.
193. Ortega FB, Tresaco B, Ruiz JR, Moreno LA, Martin-Matillas M, Mesa JL et al.
Cardiorespiratory Fitness and Sedentary Activities Are Associated with Adiposity in
Adolescents. Obesity. 2007;15(6):1589-99. doi:10.1038/oby.2007.188.
194. Levin S, Lowry R, Brown DR, Dietz WH. Physical Activity and Body Mass Index
Among US Adolescents: Youth Risk Behavior Survey, 1999. Arch Pediatr Adolesc
Med. 2003;157(8):816-20. doi:10.1001/archpedi.157.8.816.
195. Janssen I, Katzmarzyk PT, Boyce WF, King MA, Pickett W. Overweight and
obesity in Canadian adolescents and their associations with dietary habits and
physical activity patterns. J Adolesc Health. 2004;35(5):360-7.
doi:10.1016/j.jadohealth.2003.11.095.
196. Lantz H, Bratteby LE, Fors H, Sandhagen B, Sjöström L, Samuelson G. Body
composition in a cohort of Swedish adolescents aged 15, 17 and 20.5 years. Acta
Paediatr. 2008;97(12):1691-7. doi:10.1111/j.1651-2227.2008.01035.x.
197. Ekelund U, Neovius M, Linné Y, Brage S, Wareham NJ, Rössner S. Associations
between physical activity and fat mass in adolescents: the Stockholm Weight
Development Study. Am J Clin Nutr. 2005;81(2):355-60. doi:10.1093/ajcn.81.2.355.
198. McCarthy HD, Ellis SM, Cole TJ. Central overweight and obesity in British youth
aged 11-16 years: cross sectional surveys of waist circumference. BMJ.
2003;326(7390):624. doi:10.1136/bmj.326.7390.624.
199. Bjelland M, Lien N, Bergh IH, Grydeland M, Anderssen SA, Klepp KI et al.
Overweight and waist circumference among Norwegian 11-year-olds and
associations with reported parental overweight and waist circumference: The HEIA
study. Scand J Public Health. 2010;38(5 Suppl):19-27.
doi:10.1177/1403494810385036.

93
200. Fredriks AM, van Buuren S, Fekkes M, Verloove-Vanhorick SP, Wit JM. Are age
references for waist circumference, hip circumference and waist-hip ratio in Dutch
children useful in clinical practice? Eur J Pediatr. 2005;164(4):216-22.
doi:10.1007/s00431-004-1586-7.
201. Prentice-Dunn H, Prentice-Dunn S. Physical activity, sedentary behavior, and
childhood obesity: a review of cross-sectional studies. Psychol Health Med.
2012;17(3):255-73. doi:10.1080/13548506.2011.608806.
202. Rauner A, Mess F, Woll A. The relationship between physical activity, physical
fitness and overweight in adolescents: a systematic review of studies published in or
after 2000. BMC Pediatr. 2013;13:19. doi:10.1186/1471-2431-13-19.
203. Reichert FF, Wells JC, Ekelund U, Menezes AM, Victora CG, Hallal PC.
Prospective Associations Between Physical Activity Level and Body Composition
in Adolescence: 1993 Pelotas (Brazil) Birth Cohort. J Phys Act Health.
2015;12(6):834-9. doi:10.1123/jpah.2013-0509.
204. Dalene KE, Anderssen SA, Andersen LB, Steene-Johannessen J, Ekelund U, Hansen
BH et al. Secular and longitudinal physical activity changes in population-based
samples of children and adolescents. Scand J Med Sci Sports. 2018;28(1):161-71.
doi:10.1111/sms.12876.
205. Rangul V, Holmen TL, Bauman A, Bratberg GH, Kurtze N, Midthjell K. Factors
predicting changes in physical activity through adolescence: the Young-HUNT
Study, Norway. J Adolesc Health. 2011;48(6):616-24.
doi:10.1016/j.jadohealth.2010.09.013.
206. Duncan SC, Duncan TE, Strycker LA, Chaumeton NR. A cohort-sequential latent
growth model of physical activity from ages 12 to 17 years. Ann Behav Med.
2007;33(1):80-9. doi:10.1207/s15324796abm3301_9.
207. Riddoch CJ, Leary SD, Ness AR, Blair SN, Deere K, Mattocks C et al. Prospective
associations between objective measures of physical activity and fat mass in 12-14
year old children: the Avon Longitudinal Study of Parents and Children (ALSPAC).
BMJ. 2009;339:b4544. doi:10.1136/bmj.b4544.
208. Hallal PC, Reichert FF, Ekelund U, Dumith SC, Menezes AM, Victora CG et al.
Bidirectional cross-sectional and prospective associations between physical activity
and body composition in adolescence: birth cohort study. J Sports Sci.
2012;30(2):183-90. doi:10.1080/02640414.2011.631570.
94
209. Saibene F, Minetti AE. Biomechanical and physiological aspects of legged
locomotion in humans. Eur J Appl Physiol. 2003;88(4):297-316.
doi:10.1007/s00421-002-0654-9.
210. Hume DJ, Yokum S, Stice E. Low energy intake plus low energy expenditure (low
energy flux), not energy surfeit, predicts future body fat gain. Am J Clin Nutr.
2016;103(6):1389-96. doi:10.3945/ajcn.115.127753.
211. Ekelund U, Kolle E, Steene-Johannessen J, Dalene KE, Nilsen AKO, Anderssen SA
et al. Objectively measured sedentary time and physical activity and associations
with body weight gain: does body weight determine a decline in moderate and
vigorous intensity physical activity? Int J Obes (Lond). 2017;41(12):1769-74.
doi:10.1038/ijo.2017.186.
212. Hand GA, Blair SN. Energy Flux and its Role in Obesity and Metabolic Disease.
Eur Endocrinol. 2014;10(2):131-5. doi:10.17925/EE.2014.10.02.131.
213. Catenacci VA, Wyatt HR. The role of physical activity in producing and
maintaining weight loss. Nat Clin Pract Endocrinol Metab. 2007;3(7):518-29.
doi:10.1038/ncpendmet0554.
214. Ross R, Dagnone D, Jones PJH, Smith H, Paddags A, Hudson R et al. Reduction in
Obesity and Related Comorbid Conditions after Diet-Induced Weight Loss or
Exercise-Induced Weight Loss in Men. A Randomized, Controlled Trial. Ann Intern
Med. 2000;133(2):92-103. doi:10.7326/0003-4819-133-2-200007180-00008.
215. Lemstra M, Bird Y, Nwankwo C, Rogers M, Moraros J. Weight loss intervention
adherence and factors promoting adherence: a meta-analysis. Patient Prefer
Adherence. 2016;10:1547-59. doi:10.2147/ppa.S103649.
216. Colley RC, Hills AP, O'Moore-Sullivan TM, Hickman IJ, Prins JB, Byrne NM.
Variability in adherence to an unsupervised exercise prescription in obese women.
Int J Obes (Lond). 2008;32(5):837-44. doi:10.1038/sj.ijo.0803799.
217. Melby CL, Paris HL, Sayer RD, Bell C, Hill JO. Increasing Energy Flux to Maintain
Diet-Induced Weight Loss. Nutrients. 2019;11(10):2533. doi:10.3390/nu11102533.
218. Levine JA. Nonexercise activity thermogenesis – liberating the life-force. J Intern
Med. 2007;262(3):273-87. doi:10.1111/j.1365-2796.2007.01842.x.
219. Maclean PS, Bergouignan A, Cornier MA, Jackman MR. Biology's response to
dieting: the impetus for weight regain. Am J Physiol Regul Integr Comp Physiol.
2011;301(3):R581-600. doi:10.1152/ajpregu.00755.2010.

95
220. Meyer U, Schindler C, Zahner L, Ernst D, Hebestreit H, van Mechelen W et al.
Long-term effect of a school-based physical activity program (KISS) on fitness and
adiposity in children: a cluster-randomized controlled trial. PLoS One.
2014;9(2):e87929. doi:10.1371/journal.pone.0087929.
221. Gorely T, Morris JG, Musson H, Brown S, Nevill A, Nevill ME. Physical activity
and body composition outcomes of the GreatFun2Run intervention at 20 month
follow-up. Int J Behav Nutr Phys Act. 2011;8:74. doi:10.1186/1479-5868-8-74.
222. Stamatakis E, Coombs N, Tiling K, Mattocks C, Cooper A, Hardy LL et al.
Sedentary Time in Late Childhood and Cardiometabolic Risk in Adolescence.
Pediatrics. 2015;135(6):e1432-e41. doi:10.1542/peds.2014-3750.
223. Brownson RC, Boehmer TK, Luke DA. Declining Rates of Physical Activity in the
United States: What Are the Contributors? Annu Rev Public Health.
2005;26(1):421-43. doi:10.1146/annurev.publhealth.26.021304.144437.
224. Sirard JR, Slater ME. Walking and Bicycling to School: A Review. Am J Lifestyle
Med. 2008;2(5):372-96. doi:10.1177/1559827608320127.
225. Church TS, Thomas DM, Tudor-Locke C, Katzmarzyk PT, Earnest CP, Rodarte RQ
et al. Trends over 5 decades in U.S. occupation-related physical activity and their
associations with obesity. PLoS One. 2011;6(5):e19657.
doi:10.1371/journal.pone.0019657.
226. Poitras VJ, Gray CE, Borghese MM, Carson V, Chaput JP, Janssen I et al.
Systematic review of the relationships between objectively measured physical
activity and health indicators in school-aged children and youth. Appl Physiol Nutr
Metab. 2016;41(6 Suppl 3):S197-239. doi:10.1139/apnm-2015-0663.
227. Biddle SJ, Garcia Bengoechea E, Wiesner G. Sedentary behaviour and adiposity in
youth: a systematic review of reviews and analysis of causality. Int J Behav Nutr
Phys Act. 2017;14(1):43. doi:10.1186/s12966-017-0497-8.
228. Metcalf B, Henley W, Wilkin T. Effectiveness of intervention on physical activity of
children: systematic review and meta-analysis of controlled trials with objectively
measured outcomes (EarlyBird 54). BMJ. 2012;345. doi:ARTN e5888
10.1136/bmj.e5888.
229. Gába A, Dygrýn J, Štefelová N, Rubín L, Hron K, Jakubec L et al. How do short
sleepers use extra waking hours? A compositional analysis of 24-h time-use patterns
96
among children and adolescents. Int J Behav Nutr Phys Act. 2020;17(1):104.
doi:10.1186/s12966-020-01004-8.
230. Swinburn BA, Sacks G, Hall KD, McPherson K, Finegood DT, Moodie ML et al.
The global obesity pandemic: shaped by global drivers and local environments.
Lancet. 2011;378(9793):804-14. doi:10.1016/S0140-6736(11)60813-1.
231. Franco M, Orduñez P, Caballero B, Tapia Granados JA, Lazo M, Bernal JL et al.
Impact of Energy Intake, Physical Activity, and Population-wide Weight Loss on
Cardiovascular Disease and Diabetes Mortality in Cuba, 1980–2005. Am J
Epidemiol. 2007;166(12):1374-80. doi:10.1093/aje/kwm226.
232. Franco M, Bilal U, Orduñez P, Benet M, Morejón A, Caballero B et al. Population-
wide weight loss and regain in relation to diabetes burden and cardiovascular
mortality in Cuba 1980-2010: repeated cross sectional surveys and ecological
comparison of secular trends. BMJ. 2013;346:f1515. doi:10.1136/bmj.f1515
233. Twisk JW. Physical activity guidelines for children and adolescents: a critical
review. Sports Med. 2001;31(8):617-27. doi:10.2165/00007256-200131080-00006.
234. Sand A-S, Emaus N, Lian O. Overweight and obesity in young adult women: A
matter of health or appearance? The Tromsø study: Fit futures. Int J Qual Stud
Health Well-being. 2015;10(1):29026. doi:10.3402/qhw.v10.29026.
235. Zhang L, Rashad I. Obesity and time preference: the health consequences of
discounting the future. J Biosoc Sci. 2008;40(1):97-113.
doi:10.1017/S0021932007002039.

97
Papers I-III
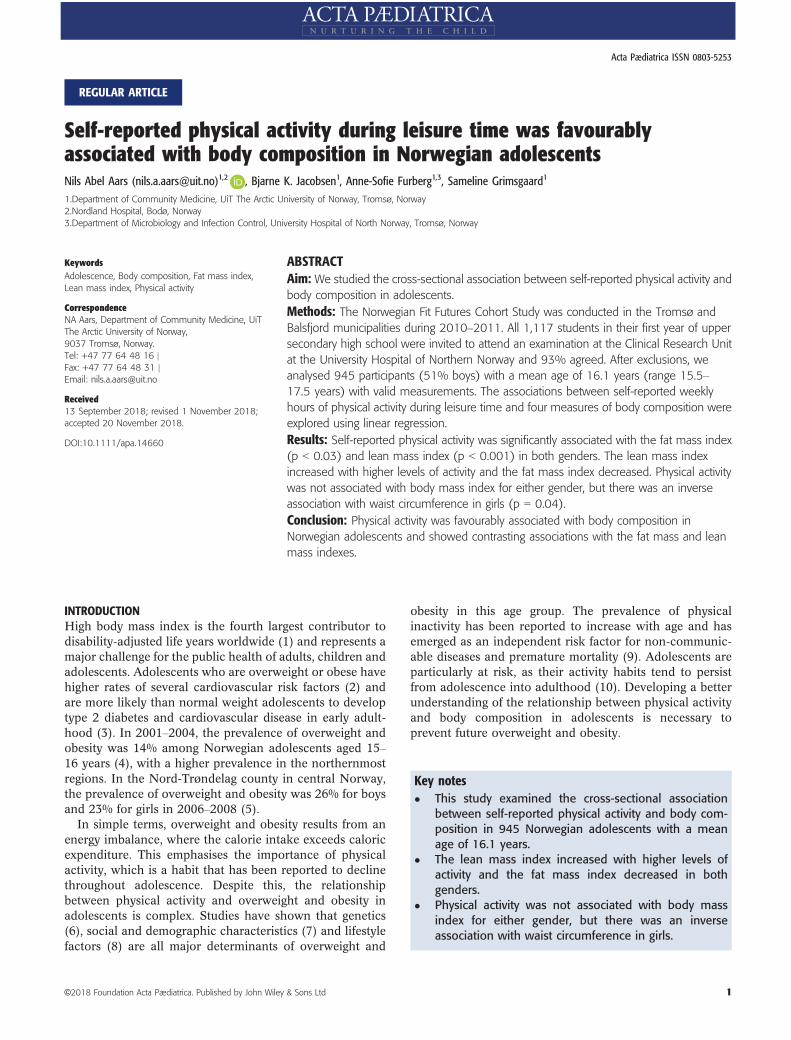
REGULAR ARTICLE
Self-reported physical activity during leisure time was favourablyassociated with body composition in Norwegian adolescentsNils Abel Aars ([email protected])1,2 , Bjarne K. Jacobsen1, Anne-Sofie Furberg1,3, Sameline Grimsgaard1
1.Department of Community Medicine, UiT The Arctic University of Norway, Tromsø, Norway2.Nordland Hospital, Bodø, Norway3.Department of Microbiology and Infection Control, University Hospital of North Norway, Tromsø, Norway
KeywordsAdolescence, Body composition, Fat mass index,Lean mass index, Physical activity
CorrespondenceNA Aars, Department of Community Medicine, UiTThe Arctic University of Norway,9037 Tromsø, Norway.Tel: +47 77 64 48 16 |Fax: +47 77 64 48 31 |Email: [email protected]
Received13 September 2018; revised 1 November 2018;accepted 20 November 2018.
DOI:10.1111/apa.14660
ABSTRACTAim: We studied the cross-sectional association between self-reported physical activity and
body composition in adolescents.
Methods: The Norwegian Fit Futures Cohort Study was conducted in the Tromsø and
Balsfjord municipalities during 2010–2011. All 1,117 students in their first year of upper
secondary high school were invited to attend an examination at the Clinical Research Unit
at the University Hospital of Northern Norway and 93% agreed. After exclusions, we
analysed 945 participants (51% boys) with a mean age of 16.1 years (range 15.5–17.5 years) with valid measurements. The associations between self-reported weekly
hours of physical activity during leisure time and four measures of body composition were
explored using linear regression.
Results: Self-reported physical activity was significantly associated with the fat mass index
(p < 0.03) and lean mass index (p < 0.001) in both genders. The lean mass index
increased with higher levels of activity and the fat mass index decreased. Physical activity
was not associated with body mass index for either gender, but there was an inverse
association with waist circumference in girls (p = 0.04).
Conclusion: Physical activity was favourably associated with body composition in
Norwegian adolescents and showed contrasting associations with the fat mass and lean
mass indexes.
INTRODUCTIONHigh body mass index is the fourth largest contributor todisability-adjusted life years worldwide (1) and represents amajor challenge for the public health of adults, children andadolescents. Adolescents who are overweight or obese havehigher rates of several cardiovascular risk factors (2) andare more likely than normal weight adolescents to developtype 2 diabetes and cardiovascular disease in early adult-hood (3). In 2001–2004, the prevalence of overweight andobesity was 14% among Norwegian adolescents aged 15–16 years (4), with a higher prevalence in the northernmostregions. In the Nord-Trøndelag county in central Norway,the prevalence of overweight and obesity was 26% for boysand 23% for girls in 2006–2008 (5).
In simple terms, overweight and obesity results from anenergy imbalance, where the calorie intake exceeds caloricexpenditure. This emphasises the importance of physicalactivity, which is a habit that has been reported to declinethroughout adolescence. Despite this, the relationshipbetween physical activity and overweight and obesity inadolescents is complex. Studies have shown that genetics(6), social and demographic characteristics (7) and lifestylefactors (8) are all major determinants of overweight and
obesity in this age group. The prevalence of physicalinactivity has been reported to increase with age and hasemerged as an independent risk factor for non-communic-able diseases and premature mortality (9). Adolescents areparticularly at risk, as their activity habits tend to persistfrom adolescence into adulthood (10). Developing a betterunderstanding of the relationship between physical activityand body composition in adolescents is necessary toprevent future overweight and obesity.
Key notes� This study examined the cross-sectional association
between self-reported physical activity and body com-position in 945 Norwegian adolescents with a meanage of 16.1 years.
� The lean mass index increased with higher levels ofactivity and the fat mass index decreased in bothgenders.
� Physical activity was not associated with body massindex for either gender, but there was an inverseassociation with waist circumference in girls.
©2018 Foundation Acta Pædiatrica. Published by John Wiley & Sons Ltd 1
Acta Pædiatrica ISSN 0803-5253
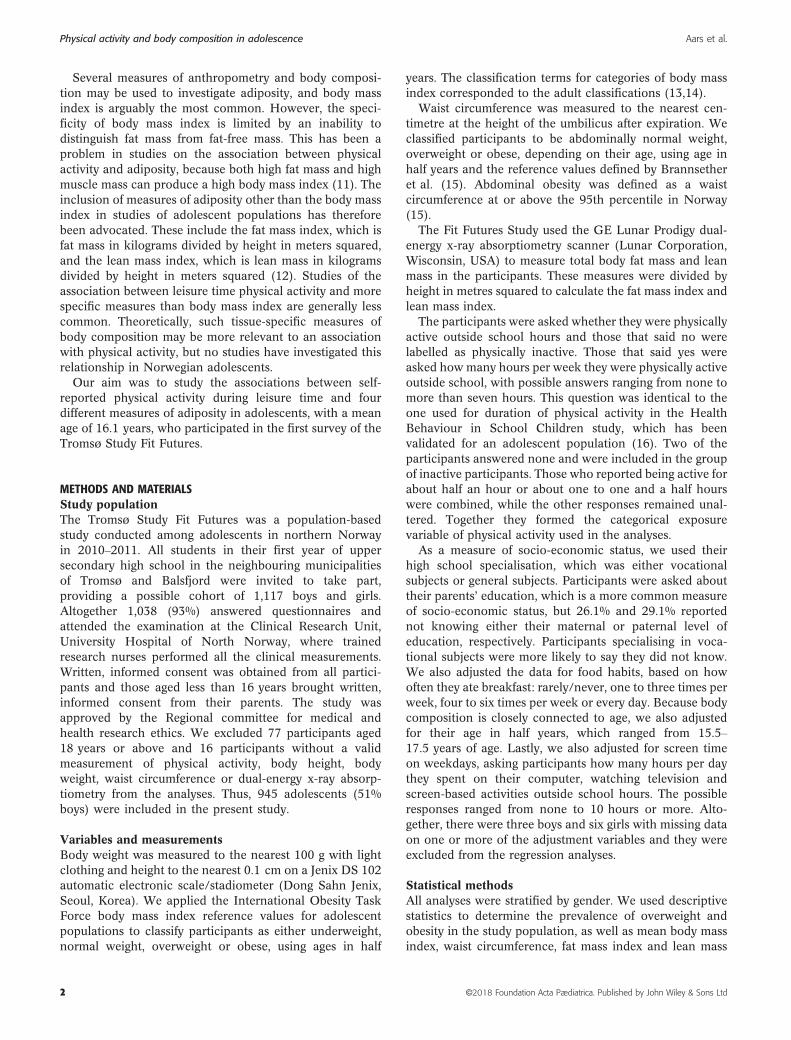
Several measures of anthropometry and body composi-tion may be used to investigate adiposity, and body massindex is arguably the most common. However, the speci-ficity of body mass index is limited by an inability todistinguish fat mass from fat-free mass. This has been aproblem in studies on the association between physicalactivity and adiposity, because both high fat mass and highmuscle mass can produce a high body mass index (11). Theinclusion of measures of adiposity other than the body massindex in studies of adolescent populations has thereforebeen advocated. These include the fat mass index, which isfat mass in kilograms divided by height in meters squared,and the lean mass index, which is lean mass in kilogramsdivided by height in meters squared (12). Studies of theassociation between leisure time physical activity and morespecific measures than body mass index are generally lesscommon. Theoretically, such tissue-specific measures ofbody composition may be more relevant to an associationwith physical activity, but no studies have investigated thisrelationship in Norwegian adolescents.
Our aim was to study the associations between self-reported physical activity during leisure time and fourdifferent measures of adiposity in adolescents, with a meanage of 16.1 years, who participated in the first survey of theTromsø Study Fit Futures.
METHODS AND MATERIALSStudy populationThe Tromsø Study Fit Futures was a population-basedstudy conducted among adolescents in northern Norwayin 2010–2011. All students in their first year of uppersecondary high school in the neighbouring municipalitiesof Tromsø and Balsfjord were invited to take part,providing a possible cohort of 1,117 boys and girls.Altogether 1,038 (93%) answered questionnaires andattended the examination at the Clinical Research Unit,University Hospital of North Norway, where trainedresearch nurses performed all the clinical measurements.Written, informed consent was obtained from all partici-pants and those aged less than 16 years brought written,informed consent from their parents. The study wasapproved by the Regional committee for medical andhealth research ethics. We excluded 77 participants aged18 years or above and 16 participants without a validmeasurement of physical activity, body height, bodyweight, waist circumference or dual-energy x-ray absorp-tiometry from the analyses. Thus, 945 adolescents (51%boys) were included in the present study.
Variables and measurementsBody weight was measured to the nearest 100 g with lightclothing and height to the nearest 0.1 cm on a Jenix DS 102automatic electronic scale/stadiometer (Dong Sahn Jenix,Seoul, Korea). We applied the International Obesity TaskForce body mass index reference values for adolescentpopulations to classify participants as either underweight,normal weight, overweight or obese, using ages in half
years. The classification terms for categories of body massindex corresponded to the adult classifications (13,14).
Waist circumference was measured to the nearest cen-timetre at the height of the umbilicus after expiration. Weclassified participants to be abdominally normal weight,overweight or obese, depending on their age, using age inhalf years and the reference values defined by Brannsetheret al. (15). Abdominal obesity was defined as a waistcircumference at or above the 95th percentile in Norway(15).
The Fit Futures Study used the GE Lunar Prodigy dual-energy x-ray absorptiometry scanner (Lunar Corporation,Wisconsin, USA) to measure total body fat mass and leanmass in the participants. These measures were divided byheight in metres squared to calculate the fat mass index andlean mass index.
The participants were asked whether they were physicallyactive outside school hours and those that said no werelabelled as physically inactive. Those that said yes wereasked how many hours per week they were physically activeoutside school, with possible answers ranging from none tomore than seven hours. This question was identical to theone used for duration of physical activity in the HealthBehaviour in School Children study, which has beenvalidated for an adolescent population (16). Two of theparticipants answered none and were included in the groupof inactive participants. Those who reported being active forabout half an hour or about one to one and a half hourswere combined, while the other responses remained unal-tered. Together they formed the categorical exposurevariable of physical activity used in the analyses.
As a measure of socio-economic status, we used theirhigh school specialisation, which was either vocationalsubjects or general subjects. Participants were asked abouttheir parents’ education, which is a more common measureof socio-economic status, but 26.1% and 29.1% reportednot knowing either their maternal or paternal level ofeducation, respectively. Participants specialising in voca-tional subjects were more likely to say they did not know.We also adjusted the data for food habits, based on howoften they ate breakfast: rarely/never, one to three times perweek, four to six times per week or every day. Because bodycomposition is closely connected to age, we also adjustedfor their age in half years, which ranged from 15.5–17.5 years of age. Lastly, we also adjusted for screen timeon weekdays, asking participants how many hours per daythey spent on their computer, watching television andscreen-based activities outside school hours. The possibleresponses ranged from none to 10 hours or more. Alto-gether, there were three boys and six girls with missing dataon one or more of the adjustment variables and they wereexcluded from the regression analyses.
Statistical methodsAll analyses were stratified by gender. We used descriptivestatistics to determine the prevalence of overweight andobesity in the study population, as well as mean body massindex, waist circumference, fat mass index and lean mass
2 ©2018 Foundation Acta Pædiatrica. Published by John Wiley & Sons Ltd
Physical activity and body composition in adolescence Aars et al.
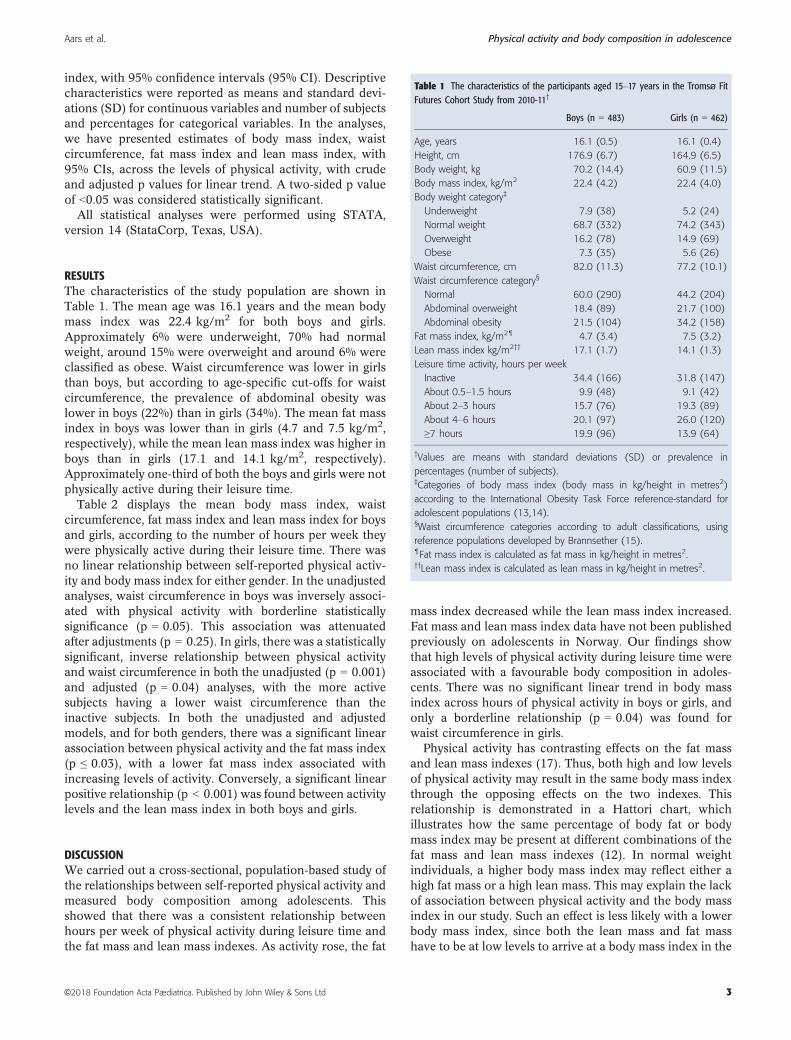
index, with 95% confidence intervals (95% CI). Descriptivecharacteristics were reported as means and standard devi-ations (SD) for continuous variables and number of subjectsand percentages for categorical variables. In the analyses,we have presented estimates of body mass index, waistcircumference, fat mass index and lean mass index, with95% CIs, across the levels of physical activity, with crudeand adjusted p values for linear trend. A two-sided p valueof <0.05 was considered statistically significant.
All statistical analyses were performed using STATA,version 14 (StataCorp, Texas, USA).
RESULTSThe characteristics of the study population are shown inTable 1. The mean age was 16.1 years and the mean bodymass index was 22.4 kg/m2 for both boys and girls.Approximately 6% were underweight, 70% had normalweight, around 15% were overweight and around 6% wereclassified as obese. Waist circumference was lower in girlsthan boys, but according to age-specific cut-offs for waistcircumference, the prevalence of abdominal obesity waslower in boys (22%) than in girls (34%). The mean fat massindex in boys was lower than in girls (4.7 and 7.5 kg/m2,respectively), while the mean lean mass index was higher inboys than in girls (17.1 and 14.1 kg/m2, respectively).Approximately one-third of both the boys and girls were notphysically active during their leisure time.
Table 2 displays the mean body mass index, waistcircumference, fat mass index and lean mass index for boysand girls, according to the number of hours per week theywere physically active during their leisure time. There wasno linear relationship between self-reported physical activ-ity and body mass index for either gender. In the unadjustedanalyses, waist circumference in boys was inversely associ-ated with physical activity with borderline statisticallysignificance (p = 0.05). This association was attenuatedafter adjustments (p = 0.25). In girls, there was a statisticallysignificant, inverse relationship between physical activityand waist circumference in both the unadjusted (p = 0.001)and adjusted (p = 0.04) analyses, with the more activesubjects having a lower waist circumference than theinactive subjects. In both the unadjusted and adjustedmodels, and for both genders, there was a significant linearassociation between physical activity and the fat mass index(p ≤ 0.03), with a lower fat mass index associated withincreasing levels of activity. Conversely, a significant linearpositive relationship (p < 0.001) was found between activitylevels and the lean mass index in both boys and girls.
DISCUSSIONWe carried out a cross-sectional, population-based study ofthe relationships between self-reported physical activity andmeasured body composition among adolescents. Thisshowed that there was a consistent relationship betweenhours per week of physical activity during leisure time andthe fat mass and lean mass indexes. As activity rose, the fat
mass index decreased while the lean mass index increased.Fat mass and lean mass index data have not been publishedpreviously on adolescents in Norway. Our findings showthat high levels of physical activity during leisure time wereassociated with a favourable body composition in adoles-cents. There was no significant linear trend in body massindex across hours of physical activity in boys or girls, andonly a borderline relationship (p = 0.04) was found forwaist circumference in girls.
Physical activity has contrasting effects on the fat massand lean mass indexes (17). Thus, both high and low levelsof physical activity may result in the same body mass indexthrough the opposing effects on the two indexes. Thisrelationship is demonstrated in a Hattori chart, whichillustrates how the same percentage of body fat or bodymass index may be present at different combinations of thefat mass and lean mass indexes (12). In normal weightindividuals, a higher body mass index may reflect either ahigh fat mass or a high lean mass. This may explain the lackof association between physical activity and the body massindex in our study. Such an effect is less likely with a lowerbody mass index, since both the lean mass and fat masshave to be at low levels to arrive at a body mass index in the
Table 1 The characteristics of the participants aged 15–17 years in the Tromsø FitFutures Cohort Study from 2010-11†
Boys (n = 483) Girls (n = 462)
Age, years 16.1 (0.5) 16.1 (0.4)
Height, cm 176.9 (6.7) 164.9 (6.5)
Body weight, kg 70.2 (14.4) 60.9 (11.5)
Body mass index, kg/m2 22.4 (4.2) 22.4 (4.0)
Body weight category‡
Underweight 7.9 (38) 5.2 (24)
Normal weight 68.7 (332) 74.2 (343)
Overweight 16.2 (78) 14.9 (69)
Obese 7.3 (35) 5.6 (26)
Waist circumference, cm 82.0 (11.3) 77.2 (10.1)
Waist circumference category§
Normal 60.0 (290) 44.2 (204)
Abdominal overweight 18.4 (89) 21.7 (100)
Abdominal obesity 21.5 (104) 34.2 (158)
Fat mass index, kg/m2¶ 4.7 (3.4) 7.5 (3.2)
Lean mass index kg/m2†† 17.1 (1.7) 14.1 (1.3)
Leisure time activity, hours per week
Inactive 34.4 (166) 31.8 (147)
About 0.5–1.5 hours 9.9 (48) 9.1 (42)
About 2–3 hours 15.7 (76) 19.3 (89)
About 4–6 hours 20.1 (97) 26.0 (120)
≥7 hours 19.9 (96) 13.9 (64)
†Values are means with standard deviations (SD) or prevalence in
percentages (number of subjects).‡Categories of body mass index (body mass in kg/height in metres2)
according to the International Obesity Task Force reference-standard for
adolescent populations (13,14).§Waist circumference categories according to adult classifications, using
reference populations developed by Brannsether (15).¶Fat mass index is calculated as fat mass in kg/height in metres2.††Lean mass index is calculated as lean mass in kg/height in metres2.
©2018 Foundation Acta Pædiatrica. Published by John Wiley & Sons Ltd 3
Aars et al. Physical activity and body composition in adolescence

lower range (18). The influence of sex steroid hormones onsex differences in body composition during adolescence isimportant. During adolescence, girls experience more fatmass accrual than boys and boys experience greaterincreases in lean mass than girls (19,20). In accordancewith this, we found a higher mean fat mass index in girlsthan boys and a higher lean mass index in boys than girls.However, it has been reported that even a small differencein lean mass may have a substantial effect on increase in fatmass, since muscles are particularly important for oxidisa-tion of fat (21). Another study found that those with higherlean mass could have higher resting metabolism through theeffect of increased muscle mass (22). The effect of regularphysical activity on lean mass is, therefore, important whenit comes to preventing overweight and obesity. This isbecause of the immediate effect of activity itself and alsobecause of the long-term effects of having an increasedresting metabolic rate (23). It has also been suggested thathigher levels of physical activity can ease the maintenanceof energy balance (24), as a sustained caloric surplus willlead to increased adiposity over time (21). Our resultsshowed a linear association between physical activity andboth the fat mass and lean mass indexes, confirmingprevious findings that leisure time activity was favourablyassociated with body composition in adolescents on a cross-sectional level (25).
We found that the prevalence of general overweight andobesity in this group of adolescents was similar to otherregions in Norway (26). The prevalence of obesity wasapproximately 6%, with no difference between boys andgirls, which was close to results from a survey performed incentral Norway in 2006–2008 (5). The prevalence of
abdominal obesity was 22% in boys and 34% in girls inthe present study, which was higher than the prevalence ofobesity, as defined by the body mass index. The largedifferences between measures of body composition suggestthat the prevalence of abdominal and general obesity is notdirectly comparable. A longitudinal study of adolescentsshowed that the increase in waist circumference surpassedthat of the body mass index and concluded that the bodymass index systematically underestimated the prevalence ofobesity in adolescents (27). The authors proposed that anincrease in fat mass had been obscured by a reduction inmuscle mass, suggesting waist circumference was a bettermeasure of fat mass than the body mass index.
A study of Swedish adolescents reported a mean fat massindex of 5.8 in girls and 3.8 in boys (28). This was slightlylower than our results, but this cohort had a mean age of15.2 and the fat mass index was calculated using bioimpe-dance rather than dual-energy x-ray absorptiometry. Nordicdata on the lean mass index in adolescents have not beenpublished. According to American reference curves for thelean mass index, the age-specific and gender-specific 50thpercentiles were 16.9 for boys and 14.4 for girls, which weresimilar to our results (29).
Our findings suggest that more precise measures ofoverweight and obesity than body mass index or waistcircumference are preferable when studying associationsbetween physical activity and body composition. This lackof precision may explain the conflicting results that havepreviously been reported on these associations (30). Inaddition, the diversity in methodology and chosen measuresof exposure and outcomes may have led to variations in thereported associations between physical activity and body
Table 2 Mean body mass index, waist circumference, fat mass index and lean mass index†, with 95% confidence intervals among boys and girls aged 15–17 years in the TromsøFit Futures Cohort Study from 2010 to 2011, according to hours per week of physical activity in leisure time
n Body mass index Waist circumference Fat mass index Lean mass index
Boys
Hours per week of physical activity 480
None (0 hours) 166 22.7 (21.9–23.4) 83.1 (81.1–85.1) 5.4 (4.8–6.0) 16.6 (16.4–16.9)
0.5–1.5 hours 47 21.9 (20.8–22.9) 82.0 (78.7–85.3) 4.8 (3.9–5.7) 16.5 (16.2–16.9)
2–3 hours 75 22.1 (21.2–23.1) 81.0 (78.6–83.4) 4.6 (3.9–5.4) 16.9 (16.6–17.2)
4–6 hours 96 23.0 (22.2–23.9) 83.4 (81.2–85.7) 4.8 (4.2–5.5) 17.7 (17.3–18.0)
≥7 hours 96 21.7 (21.2–22.2) 79.4 (78.0–80.9) 3.3 (2.9–3.7) 17.9 (17.6–18.2)
p value for linear trend 0.27 0.05 <0.001 <0.001
Adjusted p value for linear trend‡ 0.90 0.25 0.004 <0.001
Girls
Hours per week of physical activity 456
None (0 hours) 143 22.6 (21.9–23.2) 78.9 (77.1–80.8) 8.0 (7.5–8.6) 13.8 (13.6–13.9)
0.5–1.5 hours 42 22.6 (21.2–23.9) 77.3 (74.3–80.3) 7.8 (6.8–8.8) 14.0 (13.6–14.4)
2–3 hours 89 22.7 (21.8–23.7) 77.9 (75.6–80.2) 7.9 (7.2–8.7) 14.0 (13.7–14.3)
4–6 hours 118 22.2 (21.6–22.9) 76.1 (74.6–77.6) 7.1 (6.6–7.6) 14.4 (14.2–14.7)
≥7 hours 64 21.8 (21.1–22.5) 74.1 (72.1–76.1) 6.3 (5.7–6.9) 14.8 (14.4–15.1)
p value for linear trend 0.18 0.001 <0.001 <0.001
Adjusted p value for linear trend‡ 0.86 0.04 0.03 <0.001
†Body mass index equals body mass in kg/height in m2, waist circumference measured in cm, fat mass index equals fat mass in kg/height in m2, lean mass index
equals lean mass in kg/height in m2.‡Adjusted for screen time on weekdays, age in half years, regularity of eating breakfast and study specialisation.
4 ©2018 Foundation Acta Pædiatrica. Published by John Wiley & Sons Ltd
Physical activity and body composition in adolescence Aars et al.

composition (17). The multifactorial causes of adipositymust also be considered. Higher levels of activity have beenassociated with higher energy expenditure, but the influ-ence of demographics, lifestyle and genetic factors makes itchallenging to study the isolated effect of physical activityon body composition. The ability of self-reported physicalactivity to predict body mass index or other measures ofbody composition may also be questionable, as people areactive for different reasons. Lastly, adiposity can be theresult of relatively small imbalances in energy intake andexpenditure over time, which may cause substantial differ-ences in the body composition. Whether this is the case inthe present study could be examined by a follow-up study ofthe Fit Futures cohort.
Our study had some limitations. There are inherentchallenges in studying the relationship between physicalactivity and body composition using cross-sectional designs,particularly in adolescent populations, because they aresubject to natural body changes during puberty. We wereunable to ascertain the direction of the associationsreported, meaning reverse causality may have been present.If that was the case, a high level of adiposity could havecaused either lower or higher levels of physical activity.Questionnaire data on physical activity are prone tomeasurement errors and may lead to inaccurate estimatesof the activity habits of participants. Other aspects ofphysical activity, such as the intensity of the activity orexertion, may result in a different relationship with bodycomposition than we observed with self-reported hours perweek. The Fit Futures study did not include a validatedcomprehensive questionnaire on food, and we were unableto fully adjust for this potential confounder. We did adjustfor regularly eating breakfast, which may influence weightstatus through consumption of energy-dense foods later inthe day.
The study also had several strengths. The participationrate of 93%, before exclusions, was high and ensures thatthe results were representative of the study population. Allthe clinical measurements were performed by trained staff,thereby reducing reporting bias and measurement errors.We also included four different measures of body compo-sition in our analyses, which enabled us to carry outcomparisons between the instruments and produce a moredetailed description of the anthropometry of the cohort.
CONCLUSIONIn this cross-sectional study of 945 adolescents, theprevalence of obesity was approximately 6% and morethan 30% of both the boys and girls were inactive duringtheir leisure time. The fat mass index declined, and thelean mass index increased significantly in both genderswhen the self-reported number of hours of activityincreased. This means that physical activity during leisuretime was correlated with both the fat mass index and leanmass index. We also found that the fat mass indexprovided a more specific measure of unhealthy weightthan the body mass index.
ACKNOWLEDGEMENTSThe authors are grateful to the participants in the study, aswell as the staff at the Clinical Research Unit at theUniversity Hospital of North Norway for carrying out thedata collection and clinical measurements.
FUNDINGThis analysis did not receive any specific funding. The FitFutures Cohort Study was funded by the Northern NorwayRegional Health Authority and The Arctic University ofNorway.
CONFLICTS OF INTERESTThe authors declare that they have no competing interests.
References
1. Forouzanfar MH, Afshin A, Alexander LT, Anderson HR,Bhutta ZA, Biryukov S. Global, regional, and nationalcomparative risk assessment of 79 behavioural, environmentaland occupational, and metabolic risks or clusters of risks, 1990-2015: a systematic analysis for the Global Burden of DiseaseStudy 2015. Lancet 2016; 388: 1659–724.
2. Freedman DS, Kahn HS, Mei Z, Grummer-Strawn LM, DietzWH, Srinivasan SR, et al. Relation of body mass index andwaist-to-height ratio to cardiovascular disease risk factors inchildren and adolescents: the Bogalusa Heart Study. Am J ClinNutr 2007; 86: 33–40.
3. Tirosh A, Shai I, Afek A, Dubnov-Raz G, Ayalon N, Gordon B,et al. Adolescent BMI trajectory and risk of diabetes versuscoronary disease. N Engl J Med 2011; 364: 1315–25.
4. Grøholt EK, Stigum H, Nordhagen R. Overweight and obesityamong adolescents in Norway: cultural and socio-economicdifferences. J Public Health 2008; 30: 258–65.
5. Stensland SØ, Thoresen S, Wentzel-Larsen T, Dyb G.Interpersonal violence and overweight in adolescents: theHUNT Study. Scand J Public Health 2015; 43: 18–26.
6. Silventoinen K, Jelenkovic A, Sund R, Hur YM, Yokoyama Y,Honda C, et al. Genetic and environmental effects on bodymass index from infancy to the onset of adulthood: anindividual-based pooled analysis of 45 twin cohortsparticipating in the COllaborative project of Development ofAnthropometrical measures in Twins (CODATwins) study. AmJ Clin Nutr 2016; 104: 371–9.
7. Thibault H, Contrand B, Saubusse E, Baine M, Maurice-TisonS. Risk factors for overweight and obesity in Frenchadolescents: physical activity, sedentary behavior and parentalcharacteristics. Nutrition 2010; 26: 192–200.
8. Croezen S, Visscher TL, Ter Bogt NC, Veling ML, Haveman-Nies A. Skipping breakfast, alcohol consumption and physicalinactivity as risk factors for overweight and obesity inadolescents: results of the E-MOVO project. Eur J Clin Nutr2009; 63: 405–12.
9. Lee IM, Shiroma EJ, Lobelo F, Puska P, Blair SN, KatzmarzykPT, et al. Effect of physical inactivity on major non-communicable diseases worldwide: an analysis of burden ofdisease and life expectancy. Lancet 2012; 380: 219–29.
10. Telama R, Yang X, Leskinen E, Kankaanpaa A, Hirvensalo M,Tammelin T, et al. Tracking of physical activity from earlychildhood through youth into adulthood. Med Sci Sports Exerc2014; 46: 955–62.
©2018 Foundation Acta Pædiatrica. Published by John Wiley & Sons Ltd 5
Aars et al. Physical activity and body composition in adolescence

11. Etchison WC, Bloodgood EA, Minton CP, Thompson NJ,Collins MA, Hunter SC, et al. Body mass index and percentageof body fat as indicators for obesity in an adolescent athleticpopulation. Sports Health 2011; 3: 249–52.
12. Wells JC. Toward body composition reference data for infants,children, and adolescents. Adv Nutr 2014; 5: 320–9.
13. Cole TJ, Bellizzi MC, Flegal KM, Dietz WH. Establishing astandard definition for child overweight and obesityworldwide: international survey. BMJ 2000; 320: 1240–3.
14. Cole TJ, Flegal KM, Nicholls D, Jackson AA. Body mass indexcut offs to define thinness in children and adolescents:international survey. BMJ 2007; 335: 194.
15. Brannsether B, Roelants M, Bjerknes R, J�ul�ıusson PB. Waistcircumference and waist-to-height ratio in Norwegian children4-18 years of age: reference values and cut-off levels. ActaPaediatr 2011; 100: 1576–82.
16. Booth ML, Okely AD, Chey T, Bauman A. The reliability andvalidity of the physical activity questions in the WHO healthbehaviour in schoolchildren (HBSC) survey: a populationstudy. Br J Sports Med 2001; 35: 263–7.
17. Reichert FF, Wells JC, Ekelund U, Menezes AM, Victora CG,Hallal PC. Prospective associations between physical activitylevel and body composition in adolescence: 1993 Pelotas(Brazil) Birth Cohort. J Phys Act Health 2015; 12: 834–9.
18. Lohman TG, Going SB. Body composition assessment fordevelopment of an international growth standard forpreadolescent and adolescent children. Food Nutr Bull 2006;27: 314–25.
19. Wohlfahrt-Veje C, Tinggaard J, Winther K, Mouritsen A,Hagen CP, Mieritz MG, et al. Body fat throughout childhoodin 2647 healthy Danish children: agreement of BMI, waistcircumference, skinfolds with dual X-ray absorptiometry. Eur JClin Nutr 2014; 68: 664–70.
20. Baxter-Jones AD, Eisenmann JC, Mirwald RL, Faulkner RA,Bailey DA. The influence of physical activity on lean massaccrual during adolescence: a longitudinal analysis. J ApplPhysiol 2008; 105: 734–41.
21. Wolfe RR. The underappreciated role of muscle in health anddisease. Am J Clin Nutr 2006; 84: 475–82.
22. Ramires VV, Dumith SC, Wehrmeister FC, Hallal PC,Menezes AM, Goncalves H. Physical activity throughoutadolescence and body composition at 18 years: 1993 Pelotas(Brazil) birth cohort study. Int J Behav Nutr Phys Act 2016;13: 105.
23. Labayen I, Ruiz JR, Ortega FB, Huybrechts I, Rodriguez G,Jimenez-Pavon D, et al. High fat diets are associated withhigher abdominal adiposity regardless of physical activityin adolescents; the HELENA study. Clin Nutr 2014; 33:859–66.
24. Ekelund U, Kolle E, Steene-Johannessen J, Dalene KE, NilsenAKO, Anderssen SA, et al. Objectively measured sedentarytime and physical activity and associations with body weightgain: does body weight determine a decline in moderate andvigorous intensity physical activity? Int J Obes 2017; 41:1769–74.
25. Joensuu L, Syvaoja H, Kallio J, Kulmala J, Kujala UM,Tammelin TH. Objectively measured physical activity, bodycomposition and physical fitness: Cross-sectional associationsin 9- to 15-year-old children. Eur J Sport Sci 2018; 18: 1–11.
26. Bjørnelv S, Lydersen S, Mykletun A, Holmen TL. Changes inBMI-distribution from 1966-69 to 1995-97 in adolescents. TheYoung-HUNT study, Norway. BMC Public Health 2007;7: 279.
27. McCarthy HD, Ellis SM, Cole TJ. Central overweight andobesity in British youth aged 11-16 years: cross sectionalsurveys of waist circumference. BMJ 2003; 326: 624.
28. Eriksson M, Tynelius P, Rasmussen F. Associations ofbirthweight and infant growth with body composition at age15–the COMPASS study. Paediatr Perinat Epidemiol 2008; 22:379–88.
29. Weber DR, Moore RH, Leonard MB, Zemel BS. Fat and leanBMI reference curves in children and adolescents and theirutility in identifying excess adiposity compared with BMI andpercentage body fat. Am J Clin Nutr 2013; 98: 49–56.
30. Reichert FF, Baptista Menezes AM, Wells JC, CarvalhoDumith S, Hallal PC. Physical activity as a predictor ofadolescent body fatness: a systematic review. Sports Med2009; 39: 279–94.
6 ©2018 Foundation Acta Pædiatrica. Published by John Wiley & Sons Ltd
Physical activity and body composition in adolescence Aars et al.

RESEARCH ARTICLE Open Access
Longitudinal changes in body compositionand waist circumference by self-reportedlevels of physical activity in leisure amongadolescents: the Tromsø study, Fit FuturesNils Abel Aars1,2* , Bjarne K. Jacobsen1,3, Bente Morseth1,4, Nina Emaus5 and Sameline Grimsgaard1
Abstract
Background: It is not clear how physical activity affects body composition in adolescents. Physical activity levels areoften reduced during this period, and the relative proportion of body fat mass and lean mass undergo naturalchanges in growing adolescents. We aimed to examine whether self-reported physical activity in leisure time atbaseline or change in activity during follow-up affect changes in four measures of body composition; body massindex (kg/m2), waist circumference, fat mass index (fat mass in kg/m2) and lean mass index (lean mass in kg/m2).
Methods: We used data from the Tromsø Study Fit Futures, which invited all first year students in upper secondaryhigh school in two municipalities in northern Norway in 2010–2011. They were reexamined in 2012–2013.Longitudinal data was available for 292 boys and 354 girls. We used multiple linear regression analyses to assesswhether self-reported level of physical activity in leisure time at baseline predicted changes in body composition,and analysis of covariance to assess the effects of change in level of activity during follow-up on change in bodycomposition. All analyses were performed sex-specific, and a p-value of < 0.05 was considered statisticallysignificant.
Results: There were no associations between self-reported leisure time physical activity in the first year of uppersecondary high school and changes in any of the considered measure of body composition after 2 years of followup, with the exception of waist circumference in boys (p = 0.05). In boys, change in fat mass index differedsignificantly between groups of activity change (p < 0.01), with boys adopting activity or remaining physically activehaving less increase in fat mass index than the consistently inactive. In girls, change in lean mass index differedsignificantly between groups of activity change (p = 0.04), with girls adopting physical activity having the highestincrease.
Conclusions: Self-reported leisure time physical activity does not predict changes in body composition inadolescents after 2 years of follow up. Change in the level of physical activity is associated with change in fat massindex in boys and lean mass index in girls.
Keywords: Adolescence, Body composition, Longitudinal study, Physical activity
© The Author(s). 2019 Open Access This article is distributed under the terms of the Creative Commons Attribution 4.0International License (http://creativecommons.org/licenses/by/4.0/), which permits unrestricted use, distribution, andreproduction in any medium, provided you give appropriate credit to the original author(s) and the source, provide a link tothe Creative Commons license, and indicate if changes were made. The Creative Commons Public Domain Dedication waiver(http://creativecommons.org/publicdomain/zero/1.0/) applies to the data made available in this article, unless otherwise stated.
* Correspondence: [email protected] of Community Medicine, UiT The Arctic University of Norway,9037 Tromsø, Norway2Nordland Hospital, Bodø, NorwayFull list of author information is available at the end of the article
Aars et al. BMC Sports Science, Medicine and Rehabilitation (2019) 11:37 https://doi.org/10.1186/s13102-019-0150-8

BackgroundOverweight or obesity in adolescence is a major risk fac-tor for the same conditions as an adult [1], and thereforea risk factor for cardiovascular disease, type II diabetes,several types of cancer and musculoskeletal disorders inadulthood [2]. More than 20% of adolescents in Norwaywere in 2010 classified as overweight or obese [3].Among adolescents in the Western world there is evi-dence for a plateauing of the obesity epidemic at a highlevel [4]. In Norwegian men and women, the prevalenceof both overweight and obesity is increasing [5–7]. Stud-ies have shown that adolescent lifestyle tend to persistinto adulthood [8, 9], emphasizing the importance ofpreventing overweight and obesity in this period of life.A systematic review on the relationship between bodycomposition and physical activity in adolescents showedconflicting results, with reverse causality suggested as apossible explanation – meaning that overweight andobesity could be both a cause and an effect of low phys-ical activity [10]. The relationship is further complicatedby associations with sedentary behavior, nutrition, socio-economic status and genetics [11–14].There are several ways to quantify physical activity in
adolescents. The use of direct observation of individualsor doubly labelled water has been suggested as goldstandards, but questionnaire data are more feasible, do-main specific and common in observational studies [10].However, it must be acknowledged that self-reportedphysical activity tends to exaggerate the true amount ofphysical activity when compared to data from, for in-stance, accelerometers [15].Arguably, the most common measure of body com-
position is body mass index (BMI, body weight in kg/m2), but its ability to identify changes in adiposity is lim-ited as it does not distinguish between changes in fatmass and changes in lean mass [16]. This is a challengewhen studying body composition in growing adolescentsbecause boys naturally tend to gain more muscle massthan girls, while girls naturally gain more fat mass [17].In addition to BMI, we therefore included waist circum-ference, fat mass index (FMI, fat mass in kg/m2) andlean mass index (LMI, lean mass in kg/m2) as measuresof body composition in the present study. Waist circum-ference is an anthropometric measure which is specificto abdominal fatness [18]. FMI and LMI has been advo-cated as good measures of changes in adiposity in longi-tudinal studies because they measure fat mass and leanmass in relation to height [17, 19]. There are few studiesinvestigating the longitudinal association between self-reported physical activity and tissue specific measures ofbody composition in adolescents [10], with a majority ofthose available using BMI as the primary outcome. Toour knowledge, no studies modelling the association be-tween physical activity and changes in FMI or LMI have
been performed in Norway. Some international evidencepoints to a positive association between physical activityover the course of adolescence and LMI at age 18, but aless clear relationship with FMI [20]. Furthermore,higher self-reported physical activity has been associatedwith a positive change in lean mass [21], but not in fatmass [22].We examined whether self-reported physical activity
during leisure time was associated with change in mea-sures of body composition after 2 years in upper second-ary school in a cohort of adolescents in northern Norway;from a first measurement in 2010–2011 to a second meas-urement in 2012–2013. We further investigated whetherchanges in body composition differ between adolescentswho are persistently inactive, persistently active, adoptactivity or quit activity over the same period.
MethodsThe Tromsø Study Fit Futures is a population-basedcohort study, conducted in 2010–2011 (Fit Futures 1) andrepeated in 2012–2013 (Fit Futures 2). The study invitedall students in their first (Fit Futures 1) and third (FitFutures 2) year of upper secondary school in the neighbor-ing municipalities of Tromsø and Balsfjord in northernNorway. Fit Futures 1 invited 1117 students, with 1038(93%) attending. Fit Futures 2 invited 1130 students and870 (77%) attended. The participants in both studiesanswered a questionnaire and underwent a clinical examin-ation at the clinical research unit at the University Hospitalin Northern Norway, as detailed previously [23]. Thepresent study includes only those participating in both FitFutures 1 and Fit Futures 2. We excluded participants aged18 years or older at baseline (Fit Futures 1), those withoutvalid measurements of BMI, waist circumference, FMI andLMI at baseline and follow-up, and participants without in-formation on physical activity at baseline. Altogether 292boys and 354 girls were eligible for analyses.Body weight was measured to the nearest 100 g with
light clothing and height was measured to the nearest0.1 cm on a Jenix DS 102 automatic electronic scale/sta-diometer (Dong Sahn Jenix, Seoul, Korea). Waist cir-cumference was measured to the nearest cm afterexpiration and at the height of the umbilicus. Total bodyfat mass and total body lean mass was measured usingGE Lunar Prodigy dual-energy x-ray absorptiometryscanner (Lunar Corporation, Madison, Wisconsin, USA).Lean mass is comprised of all bodily tissue except fatand bone. Based on these measurements, Fat Mass Index(FMI, fat in kg/height in meters2) and Lean Mass Index(LMI, lean mass in kg/height in meters2) was calculated.The prevalence of overweight or obesity in Fit Futures
1 was determined by applying the International ObesityTask Force body mass index reference values for adoles-cent populations, using age in half years [24, 25]. The
Aars et al. BMC Sports Science, Medicine and Rehabilitation (2019) 11:37 Page 2 of 11

participants were classified as underweight, normalweight, overweight or obese. These reference values cor-respond to an adult (aged 18 and above) BMI of < 18.5kg/m2, 18.5 ≤ BMI < 25 kg/m2, 25.0 ≤ BMI < 30 kg/m2,and BMI ≥ 30.0 kg/m2, respectively.The outcomes in this study were change in BMI, waist cir-
cumference, FMI and LMI between Fit Futures 1 and FitFutures 2. The other variables included in the analyses werederived from the questionnaires. Our primary exposure wasself-reported physical activity in leisure time, measuredusing the question “Are you physically active outside schoolhours? Yes/no”. Those answering “No” were labelled as phys-ically inactive. Those answering “Yes” were asked “Howmany hours per week are you physically active outside ofschool hours?”. This question was used in the Health Behav-ior in School Children study and was validated for an ado-lescent population [26]. There are six response categories,from none to more than 7 h per week. One person in Fit Fu-tures 1 reported “none” on this question, and was thereforealso labelled as physically inactive. “About half an hour” and“About 1 to 1.5 hours” were combined, while the other re-sponses were maintained unaltered. Together they formedthe categorical physical activity variable used in the analyses.Change in physical activity from baseline to follow up
was defined by a dichotomous variable – “Active/in-active” – created based on the physical activity variableas described above. Being active was defined as physicalactivity ≥2 h per week. Those who were active in bothsurveys were labelled “consistently active” and those whowere inactive in both were labelled “consistently in-active”. The participants who became active betweensurveys (increased level of activity from < 2 h to ≥2 h perweek) were labelled “adopters”. Participants who reducedtheir level of activity from ≥2 h to < 2 h per week werelabelled “quitters”. A similar approach has been used inother studies [27, 28]. In addition to the primary expo-sures, we included baseline measurements of hours perweekday outside of school hours spent in front of acomputer or TV (screen time), age in half years, studyspecialization (which was either general, sports or voca-tional subjects) and regularity of eating breakfast in theanalyses as possible confounders.Puberty is associated with body composition in adoles-
cents, but in this particular cohort, data from the PubertalDevelopment Scale (PDS) was missing in a substantialnumber (17.8%) of boys. We explored the effect of adjust-ing for PDS or age at menarche (in girls) in complete caseanalyses, but as this had no substantial impact on results,we did not include the variables in the final model.
StatisticsResults are presented sex-specific. We used descriptivestatistics to determine the prevalence of overweight andobesity, levels of physical activity, mean values of BMI,
waist circumference, FMI and LMI at baseline and follow-up as well as changes in BMI, waist circumference, FMIand LMI. Categorical variables were presented as propor-tions in percentages with number of subjects (n), whilecontinuous variables were presented as means with stand-ard deviation (SD) (Table 1). The associations betweenbaseline physical activity and longitudinal changes in BMI,waist circumference, FMI and LMI were assessed usinglinear regression, with hours of physical activity coded toreflect the number of hours they represent. The associa-tions with changes in activity status were assessed by ana-lysis of covariance. As current body composition mayaffect the associations between physical activity andchange in body composition, we adjusted all analyses forthe baseline values. In the fully adjusted model we alsoincluded baseline measurements of sedentary behavior(screen time), study specialization, regularity of eatingbreakfast and age in half years, in addition to the timebetween baseline and follow-ups. We have presentedadjusted beta coefficients for change in outcome at eachlevel of physical activity at baseline (Table 2) or change inactivity status (Table 3 and Table 4 in Appendix). A p-value of less than 0.05 was considered significant.All statistical analyses were performed using STATA,
version 14 (StataCorp, College Station, Texas, USA).
ResultsTable 1 shows the descriptive characteristics of the studypopulation. Mean BMI increased by 1.2 units for boys, and0.8 units for girls between the surveys. On average, boysexperienced a larger increase of both body height and bodyweight than girls. In boys, the combined prevalence ofoverweight and obesity (BMI ≥ 25) increased from 21.2 to28.1%, while for girls it increased from 18.9 to 20.9%. Waistcircumference increased less in girls (1.1 cm) than in boys(3.2 cm). Both sexes experienced a similar increase in FMI(0.7 kg/m2 in boys and 0.6 kg/m2 in girls). Boys experi-enced a small increase in LMI (0.4 kg/m2), whereas in girlsthere was no change. The proportion of adolescents classi-fied as active in leisure time (active ≥ 2 h per week) de-creased by 6%-points for boys and 12.2%-points for girlsbetween the surveys.There was no statistically significant linear effect of
physical activity levels reported in 2010–2011 on changein neither BMI, FMI nor LMI during the following 2years (Table 2). This was true for both sexes and alsoafter adjustments. There were indications of a linear, in-verse relationship with waist circumference in boys (p =0.05), whereas a non-significant positive relationship wasseen in girls. The most active boys gained less in BMI,waist circumference and FMI relative to the inactive, al-beit not statistically significant. In contrast, the most ac-tive girls experienced a statistically significant higheradjusted increase in BMI (0.74 (95% CI: 0.04, 1.44)),
Aars et al. BMC Sports Science, Medicine and Rehabilitation (2019) 11:37 Page 3 of 11
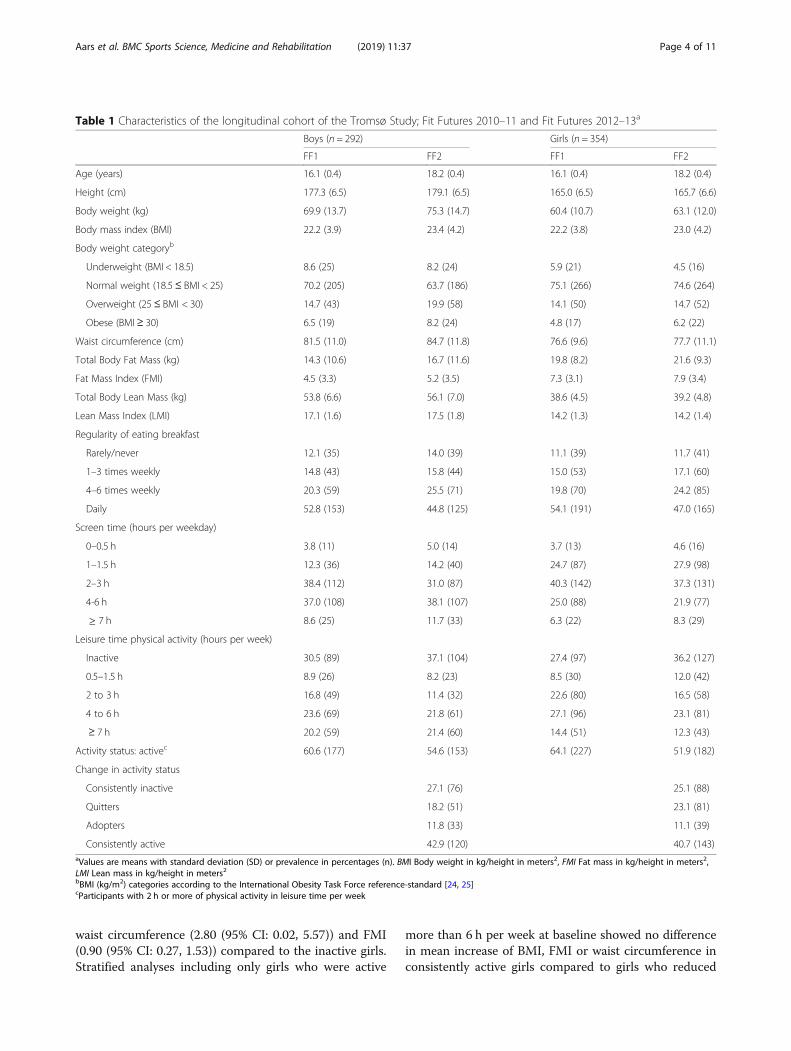
waist circumference (2.80 (95% CI: 0.02, 5.57)) and FMI(0.90 (95% CI: 0.27, 1.53)) compared to the inactive girls.Stratified analyses including only girls who were active
more than 6 h per week at baseline showed no differencein mean increase of BMI, FMI or waist circumference inconsistently active girls compared to girls who reduced
Table 1 Characteristics of the longitudinal cohort of the Tromsø Study; Fit Futures 2010–11 and Fit Futures 2012–13a
Boys (n = 292) Girls (n = 354)
FF1 FF2 FF1 FF2
Age (years) 16.1 (0.4) 18.2 (0.4) 16.1 (0.4) 18.2 (0.4)
Height (cm) 177.3 (6.5) 179.1 (6.5) 165.0 (6.5) 165.7 (6.6)
Body weight (kg) 69.9 (13.7) 75.3 (14.7) 60.4 (10.7) 63.1 (12.0)
Body mass index (BMI) 22.2 (3.9) 23.4 (4.2) 22.2 (3.8) 23.0 (4.2)
Body weight categoryb
Underweight (BMI < 18.5) 8.6 (25) 8.2 (24) 5.9 (21) 4.5 (16)
Normal weight (18.5≤ BMI < 25) 70.2 (205) 63.7 (186) 75.1 (266) 74.6 (264)
Overweight (25 ≤ BMI < 30) 14.7 (43) 19.9 (58) 14.1 (50) 14.7 (52)
Obese (BMI≥ 30) 6.5 (19) 8.2 (24) 4.8 (17) 6.2 (22)
Waist circumference (cm) 81.5 (11.0) 84.7 (11.8) 76.6 (9.6) 77.7 (11.1)
Total Body Fat Mass (kg) 14.3 (10.6) 16.7 (11.6) 19.8 (8.2) 21.6 (9.3)
Fat Mass Index (FMI) 4.5 (3.3) 5.2 (3.5) 7.3 (3.1) 7.9 (3.4)
Total Body Lean Mass (kg) 53.8 (6.6) 56.1 (7.0) 38.6 (4.5) 39.2 (4.8)
Lean Mass Index (LMI) 17.1 (1.6) 17.5 (1.8) 14.2 (1.3) 14.2 (1.4)
Regularity of eating breakfast
Rarely/never 12.1 (35) 14.0 (39) 11.1 (39) 11.7 (41)
1–3 times weekly 14.8 (43) 15.8 (44) 15.0 (53) 17.1 (60)
4–6 times weekly 20.3 (59) 25.5 (71) 19.8 (70) 24.2 (85)
Daily 52.8 (153) 44.8 (125) 54.1 (191) 47.0 (165)
Screen time (hours per weekday)
0–0.5 h 3.8 (11) 5.0 (14) 3.7 (13) 4.6 (16)
1–1.5 h 12.3 (36) 14.2 (40) 24.7 (87) 27.9 (98)
2–3 h 38.4 (112) 31.0 (87) 40.3 (142) 37.3 (131)
4-6 h 37.0 (108) 38.1 (107) 25.0 (88) 21.9 (77)
≥ 7 h 8.6 (25) 11.7 (33) 6.3 (22) 8.3 (29)
Leisure time physical activity (hours per week)
Inactive 30.5 (89) 37.1 (104) 27.4 (97) 36.2 (127)
0.5–1.5 h 8.9 (26) 8.2 (23) 8.5 (30) 12.0 (42)
2 to 3 h 16.8 (49) 11.4 (32) 22.6 (80) 16.5 (58)
4 to 6 h 23.6 (69) 21.8 (61) 27.1 (96) 23.1 (81)
≥ 7 h 20.2 (59) 21.4 (60) 14.4 (51) 12.3 (43)
Activity status: activec 60.6 (177) 54.6 (153) 64.1 (227) 51.9 (182)
Change in activity status
Consistently inactive 27.1 (76) 25.1 (88)
Quitters 18.2 (51) 23.1 (81)
Adopters 11.8 (33) 11.1 (39)
Consistently active 42.9 (120) 40.7 (143)aValues are means with standard deviation (SD) or prevalence in percentages (n). BMI Body weight in kg/height in meters2, FMI Fat mass in kg/height in meters2,LMI Lean mass in kg/height in meters2bBMI (kg/m2) categories according to the International Obesity Task Force reference-standard [24, 25]cParticipants with 2 h or more of physical activity in leisure time per week
Aars et al. BMC Sports Science, Medicine and Rehabilitation (2019) 11:37 Page 4 of 11

Table
2Differen
cein
BMI(kg/m
2 ),w
aistcircum
ference,FM
I(fatmassin
kg/m
2 )andLM
I(lean
massin
kg/m
2 )be
tweenFitFutures1(2010–2011)andFitFutures2(2012–2013),
accordingto
hourspe
rweekof
physicalactivity
inleisuretim
eat
baselinea
Beta
forΔBM
I(95%
CI)
Beta
forΔwaistcircum
ference(95%
CI)
Beta
forΔFM
I(95%
CI)
Beta
forΔLM
I(95%
CI)
Boys
nMod
el1
Mod
el2
Mod
el1
Mod
el2
Mod
el1
Mod
el2
Mod
el1
Mod
el2
Baselineph
ysicalactivity
290
Beta
95%
CI
Beta
95%
CI
Beta
95%
CI
Beta
95%
CI
Beta
95%
CI
Beta
95%
CI
Beta
95%
CI
Beta
95%
CI
Inactiveb
890
00
00
00
0
Abo
ut0.5–1.5h
260.30
−0.54,1.13
0.18
−0.65,1.01
0.61
−2.25,3.47
0.49
−2.38,3.35
0.04
−0.74,0.82
−0.02
−0.80,0.76
0.30
−0.05,0.65
0.26
−0.09,0.61
Abo
ut2to
3h
480.12
−0.56,0.80
0.12
−0.55,0.80
−0.11
−2.43,2.21
−0.11
−2.44,2.23
0.01
−0.62,0.64
0.01
−0.63,0.64
0.07
−0.21,0.35
0.09
−0.20,0.37
Abo
ut4to
6h
680.10
−0.50,0.71
−0.09
−0.70,0.53
−0.67
−2.74,1.40
−0.84
−2.96,1.27
0.07
−0.49,0.64
−0.06
−0.64,0.52
0.01
−0.25,0.27
−0.05
−0.31,0.22
≥7h
59−0.07
−0.70,0.57
−0.48
−1.24,0.29
−0.98
−3.16,1.19
−2.54
−5.19,0.12
−0.30
−0.91,0.30
−0.52
−1.25,0.21
0.20
−0.08,0.48
0.05
−0.28,0.38
Pforlineartren
d0.77
0.20
0.25
0.05*
0.41
0.22
0.41
0.75
Girls
Baselineph
ysicalactivity
351
Inactivec
950
00
00
00
0
Abo
ut0.5–1.5h
300.26
−0.50,1.01
0.40
−0.37,1.17
0.91
−2.07,3.89
1.29
−1.76,4.34
0.38
−0.31,1.06
0.56
−0.13,1.25
0.03
−0.25,0.30
−0.01
−0.29,0.27
Abo
ut2to
3h
800.03
−0.52,0.57
0.09
−0.47,0.64
0.01
−2.15,2.17
0.14
−2.06,2.33
0.14
−0.36,0.63
0.21
−0.28,0.71
−0.02
−0.22,0.18
−0.03
−0.23,0.17
Abo
ut4to
6h
95−0.40
−0.93,0.12
−0.25
−0.82,0.32
−0.10
−2.17,1.97
0.23
−2.02,2.49
−0.30
−0.78,0.17
−0.12
−0.63,0.39
−0.05
−0.24,0.15
−0.08
−0.29,0.13
≥7h
510.51
−0.12,1.14
0.74
0.04,1.44*
2.16
−0.33,4.64
2.80
0.02,5.57*
0.60
0.03,1.18*
0.90
0.27,1.53*
0.01
−0.22,0.24
−0.04
−0.30,0.22
Pforlineartren
d0.69
0.34
0.23
0.15
0.48
0.14
0.88
0.60
*Significan
tlydifferen
tfrom
thereference(p
<0.05
)a M
odel
1ad
justed
forba
selin
emeasuremen
tof
outcom
e.Mod
el2ad
justed
forba
selin
emeasuremen
tof
outcom
e,screen
timeon
weekd
ays,regu
larityof
eatin
gbreakfast,ag
ein
halfyearsat
baselin
ean
dda
ysbe
tweenmeasuremen
tsbInactiv
ebo
ysha
dameanincrease
of1.1BM
Iunits,3
.2cm
waist
circum
ference,
0.6FM
Iunits
and0.3LM
Iunits
c Inactiv
egirls
hadameanincrease
of0.8BM
Iunits,0
.6cm
waist
circum
ference,
0.5FM
Iunits
and0.1LM
Iunits
Aars et al. BMC Sports Science, Medicine and Rehabilitation (2019) 11:37 Page 5 of 11
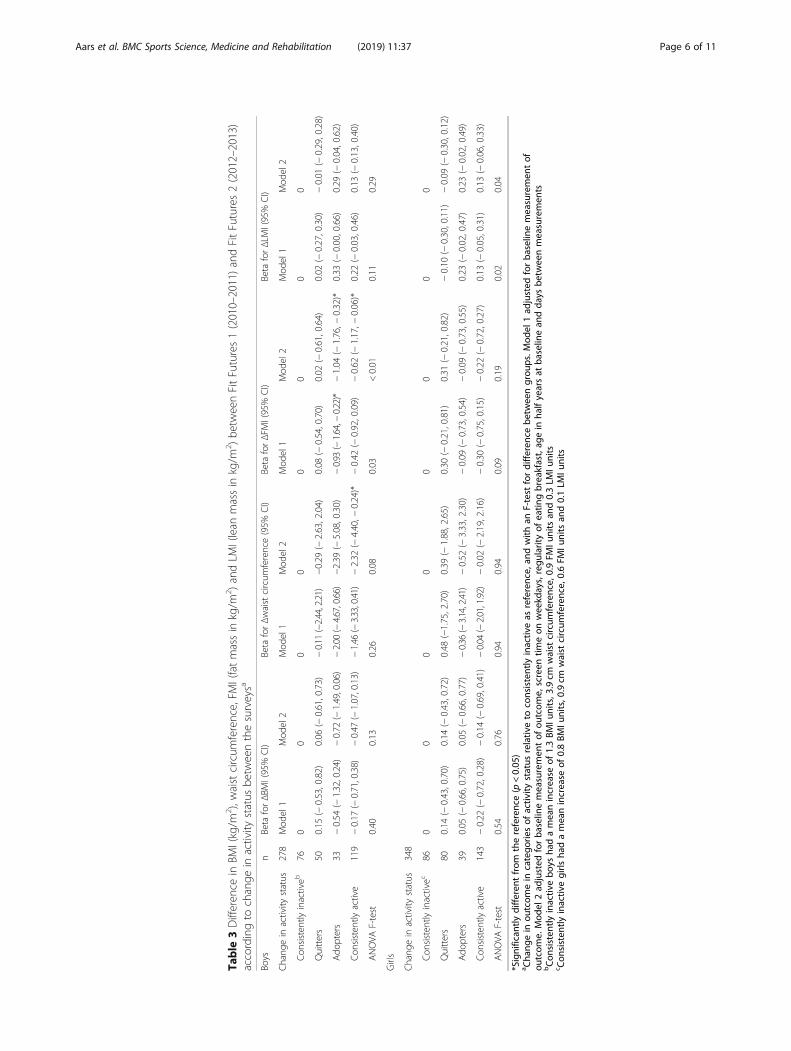
Table
3Differen
cein
BMI(kg/m
2 ),w
aistcircum
ference,FM
I(fatmassin
kg/m
2 )andLM
I(lean
massin
kg/m
2 )be
tweenFitFutures1(2010–2011)andFitFutures2(2012–2013)
accordingto
change
inactivity
status
betw
eenthesurveysa
Boys
nBeta
forΔBM
I(95%
CI)
Beta
forΔwaistcircum
ference(95%
CI)
Beta
forΔFM
I(95%
CI)
Beta
forΔLM
I(95%
CI)
Chang
ein
activity
status
278
Mod
el1
Mod
el2
Mod
el1
Mod
el2
Mod
el1
Mod
el2
Mod
el1
Mod
el2
Con
sisten
tlyinactiveb
760
00
00
00
0
Quitters
500.15
(−0.53,0.82)
0.06
(−0.61,0.73)
−0.11
(−2.44,2.21)
−0.29
(−2.63,2.04)
0.08
(−0.54,0.70)
0.02
(−0.61,0.64)
0.02
(−0.27,0.30)
−0.01
(−0.29,0.28)
Ado
pters
33−0.54
(−1.32,0.24)
−0.72
(−1.49,0.06)
−2.00
(−4.67,0.66)
−2.39
(−5.08,0.30)
−0.93
(−1.64,−
0.22)*
−1.04
(−1.76,−
0.32)*
0.33
(−0.00,0.66)
0.29
(−0.04,0.62)
Con
sisten
tlyactive
119
−0.17
(−0.71,0.38)
−0.47
(−1.07,0.13)
−1.46
(−3.33,0.41)
−2.32
(−4.40,−
0.24)*
−0.42
(−0.92,0.09)
−0.62
(−1.17,−
0.06)*
0.22
(−0.03,0.46)
0.13
(−0.13,0.40)
ANOVA
F-test
0.40
0.13
0.26
0.08
0.03
<0.01
0.11
0.29
Girls
Chang
ein
activity
status
348
Con
sisten
tlyinactivec
860
00
00
00
0
Quitters
800.14
(−0.43,0.70)
0.14
(−0.43,0.72)
0.48
(−1.75,2.70)
0.39
(−1.88,2.65)
0.30
(−0.21,0.81)
0.31
(−0.21,0.82)
−0.10
(−0.30,0.11)
−0.09
(−0.30,0.12)
Ado
pters
390.05
(−0.66,0.75)
0.05
(−0.66,0.77)
−0.36
(−3.14,2.41)
−0.52
(−3.33,2.30)
−0.09
(−0.73,0.54)
−0.09
(−0.73,0.55)
0.23
(−0.02,0.47)
0.23
(−0.02,0.49)
Con
sisten
tlyactive
143
−0.22
(−0.72,0.28)
−0.14
(−0.69,0.41)
−0.04
(−2.01,1.92)
−0.02
(−2.19,2.16)
−0.30
(−0.75,0.15)
−0.22
(−0.72,0.27)
0.13
(−0.05,0.31)
0.13
(−0.06,0.33)
ANOVA
F-test
0.54
0.76
0.94
0.94
0.09
0.19
0.02
0.04
*Significan
tlydifferen
tfrom
thereference(p
<0.05
)a Cha
ngein
outcom
ein
catego
riesof
activ
itystatus
relativ
eto
consistently
inactiv
eas
reference,
andwith
anF-test
fordifferen
cebe
tweengrou
ps.M
odel
1ad
justed
forba
selin
emeasuremen
tof
outcom
e.Mod
el2ad
justed
forba
selin
emeasuremen
tof
outcom
e,screen
timeon
weekd
ays,regu
larityof
eatin
gbreakfast,ag
ein
halfyearsat
baselin
ean
dda
ysbe
tweenmeasuremen
tsbCon
sisten
tlyinactiv
ebo
ysha
dameanincrease
of1.3BM
Iunits,3
.9cm
waist
circum
ference,
0.9FM
Iunits
and0.3LM
Iunits
c Con
sisten
tlyinactiv
egirls
hadameanincrease
of0.8BM
Iunits,0
.9cm
waist
circum
ference,
0.6FM
Iunits
and0.1LM
Iunits
Aars et al. BMC Sports Science, Medicine and Rehabilitation (2019) 11:37 Page 6 of 11

their level of physical activity. In boys, LMI increasedmost in those who at baseline were active between 0.5and 1.5 h per week, but the increase was not significantlydifferent from that observed among the inactive (0.26(95% CI: − 0.09, 0.61)). In girls, change in LMI differedlittle across level of activity.Table 3 presents changes in BMI, waist circumference,
FMI and LMI according to change in activity status from2010 to 2011 to 2012–2013. In both sexes, neither quit-ting activity nor adopting activity, relative to remaininginactive, was significantly associated with change in BMIor waist circumference. The consistently active boys hada significantly lower increase in waist circumferencecompared to the consistently inactive (− 2.32 (95% CI: −4.40, − 0.24)). The largest increase in BMI and FMI (andfor girls, also waist circumference) was observed amongthose quitting activity during follow-up, but this was notstatistically significantly different from change amongthose who remained inactive.In boys, changes in FMI were significantly different be-
tween activity groups (p < 0.01), with adopters (− 1.04(95% CI -1.76, − 0.32)) and the consistently active (−0.62 (95% CI: − 1.17, − 0.06)) gaining significantly lessFMI than the consistently inactive. The difference inchange in FMI comparing adopters and quitters was alsostatistically significant (− 1.06 (95% CI: − 1.83, − 0.28))(Table 4 in Appendix). In girls there was no statisticallysignificant difference in change of FMI between categor-ies of activity, with the exception of the consistently ac-tive which gained less than those quitting activity (− 0.53(95% CI: − 1.00, − 0.05)) (Table 4 in Appendix).In boys, there was no statistically significant difference
in change in LMI between the groups. In girls, change inLMI differed significantly between groups (p = 0.04).Girls who adopted activity between surveys experiencedgreater increase in LMI than the consistently inactive,but the difference was not of statistical significance (0.23(95% CI: − 0.02, 0.49)). Compared to those quitting ac-tivity, girls who were consistently active (0.22 (95% CI:0.03, 0.41)) or adopted physical activity (0.32 (95% CI:0.07, 0.58)) experienced a statistically significantly higherincrease in LMI (Table 4 in Appendix).
DiscussionIn this population-based longitudinal study of changes inbody composition in adolescents, there was, with the excep-tion of waist circumference in boys, no linear associationbetween self-reported leisure time physical activity and 2-year changes in indices of body composition. Change inphysical activity was associated with statistically significantdifferent changes in FMI. Boys who increased their physicalactivity during follow-up decreased their FMI compared togroups of boys quitting or remaining inactive, while consist-ently active girls experienced less increase than those
reducing activity. Change in physical activity in girls was as-sociated with statistically significant different changes inLMI. Girls who adopted physical activity increased theirLMI compared to girls quitting activity.Body weight, BMI and waist circumference increase dur-
ing natural growth in children and adolescents, and it istherefore challenging to separate healthy- from unhealthybody development. Although the direction and magnitudeof change will vary between individuals, a general increasein all the included measures of body composition is ex-pected during this phase of life given the bodily- and hor-monal changes that naturally takes place in adolescents[21]. Physical activity has positive health effects, but the as-sociations with changes in adiposity among adolescents iscomplicated and conflicting results have been reported[29]. We found weak relationships between the frequencyof leisure time physical activity at baseline and change inbody composition, suggesting that change in body compos-ition in this age group was mainly independent of level ofself-reported physical activity. Girls who were most activeat baseline had put on adipose tissue after 2 years (Table 2).A possible explanation could be that the increase occurredin girls who were active at baseline, but reduced their activ-ity during follow up. Stratified analyses in categories of girlswho were active more than 6 h per week at baseline did notsupport this explanation. Our findings are, however, in linewith those of Kettaneh et al., who found that girls in thehighest category of activity also experienced the largest in-crease in BMI, waist circumference, sum of skinfolds andpercent body fat [17]. LMI remained unaltered between FitFutures 1 and Fit Futures 2 (Table 1), suggesting that LMIchanges little in females during late adolescence.Lean mass is comprised of muscles and all bodily tissue
except fat mass and skeletal mass. Since muscles are par-ticularly important for oxidization of fat, they are also de-terminants of energy balance [30], and although physicalactivity increases muscle mass it is not the sole compo-nent of energy expenditure. Total energy expenditure iscomprised of resting metabolic rate, the thermic effect offood, bodily movement and, for children and adolescents;energy required for growth [31]. This means that althoughphysical activity declines, the effect on total energy ex-penditure is modest [17]. Adiposity is the result of a wholerange of lifestyle-, sociocultural- and genetic factors. It istherefore difficult to pinpoint the impact of one behavior,and it is possible that factors other than physical activity –and changes in these, exert more influence on change inbody composition [32].Physical activity levels change rapidly in adolescents [33],
thus challenging our ability to measure and capture theeffect of physical activity on body composition in adoles-cents. Thus, a baseline measurement may be only modestlyassociated with prior- or future physical activity [31]. Forinstance, O’Loughlin et al. reported effects of physical
Aars et al. BMC Sports Science, Medicine and Rehabilitation (2019) 11:37 Page 7 of 11
activity on changes in adiposity after 1 year, but not 2 yearsin girls, and only after 2 years in boys. The authors hypothe-sized that change in levels of physical activity over follow-up may have contributed to the differences [34].Boys adopting activity experienced a slight decrease in
FMI between surveys. This finding differs from the observedincrease in all other measures of body composition in bothsexes, and in all other sub-groups of activity change. Withthe exception of waist circumference and FMI in boys,change in all measures of body composition among the con-sistently active did not differ statistically significantly fromchanges in the consistently inactive. Physical activity has alimited potential to affect the difference between thesegroups [32]. In the consistently inactive, there is less roomfor unhealthy weight gain as a result of inactivity. Con-versely, among the consistently active there is less potentialfor preventing unhealthy weight gain through increased ac-tivity. These groups may be more susceptible to unhealthyweight gain through factors other than, or in addition to,physical activity. This can be considered as floor- and ceilingeffects of physical activity, and means that the potential foractivity related changes in adiposity is greatest among thosewho change their level of activity. The prevalence of physic-ally active adolescents declined in our study, and for bothsexes there was a rather consistent, albeit not statisticallysignificant, pattern of the highest increase in BMI, waist cir-cumference (not in boys) and FMI in those quitting activity.These findings indicate that those who reduce their level ofactivity over the course of adolescence are susceptible to un-healthy weight gain. This is of concern, since total activitydecreases by 7% annually in adolescents [33]. Boys whoadopted physical activity reduced their FMI between surveysand had the highest increase in LMI, indicating that the in-active may profit from increasing level of physical activity. Ingirls, we observed a statistically significant difference inchange of FMI between those who were consistently activeand those quitting activity, suggesting that there are negativeconsequences of reducing level of physical activity. However,girls naturally increase fat mass over the course of adoles-cence, whereas the same is true for lean mass in boys [17]. Itis therefore possible that an increase in FMI in girls occursregardless of activity level, whereas for boys, this may be pre-vented through activity. This can also explain why there wasno significant associations between change in activity andchange in BMI, as BMI does not distinguish between theoverweight inactive (with high FMI) and the overweight ac-tive (with high LMI) [35].Individuals may have, and report, high levels of physical
activity because they try to lose weight, or they may havelow (or high) body weight because of high activity. Theproblem of reverse causality applies also to longitudinalstudies, as overweight adolescents may avoid engaging inphysical activity on account of feeling inferior relative totheir active peers [31, 36]. Self-reported physical activity is
prone to information bias [26] and individuals tend to over-estimate the true amount of their physical activity. This canpotentially dilute an association with measures of bodycomposition [15]. Furthermore, self-reported physical activ-ity in leisure time does not capture the total level of activity,which can include active transportation to school andfriends, physical education and other types of leisure timeactivity. Objective measures of physical activity can producemore accurate estimates, but are not necessarily associatedwith changes in adiposity [37]. Finally, studies have sug-gested that the intensity of activity is more important thanthe total amount of activity for adiposity [38, 39]. In ourstudy, complete data on perceived physical activity intensitywere not available, but in complete case analyses the inclu-sion of self-reported intensity did not affect results.This study had several strengths, including the longitu-
dinal design, the high participation rate and the inclusion offour objective measures of body composition. A limitation isthe use of self-reported physical activity and the lack of fulladjustment for dietary habits, since a validated food-frequency questionnaires or similar was not included in thestudy. Another limitation is the lack of adjustment for pu-bertal development due to missing data. However, in boys,the vast majority (≈73%) of complete cases reported pubertalmaturation to be “underway”, meaning that the effect ofadjusting for PDS would likely be small. Inclusion of PDS incomplete case analyses did not indicate confounding by pu-bertal development. Another limitation is lack of adjustmentfor socioeconomic status. In the Fit Futures survey, a sub-stantial number of participants reported not knowing paren-tal level of education, thus limiting the possibilities foradjusting for this variable. However, the inclusion of studyspecialization in the analyses likely adjusts for some of thevariance in socioeconomic status in adolescents [40, 41].Lastly, in our study the length of follow-up was approxi-mately 2 years, but in a population undergoing naturalchanges in body composition, it may take more time beforephysical inactivity manifests in body composition. The 3rdsurvey of the Fit Futures Study is in planning and will enablefurther research on how physical activity in late adolescenceaffects changes in body composition in early adulthood.
ConclusionIn this longitudinal study of changes in objectively mea-sured body composition, we found that consistently inactiveboys increased significantly more in fat mass index com-pared to those adopting physical activity or remaining con-sistently active, and that girls adopting physical activityincreased their lean mass index significantly more thanthose who reduced physical activity. Adolescence is a timeof transformation and it is challenging to pinpoint the effectof one behavior on change in body composition. Physicalactivity should nevertheless be encouraged because of thehealth benefits other than the prevention of adiposity.
Aars et al. BMC Sports Science, Medicine and Rehabilitation (2019) 11:37 Page 8 of 11
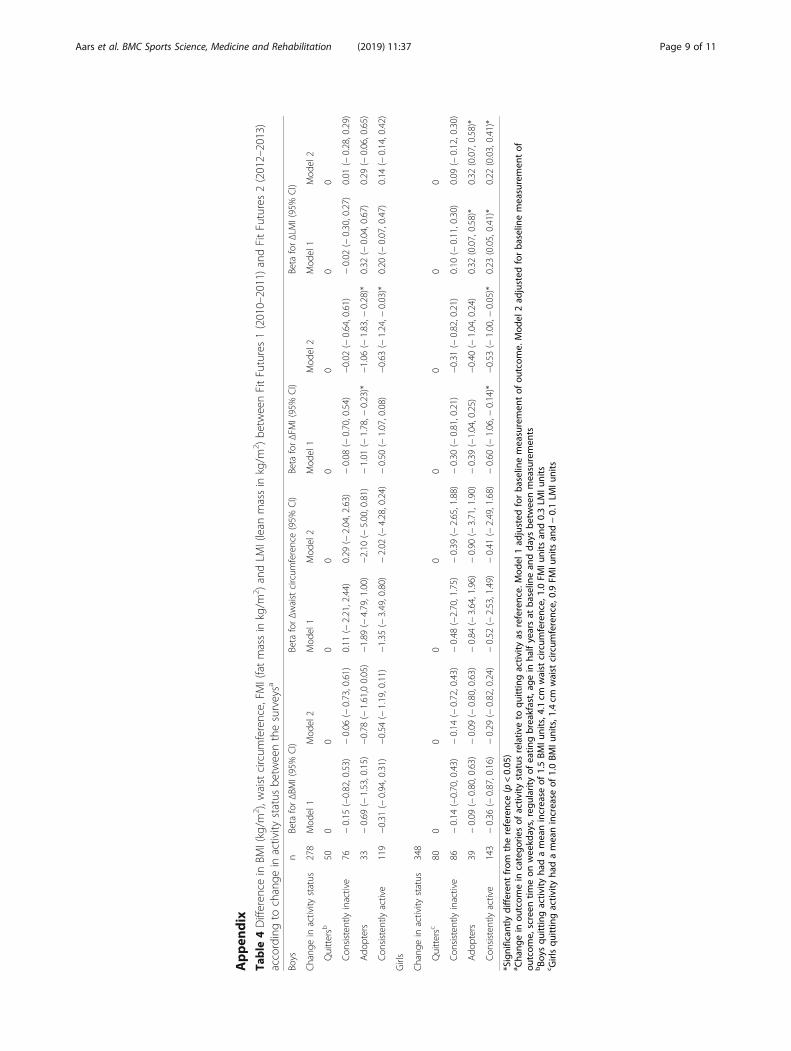
Appen
dix
Table
4Differen
cein
BMI(kg/m
2 ),w
aistcircum
ference,FM
I(fatmassin
kg/m
2 )andLM
I(lean
massin
kg/m
2 )be
tweenFitFutures1(2010–2011)andFitFutures2(2012–2013)
accordingto
change
inactivity
status
betw
eenthesurveysa
Boys
nBeta
forΔBM
I(95%
CI)
Beta
forΔwaistcircum
ference(95%
CI)
Beta
forΔFM
I(95%
CI)
Beta
forΔLM
I(95%
CI)
Chang
ein
activity
status
278
Mod
el1
Mod
el2
Mod
el1
Mod
el2
Mod
el1
Mod
el2
Mod
el1
Mod
el2
Quittersb
500
00
00
00
0
Con
sisten
tlyinactive
76−0.15
(−0.82,0.53)
−0.06
(−0.73,0.61)
0.11
(−2.21,2.44)
0.29
(−2.04,2.63)
−0.08
(−0.70,0.54)
−0.02
(−0.64,0.61)
−0.02
(−0.30,0.27)
0.01
(−0.28,0.29)
Ado
pters
33−0.69
(−1.53,0.15)
−0.78
(−1.61,00.05)
−1.89
(−4.79,1.00)
−2.10
(−5.00,0.81)
−1.01
(−1.78,−
0.23)*
−1.06
(−1.83,−
0.28)*
0.32
(−0.04,0.67)
0.29
(−0.06,0.65)
Con
sisten
tlyactive
119
−0.31
(−0.94,0.31)
−0.54
(−1.19,0.11)
−1.35
(−3.49,0.80)
−2.02
(−4.28,0.24)
−0.50
(−1.07,0.08)
−0.63
(−1.24,−
0.03)*
0.20
(−0.07,0.47)
0.14
(−0.14,0.42)
Girls
Chang
ein
activity
status
348
Quittersc
800
00
00
00
0
Con
sisten
tlyinactive
86−0.14
(−0.70,0.43)
−0.14
(−0.72,0.43)
−0.48
(−2.70,1.75)
−0.39
(−2.65,1.88)
−0.30
(−0.81,0.21)
−0.31
(−0.82,0.21)
0.10
(−0.11,0.30)
0.09
(−0.12,0.30)
Ado
pters
39−0.09
(−0.80,0.63)
−0.09
(−0.80,0.63)
−0.84
(−3.64,1.96)
−0.90
(−3.71,1.90)
−0.39
(−1.04,0.25)
−0.40
(−1.04,0.24)
0.32
(0.07,0.58)*
0.32
(0.07,0.58)*
Con
sisten
tlyactive
143
−0.36
(−0.87,0.16)
−0.29
(−0.82,0.24)
−0.52
(−2.53,1.49)
−0.41
(−2.49,1.68)
−0.60
(−1.06,−
0.14)*
−0.53
(−1.00,−
0.05)*
0.23
(0.05,0.41)*
0.22
(0.03,0.41)*
*Significan
tlydifferen
tfrom
thereference(p
<0.05
)a Cha
ngein
outcom
ein
catego
riesof
activ
itystatus
relativ
eto
quittingactiv
ityas
reference.
Mod
el1ad
justed
forba
selin
emeasuremen
tof
outcom
e.Mod
el2ad
justed
forba
selin
emeasuremen
tof
outcom
e,screen
timeon
weekd
ays,regu
larityof
eatin
gbreakfast,ag
ein
halfyearsat
baselin
ean
dda
ysbe
tweenmeasuremen
tsbBo
ysqu
ittingactiv
ityha
dameanincrease
of1.5BM
Iunits,4
.1cm
waist
circum
ference,
1.0FM
Iunits
and0.3LM
Iunits
c Girlsqu
ittingactiv
ityha
dameanincrease
of1.0BM
Iunits,1
.4cm
waist
circum
ference,
0.9FM
Iunits
and−0.1LM
Iunits
Aars et al. BMC Sports Science, Medicine and Rehabilitation (2019) 11:37 Page 9 of 11
AbbreviationsBMI: Body Mass Index; FMI: Fat Mass Index; LMI: Lean Mass Index;PDS: Pubertal Development Scale
AcknowledgementsThe authors thank the participants in the study, as well as the staff at theClinical Research Unit at the University Hospital of North Norway for datacollection and clinical measurements. We also thank the Fit Futures SteeringCommittee in both studies.
Authors’ contributionsNAA wrote the draft of the manuscript, which was revised and edited byBKJ, BM, NE and SG several times during the process. BKJ contributed to thestatistical analyses, and BM specifically contributed to the discussion ofphysical activity. NE was the principal investigator in Fit Futures 2 andcontributed significantly to the acquisition of data. SG formulated theresearch question and conceived the study. All authors have substantiallycontributed to the study, and have read and approved the final manuscript.
FundingThis particular manuscript has not received any specific funding, while theFit Futures surveys were funded by, inter alia, the Northern Norway RegionalHealth Authority and UiT – The Arctic University of Norway, Tromsø, and theNational Public Health Institute, Oslo.
Availability of data and materialsThe data that support the findings of this study are available from UiT – TheArctic University of Norway, but restrictions apply to the availability of thesedata, which were used under license for the current study, and so are notpublicly available. Data are, however, available from the authors uponreasonable request and with permission of UiT – The Arctic University ofNorway.
Ethics approval and consent to participateThis study was approved by The Regional Committee of Medical and HealthResearch Ethics in northern Norway (REK North), as part of the Tromsø StudyFit Futures cohort. Written consent was obtained from all participants aged≥16 years. Those under 16 years of age brought signed, written consentfrom their parent or legal guardian.
Consent for publicationNot applicable
Competing interestsThe authors declare that they have no competing interests.
Author details1Department of Community Medicine, UiT The Arctic University of Norway,9037 Tromsø, Norway. 2Nordland Hospital, Bodø, Norway. 3Centre for SamiHealth Research, Department of Community Medicine, UiT The ArcticUniversity of Norway, Tromsø, Norway. 4School of Sport Sciences, UiT TheArctic University of Norway, Tromsø, Norway. 5Department of Health andCare Sciences, UiT The Arctic University of Norway, Tromsø, Norway.
Received: 15 March 2019 Accepted: 14 November 2019
References1. Engeland A, Bjørge T, Tverdal A, Søgaard AJ. Obesity in adolescence and
adulthood and the risk of adult mortality. Epidemiology. 2004;15:79–85.2. World Health Organization. Obesity and Overweight Fact Sheet. 2018.
http://www.who.int/news-room/fact-sheets/detail/obesity-and-overweight.Accessed Dec 2018.
3. Evensen E, Emaus N, Kokkvoll A, Wilsgaard T, Furberg AS, Skeie G. Therelation between birthweight, childhood body mass index, andoverweight and obesity in late adolescence: a longitudinal cohort studyfrom Norway, the Tromsø study. BMJ Open. 2017. https://doi.org/10.1136/bmjopen-2016-015576.
4. NCD Risk Factor Collaboration (NCD-RisC). Worldwide trends in body-massindex, underweight, overweight, and obesity from 1975 to 2016: a pooledanalysis of 2416 population-based measurement studies in 128.9 million
children, adolescents, and adults. Lancet. 2017. https://doi.org/10.1016/S0140-6736(17)32129-3.
5. Jacobsen BK, Aars NA. Changes in body mass index and the prevalence ofobesity during 1994-2008: repeated cross-sectional surveys and longitudinalanalyses. BMJ Open. 2015. https://doi.org/10.1136/bmjopen-2015-007859.
6. Midthjell K, Lee CM, Langhammer A, Krokstad S, Holmen TL, Hveem K, et al.Trends in overweight and obesity over 22 years in a large adult population:the HUNT study. Clin Obes. 2013;3:12–20.
7. Norwegian Institute of Public Health. Public Health Report: Health Status inNorway 2018. Oslo: Norwegian Institute of Public Health; 2018.
8. Boreham C, Robson PJ, Gallagher AM, Cran GW, Savage JM, Murray LJ.Tracking of physical activity, fitness, body composition and diet fromadolescence to young adulthood: the young hearts project. Int J BehavNutr Phys Act. 2004;1:14.
9. Deforche B, Van Dyck D, Deliens T, De Bourdeaudhuij I. Changes in weight,physical activity, sedentary behaviour and dietary intake during thetransition to higher education: a prospective study. Int J Behav Nutr PhysAct. 2015;12:16.
10. Reichert FF, Baptista Menezes AM, Wells JC, Carvalho Dumith S, Hallal PC.Physical activity as a predictor of adolescent body fatness: a systematicreview. Sports Med. 2009;39:279–94.
11. Goisis A, Sacker A, Kelly Y. Why are poorer children at higher risk of obesityand overweight? A UK cohort study. Eur J Pub Health. 2015. https://doi.org/10.1093/eurpub/ckv219.
12. Croezen S, Visscher TL, Ter Bogt NC, Veling ML, Haveman-Nies A. Skippingbreakfast, alcohol consumption and physical inactivity as risk factors foroverweight and obesity in adolescents: results of the E-MOVO project. Eur JClin Nutr. 2009;63:405–12.
13. Silventoinen K, Jelenkovic A, Sund R, Hur YM, Yokoyama Y, Honda C, et al.Genetic and environmental effects on body mass index from infancy tothe onset of adulthood: an individual-based pooled analysis of 45 twincohorts participating in the COllaborative project of development ofanthropometrical measures in twins (CODATwins) study. Am J Clin Nutr.2016;104:371–9.
14. Janssen I, Katzmarzyk PT, Boyce WF, Vereecken C, Mulvihill C, Roberts C,et al. Comparison of overweight and obesity prevalence in school-agedyouth from 34 countries and their relationships with physical activity anddietary patterns. Obes Rev. 2005;6:123–32.
15. Belcher BR, Moser RP, Dodd KW, Atienza AA, Ballard-Barbash R, Berrigan D.Self-reported versus accelerometer-measured physical activity andbiomarkers among NHANES youth. J Phys Act Health. 2015;12:708–16.
16. Reichert FF, Wells JC, Ekelund U, Menezes AM, Victora CG, Hallal PC.Prospective associations between physical activity level and bodycomposition in adolescence: 1993 Pelotas (Brazil) birth cohort. J Phys ActHealth. 2015;12:834–9.
17. Kettaneh A, Oppert JM, Heude B, Deschamps V, Borys JM, Lommez A, et al.Changes in physical activity explain paradoxical relationship betweenbaseline physical activity and adiposity changes in adolescent girls: the FLVSII study. Int J Obes. 2005;29:586–93.
18. Taylor RW, Jones IE, Williams SM, Goulding A. Evaluation of waistcircumference, waist-to-hip ratio, and the conicity index as screening toolsfor high trunk fat mass, as measured by dual-energy X-ray absorptiometry,in children aged 3-19 y. Am J Clin Nutr. 2000;72:490–5.
19. Kakinami L, Henderson M, Chiolero A, Cole TJ, Paradis G. Identifying thebest body mass index metric to assess adiposity change in children. ArchDis Child. 2014;99:1020–4.
20. Ramires VV, Dumith SC, Wehrmeister FC, Hallal PC, Menezes AM, GoncalvesH. Physical activity throughout adolescence and body composition at 18years: 1993 Pelotas (Brazil) birth cohort study. Int J Behav Nutr Phys Act.2016;13:105.
21. Baxter-Jones AD, Eisenmann JC, Mirwald RL, Faulkner RA, Bailey DA. Theinfluence of physical activity on lean mass accrual during adolescence: alongitudinal analysis. J Appl Physiol. 2008;105:734–41.
22. Hallal PC, Reichert FF, Ekelund U, Dumith SC, Menezes AM, Victora CG, et al.Bidirectional cross-sectional and prospective associations between physicalactivity and body composition in adolescence: birth cohort study. J SportsSci. 2012;30:183–90.
23. Winther A, Ahmed LA, Furberg AS, Grimnes G, Jorde R, Nilsen OA, et al.Leisure time computer use and adolescent bone health--findings from theTromsø study, fit futures: a cross-sectional study. BMJ Open. 2015. https://doi.org/10.1136/bmjopen-2014-006665.
Aars et al. BMC Sports Science, Medicine and Rehabilitation (2019) 11:37 Page 10 of 11
24. Cole TJ, Bellizzi MC, Flegal KM, Dietz WH. Establishing a standard definitionfor child overweight and obesity worldwide: international survey. BMJ. 2000;320:1240–3.
25. Cole TJ, Flegal KM, Nicholls D, Jackson AA. Body mass index cut offs todefine thinness in children and adolescents: international survey. BMJ. 2007;335:194.
26. Booth ML, Okely AD, Chey T, Bauman A. The reliability and validity of thephysical activity questions in the WHO health behaviour in schoolchildren(HBSC) survey: a population study. Br J Sports Med. 2001;35:263–7.
27. Rangul V, Holmen TL, Bauman A, Bratberg GH, Kurtze N, Midthjell K. Factorspredicting changes in physical activity through adolescence: the young-HUNT study. J Adolesc Health. 2011;48:616–24.
28. Hermansen R, Broderstad AR, Jacobsen BK, Mahonen M, Wilsgaard T,Morseth B. The impact of changes in leisure time physical activity onchanges in cardiovascular risk factors: results from the Finnmark 3 study andSAMINOR 1, 1987-2003. Int J Circumpolar Health. 2018;77:1459145.
29. Ekelund U, Hildebrand M, Collings PJ. Physical activity, sedentary time andadiposity during the first two decades of life. Proc Nutr Soc. 2014;73:319–29.
30. Wolfe RR. The underappreciated role of muscle in health and disease. Am JClin Nutr. 2006;84:475–82.
31. Must A, Tybor DJ. Physical activity and sedentary behavior: a review oflongitudinal studies of weight and adiposity in youth. Int J Obes. 2005;29(Suppl 2):S84–96.
32. Collings PJ, Wijndaele K, Corder K, Westgate K, Ridgway CL, Sharp SJ, et al.Objectively measured physical activity and longitudinal changes inadolescent body fatness: an observational cohort study. Pediatr Obes. 2016;11:107–14.
33. Dumith SC, Gigante DP, Domingues MR, Kohl HW 3rd. Physical activitychange during adolescence: a systematic review and a pooled analysis. Int JEpidemiol. 2011;40:685–98.
34. O'Loughlin J, Gray-Donald K, Paradis G, Meshefedjian G. One- and two-yearpredictors of excess weight gain among elementary schoolchildren inmultiethnic, low-income, inner-city neighborhoods. Am J Epidemiol. 2000;152:739–46.
35. Basterfield L, Reilly JK, Pearce MS, Parkinson KN, Adamson AJ, Reilly JJ, et al.Longitudinal associations between sports participation, body compositionand physical activity from childhood to adolescence. J Sci Med Sport. 2015;18:178–82.
36. Laxer RE, Cooke M, Dubin JA, Brownson RC, Chaurasia A, Leatherdale ST.Behavioural patterns only predict concurrent BMI status and not BMItrajectories in a sample of youth in Ontario. PLoS One. 2018;13:e0190405.
37. Wilks DC, Besson H, Lindroos AK, Ekelund U. Objectively measured physicalactivity and obesity prevention in children, adolescents and adults: asystematic review of prospective studies. Obes Rev. 2011;12:e119–29.
38. van Sluijs EM, Sharp SJ, Ambrosini GL, Cassidy A, Griffin SJ, Ekelund U.The independent prospective associations of activity intensity anddietary energy density with adiposity in young adolescents. Br J Nutr.2016;115:921–9.
39. Deere K, Sayers A, Davey Smith G, Rittweger J, Tobias JH. High impactactivity is related to lean but not fat mass: findings from a population-basedstudy in adolescents. Int J Epidemiol. 2012;41:1124–31.
40. Friestad C, Klepp KI. Socioeconomic status and health behaviour patternsthrough adolescence: results from a prospective cohort study in Norway.Eur J Pub Health. 2006;16:41–7.
41. Hagquist CE. Health inequalities among adolescents: the impact of academicorientation and parents' education. Eur J Pub Health. 2007;17:21–6.
Publisher’s NoteSpringer Nature remains neutral with regard to jurisdictional claims inpublished maps and institutional affiliations.
Aars et al. BMC Sports Science, Medicine and Rehabilitation (2019) 11:37 Page 11 of 11
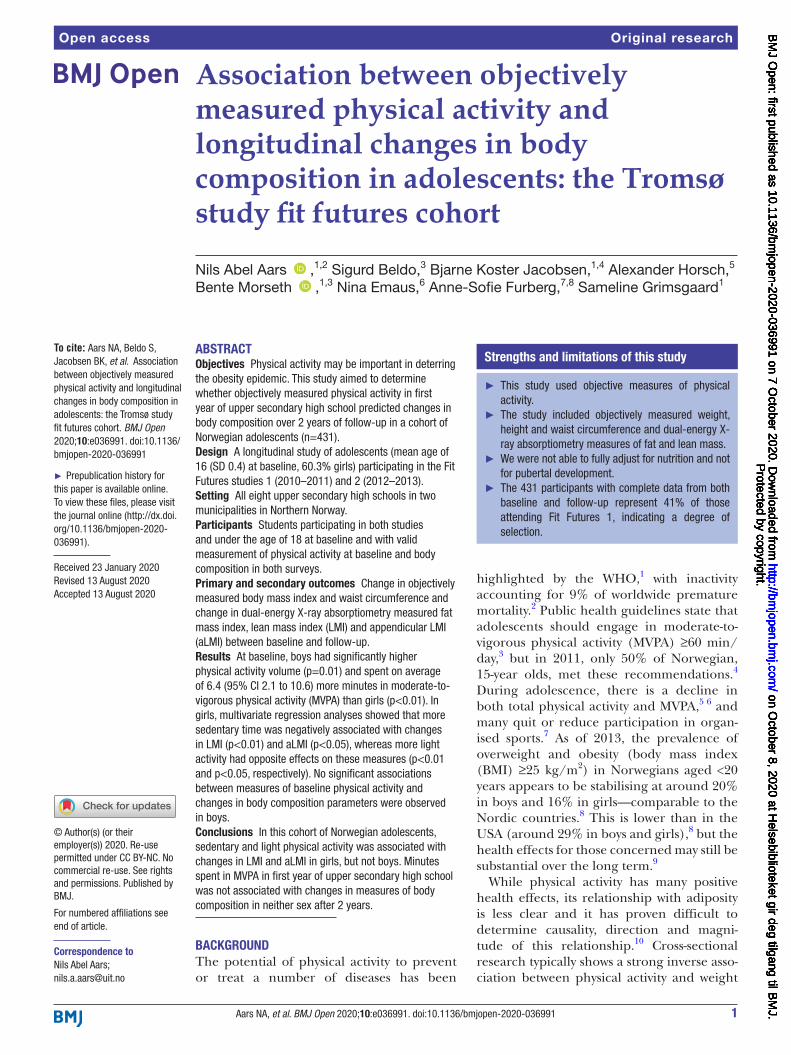
1Aars NA, et al. BMJ Open 2020;10:e036991. doi:10.1136/bmjopen-2020-036991
Open access
Association between objectively measured physical activity and longitudinal changes in body composition in adolescents: the Tromsø study fit futures cohort
Nils Abel Aars ,1,2 Sigurd Beldo,3 Bjarne Koster Jacobsen,1,4 Alexander Horsch,5 Bente Morseth ,1,3 Nina Emaus,6 Anne- Sofie Furberg,7,8 Sameline Grimsgaard1
To cite: Aars NA, Beldo S, Jacobsen BK, et al. Association between objectively measured physical activity and longitudinal changes in body composition in adolescents: the Tromsø study fit futures cohort. BMJ Open 2020;10:e036991. doi:10.1136/bmjopen-2020-036991
► Prepublication history for this paper is available online. To view these files, please visit the journal online (http:// dx. doi. org/ 10. 1136/ bmjopen- 2020- 036991).
Received 23 January 2020Revised 13 August 2020Accepted 13 August 2020
For numbered affiliations see end of article.
Correspondence toNils Abel Aars; nils. a. aars@ uit. no
Original research
© Author(s) (or their employer(s)) 2020. Re- use permitted under CC BY- NC. No commercial re- use. See rights and permissions. Published by BMJ.
ABSTRACTObjectives Physical activity may be important in deterring the obesity epidemic. This study aimed to determine whether objectively measured physical activity in first year of upper secondary high school predicted changes in body composition over 2 years of follow- up in a cohort of Norwegian adolescents (n=431).Design A longitudinal study of adolescents (mean age of 16 (SD 0.4) at baseline, 60.3% girls) participating in the Fit Futures studies 1 (2010–2011) and 2 (2012–2013).Setting All eight upper secondary high schools in two municipalities in Northern Norway.Participants Students participating in both studies and under the age of 18 at baseline and with valid measurement of physical activity at baseline and body composition in both surveys.Primary and secondary outcomes Change in objectively measured body mass index and waist circumference and change in dual- energy X- ray absorptiometry measured fat mass index, lean mass index (LMI) and appendicular LMI (aLMI) between baseline and follow- up.Results At baseline, boys had significantly higher physical activity volume (p=0.01) and spent on average of 6.4 (95% CI 2.1 to 10.6) more minutes in moderate- to- vigorous physical activity (MVPA) than girls (p<0.01). In girls, multivariate regression analyses showed that more sedentary time was negatively associated with changes in LMI (p<0.01) and aLMI (p<0.05), whereas more light activity had opposite effects on these measures (p<0.01 and p<0.05, respectively). No significant associations between measures of baseline physical activity and changes in body composition parameters were observed in boys.Conclusions In this cohort of Norwegian adolescents, sedentary and light physical activity was associated with changes in LMI and aLMI in girls, but not boys. Minutes spent in MVPA in first year of upper secondary high school was not associated with changes in measures of body composition in neither sex after 2 years.
BACKGROUNDThe potential of physical activity to prevent or treat a number of diseases has been
highlighted by the WHO,1 with inactivity accounting for 9% of worldwide premature mortality.2 Public health guidelines state that adolescents should engage in moderate- to- vigorous physical activity (MVPA) ≥60 min/day,3 but in 2011, only 50% of Norwegian, 15- year olds, met these recommendations.4 During adolescence, there is a decline in both total physical activity and MVPA,5 6 and many quit or reduce participation in organ-ised sports.7 As of 2013, the prevalence of overweight and obesity (body mass index (BMI) ≥25 kg/m2) in Norwegians aged <20 years appears to be stabilising at around 20% in boys and 16% in girls—comparable to the Nordic countries.8 This is lower than in the USA (around 29% in boys and girls),8 but the health effects for those concerned may still be substantial over the long term.9
While physical activity has many positive health effects, its relationship with adiposity is less clear and it has proven difficult to determine causality, direction and magni-tude of this relationship.10 Cross- sectional research typically shows a strong inverse asso-ciation between physical activity and weight
Strengths and limitations of this study
► This study used objective measures of physical activity.
► The study included objectively measured weight, height and waist circumference and dual- energy X- ray absorptiometry measures of fat and lean mass.
► We were not able to fully adjust for nutrition and not for pubertal development.
► The 431 participants with complete data from both baseline and follow- up represent 41% of those attending Fit Futures 1, indicating a degree of selection.
Protected by copyright.
on October 8, 2020 at H
elsebiblioteket gir deg tilgang til BM
J.http://bm
jopen.bmj.com
/B
MJ O
pen: first published as 10.1136/bmjopen-2020-036991 on 7 O
ctober 2020. Dow
nloaded from
Protected by copyright.
on October 8, 2020 at H
elsebiblioteket gir deg tilgang til BM
J.http://bm
jopen.bmj.com
/B
MJ O
pen: first published as 10.1136/bmjopen-2020-036991 on 7 O
ctober 2020. Dow
nloaded from
Protected by copyright.
on October 8, 2020 at H
elsebiblioteket gir deg tilgang til BM
J.http://bm
jopen.bmj.com
/B
MJ O
pen: first published as 10.1136/bmjopen-2020-036991 on 7 O
ctober 2020. Dow
nloaded from
Protected by copyright.
on October 8, 2020 at H
elsebiblioteket gir deg tilgang til BM
J.http://bm
jopen.bmj.com
/B
MJ O
pen: first published as 10.1136/bmjopen-2020-036991 on 7 O
ctober 2020. Dow
nloaded from
Protected by copyright.
on October 8, 2020 at H
elsebiblioteket gir deg tilgang til BM
J.http://bm
jopen.bmj.com
/B
MJ O
pen: first published as 10.1136/bmjopen-2020-036991 on 7 O
ctober 2020. Dow
nloaded from
Protected by copyright.
on October 8, 2020 at H
elsebiblioteket gir deg tilgang til BM
J.http://bm
jopen.bmj.com
/B
MJ O
pen: first published as 10.1136/bmjopen-2020-036991 on 7 O
ctober 2020. Dow
nloaded from
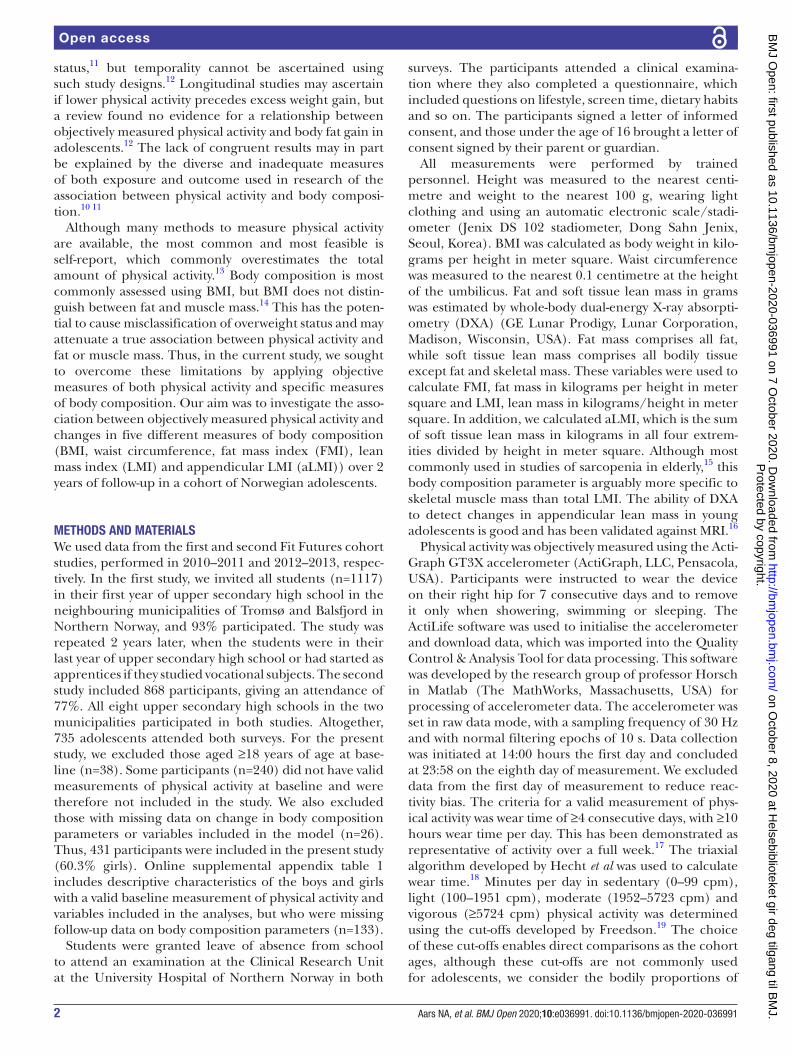
2 Aars NA, et al. BMJ Open 2020;10:e036991. doi:10.1136/bmjopen-2020-036991
Open access
status,11 but temporality cannot be ascertained using such study designs.12 Longitudinal studies may ascertain if lower physical activity precedes excess weight gain, but a review found no evidence for a relationship between objectively measured physical activity and body fat gain in adolescents.12 The lack of congruent results may in part be explained by the diverse and inadequate measures of both exposure and outcome used in research of the association between physical activity and body composi-tion.10 11
Although many methods to measure physical activity are available, the most common and most feasible is self- report, which commonly overestimates the total amount of physical activity.13 Body composition is most commonly assessed using BMI, but BMI does not distin-guish between fat and muscle mass.14 This has the poten-tial to cause misclassification of overweight status and may attenuate a true association between physical activity and fat or muscle mass. Thus, in the current study, we sought to overcome these limitations by applying objective measures of both physical activity and specific measures of body composition. Our aim was to investigate the asso-ciation between objectively measured physical activity and changes in five different measures of body composition (BMI, waist circumference, fat mass index (FMI), lean mass index (LMI) and appendicular LMI (aLMI)) over 2 years of follow- up in a cohort of Norwegian adolescents.
METHODS AND MATERIALSWe used data from the first and second Fit Futures cohort studies, performed in 2010–2011 and 2012–2013, respec-tively. In the first study, we invited all students (n=1117) in their first year of upper secondary high school in the neighbouring municipalities of Tromsø and Balsfjord in Northern Norway, and 93% participated. The study was repeated 2 years later, when the students were in their last year of upper secondary high school or had started as apprentices if they studied vocational subjects. The second study included 868 participants, giving an attendance of 77%. All eight upper secondary high schools in the two municipalities participated in both studies. Altogether, 735 adolescents attended both surveys. For the present study, we excluded those aged ≥18 years of age at base-line (n=38). Some participants (n=240) did not have valid measurements of physical activity at baseline and were therefore not included in the study. We also excluded those with missing data on change in body composition parameters or variables included in the model (n=26). Thus, 431 participants were included in the present study (60.3% girls). Online supplemental appendix table 1 includes descriptive characteristics of the boys and girls with a valid baseline measurement of physical activity and variables included in the analyses, but who were missing follow- up data on body composition parameters (n=133).
Students were granted leave of absence from school to attend an examination at the Clinical Research Unit at the University Hospital of Northern Norway in both
surveys. The participants attended a clinical examina-tion where they also completed a questionnaire, which included questions on lifestyle, screen time, dietary habits and so on. The participants signed a letter of informed consent, and those under the age of 16 brought a letter of consent signed by their parent or guardian.
All measurements were performed by trained personnel. Height was measured to the nearest centi-metre and weight to the nearest 100 g, wearing light clothing and using an automatic electronic scale/stadi-ometer (Jenix DS 102 stadiometer, Dong Sahn Jenix, Seoul, Korea). BMI was calculated as body weight in kilo-grams per height in meter square. Waist circumference was measured to the nearest 0.1 centimetre at the height of the umbilicus. Fat and soft tissue lean mass in grams was estimated by whole- body dual- energy X- ray absorpti-ometry (DXA) (GE Lunar Prodigy, Lunar Corporation, Madison, Wisconsin, USA). Fat mass comprises all fat, while soft tissue lean mass comprises all bodily tissue except fat and skeletal mass. These variables were used to calculate FMI, fat mass in kilograms per height in meter square and LMI, lean mass in kilograms/height in meter square. In addition, we calculated aLMI, which is the sum of soft tissue lean mass in kilograms in all four extrem-ities divided by height in meter square. Although most commonly used in studies of sarcopenia in elderly,15 this body composition parameter is arguably more specific to skeletal muscle mass than total LMI. The ability of DXA to detect changes in appendicular lean mass in young adolescents is good and has been validated against MRI.16
Physical activity was objectively measured using the Acti-Graph GT3X accelerometer (ActiGraph, LLC, Pensacola, USA). Participants were instructed to wear the device on their right hip for 7 consecutive days and to remove it only when showering, swimming or sleeping. The ActiLife software was used to initialise the accelerometer and download data, which was imported into the Quality Control & Analysis Tool for data processing. This software was developed by the research group of professor Horsch in Matlab (The MathWorks, Massachusetts, USA) for processing of accelerometer data. The accelerometer was set in raw data mode, with a sampling frequency of 30 Hz and with normal filtering epochs of 10 s. Data collection was initiated at 14:00 hours the first day and concluded at 23:58 on the eighth day of measurement. We excluded data from the first day of measurement to reduce reac-tivity bias. The criteria for a valid measurement of phys-ical activity was wear time of ≥4 consecutive days, with ≥10 hours wear time per day. This has been demonstrated as representative of activity over a full week.17 The triaxial algorithm developed by Hecht et al was used to calculate wear time.18 Minutes per day in sedentary (0–99 cpm), light (100–1951 cpm), moderate (1952–5723 cpm) and vigorous (≥5724 cpm) physical activity was determined using the cut- offs developed by Freedson.19 The choice of these cut- offs enables direct comparisons as the cohort ages, although these cut- offs are not commonly used for adolescents, we consider the bodily proportions of
Protected by copyright.
on October 8, 2020 at H
elsebiblioteket gir deg tilgang til BM
J.http://bm
jopen.bmj.com
/B
MJ O
pen: first published as 10.1136/bmjopen-2020-036991 on 7 O
ctober 2020. Dow
nloaded from

3Aars NA, et al. BMJ Open 2020;10:e036991. doi:10.1136/bmjopen-2020-036991
Open access
an adolescent to resemble that of an adult in terms of measured acceleration. The device collected data in both uniaxial and triaxial modes, but in the present study, only the uniaxial data had been processed and therefore available. Studies have shown that uniaxial data recorded from the GT3X correlate well with uniaxial data recorded from previous ActiGraph models.20 Data on objectively measured physical activity were only available from Fit Futures 1.
Baseline characteristics were presented as means with SD or prevalence in percentages with number of subjects (n). Sex- specific difference in body composition between baseline and follow- up was tested using a paired samples t- test. The difference in physical activity between sexes was tested using a two- sample t- test, while sex differences in categories of minutes spent in MVPA was tested using a χ2 test. Difference in linear trend across categories of minutes spent in MVPA was tested using STATA’s non- parametric test for trend, developed by Cuzick.21 Linear regression was used to determine the effect of baseline physical activity on change in body composition, that is, the change in BMI, waist circumference, FMI, LMI and aLMI from the first to the second Fit Futures Study.
We used three different predictors of change in body composition, performing three sets of analyses, with first; minutes per day spent in sedentary activity second; minutes per day spent in light activity and third; minutes per day spent in MVPA . We divided the contin-uous variables sedentary and light activity by 30 and the continuous variable MVPA by 15 before inclusion in the models, thus presenting the beta coefficient for change in body composition parameter per 30 minof sedentary or light activity, or per 15 min of MVPA, with 95% CIs and a p value. In model 1, we adjusted for the baseline measurement of the body composition parameter. In the adjusted models (model 2), we also included time between measurements (mean (SD): 730 (74) days) and baseline values of device wear time, age in half years and questionnaire data on screen time on weekdays (how many hours per weekday the students spent in front of a computer or television—answers ranged from none to more than 10 hours per weekday) and regularity of eating breakfast as an indicator of healthy meal patterns (answers ranging from rarely/never to everyday). In the analyses of sedentary and light activity, we also adjusted for minutes spent in MVPA (model 3). In a subset of analyses (online supplemental appendix tables 2–4), we repeated the analyses performed in tables 2 and 3, adjusting also for self- reported pubertal status measured by either pubertal development scale (boys) or age at menarche (girls). These analyses included the 143 boys and 256 girls with valid data on pubertal status. In all the analyses, a p value of <0.05 was considered statistically significant.
All analyses were performed sex specific as decided a priori, using STATA V.14 (StataCorp. 2015. Stata Statis-tical Software: Release 14. College Station, Texas, USA: StataCorp LP.).
Patient and public involvementParticipating schools were consulted and included in the design phase of the study.
RESULTSTable 1 displays the participants’ body composition measurements at baseline and follow- up as well as physical activity measurements at baseline. Boys had a statistically significant increase in all measures of body composition. Girls had a statistically significant increase in body weight, BMI, fat mass in kilogram and FMI, but not in LMI and appendicular lean mass. Boys were statistically signifi-cantly more physically active than girls in some aspects, with higher mean counts per minute (p=0.01) and more minutes in MVPA (p<0.01). Time spent in sedentary or light intensities did not differ significantly between sexes. Twenty- seven per cent of boys and 17% of girls complied with the recommendations of 60 min/day MVPA.
Table 2 displays the association between minutes spent in sedentary activity at baseline and changes in body composition between baseline and follow- up. There was no association between sedentary activity and changes in BMI, waist circumference and FMI in neither boys nor girls. In girls, but not in boys, more minutes spent in sedentary activity at baseline was associated with lower LMI (p<0.01) and aLMI (p=0.02). Adjustment for covari-ates and MVPA slightly attenuated the association with aLMI (p=0.05).
Table 3 displays the association between minutes spent in light activity at baseline and changes in body composi-tion between baseline and follow- up. There was no associ-ation between the exposure and either body composition parameter in boys. In girls, there was some evidence to suggest an association with change in waist circumference (p=0.05), but the association was attenuated after adjust-ments (p=0.17). More minutes spent in light physical activity was associated with higher LMI (p<0.01 (models 2 and 3)) and aLMI (p=0.04 (model 2) and 0.05 (model 3)).
Table 4 displays the association between minutes in MVPA at baseline and changes in body composition between baseline and follow- up. There was no associa-tion between time spent in MVPA and changes in either measure of body composition for either sex.
Online supplemental appendix table 1 shows the descriptive characteristics of the participants with valid baseline measurements of physical activity and adjust-ment variables, but who were lost to follow- up. Both boys and girls lost to follow- up had significantly higher mean BMI, waist circumference, fat mass and FMI at baseline as well as significantly less minutes per day spent in light- to- vigorous and moderate- to- vigorous (girls only) phys-ical activities. In online supplemental appendix tables 2–4, we present subanalyses restricted to those with complete data on pubertal development, confirming the results displayed in tables 2–4 also after adjustments for pubertal development. Overall, adjustment for pubertal
Protected by copyright.
on October 8, 2020 at H
elsebiblioteket gir deg tilgang til BM
J.http://bm
jopen.bmj.com
/B
MJ O
pen: first published as 10.1136/bmjopen-2020-036991 on 7 O
ctober 2020. Dow
nloaded from
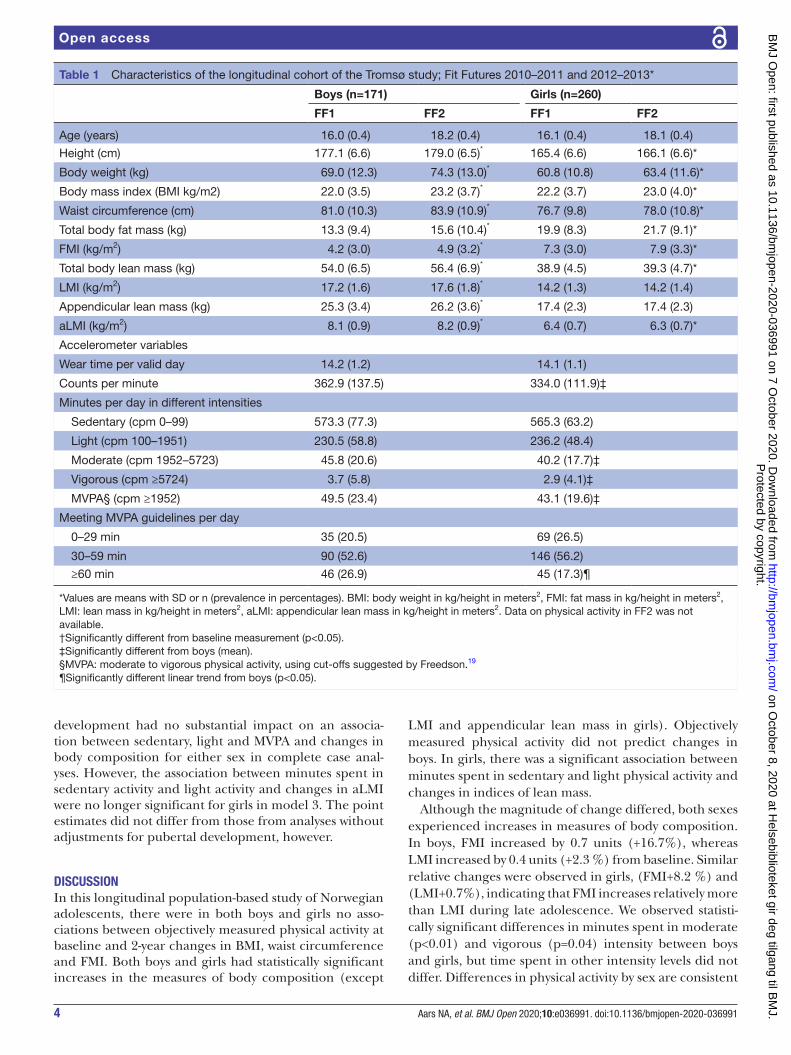
4 Aars NA, et al. BMJ Open 2020;10:e036991. doi:10.1136/bmjopen-2020-036991
Open access
development had no substantial impact on an associa-tion between sedentary, light and MVPA and changes in body composition for either sex in complete case anal-yses. However, the association between minutes spent in sedentary activity and light activity and changes in aLMI were no longer significant for girls in model 3. The point estimates did not differ from those from analyses without adjustments for pubertal development, however.
DISCUSSIONIn this longitudinal population- based study of Norwegian adolescents, there were in both boys and girls no asso-ciations between objectively measured physical activity at baseline and 2- year changes in BMI, waist circumference and FMI. Both boys and girls had statistically significant increases in the measures of body composition (except
LMI and appendicular lean mass in girls). Objectively measured physical activity did not predict changes in boys. In girls, there was a significant association between minutes spent in sedentary and light physical activity and changes in indices of lean mass.
Although the magnitude of change differed, both sexes experienced increases in measures of body composition. In boys, FMI increased by 0.7 units (+16.7%), whereas LMI increased by 0.4 units (+2.3 %) from baseline. Similar relative changes were observed in girls, (FMI+8.2 %) and (LMI+0.7%), indicating that FMI increases relatively more than LMI during late adolescence. We observed statisti-cally significant differences in minutes spent in moderate (p<0.01) and vigorous (p=0.04) intensity between boys and girls, but time spent in other intensity levels did not differ. Differences in physical activity by sex are consistent
Table 1 Characteristics of the longitudinal cohort of the Tromsø study; Fit Futures 2010–2011 and 2012–2013*
Boys (n=171) Girls (n=260)
FF1 FF2 FF1 FF2
Age (years) 16.0 (0.4) 18.2 (0.4) 16.1 (0.4) 18.1 (0.4)
Height (cm) 177.1 (6.6) 179.0 (6.5)* 165.4 (6.6) 166.1 (6.6)*
Body weight (kg) 69.0 (12.3) 74.3 (13.0)* 60.8 (10.8) 63.4 (11.6)*
Body mass index (BMI kg/m2) 22.0 (3.5) 23.2 (3.7)* 22.2 (3.7) 23.0 (4.0)*
Waist circumference (cm) 81.0 (10.3) 83.9 (10.9)* 76.7 (9.8) 78.0 (10.8)*
Total body fat mass (kg) 13.3 (9.4) 15.6 (10.4)* 19.9 (8.3) 21.7 (9.1)*
FMI (kg/m2) 4.2 (3.0) 4.9 (3.2)* 7.3 (3.0) 7.9 (3.3)*
Total body lean mass (kg) 54.0 (6.5) 56.4 (6.9)* 38.9 (4.5) 39.3 (4.7)*
LMI (kg/m2) 17.2 (1.6) 17.6 (1.8)* 14.2 (1.3) 14.2 (1.4)
Appendicular lean mass (kg) 25.3 (3.4) 26.2 (3.6)* 17.4 (2.3) 17.4 (2.3)
aLMI (kg/m2) 8.1 (0.9) 8.2 (0.9)* 6.4 (0.7) 6.3 (0.7)*
Accelerometer variables
Wear time per valid day 14.2 (1.2) 14.1 (1.1)
Counts per minute 362.9 (137.5) 334.0 (111.9)‡
Minutes per day in different intensities
Sedentary (cpm 0–99) 573.3 (77.3) 565.3 (63.2)
Light (cpm 100–1951) 230.5 (58.8) 236.2 (48.4)
Moderate (cpm 1952–5723) 45.8 (20.6) 40.2 (17.7)‡
Vigorous (cpm ≥5724) 3.7 (5.8) 2.9 (4.1)‡
MVPA§ (cpm ≥1952) 49.5 (23.4) 43.1 (19.6)‡
Meeting MVPA guidelines per day
0–29 min 35 (20.5) 69 (26.5)
30–59 min 90 (52.6) 146 (56.2)
≥60 min 46 (26.9) 45 (17.3)¶
*Values are means with SD or n (prevalence in percentages). BMI: body weight in kg/height in meters2, FMI: fat mass in kg/height in meters2, LMI: lean mass in kg/height in meters2, aLMI: appendicular lean mass in kg/height in meters2. Data on physical activity in FF2 was not available.†Significantly different from baseline measurement (p<0.05).‡Significantly different from boys (mean).§MVPA: moderate to vigorous physical activity, using cut- offs suggested by Freedson.19
¶Significantly different linear trend from boys (p<0.05).
Protected by copyright.
on October 8, 2020 at H
elsebiblioteket gir deg tilgang til BM
J.http://bm
jopen.bmj.com
/B
MJ O
pen: first published as 10.1136/bmjopen-2020-036991 on 7 O
ctober 2020. Dow
nloaded from
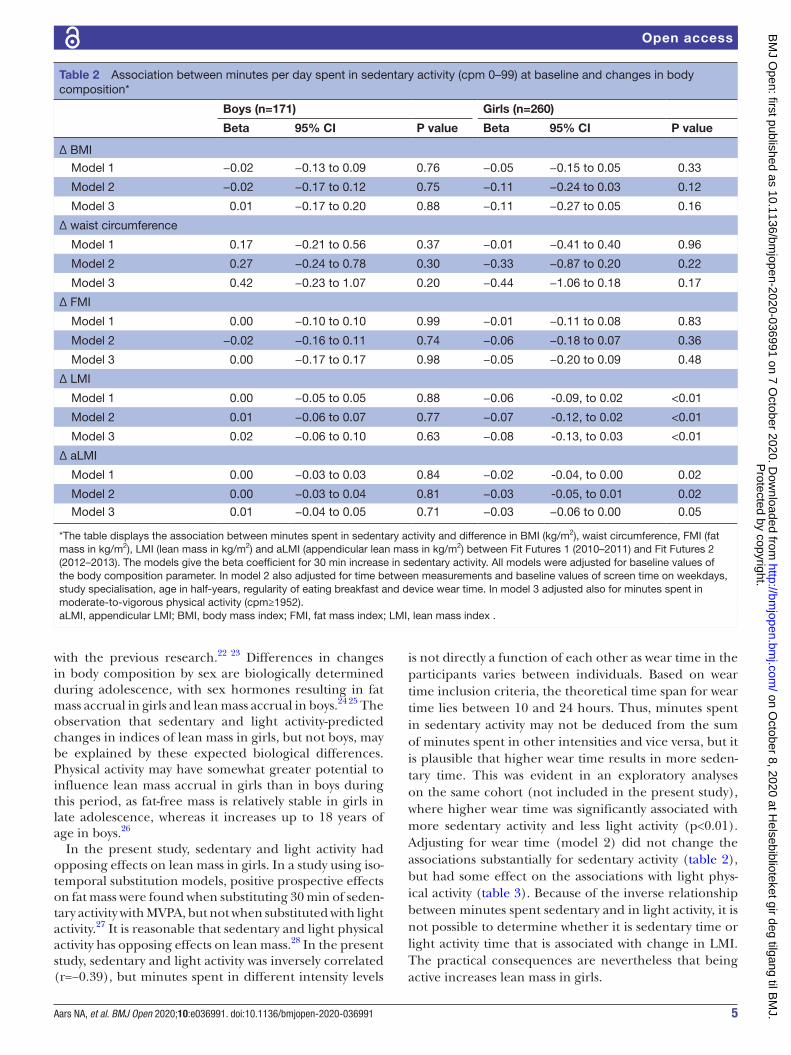
5Aars NA, et al. BMJ Open 2020;10:e036991. doi:10.1136/bmjopen-2020-036991
Open access
with the previous research.22 23 Differences in changes in body composition by sex are biologically determined during adolescence, with sex hormones resulting in fat mass accrual in girls and lean mass accrual in boys.24 25 The observation that sedentary and light activity- predicted changes in indices of lean mass in girls, but not boys, may be explained by these expected biological differences. Physical activity may have somewhat greater potential to influence lean mass accrual in girls than in boys during this period, as fat- free mass is relatively stable in girls in late adolescence, whereas it increases up to 18 years of age in boys.26
In the present study, sedentary and light activity had opposing effects on lean mass in girls. In a study using iso- temporal substitution models, positive prospective effects on fat mass were found when substituting 30 min of seden-tary activity with MVPA, but not when substituted with light activity.27 It is reasonable that sedentary and light physical activity has opposing effects on lean mass.28 In the present study, sedentary and light activity was inversely correlated (r=−0.39), but minutes spent in different intensity levels
is not directly a function of each other as wear time in the participants varies between individuals. Based on wear time inclusion criteria, the theoretical time span for wear time lies between 10 and 24 hours. Thus, minutes spent in sedentary activity may not be deduced from the sum of minutes spent in other intensities and vice versa, but it is plausible that higher wear time results in more seden-tary time. This was evident in an exploratory analyses on the same cohort (not included in the present study), where higher wear time was significantly associated with more sedentary activity and less light activity (p<0.01). Adjusting for wear time (model 2) did not change the associations substantially for sedentary activity (table 2), but had some effect on the associations with light phys-ical activity (table 3). Because of the inverse relationship between minutes spent sedentary and in light activity, it is not possible to determine whether it is sedentary time or light activity time that is associated with change in LMI. The practical consequences are nevertheless that being active increases lean mass in girls.
Table 2 Association between minutes per day spent in sedentary activity (cpm 0–99) at baseline and changes in body composition*
Boys (n=171) Girls (n=260)
Beta 95% CI P value Beta 95% CI P value
∆ BMI
Model 1 −0.02 −0.13 to 0.09 0.76 −0.05 −0.15 to 0.05 0.33
Model 2 −0.02 −0.17 to 0.12 0.75 −0.11 −0.24 to 0.03 0.12
Model 3 0.01 −0.17 to 0.20 0.88 −0.11 −0.27 to 0.05 0.16
∆ waist circumference
Model 1 0.17 −0.21 to 0.56 0.37 −0.01 −0.41 to 0.40 0.96
Model 2 0.27 −0.24 to 0.78 0.30 −0.33 −0.87 to 0.20 0.22
Model 3 0.42 −0.23 to 1.07 0.20 −0.44 −1.06 to 0.18 0.17
∆ FMI
Model 1 0.00 −0.10 to 0.10 0.99 −0.01 −0.11 to 0.08 0.83
Model 2 −0.02 −0.16 to 0.11 0.74 −0.06 −0.18 to 0.07 0.36
Model 3 0.00 −0.17 to 0.17 0.98 −0.05 −0.20 to 0.09 0.48
∆ LMI
Model 1 0.00 −0.05 to 0.05 0.88 −0.06 -0.09, to 0.02 <0.01
Model 2 0.01 −0.06 to 0.07 0.77 −0.07 -0.12, to 0.02 <0.01
Model 3 0.02 −0.06 to 0.10 0.63 −0.08 -0.13, to 0.03 <0.01
∆ aLMI
Model 1 0.00 −0.03 to 0.03 0.84 −0.02 -0.04, to 0.00 0.02
Model 2 0.00 −0.03 to 0.04 0.81 −0.03 -0.05, to 0.01 0.02
Model 3 0.01 −0.04 to 0.05 0.71 −0.03 −0.06 to 0.00 0.05
*The table displays the association between minutes spent in sedentary activity and difference in BMI (kg/m2), waist circumference, FMI (fat mass in kg/m2), LMI (lean mass in kg/m2) and aLMI (appendicular lean mass in kg/m2) between Fit Futures 1 (2010–2011) and Fit Futures 2 (2012–2013). The models give the beta coefficient for 30 min increase in sedentary activity. All models were adjusted for baseline values of the body composition parameter. In model 2 also adjusted for time between measurements and baseline values of screen time on weekdays, study specialisation, age in half- years, regularity of eating breakfast and device wear time. In model 3 adjusted also for minutes spent in moderate- to- vigorous physical activity (cpm≥1952).aLMI, appendicular LMI; BMI, body mass index; FMI, fat mass index; LMI, lean mass index .
Protected by copyright.
on October 8, 2020 at H
elsebiblioteket gir deg tilgang til BM
J.http://bm
jopen.bmj.com
/B
MJ O
pen: first published as 10.1136/bmjopen-2020-036991 on 7 O
ctober 2020. Dow
nloaded from

6 Aars NA, et al. BMJ Open 2020;10:e036991. doi:10.1136/bmjopen-2020-036991
Open access
When interpreting results, we must acknowledge the limitations of DXA in the estimation of lean mass, which can be affected by both biological factors and measure-ment error.29 Because the relative increase in lean mass was small, only slight differences in, for instance, indi-vidual hydration status at the two time points may influ-ence estimates and thus the association.
There were no associations between objectively measured physical activity and change in BMI, waist circumference and FMI for either sex. It may be that the negative effects of less physical activity have not yet had time to manifest themselves in a population still under-going physiological changes as a result of natural growth, especially considering the relatively short 2- year follow- up. Our results are in line with a systematic review suggesting that objectively measured physical activity (PA) is not an important predictor of change in adiposity in children, adolescents and adults.12 In contrast, another systematic review found a protective effect of physical activity on adiposity in adolescents.10 There were however several methodological weaknesses in the studies included in this
review, particularly regarding the validity of the measure-ment of both physical activity and body composition. In contrast, our study employed robust measures of both these exposures and outcomes, a combination of which is lacking in much past research on the association between the two.10–12
In adolescents, physical activity is influenced by friends, family and other social support30 and is less stable than in adults.31–33 Follow- up data on objectively measured physical activity were not available in the present study, but some evidence suggest that the decline in physical activity is steeper prior to the onset of adolescence.34 Reductions in level of physical activity during the transi-tion from adolescence to young adulthood nevertheless often occur.35 Prior observations from the same cohort showed that change in self- reported physical activity between baseline and follow- up was a stronger predictor of change in body composition than self- reported base-line physical activity.36 Other studies have suggested that change in activity during follow- up might obscure an association with body composition.37 38 In a subanalyses,
Table 3 Association between minutes per day spent in light activity (cpm 100–1951) at baseline and changes in body composition*
Boys (n=171) Girls (n=260)
Beta 95% CI P value Beta 95% CI P value
∆ BMI
Model 1 0.04 −0.11 to 0.18 0.60 0.05 −0.09 to 0.19 0.47
Model 2 0.01 −0.17 to 0.18 0.93 0.12 −0.04 to 0.27 0.13
Model 3 −0.01 −0.20 to 0.17 0.88 0.11 −0.05 to 0.27 0.16
∆ waist circumference
Model 1 −0.11 −0.62 to 0.40 0.68 0.54 0.01 to 1.07 0.05
Model 2 −0.38 −1.00 to 0.23 0.22 0.43 −0.19 to 1.05 0.17
Model 3 −0.42 −1.07 to 0.23 0.20 0.44 −0.19 to 1.06 0.17
∆ FMI
Model 1 0.03 −0.10 to 0.16 0.67 0.02 −0.10 to 0.15 0.71
Model 2 0.01 −0.15 to 0.18 0.87 0.06 −0.09 to 0.20 0.43
Model 3 −0.00 −0.17 to 0.17 0.98 0.05 −0.09 to 0.20 0.49
∆ LMI
Model 1 −0.01 −0.07 to 0.06 0.84 0.04 −0.01 to 0.09 0.08
Model 2 −0.02 −0.09 to 0.06 0.67 0.08 0.03 to 0.13 <0.01
Model 3 −0.02 −0.10 to 0.06 0.63 0.08 0.03 to 0.13 <0.01
∆ aLMI
Model 1 0.00 −0.03 to 0.04 0.87 0.02 −0.01 to 0.04 0.16
Model 2 −0.01 −0.05 to 0.04 0.73 0.03 0.00 to 0.06 0.04
Model 3 −0.01 −0.05 to 0.04 0.70 0.03 −0.00 to 0.06 0.05
*The table displays the association between minutes spent in light activity and difference in BMI (kg/m2), waist circumference, FMI (fat mass in kg/m2), LMI (lean mass in kg/m2) and aLMI (appendicular lean mass in kg/m2) between Fit Futures 1 (2010–2011) and Fit Futures 2 (2012–2013). The models give the beta coefficient for 30 min increase in light activity. All models were adjusted for baseline values of the body composition parameter. In model 2 also adjusted for time between measurements and baseline values of screen time on weekdays, study specialisation, age in half- years, regularity of eating breakfast and device wear time. In Model 3 adjusted also for minutes spent in moderate- to- vigorous physical activity (cpm≥1952).aLMI, appendicular LMI; BMI, body weight index; FMI, fat mass index; LMI, lean mass index.
Protected by copyright.
on October 8, 2020 at H
elsebiblioteket gir deg tilgang til BM
J.http://bm
jopen.bmj.com
/B
MJ O
pen: first published as 10.1136/bmjopen-2020-036991 on 7 O
ctober 2020. Dow
nloaded from

7Aars NA, et al. BMJ Open 2020;10:e036991. doi:10.1136/bmjopen-2020-036991
Open access
one of four in both the highest and lowest categories of MVPA at baseline reported decreased (high MVPA at baseline) and increased (low MVPA at baseline) self- reported physical activity at follow- up, thus indicating that physical activity in adolescents is fluctuant. These two observations, assuming that measurement of both MVPA and self- reported hours per week of physical activity, are representative of actual physical activity behaviour at the time, work in opposing directions with regards to the effect of physical activity on changes in adiposity. This phenomenon is known as regression dilution bias and may flatten the regression slope and cause an underesti-mate of the actual association.39 With an annual decline in total physical activity of 7% in adolescents, researchers must consider the possibility that measured physical activity has a ‘best before- date’. It remains questionable whether baseline measurements of a fluctuant behaviour such as physical activity is representative of actual habits during the period of follow- up. It may be that the measurement represents current, but not future (or even prior) habits.12 40 This has implications for longitudinal studies of the relationship between physical activity and body composition.38
Strengths and limitationsThe primary strength of this study is objective measures of both physical activity and body composition parame-ters and the inclusion of tissue- specific measures of body composition. Some limitations have to be considered.
As the Fit Futures study did not include a validated food frequency questionnaire or similar instrument for nutri-tional assessment, we were not able to fully adjust for the potential confounding effects of nutrition and changes in food habits of adolescents on changes in body compo-sition. Accelerometer- measured physical activity has limitations. A hip worn accelerometer such as the Acti-Graph GT3X is not able to correctly measure cycling and swimming.41 Furthermore, accelerometers are depen-dent on user compliance, and non- wear time therefore affects the amount of activity that is actually measured. Subjective judgement determines data management and analyses, for example, the decision to exclude partici-pants with wear time <10 hours and <4 consecutive days is a trade- off between quality of data and the number of participants with valid data. We lacked complete data on physical activity and adjustment variables in 212 partic-ipants, but changes in BMI, waist circumference, FMI, LMI (except in girls, p=0.04) and aLMI were not signifi-cantly different between those with and without complete exposure data. Furthermore, of those with valid data concerning both physical activity and body composition parameters at baseline, close to 25% did not attend the follow- up (online supplemental appendix table 1). This group differed significantly from those included in the main analyses with respect to both physical activity and body composition parameters. The prospective asso-ciations between physical activity and changes in body
Table 4 Association between minutes per day spent in MVPA (cpm≥1952) at baseline and changes in body composition*
Boys (n=171) Girls (n=260)
Beta 95% CI P value Beta 95% CI P value
∆ BMI
Model 1 0.11 −0.07 to 0.30 0.22 −0.00 −0.17 to 0.16 0.97
Model 2 0.08 −0.13 to 0.29 0.47 0.07 −0.11 to 0.25 0.47
∆ waist circumference
Model 1 0.25 −0.39 to 0.89 0.44 −0.03 −0.68 to 0.63 0.94
Model 2 −0.02 −0.75 to 0.71 0.95 0.02 −0.70 to 0.74 0.96
∆ FMI
Model 1 0.02 −0.15 to 0.19 0.83 −0.01 −0.17 to 0.14 0.86
Model 2 0.06 −0.14 to 0.25 0.57 0.05 −0.12 to 0.22 0.54
∆ LMI
Model 1 0.07 −0.02 to 0.15 0.11 0.03 −0.03 to 0.09 0.33
Model 2 0.01 −0.08 to 0.10 0.86 0.02 −0.04 to 0.09 0.44
∆ aLMI
Model 1 0.03 −0.02 to 0.08 0.19 0.02 −0.01 to 0.05 0.13
Model 2 0.00 −0.05 to 0.05 0.92 0.02 −0.01 to 0.05 0.18
*The table displays the association between minutes spent in moderate- to- vigorous physical activity (MVPA) and difference in BMI (kg/m2), waist circumference, FMI (fat mass in kg/m2), LMI (lean mass in kg/m2) and aLMI (appendicular lean mass in kg/m2) between Fit Futures 1 (2010–2011) and Fit Futures 2 (2012–2013). The models give the beta coefficient for 15 min increase in MVPA. Both models were adjusted for baseline values of the body composition parameter. In model 2 also adjusted for time between measurements and baseline values of screen time on weekdays, study specialisation, age in half- years, regularity of eating breakfast and device wear time.aLMI, appendicular LMI ; BMI, body mass index; FMI, fat mass index ; LMI, lean mass index .
Protected by copyright.
on October 8, 2020 at H
elsebiblioteket gir deg tilgang til BM
J.http://bm
jopen.bmj.com
/B
MJ O
pen: first published as 10.1136/bmjopen-2020-036991 on 7 O
ctober 2020. Dow
nloaded from
8 Aars NA, et al. BMJ Open 2020;10:e036991. doi:10.1136/bmjopen-2020-036991
Open access
composition parameters in this group (n=133) may be different from those observed in the group of partici-pants included in the main analyses (n=431), and the associations in all the 564 participants with valid baseline data may therefore be different from what we find in the main analyses. This is however not possible to determine given the lack of follow- up data.
Although longitudinal observational studies are supe-rior to cross- sectional studies to examine causation, they are also susceptible to directional bias, since participants may avoid physical activity because they are overweight, and not be overweight because they are inactive.42–44 Finally, as the participants were 16 years old, much may already have happened both to the level of physical activity and the different measures of body composition prior to participation. In light of this, 2 years of follow- up may be a short time frame to determine the potential effects of physical activity on changes in the different body compo-sition parameters.
CONCLUSIONObjectively measured physical activity was not signifi-cantly associated with change in objectively measured BMI, waist circumference or FMI after 2 years in this cohort of Norwegian adolescents. There was evidence to suggest that sedentary and light activity affected indices of lean mass in girls, but not boys.
Author affiliations1Department of Community Medicine, UiT The Arctic University of Norway, Tromso, Troms, Norway2Nordlandssykehuset HF, Bodø, Norway3School of Sport Sciences, UiT Arctic University of Norway, Alta, Finnmark, Norway4Centre for Sami Health Research, UiT The Arctic University of Norway, Tromso, Troms, Norway5Department of Computer Science, UiT The Arctic University of Norway, Tromso, Troms, Norway6Department of Health and Care Siences, UiT The Arctic University of Norway, Tromso, Troms, Norway7Department of Microbiology and Infection Control, Universitetssykehuset Nord- Norge, Tromsø, Norway8Faculty of Health and Social Sciences, Molde University College, Molde, Norway
Acknowledgements The authors thank the participants in the study, as well as the staff at the Clinical Research Unit at the University Hospital of North Norway for data collection and clinical measurements. We also thank the Fit Futures Steering Committee in both studies.
Contributors NAA wrote the draft of the manuscript, which was revised and edited by all authors several times during the process. SB produced the accelerometer variables in close collaboration with AH, who wrote the software which converted raw accelerometer data to variables. BKJ contributed to the statistical analyses, and BM specifically contributed to the discussion of physical activity. NE and A- SF were among the principal investigators in FF1 and FF2 and contributed significantly to the acquisition of data. SG formulated the research question and conceived the study. All authors have substantially contributed to the study, and have read and approved the final manuscript.
Funding The authors have not declared a specific grant for this research from any funding agency in the public, commercial or not- for- profit sectors.
Competing interests None declared.
Patient and public involvement Patients and/or the public were involved in the design, or conduct, or reporting, or dissemination plans of this research. Refer to the Methods section for further details.
Patient consent for publication Not required.
Ethics approval This study was approved by The Regional Committee of Medical and Health Research Ethics (2014/1666/REK nord).
Provenance and peer review Not commissioned; externally peer reviewed.
Data availability statement Data may be obtained from a third party and are not publicly available. The data that support the findings of this study are available from UiT – The Arctic University of Norway. Restrictions apply to the availability of these data, which were used under license for the current study, and are thus not publicly available.
Open access This is an open access article distributed in accordance with the Creative Commons Attribution Non Commercial (CC BY- NC 4.0) license, which permits others to distribute, remix, adapt, build upon this work non- commercially, and license their derivative works on different terms, provided the original work is properly cited, appropriate credit is given, any changes made indicated, and the use is non- commercial. See: http:// creativecommons. org/ licenses/ by- nc/ 4. 0/.
ORCID iDsNils Abel Aars http:// orcid. org/ 0000- 0002- 0447- 2668Bente Morseth http:// orcid. org/ 0000- 0002- 7973- 0342
REFERENCES 1 World Health Organization. Global action plan on physical activity
2018–2030: more active people for a healthier world. Geneva: World Health Organization, 2018.
2 Lee I- M, Shiroma EJ, Lobelo F, et al. Effect of physical inactivity on major non- communicable diseases worldwide: an analysis of burden of disease and life expectancy. Lancet 2012;380:219–29.
3 World Health Organization. Global recommendations on physical activity for health. who guidelines. Geneva: WHO, 2010.
4 Kolle ESJ, Hansen BH, Anderssen SA. Fysisk aktivitet blant 6-, 9- OG 15-åringer I Norge. Resultater fra en kartlegging I 2011. The Norwegian Directorate of Health, Oslo, Norway, 2012.
5 Dumith SC, Gigante DP, Domingues MR, et al. Physical activity change during adolescence: a systematic review and a pooled analysis. Int J Epidemiol 2011;40:685–98.
6 Collings PJ, Wijndaele K, Corder K, et al. Magnitude and determinants of change in objectively- measured physical activity, sedentary time and sleep duration from ages 15 to 17.5y in UK adolescents: the roots study. Int J Behav Nutr Phys Act 2015;12:61.
7 Crane J, Temple V. A systematic review of dropout from organized sport among children and youth. Eur Phy Educ Rev 2015;21:114–31.
8 Ng M, Fleming T, Robinson M, et al. Global, regional, and national prevalence of overweight and obesity in children and adults during 1980-2013: a systematic analysis for the global burden of disease study 2013. Lancet 2014;384:766–81.
9 NCD Risk Factor Collaboration (NCD- RisC). Worldwide trends in body- mass index, underweight, overweight, and obesity from 1975 to 2016: a pooled analysis of 2416 population- based measurement studies in 128·9 million children, adolescents, and adults. Lancet 2017;390:2627–42.
10 Reichert FF, Baptista Menezes AM, Wells JCK, et al. Physical activity as a predictor of adolescent body fatness: a systematic review. Sports Med 2009;39:279–94.
11 Jiménez- Pavón D, Kelly J, Reilly JJ. Associations between objectively measured habitual physical activity and adiposity in children and adolescents: systematic review. Int J Pediatr Obes 2010;5:3–18.
12 Wilks DC, Besson H, Lindroos AK, et al. Objectively measured physical activity and obesity prevention in children, adolescents and adults: a systematic review of prospective studies. Obes Rev 2011;12:e119–29.
13 Dyrstad SM, Hansen BH, Holme IM, et al. Comparison of self- reported versus accelerometer- measured physical activity. Med Sci Sports Exerc 2014;46:99–106.
14 Aars NA, Jacobsen BK, Furberg A- S, et al. Self- Reported physical activity during leisure time was favourably associated with body composition in Norwegian adolescents. Acta Paediatr 2019;108:1122–7.
15 Goulding A, Taylor RW, Grant AM, et al. Relationships of appendicular LMI and total body LMI to bone mass and physical activity levels in a birth cohort of New Zealand five- year olds. Bone 2009;45:455–9.
16 Bridge P, Pocock NA, Nguyen T, et al. Validation of longitudinal DXA changes in body composition from pre- to mid- adolescence using MRI as reference. J Clin Densitom 2011;14:340–7.
Protected by copyright.
on October 8, 2020 at H
elsebiblioteket gir deg tilgang til BM
J.http://bm
jopen.bmj.com
/B
MJ O
pen: first published as 10.1136/bmjopen-2020-036991 on 7 O
ctober 2020. Dow
nloaded from

9Aars NA, et al. BMJ Open 2020;10:e036991. doi:10.1136/bmjopen-2020-036991
Open access
17 Trost SG, Pate RR, Freedson PS, et al. Using objective physical activity measures with youth: how many days of monitoring are needed? Med Sci Sports Exerc 2000;32:426–31.
18 Hecht A, Ma S, Porszasz J, et al. Methodology for using long- term accelerometry monitoring to describe daily activity patterns in COPD. COPD 2009;6:121–9.
19 Freedson PS, Melanson E, Sirard J. Calibration of the computer science and applications, Inc. accelerometer. Med Sci Sports Exerc 1998;30:777–81.
20 Sasaki JE, John D, Freedson PS. Validation and comparison of ActiGraph activity monitors. J Sci Med Sport 2011;14:411–6.
21 Cuzick J. A Wilcoxon- type test for trend. Stat Med 1985;4:87–90. 22 Kolle E, Steene- Johannessen J, Andersen LB, et al. Objectively
assessed physical activity and aerobic fitness in a population- based sample of Norwegian 9- and 15- year- olds. Scand J Med Sci Sports 2010;20:e41–7.
23 Van Hecke L, Loyen A, Verloigne M, et al. Variation in population levels of physical activity in European children and adolescents according to cross- European studies: a systematic literature review within DEDIPAC. Int J Behav Nutr Phys Act 2016;13:70.
24 Baxter- Jones ADG, Eisenmann JC, Mirwald RL, et al. The influence of physical activity on lean mass accrual during adolescence: a longitudinal analysis. J Appl Physiol 2008;105:734–41.
25 Wohlfahrt- Veje C, Tinggaard J, Winther K, et al. Body fat throughout childhood in 2647 healthy Danish children: agreement of BMI, waist circumference, skinfolds with dual X- ray absorptiometry. Eur J Clin Nutr 2014;68:664–70.
26 Siervogel RM, Demerath EW, Schubert C, et al. Puberty and body composition. Horm Res 2003;60:36–45.
27 Sardinha LB, Marques A, Minderico C, et al. Cross- Sectional and prospective impact of reallocating sedentary time to physical activity on children's body composition. Pediatr Obes 2017;12:373–9.
28 Kenney WL, Wilmore JH, Costill DL. Physiology of sport and exercise. Seventh edition. Champaign, IL: Human Kinetics, 2020.
29 Lohman TG, Milliken LA. ACSM’s body composition assessment. Champaign, IL: Human Kinetics, 2020.
30 Mendonça G, Cheng LA, Mélo EN, et al. Physical activity and social support in adolescents: a systematic review. Health Educ Res 2014;29:822–39.
31 Telama R, Yang X. Decline of physical activity from youth to young adulthood in Finland. Med Sci Sports Exerc 2000;32:1617–22.
32 Varma VR, Dey D, Leroux A, et al. Re- evaluating the effect of age on physical activity over the lifespan. Prev Med 2017;101:102–8.
33 Caspersen CJ, Pereira MA, Curran KM. Changes in physical activity patterns in the United States, by sex and cross- sectional age. Med Sci Sports Exerc 2000;32:1601–9.
34 Farooq MA, Parkinson KN, Adamson AJ, et al. Timing of the decline in physical activity in childhood and adolescence: Gateshead millennium cohort study. Br J Sports Med 2018;52:1002–6.
35 Corder K, Winpenny E, Love R, et al. Change in physical activity from adolescence to early adulthood: a systematic review and meta- analysis of longitudinal cohort studies. Br J Sports Med 2019;53:496–503.
36 Aars NA, Jacobsen BK, Morseth B, et al. Longitudinal changes in body composition and waist circumference by self- reported levels of physical activity in leisure among adolescents: the Tromsø study, fit futures. BMC Sports Sci Med Rehabil 2019;11:37.
37 O'Loughlin J, Gray- Donald K, Paradis G, et al. One- and two- year predictors of excess weight gain among elementary schoolchildren in multiethnic, low- income, inner- city neighborhoods. Am J Epidemiol 2000;152:739–46.
38 Collings PJ, Wijndaele K, Corder K, et al. Objectively measured physical activity and longitudinal changes in adolescent body fatness: an observational cohort study. Pediatr Obes 2016;11:107–14.
39 Hutcheon JA, Chiolero A, Hanley JA. Random measurement error and regression dilution bias. BMJ 2010;340:c2289.
40 Kettaneh A, Oppert JM, Heude B, et al. Changes in physical activity explain paradoxical relationship between baseline physical activity and adiposity changes in adolescent girls: the FLVS II study. Int J Obes 2005;29:586–93.
41 Herman Hansen B, Børtnes I, Hildebrand M, et al. Validity of the ActiGraph GT1M during walking and cycling. J Sports Sci 2014;32:510–6.
42 van Sluijs EMF, Sharp SJ, Ambrosini GL, et al. The independent prospective associations of activity intensity and dietary energy density with adiposity in young adolescents. Br J Nutr 2016;115:921–9.
43 Hjorth MF, Chaput J- P, Ritz C, et al. Fatness predicts decreased physical activity and increased sedentary time, but not vice versa: support from a longitudinal study in 8- to 11- year- old children. Int J Obes 2014;38:959–65.
44 Jago R, Salway RE, Ness AR, et al. Associations between physical activity and asthma, eczema and obesity in children aged 12-16: an observational cohort study. BMJ Open 2019;9:e024858.
Protected by copyright.
on October 8, 2020 at H
elsebiblioteket gir deg tilgang til BM
J.http://bm
jopen.bmj.com
/B
MJ O
pen: first published as 10.1136/bmjopen-2020-036991 on 7 O
ctober 2020. Dow
nloaded from
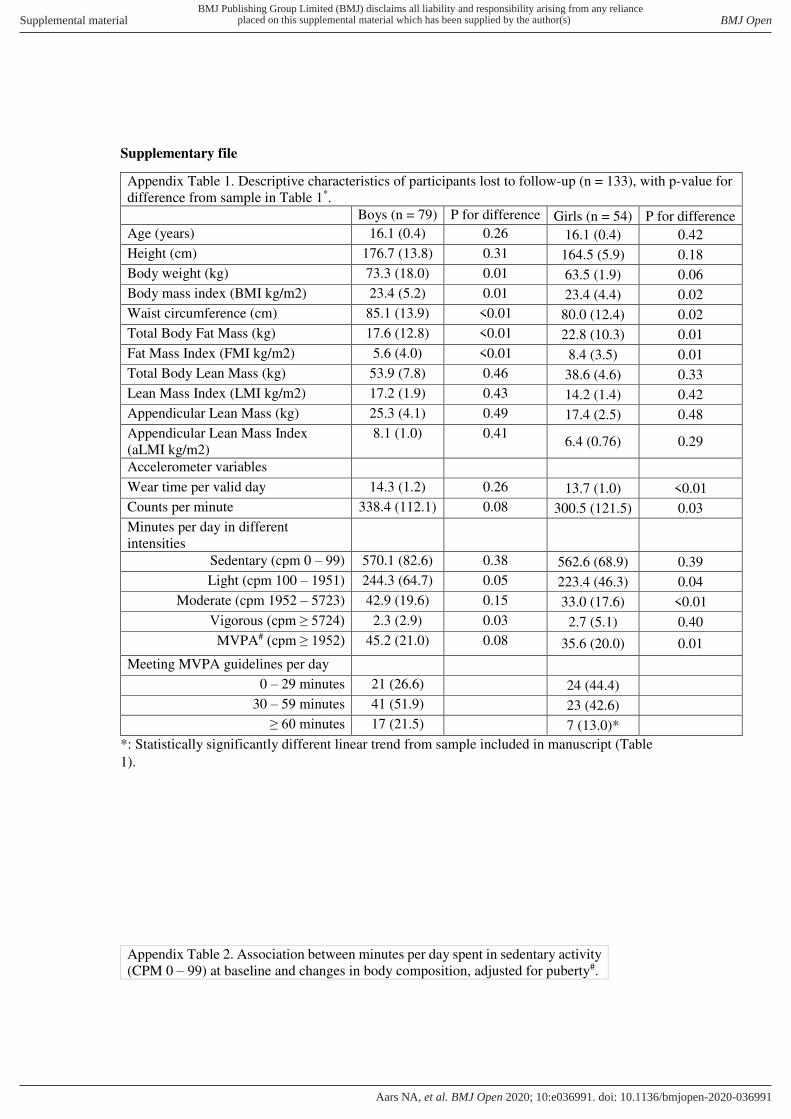
Supplementary file
Appendix Table 1. Descriptive characteristics of participants lost to follow-up (n = 133), with p-value for
difference from sample in Table 1*. Boys (n = 79) P for difference Girls (n = 54) P for difference
Age (years) 16.1 (0.4) 0.26 16.1 (0.4) 0.42
Height (cm) 176.7 (13.8) 0.31 164.5 (5.9) 0.18
Body weight (kg) 73.3 (18.0) 0.01 63.5 (1.9) 0.06
Body mass index (BMI kg/m2) 23.4 (5.2) 0.01 23.4 (4.4) 0.02
Waist circumference (cm) 85.1 (13.9) <0.01 80.0 (12.4) 0.02
Total Body Fat Mass (kg) 17.6 (12.8) <0.01 22.8 (10.3) 0.01
Fat Mass Index (FMI kg/m2) 5.6 (4.0) <0.01 8.4 (3.5) 0.01
Total Body Lean Mass (kg) 53.9 (7.8) 0.46 38.6 (4.6) 0.33
Lean Mass Index (LMI kg/m2) 17.2 (1.9) 0.43 14.2 (1.4) 0.42
Appendicular Lean Mass (kg) 25.3 (4.1) 0.49 17.4 (2.5) 0.48
Appendicular Lean Mass Index
(aLMI kg/m2)
8.1 (1.0) 0.41 6.4 (0.76) 0.29
Accelerometer variables
Wear time per valid day 14.3 (1.2) 0.26 13.7 (1.0) <0.01
Counts per minute 338.4 (112.1) 0.08 300.5 (121.5) 0.03
Minutes per day in different
intensities
Sedentary (cpm 0 – 99) 570.1 (82.6) 0.38 562.6 (68.9) 0.39
Light (cpm 100 – 1951) 244.3 (64.7) 0.05 223.4 (46.3) 0.04
Moderate (cpm 1952 – 5723) 42.9 (19.6) 0.15 33.0 (17.6) <0.01
Vigorous (cpm ≥ 5724) 2.3 (2.9) 0.03 2.7 (5.1) 0.40
MVPA# (cpm ≥ 1952) 45.2 (21.0) 0.08 35.6 (20.0) 0.01
Meeting MVPA guidelines per day
0 – 29 minutes 21 (26.6)
24 (44.4)
30 – 59 minutes 41 (51.9)
23 (42.6)
≥ 60 minutes 17 (21.5)
7 (13.0)*
*: Statistically significantly different linear trend from sample included in manuscript (Table
1).
Appendix Table 2. Association between minutes per day spent in sedentary activity
(CPM 0 – 99) at baseline and changes in body composition, adjusted for puberty#.
BMJ Publishing Group Limited (BMJ) disclaims all liability and responsibility arising from any relianceSupplemental material placed on this supplemental material which has been supplied by the author(s) BMJ Open
doi: 10.1136/bmjopen-2020-036991:e036991. 10 2020;BMJ Open, et al. Aars NA
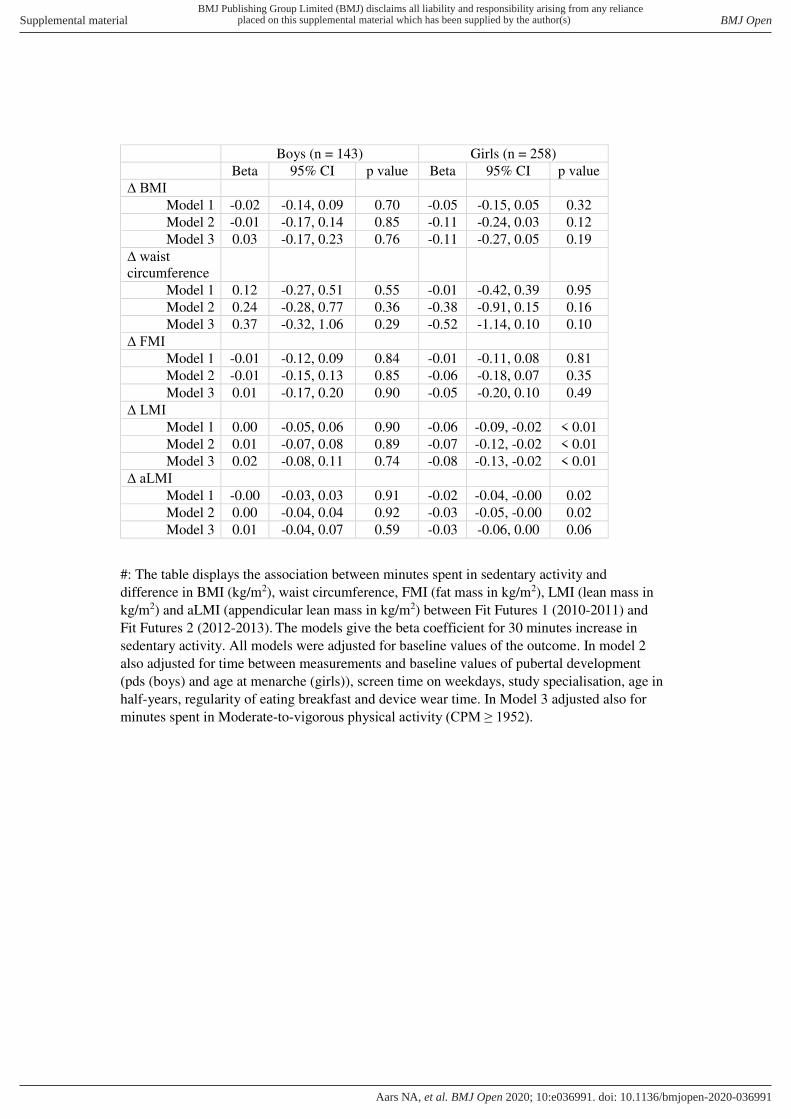
Boys (n = 143) Girls (n = 258)
Beta 95% CI p value Beta 95% CI p value
∆ BMI
Model 1 -0.02 -0.14, 0.09 0.70 -0.05 -0.15, 0.05 0.32
Model 2 -0.01 -0.17, 0.14 0.85 -0.11 -0.24, 0.03 0.12
Model 3 0.03 -0.17, 0.23 0.76 -0.11 -0.27, 0.05 0.19
∆ waist circumference
Model 1 0.12 -0.27, 0.51 0.55 -0.01 -0.42, 0.39 0.95
Model 2 0.24 -0.28, 0.77 0.36 -0.38 -0.91, 0.15 0.16
Model 3 0.37 -0.32, 1.06 0.29 -0.52 -1.14, 0.10 0.10
∆ FMI
Model 1 -0.01 -0.12, 0.09 0.84 -0.01 -0.11, 0.08 0.81
Model 2 -0.01 -0.15, 0.13 0.85 -0.06 -0.18, 0.07 0.35
Model 3 0.01 -0.17, 0.20 0.90 -0.05 -0.20, 0.10 0.49
∆ LMI
Model 1 0.00 -0.05, 0.06 0.90 -0.06 -0.09, -0.02 < 0.01
Model 2 0.01 -0.07, 0.08 0.89 -0.07 -0.12, -0.02 < 0.01
Model 3 0.02 -0.08, 0.11 0.74 -0.08 -0.13, -0.02 < 0.01
∆ aLMI
Model 1 -0.00 -0.03, 0.03 0.91 -0.02 -0.04, -0.00 0.02
Model 2 0.00 -0.04, 0.04 0.92 -0.03 -0.05, -0.00 0.02
Model 3 0.01 -0.04, 0.07 0.59 -0.03 -0.06, 0.00 0.06
#: The table displays the association between minutes spent in sedentary activity and
difference in BMI (kg/m2), waist circumference, FMI (fat mass in kg/m2), LMI (lean mass in
kg/m2) and aLMI (appendicular lean mass in kg/m2) between Fit Futures 1 (2010-2011) and
Fit Futures 2 (2012-2013). The models give the beta coefficient for 30 minutes increase in
sedentary activity. All models were adjusted for baseline values of the outcome. In model 2
also adjusted for time between measurements and baseline values of pubertal development
(pds (boys) and age at menarche (girls)), screen time on weekdays, study specialisation, age in
half-years, regularity of eating breakfast and device wear time. In Model 3 adjusted also for
minutes spent in Moderate-to-vigorous physical activity (CPM ≥ 1952).
BMJ Publishing Group Limited (BMJ) disclaims all liability and responsibility arising from any relianceSupplemental material placed on this supplemental material which has been supplied by the author(s) BMJ Open
doi: 10.1136/bmjopen-2020-036991:e036991. 10 2020;BMJ Open, et al. Aars NA
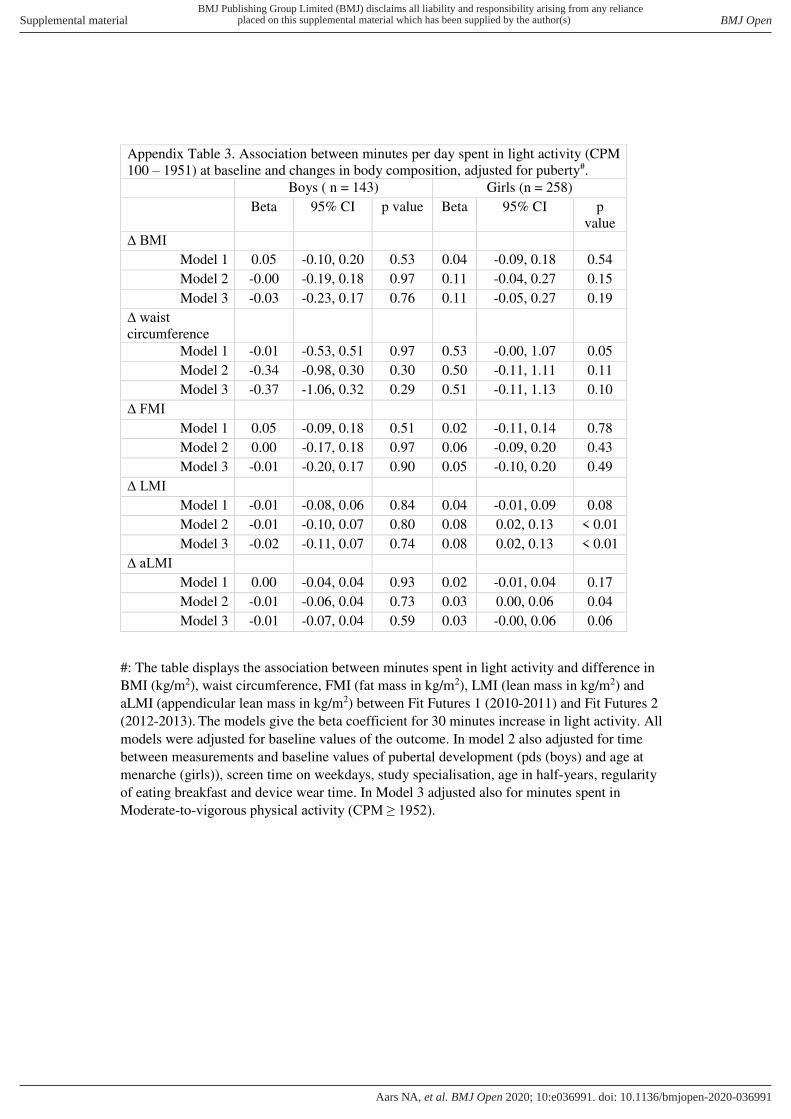
Appendix Table 3. Association between minutes per day spent in light activity (CPM
100 – 1951) at baseline and changes in body composition, adjusted for puberty#.
Boys ( n = 143) Girls (n = 258)
Beta 95% CI p value Beta 95% CI p
value
∆ BMI
Model 1 0.05 -0.10, 0.20 0.53 0.04 -0.09, 0.18 0.54
Model 2 -0.00 -0.19, 0.18 0.97 0.11 -0.04, 0.27 0.15
Model 3 -0.03 -0.23, 0.17 0.76 0.11 -0.05, 0.27 0.19
∆ waist circumference
Model 1 -0.01 -0.53, 0.51 0.97 0.53 -0.00, 1.07 0.05
Model 2 -0.34 -0.98, 0.30 0.30 0.50 -0.11, 1.11 0.11
Model 3 -0.37 -1.06, 0.32 0.29 0.51 -0.11, 1.13 0.10
∆ FMI
Model 1 0.05 -0.09, 0.18 0.51 0.02 -0.11, 0.14 0.78
Model 2 0.00 -0.17, 0.18 0.97 0.06 -0.09, 0.20 0.43
Model 3 -0.01 -0.20, 0.17 0.90 0.05 -0.10, 0.20 0.49
∆ LMI
Model 1 -0.01 -0.08, 0.06 0.84 0.04 -0.01, 0.09 0.08
Model 2 -0.01 -0.10, 0.07 0.80 0.08 0.02, 0.13 < 0.01
Model 3 -0.02 -0.11, 0.07 0.74 0.08 0.02, 0.13 < 0.01
∆ aLMI
Model 1 0.00 -0.04, 0.04 0.93 0.02 -0.01, 0.04 0.17
Model 2 -0.01 -0.06, 0.04 0.73 0.03 0.00, 0.06 0.04
Model 3 -0.01 -0.07, 0.04 0.59 0.03 -0.00, 0.06 0.06
#: The table displays the association between minutes spent in light activity and difference in
BMI (kg/m2), waist circumference, FMI (fat mass in kg/m2), LMI (lean mass in kg/m2) and
aLMI (appendicular lean mass in kg/m2) between Fit Futures 1 (2010-2011) and Fit Futures 2
(2012-2013). The models give the beta coefficient for 30 minutes increase in light activity. All
models were adjusted for baseline values of the outcome. In model 2 also adjusted for time
between measurements and baseline values of pubertal development (pds (boys) and age at
menarche (girls)), screen time on weekdays, study specialisation, age in half-years, regularity
of eating breakfast and device wear time. In Model 3 adjusted also for minutes spent in
Moderate-to-vigorous physical activity (CPM ≥ 1952).
BMJ Publishing Group Limited (BMJ) disclaims all liability and responsibility arising from any relianceSupplemental material placed on this supplemental material which has been supplied by the author(s) BMJ Open
doi: 10.1136/bmjopen-2020-036991:e036991. 10 2020;BMJ Open, et al. Aars NA
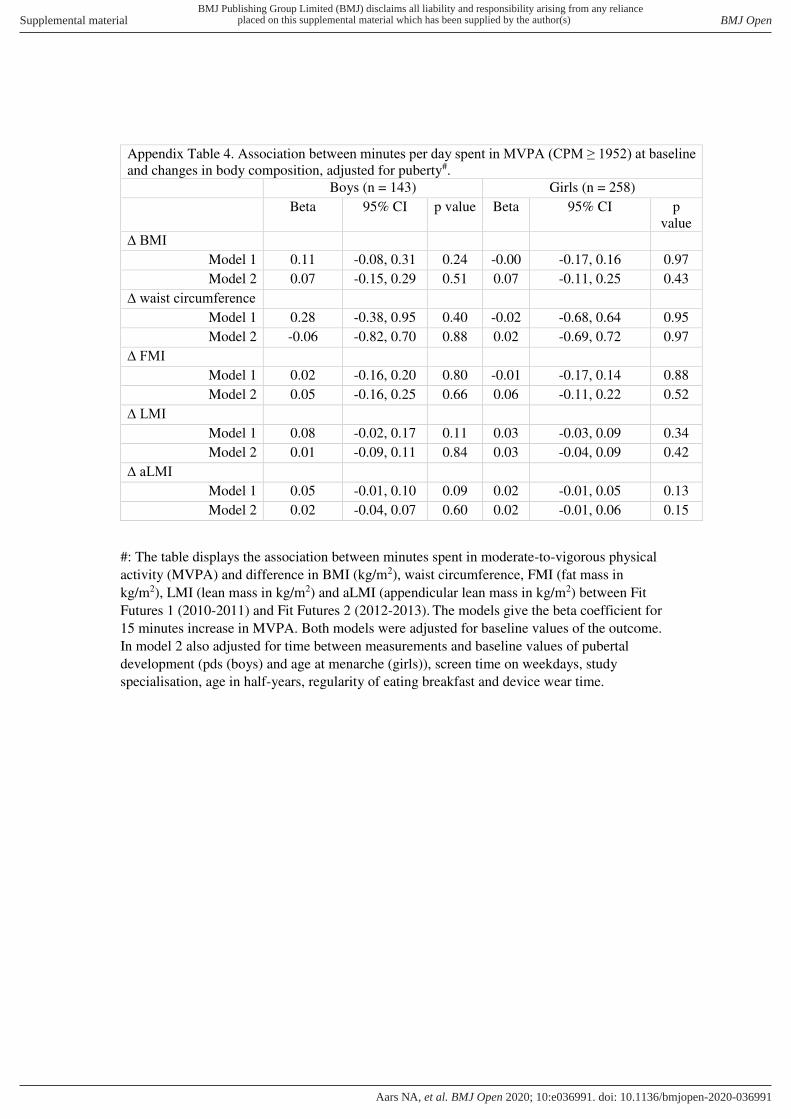
Appendix Table 4. Association between minutes per day spent in MVPA (CPM ≥ 1952) at baseline and changes in body composition, adjusted for puberty#.
Boys (n = 143) Girls (n = 258)
Beta 95% CI p value Beta 95% CI p
value
∆ BMI
Model 1 0.11 -0.08, 0.31 0.24 -0.00 -0.17, 0.16 0.97
Model 2 0.07 -0.15, 0.29 0.51 0.07 -0.11, 0.25 0.43
∆ waist circumference
Model 1 0.28 -0.38, 0.95 0.40 -0.02 -0.68, 0.64 0.95
Model 2 -0.06 -0.82, 0.70 0.88 0.02 -0.69, 0.72 0.97
∆ FMI
Model 1 0.02 -0.16, 0.20 0.80 -0.01 -0.17, 0.14 0.88
Model 2 0.05 -0.16, 0.25 0.66 0.06 -0.11, 0.22 0.52
∆ LMI
Model 1 0.08 -0.02, 0.17 0.11 0.03 -0.03, 0.09 0.34
Model 2 0.01 -0.09, 0.11 0.84 0.03 -0.04, 0.09 0.42
∆ aLMI
Model 1 0.05 -0.01, 0.10 0.09 0.02 -0.01, 0.05 0.13
Model 2 0.02 -0.04, 0.07 0.60 0.02 -0.01, 0.06 0.15
#: The table displays the association between minutes spent in moderate-to-vigorous physical
activity (MVPA) and difference in BMI (kg/m2), waist circumference, FMI (fat mass in
kg/m2), LMI (lean mass in kg/m2) and aLMI (appendicular lean mass in kg/m2) between Fit
Futures 1 (2010-2011) and Fit Futures 2 (2012-2013). The models give the beta coefficient for
15 minutes increase in MVPA. Both models were adjusted for baseline values of the outcome.
In model 2 also adjusted for time between measurements and baseline values of pubertal
development (pds (boys) and age at menarche (girls)), screen time on weekdays, study
specialisation, age in half-years, regularity of eating breakfast and device wear time.
BMJ Publishing Group Limited (BMJ) disclaims all liability and responsibility arising from any relianceSupplemental material placed on this supplemental material which has been supplied by the author(s) BMJ Open
doi: 10.1136/bmjopen-2020-036991:e036991. 10 2020;BMJ Open, et al. Aars NA

98
Appendices
1. General questionnaire Fit Futures 1.
2. General questionnaire Fit Futures 2.
3. Letter of approval from The Regional Committee of Medical and Health Research
Ethics (Rec North), project number 2014/1666.
4. License from publisher to include Paper 1 in the thesis.
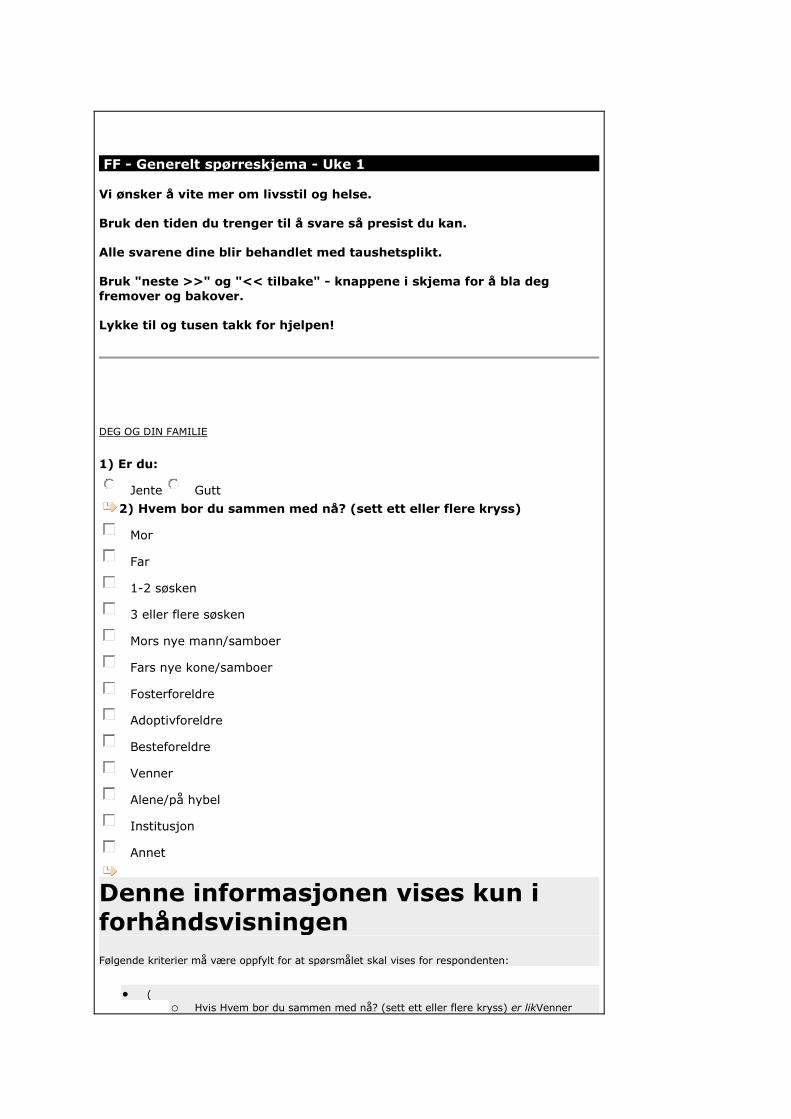
FF - Generelt spørreskjema - Uke 1
Vi ønsker å vite mer om livsstil og helse. Bruk den tiden du trenger til å svare så presist du kan. Alle svarene dine blir behandlet med taushetsplikt. Bruk "neste >>" og "<< tilbake" - knappene i skjema for å bla deg
fremover og bakover. Lykke til og tusen takk for hjelpen!
DEG OG DIN FAMILIE
1) Er du:
Jente Gutt
2) Hvem bor du sammen med nå? (sett ett eller flere kryss)
Mor
Far
1-2 søsken
3 eller flere søsken
Mors nye mann/samboer
Fars nye kone/samboer
Fosterforeldre
Adoptivforeldre
Besteforeldre
Venner
Alene/på hybel
Institusjon
Annet
Denne informasjonen vises kun i forhåndsvisningen
Følgende kriterier må være oppfylt for at spørsmålet skal vises for respondenten:
(
o Hvis Hvem bor du sammen med nå? (sett ett eller flere kryss) er likVenner
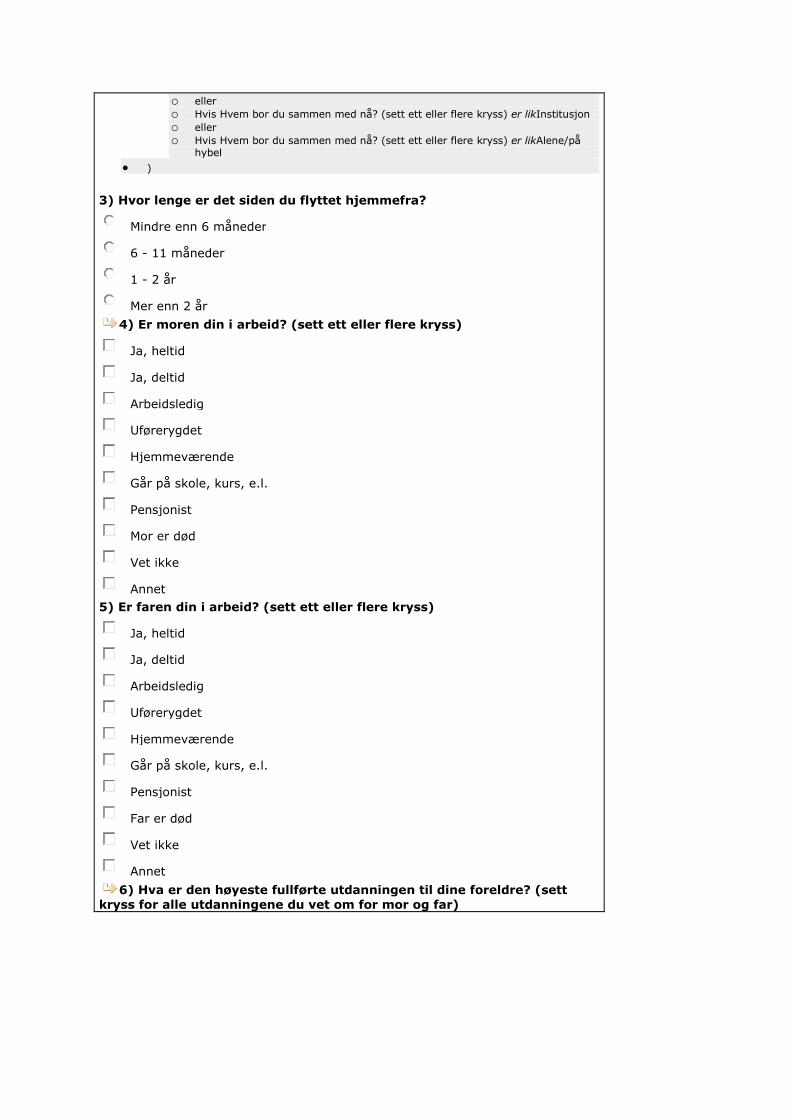
o eller
o Hvis Hvem bor du sammen med nå? (sett ett eller flere kryss) er likInstitusjon
o eller
o Hvis Hvem bor du sammen med nå? (sett ett eller flere kryss) er likAlene/på hybel
)
3) Hvor lenge er det siden du flyttet hjemmefra?
Mindre enn 6 måneder
6 - 11 måneder
1 - 2 år
Mer enn 2 år
4) Er moren din i arbeid? (sett ett eller flere kryss)
Ja, heltid
Ja, deltid
Arbeidsledig
Uførerygdet
Hjemmeværende
Går på skole, kurs, e.l.
Pensjonist
Mor er død
Vet ikke
Annet
5) Er faren din i arbeid? (sett ett eller flere kryss)
Ja, heltid
Ja, deltid
Arbeidsledig
Uførerygdet
Hjemmeværende
Går på skole, kurs, e.l.
Pensjonist
Far er død
Vet ikke
Annet
6) Hva er den høyeste fullførte utdanningen til dine foreldre? (sett
kryss for alle utdanningene du vet om for mor og far)
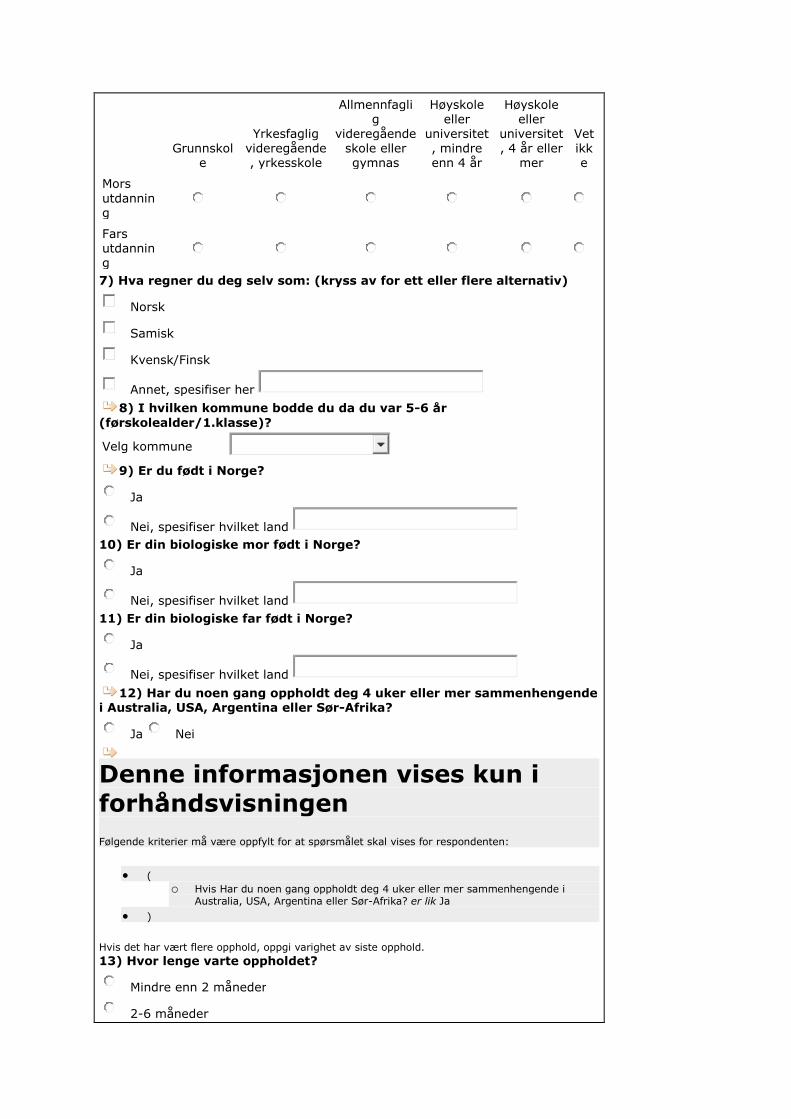
Grunnskol
e
Yrkesfaglig videregående, yrkesskole
Allmennfaglig
videregående skole eller gymnas
Høyskole eller
universitet, mindre enn 4 år
Høyskole eller
universitet, 4 år eller
mer
Vet ikke
Mors
utdanning
Fars utdanning
7) Hva regner du deg selv som: (kryss av for ett eller flere alternativ)
Norsk
Samisk
Kvensk/Finsk
Annet, spesifiser her
8) I hvilken kommune bodde du da du var 5-6 år
(førskolealder/1.klasse)?
Velg kommune
9) Er du født i Norge?
Ja
Nei, spesifiser hvilket land
10) Er din biologiske mor født i Norge?
Ja
Nei, spesifiser hvilket land
11) Er din biologiske far født i Norge?
Ja
Nei, spesifiser hvilket land
12) Har du noen gang oppholdt deg 4 uker eller mer sammenhengende i Australia, USA, Argentina eller Sør-Afrika?
Ja Nei
Denne informasjonen vises kun i
forhåndsvisningen
Følgende kriterier må være oppfylt for at spørsmålet skal vises for respondenten:
(
o Hvis Har du noen gang oppholdt deg 4 uker eller mer sammenhengende i Australia, USA, Argentina eller Sør-Afrika? er lik Ja
)
Hvis det har vært flere opphold, oppgi varighet av siste opphold.
13) Hvor lenge varte oppholdet?
Mindre enn 2 måneder
2-6 måneder

Mer enn 6 måneder
Denne informasjonen vises kun i
forhåndsvisningen
Følgende kriterier må være oppfylt for at spørsmålet skal vises for respondenten:
(
o Hvis Har du noen gang oppholdt deg 4 uker eller mer sammenhengende i Australia, USA, Argentina eller Sør-Afrika? er lik Ja
)
Hvis det har vært flere opphold, oppgi når du hadde siste opphold.
14) Når var oppholdet? (Oppgi årstall når oppholdet sluttet - 4 siffer)
VENNER OG SKOLE
15) Har du vurdert å avbryte eller ta pause fra den videregående
opplæringen du er i gang med?
Ja Nei
16) Hvor sannsynlig er det at du fullfører den utdanningen du er i gang
med?
Liten - kommer til å slutte
God - kommer sannsynligvis til å fullføre
Stor - Kommer helt sikkert til å fullføre
Vet ikke
17) Hvor mange tekstmeldinger (SMS/MMS) sendte du med mobiltelefon i går?
Ingen
1-5 meldinger
6-10 meldinger
11-20 meldinger
21-50 meldinger
Mer enn 50 meldinger
18) Nedenfor er det noen spørsmål om hvordan du synes du selv er.
Kryss av for det som passer best for deg.
Stemmer
svært godt
Stemmer nokså godt
Stemmer nokså dårlig
Stemmer svært dårlig
Jeg synes det er ganske vanskelig å få
venner
Jeg har mange venner
Andre ungdommer har vanskelig for å like meg
Jeg er populær blant jevnaldrende
Jeg føler at jevnaldrende godtar meg
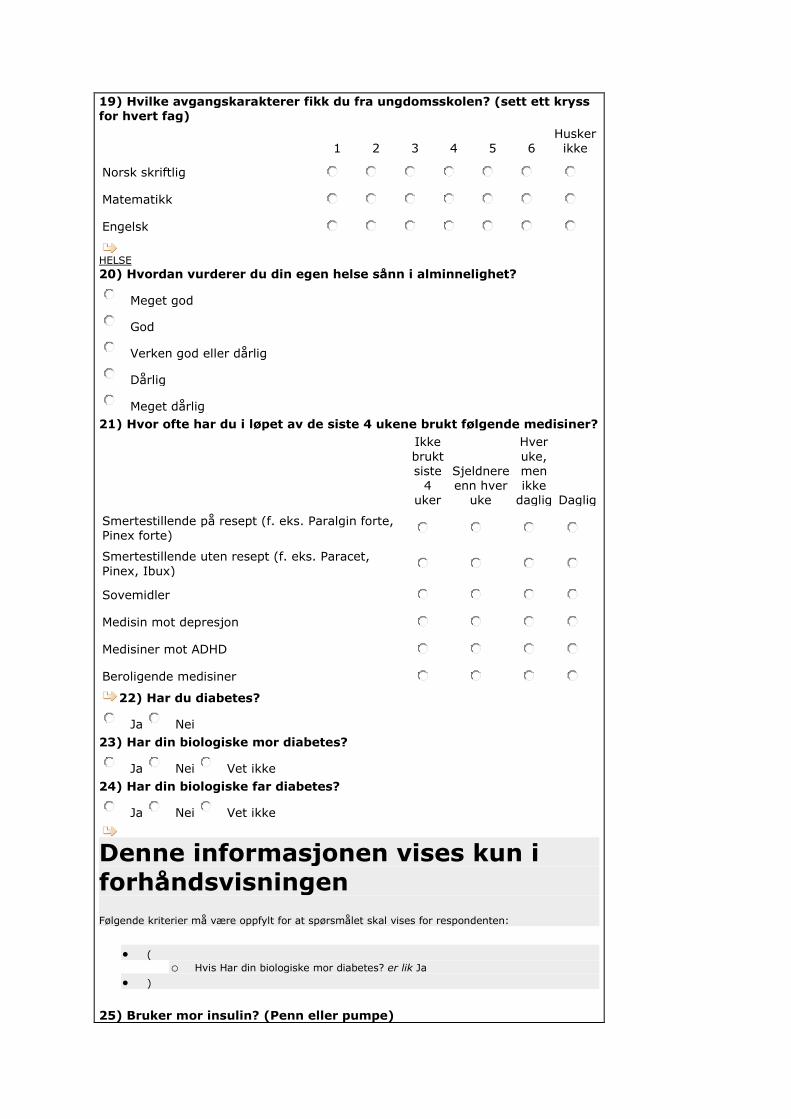
19) Hvilke avgangskarakterer fikk du fra ungdomsskolen? (sett ett kryss for hvert fag)
1 2 3 4 5 6
Husker ikke
Norsk skriftlig
Matematikk
Engelsk
HELSE
20) Hvordan vurderer du din egen helse sånn i alminnelighet?
Meget god
God
Verken god eller dårlig
Dårlig
Meget dårlig
21) Hvor ofte har du i løpet av de siste 4 ukene brukt følgende medisiner?
Ikke
brukt siste
4 uker
Sjeldnere enn hver
uke
Hver
uke, men ikke
daglig Daglig
Smertestillende på resept (f. eks. Paralgin forte, Pinex forte)
Smertestillende uten resept (f. eks. Paracet,
Pinex, Ibux)
Sovemidler
Medisin mot depresjon
Medisiner mot ADHD
Beroligende medisiner
22) Har du diabetes?
Ja Nei
23) Har din biologiske mor diabetes?
Ja Nei Vet ikke
24) Har din biologiske far diabetes?
Ja Nei Vet ikke
Denne informasjonen vises kun i forhåndsvisningen
Følgende kriterier må være oppfylt for at spørsmålet skal vises for respondenten:
(
o Hvis Har din biologiske mor diabetes? er lik Ja
)
25) Bruker mor insulin? (Penn eller pumpe)
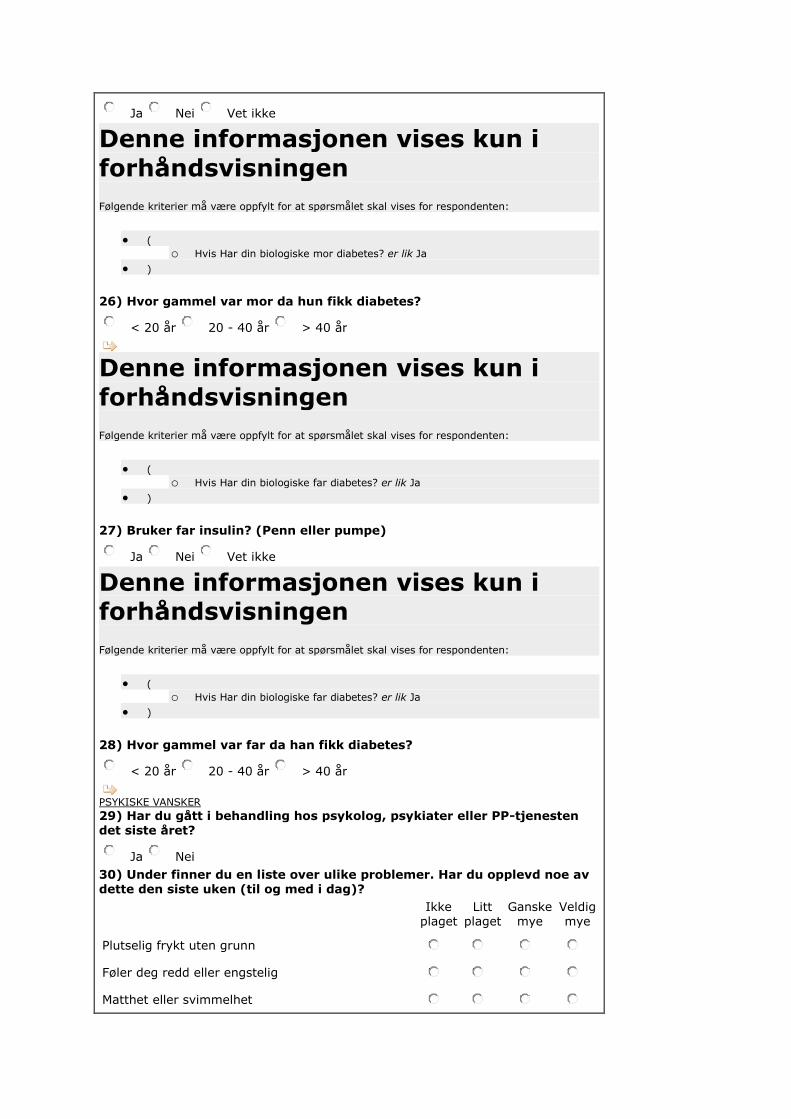
Ja Nei Vet ikke
Denne informasjonen vises kun i
forhåndsvisningen
Følgende kriterier må være oppfylt for at spørsmålet skal vises for respondenten:
(
o Hvis Har din biologiske mor diabetes? er lik Ja
)
26) Hvor gammel var mor da hun fikk diabetes?
< 20 år 20 - 40 år > 40 år
Denne informasjonen vises kun i
forhåndsvisningen
Følgende kriterier må være oppfylt for at spørsmålet skal vises for respondenten:
(
o Hvis Har din biologiske far diabetes? er lik Ja
)
27) Bruker far insulin? (Penn eller pumpe)
Ja Nei Vet ikke
Denne informasjonen vises kun i forhåndsvisningen
Følgende kriterier må være oppfylt for at spørsmålet skal vises for respondenten:
(
o Hvis Har din biologiske far diabetes? er lik Ja
)
28) Hvor gammel var far da han fikk diabetes?
< 20 år 20 - 40 år > 40 år
PSYKISKE VANSKER
29) Har du gått i behandling hos psykolog, psykiater eller PP-tjenesten det siste året?
Ja Nei
30) Under finner du en liste over ulike problemer. Har du opplevd noe av dette den siste uken (til og med i dag)?
Ikke
plaget Litt
plaget Ganske
mye Veldig mye
Plutselig frykt uten grunn
Føler deg redd eller engstelig
Matthet eller svimmelhet
Føler deg anspent eller oppjaget
Lett for å klandre deg selv
Søvnproblemer
Nedtrykt, tungsindig
Følelse av å være unyttig, lite verdt
Følelse av at alt er et slit
Følelse av håpløshet med hensyn til framtida
31) De følgende spørsmålene handler om hva du følte og gjorde de siste to ukene.
Riktig
Noen ganger riktig
Ikke riktig
Jeg var lei meg eller ulykkelig
Jeg følte meg så trøtt at jeg bare ble sittende uten å gjøre noen ting
Jeg var veldig rastløs
Jeg var ikke glad for noe
Jeg følte meg lite verdt
Jeg gråt mye
Jeg hatet meg selv
Jeg tenkte at jeg aldri kunne bli så god som andre ungdommer
Jeg følte meg ensom
Jeg tenkte at ingen egentlig var glad i meg
Jeg følte meg som et dårlig menneske
Jeg gjorde alt galt
Jeg syntes det var vanskelig å tenke klart eller å konsentrere meg
Denne informasjonen vises kun i forhåndsvisningen
Følgende kriterier må være oppfylt for at spørsmålet skal vises for respondenten:
(
o Hvis Er du: er lik Jente
)
PUBERTET Her har vi noen spørsmål om kroppslige forandringer som skjer gjennom ungdomstiden:
32) Har du fått menstruasjon?
Ja Nei
Denne informasjonen vises kun i forhåndsvisningen
Følgende kriterier må være oppfylt for at spørsmålet skal vises for respondenten:
(
o Hvis Har du fått menstruasjon? er lik Ja
)
Hvor gammel var du da du fikk menstruasjon første gang?
33) År
Velg alternativ
Denne informasjonen vises kun i forhåndsvisningen
Følgende kriterier må være oppfylt for at spørsmålet skal vises for respondenten:
(
o Hvis Har du fått menstruasjon? er lik Ja
)
34) Måneder
Velg alternativ
Denne informasjonen vises kun i
forhåndsvisningen
Følgende kriterier må være oppfylt for at spørsmålet skal vises for respondenten:
(
o Hvis Har du fått menstruasjon? er lik Nei
)
35) Har du fått eller begynt å få kjønnshår?
Ja Nei
Denne informasjonen vises kun i
forhåndsvisningen
Følgende kriterier må være oppfylt for at spørsmålet skal vises for respondenten:
(
o Hvis Har du fått menstruasjon? er lik Nei
)
36) Har du fått eller begynt å få bryster?
Ja Nei
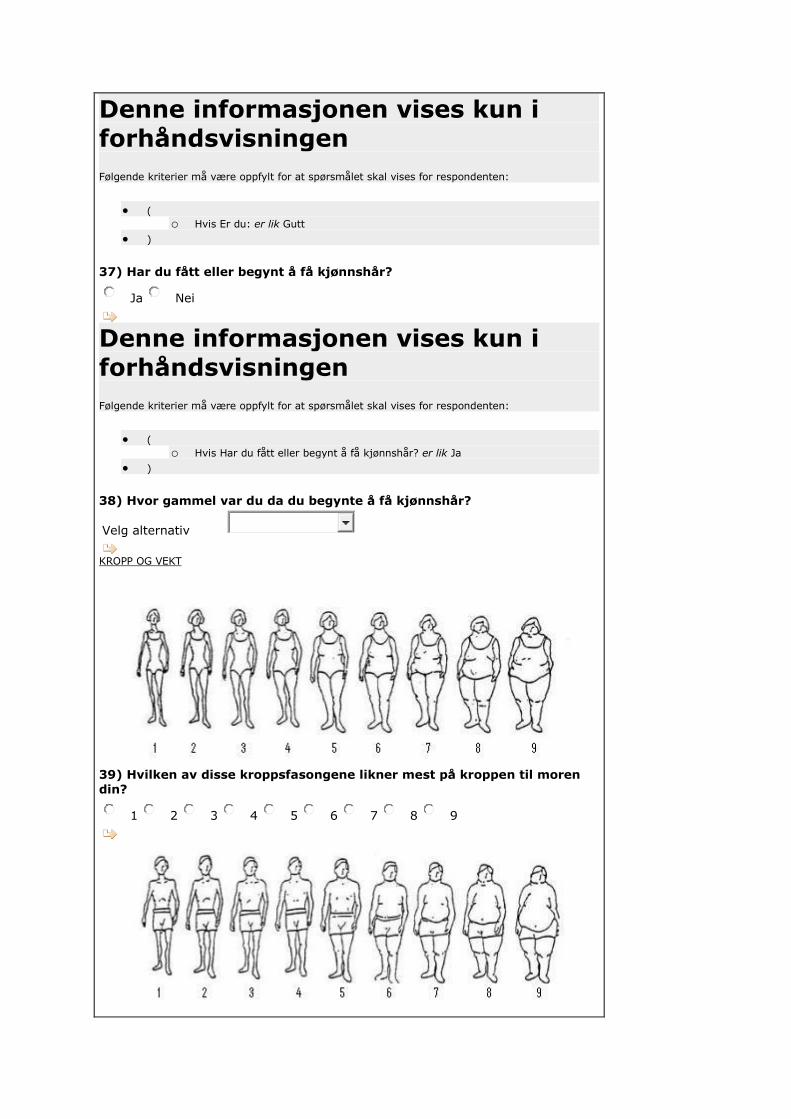
Denne informasjonen vises kun i forhåndsvisningen
Følgende kriterier må være oppfylt for at spørsmålet skal vises for respondenten:
(
o Hvis Er du: er lik Gutt
)
37) Har du fått eller begynt å få kjønnshår?
Ja Nei
Denne informasjonen vises kun i forhåndsvisningen
Følgende kriterier må være oppfylt for at spørsmålet skal vises for respondenten:
(
o Hvis Har du fått eller begynt å få kjønnshår? er lik Ja
)
38) Hvor gammel var du da du begynte å få kjønnshår?
Velg alternativ
KROPP OG VEKT
39) Hvilken av disse kroppsfasongene likner mest på kroppen til moren
din?
1 2 3 4 5 6 7 8 9
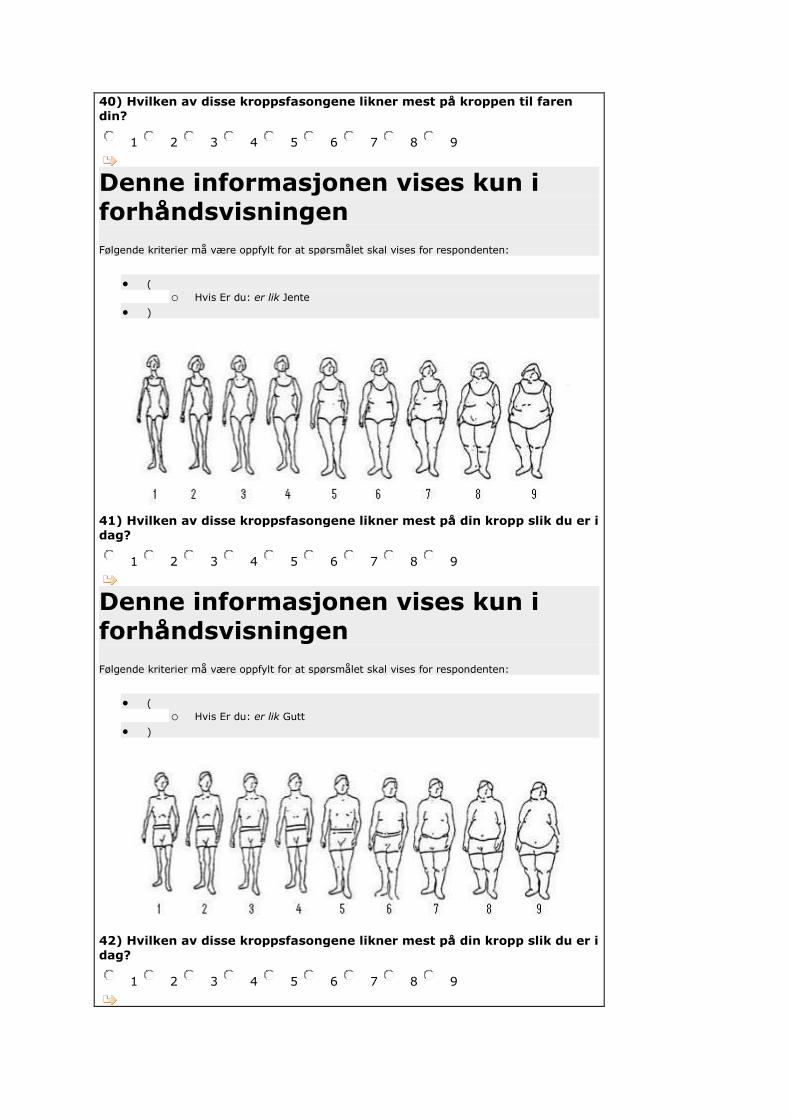
40) Hvilken av disse kroppsfasongene likner mest på kroppen til faren din?
1 2 3 4 5 6 7 8 9
Denne informasjonen vises kun i forhåndsvisningen
Følgende kriterier må være oppfylt for at spørsmålet skal vises for respondenten:
(
o Hvis Er du: er lik Jente
)
41) Hvilken av disse kroppsfasongene likner mest på din kropp slik du er i dag?
1 2 3 4 5 6 7 8 9
Denne informasjonen vises kun i forhåndsvisningen
Følgende kriterier må være oppfylt for at spørsmålet skal vises for respondenten:
(
o Hvis Er du: er lik Gutt
)
42) Hvilken av disse kroppsfasongene likner mest på din kropp slik du er i dag?
1 2 3 4 5 6 7 8 9
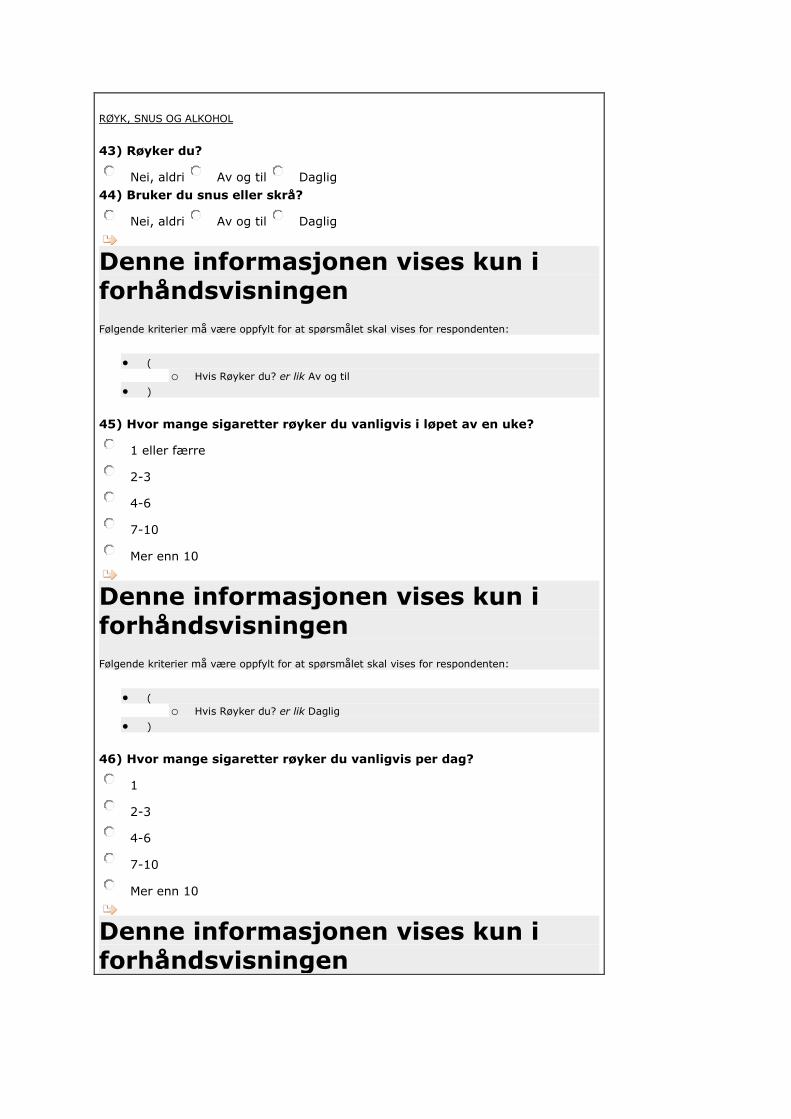
RØYK, SNUS OG ALKOHOL
43) Røyker du?
Nei, aldri Av og til Daglig
44) Bruker du snus eller skrå?
Nei, aldri Av og til Daglig
Denne informasjonen vises kun i forhåndsvisningen
Følgende kriterier må være oppfylt for at spørsmålet skal vises for respondenten:
(
o Hvis Røyker du? er lik Av og til
)
45) Hvor mange sigaretter røyker du vanligvis i løpet av en uke?
1 eller færre
2-3
4-6
7-10
Mer enn 10
Denne informasjonen vises kun i forhåndsvisningen
Følgende kriterier må være oppfylt for at spørsmålet skal vises for respondenten:
(
o Hvis Røyker du? er lik Daglig
)
46) Hvor mange sigaretter røyker du vanligvis per dag?
1
2-3
4-6
7-10
Mer enn 10
Denne informasjonen vises kun i forhåndsvisningen

Følgende kriterier må være oppfylt for at spørsmålet skal vises for respondenten:
(
o Hvis Bruker du snus eller skrå? er lik Av og til
)
47) Hvor mange priser snus/skrå bruker du vanligvis i løpet av en uke?
1 eller færre
2-3
4-6
7-10
Mer enn 10
Denne informasjonen vises kun i forhåndsvisningen
Følgende kriterier må være oppfylt for at spørsmålet skal vises for respondenten:
(
o Hvis Bruker du snus eller skrå? er lik Daglig
)
48) Hvor mange priser snus/skrå bruker du per dag?
1
2-3
4-6
7-10
Mer enn 10
49) Hvor ofte drikker du alkohol?
Aldri
1 gang per måned eller sjeldnere
2-4 ganger per måned
2-3 ganger per uke
4 eller flere ganger per uke
Denne informasjonen vises kun i
forhåndsvisningen
Følgende kriterier må være oppfylt for at spørsmålet skal vises for respondenten:
(
o Hvis Hvor ofte drikker du alkohol? er lik 1 gang per måned eller sjeldnere
o eller
o Hvis Hvor ofte drikker du alkohol? er lik 4 eller flere ganger per uke

o eller
o Hvis Hvor ofte drikker du alkohol? er lik 2-3 ganger per uke
o eller
o Hvis Hvor ofte drikker du alkohol? er lik 2-4 ganger per måned
)
50) Hvor mange enheter alkohol (en øl, ett glass vin eller en drink) tar du vanligvis når du drikker?
1-2
3-4
5-6
7-9
10 eller flere
Denne informasjonen vises kun i
forhåndsvisningen
Følgende kriterier må være oppfylt for at spørsmålet skal vises for respondenten:
(
o Hvis Hvor ofte drikker du alkohol? er lik 1 gang per måned eller sjeldnere
o eller
o Hvis Hvor ofte drikker du alkohol? er lik 4 eller flere ganger per uke
o eller
o Hvis Hvor ofte drikker du alkohol? er lik 2-3 ganger per uke
o eller
o Hvis Hvor ofte drikker du alkohol? er lik 2-4 ganger per måned
)
51) Hvor ofte drikker du 6 eller flere enheter alkohol ved en anledning?
Aldri
Sjeldnere enn 1 gang per måned
1 gang per måned
1 gang per uke
Daglig eller nesten daglig
FYSISK AKTIVITET
52) Hvilken beskrivelse passer best når det gjelder din fysiske aktivitet på fritiden det siste året?
Sitter ved PC/TV, leser eller annen stillesittende aktivitet.
Går, sykler eller beveger deg på annen måte minst 4 timer i uken (her skal
du også regne med tur til/fra skolen, shopping, søndagsturer med mer).
Driver med idrett/trening, tyngre utearbeid, snømåking eller liknende minst
4 timer i uka.
Trener hardt eller driver konkurranseidrett regelmessig og flere ganger i
uka.
53) Hvordan kommer du deg vanligvis til og fra skolen i
sommerhalvåret?
Med bil, motorsykkel/moped

Med buss
Med sykkel
Går
54) Hvor lang tid bruker du vanligvis til og fra skolen (en vei) i sommerhalvåret?
Mindre enn 5 minutter
6 til 15 minutter
16 til 30 minutter
1/2 til 1 time
Mer enn 1 time
55) Hvordan kommer du deg vanligvis til og fra skolen i
vinterhalvåret?
Med bil, motorsykkel/moped
Med buss
Med sykkel
Går
56) Hvor lang tid bruker du vanligvis til og fra skolen (en vei) i vinterhalvåret?
Mindre enn 5 minutter
6 til 15 minutter
16 til 30 minutter
1/2 til 1 time
Mer enn 1 time
57) Driver du med idrett eller fysisk aktivitet (f.eks. skateboard,
fotball, dans, løping) utenom skoletid?
Ja Nei
Denne informasjonen vises kun i forhåndsvisningen
Følgende kriterier må være oppfylt for at spørsmålet skal vises for respondenten:
(
o Hvis Driver du med idrett eller fysisk aktivitet (f.eks. skateboard, fotball, dans, løping) utenom skoletid? er lik Ja
)
58) Hvor mange dager i uken driver du med idrett/fysisk aktivitet utenom
skoletid?
Aldri
Sjeldnere enn 1 dag i uka
1 dag i uka
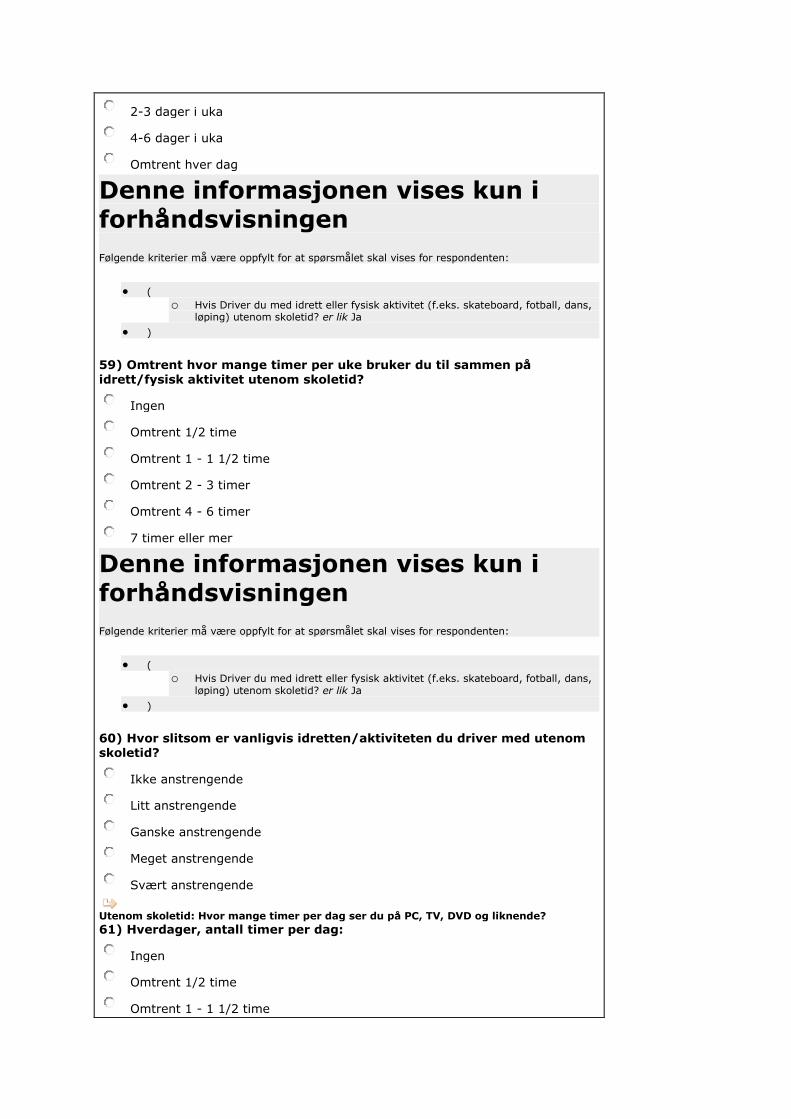
2-3 dager i uka
4-6 dager i uka
Omtrent hver dag
Denne informasjonen vises kun i forhåndsvisningen
Følgende kriterier må være oppfylt for at spørsmålet skal vises for respondenten:
(
o Hvis Driver du med idrett eller fysisk aktivitet (f.eks. skateboard, fotball, dans, løping) utenom skoletid? er lik Ja
)
59) Omtrent hvor mange timer per uke bruker du til sammen på
idrett/fysisk aktivitet utenom skoletid?
Ingen
Omtrent 1/2 time
Omtrent 1 - 1 1/2 time
Omtrent 2 - 3 timer
Omtrent 4 - 6 timer
7 timer eller mer
Denne informasjonen vises kun i forhåndsvisningen
Følgende kriterier må være oppfylt for at spørsmålet skal vises for respondenten:
(
o Hvis Driver du med idrett eller fysisk aktivitet (f.eks. skateboard, fotball, dans, løping) utenom skoletid? er lik Ja
)
60) Hvor slitsom er vanligvis idretten/aktiviteten du driver med utenom skoletid?
Ikke anstrengende
Litt anstrengende
Ganske anstrengende
Meget anstrengende
Svært anstrengende
Utenom skoletid: Hvor mange timer per dag ser du på PC, TV, DVD og liknende?
61) Hverdager, antall timer per dag:
Ingen
Omtrent 1/2 time
Omtrent 1 - 1 1/2 time
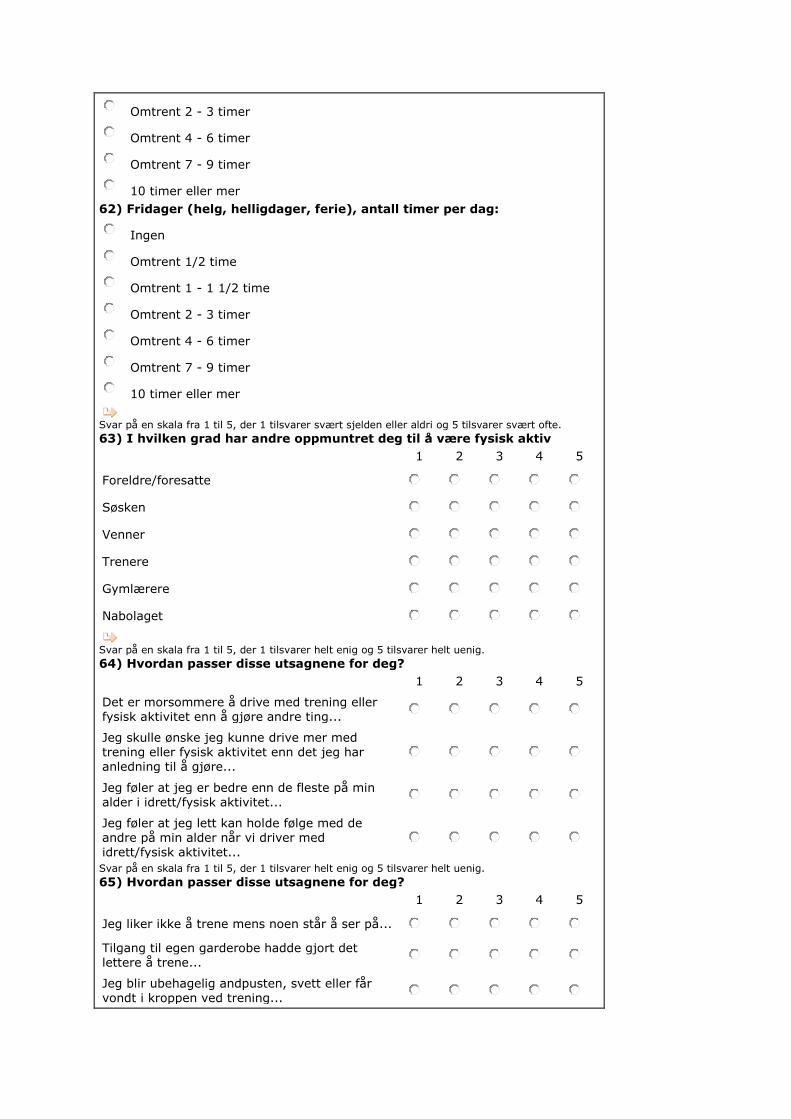
Omtrent 2 - 3 timer
Omtrent 4 - 6 timer
Omtrent 7 - 9 timer
10 timer eller mer
62) Fridager (helg, helligdager, ferie), antall timer per dag:
Ingen
Omtrent 1/2 time
Omtrent 1 - 1 1/2 time
Omtrent 2 - 3 timer
Omtrent 4 - 6 timer
Omtrent 7 - 9 timer
10 timer eller mer
Svar på en skala fra 1 til 5, der 1 tilsvarer svært sjelden eller aldri og 5 tilsvarer svært ofte.
63) I hvilken grad har andre oppmuntret deg til å være fysisk aktiv
1 2 3 4 5
Foreldre/foresatte
Søsken
Venner
Trenere
Gymlærere
Nabolaget
Svar på en skala fra 1 til 5, der 1 tilsvarer helt enig og 5 tilsvarer helt uenig.
64) Hvordan passer disse utsagnene for deg?
1 2 3 4 5
Det er morsommere å drive med trening eller fysisk aktivitet enn å gjøre andre ting...
Jeg skulle ønske jeg kunne drive mer med trening eller fysisk aktivitet enn det jeg har anledning til å gjøre...
Jeg føler at jeg er bedre enn de fleste på min alder i idrett/fysisk aktivitet...
Jeg føler at jeg lett kan holde følge med de andre på min alder når vi driver med idrett/fysisk aktivitet...
Svar på en skala fra 1 til 5, der 1 tilsvarer helt enig og 5 tilsvarer helt uenig.
65) Hvordan passer disse utsagnene for deg?
1 2 3 4 5
Jeg liker ikke å trene mens noen står å ser på...
Tilgang til egen garderobe hadde gjort det lettere å trene...
Jeg blir ubehagelig andpusten, svett eller får vondt i kroppen ved trening...
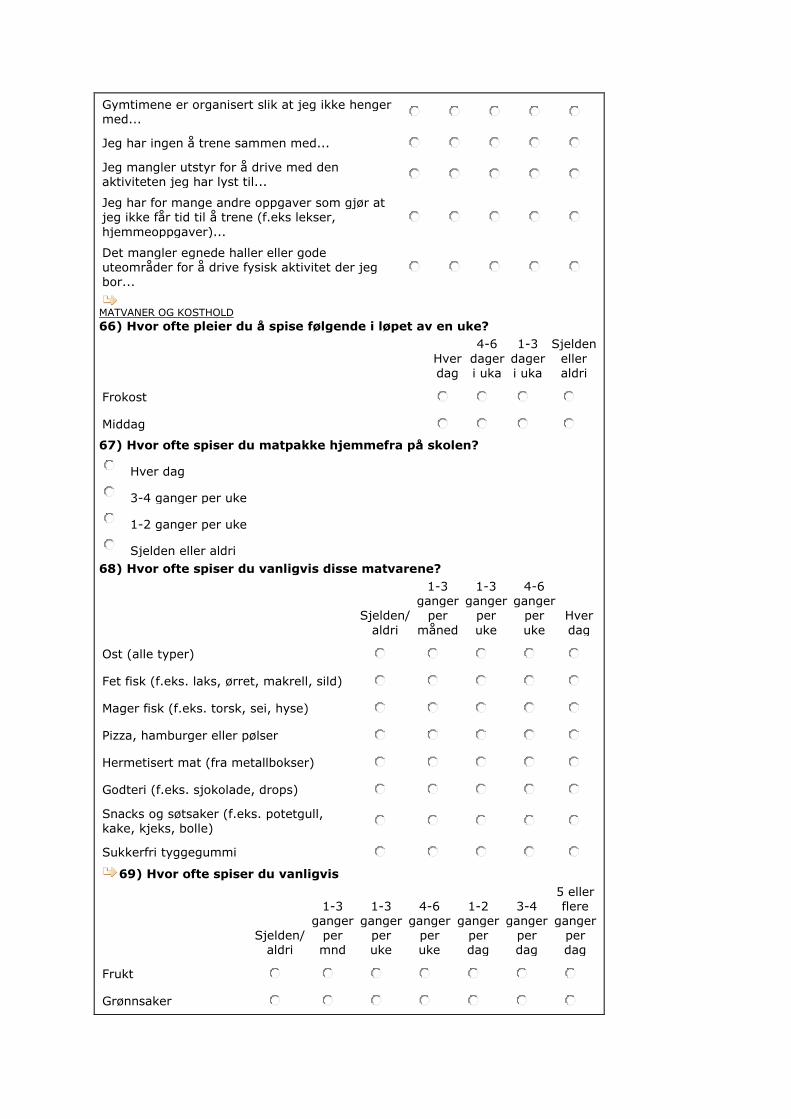
Gymtimene er organisert slik at jeg ikke henger med...
Jeg har ingen å trene sammen med...
Jeg mangler utstyr for å drive med den aktiviteten jeg har lyst til...
Jeg har for mange andre oppgaver som gjør at jeg ikke får tid til å trene (f.eks lekser,
hjemmeoppgaver)...
Det mangler egnede haller eller gode uteområder for å drive fysisk aktivitet der jeg bor...
MATVANER OG KOSTHOLD
66) Hvor ofte pleier du å spise følgende i løpet av en uke?
Hver
dag
4-6
dager
i uka
1-3
dager
i uka
Sjelden
eller
aldri
Frokost
Middag
67) Hvor ofte spiser du matpakke hjemmefra på skolen?
Hver dag
3-4 ganger per uke
1-2 ganger per uke
Sjelden eller aldri
68) Hvor ofte spiser du vanligvis disse matvarene?
Sjelden/
aldri
1-3 ganger
per
måned
1-3 ganger
per
uke
4-6 ganger
per
uke
Hver
dag
Ost (alle typer)
Fet fisk (f.eks. laks, ørret, makrell, sild)
Mager fisk (f.eks. torsk, sei, hyse)
Pizza, hamburger eller pølser
Hermetisert mat (fra metallbokser)
Godteri (f.eks. sjokolade, drops)
Snacks og søtsaker (f.eks. potetgull, kake, kjeks, bolle)
Sukkerfri tyggegummi
69) Hvor ofte spiser du vanligvis
Sjelden/
aldri
1-3 ganger
per mnd
1-3 ganger
per uke
4-6 ganger
per uke
1-2 ganger
per dag
3-4 ganger
per dag
5 eller flere
ganger per dag
Frukt
Grønnsaker
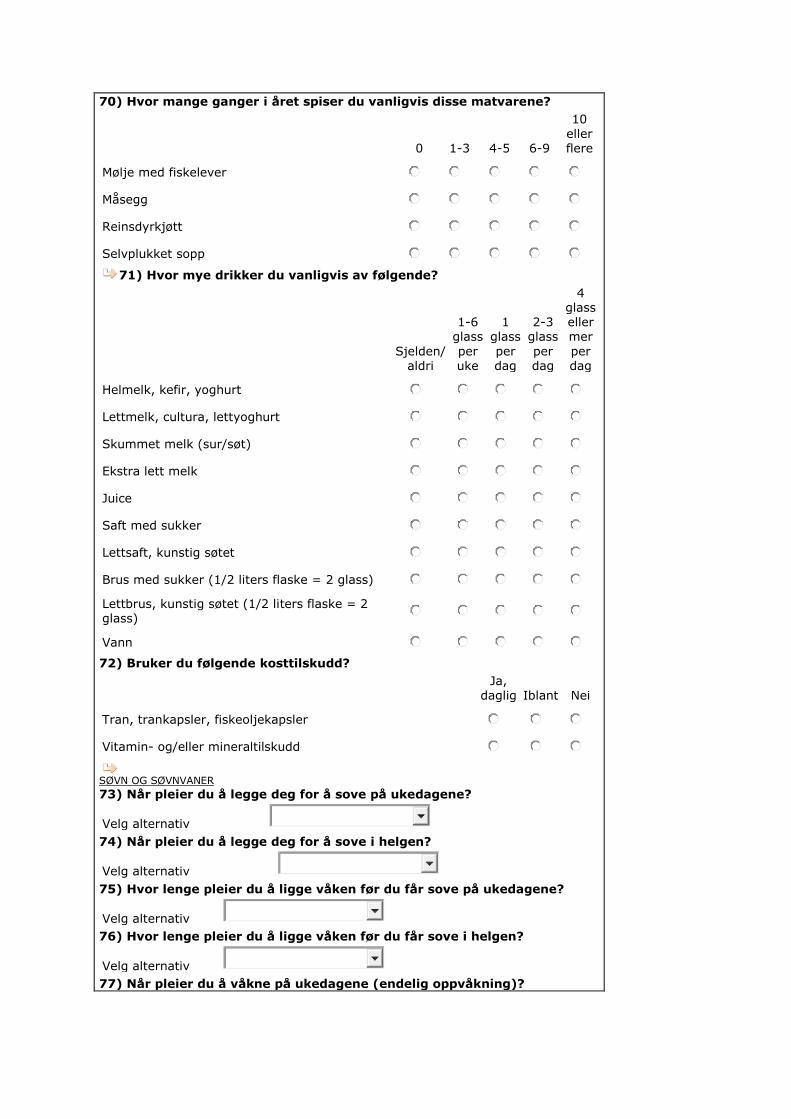
70) Hvor mange ganger i året spiser du vanligvis disse matvarene?
0 1-3 4-5 6-9
10
eller flere
Mølje med fiskelever
Måsegg
Reinsdyrkjøtt
Selvplukket sopp
71) Hvor mye drikker du vanligvis av følgende?
Sjelden/ aldri
1-6 glass
per uke
1 glass
per dag
2-3 glass
per dag
4 glass eller mer
per dag
Helmelk, kefir, yoghurt
Lettmelk, cultura, lettyoghurt
Skummet melk (sur/søt)
Ekstra lett melk
Juice
Saft med sukker
Lettsaft, kunstig søtet
Brus med sukker (1/2 liters flaske = 2 glass)
Lettbrus, kunstig søtet (1/2 liters flaske = 2 glass)
Vann
72) Bruker du følgende kosttilskudd?
Ja,
daglig Iblant Nei
Tran, trankapsler, fiskeoljekapsler
Vitamin- og/eller mineraltilskudd
SØVN OG SØVNVANER
73) Når pleier du å legge deg for å sove på ukedagene?
Velg alternativ
74) Når pleier du å legge deg for å sove i helgen?
Velg alternativ
75) Hvor lenge pleier du å ligge våken før du får sove på ukedagene?
Velg alternativ
76) Hvor lenge pleier du å ligge våken før du får sove i helgen?
Velg alternativ
77) Når pleier du å våkne på ukedagene (endelig oppvåkning)?
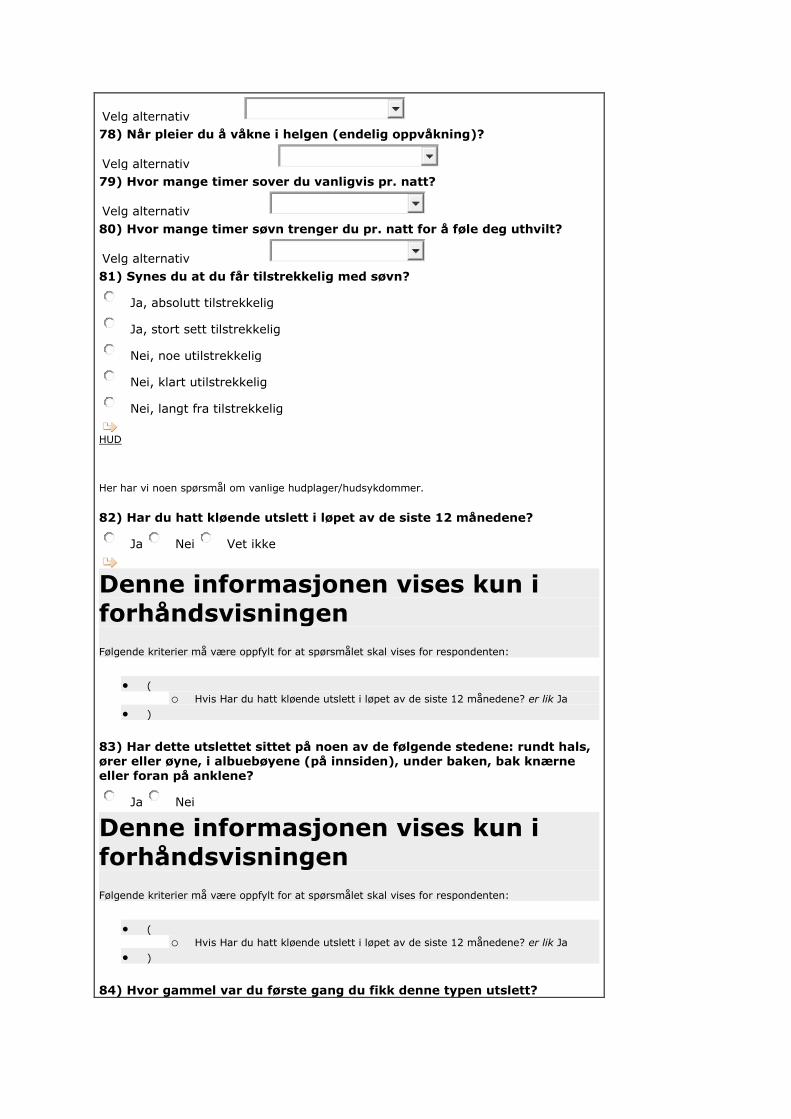
Velg alternativ
78) Når pleier du å våkne i helgen (endelig oppvåkning)?
Velg alternativ
79) Hvor mange timer sover du vanligvis pr. natt?
Velg alternativ
80) Hvor mange timer søvn trenger du pr. natt for å føle deg uthvilt?
Velg alternativ
81) Synes du at du får tilstrekkelig med søvn?
Ja, absolutt tilstrekkelig
Ja, stort sett tilstrekkelig
Nei, noe utilstrekkelig
Nei, klart utilstrekkelig
Nei, langt fra tilstrekkelig
HUD Her har vi noen spørsmål om vanlige hudplager/hudsykdommer.
82) Har du hatt kløende utslett i løpet av de siste 12 månedene?
Ja Nei Vet ikke
Denne informasjonen vises kun i forhåndsvisningen
Følgende kriterier må være oppfylt for at spørsmålet skal vises for respondenten:
(
o Hvis Har du hatt kløende utslett i løpet av de siste 12 månedene? er lik Ja
)
83) Har dette utslettet sittet på noen av de følgende stedene: rundt hals, ører eller øyne, i albuebøyene (på innsiden), under baken, bak knærne eller foran på anklene?
Ja Nei
Denne informasjonen vises kun i forhåndsvisningen
Følgende kriterier må være oppfylt for at spørsmålet skal vises for respondenten:
(
o Hvis Har du hatt kløende utslett i løpet av de siste 12 månedene? er lik Ja
)
84) Hvor gammel var du første gang du fikk denne typen utslett?
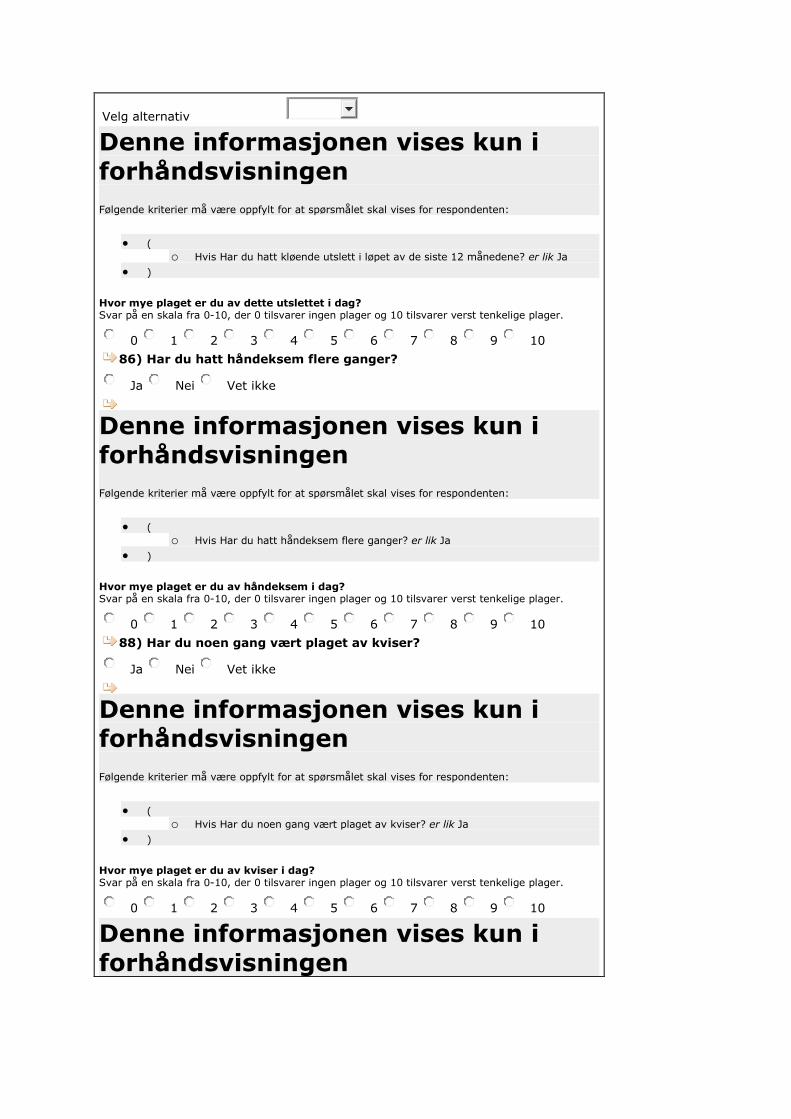
Velg alternativ
Denne informasjonen vises kun i
forhåndsvisningen
Følgende kriterier må være oppfylt for at spørsmålet skal vises for respondenten:
(
o Hvis Har du hatt kløende utslett i løpet av de siste 12 månedene? er lik Ja
)
Hvor mye plaget er du av dette utslettet i dag? Svar på en skala fra 0-10, der 0 tilsvarer ingen plager og 10 tilsvarer verst tenkelige plager.
0 1 2 3 4 5 6 7 8 9 10
86) Har du hatt håndeksem flere ganger?
Ja Nei Vet ikke
Denne informasjonen vises kun i forhåndsvisningen
Følgende kriterier må være oppfylt for at spørsmålet skal vises for respondenten:
(
o Hvis Har du hatt håndeksem flere ganger? er lik Ja
)
Hvor mye plaget er du av håndeksem i dag? Svar på en skala fra 0-10, der 0 tilsvarer ingen plager og 10 tilsvarer verst tenkelige plager.
0 1 2 3 4 5 6 7 8 9 10
88) Har du noen gang vært plaget av kviser?
Ja Nei Vet ikke
Denne informasjonen vises kun i forhåndsvisningen
Følgende kriterier må være oppfylt for at spørsmålet skal vises for respondenten:
(
o Hvis Har du noen gang vært plaget av kviser? er lik Ja
)
Hvor mye plaget er du av kviser i dag? Svar på en skala fra 0-10, der 0 tilsvarer ingen plager og 10 tilsvarer verst tenkelige plager.
0 1 2 3 4 5 6 7 8 9 10
Denne informasjonen vises kun i
forhåndsvisningen

Følgende kriterier må være oppfylt for at spørsmålet skal vises for respondenten:
(
o Hvis Har du noen gang vært plaget av kviser? er lik Ja
)
90) Har du noen gang oppsøkt lege på grunn av kviser?
Ja Nei
Denne informasjonen vises kun i forhåndsvisningen
Følgende kriterier må være oppfylt for at spørsmålet skal vises for respondenten:
(
o Hvis Har du noen gang oppsøkt lege på grunn av kviser? er lik Ja
)
91) Har du fått noen av disse behandlingene av lege?
Ja Nei
Vet ikke
Lokalbehandling (f.eks. kremer eller oppløsninger)
Antibiotika tabletter (f.eks. Tetracyclin)
Roaccutan tabletter
92) Har du eller har du noen gang hatt psoriasis?
Ja Nei Vet ikke
Denne informasjonen vises kun i forhåndsvisningen
Følgende kriterier må være oppfylt for at spørsmålet skal vises for respondenten:
(
o Hvis Har du eller har du noen gang hatt psoriasis? er lik Ja
)
Hvor mye plaget er du av psoriasis i dag? Svar på en skala fra 0-10, der 0 tilsvarer ingen plager og 10 tilsvarer verst tenkelige plager.
0 1 2 3 4 5 6 7 8 9 10
Verkebyller er svært store kviser som er ømme/smertefulle og som ofte gir arr.
94) Har du noen gang hatt verkebyller under armene/armhulene?
Ja
Nei
Vet ikke
95) Har du noen gang oppsøkt lege pga verkebyllene?
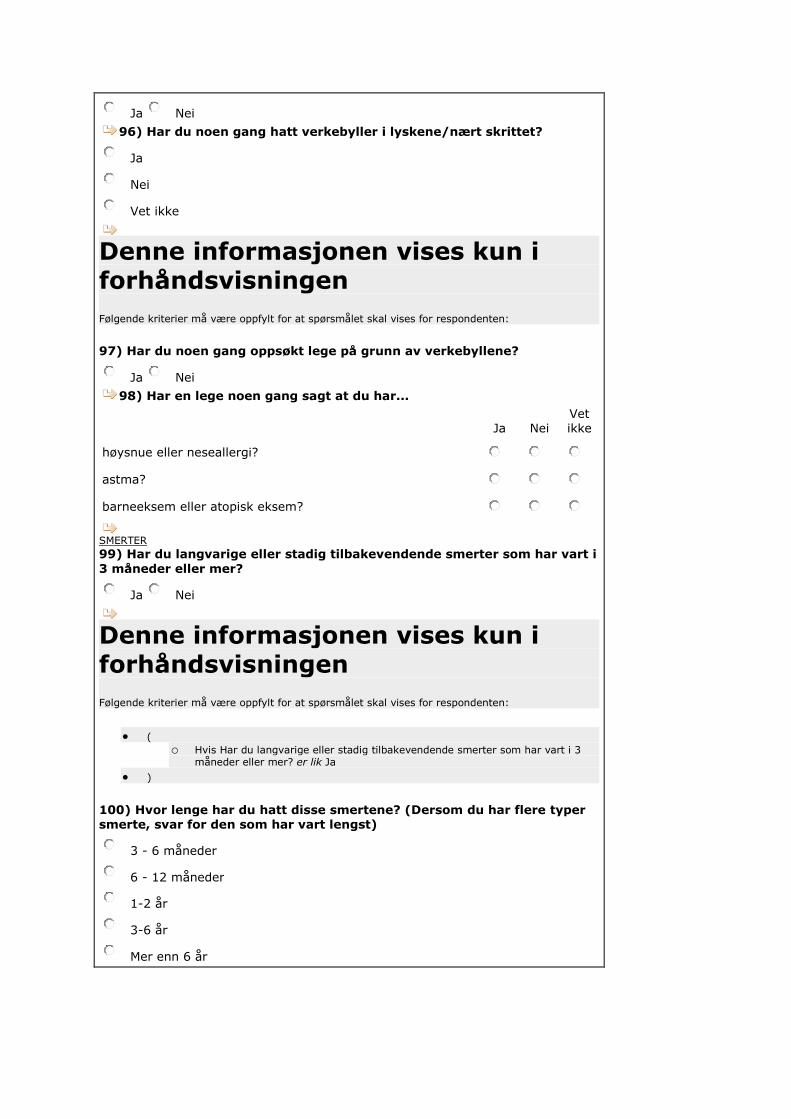
Ja Nei
96) Har du noen gang hatt verkebyller i lyskene/nært skrittet?
Ja
Nei
Vet ikke
Denne informasjonen vises kun i forhåndsvisningen
Følgende kriterier må være oppfylt for at spørsmålet skal vises for respondenten:
97) Har du noen gang oppsøkt lege på grunn av verkebyllene?
Ja Nei
98) Har en lege noen gang sagt at du har...
Ja Nei
Vet ikke
høysnue eller neseallergi?
astma?
barneeksem eller atopisk eksem?
SMERTER
99) Har du langvarige eller stadig tilbakevendende smerter som har vart i
3 måneder eller mer?
Ja Nei
Denne informasjonen vises kun i forhåndsvisningen
Følgende kriterier må være oppfylt for at spørsmålet skal vises for respondenten:
(
o Hvis Har du langvarige eller stadig tilbakevendende smerter som har vart i 3 måneder eller mer? er lik Ja
)
100) Hvor lenge har du hatt disse smertene? (Dersom du har flere typer smerte, svar for den som har vart lengst)
3 - 6 måneder
6 - 12 måneder
1-2 år
3-6 år
Mer enn 6 år
Denne informasjonen vises kun i forhåndsvisningen
Følgende kriterier må være oppfylt for at spørsmålet skal vises for respondenten:
(
o Hvis Har du langvarige eller stadig tilbakevendende smerter som har vart i 3 måneder eller mer? er lik Ja
)
101) Hvor ofte har du vanligvis disse smertene?
Hele tiden, uten opphør
Hver dag, men ikke hele tiden
Hver uke, men ikke hver dag
Sjeldnere enn hver uke
Denne informasjonen vises kun i forhåndsvisningen
Følgende kriterier må være oppfylt for at spørsmålet skal vises for respondenten:
(
o Hvis Har du langvarige eller stadig tilbakevendende smerter som har vart i 3 måneder eller mer? er lik Ja
)
Hvor er det vondt? (kryss av på alle aktuelle steder)
Venstre
side Høyre side
Skulder
Arm/albue
Hånd
Hofte
Lår/kne/legg
Ankel/fot
Denne informasjonen vises kun i forhåndsvisningen
Følgende kriterier må være oppfylt for at spørsmålet skal vises for respondenten:
(
o Hvis Har du langvarige eller stadig tilbakevendende smerter som har vart i 3 måneder eller mer? er lik Ja
)

Midten
Hode/ansikt
Kjeve/kjeveledd
Nakke
Øvre del av ryggen
Korsryggen
Bryst
Mage
Underliv/kjønnsorganer
Denne informasjonen vises kun i
forhåndsvisningen
Følgende kriterier må være oppfylt for at spørsmålet skal vises for respondenten:
(
o Hvis Har du langvarige eller stadig tilbakevendende smerter som har vart i 3 måneder eller mer? er lik Ja
)
104) Hva mener du er årsaken til smertene? (flere svar mulig)
PC-bruk, dataspill og lignende
Idrettsskade
Ulykke/skade
Kirurgisk inngrep/operasjon
Migrene/hodepine
Medfødt sykdom
Tannproblemer
Whiplash
Prolaps (skiveutglidning i ryggen)
Annet ryggproblem
Nerveskade
Mage- eller tarmsykdom
Annet, spesifiser her
Vet ikke
Denne informasjonen vises kun i forhåndsvisningen
Følgende kriterier må være oppfylt for at spørsmålet skal vises for respondenten:
(
o Hvis Har du langvarige eller stadig tilbakevendende smerter som har vart i 3 måneder eller mer? er lik Ja
)
Hvis du har langvarige smerter flere steder i kroppen, gjelder de 4 neste spørsmålene smerten som plager deg mest. Hvor sterke vil du si at smertene vanligvis er? Svar på en skala fra 0-10, der 0 tilsvarer ingen smerte og 10 tilsvarer verst tenkelig smerte. Dersom du har flere typer smerte, svar den som plager deg mest.
0 1 2 3 4 5 6 7 8 9 10
Denne informasjonen vises kun i
forhåndsvisningen
Følgende kriterier må være oppfylt for at spørsmålet skal vises for respondenten:
(
o Hvis Har du langvarige eller stadig tilbakevendende smerter som har vart i 3 måneder eller mer? er lik Ja
)
Hvor sterke er smertene når de er på sitt sterkeste? Svar på en skala fra 0-10, der 0 tilsvarer ingen smerte og 10 tilsvarer verst tenkelig smerte. Dersom du har flere typer smerte, svar den som plager deg mest.
0 1 2 3 4 5 6 7 8 9 10
Denne informasjonen vises kun i forhåndsvisningen
Følgende kriterier må være oppfylt for at spørsmålet skal vises for respondenten:
(
o Hvis Har du langvarige eller stadig tilbakevendende smerter som har vart i 3 måneder eller mer? er lik Ja
)
I hvor stor grad påvirker smertene søvnen din? Svar på en skala fra 0-10, der 0 tilsvarer ingen smerte og 10 tilsvarer verst tenkelig smerte. Dersom du har flere typer smerte, svar den som plager deg mest.
0 1 2 3 4 5 6 7 8 9 10
Denne informasjonen vises kun i forhåndsvisningen
Følgende kriterier må være oppfylt for at spørsmålet skal vises for respondenten:
(
o Hvis Har du langvarige eller stadig tilbakevendende smerter som har vart i 3 måneder eller mer? er lik Ja
)
I hvor stor grad hindrer smertene deg i å utføre vanlige aktiviteter hjemme og på skolen? Svar på en skala fra 0-10, der 0 tilsvarer ingen smerte og 10 tilsvarer verst tenkelig smerte. Dersom du har flere typer smerte, svar den som plager deg mest.
0 1 2 3 4 5 6 7 8 9 10
MAGE- OG TARMPROBLEMER
109) I løpet av de siste 2 månedene: Hvor ofte har du hatt smerte eller ubehag i magen?
Aldri
1-3 ganger i måneden
En gang i uka
Flere ganger i uka
Hver dag
Denne informasjonen vises kun i forhåndsvisningen
Følgende kriterier må være oppfylt for at spørsmålet skal vises for respondenten:
(
o Hvis I løpet av de siste 2 månedene: Hvor ofte har du hatt smerte eller ubehag i magen? er lik 1-3 ganger i måneden
o eller
o Hvis I løpet av de siste 2 månedene: Hvor ofte har du hatt smerte eller ubehag i magen? er lik Hver dag
o eller
o Hvis I løpet av de siste 2 månedene: Hvor ofte har du hatt smerte eller ubehag i magen? er lik Flere ganger i uka
o eller
o Hvis I løpet av de siste 2 månedene: Hvor ofte har du hatt smerte eller ubehag i magen? er lik En gang i uka
)
110) Hvor lenge har du vært plaget av smerte eller ubehag i magen?
Mindre enn 1 måned
2 måneder
3 måneder
4-11 måneder
Ett år eller mer
Denne informasjonen vises kun i
forhåndsvisningen
Følgende kriterier må være oppfylt for at spørsmålet skal vises for respondenten:
(
o Hvis Hvor lenge har du vært plaget av smerte eller ubehag i magen? er lik 2 måneder
o eller
o Hvis Hvor lenge har du vært plaget av smerte eller ubehag i magen? er likEtt år eller mer
o eller
o Hvis Hvor lenge har du vært plaget av smerte eller ubehag i magen? er lik4-11 måneder
o eller
o Hvis Hvor lenge har du vært plaget av smerte eller ubehag i magen? er lik 3 måneder
)
111) I hvilken del av magen er det du har hatt smerte eller ubehag?
(kryss av for alt som passer)
Over navlen
Rundt navlen
Nedenfor navlen
Denne informasjonen vises kun i forhåndsvisningen
Følgende kriterier må være oppfylt for at spørsmålet skal vises for respondenten:
(
o Hvis Hvor lenge har du vært plaget av smerte eller ubehag i magen? er lik 2 måneder
o eller
o Hvis Hvor lenge har du vært plaget av smerte eller ubehag i magen? er likEtt år eller mer
o eller
o Hvis Hvor lenge har du vært plaget av smerte eller ubehag i magen? er lik4-11 måneder
o eller
o Hvis Hvor lenge har du vært plaget av smerte eller ubehag i magen? er lik 3 måneder
)
112) Når du har smerter eller ubehag i magen, hvor lenge varer det vanligvis?
Mindre enn 1 time
1-2 timer
3-4 timer
Mesteparten av dagen
Hele døgnet
Denne informasjonen vises kun i forhåndsvisningen
Følgende kriterier må være oppfylt for at spørsmålet skal vises for respondenten:
(
o Hvis Hvor lenge har du vært plaget av smerte eller ubehag i magen? er lik 2 måneder
o eller

o Hvis Hvor lenge har du vært plaget av smerte eller ubehag i magen? er likEtt år eller mer
o eller
o Hvis Hvor lenge har du vært plaget av smerte eller ubehag i magen? er lik4-11 måneder
o eller
o Hvis Hvor lenge har du vært plaget av smerte eller ubehag i magen? er lik 3 måneder
)
Når du har smerte eller ubehag i magen, hvor sterke smerter har du vanligvis? Svar på en skala fra 0-10, der 0 tilsvarer ingen smerte og 10 tilsvarer verst tenkelig smerte. Dersom du har flere typer smerte, svar den som plager deg mest.
0 1 2 3 4 5 6 7 8 9 10
Denne informasjonen vises kun i forhåndsvisningen
Følgende kriterier må være oppfylt for at spørsmålet skal vises for respondenten:
(
o Hvis Hvor lenge har du vært plaget av smerte eller ubehag i magen? er lik 2 måneder
o eller
o Hvis Hvor lenge har du vært plaget av smerte eller ubehag i magen? er likEtt år eller mer
o eller
o Hvis Hvor lenge har du vært plaget av smerte eller ubehag i magen? er lik4-11 måneder
o eller
o Hvis Hvor lenge har du vært plaget av smerte eller ubehag i magen? er lik 3 måneder
)
114) Når du har smerter eller ubehag i magen, hvor ofte blir det bedre
etter at du har hatt avføring?
Sjelden eller aldri
En del ganger
For det meste/hver gang
Denne informasjonen vises kun i
forhåndsvisningen
Følgende kriterier må være oppfylt for at spørsmålet skal vises for respondenten:
(
o Hvis Hvor lenge har du vært plaget av smerte eller ubehag i magen? er lik 2 måneder
o eller
o Hvis Hvor lenge har du vært plaget av smerte eller ubehag i magen? er likEtt år eller mer
o eller
o Hvis Hvor lenge har du vært plaget av smerte eller ubehag i magen? er lik4-11 måneder
o eller
o Hvis Hvor lenge har du vært plaget av smerte eller ubehag i magen? er lik 3 måneder
)
115) Når du har smerter eller ubehag i magen, hvor ofte skjer det i forbindelse med at du..
Sjelden
eller aldri
En del ganger
For det
meste
har fastere eller mer klumpete avføring enn vanlig?
har løsere eller mer vannaktig avføring enn vanlig?
hadde avføring oftere enn vanlig?
hadde avføring sjeldnere enn vanlig?
HODEPINE
116) Har du vært plaget av hodepine det siste året?
Ja Nei
Denne informasjonen vises kun i forhåndsvisningen
Følgende kriterier må være oppfylt for at spørsmålet skal vises for respondenten:
(
o Hvis Har du vært plaget av hodepine det siste året? er lik Ja
)
117) Hva slags hodepine er du plaget av? (Du kan sette flere kryss)
Migrene Annen hodepine Vet ikke
Denne informasjonen vises kun i
forhåndsvisningen
Følgende kriterier må være oppfylt for at spørsmålet skal vises for respondenten:
(
o Hvis Har du vært plaget av hodepine det siste året? er lik Ja
)
118) Omtrent hvor mange dager per måned har du hodepine?
Mindre enn 1 dag
1-6 dager
7-14 dager
Mer enn 14 dager
Denne informasjonen vises kun i
forhåndsvisningen
Følgende kriterier må være oppfylt for at spørsmålet skal vises for respondenten:
(
o Hvis Har du vært plaget av hodepine det siste året? er lik Ja

)
119) Er hodepinen vanligvis:
Ja Nei
Bankende/dunkende smerte
Pressende smerte
Ensidig smerte (høyre eller venstre)
Denne informasjonen vises kun i forhåndsvisningen
Følgende kriterier må være oppfylt for at spørsmålet skal vises for respondenten:
(
o Hvis Har du vært plaget av hodepine det siste året? er lik Ja
)
120) Hvor lenge varer hodepinen vanligvis?
Mindre enn 4 timer
4 timer - 1 døgn
1-3 døgn
Mer enn 3 døgn
Denne informasjonen vises kun i forhåndsvisningen
Følgende kriterier må være oppfylt for at spørsmålet skal vises for respondenten:
(
o Hvis Har du vært plaget av hodepine det siste året? er lik Ja
)
121) Før eller under hodepinen, kan du da ha forbigående:
Ja Nei
Synsforstyrrelse? (takkede linjer, flimring, tåkesyn, lysglimt)
Nummenhet i halve ansiktet eller i hånden?
Forverring ved moderat fysisk aktivitet?
Kvalme og/eller oppkast?
122) Hvor ofte pusser du vanligvis tennene dine? (sett ett kryss)
Sjeldnere enn 1 gang per uke
1 gang per uke
2-3 ganger per uke
4-6 ganger per uke
1 gang daglig
2 eller flere ganger daglig
Hvor smertefullt, jevnt over, synes du det er å gå til tannlegen? Svar på en skala fra 0-10, der 0 tilsvarer ingen smerte og 10 tilsvarer verst tenkelig smerte.
0 1 2 3 4 5 6 7 8 9 10
Nedenfor er det fire spørsmål om hvordan du opplever det er å gå til tannlege. Les hvert spørsmål og velg det svaralternativet som du synes passer best for deg.
124) Dersom du skulle gå til tannlegen i morgen, hva ville du føle?
Jeg ville se frem til det som en ganske hyggelig opplevelse
Det ville være det samme for meg, ikke bety noe
Det ville gjøre meg litt urolig
Jeg ville bli redd for at det skulle bli ubehagelig og vondt
Jeg ville bli svært redd med tanke på hva tannlegen kanskje skulle gjøre
125) Når du venter på tannlegens venteværelse, hvordan føler du deg da?
Avslappet
Litt urolig
Anspent, nervøs
Redd, engstelig
Så redd at jeg av og til begynner å svette eller nesten føler meg syk
126) Når du sitter i tannlegestolen og venter på at tannlegen skal begynne behandlingen, hvordan føler du deg da?
Avslappet
Litt urolig
Anspent, nervøs
Redd, engstelig
Så redd at jeg av og til begynner å svette eller nesten føler meg syk
Tenk at du sitter i tannlegestolen og skal få tennene renset og pusset. Mens du sitter og venter på at tannlege skal finne frem instrumentene som brukes til å skrape og pusse med,
127) hvordan føler du deg da?
Avslappet
Litt urolig
Anspent, nervøs
Redd, engstelig
Så redd at jeg av og til begynner å svette eller nesten føler meg syk
128) Har du øresus?
Aldri Sjelden Ofte
Denne informasjonen vises kun i
forhåndsvisningen
Følgende kriterier må være oppfylt for at spørsmålet skal vises for respondenten:
(
o Hvis Har du øresus? er lik Ofte
)
129) Hvor ofte har du øresus?
Hele tiden, uten opphør
Hver dag, men ikke hele tiden
Hver uke, men ikke hver dag
Sjeldnere enn hver uke
Denne informasjonen vises kun i forhåndsvisningen
Følgende kriterier må være oppfylt for at spørsmålet skal vises for respondenten:
(
o Hvis Har du øresus? er lik Ofte
)
130) Hvor lenge varer vanligvis periodene med øresus?
Mindre enn 10 minutter 10 minutter - 1 time Mer enn 1 time
Denne informasjonen vises kun i forhåndsvisningen
Følgende kriterier må være oppfylt for at spørsmålet skal vises for respondenten:
(
o Hvis Har du øresus? er lik Ofte
)
131) Når får du vanligvis øresus?
Etter sterke lyder Når det er stille Vet aldri når
Denne informasjonen vises kun i forhåndsvisningen
Følgende kriterier må være oppfylt for at spørsmålet skal vises for respondenten:
(
o Hvis Har du øresus? er lik Ofte
)
Noen bryr seg ikke om lyden, for andre oppleves det svært plagsomt å ha øresus. Angi hvor plaget du er av øresusen. Svar på en skala fra 0 til 10, der 0 tilsvarer ingen plager og 10 tilsvarer verst tenkelige plager.
0 1 2 3 4 5 6 7 8 9 10

Denne informasjonen vises kun i forhåndsvisningen
Følgende kriterier må være oppfylt for at spørsmålet skal vises for respondenten:
(
o Hvis Har du øresus? er lik Ofte
)
133) På hvilket øre har du vanligvis øresus?
Bare høyre
Bare venstre
Begge, men mest høyre
Begge, men mest venstre
Like mye på begge
Denne informasjonen vises kun i
forhåndsvisningen
Følgende kriterier må være oppfylt for at spørsmålet skal vises for respondenten:
(
o Hvis Har du øresus? er lik Ofte
)
134) Omtrent hvor gammel var du når du begynte å ha øresus ofte?
Velg alternativ

12/8/2017 QuestBack
https://web2.questback.com/Quests/QuestDesigner/PreviewPage.aspx?QuestID=4423449&sid=63DwvLuDhv&PPK=365llqjhyz 1/68
FF2 Generelt spørreskjema - UKE 1 Vi ønsker å vite mer om livsstil og helse. Bruk den tiden du trenger til å svare så presist du kan. Alle svarene dine blir behandlet med taushetsplikt. Bruk "neste >>" og "<< tilbake" - knappene i skjema for å bla deg fremover og bakover. Lykke til og tusen takk for hjelpen!
DEG OG DIN FAMILIE
1) Er du:
Jente Gutt

12/8/2017 QuestBack
https://web2.questback.com/Quests/QuestDesigner/PreviewPage.aspx?QuestID=4423449&sid=63DwvLuDhv&PPK=365llqjhyz 2/68
2) Hvem bor du sammen med nå? (sett ett eller �ere kryss)
Mor
Far
1-2 søsken
3 eller �ere søsken
Mors nye mann/samboer
Fars nye kone/samboer
Fosterforeldre
Adoptivforeldre
Besteforeldre
Venner
Alene/på hybel
Institusjon
Samboer/gift
Annet
3) Hvor lenge er det siden du �yttet hjemmefra?
Mindre enn 6 måneder
6 - 11 måneder
1 - 2 år
Mer enn 2 år

12/8/2017 QuestBack
https://web2.questback.com/Quests/QuestDesigner/PreviewPage.aspx?QuestID=4423449&sid=63DwvLuDhv&PPK=365llqjhyz 3/68
4) Er moren din i arbeid? (sett ett eller �ere kryss)
Ja, heltid
Ja, deltid
Arbeidsledig
Uførerygdet
Hjemmeværende
Går på skole, kurs, e.l.
Pensjonist
Mor er død
Vet ikke
Annet
5) Er faren din i arbeid? (sett ett eller �ere kryss)
Ja, heltid
Ja, deltid
Arbeidsledig
Uførerygdet
Hjemmeværende
Går på skole, kurs, e.l.
Pensjonist
Far er død
Vet ikke
Annet
6) Har du noen gang oppholdt deg 4 uker eller mer sammenhengende i Australia, USA, Argentina eller Sør-Afrika?
Ja Nei
Hvis det har vært �ere opphold, oppgi varighet av siste opphold.
12/8/2017 QuestBack
https://web2.questback.com/Quests/QuestDesigner/PreviewPage.aspx?QuestID=4423449&sid=63DwvLuDhv&PPK=365llqjhyz 4/68
7) Hvor lenge varte det siste oppholdet?
Mindre enn 2 måneder
2-6 måneder
Mer enn 6 måneder
Hvis det har vært �ere opphold, oppgi når du hadde siste opphold.
8) Når var det siste oppholdet?
Velg... Velg...
9) Er du i dag?
Elev i videregående skole
Lærling/elev i bedrift
Ikke i videregående opplæring
VENNER OG SKOLE
10) Har du vurdert å avbryte eller ta pause fra den videregående opplæringen du er i gang med?
Ja Nei
11) Hvor sannsynlig er det at du fullfører den utdanningen du er i gang med?
Liten - kommer til å slutte
God - kommer sannsynligvis til å fullføre
Stor - Kommer helt sikkert til å fullføre
Vet ikke
12/8/2017 QuestBack
https://web2.questback.com/Quests/QuestDesigner/PreviewPage.aspx?QuestID=4423449&sid=63DwvLuDhv&PPK=365llqjhyz 5/68
12) Hvor mange tekstmeldinger (SMS/MMS) sendte du med mobiltelefon i går?
Ingen
1-5 meldinger
6-10 meldinger
11-20 meldinger
21-50 meldinger
Mer enn 50 meldinger
13) Nedenfor er det noen spørsmål om hvordan du synes du selv er. Kryss av for det som passer best for deg.
Stemmersværtdårlig
Stemmernoksådårlig
Stemmernoksågodt
Stemmersværtgodt
Jeg synes det er ganske vanskelig å få venner
Jeg har mange venner
Andre ungdommer har vanskelig for å like meg
Jeg er populær blant jevnaldrende
Jeg føler at jevnaldrende godtar meg
HELSE
14) Hvordan vurderer du din egen helse sånn i alminnelighet?
Meget god
God
Verken god eller dårlig
Dårlig
Meget dårlig
12/8/2017 QuestBack
https://web2.questback.com/Quests/QuestDesigner/PreviewPage.aspx?QuestID=4423449&sid=63DwvLuDhv&PPK=365llqjhyz 6/68
15) Hvor ofte har du i løpet av de siste 4 ukene brukt følgende medisiner?
Ikkebruktsiste 4uker
Sjeldnereenn hver
uke
Hveruke,menikke
daglig Daglig
Smertestillende på resept (f. eks. Paralgin forte, Pinex forte)
Smertestillende uten resept (f. eks. Paracet, Pinex, Ibux)
Sovemidler
Medisin mot depresjon
Medisiner mot ADHD
Beroligende medisiner
16) Har en lege noen gang sagt at du har...
Ja NeiVetikke
høysnue eller neseallergi?
astma?
barneeksem eller atopisk eksem?
psoriasis?
PSYKISKE VANSKER
17) Har du gått i behandling hos psykolog, psykiater eller PP-tjenesten det siste året?
Ja Nei

12/8/2017 QuestBack
https://web2.questback.com/Quests/QuestDesigner/PreviewPage.aspx?QuestID=4423449&sid=63DwvLuDhv&PPK=365llqjhyz 7/68
18) Under �nner du en liste over ulike problemer. Har du opplevd noe av dette den siste uken (til og med i dag)?
Ikkeplaget
Littplaget
Ganskemye
Veldigmye
Plutselig frykt uten grunn
Føler deg redd eller engstelig
Matthet eller svimmelhet
Føler deg anspent eller oppjaget
Lett for å klandre deg selv
Søvnproblemer
Nedtrykt, tungsindig
Følelse av å være unyttig, lite verdt
Følelse av at alt er et slit
Følelse av håpløshet med hensyn til framtida
19) De følgende spørsmålene handler om hva du følte og gjorde de siste to ukene.
Ikkeriktig
Noengangerriktig Riktig
Jeg var lei meg eller ulykkelig
Jeg følte meg så trøtt at jeg bare ble sittende uten å gjøre noen ting
Jeg var veldig rastløs
Jeg var ikke glad for noe
Jeg følte meg lite verdt
Jeg gråt mye
Jeg hatet meg selv
Jeg tenkte at jeg aldri kunne bli så god som andre ungdommer
Jeg følte meg ensom
Jeg tenkte at ingen egentlig var glad i meg
Jeg følte meg som et dårlig menneske
Jeg gjorde alt galt
Jeg syntes det var vanskelig å tenke klart eller å konsentrere meg

12/8/2017 QuestBack
https://web2.questback.com/Quests/QuestDesigner/PreviewPage.aspx?QuestID=4423449&sid=63DwvLuDhv&PPK=365llqjhyz 8/68
De følgende spørmålene handler om hvordan du ser på deg selv.
20) Jeg ser på meg selv som en som...
Sværtuenig
1 2 3 4 5Sværtenig 6
Er pratsom
Har en tendens til å �nne feil med andre
Gjør en grundig jobb
Er deprimert, nedstemt
Er orginal, kommer med nye ideer
Er reservert
Er hjelpsom og uegoistisk ovenfor andre
Kan være uforsiktig
Er avslappet, takler stress godt
Er nysgjerrig på mange ting
Er full av energi
Er en kranglefant
Er pålitelig i arbeidet mitt
Kan være anspent
Er skarpsindig, tenker dypt
Skaper mye entusiasme
Er tilgivende av natur
Har en tendens til å være ustrukturert
Bekymrer meg mye
Har livlig fantasi
Har en tendens til å være stillferdig
Er tillitsfull
De følgende spørmålene handler om hvordan du ser på deg selv.
12/8/2017 QuestBack
https://web2.questback.com/Quests/QuestDesigner/PreviewPage.aspx?QuestID=4423449&sid=63DwvLuDhv&PPK=365llqjhyz 9/68
21) Jeg ser på meg selv som en som...
Sværtuenig
1 2 3 4 5Sværtenig 6
Har en tendens til å være lat
Er følelsesmessig stabil
Er opp�nnsom
Er selvhevdende
Kan være kald og fjern
Står på til oppgaven er gjennomført
Kan være humørsyk
Setter pris på skjønnhet og kunst
Kan være sjenert og hemmet
Er hensynsfull og vennlig ovenfor de �este
Gjør ting e�ektivt
Beholder roen i spente situasjoner
Foretrekker rutinearbeid
Er utadvendt og sosial
Kan noen ganger være uhø�ig
Legger planer og gjennomfører dem
Blir lett nervøs
Liker å tenke, leke med ideer
Har få kunstneriske interesser
Liker å samarbeide
Blir lett distrahert
Har kunnskaper om kunst, musikk, litteratur
PUBERTET Her har vi noen spørsmål om kroppslige forandringer som skjer gjennom ungdomstiden:
22) Har du fått menstruasjon?
Ja Nei
Hvor gammel var du da du �kk menstruasjon første gang?

12/8/2017 QuestBack
https://web2.questback.com/Quests/QuestDesigner/PreviewPage.aspx?QuestID=4423449&sid=63DwvLuDhv&PPK=365llqjhyz 10/68
23) År
Velg... Velg...
24) Måneder
Velg... Velg...
25) Hvis du ser bort fra svangerskap, har du noen gang vært blødningsfri i minst 6 måneder?
Ja
Nei
26) Hvor mange ganger har du vært blødningsfri i mer enn 6 måneder?
Velg... Velg...
27) Hvordan er blødningene dine nå?
Jeg har regelmessige blødninger
Jeg har uregelmessige blødninger
Jeg har ikke hatt blødninger det siste året
PUBERTET
28) Når man er tenåring, er det perioder da man vokser raskt. Har du merket at kroppen din har vokst fort (blitt høyere)?
Nei, den har ikke begynt å vokse
Ja, den har såvidt begynt å vokse
Ja, den har helt tydelig begynt å vokse
Ja, det virker som om jeg er ferdig med å vokse raskt

12/8/2017 QuestBack
https://web2.questback.com/Quests/QuestDesigner/PreviewPage.aspx?QuestID=4423449&sid=63DwvLuDhv&PPK=365llqjhyz 11/68
29) Og hva med hår på kroppen (under armene og i skrittet)? Vil du si at håret på kroppen din har:
Ikke begynt å vokse enda
Såvidt begynt å vokse
Helt tydelig begynt å vokse
Det virker som om håret på kroppen er utvokst
30) Hvor gammel var du da du begynte å få hår i skrittet (kjønnshår)?
Velg... Velg...
31) Har du begynt å komme i stemmeskifte?
Nei, har ikke begynt ennå
Ja, har såvidt begynt
Ja, har helt tydelig begynt
Det virker som om stemmeskifte er ferdig
32) Har du begynt å få bart eller skjegg?
Nei, har ikke begynt ennå
Ja, har såvidt begynt
Ja, har helt tydelig begynt
ja, har fått en god del skjeggvekst
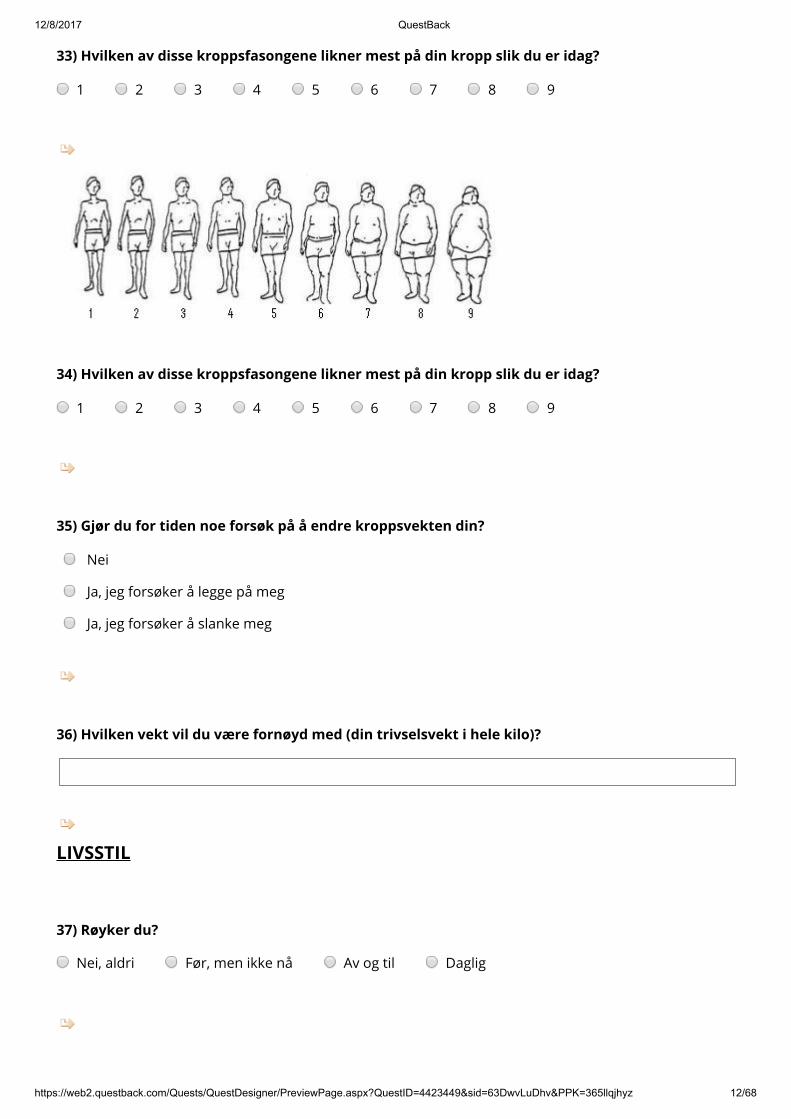
12/8/2017 QuestBack
https://web2.questback.com/Quests/QuestDesigner/PreviewPage.aspx?QuestID=4423449&sid=63DwvLuDhv&PPK=365llqjhyz 12/68
33) Hvilken av disse kroppsfasongene likner mest på din kropp slik du er idag?
1 2 3 4 5 6 7 8 9
34) Hvilken av disse kroppsfasongene likner mest på din kropp slik du er idag?
1 2 3 4 5 6 7 8 9
35) Gjør du for tiden noe forsøk på å endre kroppsvekten din?
Nei
Ja, jeg forsøker å legge på meg
Ja, jeg forsøker å slanke meg
36) Hvilken vekt vil du være fornøyd med (din trivselsvekt i hele kilo)?
LIVSSTIL
37) Røyker du?
Nei, aldri Før, men ikke nå Av og til Daglig
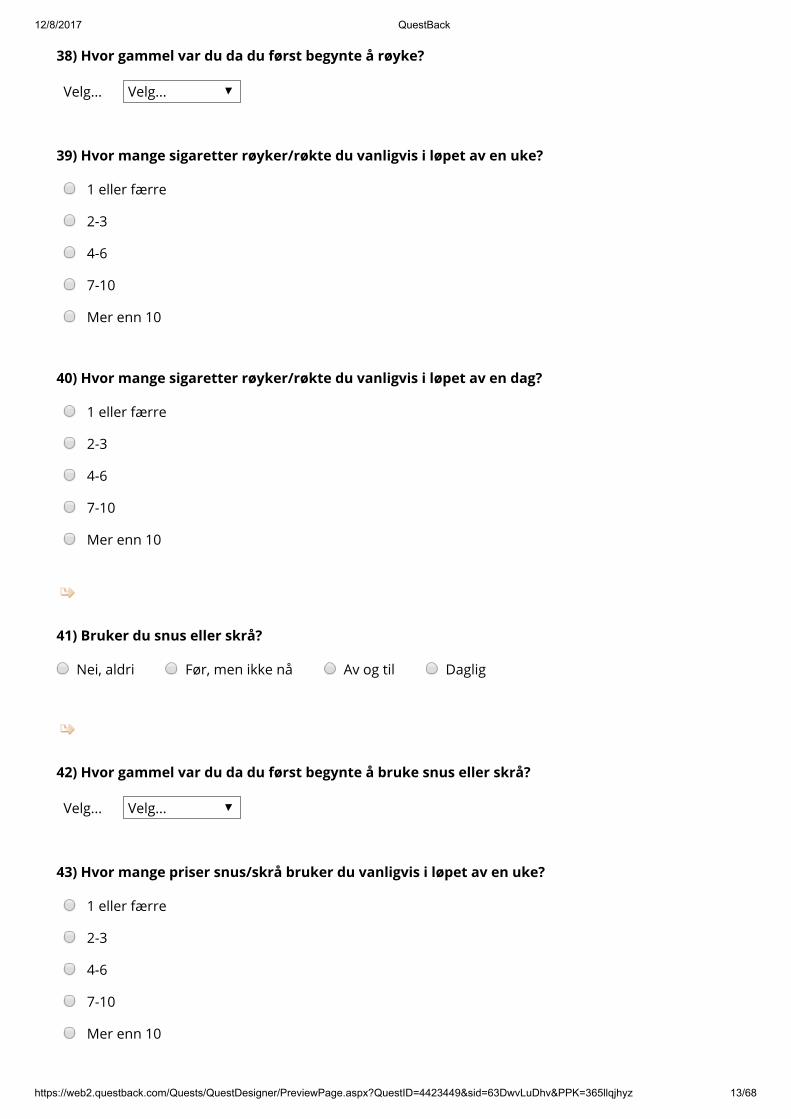
12/8/2017 QuestBack
https://web2.questback.com/Quests/QuestDesigner/PreviewPage.aspx?QuestID=4423449&sid=63DwvLuDhv&PPK=365llqjhyz 13/68
38) Hvor gammel var du da du først begynte å røyke?
Velg... Velg...
39) Hvor mange sigaretter røyker/røkte du vanligvis i løpet av en uke?
1 eller færre
2-3
4-6
7-10
Mer enn 10
40) Hvor mange sigaretter røyker/røkte du vanligvis i løpet av en dag?
1 eller færre
2-3
4-6
7-10
Mer enn 10
41) Bruker du snus eller skrå?
Nei, aldri Før, men ikke nå Av og til Daglig
42) Hvor gammel var du da du først begynte å bruke snus eller skrå?
Velg... Velg...
43) Hvor mange priser snus/skrå bruker du vanligvis i løpet av en uke?
1 eller færre
2-3
4-6
7-10
Mer enn 10

12/8/2017 QuestBack
https://web2.questback.com/Quests/QuestDesigner/PreviewPage.aspx?QuestID=4423449&sid=63DwvLuDhv&PPK=365llqjhyz 14/68
44) Hvor mange priser snus/skrå bruker du per dag?
1
2-3
4-6
7-10
Mer enn 10
45) Hvor ofte drikker du alkohol?
Aldri
1 gang per måned eller sjeldnere
2-4 ganger per måned
2-3 ganger per uke
4 eller �ere ganger per uke
46) Hvor mange enheter alkohol (en øl, ett glass vin eller en drink) tar du vanligvis når du drikker?
1-2
3-4
5-6
7-9
10 eller �ere
47) Hvor ofte drikker du 6 eller �ere enheter alkohol ved en anledning?
Aldri
Sjeldnere enn 1 gang per måned
1 gang per måned
1 gang per uke
Daglig eller nesten daglig
FYSISK AKTIVITET
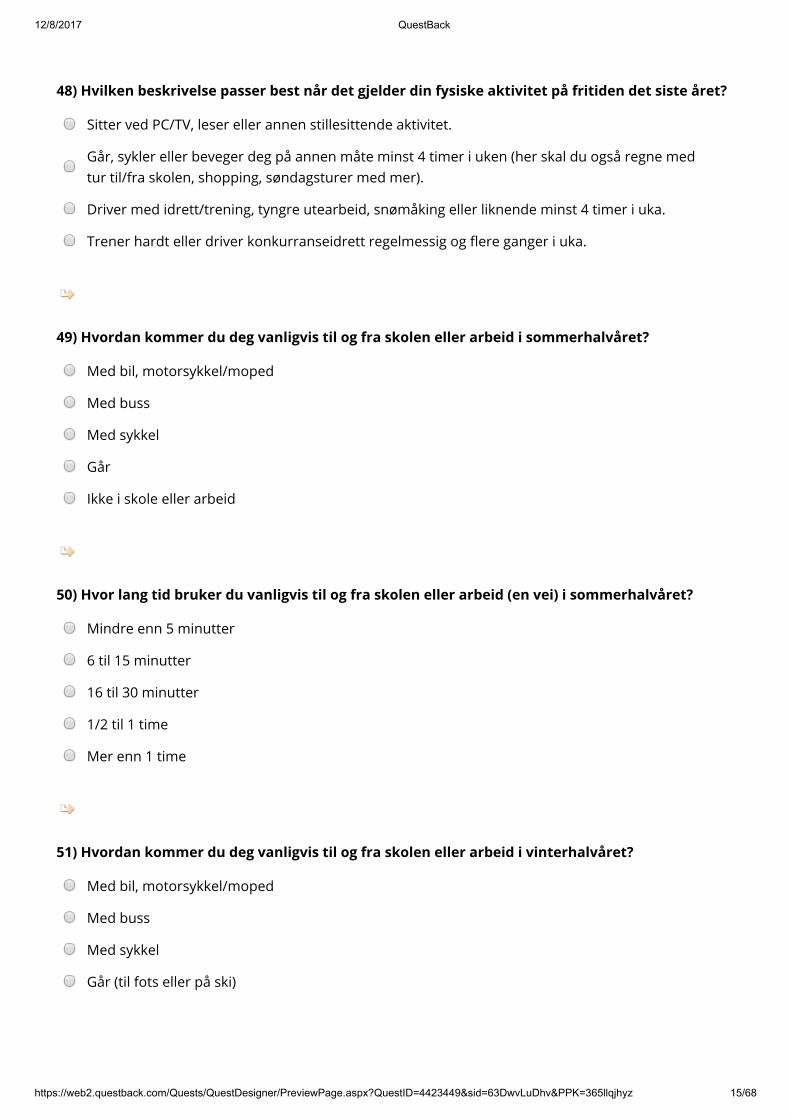
12/8/2017 QuestBack
https://web2.questback.com/Quests/QuestDesigner/PreviewPage.aspx?QuestID=4423449&sid=63DwvLuDhv&PPK=365llqjhyz 15/68
48) Hvilken beskrivelse passer best når det gjelder din fysiske aktivitet på fritiden det siste året?
Sitter ved PC/TV, leser eller annen stillesittende aktivitet.
Går, sykler eller beveger deg på annen måte minst 4 timer i uken (her skal du også regne medtur til/fra skolen, shopping, søndagsturer med mer).
Driver med idrett/trening, tyngre utearbeid, snømåking eller liknende minst 4 timer i uka.
Trener hardt eller driver konkurranseidrett regelmessig og �ere ganger i uka.
49) Hvordan kommer du deg vanligvis til og fra skolen eller arbeid i sommerhalvåret?
Med bil, motorsykkel/moped
Med buss
Med sykkel
Går
Ikke i skole eller arbeid
50) Hvor lang tid bruker du vanligvis til og fra skolen eller arbeid (en vei) i sommerhalvåret?
Mindre enn 5 minutter
6 til 15 minutter
16 til 30 minutter
1/2 til 1 time
Mer enn 1 time
51) Hvordan kommer du deg vanligvis til og fra skolen eller arbeid i vinterhalvåret?
Med bil, motorsykkel/moped
Med buss
Med sykkel
Går (til fots eller på ski)
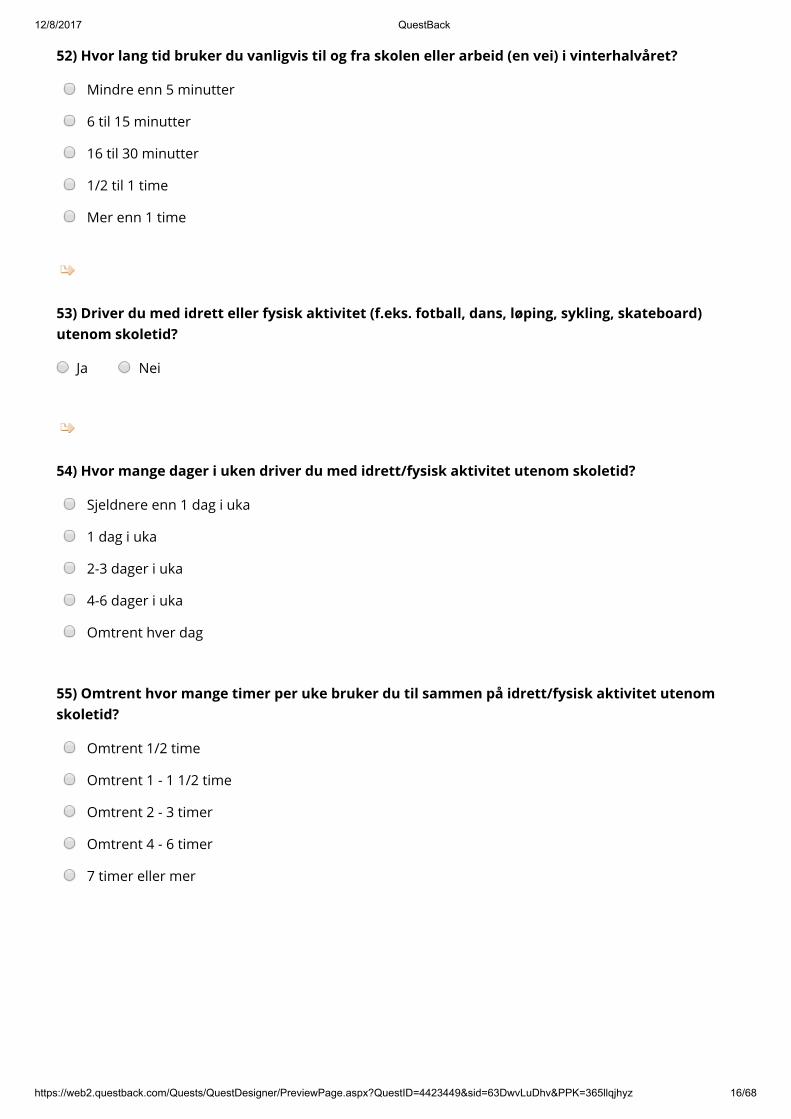
12/8/2017 QuestBack
https://web2.questback.com/Quests/QuestDesigner/PreviewPage.aspx?QuestID=4423449&sid=63DwvLuDhv&PPK=365llqjhyz 16/68
52) Hvor lang tid bruker du vanligvis til og fra skolen eller arbeid (en vei) i vinterhalvåret?
Mindre enn 5 minutter
6 til 15 minutter
16 til 30 minutter
1/2 til 1 time
Mer enn 1 time
53) Driver du med idrett eller fysisk aktivitet (f.eks. fotball, dans, løping, sykling, skateboard) utenom skoletid?
Ja Nei
54) Hvor mange dager i uken driver du med idrett/fysisk aktivitet utenom skoletid?
Sjeldnere enn 1 dag i uka
1 dag i uka
2-3 dager i uka
4-6 dager i uka
Omtrent hver dag
55) Omtrent hvor mange timer per uke bruker du til sammen på idrett/fysisk aktivitet utenom skoletid?
Omtrent 1/2 time
Omtrent 1 - 1 1/2 time
Omtrent 2 - 3 timer
Omtrent 4 - 6 timer
7 timer eller mer
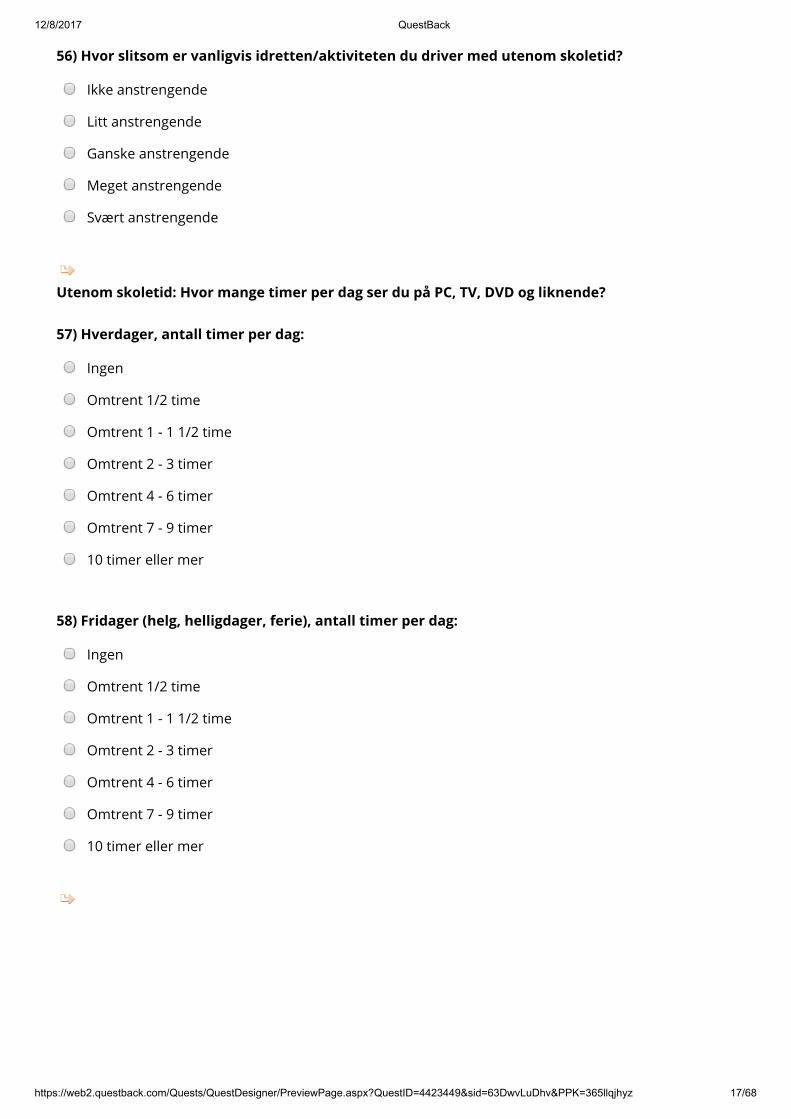
12/8/2017 QuestBack
https://web2.questback.com/Quests/QuestDesigner/PreviewPage.aspx?QuestID=4423449&sid=63DwvLuDhv&PPK=365llqjhyz 17/68
56) Hvor slitsom er vanligvis idretten/aktiviteten du driver med utenom skoletid?
Ikke anstrengende
Litt anstrengende
Ganske anstrengende
Meget anstrengende
Svært anstrengende
Utenom skoletid: Hvor mange timer per dag ser du på PC, TV, DVD og liknende?
57) Hverdager, antall timer per dag:
Ingen
Omtrent 1/2 time
Omtrent 1 - 1 1/2 time
Omtrent 2 - 3 timer
Omtrent 4 - 6 timer
Omtrent 7 - 9 timer
10 timer eller mer
58) Fridager (helg, helligdager, ferie), antall timer per dag:
Ingen
Omtrent 1/2 time
Omtrent 1 - 1 1/2 time
Omtrent 2 - 3 timer
Omtrent 4 - 6 timer
Omtrent 7 - 9 timer
10 timer eller mer
12/8/2017 QuestBack
https://web2.questback.com/Quests/QuestDesigner/PreviewPage.aspx?QuestID=4423449&sid=63DwvLuDhv&PPK=365llqjhyz 18/68
59) I hvilken grad har andre oppmuntret deg til å være fysisk aktiv
Sværtsjelden/aldri
1 2 3 4Sværtofte 5
Foreldre/foresatte
Søsken
Venner
Trenere
Gymlærere
Nabolaget
60) Hvordan passer disse utsagnene for deg?
Heltuenig
1 2 3 4Helt
enig 5
Det er morsommere å drive med trening eller fysisk aktivitetenn å gjøre andre ting...
Jeg skulle ønske jeg kunne drive mer med trening eller fysiskaktivitet enn det jeg har anledning til å gjøre...
Jeg føler at jeg er bedre enn de �este på min alder iidrett/fysisk aktivitet...
Jeg føler at jeg lett kan holde følge med de andre på minalder når vi driver med idrett/fysisk aktivitet...
12/8/2017 QuestBack
https://web2.questback.com/Quests/QuestDesigner/PreviewPage.aspx?QuestID=4423449&sid=63DwvLuDhv&PPK=365llqjhyz 19/68
61) Hvordan passer disse utsagnene for deg?
Heltuenig
1 2 3 4Helt
enig 5
Jeg liker ikke å trene mens noen står å ser på...
Tilgang til egen garderobe hadde gjort det lettere å trene...
Jeg blir ubehagelig andpusten, svett eller får vondt i kroppenved trening...
Gymtimene er organisert slik at jeg ikke henger med...
Jeg har ingen å trene sammen med...
Jeg mangler utstyr for å drive med den aktiviteten jeg har lysttil...
Jeg har for mange andre oppgaver som gjør at jeg ikke får tidtil å trene (f.eks lekser, hjemmeoppgaver)...
Det mangler egnede haller eller gode uteområder for å drivefysisk aktivitet der jeg bor...
MATVANER OG KOSTHOLD
62) Hvor ofte pleier du å spise følgende i løpet av en uke?
Hverdag
4-6dager i
uka
1-3dager i
uka
Sjeldenelleraldri
Frokost
Middag
63) Hvor ofte spiser du matpakke hjemmefra på skole eller arbeid?
Hver dag
3-4 ganger per uke
1-2 ganger per uke
Sjelden eller aldri

12/8/2017 QuestBack
https://web2.questback.com/Quests/QuestDesigner/PreviewPage.aspx?QuestID=4423449&sid=63DwvLuDhv&PPK=365llqjhyz 20/68
64) Hvor ofte spiser du vanligvis disse matvarene?
Sjelden/aldri
1-3ganger
permåned
1-3ganger
peruke
4-6ganger
peruke
Hverdag
Ost (alle typer)
Fet �sk (f.eks. laks, ørret, makrell, sild)
Mager �sk (f.eks. torsk, sei, hyse)
Pizza, hamburger eller pølser
Hermetisert mat (fra metallbokser)
Godteri (f.eks. sjokolade, drops)
Snacks og søtsaker (f.eks. potetgull, kake, kjeks, bolle)
Sukkerfri tyggegummi
65) Hvor ofte spiser du vanligvis
Sjelden/aldri
1-3ganger
permnd
1-3ganger
peruke
4-6ganger
peruke
1-2ganger
perdag
3-4ganger
perdag
5 eller�ere
gangerperdag
Frukt
Grønnsaker

12/8/2017 QuestBack
https://web2.questback.com/Quests/QuestDesigner/PreviewPage.aspx?QuestID=4423449&sid=63DwvLuDhv&PPK=365llqjhyz 21/68
66) Hvor mye drikker du vanligvis av følgende?
Sjelden/aldri
1-6glassperuke
1 glassperdag
2-3glassperdag
4 glassellermerperdag
Helmelk, ke�r, yoghurt
Lettmelk, cultura, lettyoghurt
Skummet melk (sur/søt)
Ekstra lett melk
Juice
Saft med sukker
Lettsaft, kunstig søtet
Brus med sukker (1/2 liters �aske = 2 glass)
Lettbrus, kunstig søtet (1/2 liters �aske = 2 glass)
Vann
67) Bruker du følgende kosttilskudd?
Ja,daglig
Av ogtil Nei
Tran, trankapsler, �skeoljekapsler
Vitamin- og/eller mineraltilskudd
SØVN OG SØVNVANER
68) Når pleier du å legge deg for å sove på ukedagene?
Velg... Velg...
69) Når pleier du å legge deg for å sove i helgen?
Velg... Velg...
70) Hvor lenge pleier du å ligge våken før du får sove på ukedagene?
Velg... Velg...
12/8/2017 QuestBack
https://web2.questback.com/Quests/QuestDesigner/PreviewPage.aspx?QuestID=4423449&sid=63DwvLuDhv&PPK=365llqjhyz 22/68
71) Hvor lenge pleier du å ligge våken før du får sove i helgen?
Velg... Velg...
72) Når pleier du å våkne på ukedagene (endelig oppvåkning)?
Velg... Velg...
73) Når pleier du å våkne i helgen (endelig oppvåkning)?
Velg... Velg...
74) Hvor mange timer sover du vanligvis pr. natt?
Velg... Velg...
75) Hvor mange timer søvn trenger du pr. natt for å føle deg uthvilt?
Velg... Velg...
76) Synes du at du får tilstrekkelig med søvn?
Ja, absolutt tilstrekkelig
Ja, stort sett tilstrekkelig
Nei, noe utilstrekkelig
Nei, klart utilstrekkelig
Nei, langt fra tilstrekkelig
12/8/2017 QuestBack
https://web2.questback.com/Quests/QuestDesigner/PreviewPage.aspx?QuestID=4423449&sid=63DwvLuDhv&PPK=365llqjhyz 23/68
77) I løpet av den siste måneden, hvor mange dager pr. uke har du
0dager 1 dag
2dager
3dager
4dager
5dager
6dager
7dager
brukt mer enn 30 minutter for åsovne etter at lysene ble slukket?
vært våken mer enn 30 minutterinnimellom søvnen?
våknet mer enn 30 mintter tidligereenn du ønsket å gjøre uten å få soveigjen?
følt deg for lite uthvilt etter å hasovet?
vært så søvnig/trett at det har gåttut over skole/jobb eller privatlivet?
vært misfornøyd med søvnen din?
hatt vansker med å sovne før kl02:00?
hatt vansker med å våkne ommorgenen?
har du forsovet deg til skolen,arbeid eller avtaler?
Følsomhet for støy
78) Hvor enig eller uenig er du i utsagnene? Sett kryss for det svaralternativet som passer best for hvert utsagn
Heltuenig
Ganskeuenig
Littuenig
Littenig
Ganskeenig
Heltenig
Jeg vekkes lett av støy
Jeg venner meg til de �este lyder uten storeproblemer
Det er vanskelig for meg å slappe av på et sted medmye støy
Jeg er �ink til å konsentrere meg uansett hva somskjer rundt meg
Jeg blir sint på folk som lager støy som hindrer megi å sovne eller å få gjort jobben min
Jeg er følsom for støy

12/8/2017 QuestBack
https://web2.questback.com/Quests/QuestDesigner/PreviewPage.aspx?QuestID=4423449&sid=63DwvLuDhv&PPK=365llqjhyz 24/68
SOLING
79) Hva skjer med huden din hvis du soler deg om sommeren?
Alltid rød, aldri brun
Nesten alltid rød, av og til brun
Nesten alltid brun, av og til rød
Alltid brun, aldri rød
80) Har du vært i Syden-/solingsferie de siste 2 måneder?
Ja Nei
81) Har du tatt solarium i løpet av de siste 4 ukene?
Nei Ja, en gang Ja, �ere ganger
SMERTER
82) Har du langvarige eller stadig tilbakevendende smerter som har vart i 3 måneder eller mer?
Ja Nei
83) Hvor ofte har du vanligvis disse smertene?
Hele tiden, uten opphør
Hver dag, men ikke hele tiden
Hver uke, men ikke hver dag
Sjeldnere enn hver uke

12/8/2017 QuestBack
https://web2.questback.com/Quests/QuestDesigner/PreviewPage.aspx?QuestID=4423449&sid=63DwvLuDhv&PPK=365llqjhyz 25/68
84) Hvor lenge har du hatt disse smertene? (Dersom du har �ere typer smerte, svar for den som har vart lengst)
3 - 6 måneder
6 - 12 måneder
1-2 år
3-6 år
Mer enn 6 år
Hvor er det vondt?
(Kryss av på alle aktuelle steder)
Venstreside
Høyreside
Skulder
Arm/albue
Hånd
Hofte
Lår/kne/legg
Ankel/fot
Hode/ansikt
Kjeve/kjeveledd
Nakke
Øvre del av ryggen
Korsryggen
Bryst
Mage
Underliv/kjønnsorganer

12/8/2017 QuestBack
https://web2.questback.com/Quests/QuestDesigner/PreviewPage.aspx?QuestID=4423449&sid=63DwvLuDhv&PPK=365llqjhyz 26/68
87) Hva mener du er årsaken til smertene? (�ere svar mulig)
PC-bruk, dataspill og lignende
Idrettsskade
Ulykke/skade
Kirurgisk inngrep/operasjon
Migrene/hodepine
Medfødt sykdom
Tannproblemer
Whiplash
Prolaps (skiveutglidning i ryggen)
Annet ryggproblem
Nerveskade
Mage- eller tarmsykdom
Annet, spesi�ser her
Vet ikke
Hvis du har langvarige smerter �ere steder i kroppen, gjelder de 4 neste spørsmålene smerten somplager deg mest.
Dersom du har �ere typer smerte, svar den som plager deg mest.
88) Hvor sterke vil du si at smertene vanligvis er?
0 Ingen smerte
1
2
3
4
5
6
7
8
9
10 Verst tenkelige smerte
12/8/2017 QuestBack
https://web2.questback.com/Quests/QuestDesigner/PreviewPage.aspx?QuestID=4423449&sid=63DwvLuDhv&PPK=365llqjhyz 27/68
89) Hvor sterke er smertene når de er på sitt sterkeste?
0 Ingen smerte
1
2
3
4
5
6
7
8
9
10 Verst tenkelige smerte
90) I hvor stor grad påvirker smertene søvnen din?
0 Ingen påvirkning
1
2
3
4
5
6
7
8
9
10 Umulig å få sove på grunn av smertene
12/8/2017 QuestBack
https://web2.questback.com/Quests/QuestDesigner/PreviewPage.aspx?QuestID=4423449&sid=63DwvLuDhv&PPK=365llqjhyz 28/68
91) I hvor stor grad hindrer smertene deg i å utføre vanlige aktiviteter hjemme og på skolen?
0 Påvirker ikke vanlige aktiviteter
1
2
3
4
5
6
7
8
9
10 Kan ikke gjøre noe på grunn av smertene
92) Får du smerter i muskler og ledd når du har feber?
Ja Nei
93) Hvor sterke er febersmertene vanligvis?
0 Ingen smerte
1
2
3
4
5
6
7
8
9
10 Verst tenkelige smerte

12/8/2017 QuestBack
https://web2.questback.com/Quests/QuestDesigner/PreviewPage.aspx?QuestID=4423449&sid=63DwvLuDhv&PPK=365llqjhyz 29/68
MAGE- OG TARMPROBLEMER
94) I løpet av de siste 2 månedene: Hvor ofte har du hatt smerte eller ubehag i magen?
Aldri
1-3 ganger i måneden
En gang i uka
Flere ganger i uka
Hver dag
95) Hvor lenge har du vært plaget av smerte eller ubehag i magen?
Mindre enn 1 måned
2 måneder
3 måneder
4-11 måneder
Ett år eller mer
96) I hvilken del av magen er det du har hatt smerte eller ubehag? (kryss av for alt som passer)
Over navlen
Rundt navlen
Nedenfor navlen
97) Når du har smerter eller ubehag i magen, hvor lenge varer det vanligvis?
Mindre enn 1 time
1-2 timer
3-4 timer
Mesteparten av dagen
Hele døgnet
12/8/2017 QuestBack
https://web2.questback.com/Quests/QuestDesigner/PreviewPage.aspx?QuestID=4423449&sid=63DwvLuDhv&PPK=365llqjhyz 30/68
98) Når du har smerte eller ubehag i magen, hvor sterke smerter har du vanligvis?
0 Ingen smerte
1
2
3
4
5
6
7
8
9
10 Verst tenkelige smerte
99) Når du har smerter eller ubehag i magen, hvor ofte blir det bedre etter at du har hatt avføring?
Sjelden eller aldri
En del ganger
For det meste/hver gang
100) Når du har smerter eller ubehag i magen, hvor ofte skjer det i forbindelse med at du..
Sjeldenelleraldri
En delganger
Fordet
meste
har fastere eller mer klumpete avføring enn vanlig?
har løsere eller mer vannaktig avføring enn vanlig?
hadde avføring oftere enn vanlig?
hadde avføring sjeldnere enn vanlig?
HODEPINE

12/8/2017 QuestBack
https://web2.questback.com/Quests/QuestDesigner/PreviewPage.aspx?QuestID=4423449&sid=63DwvLuDhv&PPK=365llqjhyz 31/68
101) Har du vært plaget av hodepine det siste året?
Ja Nei
102) Hva slags hodepine er du plaget av? (Du kan sette �ere kryss)
Migrene Annen hodepine Vet ikke
103) Omtrent hvor mange dager per måned har du hodepine?
Mindre enn 1 dag
1-6 dager
7-14 dager
Mer enn 14 dager
104) Er hodepinen vanligvis:
Ja Nei
Bankende/dunkende smerte
Pressende smerte
Ensidig smerte (høyre eller venstre)
105) Hvor lenge varer hodepinen vanligvis?
Mindre enn 4 timer
4 timer - 1 døgn
1-3 døgn
Mer enn 3 døgn
106) Før eller under hodepinen, kan du da ha forbigående:
Ja Nei
Synsforstyrrelse? (takkede linjer, �imring, tåkesyn, lysglimt)
Nummenhet i halve ansiktet eller i hånden?
Forverring ved moderat fysisk aktivitet?
Kvalme og/eller oppkast?

12/8/2017 QuestBack
https://web2.questback.com/Quests/QuestDesigner/PreviewPage.aspx?QuestID=4423449&sid=63DwvLuDhv&PPK=365llqjhyz 32/68
Nedenfor er det �re spørsmål om hvordan du opplever det er å gå til tannlege. Les hvert spørsmål og velg det svaralternativet som du synes passer best for deg.
107) Dersom du skulle gå til tannlegen i morgen, hva ville du føle?
Jeg ville se frem til det som en ganske hyggelig opplevelse
Det ville være det samme for meg, ikke bety noe
Det ville gjøre meg litt urolig
Jeg ville bli redd for at det skulle bli ubehagelig og vondt
Jeg ville bli svært redd med tanke på hva tannlegen kanskje skulle gjøre
108) Når du venter på tannlegens venteværelse, hvordan føler du deg da?
Avslappet
Litt urolig
Anspent, nervøs
Redd, engstelig
Så redd at jeg av og til begynner å svette eller nesten føler meg syk
109) Når du sitter i tannlegestolen og venter på at tannlegen skal begynne behandlingen, hvordan føler du deg da?
Avslappet
Litt urolig
Anspent, nervøs
Redd, engstelig
Så redd at jeg av og til begynner å svette eller nesten føler meg syk
110) Tenk at du sitter i tannlegestolen og skal få tennene renset og pusset. Mens du sitter og venter på at tannlege skal �nne frem instrumentene som brukes til å skrape og pusse med, hvordan føler du deg da?
Avslappet
Litt urolig
Anspent, nervøs
Redd, engstelig
Så redd at jeg av og til begynner å svette eller nesten føler meg syk

12/8/2017 QuestBack
https://web2.questback.com/Quests/QuestDesigner/PreviewPage.aspx?QuestID=4423449&sid=63DwvLuDhv&PPK=365llqjhyz 33/68
HØRSEL
111) Har du et hørseltap som du vet om?
Nei
Ja
Kanskje
112) Er hørseltapet bekreftet av lege eller annet helsepersonell?
Nei Ja
113) Bruker du høreapparat?
Nei Ja
114) Har du øresus?
Aldri Sjelden Ofte
115) Hvor ofte har du øresus?
Hele tiden, uten opphør
Hver dag, men ikke hele tiden
Hver uke, men ikke hver dag
Sjeldnere enn hver uke
116) Hvor lenge varer vanligvis periodene med øresus?
Mindre enn 10 minutter 10 minutter - 1 time Mer enn 1 time
117) Når får du vanligvis øresus?
Etter sterke lyder Når det er stille Vet aldri når
12/8/2017 QuestBack
https://web2.questback.com/Quests/QuestDesigner/PreviewPage.aspx?QuestID=4423449&sid=63DwvLuDhv&PPK=365llqjhyz 34/68
118) Noen bryr seg ikke om lyden, for andre oppleves det svært plagsomt å ha øresus. Angi hvor plaget du er av øresusen.
0 Ingen plager
1
2
3
4
5
6
7
8
9
10 Verst tenkelige plager
119) På hvilket øre har du vanligvis øresus?
Bare høyre
Bare venstre
Begge, men mest høyre
Begge, men mest venstre
Like mye på begge
120) Omtrent hvor gammel var du når du begynte å ha øresus?
Velg... Velg...
121) Omtrent hvor gammel var du når du begynte å ha øresus ofte?
Velg... Velg...
SYKEHUS OG INFEKSJONER
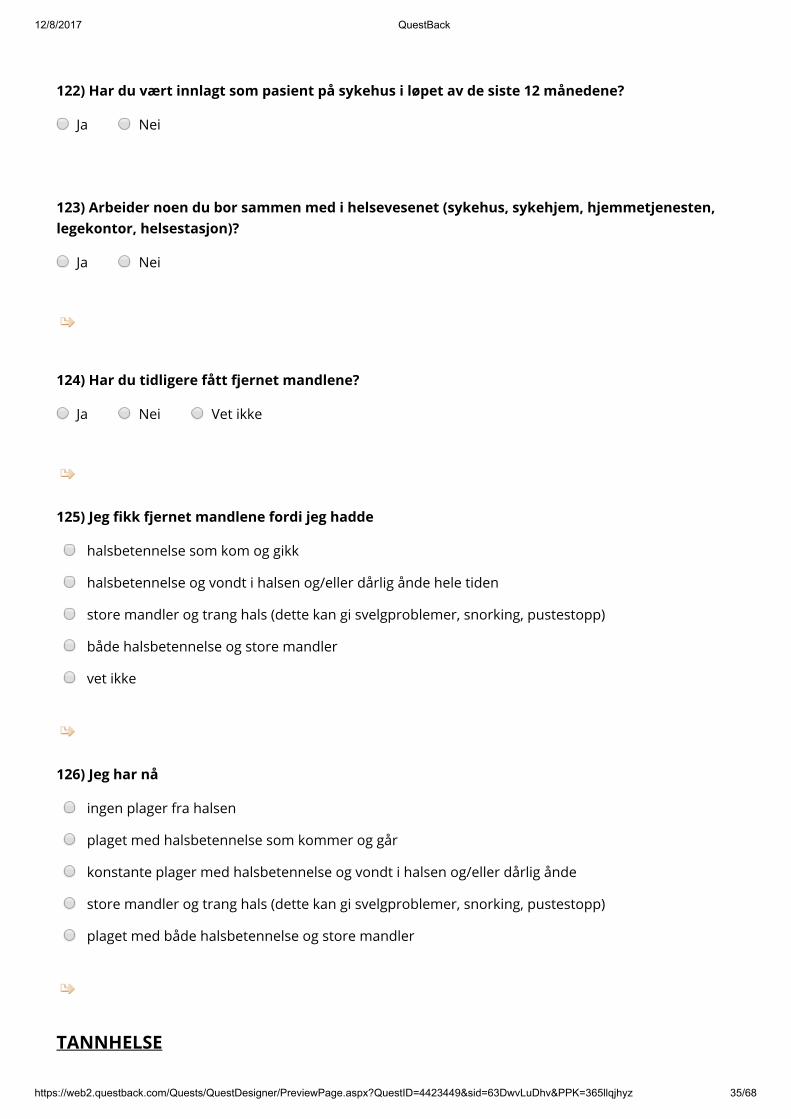
12/8/2017 QuestBack
https://web2.questback.com/Quests/QuestDesigner/PreviewPage.aspx?QuestID=4423449&sid=63DwvLuDhv&PPK=365llqjhyz 35/68
122) Har du vært innlagt som pasient på sykehus i løpet av de siste 12 månedene?
Ja Nei
123) Arbeider noen du bor sammen med i helsevesenet (sykehus, sykehjem, hjemmetjenesten, legekontor, helsestasjon)?
Ja Nei
124) Har du tidligere fått fjernet mandlene?
Ja Nei Vet ikke
125) Jeg �kk fjernet mandlene fordi jeg hadde
halsbetennelse som kom og gikk
halsbetennelse og vondt i halsen og/eller dårlig ånde hele tiden
store mandler og trang hals (dette kan gi svelgproblemer, snorking, pustestopp)
både halsbetennelse og store mandler
vet ikke
126) Jeg har nå
ingen plager fra halsen
plaget med halsbetennelse som kommer og går
konstante plager med halsbetennelse og vondt i halsen og/eller dårlig ånde
store mandler og trang hals (dette kan gi svelgproblemer, snorking, pustestopp)
plaget med både halsbetennelse og store mandler
TANNHELSE

12/8/2017 QuestBack
https://web2.questback.com/Quests/QuestDesigner/PreviewPage.aspx?QuestID=4423449&sid=63DwvLuDhv&PPK=365llqjhyz 36/68
127) Hvor ofte pusser du vanligvis tennene dine?
Sjeldnere enn 1 gang per uke
1 gang per uke
2-3 ganger per uke
4-6 ganger per uke
1 gang daglig
2 eller �ere ganger daglig
128) Hvor ofte bruker du noen av følgende hjelpemidler?
Daglig
Noengangeri uka
Noenganger i
måneden Sjelden/aldri
Fluor tannkrem
Tanntråd
Tannstikker
Fluortabletter
Fluor skyllevæske
129) Hvor ofte kontrollerte foreldrene dine eller dine foresatte at du hadde pusset tennene dine da du var yngre?
Ofte Omtrent daglig Av og til Sjelden/aldri
130) Hvordan vurderer du din egen tannhelse?
Meget god
God
Verken god eller dårlig
Dårlig
Meget dårlig
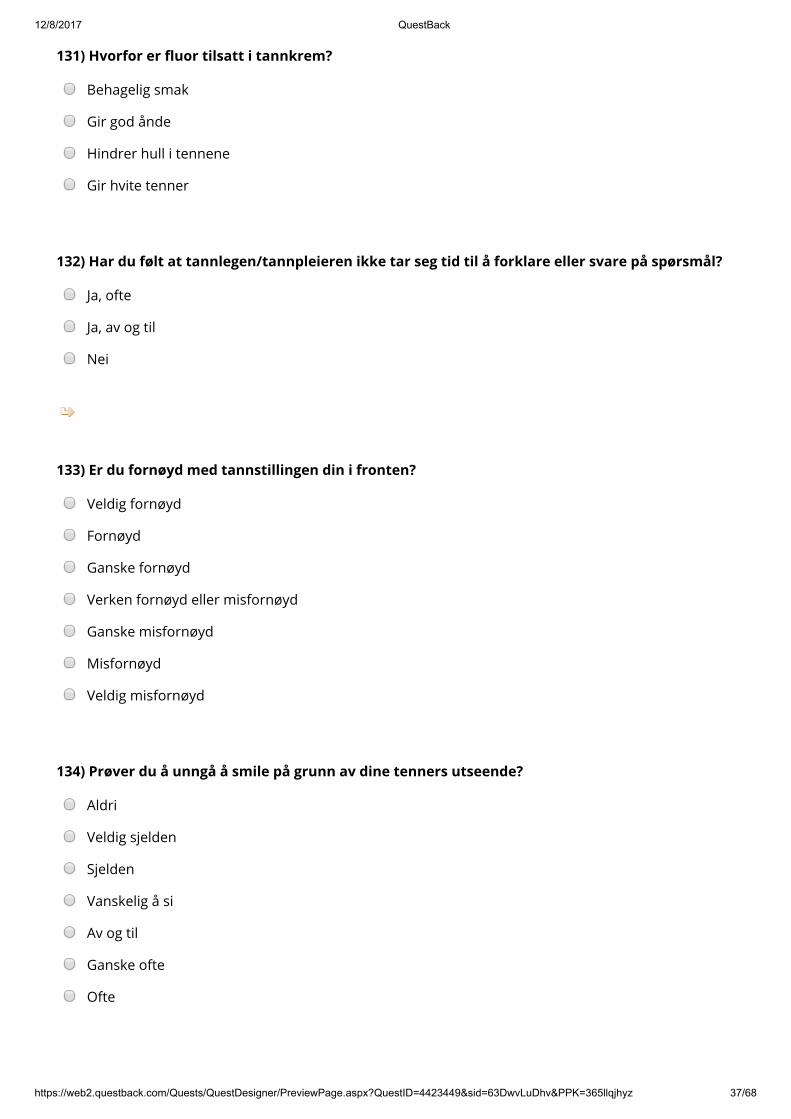
12/8/2017 QuestBack
https://web2.questback.com/Quests/QuestDesigner/PreviewPage.aspx?QuestID=4423449&sid=63DwvLuDhv&PPK=365llqjhyz 37/68
131) Hvorfor er �uor tilsatt i tannkrem?
Behagelig smak
Gir god ånde
Hindrer hull i tennene
Gir hvite tenner
132) Har du følt at tannlegen/tannpleieren ikke tar seg tid til å forklare eller svare på spørsmål?
Ja, ofte
Ja, av og til
Nei
133) Er du fornøyd med tannstillingen din i fronten?
Veldig fornøyd
Fornøyd
Ganske fornøyd
Verken fornøyd eller misfornøyd
Ganske misfornøyd
Misfornøyd
Veldig misfornøyd
134) Prøver du å unngå å smile på grunn av dine tenners utseende?
Aldri
Veldig sjelden
Sjelden
Vanskelig å si
Av og til
Ganske ofte
Ofte

12/8/2017 QuestBack
https://web2.questback.com/Quests/QuestDesigner/PreviewPage.aspx?QuestID=4423449&sid=63DwvLuDhv&PPK=365llqjhyz 38/68
135) Ønsker du tannregulering for å få rettet opp tennene dine?
Ja, absolutt
Ja
Ja, kanskje
Verken ja eller nei
Tror ikke det
Nei
Absolutt ikke
136) Har du hatt fast tannregulering/streng?
Ja Nei
137) Har du hatt avtagbar plate?
Ja Nei
138) Har du hatt tannregulering siden forrige gang du deltok i Fit Futures undersøkelsen?
Nei
Ja
Har ikke deltatt tidligere
139) Hadde du allergiske reaksjoner i forbindelse med tannreguleringen?
Ja Nei
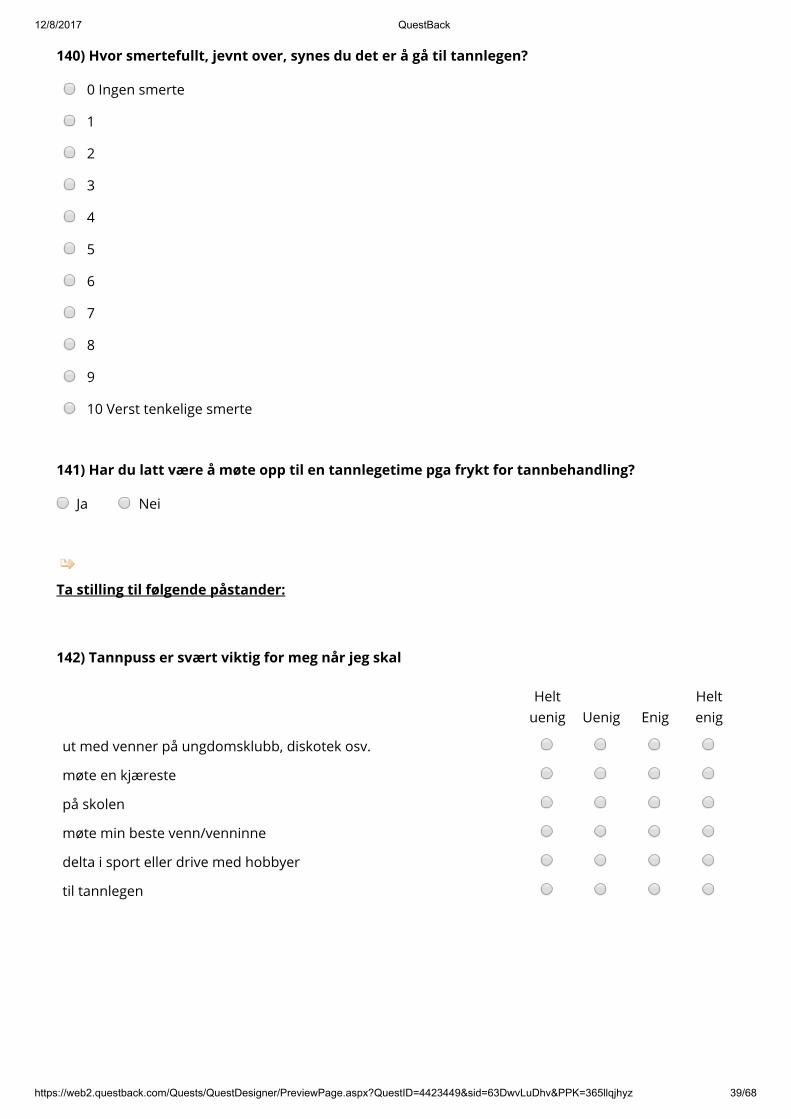
12/8/2017 QuestBack
https://web2.questback.com/Quests/QuestDesigner/PreviewPage.aspx?QuestID=4423449&sid=63DwvLuDhv&PPK=365llqjhyz 39/68
140) Hvor smertefullt, jevnt over, synes du det er å gå til tannlegen?
0 Ingen smerte
1
2
3
4
5
6
7
8
9
10 Verst tenkelige smerte
141) Har du latt være å møte opp til en tannlegetime pga frykt for tannbehandling?
Ja Nei
Ta stilling til følgende påstander:
142) Tannpuss er svært viktig for meg når jeg skal
Heltuenig Uenig Enig
Heltenig
ut med venner på ungdomsklubb, diskotek osv.
møte en kjæreste
på skolen
møte min beste venn/venninne
delta i sport eller drive med hobbyer
til tannlegen
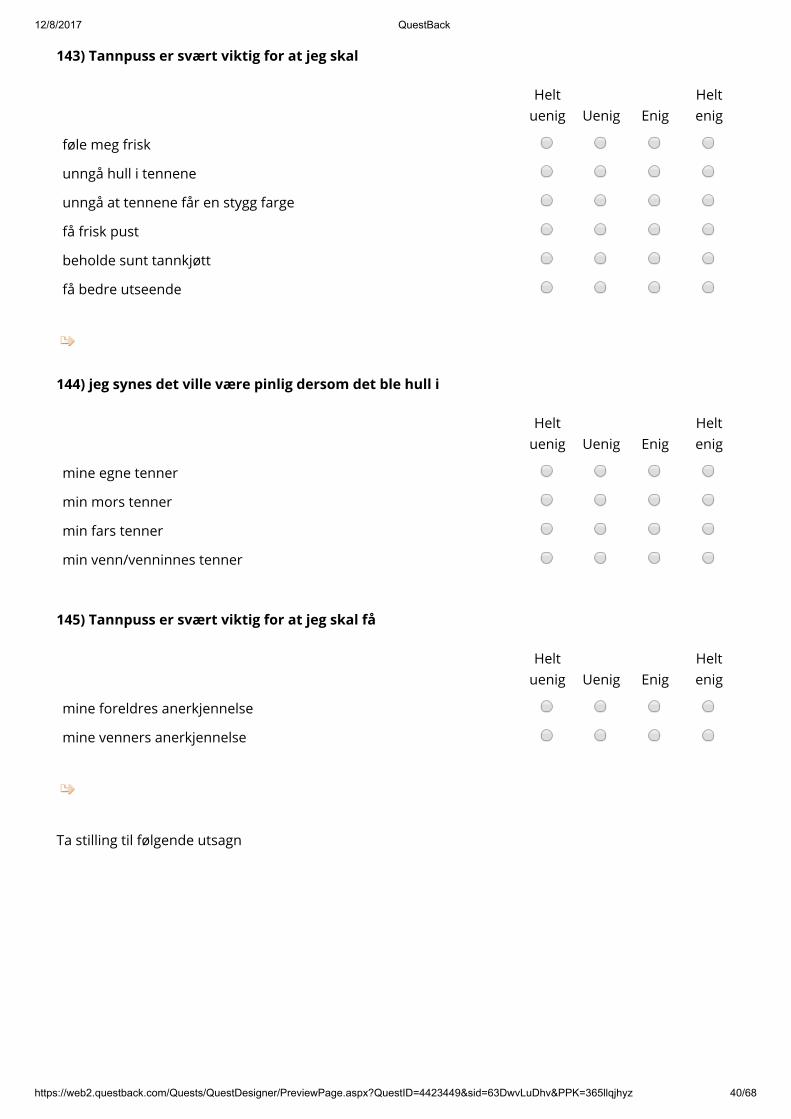
12/8/2017 QuestBack
https://web2.questback.com/Quests/QuestDesigner/PreviewPage.aspx?QuestID=4423449&sid=63DwvLuDhv&PPK=365llqjhyz 40/68
143) Tannpuss er svært viktig for at jeg skal
Heltuenig Uenig Enig
Heltenig
føle meg frisk
unngå hull i tennene
unngå at tennene får en stygg farge
få frisk pust
beholde sunt tannkjøtt
få bedre utseende
144) jeg synes det ville være pinlig dersom det ble hull i
Heltuenig Uenig Enig
Heltenig
mine egne tenner
min mors tenner
min fars tenner
min venn/venninnes tenner
145) Tannpuss er svært viktig for at jeg skal få
Heltuenig Uenig Enig
Heltenig
mine foreldres anerkjennelse
mine venners anerkjennelse
Ta stilling til følgende utsagn
12/8/2017 QuestBack
https://web2.questback.com/Quests/QuestDesigner/PreviewPage.aspx?QuestID=4423449&sid=63DwvLuDhv&PPK=365llqjhyz 41/68
146) Hvor sikker er du på at du vil pusse tennene 2 ganger om dagen i 2 minutter med �uortannkrem i følgende situasjoner
Sværtsikker
Ganskesikker
Noeusikker
Ganskeusikker
Når du er trøtt om kvelden
Når du har mye å gjøre (mye lekser, eksamener)
Når du har skoleferie
Når du er trøtt på morgenen
Når du føler deg syk (hodepine)
147) Hvor sikker er du på at du er villig til avstå fra sukkerholdige drikker som brus, juice og saft til andre tider enn ved lunsj eller middag?
Svært sikker
Ganske sikker
Noe usikker
Svært usikker
148) Jeg har til hensikt å pusse tennene 2 ganger om dagen i minst 2 minutter med �uortannkrem hver dag
Helt enig
Enig
Uenig
Helt uenig
149) Hvor fornøyd er du med din tannhelse?
Svært misfornøyd
Misfornøyd
Verken eller
Fornøyd
Svært fornøyd

12/8/2017 QuestBack
https://web2.questback.com/Quests/QuestDesigner/PreviewPage.aspx?QuestID=4423449&sid=63DwvLuDhv&PPK=365llqjhyz 42/68
150) Har du vært, eller er du, plaget med sur smak i munnen eller sure oppstøt?
Nei Ja
151) Hvor ofte har du vært, eller er du, plaget med sur smak i munnen eller sure oppstøt?
Daglig
Noen ganger i uken
Månedlig
Sjelden eller aldri
152) Hvor lenge har det vart?
Uker
Måneder
Flere år
153) Har du vært, eller er du, plaget med oppkast?
Nei Ja
154) Hvor ofte har du vært, eller er du, plaget med oppkast?
Daglig
Noen ganger i uken
Månedlig
Sjelden eller aldri
155) Hvor lenge har det vart?
Uker
Måneder
Flere år

12/8/2017 QuestBack
https://web2.questback.com/Quests/QuestDesigner/PreviewPage.aspx?QuestID=4423449&sid=63DwvLuDhv&PPK=365llqjhyz 43/68
ASTMA OG PUSTEBESVÆR
156) Har du - de siste 12 månedene - hatt pipende eller hvesende pust?
Nei Ja
157) Hvor mange ganger har du hatt disse plagene de siste 12 månedene ?
1-3 ganger
4-12 ganger
Mer enn 12 ganger
158) Har du - de siste 12 månedene - unnlatt å gjøre ting du vil gjøre pga pipende eller hvesende pust?
Nei
Ja
159) Hvor mye har pipende eller hvesende pust hindret deg fra å gjøre ting du har villet gjøre de siste 12 månedene?
Lite
Moderat
Ganske mye
Mye
160) Har du - de siste 12 månedene - hatt vanskelig for å sove, eller våknet pga pipende eller hvesende pust?
Nei
Mindre enn en gang i uken
1 eller �ere ganger i uken

12/8/2017 QuestBack
https://web2.questback.com/Quests/QuestDesigner/PreviewPage.aspx?QuestID=4423449&sid=63DwvLuDhv&PPK=365llqjhyz 44/68
161) Har du - de siste 12 månedene - vært borte fra skolen pga pipende eller hvesende pust?
Nei Ja
162) Hvor mange dager har du vært borte fra skolen pga pipende eller hvesende pust de siste 12 månedene?
Mindre enn 5 dager
5-10 dager
Mer enn 10 dager
163) Har du - de siste 12 månedene - hatt så store plager med pipende eller hvesende pust, at du har hatt behov for å ta nye åndedrag midt i en setning?
Nei Ja
164) Har du - de siste 12 månedene - hatt pustebesvær (hatt tungt for å puste, kjent deg tett i brystet, hatt pipende eller hvesende pust)?
Nei Ja
12/8/2017 QuestBack
https://web2.questback.com/Quests/QuestDesigner/PreviewPage.aspx?QuestID=4423449&sid=63DwvLuDhv&PPK=365llqjhyz 45/68
165) Dersom du har hatt pustebesvær eller pipende eller hvesende pust de siste 12 månedene, hvor tungt opplevde du at det var å puste? (Marker med et kryss på linjen)
0 Ikke tungt i det hele tatt
1
2
3
4
5
6
7
8
9
10 Verst tenkbar
166) Har du - de siste 12 månedene - hatt pipende eller hvesende pust, tungt for å puste, eller besværlig hoste, i forbindelse med noe av det nedenstående?
Nei, har ikke hatt besvær ved noe av dette
Kald luft eller tåke
Katt
Hund
Hest
Bjørkepollen
Gresspollen
Burotpollen
Psykisk belastning eller stress
Tobakksrøyk
Luftforurensninger
Sterke dufter
Mat eller matos
Kald drikke
Annet
12/8/2017 QuestBack
https://web2.questback.com/Quests/QuestDesigner/PreviewPage.aspx?QuestID=4423449&sid=63DwvLuDhv&PPK=365llqjhyz 46/68
167) Har du - de siste 12 månedene - hatt pipende eller hvesende pust, tungt for å puste, eller besværlig hoste i forbindelse med anstrengelse?
Nei Ja
168) Har du - de siste 12 månedene - brukt noen medisiner for astma eller pustebesvær?
Nei Ja
169) Hvilke medisiner for astma eller pustebesvær har du brukt de siste 12 månedene?
Vedbehov,eller for
enkortereperiode,
noenuker avgangen
Over enlengre
periode,minst 2
mnd
Bricanyl, Ventoline, Airomir, Buventol, Salbutamol Arrow
Pulmicort, Flutide, Becotide, Giona Easyhaler, Beklomet, AeroBec autohaler,Budesonid Arrow, Alvesco
Symbicort, Seretide
Oxis, Serevent, Onbrez Breezehaler
Atrovent, Ipraxa, Ipratropiumbromid
Singulair tabelett
170) Dersom du bruker luftrørsutvidende medisin (Bricanyl, Ventoline, Airomir, buventol...), hvor ofte bruker du dem i løpet av en vanlig uke?
Mindre enn 2 ganger pr uke
2 ganger eller mer pr uke

12/8/2017 QuestBack
https://web2.questback.com/Quests/QuestDesigner/PreviewPage.aspx?QuestID=4423449&sid=63DwvLuDhv&PPK=365llqjhyz 47/68
171) Har du - de siste 12 månedene - tatt kortisontabletter oppløst i vann (f.eks Betapred) mot astma eller pustebesvær?
Nei Ja
172) Har du tatt kortisontabletter oppløst i vann 3 dager i strekk eller mer de siste 12 månedene?
Nei Ja
173) Har du brukt medisiner for astma eller pustebesvær som er skrevet ut til andre?
Nei
Ja, delvis
Ja, helt
174) Har noen andre brukt dine medisiner for astma eller pustebesvær?
Nei
Ja, delvis
Ja, helt
175) Hvor mange inhalatorer av samme merke bruker du å ha samtidig? (men kanskje på ulike steder)
1 inhalator
2 inhalatorer
3 inhalatorer
Mer enn 3 inhalatorer
176) Hvor ofte hender det at du bruker din inhalator til den er tom?
Aldri
Sjelden
Ofte
Alltid
12/8/2017 QuestBack
https://web2.questback.com/Quests/QuestDesigner/PreviewPage.aspx?QuestID=4423449&sid=63DwvLuDhv&PPK=365llqjhyz 48/68
177) Har du fått undervisning om din astmasykdom av sykepleier eller lege? (f.eks hva astma er slags sykdom, hvordan medisinene fungerer og hva du skal gjøre ved forverring)
Nei Ja
178) Har du - de siste 12 månedene - hatt tørrhoste om natten uten samtidig å være forkjølet?
Nei Ja
179) Har du vært plaget av hoste mesteparten av tiden, i minst 3 måneder pr år?
Nei
Ja
180) Hvor mange år har du vært plaget med hoste mesteparten av tiden, i minst 3 måneder pr år?
Velg... Velg...
181) Har du vært plaget av slim fra brystet mesteparten av tiden, i minst 3 måneder pr år?
Nei
Ja
182) Hvor mange år har du vært plaget med slim fra brystet mesteparten av tiden, i minst 3 måneder pr år?
Velg... Velg...
12/8/2017 QuestBack
https://web2.questback.com/Quests/QuestDesigner/PreviewPage.aspx?QuestID=4423449&sid=63DwvLuDhv&PPK=365llqjhyz 49/68
183) Om du har pustebesvær eller astma, har det...
Ikke idetheletatt Litt En del
Ganskemye Mye
hindret deg i skolearbeidet
hindret deg i fritidsaktiviteter
uroet deg de siste 4 ukene
HUDPLAGER OG EKSEM
184) Har du noen gang vært plaget av kviser?
Ja
Nei
Vet ikke
185) Hvor mye plaget er du av kviser idag?
0 Ingen plager
1
2
3
4
5
6
7
8
9
10 Verst tenkelige plager
186) Har du noen gang oppsøkt lege på grunn av kviser?
Ja Nei

12/8/2017 QuestBack
https://web2.questback.com/Quests/QuestDesigner/PreviewPage.aspx?QuestID=4423449&sid=63DwvLuDhv&PPK=365llqjhyz 50/68
187) Har du fått noen av disse behandlingene av lege?
Ja NeiVetikke
Lokalbehandling (f.eks. kremer eller oppløsninger)
Antibiotika tabletter (f.eks. Tetracyclin)
Roaccutan tabletter
188) Har du eller har du noen gang hatt psoriasis?
Ja Nei Vet ikke
189) Hvor gammel var du første gang du �kk psoriasis?
Velg... Velg...
190) Hvor mye plaget er du av psoriasis idag?
0 Ingen plager
1
2
3
4
5
6
7
8
9
10 Verst tenkelige plager
Verkebyller er svært store kviser som er ømme/smertefulle og som ofte gir arr.

12/8/2017 QuestBack
https://web2.questback.com/Quests/QuestDesigner/PreviewPage.aspx?QuestID=4423449&sid=63DwvLuDhv&PPK=365llqjhyz 51/68
191) Har du noen gang hatt verkebyller under armene/armhulene?
Ja
Nei
Vet ikke
192) Har du noen gang oppsøkt lege på grunn av verkebyllene?
Ja Nei
193) Har du noen gang hatt verkebyller i lyskene/nært skrittet?
Ja
Nei
Vet ikke
194) Har du noen gang oppsøkt lege på grunn av verkebyllene?
Ja
Nei
195) Har du - de siste 12 månedene - hatt plager med tørr hud?
Nei Ja
196) Har du - de siste 12 månedene - smurt deg med mykgjørende krem/lotion på grunn av tørr hud?
Nei
Ja, mindre enn 1 måned
Ja, 1-6 måneder
Ja, mer enn 6 måneder
12/8/2017 QuestBack
https://web2.questback.com/Quests/QuestDesigner/PreviewPage.aspx?QuestID=4423449&sid=63DwvLuDhv&PPK=365llqjhyz 52/68
197) Har du - de siste 12 månedene - hatt kløende utslett?
Nei Ja
198) Hvor lenge pleier det kløende utslettet å vare?
Mindre enn 1 uke
1-2 uker
Mer enn 2 uker
199) Hvor har du de kløende utslettene? (Flere alternativer kan krysses av)
I hodebunnen
I ansiktet
I ørene
På halsen eller i nakken
På håndledd eller fotledd
På hendene
På eller under rumpeballene
På lårenes innsider
På brystkasse, mage, rygg eller skuldre
I armhulene
På armenes eller benas utsider
I albuebøyer eller knehaser
I lysken eller underlivet
På føttene
Andre steder
200) Hvor gammel var du første gang du �kk denne typen utslett?
Velg... Velg...

12/8/2017 QuestBack
https://web2.questback.com/Quests/QuestDesigner/PreviewPage.aspx?QuestID=4423449&sid=63DwvLuDhv&PPK=365llqjhyz 53/68
201) I hvilken periode i løpet av året har du hatt kløende utslett de siste 12 månedene?
Januar
Februar
Mars
April
Mai
Juni
Juli
August
September
Oktober
November
Desember
202) Har det kløende utslettet forsvunnet helt ved noe tidspunkt de siste 12 månedene?
Nei Ja
203) Har du - de siste 12 månedene - hatt vanskelig for å få sove, eller våknet pga kløende utslett?
Nei
Mindre enn 1 gang pr uke
1 eller �ere ganger pr uke
204) Har du - den siste uken - hatt kløende utslett?
Nei Ja
205) I løpet av den siste uken, hvor mye har huden din klødd eller føltes smertefull?
Veldig mye
Ganske mye
Litt
Ikke i det hele tatt

12/8/2017 QuestBack
https://web2.questback.com/Quests/QuestDesigner/PreviewPage.aspx?QuestID=4423449&sid=63DwvLuDhv&PPK=365llqjhyz 54/68
206) I løpet av den siste uken, hvor plaget, trist eller lei deg, har du vært pga huden?
Veldig mye
Ganske mye
Litt
Ikke i det hele tatt
207) I løpet av den siste uken, har huden din påvirket hvordan det har vært å være sammen med dine venner?
Veldig mye
Ganske mye
Litt
Ikke i det hele tatt
208) I løpet av den siste uken, har du byttet eller hatt på deg andre eller spesielle klær/sko på grunn av din hud?
Veldig mye
Ganske mye
Litt
Ikke i det hele tatt
209) I løpet av den siste uken, har dine hudplager påvirket deg når det gjelder å gå ut eller holde på med dine hobbyer?
Veldig mye
Ganske mye
Litt
Ikke i det hele tatt
210) I løpet av den siste uken, har du unngått svømming eller annen trening pga dine hudplager?
Veldig mye
Ganske mye
Litt
Ikke i det hele tatt

12/8/2017 QuestBack
https://web2.questback.com/Quests/QuestDesigner/PreviewPage.aspx?QuestID=4423449&sid=63DwvLuDhv&PPK=365llqjhyz 55/68
211) I løpet av den siste uken, har huden din påvirket ditt skolearbeid?
Veldig mye
Ganske mye
Litt
Ikke i det hele tatt
212) Dersom du har hatt ferie: I løpet av den siste uken, har dine hudplager hindret deg i å nyte ferien?
Veldig mye
Ganske mye
Litt
Ikke i det hele tatt
213) I løpet av den siste uken, hvor mye plager har du hatt pga din hud fordi andre personer har gitt deg tilnavn, ertet deg, mobbet deg, stilt spørsmål eller unngått deg?
Veldig mye
Ganske mye
Litt
Ikke i det hele tatt
214) I løpet av den siste uken, hvor mye har din søvn blitt påvirket av dine hudplager?
Veldig mye
Ganske mye
Litt
Ikke i det hele tatt
215) I løpet av den siste uken, hvor mye problem har du hatt med behandlingen av huden din?
Veldig mye
Ganske mye
Litt
Ikke i det hele tatt

12/8/2017 QuestBack
https://web2.questback.com/Quests/QuestDesigner/PreviewPage.aspx?QuestID=4423449&sid=63DwvLuDhv&PPK=365llqjhyz 56/68
216) Har du - de siste 12 månedene - hatt eksem?
Nei Ja
217) Hvor lenge har du tilsammen hatt eksem de siste 12 månedene?
Mindre enn 1 måned
1-3 måneder
4-6 måneder
Mer enn 6 måneder
218) Har du smurt deg med kortison pga eksem de siste 12 månedene?
Nei
Ja, mindre enn 1 måned
Ja, 1-6 måneder
Ja, mer enn 6 måneder
219) Har du noen gang hatt håndeksem? (Kløende forandring i huden, blemmer eller kløende utslett)
Nei Ja
220) Hvor gammel var du da håndeksemet begynte?
Velg... Velg...
221) Har du - de siste 12 månedene - ved noen anledning hatt håndeksem?
Nei Ja
12/8/2017 QuestBack
https://web2.questback.com/Quests/QuestDesigner/PreviewPage.aspx?QuestID=4423449&sid=63DwvLuDhv&PPK=365llqjhyz 57/68
222) Hvor mye plaget er du av håndeksem i dag?
0 Ingen plager
1
2
3
4
5
6
7
8
9
10 Verst tenkelige plager
223) Hvor mange ganger kommer hendene dine i kontakt med vann i løpet av en dag? (ikke tell med den tiden du beskytter hendene med hansker)
Ingen ganger pr dag
1-10 ganger pr dag
11-20 ganger pr dag
21-30 ganger pr dag
Mer enn 30 ganger pr dag
224) Har du - noen gang - fått kløende utslett eller eksem (rødhet, blemmer eller �assing) av sminke eller hygieneprodukter?
Nei Ja

12/8/2017 QuestBack
https://web2.questback.com/Quests/QuestDesigner/PreviewPage.aspx?QuestID=4423449&sid=63DwvLuDhv&PPK=365llqjhyz 58/68
225) Av hva har du fått plager?
Sminke eller parfyme
Deodorant
Shampo eller balsam
Såpe eller dusjkrem
Annet
226) Har du - noen gang - farget håret? (farget, tonet, bleket eller stripet håret ditt, hjemme eller hos frisør)
Nei Ja
227) Har du noen gang fått plager ved hårfarging?
Nei Ja
228) På hvilken måte har du reagert når du har farget håret?
Reaksjon i ansiktet, hodebunn, på ørene eller halsen (rødhet, �assing, kløe)
Kraftig reaskjon i ansiktet, hodebunn, på ørene eller halsen (hevelse, væskende utslett)
Reaksjon på hendene (rødhet, �assing, kløe)
Annet
229) Har du - noen gang - fått kløende utslett eller eksem (rødhet, blemmer eller �assing) av latex eller gummi (ballonger, gummihansker, kondomer...)?
Nei Ja

12/8/2017 QuestBack
https://web2.questback.com/Quests/QuestDesigner/PreviewPage.aspx?QuestID=4423449&sid=63DwvLuDhv&PPK=365llqjhyz 59/68
230) Av hvilke latex-/gummiprodukter har du fått plager?
Ballonger ved ballongblåsing
Gummihansker
Kondomer
Annet
231) Har du - noen gang - tatt hull i ørene eller laget hull for smykker noen andre steder på kroppen?
Nei Ja
232) Har du noen tatovering?
Nei Ja
233) Har du noen gang fått kløende utslett eller eksem (rødhet, blemmer eller �assing) av din tatovering?
Nei Ja
234) Har du - noen gang - fått kløende utslett eller eksem (rødhet, blemmer eller �assing) av metallgjenstander?
Nei Ja
12/8/2017 QuestBack
https://web2.questback.com/Quests/QuestDesigner/PreviewPage.aspx?QuestID=4423449&sid=63DwvLuDhv&PPK=365llqjhyz 60/68
235) Av hva har du fått kløende utslett eller eksem?
Armbånd, halsbånd, �ngerring eller annet
Smykke (unntatt smykker for hull)
Smykker for hull
Knapp, nål, spenne, glidelås eller liknende i sko eller støvler
Klokke eller klokkereim
Briller eller solbriller
Hårspenner eller liknende
Mobiltelefon
Øretelefon
Annet
236) Dersom du har hudbesvær eller eksem, har det...
Ikke idetheletatt Litt En del
Ganskemye Mye
Hindret deg i skolearbeidet
Hindret deg i fritidsaktiviteter
Bekymret (Uroet) deg de siste �re ukene
NESE- ELLER ØYEPLAGER
237) Har du - de siste 12 månedene - hatt nysing, kløende nese, rennende nese eller tett nese uten at du samtidig har vært forkjølet?
Nei Ja
238) Har du hatt nysing, kløende nese, rennende nese eller tett nese i mer en 4 dager uten at du samtidig har vært forkjølet i de siste 12 månedene?
Nei Ja

12/8/2017 QuestBack
https://web2.questback.com/Quests/QuestDesigner/PreviewPage.aspx?QuestID=4423449&sid=63DwvLuDhv&PPK=365llqjhyz 61/68
239) Skjedde dette over 4 uker i strekk de siste 12 månedene?
Nei Ja
240) Hvor lenge har du hatt disse plagene uten samtidig å være forkjølet de siste 12 månedene?
Mindre enn 1 måned
1-3 måneder
3-6 måneder
Mer enn 6 måneder
241) Har disse neseplagene - de siste 12 månedene - forekommet samtidig med kløende, rennende øyne?
Nei Ja
242) I løpet av hvilken periode har du hatt plager med nysing, kløende nese, rennende nese eller tett nese de siste 12 månedene?
Januar
Februar
Mars
April
Mai
Juni
Juli
August
September
Oktober
November
Desember

12/8/2017 QuestBack
https://web2.questback.com/Quests/QuestDesigner/PreviewPage.aspx?QuestID=4423449&sid=63DwvLuDhv&PPK=365llqjhyz 62/68
243) Har du hatt nese- eller øyeplager, uten å være forkjølet, ved kontakt med noe av det nedenstående de siste 12 månedene?
Nei, har ikke hatt besvær med noen av disse
Katt
Hund
Hest
Kanin, marsvin eller andre gnagere
Bjørkepollen
Gresspollen
Burotpollen
Tobakksrøyk
Luftforurensninger
Sterke dufter
Annet
244) Har du unnlatt å gjøre ting du har villet gjøre pga neseplager de siste 12 månedene?
Nei Ja
245) Hvor mye har neseplagene påvirket at du har unnlatt å gjøre ting du har villet gjøre de siste 12 månedene?
Litt
Moderat
Ganske mye
Mye
246) Har du hatt vanskelig for å sove pga neseplager de siste 12 månedene?
Nei Ja
247) Har du - de siste 12 månedene - tatt noen medisiner for allergisnue/høysnue?
Nei Ja
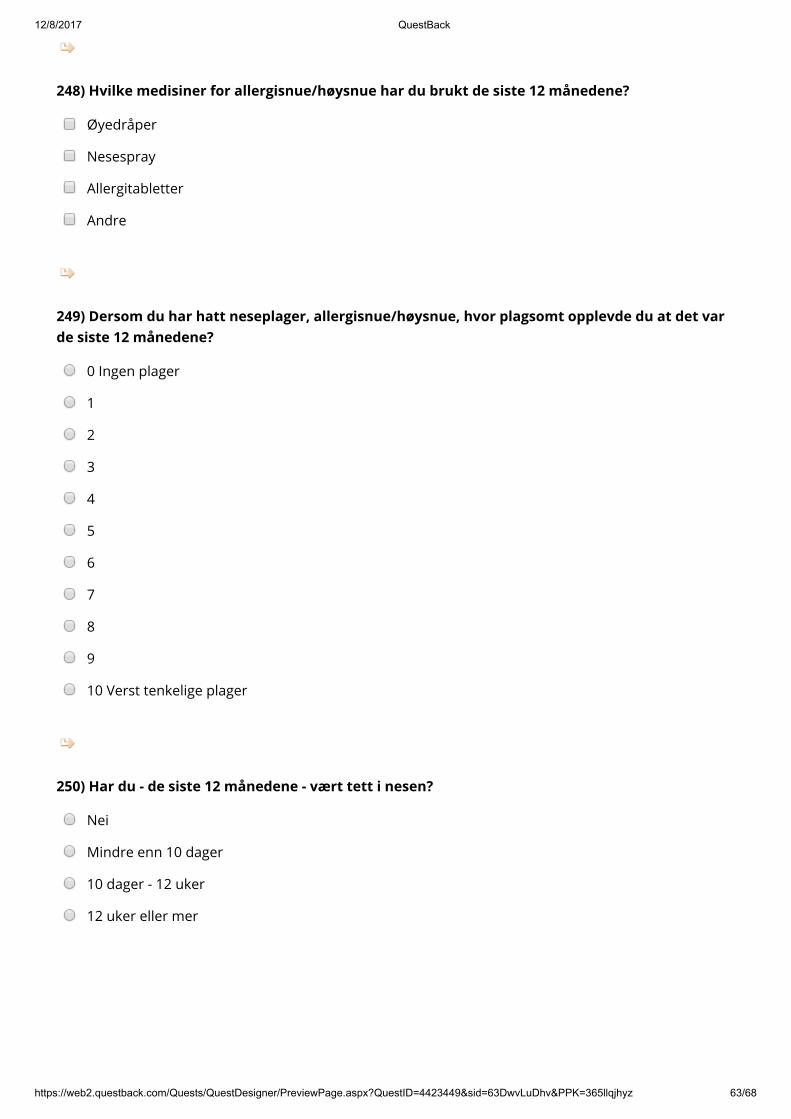
12/8/2017 QuestBack
https://web2.questback.com/Quests/QuestDesigner/PreviewPage.aspx?QuestID=4423449&sid=63DwvLuDhv&PPK=365llqjhyz 63/68
248) Hvilke medisiner for allergisnue/høysnue har du brukt de siste 12 månedene?
Øyedråper
Nesespray
Allergitabletter
Andre
249) Dersom du har hatt neseplager, allergisnue/høysnue, hvor plagsomt opplevde du at det var de siste 12 månedene?
0 Ingen plager
1
2
3
4
5
6
7
8
9
10 Verst tenkelige plager
250) Har du - de siste 12 månedene - vært tett i nesen?
Nei
Mindre enn 10 dager
10 dager - 12 uker
12 uker eller mer
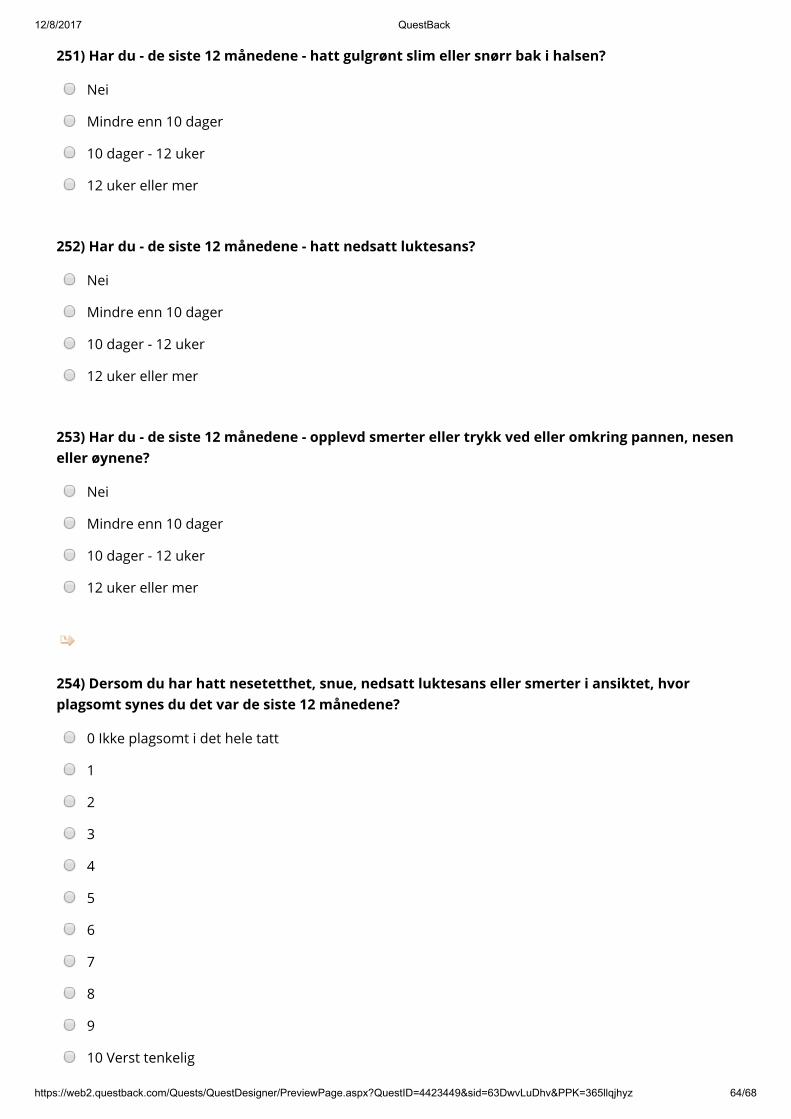
12/8/2017 QuestBack
https://web2.questback.com/Quests/QuestDesigner/PreviewPage.aspx?QuestID=4423449&sid=63DwvLuDhv&PPK=365llqjhyz 64/68
251) Har du - de siste 12 månedene - hatt gulgrønt slim eller snørr bak i halsen?
Nei
Mindre enn 10 dager
10 dager - 12 uker
12 uker eller mer
252) Har du - de siste 12 månedene - hatt nedsatt luktesans?
Nei
Mindre enn 10 dager
10 dager - 12 uker
12 uker eller mer
253) Har du - de siste 12 månedene - opplevd smerter eller trykk ved eller omkring pannen, nesen eller øynene?
Nei
Mindre enn 10 dager
10 dager - 12 uker
12 uker eller mer
254) Dersom du har hatt nesetetthet, snue, nedsatt luktesans eller smerter i ansiktet, hvor plagsomt synes du det var de siste 12 månedene?
0 Ikke plagsomt i det hele tatt
1
2
3
4
5
6
7
8
9
10 Verst tenkelig

12/8/2017 QuestBack
https://web2.questback.com/Quests/QuestDesigner/PreviewPage.aspx?QuestID=4423449&sid=63DwvLuDhv&PPK=365llqjhyz 65/68
255) Dersom du har hatt nese- eller øyeplager, har det...
Ikke idetheletatt Litt En del
Ganskemye Mye
Hindret deg i skolearbeid
Hindret deg i fritidsaktiviteter
Bekymret deg de siste 4 uker
Reaksjoner på mat
256) Har du - de siste 12 månedene - reagert på noe i maten?
Nei Ja

12/8/2017 QuestBack
https://web2.questback.com/Quests/QuestDesigner/PreviewPage.aspx?QuestID=4423449&sid=63DwvLuDhv&PPK=365llqjhyz 66/68
257) Har du reagert på noen av de nedenstående matvarene de siste 12 månedene?
Melk - protein
Melk - laktose
Egg
Fisk
Skalldyr
Hvete, andre kornslag
Soya
Sesam
Eple, pære
Fersken, nektarin, plommer, kirsebær
Kiwi
Banan
Rå gulrot
Peanøtter
Hasselnøtter
Mandel
Valnøtt, pekannøtt
Cashewnøtt, pistasjnøtt
Paranøtt
Annet
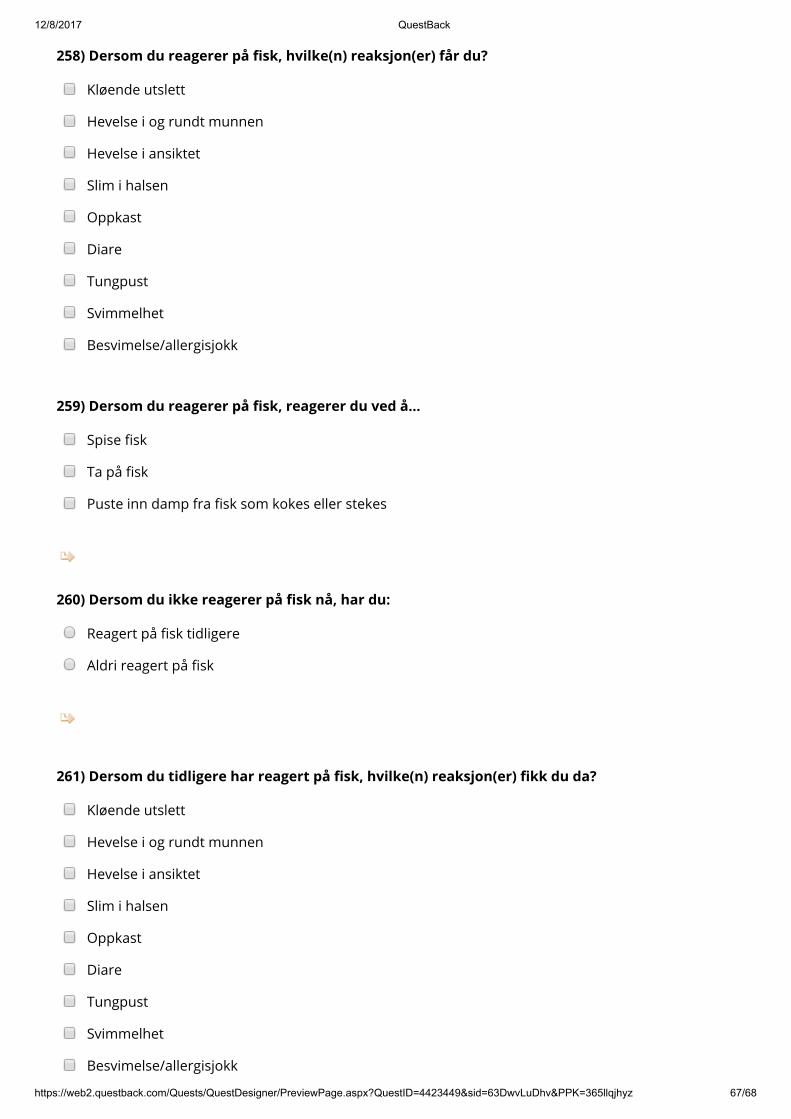
12/8/2017 QuestBack
https://web2.questback.com/Quests/QuestDesigner/PreviewPage.aspx?QuestID=4423449&sid=63DwvLuDhv&PPK=365llqjhyz 67/68
258) Dersom du reagerer på �sk, hvilke(n) reaksjon(er) får du?
Kløende utslett
Hevelse i og rundt munnen
Hevelse i ansiktet
Slim i halsen
Oppkast
Diare
Tungpust
Svimmelhet
Besvimelse/allergisjokk
259) Dersom du reagerer på �sk, reagerer du ved å...
Spise �sk
Ta på �sk
Puste inn damp fra �sk som kokes eller stekes
260) Dersom du ikke reagerer på �sk nå, har du:
Reagert på �sk tidligere
Aldri reagert på �sk
261) Dersom du tidligere har reagert på �sk, hvilke(n) reaksjon(er) �kk du da?
Kløende utslett
Hevelse i og rundt munnen
Hevelse i ansiktet
Slim i halsen
Oppkast
Diare
Tungpust
Svimmelhet
Besvimelse/allergisjokk
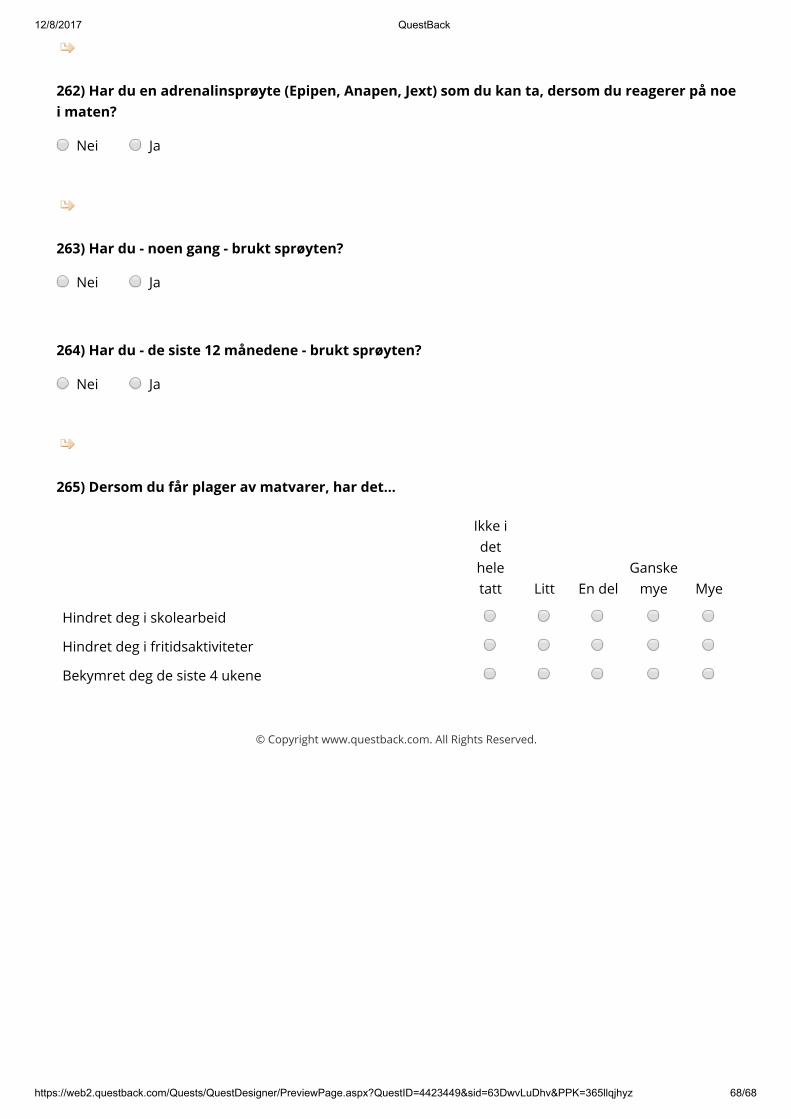
12/8/2017 QuestBack
https://web2.questback.com/Quests/QuestDesigner/PreviewPage.aspx?QuestID=4423449&sid=63DwvLuDhv&PPK=365llqjhyz 68/68
262) Har du en adrenalinsprøyte (Epipen, Anapen, Jext) som du kan ta, dersom du reagerer på noe i maten?
Nei Ja
263) Har du - noen gang - brukt sprøyten?
Nei Ja
264) Har du - de siste 12 månedene - brukt sprøyten?
Nei Ja
265) Dersom du får plager av matvarer, har det...
Ikke idetheletatt Litt En del
Ganskemye Mye
Hindret deg i skolearbeid
Hindret deg i fritidsaktiviteter
Bekymret deg de siste 4 ukene
© Copyright www.questback.com. All Rights Reserved.

Region: Saksbehandler: Telefon: Vår dato: Vår referanse:
REK nord 06.11.2014 2014/1666/REK nord
Deres dato: Deres referanse:
23.09.2014
Vår referanse må oppgis ved alle henvendelser
Besøksadresse:MH-bygget UiT Norges arktiskeuniversitet 9037 Tromsø
Telefon: 77646140E-post: [email protected]: http://helseforskning.etikkom.no/
All post og e-post som inngår isaksbehandlingen, bes adressert til REKnord og ikke til enkelte personer
Kindly address all mail and e-mails tothe Regional Ethics Committee, REKnord, not to individual staff
Sameline GrimsgaardInstitutt for Samfunnsmedisin
2014/1666 Vekt, vektutvikling og fysisk aktivitet i Fit Futures kohorten
NordlandssykehusetForskningsansvarlig: Sameline GrimsgaardProsjektleder:
Vi viser til søknad om forhåndsgodkjenning av ovennevnte forskningsprosjekt. Søknaden ble behandlet avRegional komité for medisinsk og helsefaglig forskningsetikk (REK nord) i møtet 23.10.2014. Vurderingener gjort med hjemmel i helseforskningsloven (hfl.) § 10, jf. forskningsetikkloven § 4.
Prosjektleders prosjektomtaleOvervekt/fedme og fysisk inaktivitet øker både blant barn og voksne og bidrar til økt sykelighet, dødelighetog behov for helsetjenester. Forekomsten av overvekt/fedme er høyere blant barn i Nord Norge enn i andredeler av landet. Vi har sparsomt med data og kunnskap om ungdom. Dette prosjektet vil gi ny kunnskap omdeterminanter for overvekt /fedme og sammenheng med fysisk aktivitet i en ungdomsundersøkelse. FitFutures-studien av ungdommer i videregående skole ble gjennomført i Tromsø/Balsfjord i 2010-11 og medoppfølgingsundersøkelse i 2012-13. I alt 688 ungdommer deltok i begge undersøkelser. Fysisk aktivitet blemålt med spørreskjema og aktivitetsmåler (Aktigraf) Vi planlegger både tverrsnitts- og longitudinelleanalyser.
Vurdering
Tidligere avgitt samtykkeFormålet med prosjektet er å undersøke: 1) Forekomst og determinanter for overvekt/fedme i enungdomskohort i Nord Norge, med fokus på selvrapportert fysisk aktivitet. 2) Endring, og determinanter forendring i overvekt/fedme mellom første og tredje år i videregående skole.
I samtykke avgitt i forbindelse med Fit futures er det opplyst at hovedområdene det forskes på er: Smerte,eksem og kviser, beintetthet, astma og allergi, diabetes, infeksjoner, øresus, ,fysisk aktivitet og overvektD-vitamin, frafall fra skole, jernmangel, genmodifisert mat, miljøgifter, personlighet og helseatferd ogtannhelse, syreskader og medfødte skader på tennene.
Det tidligere avgitte samtykke anses som dekkende for studien.
VedtakMed hjemmel i helseforskningsloven § 2 og § 9, samt forskningsetikkloven § 4 godkjennes prosjektet.
Sluttmelding og søknad om prosjektendringProsjektleder skal sende sluttmelding til REK nord på eget skjema senest 01.07.2018, jf. hfl. §
12. Prosjektleder skal sende søknad om prosjektendring til REK nord dersom det skal gjøres vesentligeendringer i forhold til de opplysninger som er gitt i søknaden, jf. hfl. § 11.
KlageadgangDu kan klage på komiteens vedtak, jf. forvaltningsloven § 28 flg. Klagen sendes til REK nord. Klagefristener tre uker fra du mottar dette brevet. Dersom vedtaket opprettholdes av REK nord, sendes klagen videre tilDen nasjonale forskningsetiske komité for medisin og helsefag for endelig vurdering.
Med vennlig hilsen
May Britt Rossvollsekretariatsleder
Kopi til:[email protected]

Region: Saksbehandler: Telefon: Vår dato: Vår referanse:
REK nord Maren JohannessenMelsbø
776 46 140 25.09.2018 2014/1666/REK nord
Deres dato: Deres referanse:
20.09.2018
Vår referanse må oppgis ved alle henvendelser
Besøksadresse:MH-bygget UiT Norges arktiskeuniversitet 9037 Tromsø
Telefon: 77646140E-post: [email protected]: http://helseforskning.etikkom.no/
All post og e-post som inngår isaksbehandlingen, bes adressert til REKnord og ikke til enkelte personer
Kindly address all mail and e-mails tothe Regional Ethics Committee, REKnord, not to individual staff
Sameline Grimsgaard
Institutt for Samfunnsmedisin
2014/1666 Vekt, vektutvikling og fysisk aktivitet i Fit Futures kohorten
Nordlandssykehuset, Nordlandssykehuset HFForskningsansvarlig: Sameline Grimsgaard Prosjektleder:
Vi viser til to søknader om prosjektendring, begge datert 20.9.2018. Søknadene er behandlet av Regionalkomité for medisinsk og helsefaglig forskningsetikk (REK nord) ved sekretariatsleder, etter fullmakt gitt avkomiteen med hjemmel i forskningsetikkforskriften § 7, første ledd, andre punktum. Søknadene er vurdertmed hjemmel i helseforskningsloven § 11.
VurderingProsjektleder opplyser i endringssøknadene at endringene gjelder forlengelse av prosjektperioden til1.8.2020 grunnet omsorgspermisjon hos prosjektleder og dermed utvidelse av stipendiatperioden, samttillegg av en ny prosjektmedarbeider som biveileder.
REK har ingen innvendinger til de omsøkte endringene.
Etter fullmakt er det fattet slikt
VedtakMed hjemmel i helseforskningsloven § 11 godkjennes prosjektendringen.
KlageadgangDu kan klage på komiteens vedtak, jf. helseforskningsloven § 10 og forvaltningsloven § 28 flg. Klagensendes til REK nord. Klagefristen er tre uker fra du mottar dette brevet. Dersom vedtaket opprettholdes avREK nord, sendes klagen videre til Den nasjonale forskningsetiske komité for medisin og helsefag forendelig vurdering.
Med vennlig hilsen
May Britt Rossvoll Sekretariatsleder
Maren Johannessen Melsbørådgiver
Kopi til: [email protected]; [email protected]
Region:
REK nord
Saksbehandler:
Maren Melsbø
Telefon:
77620748
Vår dato:
09.09.2020
Vår referanse:
9704
Deres referanse:
REK nord: MH-2, 12. etasje, UiT Norges arktiske universitet, TromsøBesøksadresse
:77 64 61 40 | :Telefon E-post [email protected]
:Web https://rekportalen.no
Sameline Grimsgaard
9704 Vekt, vektutvikling og fysisk aktivitet i Fit Futures kohorten
Forskningsansvarlig: Nordlandssykehuset HF
Søker: Sameline Grimsgaard
REKs vurdering
Vi viser til søknad om prosjektendring for ovennevnte forskningsprosjekt mottatt18.08.2020. Søknaden er behandlet av sekretariatet i REK Nord på delegert fullmakt frakomiteen, med hjemmel i forskningsetikkforskriften § 7, første ledd, tredje punktum.Søknaden er vurdert med hjemmel i helseforskningsloven § 11.
Det fremgår av endringsmeldingen at man søker å forlenge prosjektperioden frem til31.03.2021.
Dette er begrunnet med at «Stipendiatperioden er forlenget grunnet to omsorgspermisjonerog prosjektet søkes derfor forlenget . 31.03.2021. Protokollen er uendret.t.o.mAvhandlingen leveres i september 2020.»
REK har ingen innvendinger til dette:
På fullmakt er det fattet slikt:
Vedtak
Godkjent
Med hjemmel i helseforskningsloven § 11 godkjennes prosjektendringen.
Prosjektet er godkjent frem til ny omsøkt sluttdato 31.03.2021. Data skal oppbevares forkontrollhensyn i 5 år etter prosjektslutt. Etter dette skal data anonymiseres eller slettes.
Vi gjør samtidig oppmerksom på at etter personopplysningsloven må det også foreligge etbehandlingsgrunnlag etter personvernforordningen. Dette må forankres i egen institusjon.
MVH

May Britt RossvollSekretariatslederVeronica SørensenSeniorrådgiver
KlageadgangDu kan klage på komiteens vedtak, jf. forvaltningsloven § 28 flg. Klagen sendes til REKnord. Klagefristen er tre uker fra du mottar dette brevet. Dersom vedtaket opprettholdes avREK nord, sendes klagen videre til Den nasjonale forskningsetiske komité for medisin oghelsefag (NEM) for endelig vurdering.
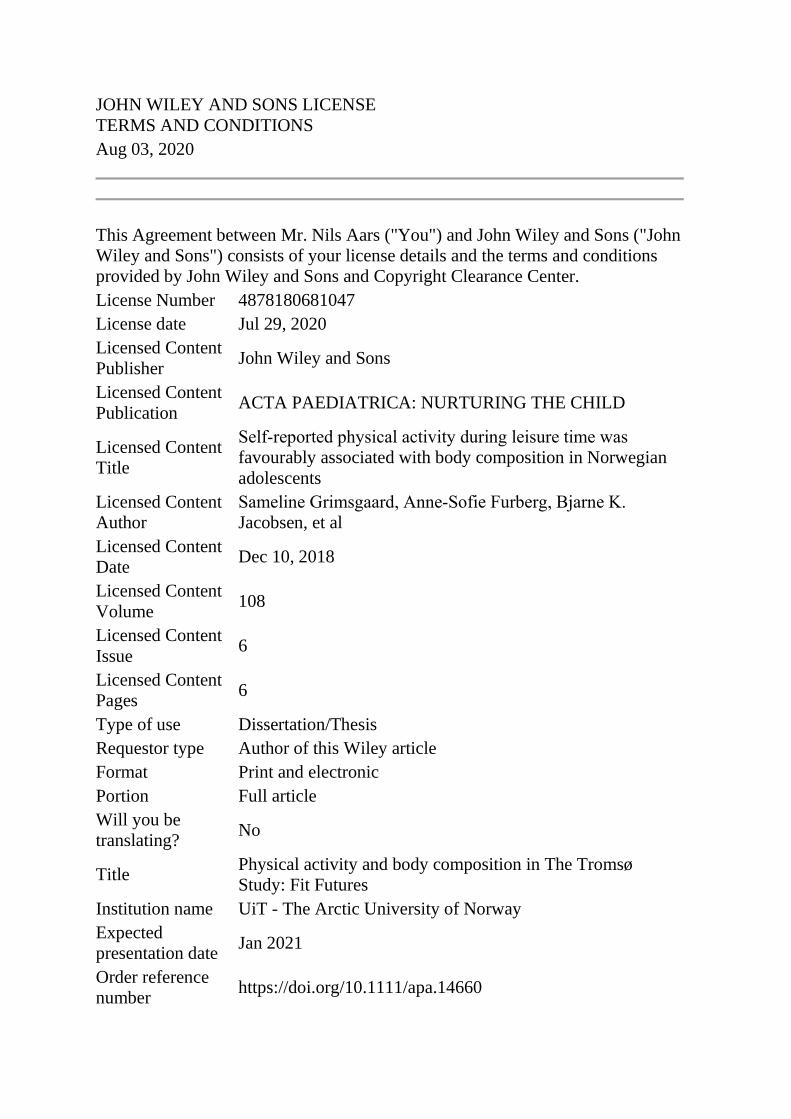
JOHN WILEY AND SONS LICENSE
TERMS AND CONDITIONS
Aug 03, 2020
This Agreement between Mr. Nils Aars ("You") and John Wiley and Sons ("John
Wiley and Sons") consists of your license details and the terms and conditions
provided by John Wiley and Sons and Copyright Clearance Center.
License Number 4878180681047
License date Jul 29, 2020
Licensed Content
Publisher John Wiley and Sons
Licensed Content
Publication ACTA PAEDIATRICA: NURTURING THE CHILD
Licensed Content
Title
Self‐reported physical activity during leisure time was
favourably associated with body composition in Norwegian
adolescents
Licensed Content
Author
Sameline Grimsgaard, Anne‐Sofie Furberg, Bjarne K.
Jacobsen, et al
Licensed Content
Date Dec 10, 2018
Licensed Content
Volume 108
Licensed Content
Issue 6
Licensed Content
Pages 6
Type of use Dissertation/Thesis
Requestor type Author of this Wiley article
Format Print and electronic
Portion Full article
Will you be
translating? No
Title Physical activity and body composition in The Tromsø
Study: Fit Futures
Institution name UiT - The Arctic University of Norway
Expected
presentation date Jan 2021
Order reference
number https://doi.org/10.1111/apa.14660
Requestor
Location
Mr. Nils Aars
Myrfiolveien 10
Bodø, 8027
Norway
Attn: Mr. Nils Aars
Publisher Tax ID EU826007151
Total 0.00 USD
Terms and Conditions
TERMS AND CONDITIONS
This copyrighted material is owned by or exclusively licensed to John Wiley &
Sons, Inc. or one of its group companies (each a"Wiley Company") or handled on
behalf of a society with which a Wiley Company has exclusive publishing rights
in relation to a particular work (collectively "WILEY"). By clicking "accept" in
connection with completing this licensing transaction, you agree that the
following terms and conditions apply to this transaction (along with the billing
and payment terms and conditions established by the Copyright Clearance Center
Inc., ("CCC's Billing and Payment terms and conditions"), at the time that you
opened your RightsLink account (these are available at any time
at http://myaccount.copyright.com).
Terms and Conditions
The materials you have requested permission to reproduce or reuse (the "Wiley Materials") are protected by copyright.
You are hereby granted a personal, non-exclusive, non-sub licensable (on
a stand-alone basis), non-transferable, worldwide, limited license to
reproduce the Wiley Materials for the purpose specified in the licensing
process. This license, and any CONTENT (PDF or image file)
purchased as part of your order, is for a one-time use only and limited
to any maximum distribution number specified in the license. The first
instance of republication or reuse granted by this license must be
completed within two years of the date of the grant of this license
(although copies prepared before the end date may be distributed
thereafter). The Wiley Materials shall not be used in any other manner or
for any other purpose, beyond what is granted in the license. Permission is
granted subject to an appropriate acknowledgement given to the author,
title of the material/book/journal and the publisher. You shall also
duplicate the copyright notice that appears in the Wiley publication in your
use of the Wiley Material. Permission is also granted on the understanding

that nowhere in the text is a previously published source acknowledged for
all or part of this Wiley Material. Any third party content is expressly excluded from this permission.
With respect to the Wiley Materials, all rights are reserved. Except as
expressly granted by the terms of the license, no part of the Wiley
Materials may be copied, modified, adapted (except for minor reformatting
required by the new Publication), translated, reproduced, transferred or
distributed, in any form or by any means, and no derivative works may be
made based on the Wiley Materials without the prior permission of the
respective copyright owner.For STM Signatory Publishers clearing
permission under the terms of the STM Permissions Guidelines only,
the terms of the license are extended to include subsequent editions
and for editions in other languages, provided such editions are for the
work as a whole in situ and does not involve the separate exploitation of the permitted figures or extracts, You may not alter, remove or
suppress in any manner any copyright, trademark or other notices
displayed by the Wiley Materials. You may not license, rent, sell, loan,
lease, pledge, offer as security, transfer or assign the Wiley Materials on a
stand-alone basis, or any of the rights granted to you hereunder to any
other person.
The Wiley Materials and all of the intellectual property rights therein shall
at all times remain the exclusive property of John Wiley & Sons Inc, the
Wiley Companies, or their respective licensors, and your interest therein is
only that of having possession of and the right to reproduce the Wiley
Materials pursuant to Section 2 herein during the continuance of this
Agreement. You agree that you own no right, title or interest in or to the
Wiley Materials or any of the intellectual property rights therein. You shall
have no rights hereunder other than the license as provided for above in
Section 2. No right, license or interest to any trademark, trade name,
service mark or other branding ("Marks") of WILEY or its licensors is
granted hereunder, and you agree that you shall not assert any such right,
license or interest with respect thereto
NEITHER WILEY NOR ITS LICENSORS MAKES ANY WARRANTY
OR REPRESENTATION OF ANY KIND TO YOU OR ANY THIRD
PARTY, EXPRESS, IMPLIED OR STATUTORY, WITH RESPECT TO
THE MATERIALS OR THE ACCURACY OF ANY INFORMATION
CONTAINED IN THE MATERIALS, INCLUDING, WITHOUT
LIMITATION, ANY IMPLIED WARRANTY OF
MERCHANTABILITY, ACCURACY, SATISFACTORY QUALITY,
FITNESS FOR A PARTICULAR PURPOSE, USABILITY,
INTEGRATION OR NON-INFRINGEMENT AND ALL SUCH

WARRANTIES ARE HEREBY EXCLUDED BY WILEY AND ITS
LICENSORS AND WAIVED BY YOU.
WILEY shall have the right to terminate this Agreement immediately upon breach of this Agreement by you.
You shall indemnify, defend and hold harmless WILEY, its Licensors and
their respective directors, officers, agents and employees, from and against
any actual or threatened claims, demands, causes of action or proceedings arising from any breach of this Agreement by you.
IN NO EVENT SHALL WILEY OR ITS LICENSORS BE LIABLE TO
YOU OR ANY OTHER PARTY OR ANY OTHER PERSON OR
ENTITY FOR ANY SPECIAL, CONSEQUENTIAL, INCIDENTAL,
INDIRECT, EXEMPLARY OR PUNITIVE DAMAGES, HOWEVER
CAUSED, ARISING OUT OF OR IN CONNECTION WITH THE
DOWNLOADING, PROVISIONING, VIEWING OR USE OF THE
MATERIALS REGARDLESS OF THE FORM OF ACTION,
WHETHER FOR BREACH OF CONTRACT, BREACH OF
WARRANTY, TORT, NEGLIGENCE, INFRINGEMENT OR
OTHERWISE (INCLUDING, WITHOUT LIMITATION, DAMAGES
BASED ON LOSS OF PROFITS, DATA, FILES, USE, BUSINESS
OPPORTUNITY OR CLAIMS OF THIRD PARTIES), AND WHETHER
OR NOT THE PARTY HAS BEEN ADVISED OF THE POSSIBILITY
OF SUCH DAMAGES. THIS LIMITATION SHALL APPLY
NOTWITHSTANDING ANY FAILURE OF ESSENTIAL PURPOSE OF ANY LIMITED REMEDY PROVIDED HEREIN.
Should any provision of this Agreement be held by a court of competent
jurisdiction to be illegal, invalid, or unenforceable, that provision shall be
deemed amended to achieve as nearly as possible the same economic
effect as the original provision, and the legality, validity and enforceability
of the remaining provisions of this Agreement shall not be affected or impaired thereby.
The failure of either party to enforce any term or condition of this
Agreement shall not constitute a waiver of either party's right to enforce
each and every term and condition of this Agreement. No breach under
this agreement shall be deemed waived or excused by either party unless
such waiver or consent is in writing signed by the party granting such
waiver or consent. The waiver by or consent of a party to a breach of any
provision of this Agreement shall not operate or be construed as a waiver of or consent to any other or subsequent breach by such other party.
This Agreement may not be assigned (including by operation of law or
otherwise) by you without WILEY's prior written consent.
Any fee required for this permission shall be non-refundable after thirty (30) days from receipt by the CCC.
These terms and conditions together with CCC's Billing and Payment
terms and conditions (which are incorporated herein) form the entire
agreement between you and WILEY concerning this licensing transaction
and (in the absence of fraud) supersedes all prior agreements and
representations of the parties, oral or written. This Agreement may not be
amended except in writing signed by both parties. This Agreement shall be
binding upon and inure to the benefit of the parties' successors, legal representatives, and authorized assigns.
In the event of any conflict between your obligations established by these
terms and conditions and those established by CCC's Billing and Payment terms and conditions, these terms and conditions shall prevail.
WILEY expressly reserves all rights not specifically granted in the
combination of (i) the license details provided by you and accepted in the
course of this licensing transaction, (ii) these terms and conditions and (iii) CCC's Billing and Payment terms and conditions.
This Agreement will be void if the Type of Use, Format, Circulation, or Requestor Type was misrepresented during the licensing process.
This Agreement shall be governed by and construed in accordance with
the laws of the State of New York, USA, without regards to such state's
conflict of law rules. Any legal action, suit or proceeding arising out of or
relating to these Terms and Conditions or the breach thereof shall be
instituted in a court of competent jurisdiction in New York County in the
State of New York in the United States of America and each party hereby
consents and submits to the personal jurisdiction of such court, waives any
objection to venue in such court and consents to service of process by
registered or certified mail, return receipt requested, at the last known address of such party.
WILEY OPEN ACCESS TERMS AND CONDITIONS
Wiley Publishes Open Access Articles in fully Open Access Journals and in
Subscription journals offering Online Open. Although most of the fully Open
Access journals publish open access articles under the terms of the Creative
Commons Attribution (CC BY) License only, the subscription journals and a few

of the Open Access Journals offer a choice of Creative Commons Licenses. The
license type is clearly identified on the article.
The Creative Commons Attribution License
The Creative Commons Attribution License (CC-BY) allows users to copy,
distribute and transmit an article, adapt the article and make commercial use of
the article. The CC-BY license permits commercial and non-
Creative Commons Attribution Non-Commercial License
The Creative Commons Attribution Non-Commercial (CC-BY-
NC)License permits use, distribution and reproduction in any medium, provided
the original work is properly cited and is not used for commercial purposes.(see
below)
Creative Commons Attribution-Non-Commercial-NoDerivs License
The Creative Commons Attribution Non-Commercial-NoDerivs License (CC-
BY-NC-ND) permits use, distribution and reproduction in any medium, provided
the original work is properly cited, is not used for commercial purposes and no
modifications or adaptations are made. (see below)
Use by commercial "for-profit" organizations
Use of Wiley Open Access articles for commercial, promotional, or marketing
purposes requires further explicit permission from Wiley and will be subject to a
fee.
Further details can be found on Wiley Online
Library http://olabout.wiley.com/WileyCDA/Section/id-410895.html
Other Terms and Conditions:
v1.10 Last updated September 2015
Questions? [email protected] or +1-855-239-3415 (toll free in
the US) or +1-978-646-2777.

Related Documents


