Thermal-diffusion and diffusion-thermo effects on squeezing flow of unsteady magneto-hydrodynamic Casson fluid between two parallel plates with thermal radiation N B NADUVINAMANI 1, * and USHA SHANKAR 1,2 1 Department of Mathematics, Gulbarga University, Kalaburagi 585 106, India 2 Department of Karnataka Power Corporation Limited, Raichur Thermal Power Station, Shaktinagar, Raichur 584 170, India e-mail: [email protected] MS received 5 December 2018; revised 20 February 2019; accepted 22 May 2019 Abstract. Present numerical study examines the heat and mass transfer characteristics of unsteady magneto- hydrodynamic squeezing flow of Casson fluid between two parallel plates with viscous and Joule dissipation effects in the presence of chemical reaction. The influence of Soret and Dufour parameters on squeezing flow is investigated along with thermal radiation and heat source/sink effects. The heat and mass transfer behaviour of squeezing flow is analysed by considering the rheological Casson fluid model. The present physical problem is governed by the set of nonlinear coupled time-dependent partial differential equations (PDEs). The method of similarity transformation approach is used to reduce the system of PDEs to a system of nonlinear ordinary differential equations (ODEs). Further, the Runge–Kutta fourth order integration scheme with shooting method (RK-SM) is used to solve the reduced ODEs. Numerical computations are performed for different sets of control parameters. The non-Newtonian flow behaviour of Casson fluid is presented in terms of graphs and tables. It is remarked that the temperature field is enhanced for increasing values of Hartmann number. Also, increasing Casson fluid parameter increases the velocity field. Concentration field is diminished for enhancing values of Soret parameter. Finally, the comparison between present similarity solutions and previously published results shows the accuracy of the current results. Keywords. Soret and Dufour; Hartmann number; thermal radiation; Casson fluid; Joule dissipation; chemical reaction. 1. Introduction Numerical heat and mass transfer characteristics of viscous fluid flow between two parallel disks/plates gained lot of attention in the current technology. This is owing to their large scale technical and industrial applications, like poly- mer processing, liquid metal lubrication, compression, squeezed film in power transmission and injection mod- elling. Most of the polymer processing cases, like thin sheets and paper formations, design of plastic and metal sheets, etc., include the squeezing flows. The literature [1–3] gives the best physical insight of these applications in detail. The biomedical applications comprise the flow inside syringes, nasogastric tubes, modelling of a synthetic materials or chemicals passage inside living bodies and physiological fluid flow through arteries due to the pumping of heart. Also, the synovial liquid inside the synovial cavity acts as a lubricant material between the hyaline cartilage or fibrocartilage, and the situation can be described through the squeezing phenomenon. However, there are some suitable examples of viscous non-Newtonian squeezing flows existing in bioengineering and biology [4–6]. The fundamental research work on squeezing flow was made by Stefan [7]. Based on the assumptions of lubrica- tion theory, Stefan formulated the basic mathematical model for squeezing flow in detail under the appropriate thermodynamic conditions. Later a number of researchers gave their attention to study the thermodynamic behaviour of squeezing flows in different flow configurations. Rey- nolds [8] extended Stefan’s problem to elliptic plates. Also, Archibald [9] studied a similar problem for rectangular plates. Since then, a number of scientists and engineers studied and analysed Stefan’s work in various flow con- figurations in a better way [10–14]. Further, the heat and mass transfer behaviour of time-dependent viscous fluid flow between two parallel plates was studied by Mustafa et al [15] by using homotopy analysis method. Also, their study reports that, for the higher values of Prandtl and *For correspondence Sådhanå (2019)44:175 Ó Indian Academy of Sciences https://doi.org/10.1007/s12046-019-1154-5

Welcome message from author
This document is posted to help you gain knowledge. Please leave a comment to let me know what you think about it! Share it to your friends and learn new things together.
Transcript
Thermal-diffusion and diffusion-thermo effects on squeezing flowof unsteady magneto-hydrodynamic Casson fluid between two parallelplates with thermal radiation
N B NADUVINAMANI1,* and USHA SHANKAR1,2
1Department of Mathematics, Gulbarga University, Kalaburagi 585 106, India2Department of Karnataka Power Corporation Limited, Raichur Thermal Power Station,
Shaktinagar, Raichur 584 170, India
e-mail: [email protected]
MS received 5 December 2018; revised 20 February 2019; accepted 22 May 2019
Abstract. Present numerical study examines the heat and mass transfer characteristics of unsteady magneto-
hydrodynamic squeezing flow of Casson fluid between two parallel plates with viscous and Joule dissipation
effects in the presence of chemical reaction. The influence of Soret and Dufour parameters on squeezing flow is
investigated along with thermal radiation and heat source/sink effects. The heat and mass transfer behaviour of
squeezing flow is analysed by considering the rheological Casson fluid model. The present physical problem is
governed by the set of nonlinear coupled time-dependent partial differential equations (PDEs). The method of
similarity transformation approach is used to reduce the system of PDEs to a system of nonlinear ordinary
differential equations (ODEs). Further, the Runge–Kutta fourth order integration scheme with shooting method
(RK-SM) is used to solve the reduced ODEs. Numerical computations are performed for different sets of control
parameters. The non-Newtonian flow behaviour of Casson fluid is presented in terms of graphs and tables. It is
remarked that the temperature field is enhanced for increasing values of Hartmann number. Also, increasing
Casson fluid parameter increases the velocity field. Concentration field is diminished for enhancing values of
Soret parameter. Finally, the comparison between present similarity solutions and previously published results
shows the accuracy of the current results.
Keywords. Soret and Dufour; Hartmann number; thermal radiation; Casson fluid; Joule dissipation; chemical
reaction.
1. Introduction
Numerical heat and mass transfer characteristics of viscous
fluid flow between two parallel disks/plates gained lot of
attention in the current technology. This is owing to their
large scale technical and industrial applications, like poly-
mer processing, liquid metal lubrication, compression,
squeezed film in power transmission and injection mod-
elling. Most of the polymer processing cases, like thin
sheets and paper formations, design of plastic and metal
sheets, etc., include the squeezing flows. The literature
[1–3] gives the best physical insight of these applications in
detail. The biomedical applications comprise the flow
inside syringes, nasogastric tubes, modelling of a synthetic
materials or chemicals passage inside living bodies and
physiological fluid flow through arteries due to the pumping
of heart. Also, the synovial liquid inside the synovial cavity
acts as a lubricant material between the hyaline cartilage or
fibrocartilage, and the situation can be described through
the squeezing phenomenon. However, there are some
suitable examples of viscous non-Newtonian squeezing
flows existing in bioengineering and biology [4–6].
The fundamental research work on squeezing flow was
made by Stefan [7]. Based on the assumptions of lubrica-
tion theory, Stefan formulated the basic mathematical
model for squeezing flow in detail under the appropriate
thermodynamic conditions. Later a number of researchers
gave their attention to study the thermodynamic behaviour
of squeezing flows in different flow configurations. Rey-
nolds [8] extended Stefan’s problem to elliptic plates. Also,
Archibald [9] studied a similar problem for rectangular
plates. Since then, a number of scientists and engineers
studied and analysed Stefan’s work in various flow con-
figurations in a better way [10–14]. Further, the heat and
mass transfer behaviour of time-dependent viscous fluid
flow between two parallel plates was studied by Mustafa
et al [15] by using homotopy analysis method. Also, their
study reports that, for the higher values of Prandtl and*For correspondence
Sådhanå (2019) 44:175 � Indian Academy of Sciences
https://doi.org/10.1007/s12046-019-1154-5Sadhana(0123456789().,-volV)FT3](0123456789().,-volV)
Eckert numbers, the temperature field enhances rapidly in
the flow region.
The magneto-hydrodynamic (MHD) two-dimensional
flow between two parallel plates was studied by Siddiqui
et al [16] by using homotopy perturbation method (HPM).
The investigation illustrated in [16] shows that increasing
magnetic number diminishes the velocity field in the flow
region. Domairry and Aziz [17] investigated a similar
problem of squeezing flow of viscous incompressible fluid
between two parallel disks, in which they presented the
influence of inertia, magnetic field and injection/suction
effects on flow behaviour. The influence of viscous dissi-
pation on flow and heat transfer characteristics of unsteady
two-dimensional viscous incompressible fluid between two
impermeable parallel plates with constant temperature was
studied by Duwairi et al [18]. It is noticed from their study
that increasing squeezing number enhances the dimensional
velocity field in the flow region. The flow sensitivity and
thermal energy exchange of unsteady viscous incompress-
ible fluid past a porous sensor surface kept in a squeezing
channel with constant transpiration was studied by Mah-
mood et al [19]. It is observed from their study that
increasing squeezing number decreases the velocity field.
The steady-state axisymmetric squeezing flow of Newto-
nian fluid between parallel disks with heat transfer process
was studied by Tashtoush et al [20]. The phenomenon of
heat and mass transfer over a shrinking surface with suction
effect was investigated by Muhamin et al [21]. The hydro-
magnetic time-independent flow and heat transfer charac-
teristics of squeezed flow of electrically conducting viscous
fluid between two parallel disks with finite-difference
method was studied by Bahadir and Abbasov [22].
However, the phenomenon of heat transfer plays a key
role in most of the industrial processes such as glass
blowing, manufacturing of paper, spinning of metal, for-
mation of glass fibres, coating of wires, hot rolling, aero-
dynamic extrusion of plastic sheets, continuous casting,
drawing of plastic films, formation of glass sheets, etc. [1].
It is important to note that, in most of the cases, the tem-
perature and concentration gradients occur in the energy
and mass fluxes simultaneously. Consequently, the process
of double diffusion becomes more complex in a moving
fluid due to the coupling of heat and mass fluxes and the
driving potentials. Further, the concentration gradients are
also responsible for the generation of thermal flux in the
moving fluid along with temperature gradients. Thus, the
heat flux produced due to the presence of the concentration
gradients is named as Dufour effect or diffusion-thermo
effect. On other hand, mass flux can also be generated by
the temperature gradients along with concentration gradi-
ents in the moving fluid and this effect is usually termed as
thermal-diffusion or Soret effect. These effects have a key
role in double diffusion phenomenon, where density dif-
ference occurs in the flow region. Clearly, Soret or thermal-
diffusion effect is observed due to the presence of tem-
perature gradients. On the other hand, Dufour or diffusion-
thermo effect is produced due to the occurrence of con-
centration gradients in the moving fluid. Soret and Dufour
effects cannot be ignored in case of gas mixture flows with
lower molecular weights (H2, He) and greater molecular
weights (air, N2).
Weaver and Viskanta [23] investigated the inter-diffu-
sion of species and their effects along with thermal-diffu-
sion and diffusion-thermo impacts on free-convection heat
and mass transfer in cavities due to the combined concen-
tration and temperature gradients. From their study it is
observed that the flow is produced due to the temperature
and concentration gradients in the flow regime. Raju and
Sandeep [24] numerically analysed the heat and mass
transfer characteristics of gyrotactic microorganisms sus-
pended in a MHD Casson fluid flow near a vertical rotating
plate or cone kept in porous medium. Sulochana et al [25]
studied the Soret effect along with heat source or sink in
case of three-dimensional Casson fluid flow over a
stretching surface by accounting the heat and mass transfer
characteristics. The influence of Dufour and Soret effects
on electrically conducting time-independent MHD two-di-
mensional flow was studied by Nawaz et al [26]. The
influence of the Soret and Dufour parameters on a channel
flow of couple stress fluid with the chemical reaction and
radiation effects was investigated by Ojjela and Kumar
[27]. Also, Khan et al [28] studied the influence of Soret
and Dufour effects, in case of viscous MHD flow between
non-parallel walls by considering the chemical reaction
process. From their study it is noticed that the temperature
field increases with increasing Dufour number, and con-
centration field is diminished for increasing values of Soret
number. Very recently, Khan et al [29] investigated the
influence of Soret and Dufour effects on squeezing flow of
MHD viscous incompressible nano-fluid between two par-
allel disks. Their study reports that, for the greater values of
Schmidt and Soret numbers, the concentration field
decreases in the flow region.
Having the above literature survey in consideration, it is
important to note that, the present unsteady squeezing flow
problem has large scale biological and engineering interest.
Also, from the available literature it is noticed that, the
squeezing behaviour of Casson fluid with MHD, Joule
heating, thermal radiation and chemical reaction together
with Soret and Dufour effects is paid less attention. With
this research gap, authors have motivated and thus an
attempt is made to investigate the heat and mass transfer
behaviour of Casson fluid squeezing flow between two
parallel plates by accounting the Soret and Dufour effects in
the presence of chemical reaction and thermal radiation.
However, this particular problem is not yet reported in the
literature. The governing squeezing flow equations are
obtained by considering the laws of fluid motion. The
resulting coupled highly nonlinear flow equations are solved
by using standard RK-SM and bvp4c methods. A detailed
comparison between RK-SM and bvp4c technique is pre-
sented. Also, a comprehensive numerical discussion is made
175 Page 2 of 16 Sådhanå (2019) 44:175
to describe the non-Newtonian flow behaviour of Casson
fluid under the influence of various physical parameters.
2. Non-Newtonian Casson fluid model
The following rheological equation [30] is used to construct
the governing equations for squeezing flow of Casson fluid
between two parallel plates:
sij ¼2 lB þ
Pyffiffiffiffiffiffi
2pp
� �
eij; p[ pc
2 lB þPyffiffiffiffiffiffiffi
2pcp
� �
eij; p\pc
8
>
>
<
>
>
:
ð1Þ
In this model, the symbol p ¼ eij:eij denotes the product of
deformation components, eij denotes the i; jð Þth deformation
rate component, pc is the critical value, lB is the dynamic
plastic viscosity and Py is the yield stress.
2.1 Mathematical formulation of the problem
The present unsteady two-dimensional flow model con-
sidered the MHD radiative squeezing flow of viscous
incompressible Casson fluid between two parallel plates
with Soret and Dufour effects under the influence of
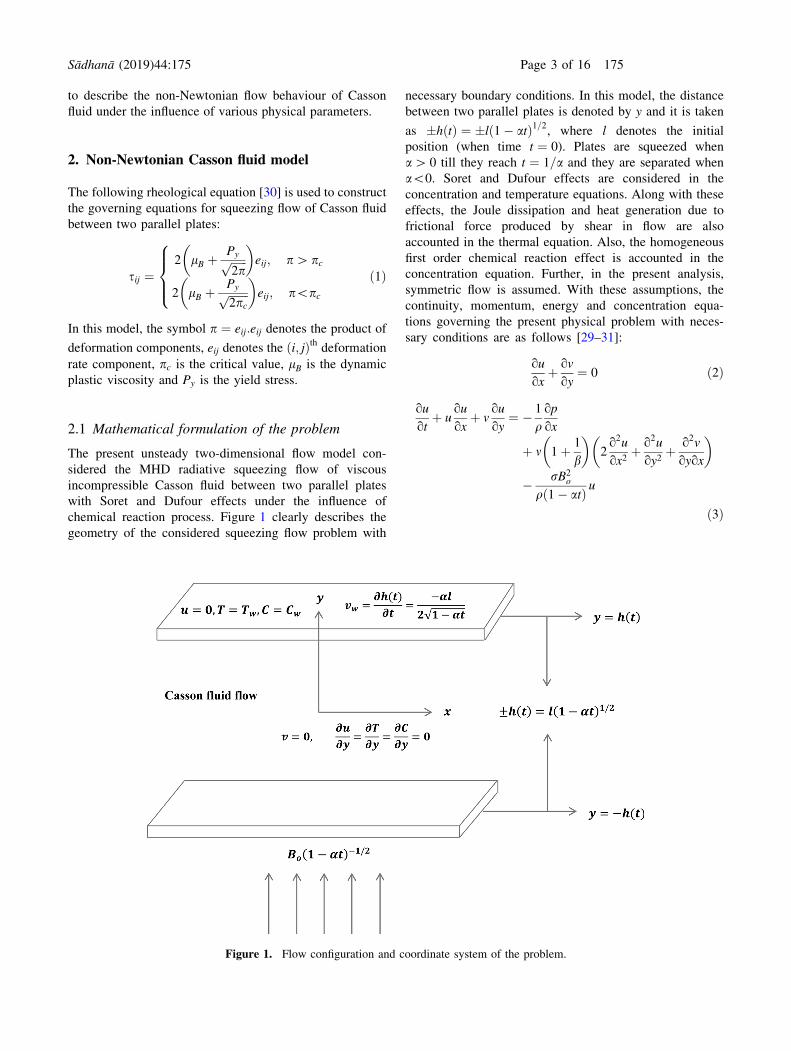
chemical reaction process. Figure 1 clearly describes the
geometry of the considered squeezing flow problem with
necessary boundary conditions. In this model, the distance
between two parallel plates is denoted by y and it is taken
as �h tð Þ ¼ �l 1� atð Þ1=2, where l denotes the initial
position (when time t ¼ 0). Plates are squeezed when
a[ 0 till they reach t ¼ 1=a and they are separated when
a\0. Soret and Dufour effects are considered in the
concentration and temperature equations. Along with these
effects, the Joule dissipation and heat generation due to
frictional force produced by shear in flow are also
accounted in the thermal equation. Also, the homogeneous
first order chemical reaction effect is accounted in the
concentration equation. Further, in the present analysis,
symmetric flow is assumed. With these assumptions, the
continuity, momentum, energy and concentration equa-
tions governing the present physical problem with neces-
sary conditions are as follows [29–31]:
ou
oxþ ov
oy¼ 0 ð2Þ
ou
otþ u
ou
oxþ v
ou
oy¼ � 1
qop
ox
þ m 1þ 1
b
� �
2o2u
ox2þ o2u
oy2þ o2v
oyox
� �
� rB2o
q 1� atð Þ u
ð3Þ
Figure 1. Flow configuration and coordinate system of the problem.
Sådhanå (2019) 44:175 Page 3 of 16 175
ov
otþ u
ov
oxþ v
ov
oy¼ � 1
qop
oy
þ m 1þ 1
b
� �
2o2v
ox2þ o2v
oy2þ o2u
oyox
� �
ð4Þ
oT
otþ u
oT
oxþ v
oT
oy¼ k
qcp
o2T
ox2þ o2T
oy2
� �
þ lqcp
1þ 1
b
� �
2ou
ox
� �2
þ ou
oyþ ov
ox
� �2
þ2ov
oy
� �2 !
þ 16r�T3o
3qcpk�o2T
oy2þ rB2
o
qcp 1� atð Þ u2 þ Q�
qCp
T � T1ð Þ
þ DmkT
cscp
o2C
oy2
:
ð5Þ
oC
otþ u
oC
oxþ v
oC
oy¼ Dm
o2C
ox2þ o2C
oy2
� �
þ DmkT
Tm
o2T
oy2
� k1
1� atð Þ C � C1ð Þ ð6Þ
The relevant boundary conditions for Casson fluid
squeezing flow are given as follows:
u ¼ 0; v ¼ vw ¼ dh
dt; T ¼ Tw; C ¼ Cw; at
y ¼ h tð Þ;ð7aÞ
ou
oy¼ 0; v ¼ 0;
oT
oy¼ 0;
oC
oy¼ 0 at y ¼ 0: ð7bÞ
In Eqs. (2)–(6), u and v are velocity components along x
and y directions, respectively, q is the density, m is the
kinematic viscosity, b denotes the Casson fluid parameter,
r is the electrical conductivity, Bo is the magnetic field, k
denotes the thermal conductivity, a is the characteristic
parameter of squeezing motion, cp is the specific heat
capacity, kT is the thermal diffusion coefficient, Q� denotesthe coefficient of heat source/sink, Tw;Cw are the wall
temperature and concentration, T1;C1 are the temperature
and concentration of freestream, k1 is the coefficient of
chemical reaction and Dm is the coefficient of mass
diffusion.
2.2 Similarity transformation approach
Equations (2)–(6) with conditions (7a) and (7b) are
unsteady, coupled and highly nonlinear in nature. Also,
there are no analytical or direct methods available in lit-
erature to solve these coupled equations. Because of this
reason, a standard numerical method namely, RK-SM is
implemented. For this purpose, we first converted the set of
coupled partial differential equations (PDEs) (2)–(6) to
nonlinear ordinary differential equations (ODEs) using the
following similarity transformations [15, 30, 31]:
u ¼ ax2 1� atð Þ
� �
F0 gð Þ; v ¼ �al
2ffiffiffiffiffiffiffiffiffiffiffiffiffi
1� atp
� �
F gð Þ;
h gð Þ ¼ T � T1Tw � T1
and / gð Þ ¼ C � C1Cw � C1
ð8Þ
where g ¼ y
lffiffiffiffiffiffiffi
1�atp .
Using Eq. (8), the dimensional equations (2)–(6) are
reduced to non-dimensional form as follows:
1þ 1
b
� �
F0000
gð Þ
� S gF000 gð Þ þ 3F00 gð Þ þ F0 gð ÞF00 gð Þ � F gð ÞF000 gð Þð Þ� Ha2F00 gð Þ¼ 0
ð9Þ
1þ 4
3R
� �
h00 gð Þ þ Pr S F gð Þh0 gð Þ � gh0 gð Þ þ Qh gð Þð Þ
þ PrEc 1þ 1
b
� �
F002
gð Þ þ 4d2F02gð Þ
� �
þ Ha2F02gð Þ
� �
þ DuPr/00 gð Þ ¼ 0
ð10Þ
/00 gð Þ þ ScS F gð Þ/0gð Þ � g/0 gð Þ
� �
� ScKr/ gð Þþ SrSch00 gð Þ¼ 0: ð11Þ
Similarly, using Eq. (8), the dimensionless boundary con-
ditions are obtained in the following form as
F gð Þ ¼ 0; F00 gð Þ ¼ 0; h0gð Þ ¼ 0; /0 gð Þ ¼ 0 at
g ¼ 0;
ð12aÞ
F gð Þ ¼ 1; F0 gð Þ ¼ 0; h gð Þ ¼ 1; / gð Þ ¼ 1 at
g ¼ 1:
ð12bÞ
In Eqs. (9)–(12), the superscript symbol prime denotes
differentiation with respect to similarity variable g. Also,the non-dimensional physical parameters in Eqs. (9)–(11)
are defined as follows:
S ¼ al22m (squeezing number), R ¼ 4r�T3
1kk� (radiation param-
eter), Ha ¼ Bolffiffi
rl
q
(Hartmann number), Du ¼ DmkT C�C1ð Þcscpm T�T1ð Þ
(Dufour number), Sr ¼ DmkT T�T1ð ÞTmm C�C1ð Þ (Soret number), Sc ¼ m
Dm
(Schmidt number), Pr ¼ lCp
k(Prandtl number), d ¼ h
x, Kr ¼
k1l2
m (chemical reaction parameter), Q ¼ 2Q� 1�atð ÞaqCp
(heat
source/sink parameter) and Ec ¼ a2x2
4Cp Tw�T1ð Þ 1�atð Þ2 (Eckert
number).
175 Page 4 of 16 Sådhanå (2019) 44:175
The movement of plates is completely described with the
help of squeezing number (S) (i.e., S[ 0 is separation of
plates from one another; S\0 is movement of plates close
to one another, and this type of flow is identified as
squeezing flow). Velocity field is regulated with the help of
Hartmann number. Similarly, to control the temperature
field, Prandtl and Eckert numbers are useful. Additionally,
for Ec ¼ 0 viscous dissipation effects are absent. Further,
Dufour and Soret effects are described in temperature and
concentration equations. In this analysis Kr\0, Kr[ 0 and
Kr ¼ 0 correspond to destructive, constructive and no
chemical reactions, respectively. Also, Schmidt number is
used to control the concentration field in the flow region. In
the present investigation, Runge–Kutta fourth order inte-
gration scheme with shooting technique is used to produce
the approximate numerical similarity solution for all the
non-dimensional parameters. To this end, the following
numerical solution procedure is described.
3. Numerical solution scheme
As mentioned earlier, the set of equations governing the
time-dependent MHD Casson fluid flow between parallel
plates with thermal-diffusion and diffusion-thermo effects
are nonlinear and coupled in nature. Thus, to solve these
coupled flow equations (9)–(11) with conditions (12), a
numerically stable Runge–Kutta fourth order integration
scheme with standard shooting technique [32] is used. This
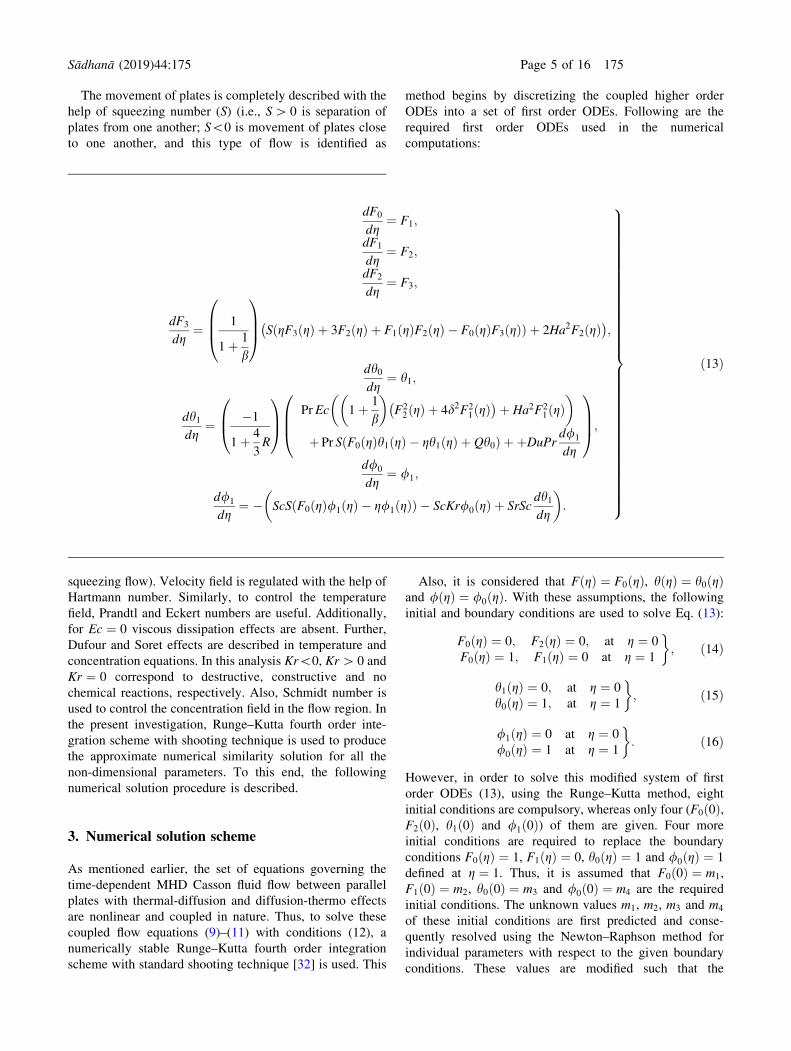
method begins by discretizing the coupled higher order
ODEs into a set of first order ODEs. Following are the
required first order ODEs used in the numerical
computations:
Also, it is considered that F gð Þ ¼ F0 gð Þ, h gð Þ ¼ h0 gð Þand / gð Þ ¼ /0 gð Þ. With these assumptions, the following
initial and boundary conditions are used to solve Eq. (13):
F0 gð Þ ¼ 0; F2 gð Þ ¼ 0; at g ¼ 0
F0 gð Þ ¼ 1; F1 gð Þ ¼ 0 at g ¼ 1
�
; ð14Þ
h1 gð Þ ¼ 0; at g ¼ 0
h0 gð Þ ¼ 1; at g ¼ 1
�
; ð15Þ
/1 gð Þ ¼ 0 at g ¼ 0
/0 gð Þ ¼ 1 at g ¼ 1
�
: ð16Þ
However, in order to solve this modified system of first
order ODEs (13), using the Runge–Kutta method, eight
initial conditions are compulsory, whereas only four (F0 0ð Þ,F2 0ð Þ, h1 0ð Þ and /1 0ð Þ) of them are given. Four more
initial conditions are required to replace the boundary
conditions F0 gð Þ ¼ 1, F1 gð Þ ¼ 0, h0 gð Þ ¼ 1 and /0 gð Þ ¼ 1
defined at g ¼ 1. Thus, it is assumed that F0 0ð Þ ¼ m1,
F1 0ð Þ ¼ m2, h0 0ð Þ ¼ m3 and /0 0ð Þ ¼ m4 are the required
initial conditions. The unknown values m1, m2, m3 and m4
of these initial conditions are first predicted and conse-
quently resolved using the Newton–Raphson method for
individual parameters with respect to the given boundary
conditions. These values are modified such that the
dF0
dg¼ F1;
dF1
dg¼ F2;
dF2
dg¼ F3;
dF3
dg¼ 1
1þ 1
b
0
B
B
@
1
C
C
A
S gF3 gð Þ þ 3F2 gð Þ þ F1 gð ÞF2 gð Þ � F0 gð ÞF3 gð Þð Þ þ 2Ha2F2 gð Þ�
;
dh0dg
¼ h1;
dh1dg
¼ �1
1þ 4
3R
0
B
@
1
C
A
PrEc 1þ 1
b
� �
F22 gð Þ þ 4d2F2
1 gð Þ�
þ Ha2F21 gð Þ
� �
þ Pr S F0 gð Þh1 gð Þ � gh1 gð Þ þ Qh0ð Þ þ þDuPrd/1
dg
0
B
B
@
1
C
C
A
;
d/0
dg¼ /1;
d/1
dg¼ � ScS F0 gð Þ/1 gð Þ � g/1 gð Þð Þ � ScKr/0 gð Þ þ SrSc
dh1dg
� �
:
9
>
>
>
>
>
>
>
>
>
>
>
>
>
>
>
>
>
>
>
>
>
>
>
>
>
>
>
>
>
>
>
>
>
>
=
>
>
>
>
>
>
>
>
>
>
>
>
>
>
>
>
>
>
>
>
>
>
>
>
>
>
>
>
>
>
>
>
>
>
;
ð13Þ
Sådhanå (2019) 44:175 Page 5 of 16 175

boundary conditions are satisfied for g ¼ 1. The resulting
initial value problem is attempted numerically using fourth
order Runge–Kutta integration scheme. The convergence
criterion and step size are taken, respectively, to be 10�5
and 0.01 for all numerical solutions. However, once the
convergence criterion is approached, the system of ODEs
are assimilated using the Runge–Kutta method to obtain the
required results in terms flow profiles. More details about
the Runge–Kutta method can be found in the available
literature [33].
4. Results and discussion
4.1 Verification of present numerical results
The accuracy of Runge–Kutta scheme with shooting
method (RK-SM) and obtained similarity solutions are
verified by comparing them with the semi-analytical
results of Mustafa et al [15]. This comparison is shown in
table 1. Further, from table 1 it is noted that, the absolute
value of wall shear stress is magnified for enhancing
values of squeezing number whereas Sherwood and Nus-
selt numbers decrease. Also, it is clear that, the negative
values of Nusselt number indicate flow of heat from plates
to the ambient fluid. Further, the accuracy and correctness
of RK-SM are illustrated with the help of table 2. From
table 2 it is noticed that, the numerical results obtained
based on RK-SM show the excellent agreement with the
results obtained based on bvp4c method. Further, this
comparison clearly demonstrates the consistency of RK-
SM in obtaining the solution of highly nonlinear prob-
lems. The detailed literature on stability and convergence
of Runge–Kutta method can found in the available liter-
ature [34–38].
4.2 Influence of control parameters on flow
behaviour
The physical insight of the present unsteady squeezing
problem is well described by analysing the effects of var-
ious control parameters on flow, heat and mass transfer
behaviour. The physics behind this particular problem is
illustrated in terms of flow profiles for the different values
of control parameters such as S, R, b, Pr, Ha, Kr, Du, Q,Ec, Sr and Sc. Also, for the better understanding of simi-
larity results, computer-generated numerical data is
expressed in terms of tables and graphs.
(i) Effect of squeezing number (S) on flow profiles
The thermodynamic variations noticed in flow profiles
under the influence of squeezing number Sð Þ are depicted infigures 2, 3, 4 and 5. In the present study, S[ 0 corre-
sponds to the moment when the plates are away from one
Table 1. Comparison of momentum, heat and mass transport coefficients, between present results (RK-SM) and analytical (HAM)
results obtained by Mustafa et al [15] for different values of S when Ha ! 0, R ! 0, Q ! 0, Du ! 0, Sr ! 0, b ! 1 and g ¼ 1.
Squeezing number S
Mustafa et al [15] Present results
�F001ð Þ �h
01ð Þ �/
01ð Þ �F
001ð Þ �h
01ð Þ �/
01ð Þ
-1.0 2.170090 3.319899 0.8045587 2.170090 3.319899 0.8045587
-0.5 2.614038 3.129491 0.7814023 2.614038 3.129491 0.7814023
0.01 3.007134 3.047092 0.7612252 3.007134 3.047092 0.7612252
0.5 3.336449 3.026324 0.7442243 3.336449 3.026324 0.7442243
2.0 4.167389 3.118551 0.7018132 4.167389 3.118551 0.7018132
Table 2. Convergence test results obtained based on RK-SM and bvp4c techniques for S ¼ Ha ¼ d ¼ Kr ¼ 0:5;Pr ¼ Sc ¼ 1:5;Du ¼Sr ¼ 0; b ¼ R ¼ Q ¼ Ec ¼ 0:3 and g ¼ 1.
F gð Þ h gð Þ / gð Þ
g RK-SM bvp4c RK-SM bvp4c RK-SM bvp4c
0.0 0.000000 0.000000 3.40651 3.40650 0.722235 0.722235
0.1 0.148340 0.148340 3.38743 3.38742 0.724944 0.724944
0.2 0.293821 0.293821 3.32979 3.32978 0.733070 0.733070
0.3 0.433566 0.433566 3.23236 3.23236 0.746619 0.746619
0.4 0.564672 0.564672 3.09287 3.09286 0.765606 0.765606
0.5 0.684191 0.684191 2.90768 2.90767 0.790070 0.790070
0.6 0.789116 0.789116 2.67132 2.67131 0.820089 0.820089
0.7 0.876369 0.876369 2.37586 2.37586 0.855800 0.855800
0.8 0.942791 0.942791 2.01011 2.01011 0.897429 0.897429
0.9 0.985122 0.985122 1.55855 1.55855 0.945323 0.945323
1.0 1.000000 1.000000 1.00000 1.00000 1.000000 1.000000
175 Page 6 of 16 Sådhanå (2019) 44:175
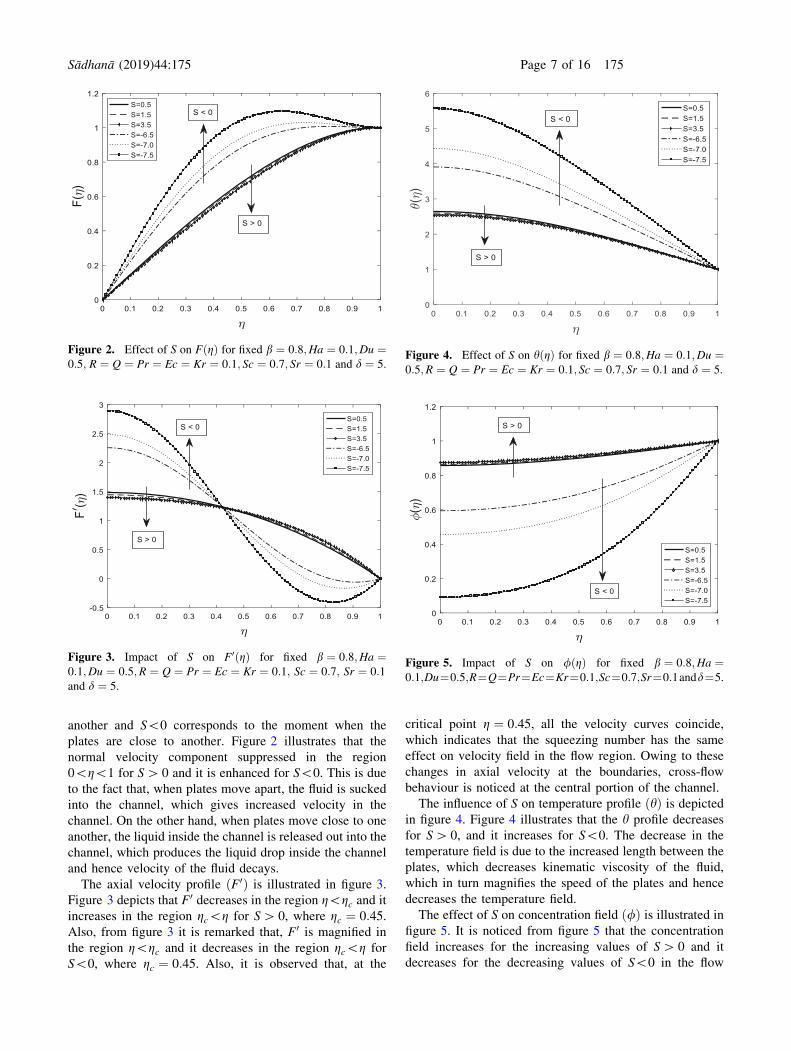
another and S\0 corresponds to the moment when the
plates are close to another. Figure 2 illustrates that the
normal velocity component suppressed in the region
0\g\1 for S[ 0 and it is enhanced for S\0. This is due
to the fact that, when plates move apart, the fluid is sucked
into the channel, which gives increased velocity in the
channel. On the other hand, when plates move close to one
another, the liquid inside the channel is released out into the
channel, which produces the liquid drop inside the channel
and hence velocity of the fluid decays.
The axial velocity profile F0ð Þ is illustrated in figure 3.
Figure 3 depicts that F0 decreases in the region g\gc and it
increases in the region gc\g for S[ 0, where gc ¼ 0:45.Also, from figure 3 it is remarked that, F0 is magnified in
the region g\gc and it decreases in the region gc\g for
S\0, where gc ¼ 0:45. Also, it is observed that, at the
critical point g ¼ 0:45, all the velocity curves coincide,
which indicates that the squeezing number has the same
effect on velocity field in the flow region. Owing to these
changes in axial velocity at the boundaries, cross-flow
behaviour is noticed at the central portion of the channel.
The influence of S on temperature profile hð Þ is depictedin figure 4. Figure 4 illustrates that the h profile decreases
for S[ 0, and it increases for S\0. The decrease in the
temperature field is due to the increased length between the
plates, which decreases kinematic viscosity of the fluid,
which in turn magnifies the speed of the plates and hence
decreases the temperature field.
The effect of S on concentration field /ð Þ is illustrated in
figure 5. It is noticed from figure 5 that the concentration
field increases for the increasing values of S[ 0 and it
decreases for the decreasing values of S\0 in the flow
Figure 3. Impact of S on F0 gð Þ for fixed b ¼ 0:8;Ha ¼0:1;Du ¼ 0:5;R ¼ Q ¼ Pr ¼ Ec ¼ Kr ¼ 0:1; Sc ¼ 0:7; Sr ¼ 0:1and d ¼ 5.
Figure 4. Effect of S on h gð Þ for fixed b ¼ 0:8;Ha ¼ 0:1;Du ¼0:5;R ¼ Q ¼ Pr ¼ Ec ¼ Kr ¼ 0:1; Sc ¼ 0:7; Sr ¼ 0:1 and d ¼ 5.
Figure 5. Impact of S on / gð Þ for fixed b ¼ 0:8;Ha ¼0:1;Du¼0:5;R¼Q¼Pr¼Ec¼Kr¼0:1;Sc¼0:7;Sr¼0:1andd¼5.
Figure 2. Effect of S on F gð Þ for fixed b ¼ 0:8;Ha ¼ 0:1;Du ¼0:5; R ¼ Q ¼ Pr ¼ Ec ¼ Kr ¼ 0:1; Sc ¼ 0:7; Sr ¼ 0:1 and d ¼ 5.
Sådhanå (2019) 44:175 Page 7 of 16 175

region. In the neighbourhood of upper plate i:e:; g � 1ð Þ, allthe / curves are merged, which shows that S has no sig-
nificant effect on / profile near the upper plate when
compared with the region close to the lower plate.
(ii) Influence of Casson fluid parameter (b) on flow
profiles
Figures 6, 7, 8 and 9 illustrate the effect of Casson fluid
parameter (b) on flow field variables. From figure 6 it is
noticed that, as b increases, the normal velocity field
increases. This is because under the effect of applied
stresses the small increment in b decreases fluid viscosity
and hence this decreased viscosity offers less resistance to
the flow of fluid in the channel. Further, it is observed that,
in the vicinity of lower and upper plates, b has less effect
when compared with other regions of the channel. Figure 7
illustrates the effect of b on axial velocity profile. It is
noticed from this figure that F0 increases in the region
g\gc and it decreases in the remaining portion gc\g for
the magnifying b values, where gc ¼ 0:45. Due to these
variations in axial velocity at the boundaries, very inter-
esting cross-flow behaviour is noticed at the central portion
of the channel.
Similarly, the effect of b on h profile is described throughfigure 8. It is noticed from this figure that temperature field
decreases as b increases. However, the effect of b on /profile is depicted in figure 9. Also, figure 9 shows that, as
b increases, the concentration field increases. Clearly,
concentration field is an increasing function of b.(iii) Impact of Ha on flow behaviour
The impact of Ha on flow profiles is depicted in fig-
ures 10, 11, 12 and 13. Figure 10 illustrates the effect of Ha
on normal velocity field (F) in the flow region. It is noticed
Figure 6. Influence of b on F gð Þ for fixed S ¼ �4;Ha ¼ Du ¼0:1;Sr ¼ 0:5;R ¼ Q ¼ Kr ¼ Ec ¼ 0:1;Pr ¼ Sc ¼ 0:7 and d ¼ 1:2.
Figure 7. Impact of b on F0 gð Þ for fixed S ¼ �4;Ha ¼ Du ¼0:1; Sr ¼ 0:5;R ¼ Q ¼ Kr ¼ Ec ¼ 0:1;Pr ¼ Sc ¼ 0:7 and d ¼1:2.
Figure 8. Effect of b on h gð Þ for fixed S ¼ �4;Ha ¼ Du ¼ 0:1;Sr ¼ 0:5;R ¼ Q ¼ Kr ¼ Ec ¼ 0:1;Pr ¼ Sc ¼ 0:7 and d ¼ 1:2.
Figure 9. Impact of b on / gð Þ for fixed S ¼ �4;Ha ¼ Du ¼0:1; Sr ¼ 0:5;R ¼ Q ¼ Kr ¼ Ec ¼ 0:1;Pr ¼ Sc ¼ 0:7 and d ¼1:2.
175 Page 8 of 16 Sådhanå (2019) 44:175
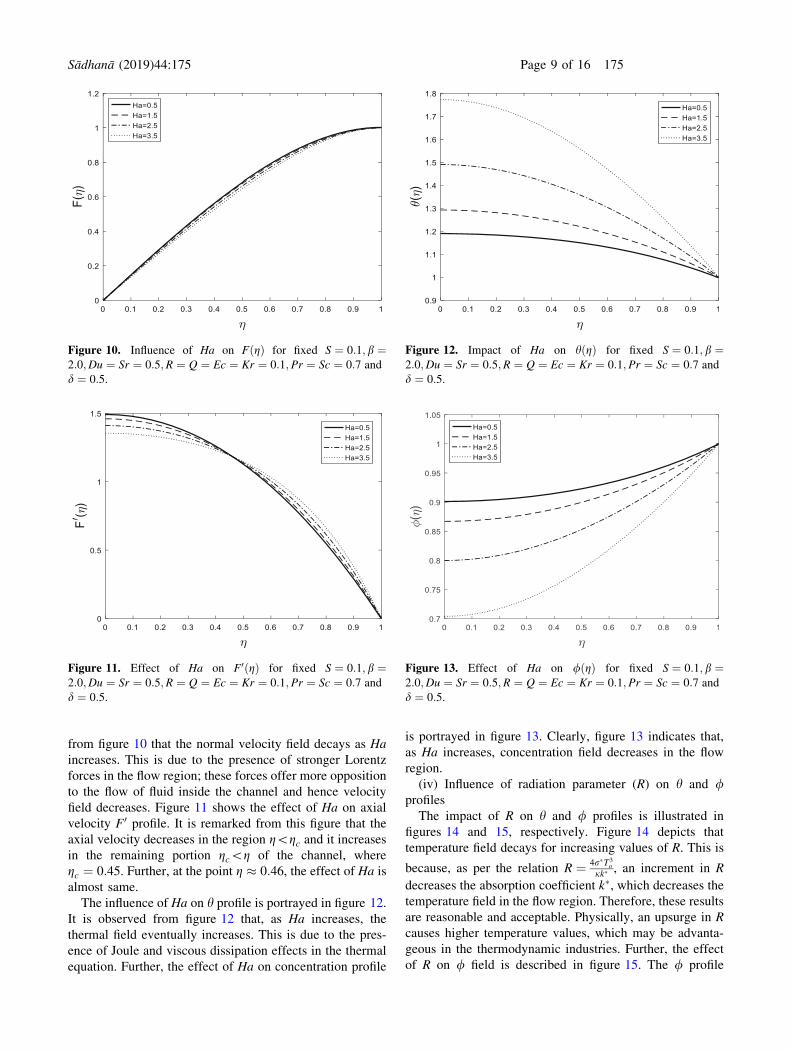
from figure 10 that the normal velocity field decays as Ha
increases. This is due to the presence of stronger Lorentz
forces in the flow region; these forces offer more opposition
to the flow of fluid inside the channel and hence velocity
field decreases. Figure 11 shows the effect of Ha on axial
velocity F0 profile. It is remarked from this figure that the
axial velocity decreases in the region g\gc and it increases
in the remaining portion gc\g of the channel, where
gc ¼ 0:45. Further, at the point g � 0:46, the effect of Ha is
almost same.
The influence of Ha on h profile is portrayed in figure 12.
It is observed from figure 12 that, as Ha increases, the
thermal field eventually increases. This is due to the pres-
ence of Joule and viscous dissipation effects in the thermal
equation. Further, the effect of Ha on concentration profile
is portrayed in figure 13. Clearly, figure 13 indicates that,
as Ha increases, concentration field decreases in the flow
region.
(iv) Influence of radiation parameter (R) on h and /profiles
The impact of R on h and / profiles is illustrated in
figures 14 and 15, respectively. Figure 14 depicts that
temperature field decays for increasing values of R. This is
because, as per the relation R ¼ 4r�T3o
jk� , an increment in R
decreases the absorption coefficient k�, which decreases the
temperature field in the flow region. Therefore, these results
are reasonable and acceptable. Physically, an upsurge in R
causes higher temperature values, which may be advanta-
geous in the thermodynamic industries. Further, the effect
of R on / field is described in figure 15. The / profile
Figure 10. Influence of Ha on F gð Þ for fixed S ¼ 0:1; b ¼2:0;Du ¼ Sr ¼ 0:5;R ¼ Q ¼ Ec ¼ Kr ¼ 0:1;Pr ¼ Sc ¼ 0:7 and
d ¼ 0:5.
Figure 12. Impact of Ha on h gð Þ for fixed S ¼ 0:1; b ¼2:0;Du ¼ Sr ¼ 0:5;R ¼ Q ¼ Ec ¼ Kr ¼ 0:1;Pr ¼ Sc ¼ 0:7 and
d ¼ 0:5.
Figure 13. Effect of Ha on / gð Þ for fixed S ¼ 0:1; b ¼2:0;Du ¼ Sr ¼ 0:5;R ¼ Q ¼ Ec ¼ Kr ¼ 0:1;Pr ¼ Sc ¼ 0:7 and
d ¼ 0:5.
Figure 11. Effect of Ha on F0 gð Þ for fixed S ¼ 0:1; b ¼2:0;Du ¼ Sr ¼ 0:5;R ¼ Q ¼ Ec ¼ Kr ¼ 0:1;Pr ¼ Sc ¼ 0:7 and
d ¼ 0:5.
Sådhanå (2019) 44:175 Page 9 of 16 175

shows the increasing trend for increasing values of thermal
radiation parameter, which is shown in figure 15.
(v) Impact of Q on temperature and concentration
profiles
Figures 16 and 17 depict the effect of heat generation or
absorption parameter (Q) on h and / fields, respectively.
Figure 16 demonstrates that, as Q increases the thermal
field increases and for Q\0, temperature profile decreases.
This is because temperature of the working fluid increases
during the heat generation process. Due to this reason, the
thermal field is magnified in the flow region. Also,
exothermic chemical reaction may increase temperature
field. Additionally, figure 17 describes the effect of Q on
concentration profile. From this figure, it is noticed that, as
Q increases negatively, the concentration field increases in
the flow region and the concentration field decreases for the
positively increasing values of Q[ 0.
(vi) Influence of Ec on h and / profiles
The effect of Ec on h and / profiles is illustrated,
respectively, in figures 18 and 19. Figures 18 and 19
demonstrate that, as Ec increases, the temperature profile
increases and concentration profile decreases. This is due to
the fact that the presence of frictional forces in the fluid
causes release of heat energy into the fluid, which magnifies
the temperature field in the flow region. Additionally,
presence of viscous dissipation also increases the temper-
ature field [13]. It is noticed that Ec explicitly occurs in the
temperature equation, and hence temperature field can be
easily regulated by controllingEc. Further, the concentra-
tion profile decreases for increasing values of Ec.
Figure 14. Influence of R on h gð Þ for fixed S ¼ 0:4; b ¼0:2;Du ¼ Sr ¼ 0:5;Ha ¼ Q ¼ Kr ¼ 0:1;Ec ¼ 1:0;Pr ¼ Sc ¼ 0:7and d ¼ 0:1.
Figure 15. Impact of R on / gð Þ for fixed S ¼ 0:4; b ¼ 0:2; Du ¼Sr ¼ 0:5;Ha ¼ Q ¼ Kr ¼ 0:1;Ec ¼ 1:0;Pr ¼ Sc ¼ 0:7 and d ¼0:1.
Figure 16. Effect of Q on h gð Þ for fixed S ¼ 0:4; b ¼ 0:2; Du ¼Sr ¼ 0:5;Ha ¼ R ¼ Kr ¼ 0:1;Ec ¼ 1:0;Pr ¼ Sc ¼ 0:7 and d ¼0:1.
Figure 17. Impact of Q on / gð Þ for fixed S ¼ 0:4; b ¼ 0:2;Du ¼Sr ¼ 0:5;Ha ¼ R ¼ Kr ¼ 0:1;Ec ¼ 1:0;Pr ¼ Sc ¼ 0:7 and d ¼0:1.
175 Page 10 of 16 Sådhanå (2019) 44:175
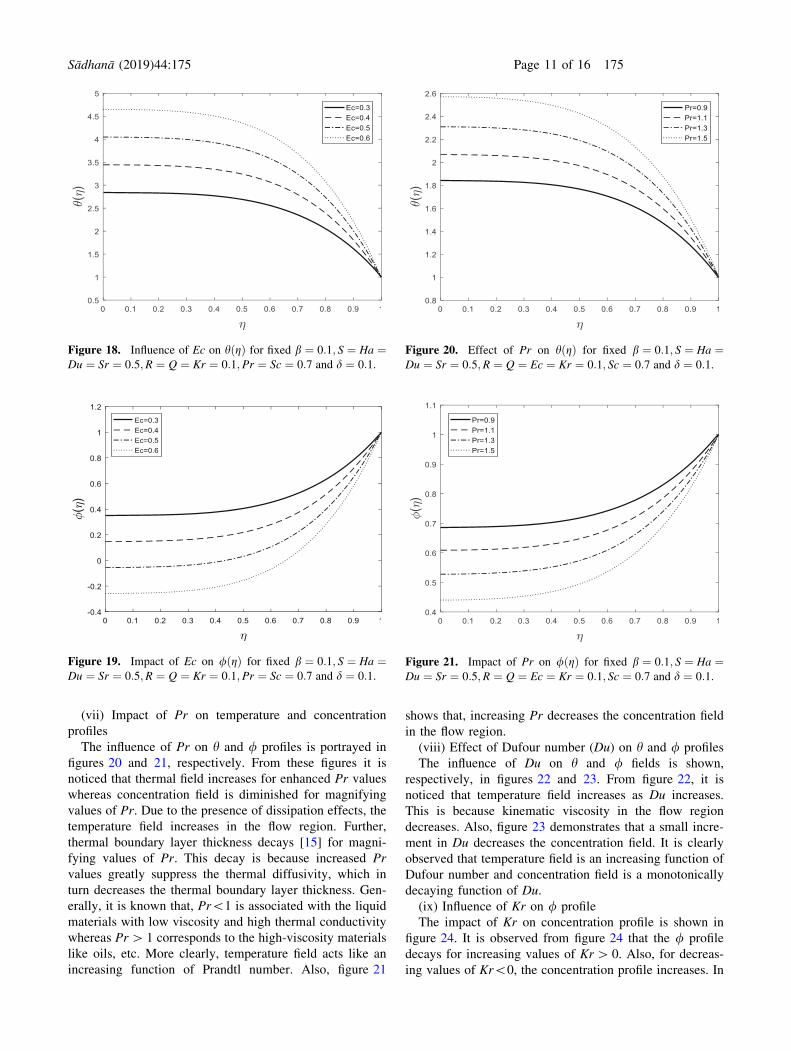
(vii) Impact of Pr on temperature and concentration
profiles
The influence of Pr on h and / profiles is portrayed in
figures 20 and 21, respectively. From these figures it is
noticed that thermal field increases for enhanced Pr values
whereas concentration field is diminished for magnifying
values of Pr. Due to the presence of dissipation effects, the
temperature field increases in the flow region. Further,
thermal boundary layer thickness decays [15] for magni-
fying values of Pr. This decay is because increased Pr
values greatly suppress the thermal diffusivity, which in
turn decreases the thermal boundary layer thickness. Gen-
erally, it is known that, Pr\1 is associated with the liquid
materials with low viscosity and high thermal conductivity
whereas Pr[ 1 corresponds to the high-viscosity materials
like oils, etc. More clearly, temperature field acts like an
increasing function of Prandtl number. Also, figure 21
shows that, increasing Pr decreases the concentration field
in the flow region.
(viii) Effect of Dufour number (Du) on h and / profiles
The influence of Du on h and / fields is shown,
respectively, in figures 22 and 23. From figure 22, it is
noticed that temperature field increases as Du increases.
This is because kinematic viscosity in the flow region
decreases. Also, figure 23 demonstrates that a small incre-
ment in Du decreases the concentration field. It is clearly
observed that temperature field is an increasing function of
Dufour number and concentration field is a monotonically
decaying function of Du.
(ix) Influence of Kr on / profile
The impact of Kr on concentration profile is shown in
figure 24. It is observed from figure 24 that the / profile
decays for increasing values of Kr[ 0. Also, for decreas-
ing values of Kr\0, the concentration profile increases. In
Figure 18. Influence of Ec on h gð Þ for fixed b ¼ 0:1; S ¼ Ha ¼Du ¼ Sr ¼ 0:5;R ¼ Q ¼ Kr ¼ 0:1;Pr ¼ Sc ¼ 0:7 and d ¼ 0:1.
Figure 19. Impact of Ec on / gð Þ for fixed b ¼ 0:1; S ¼ Ha ¼Du ¼ Sr ¼ 0:5;R ¼ Q ¼ Kr ¼ 0:1;Pr ¼ Sc ¼ 0:7 and d ¼ 0:1.
Figure 20. Effect of Pr on h gð Þ for fixed b ¼ 0:1; S ¼ Ha ¼Du ¼ Sr ¼ 0:5;R ¼ Q ¼ Ec ¼ Kr ¼ 0:1; Sc ¼ 0:7 and d ¼ 0:1.
Figure 21. Impact of Pr on / gð Þ for fixed b ¼ 0:1; S ¼ Ha ¼Du ¼ Sr ¼ 0:5;R ¼ Q ¼ Ec ¼ Kr ¼ 0:1; Sc ¼ 0:7 and d ¼ 0:1.
Sådhanå (2019) 44:175 Page 11 of 16 175

many cases, decreased concentration field is observed for
destructive chemical reactions [15]. Thus, figure 24 gen-
eralizes the results obtained in [15]. Figure 24 clearly
illustrates that for Kr[ 0, concentration field decreases.
This is due to the increased distance between the parallel
plates. Further, increased concentration field is observed for
Kr\0 since the distance between plates decreases and
causes an increase in the concentration field in the flow
region.
(x) Effect Sc on / profile
The impact of Sc on / field is depicted in figure 25.
Figure 25 shows that, as Sc increases, the concentration
profile decays. This is mainly due to the fact that an
increment in Sc leads to decrease in the molecular diffusion
coefficient, which in turn reduces the concentration field in
the flow region. Further, it is noticed that, the species con-
centration is high at the wall of the plates and it is less far
away from parallel plates. Further, it is worth noting that the
/ field is a monotonically diminishing function of Sc.
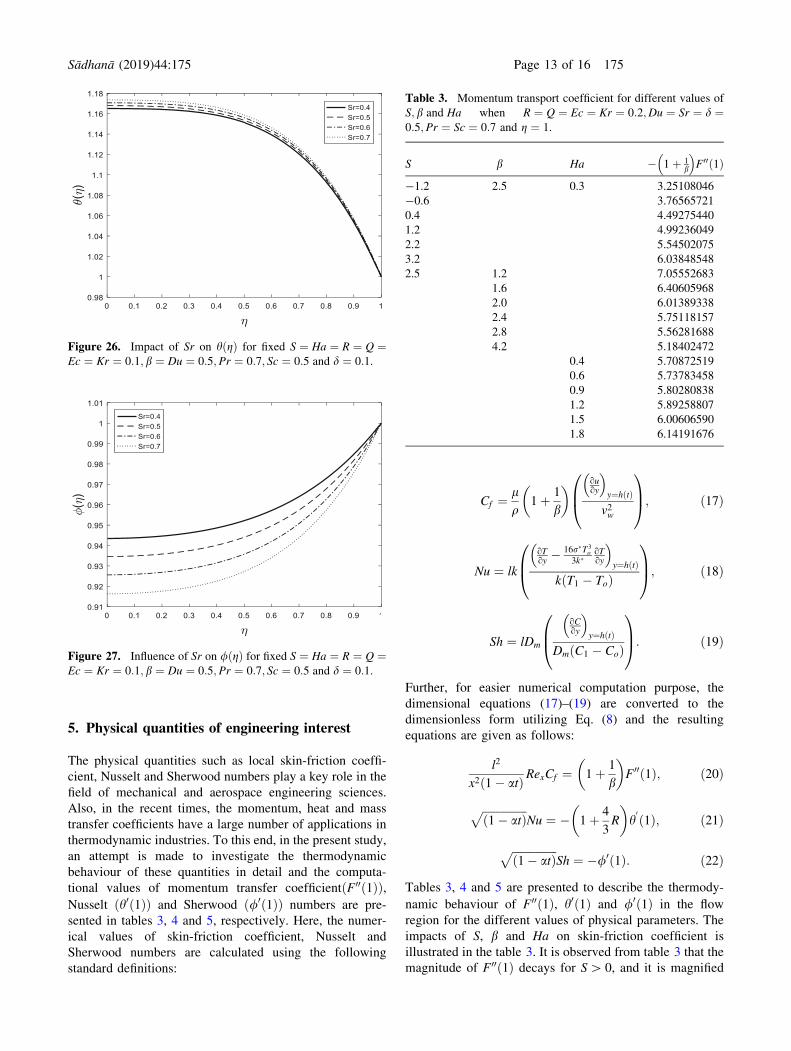
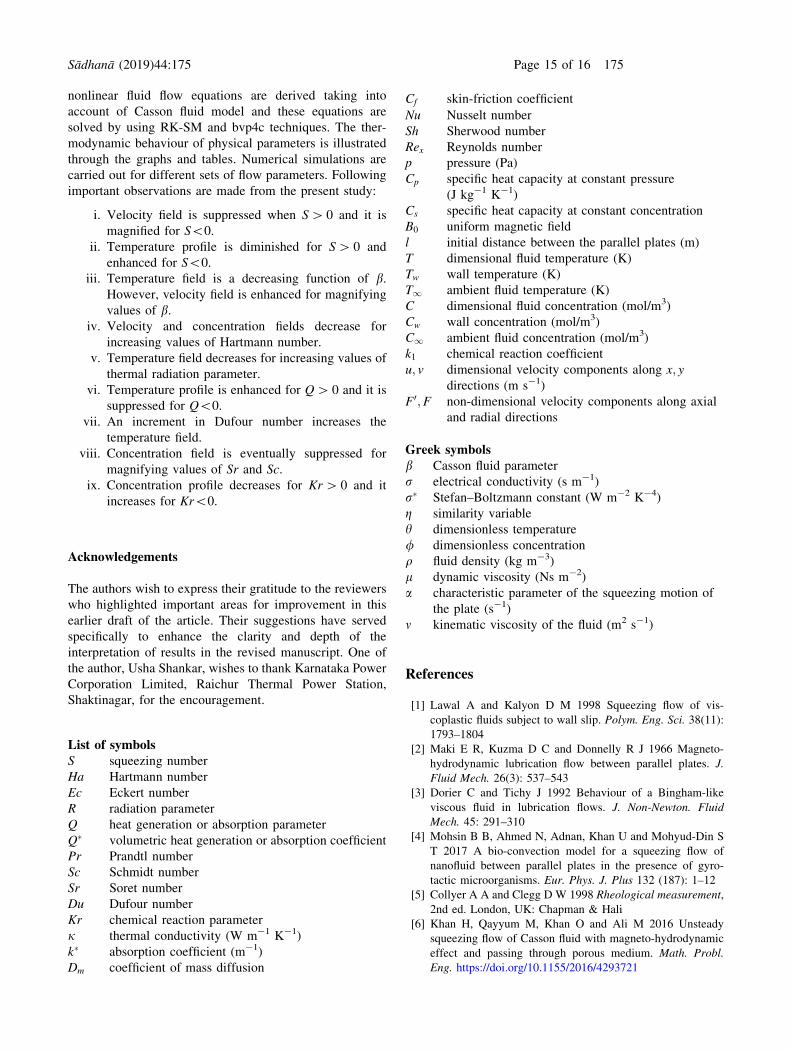
(xi) Effect of Soret number (Sr) on concentration profile
The thermodynamic variations noticed in temperature
and concentration profiles with respect to Soret number (Sr)
are portrayed in figures 26 and 27, respectively. It is
noticed from figure 26 that the thermal field increases with
increase in Sr. Further, figure 27 shows that, as Sr increa-
ses, the concentration field decreases in the flow region.
This is owing to the fact that an upsurge in Sr decreases
kinematic viscosity of the fluid, which in turn decreases
concentration. Also, concentration field behaves like a
monotonically decreasing function of Sr.
Figure 22. Influence of Du on h gð Þ for fixed S ¼ 0:4; b ¼0:2; Sr ¼ 0:5;Ha ¼ R ¼ Ec ¼ 0:1;Q ¼ 0:5;Kr ¼ 1:6;Pr ¼ 1:2;Sc ¼ 0:7 and d ¼ 0:01.
Figure 23. Effect of Du on / gð Þ for fixed S ¼ 0:4; b ¼ 0:2; Sr ¼0:5;Ha ¼ R ¼ Ec ¼ 0:1;Q ¼ 0:5;Kr ¼ 1:6;Pr ¼ 1:2; Sc ¼ 0:7and d ¼ 0:01.
Figure 24. Impact of Kr on / gð Þ for fixed S ¼ Ha ¼ R ¼ Q ¼Ec ¼ 0:1; b ¼ Du ¼ Sr ¼ 0:5;Pr ¼ Sc ¼ 0:7 and d ¼ 0:1.
Figure 25. Effect of Sc on / gð Þ for fixed S ¼ Ha ¼ R ¼ Q ¼Ec ¼ Kr ¼ 0:1; b ¼ Du ¼ Sr ¼ 0:5;Pr ¼ 0:7 and d ¼ 0:1.
175 Page 12 of 16 Sådhanå (2019) 44:175
5. Physical quantities of engineering interest
The physical quantities such as local skin-friction coeffi-
cient, Nusselt and Sherwood numbers play a key role in the
field of mechanical and aerospace engineering sciences.
Also, in the recent times, the momentum, heat and mass
transfer coefficients have a large number of applications in
thermodynamic industries. To this end, in the present study,
an attempt is made to investigate the thermodynamic
behaviour of these quantities in detail and the computa-
tional values of momentum transfer coefficient F00 1ð Þð Þ,Nusselt h0 1ð Þð Þ and Sherwood /0 1ð Þð Þ numbers are pre-
sented in tables 3, 4 and 5, respectively. Here, the numer-
ical values of skin-friction coefficient, Nusselt and
Sherwood numbers are calculated using the following
standard definitions:
Cf ¼lq
1þ 1
b
� �
ouoy
� �
y¼h tð Þv2w
0
B
@
1
C
A
; ð17Þ
Nu ¼ lk
oToy� 16r�T3
o
3k�oToy
� �
y¼h tð Þk T1 � Toð Þ
0
B
@
1
C
A
; ð18Þ
Sh ¼ lDm
oCoy
� �
y¼h tð ÞDm C1 � Coð Þ
0
B
@
1
C
A
: ð19Þ
Further, for easier numerical computation purpose, the
dimensional equations (17)–(19) are converted to the
dimensionless form utilizing Eq. (8) and the resulting
equations are given as follows:
l2
x2 1� atð ÞRexCf ¼ 1þ 1
b
� �
F00 1ð Þ; ð20Þ
ffiffiffiffiffiffiffiffiffiffiffiffiffiffiffiffi
1� atð Þp
Nu ¼ � 1þ 4
3R
� �
h01ð Þ; ð21Þ
ffiffiffiffiffiffiffiffiffiffiffiffiffiffiffiffi
1� atð Þp
Sh ¼ �/0 1ð Þ: ð22Þ
Tables 3, 4 and 5 are presented to describe the thermody-
namic behaviour of F00 1ð Þ, h0 1ð Þ and /0 1ð Þ in the flow
region for the different values of physical parameters. The
impacts of S, b and Ha on skin-friction coefficient is
illustrated in the table 3. It is observed from table 3 that the
magnitude of F00 1ð Þ decays for S[ 0, and it is magnified
Figure 27. Influence of Sr on / gð Þ for fixed S ¼ Ha ¼ R ¼ Q ¼Ec ¼ Kr ¼ 0:1; b ¼ Du ¼ 0:5;Pr ¼ 0:7; Sc ¼ 0:5 and d ¼ 0:1.
Figure 26. Impact of Sr on h gð Þ for fixed S ¼ Ha ¼ R ¼ Q ¼Ec ¼ Kr ¼ 0:1; b ¼ Du ¼ 0:5;Pr ¼ 0:7; Sc ¼ 0:5 and d ¼ 0:1.
Table 3. Momentum transport coefficient for different values of
S; b and Ha when R ¼ Q ¼ Ec ¼ Kr ¼ 0:2;Du ¼ Sr ¼ d ¼0:5;Pr ¼ Sc ¼ 0:7 and g ¼ 1.
S b Ha � 1þ 1b
� �
F00 1ð Þ
-1.2 2.5 0.3 3.25108046
-0.6 3.76565721
0.4 4.49275440
1.2 4.99236049
2.2 5.54502075
3.2 6.03848548
2.5 1.2 7.05552683
1.6 6.40605968
2.0 6.01389338
2.4 5.75118157
2.8 5.56281688
4.2 5.18402472
0.4 5.70872519
0.6 5.73783458
0.9 5.80280838
1.2 5.89258807
1.5 6.00606590
1.8 6.14191676
Sådhanå (2019) 44:175 Page 13 of 16 175

for S\0. Also, it is remarked that, the magnifying values of
b decrease the magnitude of wall shear stress. Further,
magnitude of skin-friction coefficient increases for
increasing Ha values.
Table 4 illustrates the behaviour of heat transfer rate
(h0 1ð Þ) under the influence of different flow parameters
such as squeezing and Dufour numbers, radiation and heat
generation or absorption parameters. It is noticed from
table 4 that the magnitude of h0 1ð Þ upsurges for increasingvalues of S. Also, magnitude of heat transfer rate decreases
for magnifying values of thermal radiation parameter in the
flow region. Also, the magnitude of h0 1ð Þ increases for
increasing values of Q and Du.
Further, table 5 illustrates the behaviour of mass transfer
rate (/0 1ð Þ) under the influence of squeezing parameter,
Soret number and Kr. It is clearly remarked that the mag-
nitude of /0 1ð Þ increases for increasing values of squeezing
number. Also, it is observed that, the magnitude of /0 1ð Þincreases for increasing values of Soret number in the flow
region. Further, mass transfer rate is suppressed for
increasing values of Kr (i:e:;Kr[ 0) and this is owing to
the constructive behaviour of the considered chemical
reaction. However, /0 1ð Þ increases for decreasing values of
Kr (i:e:;Kr\0) and this is mainly owing to the destructive
nature of the chemical reaction.
6. Conclusions
The present numerical study investigates the heat and mass
characteristics of time-dependent two-dimensional MHD
squeezing flow of Casson fluid between two parallel plates
under the influence of Soret and Dufour effects with radi-
ation and Joule dissipation impacts in the presence of
homogeneous first order chemical reaction. Due to the
movement of the parallel plates, flow occurs. The coupled
Table 4. Heat transport coefficient for different values of S;R;Q and Du when Ha ¼ 1:5; b ¼ Sr ¼ 0:5; Pr ¼ Sc ¼ 0:7;Ec ¼ 0:2;Kr ¼ 0:2; d ¼ 0:1and g ¼ 1.
S R Q Du � 1þ 43R
�
h01ð Þ
-1.2 0.3 0.3 0.2 1.45365837
-0.6 1.59093138
0.4 1.83282374
1.2 2.03783860
2.2 2.30876671
3.2 2.59701281
2.5 0.1 2.44016100
0.2 2.41406132
0.4 2.37652594
0.5 2.36257946
0.6 2.35083318
0.1 1.89029498
0.2 2.13013386
0.4 2.68415754
0.5 3.00782432
0.6 3.37108903
0.1 2.34427662
0.3 2.44410771
0.4 2.49662277
0.5 2.55099229
0.6 2.60731545
Table 5. Mass transport coefficient for different values of
S; Sr and Kr when Pr ¼ Sc ¼ 0:7; b ¼ Ha ¼ Du ¼ d ¼ 0:5;R ¼Q ¼ Ec ¼ 0:2 and g ¼ 1.
S Sr Kr �/01ð Þ
-1.2 0.2 0.1 0.26949810
-0.6 0.27176008
0.4 0.27705697
1.2 0.28222520
2.2 0.28941028
3.2 0.29707946
4.6 0.30820328
2.5 0.4 0.53909446
0.6 0.80606421
0.8 1.09497363
1.0 1.40861744
1.2 1.75028091
-1.2 -0.77788286
-0.7 -0.27575934
0.8 0.65376026
1.8 1.04992465
2.2 1.18220362
2.8 1.36080413
175 Page 14 of 16 Sådhanå (2019) 44:175
nonlinear fluid flow equations are derived taking into
account of Casson fluid model and these equations are
solved by using RK-SM and bvp4c techniques. The ther-
modynamic behaviour of physical parameters is illustrated
through the graphs and tables. Numerical simulations are
carried out for different sets of flow parameters. Following
important observations are made from the present study:
i. Velocity field is suppressed when S[ 0 and it is
magnified for S\0.
ii. Temperature profile is diminished for S[ 0 and
enhanced for S\0.
iii. Temperature field is a decreasing function of b.However, velocity field is enhanced for magnifying
values of b.iv. Velocity and concentration fields decrease for
increasing values of Hartmann number.
v. Temperature field decreases for increasing values of
thermal radiation parameter.
vi. Temperature profile is enhanced for Q[ 0 and it is
suppressed for Q\0.
vii. An increment in Dufour number increases the
temperature field.
viii. Concentration field is eventually suppressed for
magnifying values of Sr and Sc.
ix. Concentration profile decreases for Kr[ 0 and it
increases for Kr\0.
Acknowledgements
The authors wish to express their gratitude to the reviewers
who highlighted important areas for improvement in this
earlier draft of the article. Their suggestions have served
specifically to enhance the clarity and depth of the
interpretation of results in the revised manuscript. One of
the author, Usha Shankar, wishes to thank Karnataka Power
Corporation Limited, Raichur Thermal Power Station,
Shaktinagar, for the encouragement.
List of symbolsS squeezing number
Ha Hartmann number
Ec Eckert number
R radiation parameter
Q heat generation or absorption parameter
Q� volumetric heat generation or absorption coefficient
Pr Prandtl number
Sc Schmidt number
Sr Soret number
Du Dufour number
Kr chemical reaction parameter
j thermal conductivity (W m-1 K-1)
k� absorption coefficient (m-1)
Dm coefficient of mass diffusion
Cf skin-friction coefficient
Nu Nusselt number
Sh Sherwood number
Rex Reynolds number
p pressure (Pa)
Cp specific heat capacity at constant pressure
(J kg-1 K-1)
Cs specific heat capacity at constant concentration
B0 uniform magnetic field
l initial distance between the parallel plates (m)
T dimensional fluid temperature (K)
Tw wall temperature (K)
T1 ambient fluid temperature (K)
C dimensional fluid concentration (mol/m3)
Cw wall concentration (mol/m3)
C1 ambient fluid concentration (mol/m3)
k1 chemical reaction coefficient
u; v dimensional velocity components along x; ydirections (m s-1)
F0;F non-dimensional velocity components along axial
and radial directions
Greek symbolsb Casson fluid parameter
r electrical conductivity (s m-1)
r� Stefan–Boltzmann constant (W m-2 K-4)
g similarity variable
h dimensionless temperature
/ dimensionless concentration
q fluid density (kg m-3)
l dynamic viscosity (Ns m-2)
a characteristic parameter of the squeezing motion of
the plate (s-1)
m kinematic viscosity of the fluid (m2 s-1)
References
[1] Lawal A and Kalyon D M 1998 Squeezing flow of vis-
coplastic fluids subject to wall slip. Polym. Eng. Sci. 38(11):
1793–1804
[2] Maki E R, Kuzma D C and Donnelly R J 1966 Magneto-
hydrodynamic lubrication flow between parallel plates. J.
Fluid Mech. 26(3): 537–543
[3] Dorier C and Tichy J 1992 Behaviour of a Bingham-like
viscous fluid in lubrication flows. J. Non-Newton. Fluid
Mech. 45: 291–310
[4] Mohsin B B, Ahmed N, Adnan, Khan U and Mohyud-Din S
T 2017 A bio-convection model for a squeezing flow of
nanofluid between parallel plates in the presence of gyro-
tactic microorganisms. Eur. Phys. J. Plus 132 (187): 1–12
[5] Collyer A A and Clegg D W 1998 Rheological measurement,
2nd ed. London, UK: Chapman & Hali
[6] Khan H, Qayyum M, Khan O and Ali M 2016 Unsteady
squeezing flow of Casson fluid with magneto-hydrodynamic
effect and passing through porous medium. Math. Probl.
Eng. https://doi.org/10.1155/2016/4293721
Sådhanå (2019) 44:175 Page 15 of 16 175
[7] Stefan M J 1874 Versuchuber die scheinbare adhesion.
Sitzungsber Sachs Akad Wiss Wein. Math-Nat Wiss Kl 69:
713–721
[8] Reynolds O 1886 On the theory of lubrication. Philos. Trans.
R. Soc. Lond. 177: 157–234
[9] Archibald F R 1956 Load capacity and time relations for
squeeze films. Trans. ASME 78: 231–245
[10] Grimm G J 1976 Squeezing flows of Newtonian liquid films:
an analysis includes the fluid inertia. Appl. Sci. Res. 32(2):
149–166
[11] Wolfe W A 1965 Squeeze film pressures. Appl. Sci. Res. 14:
77–90
[12] Kuzma D C 1968 Fluid inertia effects in squeeze films. Appl.
Sci. Res. 18: 15–20
[13] Tichy J A and Winer W O 1970 Inertial considerations in
parallel circular squeeze film bearings. J. Lubr. Technol. 92:
588–592
[14] Jackson J D 1962 A study of squeezing flow. Appl. Sci. Res.
11: 148–152
[15] Mustafa M, Hayat T and Obaidat S 2012 On heat and mass
transfer in the unsteady squeezing flow between parallel
plates. Meccanica 47: 1581–1589
[16] Siddiqui A M, Irum S and Ansari A R 2008 Unsteady
squeezing flow of a viscous MHD fluid between parallel
plates, a solution using the homotopy perturbation method.
Math. Model. Anal. 13(4): 565–576
[17] Domairry G and Aziz A 2009 Approximate analysis of MHD
squeeze flow between two parallel disks with suction or
injection by homotopy perturbation method. Math. Probl.
Eng. https://doi.org/10.1155/2009/603916
[18] Duwairi H M, Tashtoush B and Damseh R A 2004 On heat
transfer effects of a viscous fluid squeezed and extruded
between two parallel plates.HeatMass Transf. 41(2): 112–117
[19] Mahmood M, Asghar S and Hossain M A 2007 Squeezed
flow and heat transfer over a porous surface for viscous fluid.
Heat Mass Transf. 44: 165–173
[20] Tashtoush B, Tahat M and Probert D 2001 Heat transfers and
radial flows via a viscous fluid squeezed between two parallel
disks. Appl. Energy 68: 275–288
[21] Muhaimin, Kandasamy R and Hashim I 2010 Effect of
chemical reaction, heat and mass transfer on nonlinear
boundary layer past a porous shrinking sheet in the presence
of suction. Nucl. Eng. Des. 240: 933–939
[22] Bahadir A R and Abbasov T 2011 A numerical approach to
hydromagnetic squeezed flow and heat transfer between two
parallel disks. Ind. Lubr. Tribol. 63(2): 63–71
[23] Weaver J A and Viskanta R 1991 Natural convection due to
horizontal temperature and concentration gradients-2. Spe-
cies interdiffusion, Soret and Dufour effects. Int. J. Heat
Mass Transf. 34(12): 3121–3133
[24] Raju C S K and Sandeep N 2016 Heat and mass transfer in
MHD non-Newtonian bio-convection flow over a rotating
cone/plate with cross diffusion. J. Mol. Liq. 215: 115–126
[25] Sulochana C, Payad S S and Sandeep N 2015 Non-uniform
heat source or sink effect on the flow of 3D Casson fluid in
the presence of Soret and thermal radiation. Int. J. Eng. Res.
Afr. 20: 112–129
[26] Nawaz M, Hayat T and Alsaedi A 2012 Dufour and Soret
effects on MHD flow of viscous fluid between radially
stretching sheets in porous medium. Appl. Math. Mech. Engl.
Ed. 33(11): 1403–1418
[27] Ojjela O and Kumar N N 2016 Unsteady MHD mixed con-
vective flow of chemically reacting and radiating couple
stress fluid in a porous medium between parallel plates with
Soret and Dufour effects. Arab. J. Sci. Eng. 41: 1941–1953
[28] Khan U, Ahmed N and Mohyud-Din S T 2016 Thermo-
diffusion, diffusion-thermo and chemical reaction effects on
MHD flow of viscous fluid in divergent and convergent
channels. Chem. Eng. Sci. 141(17): 17–27
[29] Khan S I, Mohyud-Din S T and Mohsin B B 2017 Thermo-
diffusion and diffuso-thermo effects on MHD squeezing
flow between parallel disks. Surf. Rev. Lett. 24(2):
1750022-10
[30] Ahmed N, Khan U, Khan S I, Bano S and Mohyud-Din S T
2017 Effects on magnetic field in squeezing flow of a Casson
fluid between parallel plates. J. King Saud Univ. Sci. 29:
119–125
[31] Mohyud-Din S T, Usman M, Wang W and Hamid M 2017 A
study of heat transfer analysis for squeezing flow of a Casson
fluid via differential transform method. Neural Comput.
Appl. 30(10): 3253–3264
[32] Cebeci T and Bradshaw P 1984 Physical and computational
aspects of convective heat transfer. New York, USA:
Springer-Verlag
[33] Kiusalaas J 2005 Numerical methods in engineering with
MATLAB. UK: Cambridge University Press
[34] Butcher J C 2016 Numerical methods for ordinary differen-
tial equations. UK: John Wiley & Sons
[35] Butcher J C 1975 A stability property of implicit Runge–
Kutta methods. BIT Numer. Math. 15: 358–361
[36] Butcher J C and Wanner G 1996 Runge–Kutta methods:
some historical notes. Appl. Numer. Math. 22: 113–151
[37] Houwen P J V D, Wolkenfelt P H M and Baker C T H
1981 Convergence and stability analysis for modified
Runge–Kutta methods in the numerical treatment of sec-
ond-kind Volterra integral equations. IMA J. Numer. Anal.
1: 303–328
[38] Debrabant K and Strehmel K 2005 Convergence of Runge–
Kutta methods applied to linear partial differential-algebraic
equations. Appl. Numer. Math. 53: 213–229
175 Page 16 of 16 Sådhanå (2019) 44:175
Related Documents


![SIMULTANEOUS EFFECTS THERMAL DIFFUSION AND DIFFUSION THERMO ON MHD NON-NEWTONIAN ... · 2019-06-15 · point flow of the non-Newtonian fluids. Later on, Sajid et al. [34] made the](https://static.cupdf.com/doc/110x72/5e583925096a0b60c102a5a4/simultaneous-effects-thermal-diffusion-and-diffusion-thermo-on-mhd-non-newtonian.jpg)