Thermal Actuation and Fluidic Characterization of a Fluorescence-Based Multiplexed Detection System by Hany Mohamed Arafa A Dissertation Presented in Partial Fulfillment of the Requirements for the Degree Master of Science Approved August 2018 by the Graduate Supervisory Committee: Jennifer Blain Christen, Chair Michael Goryll Barbara Smith ARIZONA STATE UNIVERSITY August 2018

Welcome message from author
This document is posted to help you gain knowledge. Please leave a comment to let me know what you think about it! Share it to your friends and learn new things together.
Transcript
Thermal Actuation and Fluidic Characterization of a Fluorescence-Based MultiplexedDetection System
by
Hany Mohamed Arafa
A Dissertation Presented in Partial Fulfillmentof the Requirements for the Degree
Master of Science
Approved August 2018 by theGraduate Supervisory Committee:
Jennifer Blain Christen, ChairMichael GoryllBarbara Smith
ARIZONA STATE UNIVERSITY
August 2018
ABSTRACT
This work describes efforts made toward the development of a compact, quantitative
fluorescence-based multiplexed detection platform for point-of-care diagnostics. This
includes the development of a microfluidic delivery and actuation system for multistep
detection assays. Early detection of infectious diseases requires high sensitivity
dependent on the precise actuation of fluids.
Methods of fluid actuation were explored to allow delayed delivery of fluidic reagents
in multistep detection lateral flow assays (LFAs). Certain hydrophobic materials such
as wax were successfully implemented in the LFA with the use of precision dispensed
valves. Sublimating materials such as naphthalene were also characterized along with
the implementation of a heating system for precision printing of the valves.
Various techniques of blood fractionation were also investigated and this work
demonstrates successful blood fractionation in an LFA. The fluid flow of reagents was
also characterized and validated with the use of mathematical models and multiphysics
modeling software. Lastly intuitive, user-friendly mobile and desktop applications
were developed to interface the underlying Arduino software. The work advances
the development of a system which successfully integrates all components of fluid
separation and delivery along with highly sensitive detection and a user-friendly
interface; the system will ultimately provide clinically significant diagnostics in a of
point-of-care device.
i

ACKNOWLEDGMENTS
The journey through my short (but hectic) graduate career at ASU has been an
incessant fluctuation of ups and downs. As this phase of my life comes to an end, I
have reached the conclusion that I would be nowhere near where I am had it not been
for a number of significant individuals in my life.
I would like to thank my advisor Dr. Jennifer Blain Christen for welcoming me into
her laboratory as a fledgling high school student and for providing me with mentorship
and guidance through my seven years at Arizona State. She went above and beyond
in supporting me through these years and it has been my pleasure to work under
her guidance. I would also like to thank the multitude of past and present graduate
students in her lab especially David, Sahil, Paul, Ian, Meilin, and Uwa for putting up
with more than I ever asked for in advice and guidance in research and in life.
I would also like to thank Dr. Michael Goryll for graciously helping me through
the graduate school application process and for giving me advice when I needed it the
most. I would also like to thank him for graciously agreeing to serve on my committee.
I would also like to thank Dr. Barbara Smith for her helping me understand paper
microfluidics and for graciously agreeing to serve on my committee.
I would also like to thank my friends for setting me straight and graciously listening
to all of my experimental stuggles.
Most importantly, I would like to thank my parents, Mohamed and Heba, for being
there for me at my best and even more so at my worst. If not for my parent’s endless
love and care, I wouldn’t be the person I am today (even though I am admittedly
a work in progress). I would like to thank my father Mohamed for opening up my
eyes to the expansive world of science and engineering and sparking my interest in
research. I would like to thank my mother Heba for her unwavering patience with
ii

me during all 22 years of my existence. Last but definitely not least, I would like to
thank my brother Omar for being an inspiration and a constant source of motivation
for me in all areas of life.
I am eternally in all of your debts.
iii
TABLE OF CONTENTS
Page
LIST OF TABLES . . . . . . . . . . . . . . . . . . . . . . . . . . . . . . . . . . . . . . . . . . . . . . . . . . . . . . . . vi
LIST OF FIGURES . . . . . . . . . . . . . . . . . . . . . . . . . . . . . . . . . . . . . . . . . . . . . . . . . . . . . . . vii
CHAPTER
1 INTRODUCTION . . . . . . . . . . . . . . . . . . . . . . . . . . . . . . . . . . . . . . . . . . . . . . . . . 1
1.1 The Emergence of Lateral Flow Assays . . . . . . . . . . . . . . . . . . . . . . . . . 1
1.2 Blood as an Diagnostic Tool . . . . . . . . . . . . . . . . . . . . . . . . . . . . . . . . . . . 4
1.3 Development of a Fluorescence-based Lateral Flow Platform for
Detection of Biomarkers in Whole Blood . . . . . . . . . . . . . . . . . . . . . . . . 5
1.4 Characterization of Capillary Driven Fluid Flow . . . . . . . . . . . . . . . . 8
1.5 Characterization of Fluid Flow through Porous Media . . . . . . . . . . . . 11
1.6 Review of Blood Fractionation Methods . . . . . . . . . . . . . . . . . . . . . . . . . 12
1.6.0.1 Membrane Filtration . . . . . . . . . . . . . . . . . . . . . . . . . . . . . . . 14
1.6.0.2 Capillary and Hydrodynamic Separations . . . . . . . . . . . . 18
1.7 Experimental Overview . . . . . . . . . . . . . . . . . . . . . . . . . . . . . . . . . . . . . . . . 19
2 BLOOD FRACTIONATION AND ASSAY IMPLEMENTATION . . . . . . 20
2.1 Testing of Filtration Membranes . . . . . . . . . . . . . . . . . . . . . . . . . . . . . . . . 21
2.1.1 Plasma Yield Experimental Setup . . . . . . . . . . . . . . . . . . . . . . . . 22
2.1.2 Evaporation and Fluid Retention Experiments . . . . . . . . . . . . . 28
2.2 Implementation in the Lateral Flow Assay . . . . . . . . . . . . . . . . . . . . . . 32
3 VALVE ACTUATION AND FLUIDIC CONTROL . . . . . . . . . . . . . . . . . . . 41
3.1 Introduction . . . . . . . . . . . . . . . . . . . . . . . . . . . . . . . . . . . . . . . . . . . . . . . . . . 41
3.2 Design and Validation of PID Controller . . . . . . . . . . . . . . . . . . . . . . . . 41
3.3 Wax Valves . . . . . . . . . . . . . . . . . . . . . . . . . . . . . . . . . . . . . . . . . . . . . . . . . . . 46
iv
CHAPTER Page
3.3.1 Autofluorescence of Wax . . . . . . . . . . . . . . . . . . . . . . . . . . . . . . . . . 47
3.3.2 Characterization of Fluidic Flow with a Hydrophobic Wax
Treatment . . . . . . . . . . . . . . . . . . . . . . . . . . . . . . . . . . . . . . . . . . . . . . 52
3.4 Sublimating Valves . . . . . . . . . . . . . . . . . . . . . . . . . . . . . . . . . . . . . . . . . . . . 57
3.4.1 Flow Characterization of Sublimating Valves . . . . . . . . . . . . . . 58
3.4.2 Compatibility of Naphthalene . . . . . . . . . . . . . . . . . . . . . . . . . . . . 62
4 MODELING OF FLUID FLOW IN A POROUS MEDIUM . . . . . . . . . . . 67
4.1 Mathematical Modeling . . . . . . . . . . . . . . . . . . . . . . . . . . . . . . . . . . . . . . . . 67
4.1.1 Governing Equations and Assumptions . . . . . . . . . . . . . . . . . . . . 67
4.1.2 Mathematical Model Development . . . . . . . . . . . . . . . . . . . . . . . . 70
4.2 COMSOL Modelling . . . . . . . . . . . . . . . . . . . . . . . . . . . . . . . . . . . . . . . . . . . 70
5 DEVELOPMENT OF A SOFTWARE TO INTERFACE THE DATA
ACQUISITION PROGRAM FOR THE LATERAL FLOW PLATFORM 72
5.1 Computer Interface Development . . . . . . . . . . . . . . . . . . . . . . . . . . . . . . . 72
5.2 iOS Application Development . . . . . . . . . . . . . . . . . . . . . . . . . . . . . . . . . . 74
6 CONCLUSIONS & FUTURE WORK . . . . . . . . . . . . . . . . . . . . . . . . . . . . . . . 79
REFERENCES . . . . . . . . . . . . . . . . . . . . . . . . . . . . . . . . . . . . . . . . . . . . . . . . . . . . . . . . . . . 81
APPENDIX
A CODE FOR PROGRAMS . . . . . . . . . . . . . . . . . . . . . . . . . . . . . . . . . . . . . . . . . . 85
B PROTOCOLS FOR ASSAYS . . . . . . . . . . . . . . . . . . . . . . . . . . . . . . . . . . . . . . . 121
C IRB DOCUMENTATION FOR BLOOD COLLECTION . . . . . . . . . . . . . . 126
BIOGRAPHICAL SKETCH . . . . . . . . . . . . . . . . . . . . . . . . . . . . . . . . . . . . . . . . . . . 144
v

LIST OF TABLES
Table Page
1. A Comparison of Various Commercial Membranes Marketed for the Filtration
of RBCs. . . . . . . . . . . . . . . . . . . . . . . . . . . . . . . . . . . . . . . . . . . . . . . . . . . . . . . . . . . . . . . . 15
2. The 23 Factorial Design for the Set of Wax Experiments to Test the Effect of
Autofluorescence. . . . . . . . . . . . . . . . . . . . . . . . . . . . . . . . . . . . . . . . . . . . . . . . . . . . . . . . . 47
3. The 23 Factorial Run Chart for the Set of Wax Experiments to Test the
Effects of Autofluorescence Which Includes the Interactions between Each of
the Factors. . . . . . . . . . . . . . . . . . . . . . . . . . . . . . . . . . . . . . . . . . . . . . . . . . . . . . . . . . . . . . 48
vi

LIST OF FIGURES
Figure Page
1. Various Types of Paper Based Microfluidic Devices Which Are Described in
the Section and the Various Types of Functionalizations that Can Be Applied
to the Surface. . . . . . . . . . . . . . . . . . . . . . . . . . . . . . . . . . . . . . . . . . . . . . . . . . . . . . . . . . . 3
2. A Sample Nanoparticle Based Immunoassay and Schematic (`Posthuma-
Trumpie2009). . . . . . . . . . . . . . . . . . . . . . . . . . . . . . . . . . . . . . . . . . . . . . . . . . . . . . . . . . . 6
3. A Schematic of the Excitation and Emission Sources of the Setup. Part (a)
Shows the Green Emission LED, (B) Shows the Housing of the Emission and
Excitation Filters, and (C) Shows the Orange Excitation Photodiode along
with the Charge Integration Amplifier Circuit (`7797711). . . . . . . . . . . . . . . . . . 8
4. A Relation of the Output Voltage of the Charge Integration Circuit Which
Is Directly Related to the Intensity of the Fluorescent Signal (`7797711). . . . 9
5. Contact Angle for Both Non-Wetting and Wetting Fluids (`yuan2013contact). 10
6. Various Methods of Blood Fractionation of Small Samples. . . . . . . . . . . . . . . . . . 13
7. An SEM Image of the Vivid Plasma Separation Membrane. The Asymmetric
Nature of the Polysulfone Membrane Can Be Clearly Seen in This Cross
Section.Courtesy of Pall Corporation . . . . . . . . . . . . . . . . . . . . . . . . . . . . . . . . . . . . . 16
8. A Setup Which Also Uses Gravity Aided Sedimentation to Filter
800 µL of Human Blood by Using a Super Hydrophobic Membrane
(`liu2013membrane,liu2016high). . . . . . . . . . . . . . . . . . . . . . . . . . . . . . . . . . . . . . . . . . 17
9. A Characterization of the Autofluorescence of Different Types of Polymeric
Membranes that Are Used in Various Parts of the Lateral Flow Assay. . . . . . . 21
vii

Figure Page
10.An Example of the Hemolysis Seen in a Strip of Pall Vivid GR Plasma
Separation Membrane in the Sample of Mouse Blood. This Result Was
Verified by Centrifugation of the Blood Sample. . . . . . . . . . . . . . . . . . . . . . . . . . . . 24
11.Overflow of a 50µL Mouse Blood Sample on a Whatman MF1 Membrane
Mounted on a Glass Slide with Double Sided Tape. . . . . . . . . . . . . . . . . . . . . . . . . 24
12.An Example of Inconsistent Blood Deposition on the Vivid Gx Membrane
that Was Done with the Finger Touch Method. The Plasma Front Is Clearly
Seen, but the Wicking of the Plasma Occurs in Multiple Directions Which
Introduces Extra Variability into the Assay. . . . . . . . . . . . . . . . . . . . . . . . . . . . . . . . 25
13.A Schematic of the Experimental Setup for the Blood Weighing Experiment
Where the Sample Pad Was Placed on Top of the Nitrocellulose and the
Nitrocellulose Was Weighed after 180 Seconds. . . . . . . . . . . . . . . . . . . . . . . . . . . . . 26
14.The Results of the Plasma Recovery Experiment Created to Characterize in
Each of the Plasma Membranes. . . . . . . . . . . . . . . . . . . . . . . . . . . . . . . . . . . . . . . . . . . 27
15.A Box and Whisker Plot Showing the Overall Evaporation of Each of the
Millipore HF75 Membrane with Both K2 EDTA Sheep Blood Applied for One
Group and Deionized Water Applied to the Other Group. Statistical Analysis
Showed that There Was No Statistically Significant Difference between Both
of the Treatment Groups. . . . . . . . . . . . . . . . . . . . . . . . . . . . . . . . . . . . . . . . . . . . . . . . . 29
16.The Results of the Low Humidity Evaporation Rate Experiment for the
Millipore HF75 Membrane. The Evaporation Seems to Be Linear at All
of the Fluid Amounts (50µL, 100µL, and 150µL), Which Means that a
Correction Can Be Applied to Compensate for Fluid Losses. . . . . . . . . . . . . . . . . 31
viii

Figure Page
17.The Results of the High Humidity Evaporation Condition Experiment on the
Millipore HF75 Experiment and the Fluid Losses Can Be Seen to Be Linear
at All the Initial Fluid Amounts. . . . . . . . . . . . . . . . . . . . . . . . . . . . . . . . . . . . . . . . . . 32
18.The Results of the Fluid Loss Experiments for Both of the Pall Vivid GX/GR
Membranes. . . . . . . . . . . . . . . . . . . . . . . . . . . . . . . . . . . . . . . . . . . . . . . . . . . . . . . . . . . . . . 33
19.A Test Strip that Was Prepared for the Lateral Flow Blood Fractionation
Tests. . . . . . . . . . . . . . . . . . . . . . . . . . . . . . . . . . . . . . . . . . . . . . . . . . . . . . . . . . . . . . . . . . . 34
20.A Test Strip with 10µL of Blood that Was Tested in This Experiment. . . . . . . 36
21.A Comparison of All of the Samples with Various Methods (Finger Touch,
and Capillary) for Two Patient Samples (Solid, Striped Lines). . . . . . . . . . . . . . 37
22.A Comparison of Finger Touch Blood and Capillary Deposited Blood for
Three Samples with Measurements for Concentration of BSA, IgG, and
EBNA for Sample D2. . . . . . . . . . . . . . . . . . . . . . . . . . . . . . . . . . . . . . . . . . . . . . . . . . . . 37
23.A Comparison of the Concentrations of EBNA and IgG to Various Dilutions
of the Pooled Plasma Samples. It Can Be Seen that Slide B in the 1:50
Dilution of the Pooled Sample Was Slightly Higher than the 1:10 Sample, but
This Could Be due to a Number of Different Factors. Overall of the Other
Slides Were Consistently Withing 10% of Each Other, Which Is a Good Point
of Reference to the Other Samples. . . . . . . . . . . . . . . . . . . . . . . . . . . . . . . . . . . . . . . 38
24.A Comparison of Results between the Different Types of Application Methods
(Finger Touch, Heparinized Capillary, and a Pooled Blood Plasma Sample
for Both Donors. There Seems to Be No Significant Variance in the Results
for Patient D2, but There Were Some Variations that Were Noticeable in the
First Sample. . . . . . . . . . . . . . . . . . . . . . . . . . . . . . . . . . . . . . . . . . . . . . . . . . . . . . . . . . . 39
ix

Figure Page
25.A Comparison of the Results for All of the Donors Which Takes into Account
the Application Method as Well as the Inclusion of the Pooled Plasma Sample
at the Two Dilutions. There Seems to Be No Significant Variation in the
Results between Each of the Groups. . . . . . . . . . . . . . . . . . . . . . . . . . . . . . . . . . . . . . 40
26.An Example Setup of the PID Controller with the Thermocouple Placed
Directly on Top of the Heating Surface. . . . . . . . . . . . . . . . . . . . . . . . . . . . . . . . . . . . 42
27.The Schematic of the First Iteration of the PID Controller Which Includes
a 120V AC Input, a PID Controller, a 10A Relay, a Heating Pad, and a
Separate 24V Power Supply to Heat the Silicone Heating Blanket. . . . . . . . . . . 43
28.The Schematic of the Second Iteration of the PID Controller Which Utilizes
a Solid State Relay and an External Heating Element. . . . . . . . . . . . . . . . . . . . . . 44
29.The Simulated Conditions of the PID Control with the Use of the Preset
P and I Conditions for a Temperature of 120 Degrees. There Is Minimal
Hysteresis in the Graph and the Simulated Controller Returns to Optimal
Conditions in Minimal Time. . . . . . . . . . . . . . . . . . . . . . . . . . . . . . . . . . . . . . . . . . . . . . 45
30.The Simulated Conditions of the PID Control with the Use of the Preset P and
I Conditions for a Temperature of 120 Degrees. There Is Minimal Hysteresis
in the Graph and the Heating Cord Reached the Operating Temperature in
about 500 Seconds. The Stock Presets of the PID Controller Were Kp=3,
Ki=0.8, Kd=0.7. Fine Tuning Will Be Done at a Further Time. . . . . . . . . . . . . . 46
31.A CAD Model of the Wax Dipping Piece to Create Clearly Defined Channels
in the Membrane. . . . . . . . . . . . . . . . . . . . . . . . . . . . . . . . . . . . . . . . . . . . . . . . . . . . . . . . 49
x

Figure Page
32.A Comparison of the Initial Iteration of the Wax Dipping Apparatus (Seen
on the left Side of the Image) and the Consequent Evolution of the Dipping
Molds. There Are Noticeable Wax Residues on the Molds and This Was
Removed with Isopropyl Alcohol and Compressed Air. . . . . . . . . . . . . . . . . . . . . . 50
33.The Results of the Wax Fluorescent Emissions Experiment. It Can Be Seen
that the Ozokerite Wax Had a Higher Intensity in Comparison to the Soybean
Wax. . . . . . . . . . . . . . . . . . . . . . . . . . . . . . . . . . . . . . . . . . . . . . . . . . . . . . . . . . . . . . . . . . . . 51
34.The Results of Effect Summary Analysis for the Wax Autofluorescence
Experiment. Variables with a Higher Log Worth Are Deemed to Have a More
Significant Effect on the Ramp Time. . . . . . . . . . . . . . . . . . . . . . . . . . . . . . . . . . . . . . 52
35.Another Comparison of the Effects on the Ramp Time, Which Verifies the
Results Seen in the Previous Figure. This Table Also Shows Which Effects
Are Statistically Significant with the Use of an F Test. . . . . . . . . . . . . . . . . . . . . . 52
36.The Results of the Prediction Profiler Which Uses the Data Compiled from
the 8 Runs to Find the Optimal Conditions Which Maximize the Ramp Time
and Minimize the Fluorescent Signal. . . . . . . . . . . . . . . . . . . . . . . . . . . . . . . . . . . . . . 53
37.A Schematic of the Y Pattern that Was Used to Characterize the Flow Rates
with Different Types of Hydrophobic Wax Treatments. . . . . . . . . . . . . . . . . . . . . . 54
38.a Simplified Schematic of the Flow through the Y Membrane. . . . . . . . . . . . . . . 55
39.The Characterization of Flow Rates of Ozokerite and Soybean Waxes and
the Comparison of Length Traveled versus Time. . . . . . . . . . . . . . . . . . . . . . . . . . . 56
40.The Characterization of Flow Rates of Ozokerite and Soybean Waxes and
the Comparison of Length Traveled versus Time. . . . . . . . . . . . . . . . . . . . . . . . . . . 57
xi

Figure Page
41.The Characterization of Flow Rates of Ozokerite and Soybean Waxes and
the Comparison of Length Traveled versus Time. . . . . . . . . . . . . . . . . . . . . . . . . . . 59
42.A Schematic of the Experimental Setup of the Hold Time Experiment with a
Reservoir of Fluid. . . . . . . . . . . . . . . . . . . . . . . . . . . . . . . . . . . . . . . . . . . . . . . . . . . . . . . 60
43.A Comparison of the Hold Times of Naphthalene Valves versus Ozokerite
Wax Valves. It Can Be Seen that Ozokerite Wax Held for Longer than the
Experimentation Time of 12 Hours and the Naphthalene Valves Held for an
Average of about Nine Hours. . . . . . . . . . . . . . . . . . . . . . . . . . . . . . . . . . . . . . . . . . . . . 61
44.The Characterization of Flow Rates of Ozokerite and Soybean Waxes and
the Comparison of Length Traveled versus Time. . . . . . . . . . . . . . . . . . . . . . . . . . . 62
45.The Setup of the ELISA Assay with the Plate Map of the Assay with the
EBNA and GST(Negative Control). The Legend of the Plate Map Can Be
Seen and Three Duplicates of Each Run Were Created. . . . . . . . . . . . . . . . . . . . . 64
46.The Legend of the ELISA Assay with All of the Necessary Controls with the
Secondary, Plasma With/without the Addition of Naphthalene. . . . . . . . . . . . . . 65
47.The Chemiluminescent Results of the ELISA Compatibility Experiment
with the Addition of Naphthalene. It Can Be Seen that the Addition of
Naphthalene with Plasma and Secondary Resulted in En Extremely High
Signal, but It Is Also Noted that the Standard Deviation of This Group Was
High. Overall It Is Noted that the Naphthalene Did Not Significantly Affect
the Signal in the Other Wells. . . . . . . . . . . . . . . . . . . . . . . . . . . . . . . . . . . . . . . . . . . . 66
48.The Image Import of the SEM Image of an Asymmetric Polysulfone Membrane
on COMSOL Multiphysics. . . . . . . . . . . . . . . . . . . . . . . . . . . . . . . . . . . . . . . . . . . . . . . 71
xii

Figure Page
49.The Screen Where the User Is Prompted to Insert the Patient and the
Application Also Saves the Time and Date of the Test. . . . . . . . . . . . . . . . . . . . . . 73
50.A System Block Diagram for the Software Interfaces Developed for the Lateral
Flow Platform. . . . . . . . . . . . . . . . . . . . . . . . . . . . . . . . . . . . . . . . . . . . . . . . . . . . . . . . . . . 74
51.The Landing Screen of the FlexDx Application Where the Device Searches
for Available BLE Devices. . . . . . . . . . . . . . . . . . . . . . . . . . . . . . . . . . . . . . . . . . . . . . . . 75
52.The Screen Where the User Is Prompted to Insert the Patient and the
Application Also Saves the Time and Date of the Test. . . . . . . . . . . . . . . . . . . . . . 76
53.The Testing Screen of the Device Where the Timer Measures the Overall
Time Elapsed for the Detection Test. . . . . . . . . . . . . . . . . . . . . . . . . . . . . . . . . . . . . . 77
54.A Sample Email Screen Where the Application Compiles All of the Data into
a .csv File and Prompts the User to Email the Data to a Health-Care Provider. 78
xiii

Chapter 1
INTRODUCTION
Microfluidic devices have recently become the golden standard for diagnostic
devices particularly in the field of global health. These devices can be used to
accurately transport fluids as well as the completion of other processes such as
separation, purification and other fluidic reactions. These devices are usually fabricated
via conventional photolithography methods to create features in a polymer such
as polydimethylsiloxane (PDMS). However, there are certain limitations to these
devices, mainly cost and the resources needed to fabricate these devices (clean room
environments, photolithography spinners, etc.). This has made paper microfluidics
more attractive in global health applications in developing countries.
1.1 The Emergence of Lateral Flow Assays
Paper has been utilized for a myriad of applications in analytical chemistry. Paper
is thin, simple to package, and is cost effective. The surface of the paper can be
functionalized and the specificity of a membrane can be altered based on the aims
of the device. Reagents can also be selectively impregnated into the membrane and
the porous structure of the paper can be used to alter the flow characteristics of
the membrane. Paper is also relatively inert and are compatible with a number of
chemicals. Since paper is versatile material it has recently experienced an uptick
in the field or rapid diagnostics. Potential applications include bioterrorism, food
safety, veterinary medicine, immunoassays, urinalysis, and environmental monitoring
1
(Yetisen, Akram, and Lowe 2013). Commercial rapid diagnostics have been successfully
deployed for the detection of influenza, tuberculosis, and other bio-hazards. The most
prominent manifestation of these paper microfluidic devices has been deployed for
the detection of human chorionic gonadotropin (HCG) for pregnancy. Other systems
implement lateral flow detection or electrochemical detection for a wide variety of
analytes such as the widely available glucose sensor used by diabetics.
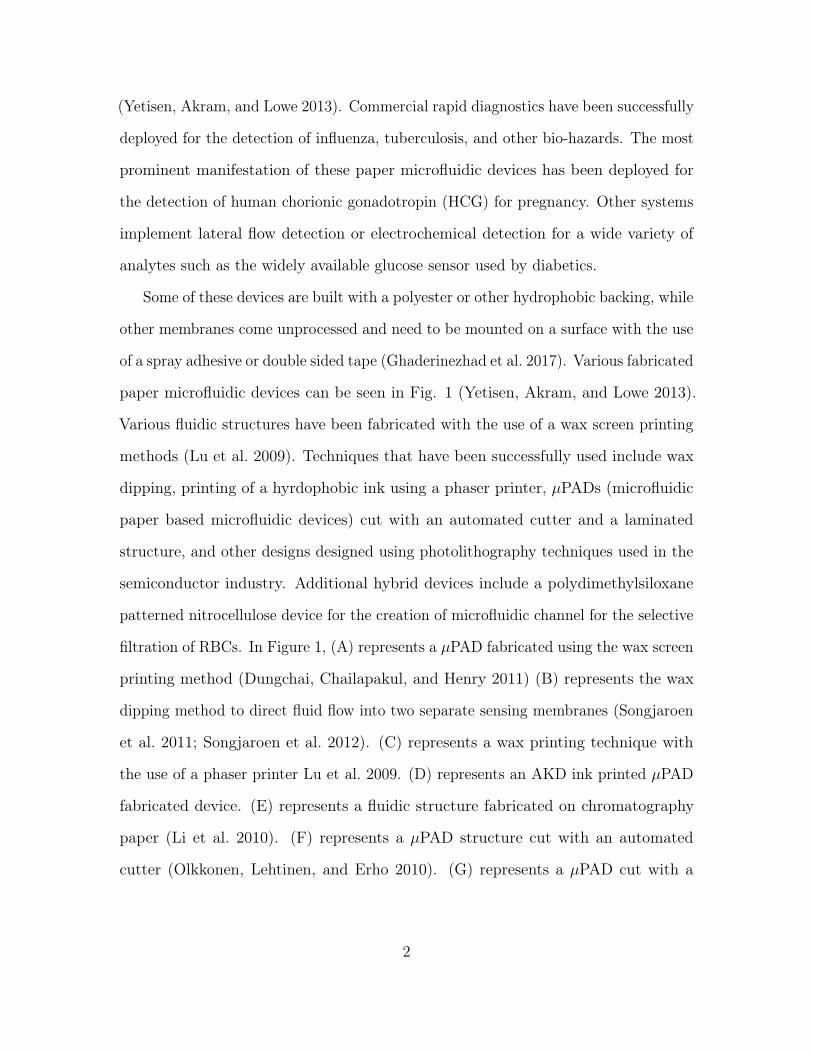
Some of these devices are built with a polyester or other hydrophobic backing, while
other membranes come unprocessed and need to be mounted on a surface with the use
of a spray adhesive or double sided tape (Ghaderinezhad et al. 2017). Various fabricated
paper microfluidic devices can be seen in Fig. 1 (Yetisen, Akram, and Lowe 2013).
Various fluidic structures have been fabricated with the use of a wax screen printing
methods (Lu et al. 2009). Techniques that have been successfully used include wax
dipping, printing of a hyrdophobic ink using a phaser printer, µPADs (microfluidic
paper based microfluidic devices) cut with an automated cutter and a laminated
structure, and other designs designed using photolithography techniques used in the
semiconductor industry. Additional hybrid devices include a polydimethylsiloxane
patterned nitrocellulose device for the creation of microfluidic channel for the selective
filtration of RBCs. In Figure 1, (A) represents a µPAD fabricated using the wax screen
printing method (Dungchai, Chailapakul, and Henry 2011) (B) represents the wax
dipping method to direct fluid flow into two separate sensing membranes (Songjaroen
et al. 2011; Songjaroen et al. 2012). (C) represents a wax printing technique with
the use of a phaser printer Lu et al. 2009. (D) represents an AKD ink printed µPAD
fabricated device. (E) represents a fluidic structure fabricated on chromatography
paper (Li et al. 2010). (F) represents a µPAD structure cut with an automated
cutter (Olkkonen, Lehtinen, and Erho 2010). (G) represents a µPAD cut with a
2

CO2 laser cutter (Fenton et al. 2008). (H) represents a novel laser treatment for
a nitrocellulose membrane (Fu et al. 2011). (I) represents and inkjet deposition of
polystrene/toluene solution on paper (Abe, Suzuki, and Citterio 2008). (J) represents
a photoresist patterned device created on chromatography paper (Martinez et al. 2007).
(K) represents an alternative technique for the printing on chromatography paper
with an inkjet printer (Martinez et al. 2008). (L) represents a Polydimethylsiloxane
(PDMS) microfluidic patterned device (Bruzewicz, Reches, and Whitesides 2008).
Figure 1. Various types of paper based microfluidic devices which are described in thesection and the various types of functionalizations that can be applied to the surface.
The majority of these devices can be grouped into the category of point of care
diagnostics, which refer to diagnostic testing at the immediate point of testing. This
is appealing from a global health perspective in terms of diagnostics for developing
countries which may not have the infrastructure for laboratories. In addition the
detection of analytes in smaller concentrations in an appealing form factor is appealing
to health-care providers. There are a number of criteria with regards to the design of
a point-of-care diagnostic tool that are outlined by the World Health Organization
(WHO). In general point of care devices should follow the ASSURED criteria, which
3
means that a potential point of care device should be Affordable, Sensitive, Specific,
User Friendly, Rapid/Robust, Equipment Free, and Delivered to those needing it.
This criteria has been widely adopted in the vast majority of implementations of
devices for point of care or global health applications.
1.2 Blood as an Diagnostic Tool
Blood is one of the most essential biological fluids and has a number of crucial
purposes from transporting nutrients and oxygen to vital organs of the body to
regulating pH, essentially acting as a biological buffer. Blood also facilitates the
immune response in the body by shuttling the immune cells across the vascular
network to respond to potential infections and to enable the healing process(Goodman
et al. 2007). Due to the presence of a plethora of cofactors, proteins, and other
biomarkers, the majority of diagnostic tools have relied on the collection of a blood
sample to provide information on the well-being of the patient(Bhalla et al. 2013;
Castillo-León and Svendsen 2014). Health care professionals can extract a wealth of
information from the collection of a blood specimen, and this is the general method of
diagnosis. Blood samples are generally used for a plethora of applications, from cancer
screening to general hospital diagnostics (inflammation markers, mineral concentrations
in the body, etc.). Blood tests/diagnostics are generally performed in a lab setting,
impacting the scope of healthcare delivery particularly in developing countries.
Blood contains both cellular and plasma components. Cellular components include
platelets, leukocytes, and eryhrocytes (red blood cells) while plasma components
include water, salts, enzymes, glucose, clotting factors, electrolytes, and antibodies.
Plasma comprises about 55% of total blood volume and the cellular component
4

comprises the remaining 45% of blood volume(Cate et al. 2014). Some of the proteins
contained in plasma include albumin, fibrinogen, and other globulins that may be
present in blood. Blood serum refers to plasma that does not contain any clotting
factors (Homsy et al. 2012). The hematocrit level of a blood sample refers to the
volume percent of erythrocytes in a sample, with males having a hematocrit level of
about 52% and women having a hematocrit level of about 47%. Abnormal hematocrit
levels can indicate the presence of anemia, which can affect oxygen delivery across the
cardiovascular system. In addition, red blood cells are geometrically larger than most
components of blood and can be as large as 6µm in diameter, which allows for size
exclusion filtration methods which are covered in the following section.
Red blood cells make up the majority of the cells that are present in a blood
sample > 99% with the remaining < 1% of cells or formed cells being thrombocytes
and leukocytes. Separating red blood cells has always been a significant issue for
point-of-care diagnostic tools as standard techniques used in a laboratory such as
centrifugation do not meet the criteria for point of care devices.
Other diagnostic fluids that are commonly used are urine, fecal matter, and saliva.
Saliva based detection modalities are rapidly gaining widespread adoption, but blood
still remains as the gold standard in terms of diagnostics.
1.3 Development of a Fluorescence-based Lateral Flow Platform for Detection of
Biomarkers in Whole Blood
Our group has been developing a fluorescence-based platform for the detection of
biomarkers in the form factor of a lateral flow assays. In general lateral flow assays are
designed to be more qualitative, with the goal of having a yes or no reading. On the
5
other side of the spectrum, fluorescence platforms (Tecan scanners and other optical
methods) require a trained professional to operate the equipment and can cost in the
hundreds of thousands of dollars. By eliminating the expensive optics, our team has
developed a device which related fluorescent intensity to the voltage-time domain.
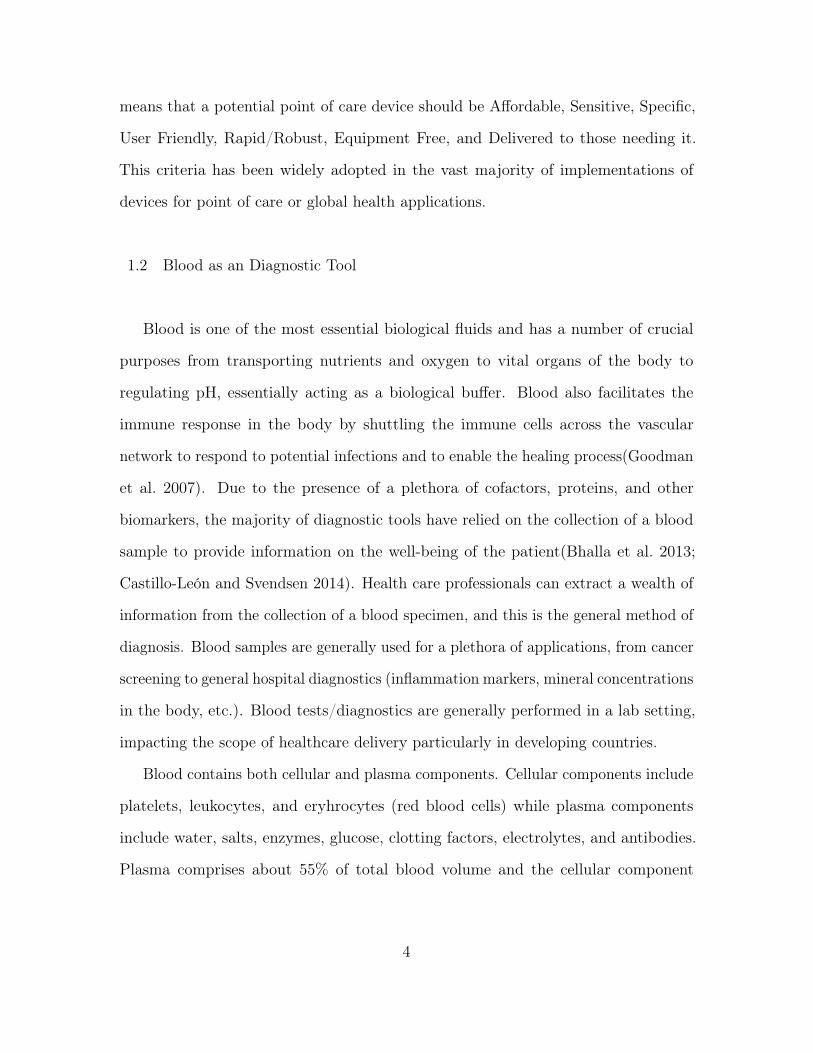
Figure 2. A sample nanoparticle based immunoassay and schematic(Posthuma-Trumpie, Korf, and Amerongen 2009).
Lateral flow assays generally use colorimetric means to measure various biomarkers
with a fairly simple setup. By using varying layers of membranes, an analyte is
deposited on a sample pad. The lateral flow also contains a conjugate pad (containing
colorimetric markers in this situation), a testing membrane, and a wick at the end of
the assay. In the test membrane, there is usually a test line and a positive control line.
6

This is the gold standard for qualitative measurements but in the majority of cases
colorimetric methods are not sufficient. The fluorescence based assay that is designed
uses an LED to emit light and a photodiode to measure the fluorescent signal emitted
by the fluorophores.
The system uses a green exitation filter and an orange emission filter with a
photodiode and an intergrator. In this situation, the Beer-Lambert law becomes
important, with the current output of the detector being directly related to the
strength of the fluorescent signal at the photodiode, which can be seen in Equation 1.
IPD = KI0[1− exp(−εlc)] (1)
where IPD is the current of the photodetector, K is a variable that describes the
responsitivity of the photodiode, I0 describes the intensity of the excitation source, ε
describes the extinction coefficient of the fluorophore, l describes the path length of
the sample, and c describes the value of the capacitor (Obahiagbon et al. 2016).
Vout =1
C
∫ T
0
IPDdt (2)
Equation 2 shows the output of the charge integrator circuit, which is related to
the current at the inverting terminal of the operational amplifier. C describes the
feedback capacitance and t describes the integration period. Equation 3 shows the
fluorophore-concentration-dependent output voltage of the integrator circuit, which
directly relates the sensor voltage to the photodiode current and the integration time
(Obahiagbon et al. 2016).
Vout =1
C
∫ T
0
[KI0((1− exp(−εlc)) + IB]dt (3)
7

Figure 3. A schematic of the excitation and emission sources of the setup. Part (a)shows the green emission LED, (b) shows the housing of the emission and excitationfilters, and (c) shows the orange excitation photodiode along with the chargeintegration amplifier circuit (Obahiagbon et al. 2016).
Fig. 3 displays a simplified schematic of the entire PD detection scheme. As
mentioned earlier, the system uses a green excitation source and an orange emission
source. There are two emission and excitation filters which are placed in a 3D printed
ABS housing and a photodiode/charge integration circuit for the measurement of the
intensity of the emitted signal. Fig. 4 demonstrates how the output voltage can be
related to the intensity of the signal. The ramp time describes the time delta between
the low and high states of the charge integrator (typically between 1V and 8V).
Therefore, a sample with a faster ramp time would correlate to a higher fluorescent
signal and vice versa.
1.4 Characterization of Capillary Driven Fluid Flow
The flow of fluid on a paper substrate can be essentially modelled as a flow
through a porous medium. The wicking mechanism of the paper can be simplified
as capillary-driven flow, which is caused by a pressure gradient along the meniscus
of the fluid in a capillary. The pressure gradient is caused by the surface tension
8

Figure 4. A relation of the output voltage of the charge integration circuit which isdirectly related to the intensity of the fluorescent signal (Obahiagbon et al. 2016).
induced by molecular interactions in the fluid interface.The magnitude of the cohesion
of the forces can be quantified by measuring the contact angle of the liquid-to-air
interface. This is measurement of surface energy provides information about the
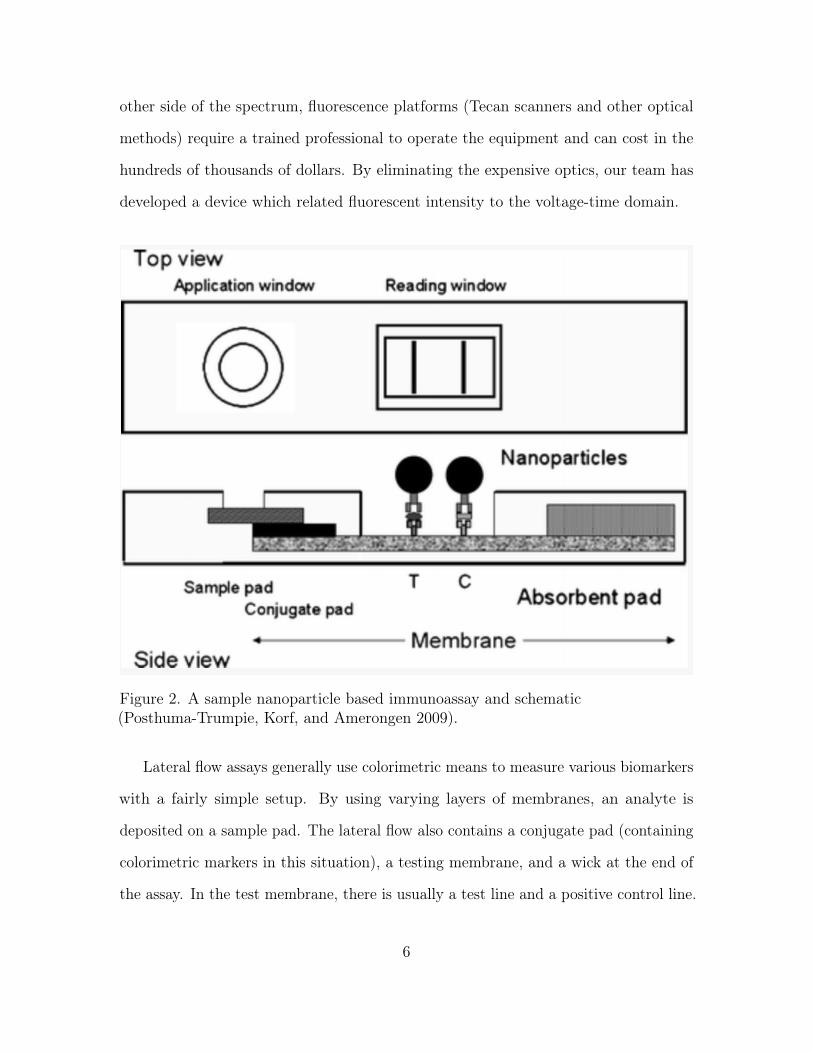
wettability of the surface, with smaller contact angles (< 90◦) corresponding to a high
wettability and larger contact angles (> 90◦) corresponding to a lower wettability as
seen in Figure 5(Yuan and Lee 2013). Higher wettability also indicates that fluid will
spread and maximize its contact with the fluid interface and vice versa. Hydrophobic
modifications to the paper substrate can decrease the wettability of the surface and
this can be combined with lithography techniques to create fluid flow in selective
areas of a substrate. This relationship between contact angle and surface tension was
quantified by Thomas Young in the early 1800s:
γlv · cosθγ = γsv − γsl (4)
where γlv,γsv, and γsl describe the interficial tensions between the liquid-vapor, solid-
9
vapor, and solid-liquid interfaces respectively. This equation is commonly referred
to as Young’s equation. However due to contact angle hysteresis, the smoothness of
the surface also plays a role in the wettability of a surface and Young’s equation is
only used to model the contact angle in ideal situations (no hysteresis and perfectly
smooth solid surface) (Li et al. 2010). Young’s equation is generally used in cases
where the pore size is known as is consistent across the solid interface. However, this is
unlikely in a paper or fibrous material since the contact angle and smoothness cannot
be accurately quantified due to its non-uniformity. Fig 5 shows the effect of contact
angle for both wetting and non-wetting fluids.
Figure 5. Contact Angle for both non-wetting and wetting fluids (Yuan and Lee2013).
The flow of blood in the constructed microchannel as well as in the case of
aggregation of erythrocytes at the site of separation can be theoretically modeled
using the Casson flow model where the non-Newtonian characteristic of blood is also
taken into consideration. The equation for the Casson flow model is identified as:
√τ =√τ0 + (
õc
√γ̇) (5)
where τ is the shear stress, µc is the Casson’s coefficient of viscosity, τo is the yield
stress and γ̇ is the rate of shear. From experimental studies conducted on blood, it
was found that the yield stress of blood is approximately 0.004 Pa. Casson’s coefficient
10
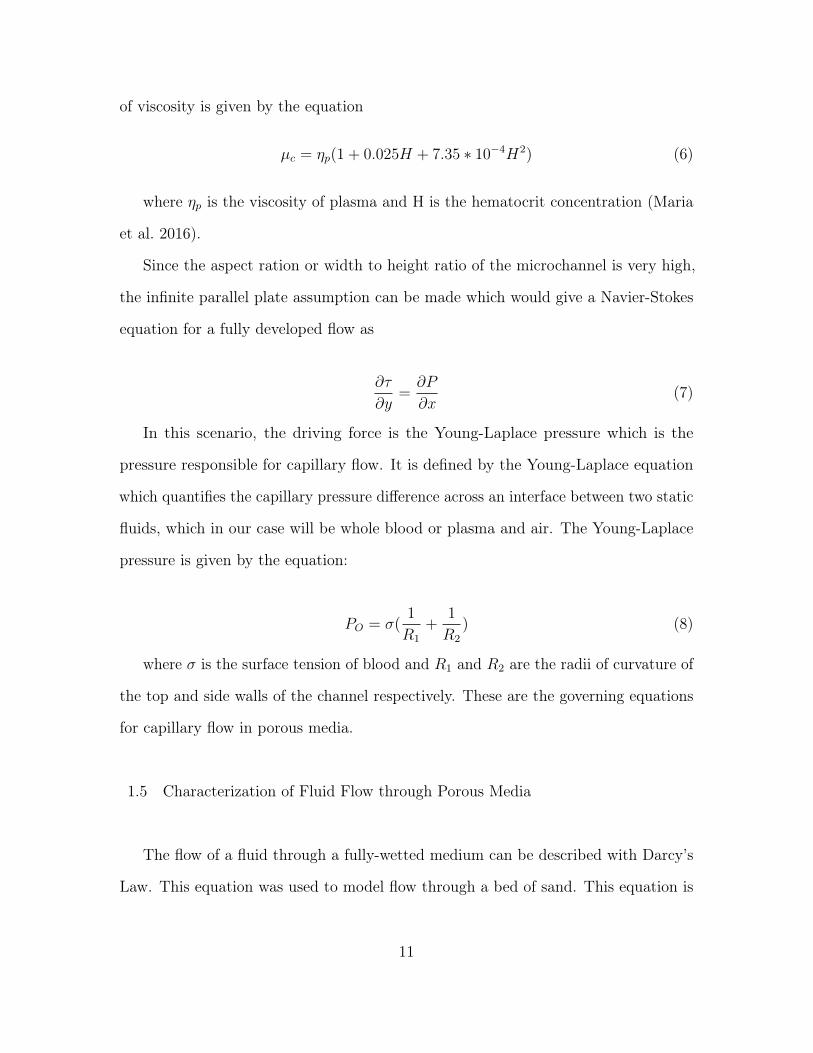
of viscosity is given by the equation
µc = ηp(1 + 0.025H + 7.35 ∗ 10−4H2) (6)
where ηp is the viscosity of plasma and H is the hematocrit concentration (Maria
et al. 2016).
Since the aspect ration or width to height ratio of the microchannel is very high,
the infinite parallel plate assumption can be made which would give a Navier-Stokes
equation for a fully developed flow as
∂τ
∂y=∂P
∂x(7)
In this scenario, the driving force is the Young-Laplace pressure which is the
pressure responsible for capillary flow. It is defined by the Young-Laplace equation
which quantifies the capillary pressure difference across an interface between two static
fluids, which in our case will be whole blood or plasma and air. The Young-Laplace
pressure is given by the equation:
PO = σ(1
R1
+1
R2
) (8)
where σ is the surface tension of blood and R1 and R2 are the radii of curvature of
the top and side walls of the channel respectively. These are the governing equations
for capillary flow in porous media.
1.5 Characterization of Fluid Flow through Porous Media
The flow of a fluid through a fully-wetted medium can be described with Darcy’s
Law. This equation was used to model flow through a bed of sand. This equation is
11
related the relation of electrical resistance in Ohm’s Law. This equation related to
laminar flow when the interstices of the pores are small and do not have any turbulent
flow. The pressure gradient of the flow is also directly proportional to the fluid velocity
and this is given in vector form as Darcy’s Law:
µU
k= −∇p (9)
where µ represents the viscosity of the fluid, U represents the average velocity of the
fluid, k represents the permeability of the fluid, and∇p represents the pressure gradient
of the fluid. The adaptation of this equation will be covered in the mathematical
modeling section of this document.
1.6 Review of Blood Fractionation Methods
Blood fractionation has been generally separated into two different techniques:
active methods of separation as well as passive methods. The accepted techniques for
the separation of red blood cells are generally membrane based blood fractionation
methods, but there has recently been significant advances in microfluidics based sepa-
ration systems(Toner and Irimia 2005). Interestingly enough, there have been several
paper microfluidics techniques that have been developed that combine microfluidic
aspects into a nitrocellulose membrane. However, there is no widely accepted method
for multiplexed detection of biomarkers from a small sample of blood. Figure 6 shows
the general methods of red blood cell fractionation, which includes passive in addition
to active methods.
Certain active methods seen in Fig. 6 such as magnetic activated cell sorting
(MACS), fluorescent activated cell sorting (FACS), and other optical methods are too
12
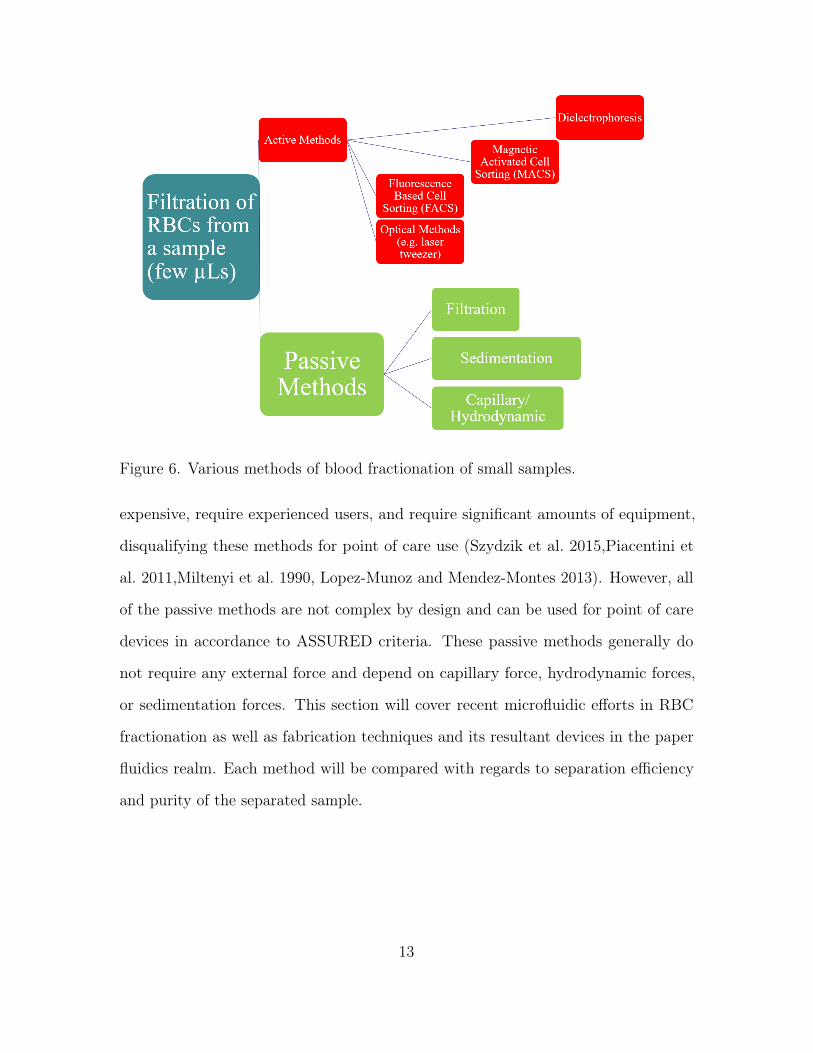
Figure 6. Various methods of blood fractionation of small samples.
expensive, require experienced users, and require significant amounts of equipment,
disqualifying these methods for point of care use (Szydzik et al. 2015,Piacentini et
al. 2011,Miltenyi et al. 1990, Lopez-Munoz and Mendez-Montes 2013). However, all
of the passive methods are not complex by design and can be used for point of care
devices in accordance to ASSURED criteria. These passive methods generally do
not require any external force and depend on capillary force, hydrodynamic forces,
or sedimentation forces. This section will cover recent microfluidic efforts in RBC
fractionation as well as fabrication techniques and its resultant devices in the paper
fluidics realm. Each method will be compared with regards to separation efficiency
and purity of the separated sample.
13

1.6.0.1 Membrane Filtration
Membrane filtration is the most common technique for the filtration of red blood
cells and relies on the size exclusion principle and capillary/hydrodynamic forces for
the separation of plasma. There are some off the shelf nitrocellulose and polysulfone
membranes which rely on this principle with varying degrees of success (Tageson
2013; Lam et al. 2017; VanDelinder and Groisman 2006). These membranes have a
three dimensional porous structure which allows for proteins, immune cells, and other
bio-markers to flow through while trapping the red blood cells in the pores of the
membrane. GE Whatman, Pall, Millipore, and I.W. Tremont all create membranes
which are specifically tailored for lateral flow and vertical flow assays. Some membranes
are also functionalized with an agglutinating chemistry which can be used for the
filtration of clotting factors in the lateral flow format. A significant factor that must
be considered in these membranes is the risk of hemolysis of the red blood cells due
to high pressures induced in a microfluidic system. Shear pressures must be kept to a
minimum and adding more fluid to a membrane which has been saturated can increase
the risk of hemolysis(Nilghaz and Shen 2015). As such, point of care assays have to be
carefully designed to accommodate for fluctuations in fluid delivery. Additional factors
that have to be considered include material type, thickness of the membrane, fluid
capacity, and the capillary flow rate. Table 1 provides a summary of the operating
specifications of the various commercial membranes which are specifically marketed
for the filtration of RBCs as seen in Table 1.
The majority of the filters seen in Table 1 are rated to handle 100 µL of whole
blood with minimal risk of hemolysis. Some of these filters are built with a polyester
or other hydrophobic backing, while other membranes come unprocessed and need to
14

Table 1. A comparison of various commercial membranes marketed for the filtrationof RBCs.Brand/Model Particle Retention (in µm) Material Type Thickness (in µm) Capillary Flow RateGE Whatman Fusion 5 2.3 Glass Microfiber w/ Organic Binder 370 38s/4cmGE Whatman MF1 1.5 Bound Glass Fiber 367 29.7s/4cmI.W. Tremont Grade D-23 4 Borosilicate Glass Microfiber 500 35s/4cmPall Vivid 170 Asymmetric (100-2 microns) Asymmetric polysulfone 330 150-225 sec/4cmMillipore Durapore SLVP 5 Polyvinylidene fluoride 125 N/A
be mounted on a surface with the use of a spray adhesive or the use of double sided
tape (Ghaderinezhad et al. 2017). Various fabricated paper microfluidic devices can be
seen in Fig. 1 (Yetisen, Akram, and Lowe 2013). Various fluidic structures have been
fabricated with the use of a wax screen printing methods (Lu et al. 2009). Techniques
that have been successfully used include wax dipping, printing of a hyrdophobic
ink using a phaser printer, µPADs cut with an automated cutter and a laminated
structure, and other designs designed using photolithography techniques used in the
semiconductor industry. Additional hybrid devices include a polydimethylsiloxane
patterned nitrocellulose device for the creation of microfluidic channel for the selective
filtration of RBCs.
As seen in Table 1, there are several materials that are used for the filtration of red
blood cells, which include glass fiber membranes and other polymeric materials such as
polysulfone. However, they all use the same premise of size exclusion but have slightly
different fluid characteristics. An example of this is the Pall Vivid membrane, which
employs an asymmetric membrane, which has pores which progressively decrease in
size from top to bottom of the membrane. The pores at the top side of the sheet are
about 100 microns and the pores gradually decrease to 2 microns on the bottom side
of the sheet. A cross sectional SEM image of a Pall Vivid asymmetric polysulfone
membrane can be seen in Fig. 7.
Most of these filters require a backing for proper packaging of the fluidic device.
In most instances, the use of a spray adhesive or double sided tape to a non-wicking
15

Figure 7. An SEM image of the Vivid Plasma Separation Membrane. Theasymmetric nature of the polysulfone membrane can be clearly seen in this crosssection.Courtesy of Pall Corporation
surface affects the flow characteristics of the membrane and the use of lamination to
keep the strip suspended is common practice with the use of paper microfluidics. To
direct fluid flow, there are a umber of surface modifications that have been attempted.
The majority of these functionalizations act as passive elements and selectively add
hydrophobicity to certain areas of the membrane. Membranes can also be used for
sedimentation which uses the effects of gravity a blood sample can be filtered with
minimal risk of biofouling.Cell sedimentation has also been used to separate red blood
cells from plasma. The majority of these devices use gravity sedimentation which
incorporates flow across of a porous medium (Crowley and Pizziconi 2005). By using
the effects of gravity, larger amounts of samples can be filtered with minimal risk of
biofouling. One particular work utilized gravity sedimentation to filter up to 1.5mL of
whole blood seen in Fig. ??(Galligana et al. 2015).
Liu et. al have proposed a superhydrophobic gravity aided blood fractionation
16

device which is capable of filtering up to 800µL of whole human blood (Liu et al. 2013;
Liu et al. 2016). A separation membrane was mounted with double sided tape and
within an hour the RBCs were seen to be fully separated from the plasma. The
absorbance spectra of the extracted plasma was comparable to a sample prepared via
standard centrifugation. As seen in Fig. 8, a clear interface between the separated
plasma and blood is apparent after 5 minutes with the sedimentation filter.
Figure 8. A setup which also uses gravity aided sedimentation to filter 800 µL ofhuman blood by using a super hydrophobic membrane (Liu et al. 2013; Liuet al. 2016).
17
1.6.0.2 Capillary and Hydrodynamic Separations
As mentioned in previous sections, capillary separations involve the use of capillary
forces to separate red blood cells from a sample. Capillary separations can be performed
with a minimal sample size with the use of minimal auxiliary equipment. he equipment
needed to carry out capillary separation is also minimal, lightweight and portable
which makes it a very attractive method of plasma separation to evaluate the condition
of soldiers in the midst of a war or people in places where medical services are scarce
which usually makes medical help unaffordable. The difference in viscosity between
red blood cells and plasma is what causes the capillary separation. Devices have been
fabricated with a conjunction of hydrophilic and hydrophobic surfaces to direct fluid
flow (Tripathi et al. 2016). In the majority of devices, channels are selected where a
section of the channel is completely hydrophobic, and this can allow the flow of less
viscous materials such as plasma while reducing the flow of red blood cells. In some
situations, the accumulating red blood cells can create a barrier to eliminate the flow
from other red blood cells.
For these devices the most important factor is the elimination of any additional
induced shear stresses as any additional force on the red blood cells can force them
to burst, which is a phenomenon known as hydrolysis. If the RBCs burst, then
hemoglobin and the contents of the cells are released into the plasma and may be a
confounding variable in ELISA assays and other colorimetric type diagnostic tests.
Therefore it is important to eliminate any additional hydrodynamic stress in the
system to ensure that the plasma/serum is pure throughout the entire detection assay
process. Pre-wetting membranes with buffers or the introduction of wicking pads into
a lateral flow assay may help to eliminate the incidence of this during an assay.
18
1.7 Experimental Overview
This thesis is split up into multiple chapters by each aspect that was developed
of the lateral flow assay. Chapter 2 covers the development of a blood fractionation
technique along with the characterization of the fluidic flow of each of these membranes.
This chapter culminates with an implementation of the blood separation membrane
in an actual lateral flow ELISA assay. Chapter 3 covers the progress made towards
the creation of valve actuation on a porous membrane and the characterization of the
fluidic control with the introduction of these valves. This includes the development
of a heated deposition method, chemical and fluidic characterization of each of the
valve materials, and the development of moulds for the development of alternative
deposition methods on a porous membrane. Chapter 4 covers progress made towards
modelling fluid flow in a porous media with a two pronged approach. Mathematical
models in addition to computational fluid dynamics models were created and verified
with experimentation. Lastly, Chapter 5 covers the development of two software
interfaces created to connect the lateral flow data acquisition program to a more user
friendly graphical user interface. This section covers application development for iOS
devices as well as the creation of a computer application in Visual Basic.
19
Chapter 2
BLOOD FRACTIONATION AND ASSAY IMPLEMENTATION
This chapter covers the efforts made towards the development of the blood frac-
tionation aspect of the lateral flow assay outlined in the first chapter. The initial
set of experiments covered a means of modeling fluid losses due to evaporation and
predicting these losses in various conditions. The second section covers the selection
and characterization of various blood filtration membranes by testing the overall
effective plasma filtration rate as well as a measurement of the baseline fluorescence of
each of the membranes that were to be characterized in these experiments . The last
section discusses the implementation of the optimal blood fractionation membrane in
an assay as well as initial results.
The objective of these sections is to find the overall effective rate of evaporation
of blood in a porous media in addition to measuring the effective rate of plasma
filtration for the blood fractionation membranes. The lateral flow assay is to be
deployed in India where the climate is usually humid and hot. Devices that are
designed for global health applications must be somewhat stable from fluctuations
from the external environment and humidity or the evaporation of the fluid measured
could have a significant effect on the overall accuracy of the detection assay. In
addition fluid flow characteristics are an important consideration as proper control
of flow will eliminate the majority of variations in the lateral flow assay when it
comes to mass transport. The initial set of experiments characterized the overall
auto fluorescence of the membranes under consideration as too much background
signal will decrease the overall signal to noise ratio (SNR) of the fluorescence based
20

reader. Afterwards the evaporation of blood was characterized in comparison to
mouse blood and K2 EDTA sheep blood. Afterwards the membrane evaporation
was characterized at various humidities and starting masses with the membranes
which exhibited minimal autofluorescence. The final section of this chapter covers the
selection of the optimal membrane and the implementation of the assay with blood
samples for Epstein-Barr Nuclear Antigen (EBNA) and Immunoglobulin G (IgG) in
the lateral flow configuration was performed with a whole blood sample.
2.1 Testing of Filtration Membranes
The performance of each of the membranes can be quantified with a number of
metrics such as autofluorescence (addition to background signal), flow characteristics
pre/post wetting, and overall capacity of the membrane. Pore size is also important
for membranes that will be used for the filtration of blood as mentioned in previous
sections.
Figure 9. A characterization of the autofluorescence of different types of polymericmembranes that are used in various parts of the lateral flow assay.
21

Strips of (GET DIMENSIONS FROM UWA) were cut with the use of a pro-
grammable shear cutter. Three different strips were cut and the autofluorescence
was measured at three different points of each of the membranes. Each strip was
mounted directly on a glass slide with the use of double sided tape and was inserted
into the fluorescence reader. More information about the fluorescence reader can be
seen in Chapter 1. A lower ramp time indicates more overall fluorescence and vice
versa. The widely used Whatman Ashless 40 Filter Paper was tested as a general
basis of comparison. Blood Filters that were characterized include the Pall Vivid
GR asymmetric polysulfone separator membrane, the GE Whatman LF1 glass fiber
membrane, and the GE Whatman MF1 glass fiber membrane. The GE Fusion 5
multipurpose nitrocellulose membrane, Pall Immunodyne, and the Millipore HF 75
nitrocellulose are high flow membranes and were considered for selection in the testing
section of the lateral flow assay.
As seen in Figure 9, The Pall Vivid GR membrane exhibited a high amount of
autofluorescence, due to its asymmetric polysulfone material. On the other hand,
the Whatman LF1/MF1 membranes had an autofluorescence that was comparable
to the glass slide reference samples in addition to the Fusion 5 membrane. However,
since the blood filters were to be placed upstream from the photodetector/LED setup,
autofluorescence of the membrane should have minimal effect on the SNR from the
reader.
2.1.1 Plasma Yield Experimental Setup
These lateral flow assays are meant to be run in the matter of about 10 minutes, so
the effects of evaporation were tested. In these experiments, strips were weighted and
22

placed in a scale (Denver Instruments, Colorado, USA) to get a baseline measurement.
Afterwards 50µL of mouse blood was dispensed on the strip and a tared measurement
was taken of the initial weight of the sample. The humidity and temperature of the
ambient environment was also recorded and the change in weight was recorded every
30 seconds for a period of 600 seconds. In this period of time, the fractionation of the
sample was observed and photographs were taken of the membranes in the beginning
and end of each trial.
There was significant hemolysis in the sample as seen in Fig. 10, which shows
successful fractionation of the plasma from the red blood cells. However, the light red
tinge in the separated plasma is indicative of hemolysis of the sample. To verify this,
the sample was centrifuged to separate the blood from the plasma and the plasma layer
had a slight red discoloration consistent with the samples that were tested. A 125µL
sample of nonhemolyzed K2 EDTA sheep blood was ordered (BioReclamation/BioIVT,
USA) and the meantime the majority of the experiments were completed with water
since the majority of the blood is composed of water. After the sheep blood arrived
the rate of evaporation of water was compared to that of blood to verify this result.
Another important consideration of the selection of the blood filtration membrane is
proper fluid retention of the sample. The average finger prick yields anywhere from 50
µL to 150 µL of blood and membranes which cannot retain this fluid were automatically
rejected from consideration. In Fig. 11, a Whatman MF1 membrane was cut to the
same width as the nitrocellulose test membrane and the blood sample overflowed from
the membrane. Since containment of the sample leads to the highest yield of the
sample, this type of membrane was automatically rejected from consideration since it
could not properly hold the minimum amount of fluid (50 µL) required for this lateral
flow configuration.
23
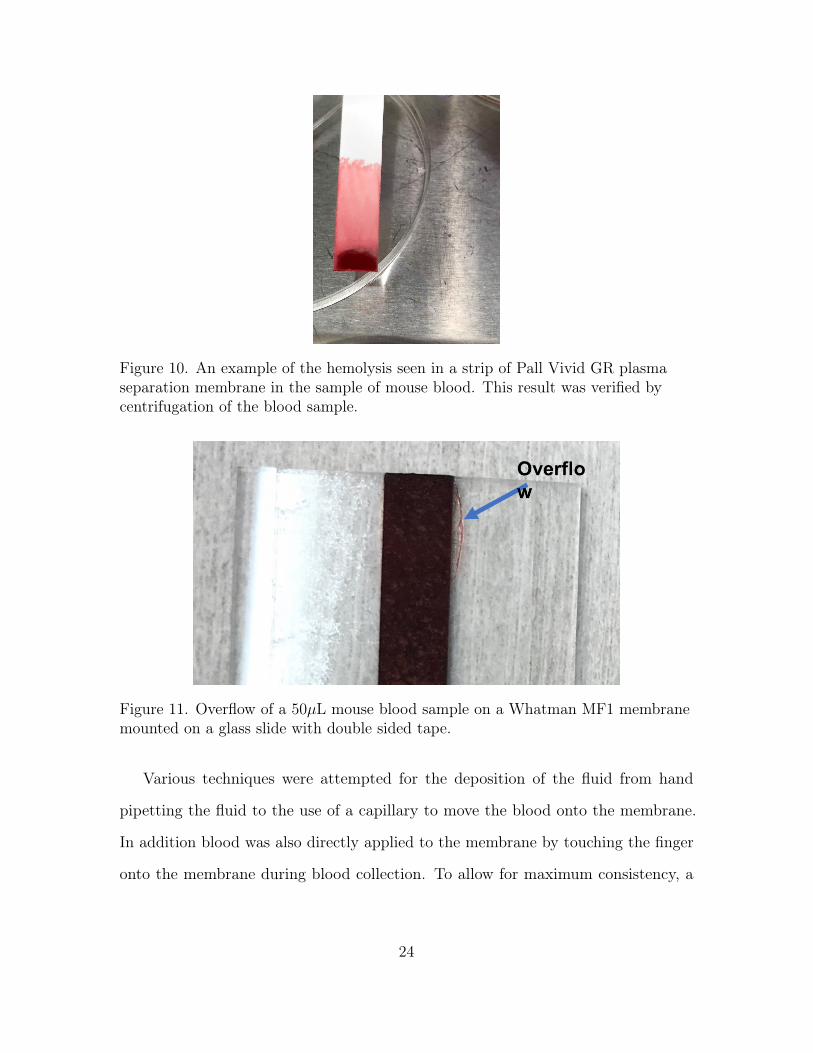
Figure 10. An example of the hemolysis seen in a strip of Pall Vivid GR plasmaseparation membrane in the sample of mouse blood. This result was verified bycentrifugation of the blood sample.
Figure 11. Overflow of a 50µL mouse blood sample on a Whatman MF1 membranemounted on a glass slide with double sided tape.
Various techniques were attempted for the deposition of the fluid from hand
pipetting the fluid to the use of a capillary to move the blood onto the membrane.
In addition blood was also directly applied to the membrane by touching the finger
onto the membrane during blood collection. To allow for maximum consistency, a
24

150µL heparin coated glass capillary was used in the remaining blood experiments.
Inconsistent application of the blood with the use of the finger touch method can be
seen in Fig. 12 on the Vivid GX membrane.
Figure 12. An example of inconsistent blood deposition on the Vivid Gx membranethat was done with the finger touch method. The plasma front is clearly seen, butthe wicking of the plasma occurs in multiple directions which introduces extravariability into the assay.
There were three final membranes which visually exhibited optimal filtration
characteristics in comparison to the other membranes, which were found to be the
Pall Vivid GR, Pall Vivid GX, and the GE Whatman LF1 membranes. To quantify
optimal percent yield of plasma a set of experiments was completed between the
three polymeric membranes. 5mm by 5mm square strips were cut from each of the
membranes and were placed directly on top of a 5mm by 30 mm Millipore membrane.
The Millipore HF75 membrane was weighed before each experiment. Afterwards, 20
µL of K2 EDTA sheep blood was pipetted on top of the filtration membrane. The
filtration membrane was allowed to filter the blood into plasma for 180 seconds and it
was removed after this period. The Millipore HF75 membrane was weighed afterwards
25

and this change in mass was converted to an estimated plasma yield, using a general
calculation of 1.025 g/ml. Three trials were completed in one sitting to eliminate any
variance due to humidity or temperature fluctuations. Figure 13 shows the setup of
these yield experiments.
Figure 13. A schematic of the experimental setup for the blood weighing experimentwhere the sample pad was placed on top of the nitrocellulose and the nitrocellulosewas weighed after 180 seconds.
As a point of reference, the Pall Vivid GX membrane is rated to recover at least
60% of the plasma in a sample and the Pall Vivid GR membrane is rated to recover at
least 80% of the plasma in the sample. There is no published data on the plasma yield
of the GE Whatman LF1 glass bound fiber membrane. It is also important to note
that both the Vivid GX/GR membranes are asymmetric and they must be placed
in a certain orientation for optimal results. The ’shiny’ side of the membrane is the
more porous side of the membrane so it must be placed face up. The GE Whatman
LF1 membrane does not exhibit any asymmetry and is not orientation specific.
To find this percent recovery metric for each of the membranes, the amount of K2
EDTA blood that was pipetted (20µL) was converted to a weight with the use of a
26

standard density of blood (1.014 g/mL) and the weight of the plasma captured in the
second membrane was used and compared to the original mass. This conversion was
converted to percentage and three of each sample was completed to find out if there
is any variance that is needed to be accounted for with regards to the efficiency of
each membrane in addition to the calculation of the standard deviation and variance
of each of the membranes. In addition all of the experiments were completed in two
days with similar humidity rates (25-27% effective humidity) to equalize between the
evaporation rates of the blood and plasma over time. The humidity, temperature, and
barometric pressure was measured with the use of an ST Microelectronics IoT Tile and
the sensor was allowed to rest for at least five minutes before any measurements were
taken. In addition the scale was calibrated before every daily set of experimental runs
to ensure consistency between days of experimentation. The results of this experiment
can be seen in Fig. 14.
Figure 14. The results of the plasma recovery experiment created to characterize ineach of the plasma membranes.
27

As seen in Fig. 14, the Vivid Plasma GR membrane filtered close to 40% of the
plasma from the sample of whole blood. Since blood is roughly 55 percent plasma
by volume, about 75% of the plasma was filtered through the membrane into the
secondary capture sheet. There was significant variance in a couple of the samples,
and all of the potential outliers were much lower than the other points and this is due
to the fact that one or two of the samples were left out for an extended period of time,
which could relate to fluid losses due to evaporation. Improvements to this experiment
involve taking the measurement of the plasma instantly after the fractionation step is
complete. In addition, pre-wetting the membrane and compensating for volumetric
addition of the fluid would help to purge any plasma that was stuck in the pores of
the membrane. In addition more runs should have been conducted to decrease the
range of the error bars or the standard deviation of each of the groups. Overall the
Vivid Plasma GR polysulfone membrane exhibited the best filtration characteristics
and was used in the following sections in this chapter.
2.1.2 Evaporation and Fluid Retention Experiments
The Vivid GR asymmetric polysulfone membrane was selected as the blood filter
since it resulted in the highest yield of plasma in comparison to the other two
membranes (Pall Vivid GX and Whatman MF1). However, a noticeable issue in
the field of assays in paper microfluidics is the evaporation of fluids for assays which
take a longer time. The first experiment aimed to compare the evaporation rate of
water to that of blood to see if there was any significant differences in their respective
evaporation rates. This process was completed by measuring the change in weight of
each of the membranes over a period of 600 seconds. In these series of experiments,
28
temperature, humidity, and barometric pressure were all measured with the use of the
ST Microelectronics IoT tile and the strips were pre-weighed as well.
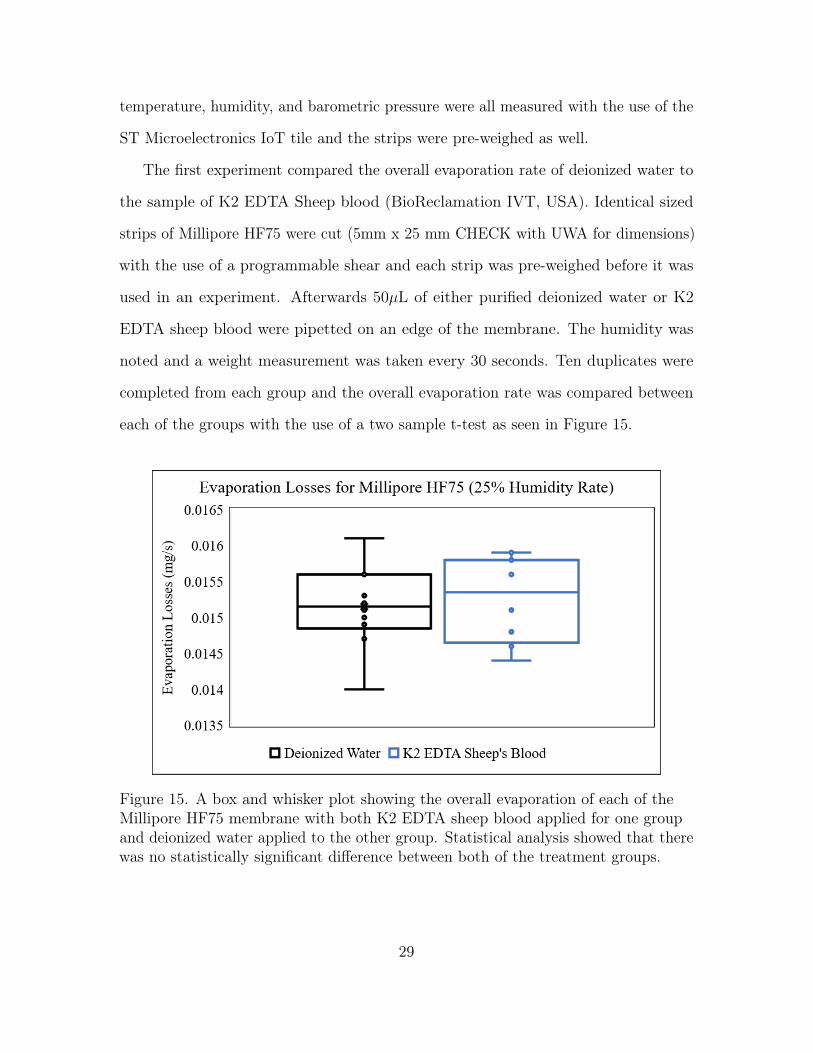
The first experiment compared the overall evaporation rate of deionized water to
the sample of K2 EDTA Sheep blood (BioReclamation IVT, USA). Identical sized
strips of Millipore HF75 were cut (5mm x 25 mm CHECK with UWA for dimensions)
with the use of a programmable shear and each strip was pre-weighed before it was
used in an experiment. Afterwards 50µL of either purified deionized water or K2
EDTA sheep blood were pipetted on an edge of the membrane. The humidity was
noted and a weight measurement was taken every 30 seconds. Ten duplicates were
completed from each group and the overall evaporation rate was compared between
each of the groups with the use of a two sample t-test as seen in Figure 15.
Figure 15. A box and whisker plot showing the overall evaporation of each of theMillipore HF75 membrane with both K2 EDTA sheep blood applied for one groupand deionized water applied to the other group. Statistical analysis showed that therewas no statistically significant difference between both of the treatment groups.
29

Each of the groups had roughly the same mean and variance and a two sample
t-test resulted in a t statistic of 0.71 which is not significant and results in a failure to
accept the null hypothesis. This means that the evaporation of water and blood is
essentially similar and can be equivalent for further experimentation. This experiment
was completed since there were significant hemolysis and agglutination issues with
the blood samples which increased with storage time and deionized water can be used
as a consistent means of measuring the evaporation rate of the fluid in porous media.
The characterization of the evaporation rate of the Millipore HF75 was done on
two separate occasions, one day with a higher humidity rate and another day where
the humidity day was average for Arizona standards. The same procedure was followed
where the strips were preweighed and the initial ambient environmental conditions
were recorded with the use of the ST Microelectronics IoT Sensor Tile. The initial
weight measurement was taken and the weight was recorded every 30 seconds for a
period of 600 seconds. For each of the days three different amounts of fluid (50µL,
100µL, and 150µL) were used and hand pipetted on an edge of the membrane. The
fluid loss results can be seen in Fig. 16.
The fluid losses in the low humidity condition (24% relative humidity) can be seen
to be fairly linear across all of the fluid amounts (50µL, 100µL, and 150µL). This
allows for a correction to be applied with the use of an algorithm. The second high
humidity experiment (43% relative humidity) shows similar results with a linear rate
of fluid loss across all fluid amounts as seen in Fig. 17.
The last experiment of the evaporation fluid loss series of experiments covered
the fluid losses of the asymmetric polysulfone membranes (Pall Vivid GX/GR).
Both membranes are rated to filter blood to plasma in less than 120 seconds and
30

Figure 16. The results of the low humidity evaporation rate experiment for theMillipore HF75 membrane. The evaporation seems to be linear at all of the fluidamounts (50µL, 100µL, and 150µL), which means that a correction can be applied tocompensate for fluid losses.
characterizing the fluid losses during this period could also help with the selection of a
membrane. About 100µL of mouse blood was introduced to the Vivid GR membrane
and about 50µL of mouse blood was added to the Vivid GX membrane. Both of these
trials were completed in the same day to account for any fluctuations in temperature
and humidity. In this setup a Millipore HF75 membrane was placed directly under
the fractionation membrane. 5mm by 5mm squares of each of the membranes were
cut with the use of a laser cutter (Universal Systems, Scottsdale, USA) and were
mounted directly on top of one side of the Millipore HF75 membrane. As per the usual
protocol, weight measurements of the strips with the blood separation membrane were
taken before every run. Measurements were taken every 30 seconds for a period of
600 seconds as well. The results of this experiment are seen in Figure 18.
31
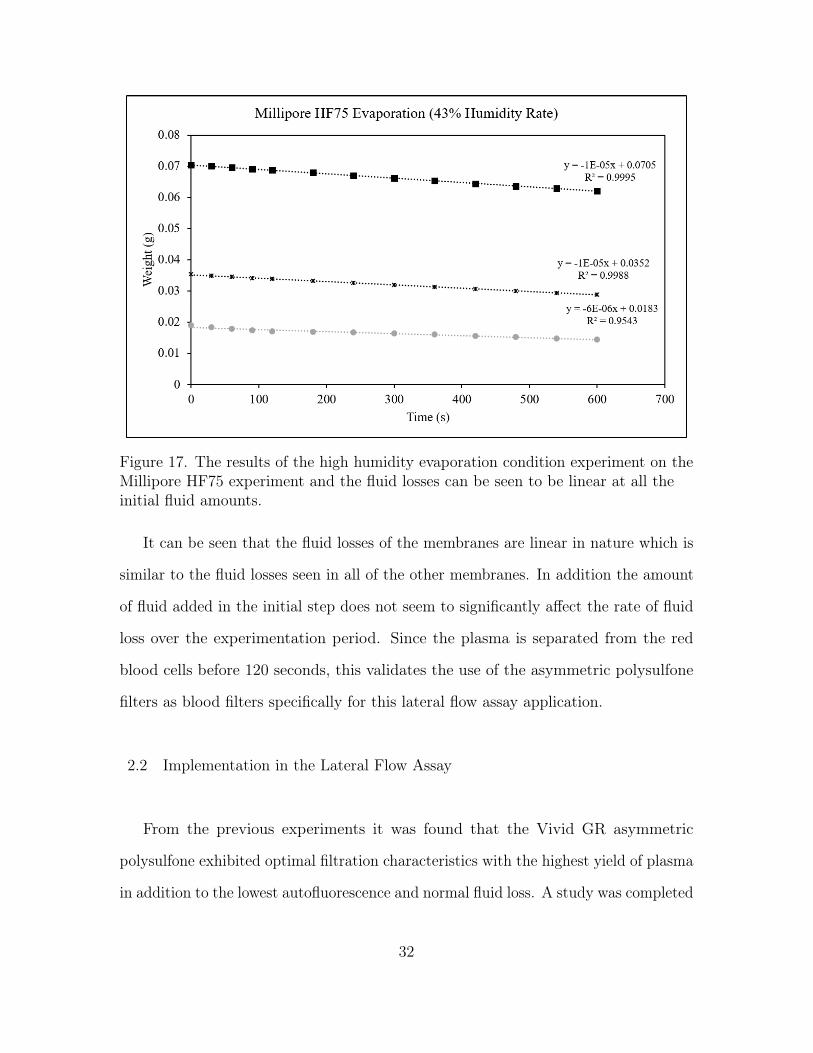
Figure 17. The results of the high humidity evaporation condition experiment on theMillipore HF75 experiment and the fluid losses can be seen to be linear at all theinitial fluid amounts.
It can be seen that the fluid losses of the membranes are linear in nature which is
similar to the fluid losses seen in all of the other membranes. In addition the amount
of fluid added in the initial step does not seem to significantly affect the rate of fluid
loss over the experimentation period. Since the plasma is separated from the red
blood cells before 120 seconds, this validates the use of the asymmetric polysulfone
filters as blood filters specifically for this lateral flow assay application.
2.2 Implementation in the Lateral Flow Assay
From the previous experiments it was found that the Vivid GR asymmetric
polysulfone exhibited optimal filtration characteristics with the highest yield of plasma
in addition to the lowest autofluorescence and normal fluid loss. A study was completed
32
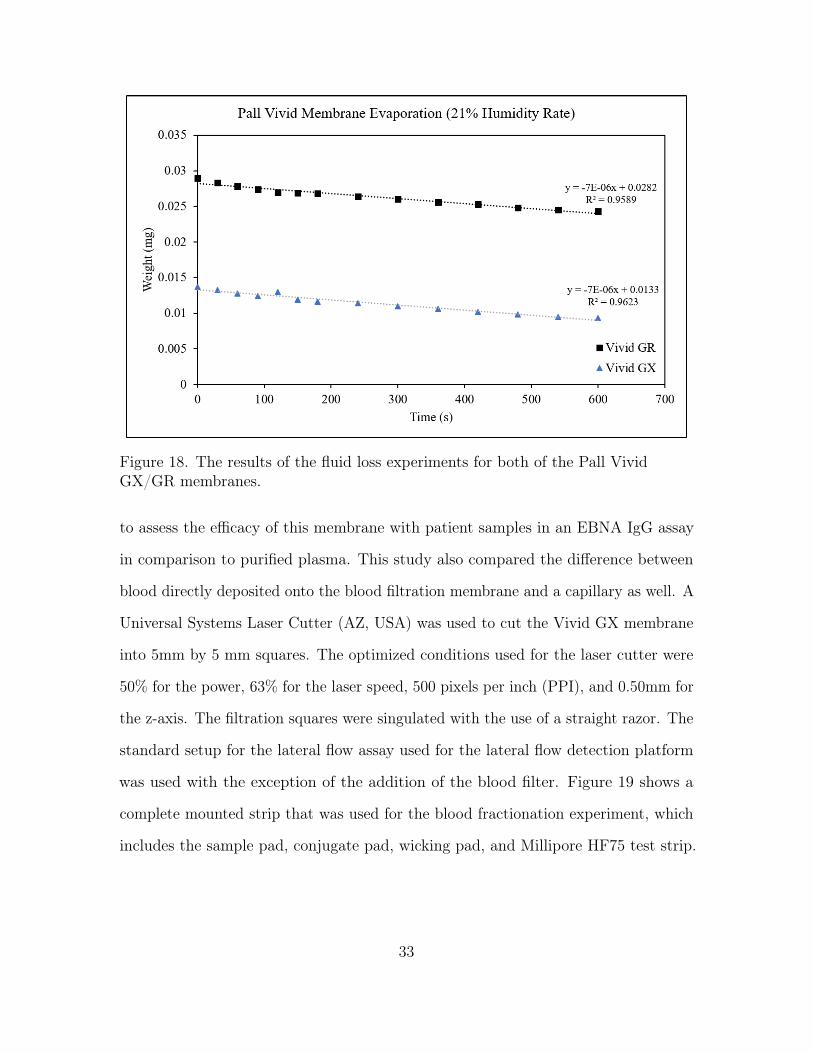
Figure 18. The results of the fluid loss experiments for both of the Pall VividGX/GR membranes.
to assess the efficacy of this membrane with patient samples in an EBNA IgG assay
in comparison to purified plasma. This study also compared the difference between
blood directly deposited onto the blood filtration membrane and a capillary as well. A
Universal Systems Laser Cutter (AZ, USA) was used to cut the Vivid GX membrane
into 5mm by 5 mm squares. The optimized conditions used for the laser cutter were
50% for the power, 63% for the laser speed, 500 pixels per inch (PPI), and 0.50mm for
the z-axis. The filtration squares were singulated with the use of a straight razor. The
standard setup for the lateral flow assay used for the lateral flow detection platform
was used with the exception of the addition of the blood filter. Figure 19 shows a
complete mounted strip that was used for the blood fractionation experiment, which
includes the sample pad, conjugate pad, wicking pad, and Millipore HF75 test strip.
33

These components were mounted on a standard glass slide with the use of double-sided
adhesive tape.
Figure 19. A test strip that was prepared for the lateral flow blood fractionation tests.
The standard protocol for the fluorescence based assay was used for IgG, BSA, and
EBNA for both sets of samples that were tested. These protein concentrations were
tested at 114 µg/mL, with the protein printer parameters set at 3V and 0.2 mL/min
and two passes. All of the strips were mounted with the use of an adhesive backing
and the dimensions of the sample pad was 23 mm by 5 mm and the dimensions of
the wicking pad was 18 mm x 5 mm. All of the strips were pre-wet with 100 µL of
PBST and there were three strips or duplicates tested for each of the conditions. As
per usual, the test membrane (Millipore HF75) has a backing plate mounted to it to
34
direct fluid flow across the membrane. About 10µL of capillary blood was used and
there were two conditions that were used for the blood that was spun to separate it
from the red blood cells at two different concentrations (1:10 of 1:50 dilution of a 30
µL pooled plasma sample). Afterwards 50 µL of PBST was used to wash the strips.
60µL of 2:1 diluted Millipore F1-Y050 functionalized microspheres were incubated
in each sample for a period of 20 minutes. Finally 50 µL of PBST was used to wash
away the unconjugated microspheres from the test area.
To collect the blood a 20 gauge diabetic lancer was used to collect a sufficient
amount of sample. The first drop that was collected was wiped away and light pressure
was applied on the finger to allow the blood to flow out of the collection site. The
methods tested included the use of an 80 µL heparinized glass capillary or the use
of a manual finger touch method to see if there was any variation in results between
blood application techniques. Both techniques were tested for both samples that were
collected from patients D1 and D2. The fluorescent signal was recorded with the use
of the lateral flow detection platform mentioned in the previous section. As per usual,
a higher bar or ramp time equals a lower fluorescent signal.
Figure 20 shows a test strip with 10 µL of capillary blood that was tested in this
experiment. It can be seen that there is a small amount of red blood cells that have
passed through the filter into the sample pad. This could be due to a lack of a solid
connection between the blood filter and the sample pad or it could also be due to
the fact that the blood filter was too small for the amount of blood that was applied
(the filter became over saturated and the blood was forced to flow around the filter
straight into the sample pad). In the next iteration of these experiments, a larger
sized blood filter will be used and techniques to immobilize the filter onto the sample
pad will be researched. Figure 21 shows the difference in signal acquired by using the
35

Figure 20. A test strip with 10µL of blood that was tested in this experiment.
finger touch and capillary methods in the first donor (D1). The results seemed to be
fairly consistent across the capillary and finger touch methods with the exception of
Slide A. The other samples were consistent across both the capillary and the finger
touch method.
Figure 22 compares the results between the capillary deposition method and the
finger touch method for the second donor. It can be seen that there are no significant
difference between both of the methods, but Slide A seems to have a lower fluorescent
signal in the capillary technique test in comparison to the finger touch method. This
could be due to inconsistent application of the blood onto the membrane or due to
other factors. However, there was not too much variation to warrant the testing of
36

Figure 21. A comparison of all of the samples with various methods (finger touch,and capillary) for two patient samples (solid, striped lines).
more samples. However, in some of the finger touch samples, the blood filter was
moved when it was touched which could add extra variance to the results of the assay.
Figure 22. A comparison of finger touch blood and capillary deposited blood for threesamples with measurements for concentration of BSA, IgG, and EBNA for sample D2.
37

Figure 23 compares concentrations of EBNA and IgG to various dilutions of the
pooled sample of plasma. This served as a point of reference for the comparison of
the patient samples which were applied with the different finger touch and capillary
methods. It can be seen that Slide B did experience some deviations but there were
no notable significant differences in the sample. This allows for this set to be used
as a comparison to the other sets of data and these samples will be averaged and
error bars will be added which rely on the overall standard deviation of the sample.
Overall of the other slides were consistently withing 10% of each other, which is a
good point of reference to the other samples since this takes into account a pooled
sample of blood plasma of many individuals.
Figure 23. A comparison of the concentrations of EBNA and IgG to various dilutionsof the pooled plasma samples. It can be seen that slide B in the 1:50 dilution of thepooled sample was slightly higher than the 1:10 sample, but this could be due to anumber of different factors. Overall of the other slides were consistently withing 10%of each other, which is a good point of reference to the other samples.
Figures 24 and 25 show the compiled results of all three samples from each
group along with an addition of error bars which include standard deviation. It is
surprisingly seen that the capillary method for the first patient D1 had larger error
38

bars in comparison to the finger touch method, but this could be due to a number
of factors which could be related to issues related to the collection of blood samples
with the use of the glass capillaries or the fact that the capillaries were close to their
expiration date and that the heparinization might have been affected over this period
of time. On the other hand, there was minimal variance in the results from the second
patient (D2) as IgG, BSA, and EBNA were similar for the finger touch method, the
capillary, and the pooled blood sample. To be sure of this result and that there is
no statistical significance or variations between the group, more samples have to be
tested and more patients should be tested as well. As for the head to head comparison
between the donors and the pooled samples, there seems to be a number of variations
seen in the figure. The donor samples seem to have no correlation with the donor
samples as they are different in both the EBNA and IgG results. However, the error
bars were quite significant in these results so further testing has to be done to ensure
that results are significant.
Figure 24. A comparison of results between the different types of application methods(finger touch, heparinized capillary, and a pooled blood plasma sample for bothdonors. There seems to be no significant variance in the results for patient D2, butthere were some variations that were noticeable in the first sample.
39
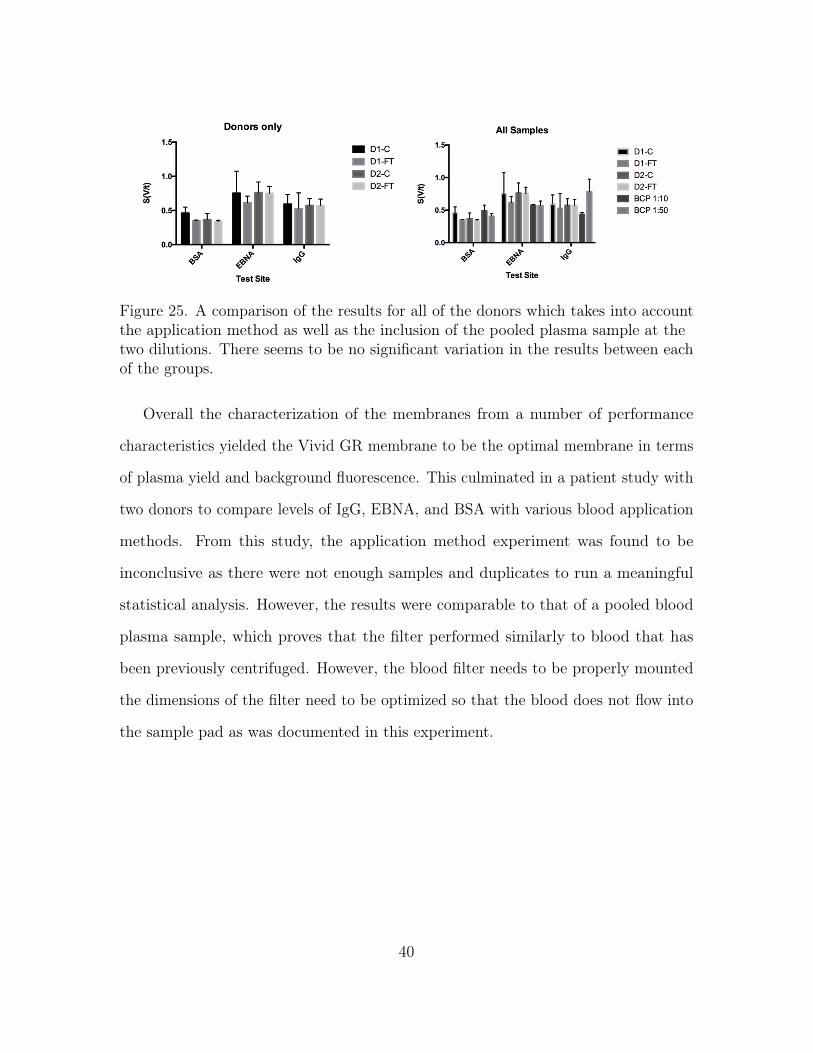
Figure 25. A comparison of the results for all of the donors which takes into accountthe application method as well as the inclusion of the pooled plasma sample at thetwo dilutions. There seems to be no significant variation in the results between eachof the groups.
Overall the characterization of the membranes from a number of performance
characteristics yielded the Vivid GR membrane to be the optimal membrane in terms
of plasma yield and background fluorescence. This culminated in a patient study with
two donors to compare levels of IgG, EBNA, and BSA with various blood application
methods. From this study, the application method experiment was found to be
inconclusive as there were not enough samples and duplicates to run a meaningful
statistical analysis. However, the results were comparable to that of a pooled blood
plasma sample, which proves that the filter performed similarly to blood that has
been previously centrifuged. However, the blood filter needs to be properly mounted
the dimensions of the filter need to be optimized so that the blood does not flow into
the sample pad as was documented in this experiment.
40

Chapter 3
VALVE ACTUATION AND FLUIDIC CONTROL
3.1 Introduction
This chapter covers efforts made towards fluidic control and actuation with a
paper porous substrate. The initial section covers efforts made towards the design
and validation of a PID controller for controlled dispensing of valves and the requisite
validation of the system with various heating elements. The second section covers
efforts made in the fabrication of wax valves and actuation of these valves with regards
to a diagnostic assay and the last section covers the fabrication of a novel sublimating
valve that is made out of naphthalene and a demonstration of fluidic control in the
system.
3.2 Design and Validation of PID Controller
Two iterations of the PID were created for the heated printing platform. The first
iteration of the PID controller included a PX4 controller (Fuji Industries, Japan), a
silicone heating pad (McMaster-Carr, USA), a type J stick-on thermocouple (McMaster-
Carr, USA) and a 10A relay as seen in Fig 27. The entire setup was designed to plug
into a 120V AC plug and inserted in a plastic box as seen in Fig. 26.
The relay was not enough to supply the heater and the initial heating pad that
was purchased was rated for a 24V supply. Therefore, the system in its initial state
would only work with an additional power supply to power the heating pad. Therefore
41

Figure 26. An example setup of the PID controller with the thermocouple placeddirectly on top of the heating surface.
a second iteration of the PID controller was created to accommodate a 2’ heating cord
(BriskHeat, USA) which allows for a 120 V supply. This second iteration included a
40A solid state relay (Inkbird, USA) and a heat sink in the same plastic enclosure.
The second iteration of the PID controller was designed to be a standalone system,
with all high voltage components placed inside the box. A plug on the exterior of the
box would allow for the control of two heating sources if the need arises.
To calibrate the PID controller, open loop tuning was performed where the system
is programmed to reach a steady state temp and power is steadily increased. This
following governing equation was used to determine the operating parameters of the
PID controller:
42

G(s) =K · e−tds
τ ∗ s+ 1(1)
where G(s) represents the response of the PID controller, K represents the gain
of the PID controller, td represents the dead time, or the time between the changing
output and a response, and τ represents the time constant of the system (1/1− e).
Figure 27. The schematic of the first iteration of the PID controller which includes a120V AC input, a PID controller, a 10A relay, a heating pad, and a separate 24Vpower supply to heat the silicone heating blanket.
The second iteration of the PID controller schematic can be seen in 28. The PID
controller was connected to a 40A solid state relay in addition to a power plug which
connects to the Briskheat heating cord. Tuning of this system was burdensome since
the SSR was designed to work with higher wattage heaters. The Briskheat heating
cord was designed to work with lower amperage and there was no voltage reaching
the input of the SSR. The light of the SSR was not operational as well in all of
the situations even though the thermocouple was measuring a temperature that was
lower than the set point programmed into the PID controller. Troubleshooting of this
43
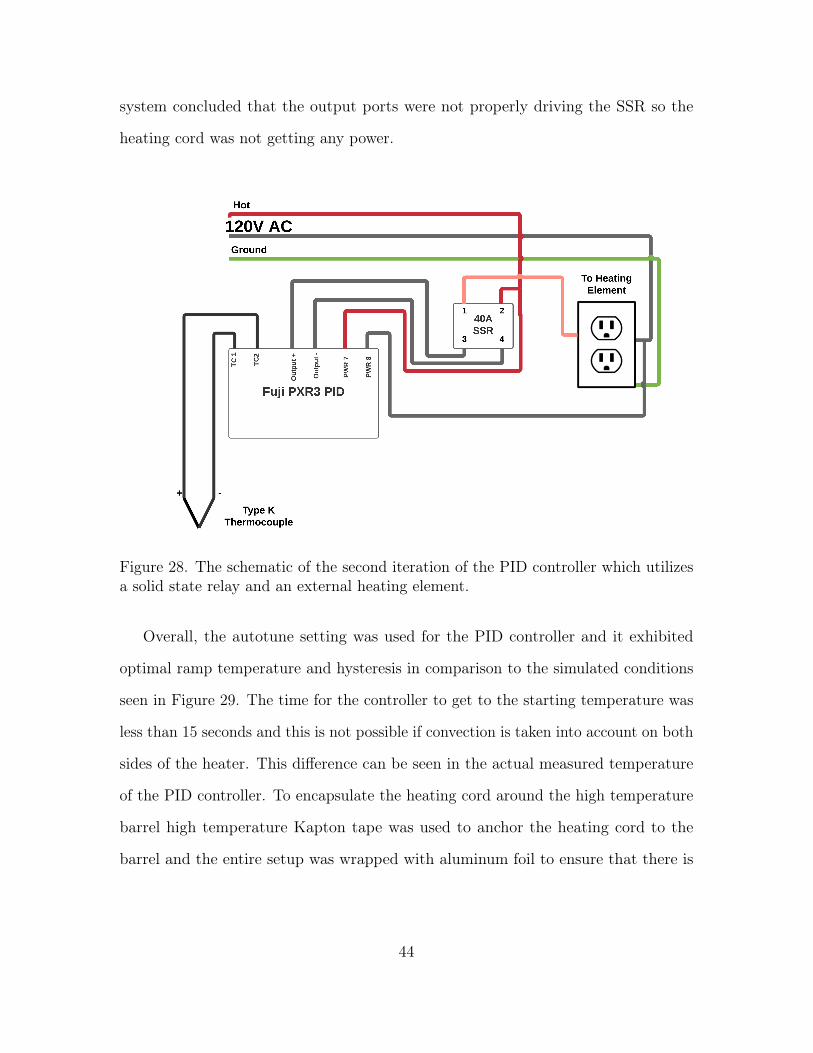
system concluded that the output ports were not properly driving the SSR so the
heating cord was not getting any power.
Figure 28. The schematic of the second iteration of the PID controller which utilizesa solid state relay and an external heating element.
Overall, the autotune setting was used for the PID controller and it exhibited
optimal ramp temperature and hysteresis in comparison to the simulated conditions
seen in Figure 29. The time for the controller to get to the starting temperature was
less than 15 seconds and this is not possible if convection is taken into account on both
sides of the heater. This difference can be seen in the actual measured temperature
of the PID controller. To encapsulate the heating cord around the high temperature
barrel high temperature Kapton tape was used to anchor the heating cord to the
barrel and the entire setup was wrapped with aluminum foil to ensure that there is
44
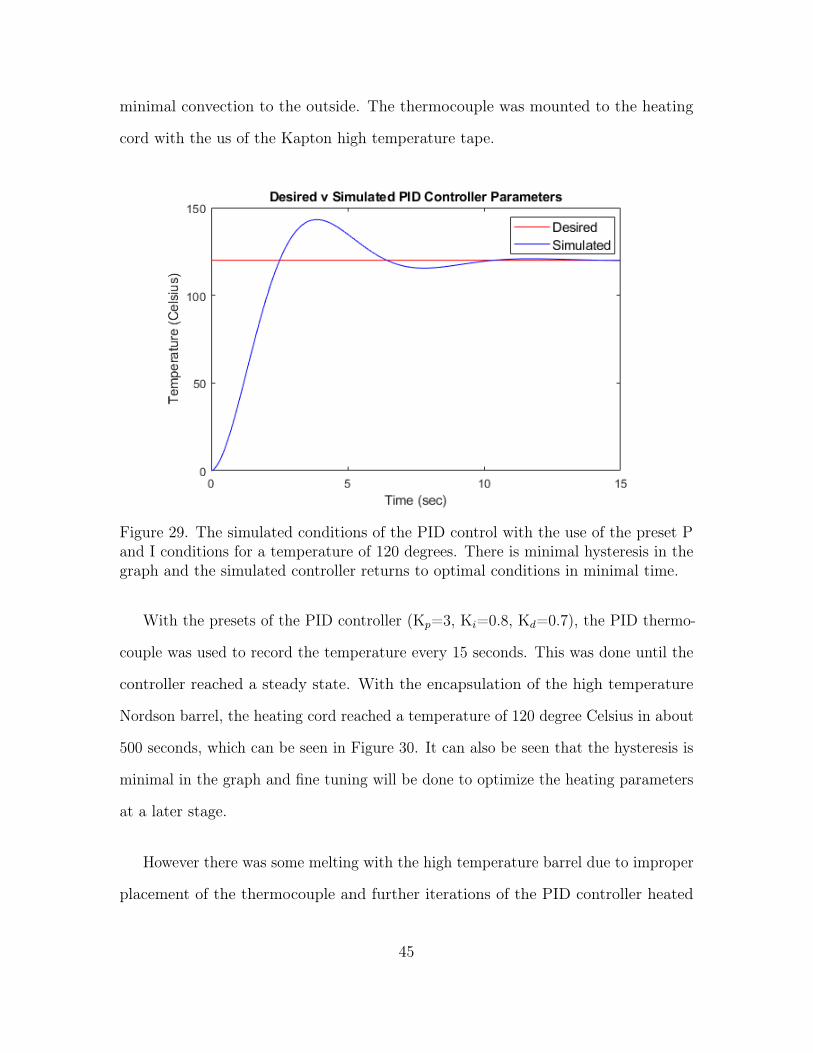
minimal convection to the outside. The thermocouple was mounted to the heating
cord with the us of the Kapton high temperature tape.
Figure 29. The simulated conditions of the PID control with the use of the preset Pand I conditions for a temperature of 120 degrees. There is minimal hysteresis in thegraph and the simulated controller returns to optimal conditions in minimal time.
With the presets of the PID controller (Kp=3, Ki=0.8, Kd=0.7), the PID thermo-
couple was used to record the temperature every 15 seconds. This was done until the
controller reached a steady state. With the encapsulation of the high temperature
Nordson barrel, the heating cord reached a temperature of 120 degree Celsius in about
500 seconds, which can be seen in Figure 30. It can also be seen that the hysteresis is
minimal in the graph and fine tuning will be done to optimize the heating parameters
at a later stage.
However there was some melting with the high temperature barrel due to improper
placement of the thermocouple and further iterations of the PID controller heated
45

Figure 30. The simulated conditions of the PID control with the use of the preset Pand I conditions for a temperature of 120 degrees. There is minimal hysteresis in thegraph and the heating cord reached the operating temperature in about 500 seconds.The stock presets of the PID controller were Kp=3, Ki=0.8, Kd=0.7. Fine tuning willbe done at a further time.
dispensing setup will be performed to eliminate this incidence. The PID controller
was used for the precision dispensing of the wax valves and the sublimating valves in
the following section and these materials were characterized in these sections as well.
3.3 Wax Valves
Wax valves have been extensively covered in the literature to direct fluid flow into
certain areas of a microfluidic channel. To block the flow of the fluidic channel heat is
applied onto the wax membrane to melt it and force the blockage of the flow. Wax is
innately hydrophobic and can effectively prevent flow in the channel. This is usually
used as a one-time actuation system and it is difficult to completely remove the wax
46

Table 2. The 23 factorial design for the set of wax experiments to test the effect ofautofluorescence.
Factor Low Factor (-1) High Factor (+1)A: Type of Wax Used Ozokerite Wax Soybean WaxB: Temperature of Heating 125 C 155 CC: Dipping Technique 1s (1x) 1s (2x)
from the membrane once it is immobilized into the pores of the substrate. In addition
wax is an organic material and research into the fluorescent properties of wax will
be completed into the following sections. In addition the inverse of the wax valves
(sublimating materials) will be covered in this chapter as well.
3.3.1 Autofluorescence of Wax
Since the entire system is built to work in conjunction with a quantitative fluores-
cence based platform, the addition of valves would ideally not induce any additional
fluorescence effects in the assay. As such, it was important to measure the background
fluorescence of the various types of waxes and dipping techniques. A 23 factorial test
was performed to find these effects and the fluorescence was measured with the reader.
A run chart was created to show the factors for each of the eight runs and this is
seen in Table 3 which displays the eight runs in addition to the interactions between
each of the factors, which is also known as an Analysis of Goods Table (ANOG). This
includes the interactions between all possible combinations of two factors and the
individual factors as well. Three duplicates were completed of each run and each
duplicate was taken as an average of three points on each membrane. GE Whatman
MF1 glass fiber woven membrane was used for these sets of experiments. In Table
47

Table 3. The 23 factorial run chart for the set of wax experiments to test the effectsof autofluorescence which includes the interactions between each of the factors.
Run A B C A*B A*C B*C A*B*C1 - - - + + + -2 + - - - - + +3 - + - - + - +4 + + - + - - -5 - - + + - - +6 + - + - + - -7 - + + - - + -8 + + + + + + +
3, a plus symbol indicates an application of the factor and vise versa for the minus
symbol.
By collecting the average values generated from the ANOG table in the previous
section, a Geoplot was created which compares the effect of the interaction of factors
on the autofluorescent signal collected from the reader. Since there were three factors,
a cubical Geoplot was created to take into account the two levels for each of the three
factors in this problem. The Geoplot which contains the average values for all of the
8 runs can be seen in the figure below.
To consistently coat the surface of the membrane a dipping setup was used similar
to the one seen in Chapter 1. A 3D printed mold was created for this dipping technique
as seen in Figures 31 and 32 to be affixed between two magnets on either side. The
membrane was mounted onto a glass slide and the entire fixture was dipped into a
fixture of melted wax. the parameters of the dipping can also be seen in the factorial
chart. The fixture was removed before the wax solidified and the membranes were
baked for ten minutes in an oven.
There were noticeable wax residues on the molds and this was removed with
48

Figure 31. A CAD model of the wax dipping piece to create clearly defined channelsin the membrane.
isopropyl alcohol and compressed air. In addition, the membranes were removed
immediately from the fixtures as it was seen that if the wax was left to solidify for
extended periods of time then the membrane was at risk of tearing and this happened
in several instances. Any additional residues were also removed from the membrane
with the use of a razor. To take the three measurements of the membrane, the reader
was used to read the signal when it was fully in and the membrane was ejected in
increments of 2 cm for the duplicate measurements for each run. This was repeated
for each of the trials in similar conditions to ensure consistency across all of the runs.
The runs used a variable combination of waxes (ozokerite wax and soybean wax),
different melting temperatures, and number of dipping steps to find if there was any
significant difference in the fluorescent emissions of each strip. As seen in Figure 33,
49
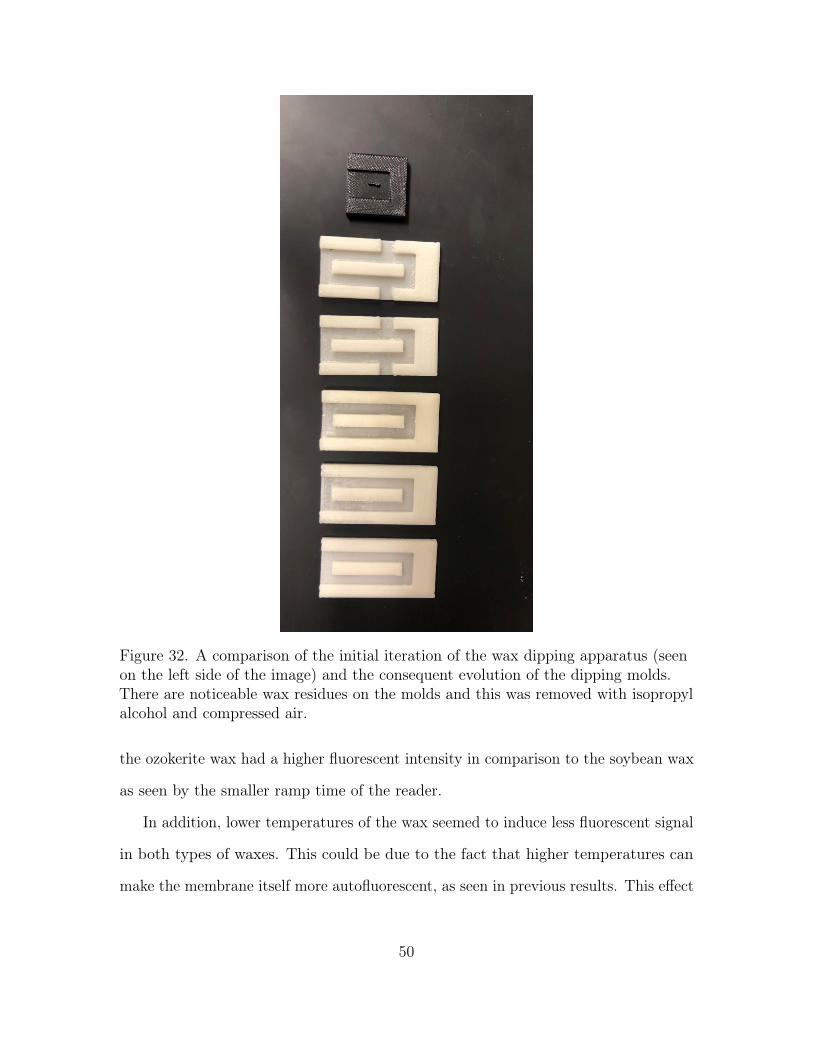
Figure 32. A comparison of the initial iteration of the wax dipping apparatus (seenon the left side of the image) and the consequent evolution of the dipping molds.There are noticeable wax residues on the molds and this was removed with isopropylalcohol and compressed air.
the ozokerite wax had a higher fluorescent intensity in comparison to the soybean wax
as seen by the smaller ramp time of the reader.
In addition, lower temperatures of the wax seemed to induce less fluorescent signal
in both types of waxes. This could be due to the fact that higher temperatures can
make the membrane itself more autofluorescent, as seen in previous results. This effect
50
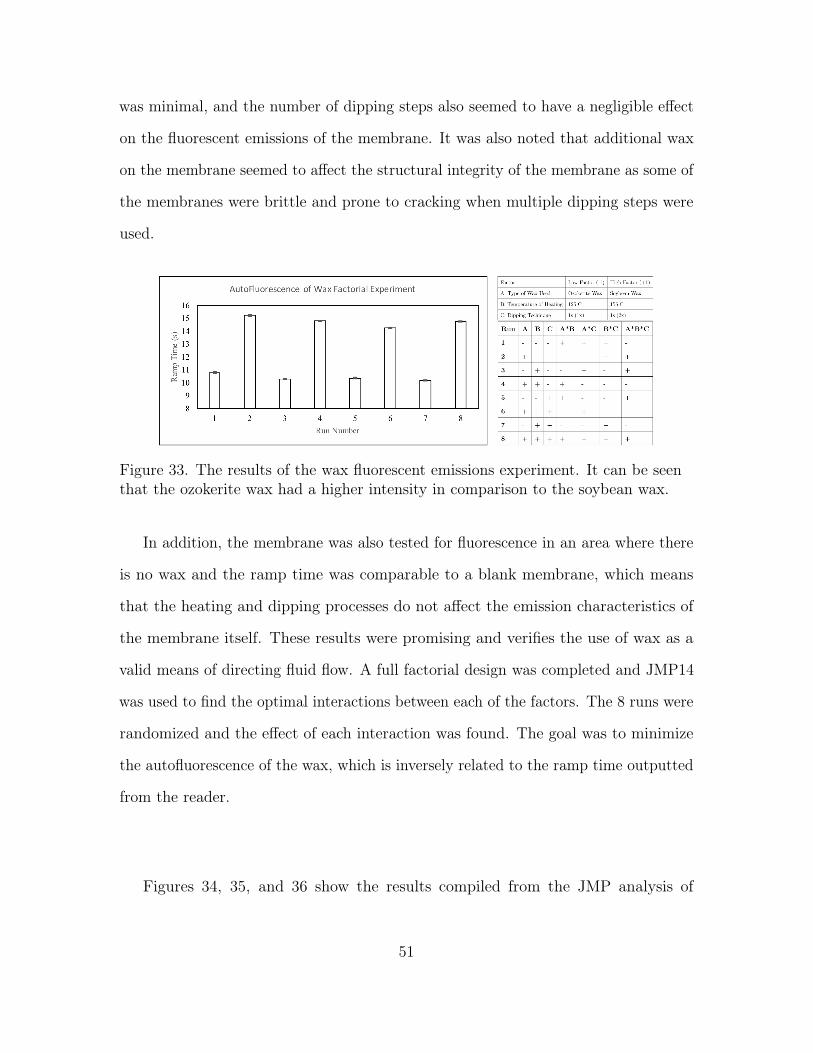
was minimal, and the number of dipping steps also seemed to have a negligible effect
on the fluorescent emissions of the membrane. It was also noted that additional wax
on the membrane seemed to affect the structural integrity of the membrane as some of
the membranes were brittle and prone to cracking when multiple dipping steps were
used.
Figure 33. The results of the wax fluorescent emissions experiment. It can be seenthat the ozokerite wax had a higher intensity in comparison to the soybean wax.
In addition, the membrane was also tested for fluorescence in an area where there
is no wax and the ramp time was comparable to a blank membrane, which means
that the heating and dipping processes do not affect the emission characteristics of
the membrane itself. These results were promising and verifies the use of wax as a
valid means of directing fluid flow. A full factorial design was completed and JMP14
was used to find the optimal interactions between each of the factors. The 8 runs were
randomized and the effect of each interaction was found. The goal was to minimize
the autofluorescence of the wax, which is inversely related to the ramp time outputted
from the reader.
Figures 34, 35, and 36 show the results compiled from the JMP analysis of
51
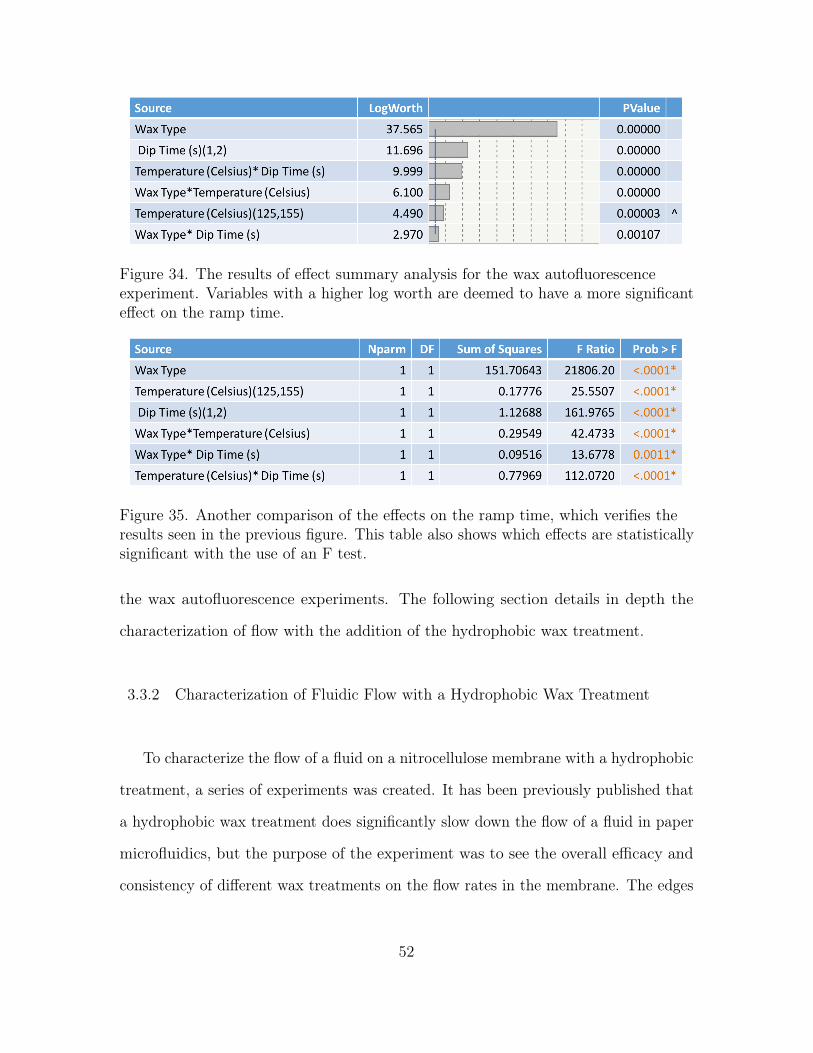
Figure 34. The results of effect summary analysis for the wax autofluorescenceexperiment. Variables with a higher log worth are deemed to have a more significanteffect on the ramp time.
Figure 35. Another comparison of the effects on the ramp time, which verifies theresults seen in the previous figure. This table also shows which effects are statisticallysignificant with the use of an F test.
the wax autofluorescence experiments. The following section details in depth the
characterization of flow with the addition of the hydrophobic wax treatment.
3.3.2 Characterization of Fluidic Flow with a Hydrophobic Wax Treatment
To characterize the flow of a fluid on a nitrocellulose membrane with a hydrophobic
treatment, a series of experiments was created. It has been previously published that
a hydrophobic wax treatment does significantly slow down the flow of a fluid in paper
microfluidics, but the purpose of the experiment was to see the overall efficacy and
consistency of different wax treatments on the flow rates in the membrane. The edges
52
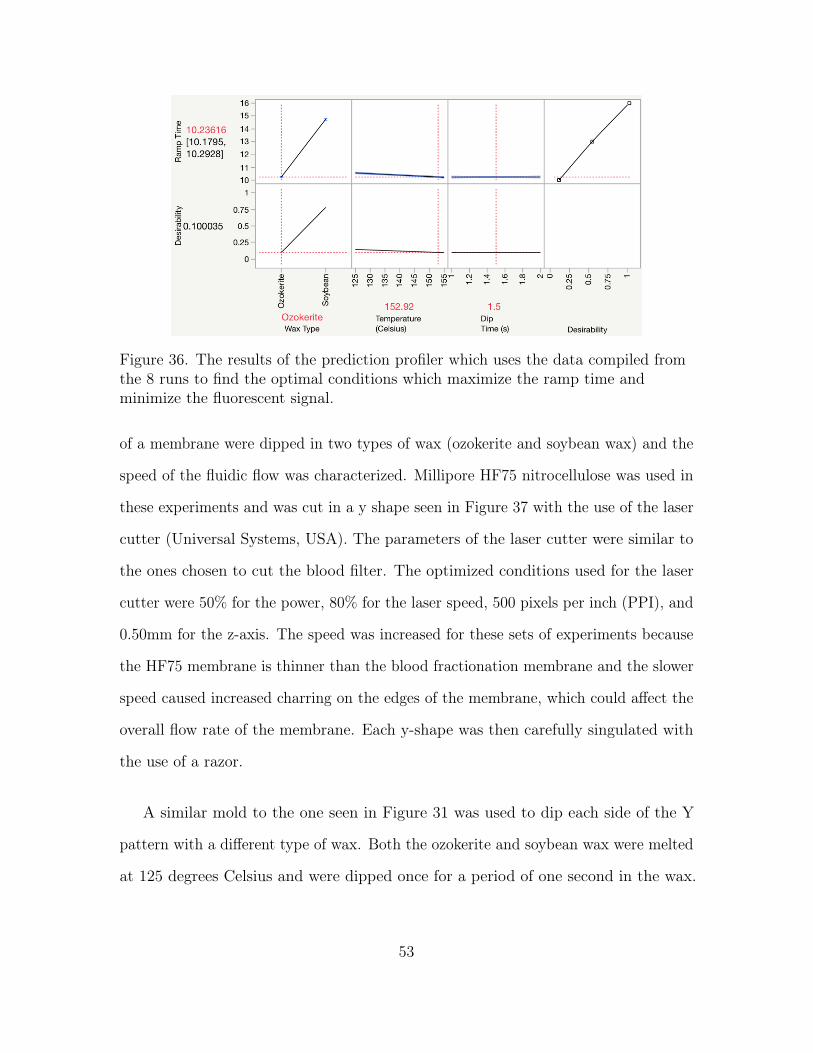
Figure 36. The results of the prediction profiler which uses the data compiled fromthe 8 runs to find the optimal conditions which maximize the ramp time andminimize the fluorescent signal.
of a membrane were dipped in two types of wax (ozokerite and soybean wax) and the
speed of the fluidic flow was characterized. Millipore HF75 nitrocellulose was used in
these experiments and was cut in a y shape seen in Figure 37 with the use of the laser
cutter (Universal Systems, USA). The parameters of the laser cutter were similar to
the ones chosen to cut the blood filter. The optimized conditions used for the laser
cutter were 50% for the power, 80% for the laser speed, 500 pixels per inch (PPI), and
0.50mm for the z-axis. The speed was increased for these sets of experiments because
the HF75 membrane is thinner than the blood fractionation membrane and the slower
speed caused increased charring on the edges of the membrane, which could affect the
overall flow rate of the membrane. Each y-shape was then carefully singulated with
the use of a razor.
A similar mold to the one seen in Figure 31 was used to dip each side of the Y
pattern with a different type of wax. Both the ozokerite and soybean wax were melted
at 125 degrees Celsius and were dipped once for a period of one second in the wax.
53
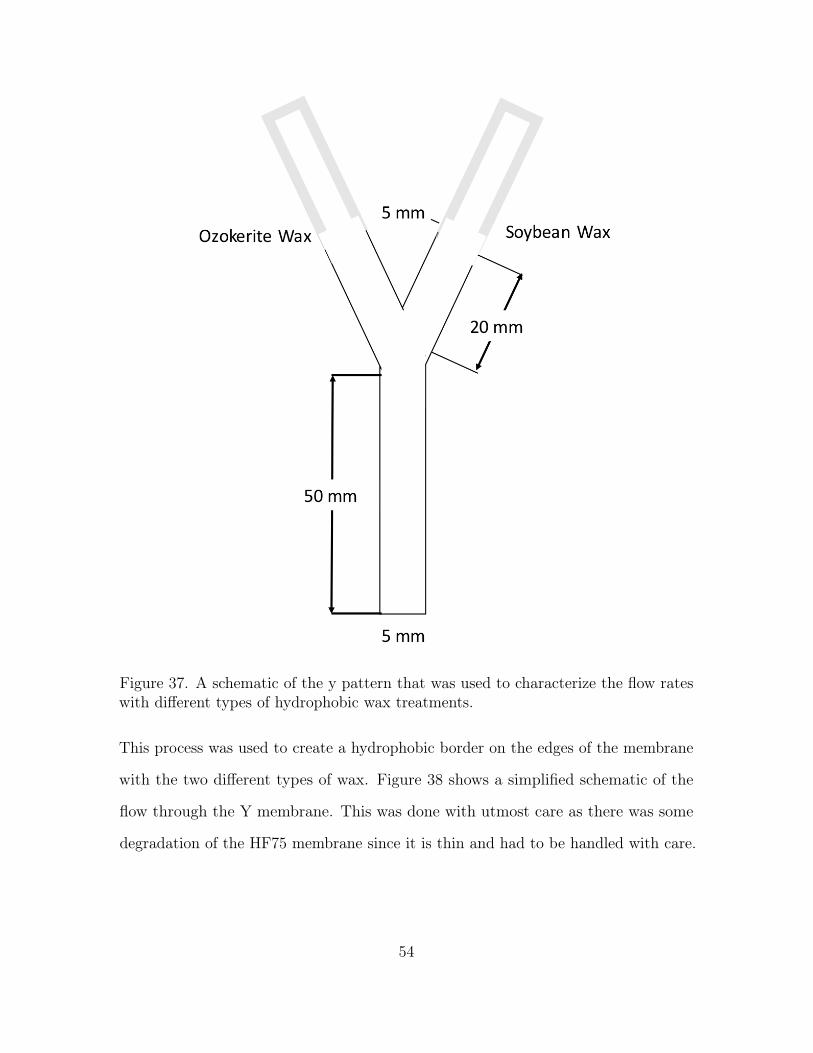
Figure 37. A schematic of the y pattern that was used to characterize the flow rateswith different types of hydrophobic wax treatments.
This process was used to create a hydrophobic border on the edges of the membrane
with the two different types of wax. Figure 38 shows a simplified schematic of the
flow through the Y membrane. This was done with utmost care as there was some
degradation of the HF75 membrane since it is thin and had to be handled with care.
54

Figure 38. a simplified schematic of the flow through the Y membrane.
To characterize the speed of the fluid flow 5 milliliters of deionized water was
added to the single inlet of the channel and the distance traveled over time of each
of each side of the membrane (which has a different wax treatment) was measured.
Three duplicates were created and the fluid was introduced with the use of a pipette
at the edge of the membrane. The pattern was mounted on a flat plexiglass sheet and
the length traveled of the fluid was measured every 60 seconds once the fluid traveled
55

past the branching point of the the y shape, which was about 50 mm plus the initial
buffer distances of 20 mm seen in the diagram.
Figure 39. The characterization of flow rates of ozokerite and soybean waxes and thecomparison of length traveled versus time.
As seen in Figure 39, soybean wax traveled a significantly longer distance in the
y shape in comparison to the ozokerite wax. It can be seen that the soybean wax
reached the edge of the membrane during the period of experimentation in almost all
of the trials, while the ozokerite wax traveled about two-thirds of the way or about
20 out of the 30 millimeters until the edge of the membrane. This means that the
soybean wax is overall less hydrophobic than the ozokerite wax, which comes to show
that the ozokerite wax is more effective in the creation of valve since it forces the fluid
to have a higher surface tension which results in a higher contact angle as well. The
next steps of these experiments include the creation of a heating element to allow
for the precise actuation of these valves in addition to the characterization of the
pressures needed to rupture these wax valves.
56

3.4 Sublimating Valves
To complement the wax valves which block the porous media when heat actuation
is applied, sublimating materials were researched to allow for the inverse effects
(sublimation when heat actuation is applied on the membrane) and naphthalene was
selected as an initial material since it has a relatively low sublimation temperature
(80 − 90o C) and is cheap and easy to procure. However, studies on naphthalene
have found that it is relatively carcinogenic and can potentially cause detrimental
respiratory effects. In addition, naphthalene emits a foul odor and the elimination
of this odor usually indicates the absence of naphthalene in this substrate. Various
techniques of the deposition of naphthalene were attempted (heated dipping technique/
heated precision dispensing technique) and the flow rates were characterized of each
of the substrates. The implementation of naphthalene in a lateral flow device can be
seen in a simplified schematic (Figure 40). In this schematic the naphthalene valve
is used as a barrier for reagents so that the blood can get to the test strip before
the wash reagents. The precise control of the dispensing of the fluid is done with a
heating actuator to sublimate the naphthalene at the correct time.
Figure 40. The characterization of flow rates of ozokerite and soybean waxes and thecomparison of length traveled versus time.
In addition, a technique was developed for the quantification of the fluorescent
57

signal emitted from the naphthalene as well as any downstream effects that are created
due to fluidic effects. The changes to fluidic flow were also studied due to any residual
remains of the naphthalene as well. In addition the bio-compatibility of naphthalene
was also tested with an enzyme-linked immunosorbent assay (ELISA) and was included
in multiple steps of the ELISA assay as well. A complete study of the residual effects
of the naphthalene in addition to its fluidic effects in a fabricated channel will be
useful in future implementations of this material in lateral flow assays in the future.
3.4.1 Flow Characterization of Sublimating Valves
To characterize the fluidic properties of naphthalene in a channel, a similar form
of the Y channel created in the wax experiments was created. Millipore HF75
nitrocellulose was used in these experiments and was cut in a y shape seen in Figure
41 with the use of the laser cutter (Universal Systems, USA). The parameters of the
laser cutter were similar to the ones chosen to cut the blood filter. The optimized
conditions used for the laser cutter were 50% for the power, 80% for the laser speed,
500 pixels per inch (PPI), and 0.50mm for the z-axis. The speed was increased for
these sets of experiments because the HF75 membrane is thinner than the blood
fractionation membrane and the slower speed caused increased charring on the edges
of the membrane, which could affect the overall flow rate of the membrane. Each
y-shape was then carefully singulated with the use of a razor.
Naphthalene was then heated to 120 degrees Celsius and a 5 mm area was added
to the membrane with the use of a dipping technique with the use of a cut acrylic
mold. This ’valve’ was added about 20 mm from the branching point on one of the
y-channels. Two experiments were performed to characterize flow with the addition of
58
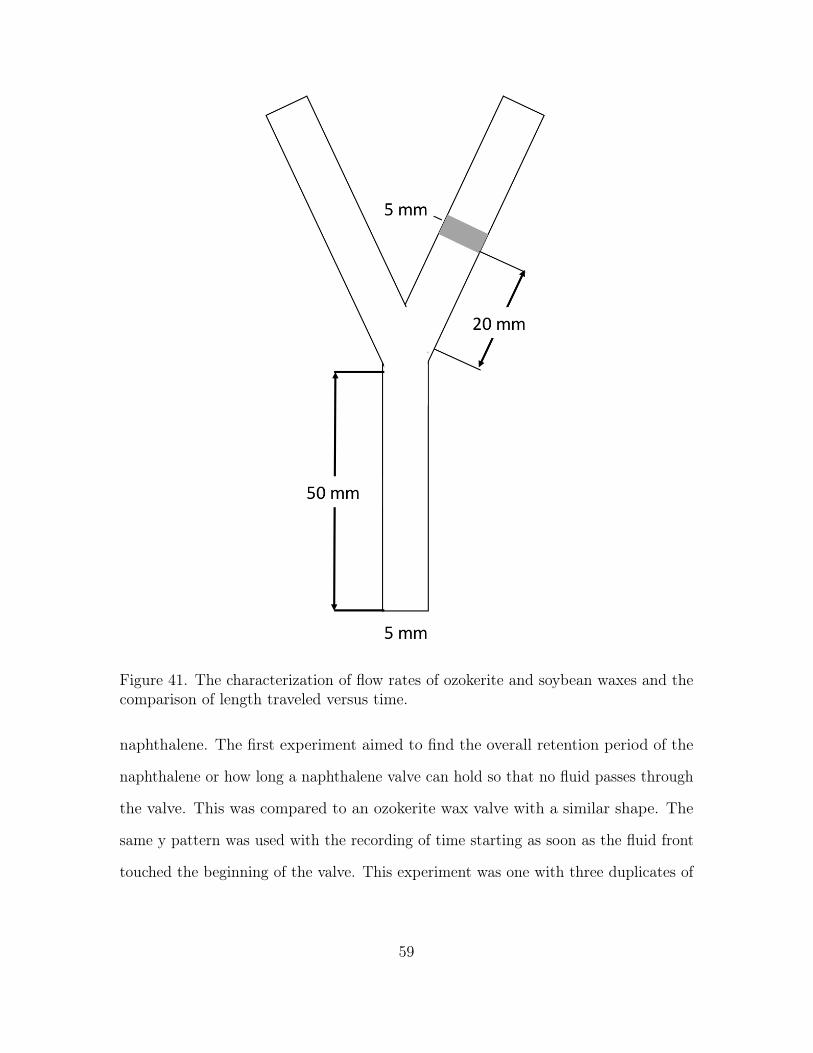
Figure 41. The characterization of flow rates of ozokerite and soybean waxes and thecomparison of length traveled versus time.
naphthalene. The first experiment aimed to find the overall retention period of the
naphthalene or how long a naphthalene valve can hold so that no fluid passes through
the valve. This was compared to an ozokerite wax valve with a similar shape. The
same y pattern was used with the recording of time starting as soon as the fluid front
touched the beginning of the valve. This experiment was one with three duplicates of
59

the naphthalene as well as the ozokerite wax valves. To record progress of the fluid
front the valve was recorded for a period of 12 hours or when the fluid passed through
the entirety of the valve.
Figure 42. A schematic of the experimental setup of the hold time experiment with areservoir of fluid.
Since this experiment was expected to take a longer time, evaporation is a significant
factor and fluidic losses would significantly affect the results. To remedy this issue, a
reservoir of deionized water with red food coloring was used and the y channels were
mounted upright so that the edge of the y channel is submerged in about 1 centimeter
of the reservoir.
As seen in Figure 43 and Fig. 42, all trials of the ozokerite wax valves were able
to hold fluid back for more than the experimentation period of 12 hours. However,
60

Figure 43. A comparison of the hold times of naphthalene valves versus ozokerite waxvalves. It can be seen that ozokerite wax held for longer than the experimentationtime of 12 hours and the naphthalene valves held for an average of about nine hours.
the naphthalene valves were able to hold the fluid back for close to nine hours on
average, which is a positive result. This still means that the naphthalene valves
could successfully be used to hold back washes and other reagents since the maximum
expected hold time required is close to 3 or 4 hours. However, shelf life testing has
to be performed for naphthalene so its longevity can be properly determined. A
feasibility analysis can then be performed to see if these naphthalene valves can be
consistently fabricated for implementation in field testing in a third world country.
The second experiment aimed to find the effects of surface tension in a way that
was similar to the wax flow rate comparison experiment. The same pattern seen in
Figure 37 was used with one of branches dipped in naphthalene which was melted in a
beaker at 80 degrees Celsius. The area where naphthalene was not needed was masked
with the same mold from the wax comparison section. The other branch point was
61

dipped in ozokerite wax to provide a comparison of hydrophobicity to a naphthalene
valve. This was repeated in three separate trials.
Figure 44. The characterization of flow rates of ozokerite and soybean waxes and thecomparison of length traveled versus time.
3.4.2 Compatibility of Naphthalene
To find the compatibility of naphthalene when used in conjunction with an assay,
it was important to find the overall compatibility of this material in an enzyme-linked
immunosorbent assay (ELISA). A chemiluminescent assay was used along with a
positive and negative control on a standard 96-well plate with EBNA and Gluthathione
S-Transferase (GST) as the negative control. The ratios between the EBNA and the
correlated GST well were compared along with the addition of naphthalene in each of
the test wells. The complete protocol for this ELISA assay can be seen in Appendix
B.
62
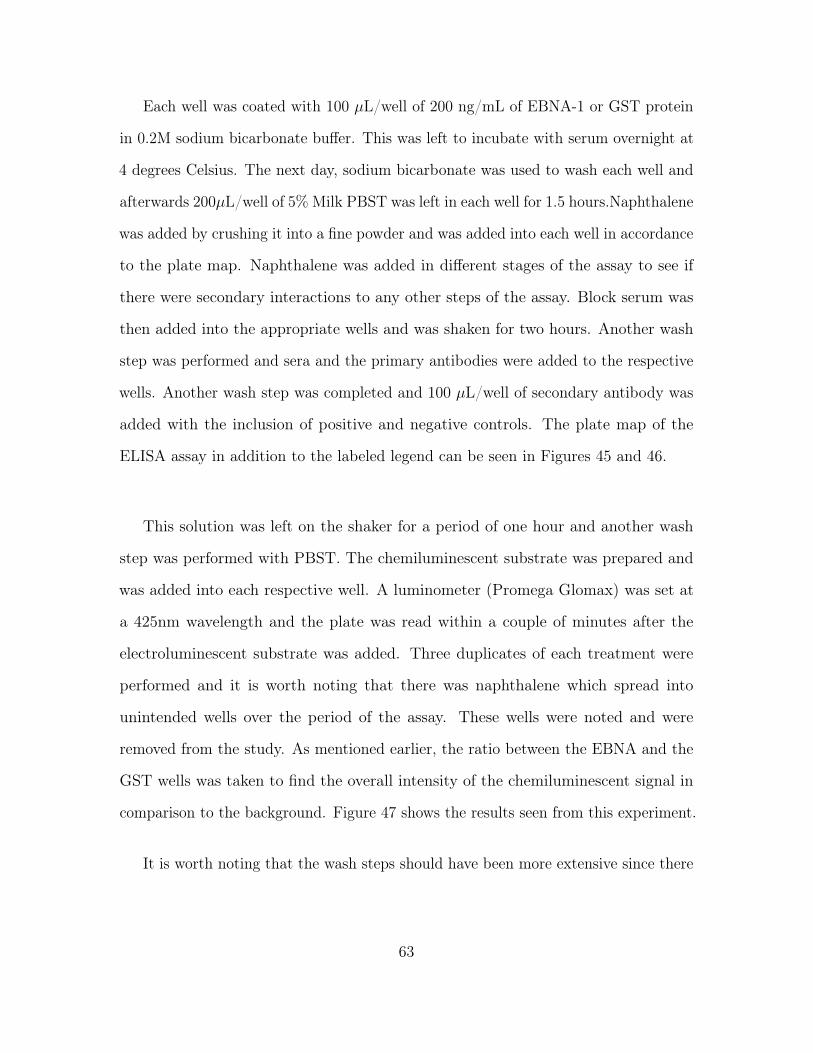
Each well was coated with 100 µL/well of 200 ng/mL of EBNA-1 or GST protein
in 0.2M sodium bicarbonate buffer. This was left to incubate with serum overnight at
4 degrees Celsius. The next day, sodium bicarbonate was used to wash each well and
afterwards 200µL/well of 5% Milk PBST was left in each well for 1.5 hours.Naphthalene
was added by crushing it into a fine powder and was added into each well in accordance
to the plate map. Naphthalene was added in different stages of the assay to see if
there were secondary interactions to any other steps of the assay. Block serum was
then added into the appropriate wells and was shaken for two hours. Another wash
step was performed and sera and the primary antibodies were added to the respective
wells. Another wash step was completed and 100 µL/well of secondary antibody was
added with the inclusion of positive and negative controls. The plate map of the
ELISA assay in addition to the labeled legend can be seen in Figures 45 and 46.
This solution was left on the shaker for a period of one hour and another wash
step was performed with PBST. The chemiluminescent substrate was prepared and
was added into each respective well. A luminometer (Promega Glomax) was set at
a 425nm wavelength and the plate was read within a couple of minutes after the
electroluminescent substrate was added. Three duplicates of each treatment were
performed and it is worth noting that there was naphthalene which spread into
unintended wells over the period of the assay. These wells were noted and were
removed from the study. As mentioned earlier, the ratio between the EBNA and the
GST wells was taken to find the overall intensity of the chemiluminescent signal in
comparison to the background. Figure 47 shows the results seen from this experiment.
It is worth noting that the wash steps should have been more extensive since there
63

Figure 45. The setup of the ELISA assay with the plate map of the assay with theEBNA and GST(negative control). The legend of the plate map can be seen andthree duplicates of each run were created.
were visible residues from the naphthalene powder in some wells even after five washes.
In addition, some of the naphthalene powders was mistakenly placed in the wrong
wells and these wells were removed from the study. It can be seen that the addition
of naphthalene with plasma and secondary resulted in en extremely high signal, but it
is also noted that the standard deviation of this group was high. Overall it is noted
that the naphthalene did not significantly affect the signal in the other wells. It is
also worth noting that Group 7 (Naphthalene and Plasma without Secondary) had
minimal signal. The next step of this experiment is to perform a proper fluorescence
assay to see if there are any secondary interactions between the naphthalene and the
fluorescence since naphthalene in fluorescent in the green range.
Overall a complete characterization of different reagents (BSA, blocking agents,
64

Figure 46. The legend of the ELISA assay with all of the necessary controls with thesecondary, plasma with/without the addition of naphthalene.
and different nitrocellulose membranes) with the naphthalene will provide a more
extensive picture of the interactions that occur with the sublimating valve material.
In addition, more precise amounts of naphthalene in the ELISA wells in conjunction
with a fluorescence based ELISA assay will provide a complete picture on the overall
bio-compatibility of naphthalene and its feasibility in lateral flow assays.
65

Figure 47. The chemiluminescent results of the ELISA compatibility experiment withthe addition of naphthalene. It can be seen that the addition of naphthalene withplasma and secondary resulted in en extremely high signal, but it is also noted thatthe standard deviation of this group was high. Overall it is noted that thenaphthalene did not significantly affect the signal in the other wells.
66

Chapter 4
MODELING OF FLUID FLOW IN A POROUS MEDIUM
This section will cover the efforts made in modeling of fluid flow in a porous
medium. This was done with two methods, the development of a mathematical model
in addition to a computational fluid dynamics model in COMSOL. These models were
used to predict fluid flow to properly characterize the flow dynamics of the paper
based microfluidic models.
4.1 Mathematical Modeling
Fluidic control in a porous medium can be simplified in terms of an electrical circuit
analogy. For the sake of simplicity, fluid flow is modelled in fully wetted flow, where
the membrane is already pre-wetted. Fluidic dimensions of the strip are analogous
to the resistance of the electrical circuit. The current of the analogous model can be
related to the volumetric flow rate and the pressure difference across the membrane is
analogous to the potential difference.
4.1.1 Governing Equations and Assumptions
As mentioned in Chapter 1, the Washburn equation is used to describe capillary
driven flow with the assumption that there is an ’infinite’ reservoir on one side of
the fluidic channel. The other side of the channel is assumed to be exposed to the
ambient environment. The Washburn equation is further derived with and a number
67

of core assumptions are in the case of capillary flow, but cannot be assumed in the
case of paper-based fluidics:
• The effects of gravity, hydrostatic pressure, and atmospheric pressure are negli-
gible
• The walls of the capillary are no-slip and the velocity is highest at the center of
the capillary
• The liquid in the capillary is incompressible and moves at a constant velocity
• The pressure gradient is constant in the x direction and is also linear
• The flow in the capillaries are laminar and constant
• The capillaries are cylindrical and have a constant diameter
These assumptions cannot all be adapted in the use of a porous medium, but it
can be assumed that a porous body is composed of n number of cylindrical capillaries,
which allows for the calculation of all of the volumes in a porous medium.
V = π∑
r2cX =π
2
√t
µ
∑√PE +
2γ
rc· r3c (1)
where V is the total volume of the fluid in the porous media, rc is the radius of the
capillary, X is the length of the column of the liquid in the capillary, µ is the viscosity
of the liquid, PE is the external pressure driving the fluid, and γ is the surface tension
between the liquid and air interface. In this situation, the capillary forces dominate
and PE is negligible and a similar equation can be derived with another term κ which
describes the degree of penetration of the fluid. This term is similar to permeability
while taking into account the interaction between the fluid and the porous medium.
V = κ
√γt
µ(2)
68
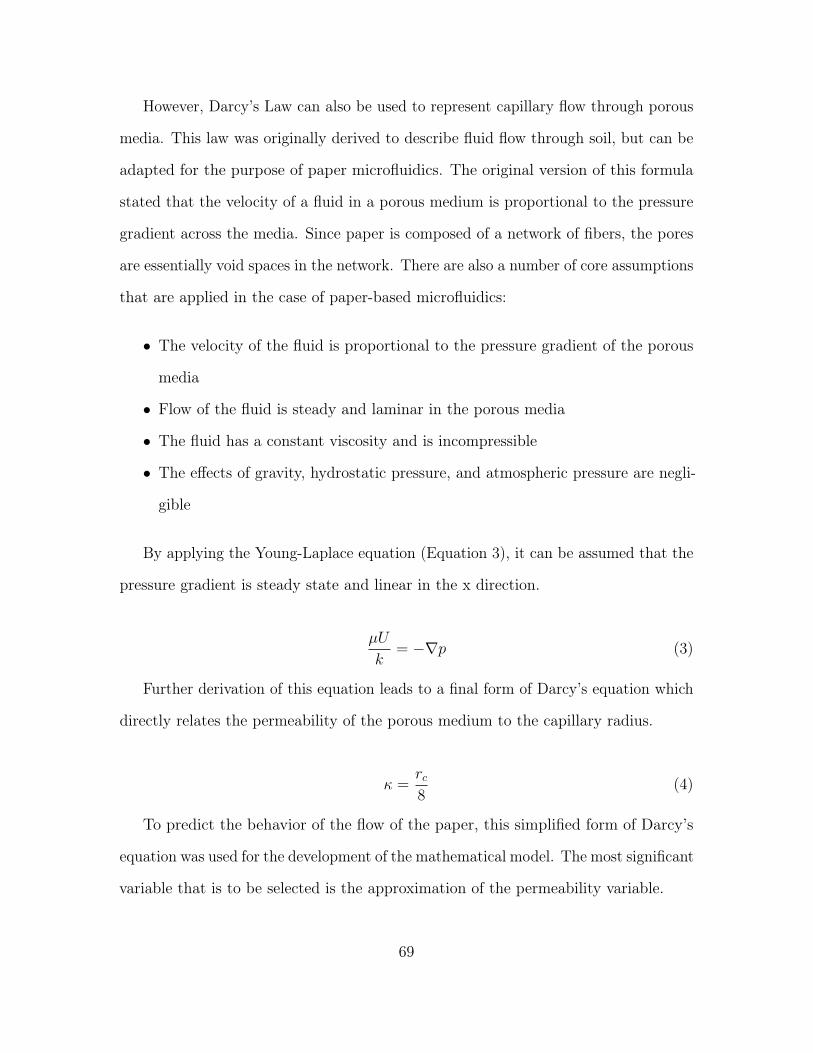
However, Darcy’s Law can also be used to represent capillary flow through porous
media. This law was originally derived to describe fluid flow through soil, but can be
adapted for the purpose of paper microfluidics. The original version of this formula
stated that the velocity of a fluid in a porous medium is proportional to the pressure
gradient across the media. Since paper is composed of a network of fibers, the pores
are essentially void spaces in the network. There are also a number of core assumptions
that are applied in the case of paper-based microfluidics:
• The velocity of the fluid is proportional to the pressure gradient of the porous
media
• Flow of the fluid is steady and laminar in the porous media
• The fluid has a constant viscosity and is incompressible
• The effects of gravity, hydrostatic pressure, and atmospheric pressure are negli-
gible
By applying the Young-Laplace equation (Equation 3), it can be assumed that the
pressure gradient is steady state and linear in the x direction.
µU
k= −∇p (3)
Further derivation of this equation leads to a final form of Darcy’s equation which
directly relates the permeability of the porous medium to the capillary radius.
κ =rc8
(4)
To predict the behavior of the flow of the paper, this simplified form of Darcy’s
equation was used for the development of the mathematical model. The most significant
variable that is to be selected is the approximation of the permeability variable.
69
4.1.2 Mathematical Model Development
The mathematical model was developed with the use of Darcy’s equation since
there is a permeability parameter which is quite significant in porous media. To
develop a model experimental data the most important parameter was the creation
of permeability constant which was found for various types of the membrane. The
capillary size was empirically determines.
4.2 COMSOL Modelling
To model the flow of blood through the asymmetric polysulfone membrane, two
phase porous media was utilized to model the pores for the membrane. Blood was
used as a Newtonian fluid and was flown through the membrane. An SEM image of
the asymmetric polysulfone membrane was acquired into COMSOL Multiphysics and
its data was imported into an image for computer analysis. An image of the import
can be seen in Figure 48.
A pore scale modeling technique was used which uses creeping (Stokes) flow in the
interstices of a porous media. This modeling technique can be used to predict fluid
velocity in a porous membrane. Extrapolating the permeability and porosity of the
SEM image can be used to validate experimental results.
The future step of this model is the creation of equivalent sized particles for red
blood cells so that they can be filtered through the membrane.
70

Figure 48. The image import of the SEM image of an asymmetric polysulfonemembrane on COMSOL multiphysics.
71

Chapter 5
DEVELOPMENT OF A SOFTWARE TO INTERFACE THE DATA
ACQUISITION PROGRAM FOR THE LATERAL FLOW PLATFORM
This chapter covers the efforts made towards the development of a data acquisition
interface for the various iterations of the fluorescence-based lateral flow platform
for the detection of biomarkers in whole blood. The entire system is based in the
Arduino ecosystem, but there was a need to interface the Arduino system to an
external interface such as an iPhone or a computer. The computer based system was
designed for the standard Arduino platform and the iPhone application was designed
to interface with the LightBlue Bean, a Bluetooth Low Energy (BLE) based Arduino
system. These efforts will be outlined in the following sections.In both cases it is
assumed that the Arduino script is uploaded onto the device and runs when the on
button is pressed on the device.
5.1 Computer Interface Development
To interface with a standard Arduino Uno/Mega via USB a Visual Basic application
was created. This Visual Basic Application was created to output data from the serial
monitor of the Arduino and allowed the user to input information about the user
along with the selection of the USB port. After the test is run all the data is appended
into a .csv file. The user is then prompted to name and save the file along with an
optional prompt to disconnect the Arduino device.
The application created in Fig. 49includes the Visual Basic Enterprise (2017
72

Figure 49. The screen where the user is prompted to insert the patient and theapplication also saves the time and date of the test.
Release) displays interface of the lateral flow reader with a computer. The application
was compiled as an executable and can be loaded on any computer. In this application
the user is prompted to include the patient identifier number as well as an option
to selection USB port to connect to. In addition there is a box which displays the
output of the serial monitor in real time as well as an option to clear that box. Once
the test is running the user is given a .csv file with the time and date as well as the
identifier of the patient in addition to all of the data collected from the Arduino. This
application was successfully used in the 2017 BIOCAS conference as well as a site
visit seen in Fig. 50.
73

Figure 50. A system block diagram for the software interfaces developed for thelateral flow platform.
5.2 iOS Application Development
An application was created which would interface with the LightBlue Bean (de-
signed by Punch Through Design) for field use when the lateral flow device will be
deployed in rural populations in India. The application was created in Swift (Xcode)
to interface with Apple devices with the use The application was created to store
patient names, which appends to the data stream that is received from the LightBlue
Bean. The results of the detection time are continually outputted in real time on the
screen of the iPhone or Apple device. The data that is collected is stored in a .csv file
and users are prompted to send the data via email in the application.
74

When the application is started, the application automatically searches for nearby
LightBlue Beans. The user is given the option to refresh the application when it is
searching for additional devices, which can be seen in Fig. 51.
Figure 51. The landing screen of the FlexDx application where the device searches foravailable BLE devices.
After this is performed and the application ensures that a steady connection is
created withe the LightBlue Bean, the application segues to the next screen where
the user is prompted to enter the ID number of the patient. In addition, the date and
time of the test is also saved at the same time and once the submit button is pressed,
the LightBlue Bean is prompted to begin the test, which can be seen in Fig. 52.
75
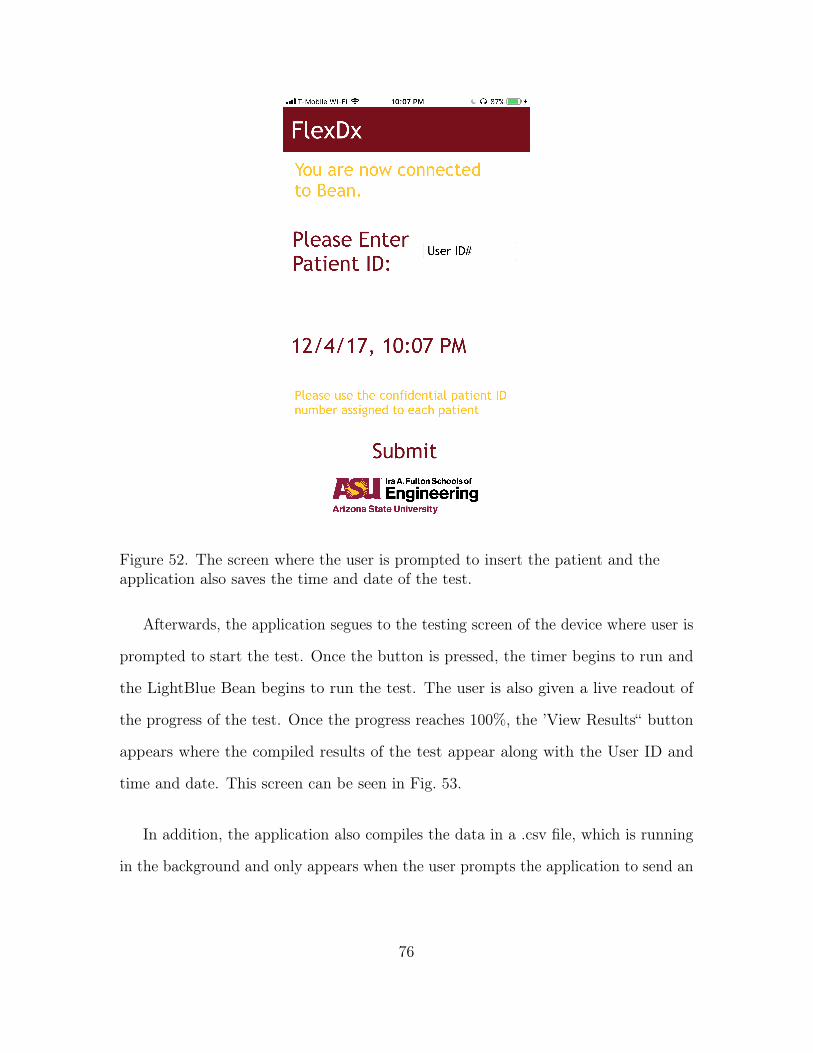
Figure 52. The screen where the user is prompted to insert the patient and theapplication also saves the time and date of the test.
Afterwards, the application segues to the testing screen of the device where user is
prompted to start the test. Once the button is pressed, the timer begins to run and
the LightBlue Bean begins to run the test. The user is also given a live readout of
the progress of the test. Once the progress reaches 100%, the ’View Results“ button
appears where the compiled results of the test appear along with the User ID and
time and date. This screen can be seen in Fig. 53.
In addition, the application also compiles the data in a .csv file, which is running
in the background and only appears when the user prompts the application to send an
76

Figure 53. The testing screen of the device where the timer measures the overall timeelapsed for the detection test.
email to the health-care provider with the results of the test. A sample email that can
pop up can be seen in Fig. 54. The source code for this application can be seen the
following Github Repository https://github.com/hmarafa/POC_iOS or in Appendix
A of this document.
There were issues associated with keeping a steady connection with the application.
If the connection is interrupted, the application crashes and had to be rebuilt in
its initial version. In the following versions, eliminating the application in the task
manager would fix the issue, but ideally, the application should segue back to the
connection screen if this were to occur. Another issue that appeared was that in some
77

instances, the application would trigger the LightBlue Bean to run the test multiple
times in quick succession. Overall, there are a number of iterations that are still
required to launch the application and a significant amount of debugging is required
as well. However, this application in its current state functions as an initial proof of
concept and successfully demonstrates communication with a Bluetooth Low Energy
Arduino device.
Figure 54. A sample email screen where the application compiles all of the data intoa .csv file and prompts the user to email the data to a health-care provider.
78

Chapter 6
CONCLUSIONS & FUTURE WORK
This work describes efforts made in the development of multiple facets of the
fluorescence based lateral based detection assay for global health applications. This
work describes developments in the field of paper microfluidics and functionalization
of porous surfaces. In addition, actuation of valves and other materials in porous
membranes and paper microfluidics was researched in depth. There was significant
effort made in the creation of the blood fractionation aspect of the lateral flow device by
testing and characterizing various glass bound and asymmetric polysulfone membranes
with blood samples. Characterization of the rate of evaporation of fluids in a porous
membrane in various temperatures and humities was also completed and it was found
that the rate of evaporation of blood was statistically similar to that of water. The
culminating point of this chapter presented an implementation of the optimal blood
fractionation filter in the lateral flow reader form factor. This experiment was favorably
compared to the conventionally centrifuged pooled plasma sample. Recommendations
have been made for the optimization of the blood factor in addition towards future
attempts in packaging the entire lateral flow assay strips.
The third chapter of this work covered efforts made towards the development of
thermally actuated valves for delayed and precise control of reagents in the lateral flow
assay. The consistent and timed delivery of reagents has been shown to greatly affect
the consistency of the results of the lateral flow assay and various materials were tested
and characterized. A PID controller was designed and implemented in the precision
printing fixture to allow for the heated deposition of these materials onto a porous
79

membrane. This system was validated and its operating conditions were optimized
for the heated deposition of these materials. Wax valves were researched and the
hydrophobicity of various waxes was tested in direct comparisons of the flow rate in
the same porous materials. In addition these same tests were completed with a novel
sublimating material (naphthalene) and its material characteristics were compared to
conventional hydrophobic wax materials.
The fourth chapter of this work presents efforts made towards the development of
mathematical and computational fluid dynamic (CFD) models for the simulation of
flow in porous membranes. There needs to be significant work on the simulation front
for the refinement of these models so they can compare to experimental results. The
fifth chapter of this work presents efforts made towards the creation of user interfaces
for the entire fluorescence based lateral flow detection platform on mobile phones and
desktops. An application was created for iOS devices which successfully interfaces with
an Arduino with Bluetooth compatibility (LightBlue Bean) and communicates with
the device. In addition an application was created for computer use which connects to
traditional Arduino Uno micro-controller boards. Both systems have been validated
and tested and are close to field implementation.
Future works include the optimization of naphthalene valves in addition to the
optimization of the mathematical and CFD models so they can be comparable to
real world experimental results. In addition packaging of the lateral flow test strips
will be researched and further optimization of the blood fractionation membrane and
improved integration of the filter will be completed at a future time.
80

REFERENCES
Abe, Koji, Koji Suzuki, and Daniel Citterio. 2008. ‘Inkjet-printed microfluidic multi-analyte chemical sensing paper.’ Analytical chemistry 80 (18): 6928–6934.
Bhalla, Nikhil, Danny Wen Yaw Chung, Yaw-Jen Chang, Kimberly Jane S Uy, YiYing Ye, Ting-Yu Chin, Hao Chun Yang, and Dorota G Pijanowska. 2013. ‘Mi-crofluidic platform for enzyme-linked and magnetic particle-based immunoassay.’Micromachines 4 (2): 257–271.
Bruzewicz, Derek A, Meital Reches, and George MWhitesides. 2008. ‘Low-cost printingof poly (dimethylsiloxane) barriers to define microchannels in paper.’ Analyticalchemistry 80 (9): 3387–3392.
Castillo-León, Jaime, and Winnie E Svendsen. 2014. Lab-on-a-Chip Devices andMicro-Total Analysis Systems: A Practical Guide. Springer.
Cate, David M, Jaclyn A Adkins, Jaruwan Mettakoonpitak, and Charles S Henry. 2014.‘Recent developments in paper-based microfluidic devices.’ Analytical chemistry87 (1): 19–41.
Crowley, Timothy A, and Vincent Pizziconi. 2005. ‘Isolation of plasma from wholeblood using planar microfilters for lab-on-a-chip applications.’ Lab on a Chip 5(9): 922–929.
Dungchai, Wijitar, Orawon Chailapakul, and Charles S Henry. 2011. ‘A low-cost,simple, and rapid fabrication method for paper-based microfluidics using waxscreen-printing.’ Analyst 136 (1): 77–82.
Fenton, Erin M, Monica R Mascarenas, Gabriel P López, and Scott S Sibbett. 2008.‘Multiplex lateral-flow test strips fabricated by two-dimensional shaping.’ ACSapplied materials & interfaces 1 (1): 124–129.
Fu, Elain, Stephen A Ramsey, Peter Kauffman, Barry Lutz, and Paul Yager. 2011.‘Transport in two-dimensional paper networks.’ Microfluidics and nanofluidics 10(1): 29–35.
Galligana, C, J Nicholsb, E Kvamc, P Spoonerc, R Gettingsb, L Zhub, and CM Puleoa.2015. ‘Mesoscale Blood Cell Sedimentation for Rapid Collection of MillilitreSamples.’ Lab on a Chip.
81

Ghaderinezhad, Fariba, Reza Amin, Mikail Temirel, Bekir Yenilmez, Adam Wentworth,and Savas Tasoglu. 2017. ‘High-throughput rapid-prototyping of low-cost paper-based microfluidics.’ Scientific Reports 7 (1): 3553.
Goodman, Steven R, Karis MH Hughes, David G Kakhniashvili, and Sudha Neelam.2007. ‘The isolation of reticulocyte-free human red blood cells.’ ExperimentalBiology and Medicine 232 (11): 1470–1476.
Homsy, Alexandra, Peter D van der Wal, Werner Doll, Roland Schaller, StefanKorsatko, Maria Ratzer, Martin Ellmerer, Thomas R Pieber, Andreas Nicol, andNico F De Rooij. 2012. ‘Development and validation of a low cost blood filtrationelement separating plasma from undiluted whole blood.’ Biomicrofluidics 6 (1):012804.
Lam, Trinh, Jasmine P Devadhasan, Ryan Howse, and Jungkyu Kim. 2017. ‘AChemically Patterned Microfluidic Paper-based Analytical Device (C-µPAD) forPoint-of-Care Diagnostics.’ Scientific Reports 7 (1): 1188.
Li, Xu, Junfei Tian, Gil Garnier, and Wei Shen. 2010. ‘Fabrication of paper-basedmicrofluidic sensors by printing.’ Colloids and Surfaces B: Biointerfaces 76 (2):564–570.
Liu, Changchun, Shih-Chuan Liao, Jinzhao Song, Michael G Mauk, Xuanwen Li,Gaoxiang Wu, Dengteng Ge, Robert M Greenberg, Shu Yang, and Haim H Bau.2016. ‘A high-efficiency superhydrophobic plasma separator.’ Lab on a Chip 16(3): 553–560.
Liu, Changchun, Michael Mauk, Robert Gross, Frederic D Bushman, Paul H Edelstein,Ronald G Collman, and Haim H Bau. 2013. ‘Membrane-based, sedimentation-assisted plasma separator for point-of-care applications.’ Analytical chemistry 85(21): 10463–10470.
Lopez-Munoz, Eunice, and Manuel Mendez-Montes. 2013. ‘Markers of circulatingbreast cancer cells.’ Adv Clin Chem 61:175–224.
Lu, Yao, Weiwei Shi, Lei Jiang, Jianhua Qin, and Bingcheng Lin. 2009. ‘Rapidprototyping of paper-based microfluidics with wax for low-cost, portable bioassay.’Electrophoresis 30 (9): 1497–1500.
Maria, M Sneha, PE Rakesh, TS Chandra, and AK Sen. 2016. ‘Capillary flow ofblood in a microchannel with differential wetting for blood plasma separationand on-chip glucose detection.’ Biomicrofluidics 10 (5): 054108.
82
Martinez, Andres W, Scott T Phillips, Manish J Butte, and George M Whitesides. 2007.‘Patterned paper as a platform for inexpensive, low-volume, portable bioassays.’Angewandte Chemie International Edition 46 (8): 1318–1320.
Martinez, Andres W, Scott T Phillips, Benjamin J Wiley, Malancha Gupta, andGeorge M Whitesides. 2008. ‘FLASH: a rapid method for prototyping paper-based microfluidic devices.’ Lab on a Chip 8 (12): 2146–2150.
Miltenyi, Stefan, Werner Müller, Walter Weichel, and Andreas Radbruch. 1990. ‘Highgradient magnetic cell separation with MACS.’ Cytometry 11 (2): 231–238.
Nilghaz, Azadeh, and Wei Shen. 2015. ‘Low-cost blood plasma separation methodusing salt functionalized paper.’ Rsc Advances 5 (66): 53172–53179.
Obahiagbon, U., D. Kullman, J. T. Smith, B. A. Katchman, H. Arafa, K. S. Anderson,and J. B. Christen. 2016. ‘Characterization of a compact and highly sensitivefluorescence-based detection system for point-of-care applications.’ In 2016 IEEEHealthcare Innovation Point-Of-Care Technologies Conference (HI-POCT), 117–120. November. doi:10.1109/HIC.2016.7797711.
Olkkonen, Juuso, Kaisa Lehtinen, and Tomi Erho. 2010. ‘Flexographically printedfluidic structures in paper.’ Analytical chemistry 82 (24): 10246–10250.
Piacentini, Niccolò, Guillaume Mernier, Raphaël Tornay, and Philippe Renaud. 2011.‘Separation of platelets from other blood cells in continuous-flow by dielectrophore-sis field-flow-fractionation.’ Biomicrofluidics 5 (3): 034122.
Posthuma-Trumpie, Geertruida A., Jakob Korf, and Aart van Amerongen. 2009.‘Lateral flow (immuno)assay: its strengths, weaknesses, opportunities and threats.A literature survey.’ Analytical and Bioanalytical Chemistry 393, no. 2 (January):569–582. doi:10.1007/s00216-008-2287-2.
Songjaroen, Temsiri, Wijitar Dungchai, Orawon Chailapakul, Charles S Henry, andWanida Laiwattanapaisal. 2012. ‘Blood separation on microfluidic paper-basedanalytical devices.’ Lab on a Chip 12 (18): 3392–3398.
Songjaroen, Temsiri, Wijitar Dungchai, Orawon Chailapakul, and Wanida Laiwat-tanapaisal. 2011. ‘Novel, simple and low-cost alternative method for fabricationof paper-based microfluidics by wax dipping.’ Talanta 85 (5): 2587–2593.
Szydzik, Crispin, Khashayar Khoshmanesh, Arnan Mitchell, and Christian Karnutsch.2015. ‘Microfluidic platform for separation and extraction of plasma from wholeblood using dielectrophoresis.’ Biomicrofluidics 9 (6): 064120.
83

Tageson, Mackenzie Elizabeth. 2013. ‘FUNCTIONAL 3-D CELLULOSE & NITRO-CELLULOSE PAPER-BASED, MULITPLEX DIAGNOSTIC PLATFORMSWITHOUT COUPLING AGENTS.’
Toner, Mehmet, and Daniel Irimia. 2005. ‘Blood-on-a-chip.’ Annu. Rev. Biomed. Eng.7:77–103.
Tripathi, Siddhartha, YV BalaVarun Kumar, Amit Agrawal, Amit Prabhakar, andSuhas S Joshi. 2016. ‘Microdevice for plasma separation from whole human bloodusing bio-physical and geometrical effects.’ Scientific reports 6:26749.
VanDelinder, Virginia, and Alex Groisman. 2006. ‘Separation of plasma from wholehuman blood in a continuous cross-flow in a molded microfluidic device.’ Analyticalchemistry 78 (11): 3765–3771.
Yetisen, Ali Kemal, Muhammad Safwan Akram, and Christopher R Lowe. 2013.‘Paper-based microfluidic point-of-care diagnostic devices.’ Lab on a Chip 13 (12):2210–2251.
Yuan, Yuehua, and T Randall Lee. 2013. ‘Contact angle and wetting properties.’ InSurface science techniques, 3–34. Springer.
84

APPENDIX A
CODE FOR PROGRAMS
85

A.1 Visual Basic Code for Lateral Flow Program
This section includes the Visual Basic Enterprise (2017 Release) code for theapplication with interfaces the lateral flow reader with a computer. The applicationwas compiled as an executable and can be loaded on any computer.
Imports SystemImports System.IO.PortsImports System.Text
Public Class Form1Dim comPORT1 As StringDim receivedData1 As String = ""
Private Sub flexdx_Load(ByVal sender As System.Object,ByVal e As System.EventArgs) Handles MyBase.Load
Timer1.Enabled = FalsecomPORT1 = ""For Each sp As String In My.Computer.Ports.SerialPortNames
comPort_ComboBox.Items.Add(sp)Next
End Sub
Private Sub comPort_ComboBox_SelectedIndexChanged(sender As Object, e As EventArgs)Handles comPort_ComboBox.SelectedIndexChanged
If (comPort_ComboBox.SelectedItem <> "") ThencomPORT1 = comPort_ComboBox.SelectedItem
End IfEnd Sub
Private Sub connect_BTN_Click(sender As Object,e As EventArgs) Handles connect_BTN.Click
If (connect_BTN.Text = "Connect") ThenIf (comPORT1 <> "") Then
SerialPort1.Close()SerialPort1.PortName = comPORT1SerialPort1.BaudRate = 9600SerialPort1.DataBits = 8SerialPort1.Parity = Parity.None
86

SerialPort1.StopBits = StopBits.OneSerialPort1.Handshake = Handshake.NoneSerialPort1.Encoding = System.Text.Encoding.DefaultSerialPort1.ReadTimeout = 10000
SerialPort1.Open()connect_BTN.Text = "Dis-connect"Timer1.Enabled = TrueTimer_LBL.Text = "Timer: ON"
ElseMsgBox("Select a COM port first")
End IfElse
SerialPort1.Close()connect_BTN.Text = "Connect"Timer1.Enabled = FalseTimer_LBL.Text = "Timer: OFF"
End If
End Sub
Private Sub Timer1_Tick(sender As Object,e As EventArgs) Handles Timer1.Tick
receivedData1 = ReceiveSerialData1()RichTextBox1.Text &= receivedData1
End Sub
Function ReceiveSerialData1() As StringDim tb1Text As Stringtb1Text = tb1.TextDim Incoming As StringDim FILE_NAME As StringFILE_NAME = System.IO.Path.Combine(
My.Computer.FileSystem.SpecialDirectories.MyDocuments,"test.txt")
TryIncoming = SerialPort1.ReadExisting()
If System.IO.File.Exists(FILE_NAME) = True Then
Dim objWriter As New System.IO.StreamWriter(FILE_NAME,
87

True)objWriter.WriteLine(tb1Text + "," + Incoming + "," + DateTime.Now.ToString("yyyyMMddHHmm"))objWriter.Close()
ElseSystem.IO.File.Create(FILE_NAME).Dispose()Dim objWriter As New System.IO.StreamWriter(FILE_NAME,True)objWriter.WriteLine(tb1Text + "," + Incoming + "," + DateTime.Now.ToString("yyyyMMddHHmm"))objWriter.Close()
End If
If Incoming Is Nothing ThenReturn "nothing" & vbCrLf
ElseReturn Incoming
End IfCatch ex As TimeoutException
Return "Error: Serial Port read timed out."End Try
End Function
Private Sub clear_BTN_Click(sender As Object,e As EventArgs) Handles clear_BTN.Click
RichTextBox1.Text = ""End Sub
Private Sub Label2_Click(sender As Object,e As EventArgs) Handles Label2.Click
End Sub
Private Sub TextBox1_TextChanged(sender As Object,e As EventArgs) Handles tb1.TextChanged
End Sub
Private Sub Button1_Click(sender As Object,e As EventArgs) Handles Button1.Click
88

End Sub
Private Sub PictureBox1_Click(sender As Object,e As EventArgs) Handles PictureBox1.Click
End SubEnd Class\end{verbatim}
\begin{figure}[h]\centering\includegraphics[scale=1.3]{fig/vbapp.PNG}\caption{The screen where the user is prompted to insert the patient and the
application also saves the time and date of the test.}\label{fig:vbapp}\end{figure}
\section{Swift Code for Arduino Application}
This is the compiled code for the iOS application created to interface withthe LightBlue Bean. This code was compiled in Xcode (Version 9) usingthe Swift programming language.
\begin{lstlisting}
//// AppDelegate.swift// POC_iOS//// Created by Hany Arafa on 10/30/17.// Copyright 2017 Hany Arafa. All rights reserved.//
import UIKitimport CoreData
@UIApplicationMainclass AppDelegate: UIResponder, UIApplicationDelegate {
var window: UIWindow?
89

func application(_ application: UIApplication,didFinishLaunchingWithOptions launchOptions:
[UIApplicationLaunchOptionsKey: Any]?) -> Bool {// Override point for customization after application launch.return true
}
func applicationWillResignActive(_ application: UIApplication) {// Sent when the application is about to move from active to inactive
state.This can occur for certain types of temporary interruptions (such as
an incomingphone call or SMS message) or when the user quits the application and
it beginsthe transition to the background state.// Use this method to pause ongoing tasks, disable timers, and invalidate graphics rendering callbacks. Games should use this
method to pause the game.}
func applicationDidEnterBackground(_ application: UIApplication) {// Use this method to release shared resources, save user data,
invalidate timers,and store enough application state information to restore your
application toits current state in case it is terminated later.// If your application supports background execution,this method is called instead of applicationWillTerminate: when the
user quits.}
func applicationWillEnterForeground(_ application: UIApplication) {// Called as part of the transition from the background to the active
state;here you can undo many of the changes made on entering the background.
}
func applicationDidBecomeActive(_ application: UIApplication) {// Restart any tasks that were paused (or not yet started) while the
application was inactive.
90
If the application was previously in the background, optionallyrefresh the user interface.
}
func applicationWillTerminate(_ application: UIApplication) {// Called when the application is about to terminate. Save dataif appropriate. See also applicationDidEnterBackground:.// Saves changes in the application's managed object context before
the application terminates.//self.saveContext()
}
// MARK: - Core Data stack
lazy var persistentContainer: NSPersistentContainer = {/*The persistent container for the application. This implementationcreates and returns a container, having loaded the store for theapplication to it. This property is optional since there are
legitimateerror conditions that could cause the creation of the store to fail.*/let container = NSPersistentContainer(name: "POC_iOS")container.loadPersistentStores(completionHandler: { (storeDescription
, error) inif let error = error as NSError? {
// Replace this implementation with code to handle the errorappropriately.
// fatalError() causes the application to generate a crash logand terminate. You should not use this
function in a shipping application, although it may be usefulduring development.
/*Typical reasons for an error here include:* The parent directory does not exist, cannot be created, or
disallows writing.* The persistent store is not accessible, due to permissions
or data protectionwhen the device is locked.* The device is out of space.* The store could not be migrated to the current model
version.
91

Check the error message to determine what the actual problemwas.
*/fatalError("Unresolved error \(error), \(error.userInfo)")
}})return container
}()
// MARK: - Core Data Saving support
func saveContext () {let context = persistentContainer.viewContextif context.hasChanges {
do {try context.save()
} catch {// Replace this implementation with code to handle the error
appropriately.// fatalError() causes the application to generate a crash log
and terminate.You should not use this function in a shipping application,
although it maybe useful during development.let nserror = error as NSErrorfatalError("Unresolved error \(nserror), \(nserror.userInfo)")
}}
}
}
//// ViewController.swift// POC_iOS//// Created by Hany Arafa on 10/30/17.// Copyright 2017 Hany Arafa. All rights reserved.//
import UIKitimport Bean_iOS_OSX_SDKimport CoreBluetoothimport UICircularProgressRing
92

class ViewController: UIViewController, UITextFieldDelegate,PTDBeanManagerDelegate,
PTDBeanDelegate {
@IBOutlet weak var percentUpdate: UILabel!@IBOutlet weak var valueFromBean: UILabel!var beanManager: PTDBeanManager!var userID: UITextField!@IBOutlet weak var resetBtn: UIButton!var maxValue: String = " "var dateString: String = " "//@IBOutlet weak var timeTaken: UILabel!@IBOutlet weak var labelMinute: UILabel!@IBOutlet weak var labelSecond: UILabel!@IBOutlet weak var labelMillisecond: UILabel!@IBOutlet weak var testProgressLabel: UILabel!var myBean: PTDBean!var lightState: Bool = falsevar startReading: Bool = truevar stopReading: Bool = falsevar displayTime: Bool = falsevar lastValue: Bool = falsevar newLine: String = ""var csvText = ""
weak var timer: Timer?var startTime: Double = 0var time: Double = 0var elapsed: Double = 0var status: Bool = false
override func didReceiveMemoryWarning() {super.didReceiveMemoryWarning()
}
override func viewDidLoad() {super.viewDidLoad()self.hideKeyboardWhenTappedAround()beanManager = PTDBeanManager()beanManager?.delegate = selflightState = false
93
//Uncomment the line below if you want the tap not not interfere andcancel other interactions.
//tap.cancelsTouchesInView = false
//make the csv up here}
//optional func textFieldDidEndEditing(_ textField: UITextField)
func textFieldShouldReturn( userID : UITextField) -> Bool {userID.resignFirstResponder()return true
}
func beanManagerDidUpdateState(_ beanManager: PTDBeanManager!){
if(self.beanManager!.state == BeanManagerState.poweredOn){self.beanManager?.startScanning(forBeans_error: nil)
} else if (self.beanManager!.state == BeanManagerState.poweredOff) {let alert = UIAlertController(title: "Error", message: "Turn on
bluetooth to continue",preferredStyle: .alert)alert.addAction(UIAlertAction(title: NSLocalizedString("OK",
comment: "Default action"), style: .`default`, handler: { _ in
NSLog("The \"OK\" alert occured.")}))self.present(alert, animated: true, completion: nil)return
}}
func startScanning(){
var error: NSError?beanManager!.startScanning(forBeans_error: &error)if let e = error{
print(e)}else{
94
print("Connection is made")}
}
func beanManager(_ beanManager: PTDBeanManager!, didDiscover bean:PTDBean!, error: Error!) {if myBean == nil {
if bean.state == .discovered {print("bean discovered")// beanDiscovered = trueviewDidAppear(true)myBean = beanbeanManager!.connect(to: bean, withOptions:nil, error: nil)bean.delegate = self
}}
#if DEBUGprint("DISCOVERED BEAN \nName: \(bean.name), UUID: \(bean.
identifier) RSSI: \(bean.rssi)")#endif
}func beanManager(_ beanManager: PTDBeanManager!, didConnect bean:
PTDBean!, error: Error!) {if ((error) != nil) {
let alert = UIAlertController(title: "Error", message: "This isan alert.",
preferredStyle: .alert)alert.addAction(UIAlertAction(title: NSLocalizedString("OK",
comment:"Default action"), style: .`default`, handler: { _ in
NSLog("The \"OK\" alert occured.")}))self.present(alert, animated: true, completion: nil)return;
}
var theError: NSError? = nil
self.beanManager?.stopScanning(forBeans_error: &theError)
if ((theError) != nil) {let alert = UIAlertController(title: "Error", message: "This is
an alert.", preferredStyle: .alert)
95

alert.addAction(UIAlertAction(title: NSLocalizedString("OK",comment:
"Default action"), style: .`default`, handler: { _ inNSLog("The \"OK\" alert occured.")}))
self.present(alert, animated: true, completion: nil)return;
}}
func BeanManager(beanManager: PTDBeanManager!,didDisconnectBean bean: PTDBean!, error: NSError!) {
}
@IBAction func handlerefresh(_ sender: Any) {if(self.beanManager!.state == BeanManagerState.poweredOn){
var theError: NSError? = nil
self.beanManager?.startScanning(forBeans_error: &theError)
if ((theError) != nil) {let alert = UIAlertController(title: "Error", message: "This
is an alert.", preferredStyle: .alert)alert.addAction(UIAlertAction(title: NSLocalizedString("OK", comment: "Default action"), style: .`default`, handler:
{ _ inNSLog("The \"OK\" alert occured.")
}))//let alert: UIAlertController = UIAlertAction(title: "Error",message: theError!.localizedDescription, delegate: nil,cancelButtonTitle: nil, otherButtonTitles: "Ok")//self.present(alert, animated: true, completion: nil)
}}
(sender as! UIRefreshControl).endRefreshing()}
/* func connectionChanged(_ notification: Notification) {// Connection status changed. Indicate on GUI.let userInfo = (notification as NSNotification).userInfo as! [String:
Bool]
96

DispatchQueue.main.async(execute: {// Set image based on connection statusif let isConnected: Bool = userInfo["isConnected"] {
if isConnected {let alertController = UIAlertController(title: "iOScreator
", message:"Hello, world!", preferredStyle:
UIAlertControllerStyle.alert)alertController.addAction(UIAlertAction(title: "Dismiss",
style:UIAlertActionStyle.default,handler: nil))
}else {
let alertController = UIAlertController(title: "iOScreator", message:"Bluetooth is disconnecected. Please check your
connection.",preferredStyle: UIAlertControllerStyle.alert)
alertController.addAction(UIAlertAction(title: "Dismiss",style:
UIAlertActionStyle.default,handler: nil))self.present(alertController, animated: true, completion:
nil)
}}
});}
*/
/* func bean(_ bean: PTDBean!, serialDataReceived data: Data!){if(data != nil){var receivedMessage = NSString(data:data, encoding: String.Encoding.utf8
.rawValue)print("From serial: (receivedMessage)")ledTextLabel.text = receivedMessage! as string}}*/
97

/* func connectToBean(bean: PTDBean){var error: NSError?print ("hi")beanManager!.connect(to: bean, withOptions:nil, error: &error)print("Bean connected")bean.delegate = self
}*/
func sendSerialData(beanState: NSData){
print(myBean)print("bye")//while(lightState == true)//{myBean?.sendSerialData(beanState as Data!)//}//myBean?.sendSerialData(beanState as Data!)print("sent over serial data")
}
func bean(_ bean: PTDBean!, serialDataReceived data: Data!){
if(data != nil){
print ("Received Data")}
let stringData : String = NSString(data: data, encoding : String.Encoding.ascii.rawValue)! as String
if(stringData == "The time is"){
displayTime = truevar stringData : String = NSString(data: data, encoding :String.Encoding.ascii.rawValue)! as String//timeTaken.text? = stringData
}else if(stringData == "Done"){
//put a new line into the csv
98

}else if(stringData == "Finished Calculating Value"){
lastValue = true}else{
/* var onlyDigits: CharacterSet = CharacterSet.decimalDigits.inverted
if stringData.rangeOfCharacter(from: onlyDigits) != nil{let newValue = (Int(stringData)! / 1000) * 100percentUpdate.text = String(newValue)}*/
let numbers = NSCharacterSet(charactersIn: "0123456789.").inverted
if stringData.rangeOfCharacter(from: numbers) == nil{
let newValue = (Double(stringData)! / 100.0) * 100print("HIIII")print(newValue)percentUpdate.text = String(newValue)
}
newLine += stringData + ","if(lastValue == true){
maxValue = stringDatalastValue = false
}else if(lastValue == true){
testProgressLabel.text = "Test is completed."//timeTaken.text? = stringDatanewLine += "\n"csvText.append(newLine)//WHEN THEY CLICK SAVE WRITE THE FILE TO THE PATH WE CREATED
thensend data over to next view controller to exportdisplayTime = false
}else
99

{valueFromBean.text? = stringData
}
}
//var fullString : String = valueFromBean.text!
// valueFromBean.scrollRangeToVisible(NSMakeRange(count(valueFromBean.string!),0))
//put this in a loop (while serialDataReceived < 1000(so led has been turned on) or stop has been pressed)/* if(data != nil){var stringReceived: String = ""
let nLength: Int = data.count / MemoryLayout<UInt8>.sizevar arrData: [UInt8] = [UInt8](repeating: 0, count: nLength)data.copyBytes(to: &arrData, count: nLength)
var n: Int = 0while(n < nLength){let str = String(UnicodeScalar(arrData[n]))stringReceived += strn += 1}print(stringReceived)// var receivedMessage = NSString(data:data, encoding: String.
Encoding.utf8.rawValue)valueFromBean.text = stringReceived as String}*/
// NSString *uuidSubstring = [bean.identifier.UUIDStringsubstringFromIndex:bean.identifier.UUIDString.length-4];// serialOutput = [NSString stringWithFormat:@"%@-%@:%@",bean.name, uuidSubstring,serialOutput];
/* if(serialOutput){serialOutput = [self.consoleOutputTextView.string
stringByAppendingString:serialOutput];self.consoleOutputTextView.string = serialOutput;
100
}
[self.consoleOutputTextView scrollRangeToVisible:NSMakeRange(self.consoleOutputTextView.string.length, 0)];*/
}
/* func saveData(_ sender: Any){
let fileName = "TimeData.csv"let path = NSURL(fileURLWithPath: NSTemporaryDirectory()).
appendingPathComponent(fileName)
do{
try csvText.write(to: path!, atomically: true, encoding: String.Encoding.utf8)
print(csvText)}catch{
print("File creating failed")print("\(error)")
}}*/func start() {
startTime = Date().timeIntervalSinceReferenceDate - elapsedtimer = Timer.scheduledTimer(timeInterval: 0.01, target: self,selector: #selector(updateCounter), userInfo: nil, repeats: true)
// Set Start/Stop button to truestatus = true
}
func stop() {
elapsed = Date().timeIntervalSinceReferenceDate - startTimetimer?.invalidate()
// Set Start/Stop button to falsestatus = false
}
101
@objc func updateCounter() {
// Calculate total time since timer started in secondstime = Date().timeIntervalSinceReferenceDate - startTime
// Calculate minuteslet minutes = UInt8(time / 60.0)time -= (TimeInterval(minutes) * 60)
// Calculate secondslet seconds = UInt8(time)time -= TimeInterval(seconds)
// Calculate millisecondslet milliseconds = UInt8(time * 100)
// Format time vars with leading zerolet strMinutes = String(format: "%02d", minutes)let strSeconds = String(format: "%02d", seconds)let strMilliseconds = String(format: "%02d", milliseconds)
// Add time vars to relevant labelslabelMinute.text = strMinuteslabelSecond.text = strSecondslabelMillisecond.text = strMilliseconds
}@IBAction func pressButtonToChangeValue(_ sender: UIButton!){
if (status) {stop()
//resetBtn.isEnabled = true
// If button status is false use start function, relabel buttonand disable reset button
} else {start()
//resetBtn.isEnabled = falsetestProgressLabel.text = "Test in Progress"print(testProgressLabel.text)
}
102

//newLine = ""//print ("hi")//lightState = true//while (stopReading == false){//let data = NSData(bytes: &lightState, length: MemoryLayout<Bool>.
size)//sendSerialData(beanState: data)// updateLedStatusText(lightState: lightState)
// }
}
/*func stopReadingBean(_ sender: Any){
lightState = falseprint("debugging")let data = NSData(bytes: &lightState, length: MemoryLayout<Bool>.size
)sendSerialData(beanState: data)performSegue(withIdentifier: "transfertoEmail", sender: self)
}*/
@IBAction func viewresult(_ sender: Any) {//lightState = falseprint("debugging")//let data = NSData(bytes: &lightState, length: MemoryLayout<Bool>.
size)// sendSerialData(beanState: data)//performSegue(withIdentifier: "transfertoEmail", sender: self)
}
override func prepare(for segue: UIStoryboardSegue, sender: Any?){
if segue.identifier == "transferToEmail"{
//let controller = segue.destination as!EmailViewController//controller.csvText = csvText//print(userID)//controller.userID.text = userID.text//controller.mPML = maxValue//controller.dateString = dateAndTimeLabel.text!//print(emailViewController?.userID.text as Any)
}
103

}}
//// ConnectionViewController.swift// POC_iOS//// Created by Hany Arafa on 10/30/17.// Copyright 2017 Hany Arafa. All rights reserved.//
import UIKitimport Bean_iOS_OSX_SDKimport CoreBluetooth
class ConnectionViewController: UIViewController, PTDBeanManagerDelegate,PTDBeanDelegate
{var beanManager: PTDBeanManager?var myBean: PTDBean?
@IBOutlet weak var connectionLabel: UILabel!
@IBOutlet weak var beanNameChanged: UILabel!
override func didReceiveMemoryWarning(){
super.didReceiveMemoryWarning()}
override func viewDidLoad() {super.viewDidLoad()self.hideKeyboardWhenTappedAround()beanManager = PTDBeanManager()beanManager!.delegate = self
}
func textFieldShouldReturn( userID : UITextField) -> Bool {userID.resignFirstResponder()return true
}
104
override func viewDidAppear(_ animated: Bool){if(self.myBean != nil){
beanManager?.disconnectBean(myBean, error: nil)self.myBean = nil}
var error: NSError?beanManager!.startScanning(forBeans_error: &error)if let e = error{print(e)}else{print("Connection is made")}}
func update() {if (self.myBean!.state == .discovered) {
//self.connectToBean.title = "Connect"self.connectionLabel.isEnabled = true
} else if (self.myBean!.state == .connectedAndValidated ) {//self.connectToBean.title = "Disconnect"self.connectionLabel.isEnabled = true
}
}
func beanManagerDidUpdateState(_ beanManager: PTDBeanManager!){
let scanError: NSError?if beanManager!.state == BeanManagerState.poweredOn{
print("made it here")startScanning()print("made it here part 2")
}
}
105

func startScanning(){
var error: NSError?beanManager!.startScanning(forBeans_error: &error)if let e = error{
print(e)}else{
print("Connection is made")}
}
@IBAction func connectToBean(_ sender: Any){
//self.myBean!.delegate = self//beanManager!.connect(to: myBean, withOptions:nil, error: nil)//myBean?.delegate = self//self.connectionLabel.isEnabled = false
beanManager!.connect(to: myBean, withOptions:nil, error: nil)myBean?.delegate = selfconnectionLabel.text = "You are now connected"
}
func beanManager(_ beanManager: PTDBeanManager!, didDiscover bean:PTDBean!, error: Error!)
{if myBean == nil{
if bean.state == .discovered{
print("bean discovered")beanNameChanged.text = bean.name// beanDiscovered = trueviewDidAppear(true)myBean = beanbeanManager!.connect(to: bean, withOptions:nil, error: nil)// bean.delegate = self
}}
106

#if DEBUGprint("DISCOVERED BEAN \nName: \(bean.name), UUID: \(bean.
identifier) RSSI: \(bean.rssi)")#endif
}
func beanManager(_ beanManager: PTDBeanManager!, didConnect bean:PTDBean!, error: Error!) {if ((error) != nil) {
let alert = UIAlertController(title: "Error", message: "This isan alert.", preferredStyle: .alert)
alert.addAction(UIAlertAction(title: NSLocalizedString("OK",comment: "Default action"),
style: .`default`, handler: { _ inNSLog("The \"OK\" alert occured.")}))
self.present(alert, animated: true, completion: nil)return;
}
var theError: NSError? = nil
self.beanManager?.stopScanning(forBeans_error: &theError)
if ((theError) != nil) {let alert = UIAlertController(title: "Error", message: "This is
an alert.",preferredStyle: .alert)alert.addAction(UIAlertAction(title: NSLocalizedString("OK", comment: "Default action"),style: .`default`, handler: { _ in
NSLog("The \"OK\" alert occured.")}))self.present(alert, animated: true, completion: nil)return;
}}
func BeanManager(beanManager: PTDBeanManager!, didDisconnectBean bean:PTDBean!, error: Error!) {if (myBean == self.myBean) {
self.update()}
}
107

@IBAction func handlerefresh(_ sender: Any){
if(self.beanManager!.state == BeanManagerState.poweredOn){var theError: NSError? = nil
self.beanManager?.startScanning(forBeans_error: &theError)
if ((theError) != nil) {let alert = UIAlertController(title: "Error", message: "This is
an alert.", preferredStyle: .alert)alert.addAction(UIAlertAction(title: NSLocalizedString("OK",
comment: "Default action"),style: .`default`, handler: { _ in
NSLog("The \"OK\" alert occured.")}))//let alert: UIAlertController = UIAlertAction(title: "Error",message: theError!.localizedDescription,delegate: nil, cancelButtonTitle: nil, otherButtonTitles: "Ok")//self.present(alert, animated: true, completion: nil)
}}
(sender as! UIRefreshControl).endRefreshing()
}
override func prepare(for segue: UIStoryboardSegue, sender: Any?){if segue.identifier == "transferToPatientScreen"{let controller = segue.destination as! IDViewController//controller.dateString = dateAndTimeLabel.text!//controller.myBean = myBean}
}}
108
//// EmailViewController.swift// POC_iOS//// Created by Hany Arafa on 10/30/17.// Copyright 2017 Hany Arafa. All rights reserved.//
import UIKitimport MessageUI
class EmailViewController: UIViewController,MFMailComposeViewControllerDelegate {
@IBOutlet weak var dateLabel : UILabel!@IBOutlet weak var moleculesPerMicroL: UILabel!var mPML: String = " "@IBOutlet weak var userID: UITextField!var userIDString: String = " "var csvText : String = " "var result : String = " "@IBOutlet weak var senditTapped: UIButton!@IBOutlet weak var sendButton: UIButton!override func viewDidLoad() {
super.viewDidLoad()self.hideKeyboardWhenTappedAround()let currentDateTime = Date()
// initialize the date formatter and set the stylelet formatter = DateFormatter()formatter.timeStyle = .shortformatter.dateStyle = .short
// get the date time String from the date objectlet result = formatter.string(from: currentDateTime) // October 8,
2017 at 10:48:53 PM
dateLabel.text = result//labelSecond.text = strSeconds//userID.text = userIDString//moleculesPerMicroL.text = mPML//dateTimeLabel.text = dTL// Do any additional setup after loading the view.
109

}
override func didReceiveMemoryWarning(){
super.didReceiveMemoryWarning()// Dispose of any resources that can be recreated.
}@IBAction func testing(_ sender: Any) {
print("touchdown")}
/*@IBAction func exportCSV(_ sender: UIButton!){
let fileName = "TimeData.csv"let path = NSURL(fileURLWithPath: NSTemporaryDirectory()).
appendingPathComponent(fileName)do{
try csvText.write(to: path!, atomically: true, encoding: String.Encoding.utf8)
}catch{
print("Failed to export file")}let emailViewController = configuredMailComposeViewController()if MFMailComposeViewController.canSendMail(){
self.present(emailViewController, animated: true, completion: nil)
}}*/
@IBAction func sendEmailButtonTapped(_ sender: Any) {let mailComposeViewController = configuredMailComposeViewController()if MFMailComposeViewController.canSendMail() {
self.present(mailComposeViewController, animated: true,completion: nil)
} else {self.showSendMailErrorAlert()
}}
110

func configuredMailComposeViewController() ->MFMailComposeViewController {let mailComposerVC = MFMailComposeViewController()mailComposerVC.mailComposeDelegate = self // Extremely important to
setthe --mailComposeDelegate-- property,NOT the --delegate-- property
mailComposerVC.setToRecipients(["[email protected]"])mailComposerVC.setSubject("Sending you an in-app e-mail...")mailComposerVC.setMessageBody("Sending e-mail in-app is not so bad!",
isHTML: false)
return mailComposerVC}
func showSendMailErrorAlert() {let sendMailErrorAlert = UIAlertView(title: "Could Not Send Email",
message: "Your devicecould not send e-mail. Please check e-mail configuration and try
again.",delegate: self, cancelButtonTitle: "OK")sendMailErrorAlert.show()
}
// MARK: MFMailComposeViewControllerDelegate Methodfunc mailComposeController(_ controller: MFMailComposeViewController,didFinishWith result: MFMailComposeResult, error: Error?) {
controller.dismiss(animated: true, completion: nil)}/* func configuredMailComposeViewController() ->
MFMailComposeViewController{
let emailController = MFMailComposeViewController()emailController.mailComposeDelegate = selfemailController.setSubject("CSV File")emailController.setMessageBody("Here is the data", isHTML: false)
let data = csvText.data(using: String.Encoding.utf8,allowLossyConversion: false)!
emailController.addAttachmentData(data, mimeType: "text/csv",fileName: "TimeData.csv")
return emailController
111

}
func mailComposeController(_ controller: MFMailComposeViewController,didFinishWith result: MFMailComposeResult, error: Error?) {
controller.dismiss(animated: true, completion: nil)//pop up with notification saying "your message has been sent!"
}*/
override func prepare(for segue: UIStoryboardSegue, sender: Any?){
if segue.identifier == "backToTest"{
//let controller = segue.destination as! ViewController// controller.userID.text = userID.text!// print(userID.text as Any)
//controller.dateString = dateAndTimeLabel.text!//controller.dateString = dateTimeLabel.text!
}}/*// MARK: - Navigation// In a storyboard-based application, you will often want to do a littlepreparation before navigationoverride func prepare(for segue: UIStoryboardSegue, sender: Any?) {// Get the new view controller using segue.destinationViewController.// Pass the selected object to the new view controller.}*/
}
//// IDViewController.swift// POC_iOS//// Created by Hany Arafa on 10/30/17.// Copyright 2017 Hany Arafa. All rights reserved.//import UIKitimport Bean_iOS_OSX_SDKimport CoreBluetooth
112
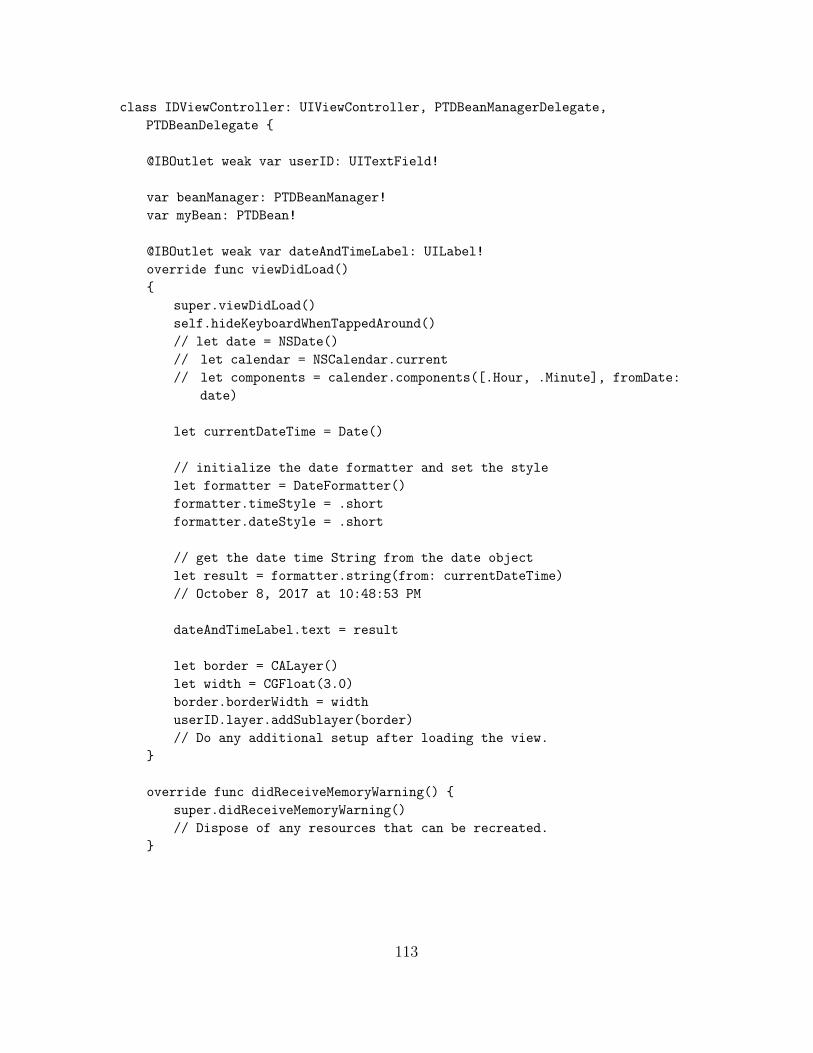
class IDViewController: UIViewController, PTDBeanManagerDelegate,PTDBeanDelegate {
@IBOutlet weak var userID: UITextField!
var beanManager: PTDBeanManager!var myBean: PTDBean!
@IBOutlet weak var dateAndTimeLabel: UILabel!override func viewDidLoad(){
super.viewDidLoad()self.hideKeyboardWhenTappedAround()// let date = NSDate()// let calendar = NSCalendar.current// let components = calender.components([.Hour, .Minute], fromDate:
date)
let currentDateTime = Date()
// initialize the date formatter and set the stylelet formatter = DateFormatter()formatter.timeStyle = .shortformatter.dateStyle = .short
// get the date time String from the date objectlet result = formatter.string(from: currentDateTime)// October 8, 2017 at 10:48:53 PM
dateAndTimeLabel.text = result
let border = CALayer()let width = CGFloat(3.0)border.borderWidth = widthuserID.layer.addSublayer(border)// Do any additional setup after loading the view.
}
override func didReceiveMemoryWarning() {super.didReceiveMemoryWarning()// Dispose of any resources that can be recreated.
}
113

func textFieldShouldReturn(userID: UITextField) -> Bool {userID.resignFirstResponder()return true
}
/*** Called when the user click on the view (outside the UITextField).
override func touchesBegan(touches: Set<UITouch>, withEvent event:UIEvent?) {self.view.endEditing(true)
}*/
override func prepare(for segue: UIStoryboardSegue, sender: Any?){
if segue.identifier == "idSegue"{
//let controller = segue.destination as! ViewController//controller.userID = userID.text//controller.dateString = dateAndTimeLabel.text!//controller.myBean = myBean//print(dateAndTimeLabel.text as Any)
}}
/*// MARK: - Navigation// In a storyboard-based application, you will often want to do alittle preparation before navigationoverride func prepare(for segue: UIStoryboardSegue, sender: Any?) {// Get the new view controller using segue.destinationViewController.// Pass the selected object to the new view controller.}*/
}
//// extensionkeyboard.swift// POC_iOS//// Created by Hany Arafa on 12/3/17.// Copyright 2017 Hany Arafa. All rights reserved.
114
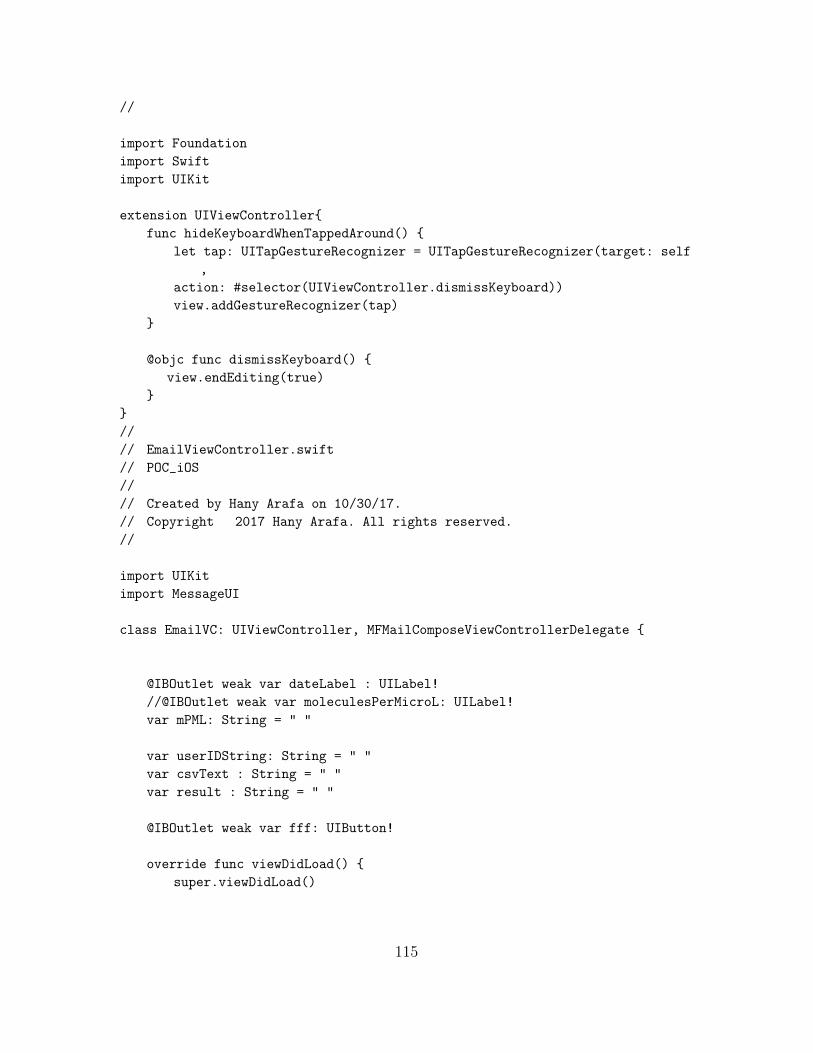
//
import Foundationimport Swiftimport UIKit
extension UIViewController{func hideKeyboardWhenTappedAround() {
let tap: UITapGestureRecognizer = UITapGestureRecognizer(target: self,
action: #selector(UIViewController.dismissKeyboard))view.addGestureRecognizer(tap)
}
@objc func dismissKeyboard() {view.endEditing(true)
}}//// EmailViewController.swift// POC_iOS//// Created by Hany Arafa on 10/30/17.// Copyright 2017 Hany Arafa. All rights reserved.//
import UIKitimport MessageUI
class EmailVC: UIViewController, MFMailComposeViewControllerDelegate {
@IBOutlet weak var dateLabel : UILabel!//@IBOutlet weak var moleculesPerMicroL: UILabel!var mPML: String = " "
var userIDString: String = " "var csvText : String = " "var result : String = " "
@IBOutlet weak var fff: UIButton!
override func viewDidLoad() {super.viewDidLoad()
115

self.hideKeyboardWhenTappedAround()let currentDateTime = Date()
// initialize the date formatter and set the stylelet formatter = DateFormatter()formatter.timeStyle = .shortformatter.dateStyle = .short
// get the date time String from the date object//let result = formatter.string(from: currentDateTime) // October 8,
2017 at 10:48:53 PM
//dateLabel.text = result//labelSecond.text = strSeconds//userID.text = userIDString//moleculesPerMicroL.text = mPML//dateTimeLabel.text = dTL// Do any additional setup after loading the view.
}
override func didReceiveMemoryWarning(){
super.didReceiveMemoryWarning()// Dispose of any resources that can be recreated.
}@IBAction func testing(_ sender: Any) {
print("touchdown")}
/*@IBAction func exportCSV(_ sender: UIButton!){let fileName = "TimeData.csv"let path = NSURL(fileURLWithPath: NSTemporaryDirectory()).
appendingPathComponent(fileName)do{try csvText.write(to: path!, atomically: true, encoding: String.Encoding
.utf8)}catch{print("Failed to export file")}let emailViewController = configuredMailComposeViewController()
116

if MFMailComposeViewController.canSendMail(){self.present(emailViewController, animated: true, completion: nil)}}*/
@IBAction func sendEmailButtonTapped(_ sender: Any) {let mailComposeViewController = configuredMailComposeViewController()if MFMailComposeViewController.canSendMail() {
self.present(mailComposeViewController, animated: true,completion: nil)
} else {self.showSendMailErrorAlert()
}}
func configuredMailComposeViewController() ->MFMailComposeViewController {let mailComposerVC = MFMailComposeViewController()mailComposerVC.mailComposeDelegate = self // Extremely important toset the --mailComposeDelegate-- property, NOT the --delegate--
property
mailComposerVC.setToRecipients(["[email protected]"])mailComposerVC.setSubject("Flex Dx Results for Patient Harafa")mailComposerVC.setMessageBody("Your data has now been saved locally.You can send it to a health care provider below.", isHTML: false)
return mailComposerVC}
func showSendMailErrorAlert() {let sendMailErrorAlert = UIAlertView(title: "Could Not Send Email",
message: "Yourdevice could not send e-mail. Please check e-mail configuration and
try again.",delegate: self, cancelButtonTitle: "OK")sendMailErrorAlert.show()
}
// MARK: MFMailComposeViewControllerDelegate Methodfunc mailComposeController(_ controller: MFMailComposeViewController,didFinishWith result: MFMailComposeResult, error: Error?) {
controller.dismiss(animated: true, completion: nil)
117

}/* func configuredMailComposeViewController() ->
MFMailComposeViewController{let emailController = MFMailComposeViewController()emailController.mailComposeDelegate = selfemailController.setSubject("CSV File")emailController.setMessageBody("Here is the data", isHTML: false)
let data = csvText.data(using: String.Encoding.utf8,allowLossyConversion: false)!
emailController.addAttachmentData(data, mimeType: "text/csv", fileName:"TimeData.csv")
return emailController}
func mailComposeController(_ controller: MFMailComposeViewController,didFinishWith result: MFMailComposeResult, error: Error?) {controller.dismiss(animated: true, completion: nil)//pop up with notification saying "your message has been sent!"}*/
override func prepare(for segue: UIStoryboardSegue, sender: Any?){
if segue.identifier == "backToTest"{
//let controller = segue.destination as! ViewController// controller.userID.text = userID.text!// print(userID.text as Any)//controller.dateString = dateAndTimeLabel.text!//controller.dateString = dateTimeLabel.text!
}}/*// MARK: - Navigation// In a storyboard-based application, you will often want to do a little
preparation before navigationoverride func prepare(for segue: UIStoryboardSegue, sender: Any?) {// Get the new view controller using segue.destinationViewController.// Pass the selected object to the new view controller.}*/
118

}
//// POC_iOSUITests.swift// POC_iOSUITests//// Created by Hany Arafa on 10/30/17.// Copyright 2017 Hany Arafa. All rights reserved.//import UIKitimport XCTest
class POC_iOSUITests: XCTestCase {var app: XCUIApplication!
override func setUp() {super.setUp()
// Put setup code here. This method is called before theinvocation of each test method in the class.app = XCUIApplication()// In UI tests it is usually best to stop immediately when a failure
occurs.continueAfterFailure = false// UI tests must launch the application that they test. Doing this in
setupwill make sure it happens for each test method.//XCUIApplication().launch()app.launchArguments.append("--uitesting")// In UI tests its important to set the initial state - such as
interface orientation -required for your tests before they run. The setUp method is a good
place to do this.}func testGoingThroughOnboarding() {
app.launch()app.launchArguments.append("skipEntryViewController")// Make sure we're displaying onboarding//XCTAssertTrue(app.isDisplayingOnboarding)
// Swipe left three times to go through the pages//app.buttons["Connect"].tap()//app.swipeLeft()
119

// Tap the "Done" button//XCUIApplication().buttons["Connect"].tap()
// XCTAssert(app.connecttoBean.exists)//app.buttons["Done"].tap()
// Onboarding should no longer be displayed//XCTAssertFalse(app.isDisplayingOnboarding)
}
override func tearDown() {// Put teardown code here. This method is called after theinvocation of each test method in the class.super.tearDown()
}
func testExample() {// Use recording to get started writing UI tests.// Use XCTAssert and related functions toverify your tests produce the correct results.
}
}
120

APPENDIX B
PROTOCOLS FOR ASSAYS
121
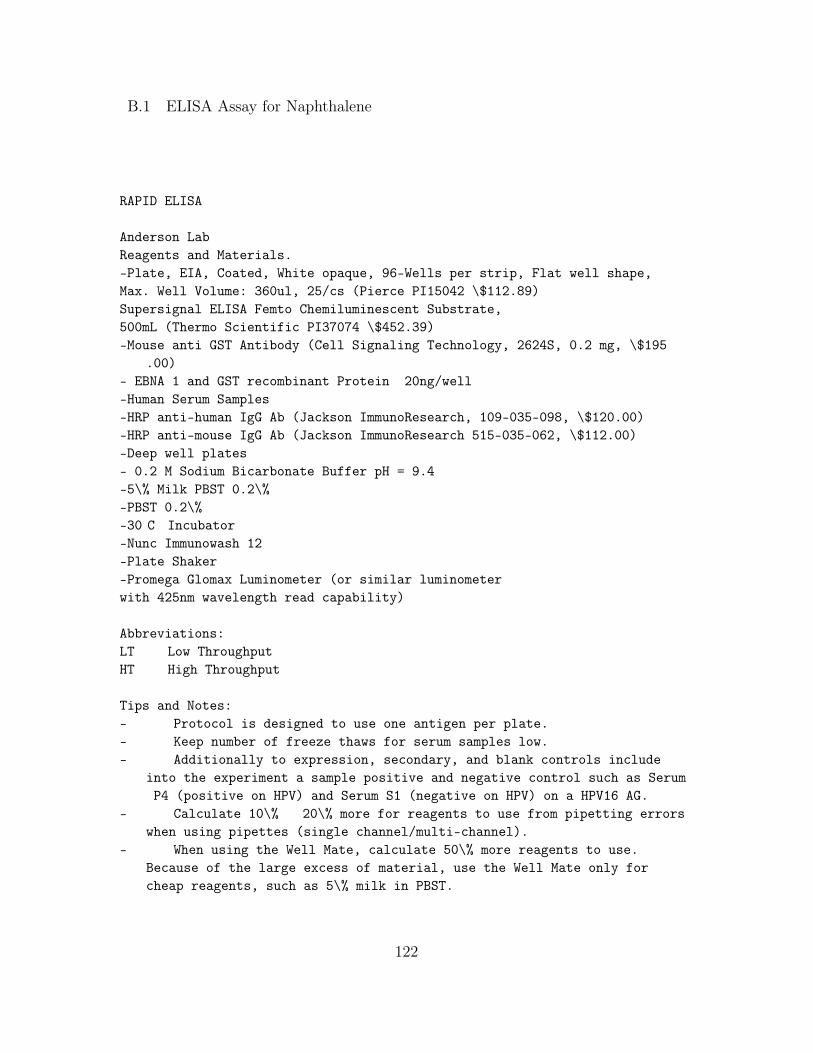
B.1 ELISA Assay for Naphthalene
RAPID ELISA
Anderson LabReagents and Materials.-Plate, EIA, Coated, White opaque, 96-Wells per strip, Flat well shape,Max. Well Volume: 360ul, 25/cs (Pierce PI15042 \$112.89)Supersignal ELISA Femto Chemiluminescent Substrate,500mL (Thermo Scientific PI37074 \$452.39)-Mouse anti GST Antibody (Cell Signaling Technology, 2624S, 0.2 mg, \$195
.00)- EBNA 1 and GST recombinant Protein 20ng/well-Human Serum Samples-HRP anti-human IgG Ab (Jackson ImmunoResearch, 109-035-098, \$120.00)-HRP anti-mouse IgG Ab (Jackson ImmunoResearch 515-035-062, \$112.00)-Deep well plates- 0.2 M Sodium Bicarbonate Buffer pH = 9.4-5\% Milk PBST 0.2\%-PBST 0.2\%-30 C Incubator-Nunc Immunowash 12-Plate Shaker-Promega Glomax Luminometer (or similar luminometerwith 425nm wavelength read capability)
Abbreviations:LT Low ThroughputHT High Throughput
Tips and Notes:- Protocol is designed to use one antigen per plate.- Keep number of freeze thaws for serum samples low.- Additionally to expression, secondary, and blank controls include
into the experiment a sample positive and negative control such as SerumP4 (positive on HPV) and Serum S1 (negative on HPV) on a HPV16 AG.
- Calculate 10\% 20\% more for reagents to use from pipetting errorswhen using pipettes (single channel/multi-channel).
- When using the Well Mate, calculate 50\% more reagents to use.Because of the large excess of material, use the Well Mate only forcheap reagents, such as 5\% milk in PBST.
122

- During IVTT preparation step, work on ice to ensure, that each AGstarts expressing on the same time when put into the incubator. Afterexpressing and adding milk to the AG, keep expression mixture on iceuntil ready to distribute into wells.
- Keep ECL solution covered to protect from light exposure.- When reading the plate with the Glomax, save the data after each
plate read to ensure minimal loss of data due to technical difficulties.Technical failure to read the plate occurs often when reading many
plates. The most important plate is the background subtraction platewith the GST AG. Run this plate within \#1 - \#4 in a random fashion.
Day 11. Well Coating coat wells with 100 ul/well of 200 ng/mL of either
EBNA -1 or GST recombinant protien in 0.2M sodium bicarbonate bufferovernight @ 4C.
2. Distribute serum into deep-well blocks (see complete protocol fordilution and volume). Depending on the amount of antigens to be testedand concentration of serum, this volume will vary.
Day 23. Make 5\% Milk PBST 0.2\% in advance (one plate will consume 50-75mL
milk) and allow it to mix for at least 2 hours before using it.4. Wash Plate remove the plate from 4C environment and dump Protein/
Sodium Bicarbonate buffer into a bucket and pat plate off on papertowels. Add 200ul/well of PBST 0.2\%. Repeat 5x. Blot Plate after fifthwash.
5. Block Plate Add 200ul/well of 5\% Milk PBST 0.2\% and let sit atroom temperature for 1.5 hours.
a. LT: Use a multichannel pipet to add milk to plates.b. HT: Use Biomek FX* to add milk to plates.6. Prepare serum blocking buffer Add E Coli lysate to 5\% Milk PBST
0.2\% at a ratio of 1:10. See separate protocol for preparation of EColi Lysate.
7. Block Serum block/dilute serum (1:100) with serum blocking buffer.Dilute and add positive (mouse anti-GST mAb) and negative (blank)
controls to appropriate wells. Leave rotating or shaking for at least 2hours.
a. LT Use serum blocking buffer to dilute (1:100), and concurrentlyblock, serum samples in tubes for at least 2 hours.
b. HT after serum has thawed in deep well block, dilute serumsamples 1:100 by adding appropriate amount of serum blocking buffer (
123

just make sure total volume equals 100ul/well). Then centrifuge platesfor 1m at 1000rpm and leave on a plate shaker for at least 2 hours.
8. Wash plate Wash plate with 200ul/well with PBST 0.2\% using NUNCimmunowash 12 (put 10\% bleach into waste receptacle). Repeat 5x leavingat least one minute between washes. After the last wash, wait 1 minute
and blot plates on paper towels.9. Add sera and primary antibodies add diluted human serum into
appropriate wells.a. LT and HT: Add 100ul/well of anti-GST mAB (positive control, tests
for protein expression) at a 1:3000 dilution in 5\% Milk PBST 0.2\% toappropriate wells.
b. LT: add diluted sera to plate manually.c. HT: add diluted sera using source plate on the Biomek FX.10. Shake at 500 RPM for 1 hour at RT.11. Wash plate - Dump sera out into a bucket with 10\% bleach and wash
plate with 200ul/well with PBST 0.2\%. Repeat 5x. Leave PBST in wells forat least 1 minute between washes and after last wash. Blot plate on
paper towels following last wash.12. Add Secondary Add 100ul/well diluted secondary antibody.a. Serum samples: HRP Goat anti-Human IgG 1:10,000 dilution in 5\% Milk
PBST 0.2\%.b. Positive Control and select negative controls: HRP Sheep anti-Mouse
IgG 1:6250 dilution in 5\% Milk PBST 0.2\%.13. Shake at 600 RPM for 1 hour at RT.14. Prepare ECL Calculate how much ECL is required before hand (100ul
total working solution per well) and combine equal volumes of bothsolutions shortly before use.
a. Note: ECL working solution is a combination of luminol/enhancer andstable peroxide buffer mixed together in equal volumes.
15. Wash Plate - Wash plate with 200ul/well with PBST 0.2\% using NUNCimmunowash 12. Repeat 5x leaving at least one minute between washes.After the last wash, wait 1 minute and blot plates on paper towels.
16. Add ECL Add 100ul/well of the combined ECL solutions.17. Measure luminescence using a luminometer at 425nm wavelength. Read
the plate within 1-5 minutes after shaking as the signal can drop offafter extended periods.
*SOP for Beckman Coulter Biomek FX Liquid Handler System1. Turn on Biomek (Power button is on the way top. You may need a stool)
and turn on computer. Username is Administrator and there is nopassword.
2. Tips to use are Beckman Coulter Biomek AP96 P250 Pipette Tips,#717253. Unwrap tips and remove lid, and place in tip holder underneaththe robots head. Make sure the box is aligned properly!
124
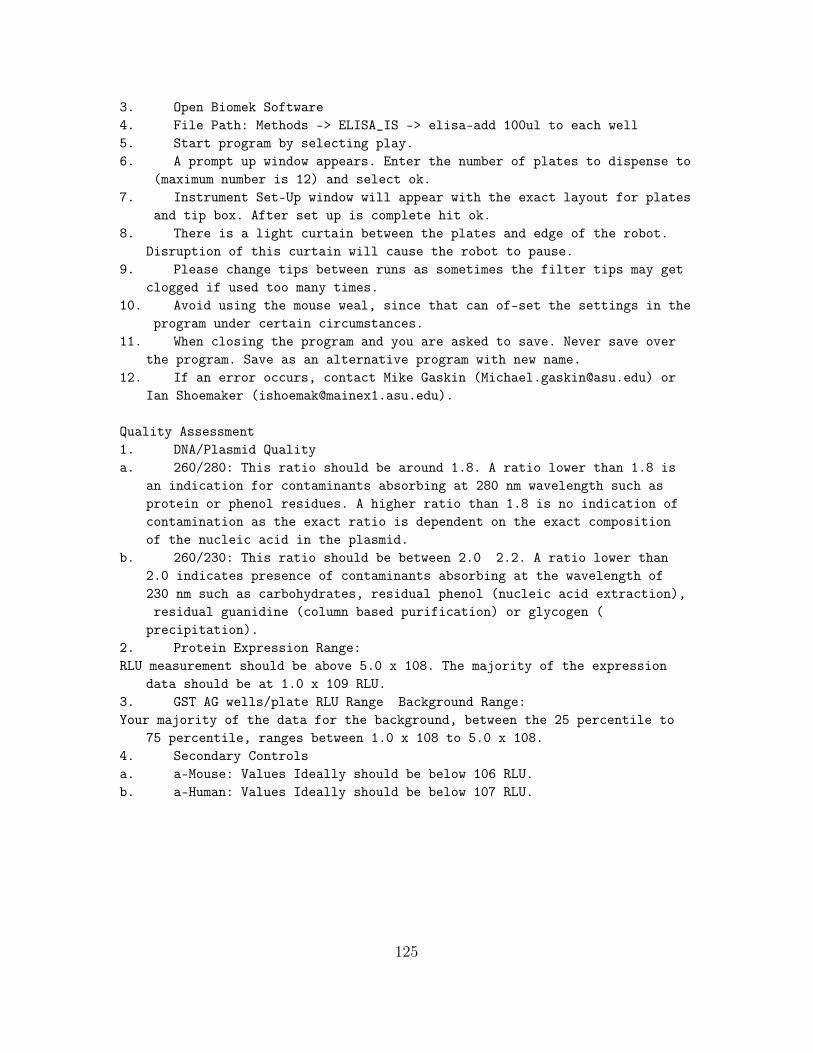
3. Open Biomek Software4. File Path: Methods -> ELISA_IS -> elisa-add 100ul to each well5. Start program by selecting play.6. A prompt up window appears. Enter the number of plates to dispense to
(maximum number is 12) and select ok.7. Instrument Set-Up window will appear with the exact layout for plates
and tip box. After set up is complete hit ok.8. There is a light curtain between the plates and edge of the robot.
Disruption of this curtain will cause the robot to pause.9. Please change tips between runs as sometimes the filter tips may get
clogged if used too many times.10. Avoid using the mouse weal, since that can of-set the settings in the
program under certain circumstances.11. When closing the program and you are asked to save. Never save over
the program. Save as an alternative program with new name.12. If an error occurs, contact Mike Gaskin ([email protected]) or
Ian Shoemaker ([email protected]).
Quality Assessment1. DNA/Plasmid Qualitya. 260/280: This ratio should be around 1.8. A ratio lower than 1.8 is
an indication for contaminants absorbing at 280 nm wavelength such asprotein or phenol residues. A higher ratio than 1.8 is no indication ofcontamination as the exact ratio is dependent on the exact compositionof the nucleic acid in the plasmid.
b. 260/230: This ratio should be between 2.0 2.2. A ratio lower than2.0 indicates presence of contaminants absorbing at the wavelength of230 nm such as carbohydrates, residual phenol (nucleic acid extraction),residual guanidine (column based purification) or glycogen (
precipitation).2. Protein Expression Range:RLU measurement should be above 5.0 x 10⁸. The majority of the expression
data should be at 1.0 x 10⁹ RLU.3. GST AG wells/plate RLU Range Background Range:Your majority of the data for the background, between the 25 percentile to
75 percentile, ranges between 1.0 x 10⁸ to 5.0 x 108.4. Secondary Controlsa. a-Mouse: Values Ideally should be below 106 RLU.b. a-Human: Values Ideally should be below 107 RLU.
125

APPENDIX C
IRB DOCUMENTATION FOR BLOOD COLLECTION
126

C.1 Bioscience IRB Form
Instructions and Notes:Depending on the nature of what you are doing, some sections may not
be applicable to your research. If so mark as NA.When you write a protocol, keep an electronic copy. You will need to
modify this copy when making changes.1 Protocol TitleInclude the full protocol title: Smart and Connected Health Study
2 Background and ObjectivesProvide the scientific or scholarly background for, rationale for, and
significance of the research based on the existing literature and howwill it add to existing knowledge.
Describe the purpose, specific aims, or objectives.State the hypotheses to be tested.Describe the relevant prior experience and gaps in current knowledge.Describe any relevant preliminary data.
Traditionally minimally-invasive biomarker screening is performed usingblood, urine, or saliva. Eccrine sweat glands are heavily interwovenwith capillaries beneath the epidermal surface; hence, we predict thatsweat may be a resourceful bodily fluid for diagnostics. Our epidermalsurfaces represent the largest organ in our body, yet relatively littleis known regarding the proteins, antibodies, or nucleic acids secreted orpresent on its surface in healthy individuals or in response to a
pathogen or disease. While we know that sweat contains electrolytes,proteins, peptides, antibodies, amino acids, and xenobiotics (drugs andethanol), there has yet to be a comprehensive study of the proteomiccontent of sweat. Our goal is to investigate the proteomic compositionof sweat with a focus on immune-related biomarkers. Previously, ourgroup had discovered that there is a plethora of immunoglobulins andcytokines that have yet to be reported in human sweat samples. Thesefindings were not concurrently confirmed in blood samples and thus,require further validation. In order to confirm any proteomic findingsin sweat samples, we will also need to correlate those findings toproteins present in blood samples. Further, we will need to collectsweat, capillary blood, and venous blood samples to develop platforms forwearable and point of care biosensors.
We will use the Macroduct sweat collector (without the iontophoresis system),an absorbent pad, and/or a similar passive sweat collection device to
collect sweat from adults. The Macroduct sweat collector is an FDA
127

approved, disposable plastic device that is strapped to the forearm tohold it in place during passive sweat collection. The sweat secreted bythe sweat glands is forced from the ducts under hydraulic pressure andflows between the skin and the concave undersurface of the Macroductcollector into a microbore tubing spiral. After collection a bluntneedle on a TB syringe can be inserted into the open end of themicropore tubing to withdraw the collected sample.
We will use a disposable, retractable lancet, lancing device, and/or theHemolink blood collection device to collect capillary blood samples fora select number of participants. Venous blood samples will be collectedby a trained phlebotomist at the ASU Health Service Center on Tempecampus.
3 Data UseDescribe how the data will be used. Examples include:
Dissertation, Thesis, Undergraduate honors projectPublication/journal article, conferences/presentationsResults released to agency or organization
Results released to participants/parentsResults released to employer or schoolOther (describe)
The de-identified data will be used in dissertations and theses as well aspublications/journal articles and conferences/presentations. The resultswill be presented to the National Science Foundation and National
Institutes of health.
4 Inclusion and Exclusion CriteriaDescribe the inclusion and the exclusion criteria for the study.Describe how individuals will be screened for eligibility.Indicate specifically whether you will target or exclude each of the
following special populations:Minors (individuals who are under the age of 18)Adults who are unable to consentPregnant womenPrisonersNative AmericansUndocumented individuals
We will only include adults who are able to consent. They must already beplanning to participate in a physical activity as part of their normalexercise routine. We will exclude minors and adults who are unable to
128

consent. There will be no selection based on race, ethnicity, orimmigration status. No individuals of special populations will bespecifically targeted.
Inclusion CriteriaTo be enrolled in the study, the patients will meet the following inclusion
criteria:1. The donor is able to give informed written consent.2. The donor is at least 18 years old.3. The donor is already planning to participate in a physical activity as
part of their normal exercise routine.4. Consenting adults (such as staff and students from the Biodesign
Institute or ASU) who are willing to donate sweat or blood for researchpurposes.
Exclusion CriteriaPatients who meet any of the following criteria will be excluded from the
study:1. Subject is unable to provide a written consent.2. The subject is a minor.3. The subject weighs less than 110 pounds (only applies to participants
donating a venous blood sample).5 Number of ParticipantsIndicate the total number of participants to be recruited and enrolled
Provide a rationale for the proposed enrollment numberWhat percentage of screened individuals will likely qualify for the
study?We plan to recruit 300 individuals for sweat collection, another 300
individuals for sweat and blood (capillary or venous) collection, andanother 300 individuals for only blood (capillary or venous) collection.We anticipate 80\% of the individuals will qualify for and complete thestudy. This will result in approximately 240 samples for each of the
three collection groups (sweat only, sweat + blood, and blood only). Wefurther anticipate that the sample size collected from 10\% of ourparticipants will not provide sufficient volume of sweat or blood for ourstudy. This will further reduce our sample size to approximately 216
samples for each of the three collection groups. Approximately 216samples for each collection group will provide us with a sufficientlylarge ensemble to investigate the proteomic composition of sweat anddevelop platforms for wearable and point of care biosensors.
6 Recruitment MethodsDescribe when, where, and how potential participants will be
identified and recruited.
129

Describe materials that will be used to recruit participants. (Attachcopies of these documents with the application.)
Does any member have a dual role with the study population?We will recruit individuals who are already planning to participate in
physical activity. This should be part of their usual exercise routine,and they should know of no health risk to conducting the exercise. Themembers will be recruited by word of mouth, email, and flyers. We willrequest e-mailing lists from local events. We will post flyers locallyand via social media. The email addresses will be used for this studyonly and will not be linked to the samples in any way. Participantsparticipating in the sweat only or blood (capillary or venous) onlycollection will receive a \$15 gift card. Participants participating inthe sweat and blood collection will receive a \$20 gift card for thesweat and capillary blood collection and \$30 gift card for the sweatand venous blood collection. Participants donating capillary and venousblood will receive a \$30 gift card. Gift cards will be for Target orStarbucks, depending on the participants preference.
7 Study TimelinesDescribe:
The duration of an individual participants participation in the study.
The duration anticipated to enroll all study participants.The estimated date for the investigators to complete this study (up
to and including primary analyses).Participants, who consent to the sweat collection, will wear the sweat
collection devices on either the arm or abdominal area for 12 hours perday on two days within a seven-day period, one day on which theyparticipate in physical activity and another day with little to nophysical activity. Participants, who consent to the capillary bloodcollection, will perform capillary blood self-collection via adisposable, retractable lancet, lancing device, or HemoLink on the samedays as their sweat collection. Venous blood collections will beperformed at the participants convenience at the ASU Health ServicesCenter. No costs will be charged to the participants for a venous bloodcollection. We expect to start enrolling participants in the studystarting April 15th, 2018 and conclude the study August 30, 2022.
8 Procedures InvolvedDescribe and explain the study design. Provide a description of all research
procedures being performed and when they are performed. Describeprocedures including:
The documents/ measures / devices/ records /sampling that will be
130
used to collect data about participants. (Attach all surveys, scripts,and data collection forms).
What data will be collected including long-term follow-up?All drugs and medical devices used in the research and the purpose of
their use, and their regulatory approval status.Describe the available compensation (monetary or credit that will be
provided to research participants).Describe any costs that participants may be responsible for because
of participation in the research.The participants will sign the included consent form. There are six
different consent forms as participants will be presented with sixoptions. 1) Participant will donate only sweat samples. 2) Participantswill donate sweat and capillary blood samples. 3) Participant willdonate sweat and venous blood samples. 4) Participants will donate onlycapillary blood samples. 5) Participants will donate only venous bloodsamples. 6) Participants will donate capillary and venous blood samples.Participants will not be pushed to choose any specific options as the
choice will be entirely voluntary.
Thus, participants, who choose option #1, will be asked to collect sweat for12 hours on two days (one of high and one of low physical activity),
record their skin hydration levels before and after each sweatcollection with a commercial skin hydration measuring device, and recordthe types and times of physical activity on the log. Participants, who
choose option #2, will be asked to collect a capillary blood sample atthe same time of each skin hydration measurement in addition to therequests for option #1. Participants, who choose option #3, will beasked to schedule an appointment with ASU Health Services to receive ablood draw to donate two tubes at any time in addition to the requestsfor option #1. Participants, who choose option #4, will be asked tocollect 4 capillary blood samples at any time. Participants, who chooseoption #5, will be asked to schedule an appointment with ASU HealthServices to receive a blood draw to donate two tubes at any time.Participants, who choose option #6, will be asked to collect 4 capillaryblood samples and schedule an appointment with ASU Health Services to
receive a blood draw to donate two tubes at any time.
For participants choosing to donate sweat, we will demonstrate for them howto use the Macroduct Sweat Collector, absorbent pads, and/or similarpassive sweat collection device. We will provide them with a packetcontaining the devices/pads and ancillary items needed for the study.They will be provided with 4 Macroduct devices (2 per day) and 4absorbent pads (2 per day) to be used on the two days of the study.Participants may choose the area that fits most comfortably with the
131

device for the sweat collection. The FDA approved Macroduct SweatCollector (a disposable plastic device) devices will be placed on thevolar forearm. The forearm will be cleaned with water, rinsed, and driedprior to placement of the Macroduct. The Macroduct will be strapped to
the participants arm using the Macroduct strap (Velcro). The absorbentpad or similar passive sweat collection device will be fitted to the armor abdominal area by using medical tape. These fitting procedures will
be shown to the participant who will perform the fitting procedures onthemselves on the sweat collection days. Participants will also beprovided a commercial noninvasive skin hydration measuring device to useon each day of sweat collection.
For participants choosing to donate capillary blood, we will alsodemonstrate to them how to use the disposable, retractable lancet,lancing device, or HemoLink for the capillary blood draw and providethem the appropriate materials. They will be provided with 4 capillaryblood collection devices and Heparin-coated microcentrifuge tubes orWhatman protein saver cards for the blood collection (2 per day). Thesecapillary blood samples must be dropped off at Biodesign within 12 hoursof the second capillary collection for each day. Participants donating
capillary blood samples without donating sweat samples may collect allfour capillary blood samples at once at any time point convenient forthem. For participants choosing to donate venous blood, no additionalblood collection devices will be provided; however, they will schedule atime to donate two tubes (10 mL each) of venous blood at the Health
Services Center on ASU Tempe campus. Participants will be allowed toschedule any time that is convenient for them, and the appointment willbe at no cost to them.
When the participants are collecting sweat and/or capillary blood samples,the participants will wear the device/pad for 12 hours on a day ofphysical activity and a day of little to no physical activity. Thecapillary blood samples will also be performed on those same days. Askin hydration measurement will also be performed before and after eachsweat collection. The participant will return the devices/pads to theresearchers following 12 hours of use. They will also fill out a logindicating what physical activity they participated in, the times of theday they started and stopped, and the results of their skin hydration
measurements.
All sweat and/or blood collections must be completed within 4 weeks offilling out the consent form. Once samples are returned, the sweat andcapillary blood samples will be collected from the device/pad and storedfor analysis. Participants participating in the sweat only or blood (
132
capillary or venous) only collection will receive a \$15 gift card.Participants participating in the sweat and blood collection willreceive a \$20 gift card for the sweat and capillary blood collectionand \$30 gift card for the sweat and venous blood collection.Participants will receive a \$30 gift card for capillary and venousblood collection. Gift cards will be for Target or Starbucks, dependingon the participants preference. Participants will be handed thepreferred gift card of choice of the appropriate dollar amount once allsweat and/or blood samples are returned to Biodesign. These gift cardswill be awarded regardless of sample quality or quantity. The possiblecost to the participant is transportation to and from ASU Tempe campus.
Macroduct Sweat Collection System Model 3700 SYS instruction/service manualpage 16-17 describes the devices (note: the iontophoresis component ofthe device will not be included in this study). The instructions for useadapted from the instruction/service manual that will be provided to
the participants has also been included.
9 Withdrawal of ParticipantsDescribe anticipated circumstances under which participants will be
withdrawn from the research without their consent.Describe procedures that will be followed when participants withdraw from
the research, including partial withdrawal from procedures withcontinued data collection.
Participation in the study by students or faculty is purely voluntary. Therewill not be any coercion to participate of any kind. Participants can
remove themselves from the study at any time by informing the PI inwriting or email. If sample quality is poor during blood processing andcannot be used for experiments, the participants samples will bedestroyed. Since these are samples to be used for exploratory studies,participant withdrawal will not impact our study.
10 Risks to ParticipantsList the reasonably foreseeable risks, discomforts, hazards, or
inconveniences to the participants related the participantsparticipation in the research. Include as may be useful for the IRBsconsideration, the probability, magnitude, duration, and reversibilityof the risks. Consider physical, psychological, social, legal, andeconomic risks. Reference this information when appropriate.
If applicable, indicate which procedures may have risks to an embryoor fetus should the participant be or become pregnant.
If applicable, describe risks to others who are not subjects.For the sweat collection, the possible risk to the participant is dermal
133

irritation from wearing the device/pad that would result from strap orcollection cup of the device.
The capillary and venous blood drawing will provide minor discomfort to theparticipants. There is less than a 1\% risk of fainting secondary toblood drawing, and there is less than a 1\% risk of a local hematomasecondary to blood drawing. There are no other risks involved.
Data confidentiality will be a risk to the participants. All efforts will bemade to ensure patient confidentiality and assurance of HIPAA
compliance. Samples will be exclusively used for biomarker discovery andbiosensor platform development. No other information will be obtained
from the patient or normal samples. The names of the patients will notbe released to any outside organizations or to persons not involved withthe study. No efforts will be taken to identify the participant, or be
revealed in written reports or publications detailing the researchfindings. Subjects will be referred to by subject number, not name orinitials in any manuscripts.
11 Potential Benefits to ParticipantsRealistically describe the potential benefits that individual subjects may
experience from taking part in the research. Include the probability,magnitude, and duration of the potential benefits. Indicate if there isno direct benefit. Do not include compensation or benefits to society orothers.
There is no direct benefit to the participant from the study. However, thestudy will benefit society by determining the proteomic content of sweat.Knowledge of the content will allow for the development of non-invasiveassays eliminating the need for blood draws.
12 SettingDescribe the sites or locations where your research team will conduct the
research.Identify where research procedures will be performed.For research conducted outside of the ASU describe:
o Site-specific regulations or customs affecting the research.o Local scientific and ethical review structures in place.The participants will meet with the PI, co-PI, or approved research
assistant to sign the paper work and go over the instructions for theproper use of the sweat collection devices and capillary bloodcollection devices for this study. The self-collection of the sweat andcapillary blood samples will be performed at the participants locationof choice. The venous blood collection will be performed at ASU HealthServices on Tempe campus. They will also schedule a time to return thedevices. The research using the obtained samples will occur at the ASU
134

Tempe Campus in the Biodesign Institute, Engineering Research Center,and Goldwater Center.
13 Multi-Site ResearchIf this is a multi-site study where you are the lead investigator, describe
the processes you will use to ensure communication among sites, such as:Each site has the most current version of the protocol, consent
document, and HIPAA authorization.Required approvals have been obtained at each site (including
approval by the sites IRB of record).Describe processes you will use to communicate with participating
sites.Participating sites will safeguard data as required by local
information security policies.Local site investigators conduct the study appropriately.
Not applicable.14 Resources AvailableDescribe the qualifications (e.g., training, experience, oversight) of you
and your staff as required to perform your roles. When applicabledescribe knowledge of the local study sites, culture, and society.Provide enough information to convince the IRB that you have qualifiedstaff for the proposed research.
Describe other resources available to conduct the research: For example, asappropriate:
Describe your facilities.Describe the availability of medical or psychological resources that
participants might need as a result of any anticipated consequences ofthe human research.
Describe your process to ensure that all persons assisting with theresearch are adequately informed about the protocol, the researchprocedures, and their duties and functions.
The administration of the sweat and capillary blood collection devicesrequires minimal training that will be provided by research staff, PI orCo-PI. The training can take place in an office. All researchers or
assistant interacting with the participants or samples will undergo CITItraining. Since the study involves minimal risk to the participants,
medical or psychological resources are not necessary. The PI will ensurethat any personnel interacting with the participants will be trained toadequately inform them about the protocol, research procedures, and
their duties and functions.
Venous blood draws will be performed at the ASU Health Services Center onTempe campus by a trained phlebotomist. Physicians, nurses, and otherhealth professionals will also be available during the sample collection.
135
Lab facilitiesOur lab space is located on the second floor with enough lab space for 12
researchers and lab equipment. We have incubators, two -20 degreefreezers, one -80 degree freezer a 4-degree refrigerator and a walk-incooler. There are four computers (two PCs and 2 Macintosh) for lab use,all equipped with relevant software (Graphpad prism, MS office, DNAsequencherTM etc). There is also one MVE 800 Series 190 Liquid NitrogenCell Storage System, to maintain and stockpile all cell lines and studysamples obtained for this study. Our lab is also right next to theBiodesign flow cytometry core facility housing the BD FACSaria flowsorter which we will use CTL studies.
The 500 sq foot BSL2+ cell culture room is access only and is equipped withfour Baker sterile Biosafety cabinets (with UV lights). The room islocked at all times with negative air flow and is card accessible only,requiring OSHA and biohazard trainings. It also has two water baths andfour 37-degree CO2 incubators. The cell culture room also has its own 4-degree refrigerator, two Beckman Allegra tabletop centrifuges, threeThermo HeraCell 240i CO2 incubators and an inverted microscope (Nikon)with GFP capability.
Office spaceWe also have office space for 3 researchers in the office area opposite to
the lab with computers. All office computers (PCs) are equipped withrelevant software (Attune v2.5 for flow cytometry, Graphpad prism, DNAsequencherTM etc) to be used for research purposes. The computers areconnected to the internet at all times and have all appropriate firewalland anti-virus security systems. CPD also has its own server and shareddrive on which research data can be stored for back up.
EquipmentsThe Anderson lab has an automated Biotek ELX405 magnetic plate washer, many
manual and electronic single and multichannel pipettes, high and low-voltage gel electrophoresis units, and a Biorad image analyzer. The labalso has one plate/tube shaker, 2 37C shakers, one nanodrop,microcentrifuges, two ABI PCR Thermocycling machines, one automatedBiotek ELX405 magnetic plate washer and a new Millipore Magpix Luminexmachine. In addition to general lab equipment mentioned above, we alsohave the 4D Lonza Amaxa Nucleofector with two single-cuvette, 16-wellmicrocuvette and 96-well capability. The 4D Nucleofector is highlyefficient in transfections of different cell lines with optimizedprograms for each of them. Also, its 96 well microcuvette system gives
136

us high throughput transfection capability without compromising ontransfection efficiency and time.
We have an Attune flow cytometer (Life Technologies) with single tube and 96-well capability to be used for our high throughput studies. Our Attunehas a Blue/Violet laser configuration and works on principle of acousticfocusing. This helps rapid high throughput analysis without
compromising on sensitivity. Our researchers are certified trained tohandle the Attune cytometer for T-cell epitope screening studies. TheAttune is also robot-compatible which we could make use of in the future.
Since we only seek English-understanding consenting adult volunteers, wewill describe in brief what the research is about, and what it will beused for. The subjects will have the opportunity to review the consentform prior to donating sweat and/or blood. They will also have theopportunity to decline from donating sweat and/or blood at any time whenthey want to.
15 Prior ApprovalsDescribe any approvals that will be obtained prior to commencing the
research. (E.g., school, external site, funding agency, laboratory,radiation safety, or biosafety approval.)
N/A16 Data Management and ConfidentialityDescribe the data analysis plan, including procedures for statistical
analysis.Describe the steps that will be taken to secure the data during storage, use,
and transmission.Training, authorization of access, password protection, encryption,
physical controls, certificates of confidentiality, and separation ofidentifiers and data
Describe how data and any specimens will be handled:What personal identifiers will be included in that data or associated
with the specimens?Where and how data or specimens will be stored?How long the data or specimens will be stored?Who will have access to the data or specimens?Who is responsible for receipt or transmission of the data or
specimens?How will data and specimens be transported?If data or specimens will be banked for future use, describe where
the specimens will be stored, how long they will be stored, how thespecimens will be accessed, and who will have access to the specimens.
Describe the procedures to release data or specimens, including: the
137

process to request a release, approvals required for release, who canobtain data or specimens, and the data to be provided with specimens.
The collected devices and samples will be de-identified upon receipt withonly a male/female identifier, physical activity log, and a random codethat cannot be linked back to the participant and will allow us to matchonly the sweat and/or blood samples to the activity logs but not back
to the participant. The specimens will be transferred to amicrocentrifuge tube and stored in a -80oC freezer. The specimens willbe kept for the entire length of the study and at least 3 yearsfollowing its conclusion, if any sample remains. The specimens will notbe transported from the building, and electronic access to the laboratoryis required. The data will be maintained on a secure network drive withaccess given only to those researchers directly involved with the
project who have completed the CITI training. The data will only bepublished in de-identified and/or aggregate form. The data will bemaintained on the servers for a period of no less than 3 years followingthe conclusion of the study. The consent forms will be secured in a
secure, separate location (locked container in the PIs office) from therest of the study data for a period of three years and then will bedestroyed. Researchers will sign a confidentiality statement.
Again, subjects will not be identified by any personal identifiers in anyoral or written reports related to the study. No personal identifierswill be kept on file. Since we are only analyzing proteomic content, noinformation will be exchanged with the donors. Participation is purelyvoluntary and no other information will be obtained from the participant.
17 Safety MonitoringThis is required when research involves more than Minimal Risk to
participants. The plan might include establishing a data monitoringcommittee and a plan for reporting data monitoring committee findings tothe IRB and the sponsor. Describe:
The plan to periodically evaluate the data collected regarding bothharms and benefits to determine whether participants remain safe.
What data are reviewed, including safety data, untoward events, andefficacy data?
How the safety information will be collected (e.g., with case reportforms, at study visits, by telephone calls with participants).
Who will review the data?Since the protocol involves only sweat and blood collection, it poses
minimal risk to the participants. Therefore, no follow-up visits oradditional monitoring is essential for the donors. Furthermore, asstated earlier, the participation is purely voluntary and participantsmay withdraw at any time.
138

18 Consent ProcessDescribe the process and procedures process you will use to obtain consent.
Include a description of:Who will be responsible for consenting participants?Where will the consent process take place?How will consent be obtained?If participants who do not speak English will be enrolled, describe
the process to ensure that the oral and/or written information providedto those participants will be in that language. Indicate the languagethat will be used by those obtaining consent. Translated consent formsshould be submitted after the English is approved.
C.2 Capillary Blood Consent Form
A. INTRODUCTION
We are inviting you to take part in a research study titled Smart andConnected Health Study funded by the National Science Foundation. Thisis a study to develop platforms for wearable and point-of-carediagnostic devices, which can detect health and disease (biomarkers). Itis expected that about 300 people will take part in this research studyat Arizona State University. You must be 18 years or older to
participate, and you must already be planning to participate in physicalactivities as part of your normal exercise routine. You must know of norisks to your health by participating in this activity.
This form was created to help explain to you the nature of this study and ifyou choose to participate, it will be used to document your agreement
to be part of this study.
Included in this form is a description of why this study is being done, whatis involved in participating in the research study, the possible risks,inconveniences or discomforts you may experience, alternatives to
participation, and your rights as a research subject. The decision toparticipate is yours. If you decide to participate, please sign and dateat the end of this form. We will give you a copy so that you can refer
to it while you are involved in this research study.
B. WHY IS THIS RESEARCH STUDY BEING DONE?
We are researchers at Arizona State University, and we are conductingresearch to develop wearable and point of care diagnostic platforms. Weare doing this study to collect capillary and venous blood from men andwomen to measure proteins, electrolytes, and biomarkers using point of
139

care devices, which we are working to optimize. We plan to use thisinformation to make diagnostics more accessible and cheaper.
C. WHAT IS INVOLVED IN THE RESEARCH STUDY?
Participation in this research is entirely voluntary. If you agree toparticipate in this study:
You will spend about 15 minutes filling out this consent form.You do not have to answer any questions that make you uneasy. Whether
or not you answer any question will not affect your medical care. Wewill keep the paper copies of the questionnaire in a locked file toprotect your privacy. You can choose to not donate blood at any pointduring this study and we will not coerce you.
You will be asked to schedule an appointment with ASU Health Servicesto donate 2 tubes (10 mL/tube) of venous blood drawn by a trained
health professional. A venous blood draw includes a health professionalinserting a syringe needle into a vein, usually on the forearm, to drawup blood. There will be no costs to you for this appointment with ASUHealth Services.
You will be asked to self-collect four small volume blood samplesthat either from a finger or arm prick. This self-collection would beperformed using the provided retractable lancet, lancing device, orHemoLink. These devices have a small metal blade that will push out atthe press of a button and then immediately retract. Retractable lancetsmay be disposed in any landfill waste container. When held to afingertip or a part of the arm, the device will draw a few drops ofblood. Samples will be collected into a provided heparin-coatedmicrocentrifuge tube or Whatman protein saver card. The capillary bloodsamples must be returned within 12 hours of the collection.
Once you return the capillary blood collection devices, they will bemarked with only as male or female and a random number to protect yourprivacy and ensure that the results of testing cannot be associated withyou in any way. Your participation will be confidential. The results ofthis study may be used in reports, presentations, or publications but
your name will not be used. The results will only be shared in theaggregate form only.
All sweat and/or blood collections must be completed within 4 weeksof filling out this consent form.
In addition, you can stop participating in the research study at any time.However, before you decide to stop participating in this study, weencourage you to reach out to the research team first.
140

E. HOW LONG WILL I BE IN THIS RESEARCH STUDY?
This project is designed to gather capillary and venous blood fromparticipants. Your participation is expected to take about 2 hours ofyour time. After consenting to participate in this study, you do nothave to do anything active to continue to participate. You may, ofcourse, withdraw at any time. Because we cannot predict when newbiomarkers may become available for study, we are asking you to permitus to store this information and share it with other investigators in aform that could not be identified as yours for an indefinite period oftime. We are asking you to give us permission to use your capillary andvenous blood, which will be stored in a way that cannot be linked backto you for future research studies. All efforts will be made to protectyour privacy at all times.
The research team may decide to take you off the research study for manyreasons, including:
It is considered to be in your best interestThere is any problem with following study treatments and proceduresThere are any problems with research fundingOr other unforeseen reasons
If you are removed from the research study, we will explain to you why youwere removed.
F. WHAT ARE THE RISKS AND CONFIDENTIALITY OF THE RESEARCH STUDY?
Physical Risks:The capillary venous blood collection will provide minor discomfort to the
participants. There is less than a 1\% risk of fainting secondary toblood drawing, and there is less than a 1\% risk of a local hematomasecondary to blood drawing. There are no other risks involved.Occasionally, there are technical problems with the laboratory analysis.If this happens, we would discard your samples. This has no
significance in terms of results, and should not alarm you in anyway.Non-Physical Risks:We will collect information from you on your physical activity and your
gender. This information will be coded with a unique number.
G. WHAT ARE THE BENEFITS OF THE RESEARCH STUDY?
You will be provided a \$30 gift card to Target or Starbucks (your choice)for participating in this study. It will be provided after you complete
141

the capillary and venous blood collection and return the materials asindicated in the instruction packet.
H. CAN I STOP BEING IN THE RESEARCH STUDY AND WHAT ARE MY RIGHTS?You have the right to choose not to sign this form. If you decide not to
sign this form, you cannot participate in this research study. You mayalso stop being in the research study at any time. If you choose to notparticipate, or if you are not eligible to participate, or if youwithdraw from this research study, this will not cause any penalty toyou.
WHAT ARE THE COSTS?
No charges will be billed to you for this study. There will be nocosts to you for your appointment with ASU Health Services.
What happens if I am injured or sick because I took part in this researchstudy?
We do not anticipate you becoming physically sick or injured from takingpart in this study. If you think you have been injured as a result oftaking part in this research study, tell the person in charge of thisstudy as soon as possible and seek standard medical care. You may haveto pay for this treatment. The research teams name and phone number arelisted in this consent form.
I. WHOM DO I CONTACT IF I HAVE QUESTIONS ABOUT THE RESEARCH STUDY?
If you have questions about the study, please contact the research studystaff as listed below:
Jennifer Blain Christen PhD 480-965-9859Karen Anderson, MD, PhD 480-965-6982
For questions about your rights as a research participant, please contact arepresentative of the Office for the Protection of Research Subjects atArizona State University. This can include questions about yourparticipation in the study, concerns about the study, a research relatedinjury, or if you feel/felt under pressure to enroll in this research
study or to continue to participate in this research study.
J. PRIVACY OF PROTECTED HEALTH INFORMATION
Federal law requires research teams to protect the privacy of informationthat identifies you and relates to your past, present, and futurephysical and mental health conditions (protected health information). Ifyou enroll in this research study, we will only collect information on
your age, gender, and physical activity. This information will be coded
142

and linked to your capillary and venous blood samples, but no personalinformation will be retained (i.e. your name).
K. DOCUMENTATION OF CONSENT
PLEASE READ THE FOLLOWING QUESTIONS AND INSTRUCTIONS VERY CAREFULLY. Foryour own safety, you CANNOT participate in this study if you have amedical condition for which capillary and venous blood donation is notadvised. You should also NOT participate in this study if you areincapable of understanding the consent process, or cannot understandEnglish.
To be enrolled in the study, you must meet the following inclusion criteria:1. Are you able to give informed written consent?
a) Yes b) No2. Are you at least 18 years old?a) Yes b) No3. Do you weigh over 110 pounds?
a) Yes b) NoMy signature below indicates my willingness to participate in this research
study and my understanding that I can withdraw at any time. I alsoconfirm my understanding that I will receive a \$30 gift card to Targetor Starbucks (of my choice) upon returning all collected samples forparticipating in this study.
Signature of Subject Dateor Legally Authorized Representative
To be completed by person obtaining consent:
The consent discussion was initiated on (date) at (time.)0 A copy of this signed consent form will be given to the subject.
For Adult Subjects0 The subject is an adult and provided consent to participate.
Signature of Individual obtaining consent:
Printed name of above:
Date:
143

BIOGRAPHICAL SKETCH
Hany Arafa graduated with his Bachelor’s degree in Biomedical Engineering fromASU in the Spring of 2017 and is currently completing his MS in Biomedical Engineer-ing. As a member of the BioElectrical Systems and Technologies Lab, he specializesin biosensors and point-of-care diagnostics. His previous work was primarily focusedon the development of an integrated system for the ex vivo continuous assessmentof tumor cell proliferation, resulting in several publications. He has also workedon the development of a wearable, crowd-sourced air quality monitoring device forrespiratory disease. His thesis project focused on various aspects of fluorescence-basedbio recognition system architecture for multiplexed point-of-care molecular diagnosticssuch as the optimization of the fluidic systems in addition to the development ofthermally actuated systems. He has industry experience in the development of DNAand protein microarrays for diagnostics with Applied Microarrays and is currentlyworking part time at Medtronic as a test engineer. After graduating, Hany will bepursuing a doctoral degree in biomedical engineering at Northwestern University.
144
Related Documents