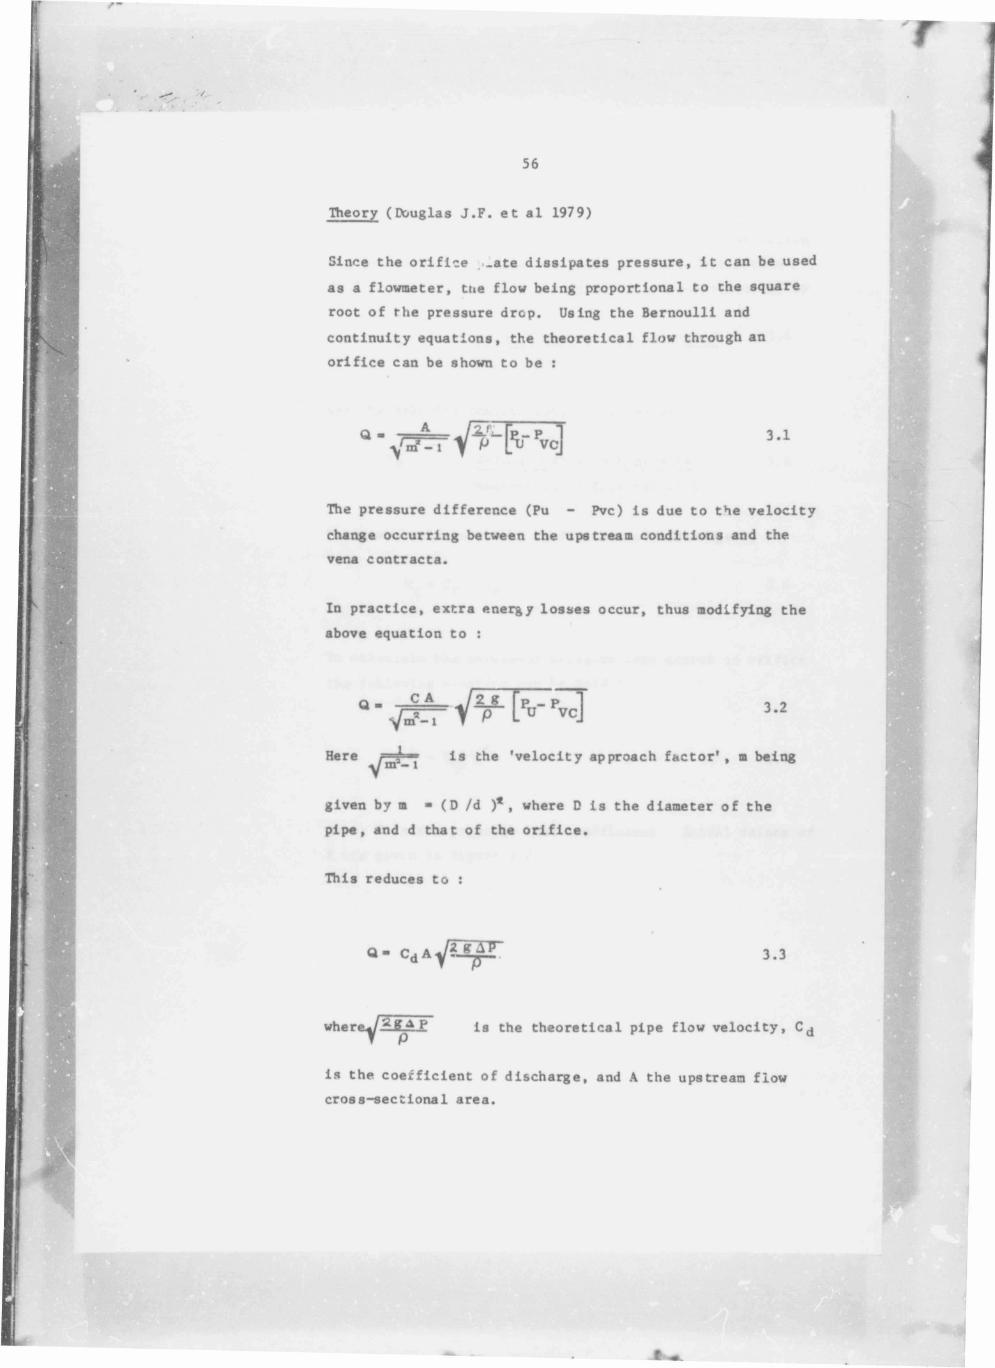
Theory ( ebuglas J.F. et al 1979) Since the orifice >_ate dissipates pressure, it can be used as a flowmeter, tue flow being proportional to the square root of the pressure drop. Using the Bernoulli and continuity equations, the theoretical flow through an orifice can be shown to be : The pressure difference (Pu - Pvc) is due to the velocity change occurring between the upstream conditions and the vena contracta. In practice, extra energy losses occur, thus modifying the above equation to : given by m ■ (D /d )* , where D is the diameter of the pipe, and d that of the orifice. This reduces to : is the coefficient of discharge, and A the upstream flow cross-sectional area. 3.1 3.2 Here is the 'velocity approach factor' , m being 3.3

Welcome message from author
This document is posted to help you gain knowledge. Please leave a comment to let me know what you think about it! Share it to your friends and learn new things together.
Transcript
Theory (ebuglas J .F . et al 1979)
Since the orifice >_ate dissipates pressure, it can be used
as a flowmeter, tue flow being proportional to the square
root of the pressure drop. Using the Bernoulli and
continuity equations, the theoretical flow through an
orifice can be shown to be :
The pressure difference (Pu - Pvc) is due to the velocity
change occurring between the upstream conditions and the
vena contracta.
In practice, extra energy losses occur, thus modifying the
above equation to :
given by m ■ (D / d )* , where D is the diameter of the
pipe, and d that of the orifice .
This reduces to :
is the coefficient of discharge, and A the upstream flow
cross-sectional area.
3 .1
3.2
Here is the 'velocity approach factor' , m being
3.3

T
57
The coefficient of discharge C j is composed of two
coefficients, associated respectively with jet contraction
and jet velocity. These are defined as the Contraction
Coefficient, Cc , given (to a first order approximation) by
Area of jet at vena contracta
Area of orifice
3.4
and the Velocity Coefficient, Cv, given by
Velocity at vena ( »ntracta
Theoretical orifice velocity
3.5
These are related to the coefficient of discharge by :
cd " C c * cv3.6
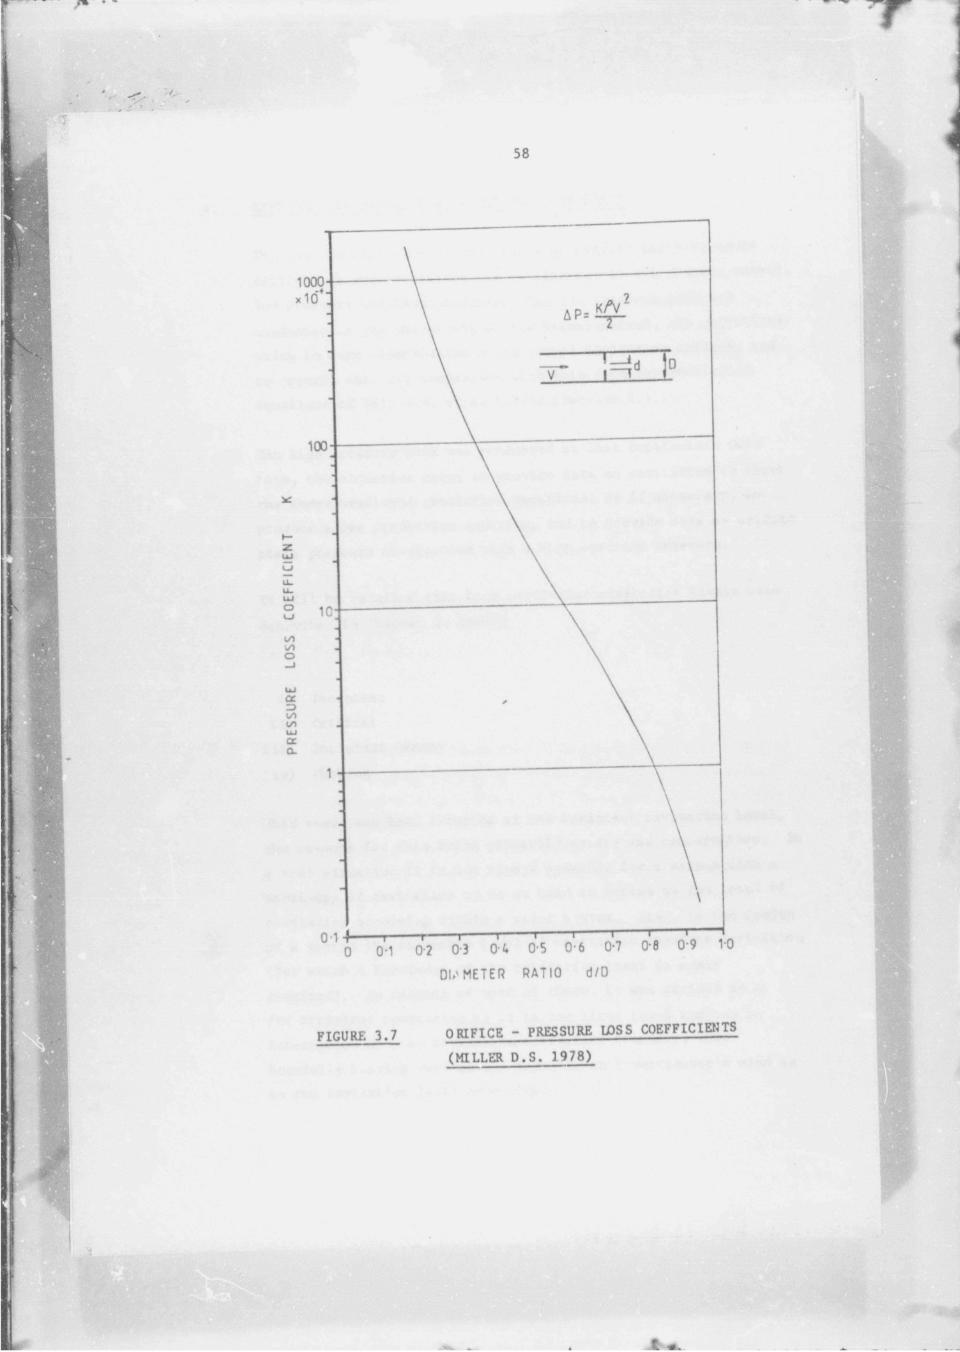
To calculate the permanent pressure loss across an orifice
the following equation can be used :
3.7
where K is the pressure loss coefficient. Actual values of
K are given in Figure 3.7
PR
ESS
UR
E
LOSS
C
OE
FF
ICIE
NT
58
FIGURe 3.7 ORIFICe ~ PReSSURe LOSS COeFFICIeNTS
(MILLeR D .S . 1978)
t

eIIPeRIMSNTAL FACILITIeS, PROCeDUReS AND TeSTS
The experimental part of this study on orifice plate pressure
dissipation and cavitation was carried out in two phases, namely,
low pressure and high pressure. The low pressure part was
conducted at the University of the Witwatersrand , the objectives
being to make observations on an actual cavitatlng orifice , and
to provide data for comparison with data from the prediction
equations of Ball J .W . et al (1975) (Section 2 . 4 ) .
The high pressure work was conducted at east Driefontein Gold
Mine, the objective being to provide data on cavitation to check
the abov« mentioned prediction equations, or i f necessary, to
produce a new prediction equation, and to provide data on orifice
plate pressure dissipation with a high upstream pressure.
It w ill be recalled that four particular cavitation levels were
described in Qiapter 2 , namely
i ) Incipient
J i ) Critical
H i ) Incipient Damage
iv) Choking
This study has been directed at the incipient cavitation level,
the reasons for this being primarily safety and conservation. In
a real situation it is not always possible for a person with a
knowledge of cavitation to be on hand to decide on the level of
cavitation occurring within a water system. Also, in the design
of a system the tolerable level of cavitation requires definition
(for which a knowledge of the cavitation level is again
required). In respect of both of these, it was decided to opt
for incipient cavitation as it is the first level and can be
interpreted as a no cavitation/cavitation boundary, thus
hopefully leaving very little doubt in an investigator's mind as
to the cavitation level occurring.

60
4 .1 UNIVeRSITY OF THe WTfWATeRS RAND
As stated above, the low pressure tests were conducted In
the Mechanical engineering Laboratory of the University of
the Witwatersrand. The fluids section of this laboratory
is situated above and underground sump which contains water
at a relatively constant temperature of 16°C , thus allowing
testing to be carried out with water in which the vapour
pressure did not significantly vary.
4 . 1 . 1 TeST FACILITY
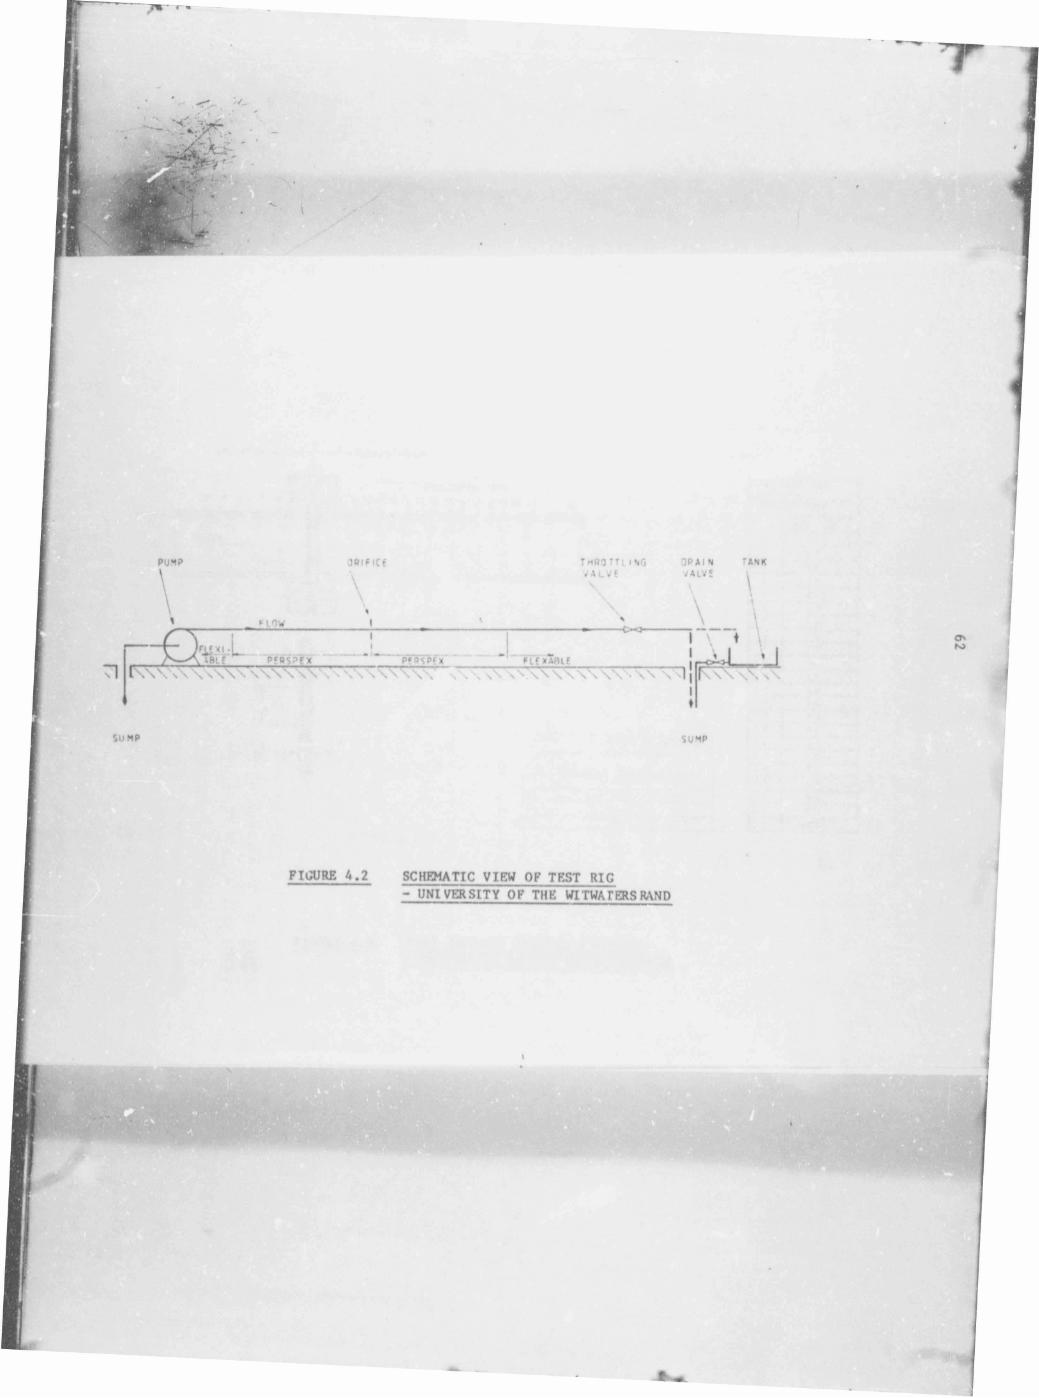
Tiie test equipment is shown in Figures 4 .1 & 4 . 2 , the main
components being :
i ) Puup
i i ‘ Perspex test section
i i i ) Orifice
iv) Throttling valve
v) Flowmeter
The test section consisted of two flanged perspex tubes of
3 3 , Som internal diameter, each flang? being recessed to
housa an 'O ' ring. The orifice plate was located between
the flanges and the 'O ' rings (Figure 4 . 3 ) , the assembly
being clamped by six bolts around the flange. Both
upstream and downstream of the flanges were a series of
pressure taps, 6 upstream and 15 downstream, to allow
pressures to be sampled at various positions upstream and
downstream of the orifice .
The orifice plates were made from 3mm thick brass plate
(Figure 4 .3 ) and designed in accoriance with B .S . 1042 -
square edged.
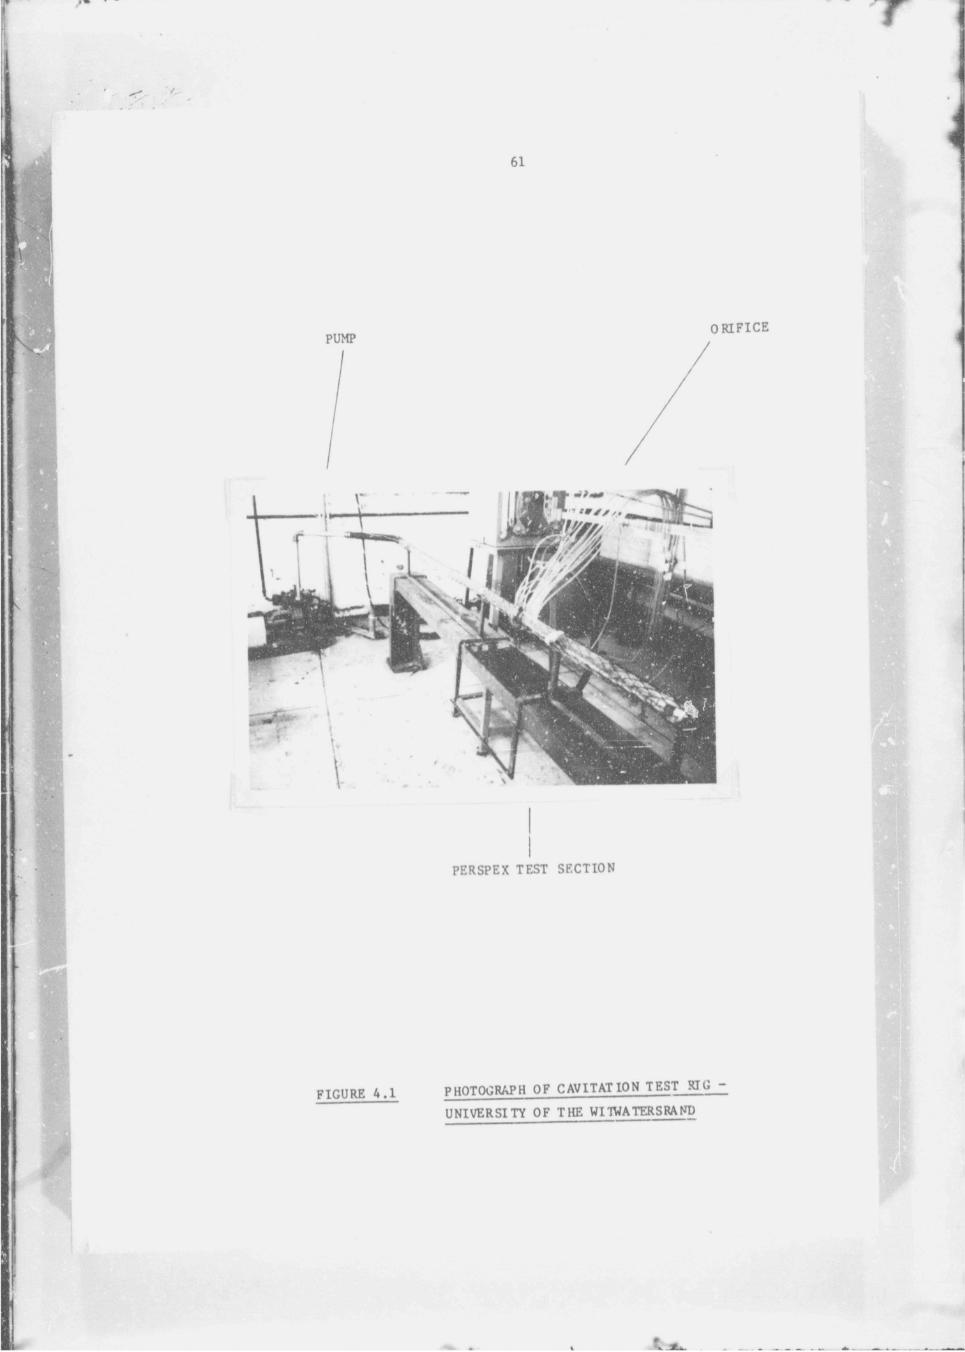
PeRSPeX TeST SeCTION
FIGURe 4.1 PHOTOGRAPH OF CAVITATION TeST RIG
UNIVeRSITY OF THe WI TV A TeR S RAND
PUMP
I
ORIFICe

OP AI N /A (.VS
FIGURe 4.2 SCHeMATIC VIeW OF TeST RIG
- UNIVeRSITY OF THe WITWATeRS RAND

To rou- the flow from the test section to the sump, a
flexible rubber hose was used. Located in the hose was a
final pressure tap, and a gate valve to control the flow
rate. For flow measurements the hose could either be
routed directly to the sump or via a graduated tank for a
volume check.
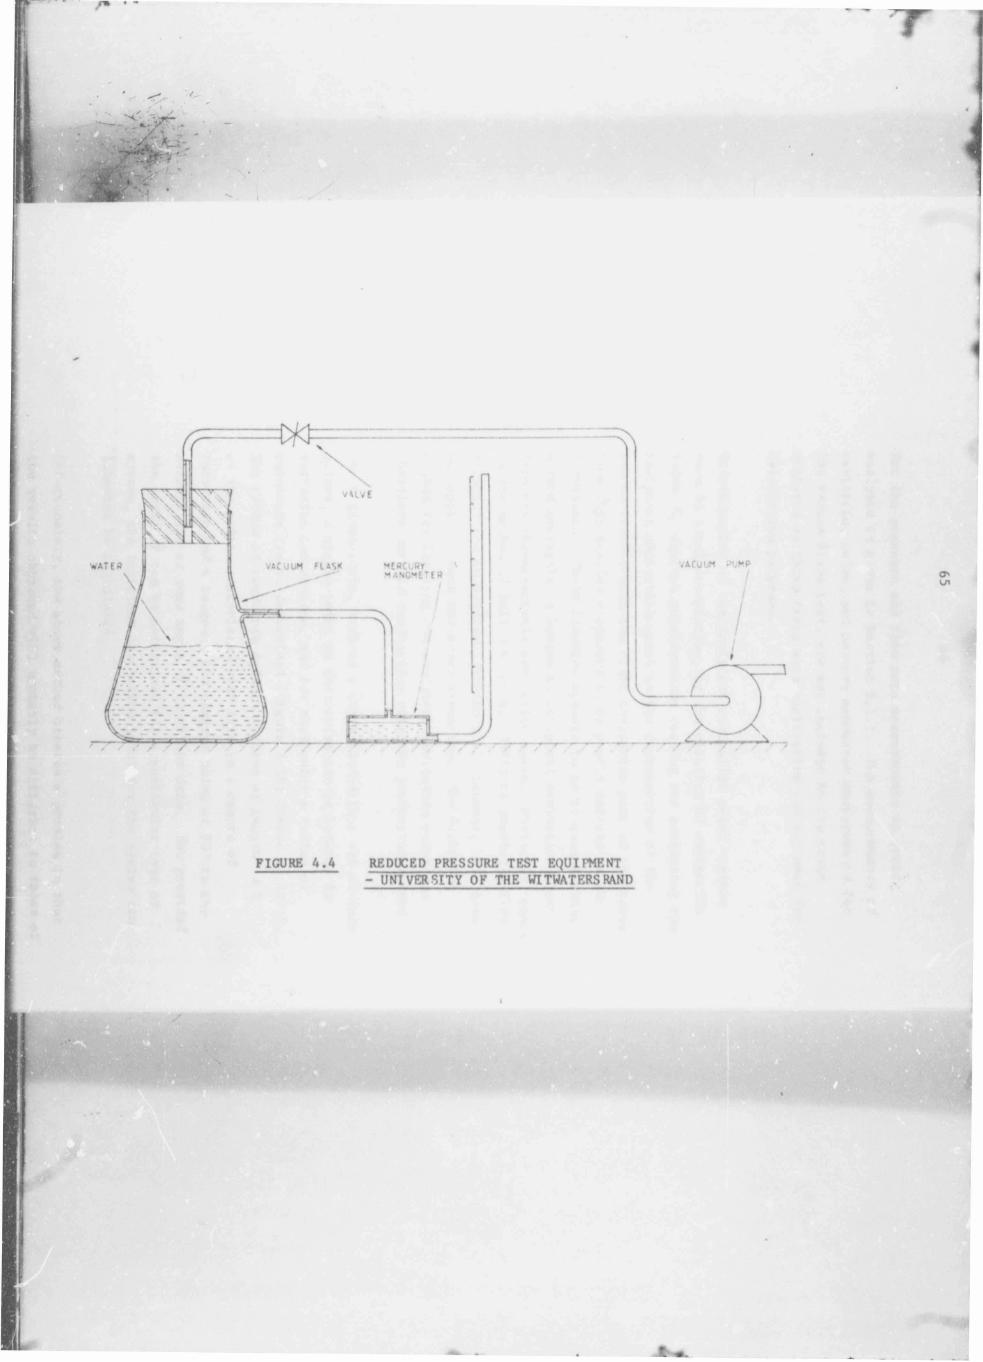
In addition to the above mentioned test equipment, a
non-flow apparatus was also set up to observe water
cavitation at reduced pressured ( ie . below atmospheric).
This equipment •'onslsted of a vacuum flask coupled to a
vacuum pump and a mercury manometer (Figure 4 . 4 ) .
4 . 1 . 2 >£ ASU RefCNTS
The measurements taken during the flow tests were pressure,
flow and cavitation noise. For conditions where cavitation
was present photographs were also taken.
Pressure measurements were made by means of pressure gauges
(Bourdon type), these being calibrated before and after use
(using a dead weight tester). To calculate the pressure
drop across the o r ific e , a difference of pressures measured
at positions 6 and 22 (0 ,66 D upstream and 24 D downstream
respectively), was taken (Figure 4 . 3 ) . Flow rate was
measured by devertlng the flow from the sump to the
graduated tank. Cavitation noise was measured using a
sound level meter (Scott Inst Lab. Type 452 , Sr No. 6173);
during testing the background noise in the laboratory was
minimal, so its effect on the measured cavitation rjlse
level as also minimal. It was easier to use this procedure
than to attach an accelerometer to the perspex pipes where
there were space limitations due to pipe diameter and
flange sizes .
in the vacuum flask test, a mercury manometer was used to
measure the pressure.
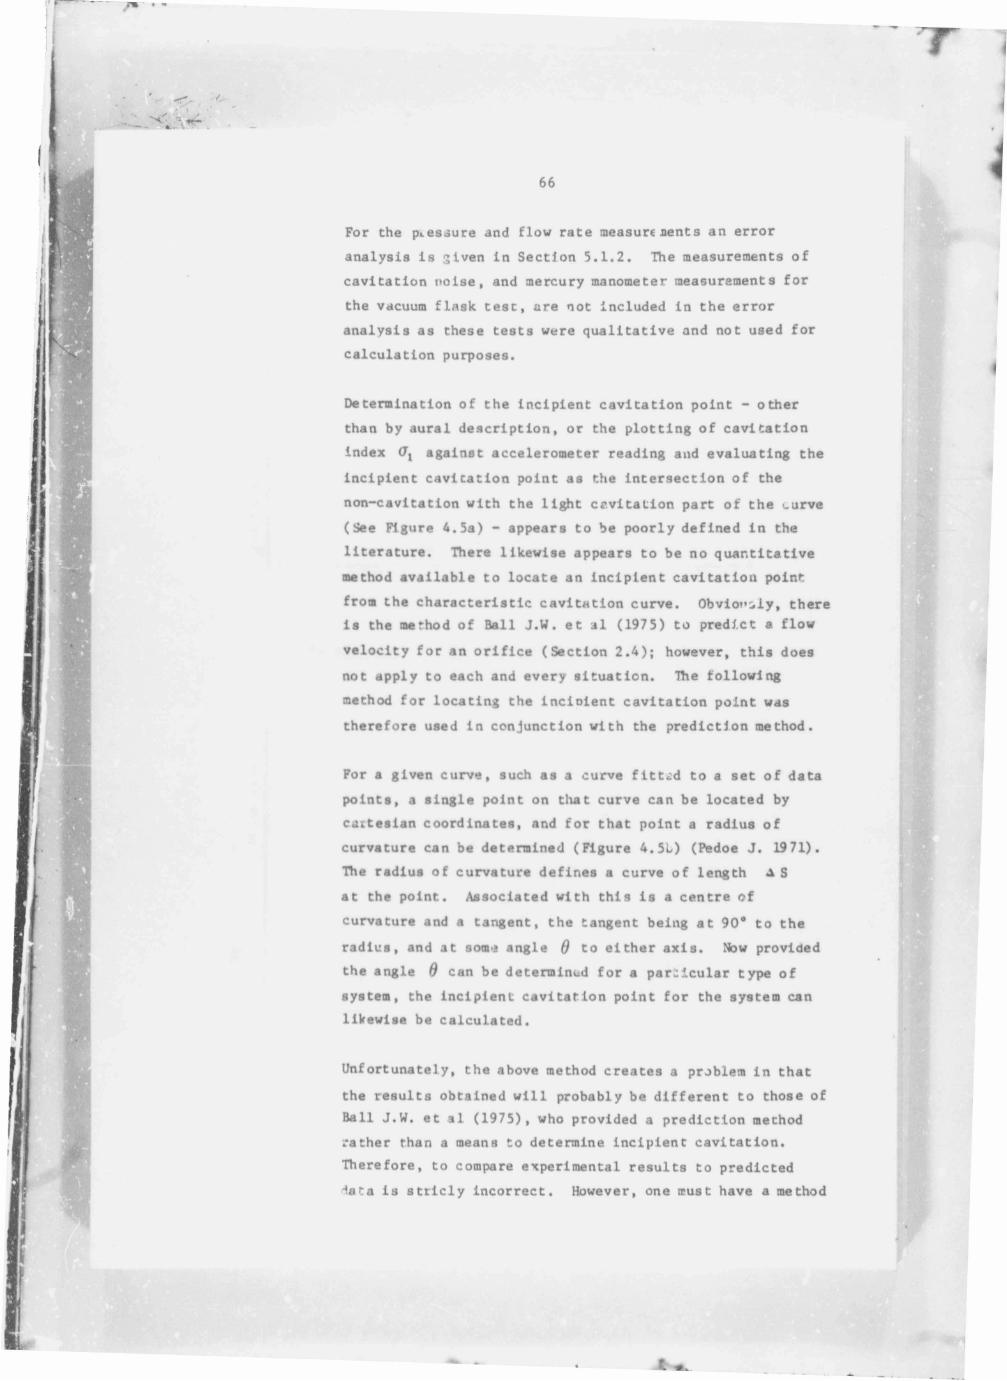
For the pressure and flow rate measurenents an error
analysis is given in Section 5 . 1 . 2 . The measurements of
cavitation noise, and mercury manometer measurements for
the vacuum flask test, are not included in the error
analysis as these tests were qualitative and not used for
calculation purposes.
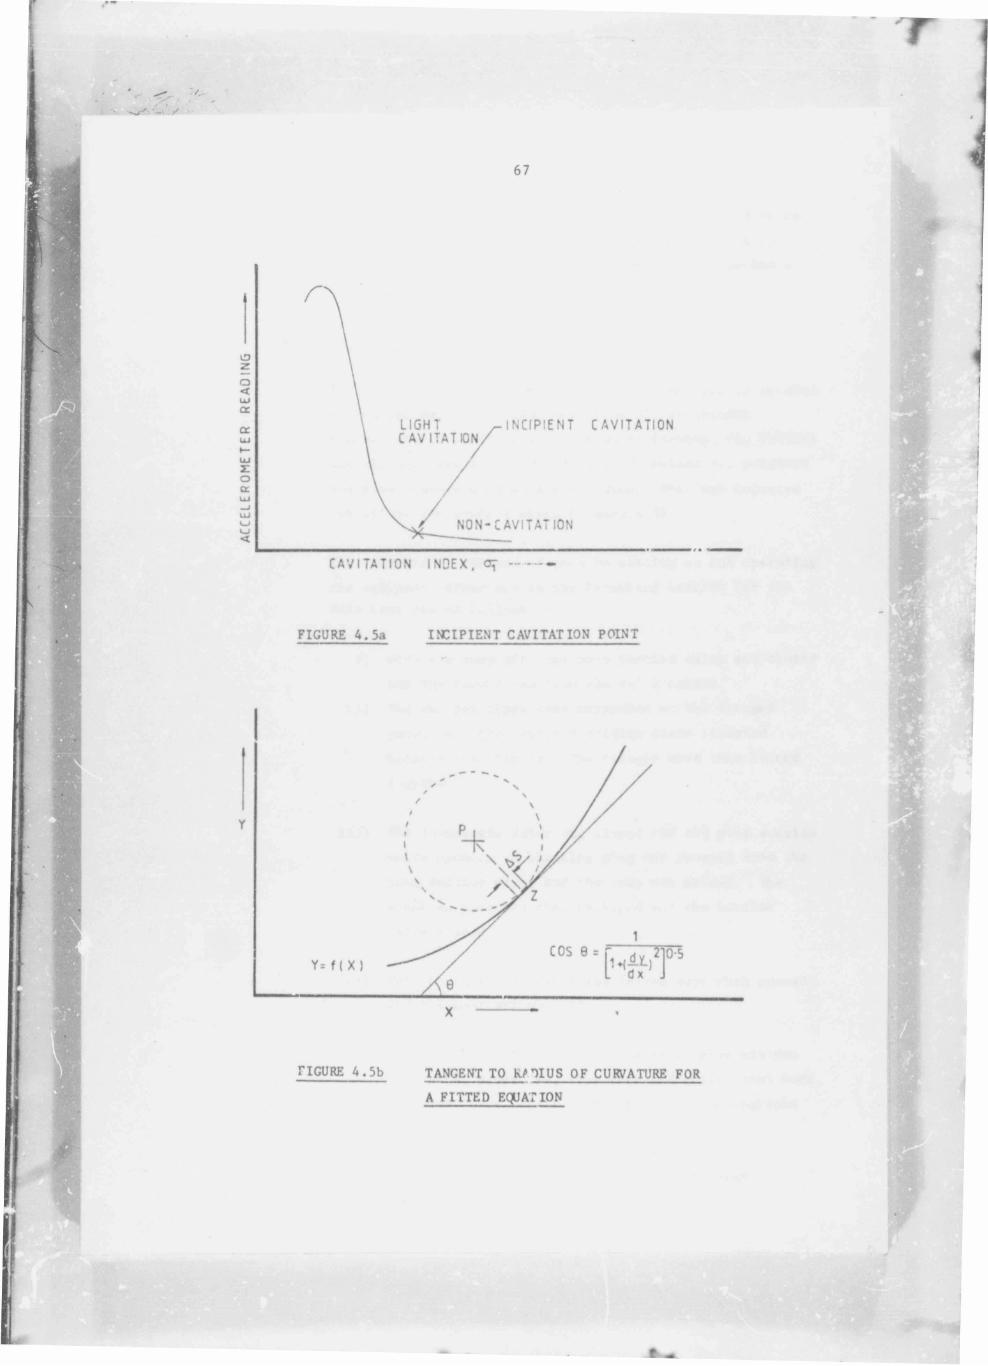
Determination of the incipient cavitation point - other
than by aural description, or the plotting of cavitation
index (7j against accelerometer reading and evaluating the
incipient cavitation point as the intersection of the
non-cavitatlon with the light crvitation part of the uurve
(See Figure 4 .5 a ) - appears to be poorly defined in the
literature. There likewise appears to be no quantitative
method available to locate an Incipient cavitation point
from the characteristic cavitation curve. Obviot’i iy , there
is the merhod of Ball J .W . et al (1975) to predict a flow
velocity for an orifice (Section 2 .4 ) ; however, this does
not apply to each and every situation. The following
method for locating the In d o le n t cavitation point was
therefore used in conjunction with the prediction method.
For a given curve, such as a curve fitted to a set of data
points, a single point on that curve can be located by
caitesian coordinates, and for that point a radius of
curvature can be determined (Figure 4 .5L ) (Pedoe J. 19 71).
The radius of curvature defines a curve of length A S
at the point. Associated with this is a centre of
curvature and a tangent, the tangent being at 90* to the
radius, and at sotn<» angle 0 to either axis . Now provided
the angle 8 can be determined for a particular type of
system, the incipient cavitation point for the system can
likewise be calculated.
Unfortunately, the above method creates a problem in that
the results obtained w ill probably be different to those of
Ball J .W . et al (1 9 7 5 ) , who provided a prediction method
rather than a means to determine incipient cavitation.
Therefore, to compare experimental results to predicted
-lafra is stricly incorrect. However, one must have a method
67
FIGURe 4.5a INCIPIeNT CAVITATION POINT
FIGURe 4.5b TANGeNT TO RfOIUS OF CURVATURe FOR
A FITTeD eQUATION
■
i
e —

WH
RH
P1
T% ' -
68
il ■..W
for determining the incipient cavitation point, and so to
be able to check the prediction equation as well as to
provide data to pos?ibly extend its range or to derive a
new equation.
4 .1 .3 TeSTS AND PROCeDUReS
The orifice test programme consisted of locating an orifice
in the perspex pipes, and then, with all Instrument
connections in position and with water flowing, the orifice
was photographed at various stages of cavitation; pressure
and flow measurements were also taken. This was repeated
for all of the orifice sizes (Figure 4 . 3 ) .
The sequence of operations used in setting up and operating
the equipment described in the foregoing section for the
main test was as follows
i) With the pump o f f , :he pump suction valve was closed
aad the downstream throttle vclve opened.
i i ) The perspex pi*-es were uncoupled at the flanged
joint, and the required orifice plate inserted
between the flaugeo. The flanges were then bolted
together.
i l l ) The downstream valve was closed and the pump suction
valve opened. A blanking plug was removed from the
pump suction pipe, and the pump was primed. The
blanking plug was then replaced and the suction
valve closed.
iv) Both suction and downstream valves were then opened,
and the pump switched on.
v) With the downstream valve adjusted to give minimum
flow rate, pressures, flow rate and noise level were
measured (under cavltating conditions, photographs
were also taken).
vi) The flow was then increased to give the next
flow/cavitation condition.
m

69
vii) Steps v and vi were then repeated until the maximum
flow or cavitation condition for that orifice had
been observed and recorded,
viii ) The next orifice was tested by repeating steps i to
vii.
Also, the theoretical incipient cavitation pipe flow
velocities for the various orifice sizes were
calculated u; ing equations 2 .16 and 2.17 , the data being
shown in Figure 4 .6 . These data are later used for the
calculation of theoretical pressure drops (for
incipient cavitation), using equation 3 .7 and the
coefficients in figure 3 .7 ; these are compared to the data
from the experimental tests.
The results of the test are to be found in Section 5.1 .
The reduced pressure test programme procedure was to take
water samples, and then using the vacuum flask and vacuum
pump, reduce the pressure (below atmospheric)
progressively; in so doing bubble growth could be observed
and the vapour pressure of the water sample noted. Two
samples of water from the same source were tested, the
first of which had been standing overnight (the air/water
thus being in an equilibrium state), and the second having
been agitated immediately prior to testing.
The following procedure was used for this test:
i) The flask was cleaned using hot soapy water,
followed by flushing with hot water,
i i ) The flask was filled with the sample of water for
testing.
i i i ) Hie vacuum pump, mercury manometer, and flar.k were
connected (Figure 4 .4 ) .
iv) All valves interconnecting equipment were opened,
and the vacuum pump switched on.
v) As the pressure reduced, observations were made and
recorded, along with the manometer reading.
vi) Steps i and v were repeated for the second water
sample.


U P S T B t AM P f c t i i U f t f I kPa I

4 .2 eAST DRIeFONTeIN GOLD MINe CO LTD
in* high pressure part of the study was cor. lucted at the 7
Level Pump Station, North Shaft, east Drlefonteln Golu
Mine. Situated at the pump station are 9 high pressure
pumps, their purpose being to continuously dewater the mine
by pumping water to the surface. each pimp delivers 200
1/s at 10 MPa when operating, the water being drawn from a
large reservoir, and carried in 400mm N.B . columns to the
surface. Connected to the pump columns are drain lines.,
which wnen used, return water to the reservoir.
Due to the underground location of the pump station ( 1000
m below surface), t'' * vater temperature remains constant at
2 4 #C, with corresponding constant vapour pressure.
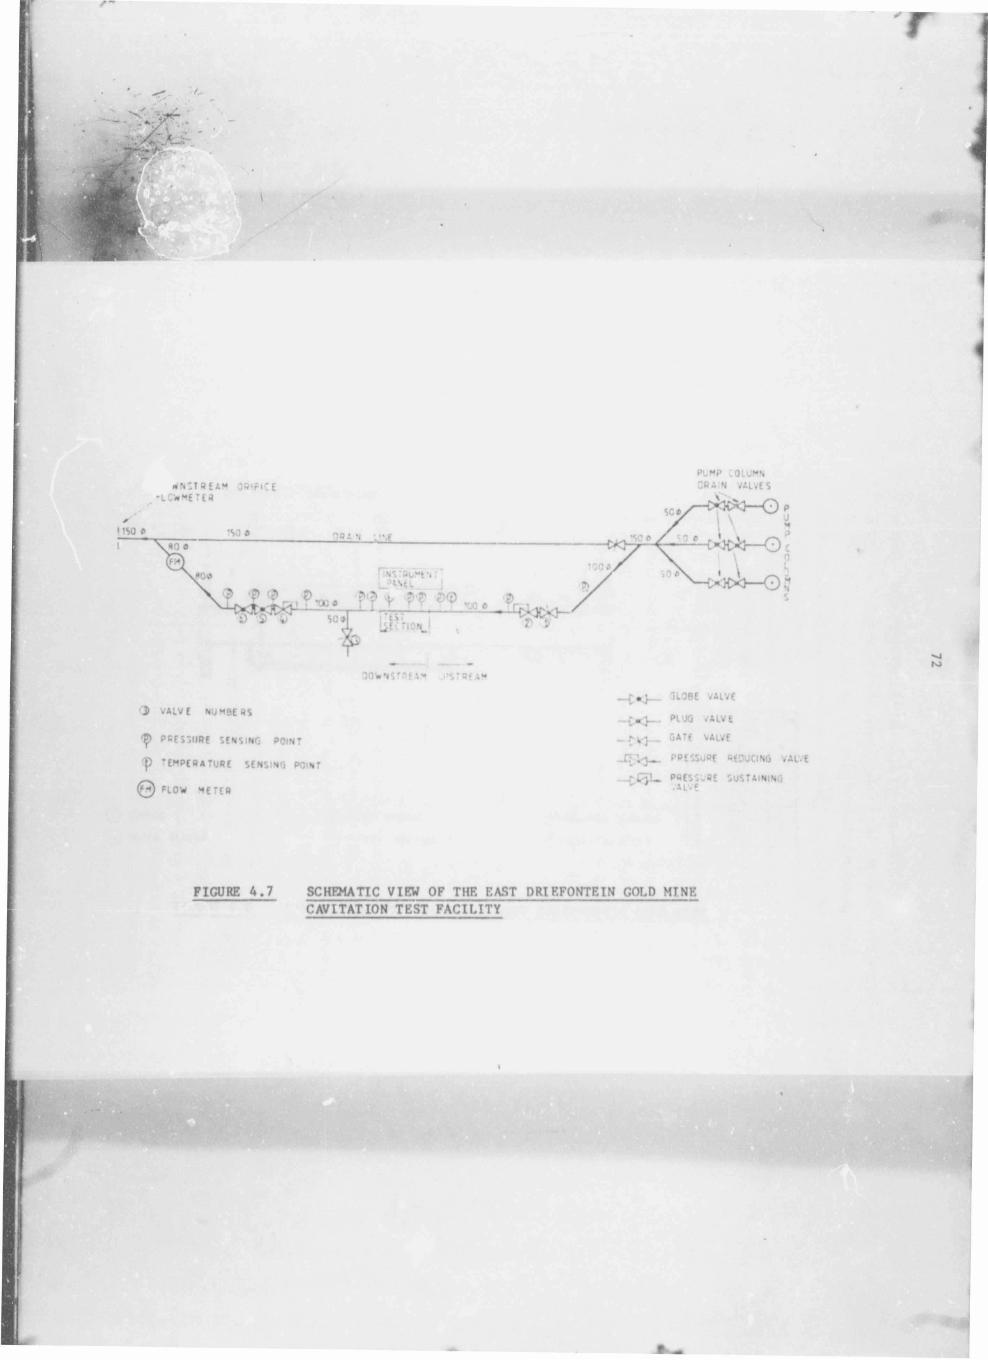
4 .2 .1 TeST FACILITY
The test facility was located beneath one of the above
mentioned drain lines from the pump columns (Figure 4 . 7 ) ,
drawing water from a drain line and returning it to the
drain line after use. The water supply to the test
facility was attained via a lateral tee section which hrd
been positioned in the drain line . Downstream of the tee ,
the drain line was valved o f f , thus allowing water to flow
in an unrestricted manner to the test facility . The first
valve (fo . 1) was a gate valve. This was used for
isolating purposes. To facilitate easy opening when there
was a large pressure difference across the valve, a
reduction gearbox was fitted. Downstream of valve No. 1
was the upstream control valve (N>. 2) which had a pressure
control range of 1724 kPa to 8274 kPa (250 - 1200 PS I) .
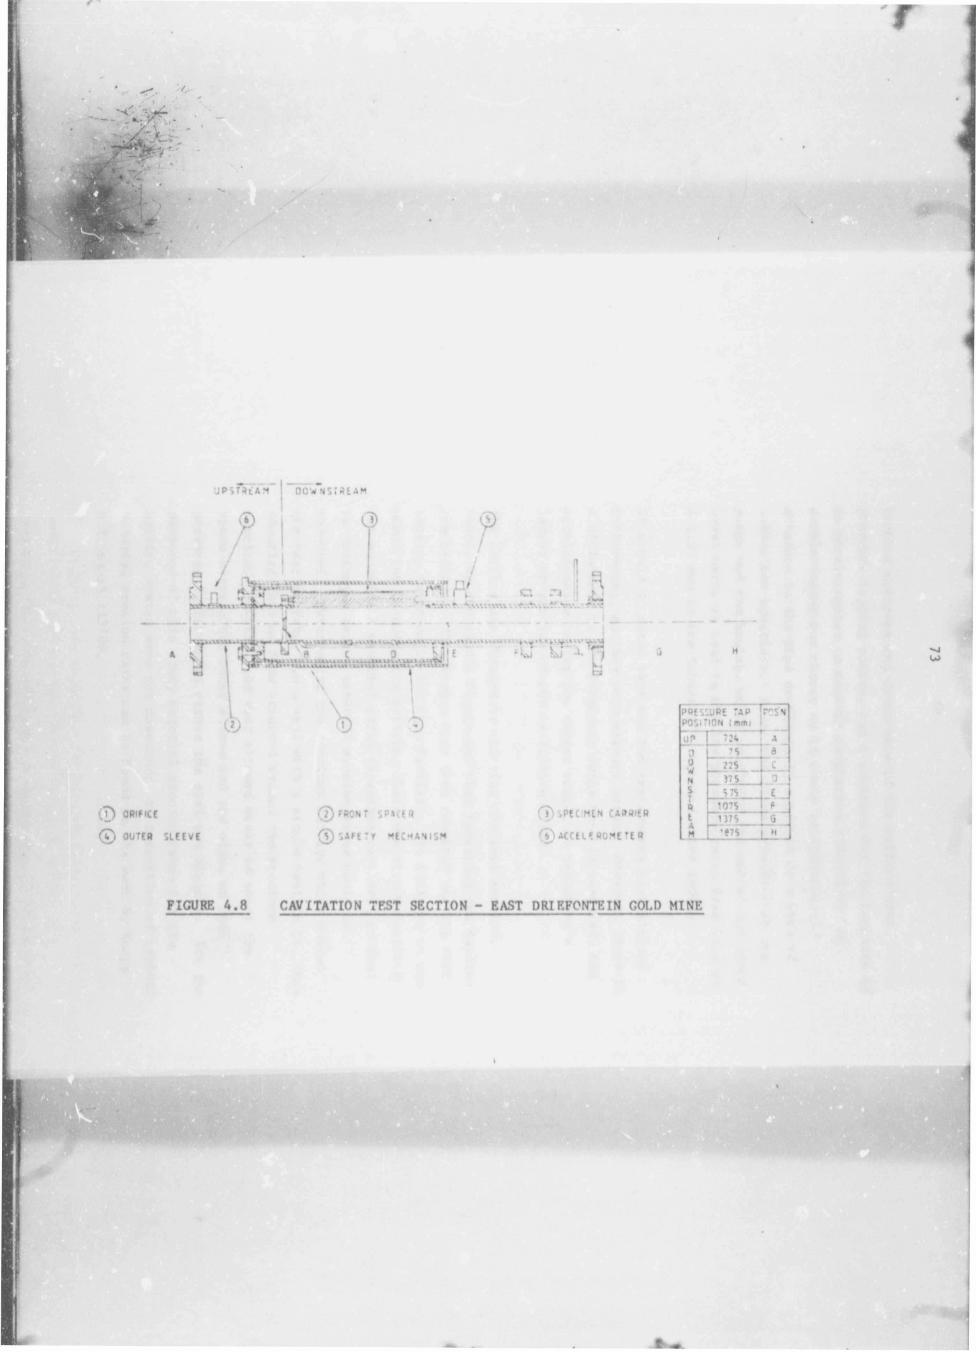
The water at its controlled pressure flowed from valve No.
2 to the test section (See Figure 4 .8 ) where the test
orifice was situated.
,
«*n: tream ooiriCE - LC W M E T ta
PUMP OLUMN
uR A .N VALVES
Pvo* ?'? f f ? W w c ?r.SC»| I ' 1ST
1 U f f r i o n .
30WNSr*fA'* i’S'REA“
5 VA LV E N U M B E R S
P E E S SURE s e n s i n g p o i n t
f p ' E M P E R A T U R E SENS I NG p o i n t
( 0 FLOW M ET E R
_ C * J _ GLOBE VALVE
- £ < }- - PLUG / A L V l
_ ____GATE v a l v e
- C £ V } — PRESSURE REDUCING VAL-E
{ ; C p — PRE SS URE SUSTAINING>A LV 5
FIGURE 4 .7 SCHEMATIC VIEW OF THE EAST DRIEFONTEIN GOLD MTNE
CAVITATION TEST FACILITY
slKJ
H n / o r, i‘wswuwv vteAv. ..f! W . &
C**J &J Tj
-
0 OR i f ICC
0 OUTER S U E V f
0 FRONT S P *ilH
- I C * A N I S *
( T ^ P E C MEN CARRIER
0 ACCEL* ROME T ER
r'-SN
UP
PRESSURE TAP POSITION Immi
Til A’ » r a
"c37 s____ | a
_J.75___ IE _t07j I fT m __"T q
FIGURE 4 .8 CAVITATION TF.ST SECTION - EAST DRIEFONTEIN GOLD MINE
"si
74
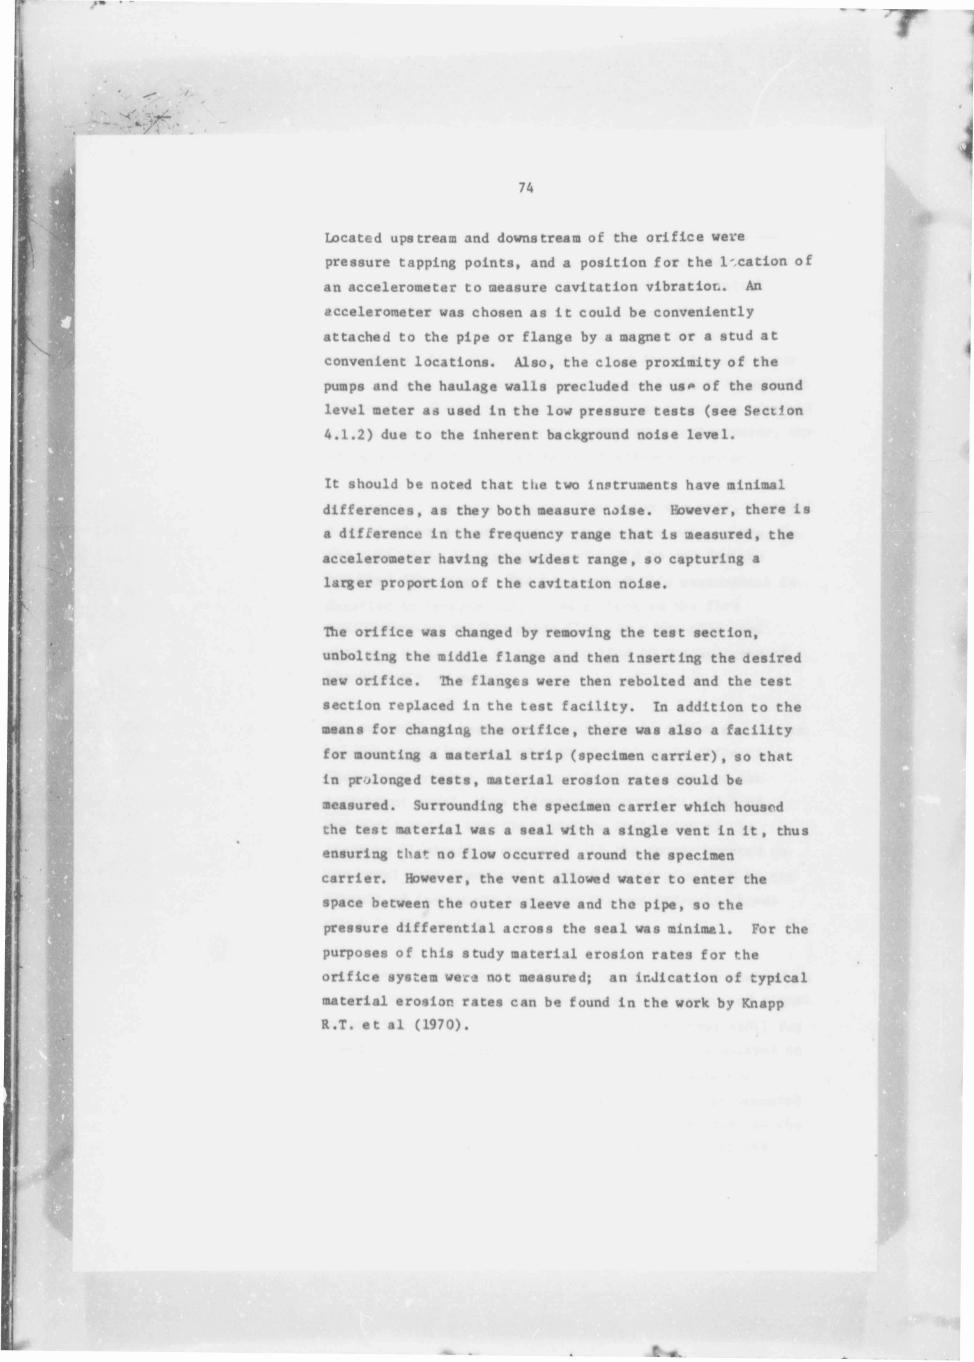
Located upstream and downstream of the orifice were
pressure tapping points, and a position for the l'.cation of
an accelerometer to measure cavitation vibratiot.. An
accelerometer was chosen as it could be conveniently
attached to the pipe or flange by a magnet or a stud at
convenient locations. Also, the close proximity of the
pumps and the haulage walls precluded the us* of the sound
level meter as used in the low pressure tests (see Section
4 .1 . 2 ) due to the Inherent background noise level.
It should be noted that the two instruments have minimal
differences, as they both measure noise. However, there is
a difference in the frequency range that is measured, the
accelerometer having the widest range, so capturing a
larger proportion of the cavitation noise.
The orifice was changed by removing the test section,
unbolting the middle flange and then inserting the desired
new orifice . The flanges were then rebolted and the test
section replaced in the test facility . In addition to the
means for changing the orifice , there was also a facility
for mounting a material strip (specimen carr ier ) , so that
in prolonged tests , material erosion rates could be
measured. Surrounding the specimen carrier which housed
the test material was a seal with a single vent In i t , thus
ensuring that no flow occurred around the specimen
carrier. However, the vent allowed water to enter the
space between the outer sleeve and the pipe , so the
pressure differential across the seal was minimal. For the
purposes of this study material erosion rates for the
orifice system wera not measured; an indication of typical
material erosion rates can be found in the work by Knapp
R .T . et al (1970).
75
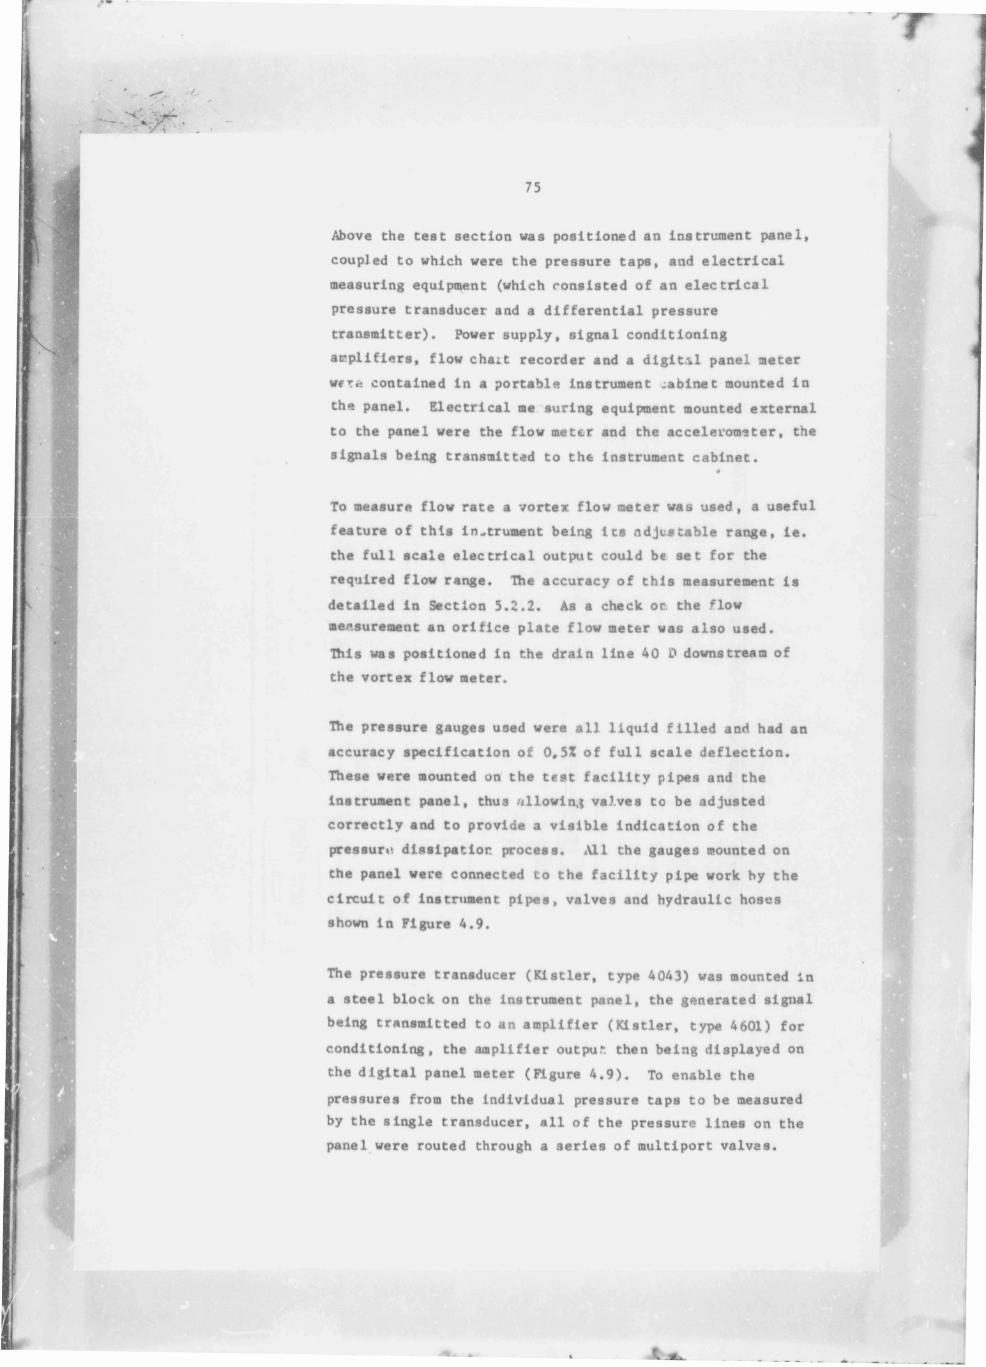
Above the teat section was positioned an instrument panel,
coupled to which were the pressure taps, and electrical
measuring equipment (which consisted of an electrical
pressure transducer and a differential pressure
transmitter). Power supply , signal conditioning
amplifiers, flow chait recorder and a digital panel meter
wer*! contained in a portable instrument cabinet mounted in
the panel. Electrical me suring equipment mounted external
to the panel were the flow meter and the accelerometer, the
signals being transmitted to the Instrument cabinet.*
To measure flow rate a vortex flow meter was used , a useful
feature of this instrument being les adjustable range, ie .
the full scale electrical output could be 3e t for the
required flow range. The accuracy of this measurement is
detailed in Section 5 .2 .2 . As a check oc. the flow
measurement an orifice plate flow meter was also used.
This was positioned in the drain line 40 D downstream of
the vortex flow meter.
The pressure gauges used were all liquid filled and had an
accuracy specification of 0 ,5Z of full scale deflection.
These were mounted on the test facility pipes and the
instrument panel, thus allowing valves to be adjusted
correctly and to provide a visible indication of the
pressure dissipation process. All the gauges mounted on
the panel were connected to the facility pipe work by the
circuit of Instrument pipes, valves and hydraulic hoses
shown in Figure 4 .9 .
The pressure transducer (Kistler , type 4043) was mounted in
a steel block on the Instrument panel, the generated signal
being transmitted to an amplifier (Kistler , type 4601) for
conditioning, the amplifier outpur. then being displayed on
the digital panel meter (Figure 4 . 9 ) . To enable the
pressures from the individual pressure taps to be measured
by the single transducer, all of the pressure lines on the
panel were routed through a series of multiport valves.

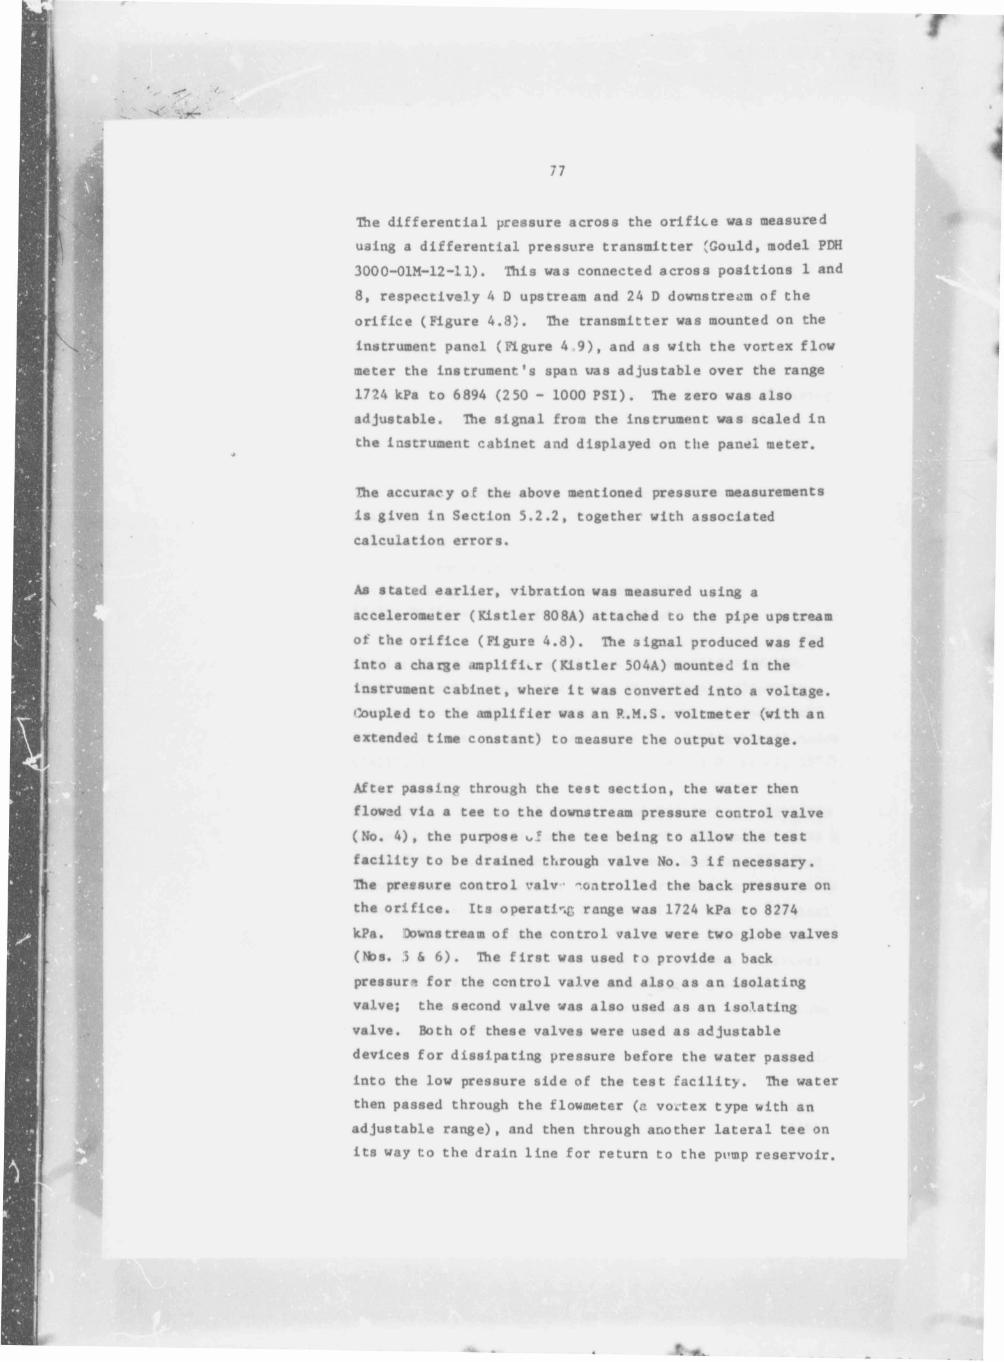
The differential pressure across the orifice was measured
using a differential pressure transmitter (Gould , model PDH
3000-01M-12-11). This was connected across positions 1 and
8 , respectively 4 D upstream and 24 D downstream of the
orifice (Figure 4 . 8 ) . The transmitter was mounted on the
instrument panel (Figure 4 9 ) , and as with the vortex flow
meter the Instrument's span was adjustable over the range
1724 kPa to 6894 (2 50 - 1000 P S I ) . The zero was also
adjustable. The signal from the instrument was scaled in
the instrument cabinet and displayed on the panel meter.
The accuracy of the above mentioned pressure measurements
is given in Section 5 . 2 . 2 , together with associated
calculation errors.
As stated earlier , vibration was measured using a
accelerometer (Kistler 808A) attached to the pipe upstream
of the orifice (Figura 4 . 8 ) . The signal produced was fed
into a charge amplifier (Kistler 504A) mounted in the
instrument cabinet, where it was converted into a voltage.
'Coupled to the amplifier was an P..M.S. voltmeter (with an
extended time constant) to measure the output voltage.
After passing through the test section, the water then
flowed via a tee to the downstream pressure control valve
(No. 4 ) , the purpose of the tee being to allow the test
facility to be drained through valve No. 3 i f necessary.
The pressure control valv • controlled the back pressure on
the orifice . Its operative range was 1724 kPa to 8274
kPa. downstream of the control valve were two globe valves
(Nos. 3 & 6 ) . The first was used to provide a back
pressure for the control valve and also as an Isolating
valve; the second valve was also used as an isolating
valve. Both of these valves were used as adjustable
devices for dissipating pressure before the water passed
into the low pressure side of the test facility . The water
then passed through the flowmeter ( a vortex type with an
adjustable range), and then through another lateral tee on
its way to the drain line for return to the pemp reservoir.
Author Greenfield Paul Somerford
Name of thesis Investigation Of Incipient Cavitation Limits For Square-edged Orifice Plate Pressure Dissipators In High
Pressure Water Reticulation Systems. 1985
PUBLISHER: University of the Witwatersrand, Johannesburg
©2013
LEGAL NOTICES:
Copyright Notice: All materials on the Un i ve r s i t y o f the Wi twa te r s rand , Johannesbu rg L ib ra ry website are protected by South African copyright law and may not be distributed, transmitted, displayed, or otherwise published in any format, without the prior written permission of the copyright owner.
Disclaimer and Terms of Use: Provided that you maintain all copyright and other notices contained therein, you may download material (one machine readable copy and one print copy per page) for your personal and/or educational non-commercial use only.
The University of the Witwatersrand, Johannesburg, is not responsible for any errors or omissions and excludes any and all liability for any errors in or omissions from the information on the Library website.
Related Documents