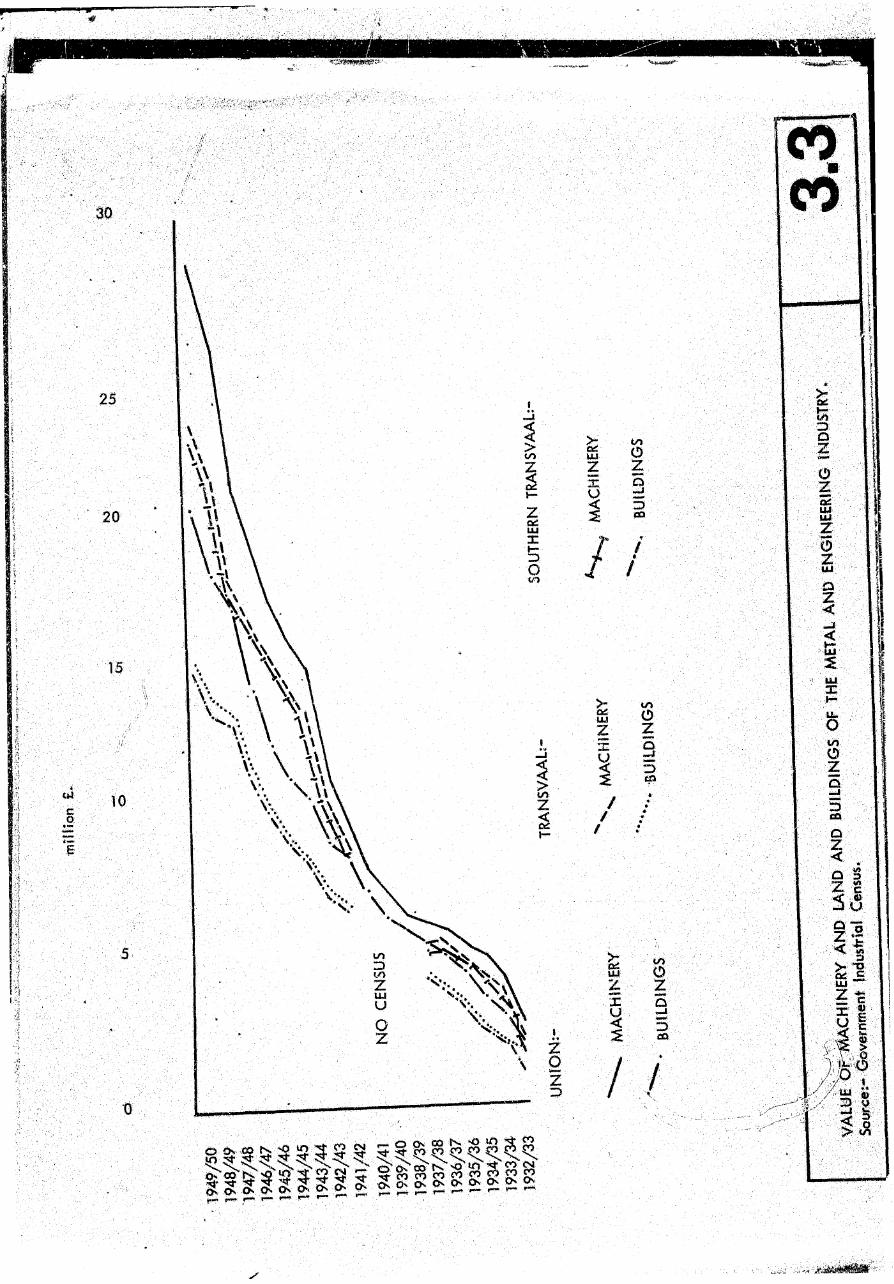
Capital investment Increased rapidly during this phase, (Figure 2.4) most o f it in itia lly being invested in machinery on the Witwatersrand. In fact during 1933/34/35 and 36, the amount invested in machinery on the Wihvatersrand exceeded that invested in land and buildings throughout the Union, th is caused an increase in productivity per head and allowed the industry to gain profits which were badly needed to further expansion and improvements. As the economy in the country improved and gold production increased, the Witwatersrand engineers extended their scope and markets, a situation closely associated with a gold price rise from R12.50 an ounce in 1933 to R15.50 an ounce in 1939 (Houghton 1964). In 1938 there were 548 private metal engineering, machinery and cutlery works in the Southern Transvaal. O f these 270 or 49% were engineering works, 82 or 15% were electrical apparatus and engineering works, while 60 or 11% were mine workshops. The remaining 3% included repair shops for scales, typewriters# sewing machines, locksmiths etc. The Government maintained 91 engineering establishments throughout the country, mainly for repairs to the railways, telephones and other Government property. Some o f these were on the Witwatersrand, but as they did not supply products to the public or mines, they can be considered rather as consumers of the metal industry’s products and form only q small portion of the market. After the mining industry's large shore in the market, the next consumer o f iron and steel products was the building construction industry. This Industry was even more dependent on the general state o f the economy for its well being. The building Industry is closely associated with capital investments and was perhaps one o f those most susceptible to fluctuations# expanding In boom times when ccpittii was readily available and declinging during recessions. A wide range of products were produced by the metal industry prior to the Second World War. The two most valuable articles were "Pipes, tubes and fittings" (iron and steel) and "structural steel work manufactured" (Figure 2.9). These were used by many industries including the mines and construction works. Plumbing and galvanising works were second only to engineering works on the Witwatersrand, constituting 22% of the establishments. The same table shows that the greatest volume and value o f output came from those manufacturers whose articles could find markets apart from the mines. This meant that the industrial sector of the country was beginning to develop sufficiently to play a noticeable port in the marketing of engineering products. An example of this is the plumbing industry which catered not only for the mines and construction industries, but also for the manufacturing industry, public and even the service industries. Because of this comparatively wide market for plumbing products, engineering 'vorks specialising In their manufacture were able to produce and market R2 687 524 worth in 1938.

Welcome message from author
This document is posted to help you gain knowledge. Please leave a comment to let me know what you think about it! Share it to your friends and learn new things together.
Transcript

Capital investment Increased rapidly during this phase, (Figure 2.4) most o f it in itia lly being invested in
machinery on the Witwatersrand. In fact during 1933/34/35 and 36, the amount invested in machinery on the
Wihvatersrand exceeded that invested in land and buildings throughout the Union, th is caused an increase in
productivity per head and allowed the industry to gain profits which were badly needed to further expansion and
improvements. As the economy in the country improved and gold production increased, the Witwatersrand engineers
extended their scope and markets, a situation closely associated with a gold price rise from R12.50 an ounce in 1933
to R15.50 an ounce in 1939 (Houghton 1964).
In 1938 there were 548 private metal engineering, machinery and cutlery works in the Southern Transvaal.
O f these 270 or 49% were engineering works, 82 or 15% were electrical apparatus and engineering works, while 60 or 11% were mine workshops. The remaining 3% included repair shops for scales, typewriters# sewing machines,
locksmiths etc. The Government maintained 91 engineering establishments throughout the country, mainly for repairs
to the railways, telephones and other Government property. Some of these were on the Witwatersrand, but as they
did not supply products to the public or mines, they can be considered rather as consumers of the metal industry’s
products and form only q small portion of the market. After the mining industry's large shore in the market, the next
consumer of iron and steel products was the building construction industry. This Industry was even more dependent
on the general state o f the economy for its well being. The building Industry is closely associated with capital
investments and was perhaps one of those most susceptible to fluctuations# expanding In boom times when ccpittii was
readily available and declinging during recessions.
A wide range of products were produced by the metal industry prior to the Second World War. The two most
valuable articles were "Pipes, tubes and fittings" (iron and steel) and "structural steel work manufactured" (Figure 2.9).
These were used by many industries including the mines and construction works. Plumbing and galvanising works were
second only to engineering works on the Witwatersrand, constituting 22% of the establishments.
The same table shows that the greatest volume and value o f output came from those manufacturers whose
articles could find markets apart from the mines. This meant that the industrial sector of the country was beginning to
develop sufficiently to play a noticeable port in the marketing of engineering products. An example of this is the plumbing
industry which catered not only for the mines and construction industries, but also for the manufacturing industry, public
and even the service industries. Because of this comparatively wide market for plumbing products, engineering 'vorks
specialising In their manufacture were able to produce and market R2 687 524 worth in 1938.
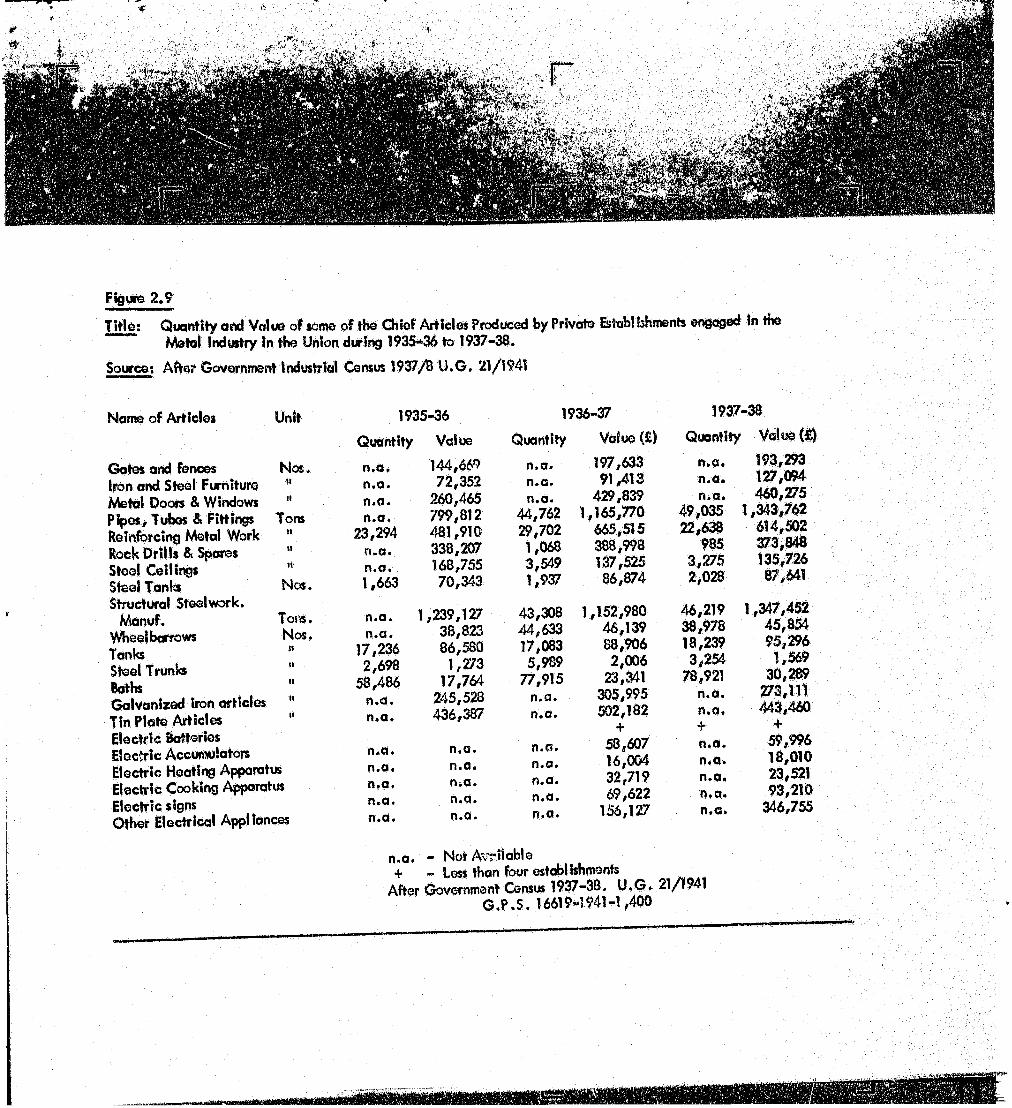
Figure 2.9
T itle ; Quantity and Value o f some of the Chief Articles Produced by Private Estab!Uhments engaged in the Metal Industry In the Union during 1935-36 to 1937-38.
Source; A fter Government Industrial Census 1937/8 U .G . 21/1941
Name o f Articles Unit
Gates and fences Iron and Steel Furniture Metal Doors & Windows Pipes, Tubes & Fittings Reinforcing Metal Work Rock D rills & Spares Steel Ceilings Steel Tanks Structural Steelwork.
Manuf.Wheelbarrows TanksSteel Trunks 1BathsGalvanized iron articles 1 Tin Plate Articles Electric Batteries Electric Accumulators Electric Heating Apparatus Electric Cooking Apparatus Electric signsOther Electrical Appliances
Nos.t l
IITons
II
Nos.
Tons.Nos.si
1935-36
Quantity Value
n.a . 144,669 n .a . 72,352n.a. 260,465n.a , 799,812
23,294 481,910n.a . 338,207n.a. 168,7551,663 70,343
n.a . 1,239,127n.a . 38,823
17,236 86,5802,698 1,273
58,486 17,764n.a. 245,528n.a . 436,387
1936-37 1937-38
n.a.n.a.n.a,n.a,n.a.
n.a,n.a.n.a.n.a.n.a.
Quantity Value (£) Quantity
n.a* 197,633 n.a.n.a. 91,413 n.a.n.a. 429,839 n.a.
44,762 1,165,770 49,03529,702 665,515 22,6381,068 388,998 9853,549 137,525 3,2751,937 86,874 2,028
43,308 1,152,980 46,21944,633 46,139 38,97817,083 88,906 18,2395,989 2,006 3,254
77,915 23,341 78,921n.a. 305,995 n.a.n.a. 502,182 n.a.
+ +n.a. 58,607 n.a.n.a. 16,004 n.a.n.a. 32,719 n.a.n.a. 69,622 n.a.n.a. 156,127 n.a.
n.a. - Not Available+ - Less than four establishments
After Government Census 1937-38, U .G , 21/1941Ann
193,293127,094460,275
1,343,762614,502373,848135,72687,641
1,347,452 45,854 95,296
1,569 30,289
273,111 443,460
4-59,99618,01023,52193,210
346,755
The only product directly linked to the mining industry was "rock drills and rock d rill spares". 985 tons or
R747 696 (£373 843) worth, were produced during 1937/38. This is a small amount when compared to the R2 694 904
(£! 347 452), worth o f structural steel which was also produced In the country.
It Is apparent therefore that with more than 47.5% of the country's engineering In the Southern Transvaal # the
mines remained the major stimulant to this industry. However, it should also be realised that the vast majority of
articles produced by them for the mines were such, that they could be used in other spheres of the economy without
further adaptation. Thus a factory which produced pipes for the mines, could also sell these to the Navy or Army.
The eight years following the 1933 depression had seen the development of a good growth rate. The tempo of this
expansion has been maintained since. South Africa's modern Industrial economy dates from the recovery of the
depression. The Second World War which lasted from 1939 to 1945 had its own effect upon this growth, but it found
a much better prepared country in 1939 than had existed In 1914 when the First World War started. The boost given
by the Second World War was better utilised than that of the First. The growth and expansion had been initiated In
the early thirties and was enhanced by the necessities of the Second World War.
In conclusion one might observe that the Metal and Engineering Industry In South Africa followed the spread
of the European Population. Starting at the coast it spread Inland with the mineral discoveries. On the Witwatersrand
the industry was dependent upon the gold mines for its main market. The First World War and the resultant curtailment
of imports produced increased demands upon the Industry . With the fall of prices and the depression after the war, the
Industry came under a severe strain. The internal market diminished and foreign competition increased. Protective
ta r if fs , introduced after 1924, did a little to help,but the industry remained much dependent upon the gold mines.
After the 1930 depression, expansion and development occurred as never before. This was the result o f an improved
economic climate, which together with protective tariffs encouraged Industrialisation, blew manufacturing concern,
were developed and older firms expanded to keep up with local demands. The South African engineering Industry
was attempting to supply the Internal market and in doing so was itself furthering the industrialisation of the country
and expanding the local market. From 1933 onwards the engineering industry entered a period of sustained growth,
which placed It in a good position to benefit from the demands of World War Two.
C H A P T E R III!
THE DRIVE TO MATURITY OF THE BASE METAL, METAL PRODUCTS AND ~ ' ” MACHINE INDUSTRY
19^9^1945"
1.0 The Waf Efforts
The period of rapid recovery from ihe depression had placed South Africa In a much better position than i t had
been in 1914* Between 1936 and 1939 efficiency improved and production at ISCOR increased to 350 000 Ingot tons
per annum. Profits also increased to approximately R2 000 000 a year. The rqpld growth of secondary engineerirg
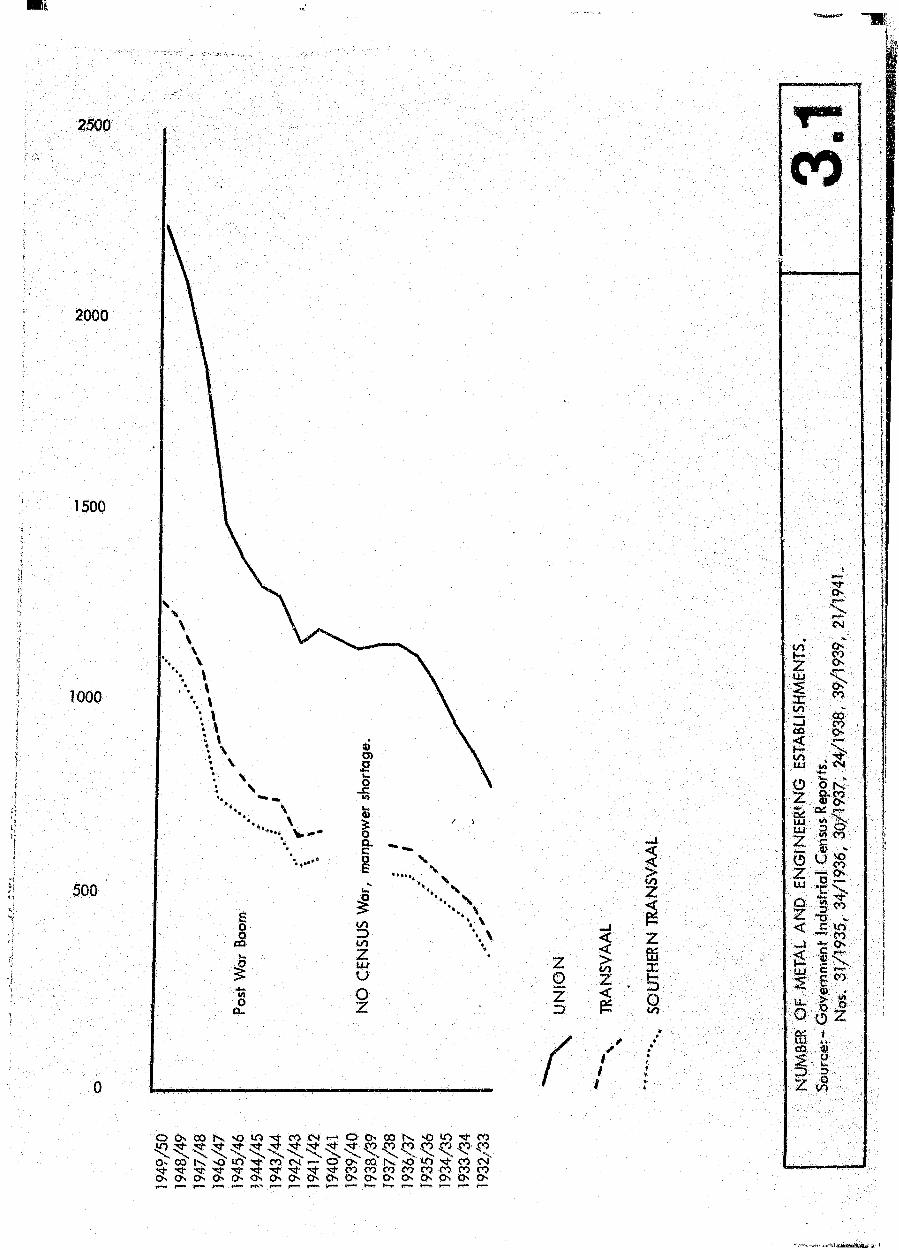
establishments resulted in the need for expansion at ISCOR (Figure 3.1)
In 1938, ISCOR had R2 500 000 in free funds which Dr. van der B ijl wanted to invest in a new steelworks in
the Vereeniging area, but the declaration o f war occurred before financial assistance could be obtained In London
and expansion was limited to Pretoria. A second coke oven battery and two 25 ton Bessemer convertors were planned.
These alterations and additions were designed to increase output by 100 000 tons per annum.
A t the outbreak of war In September 1939, South Africa had 1 134 establishments engaged In metal and engineering
work. These firms employed 66 151 people of all races, had an investment of R25 132 000 and a gross volue of production
of R61 258 000.
Despite the phenomenal growth daring the previous decade (Figure 2.3) the industry In the Transvaal was limited
to jobbing, repairing and maintaining equipment for the mines and secondary industry.
By 1941 ISCOR had converted from a peace-time to a war-time basis. Production was geared to include helmet
steel, bayonet steel, trench mortar, barrel steel and many other varieties designed to serve the needs o f war, A t the
same time ISCOR lost a number of its more experienced staff who were Germans and who were interned. Output also
declined through the necessity of making special steels in furnaces never intended for such work. Sales decreased and
costs rose, but ISCOR, which had been supported by the Government during the depression by the establishment of
anti-dumping duties, now repaid its debt by keeping prices down, even though profits dropped.
The isolation and d ifficu lty of importing special steels at this time resulted in a need to expand the works to keep
pace w ith demands. Louis Marks offered van der Bijl land a few miles west of Vereeniging below the ruling market price.
2500
2000
1500
1 0 0 0
w
V - CL
500
Q-
zgz3
!
f
N o inZ4" 3T Cf C O t N r - O O C O I x O t O ’ ^ C ' )
On co N o' in* **' co' cm t— o O' cd" rx o' o V co cn1N r t - ' ^ - N ! j - N c J - N ^ - « j - N 5J - ' < ^ N f N C t C O O O C O O O C O C O C O r OOn On On On On On On On On On On O O n On On On On Onr— >-•». y—4 »*•— rtvv r— r** >*• r-*1 p—- :r— *—? r—" r** r—
12ZLU
#—I
Ii2
i
Iz
I
I<
%<N
§
I
f
I s
I Ifl> <
0
•§.c-
rj-co
.]!% 1
§ g z (8
NeoHy 40 square miles o f land vws acquired In this way and not only was a new steelworks planned, but also a complete
new town and industrial centre. Because of the war only a plate m ill was erected at van der B ijl Park which was so
designed to become part of a major integrated works, with semi-continuous mills devoted to rolling fla t products*
In itia lly , the plate m ill was supplied with steel slab from Pretoria, bu> this further increased demands on ISCOR and stimulated further expansion.
A third furnace was provided to increase the output of Iron and steel for the plant, improvements were made
and new soaking pits and a combined slabbing and blooming m ill were provided to supply slabs as well as to ro ll blooms for the Pretoria m ills. Further improvements resulted In a medium m ill with reheating furnace, the light mills were
extended and a small sections m ill Was erected for the production of the smaller bars required by the tool-making industry.
In addition an "Emergency Wire Plant" was erected which included a 3 000 ton forge press bu ilt in America; this helped to ease the pressing needs of Agriculture,
The increase in production placed greater dsmands on the sources of raw materials and transport facilities.
The expansion also placed heavier burdens upon iSCOR's own engineers and maintenance works. The entire expansion
which cost RI5 200 000, was raised by the issue o f new shares. It Is indicative o f the potential and sound economic
ground upon which ISCOR and the country's metal and engineering industry is based, that a ll this expansion and increased
demands were accomplished without great disruption.
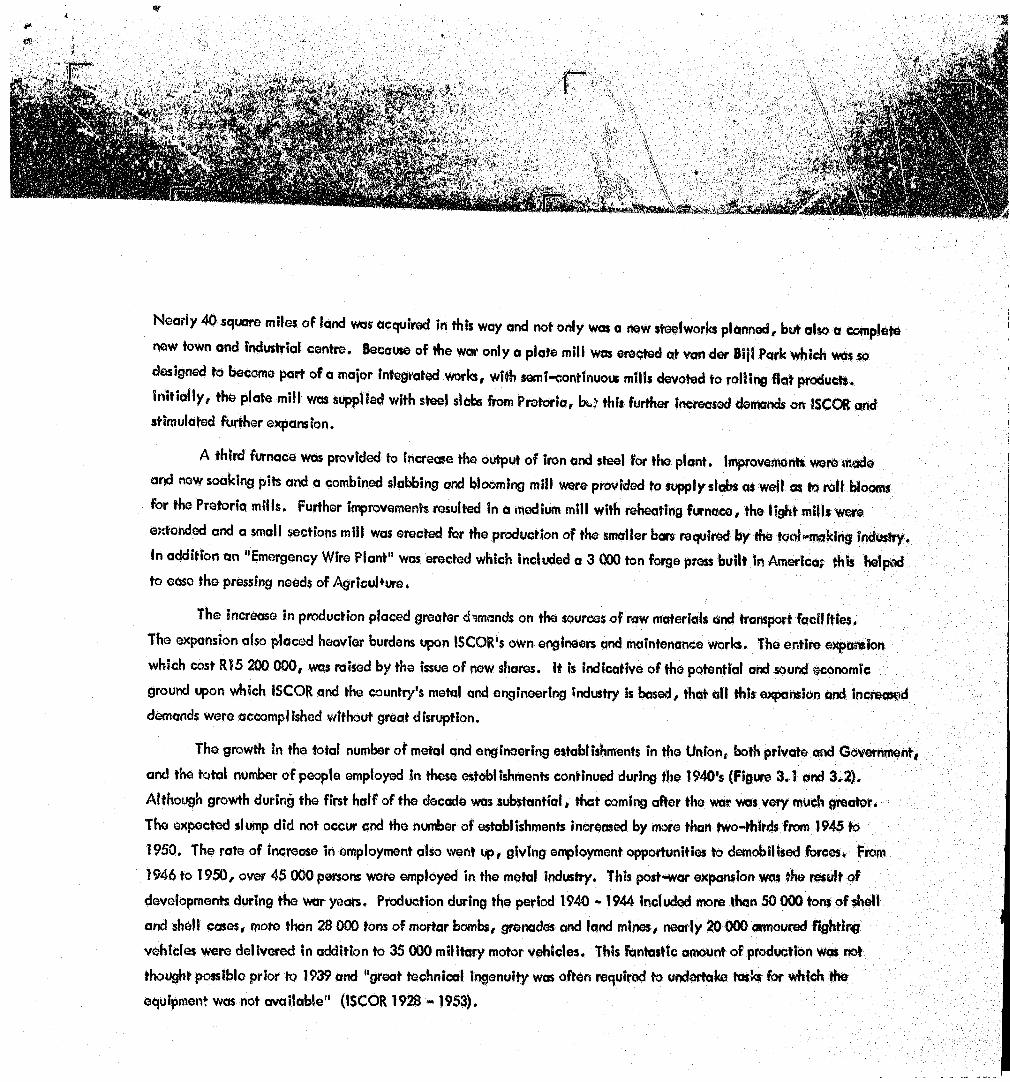
The growth in the total number o f metal and engineering establishments in the Union, both private and Government,
and the total number o f people employed in these estobl ishments continued during the 1940's (Figure 3.1 and 3,2),
Although growth during the first ha lf of the decade was substantial, that coming after the war was very much greater.
The expected slump did not occur end the number of establishments increased by more than two-thirds from 1945 to
1950. The rate of increase in employment also went up, giving employment opportunities to demobilised forces* From
1946 to 1950, over 45 000 persons were employed in the metal industry. This post-war expansion was the result of
developments during the war years. Production during the period 1940 - 1944 included more than 50 000 tons o f shell
and shell cases, more than 28 000 tons of mortar bomb, grenades and land mines, nearly 20 000 armoured fighting
vehicles were delivered in addition to 35 000 m ilitary motor vehicles. This fantastic amount o f production was not
thought possible prior to 1939 and "great technical ingenuity was often required to undertake tasks for which the
equipment was not available" (ISCOR 1928 - 1953),
80,000
70,000
60,000
50,000
40,000
30,000
IV )z$O-
§tu
ZozD
7
&z
I
1 1xf— 7
f t
//
i<y
zoz3
/z I II— 7
D 2
8 #o
z
South Africa not only managed to produce these articles, but even led the world in design and cheap production ,n some article, such a, mortar sights and rifle barrel lapping machine,. It should be realised that b e t,* ,939 South
Africa had never made a rifle or gun. Trench mortars, mobile artillery for infantry, 3 .7howitzers, % pound and
6 POUnd anH“ tank Suns as well as rifles and machine guns were a ll manufactured in South Africa. In the structural
steel fie ld aeroplane hangars and various types of bridges alone consumed 60 000 tons of steel. A ll this production
required ingenuity and tools. The value of machine tools especially imported for war production alone amounted to R2 000 000.
It can be seen from Figure i ,7 that the Union's total number of private establishments increased very little
between 1938/39 and 1944/45. In fact 1939 - 40 and 1942 - 43 saw decreases in the total number. Unfortunately
figures for the Witwatersrand and Transvaal for 1938/39 and 1941/42 were never published, However, they seem to
follow the general trend of the country. The lack of development o f new industries during the early part of the war
was probably due to the restrictions on imports and the increased priorities given to war materials.
The Witwatersrand always had a lion's share o f the metal and engineering industry. It increased from 47,56%
in 1937/38 to 51.11% in 1945/46. This meant that by the end of the war more than half of the country's metal and
engineering establishments were in the Southern Transvaal. By 1949/50 the Witwatersrand s till had 50.31% of a ll
establishments. The percentage increases from 1937 to 1950 were 99.64% and 107.97% for the Union and Southern
Transvaal respectively. This means that the rate o f development of the industry on the Witwatersrand was 8% higher
for the decade than the rest of the country. Although this averages less than 1% per annum it did mean that Industry
was centralising around the Witwatersrand economic Island. It also meant that the rapid growth of towns on the Reef
was not sufficiently well-planned or co-ordinated to meet the demands made upon them for housing and transport.
Wartime Controls;
Labour;
The economy o f the country had to be carefully watched and kept in check by the Government and to do this
a Director-General of War Supplies Organisation was appointed. As a body this was responsible for placing of contracts,
organising the flow of components and making scheduled deliveries to the m ilitary, naval and a ir force authorities.
Generally a policy of decentralisation was followed where possible.
25
20
15
I10
0/

2000
1800
1700 1200
16001100
1000
900
800
NO J FMA MJ J AS ONOJF M AM J J ASONDJFHAMJ JASON D
1939 1940 1941
* »
^ Z = = : z c c = i z z z z : .
C n J ” " ^ ™ T ^ 10 ^ and C° UW " » * - » • ,h • M W without the prior euHwrlty o f the
“ ; 2 Z W° : ra,en* d by ” kin9 " 0bM^ * « * • Axed number of overtime h=u„ e™, *traditional 2 000 eppnrnt.cor wem trough, into the metal Industrie,. Women emergency worker, were (mreduced In
In ™ !ntoroiVC " ° Mn9 COTMS' W « e r 6 500 emergency female workers were employed
Wages:
This w J r . T ° f r " <R8,<rc 3 ' 9 C0Uld Wl* * • * * “ ™ -' =f 'he Controller of Manpower,was due lo the voluntary acceptance of a form of conscription by the metal industry 0s par, of Its war effort.

£’! p
er a
nnum
%
1 0 0 0
goo
600
400
MANAGERS
200
WHITE WORKERS
AFRICANS
' X _
zo
/
%z#
1XD8
o O 'O r^ 'O in x h W c v ̂ ^ ̂ ̂ ̂ ^ r- ' CO >-. ~0 uS* -y- (o' CV! ,— O cv,,<r ^ -'■* *<f xh %' ' '*>o * o - c> cn -cs o e>s. ■s
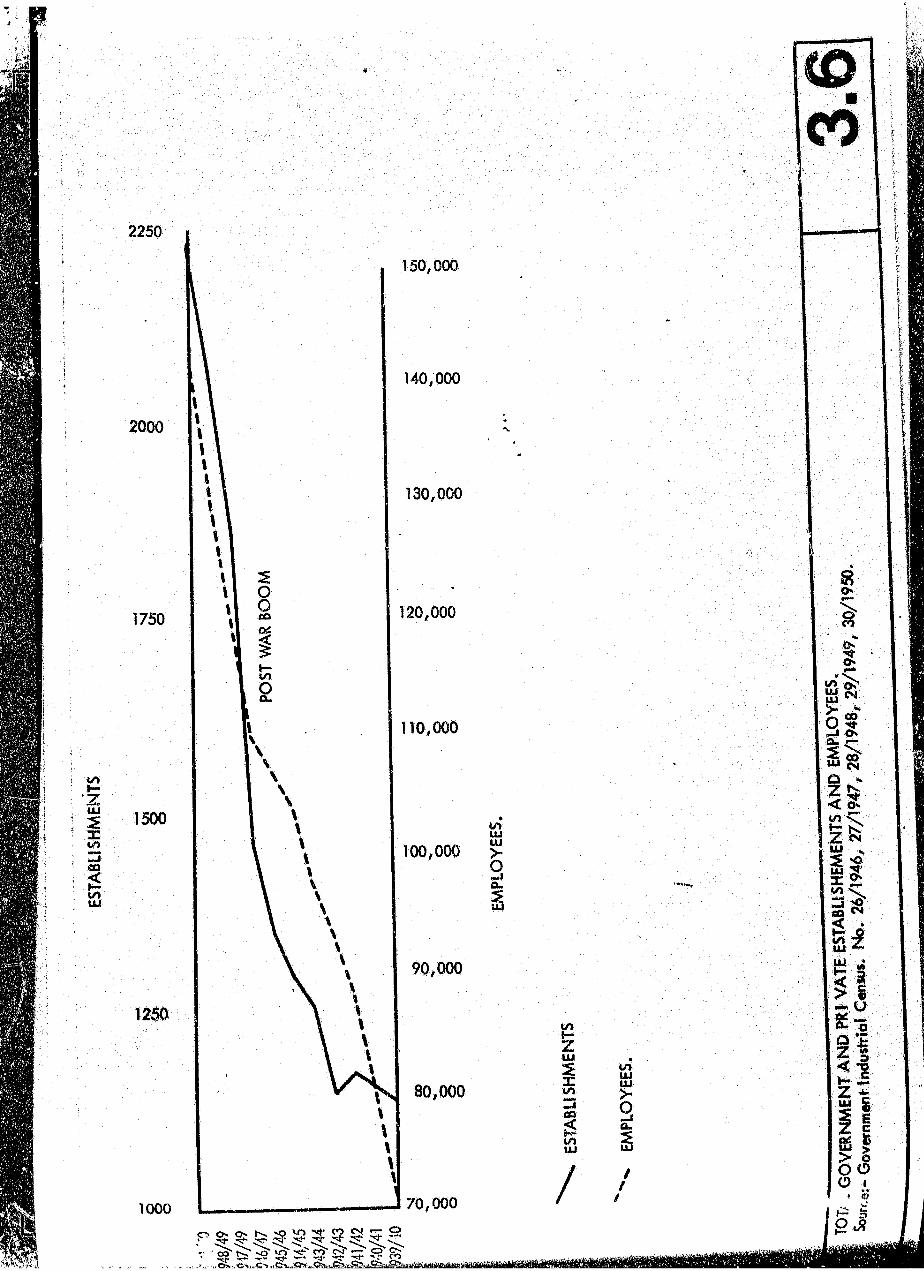
Workers were moved from firm to firm depending on the importance of contracts or were transferred to coastal
areas to assist in the ship repair work which was becoming increasingly important. Figure 3.6 shows the increase in the
number of private and Government metal and engineering establishments and employeesfor the whole country during the
1940"s. The total number of employees in the industry rose from 94 504 in 1939/40 to 132 577 in 1944/45. In the
Southern Transvaal the increase in private employees rose from 50 982 in 1937/38 to 75 783 in 1944/45. During the
1937/38 62% of a ll private employees had been african; by 1944/45 this rose to 64%, but then remained more or
less constant until 1950. This means that throughout the 1940's decade Europeans constituted approximately 36% df
the metal and engineering industry's labour force in the Southern Transvaal. The small increase in the percentage of
non-white labour employed by the industry did not result in any marked encroachment on skilled and semi-skilled
European metal workers. Although skilled labour was in short supply the expansion of the Industry's labour force
remained remarkably constant in its growth - the gap left by skilled artisans being filled by emergency workers, women
and new apprentices. Here the metal and engineering industry differs markedly from manufacturing as a whole where the
increasu in non-white labour was 74% over the 1938/439 to 1944/45 period and the white labour force Increased only
20% for the same period. Not only were wages and workers controlled, but so were raw materials, The Director-
General of War Supplies Organisation controlled both ferrous and non-ferrous metal supplies. These were supplied
in such a way as to ensure their equitable allocation especially to essential jobs.
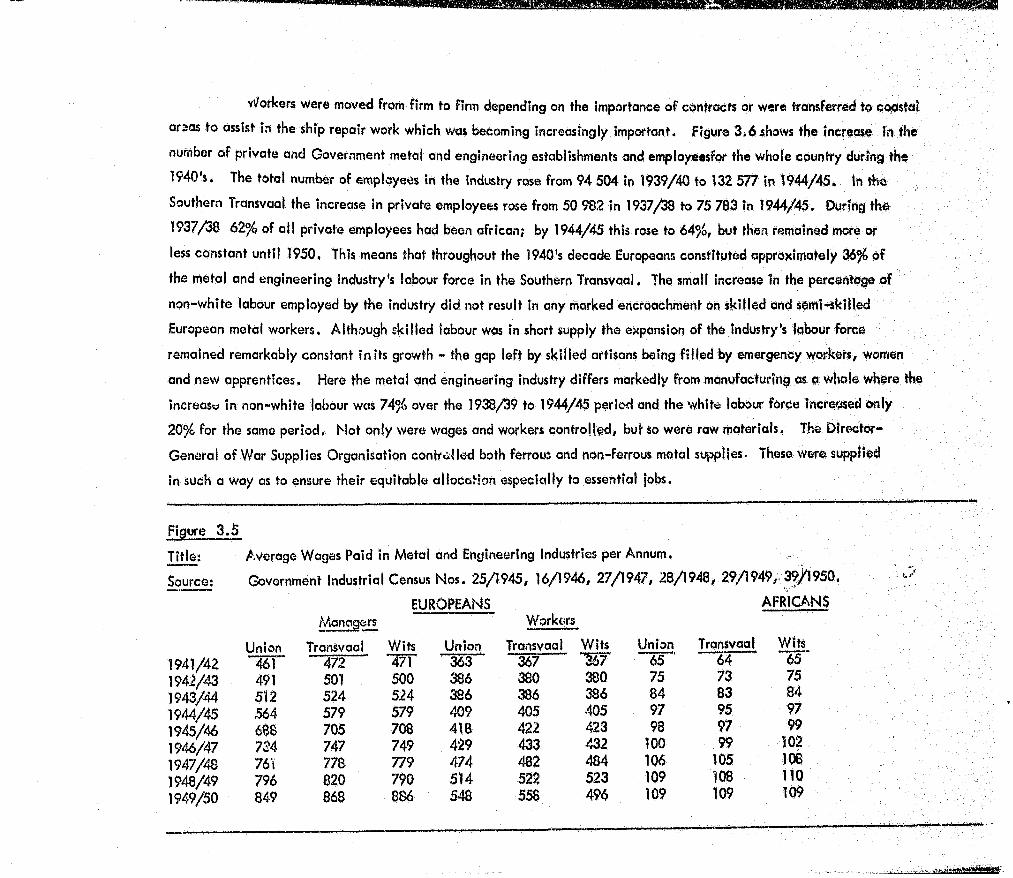
Figure 3.5
Title; Average Wages Paid in Metal and Engineering Industries per Annum,
Source; Government Industrial Census Nos. 25/1945, 16/1946, 27/1947, 28/1948 , 29/1949, 39/1950,
EUROPEANSManagers
Union Transvaal Wits Union1941/42 461 472 471 ' 3631942/43 491 501 500 3861943/44 512 524 524 3861944/45 564 579 579 4091945/46 688 705 708 4181946/47 734 747 749 4291947/48 76 i 778 779 4741948/49 796 820 790 5141949/50 849 868 886 548
AFRICANSWorkers
Transvaal Wits Union Transvaal Wits367 '367 65 ' 64 65380 380 75 73 75386 386 84 83 84405 405 97 95 97422 423 98 97 99433 432 100 99 102482 484 106 105 106522 523 109 108 no558 496 109 109 109
2250
150,000
2000
140,000
130,000
1750 120,000
110,000
5uu
ito13
!
1500
100,000s1
90,000
1000
80,000
zLUIto—I<
$3I
z l :
70,000
..O x .C s -.C -i .,C% ..Ch>,.O xl .< ^ . j& l!S2ui£SLiu«-ii>'uteiiiaii»»iR
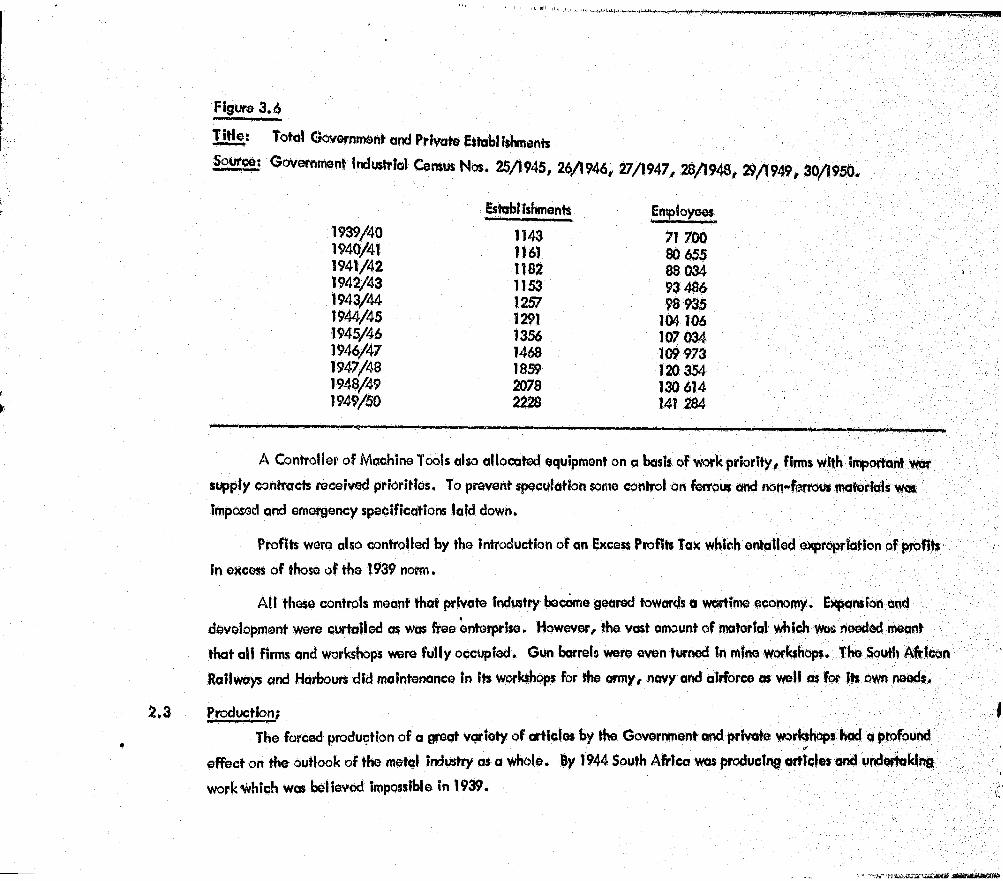
Figure 3.6
TiHe: Total Govemrmmfr and Private Establishments
Sotffce: Govemmont Industrial Census Nos. 25/1945, 26/1946, 27/1947, 28/1948, 29/1949, 30/1950.
Establishments Empioyoes
1939/40 1143 71 700W O/41 116) 80 6551941/42 1182 8 8 0341942/43 1153 93 4861943/44 1257 98 9351944/45 1291 104 1061945/46 1356 107 0341946/47 1468 109 9 7 3
1947/48 1859 120 3541948/49 2078 )30 6141949/50 2228 141 284
A Controller o f Machine Tools also allocated equipment on a basis of work priority, firms with important war
supply contracts received priorities. To prevent speculation some control on ferrous and non-ferrous materials was
imposed and emetgency specifications laid down.
Profits were also controlled by the Introduction o f an Excess Profits Tax which entailed expropriation of profits
in excess o f those o f the 1939 norm,
A ll these controls meant that private Industry became geared towards a wartime economy. Expansion and
development were curtailed as was free enterprise. However, the vast amount of material which Was heeded meant
that a ll firms and workshops were fu lly occupied. Gun barrels were even turned In mine workshops. The South Afrlcon
Railways and Harbours did maintenance In Its workshops for the army, navy and airforce os well os for Its own needs.
Production; I
The forced production of a great variety of articles by the Government and private workshops had a profound
effect on the outlook o f the metal industry as a whole. By 1944 South Africa was producing articles and undertaking
work Which was believed impossible in 1939. /
Some examples of this are the 5 700 armoured cars which were completed from imported chassis and engines In
the Union. The 35 0 0 0 other motor vehicles of 65 different types which were produced. The ! 500 000 steel helmets
which were manufactured from ISCOR steel alloys. In most coses rigid specifications had to be met and the articles
produced had to be on a par with those produced anywhere in the world.
The demand for aircraft spares was great and varied. Many special steels and much engineering skill was
required in their production. Tens of thousands of cylinder barrels were turned out by South African factories and
hundreds of thousands o f other parts such as pistons, piston rings, nuts# bolts, washers, strut ends, *trut end forks,
leg pants, bomb release switches, exhaust manifolds, torsion, tension and compression springs and ta il skids were among
the smaller articles produced. Large spores were aircraft chairs, bomb racks and gun turrets. Heavy equipment
produced included mobile cranes, drum winches, engine stands and battery chargers. Spares for tanks also ranged over
hundreds of articles from driving sprockets and track links to delicate springs and gauges.
Many of these endless lists of products had never been manufactured in South Africa before. There was little
"know how" and in many coses drawings and specifications were not available. Samples were flown to the Union for
drawings to be made, then the metal was analysed and photomicrographed at ISCOR so that its qualities could be
determined, a lter which the stool alloys were produced at ISCOR and the manufacturing contract given out to the
various private and Government shops for production. Most of the articles produced were mode In the Southern
Transvaal. Figures were never published, but it can be safely surmised that this would be the case since:-
1. 50% o f a ll private metal and engineering concerns wore in the Southern Transvaal?
2. ISGOR was in the Southern Transvaal and so transport costs on steel would be lower?
3 . It was usually cheaper to ship the finished articles to the coast than to have the articles produced there?
4. The coastal engineering firms were inundated with ship repairs and maintenance and over 12 000 ships hod beon repaired by 1945.
The strict control of labour and production without the same regard to costs and markets as free enterprise,
resulted in a good u til isatfon o f resources. The mobility of the labour force, especially skilled labour, resulted In
o spreading o f techniques and knowledge.
The increased number o f apprentices and the emergency training periods increased the expansion rate o f the
skilled labour force - making more men available for production. Despite this, the demand for skilled and semHfciUed
labour far outstripped the supply. Figure 3. 6 shows the increases of both employees and the number of estobl ishments
engaged in the metal and engineering industry in the Union. It can be seen that during the War the number o f
ostab! ishments did not increase as rapidly as it did afterwards„ The rate of increase o f employees had been more or
less constant at the 6 000 per annum mark during the War, but increasing after 1946, Unfortunately Figures 3,1 and
3.2 are not complete, but with Figure 3,4 it can be seen that the Southern Transvaal expanded o f rotes comparable
with the whole country. The slow rote of growth in the number o f establishments during the War is a direct result of
tho restrictions on cqpital, the inab ility to Import capital goods, and the lock of sufficient skilled and semi-skilled
manpower - which was a ll being used in the war effort. However, the cessation of hostilities allowed expansion to
take place. Whereas during the War establishments in the Southern Transvaal increased from 548 in 1938 to 664 In
1945 - an increase o f 116 - by 1950 they totalled ! 121 - an increase o f 457. The metal Industry had realised Its
potential; the forced diversification of production during the War now began to pay. Firms which had had to produce
articles loca lly during the War continued to do so afterwards and In many cases were able to compete successfully with
the imported article . During the war; " . . . . . output - taking into account a 50% increase In price level - rose by
about 60%". (SEIFSA 1968).
Considering a ll the problems which had faced the industry prior to the war, this Is a remarkable achievement.
The Immediate Post-War Period (1945 - 1950)
Economists predicted a gloomy future for the South African economy after the war. Bearing in mind the depression
and chaos which had followed the end of World War I, people believed that re-adjustment to a peacetime economy
would take tim e, during which a depression was expected. However, it did not materialise. South Africa hod been
much better prepared for the second World War than she was for the first and the metal and engineering industry
continued to expand throughout the country (Figure 3.6).
By 1946 ISCOR was reverting once more to normal peace-time production. Annual output had risen from 330 900
short tons In 1939 to 520 030 short tons In 1944. Fortunately there was a vast backlog to be made up and ISCOR did
not lack orders. The Steel Industries of the world were facing their own problems and imported steel was in short supply.
The ISCOR Board fe lt that a major expansion programme was needed to meet tho Increasing local demand for Iron and

sfesl products, but there was strong opposition to any ideas of expansion by people who feared $ slump similar to that
experienced after World War I. It was thought that the rapid demobilisation o f a large number of men would increase
unemployment and make the transition back to a peace-time economy d ifficu lt. The results would cause retardation
of industrial activ ity and a consequent decrease in the demand for iron and steel. The decision to expand was fina lly
made and Pariiament agreed to a £15 000 COO (R30 000 000) increase In ISCOR's share capital,
The major fie ld of expansion could now take place at Vanderbijlpark, a town capable of accommodating a
population o f 200 000. European and Non-European facilities for housing and recreation had to be bu ilt around the
new steelworks.
These were to be the most modern of their type and included coke ovens, blast furnaces, steel furnaces,
stripping bays and slabbing mills which would serve the original plate m ill. Beyond the plate m ill, hot and cold
strip m ills , cleansing lines, continuous galvanising lines, annealing furnaces, temper m ills, shearing and slitting
lines and tin stacks were provided as well as the necessary service departments. The works were originally planned
for an output of 250 0 0 0 tons o f finished products, but could be expanded to produce 1 0 0 0 0 0 0 tons.
A t Pretoria further expansion was also undertaken, A third coke oven battery# a new Bessemer convertor,
extensions to the finishing facil Ities In the mills and a new wire plant were added, At Thabazimbi a new washing
boheficiation and ore bedding plant was provided for and the whole scheme was designed to increase ISCOR's ingot
production to 1 0 0 0 0 0 0 tons per annum.
The decision to go ahead with these plans was taken in 1947, which could explain the dramatic increases in
the number of engineering establishments and employees in the country (Figure 3.6), By 1952 the plans o f 1946 had
matured and had grown in magnitude. The town of Vanderbijlpark had 27 000 inhabitants and the works had an ingot
capacity o f 350 000 tons per annum and a rolling capacity of 240 000 tons. The raw materials used by the Vanderbijl-
park works were drawn virtua lly from the some sources os Pretoria. Ore from Thabazimbi, cool from Witbonk and
N ata l, lime from the North Eastern Cape, fluorspar from South West A frica, dolomite from Pretoria and ferro-alloys
from the works o f the African Metals Corporation Limited at Veroeniglng. Power was provided by the Electricity
Supply Commission, water from the Vaal River, For the construction of the works, refractory materials ware supplied
by the Olifointsfontein and Vereeniging brickworks, heavy engineering im plies from the Vanderbilt Engineering
Corporation Limited and other engineering firms.
After the construction of the works, provision had to be made for the storage of raw materials at the site. Coal
bunkers and coke ovens had to be constructed. Ore bunkers were built at the blast furnaces# scrap yeards and storage
bunkers at the steel plant. Water reservoirs and gas holders and many other specialised storage facilities were also constructed.
When the works at Vonderbijlpark were opened on 4th October, 1951, there were 54 top charged coke ovens
which carbonised 1 200 tons of dry coal per day to produce 840 tons of coke, Witbahk coal was usually mixed in a
72-25 ratio with Natal coal. In fact by 1953 75% of the Union's coking coal came from the two Witbank colli@rle&.
Gas from the coke ovens was cleaned and stored in a gas holder for distribution throughout the works as fuel . Further
by-products from the coke production included crude ta r, ammonia, liquor and crude benzole.
Two blast furnaces o f 8 000 to 850 tons per day were in use and the gas given o ff by them was collected
and used in the works as fuel. The hot metal was used for steel production while the excess iron was cast into pig iron.
In addition five open hearth furnaces o f 180 tons each were charged with scrap and hot metal for steel production*
Soaking pits and a slabbing m ill were in production,converting steel ingots into 70 ft. long slabs* The plate m ill hod been
in production since 1943 and was integrated Into the new works. The works included a hot strip m ill, continuous puckling
lin e , cold reduction m ill, continuous galvanising lines and annealing furnaces, temper m ills, shearing lines and slitting
lines.
The maintenance of the plant was undertaken by the work's own engineering division, which employed a staff o f
fittere, riggers, m illwrights, electricians, boilermakers, carpenters and plumbers.
With the establishment of the ISCOR works at Vanderbljlpark the Vereeniging area was assured of a metal and
engineering future. Not only did it allow the existing firms to develop, but a number o f subsidiary and related firms
were established In the region during this decode. The Vereeniging complex had developed considerably by the
beginning of the 1950'$.
4 .0 The ISCOR Group:
The firms directly or partially linked with ISCOR can be divided into two main categories; those concernedw i t h smelting, alloying and production o f metals and those concerned with engineering and maintenance.
4.1 Smelters, Alloyers and Metal Producers:
4.1.1 The Union Steel Corporation (of S.A.) Limited
Although establ ished by Mr, S, Marks In 1912 it merged with ISCOR In 1931 when ISCOR obtained
a controlling vote in the Union Steel Corporation (Usco). In cooperation with ISCOR, Utco concentrated
on ligh t steel sections and the manufacture and rolling of special and alloy steel. it also produced a ll
types of copper w ire. With the demands of war the works had grown and consolidated, so that by the
beginning of the 1950's Usco operated at two work sites.
The Vagi Works.
These consisted of three basic open hearth furnaces, one of 40 tons and two of 50 tons, a ll of which
used scrap and cold pig iron. Three Heroult electric furnaces o f 4 | tons capacity. A 22" cogging and
finishing m ill o f two 3-high stands, which ^plied billets to a 15" finishing m ill o f two 3-high stands and
two 1 2 U finishing mills of two and three stands respectively.
Production was primarily of mild steel, carbon steel and a wide range o f special analysis irons and . j
steels. The foundries produced 250 tons o f iron costings and 500 tons of steel castings per month. The 600 ton ,
forge press was used to produce mild steel, high carbon steel and alloy steel qualities.
The Klip Works \ 1This site had o rig ina lly been established in 1931, but had only been fu lly developed after World War II. ;
The works were divided into two sections ** one specialising in wire production, the other in special steels.
The special steels section: Six Heroult electric furnaces were in use ranging from 2& tons to 10 tore
capacity. The largest having been bu ilt and installed by the Vondeibljl Engineering Corporation Limited.
Special steels could be rolled on a two stand 3-hlgh 16" cogging mil I. and a five stand 3-high 12" finishing
m ill. This Section specialised in medium and high carbon steels, steel alloyed with tungsten, molybdenum#
vanadium, nickel and chrome. Forgings wore also produced, Usco having become the worlds largest |
producer of hollow d rill steel. The bits were forged from ccrbon steel in the 22 presses operated In the Works.36 0 0 0 0 0 0 bits per annum were being produced in 27 different typos. This had enabled gold production to
continue throughout the War.
4 .1 .2
4 .1 .3
South African Bolt and Nur Co. Ltd. (SABAN)
The second establishment in this group was the South African Bolt and Nut company Limited (Saban),
which had boon formed in 1934. It was originally meant to produce a ll types o f nuts, bolts, rivets, coach
screws and railway fastenings, but production had been expanded during the War. By 1950 Saban was
producing 8 400 tons of bolts, nuts, screws and rivets per annum, which amounted to about 60 000 pieces
or ha lf o f the Union's consumption. The remaining 50% was also being produced in the Union, so that the
country was thon self-sufficient in these products. In addition, wood screws, copper and tinman rivets
and metal thread screws and nuts were also being produced at a rate o f 600 tons per annum or 144 0 0 0 000
pieces. A ll screws were made to British standard specifications.
The African Metals Corporation Ltd, (AMCOR)
The third of these companies was the African Metals Corporation Limited which Was founded In
1937. It first concentrated on ferro-alloys and to prevent wasteful competition, became a subsidiary of
ISCOR's by virtue of the 1 800 000 shares which they hold in the company. By 1953 Amcor had extended
its interests to include the production o f pig iron at Newcastle in N atal, a ferro-alloys plant near
Vereeniging, dolomite at Lyttleton near Pretoria, phosphate rock at Langebaan and phosphatic fertiliser
at Bellville in the Cape Province. In addition Amcor had obtained the rights over important base minem!
deposits in various parts of the Union.
The ferro-alloy works at Vereeniging took over the production of ferro-manganese from the Newcastle
blast furnace in 1942, This plant has since supplied the new works at Vanderbi;ipark with the ferro-alloys
which it requires. In itia lly the plant had comprised four electric furnaces, but since ferrd-mangabese alloys
have a high carbon content, blast furnaces are best suited to their production. For this reason production
has continued at Newcastle. The increased demand for fenro-manganese, both at home and overseas, prompted Amcor to expand. A 150 acre site at Kookfontein, four and a half miles from the original site,
was developed and much equipment was transferred from the old Vereeniging site. By 1952 the Kookfontein
plant had two 1 2 500 k .v . and one 7 500 k .v .a . electric furnaces in operation, while the old site maintained
two 3 000 k .v . and two 3 ton electrical refining furnaces. This meant that Kookfontein could produce
5 000 lb . castings and break them to a 6 " mild steel product. Kookfontein alone produced 35 000 tons of
a ll types o f ferro-alloys in 1952 while the old site produced an additional 15 000 tons.

To produce these alloys Amcor had to draw Its raw materials from throughout Southern Africa.
Manganese came from Postmasburg (Cape Province), chrome from Selukwe (Rhodesia), stlicon from
Pietersburg (Transvaal), coke from ISCOR Pretoria (Transvaal), phosphate* from Langebaan and Bellville
(Cq»e Province) and dolomite from Lyttelton (Transvaal).
Engineering and Maintenance:
The second group of industries are dependants of the base metal industry. Despite this# however# they
are an important lin k in the production of metals, because without the maintenance and skill o f the engineering firms#
the larger smelting complex could not operate.
4.2.1 The Vgnderbi|l Engineering Corporation L ti. VECOR)
It was Dr. van der Bijl who, with his usual farsightedness, instigated the formation of the Vandesbljl
Engineering Corporation in 1945, ISCOR held 2 600 000 ord inary shares and a major part of the 1 250 000
preference shares in the new company. The development of Vecor was unique in that the firm was made
fu lly grown on the bare veld, instead of developing gradually and expanding with the metal Industry. This
resulted in many problems which were gradually overcome until by 1952 the company was showing a modest
p ro fit. Vecor produces Iron castings# some as big as 12 tons of steel and 35 ton* of iron. It is on Lloyd's
register for steel casting# but remains primarily a heavy engineering establishment. By the 1950'$ It was
manufacturing large vessels of up to 90 feet in length out of l&" plate. Vecor produced ISCOS's b ille t m ill
from the Demag (German) designs and then Installed it . It also bu ilt and installed the 10 ton furnace in
Usco's K lip river works. In addition Vecor produces steam plants, hoists for the mines, pressure vessels,
uranium plant equipment, large hydraulic presses and since 1949, chilled iron rolls for the iron and steel
Industry as well os flour m ills, sugar mills and paper m ills. These rolls often exceed 12 tons In weight and
have to be carefully worked o ff in the workshops.
The establishment o f a heavy engineering division relieved ISCOR of the problem of developing Its
own engineering workshop for maintenance and service. Vecor can do this work not only for the basic works,
but can also contract out, producing equipment for the mines and industry and so beneflttlng the economy os
a whole and operating as a profitable concern.
Apart from these firms which were more or less directly connected with IS COR and financed by
Government c q iita l, Vereeniging developed as an industrial area in its own right, the establishment of
Vanderbijl Park with its 26 750 inhabitants was the result of the expansion o f the iron and steel industry*
It was not only here that development hod taken place, but throughout the country as can be seen from
Figures 3 .1 , 3 .2 , 3.3 and 3.5,
Expansion had also taken place at Pretoria. By 1952 the new Bessemer convertor and a new coke
oven battery planned in 1946 had been in operation for several years. In addition u further coke oven
battery had been added to replace the first which had reached the end of its useful life . A new wire plant
came into production in 1952 and a new rod m ill Was added to the light mills section. Plans were also
initiated for a new continuous b ille t m ill to roll billets for the light and small sections mills.
A t Thabazimbi the ore washing, beneficiation and bedding plant had come into production.
Stops were being taken to increase the ore supplied by the new Sishen mine in the Kuruman district.
By this stage ISCOR was able to boast a capacity of 1 300 000 tows of ingots per annum or nearly
1 000 000 tons of finished products. This was a tremendous achievement. The phenomenal growth in
25 years was indicative of the potential which was being realised in the country.
t 3n be seen therefore that the Second World War and the immed^' 3 post-war period was an era
of grea, pension in the metal and engineering field in South Africa. The country as a whole hod
developed l ->nsively, the value o f the net output of industry increased from R128 000 000 (£64 000 000)
in 1938/9 to t ,'44 000 000 (£482 000 000) in 1954/5, an increase of 364% in sixteen years, or 22.75%
per annum. The metal and engineering industry in the Southern Transvaal had expanded sim ilarly. In
1937/3 there were 50 982 workers employed in 548 private establishments who produced R50 030 662
(£25 015 331) worth of articles? by 1949/50 101 746 employees in 1 121 private establishments produced
R167 390 958 (£83 695 479) worth o f articles, an increase of nearly 400% in the value o f articles produced
in only eleven years. This meant that the Southern Transvaal was now producing 54% of the country's basic
metal goods by value, with only 50.3% of its metal, engineering, machinery and cutlery works.
(Figure 3.1 and 3.6)
C H A P T E R IV
THE PHASE OF RAPID GROWTH, EXPANSION AND DIVERSIFICATION 1950 to 1960
L 0 The Period 1950 to 1960 :
Trends Initiated during this decade were perpetuated and developed during the sixties . The greater attention
given to the post-war period is justified by the development which has occurred in the industry during this period.
1.1 Data Collection and Classification:
Changes by the Bureau of Statistics in the method of classifying and publishing data have presented
complications to the detailed study of this period. The new classification prevents comparison o f figures with those
of previous phases and so in effect detailed developments can only be studied in chronological isolation. The pattern
o f location had already been set, primarily by the mines, so no radical changes were like ly to occur undetected. The
original markets of the iron and steel and engineering industry were the gold mines, consequently early development
occurred in close proximity to the Reef, spreading east and west from Johannesburg. Developments since then have
reinforced this pattern, so that a lack of practical information was not as marked a handicap as It might have been.
The new classification allows the study of the spatial pattern of the industry. However, the available data U not
continuous. Detailed figures relating to different areas within the P - W - V have gaps and alterations do occasionally
occur. The information is publislied by a magisterial d istrict on the basis of economic regions and sometimes It Is
available only for the P - W - V as a whole.
In an attempt to compare the expansion of the metal industry In the P - W - V other problems of data
collection manifest themselves. The only extensive source of information available to members of tba public are those
figures published by the Bureau of Statistics. A number o f alterations were made in the method of presenting information
during this decade, so that the industrial census of the !950's are not comparable either among themselves, or w ith ony
census from another period. Among the changes made was the alteration of the metal and engineering industries, whichhod been classified os Group 4 prior to 1950, to five others including Groups 15,16,17,18 and 19,
These categories have remained In use, with minor changes since# however, no detailed regional breakdown
is available for any period before the 1959/60 census which was conducted on a magisterial district basis. This meant
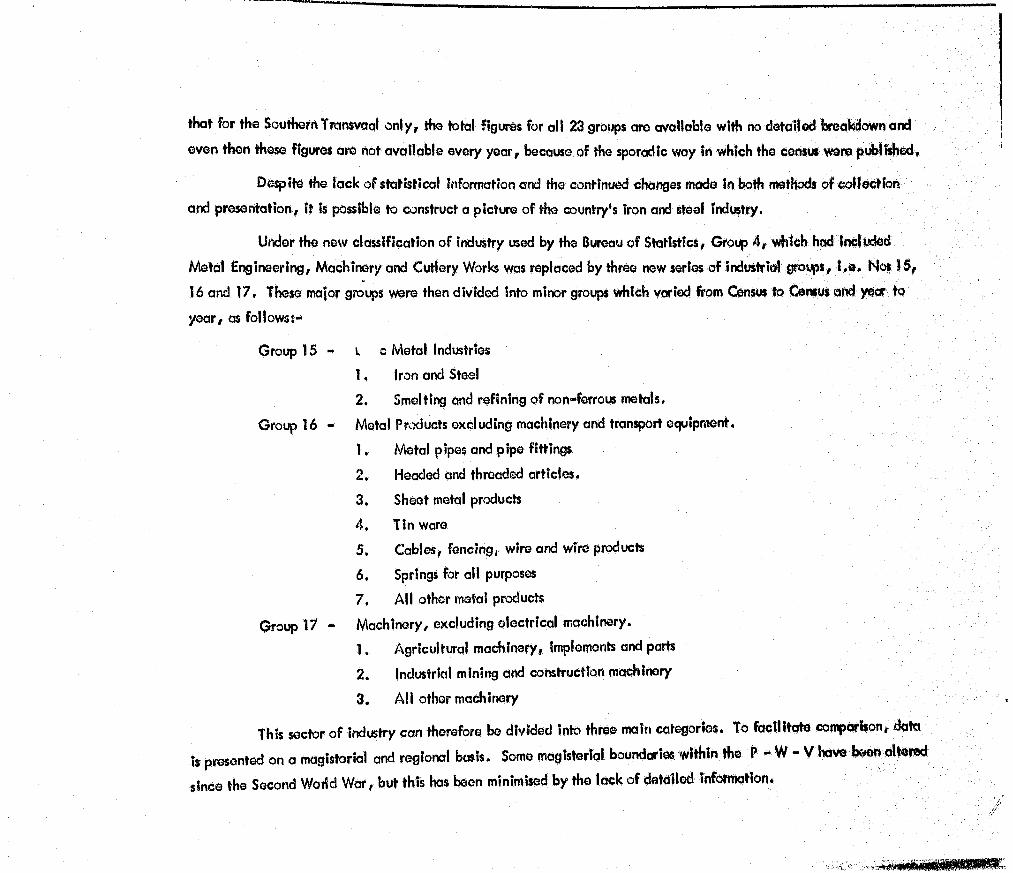
that for the Southern Transvaal only, the total figures for all 23 groups are available with no detailed breakdown and
even then these figures are not available every year, because of the sporadic way In which the census were published*
Despite the lack of statistical information and the continued changes made In both methods of collection
and presentation, it is possible to construct a picture of the country's iron and steel industry.
Under the new classification of industry used by the Bureau of Statistics, Group 4 , which had included
Metal Engineering, Machinery and Cutlery Works was replaced by three new series of industrial groups. I.e . Nos 15,
16 and 17. These major groups were then divided Into minor groups which varied from Census to Census and year to
year, as followss-
Group 15 - I s Metal Industries
1. Iron and Steel
2. Smelting and refining o f non-ferrous metals.
Group 16 - Metal Products excluding machinery and transport equipment.
1. Metal pipes and pipe fittings
2. Headed and threaded articles.
3. Sheet metal products
4. Tin ware
5. Cables, fencing, wire and wire products
6 . Springs for a ll purposes
7. A ll other metal products
Group 17 - Machinery, excluding electrical machinery.
1 . Agricultural machinery, implements and parts
2. Industrial mining and construction machinery
3. A ll other machinery
This sector o f industry can therefore be divided into three main categories. To facilitate comparison, data
is presented on a magisterial and regional basis. Some magisterial boundcrias within the P » W - V have been altered
since the Second World War, but this has been minimised by the lack of detailed information*

Problems of the P ~W - V during the Post-War Period:
1 *2 . 1 Population:
The Post-war expansion of industry on the Witwatersrand necessitated careful planning and organisation
to solve the problems which had arisen, large overcrowded $lum~}ocations rose due to the inflow o f African
workers. Facilities to cope with the expansion wore inadequate* The P - W - V complex lacked the foods
and housing to deal with this population increase. The non-whites of the Witwatersrand rose from 618 313
In 1936 to 890 639 In 1946 and to 1 091 097 by 1951 (Figure 4.1). Under normal conditions this increase
might have boon absorbed, but because of wartime priorities, housing and services had been neglected by
the authorities and had not been developed to keep pace with the industry's growth and re-ad|ustment to a
peacetime economy. This meant that thero was a shortage of housing and a lack o f planned townships -
both residential and industrial. (Figure 1.8)
Figure 4.1
Source:
Date
19211936194619511960
19651970
Population o f the Witwatersrand
Metropolitan Johannesburg - Report by the Forward Planning Branch, C.E.D. Johannesburg C ity Council, November 1966.
Total A il Races
537 055 1 024 564 1 4384751 741 3182 186914
24420002 736 000
Whites Coloureds Asiatics Bantu TotalNon-Whites
233 194 16 027 8 895 278 939 303 861406 251 30 820 14 270 573 223 618 313547 836 40 398 21 147 829 094 890 639650 221 52 8 8 8 29 906 1 003 303 1 091 097766 379 78 134 39 915 1 297 486 1 414 535
w ww W«w«* W** W ■*w ww w WWW* *r*» wte WMW Wl w « WWW wrmm Ww» w
11i
845 000 92 000 46 000 1 459 000 1 597 000947 000 106 0 0 0 52 000 1 631 000 1 789 0 0 0
Ratio White: Nen*Whlt©
1 : 1 5 1 t I t I f
1,200 21.631.681.85
W .-wwawwuBe* 1 — I w e * * * * * ( .
I i L W 1 * 1,#
The increase in the white population from 547 836 in 1946 to 650 221 In 1951 (Figure 4.1) on the
Witwatersrand had aggravated the problem, although it did create a market for finished goods, both local
and imported, The Country's imports increased In value from R433 m illion In 1946 to R714 m illion In 1948.
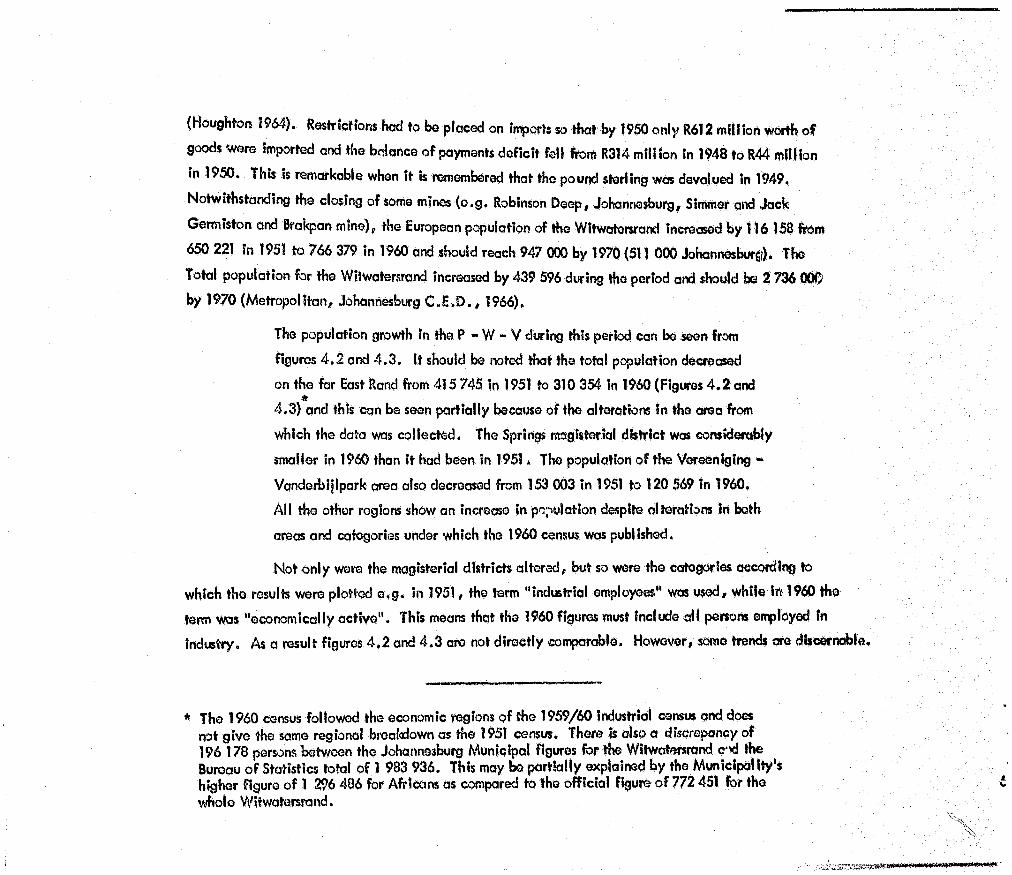
(Houghton 1964). Restrictions hod to be placed on imports so that by 1950 only R612 m illion worth o f
goods were imported and the balance o f payments deficit fell from R314 m illion in 1948 to R44 m illion
in 1950. This is remarkable when It is remembered that the pound sterling was devalued in 1949.
Notwithstanding the closing of some mines (e.g. Robinson Deep, Johannesburg, Simmer and Jack
Germiston and Brakpan mine), the European population of the Wltwatersrand increased by 116 158 from
650 221 in 1951 to 766 379 In 1960 and should reach 947 000 by 1970 (511 000 Johannesburg). The
Total population for the Wltwatersrand increased by 439 596 during the period and should be 2 736 000
by 1970 (Metropolitan, Johannesburg C .E .D ., 1966),
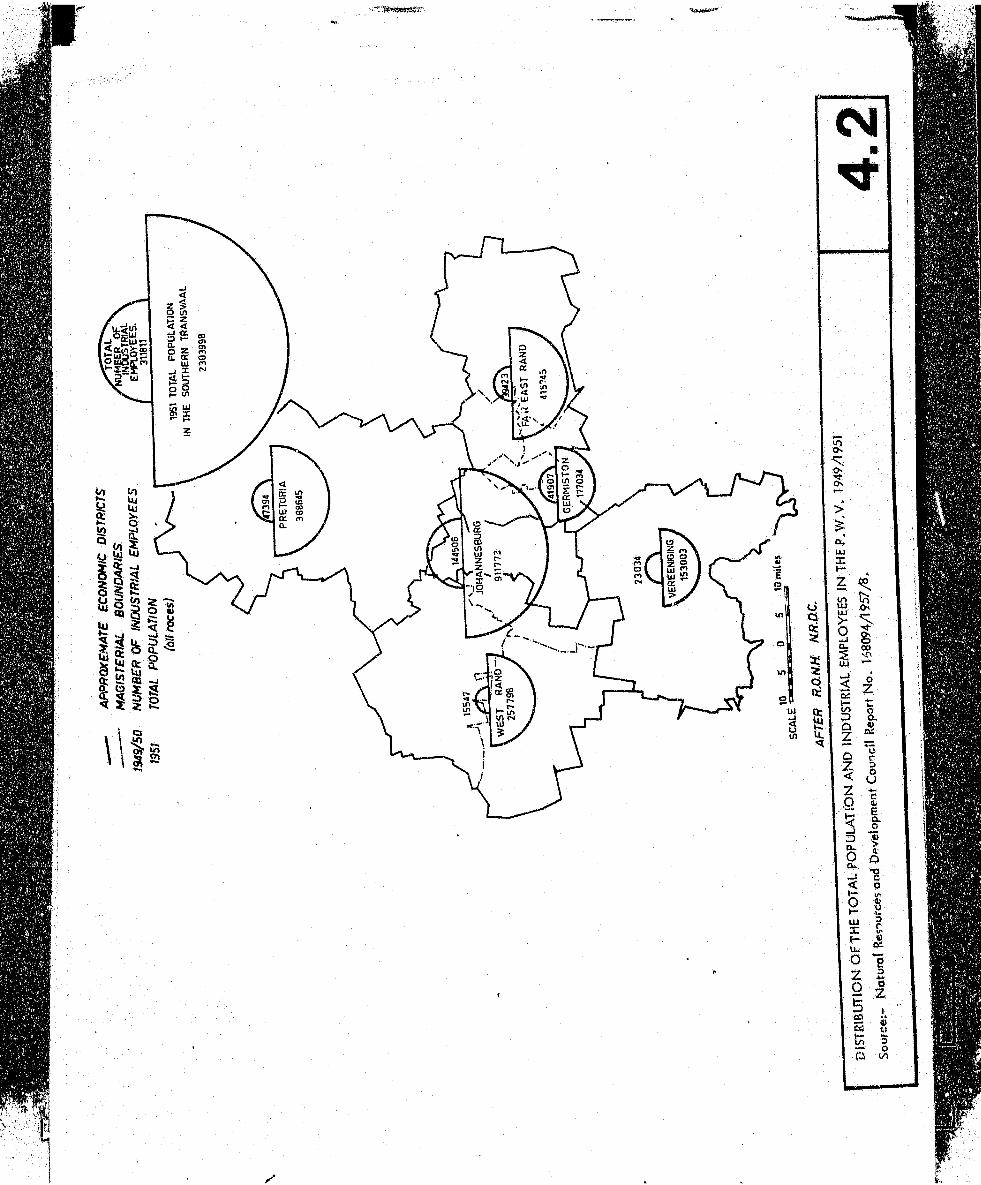
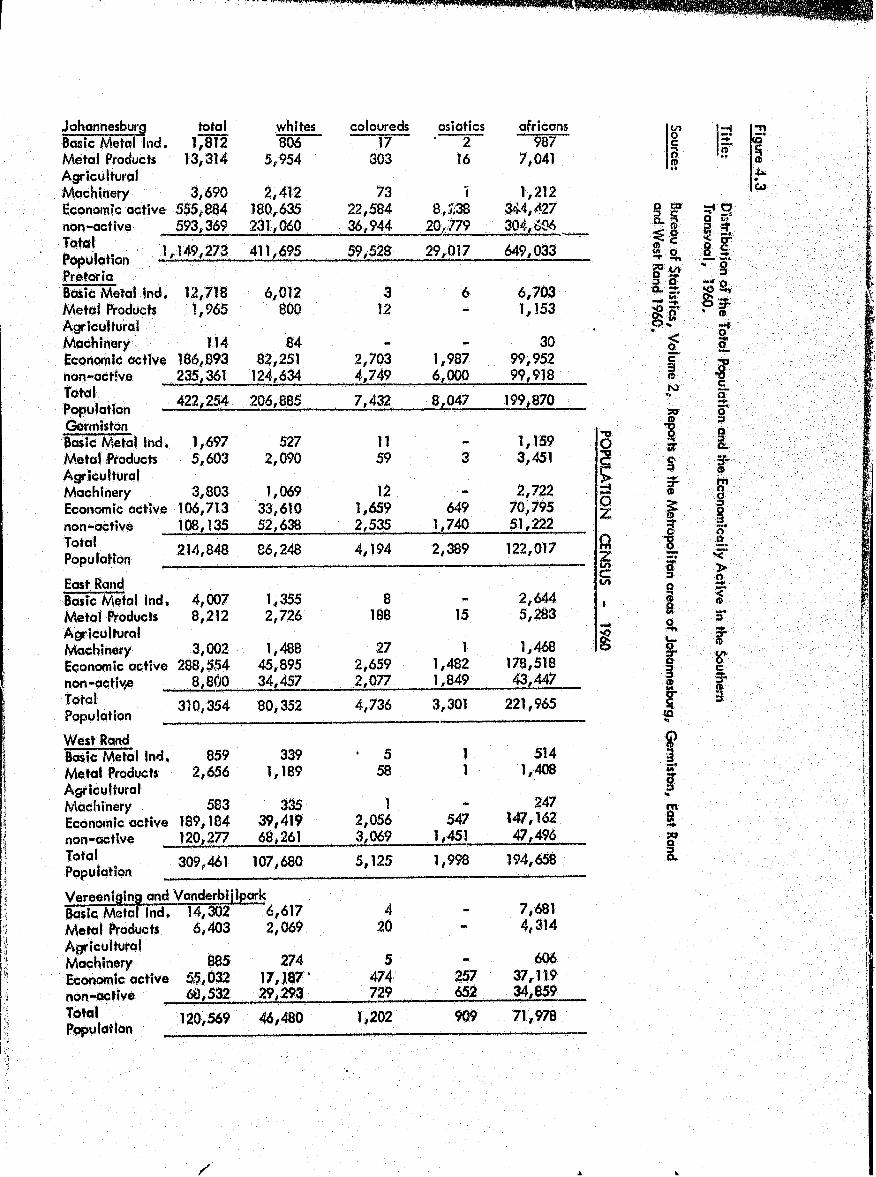
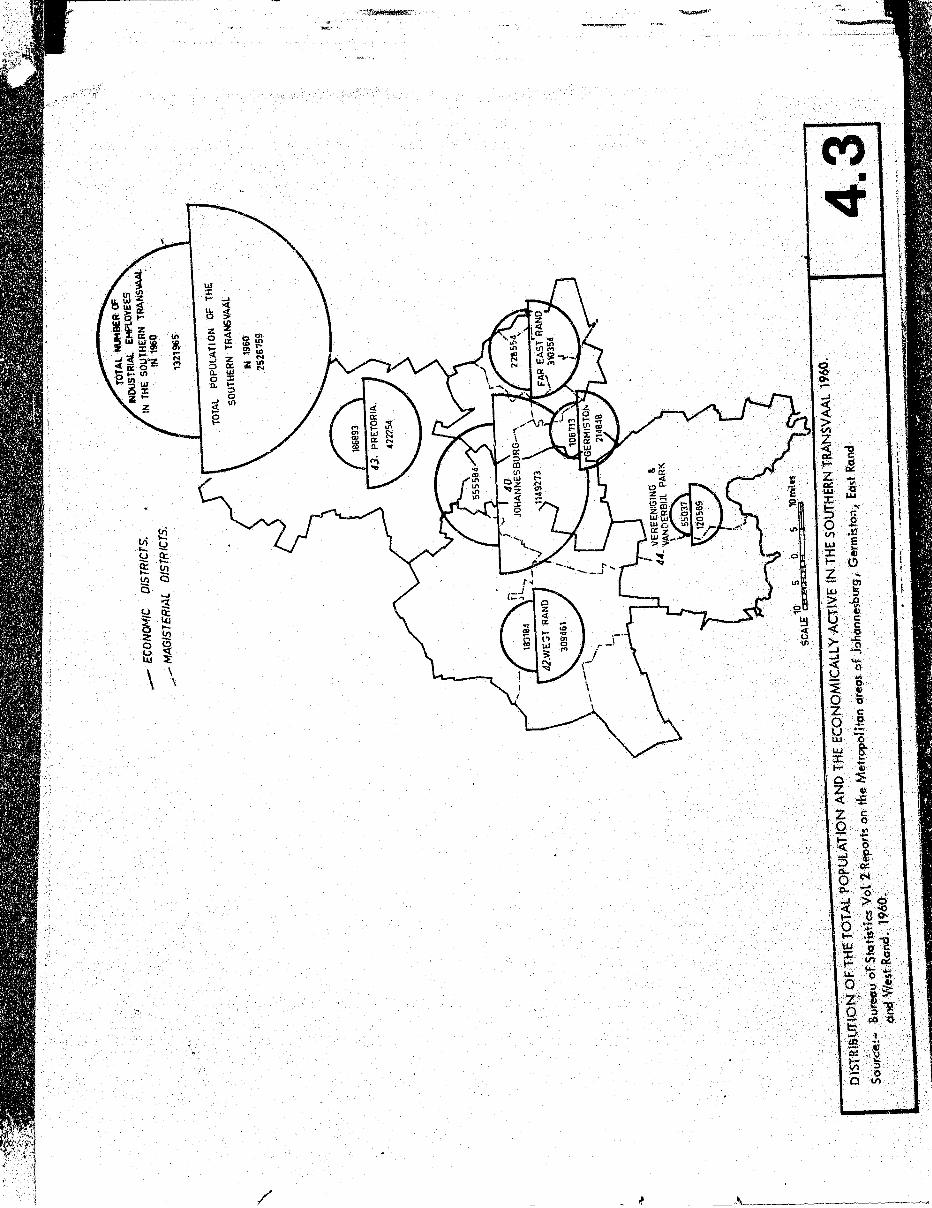
The population growth in the P ** W ~ V during this period can be seen from
figures 4.2 and 4 .3 . It should be noted that the total population decreased
on the far East Rand from 415 745 in 1951 to 310 354 in 1960 (Figures 4 .2 and *
4.3) and this can be seen partially because of the alterations In the area from
which the data was collected. The Springs magisterial district was considerably
smaller in 1960 than it had been in 1951. The population o f the Voreenigihg -
Vanderbijlpark area also decreased from 153 003 In 1951 to 120 569 in 1960.
A ll the other regions show an increaso in population despite alterations In both
areas and categories under which the 1960 census was published.
Not only were the magisterial districts altered, but so were the categories according to
which the results were plotted e.g. in 1951, the term "industrial employees" was used, while In 1960 the
term was "economically active". This means that the 1960 figures must include a ll persons employed in
industry. As a result figures 4 .2 and 4.3 are not directly comparable. However, some trends are discernable.
* The 1960 census followed the economic regions of the 1959/60 industrial census and does not give the same regional breakdown as the 1951 census. There is also a discrepancy of 196 178 persons between the Johannesburg Municipal figures for the Witwatersrend c*id the Bureau o f Statistics total of 1 983 936. This may be partia lly explained by the Municipality's higher figure o f 1 296 486 for Africans as compared to the officia l figure o f772 451 for the whole Wltwatersrand.
Johannesburg total whites coloureds asiatics africansBasic Metal Ind. 1,812 806 17 • 2 987Metal Products 13,314 5,954 303 16 7,041AgriculturalMachinery 3,690 2,412 73 t 1 , 2 1 2
Economic active 555,884 180,635 22,584 8,238 344,427non-active 593,369 231,060 36,944 20,779 304,606Total . r149,273 411,695 59,528 29,017 649,033ropuiaiiu ii """PretoriaBasic Metal Ind. 12,718 6 , 0 1 2 3 6 6,703Metal Products 1,965 800 12 1,153AgriculturalMachinery 114 84 w 30Economic active 186,893 82,251 2,703 1,987 99,952non-active 235,361 124,634 4,749 6 , 0 0 0 99,918Total 422,254 206,885 7,432 8,047 199,870rOpUiQifOn ”■GermistonBasic Metal Ind. 1,697 527 11 - 1,159Metal Products 5,603 2,090 59 3 3,451AgriculturalMachinery 3,803 1,069 12 - 2,722Economic active 106,713 33,610 1,659 649 70,795non-active 108,135 52,638 2,535 1,740 51,222Total 214,848 86,248 4,194 2,389 122,017Population
East RandBasic Metal Ind. 4,007 1,355 8 *" 2,644Metal Products 8 , 2 1 2 2,726 188 15 5,283AgriculturalMachinery 3,002 1,488 27 1 1,468Economic active 288,5-54 45,895 2,659 1,482 178,518non-activ^ 8,800 34,457 2,077 1,849 43,447Total 310,354 80,352 4,736 3,301 221,965Population
West RandBasic Metal Ind. 859 339 ' 5 1 514Metal Products 2,656 1,189 58 1 1,408AgriculturalMachinery 583 335 1 — 247Economic active 189,184 39,419 2,056 547 147,162non-active 120,277 68,261 3,069 1,451 47,496Total 309,461 107,680 5,125 1,998 194,658Population
Vereeniging and VonderbijlparkBasic Metal Ind. 14,302 6,617 4 - 7,681Metal Products 6,403 2,069 2 0 4,314AgriculturalMachinery 885 274 5 606Economic active @&*32 17,187 474 257 37,119non-active 68,532 29,293 729 652 34,859Total 120,569 46,480 1 ,2 0 2 909 71,978Population

Tfne East Rand has at a ll times pioportiontilty fewer economically inactive persons than the West Band,
which indicates that- mis area is not a dormitory area similar to the West Rand. This fact together with
the decrease in total population seems to indicate that the decrease in mining activ ity of the^Ovulneroble
mines (Figure 4.4) had not been taken over by industry in i960*
Figure 4 .4 ,
T itle : The Wihvatersrond White Population and Employment 1949/50/51
Sources Natural Resources and Development Council Report No, 168094/1957/3
Districts
Central Rand
JohannesburgGermiston
East Rand
BoksburgBenoniBrokpsnSprigsNigel
West Rand
RoodopoortKrageysdorpRandfontein
A r c D E Fs Population White ! White Mine Ratio Ratio Number of
1951 Empu, Employees BsA Vulnerable1949/50 1951 Mines *
363 587 52 894 6 061 1:6.9 1:60.0 2
74 384 13 834 2 839 1:5.4 1:26.0 2
25 049 2690 2 242 1:9.3 1 :1 1 . 2 1037 040 4389 1 981 1:8.4 1:18.7 1029 703 1 489 4 852 1 :2 0 . 0 1: 6 .1
33 013 3 786 7131 1:8.7 1: 4.610560 522 1 727 1 :2 0 . 2 I t 6 .1
35 215 1 632 4500 1 :2 1 . 6 1: 7,8 2
32 296 1 839 2 684 1:17.6 1 :1 2
19 397 1073 4 149 1:18.1 1; 4.7
Another category used in the 1960 census whijch may appropriate mare accurately to the 1951 term of “ industrial employees" is "manufacturing population" (Figure 4 .5 ). A co m p ariso n o f those two terms (Figures 4 ,2 and 4.5) show that there was an increase In the number o f persons engaged In economic A t* e#ecM tV ^on the East and Central Rands and in the Vereeniging areos . ih i* means that the tefficiency o f industry as an employer increased during this period. # is also significant that these areas are the ma$or iron and steel and engineering regions, o f the P. w W. ^ V .

By I960 total economically active population was fast approaching the total population of 1951, The
1951 population o f Johannesburg was 911 773 (all races) and in 1960 the economically active population was
555 584 or more than half o f the total population of 1951. It can be seen that Johannesburg dominated, the
area followed by the East Rand, with the West Rand forming a much smaller industrial complex.
A degree o f specialisation is apparent In Figure 4 .5 . The Vereeniging Vanderbijlpark region and
the Pretoria area had the majority of their employees engaged in the Basic Metal Products and Agricultural
Machinery industry in 1960. O f the 27 137 people engaged in manufacturing in the Vereeniging area,
21 589 were employed in this category. Pretoria was in a similar position being dependent upon the metal
industry for the employment of 14 797 workers out o f a total manufacturing work force of 31 112 (Figure 4.5).
The special isation of the Vereeniging-Vanderbijlpark area Is better Illustrated by the fact that o f the 55 037
persons engaged in economic activ ity , 21 589 are employed in the metal industry. Johannesburg is shown
as the commercial centre with the greatest proportion of its economically active population engaged outside
the manufacturing sphere. GermSston and the far East Rand have a large proportion o f their economically
active population engaged in manufacturing, while the West Rand has a very small proportion of Its workers
in the metal industry (4 098 out of a total of 13 940 Figure 4 .5 ). However, its position can be explained by
the great number of workers who commute into Johannesburg daily.
"Over 11 000 people hovel dally from Roodepoort to work In Johannesburg. Only 1 500 travel from Johannesburg to work in Roodepoort". (Metropolitan Johannesburg, Forward Planning, C .E .D .)
The West Rand is therefore a dormitory suburb of Johannesburg.
1 .2 .2 Dependency upon the Gold Mines:
It is apparent (Figure 4.5) that the Central and Eastern Witwatersrand has a balance between Its metal
Industries, manufacturing as a whole and the commercial activities of the remainder o f the economically active
population. While the peripheral areas of Pretoria and Vereeniging-Vondeibljlpark are dependent upon the
metal Industries for employment, they are dependent upon the rest of the Witwatersrand for a market for their
metal goods. The West Rand has a defic it of metal industries and manufacturing Industries and therefore is
dependent upon Johannesburg and the Central Rand for the employment o f its workers. In 1951 only one person
in eight worked on the mines In Roodepoort, while In Springs one person fa five was a mine employee. (Figure 4.4)

<N<N

This meant’ that at the beginning of Hie 50"s the tar East Rand was mote dependent upon mining than the
West Rand which had become a dormitory area. There were a number of weaknesses in the distribution pattern
of industry in the P - W - V area. Briefly they can be summarised as fbtiows;-
A . Much of the industrial land was fragmented, due to a lack of planning and the fact that the urban
belt had followed the irregular mining belt. This lack of co-ordination meant that a ll types o f
industry, were scattered throughout the region, more or less without regard to specialised site
requirements or linkage with other secondary or tertiary industries*
B. There was a lack of guidance for industries wishing to shift from one area to w > ? ,$■ for those
needing special iscd site facilities. In some areas from which larger firms had m /ved the sites were
subdivided according to the old railway facilities and sold.
C . This period saw a great demand for industrial sites in Germ is ton, bu* aclaimed mining ground,
railway yards and urban development, hindered this industrial expansion. Consequently ribbon
development took place along the railway lines to the north and south and intruded upon ao|acent
areas,D . There was s till a general lack of housing for African workers and the fragmented industrial pattern
made the location of townships d ifficu lt.E. The unco-ordinatcd planning resulted in speculation so that in some areas available land exceeded
demand, while in other areas more suitable for industry, no development had occurred.
F. Due to a lock of planning, some vacant industrial land was unsuitable for industries or was unusable
due to fragmentation and a lack of services. Boksburg, Benoni and Brakpan also suffered from a
shortage of proclaimed industrial sites (Figure 1 . 8 ).
During the fifties the effects o f a decline in gold mining activities began to interest planners. Although
the output of gold continued to rise, mines along the reef were coming to the end of their viable productive
lives. They hod formed an important market tor the metal and engineering firms from their inception. In
1939 the country's mines consumed R63 m illion worth of stores, of which R21 m illion was imported * (Govern
ment Mining Eng. 1940). By 1945, when the mines consumed R62 m illion worth of goods only R9 m illion was
imported. The consumption o f metals and machinery by the Witwatersrand mines for 1955 and 1965 is shown
in Ftigure 4 .6 . Unfortunately due to the methods of presentation o f Government Mining Engineer! reports.

Figure 4.6
T itle : Consumption of Iron and Steel by the Witwatersrand Gold MI - - Both Local and Imported
Source: Government Mining Engineers Reports 1955, 1959, 1959/6v 1965.
: .
1955
Iron and SteelMachineryPipesLock and Bolts
Total
1959
Local (R)
11 910 8 8 6
24 974 678 5 656 704
76 19242 618460
Imported (R)
632 306 9 8 6 8 652
870 372 57 320
11 428 650
I
....
: ’ '0 .
The major Witwatersrand mines consumed R192 786 972 worth of stores. The larger mines used R77 242 340 wot of local products and R12 105 060 o f imported metal goods.
1959/60 (a ll large mines in the country)
Iron and Steel 22 776 236Machinery 42 951 628Pipes 11 375 730Locks and Bolts 104 762
Total 77 208 356
389 006 11 040 6 8 8
597 562 43 182
12 070 438
1965 (The Witwatersrand Mines)
Iron and Steel I? 158 371Machinery PipesLock and Bolts
30 545 864 7 731 131
8 6 756
Total 55 522 122
988 8563 534 393
187 76722219
4 733 235!
a sequence of figures showing the consumption o f iron and steel goods and machinery by the Witwite
gold mines is not available. As can be seen from the table, the increase in South African manufceti
had been R13 m illion during the 10 year period. No figures for the output of the motel and engines
industry in the Southern Transvaal were published during the m id-fifties, but the gross output o f
steel manufacturers In the Transvaal during 1956/57 amounted to R124 471 000, (I.C . 45) In 1953/14
m -
( I.e . 45) H» aros output of the metal and engineering industry far the country amounted to 8398 172 000
o f which 8148 0 0 0 was produced by the mine workshop, and R62 268 000 worth of machinery was manufacturedfor the mines, construction and Industrial concerns.
This Indicates that the R42 m illion worth of iron and steel goods consumed by the Wltwatenrand gold
mines In the m id-fifties. The mines total consumption o f Iron and steel amounted to R54 m illion In 1955, while
during 1956/7 the Iron and steel producing firms in the Transvaal had a gross output of only R124 m illion.
However, comparatively little of this went directly to the mine workshops (only R143 0 0 0 in 1953/4). Most
o f it was processed by the metal and engineering industry Into a gross output o f approximately R400 m illion o f which the mines consumed about one tenth.
Since the dependence upon the gold mines for a direct market for the metal and engineering industries*
output is no longer as marked as it was, the question of a decline in gold production need not be seen as an
economic medusa. The employment o f the mines and Industry at the beginning of the fifties decade, is
illustrated in Figure 4 .4 . As can be seen, Johannesburg had only 1:60 of its European population employed
in mining and 1:6.9 in Industry. The East Rand with its more highly developed industrial areas and largo
metal and engineering establishments tended to have a better industrial employment ratio than the West Rand,
with the exception o f Brakpan and N igel, which had <. dy one European in twenty employed in Industry and
1:6 working on the mines. If should be remembered thab-
A . the mines are not I ikely to cease production suddenly, but that a gradual decl ine w ill
occur * this v 'l l s till affect areas like the West Rand more than tiie East Rand;
, in the overall economy of the country, any decl I. s In production on the Witwatersrond
should be more than of^ot by the development of the Orange Free State gold mines;
C. the growth and development of the metal and engineering industry should continue In
the Southern Transvaal where It (s so well established. It is unlikely that an Industry
with such great inertia and requiring large amounts o f Capital would migrate to the
ports or the Orange Free State goldfields. Relocation In the Transvaal Is d ifficu lt
since tho industry's main market is Itself and other manufacturing and building
industries.
Since 1955 a number of mines on fbe Wivwatesrsrond have ceased prodvction. Others are being worked
at a greatly reduced scale by private firms or even individuals. There were vulnerable mines on the East Rand
in 1951 (Figure 4.4) however, there has occurred a gradual transfer of the. economic base from gold mining to
industry. By 1958 there was a shortage o f industrial land on the East Rand - the continued growth and expansion
o f industry resulted in an increased demand for industrial land which in turn resulted in the development o f new
Industrial townships during the 1960'$.
New Government Policies - Decentralization
As a result of the problems which had developed In the P ” W ~ V during the early post war period and
in accordance with the policy o f apartheid, a new governmental policy towards the region was evolved»
The new National Government had come to power in 1948, Introduced a political policy, which wes
to have an effect on a ll industry in South Africa. Policy statements were mode by the Governmetit on the
restriction of an uncontrolled flow of African Labour to the Witwotersrand and to urban areas In general. A
commission was appointed by the Government tos-
"conduct an exhaustive enquiry into and to report on a comprehensive scheme for the
rehabilitation of the Native Areas with a view to developing within them a social
structure in keeping with the cui tore of the Native and based on effective socio
economic planning." (U .G . 61, 1955).
This report was first presented to the government on 1st O ctober, 1954 and suggested that <# an
alternative to the migratory labour ryttem , Industrie, should bo establ Ished In o, near the existing Africanareas. The Government rejected H * Tomlinson Commission’s recommendations to establish Industries
w ithin the Reserve areas because:-
"Bantu enterprise, unimpeded by European competition, should be enabled to
develop Its own Industries. ' (W.P.F. 1956),
Instead It vas proposed that Industries should be establ hhed In white areas on the periphery =« * .
African Resorvos. This policy became known as the Border Industries policy, which has a bearing on the
Wllnatersrand because It meant that o ffic ia lly Industry was k in g encouraged to decenfrdbe and so the
expansion o f the urban Industrial areas should be slowed down.

" ~ ~ ~ ~ r ^ z z = .would a ll become expensive problems,
C. It w ,s pointed out byH .R . Roike, (1949) , k t -ho ofvm to, e . the
W.twotonrond could bo on Inhibiting fbctor In Indushlol emomion
D- M aV p90pl'3 felt ,k " *«“ ocHon must bo token to ovoid ,ny crisis thot might resultfrom the expansion of the Wltwotersrond belbre It was too lote to effectively do any- thing about it,
e" Fr0m 0 m$l ,tary oF v?ew if Wos strategically unwise to concentrate half thecountry's industry and a quarter o f its population in 472 0 0 0 square miles.
In opposition to this it was argued that:*
A . There was a great need In South Africa for rapid Industrial expansion to absorb the growing population.
B. It was feared that State Intervention In the Southern Transvaal may have checked the
economic growth rate o f not only the Transvaal, but the country as a whole.
C. Some economists fe lt that Border Industries would remain a tax burden on the country
indefinitely and never become a viable proposition.
The concentration of commerce and industry in the Southern Transvaal may be large
in comparison to the rest of South Africa# but relatively small when looked at on a worldwide basis,
I , W ith the gold mines closing down# it was argued that industrial expansion was a necessity
to replace them and so prevent the development of "ghost towns" along the reef.
° and wl» ‘ • * « thb have „„ lond-w , w l doH„„dW rlbo.Ion
; H ; “ f ’° m m , M bo ln»rodocadlnS * * * min” ' ^ ««* W «dH .I grow* would conHnu. on * . Wltwoto^ond
noMHwtawdlng policy - plonnon had to dncldo on Iho quo,.bn o f how much land Aould be rountod tor Ihb
oxpatolon. Finally fhore was the question o f Itmltod resourcos/faolh natural - In Ihfe com mainly water ~ and
human, due to non-white Influx control cod a shortage o f qualified skilled European wwkeis.
Figure 4 .7
T lflo : Number o f Establishments and Employees in the Union and Transvaal 1919/1953
Source: 195%% Industrial Census Report Number 206/1955
Union
f 919/20
Tv!Tvl%
Union
1949/50
Union Tvl
\
Tvl%
UnionUnion
1952/53
TvlTvl%
Union
increase 1919/ 20 to 195%Q
Union Tvi
Number o f Establishments Total employees
6 890 175 520
1 74653427
25%30%
14 809 4 890 773151 313435
33%44%
16 064 819 658
5 518 366 728
34%45%
2.3 3.2 4 .7 6.9
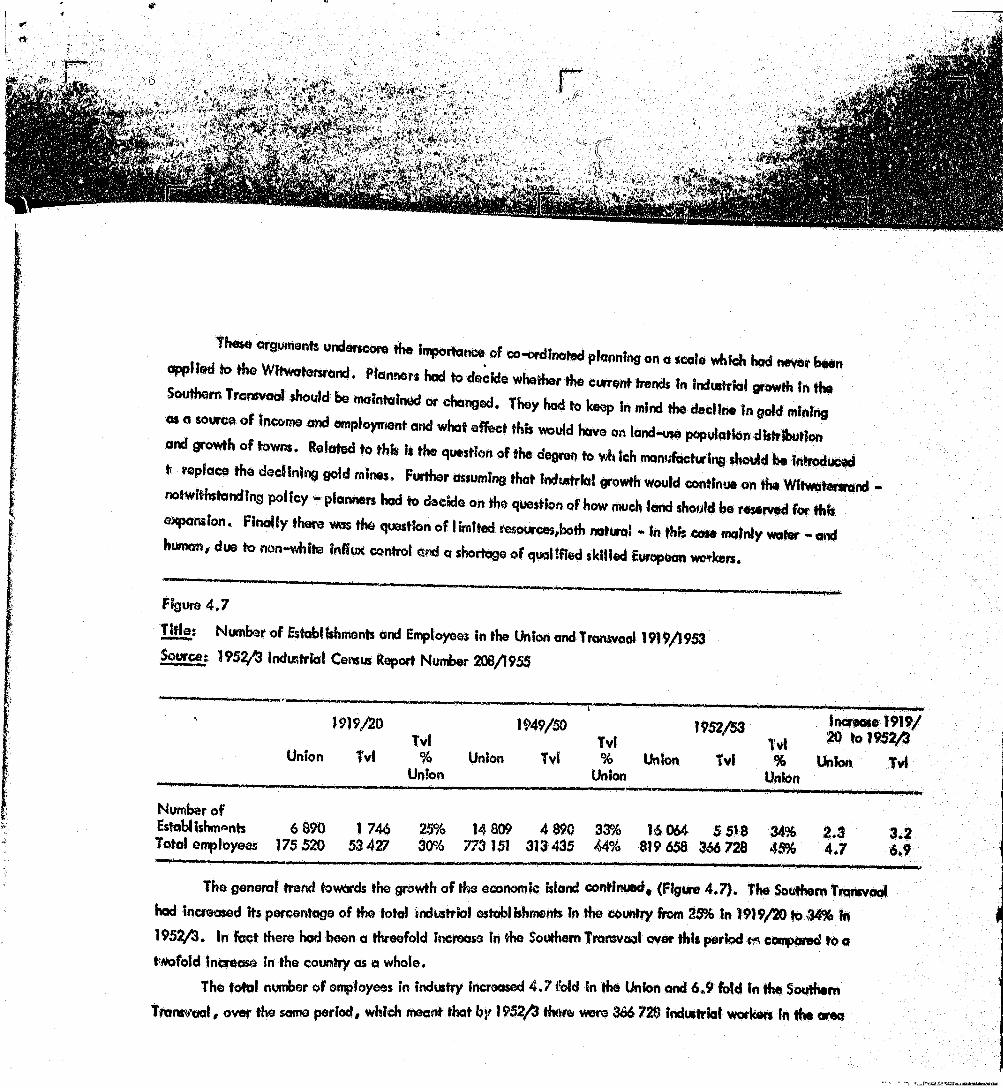
The general trend towards the growth o f the economic island continued* (Figure 4 .7). The Southern Transvaal
hod increased its percentage of the total industrial establishments in the country from 25% In 1919/20 to 3 4 % in
1953/3. In fact there had been a threefold increase In the Southern Transvaal over this period m compared to a
twofold increase In the country as a whole.
The total number o f employees in Industry increased 4 .7 ibid in the Union and 6.9 fold In the Southern
Transvaal, over the same period, which meant that by 195%% there were 366 728 industrial workers In the area
I fuIfI*
80
60
40
2 0
2O
&ti£o2O2t i
>«
Qz
e<
i<
I 1
I
1
IH*
8
z $
v - '
/

3.0 the Coun|ry|t ^ ^ i|gnWegnee |o ^ P _ w - v
r t r r r y m m0m,Ci7 V° '" ° ,,,e ro n °mic "» P M d volume )Gndad to ret7>ain skibfe.srculted not ouHlow of private capita! amounting h. R£1 million in I957 *h to procipi.oM * 0
balqnco of poymonlo crisis. Tho 1P«/1 crlsfe rosulM ftoo, o lo» of confMooco h ,te c ,u ^ o , 0 m .*me Shaspev.lle Incldonf, Again a moslve outflow o f copllol omouofing to Rl 2 m ill Ion por mooli, reocbod
Rlov m illion before laslrlctlons and foreign exchange controls restored soma conffdanca in the country,
Dospite ihe$Q crises the metal products and engineering Industry was able to continue a general
expansion throughout the country. The physical volume of output more than doubled between 1945 and 1955
and by 1959 :t produced a not output of R299 million and employed 172 100woH<enm*Mng Itthe mast
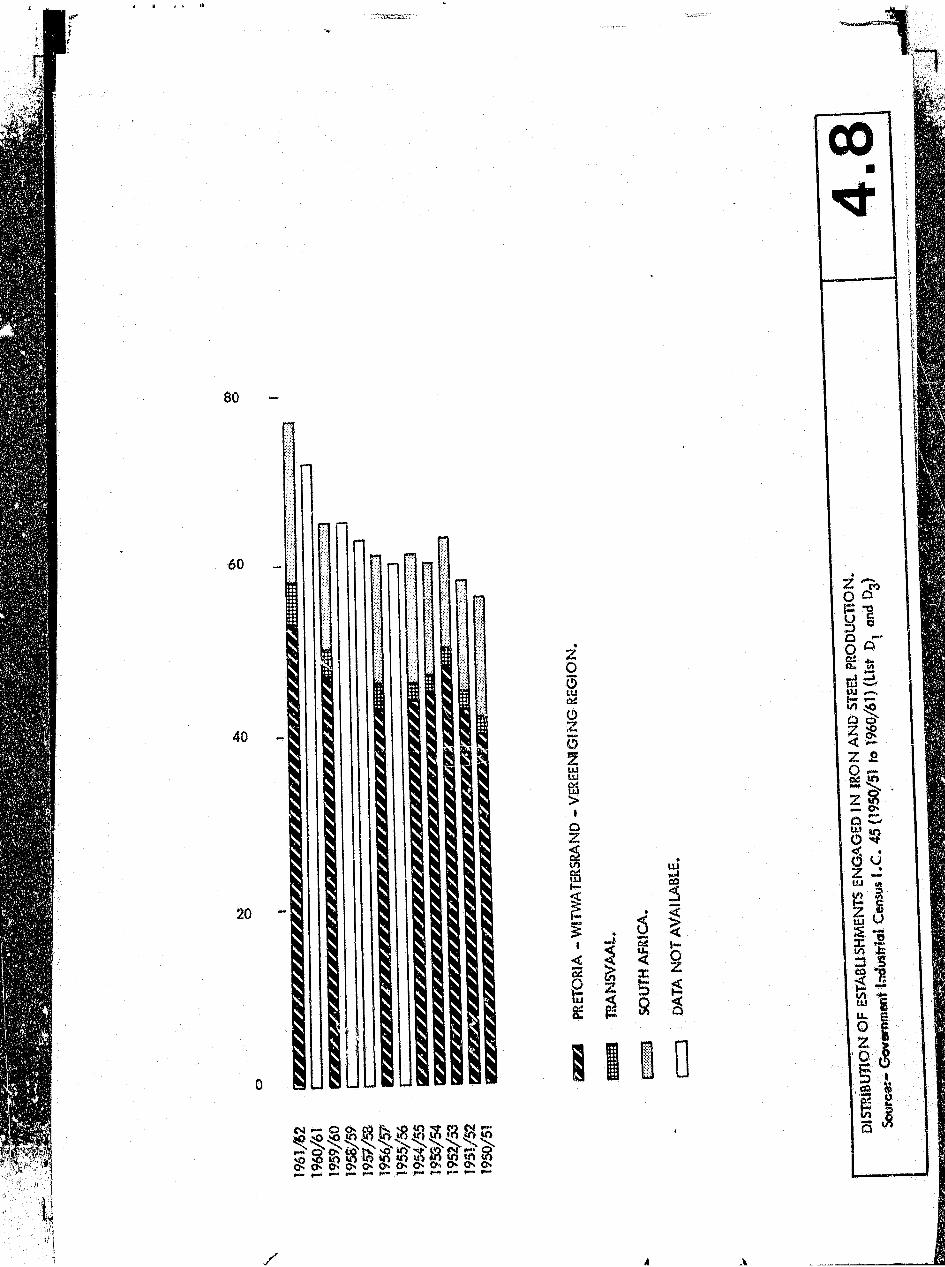
important industry in the manufacturing sector. The importance o f the P - W - V as an iron and Steel producing area can be gauged from Figure 4 .8 ,
Figure 4 .8 refers only to the iron and steel industry and excludes establishments smelting, refining
and other metals or engaged in any aspect o f engineering. Compiled from various sources .(IX * 45, N .R .D .C .,
168094/1957), it does give an Idea o f the distribution o f the establishments. The P - W - V complex
completely dominates the country's iron and steel industry. During the early 1950's it can be seen that 40 of
the 56 establ ishments In the country engaged in Iron and steel production were to be found in the Southern
Transvaal. By 1952/3 the number had actually increased to48, while in the rest of the country, they decreased
from 14 in 1950/1 to 13 in 1952/3. In the rest of the Transvaal the figure remained constant at 2. This meare
that during the year 1952/3, 76,2% of a ll iron and steel fabrication concerns in South Africa wore situated In
the P - W - V complex. The trend towards the concentration and centralization of this industry had continued
1 1 2 2 T " * T f e A> ^ * * • Hk * * * • - * = w - V w ,w e l# . " . ^ * « • • • • * r f h . h I , i t o s ^ T r d w m i : ^ * ; :
a _ f 7 . ' ^ ^ ^ P o H ^ o fen m u ro g in g ,hed aceW W W o f W w irfW p o d iy *i9 4 M ° ^ C C recea*,on* The 1953/4 balance o f payment crisis was similar to t l # of
' * ‘ excessive importaHon in relation to export earnings * d it occymxi Inspltoo f a considerable capital inflow.
By 1954/5 other establishments were being developed elsewhere in the country. The Wltwatmrand
area’s growth rate declined in comparison to the rest of the country (Figure 4 . 8). Unfortunately, detailed
Information for the year, 1955/6, 1957/3, 1958/? and 1960/1, b not available, but by 19515/f tbere ytoreonly 43 esfabl ishmsnts in the P - W - V complex, out of a total of 61 for the country as a whole,, The rest
o f the Transvaal had also begun to grow in importance, although there were only three establ ishments outside
o f the P - W - V . This marked the beginning of the trend IndecentralW ion, which continued so that by 1961/5 there were five establishments operating In the Transvaal,
doctors of the Base Metals and Engineering Industry within the P - W - V
4.1 The Iron and Steel Industry (Base Metals Group 15)
From 1950 to 1953 the number of establishment, producing iron and steel goods In the p - W -V
rose from 56 to 63 (Figure 4.9). This was followed by a decl me until 1957/8 when it again reaped
63. However, the number of employees did not follow the same trend, but Increased steadily
throughout the decade from 20 915 to 33 276, (Figure 4.9) This means that after 1953 the industry
must have undergone a period of consol Motion and improvement. The net output per employee rose
from Rt 372 in 1950/1 to R2 433 in 1953/4, then fo il to R2 268 in 1954/5, but rose again to R2 907
In 1960/1 (I.C . 45). The decrease in the number o f establishments and the fa ll o f productivity during
1954/5 can be ascribed to foe second of four crises in the country’s post war balance of payments.
The inflationary pressures caused by foe rapid expansion o f foe economy and in particular by a high
rate o f investment in both the private and pub! Ic sectors caused a strain on foreign exchange,
Monetary and fiscal restrains were imposed (Houghton 1964), The 1957/8 foreign exchange crises
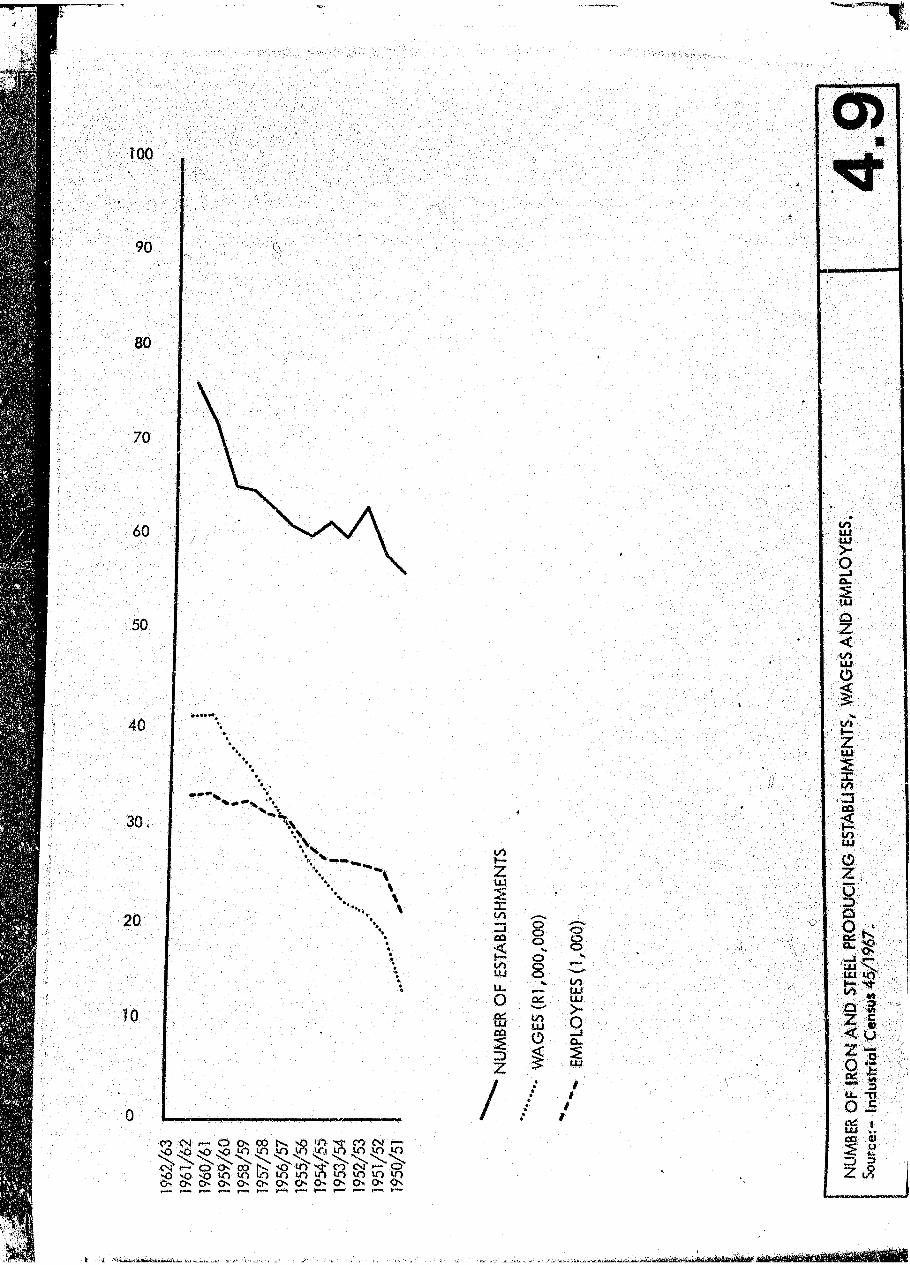

p gure 4 ,9
T itle : Number of Iron and Steel Producing Establishments, Wages and Employees,
Source: Industrial Census 1950/51 to 1960/6! Report No. I.C . 45 (1968) List D1 and D j.
Number of Employees Salaries and V&gesEstabl ishmonts (A ll races) (Rt 090)
1950/51 56 20 915 13 7351951/52 58 25 362 198221952/53 63 25 575 21 5991953/54 60 25 870 22 9671954/55 61 26 673 249501955/56 60 28113 26 3281956/57 61 30 908 30 8441957/58 63 31 932 33 8481958/59 65 32 542 36 0481959/60 65 32 363 38 1611960/61 72 33 276 417441961/62 76 32 964 41558
which resulted from a net outflow of private capital of R61 m illion and a fe ll in fee value o f exports
o f R129 m illion is reflected in fee levelling o ff o f the increase in employees. (Figure 4.9). The
1960/1 crisis years wsulted in a net outflow of Capital of over R12 m illion per month (Houghton 1964.)
The number of employees actually fe ll from 33 276 in 1960/1 to 32 964 in 19o!/2 (l.C . 45). Woges
also followed this trend, increasing by R28 m illion between 1950/1 and 1960/1, but then declining
from R41 744 000 to R41 558 000. The fact that wages rose more rapidly during the decade thah the
total number o f employees, points to an Inflationary tendency which had boon sot off by the increased
output and demands put upon this sector .
The fact that the base metal industry reflects the country's overall economic position re clearly
Is indicative o f Its importance to industry. It has high forward and backward economic linkages,
it re! les upon a number of primary Industries, such as m inim , electrical power production and transport.

While In ih tu rn ,upp ing m=ny more monufactunng, conihrwiHonend cw m unW kn W i# ! * ,
Th.s means that not only is the base metal industry a basic proraquisito for modern industrfol
development, W it b *n excellent barometer of the country', economic pW ltbnW by *b t*n W *
bosic trends within the industry, one can predict general industrial developments* The location of
the industry can often determine industrial development. When situated with other sectors o f the
metal and engineering industry It forms a powerful stimulant for industrial growth.
The gross output of the base metal industry increased rapidly during the d^tade (Figure 4.10)
only slowing slightly during 1952/3 and 1957/3. The relative percentage o f net output to gross Output decreased in value.
Figure 4.10
T itle : Productivity and capital value of Iron and Steel Producing Establsihmdhfs. (ROOO's)
Source; Industrial Census 1950/51 to 1960/61 Report No, l.C . 45(1968)
Gross Net Land and Plant, machinery,Output Output Buildings transport, etc.
1950/51 46 832 28 698 23481 38 9661951/52 72 046 45 824 19 278 415031952/53 89 228 58 998 21 605 34 5311953/54 93 028 62 932 27 272 39 4191954/55 108 922 60 493 28470 38 3561955/56 119 570 65 810 26853 36 9091956/57 129 924 76 281 30 365 46 3721957/58 143 020 81 802 32 669 57 0481958/59 147 361 83 254 31 978 76 1041959/60 162 657 93 951 40 833 89 3091960/61 182 406 96 744 42 056 93 5011961/62 190 618 98 096 r/a n/a
This Is indicative of the increase in the costs o f iron and steel production during the decade and can
be partia lly explained by the increase In wages, It should also be noted that from 1955/6 there was
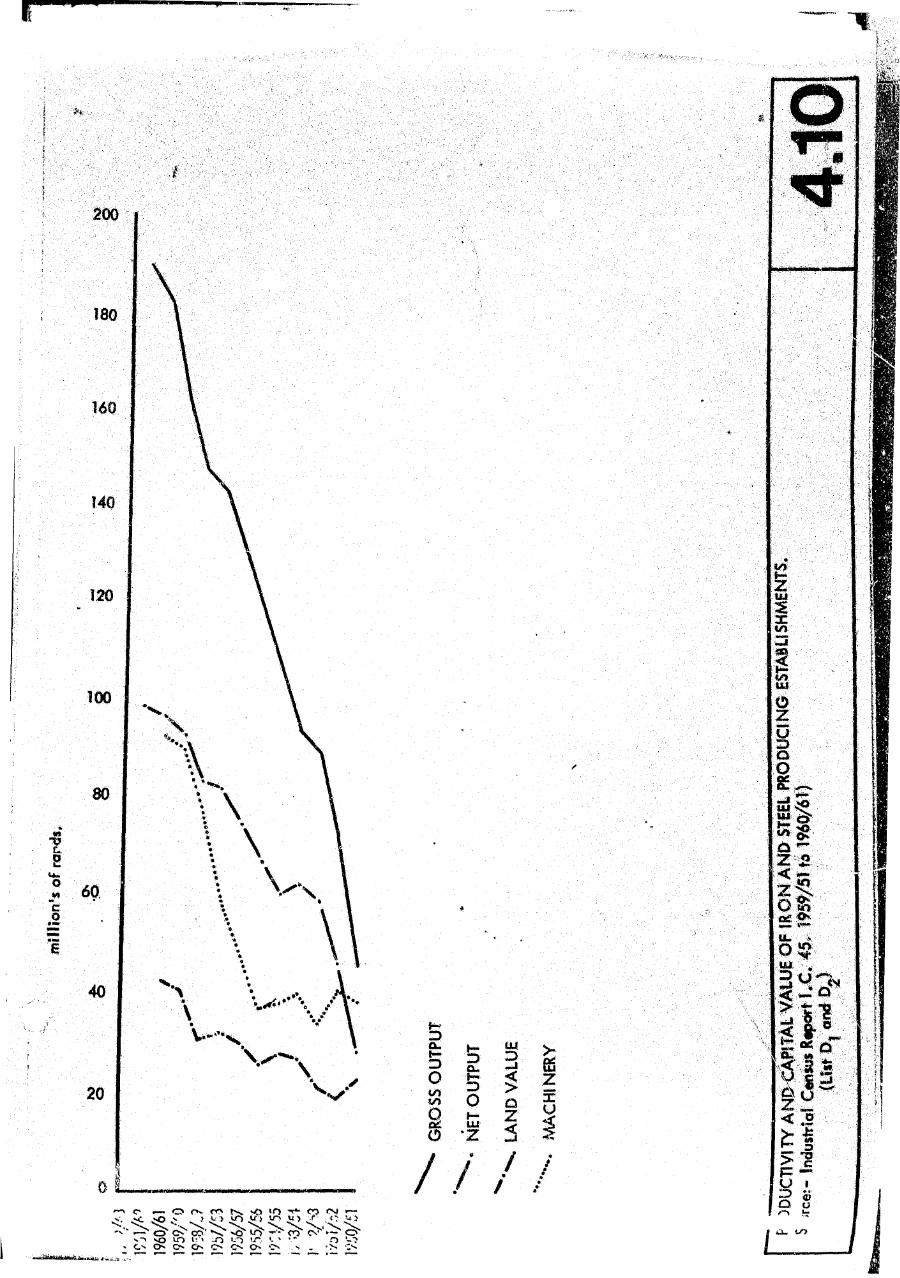
mill
ion'
s of
ra
nds
om pd mcreme * the value pf machinery which wa, being u*d the W u *y . W , could explain therelatwelydow Increase In employee,. I, could ^ firm: am moving
oukmatlon 1b off-set Hie spiralling cosh and wage Increase,. Thk capM Invedment In machineryand equipment vrould also explain the smaller percentage of net output to gross output.
Unfortunately, these figures apply to the country as a whole, but with the ma;orlty of firms
being found In I,he P - W - V (Figure 4.8) it does give an Indication as to trends within the area.
The iron and steel industry has managed to maintain a good growth rate In gross output, but has been
forced towards automation in an attempt to combat increased labour costs. As a result the value o f the
net output of iron and steel products no longer forms as great a percentage of the gross output as it
did at the end of the 1940'$. South Africa is not a country of cheap labour and ns new iron and steel
producing establishments are established they are employing fewer people. In I f 61/2 four new
foundries cane into production in the country, but total employment in the industry fe ll by 312.
The 1950's were a time o f expansion for the iron and steel Industry, notwithstanding! the
decreases in the number of establishments in the P-W-V in the m id-fifties. A brief summery of ISCOR's
development gives an indication of the size and importance of the corporation to the P-W-V.
1950: Several production units started up at Vanderbijlpark.1952: Iscor's total annual production, for the first time exceeded one m ill ion ingot tons o f steel.1953: Operations started at the Sishen iron ore mine.1954: Durban Navigation Collieries taken over by Iscor.1956: Ri 12 m illion expansion scheme,, designed to increase Iscor's annual production Capacity
to 2 350 000 ingot tons announced.1957: Operations started at the Mooiplaas dolomite quarry.1959: The Uis Mine purchased by Iscor.1959: Operations started at the Glen Douglas dolor*Ifo quarry.i960: R560 m illion expansion scheme designed to increase the annual production capacity
to about 4 500 000 ingot tons announced (ISCOR 1965)
The 1956 Rl 12 m ill ion expansion scheme was completed by the beginning o f the sixties and had
increased the corporation's annual steel production ccpacity to 2 350 000 ingot tons, of which the Pretoria
Works supplied 1 100 000 and the Vanderbijlpark works 1 250 000 ingot tons.
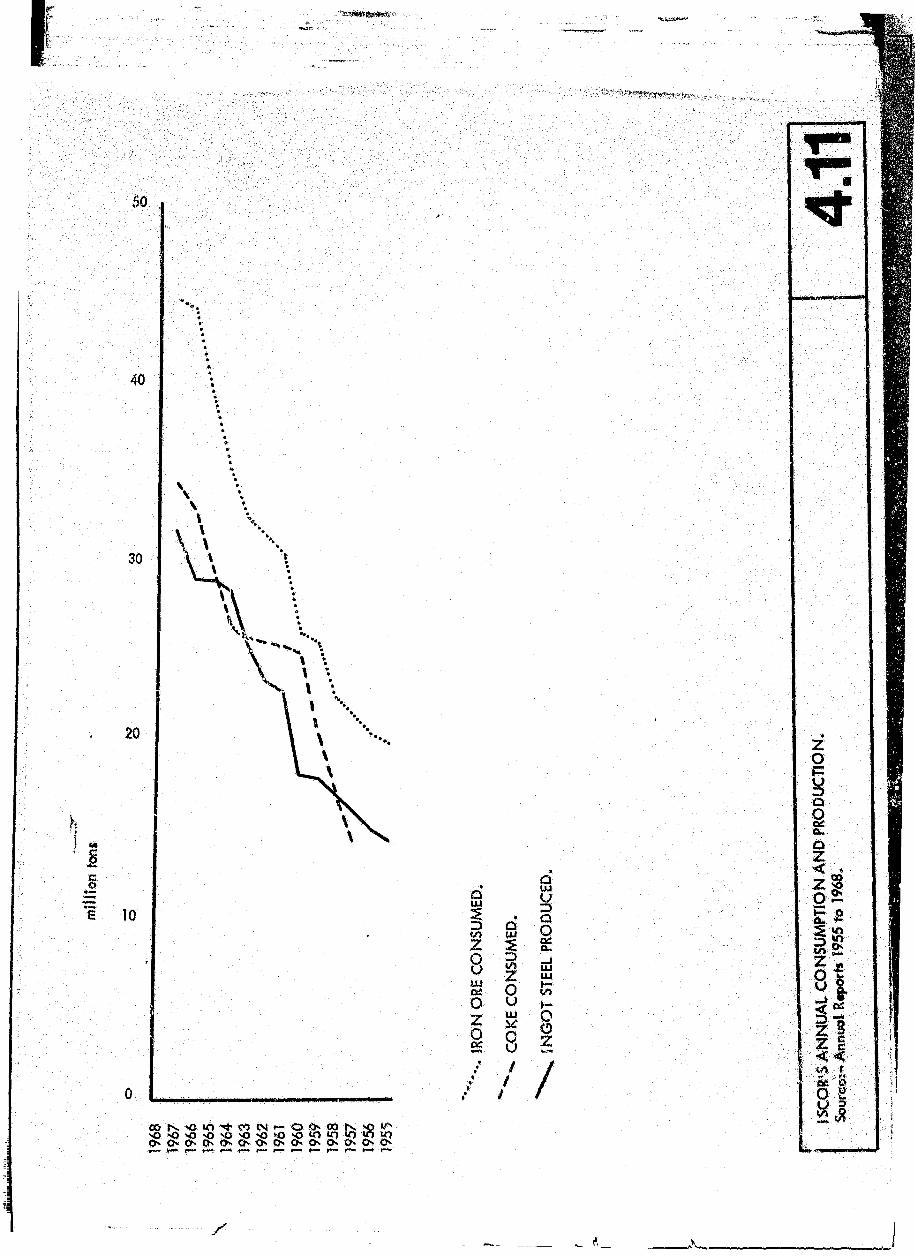
. ■■■:n: ,
3o
40
30
20
K
%10
1z8m01oz2
asQ
I i
i UJZ LUou H*Uj o
<58/
/
Z
7
I I
i i
lHi$8§$ls$6gg . ..... — . -̂-_. ...— ... >.— — ■ — - — • —
The iron ore and coke comsumption of Iscor and its Ingot output in ton* are shown in Figure 4.11.
The steady rise in ingot production was to meet the growing demand for Wn and steel goods. By 1957 the
country's total consumption amounted to R178 m ill ion's worth of which R48 million was imported. During
that year Iscor's net sales revenue amounted to R89.5 m illion. This meant that Iscor alone was supplying
approximately 70 percent of the country's Iron and steel requirements. iscoA position o f dominance
continued during 1965, when the country's iron and steel consumption exceeded $ m illion te0| P ^ t t * ^ i R)
In so far as the distribution o f eslablishments in the Southern Transvaal are concerned, iscor's
fast increasing output o f iron and steel and its dominance of the market is like ly to negate any effect
which the slight decentralisation of the iron and steel foundries may have. If more than 70%
(Figure 4.12) of the country's iron and steel is produced within the relatively small P-W-V tired the
expansion of the industry in other centres is going to be slow and a much less attractive economic
proposition to the industrialist. This would apply even more strongly to the Engineering and Machinery
manufacturing industries which are dependent upon semi-processed metal goods. The industrial Inertia
of the iron and steel industry effects a ll a ll led industries so that they are unable to survlve,eeonomically*
far from the foundry. To overcome this Inertia requires the jugghng of transport rates and the manipulation
o f the country's economy, so that the costs of sustaining works Is borne by
other sectors o f the economy.What in effect is needed, is not the decentralisation of establishments, but the divergence of
production, so that one area no longer dominates the entire country, by producing nearly 75% o f its
iron and steel. However, this divergence is not economically practical when such small quantities of
Iron and steel are being produced.
Specimen Achievement:l „ A , United Stoto, in 1959, an area. Sou* of Lake Eire, 275 OOCquore m ll« In extent,
produced 60 m illfon Ions o f steel. D u ,!., tH r o m e y » r . Chicago and it,.ubcvb. product 24 970 000
tons of steel. .The three m illion ton, produced In the 472 000 iquare mile, P-W-V complex I, by conparUon
.m a ll, but planning precedents m et exbt «o that future development within the region h HmW e.
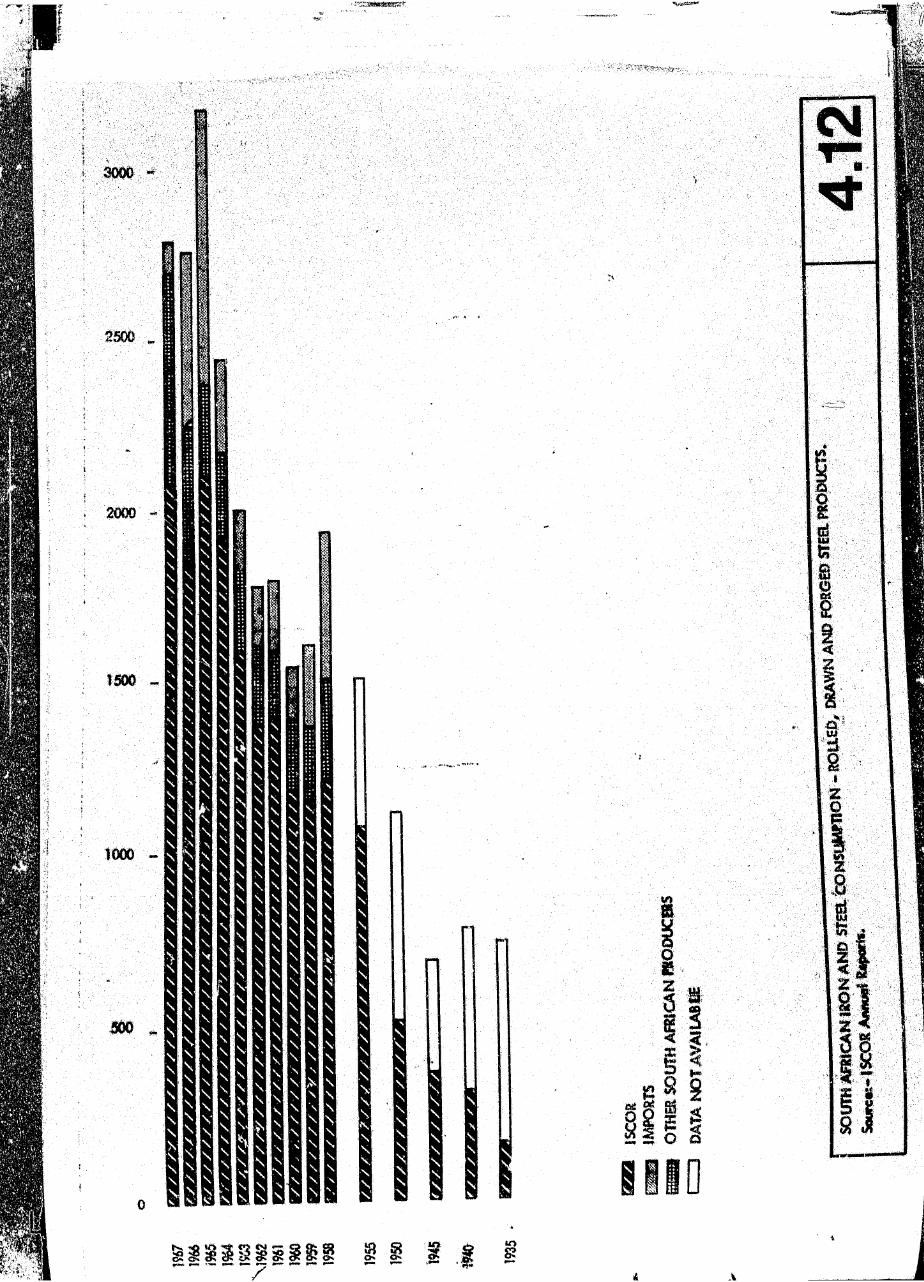
2506
2000
s \
X x
H
I
? 5
\ :;\ *;■ \\ H\ !:X I \ \ \ \ \ \ \ \ \ \ \ \ \ \
\ \ \ \ \ N x \ \ \ \ X X \ X X X \ X \ X \ X \
X ^
I
K*
s r

Heavy Engineering (Group 16)
Heavy engineering firms are more closely linked to the production o f iron and steel than
perhaps any other sector of the economy. It has been seen that the development o f U5CO and
ISCOR resulted in a greater need for heavy engineering in the P-W-V. In itia lly the only large
engineering jobs were directly related to the mines.
After the expansion of the iron and steel industry during the 1940's heavy engineering firms
were able to develop, being no longer dependent upon the mines and their piece-meal demands,
for survival. VECOR which had been initiated by the Government and the Iron and Steel Industry
in 1947, continued to expand. Today it is the largest comprehensive engineering works In South
Africa and the giant of the manufacturing concerns in the heavy engineering sector. It manufactures
equipment which includes winding equipment for the mines, cement plants* crushing and grinding
plants, condensing plants, paper and paper pulp mill equipment, refinery equipment, Iron and steel
Industrial equipment, boiler plant equipment, cranes and other heavy equipment. The firm pioneered
the manufacture c f welded pressure vessels In South Africa. In conjunction with David Brown
Precision Equipment (Pty.) Ltd, Veeor has fu ll gear cutting facilities.
The work undertaken by Veeor is usually the manufacture of heavy equipment for other sectors
of industry. For example, among other things, Veeor produced, during the 1950'$;-
- M ill stands for a continuous rod m ill, weighing 8 tons.
- A class ONE a ll welded pressure vessel of 2 inch cladding stainless steel plate,weighing 120 tons.
•» A cement k iln , 350 ft. x 10 ft.
- A 60 megawatt condenser,- A steel frame for an 8 inch bloom shear for Risco, weighing 60 tons,
- A 48 inch x 42 inch jaw crusher weighing 60 tore._ A 16 f t . d ia. hoist double helical gear, faced with 36 inch, fabricated construction
runs in high manganese steel.
- Medium mill rolls in spheroidal graphite iron. (VECOft 1958)
It should be noted thot much of the equipment required by the iron and steel industry con be
manufactured and installed by Vecor. In fact, os has been stated, the estoblishment of Vecor relieved
Iscor of having to develop and maintain its own engineering section. The Importance o f Vecor to
Iscor is emphasised by D r. Meyer's annual report in 1964 when he stated that:-
'The Corporation's trade investments are vested in the following public companies,
whose interests are closely allied tc its cwm African Metals Corporation Limited,
the Union Steel Corporation (of South Africa) L td ., Vanderbijl Engineering Corporation
Ltd. .............' (ISCOR 1964)
Without the engineering and the maintenance o f Vecor , Iscor could not function long, nor
undertake its present R560 m illion expansion. Vecor Is not solely concerned with industry in the
P-W-V although its works at Vanderbiflpark have been expanded and are well suited to serve large
iron and steel corporations plus the mines.
Metal Products (Group 16)
Figure 4.13 shows the total number of establishments in the Union for the base metals, metal
products and machine industry (Groups 15, 16 and 17). In some cases the base metals industry
(Group 15) includes non-ferrous metal foundries and the Iron and steel Industry, but these have been
excluded so that the bar graph shows only Iron and steel works. In the case of metal products
(Group 16) tinware was excluded and in some years “springs for all purposes" were not listed as a
separate category. After 1954/5 a different method of collecting Information and processing was
employed as a ll that year's figures are consistently lower than the previous year, despite the fact
that them are only two minor changes in the subsection, of the ma|or grot*,. The figure, Wm 1954/5 to 1957/B were published In the 1957/% Industrial census report and detailed figure, far the
years prior to 1956/7 are available . Also during thb period no distinction wo, made between prhrata
and government Industrial establishments * had been the core. This together with the mOtW inconsistency of figures from 1953/1 to 1954/9 tand to throw doubt on the validity of the graph.The reports published after 1957/8 seem to follow the W fo r report, consbtontly, using the tame
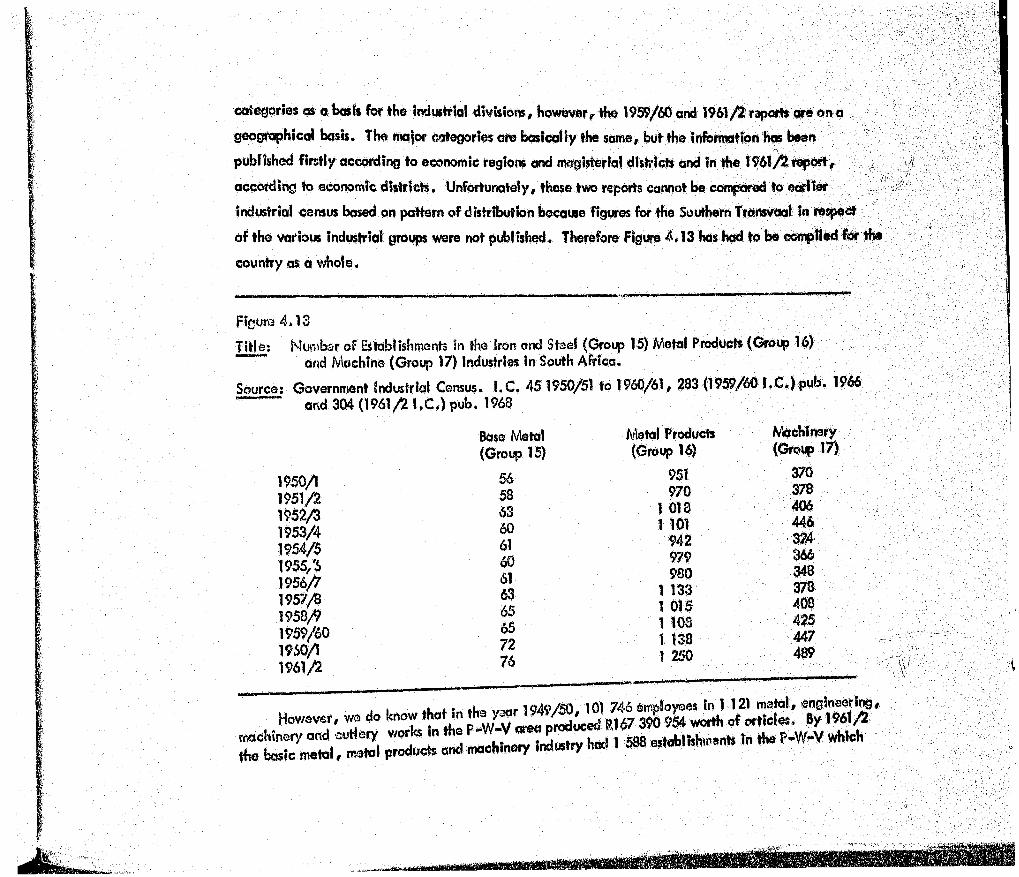
categories es a basis for the Industridl divisions, however, the 1959/60 and 1961/^ raports * 6 onq
geographical basis. The major Megories are basically the same, hot the information h « been
published firstly according to economic regions and magisterial districts and in the 1961/2 report,
according to economic districts. Unfortunately, these two reports cannot be compared to earlier J
industrial census based on pattern of distribution because figures for the Southern Transvaal in respect
o f the various industrial groups were not published. Therefore Figure 4.13 has had to be compiled fo r the
country as a whole.
Figure 4.13
T itle : Number of Establishments in the Iron and Steel (Group 15) Metal Products (Group 16)' and Machine (Group 17) Industries in South Africa.
Source: Government Industrial Census. I.C . 451950/51 to 1960/61, 283 (1959/60 I.C .) pub. 1966 ~ - and 304 (1961/2 I.C .) pub. 1968
Bass Metal Metal Products Machinery(Group 15)
1950/1 561951/2 581952/3 631953/4 601954/$ 611955,(6 60
61 63 65 65 72 76
1956/71957/81958/91959/601960/11961/2
(G ro if 16) (Group
951 370970 378
1 018 4061 101 446
942 324979 366980 348
1 133 3781015 4081 108 1 138
425447
1 250 489
the basic metal

Is
V
900
800
700
600
500
K
Vf
, to
II:i : i
8£< ,
400 *
300
200
100
x..
l O v •sd-' C f CnT t— i” O ' i p iO t o tr> V ) O' O' O. On CN 0
tp
p
I
Qz<zs
/
NO
P112u3Q2 Du-Jli<LUs
S
Boo
>wz5
<z
z
* u r* uli —‘SI -tTtii*, i«grI
employed 130 408 people and hod o gross output of R627 196 000. It can be surmised that apparent
growth in the number of e$tabi ishments engaged in the three groups of industry was more or less
constant and that the metal products industry (Group 16) constitutes by far the largest proportion of these establishments (Figure 4.13).
4 .4 Machinery (Group 17)
The development of the manufacturing of machinery can be seen despite the d ifficu lty in
obtaining figures which allow comparison and the alternating methods of collecting data employed
by the Bureau of Statistics (Figure 4.14), It is apparent that a continued growth of this group
occurred during the fifties and early sixties. The discontinuity between the years 1953/4 and
1954/5 cannot be adequately explained by any marked recessions in tlie economy, but more like ly
is due to the different methods of classifying industry, by the Bureau of Statistics from 1954 onwards.
Hobart Houghton notes thafs-
“ Sinco 1954 manufacturing has continued to expand, but no comparable statistics
are available other than those published in the national income statistics. These
Indicate a continued upward movement to 1957, but less rapid after that date.11
(HOUGHTON 1964)
Notwithstanding the difference, the largest sub-category of group 17 - industrial, mining and
construction machinery shows a steady increase in gross output of R60 848 000 from 220 establishments
in 1953/4 to R83 652 000 in 1956/7 from 222 establishments. One may therefore conclude that
expansion in this group continued throughout the country as a whole and consequently on the
Witwatorsrand as w e ll.
DISTRIBUTION OF THE METAL AND ENGINEERING INDUSTRY IN THE P-W-V: *(Rgwres 1.8 and 4.5)
The early 1950's saw a continued growth of light engineering and the manufacture of metal goods in
the Southern Transvaal and particularly on the Witwatersrand, By 1954, 67% of the 10 604 morgen (NRPC 1957/$)
of land zoned for Industrial purposes in the Southern Transvaal, lay within the Witwatersrand complex. O f this,3 8 8 3 morgen or 55% was actually occupied by industrial firms (Figure 1.8).
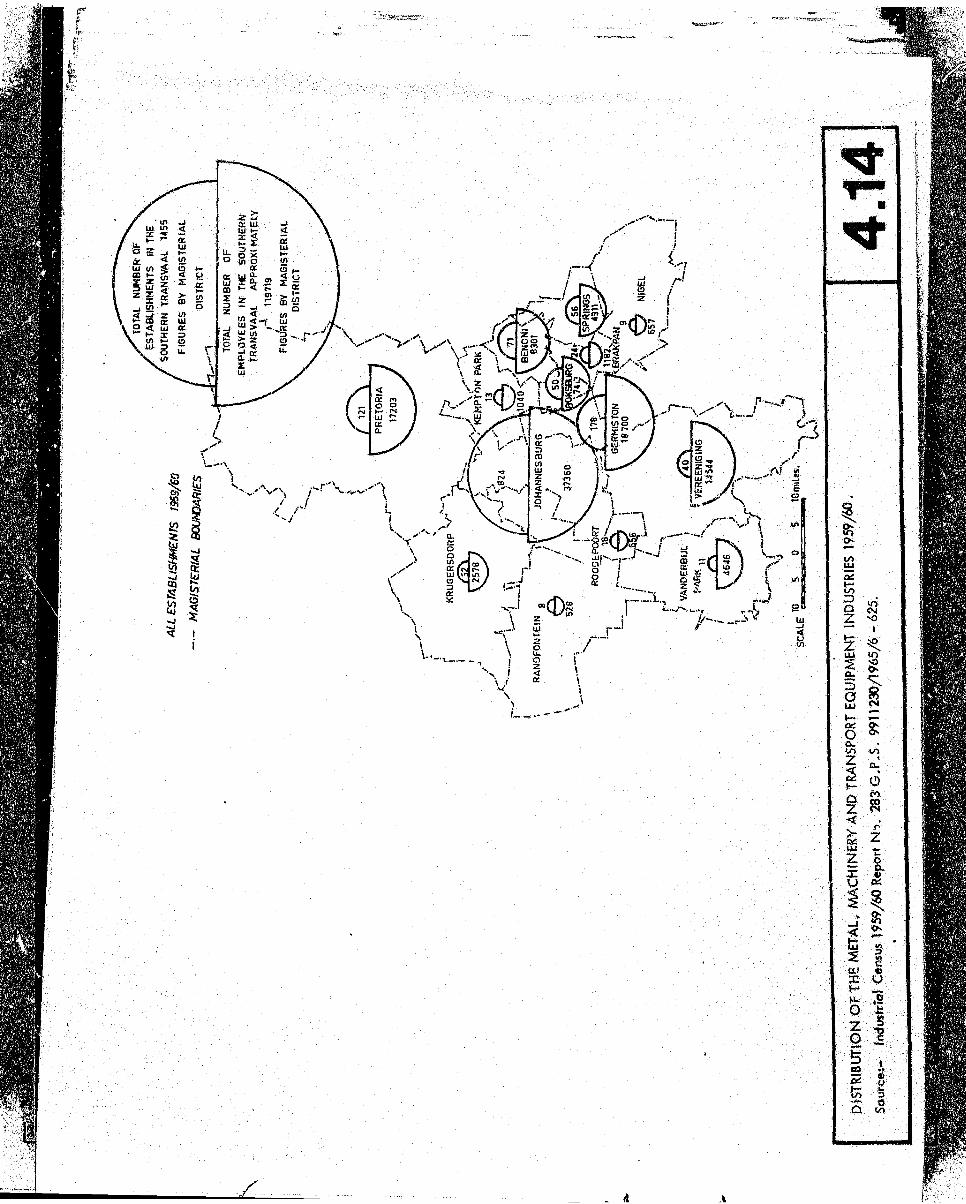
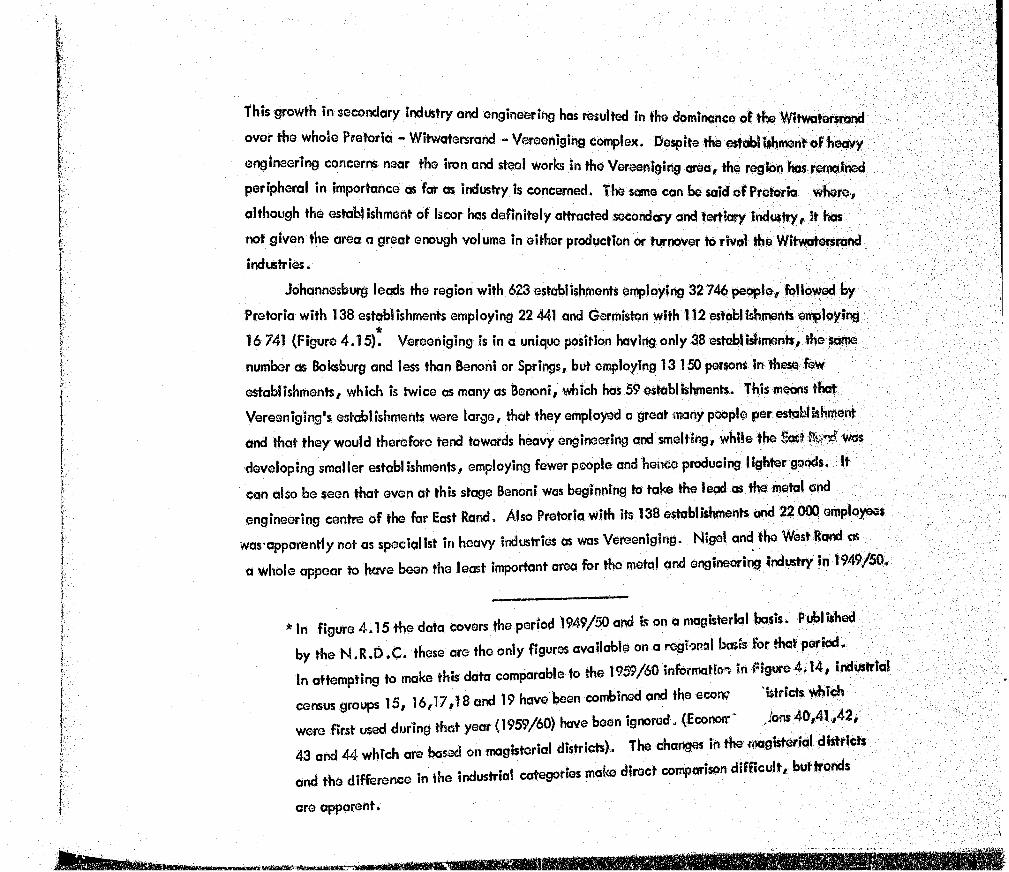
This growth in secondary industry and engineering has resulted In the dominance of the Witwatersrond
over the whole Pretoria - Witwatersrond - Vereenigihg complex. Despite the establishment o f hemry
engineering concerns near the iron and steel works in the Vereeniging area, the region has remained
peripheral in importance as far as industry is concerned. The sane can be said of Pretoria where,
although the estabi ishment o f Is cor has definitely attracted secondary and tertiary industry. I t has
not given the area a great enough volume in either production or turnover to rival the Witwatersrond
industries.
Johannesburg leads the region with 623 establishments employing 32 746 people, followed by
Pretoria with 138 establishments employing 22 441 and Germiston with 112 establishments employing
16 741 (Figure 4.15). Vereeniging is in a unique position having only 38 establishments, the Same
number as Boksburg and less than Benoni or Springs, but employing 13 150 persons in these few
establishments, which is twice as many as Benoni, which has 59 establishments. This means that
Vereeniging's establishments were large, that they employed a great many people per establishment
and that they would therefore tend towards heavy engineering and smelting, while the Sast. was
developing smaller establishments, employing fewer people and hence producing lighter goods, it
can also be seen that even at this stage Benoni was beginning to take the lead as the metal and
engineering centre o f the for East Rand. Also Pretoria with its 138 establishments and 22 000 employees
was apparently not as special ist in heavy industries as was Vereeniging. Nigel and the West Rand as
a whole appear to have been the least important area for the metal and engineering Wastry In *949/50.
' In figure 4.15 the data covers the period 1949/50 and is on a magisterial basis. Published
by the N .R .D .C . these are the only figures available on a regime,! b *i* for Act P *W .In attempting to make thk data comparable to the 1959/60 information In F I*** 4.14, WustrW
census groups 15, 16, 17,1 Sand 19 have been combined and the eco* Istrlct, which
were first used (luring, that year (1959/60) have been ignored, (Econo*- ,W 4 0 ,4 1 ,42;
43 and 44 which are based on magisterial districts). The changes In the dM rkt,and the difference in the industrial categories make direct comparison difficult, butlrond,
are apparent.
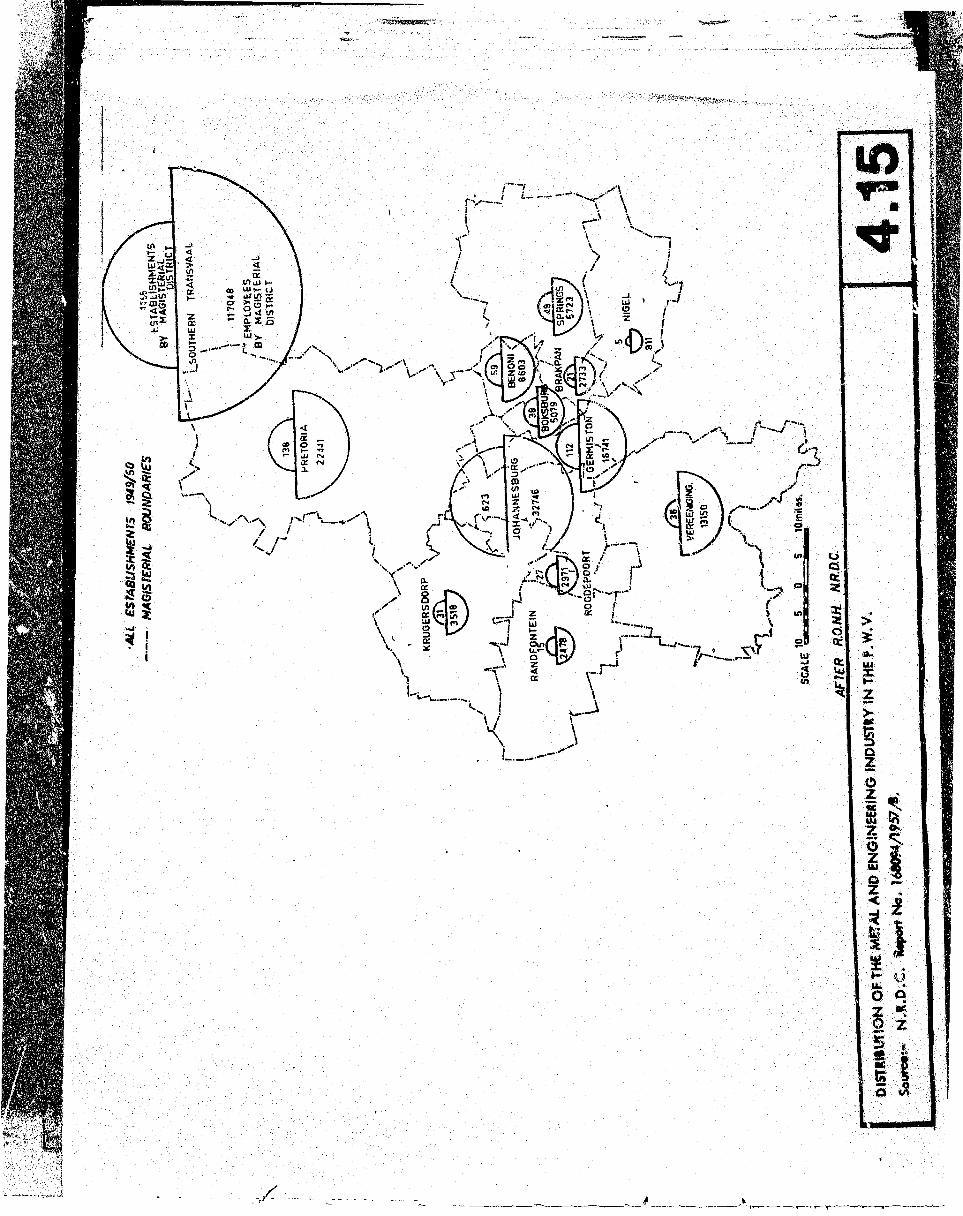
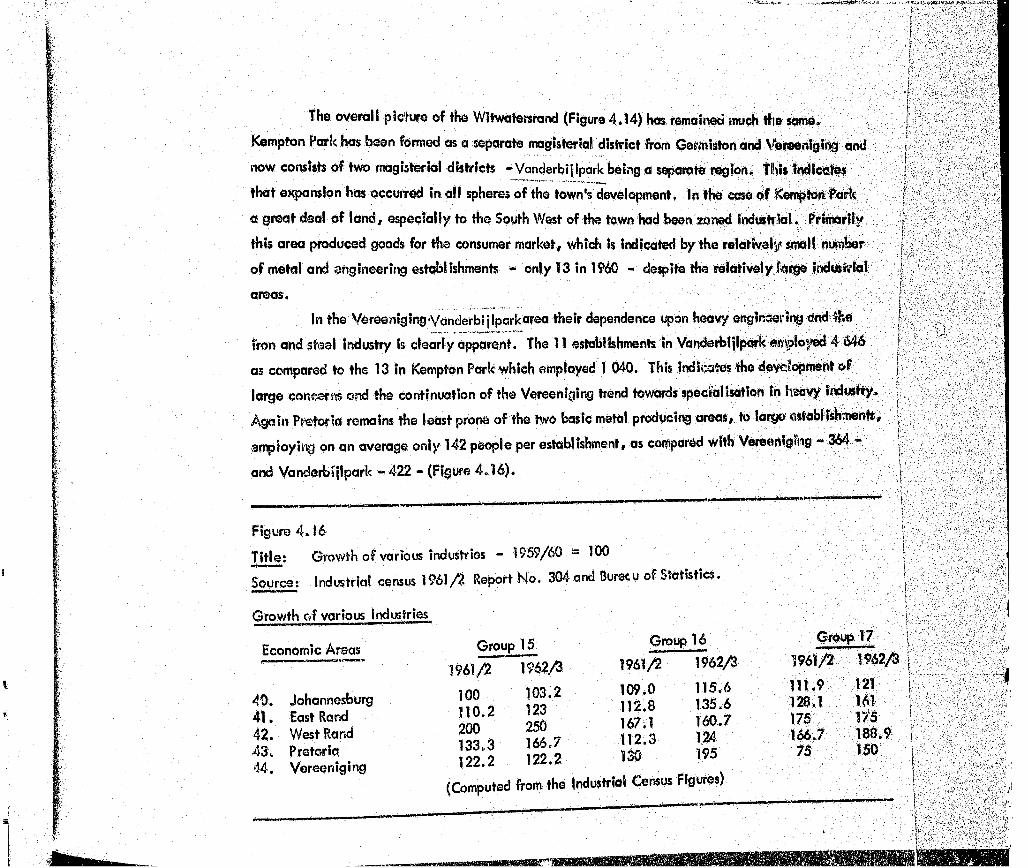
- %
The overall picture of the Witwotersrand (Figure 4.14) has remained much the some.
Kempton Parle has been formed as a separate magisterial disirict from Germiston and Vereenlgfrig and
now consists of two magisterial districts i Vanderbij Ipark being a separate region. This Ihdicttfes
that expansion has occurred In a ll spheres of the town's development. In the ease o f KemptopPdrk
a great deal of land, especially to the South West of the town had been zoned industiial . Primarily
this area produced goods for the consumer market, which is indicated by the relatively small number
o f metal and engineering establishments - only 13 in 1960 - despite the relatively forge industrial
areas.
In the VereenigingVanclerbi jlparkarea their dependence upon heavy engineering ond ^he
iron and steal industry is clearly apparent. The 11 establishments in Vanderbijlpark eti^loyed 4 <546
as compared to the 13 in Kempton Park which employed 1 040. This indicates the development o f
large concerns end the continuation of the Vereeniging trend towards specialisation in heavy indiHtry.
Again Pretoria remains the least prone o f the two basic metal producing areas, to large tistablishments,
smploying on an average only 142 people per establishment, as compared with Vereeniging **
and Vanderbijlpark - 422 - (Figure 4.16).
H '■
t'::
Figure 4.16
T itle : Growth o f various industries - 1959/60 = 100
Source: Industrial census 1961/2 Report No. 304 and Buretu of Statistics.
Growth o f various Industries
Economic Areas
49. Johannesburg41. East Rand42. West Rand43. Pretoria44. Vereeniging
i l i l i
Group 15
1961/2 1962/3
100 103.2110.2 123200 250133.3 166.7122.2 122.2
Group 16 Group 17
(Computed from the Industrial Census
1961/2 1962/3 1961/2
109.0 115.6 111.9112.8 135.6 128,1167,1 160.7 175112.3 124 166,7130 195 75
ol Census Figures)
1962/S
s
188.9150
l i i l.
i -

This degree o f specialisation could have resulted in a movement of the population away from
the area because it lacked opportunities for the employment of other skills and interests which could
be more profitably employed elsewhere on the Witwotersrond, The fact that there is a limited amount
o f ligh t manufacturing industries in the Vereenlging region, means that in its relationship'1, with the: rest
of the P.W .V, it is a "depressed area", in so far as there is a limitation on the type o f employment
available. The heavy industry has not attracted the secondary and tertiary industries which it might
have, or could have, in other parts of the world. This has meant less employment opportunity for the
population as a whole. Secondary and tertiary industry has been drawn to the Witwatersrand where
conditions are more favourable for them and the population has possibly followed the developing
manufacturing industries. This may also explain to a slight degree the decrease in population on the
Far East Rand, but not to the same extent as in the case of Vereenlging - Vanderbi|lpark.
6.0 Regional Breakdown o f the F - W - V
Some regional specialisation within the Iron and steel and engineering industry in the
P-W-V has occurred. Base metal working has developed peripherally to a marketing centre
of smaller metal producing concerns. The heavier production engineering with some smelting
and private base metal working has tended to locate on the East Rand . This makes a regional
study o f the P-W-V necessary.The 1957/3 report on the P-W-V by the Natural Resources Development Council,
divided the Witwatersrand Into three main areas:-
1. The Central Rand being the Johannesburg and Germiston magisterial districts.
2. The East Rand being Boksburg, Benoni, Brakpan, Springs and N igel,
3. The West Rend being Roodepoett . Mereisburg, Krugersdoip and Rendlentein.
Developments since then have accentuated a trend which wa, already apparent at that
time namely the growth and expansion of the GemUton area. This town . « ’be,w lth ^
Kempton Park and Albertan ha, shown tremendous growth. This can be explained by the fact
that it is a nodal paint between bath North/Sou* and East/West line, of communication.
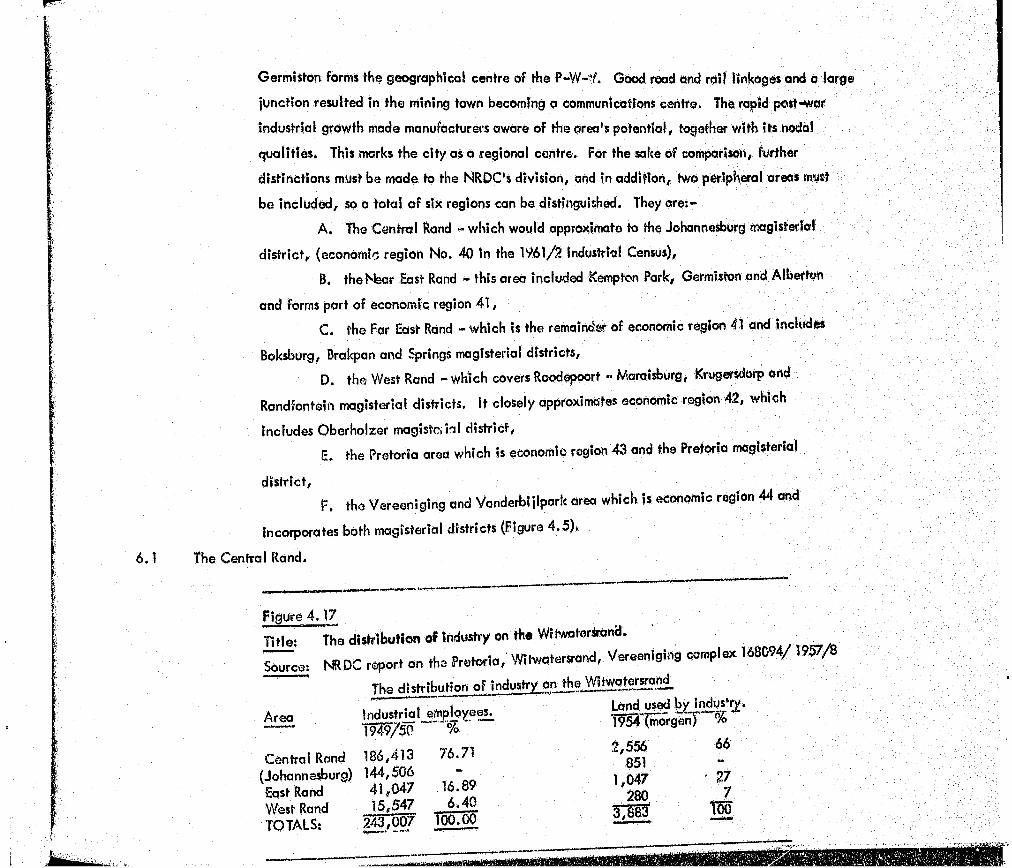
Germiston forms the geographical centre of the P-W-Y. Good road and rail linkages and a large
junction resulted in the mining town becoming a communications centre. The rapid post-war
industrial growth made manufacturers aware of the area's potential, together with its nodal
qualities. This marks the city as a regional centre. For the sake of comparison, further
distinctions must be made to the NRDC's division, and in addition, two peripheral areas must
be included, so a total of six regions can be distinguished. They are:-
A. The Central Rand - which would approximate to the Johannesburg magisterial
d istrict, (economic region No. 40 in the 1961/2 Industrial Census),
B. the Near East Rand - this area included Kemp ton Park, Germiston and Albertan
and forms part of economic region 41,C. the Far East Rand - which is the remainder of economic region 41 and includes
Boksburg, Brakpan and Springs magisterial districts,D„ the West Rend - which covers Roodepoort - Maraisburg, Krugersdorp and
Randfontein magisterial districts. It closely approximates economic region 42, which
includes Oberholzer magistcibl district,E. the Pretoria area which is economic region 43 and the Pretoria magisterial
d istrict,F. the Vereeniging and Vanderbijlpark area which is economic region 44 and
incorporates both magisterial districts (Figure 4.5).
The Central Rand.
Figure 4.17Title: The distribution of industry on the Wilwaterirana.
Source: NRDC report on the Pretoria, WItwatersrand, Vereeniging complex 168094/1957/8
The distribution of industry on the W jwo te ryo i^
C entral Rond 186,413 76.71 -
,6 :8 , v7West Rand 15,547 WTOTALS:
From i-he distribuHon of industry and employees during the early 1950 $ (figure 4 .17) it is clear fhaf the Central Rand dominated the region. 77% of the industrial workers employed
on the Wifwatersrand in 1949/50 worked here while 66% of a ll industrial land was here. There
were 144,506 industrial workers in Johannesburg alone, three and a half times as many in GermistOrt.
As yet Germiston had not developed as a market of any significance, and growth, as a result of its
unique position, was in its infancy. Germiston could only develop aso result of Johannesburg's expansion
Johannesburg had to reach a size which generated enough business, commerce and demand to support
industry in Germiston, Consequently as Germiston has grown, it Isos developed an loter-dependency with
Johannesburg,
‘Nearly 9,500 people travel daily to Johannesburg from Germiston to work and about 5,300 travel from Johannesburg to work in Germiston. Johannesburg and Germiston ore Very interdependent. 1
(Metropolitan Report C.E.D.Johannesburg 1966)
During the early 1950's the importance of the mines decreased os a market for the metol
industry, while the industry itself began to form its own market. Metal fabrication forms an
important part of any developed country's economy because of its economic integration With the
manufacturing and industrial sector. The metal industry is an important generator of goods,
employment and a market for other manufactured goods including metal products. In the U.S.A.
in 1958 there were 25,000 metal fabricating concerns employing over a million people (U.S.
Census o f Manufac. But. MC 58 (1) 1958). In Johannesburg the metal and engineering industry
employ 22.7% of the area's workers, by far the largest single sector of industry. It was followed ^
bv clothing and te x tile 16.9%, building and comtructlon 16.9% and toad and drink and tobacco 9 .1 5 *.
The metal and engineertng industry! tbus provided a major portion of Johannesburg’s industrial
turnover, (NRDC, 1958 Report W 94/1957/8).By 1959/60 there were 2,683 manufacturing establishment. In the Jok.nne.burg Magisterial
d istrict which employed 119,905 workers and had a gross output valued at 8468,519,000.
During the same year Germiston had only 373 manufacturing establishment, which employeda total of 32,451 workers and produced R122.347 worth of goods in gross oulput. (I,C . 1959/60 U G No. 903). This c o m p a rl» n lllu s tm te s the fact that Johannesburg fa , outstrip, Germiston a, a
manufecturing centre despite Germiston', comparatively higher percentage of heavy Industry and I,
indicative of the inter^dependency of the areas, Germiston being a more primary industrial region
supplying Johannesubrg's manufacturers with baste materials.
The Near East Rand!
In Germiston nearly 40% of the industrial employees were in the metal and engineering
industry. Its establishments were the largest on the Rand, employing 118,4 workers per firm as
compared to 50.8 for Johannesburg. Its metal industries employed an average o f 149,5 workers
as compared to 52.6 for Johannesburg, This means " that the larger and heavier engineering
firms which employ more workers have established themselves in Germiston,
This could be due to o number of reasons:-
A . Cost of Land.
O f the 1,682 morgen of industrial land in Johannesburg, 51% was deveioped as compared
to 70% of the 1, 9??, morgen in Germiston. The movement of Industry and pdrticylarty the
heavier engineering firms into Germiston could be due to the lower cost of land and
services.
B. Better location,Land being released by the mines is already being used by industry particularly to the
south of the railway lines. Germiston offers o better location for industry
Not only was if cheaper but it was well connnectod by road and rail to the rest of the
P-W-V and the country. The main junction of the east-west and north-south lines of
communication (both rood and rail) occurred here. It is also closer to the industrial
East Rand than Johannesburg: yat it is not far from the’ latter,
C. Proximity to established heavy industries.
According to figures published by the Germiston City Engineers Department In 1963
(Planning for W fic 2nd, ed.) the city had been developed os follows;.

Figure 4.18
Titles Land use of Germistoh in acres.
Source; Planning for traffic C.E.D. Germiston 1963.Function Total area
occupied in acres% of total
Residential 4,912 52.5C ity centre 55 0.59
15.8Heavy industry 1,198Light industry 228 2.4Small holdings 651 6.9Agriculture 2,308 24.7TOTAL: 100.0%
There was a further 1,800 acres of unused land which could become available for industry.
This means that the total industrial land available amounts to 3,226 acres or approximately
1,536 morgen which is 386 morgen less than that accredited to the c ity by the National
Resources Development Council in its 1957/8 Report. The table does show that heavy
industry dominated Germ is ton, occupying 12.8% of its total area and nearly 2/3 of the
city 's industrial land (NDRC 168094 1957/8)
During the m id-fifties Kemp ton Park and Albertan appeared os industrial areas although
only 36% and 18% of their total available industrial land was occupied by 1955 (Jhb. City
Engineer 1966). A t that time the main development in Alberton was along the railway line
towards Vereeniging in an area adjacent to the Natalspreit location. More recent figures of
a comparable nature are unavailable. However, development to both the north and south of
this area did continue especially after 1960, a fact which Is illustrated in the next section.
What is important is that this trend was already discernible during the m id-fifties. By theend o f the decade industrial development In the Alberton area was significant. It should
be remembered that much of the Alberton Industrial area was included in the Germlstoh
magisterial district.

I t can be seen that the industrial areas of Wadeville and Albertan form an almost continuous
be lt south of the European areas (figure i .8). The new African township}, of Natalspruif, and V6$!oorus
have been developed south of the industrial areas to supply labour. By 1959/60 Germiston had 178 firms
engaged in the metal,machinery and transport industries, which employed 18,700 parsons or an average
of 105,1 persons per establishment as compared to 45.43 in Johannesburg. This means that despite the
fact that Johannesburg employed nearly twice as many metal workers as Germiston (37,360 to 18,700)
Germiston's metal, machinery and transport equipment firms tended to be bigger. It can therefore be
concluded that the earlier trend towards development of a heavier metal industry in Germiston contin
ued, however these industries remained smaller on an average than those of both the Vereeniging area
and Pretoria.
The Far East Rond (Part of region 41)
The main Far East Rand industrial areas are Bolcsburg and Benoni which are contiguous with
Springs. The first two together employ 9,4% of the Rand's industrial employees and the degree of
specialisation is greater than in Germiston. in Boksburg metal and engineering works employ 65.9%
of a ll industrial workers and in Benoni 57.2%. These two towns had 89% and 98% of their industrial
land developed. This fu ll utilization created a demand in this category, (figure 4.19).
Figure 4.19Title: Industrial land on the Witwatersrandjn 1954
Sourced N .R .D .C . Report No. 168094, 1957/8.(ereti of industrial land in morgen)
Central Rand Developed Undeveloped M a i Percentage
Johannesburg 851Germiston 1,351Alberton 117Kemp ton Park 228Edenvale 9
83157154840635
1,6821,922
66563444
5170183620
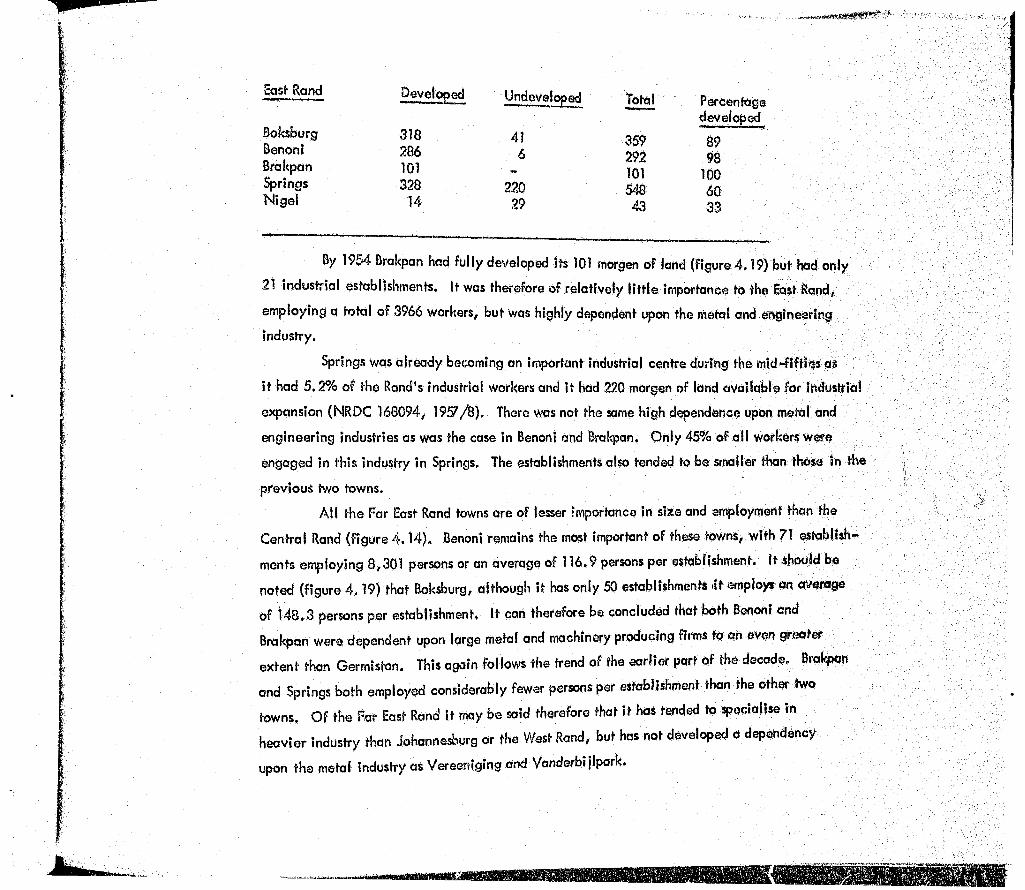
cosfr Rand Developed
Boksburg 318Benoni 286Bral<pan 101Springs 328N ig e l 14
Undeveloped Total Percentagedeveloped
41 359 896 292 98
- 101 100220 548 6029 43 33
By 1954 Brakpan hod fu lly developed \H 101 morgen o f land (figure 4 ,19) but had on ly
21 industria l establishments. It was therefore o f re la tive ly l i t t le importance to the East Rand,
em ploying a to ta l o f 3966 workers, but was highly dependent upon the metal and engineering
industry.
Springs was already becoming an important industrial centre during the m id -fiftie s as
i t had 5 ,2% o f the Rand's industrial workers and i f had 220 morgen o f land availab le for industrial
expansion (NRDC 168094, 1957/8). There was not the same high dependence upon metal and
engineering industries as was the case in Benoni and Bratqsan, O n ly 45% o f a ll workers were
engaged in th is industry in Springs. The establishments also fended to be smaller than those in the
previous two towns.
A ll the Far East Rand towns are o f lesser importance in size and employment than the
Central Rand (figu re 4 .1 4 ). Benoni remains the most important o f these towns, w ith 71 establish
ments employing 8,301 persons or an average o f 116.9 persons per establishment. I f should be
noted (figure 4 .1 9 ) that Boksburg, although i t has on ly 50 establishments i t employs »n average
o f 148.3 persons per establishment* I t can therefore be concluded that both Benoni and
Brakpan were dependent upon large metal and machinery producing firms to an even greater
ex ten t than Germiston. This again fo llows the trend o f the earlie r part o f the decade. Brakpan
and Springs both employed considerably fewer persons per establishment than the other two
towns. O f the Far East Rand i t may be said therefore that i t has tended to specialise in
heavier Industry than Johannesburg or the West Rand, but has not developed a dependencyupon the metal industry as Vereeriiging and Vanderbijlpark,

6 .4 The Wesf Rond (Region 42).
The fifH es saw no concentrated development o f industry on the West Rand. The Roodepoort-
Moroisburg area employed on ly s ligh tly fewer workers than Boksburg having o n ly 2.7% o f theRahdN
to ta l. Again the metal and engineering industry employed the m ajority o f workers i .e . 45.67%
(NDRC 168094, 1957/8). Krugersdorp had only 2.2% o f the Rand's industria l workers, but lik e
Boksburg, Brakpan and Randfontein, i t was one o f the four Witwatersrand districts most dependent
upon the metal and engineering industries, w ith 64.7% o f its employees engaged in this sector.
Roodepoort and Krugersdorp used on ly 41%and 29% respectively o f the ir ava ilab le industrial land.
The industrial development fo llowed an east-west tine from Randfontein to brings: (figpra
1 .8 ) w ith Johannesburg as the largest and most sought a fte r area for industria l sites In generai^ bu t
w ith Oermiston and the East Rand forming important metal and engineering ce n tre s ,/ The preference
o f the East Rand has been ascribed to its better ra il links w ith the ports and w ith the sources o f Iron
and steel in Pretoria and Vereeniging.
By the end o f the decade the West Rand had remained re la tive ly underdeveloped ahd
o f less importance to the metal and machinery industry than any rregiorr in 'the P,W, V ,,
having a tota l o f 68 establishments employing 3*762 people or an average o f on ly 55 ,3 persons
per firm .
6 .5 Pretoria and Vereeniging (Regions 43 and 44)
These two areas are basic metal producing regions peripheral to the Witwatersrond and
have been covered in some de to il previously. Because o f the dominating ihportonce o f the S>oor
works, Usco and Vecor-concems which are closely related - these two regions have be# combined
in this instance.
At this time Pretoria and Vereeniging formed peripheral centres engoged ln tho prodwctlon
of iron and steel. Pretoria had a total of 47,394 industrial employees of which 22,441 * engaged by 138 metal and engineering establishments (figure 4.2 and 4 .15), In Vereeniging 13# 1 #
workers or 57% of the total number were engaged by 138 metal and engineering establishments (figure4 ,1 5 ). The Importance o f these two centres does not become immediately apparent from this.
I t was because o f the dominance o f the metal and engineering industry in these centres tha t they
were important to the Witwatersrand. Heavy engineering in the Vereeniging/Vanderbi j I park
area and the production o f iron and steel by Iscor allowed smaller engineering works to
establish themselves, but the prime market for both these centres remainsin the Witwatersrand.
Figures published by the NRDC and the Bureau of Statistics do not correlate w ith
those published under the new classification o f the Industrial Census. However they do
a llow comparison o f areas w ith in the fiftie s decade.
S im ilar developments can be discerned in both sets of figures. These inconsistencies
can be a ttribu ted to the new methods of the classification of industry after 1950. This also
means that comparison w ith figures re lating to the decade of the sixties is not always possible,
provid ing that such figures are ava ilab le ,
In conclusion i t may be noted that the population of the far East Rand and the
Vcreenig ing area decreased during the 1950's decade and both these areas tended to
specialise in heavier metal and engineering works. The development o f the Kemp ton
Parliy/Germ iilton/Alberton areas became marked. There was also a growing interdependence
between these areas and Johannesburg. Planned development began to manifest itse lf
in the establishment o f non-European townships and industrial areas. The importance
of the Central Rand as a market for the lig h t metal industry Is apparent from the pre
dominance o f smaller establishments in this area, especially In Johannesburg where
the average number o f people employed per establishment (45.34) was the lowest in
the whole o f the P -W -V . The tendency towards specialisation in heavy industry in
Pretoria was not nearly as marked as in the Vereeniging - Vanderbljlpark region.
In fa c t establishments in Boksburg employed on the average more people per
establishment than those in Pretoria.
Johannesburg's population increased by 237,000* during the decade arid the ratio of
White to Non-white fel l from I ; 1.52 to t s 1.82. . While the population for the whole of
the Witwatevsrand increased by 439,596 and the ratio of White to Non-white from
1 ; l,6 8 to 1 :L 9 5 .* *
Figures after the offic ia l census - a discrepancy exists between these figures dniithpse
** Figures from the Department for Planning City Engineer's Department. Johannesburg
C ity Council,
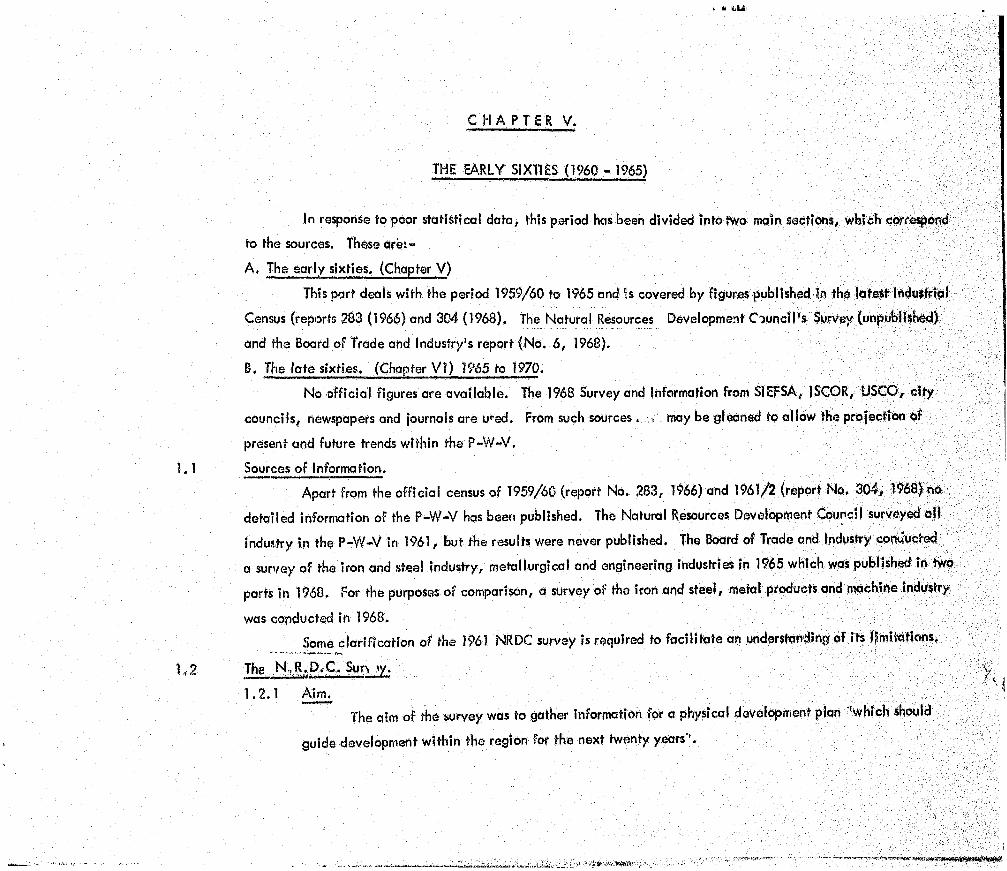
u M I L U l
C HA PTE R V.
THE EARLY SIXTIES (I960 - 1965)
In response to poor statistica l data, this period has been divided in to tW main sections, which
to the sources. These a re :-
A . The early sixties. (Chapter V )
This part deals w ith the period 1959/60 to 1965 and Is covered by figures published In the latest Industrial
Census (reports 283 (1966) and 304 (1968). The Natural Resources Development C ouncil’ s Survey (unpublished)
1 . 1
1,2
and the Board o f Trade and Industry's report (N o. 6 , 1968).
B. The la te sixties. (Chapter V I ) 1965 to 1970.
No o ffic ia l figures are ava ilab le . The 1968 Survey and Information from SIEF5A, ISGOR, USCO, c ity
councils, newspapers and journals are ured. From such sources , s . may be gleaned to a llow the projection of
present and future trends w ith in the P -W -V .
Sources o f Information.
Apart from the o ff ic ia l census o f 1959/60 (report No. 283, 1966) and 1961/2 (report Mo. 304, 1968) ttd
deta iled information o f the P -W -V has been published. The Natural Resources Development Council surveyed a ll
industry in the P -W -V in 1961, but the results were never published. The Board of Trade and Industry conducted
a survey o f the iron and steel industry, m etallurgical and engineering industries in 1965 which was published in two
parts in 1968. For the purposes o f comparison, a survey o f the iron and steel, metal products and machine industry
was conducted in 1968.
Some c la rifica tio n o f the 1961 NR DC survey is required to fa c ilita te an understanding p f its IlhuW ions, /
The N .R .D .C . Sun, vy. _ -V '
1.2.1 AirmThe aim o f the survey was to gather information for a physical development plan ’w hich should
guide development w ith in the region for the next twenty years'V

The Director of the Deportment of Planning, Professor C. J. V iljoen, stated in &e e^alanafory noto cn
the questionnaire that "due to the ropld growth of towns and cities, land for residential, industrial, recreational
and other purposes must be reserved many years in advance of urbanisation. With the doting dF the gold mines.
Industries would be of vital importance in the present and future development of the region. The structure of the
existing industrial complex must be studied in detail in order to make preparations for the future 4.
The questionnaire received a 40.'48 per cent return. In metallurgical and engineering industries a
response of 52,2 per cent was noted which meant that of the three industrial groups (IS , 16 and 17 * ) 593 out of 1,136
answered (report No, 304,1966) Johannesburg and the East Rand gave the best response (figure 5,1).
m m .
'jI EFigure 5,1
Titie; Comparison of the 1961 NDRC returns and the 1961/2 Industrial Census,
Source: Report No, 304, 1968 and Department of Planning.
Economic Region
40. Johannesburg41. East Rand42. W e* Rond43. Pretoria44. V ' aeniging TOTAL:
' ■
Base Meta! (group 15) NDRC 1961/2
Metal Products (group 16) NDRC 1961/2
Machinery (group 17) NDRC 1961/2
19 31 23 43
1 8 3 8 6 U
202119253619
40521530642C
69 16952 91 4 14 4 154__— &
B H o ? l o r 740 137 $$5
. -V.
1,2.2 Areas. - ^The p-W-V was divided into six rm|or areas corresponding apptaximately to the economic regiops Of
the Industrial Census. Each motor region was then broken down into a number of smaller areas (figure 5,2 and
4.5). The malar regions follow #*v* magisterial district boundaries and as with the W usMol Census some
magisterial districts have been consolidated. To compare this survey with the Industrial Census1 economic
regions necessitates minor adjustments.A. Area 40 of the Industrial Census conforms to the magisterial district of Johannesburg (figured,5),
but would exclude area 37 and port of area 36 from the NRDC's central region which ho, verylittle industry (figure 5.2). A comparison of figure 5.2 with figure 5,15 shows this as land lying
:
u (^ 4
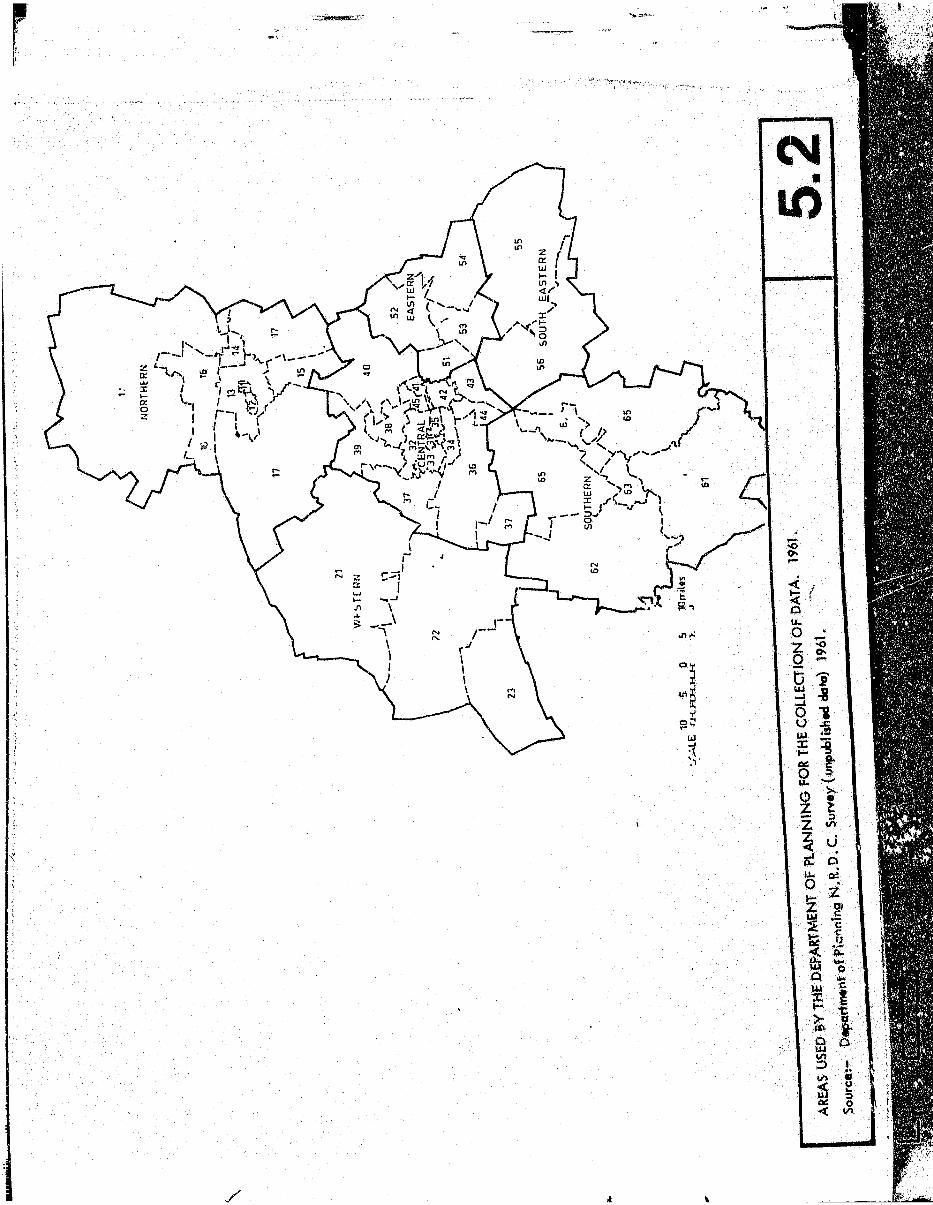
NORTHERN

south of the industrial areas. On the eastern side the boundary between area 40 and 41 is coincidental
with the boundary between the 30's and the 40'$ which means that the West Rend includes Of# 37 with
areas 21, 22 and 23, while the East Rand comprises, numbers 40 to 45 and 51 to 54, leaving the central
area with 31 to 39 excluding 37, In this way a regional comparison can be made with the areas of the
Industrial census.
B, The southern region of the NR DCs delimitation approximates to economic region 44 of the industrial
Census except in the case of area 61 ~ which Is Sasolburg's magisterial district. There were no returns
from any o f the relevant industrial groups in this region - so area 61 is ignored for comparative p poses.
C, The south-eastern area is included because it forms part of the P-W-Valthough no equivalent }| found
in the Industrial census. Returns from this region were small.
So the NR DCs regions can be reduced to six areas (fig. 5.3) which compare with the industrial
census'area for which figures are available. These areas were also used for the above J968 survey.
Because of the detailed information available on a geographical basis, the NR DC survey's
data has been mapped. It is therefore comparable to the Industrial Census of the same year (1961) and
the 1968 survey.
1,3 The Industrial Census. wThe Industrial Census information is collected every year from a ll industrial establishments but is published
erratically and in various forms, However it is the most extensive do to available and can be used to determine growth
rates.
Characteristics of the P-W-V.
2,1 Growth.Despite the economic set bock o f the 1960/61 period when reserves of gold and foreign exchange fe ll from
R3T2 m illion to R153 m illion 0 ,H . Houghton W ) much development occurred in the iron and Steel and engineering
industries of the P-WrV. The actual number of establishments in the base metal (group 15) metal products (group 16)and machinery industry (group 17) increased steadily (fig . 5 .4 ) .
* 15, Base metal industry
16. M e ta l Products industry
17. Machine industry
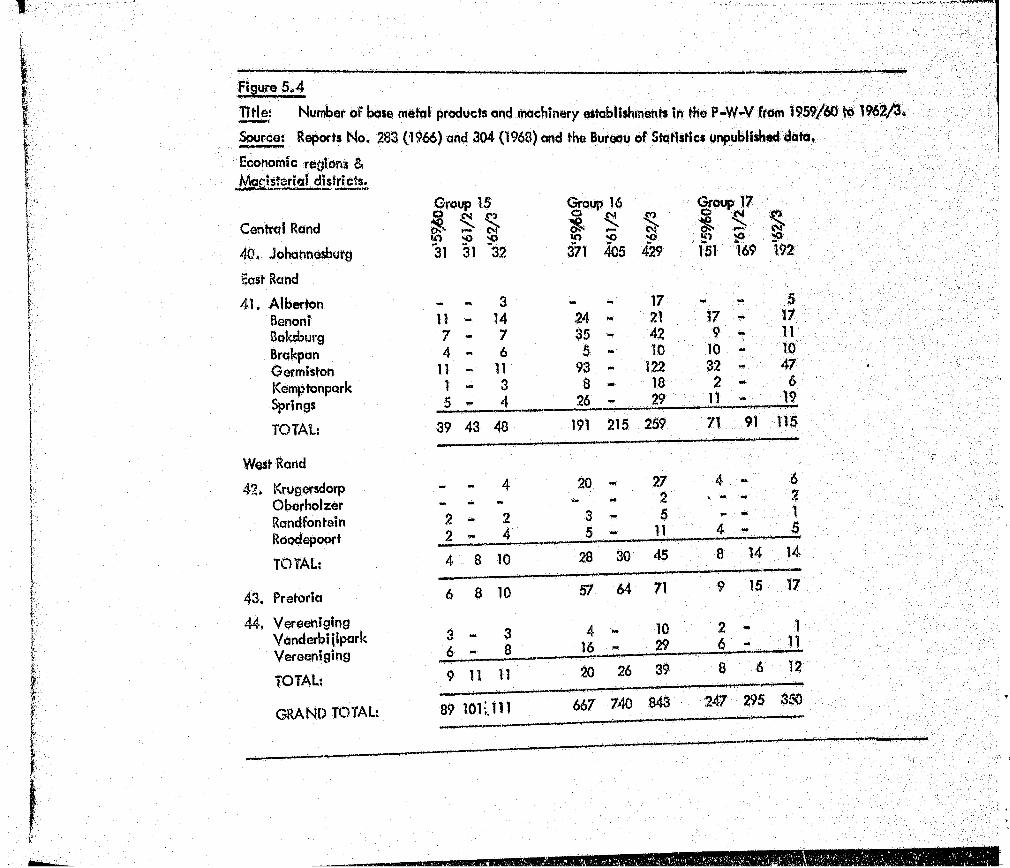
Figure 5*4
Title:
Source: Reports No. 283 (1966) and 304 (1968) and the Bureau of Statistics unpublished data.
Economic regions &Magisterial districts.
Central Rand
40. Johannesburg
East Rand
41. AlbertonBenoniBoksburgBrakpanGermistonKemptonparkSprings
TOTAL:
West Rand
42. Krugersdorp Oberholzer Randfontein Rbodepoort
TOTAL:
43. Pretoria
44. Vereeniglng Vanderbijipark Vereeniging
TOTAL:
GRAND TOTAL:
Group 15
I(O 'O o
31 31 '32
Group 16
371 405 429 151 169 192I
Group 12I | 1in -a
3 17 *» . 511 14 24 w 21 17 - 177 - 7 35 « 42 9 114 . * 6 5 - 10 10 - 10
11 11 93 122 32 471 MS 3 8 18 2 - 65 w 4 26 29 11 19
39 43 48 191 215 259 71 91 115
4 20 27 4 6- 2 - 2
9 2 3 5 1
? w 4 5 - 11 4 • * b
4 8 10 28 30 45 8 14 14
6 8 10 57 64 71 9 15 17
3 3 4 „ 10 2 1
A 8 16 ■ "• 29 6 “• • 11
9 11 11 20 26 39 8 6 12
89 lO l i l l l 667 740 843 247 295 350

1
s i sUJ 1— «—
1959 oO1962 ‘‘63 1961 6̂2

l i / . '
I .
1#
■ 5 -
fi
w
600
«o
400Z
! 'n.
I
200 -
£ £ §
I I I
%s
0gz5
l
1
@3 #
i iu.
B
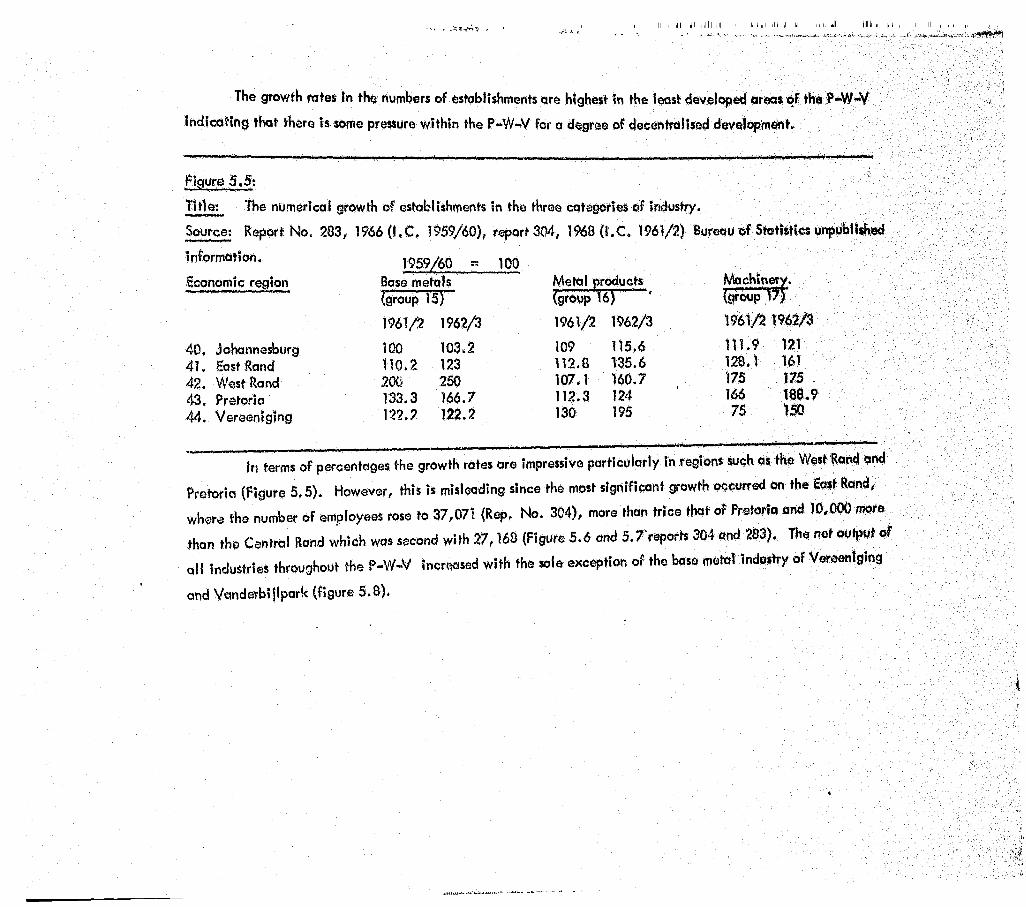
The growth rotes in the numbers of establishments ore highest in the least developed areas of the P-W-V
indicating that there is some pressure within the P-W-V for a degree of decentralised development.
figure 5.5: .
Title; The numerical growth of establishments in the three categories of industry,
Source; Report No. 283, 1966 (I.C . 1959/60), report 304, 1968 (i.C , 1961/2) Bureau of Statistics unpublished
information.
Economic region1959/60 = 100
Base metals (group 15)
Metal products (group Vdj
Machinery, (group 17)
1961/2 1962/3 1961/2 1962/3 1961/2 1962/3
40. Johannesburg41. East Rand42. West Rand43. Pretoria44. Vereenlging
100 103.2110.2 123 200 250133.3 166.7 122,7 122.2
109 115.6112.8 135.6 107.1 160,7 112.3 124 130 195
111.9 121 128,1 161 175 175 166 188.5 75 150
In terms of percentages the growth rates are impressive particularly In regions such as the West Rand and
Pretoria (Figure 5.5). However, this is misleading since the most significant growth occurred on the East Rand,
where the number of employees rose to 37,071 (Rep, No. 304), more than trice that of Pretoria and 10,000 more
than the Central Rand which was second with 27,168 (Figure 5.6 and 5.7'reporh 304 and 283). The net output ofa ll industries throughout the P-W-V increased with the sole exception of the base metal mdostry of Veteeniging
and Yanderbi jlpark (figure 5.8).
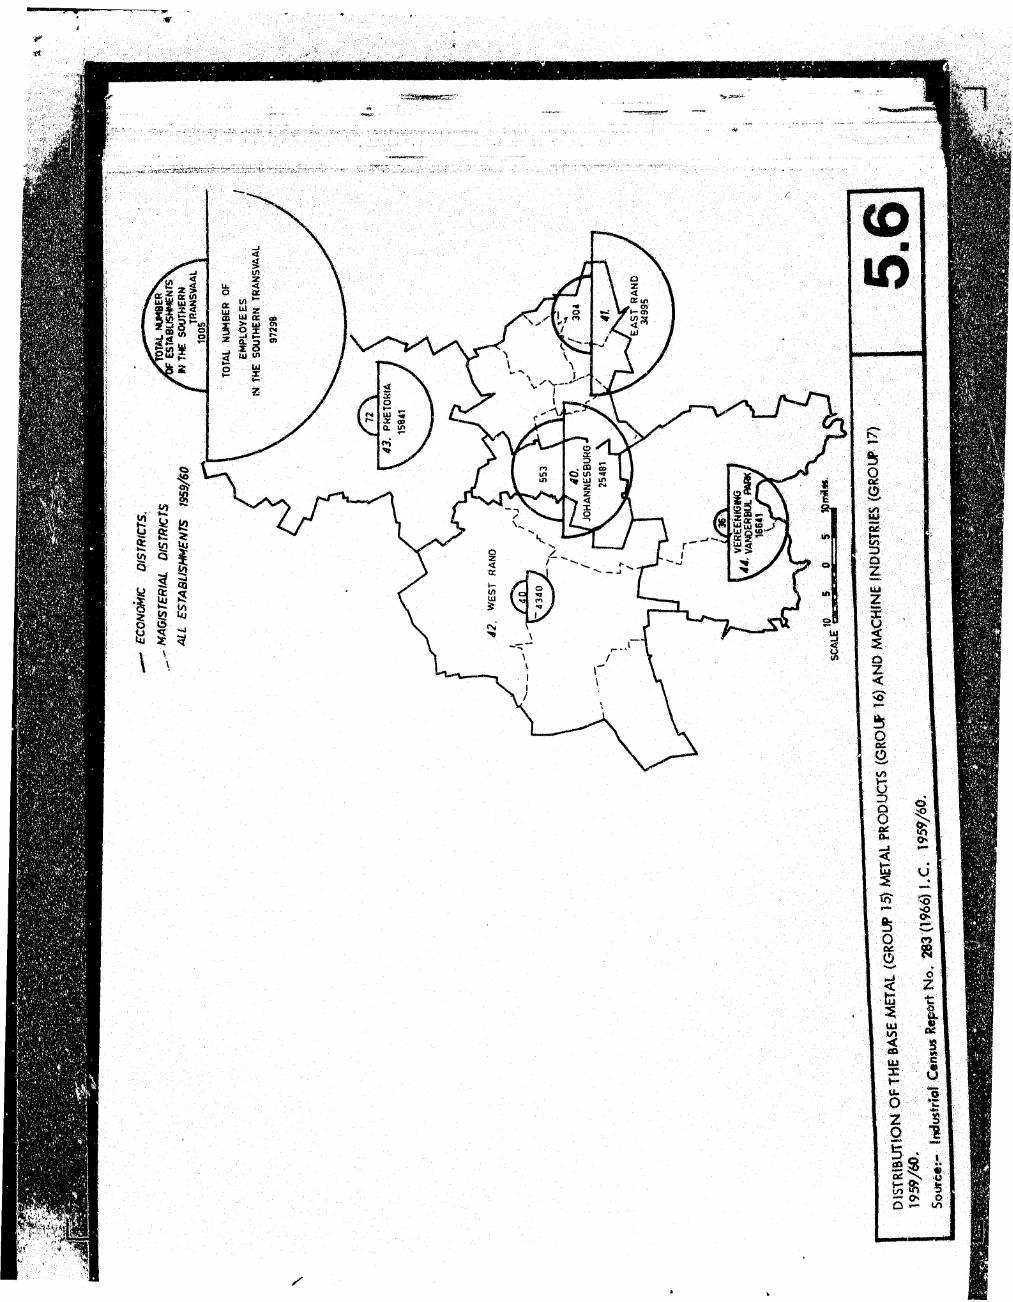
w
-AW
0 1
2
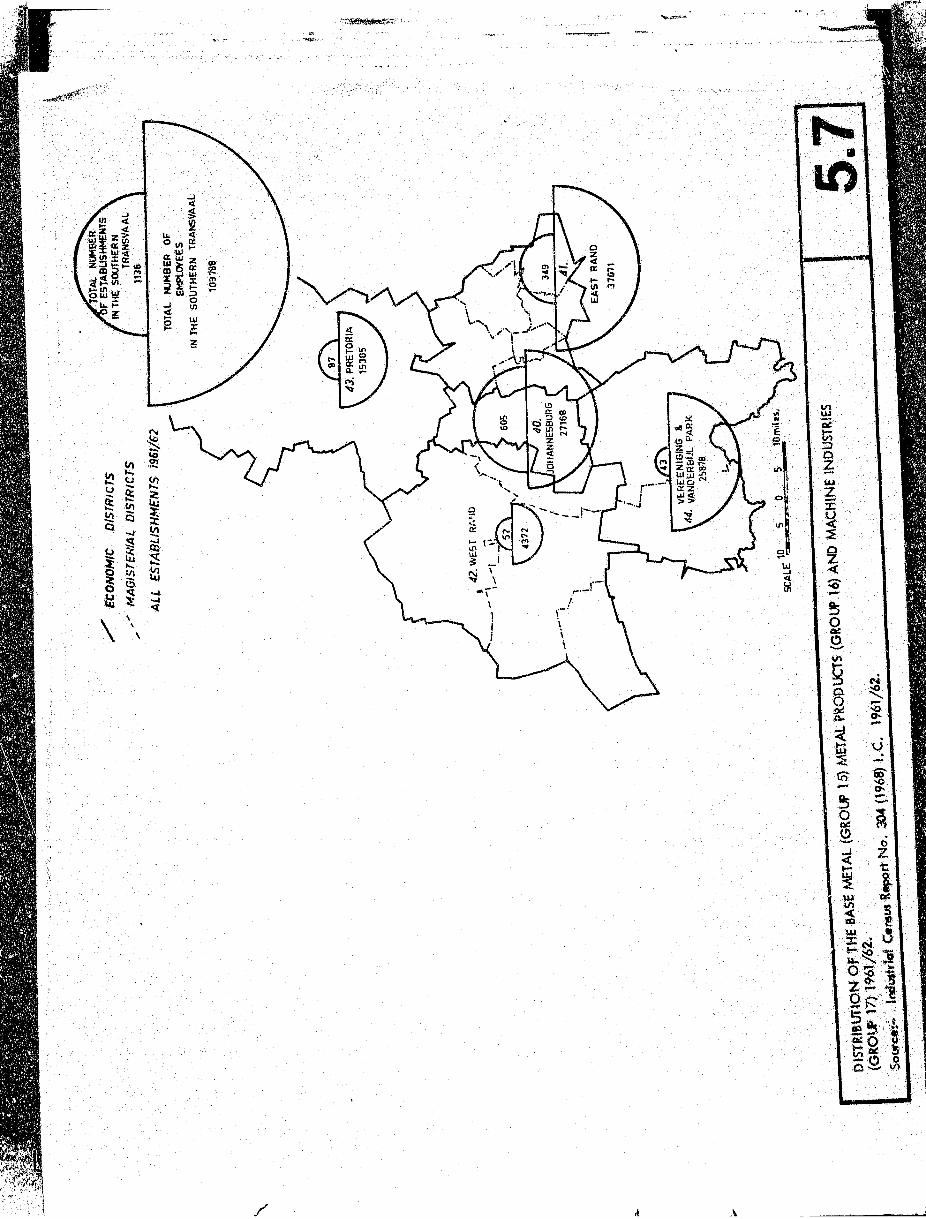
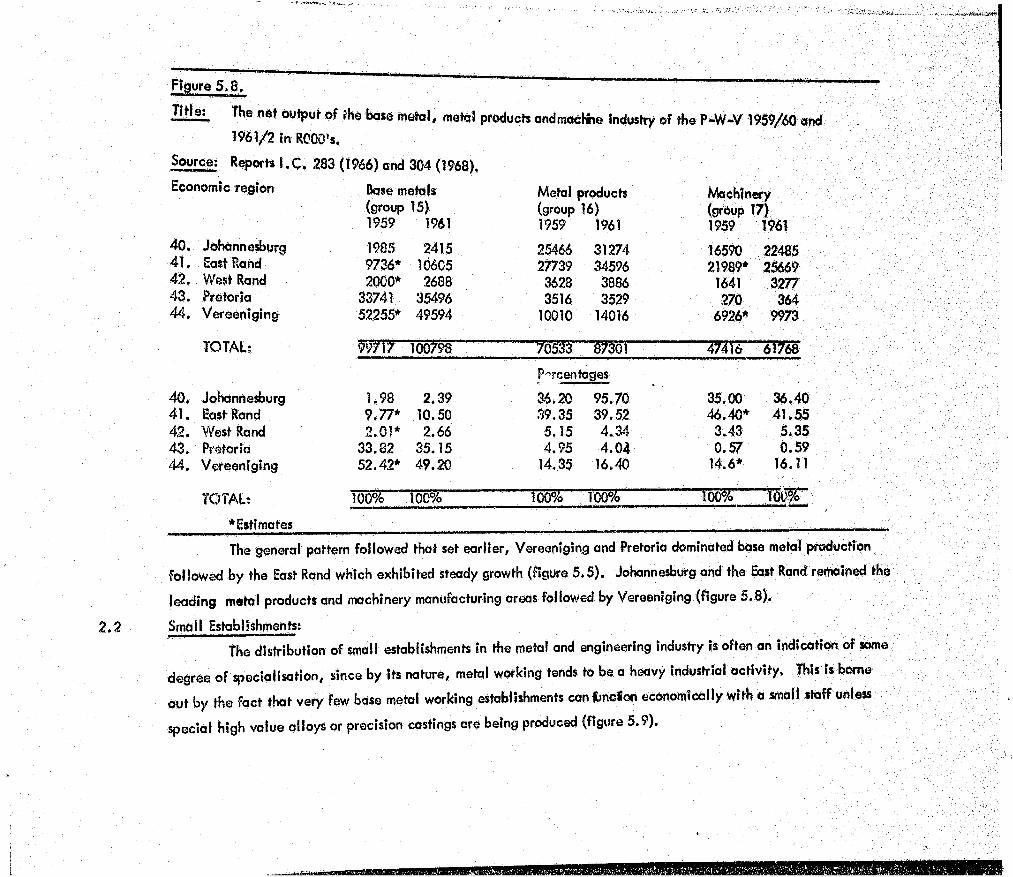
TMi The net output of the base metal, metal products andmacNhe industry of the R-W-V 1959/60 and 1961/2 in ROOO's.
Source: Reports I.C . 283 (1966) and 304 (1968),
Economic region Base metals(group 15)1959 1961
Metal products (group 16)1959 1961
Machinery (group 17) 1959 1961
40.41.42.43.44.
Johannesburg East Rahd West Rand Pretoria Vereeniging
19859736*2000*
3374152255*
2415106052688
3549649594
254662773936283516
10010
312743459638863529
14016
1659021989*
1641270
6926*
2248525669
3277364
9973
TOTAL: 99/T7™ 100798 70533 87301 47416 61768
Percentages
40, Johannesburg 1,98 2.39 36.20 95.70 35.00 36,4041. East Rand 9.77* 10.50 39.35 39.52 46.40* 41,5542. West Rand 2.01* 2.66 5.15 4.34 3.43 5,3543, Pretoria 33.82 35.15 4.95 4,04 0.57 0.5944. Vereeniging 52.42* 49.20 14.35 16.40 14,6* 16.11
TOTAL: 100% 100% 100% 100% 100%
* Estimates
The general pattern followed that set earlier, Vereeniging and Pretoria dominated base metal production
followed by the East Rond which exhibited steady growth (figure 5,5), Johannesburg and the East Rtind remained the
leading metal products and machinery manufacturing areas followed by Vereeniging (figure 5.8).
Small Establishments:The distribution of small establishments in the metal and engineering industry is often an indication of some
degree of specialisation, since by its nature, metal working tends to be a heavy industrial activity. This Is bcrne
out by the fact that very few base metal working establishments canfcnciari economically With a small staff unlessspecial high value alloys or precision castings are being produced (figure 5.9).
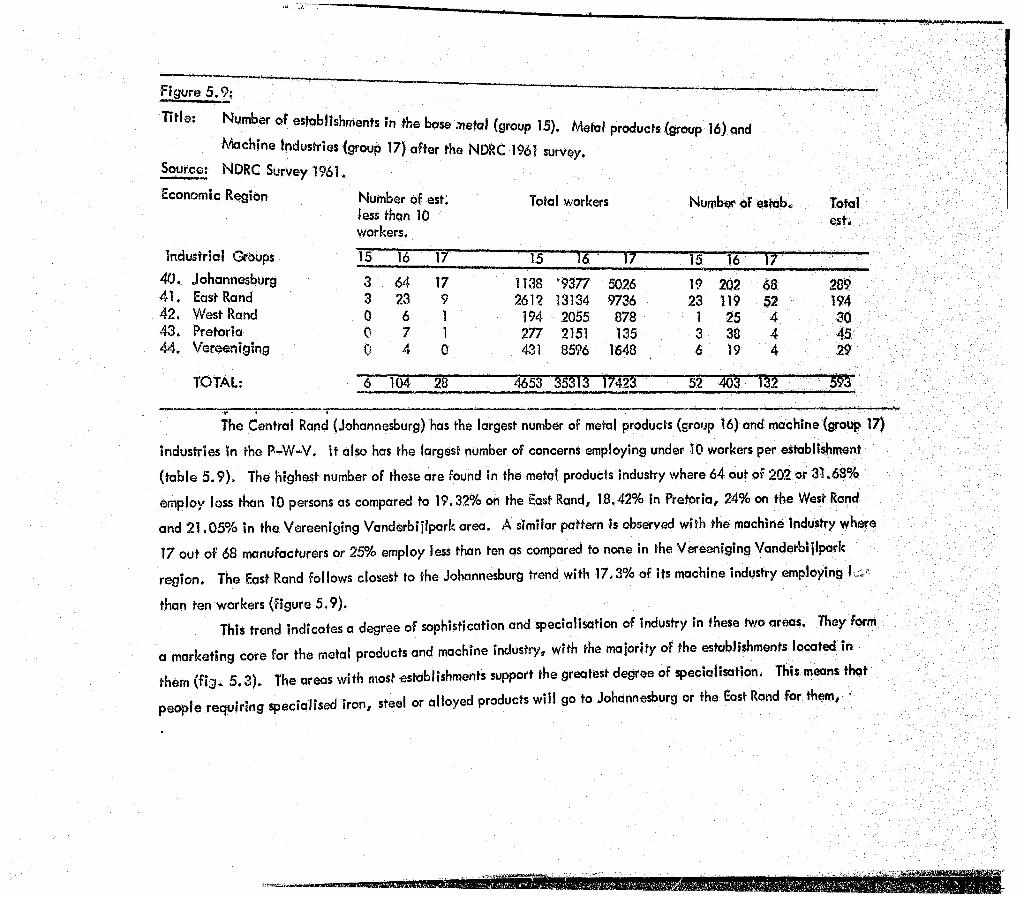
Figure 5.9: " 1 ! 1 !“
TiHe: Number of establishments in the base metal (group 15). Metal products (group 16) and
Machine Industries (group 17) after the NDRC 1961 survey.Source: NDRC Survey 1961.
Economic Region Number of est; Total workers Number of estab. Totalless than 10 workers.
industrial Groups 15 16 17 15 )6' ' 17 " .......... 15 16 I f40. Johannesburg 3 64 17 1138 9377 5026 19 202 68 28941. East Rand 3 23 9 2612 13134 9736 23 119 52 19442. West Rand 0 6 1 194 2055 878 1 25 4 3043. Pretoria 0 7 1 277 2151 135 3 38 4 4544. Vereeniging 0 4 0 431 8596 1648 6 19 4 29
TOTAL: 6 104 28 4653 33513 1/423 .. 52 403 132 393"
The Central Rand (Johannesburg) has the largest number of metal products (group 16) and machine (group 17)
industries in the P-W-V. It also has the largest number of concerns employing under 10 workers per establishment
(table 5.9), The highest number of these are found in the metal products industry where 64 out of 202 or 31.60%
employ less than 10 persons as compared to 19.32% on the East Rand, 18,42% in Pretoria, 24% on the West Rond
and 21.05% in the Vereeniging Vanderbiiipark area. A similar pattern is observed with the machine industry where
17 out of 68 manufacturers or 25% employ less than ten as compared to none in the Vereeniging Vanderbiiipark
region. The East Rand follows closest to the Johannesburg trend with 17,3% of its machine industry employing W
than ten workers (Figure 5,9).This trend indicates a degree of sophistication and specialisation of industry in these two areas. They form
a marketing core for the metal products and machine Industry, with the majority of the establishments located in
them ( fig . 5.3). The areas with most establishments support the greatest degree of specialisation, This means that
people requiring specialised iron, steel or alloyed products will go to Johannesburg or the East Rond for them,

and this W ill hamper the development of competition in other areas of the P-W-V. This pattern is also
indicative of the strength of the market in the location of small industry and the trend towards the
centralisation of these industries. The importance of the market in the location of the industry has been
stressed by modern economists., . . . . . . " Many students of the subject consider the attractions of the
market to be so great that they regard the market location now as the 'norm' for modern industry.
Locations other than market locations would than need to be explained by cost of moving the product
to its consumer. ‘ (Estoll & Buchanan 1966).
The market area w ill differ for each concern depending upon competition^ transportation,
salesmanship and qualify of product, but the best market w ill be where the concentration of potential
sales is the highest per unit area i.e . where the most intensive industrial and commercial development is
In the P-W-V this is in the Central and the East Rand.
Reasons for location o f industry.The industrialist alw ays in s id e rs the market when loeatmgrony concern
Other considerations w ill depend upon the of manufoctiirlng to be done. In the cose of the hose
metal industry, the market is most important followed by neomess to raw materials; the metal producls
industry listed the market followed by availability of skilled labour. The machine Industry lis t, availab-
ility o f skilled labour as a prime reason for locution, followed by proximity to market (figure 5.10).
Figure 5.10:Title: Principle reasons for factory location.
Source: NRDC Survey 1961. n Base metal
1. Close to main road2. Close to ra il l in k3. A va ilab ility of skilled labour4. A v a ila b il i ty o f unskilled labour5. Nearness to raw materials6. Nearness to market _ „7. Nearness to similar industries8. Suitable site available9. Suitable, buildings available
TOTAL: ~
2
Metal product?) Machine(group fS T (group 17)
27 536 1469 4130 243 7
101 2711 739 722 3
407 '44
Author Drake M F Name of thesis The iron and steel, metal and engineering industry in the Pretoria-Witwatersrand-Vereeniging region 1971
PUBLISHER: University of the Witwatersrand, Johannesburg
©2013
LEGAL NOTICES:
Copyright Notice: All materials on the Un i ve r s i t y o f the Wi twa te r s rand , Johannesbu rg L ib ra ry website are protected by South African copyright law and may not be distributed, transmitted, displayed, or otherwise published in any format, without the prior written permission of the copyright owner.
Disclaimer and Terms of Use: Provided that you maintain all copyright and other notices contained therein, you may download material (one machine readable copy and one print copy per page) for your personal and/or educational non-commercial use only.
The University of the Witwatersrand, Johannesburg, is not responsible for any errors or omissions and excludes any and all liability for any errors in or omissions from the information on the Library website.
Related Documents