The Value of Design In Real Estate Asset Pricing Helena H Rong* a,1,* , Juncheng Yang a , Minkoo Kang a , Andrea Chegut a a Massachusetts Institute of Technology Real Estate Innovation Lab, 77 Massachusetts Avenue, Cambridge MA 02139 Abstract Architects require evidence to justify design interventions of function and form within the financial ecosys- tem. Some buildings that become real estate assets are valued using models that consider abstract proxies for understanding value, but these features may misidentify differentiation design brings. We investigate the transaction price performance of formal features - curvature, setbacks, podiums and diagonals. Whilst controlling for drivers that are known to explain the price variation, we find that curvature and podiums have a positive pricing differential of 15.9 and 14.6 percent more than the control buildings, respectively. Buildings with setbacks have a negative pricing differential of 13.6 percent. Results suggest there is a signifi- cant economic impact of some design interventions that differentiate buildings and requires further research. Keywords: Architectural Design, Design Precedents, Evaluation, Aesthetics, Asset Pricing JEL codes: R33, R39, 033 * Corresponding author Email address: [email protected] (Helena H Rong*) URL: http://realestateinnovationlab.mit.edu/ (Helena H Rong*), +1 607 372 7588 (Helena H Rong*) Preprint submitted to Building and Environment May 4, 2020

Welcome message from author
This document is posted to help you gain knowledge. Please leave a comment to let me know what you think about it! Share it to your friends and learn new things together.
Transcript

The Value of Design In Real Estate Asset Pricing
Helena H Rong*a,1,∗, Juncheng Yanga, Minkoo Kanga, Andrea Cheguta
aMassachusetts Institute of Technology Real Estate Innovation Lab, 77 Massachusetts Avenue, Cambridge MA 02139
Abstract
Architects require evidence to justify design interventions of function and form within the financial ecosys-
tem. Some buildings that become real estate assets are valued using models that consider abstract proxies
for understanding value, but these features may misidentify differentiation design brings. We investigate
the transaction price performance of formal features - curvature, setbacks, podiums and diagonals. Whilst
controlling for drivers that are known to explain the price variation, we find that curvature and podiums
have a positive pricing differential of 15.9 and 14.6 percent more than the control buildings, respectively.
Buildings with setbacks have a negative pricing differential of 13.6 percent. Results suggest there is a signifi-
cant economic impact of some design interventions that differentiate buildings and requires further research.
Keywords: Architectural Design, Design Precedents, Evaluation, Aesthetics, Asset Pricing
JEL codes: R33, R39, 033
∗Corresponding authorEmail address: [email protected] (Helena H Rong*)URL: http://realestateinnovationlab.mit.edu/ (Helena H Rong*), +1 607 372 7588 (Helena H Rong*)
Preprint submitted to Building and Environment May 4, 2020

Highlights
• 826 buildings with architectural design features identified and computed in New York City.
• 3,095 building financial records paired with design features to measure the value of design.
• A review of how design features are valued already by building users and markets
• A review of how architectural design has been measured financially
• Architectural design features differentiate a building’s financial value by -13.6 percent to 15.9 percent more.
2

The Value of Design In Real Estate Asset Pricing
Abstract
Architects require evidence to justify design interventions of function and form within the financial ecosys-
tem. Some buildings that become real estate assets are valued using models that consider abstract proxies
for understanding value, but these features may misidentify differentiation design brings. We investigate
the transaction price performance of formal features - curvature, setbacks, podiums and diagonals. Whilst
controlling for drivers that are known to explain the price variation, we find that curvature and podiums
have a positive pricing differential of 15.9 and 14.6 percent more than the control buildings, respectively.
Buildings with setbacks have a negative pricing differential of 13.6 percent. Results suggest there is a signifi-
cant economic impact of some design interventions that differentiate buildings and requires further research.
Keywords
Architectural Design, Design Precedents, Evaluation, Aesthetics, Asset Pricing
3

What are the value drivers for a building? This is an important question for disciplines within the built
environment associated with the design and development of buildings, as fifty percent of our building stock
is actively traded in the real estate market. Asset valuation models have been steadily improving for the
past 50 years to consider real estate value drivers. Predominantly, they are used to understand neighborhood
and building feature value impacts. To do so the valuation literature has relied on the hedonic asset pricing
model, or some derivation, the hybrid or repeat sales approach (Chegut et al., 2013). Rosen (1974) denoted
that the model was intended as a tool to understand product differentiation or variation that led to increased
or decreased value in the marketplace. Simply, the model aims to measure the drivers of utility that users
are willing to pay for and, when using historical data and a regression, have been shown to pay for. As a
statistical tool, it is a multi-variate framework that intends to explain the drivers of a building’s price, rent,
appraisal value, cost, etc. Although the variables generally used to measure differentiated value are crude
and abstract e.g.,building size, age, number of stories, status of renovation, location and proximity to CBD
(Chegut et al., 2013), it is the basis behind appraisal analysis and asset valuation econometrics. However,
these building and neighborhood features describe only the simplest building elements and its context, which
have already been specified as guidelines prior to the design of the physical structure.
Designers, on the other hand, consider much more qualitative and tactile elements of architecture during
the design process - such as materiality, geometry, daylight, views and spatial flexibility - to cater to both
functional and aesthetic needs. Moreover, design elements, features and characteristics that differentiate
buildings are entirely dismissed and overlooked by the current financial practice of commercial real estate
valuation, either due to a previous lack of means to collect data about building features, or limited knowledge
of the design discipline. However, omitting these features from asset valuation may leave a missed opportunity
to understand the extent to which the actual building design features and program impact the property
market value and product differentiation during individual real estate transactions. Therefore, we ask, how
do design features contribute to building value?
To answer this question, we identify and catalog design features of commercial office buildings and
operationalize their geometric measurement using a 3D model of New York City. We construct metrics for
four distinct external architectural design elements that relate to transforming a building’s design. These
design features are diagonal intersections, building curvature, set-backs, and podium extrusions. All of the
above, represent design interventions that architects made to differentiate the spatial extrusion of the building
in response to regulatory standards and potentially financial constraints. We then pair these building features
with realized individual transaction prices in the Manhattan property market from Real Capital Analytics
over the 2001 to 2018 period and then compare these to buildings transacted without the four specified
design features measured in this paper.
The results of our analysis indicate that there are some design features that demonstrate product dif-
ferentiation and increased value relative to their market peers. Namely, building curvature and podium
extrusions have positive and significant pricing differential relative to their peers of 15.9 and 14.6 percent
4

more, respectively. These results suggest that there is a positive impact of architectural design features that
aesthetically and functionally enhance the building. On the other hand, setbacks have a negative pricing
differential relative to their building peers of 13.6 percent.
Understanding pricing differentials from design can help align designers and financial decision makers
around what creates a long-term value proposition. One may argue that it costs more to execute these design
strategies, and unfortunately these data are not systematically collected nor publicly available. However,
there remains evidence of a relative value proposition in differentiating the structural design features of
the building as evidenced by what building owners were historically willing to pay. In that way, there is a
precedent for paying for and justifying the value of design.
The remainder of this paper is laid out as follows. In section two, we outline the literature that looks
at the real estate valuation for commercial buildings as well as prior research on design value. In section
three, we outline the design elements we developed for this paper. We then select four external architectural
design features for further investigation. In section four, we document our dataset, descriptive statistics
and geographical characteristics. In section five, we outline our hedonic methodology. In section six, we
document our results. In section seven, we discuss what these results mean for design practice and the real
estate valuation literature.
1. Valuing Design: a Review
In general, there is limited literature that measures architectural design features rather than involvement of
awarded architects. Current research identifies market response to design awards as a measure of architectural
design quality which can have financial value. Important architectural projects as represented by awarded
designers may generate a real estate value premium (Hough & Kratz, 1983; Vandell & Lane, 1989; Millhouse,
2005; Fuerst et al., 2009; Nase et al., 2016; Kang, 2019) and may perform as a positive externality for nearby
building valuations (Ahlfeldt & Mastro, 2012). Common practice to measure architectural quality and
assess how design differentiates involves using a hedonic pricing model, and conducting surveys, interviews
and expert-led grading (Vandell & Lane, 1989; Millhouse, 2005; Rahadi et al., 2013; Nase et al., 2016).
In their seminal work, Hough and Kratz (1983) document the economic impacts of architectural design
in commercial buildings for buildings in the CBD of Chicago and focused on the designation of a building
as a landmark, and(or) award-winning status with value premiums.1 Asabere et al.,(1989) focused on
historical architecture and categorized the samples into architectural styles - colonial, federal, garrison, and
Victorian architectural styles - townhouse, duplex, condominium, and ranch housing styles in order to detect
economic impacts of architecture style on home value. Plaut and Uzulena (2005) conducted similar research
in Riga, Latvia by studying buildings from different time periods. Buitelaar and Schilder (2017) also looked
1Other attributes that they were able to be quantifiably measure, such as the radial distance of an office building from the
CBD, building age, total gross floor area, number of floors and the presence of a restaurant.
5

into architectural styles but included many specific characteristics in their hedonic price model - plot size,
construction year, dwelling type, parking type, and land lease condition, thereby controlling for design value
more closely.
Another approach has been to look at awarded designers. Cheshire and Derick (2014) and Fuerst,
McAllister, and Murray (2009) focused on architectural projects by the Pritzker Prize and/or AIA Gold
Medal winning architects in the USA. Both papers found evidence of correlation between buildings by
award-winning architects and their economic value but, the research did not scrutinize the impacts of other
aspects of architectural design and attributed the additional economic value to the reputation of famous
architects. So-called ”Good” architecture, be it an award-winning project, a project designed by a famous
architect, or a building with high ratings from experts, may bring significant value premiums (Hough &
Kratz, 1983; Vandell & Lane, 1989; Millhouse, 2005; Fuerst et al., 2009; Nase et al., 2016; Kang, 2019).
Few researchers have attempted to identify the term ”design,” with one exception, Lindenthal (2017)
who documents a hedonic pricing relationship between design form homogeneity for residential houses in
Rotterdam, the Netherlands, where heterogenous or differentiating housing forms earned a discount. People’s
interpretation of design works are likely to involve the communicative intentions embedded in those designs
(Crilly et al., 2008). Different combinations of individual design attributes are likely to shape viewers’
perception of design style (Chan, 2000) or recognition of the overall image (Ranscombe et al., 2012). To
further understand the value of design, thus, requires research to identify and quantify design attributes for
in-depth valuation. Architectural form is an important place to start.
2. Identifying Design Features
Nascent research in this field took ”design” as an explicit subject of the architect, mainly his(her) prowess or
measured accomplishments, without looking into the underlying features of design. Early work in this domain
is provided by Ching (1979) who deconstructs architectural design into compositional features through
an analysis of form, space, and spatial order.“As an art, architecture is more than satisfying the purely
functional requirements of a building program. Fundamentally, the physical manifestations of architecture
accommodate human activity. However, the arrangement and ordering of forms and spaces also determine
how architecture might promote endeavors, elicit responses, and communicate meaning (Ching, 1979).” While
examining and illustrating abstract concepts of design, such as point, line, and plane, Ching devoted extensive
effort into categorizing formal elements - surface, primary solids, and openings with planes - or elements that
may shape directly a building’s form - linear organization, structural proportion, and configuration of the
path, just to name a few. Similarly, Ching (1995) focuses on providing extensive illustrations of key terms
used in architectural practice.
This line of research is also explored by Koolhaas et al. (2014) where architecture fundamentals are
dissected into fifteen primary components, such as wall, floor, ceiling, corridor, and facade, just to name a
few. Bille and Sorensen (2016) focused more on the conceptual, atmospheric aspects of design. These studies
6

understood architecture as integration of tangible and intangible elements that are related to materiality
and historical meanings.
One way we have advanced across domains is in computation. In the valuation practice in real estate,
methodologies currently used to observe and evaluate the built environment are based on the data available
from transaction prospectus or rent contracts, which presents only a minuscule fraction of the large data sets
and features we are equipped to gather. In contrast, we identify and construct a new set of data on design
metrics to provide reference and guidelines for both designers and developers for some external architectural
design elements.
Considering both the internal and external design features that are outlined by Ching (1995) and Koolhaas
et al. (2014) there are extensive design features that can be potentially measured inside and outside of the
building. Internal design metrics require comprehensive floor-plans and sections details of each building
which are currently scattered across individual architecture firms, inconsistently collected by the planning
authority and unavailable to collect for many properties.2
We focused on individual features of external building form. The selected design metrics may produce
noticeable changes on the exterior of buildings, hence significantly shaping the overall building design and
differentiation of the structure relative to its peers. The four metrics are diagonal intersections, curvature,
setbacks and podium extrusions. They are detailed further in Figure 1. First, the sites of buildings that sit
on diagonal road intersections usually have a unique geometry, which would require architectural designers
to come up with alternative design solutions involving use of non-90-degree angles.3 Second, we see curvature
as a design feature which might make the buildings more iconic than buildings without significant exterior
features. In addition, the presence of curvature may also reflect the developer and designer’s effort to create
a leading real estate product in the market, creating iconicity at the cost of higher construction price. The
third feature is the setback feature. The city’s 1916 Zoning Resolution forced buildings to push back from the
street above a certain height to ensure the access of light and air from the street level. As a result, designers
had to design a terrace-like form for the upper portion of many buildings, hence creating a geometry that
is different from other buildings. This has led to the later development of the podium, which as a design
feature was meant to meet strict zoning requirements, while embracing alternative mixed-use commercial
space for retail needs on the bottom floor.
2However, it is important to consider in the design catalogue as commercially available reality capture technology can help
document the details of every physical space in a building.3Although the Flatiron building is famous for dealing with land constraints, it is actually not a unique building in Manhattan.
There are 167 buildings that respond to diagonal intersections with non-rectangular forms.
7

Figure 1: External Architectural Design Features
Notes: Figure 1 documents the descriptive elements of four external design features, diagonal intersection, curvature, setbacks and
podium extrusions and some design examples.
8

2.1. Diagonal Intersection
The Commissioners Plan of 1811 imposed a rigid gridiron plan on the island of Manhattan, whose proponents
saw as “legible, accessible, efficient, traditional, and perhaps, even egalitarian” (Grant, 2001).Since “straight-
sided and right-angled houses were the least expensive to build and most convenient to live in” according
to the city commissioners, grids were intended to maximize the value of real estate and make the division
of land into saleable lots more easily (Goldberger, 2001). The grid laid out 155 east-west streets and twelve
north-south avenues, halting at 155th street due to challenging ground conditions. Two elements stood out
as exceptions to the rule: Central Park and Broadway were foreign elements that disrupted the regularity
of the grid and confused traffic.4 However, the legacy of this tension is production of a major public open
space approximately every ten blocks. Whenever Broadway crosses an Avenue, it creates a large six-way
“bowtie” intersection, generously providing room for public space such as parks or seating areas around the
buildings, thereby enhancing safety, pedestrian traffic and liveliness. 5
2.2. Curvature
In general, the way curvilinearity affects human perception has been studied widely across scales in the built
environment: from products’ graphics and container designs (Westerman et al., 2012), to cars (Leder &
Carbon, 2005), to architectural interiors (Vartanian et al., 2013). Scholars have long studied the relationship
between curvilinearity and form, from the perspective of psychology, philosophy, evolution and aesthetics
(Hogarth, 1753; Spencer, 1873; Allen, 1877; Santayana, 1896; Valentine, 1913). More generally, curved lines
have often been considered as ”more harmonious, relaxing, or pleasant – and more in consonance with
nature than straight or broken lines” (Gomez-Puerto et al., 2016).6 In architectural theory, organic archi-
tecture claims that free-flowing form is more compatible to the human body (Pearson, 2001) and buildings
which share formal qualities with natural forms are subconsciously and psychologically perceived as more
comfortable (Salingaros, 1998).7
In research emerging from fields of environmental science, Shepley’s comparison of two different interior
environments show that people of various ages more frequently prefer curved walls as object-orienting spaces
as opposed to square-off walls as spatially-orienting spaces (Shepley, 1982). Vartanian et al. have conducted
an fMRI study where participants responded to images of interior architectural spaces with various degrees
4Broadway was originally a Native American footpath called the Wickquasgeck Trail traversing the length of Manhattan,
which became a main north-south road through the island after the Dutch founded New Amsterdam at the southern tip of
Manhattan in 1626 (American Planning Association, 2014).5Squares such as Union Square at 14th Street, Madison Square Park at 23rd Street, Herald Square at 34th Street, Times
Square at 46th Street, and Columbus Circle at 59th Street (Davis, 2010). As a result, these portions of the Broadway have
become popular destinations for strolling during both day and night (Okamoto & Williams, 1969).6Pythagoras studied the beauty of architecture by assessing the mathematical relationship between a building and its
constituent architectural elements (Murphy & Kovach, 1972).7Along this lineage, Madani (2007) studies the ”affective” and ”interpretive” assessments of curvilinearity in the interior
built environment using approaches outlined by Gifford et al. (2000) and methods used by Delvin and Nasar (1989).
9

of curvature and sharp angles. The study found rooms with curved spaces to be subjectively preferred overall
(Vartanian et al., 2013). From a psychological perspective, various degrees of curvature could induce different
feelings from the observer. A Hopkins’ study from 1976 created four categories of line segments for judging
the amount of curvature based on curve radii (Hopkins et al., 1976). While a straight line generates minimal
attraction, data shows that too much curvature makes the participant experience feelings of confusion and
anxiety (Roelfsema et al., 1999).
2.3. Setbacks
According to Ely Jacques Kahn 1926, “The New York zoning laws protecting property rights, light, and
air have encouraged a new art by reason of the very restrictions they contain.” Passed by the City’s Board
of Estimate on July 25, 1916, the zoning ordinance applied the principle of the zoning envelope to all
commercial high-rise buildings. Five formulas that were based on the width of the street and the angle of
the setback were used to define the physical envelope of a building.8 The numerous permutations of the
formula provided by different width of the street encouraged the ”wedding cake” setbacks. The shape of the
building was effectively pre-designed by code (Willis, 1995).
By the mid-1920s, a number of architects and critics were writing about a new design approach which
some labeled the ”setback style” (Willis, 1986). Pioneering projects such as the Shelton Hotel and the
Barclay-Vesey Telephone Building became the benchmark of progressive design by simplifying the number
of setbacks and emphasizing the power of simple, sculptural, and pyramidal mass (Haskell). Architect Harvey
Wiley Corbett and delineator Hugh Ferriss added the programmatic influence of the setback by elaborating
the utilization of the upper levels being an additional effect of stepping back the building. Increased privacy,
exposure, light and air, as well as use of an outdoor space were the inherent advantages identified in the new
”setback style” (Ferriss, 1929).
2.4. Podium Extrusion
A classical skyscraper consists of a base, a shaft and a crown, which is a morphology that has emerged in
the 1920’s. According to the Skyscraper Dictionary created by Dutch economist Jan Klerks, a podium is
distinct from a base when the difference in orientation and the width between the shaft and the base render
the building two separate buildings on top of each other rather than a single integrated building. Due to its
form and proportions, podiums conveniently incorporate programs which require horizontal spaces, such as
conference halls, or street space such as shops or other public amenities. In order to assist developers and
architects in designing tall buildings, numerous cities provide tall building guidelines to establish standards
8According to Commission on Building Districts and Restrictions, the five basic formulas were: (1) 1 X width of street =
1ft, setback: 2ft, vertical rise; (2) 1.25 X width of street = 1ft, setback: 2.5ft, vertical rise; (3) 1.5 X width of street = 1ft,
setback: 3ft, vertical rise; (4) 2 X width of street = 1ft, setback: 4ft, vertical rise; (5) 2.5 X width of street = 1ft, setback: 5ft,
vertical rise.
10

and recommendations where the podium of a tall building ”anchors the tower and defines pedestrian expe-
rience at the street level...[in which its] location and height should frame and create a positive relationship
to the street” (Brook McIlroy, 2017).9
3. A Geometric, Geospatial and Relational Dataset
First, to assess the external architectural differentiation of the city, we need to examine the geometry of
New York City.10 We then classify the geometry of every building in the city, according to our four external
architectural features. Using the 3D model of NYC, we assign a dummy variable of 1 to each building if it has
a design feature, and 0 otherwise. Some buildings may have more than one design feature. Figure 2 depicts
the Manhattan building geometry in 3D and isolates the diagonal intersections, building curvature, setbacks,
and podium extruded buildings across the city. We find that there is concentration of buildings with podium
extrusions in Midtown and Downtown Manhattan, whereas buildings located on diagonal intersections are
spread throughout NYC. Similarly, buildings with curvature in their exterior envelope are distributed across
the city.
We then pair the building geometry of our selected sample to their geolocational attributes using New
York City’s geocoding tool, GeoBat, to identify unique building identification numbers (BIN). We then match
the BIN of the 3D models with our building dataset and assign a variable to each of the design metrics.
Finally, we use commercial building transaction data provided by Real Capital Analytics (RCA) and
feature data from Compstak to provide fundamental hedonic variables for our pricing model and test the
model in New York City. 11 12 We extract location and transaction time data for individual property
transactions from the RCA dataset to control for time and location. We then extract the Building Class
feature for each building that transacted from the Compstak dataset to control for the overall quality of the
buildings in the sample dataset and match the observations from the RCA dataset. In addition to these two
datasets, we include a Walk Score variable from Walkscore.com to measure the walkability of a neighborhood
and its accessibility to public transit with a score range from 0.00 to 100. In total, we have the complete
database for all the variables for 3,141 observations for commercial real estate in Manhattan over the 2001
to 2018 period.
9Brook McIlory emphasizes the importance of creating a connection between the public and private realm through the
podium, while ensuring vibrancy throughout the day.10The NYC DOTT has released a 3D model of NYC at the Level of Detail (LOD) 1 to 2 scale, which means that external
building features and iconic building features can be identified through each building’s geometry across the entire city.11RCA specializes in property transaction data in New York City and provides building transaction data that includes
financing details, prior transaction history, and true owner identification.12Compstak provides crowdsourced information such as lease contract characteristics, tenant profile, and market variables
from verified professionals from commercial brokerage and appraisal firms.
11
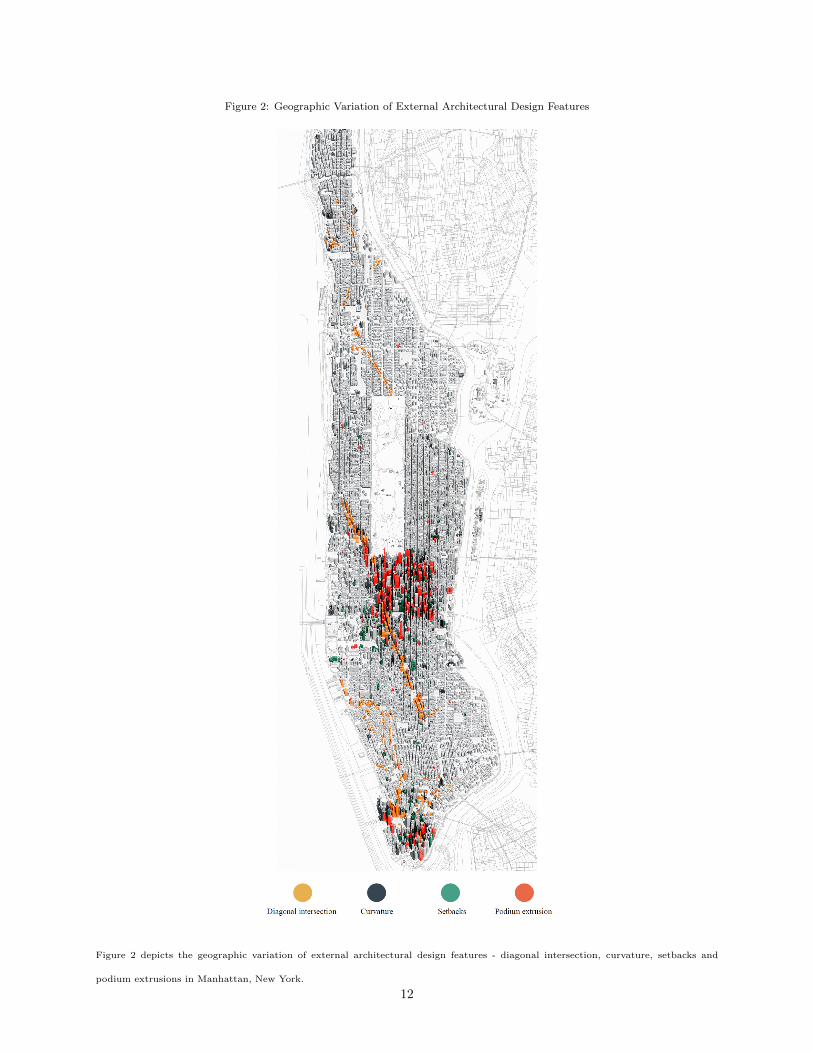
Figure 2: Geographic Variation of External Architectural Design Features
Figure 2 depicts the geographic variation of external architectural design features - diagonal intersection, curvature, setbacks and
podium extrusions in Manhattan, New York.
12
Tab
le1:
Bu
ild
ing
Ch
ara
cter
isti
csby
Geo
met
ry
Variable
BuildingIn
form
ation
logP
SM
Pri
ce
Age
Nu
mb
erF
loors
SqM
Cla
ssA
Cla
ssB
Cla
ssC
Ren
ovate
d
Walk
Sco
re
BuyerType
BT
Cor
p
BT
Fu
nd
BT
Gov
’t
BT
Inst
BT
Off
shore
BT
Pri
vate
BT
RE
IT
BT
RE
OC
BT
Ret
ail
er
BT
Un
kn
own
SellerType
ST
Corp
ST
Fu
nd
ST
Gov
’t
ST
Inst
ST
Off
shor
e
ST
Pri
vate
ST
RE
IT
ST
RE
OC
ST
Ret
aile
r
ST
Un
kn
own
LeasingType
LT
CM
BS
LT
Fin
anci
al
LT
Gov
ernm
ent
Agen
cy
LT
Insu
ran
ce
LT
Inte
rnati
onal
Bank
LT
Nati
on
al
Ban
k
LT
Pen
sion
Fu
nd
LT
Pri
vate
LT
Reg
ion
al/L
oca
lB
an
k
LT
Un
kn
own
Numberofobserv
ations
Curv
y
Mean
(Std
.Dev.)
8.8
4(0
.61)
104,2
12,
982
.46
(174
,819,9
99.
89)
76.3
2(3
1.88)
9.6
8(9
.80)
16,4
53.3
4(2
6,20
4.2
7)
0.4
7(0
.51)
0.3
7(0
.5)
0.1
6(0
.37)
0.0
5(0
.23)
99.1
6(1
.64)
0.0
5(0
.23)
0.0
0(0
.00)
0.0
0(0
.00)
0.0
0(0
.00)
0.0
0(0
.00)
0.5
3(0
.51)
0.0
5(0
.23)
0.0
5(0
.23)
0.0
0(0
.00)
0.3
2(0
.48)
0.0
5(0
.23)
0.0
5(0
.23)
0.0
5(0
.23)
0.0
0(0
.00)
0.0
0(0
.00)
0.3
2(0
.48)
0.0
0(0
.00)
0.0
0(0
.00)
0.0
0(0
.00)
0.5
3(0
.51)
0.0
5(0
.23)
0.0
0(0
.00)
0.0
0(0
.00)
0.0
0(0
.00)
0.2
1(0
.42)
0.1
6(0
.37)
0.0
0(0
.00)
0.0
0(0
.00)
0.1
1(0
.32)
0.4
7(0
.51)
19
Diagonal
Mean
(Std
.Dev.)
8.4
9(0
.73)
209,1
84,
989
.82
(253
,607,0
70.1
4)
79.
16
(30.
60)
19.
54
(13.
75)
36,
608
.05
(34,1
80.
71)
0.3
5(0
.48)
0.5
1(0
.5)
0.1
4(0
.35)
0.2
3(0
.42)
99.
22
(0.9
6)
0.0
2(0
.12)
0.0
2(0
.15)
0.0
2(0
.15)
0.0
2(0
.12)
0.0
5(0
.23)
0.3
8(0
.49)
0.0
3(0
.17)
0.0
0(0
.00)
0.0
1(0
.09)
0.4
5(0
.50)
0.0
5(0
.21)
0.0
3(0
.17)
0.0
2(0
.15)
0.0
2(0
.15)
0.0
0(0
.00)
0.1
5(0
.36)
0.0
2(0
.15)
0.0
0(0
.00)
0.0
0(0
.00)
0.7
0(0
.46)
0.2
7(0
.45)
0.0
5(0
.23)
0.0
2(0
.12)
0.1
0(0
.30)
0.1
3(0
.34)
0.1
5(0
.36)
0.0
0(0
.00)
0.0
0(0
.00)
0.0
8(0
.27)
0.2
0(0
.40)
128
Podium
Mean
(Std
.Dev.)
8.6
7(0
.65)
630,
293,
650.
63(6
60,4
99,2
45.5
8)
42.
35
(26.6
3)
35.
72
(15.2
1)
88,0
90.2
9(6
8,4
19.
35)
0.8
0(0
.40)
0.1
7(0
.37)
0.0
4(0
.19)
0.2
4(0
.43)
99.
10
(1.2
2)
0.0
2(0
.13)
0.0
3(0
.16)
0.0
2(0
.13)
0.0
4(0
.19)
0.0
6(0
.25)
0.2
5(0
.43)
0.1
0(0
.30)
0.0
3(0
.18)
0.0
0(0
.00)
0.4
6(0
.5)
0.0
4(0
.19)
0.0
2(0
.15)
0.0
2(0
.13)
0.0
3(0
.18)
0.0
5(0
.21)
0.1
6(0
.37)
0.0
1(0
.07)
0.0
1(0
.07)
0.0
0(0
.00)
0.6
7(0
.47)
0.3
8(0
.49)
0.0
2(0
.15)
0.0
0(0
.00)
0.1
2(0
.32)
0.1
5(0
.36)
0.0
7(0
.26)
0.0
0(0
.00)
0.0
1(0
.10)
0.0
3(0
.18)
0.2
2(0
.41)
187
Setb
ack
s
Mean
(Std
.Dev.)
8.40
(0.6
0)
130
,133
,036.9
9(2
19,
363,
640.
64)
68.
82(2
2.31)
21.
24(7
.90)
25,
866.
45
(29,4
06.4
0)
0.42
(0.4
9)
0.52
(0.5
0)
0.06
(0.2
4)
0.20
(0.4
0)
99.
31(0
.73)
0.06
(0.2
3)
0.02
(0.1
3)
0.04
(0.2
0)
0.02
(0.1
5)
0.03
(0.1
8)
0.36
(0.4
8)
0.02
(0.1
3)
0.00
(0.0
0)
0.00
(0.0
0)
0.45
(0.5
0)
0.02
(0.1
5)
0.02
(0.1
3)
0.01
(0.1
0)
0.03
(0.1
8)
0.04
(0.2
0)
0.25
(0.4
4)
0.01
(0.1
1)
0.00
(0.0
0)
0.00
(0.0
0)
0.61
(0.4
9)
0.27
(0.4
4)
0.04
(0.2
0)
0.00
(0.0
0)
0.07
(0.2
5)
0.09
(0.2
9)
0.14
(0.3
5)
0.00
(0.0
6)
0.01
(0.0
8)
0.13
(0.3
4)
0.26
(0.4
4)
492
ControlSample
Mean
(Std
.Dev.)
8.59
(0.6
8)
104,
282,
214.
15(2
33,8
99,5
88.8
3)
81.4
0(3
0.63
)
14.2
8(1
2.58
)
19,2
36.9
5(3
4,642
.56)
0.22
(0.4
2)
0.49
(0.5
0)
0.29
(0.4
5)
0.18
(0.3
8)
99.2
3(1
.31)
0.06
(0.2
4)
0.02
(0.1
5)
0.03
(0.1
6)
0.02
(0.1
4)
0.03
(0.1
8)
0.44
(0.5
0)
0.02
(0.1
3)
0.00
(0.0
7)
0.00
(0.0
4)
0.37
(0.4
8)
0.05
(0.2
1)
0.01
(0.1
1)
0.03
(0.1
7)
0.02
(0.1
2)
0.02
(0.1
4)
0.32
(0.4
6)
0.01
(0.1
0)
0.00
(0.0
3)
0.00
(0.0
5)
0.55
(0.5
0)
0.20
(0.4
0)
0.04
(0.2
0)
0.00
(0.0
5)
0.05
(0.2
1)
0.10
(0.3
0)
0.12
(0.3
3)
0.00
(0.0
4)
0.02
(0.1
3)
0.15
(0.3
6)
0.32
(0.4
7)
226
9
Full
Sample
Mean
(Std
.Dev.)
8.5
6(0
.67)
144,
511,
287.
93(3
04,0
55,1
53.7
2)
76.9
2(3
0.84
)
16.8
7(1
3.35
)
25,1
52.2
6(4
0,266
.14)
0.3
0(0
.46)
0.4
7(0
.50)
0.2
3(0
.42)
0.1
9(0
.39)
99.2
3(1
.22)
0.0
6(0
.23)
0.0
2(0
.14)
0.0
3(0
.17)
0.0
2(0
.14)
0.0
4(0
.19)
0.4
1(0
.49)
0.0
2(0
.15)
0.0
1(0
.07)
0.0
0(0
.04)
0.3
9(0
.49)
0.0
4(0
.20)
0.0
2(0
.12)
0.0
3(0
.16)
0.0
2(0
.14)
0.0
2(0
.15)
0.2
9(0
.45)
0.0
1(0
.10)
0.0
0(0
.03)
0.0
0(0
.04)
0.5
7(0
.50)
0.2
2(0
.42)
0.0
4(0
.20)
0.0
0(0
.05)
0.0
6(0
.23)
0.1
0(0
.30)
0.1
2(0
.33)
0.0
0(0
.04)
0.0
1(0
.12)
0.1
4(0
.35)
0.3
0(0
.46)
3095
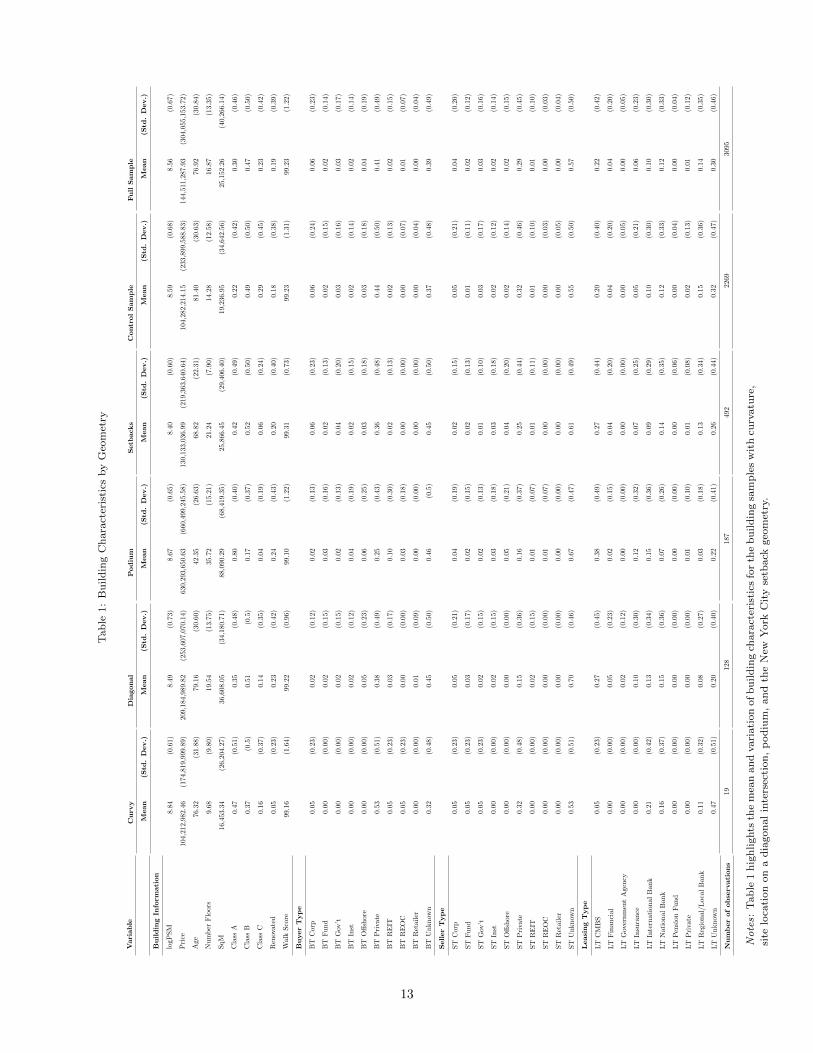
Notes:
Tab
le1
hig
hlights
the
mea
nan
dvari
ati
on
ofb
uild
ing
chara
cter
isti
csfo
rth
eb
uild
ing
sam
ple
sw
ith
curv
atu
re,
site
loca
tion
on
ad
iagon
al
inte
rsec
tion
,p
od
ium
,an
dth
eN
ewY
ork
Cit
yse
tback
geo
met
ry.
13
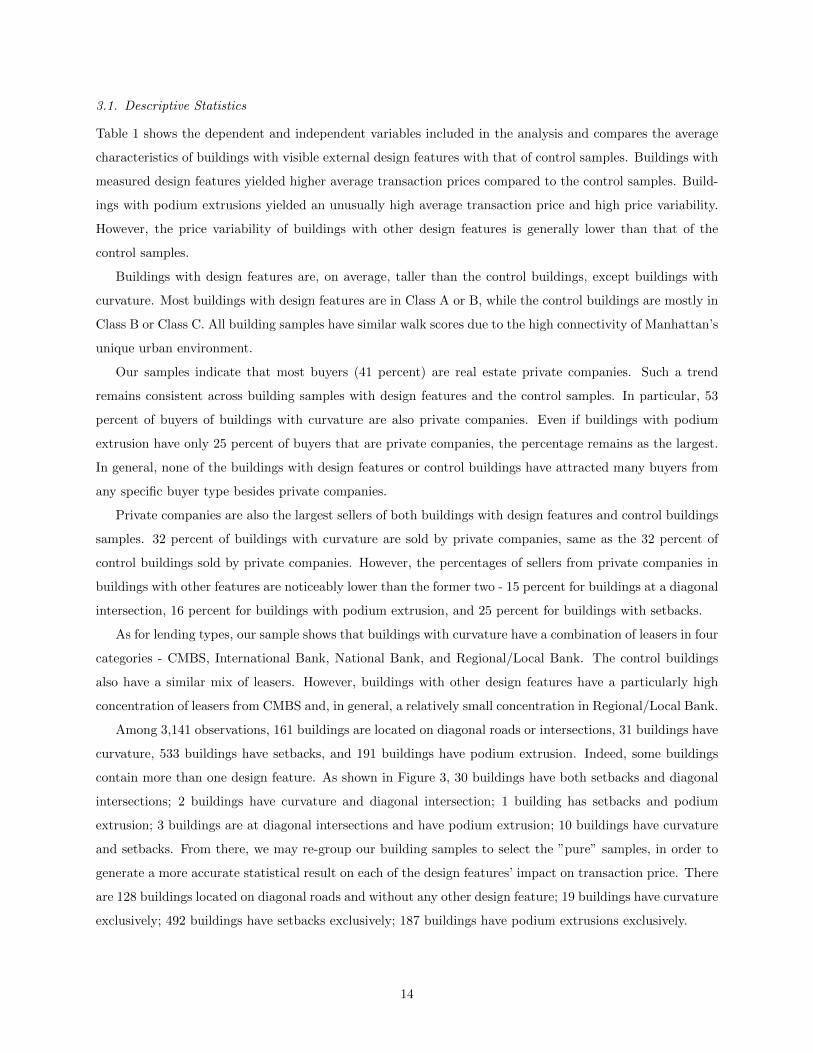
3.1. Descriptive Statistics
Table 1 shows the dependent and independent variables included in the analysis and compares the average
characteristics of buildings with visible external design features with that of control samples. Buildings with
measured design features yielded higher average transaction prices compared to the control samples. Build-
ings with podium extrusions yielded an unusually high average transaction price and high price variability.
However, the price variability of buildings with other design features is generally lower than that of the
control samples.
Buildings with design features are, on average, taller than the control buildings, except buildings with
curvature. Most buildings with design features are in Class A or B, while the control buildings are mostly in
Class B or Class C. All building samples have similar walk scores due to the high connectivity of Manhattan’s
unique urban environment.
Our samples indicate that most buyers (41 percent) are real estate private companies. Such a trend
remains consistent across building samples with design features and the control samples. In particular, 53
percent of buyers of buildings with curvature are also private companies. Even if buildings with podium
extrusion have only 25 percent of buyers that are private companies, the percentage remains as the largest.
In general, none of the buildings with design features or control buildings have attracted many buyers from
any specific buyer type besides private companies.
Private companies are also the largest sellers of both buildings with design features and control buildings
samples. 32 percent of buildings with curvature are sold by private companies, same as the 32 percent of
control buildings sold by private companies. However, the percentages of sellers from private companies in
buildings with other features are noticeably lower than the former two - 15 percent for buildings at a diagonal
intersection, 16 percent for buildings with podium extrusion, and 25 percent for buildings with setbacks.
As for lending types, our sample shows that buildings with curvature have a combination of leasers in four
categories - CMBS, International Bank, National Bank, and Regional/Local Bank. The control buildings
also have a similar mix of leasers. However, buildings with other design features have a particularly high
concentration of leasers from CMBS and, in general, a relatively small concentration in Regional/Local Bank.
Among 3,141 observations, 161 buildings are located on diagonal roads or intersections, 31 buildings have
curvature, 533 buildings have setbacks, and 191 buildings have podium extrusion. Indeed, some buildings
contain more than one design feature. As shown in Figure 3, 30 buildings have both setbacks and diagonal
intersections; 2 buildings have curvature and diagonal intersection; 1 building has setbacks and podium
extrusion; 3 buildings are at diagonal intersections and have podium extrusion; 10 buildings have curvature
and setbacks. From there, we may re-group our building samples to select the ”pure” samples, in order to
generate a more accurate statistical result on each of the design features’ impact on transaction price. There
are 128 buildings located on diagonal roads and without any other design feature; 19 buildings have curvature
exclusively; 492 buildings have setbacks exclusively; 187 buildings have podium extrusions exclusively.
14

Figure 3: Overlaps of Design Features
Figure 3 documents the overlaps of design features in our data set.
15

4. Methodology
In this study, we employ the hedonic pricing method to analyze and understand commercial real estate
pricing dynamics. The hedonic pricing method captures the impact on asset pricing of both internal and
external characteristics of a property, allowing an analysis of a cross-sectional dataset and measurement of
design features in the real estate marketplace. However, while New York City has a rich database in the
built environment, little information exists on the subject of design, especially on design features examined
from an architectural perspective. A key contribution of this research is the construction of a design dataset
that begins to measure design characteristics, which may serve as support or guide to the designer’s future
work as design becomes increasingly important in development projects.
To measure the impact of external design features we operationalize the control samples a semi-log model
to understand the impact of external architectural design features with Equation 1 outlined here:
logPi = α+ βXi + δGi + εi, (1)
where the dependent variable is the logarithm of the transaction price P in commercial office buildings
i. X is a vector containing a list of hedonic characteristics of buildings i and G is a vector of a list of design
feature variables with the value of 1 if building i falls into the category of design metric we specified, and
0.00 otherwise. α is a constant while β and δ are estimated coefficients and ε is an i.i.d. error term.
5. Results
Employing equation (1) we estimate the impact of external architectural design features upon the logarithm
of building transaction prices. The results of the models explain between 34 and 48 percent of the transacted
price of a building. Table 2 documents the results for rectilinear structures in NYC, in columns (2-5) we
document the impact of each design feature. In column 6 we document the results of design features relative
to control buildings.
16
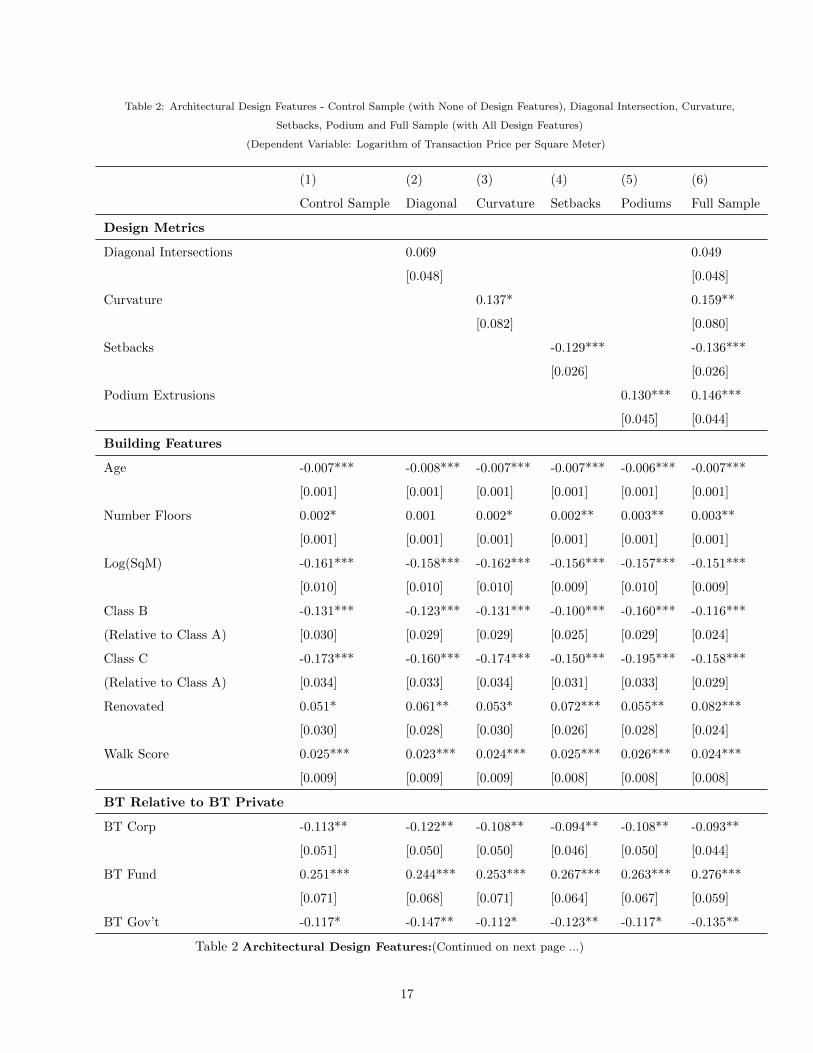
Table 2: Architectural Design Features - Control Sample (with None of Design Features), Diagonal Intersection, Curvature,
Setbacks, Podium and Full Sample (with All Design Features)
(Dependent Variable: Logarithm of Transaction Price per Square Meter)
(1) (2) (3) (4) (5) (6)
Control Sample Diagonal Curvature Setbacks Podiums Full Sample
Design Metrics
Diagonal Intersections 0.069 0.049
[0.048] [0.048]
Curvature 0.137* 0.159**
[0.082] [0.080]
Setbacks -0.129*** -0.136***
[0.026] [0.026]
Podium Extrusions 0.130*** 0.146***
[0.045] [0.044]
Building Features
Age -0.007*** -0.008*** -0.007*** -0.007*** -0.006*** -0.007***
[0.001] [0.001] [0.001] [0.001] [0.001] [0.001]
Number Floors 0.002* 0.001 0.002* 0.002** 0.003** 0.003**
[0.001] [0.001] [0.001] [0.001] [0.001] [0.001]
Log(SqM) -0.161*** -0.158*** -0.162*** -0.156*** -0.157*** -0.151***
[0.010] [0.010] [0.010] [0.009] [0.010] [0.009]
Class B -0.131*** -0.123*** -0.131*** -0.100*** -0.160*** -0.116***
(Relative to Class A) [0.030] [0.029] [0.029] [0.025] [0.029] [0.024]
Class C -0.173*** -0.160*** -0.174*** -0.150*** -0.195*** -0.158***
(Relative to Class A) [0.034] [0.033] [0.034] [0.031] [0.033] [0.029]
Renovated 0.051* 0.061** 0.053* 0.072*** 0.055** 0.082***
[0.030] [0.028] [0.030] [0.026] [0.028] [0.024]
Walk Score 0.025*** 0.023*** 0.024*** 0.025*** 0.026*** 0.024***
[0.009] [0.009] [0.009] [0.008] [0.008] [0.008]
BT Relative to BT Private
BT Corp -0.113** -0.122** -0.108** -0.094** -0.108** -0.093**
[0.051] [0.050] [0.050] [0.046] [0.050] [0.044]
BT Fund 0.251*** 0.244*** 0.253*** 0.267*** 0.263*** 0.276***
[0.071] [0.068] [0.071] [0.064] [0.067] [0.059]
BT Gov’t -0.117* -0.147** -0.112* -0.123** -0.117* -0.135**
Table 2 Architectural Design Features:(Continued on next page ...)
17

Table 2 —- : (Continued from previous page)
(1) (2) (3) (4) (5) (6)
Control Sample Diagonal Curvy Setbacks Podium Full Sample
[0.064] [0.063] [0.064] [0.055] [0.061] [0.053]
BT Inst 0.227*** 0.237*** 0.229*** 0.201*** 0.206*** 0.196***
[0.052] [0.051] [0.052] [0.047] [0.052] [0.047]
BT Offshore 0.280*** 0.291*** 0.283*** 0.275*** 0.271*** 0.284***
[0.060] [0.057] [0.060] [0.055] [0.053] [0.048]
BT REIT 0.949*** 0.938*** 0.949*** 0.933*** 0.968*** 0.947***
[0.075] [0.074] [0.075] [0.071] [0.072] [0.067]
BT REOC -0.036 -0.048** -0.033 -0.030 -0.032 -0.033
[0.024] [0.023] [0.024] [0.022] [0.023] [0.021]
BT Retailer 0.241*** 0.240*** 0.236*** 0.207*** 0.200*** 0.177***
[0.078] [0.073] [0.077] [0.071] [0.063] [0.055]
ST Relative to ST Fund
ST Corp 0.109** 0.126** 0.111** 0.066 0.154*** 0.127***
[0.051] [0.049] [0.051] [0.049] [0.051] [0.047]
ST Gov’t 0.314*** 0.337*** 0.301*** 0.304*** 0.279*** 0.289***
[0.094] [0.086] [0.091] [0.078] [0.085] [0.067]
ST Inst 0.098* 0.115* 0.091 0.078 0.102* 0.091
[0.059] [0.060] [0.058] [0.055] [0.057] [0.056]
ST Offshore 0.179*** 0.212*** 0.178*** 0.202*** 0.174*** 0.220***
[0.069] [0.066] [0.069] [0.057] [0.065] [0.053]
ST Private 0.332*** 0.332*** 0.332*** 0.284*** 0.293*** 0.266***
[0.056] [0.056] [0.056] [0.052] [0.062] [0.055]
ST REIT 0.107*** 0.109*** 0.104*** 0.098*** 0.112*** 0.102***
[0.027] [0.026] [0.026] [0.024] [0.026] [0.023]
ST REOC 0.172 0.200* 0.171 0.162* 0.145 0.169*
[0.122] [0.113] [0.122] [0.098] [0.116] [0.090]
ST retailer 0.173 0.197 0.176 0.155 0.351** 0.347**
[0.149] [0.143] [0.150] [0.126] [0.150] [0.144]
LT Relative to LT Private
LT CMBS 0.116*** 0.125*** 0.117*** 0.089*** 0.127*** 0.112***
[0.034] [0.033] [0.034] [0.030] [0.032] [0.028]
LT Financial 0.115** 0.114** 0.116** 0.042 0.107** 0.042
Table 2 Architectural Design Features:(Continued on next page ...)
18
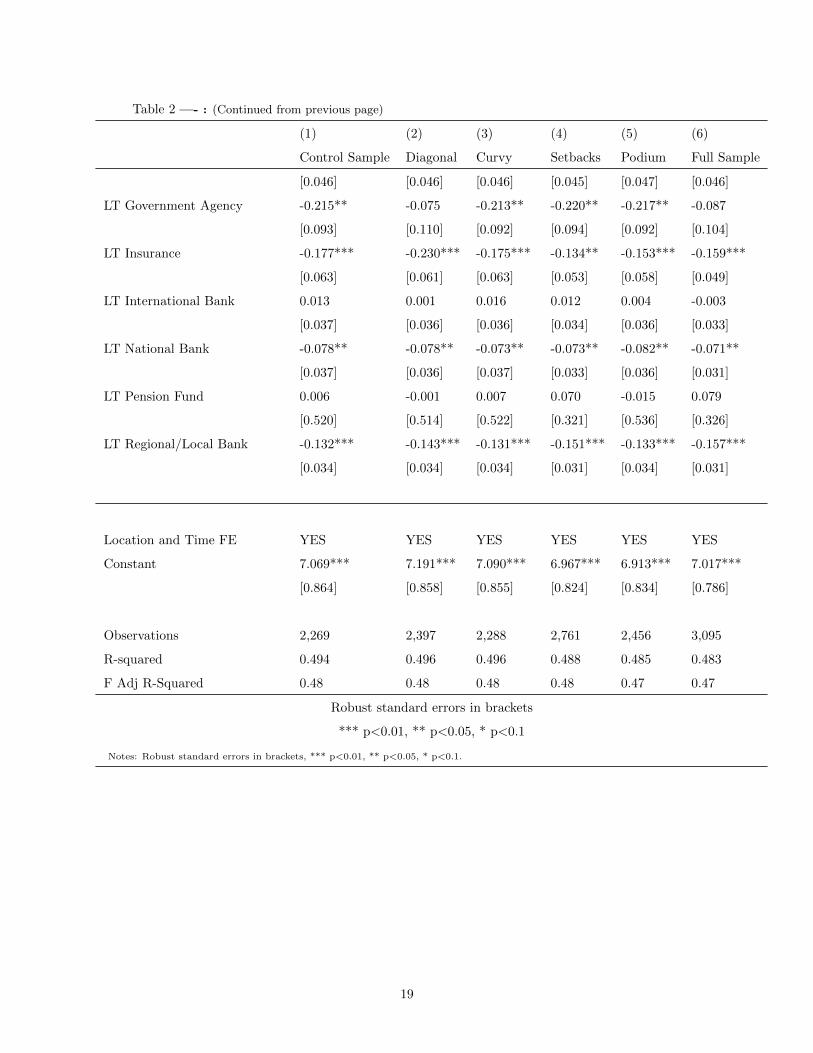
Table 2 —- : (Continued from previous page)
(1) (2) (3) (4) (5) (6)
Control Sample Diagonal Curvy Setbacks Podium Full Sample
[0.046] [0.046] [0.046] [0.045] [0.047] [0.046]
LT Government Agency -0.215** -0.075 -0.213** -0.220** -0.217** -0.087
[0.093] [0.110] [0.092] [0.094] [0.092] [0.104]
LT Insurance -0.177*** -0.230*** -0.175*** -0.134** -0.153*** -0.159***
[0.063] [0.061] [0.063] [0.053] [0.058] [0.049]
LT International Bank 0.013 0.001 0.016 0.012 0.004 -0.003
[0.037] [0.036] [0.036] [0.034] [0.036] [0.033]
LT National Bank -0.078** -0.078** -0.073** -0.073** -0.082** -0.071**
[0.037] [0.036] [0.037] [0.033] [0.036] [0.031]
LT Pension Fund 0.006 -0.001 0.007 0.070 -0.015 0.079
[0.520] [0.514] [0.522] [0.321] [0.536] [0.326]
LT Regional/Local Bank -0.132*** -0.143*** -0.131*** -0.151*** -0.133*** -0.157***
[0.034] [0.034] [0.034] [0.031] [0.034] [0.031]
Location and Time FE YES YES YES YES YES YES
Constant 7.069*** 7.191*** 7.090*** 6.967*** 6.913*** 7.017***
[0.864] [0.858] [0.855] [0.824] [0.834] [0.786]
Observations 2,269 2,397 2,288 2,761 2,456 3,095
R-squared 0.494 0.496 0.496 0.488 0.485 0.483
F Adj R-Squared 0.48 0.48 0.48 0.48 0.47 0.47
Robust standard errors in brackets
*** p<0.01, ** p<0.05, * p<0.1
Notes: Robust standard errors in brackets, *** p<0.01, ** p<0.05, * p<0.1.
19

Column (1) of Table 2 documents the impact of location, time, building features such as age, number
of floors, size, building class, status of renovation and Walk Score, transaction features such as buyer type,
seller type and lender type, for the control samples in the dataset, which are buildings without any of the
four design features.
Column (2) of Table 2 documents the impact of diagonality on transaction prices for the control sample
observations and buildings located on diagonal roads or intersections, with controls for location, time, build-
ing and transaction features. Column (2) of Table 2 yields a result of 6.9 percent positive and statistically
insignificant coefficient for diagonal intersections. Results show that 48 percent of the variation in the loga-
rithm of transaction price per square meter is explained by location, time, building and transaction features.
Table 3 from the Appendix shows the full documentation of the controls for fixed effects. In column (1)
of Table 3, we document controls for location and transaction time; column (2) of Table 3 documents the
addition of building features such as age, number of floors, building area, land parcel area, building class,
year of renovation and Walkscore; in columns (3) we assess transaction features such as who is the buyer,
seller and lender in the transaction. After controlling for the fullest specification of the model, we document
that buildings located on diagonal roads or intersections do not transact more or less than buildings located
on regular orthogonal street grids.
Column (3) of Table 2 documents the impact of curvature on transaction prices for the control sample
observations and buildings with curvature. Column (3) of Table 2 yields a result of 13.7 percent positive
and significant coefficient for curvature. Results show that 48 percent of the variation in the logarithm of
transaction price per square meter is explained by location, time, building and transaction features. Table
4 from the Appendix shows the full documentation of the controls for fixed effects. In column (1) of Table
4, we document controls for location and transaction time; column (2) of Table 4 documents the addition
of building features such as age, number of floors, building area, land parcel area, building class, year of
renovation and Walkscore; in columns (3) of Table 4 we assess transaction features such as who is the buyer,
seller and lender in the transaction. After controlling for the fullest specification of the model, we document
that buildings with curvature account for 13.7 percent more than those buildings with no curvature, with a
positive and significant coefficient.
Column (4) of Table 2 documents the impact of setbacks on transaction prices for the control sample
observations and buildings with setbacks. Column (4) of Table 2 yields a result of 12.9 percent negative
and significant coefficient for setbacks. Results show that 48 percent of the variation in the logarithm of
transaction price per square meter is explained by location, time, building and transaction features. Table
5 from the Appendix shows the full documentation of the controls for fixed effects. We estimate the same
models as those represented in Tables 3 and 4. After controlling for the fullest specification of the model, we
document that buildings with setbacks account for 12.9 percent less than those buildings with no building
setbacks, with a negative and significant coefficient.
Column (5) of Table 2 documents the impact of podium extrusion on transaction prices for the control
20

sample observations and buildings with podium extrusion. Column (5) of Table 2 yields a result of 13.0 per-
cent positive and significant coefficient for podium extrusion. Results show that 47 percent of the variation
in the logarithm of transaction price per square meter is explained by location, time, building and trans-
action features. Table 6 from the Appendix shows the full documentation of the controls for fixed effects.
We estimate the same models as those represented in Tables 3, 4 and 5. After controlling for the fullest
specification of the model, we document that buildings with podium extrusions account for 13.0 percent
more than those buildings with no podium extrusions, with a positive and significant coefficient.
Column (6) of Table 2 documents the impact of building location on diagonal intersection, curvature,
setbacks, and podium extrusion on transaction prices for all the observations. Column (6) of Table 2 yields
a result of 4.9 percent positive and insignificant coefficient for diagonal intersection, 15.9 percent positive
and significant coefficient for curvature, 13.6 percent negative and significant coefficient for setbacks, and
14.6 percent positive and significant for coefficient for podium extrusion. Results show that 47 percent of
the variation in the logarithm of transaction price per square meter is explained by location, time, building
and transaction features. Table 7 from the Appendix shows the full documentation of the controls for fixed
effects. We estimate the same models as those represented in Tables 3, 4, 5 and 6. After controlling for the
fullest specification of the model, we document that buildings located on diagonal roads or intersections do
not transact more or less than buildings located on regular orthogonal street grids; buildings with curvature
are transacted for 15.9 percent more than buildings with pure rectangular geometry; buildings with setbacks
are transacted for 13.6 percent less than those buildings without setbacks; buildings with podium extrusions
are transacted for 14.6 percent more than buildings without podium extrusions.
6. Discussion and Conclusion
We examine the impact of architectural design features upon building valuation. Distinct from the current
design valuation literature, we measure architectural form at a feature level to assess the impact of external
architectural form on transaction price. Importantly, disassociating design as part of a cohort of various
architectural styles or as functional components, such as the number of floors, inclusion of amenities, or
views to the exterior, this study attempts to understand the relationship between architectural form and
real estate value. After controlling for building features, contract features, location and transaction time and
other features included in past research. We find that architectural form decisions can have a statistically
and economically significant impact on the value of buildings.
The fundamental challenge of assessing the impact of an isolated variable is to control for other exogenous
and omitted variables that also determine the transaction price. For that, we used a hedonic price model.
After controlling for building and neighborhood features, these models explained 48 percent of the variation
in price per square foot, but when looking solely at the price explain around 80 percent of the variation in
price. This differential suggests the outsize impact that building size and variation has on the value of assets
and makes these results more conservative than the real estate asset valuation literature.
21

Two design features yielded positive impacts on transaction price - curvature and podium extrusion.
These design features shaped the exterior appearance of buildings. Curvature and podium extrusion were
estimated to have a 15.9 percent and 14.6 percent transaction price premium, respectively, relative to build-
ings without these features. Both the curvature feature and the podium extrusion feature yielded positive
and significant impact on transaction price. On the other hand, buildings whose footprints are non-90-degree
angles as result of locating on diagonal roads or intersections do not appear to have a transaction premium
than buildings located on orthogonal street grids.
However, setbacks returned a statistically significant and negative result. Initially, we understood this
design feature as a result of the new zoning law implemented in 1916, which forced buildings to push back
from the street above a certain height to ensure the access of light and air from the street level, adopting a
terrace-like form for the upper portion of the building. This result suggests that this design strategy created
negative value differentiation amongst their rectilinear building peers in New York City. As a speculation,
this may be due to the fact that the terrace-like form for the upper portion of tall buildings reduces rentable
building footprint significantly and adds difficulty in floor plan layouts. Unlike buildings with podiums,
buildings with setbacks lose square footage without providing enough mixed-use commercial amenities to
balance the loss.
Incorporating alternative technologies and approaches are needed to identify potentially omitted at-
tributes or quantifying other building design metrics, such as algorithmic measurement of 3D complexity
(Little et al., 1997; Gero & Kazakov, 2003), and computer vision technology for recognizing the presence of
greenery or identifying building materials. Omitting architectural formal features from asset valuation may
leave a missed opportunity to understand product differentiation and impact on the property market value
caused by actual building design features during individual real estate property transactions. This then
poses the same problem to both sides, a diminished design agency for both financial and design stakeholders
during design, development and negotiation processes. It is also imperative to further develop a system-
atic approach to recognize and describe design attributes to facilitate the communication among designers
and researchers when discussing about forms and styles of design works (Chen & Owen, 1997). Enhanced
methods may also potentially address the difficulty of interpreting the current research results by isolating
individual design attributes or removing confounding factors.
Research on the value of design is moving beyond measuring design through assessing involvement of
award-winning architects and moving into the study of physical design features. This distinction is important
as not all architects come to be prize winning nor do all developers employ award winning designers. In
this way, we may be able to understand the design decisions that create value and align the wider design
community with valuation precedents. Our contribution is to create a relational understanding between
building geometry, geography and real estate valuation techniques. Expanding the knowledge base of design
and its impact on finance and economics will enable designers and real estate economists to engage in
interdisciplinary exchange. Further, it may also magnify the agency of design in fields that emphasize
22

quantitative analysis.
23

References
Ahlfeldt, G., & Mastro, A. (2012). Valuing iconic design: Frank lloyd wright architecture in oak park, illinois.
Housing studies, 27 , 1079–1099.
Allen, G. (1877). Physiological aesthetics. 5060. New York: D. Appleton.
American Planning Association (2014). Broadway: New york, new york. URL: https://www.planning.
org/greatplaces/streets/2014/broadway.htm.
Asabere, P. K., Hachey, G., & Grubaugh, S. (1989). Architecture, historic zoning, and the value of homes.
The Journal of Real Estate Finance and Economics, 2 , 181–195.
Bille, M., & Sorensen, T. F. (2016). Elements of architecture: assembling archaeology, atmosphere and the
performance of building spaces. New York, NY: Routledge.
Brook McIlroy (2017). City of burlington tall building guidelines.
Buitelaar, E., & Schilder, F. (2017). The economics of style: measuring the price effect of neo-traditional
architecture in housing. Real Estate Economics, 45 , 7–27.
Chan, C.-S. (2000). Can style be measured? Design studies, 21 , 277–291.
Chegut, A. M., Eichholtz, P. M., & Rodrigues, P. (2013). The london commercial property price index. The
Journal of Real Estate Finance and Economics, 47 , 588–616.
Chen, K., & Owen, C. L. (1997). Form language and style description. Design studies, 18 , 249–274.
Cheshire, P., & Dericks, G. (2014). ’iconic design’as deadweight loss: rent acquisition by design in the
constrained london office market, .
Ching, F. D. (1979). Architecture: Form, space, and order . Hoboken, NJ: John Wiley & Sons.
Ching, F. D. (1995). A visual dictionary of architecture. New York, NY: John Wiley & Sons.
Commission on Building Districts and Restrictions (1916). Final Report : June 2, 1916 . New York, NY:
City of New York, Board of Estimate and Apportionment.
Crilly, N., Good, D., Matravers, D., & Clarkson, P. J. (2008). Design as communication: exploring the
validity and utility of relating intention to interpretation. Design Studies, 29 , 425–457.
Davis, B. (2010). Faslanyc. URL: http://faslanyc.blogspot.com/2010/06/
on-broadway-tactical-urbanism.html.
24

Devlin, K., & Nasar, J. L. (1989). The beauty and the beast: Some preliminary comparisons of ‘high’versus
‘popular’residential architecture and public versus architect judgments of same. Journal of Environmental
Psychology , 9 , 333–344.
Ferriss, H. (1929). The metropolis of tomorrow . Mineola, NY: Dover Publication.
Fuerst, F., McAllister, P., & Murray, C. (2009). Designer buildings: an evaluation of the price impacts of
signature architects, .
Gero, J., & Kazakov, V. (2003). On measuring the visual complexity of 3d solid objects. e-Activities in
Design and Design Education, Europia, Paris, (pp. 147–156).
Gifford, R., Hine, D. W., Muller-Clemm, W., Reynolds JR, D. J., & Shaw, K. T. (2000). Decoding mod-
ern architecture: A lens model approach for understanding the aesthetic differences of architects and
laypersons. Environment and Behavior , 32 , 163–187.
Goldberger, P. (2001). URL: https://www.paulgoldberger.com/lectures/
new-york-and-the-new-urbanism/.
Gomez-Puerto, G., Munar, E., & Nadal, M. (2016). Preference for curvature: A historical and conceptual
framework. Frontiers in human neuroscience, 9 , 712.
Grant, J. (2001). The dark side of the grid: power and urban design. Planning Perspectives, 16 , 219–241.
Haskell, D. (). Building or sculpture? the architecture of’mass.’. Architectural Record , 67 , 366–367.
Hogarth, W. (1753). The analysis of beauty: Written with a view of fixing the fluctuating ideas of taste.
Georg Olms Verlag.
Hopkins, J. R., Kagan, J., Brachfeld, S., Hans, S., & Linn, S. (1976). Infant responsivity to curvature. Child
Development , (pp. 1166–1171).
Hough, D. E., & Kratz, C. G. (1983). Can “good” architecture meet the market test? Journal of Urban
Economics, 14 , 40–54.
Kahn, E. J. (1926). Our skyscrapers take simple forms. New York Times, 4 , 22.
Kang, M. (2019). Dancing with the stars: The value of design in real estate development.
Koolhaas, R., Westcott, J., & Petermann, S. (2014). Elements of architecture. Venice, Italy: Marsilio.
Leder, H., & Carbon, C.-C. (2005). Dimensions in appreciation of car interior design. Applied Cognitive
Psychology: The Official Journal of the Society for Applied Research in Memory and Cognition, 19 ,
603–618.
25

Lindenthal, T. (2017). Beauty in the eye of the home-owner: Aesthetic zoning and residential property
values. Real Estate Economics, .
Little, G., Tuttle, B., Clark, D. E., & Corney, J. R. (1997). Measuring geometric complexity of 3d models
for feature recognition. International Journal of Shape Modeling , 3 , 141–154.
Madani Nejad, K. (2007). Curvilinearity in Architecture: Emotional Effect of Curvilinear Forms in Interior
Design. Ph.D. thesis Texas A&M University.
Millhouse, J. A. (2005). Assessing the effect of architectural design on real estate values: A qualitative
approach. Ph.D. thesis Massachusetts Institute of Technology.
Murphy & Kovach, J. (1972). Historical introduction to modern psychology.
Nase, I., Berry, J., & Adair, A. (2016). Impact of quality-led design on real estate value: a spatiotemporal
analysis of city centre apartments. Journal of ProPerty research, 33 , 309–331.
Okamoto, R. Y., & Williams, F. E. (1969). Urban Design Manhattan. Cambridge, MA: MIT Press.
Pearson, D. (2001). New Organic Architecture: the Breaking Wave. Dubai, UAE: University of California
Press with Gaia Books.
Plaut, S., Uzulena, E. et al. (2005). Architectural design and the value of housing in riga, latvia. International
Real Estate Review , 9 , 112–131.
Rahadi, R. A., Wiryono, S. K., Koesrindartoto, D. P., & Syamwil, I. B. (2013). Attributes influencing
housing product value and price in jakarta metropolitan region. Procedia-Social and Behavioral Sciences,
101 , 368–378.
Ranscombe, C., Hicks, B., Mullineux, G., & Singh, B. (2012). Visually decomposing vehicle images: Ex-
ploring the influence of different aesthetic features on consumer perception of brand. Design Studies, 33 ,
319–341.
Roelfsema, P. R., Scholte, H. S., & Spekreijse, H. (1999). Temporal constraints on the grouping of contour
segments into spatially extended objects. Vision Research, 39 , 1509–1529.
Rosen, S. (1974). Hedonic prices and implicit markets: product differentiation in pure competition. Journal
of political economy , 82 , 34–55.
Salingaros, N. A. (1998). A scientific basis for creating architectural forms. Journal of Architectural and
Planning Research, (pp. 283–293).
Santayana, G. (1896). Sonnets and Other Verses. Stone and Kimball.
26

Shepley, M. M. (1982). Age changes in spatial and object orientation as measured by architectural preference
and eft visual performance, .
Spencer, H. (1873). Psychology of the sexes. Popular Science Monthly , 4 , 30–38.
Valentine, C. W. (1913). The aesthetic appreciation of musical intervals among school children and adults.
British Journal of Psychology , 6 , 190.
Vandell, K. D., & Lane, J. S. (1989). The economics of architecture and urban design: some preliminary
findings. Real Estate Economics, 17 , 235–260.
Vartanian, O., Navarrete, G., Chatterjee, A., Fich, L. B., Leder, H., Modrono, C., Nadal, M., Rostrup,
N., & Skov, M. (2013). Impact of contour on aesthetic judgments and approach-avoidance decisions in
architecture. Proceedings of the National Academy of Sciences, 110 , 10446–10453.
Westerman, S. J., Gardner, P. H., Sutherland, E. J., White, T., Jordan, K., Watts, D., & Wells, S. (2012).
Product design: Preference for rounded versus angular design elements. Psychology & Marketing , 29 ,
595–605.
Willis, C. (1986). Zoning and” zeitgeist”: The skyscraper city in the 1920s. Journal of the Society of
Architectural Historians, 45 , 47–59.
Willis, C. (1995). Form Follows Finance: skyscrapers and skylines in New York and Chicago. New York,
NY: Princeton Architectural Press.
27

Appendix
Table 3: Architectural Design Features - Diagonal Intersection
(Dependent Variable: Logarithm of transaction price per square meter)
(1) (2) (3)
Diagonal -0.044 0.060 0.069
[0.055] [0.054] [0.048]
Location and Transaction Time FE YES YES YES
Building Features FE NO YES YES
Transaction Features FE NO NO YES
Constant 7.764*** 7.108*** 7.191***
[0.044] [0.833] [0.858]
Observations 2,482 2,397 2,397
R-squared 0.344 0.447 0.496
F Adj R-Squared 0.34 0.44 0.48
Notes: Robust standard errors in brackets, *** p<0.01, ** p<0.05, * p<0.1. For the sake of purity, we ran the
regression for the dataset without any overlapping features. However, if we run the regression for the dataset
including the overlapping features, column (3) would yield a positively significant coefficient of 10.8 percent for the
diagonal design feature.
Table 4: Architectural Design Features - Curvature
(Dependent Variable: Logarithm of transaction price per square meter)
(1) (2) (3)
Curvy 0.274*** 0.115 0.137*
[0.094] [0.073] [0.082]
Location and Transaction Time FE YES YES YES
Building Features FE NO YES YES
Transaction Features FE NO NO YES
Constant 7.773*** 6.959*** 7.090***
[0.045] [0.832] [0.855]
Observations 2,371 2,288 2,288
R-squared 0.347 0.454 0.496
F Adj R-Squared 0.34 0.45 0.48
Notes: Robust standard errors in brackets, *** p<0.01, ** p<0.05, * p<0.1. For the sake of purity, we ran the
regression for the dataset without any overlapping features. However, if we run the regression for the dataset
including the overlapping features, column (3) would yield a positively significant coefficient of 16.8 percent for the
curvature design feature.
28

Table 5: Architectural Design Features - Setbacks
(Dependent Variable: Logarithm of transaction price per square meter)
(1) (2) (3)
Setbacks -0.172*** -0.141*** -0.129***
[0.026] [0.027] [0.026]
Location and Transaction Time FE YES YES YES
Building Features FE NO YES YES
Transaction Features FE NO NO YES
Constant 7.795*** 6.832*** 6.967***
[0.042] [0.806] [0.824]
Observations 2,862 2,761 2,761
R-squared 0.350 0.450 0.488
F Adj R-Squared 0.34 0.44 0.48
Notes: Robust standard errors in brackets, *** p<0.01, ** p<0.05, * p<0.1. For the sake of purity, we ran the
regression for the dataset without any overlapping features. However, if we run the regression for the dataset
including the overlapping features, column (3) would yield a negatively significant coefficient of 11.8 percent for
the setbacks design feature.
Table 6: Architectural Design Features - Podium
(Dependent Variable: Logarithm of transaction price per square meter)
(1) (2) (3)
Podium 0.121*** 0.138*** 0.130***
[0.041] [0.046] [0.045]
Location and Transaction Time FE YES YES YES
Building Features FE NO YES YES
Transaction Features FE NO NO YES
Constant 7.795*** 6.720*** 6.913***
[0.044] [0.821] [0.834]
Observations 2,544 2,456 2,456
R-squared 0.341 0.443 0.485
F Adj R-Squared 0.34 0.44 0.47
Notes: Robust standard errors in brackets, *** p<0.01, ** p<0.05, * p<0.1. For the sake of purity, we ran the
regression for the dataset without any overlapping features. However, if we run the regression for the dataset
including the overlapping features, column (3) would yield a positively significant coefficient of 14.5 percent for the
podium extrusion design feature.
29

Table 7: Architectural Design Features - Diagonal Intersection, Curvature, Setbacks, and Podium
(Dependent Variable: Logarithm of transaction price per square meter)
(1) (2) (3)
Diagonal -0.049 0.040 0.049
[0.055] [0.053] [0.048]
Curvy 0.279*** 0.141** 0.159**
[0.093] [0.072] [0.080]
Setbacks -0.174*** -0.150*** -0.136***
[0.026] [0.026] [0.026]
Podium 0.117*** 0.150*** 0.146***
[0.041] [0.045] [0.044]
Location and Transaction Time FE YES YES YES
Building Features FE NO YES YES
Transaction Features FE NO NO YES
Constant 7.808*** 6.834*** 7.017***
[0.040] [0.774] [0.786]
Observations 3,203 3,095 3,095
R-squared 0.347 0.441 0.483
F Adj R-Squared 0.34 0.43 0.47
Notes: Robust standard errors in brackets, *** p<0.01, ** p<0.05, * p<0.1. For the sake of purity, we ran the
regression for the dataset without any overlapping features. However, if we run the regression for the dataset
including the overlapping features, column (3) would yield a positively significant coefficient of 10.5 percent for the
diagonal intersection,a positively significant coefficient of 20.9 percent for the curvature, a negatively significant
coefficient of 12.9 percent for the setbacks, and a positively significant coefficient of 16.5 percent for the podium
extrusion.
30

Acknowledgements
This research was supported by Real Capital Analytics, JLL, EY, Compstak, and Center for Real Estate
Class of 1988 Memorial Fund.
31
Related Documents