1 The Use of Financial Inclusion Data Country Case Study: SOUTH AFRICA The Mzansi Story and Beyond Prepared by: The National Treasury, South Africa and the AFI Financial Inclusion Data Working Group on behalf of the Data and Measurement sub-group of the Global Partnership for Financial Inclusion January 2014

The use of financial inclusion data country case study south africa(1)
Aug 12, 2015
Welcome message from author
This document is posted to help you gain knowledge. Please leave a comment to let me know what you think about it! Share it to your friends and learn new things together.
Transcript
1
The Use of Financial Inclusion Data Country Case
Study: SOUTH AFRICA
The Mzansi Story and Beyond
Prepared by: The National Treasury, South Africa
and the AFI Financial Inclusion Data Working Group
on behalf of the Data and Measurement sub-group of the
Global Partnership for Financial Inclusion
January 2014
2
SOUTH AFRICA – The Mzansi Story and Beyond
1. Country Context At the beginning of the millennium South Africa was still very much a country in transition. Whilst
the establishment of democracy in 1994 and the resultant constitutional changes and
developmental initiatives gave hope to millions of people, economic exclusion was still the reality
for a large proportion of South Africans. The Government recognised at the time that access to
financial services is one of the key stepping stones on the path to sustainable economic
development. As a clear governmental policy objective was (and remains) redressing the skewed
development of the past, increasing pressure was being brought to bear on financial service
providers to actively extend access and improve usage of appropriate financial services by all South
Africans.
The financial services sector in South Africa is well developed and characterised in most sectors by
well-established private companies, with significant infrastructure and sophisticated operational
capabilities, a wide range of products covering multiple markets segments and typically well-
capitalised. The banking sector was a prime example of this, with the four major retail banks at the
time dominating the local retail market with a market share of approximately 90%. The banks were
cautious at that stage though, as the consequences of a credit bubble implosion has just led to a
run on some smaller banks and the demise of one of the most prominent smaller bank. Although
there were some notable movements to engage lower-income segments, the banks by-and-large
focussed on middle- and upper-income individuals and established business and corporate clients.
The concentrated nature of the industry also did not engender a sufficiently competitive
environment promoting innovation, which meant that new business models and innovative access
means were not high on the agenda.
State-owned financial services enterprises are the exception in South Africa, given the dominant
position of the private sector. However, the Postbank has been a financial services division of the
South African Post Office for many years. Although not a full bank, it offers savings and
transactional services through the national Post Office network.
2. Financial Inclusion Status in 2004 South Africa has a number of data sources on the uses of financial services. In the case of banks,
some supply-side data are available from the banks themselves, the industry representative body
(the Banking Council of South Africa, renamed the Banking Association of South Africa), the
regulator (the South African Reserve Bank), the Payments Association of South Africa and
independent payments service providers. Demand-side data is measured through a number of
national surveys, the most pertinent being the annual FinScope surveys conducted by FinMark Trust,
a South African NGO focusing on advancing financial inclusion now extending its services to other
African and Asian countries. FinScope survey results are validated through comparison with other
national surveys, notably the All Media and Products Study of the South African Audience Research
Foundation, formerly the South African Advertising Research Foundation.
An assessment of basic financial inclusion in South Africa based on FinScope data revealed the
following for formally banked adults in 2004:
3
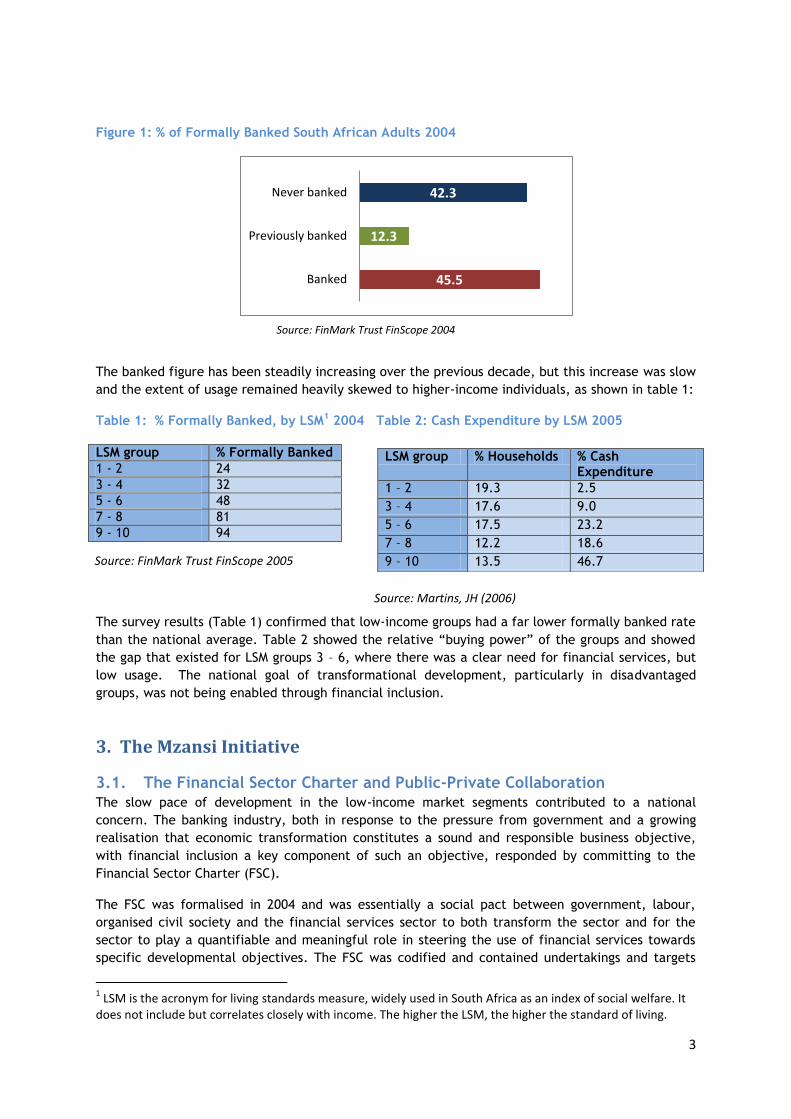
Figure 1: % of Formally Banked South African Adults 2004
The banked figure has been steadily increasing over the previous decade, but this increase was slow
and the extent of usage remained heavily skewed to higher-income individuals, as shown in table 1:
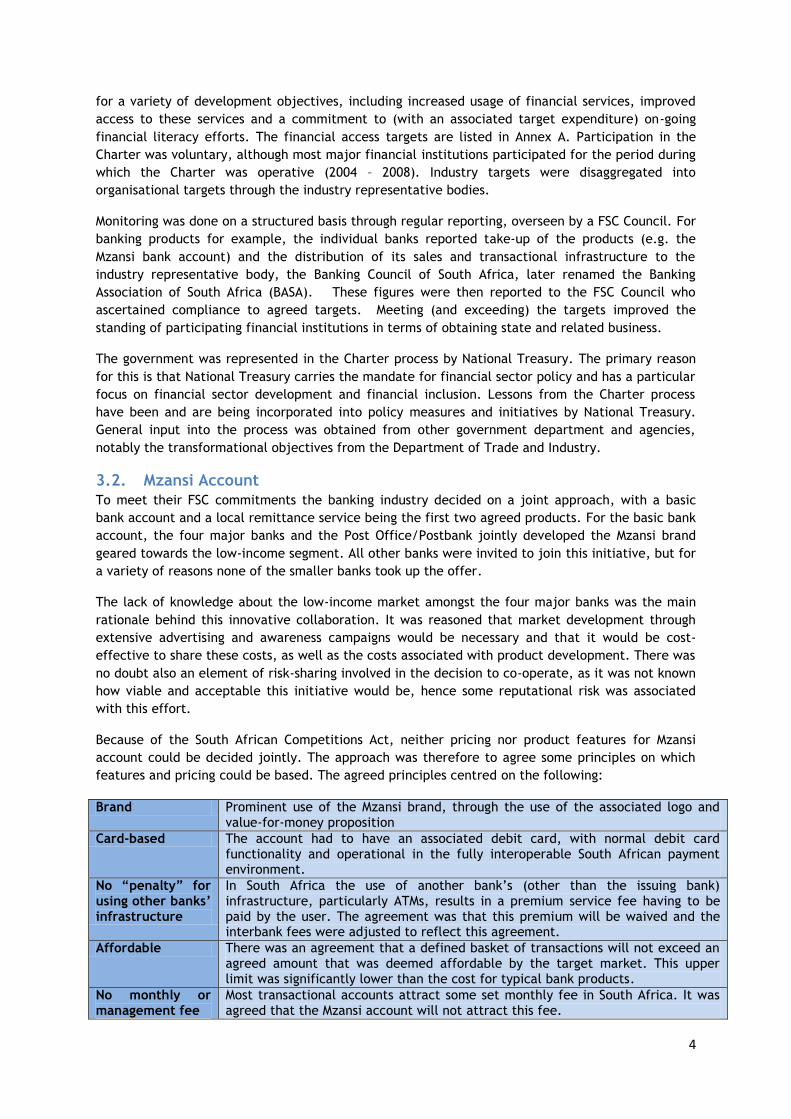
Table 1: % Formally Banked, by LSM1 2004 Table 2: Cash Expenditure by LSM 2005
LSM group % Formally Banked
1 - 2 24
3 - 4 32
5 - 6 48
7 - 8 81
9 - 10 94
The survey results (Table 1) confirmed that low-income groups had a far lower formally banked rate
than the national average. Table 2 showed the relative “buying power” of the groups and showed
the gap that existed for LSM groups 3 – 6, where there was a clear need for financial services, but
low usage. The national goal of transformational development, particularly in disadvantaged
groups, was not being enabled through financial inclusion.
3. The Mzansi Initiative
3.1. The Financial Sector Charter and Public-Private Collaboration
The slow pace of development in the low-income market segments contributed to a national
concern. The banking industry, both in response to the pressure from government and a growing
realisation that economic transformation constitutes a sound and responsible business objective,
with financial inclusion a key component of such an objective, responded by committing to the
Financial Sector Charter (FSC).
The FSC was formalised in 2004 and was essentially a social pact between government, labour,
organised civil society and the financial services sector to both transform the sector and for the
sector to play a quantifiable and meaningful role in steering the use of financial services towards
specific developmental objectives. The FSC was codified and contained undertakings and targets
1 LSM is the acronym for living standards measure, widely used in South Africa as an index of social welfare. It
does not include but correlates closely with income. The higher the LSM, the higher the standard of living.
45.5
12.3
42.3
Banked
Previously banked
Never banked
LSM group % Households % Cash Expenditure
1 – 2 19.3 2.5
3 – 4 17.6 9.0
5 – 6 17.5 23.2
7 – 8 12.2 18.6
9 – 10 13.5 46.7
Source: Martins, JH (2006)
Source: FinMark Trust FinScope 2005
Source: FinMark Trust FinScope 2004
4
for a variety of development objectives, including increased usage of financial services, improved
access to these services and a commitment to (with an associated target expenditure) on-going
financial literacy efforts. The financial access targets are listed in Annex A. Participation in the
Charter was voluntary, although most major financial institutions participated for the period during
which the Charter was operative (2004 – 2008). Industry targets were disaggregated into
organisational targets through the industry representative bodies.
Monitoring was done on a structured basis through regular reporting, overseen by a FSC Council. For
banking products for example, the individual banks reported take-up of the products (e.g. the
Mzansi bank account) and the distribution of its sales and transactional infrastructure to the
industry representative body, the Banking Council of South Africa, later renamed the Banking
Association of South Africa (BASA). These figures were then reported to the FSC Council who
ascertained compliance to agreed targets. Meeting (and exceeding) the targets improved the
standing of participating financial institutions in terms of obtaining state and related business.
The government was represented in the Charter process by National Treasury. The primary reason
for this is that National Treasury carries the mandate for financial sector policy and has a particular
focus on financial sector development and financial inclusion. Lessons from the Charter process
have been and are being incorporated into policy measures and initiatives by National Treasury.
General input into the process was obtained from other government department and agencies,
notably the transformational objectives from the Department of Trade and Industry.
3.2. Mzansi Account
To meet their FSC commitments the banking industry decided on a joint approach, with a basic
bank account and a local remittance service being the first two agreed products. For the basic bank
account, the four major banks and the Post Office/Postbank jointly developed the Mzansi brand
geared towards the low-income segment. All other banks were invited to join this initiative, but for
a variety of reasons none of the smaller banks took up the offer.
The lack of knowledge about the low-income market amongst the four major banks was the main
rationale behind this innovative collaboration. It was reasoned that market development through
extensive advertising and awareness campaigns would be necessary and that it would be cost-
effective to share these costs, as well as the costs associated with product development. There was
no doubt also an element of risk-sharing involved in the decision to co-operate, as it was not known
how viable and acceptable this initiative would be, hence some reputational risk was associated
with this effort.
Because of the South African Competitions Act, neither pricing nor product features for Mzansi
account could be decided jointly. The approach was therefore to agree some principles on which
features and pricing could be based. The agreed principles centred on the following:
Brand Prominent use of the Mzansi brand, through the use of the associated logo and value-for-money proposition
Card-based The account had to have an associated debit card, with normal debit card functionality and operational in the fully interoperable South African payment environment.
No “penalty” for using other banks’ infrastructure
In South Africa the use of another bank’s (other than the issuing bank) infrastructure, particularly ATMs, results in a premium service fee having to be paid by the user. The agreement was that this premium will be waived and the interbank fees were adjusted to reflect this agreement.
Affordable There was an agreement that a defined basket of transactions will not exceed an agreed amount that was deemed affordable by the target market. This upper limit was significantly lower than the cost for typical bank products.
No monthly or management fee
Most transactional accounts attract some set monthly fee in South Africa. It was agreed that the Mzansi account will not attract this fee.
5
One free cash deposit
Cash deposits (as opposed to electronic or cheque deposits) typically attract a fee in South Africa. It was agreed that Mzansi account holders will have one free cash deposit transaction per month.
Use of Post Office branches
Mzansi account holders could withdraw funds and do basic enquiries at Post Office branches, irrespective of the bank involved in the issuing of the account.
Use of AML/CFT exceptions
It was agreed that Exemption 17 (see below) will be incorporated in the opening procedure of all Mzansi accounts.
Since banks were concerned, unnecessarily as it turned out, that there will be an erosion of
revenue in their existing low-income products, both maximum balances and a limited range of
transactions were introduced by individual institutions. Over time this proved counter-productive as
these limitations reduced transaction volumes and reduced Mzansi revenue, as compared to
established products, so the transaction limitations were gradually removed.
South African AML/CFT legislation was introduced in 2001 in the form of the Financial Intelligence
Centre Act. Although the regulations did define appropriate measures for lower risk situations,
these were not practical for the roll-out of a product like the Mzansi account. An agreement was
reached with the regulator to introduce an adjustment (Exemption 17) that would still ensure that
all clients are identified and verified, but that physical address details need not be verified. This
was particularly relevant for the low-income segment, as a large percentage of potential clients
simply did not have a verifiable address. The fact that a national identity system, with appropriate
documentation, was well-entrenched aided significantly in efficient client on-boarding.
The roles of the Post Office and the Postbank need some clarification. The Postbank participated as
an issuing bank and converted most of their existing savings account base into Mzansi accounts over
time, taking advantage of the reduced interbank fees associated with the use of ATMs (Postbank
had no ATM base). The Post Office, apart from providing the transactional network for the
Postbank, also made their network available for transactional use by all Mzansi account holders.
During the first year significant joint marketing was undertaken, with joint awareness campaigns
and literacy efforts. Thereafter marketing efforts and awareness campaigns were undertaken
individually by each institution, but still using the established Mzansi brand.
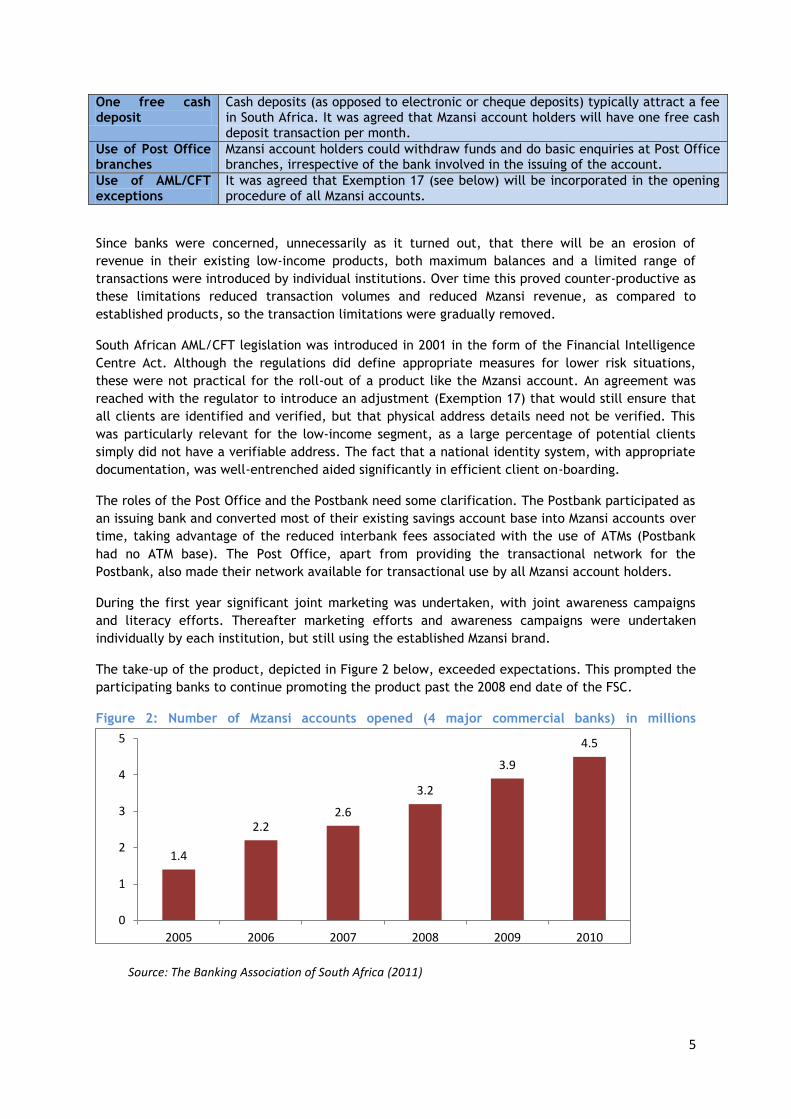
The take-up of the product, depicted in Figure 2 below, exceeded expectations. This prompted the
participating banks to continue promoting the product past the 2008 end date of the FSC.
Figure 2: Number of Mzansi accounts opened (4 major commercial banks) in millions
1.4
2.2 2.6
3.2
3.9
4.5
0
1
2
3
4
5
2005 2006 2007 2008 2009 2010
Source: The Banking Association of South Africa (2011)
6
The Postbank did not report sales figures separately, but the registration of all Mzansi accounts at
Bankserv (now BankservAfrica), the major payment systems operator in South Africa, enabled a
reliable estimate of at least 6 million Mzansi accounts opened in total. Given an adult population of
approximately 30 million at the time, this was a significant achievement. This number, coupled
with the market feedback that 72%2 of the signed-up base stated that the Mzansi account was the
first bank account that they opened, meant that the objective of attracting unbanked people was
largely being met.
3.3. Increased access as part of the initiative
Part of the FSC targets included improved physical access, both in terms of acquiring financial
products (sales points), as well as transaction points. The overarching objective was to bring
financial services within reach of everyone. The initial targets were agreed as follows:
At least 80% of the target market (LSM 1 – 5) must be within 20 km of a service point
(branch or ATM)
At least 80% of the same target market must also be within 20km of a transaction point
(non-ATM, but where an electronic transaction can be performed)
These targets were easily met and were later amended to 15 km for service points and 10 km for
transaction points soon after the commencement of the FSC. The revised targets were also met by
2008.
The measurement of progress towards the target and its subsequent upgrading were made possible
by the monitoring of the points of presence through geospatial information mapping, matching the
points of presence to population centres and densities. This exercise also relied on the banks to
provide geocoded information on all points of presence to the industry representative body, who
commissioned a 3rd party service provider to map this data to the available census data, with LSM
categories, and provide a realistic measure of meeting the objectives.
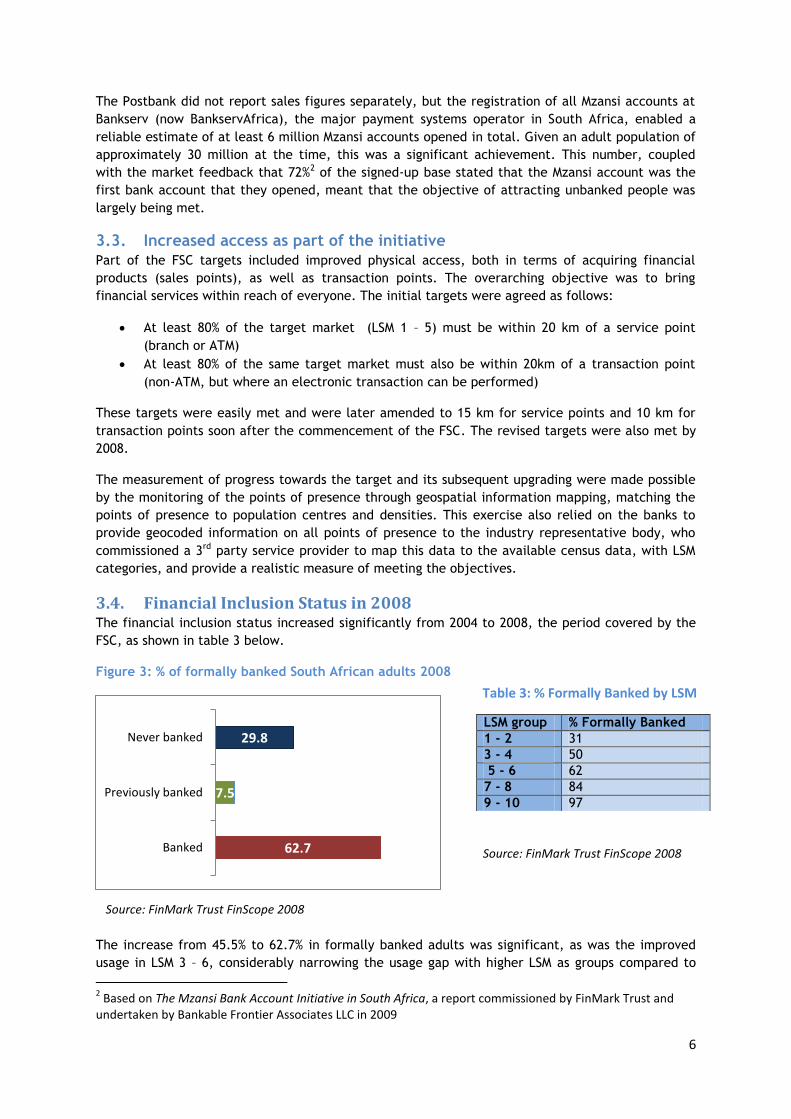
3.4. Financial Inclusion Status in 2008 The financial inclusion status increased significantly from 2004 to 2008, the period covered by the
FSC, as shown in table 3 below.
Figure 3: % of formally banked South African adults 2008
The increase from 45.5% to 62.7% in formally banked adults was significant, as was the improved
usage in LSM 3 – 6, considerably narrowing the usage gap with higher LSM as groups compared to
2 Based on The Mzansi Bank Account Initiative in South Africa, a report commissioned by FinMark Trust and
undertaken by Bankable Frontier Associates LLC in 2009
62.7
7.5
29.8
Banked
Previously banked
Never bankedLSM group % Formally Banked
1 - 2 31
3 - 4 50
5 - 6 62
7 - 8 84
9 - 10 97
Table 3: % Formally Banked by LSM
Source: FinMark Trust FinScope 2008
Source: FinMark Trust FinScope 2008
7
2004. These figures underscored the conclusion that the Mzansi account was primarily used by the
intended market segments. The same survey data also indicated that the increase in the formally
banked indicator was not only due to the number of Mzansi accounts introduced, but to the
continued take-up of other low-income products offered by the banks.
3.5. Was the Mzansi account successful? The Mzansi initiative was successful in promoting take-up of bank accounts, but much less so in
promoting their usage. There has been much discussion about the relatively low rate of usage of
Mzansi accounts, the low average balances compared to other products, and the low rate of active
accounts. There is no doubt that active use of the account, particularly for first-time users,
requires on-going support and reinforcement. To what extent the lower average balances is the
result of the lower LSM levels being the primary users as opposed to inadequate product features
and insufficient client literacy engagement is a moot point; it is probably the result of a number of
factors.
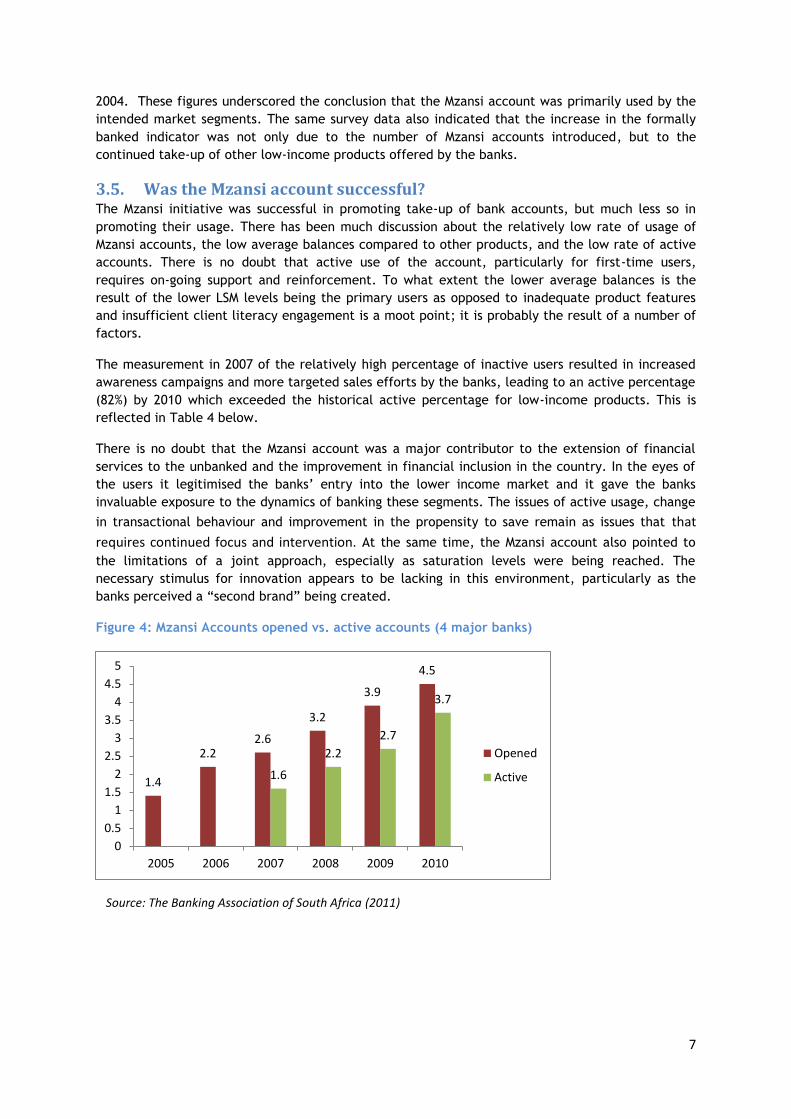
The measurement in 2007 of the relatively high percentage of inactive users resulted in increased
awareness campaigns and more targeted sales efforts by the banks, leading to an active percentage
(82%) by 2010 which exceeded the historical active percentage for low-income products. This is
reflected in Table 4 below.
There is no doubt that the Mzansi account was a major contributor to the extension of financial
services to the unbanked and the improvement in financial inclusion in the country. In the eyes of
the users it legitimised the banks’ entry into the lower income market and it gave the banks
invaluable exposure to the dynamics of banking these segments. The issues of active usage, change
in transactional behaviour and improvement in the propensity to save remain as issues that that
requires continued focus and intervention. At the same time, the Mzansi account also pointed to
the limitations of a joint approach, especially as saturation levels were being reached. The
necessary stimulus for innovation appears to be lacking in this environment, particularly as the
banks perceived a “second brand” being created.
Figure 4: Mzansi Accounts opened vs. active accounts (4 major banks)
1.4
2.2 2.6
3.2
3.9
4.5
1.6
2.2
2.7
3.7
0
0.5
1
1.5
2
2.5
3
3.5
4
4.5
5
2005 2006 2007 2008 2009 2010
Opened
Active
Source: The Banking Association of South Africa (2011)
8
4. What happened after Mzansi?
4.1. Further Exploration of the Low-income Market The Financial Sector Charter was not applicable after 2008, although banks continued to market
the Mzansi product. However, momentum was certainly not the same as in the years immediately
following 2004 and take-up levels declined. There was also feedback from the market that the
Mzansi account was perceived as a “poor man’s” account, because it was positioned separately
from other bank products.
The banks, including innovative smaller banks, also intensified the exploration of new business
models. There were some major initiatives in the mobile space, exploring different versions of a
branchless banking model, with some of those initiatives still on-going. There were also a number
of initiatives involving co-operation between retailers and banks, with some essentially offering a
banking service through a retailer, whilst others focussed on more limited services, e.g. store-to-
store remittances enabled through the banking infrastructure. Some of the initiatives were not
successful, whilst others (the remittance service being one) continue to be successful to this day.
It is fair to characterise this period as one where institutions were using their newly-found appetite
for the lower-income market to explore new territories with new partners, but the impact on
improving financial inclusion in terms of the percentage of banked adults was negligible (see figure
5 below). The effect of the global economic situation and the reduction in growth rates was a
further exacerbating factor in this muted impact.
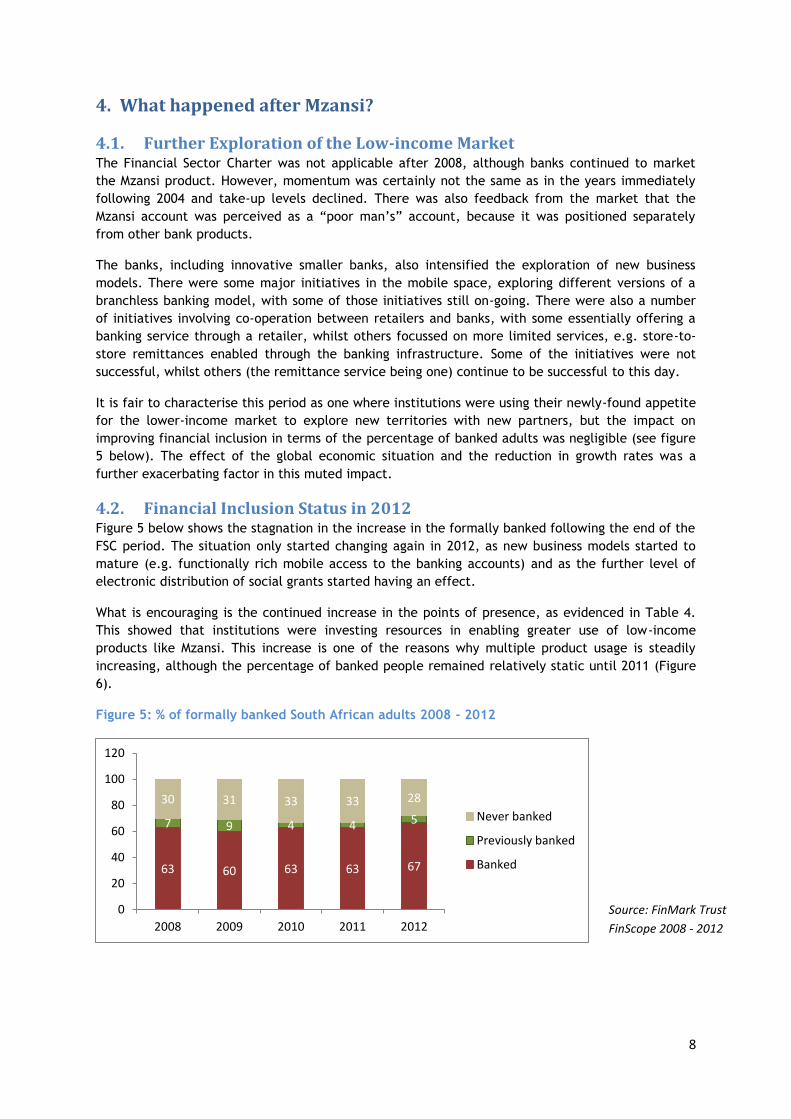
4.2. Financial Inclusion Status in 2012 Figure 5 below shows the stagnation in the increase in the formally banked following the end of the
FSC period. The situation only started changing again in 2012, as new business models started to
mature (e.g. functionally rich mobile access to the banking accounts) and as the further level of
electronic distribution of social grants started having an effect.
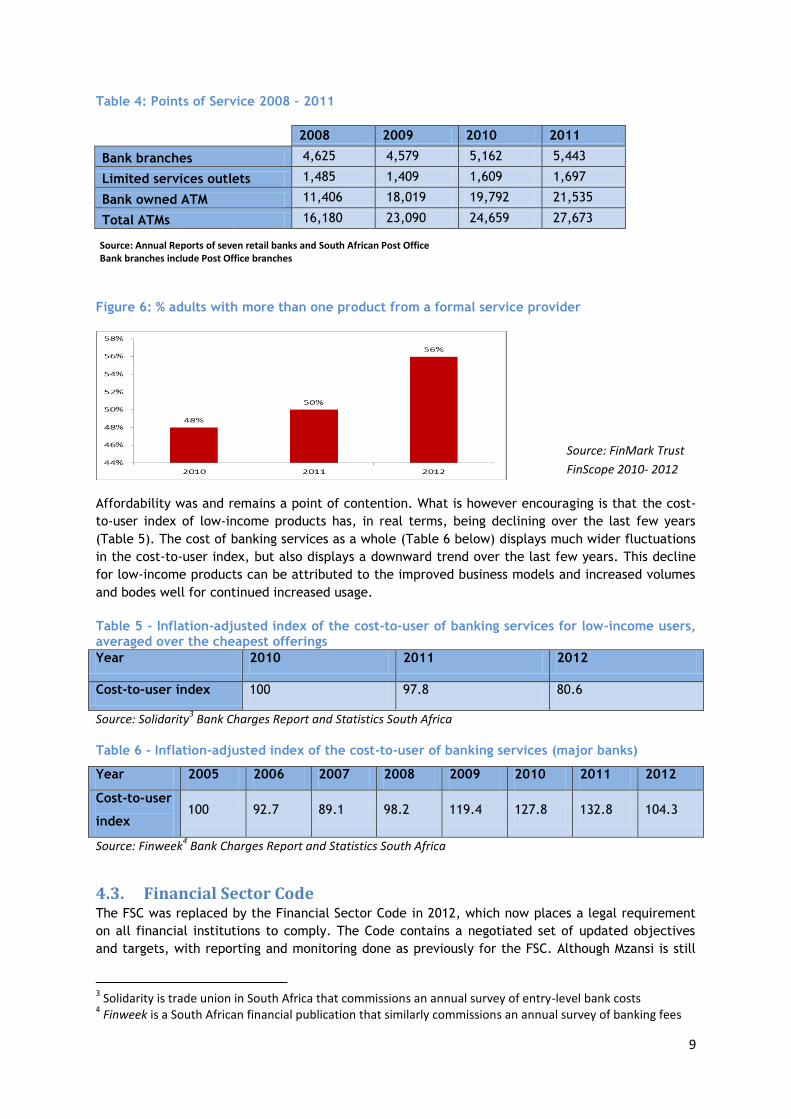
What is encouraging is the continued increase in the points of presence, as evidenced in Table 4.
This showed that institutions were investing resources in enabling greater use of low-income
products like Mzansi. This increase is one of the reasons why multiple product usage is steadily
increasing, although the percentage of banked people remained relatively static until 2011 (Figure
6).
Figure 5: % of formally banked South African adults 2008 - 2012
63 60 63 63 67
7 9 4 4 5
30 31 33 33 28
0
20
40
60
80
100
120
2008 2009 2010 2011 2012
Never banked
Previously banked
Banked
Source: FinMark Trust
FinScope 2008 - 2012
9
Table 4: Points of Service 2008 – 2011
2008 2009 2010 2011
Bank branches 4,625 4,579 5,162 5,443
Limited services outlets 1,485 1,409 1,609 1,697
Bank owned ATM 11,406 18,019 19,792 21,535
Total ATMs 16,180 23,090 24,659 27,673
Figure 6: % adults with more than one product from a formal service provider
Affordability was and remains a point of contention. What is however encouraging is that the cost-
to-user index of low-income products has, in real terms, being declining over the last few years
(Table 5). The cost of banking services as a whole (Table 6 below) displays much wider fluctuations
in the cost-to-user index, but also displays a downward trend over the last few years. This decline
for low-income products can be attributed to the improved business models and increased volumes
and bodes well for continued increased usage.
Table 5 - Inflation-adjusted index of the cost-to-user of banking services for low-income users, averaged over the cheapest offerings
Year 2010 2011 2012
Cost-to-user index 100 97.8 80.6
Source: Solidarity3 Bank Charges Report and Statistics South Africa
Table 6 - Inflation-adjusted index of the cost-to-user of banking services (major banks)
Year 2005 2006 2007 2008 2009 2010 2011 2012
Cost-to-user
index 100 92.7 89.1 98.2 119.4 127.8 132.8 104.3
Source: Finweek4 Bank Charges Report and Statistics South Africa
4.3. Financial Sector Code The FSC was replaced by the Financial Sector Code in 2012, which now places a legal requirement
on all financial institutions to comply. The Code contains a negotiated set of updated objectives
and targets, with reporting and monitoring done as previously for the FSC. Although Mzansi is still
3 Solidarity is trade union in South Africa that commissions an annual survey of entry-level bank costs
4 Finweek is a South African financial publication that similarly commissions an annual survey of banking fees
Source: Annual Reports of seven retail banks and South African Post Office Bank branches include Post Office branches
Source: FinMark Trust
FinScope 2010- 2012
10
mentioned, the agreed product standards are now generic, dealing with affordability,
appropriateness, clear communication of features and costs, non-discrimination, as well as some
operational efficiency guidelines like payment inter-operability. The on-going focus on financial
literacy and easy-to-use market-conduct support systems remain part of the agreed standards.
5. Key lessons
A national forum or platform is a key enabler
The Financial Sector Charter and Code structures are probably uniquely South African constructs,
given the historical imbalances from South Africa’s past political structures that have to be
addressed. However, similar national platforms are key elements in advancing financial inclusion in
a sustainable and beneficial way. The buy-in of the financial institutions and the support of
government and society are all necessary to move forward. The period between the end of the FSC
and the beginning of the Financial Sector Code provides evidence that a lack of focus leads to a
lack of momentum in advancing financial inclusion.
A holistic approach, with a developmental mind set, is required
Given the dependency of improving financial inclusion on an eco-system of enabling initiatives and
basic infrastructure, it is imperative that the developmental links are established and addressed
simultaneously, in as far as that is possible. Simply making sure someone has a bank account is but
the beginning of the real challenge – the capability and opportunity to use this service to start
actually improving lives are areas that have to be addressed.
Measurement, agreed indicators, targets and monitoring are prerequisites
It is pointless starting an initiative without an assessment of the current status. Similarly, informed
and specific targets focus efforts and drive initiatives. Monitoring the effect of initiatives in a
quantifiable way is the only way in which to realise that adjustments are necessary.
Adjust the approach over time, where necessary
Based on indicators, changes in the environment can be detected and should be acted on. The
decline in the take-up rate for Mzansi accounts and the market feedback that perceptions were
changing from positive to a “poor man’s” product were clear indications that the end of the joint
effort had been reached and that full competitive forces, within the agreed framework of the
Financial Sector Code, should be utilised and encouraged.
Reference
Martins, JH. 2006. Household Cash Expenditure by Living Standards Measure Group. Journal of
Family Ecology and Consumer Sciences, Vol. 34, 2006.
11
Annexure A Financial Sector Charter
The following is not the complete Charter, but just those points directly pertinent to financial
inclusion. It is quoted verbatim, except where references have been replaced with comments in
italics.
8. Access to Financial Services.
8.2 In terms of the Declaration of the Financial Sector Summit on 20th August 2002, it was agreed
that strategies would be put in place to ensure that the financial sector is more efficient in
the delivery of financial services, which enhance the accumulation of savings and direct
them to development initiatives. Insofar as it relates to access to financial services, specific
actions were agreed in relation to:
Ensuring the provision of first order retail financial services including:
sustainable and affordable banking services;
contractual saving schemes; and
credit for small and micro enterprise and poor households.
the development of sustainable institutions to serve poor communities;
the regulation of Credit Bureaux;
discrimination;
HIV/AIDS; and
supporting higher levels of savings and investment overall.
a. In respect of this charter, the financial sector commits itself to substantially increase
effective access to first order retail financial services to a greater segment of population
within LSM 1-5. The financial sector specifically undertakes:
i. by 2008 to make available appropriate first order retail financial service, affordably priced
and though appropriate and accessible physical and electronic infrastructure such that:
80% of LSM 1-5 have effective access to bank services (as defined)
80% of LSM 1-5 have effective access to bank services products (as defined)
a percentage (to be settled with the life insurance industry) of LSM 1-5 households
have effective access to life assurance industry products and services(as defined)
1% of LSM 1-5 plus 250,000 have effective access to formal collective investment
saving products and services (as defined); and
6% of LSM 1-5 plus 250,000 have effective access to formal collective investment
saving products and services (as defined).
12
ii. in accordance with the arrangements concluded with Government and DFI’s (as defined) to
originate the low-income housing loans, agricultural development loans, and loans to black
SME’s necessary to achieve the desire breakdown of targeted investments (as established).
For the purposes of determining the value of loans originated in terms of this paragraph,
any loan which falls within the definition of the first order retail financial services or
product (as defined) will be taken into account.
iii. Each sub-sector will determine, in consultation with the Charter Council how the sub-sector
targets will be divided between the individual financial institutions in the sub-sector.
b. Each financial institution commits, from the effective date of the charter to 2008, to
annually invest a minimum of 0.2% of post tax operating profits in consumer education.
Consumer education will include programmes that are aimed at empowering consumers with
knowledge to enable them to make more informed decisions about their finances and
lifestyles
c. The financial sector furthermore commits to:
the elimination of discrimination in the provision of financial services;
supporting the establishment of third tier community based financial organization or
alternative financial institutions.
Related Documents