The use of Clarias gariepinus and associated helminthic parasites as bio-indicators of metal pollution in a subtropical ecosystem RS Pienaar orcid.org 0000-0001-9166-3915 Dissertation accepted in fulfilment of the requirements for the degree Masters of Science in Environmental Sciences at the North-West University Supervisor: Prof NJ Smit Co-supervisor: Dr RJL Gerber Graduation May 2020 24140430

Welcome message from author
This document is posted to help you gain knowledge. Please leave a comment to let me know what you think about it! Share it to your friends and learn new things together.
Transcript
1
The use of Clarias gariepinus and associated helminthic parasites as
bio-indicators of metal pollution in a subtropical ecosystem
RS Pienaar
orcid.org 0000-0001-9166-3915
Dissertation accepted in fulfilment of the requirements for the degree Masters of Science in Environmental Sciences at the
North-West University
Supervisor: Prof NJ Smit Co-supervisor: Dr RJL Gerber
Graduation May 2020 24140430
i
Acknowledgements: I would like to extend my sincere gratitude to and acknowledge the following people and
organisations for their valuable contributions during this project:
● To my supervisors, Prof. Nico Smit and Dr. Ruan Gerber for all your guidance, patience,
support and assistance in the field and in the lab as well as all the time spent reviewing
and providing guidance and direction for my dissertation. I would also like to thank you for
assisting me with my Project topic.
● To the National Research Foundation (NRF) for the financial assistance with this project
(NRF project IFR170210222411 grant 109352, NJ Smit, PI). Opinions expressed and
conclusions arrived at are those of the author and are not necessarily those of the NRF.
● To the Water Research Commission (WRC) and GreenMatter for their financial support
with a personal study bursary.
● To Ezemvelo KZN Wildlife for allowing us to sample within the Ndumo Game Reserve, to
Catharine Hanekom, Regional Ecologist of uMkhanyakude; Bongani Gumede, Section
Ranger of Ndumo Game Reserve; and Andile Mhlongo, Conservation Manager of Ndumo
Game Reserve. To all other staff at Ndumo Game Reserve for their friendly smiles and
always being willing to help with any type of problem.
● To the North-West University (NWU) and the Water Research Group (WRG) for the use
of their equipment and facilities for the project.
● To all my fellow postgraduates at the WRG, with a special mention of Dr. Lizaan de
Necker, Divan van Rooyen, Hannes Erasmus, Anja Greyling, Marelize Labuschagne and
Chantelle Pretorius for their assistance in the field and lab as well as guidance with
statistics and the creation of my map.
● To Renier Posthumus for the proof reading and the necessary editorial changes.
● A special thanks to Timmy for keeping me company and listening to me during all the early
mornings and late nights at the office.
● To my family (Pappa, Mamma, Sussie en Boetie), the most important people in my life,
thank you for all your love and support during the study and especially the period of the
write-up.
● Lastly, I would like to thank God for giving me the strength to complete my MSc.
ii
Summary: Metals are naturally occurring elements that play an important role in the functioning of organisms.
However, imbalances in metal concentrations in the environment are of great concern due to their
potential detrimental nature. Since the start of the Anthropocene, humans have increased their
impact on the environment through anthropogenic activities such as mining, over-exploitation,
deforestation, gas emission and pollution. Metals are non-biodegradable and thus will
bioaccumulate in organisms that are exposed to metals for extended periods of time. Metals can
also biomagnify to higher levels in the food chain, with top predators potentially having the highest
levels of metal concentrations. The accumulation of metals along the food chain can have serious
health implications for humans consuming these organisms. For example, lead can cause renal
failure, mercury and cadmium can cause kidney problems, whilst zinc and copper can lead to
nephritis.
Aquatic ecosystems are under constant threat of metal pollution because of runoff into these
ecosystems. Lotic and lentic ecosystems act as a sink for metals with metals being adsorbed in
the sediment and building up to high concentrations. Metals in aquatic ecosystems are readily
available for organisms to accumulate. It is therefore of the utmost importance to detect metal
pollution in aquatic ecosystems as early as possible. Scientists use a tool called biomonitoring to
assess environmental exposures to synthetic or natural chemicals by testing individual organisms ’
body fluids or tissue samples, i.e. using these organisms as bio-indicators. The technique uses
the knowledge that chemicals leave a footprint within cells after exposure. By measuring the mark
after exposure, the amount of chemicals entering the organisms from the environment can be
indicated. Biomonitoring is therefore a very important tool to assess pollution levels in the
environment.
The bio-indicator approach involves the measurement of the response of an organism from
molecular to community levels. For the purposes of this study, Clarias gariepinus and its
associated endohelminth parasites were used as bio-indicators of metals in three different aquatic
systems located in the Ndumo Game Reserve (NGR). The three aquatic systems consist of a
freshwater lotic system: The Usuthu River, which flows along the northern border of NGR, a
freshwater lentic system: Shokwe Pan and a saline lentic system: Nyamithi Pan. Clarias
gariepinus is an omnivorous and bottom-dwelling fish that has a long life-span and is therefore a
good species to use as a bio-indicator of metal pollution. Parasites are found in all ecosystems
on Earth and can be present at high abundances. Parasites feed on their hosts and are therefore
classified as occupying a higher level in the food chain than their hosts. Clarias gariepinus in NGR
iii
is infected with five different endohelminth parasites, two of which are cestodes and three
nematodes. The two cestode species are the Proteocephalus sp. and Tetracampos ciliotheca
located in the intestine of their hosts. The three nematode species are the Contracaecum sp.
located in the body cavity of their host, Procamallanus pseudolaeviconchus located in the
stomach of their hosts and Paracamallanus cyathopgharynx located in the rectum of their hosts.
For this reason, the study chose C. gariepinus and its associated helminth parasites.
The metals tested for in the study were the essential metals (Fe, Co, Ni, Zn and Cu) and the non-
essential metals (Al, Mn, As, Cd, Pb, Se and Ag) and the biological responses tested for were
cellular energy allocation (CEA), metallothioneins (MTs) and reduced glutathione (GSH). In order
to determine the metal concentrations of the different samples, the sediment, host tissues and
parasites were freeze dried and microwave digested in 2.5 mL nitric acid and 7.5 mL 32%
hydrochloric acid and the water samples were acidified with nitric acid, whereafter the metal
concentrations were measured using standard inductively coupled plasm mass spectrometry.
Univariate statistics were analysed using GraphPad Prism®7 software, where homogeneity was
tested using the Shapiro-Wilk test, one-way analysis of variance (ANOVA) with Tukey post-hoc
analysis or a Kruskal-Wallis followed with Dunn’s multiple comparisons to determine significance.
Multivariate statistics were analysed using SPSS version 18 (PAWS Statistics, IBM, USA) to
perform a Discriminant Function Analysis (DFA) and Canoco version 5 (Ter Braak & Smilauer,
2012) was used to perform a redundancy analysis (RDA).
The results showed that the freshwater lentic system had the highest levels of metals in the
sediment whilst the saline lentic system had the highest levels of metals in the water. The
freshwater lotic system had the lowest levels of metals in the environment. The results also
showed that the NGR was close to a natural state with no visible human impact on the aquatic
systems, and the metal concentrations were below that of other impacted areas in South Africa.
After the environmental concentrations were measured, the metal concentrations in the muscle
and liver tissues of C. gariepinus were compared to the metal concentrations in the environment.
The study found that C. gariepinus at the three different sites accumulated metals to a higher level
than present in the environment and they can therefore be used as a bio-indicators of metals in
natural ecosystems. The catfish in the freshwater lentic systems accumulated metals to higher
levels than the catfish in the saline lentic and freshwater lotic systems. The catfish in the saline
lentic system showed the lowest amounts of accumulation. After the bioaccumulation of C.
gariepinus was determined its endohelminth parasites were evaluated as bio-indicators of metals.
iv
The study found that the five endohelminth parasites had higher concentrations of all the metals
than their host muscle tissues and higher than most of the liver tissues. The study therefore found
that endohelminth parasites could be used as bio-indicators of metal pollution and could even be
better indicators than their hosts by accumulating metals to higher levels than their hosts. The
different aquatic systems played a role in the accumulation of metals in the parasites with the
Nyamithi catfish parasites accumulating the least amount of metals. Of the five helminth parasites,
the cestode species Tetracampos ciliotheca had the highest bioaccumulation rates while the body
cavity nematode Contracaecum sp. had the lowest bioaccumulation. The study thus established
that NGR was in a natural state, that C. gariepinus accumulated environmental metal
concentrations to higher levels in their tissues and that endohelminth parasites accumulated
metals to even higher levels. These findings could then be used to determine the effect of metals
on the biological response of both the C. gariepinus as well as the endohelminth parasites in their
respective environments.
The study found that there was a spatial difference in the biological response of C. gariepinus to
the accumulation of metals, with catfish in the lotic system having significantly higher
concentrations of metallothioneins than the catfish at the two lentic sites. The study also found
that the endohelminth parasites, Contracaecum sp., had lower concentrations of metallothioneins
(MT) than their hosts, but significantly higher levels of Glutathione reductase (GSH) than their
hosts. These findings indicate that Contracaecum sp. does not have the same ability as their
hosts to detoxify and remove metals from their systems. The biomarker responses indicate that
an increase in metal concentrations will have a negative impact on their hosts with a decrease in
energy. The study found that parasites had an effect on the biomarker response of their hosts to
metal concentrations in that the catfish with the least number of parasites had the highest
concentrations of MTs and the catfish with the highest number of parasites had the lowest
concentration of MTs. This is because the parasites help to remove metals from their hosts by
biomagnification, and therefore their host does not have to waste energy in removing the metals.
But the study found that the catfish with the highest number of parasites had the lowest available
energy because of the parasites feeding off the host. It is thus a “catch-22” situation where an
increase in parasites helps to deal with the effect of metals on their hosts but at a cost to their
hosts’ energy budget.
Key words: bioaccumulation, bio-indicator, biomagnification, biomonitoring, biomarkers, Cestoda,
Clarias gariepinus, host-parasite relationship, metallothioneins, Nematoda.
v
Table of Contents List of abbreviations: xviii
1. General introduction 1
1.1. Background 1
1.1.1. Metal pollution in aquatic ecosystems 1
1.1.2. Biomonitoring of ecosystems 2
1.1.3. Bio-indicators of metal contamination in aquatic ecosystems 3
1.1.3.1. Biomarkers of exposure 5
1.1.3.2. Biomarkers of effect 5
1.2. Hypotheses, aims and objectives 6
1.2.1. Hypotheses 7
1.2.2. Aims and objectives 8
1.2.3. Chapter layout 9
1.3. Potential impact 9
2. Current environmental metal concentrations of the selected study area 11
2.1. Introduction 11
2.2. Materials and methods 14
2.2.1. Study area 14
2.2.2. Site selection 15
2.2.3. Site description 16
2.2.3.1. Site 1: Usuthu River 16
2.2.3.2. Site 2: Shokwe Pan 17
2.2.3.3. Site 3: Nyamithi Pan 17
2.2.4. Sampling 19
2.2.5. Laboratory methods 19
2.2.5.1. Metal concentration in water samples 19
2.2.5.2. Metal concentration in sediment samples 19
vi
2.2.6. Statistical analysis 20
2.3. Results 21
2.3.1 Essential metals in water and sediment 21
2.3.2 Non-essential metals in water and sediment 23
2.4. Discussion 30
2.5. Conclusion 37
3. Bioaccumulation of essential and non-essential metals in the tissues of the bio-indicator –
Clarias gariepinus – from three sites with differing abiotic metal profiles. 38
3.1. Introduction 38
3.2. Materials and methods 40
3.2.1. Study area and sampling 40
3.2.2. Field collections 40
3.2.3. Laboratory analysis of tissues and quality control 40
3.2.4. Statistical analysis 41
3.3. Results 42
3.3.1. Biometric data of Clarias gariepinus across the three sites 42
3.3.2. Metal concentrations in hosts 42
3.3.2.1. Essential metals 43
3.3.2.2. Non-essential metals 46
3.3.3. Bioaccumulation factors of essential and non-essential metals (BAF) 54
3.4. Discussion 55
3.5. Conclusion 62
4. Bioaccumulation of metals in endohelminth parasites of Clarias gariepinus: correlation with
host accumulation, ecosystem type and infection site location-specific accumulation patterns. 63
4.1. Introduction 63
4.2. Materials and methods 66
4.2.1. Field collection 66
vii
4.2.2. Laboratory analysis of the body cavity nematode (Contracaecum sp.) and quality
control 66
4.2.3. Laboratory analysis of collected gastro-intestinal helminth parasites 68
4.2.4. Statistical analysis 70
4.3. Results: 70
4.3.1. Parasites collected: 70
4.3.2. Essential metal concentrations in parasites: 73
4.3.3. Non-essential metal concentrations in parasites: 77
4.3.4. Bioaccumulation factors for essential and non-essential metals (BAF) 81
4.3.5. Correlations between essential and non-essential metal concentrations in parasite
species and the environmental and host muscle and liver concentrations 83
4.3.6. Correlation between the metal concentrations of parasites and their environment in
both long and short-term accumulation 87
4.4. Discussion 89
4.5. Conclusion 93
5. Host-parasite systems: interactions of parasite load, biomarkers of exposure and biomarkers
of effect 95
5.1. Introduction 95
5.2. Materials and methods 97
5.2.1. Sampling 97
5.2.2. Biomarker of exposure 98
5.2.3. Tissue preparation for biomarkers of effect 98
5.2.4. Biomarker of effect 99
5.2.5. Cellular energy allocation in muscle tissue 99
5.2.5.1. Energy available (Ea) 100
5.2.5.2. Energy consumption (Ec) 101
5.2.5.3. CEA calculations 101
viii
5.2.6. Statistical analysis 101
5.3. Results 102
5.3.1. Biomarkers of effect 102
5.3.2. Correlations between the number of parasites and metal concentration in host
muscle tissue 107
5.3.3. Correlations between the number of parasites and metal concentrations in host liver
tissue 107
5.3.4. Effect of endohelminth infection rate on the long-term metal exposure 109
5.3.5. Effect of endohelminthic infection rate on the long-term metal exposure 110
5.3.6. Biomarker of effect 111
5.3.7. Biological response of Clarias gariepinus in terms of endohelminth parasite infection
114
5.3.8. Biomarker response of C. gariepinus in relation to accumulated metal
concentrations 116
5.3.9. Biomarker response of C. gariepinus in relation to different endohelminth parasite
numbers 119
5.3.10. Biological response of Contracaecum sp. in relation to their accumulation and
their environment (host accumulation) 121
5.4. Discussion 126
5.4.1. Effect of endohelminth parasites on their host biomarker responses 126
5.4.2. Biomarker of exposure 127
5.4.3. Biomarker of effect 128
5.5. Conclusion 130
6. Conclusion and recommendations 131
6.1. Conclusion 131
6.1.1. Lentic aquatic ecosystems 131
6.1.1.1. Freshwater lentic ecosystem (Shokwe Pan) 131
6.1.1.2. Saline lentic ecosystem (Nyamithi Pan) 132
ix
6.1.2. Lotic aquatic ecosystem (Usuthu River) 133
6.1.3. Parasites and biomarkers 134
6.1.4. General conclusions 135
6.2. Hypotheses 136
6.3. Recommendations 138
References 139
Appendices 172
x
List of Figures:
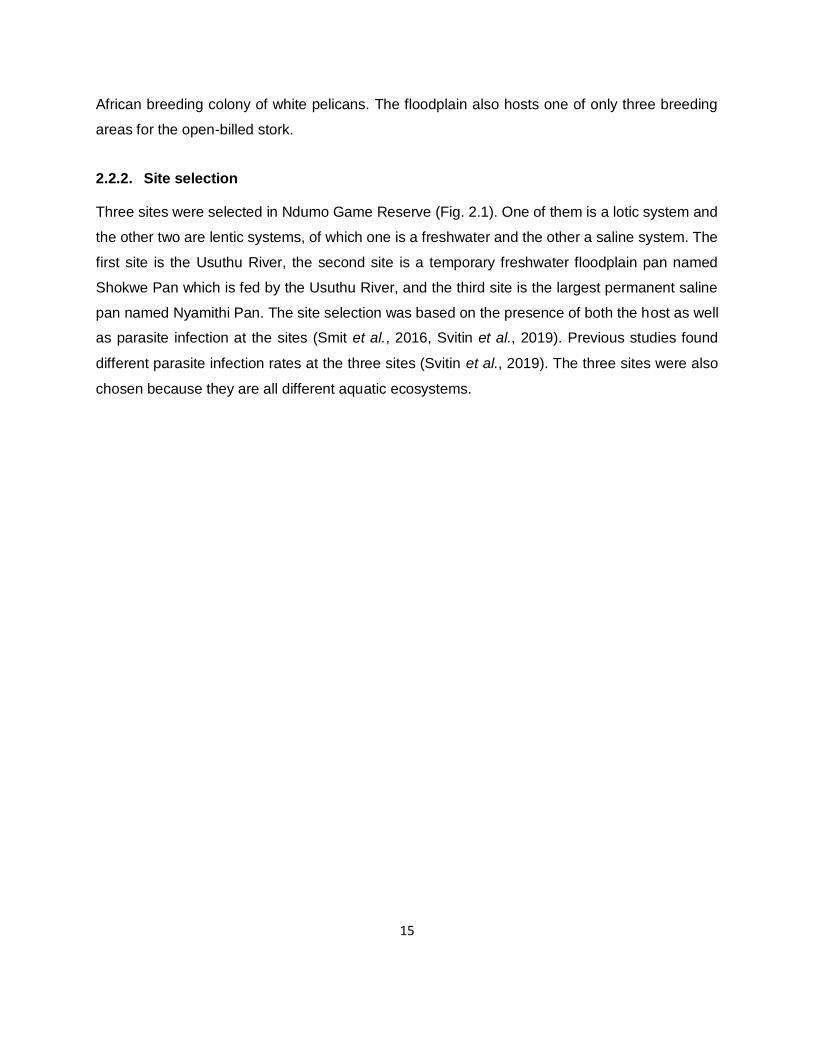
Figure 2-1: Map of the protected Ramsar site of the Ndumo Game Reserve with the three selected
sites indicated on the map – the sites are the lotic system: Usuthu River, the freshwater pan:
Shokwe Pan and the saline pan: Nyamithi Pan. ........................................................................16
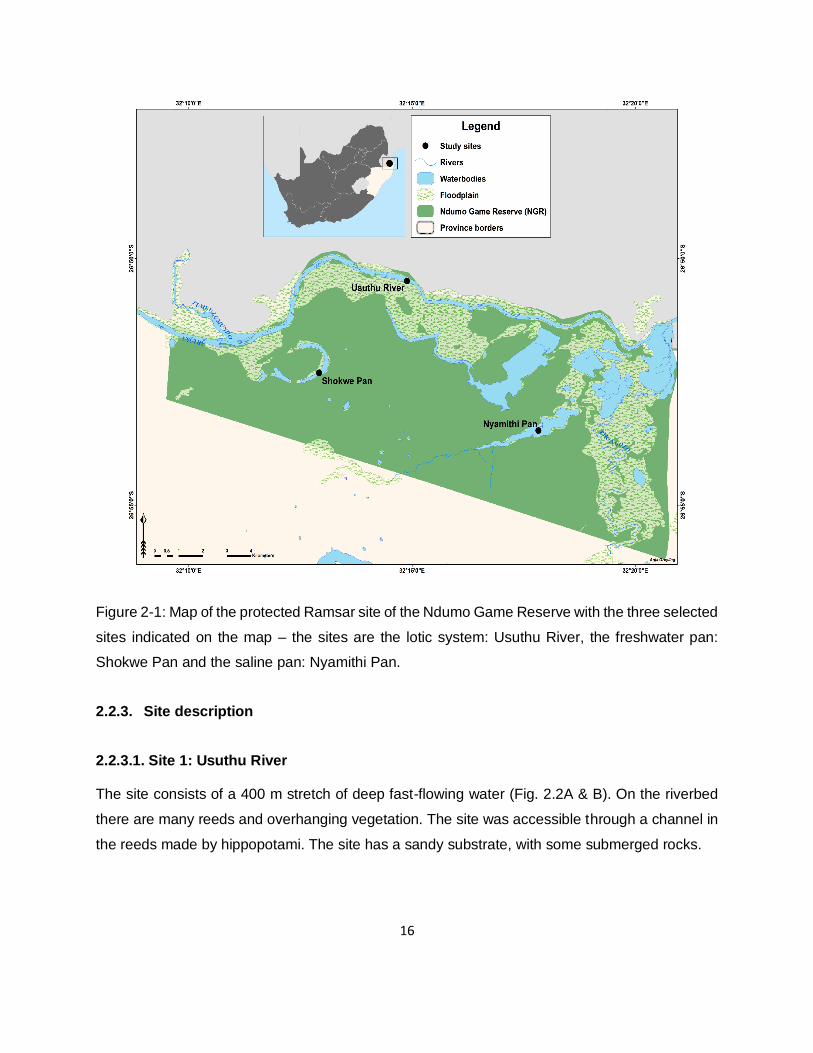
Figure 2-2: Photographs of the three selected sites and the typical marginal and aquatic
vegetation, showing firstly, the lotic system: Usuthu River (A & B), the lentic freshwater system:
Shokwe Pan (C & D) and the lentic saline system: Nyamithi Pan (E & F). .................................18
Figure 2-3: Bar graphs showing the concentration (mean and SEM) of different essential metals
(Fe, Co, Ni, Zn, Cu) in both the sediment and water across the three sites located in Ndumo Game
Reserve (common superscripts are used to indicate significant differences between sites). .....22
Figure 2-4: Bar graphs showing the concentration (mean and SEM) of different non-essential (Al,
Mn, As) metals in both the sediment and water across the three sites (common superscripts are
used to indicate significant differences between sites; # indicates a concentration below detection
limit). .........................................................................................................................................24
Figure 2-5: Bar graphs showing the concentration (mean and SEM) of different non-essential
metals (Cd, Pb, Se, Ag) in both the sediment and water across the three sites located in Ndumo
Game Reserve (common superscripts are used to indicate significant differences between sites).
.................................................................................................................................................25
Figure 2-6: Biplot of the canonical variates obtained from a Discriminant Function Analysis (DFA)
comparing the metal concentration of the different metals in the sediment of three sites located in
Ndumo Game Reserve. ............................................................................................................27
Figure 2-7: Biplot of the canonical variates obtained from a Discriminant Function Analysis (DFA)
comparing the concentration of 12 different metals in water samples across three sites located in
Ndumo Game Reserve South Africa. ........................................................................................29
Figure 3-1: Bar graphs showing the mean concentration (± 1 SEM) of the different essential metals
(Fe, Co, Ni, Zn, Cu) in both the muscle and liver tissues (mg/kg) of the catfish Clarias gariepinus
from the Usuthu River and Nyamithi and Shokwe pans inside the Ndumo Game Reserve
(common superscripts for each of the tissues indicate significant differences between the sites).
.................................................................................................................................................45
Figure 3-2: Bar graphs showing the mean concentration (± 1 SEM) of the different non-essential
metals in both the muscle and liver tissues (mg/kg) of the catfish Clarias gariepinus from the
Usuthu River and Nyamithi and Shokwe pans inside the Ndumo Game Reserve (common
superscripts indicate significant differences between the sites). ................................................48
xi
Figure 3-3: Bar graphs showing the mean concentration (± 1 SEM) of the different non-essential
metals in both the muscle and liver tissues (mg/kg) of the catfish Clarias gariepinus from the
Usuthu River and Nyamithi and Shokwe pans inside the Ndumo Game Reserve (common
superscripts indicate significant differences between the sites). ................................................49
Figure 3-4: Biplot of the canonical variates obtained from a Discriminant Function Analysis (DFA)
comparing the 12 different metal concentrations in the muscle tissue of Clarias gariepinus across
three sites located in Ndumo Game Reserve, South Africa. ......................................................51
Figure 3-5: Canonical variates obtained from a Discriminant Function Analysis (DFA) comparing
the metal concentration of 12 different metals in the liver tissue of Clarias gariepinus across three
sites located in Ndumo Game Reserve, South Africa. ...............................................................53
Figure 4-1: The digestive tract of Clarias gariepinus with photographs of the five different
endohelminth parasites at the location where they were found in their hosts: Contracaecum sp. in
the body cavity (A,B), Procamallanus pseudolaeviconchus in the stomach (C), Proteocephalus
sp. (D,E) and Tetracampos ciliotheca (F) in the intestine and Paracamallanus cyathopgharynx in
the rectum of the host (G). ........................................................................................................67
Figure 4-2: Bar graphs showing the concentration (mg/kg) (mean ± SE) of the essential metals:
Fe (A, B, C), Co (D, E, F) and Ni (G, H, I), in five different endohelminth parasites of Clarias
gariepinus across three sites in Ndumo Game Reserve (the blue solid line and red dotted lines
indicate the mean concentration of metals in the host muscle and liver tissues, respectively). ..75
Figure 4-3: Bar graphs showing the concentration (mg/kg) (mean ± SE) of the essential metals:
Zn (A, B, C) and Cu (D, E, F), in five different endohelminth parasites of Clarias gariepinus across
three sites in Ndumo Game Reserve (the blue solid line and red dotted lines indicate the mean
concentration of metals in the host muscle and liver tissues, respectively). ...............................76
Figure 4-4: Bar graphs showing the concentration (mg/kg) (mean ± SE) of the non-essential
metals: Al (A, B, C), Mn (D, E, F) and As (G, H, I), in five different endohelminth parasites of
Clarias gariepinus across three sites in Ndumo Game Reserve (the blue solid line and red dotted
lines indicate the mean concentration of metals in the host muscle and liver tissues, respectively).
.................................................................................................................................................78
Figure 4-5: Bar graphs showing the concentration (mg/kg) (mean ± SE) of the non-essential
metals: Cd (A, B, C), Pb (D, E, F), Se (G, H, I), and Ad (J, K, L), in five different endohelminth
parasites of Clarias gariepinus across three sites in Ndumo Game Reserve (the blue solid line
and red dotted lines indicate the mean concentration of metals in the host muscle and liver tissues,
respectively). .............................................................................................................................80
xii
Figure 4-6: Constrained Redundancy Analysis triplot of the concentration of metals in the different
endohelminth parasites across three different sites in Ndumo Game Reserve (Squares – Usuthu
River, Circles – Nyamithi Pan, Triangles – Shokwe Pan; with the metal concentration in the muscle
tissue of Clarias gariepinus overlaid; the first [horizontal] axis explains 5.48% and the second
[vertical] axis a further 2.98%, for a cumulative 8.43%). ............................................................88
Figure 4-7: Constrained Redundancy Analysis triplot of the concentration of metals in the different
endohelminth parasites across three different sites in Ndumo Game Reserve (Squares – Usuthu
River, Circles – Nyamithi Pan, Triangles – Shokwe Pan; with the metal concentration in the liver
tissue of Clarias gariepinus overlaid; the first [horizontal] axis explains 15.77% and the second
[vertical] axis a further 2.24%, for a cumulative 18.01%). ..........................................................89
Figure 5-1: Constrained Redundancy Analysis triplot of the concentration of metals in the muscle
tissue of Clarias gariepinus across three different sites in Ndumo Game Reserve (Squares –
Usuthu River, Circles – Nyamithi Pan, Triangles – Shokwe Pan; with the parasite numbers of the
four different endohelminth parasites overlaid; the first [horizontal] axis explains 7.36% and the
second [vertical] axis a further 1.99%, for a cumulative 9.34%). .............................................. 110
Figure 5-2: Constrained Redundancy Analysis triplot of the concentration of metals in the liver
tissue of Clarias gariepinus across three different sites in Ndumo Game Reserve (Squares –
Usuthu River, Circles – Nyamithi Pan, Triangles – Shokwe Pan; with the parasite numbers of the
four different endohelminth parasites overlaid; the first [horizontal] axis explains 11.76% and the
second [vertical] axis a further 2.27%, for a cumulative 14.03%). ............................................ 111
Figure 5-3: Concentrations of metallothioneins (A) (nmol MT/mg) and reduced glutathione (B)
(µg/g) in the host Clarias gariepinus and the Contracaecum sp. across the three sites in Ndumo
Game Reserve ([mean ± SEM]; bars with common superscripts are significantly different [p <
0.05]). ..................................................................................................................................... 112
Figure 5-4: Concentrations of all components of cellular energy allocations (CEA) of Clarias
gariepinus at Ndumo Game Reserve – available energy (D) consists of proteins (A), lipids (B) and
glycogen (C) and energy consumption (E) and the final cellular energy allocation (F) (bars with
common superscripts are significantly different [p < 0.05]). ..................................................... 113
Figure 5-5: Constrained Redundancy Analysis triplot of the concentration of metals in the muscle
tissue of Clarias gariepinus across three different sites in Ndumo Game Reserve (Squares –
Usuthu River, Circles – Nyamithi Pan, Triangles – Shokwe Pan; with their corresponding
biomarker responses: cellular energy allocation [CEA], metallothioneins [MT] and reduced
glutathione [GSH] overlaid; the first [horizontal] axis explains 11.28% and the second [vertical]
axis a further 6.61%, for a cumulative 17.89%). ...................................................................... 117
xiii
Figure 5-6: Constrained Redundancy Analysis triplot of the concentration of metals in the liver
tissue of Clarias gariepinus across three different sites in Ndumo Game Reserve (Squares –
Usuthu River, Circles – Nyamithi Pan, Triangles – Shokwe Pan; with their corresponding
biomarker responses: cellular energy allocation [CEA], metallothioneins [MT] and reduced
glutathione [GSH] overlaid; the first [horizontal] axis explains 8.43% and the second [vertical] axis
a further 5.69%, for a cumulative 14.12%). ............................................................................. 118
Figure 5-7: Constrained Redundancy Analysis triplot of the biomarker responses: cellular energy
allocation (CEA), metallothioneins (MT) and reduced glutathione (GSH) of the host Clarias
gariepinus across three different sites in Ndumo Game Reserve with the parasite counts of the
four endohelminth parasites overlaid (The first [horizontal] axis explains 4.27% and the second
[vertical] axis a further 1.51%, for a cumulative 5.78%). .......................................................... 120
Figure 5-8: Unconstrained Redundancy Analysis triplot of the concentration of metals in
Contracaecum sp. across two different sites in Ndumo Game Reserve with their biomarker
responses: cellular energy allocation (CEA), metallothioneins (MT) and reduced glutathione
(GSH) overlaid (The first [horizontal] axis explains 19.49% and the second [vertical] axis a further
17.11%, for a cumulative 36.08%)........................................................................................... 122
Figure 5-9: Unconstrained Redundancy Analysis triplot of the biological responses: cellular
energy allocation (CEA), metallothioneins (MT) and reduced glutathione (GSH) of the
Contracaecum sp. across three different sites in Ndumo Game Reserve with the metal
concentration in the muscle tissue of the host Clarias gariepinus overlaid (The first [horizontal]
axis explains 24.77% and the second [vertical] axis a further 13.13%, for a cumulative 37.90%).
............................................................................................................................................... 124
Figure 5-10: Unconstrained Redundancy Analysis triplot of the biological responses: cellular
energy allocation (CEA), metallothioneins (MT) and reduced glutathione (GSH) of the
Contracaecum sp. of the Clarias gariepinus in Nyamithi Pan in Ndumo Game Reserve with the
metal concentrations in the liver tissue of the host Clarias gariepinus overlaid (The first [horizontal]
axis explains 23.14% and the second [vertical] axis a further 19.13%, for a cumulative 42.47%).
............................................................................................................................................... 125
xiv
List of Tables:
Table 2-1: Measured concentrations of the different metals of the certified reference material
([NCS DC 73310] Stream Sediment from the China National Analysis Centre for Iron & Steel) with
the percentage recovery rates (all concentrations are expressed as mg/kg). ............................20
Table 2-2: The structure matrix of the first two functions of a Discriminant Function Analysis (DFA)
using various metal concentrations present in the water from three different sites in Ndumo Game
Reserve (the largest absolute correlation between each variable and any discriminant function is
indicated in bold). ......................................................................................................................26
Table 2-3: Classification summary of the different metal concentrations from a Discriminant
Function Analysis (DFA) of metal concentrations in the sediment of the three different sites at
Ndumo Game Reserve. ............................................................................................................27
Table 2-4: The structure matrix of the first two functions of a Discriminant Function Analysis (DFA)
using various metal concentrations present in the water from three different sites in Ndumo Game
Reserve (the largest absolute correlation between each variable and any discriminant function is
indicated in bold). ......................................................................................................................28
Table 2-5: Classification summary of the different metal concentrations from a Discriminant
Function Analysis (DFA) of metal concentrations in the sediment of the three different sites at
Ndumo Game Reserve. ............................................................................................................29
Table 2-6: Comparison of the metal concentrations (mg/kg) in the sediment of the Usuthu River
lotic system, the Shokwe Pan freshwater lentic system and the Nyamithi Pan saline lentic system
with the metal concentrations found in the sediment of three rivers in the Kruger National Park
(Olifants, Letaba, Luvuvhu) and in three floodplains (Nyl River, River Lahn, River Severn). ......32
Table 2-7: Comparison of the metal concentrations (µg/L) in the water of the lotic site (Usuthu
River) and the two lentic sites (freshwater Shokwe Pan and saline Nyamithi Pan) of Ndumo Game
Reserve to three rivers of the Kruger National Park (Olifants River, Letaba River, Luvuvhu River)
as well as the Nyl River. ............................................................................................................36
Table 3-1: The mean measured concentrations of several metals of the certified reference
material (DORM-4: Fish protein certified reference material for trace metals) with the percentage
recovery rates (all concentrations were converted into mg/kg). .................................................41
Table 3-2: Biometric data of the Clarias gariepinus sampled at the three different sites located in
the Ndumo Game Reserve (bold numbers indicate significantly different values). .....................42
Table 3-3: The structure matrix of the first two functions of a Discriminant Function Analysis (DFA),
using the various metal concentrations present in the muscle tissue of Clarias gariepinus from the
xv
three different sites in Ndumo Game Reserve (the largest absolute correlation between each
variable and any discriminant function is indicated in bold). ......................................................50
Table 3-4: Classification summary of the different metal concentrations from a Discriminant
Function Analysis (DFA) of metal concentrations in the muscle tissue of Clarias gariepinus from
three sites in Ndumo Game Reserve. .......................................................................................51
Table 3-5: The structure matrix of the first two functions of a Discriminant Function Analysis (DFA),
using the various metal concentrations present in the liver tissue of Clarias gariepinus from the
three different sites in Ndumo Game Reserve (the largest absolute correlation between each
variable and any discriminant function is indicated in bold). ......................................................52
Table 3-6: Classification summary of the different metal concentrations from a Discriminant
Function Analysis (DFA) of metal concentrations in the liver tissue of Clarias gariepinus from three
sites in Ndumo Game Reserve. ................................................................................................53
Table 3-7: Bioaccumulation factors (BAF) of metals calculated from the water to the muscle and
liver tissues of Clarias gariepinus in three sites located in the Ndumo Game Reserve (# indicates
levels under the detection limits were present in the water of Nyamithi Pan and therefore no
calculations could be done). ......................................................................................................55
Table 3-8: Comparison of metal concentrations in the muscle tissue of Clarias gariepinus at the
three sites in the Ndumo Game Reserve with the concentrations of metals in the muscle tissue at
other aquatic ecosystems in other areas of South Africa (the concentrations of metals are
indicated in mg/kg). ...................................................................................................................58
Table 3-9: Comparison of metal concentrations in the liver tissue of Clarias gariepinus at the three
sites in the Ndumo Game Reserve with the concentrations of metals in the liver tissue at other
aquatic ecosystems in other areas of South Africa (the concentrations of metals are indicated in
mg/kg wet weight). ....................................................................................................................59
Table 4-1: Pooled sample numbers with the weight of the Procamallanus pseudolaeviconchus,
Tetracampos ciliotheca and Paracamallanus cyathopgharynx across the three sites of Ndumo
Game Reserve (each number in brackets represents a specific sample number for Clarias
gariepinus sample at a specific site). .........................................................................................69
Table 4-2: The mean (1 ± SEM) measured concentrations for different metals of the certified
reference material (CRM) (DORM-4: Fish protein certified reference material for trace metals)
with percentage recovery rate (all concentrations were converted into mg/kg). .........................69
Table 4-3: The prevalence, mean abundance and intensity of the endohelminth parasites
Procamallanus pseudolaeviconchus, Proteocephalus sp., Tetracampos ciliotheca,
xvi
Paracamallanus cyathopgharynx and Contracaecum sp. found in 74 Clarias gariepinus across
three sites located in the Ndumo Game Reserve. .....................................................................72
Table 4-4: Mean ± SE and range (in parentheses) of bioaccumulation factors (BAF) for metals,
calculated from the Clarias gariepinus muscle tissue for each of the different endohelminth
parasites from three sites located in the Ndumo Game Reserve (ND indicates where the
concentrations were below detection in the parasites). .............................................................82
Table 4-5: Spearman correlation coefficients (r) between the concentration of both essential and
non-essential metals in four different helminth parasites and the concentration of the metals in
both the water and sediment at sites within the Ndumo Game Reserve (bold number indicates
significant differences; * is < 0.005** is < 0.001). .......................................................................85
Table 4-6: Spearman correlation coefficients (r) between the concentration of both essential and
non-essential metals in four different helminth parasites and the concentration of the metals in
the muscle and liver tissue of Clarias gariepinus at sites within the Ndumo Game Reserve (bold
number indicates significant differences; * is < 0.005** is < 0.001). ...........................................86
Table 5-1: Spearman’s comparison of the concentrations of the different metals in both the muscle
and liver tissues of the host Clarias gariepinus infected or uninfected by four different
endohelminth parasites in the lotic system of the Usuthu River in Ndumo Game Reserve (bold
numbers indicate significant differences with * is p < 0.05 and ** p < 0.001). .......................... 104
Table 5-2: Spearman’s comparison of the concentrations of the different metals in both the muscle
and liver tissues of the host Clarias gariepinus infected or uninfected by four different
endohelminth parasites in the lentic system of Shokwe Pan in Ndumo Game Reserve (bold
numbers indicate significant differences with * is p < 0.05 and ** p < 0.001). .......................... 105
Table 5-3: Spearman’s comparison of the concentrations of the different metals in both the muscle
and liver tissues of the host Clarias gariepinus infected or uninfected by four different
endohelminth parasites in the lentic system of Nyamithi Pan in Ndumo Game Reserve (# indicates
where there were no uninfected hosts; bold numbers indicate significant differences with * is p <
0.05 and ** p < 0.001). ............................................................................................................ 106
Table 5-4: Spearman’s correlations between the number of parasites (Procamallanus
pseudolaeviconchus, Tetracampos ciliotheca, Paracamallanus cyathopgharynx and
Contracaecum sp.) and the metal concentrations in Clarias gariepinus muscle and liver tissues in
three different aquatic ecosystems in Ndumo Game Reserve (bold numbers indicate significant
differences with * is < 0.05 and ** < 0.001). ............................................................................. 109
Table 5-5: Spearman’s comparison of different biological responses taking place in the host
Clarias gariepinus, infected or uninfected, by four different endohelminth parasites in Ndumo
xvii
Game Reserve (# indicates where there were no uninfected hosts; bold numbers indicate
significant differences with * is p < 0.05 and ** p < 0.001). ...................................................... 115
xviii
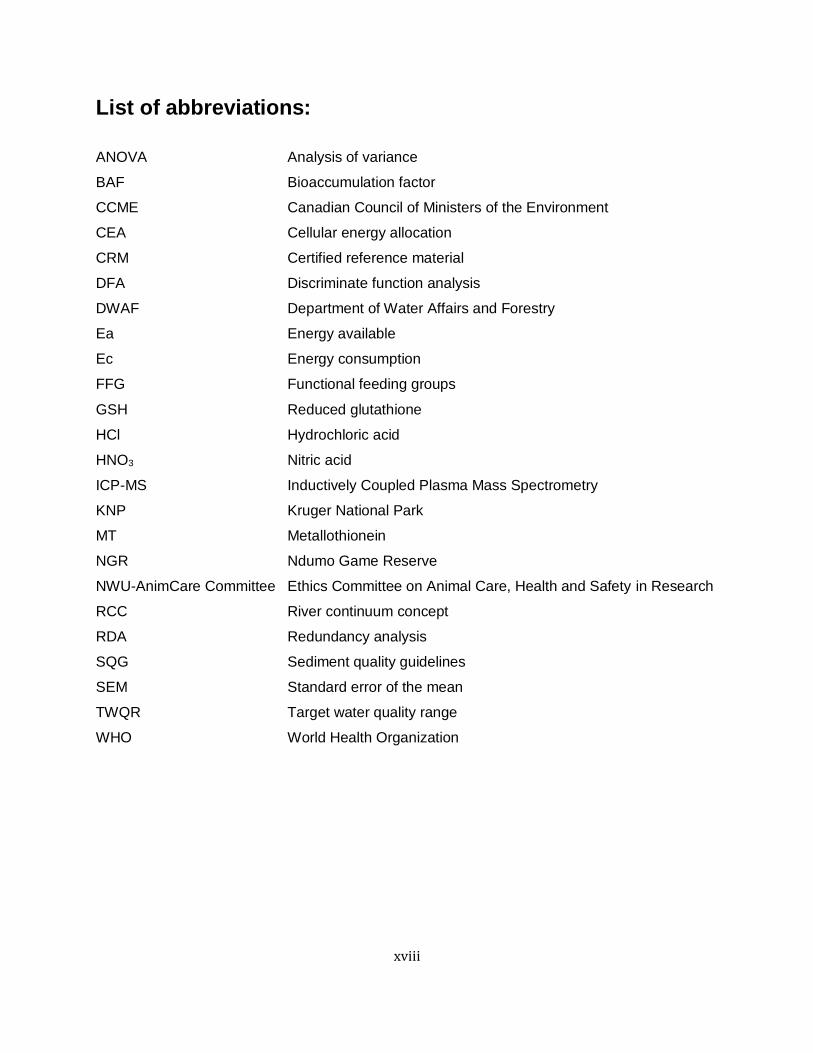
List of abbreviations:
ANOVA Analysis of variance
BAF Bioaccumulation factor
CCME Canadian Council of Ministers of the Environment
CEA Cellular energy allocation
CRM Certified reference material
DFA Discriminate function analysis
DWAF Department of Water Affairs and Forestry
Ea Energy available
Ec Energy consumption
FFG Functional feeding groups
GSH Reduced glutathione
HCl Hydrochloric acid
HNO3 Nitric acid
ICP-MS Inductively Coupled Plasma Mass Spectrometry
KNP Kruger National Park
MT Metallothionein
NGR Ndumo Game Reserve
NWU-AnimCare Committee Ethics Committee on Animal Care, Health and Safety in Research
RCC River continuum concept
RDA Redundancy analysis
SQG Sediment quality guidelines
SEM Standard error of the mean
TWQR Target water quality range
WHO World Health Organization
1
1. General introduction
1.1. Background
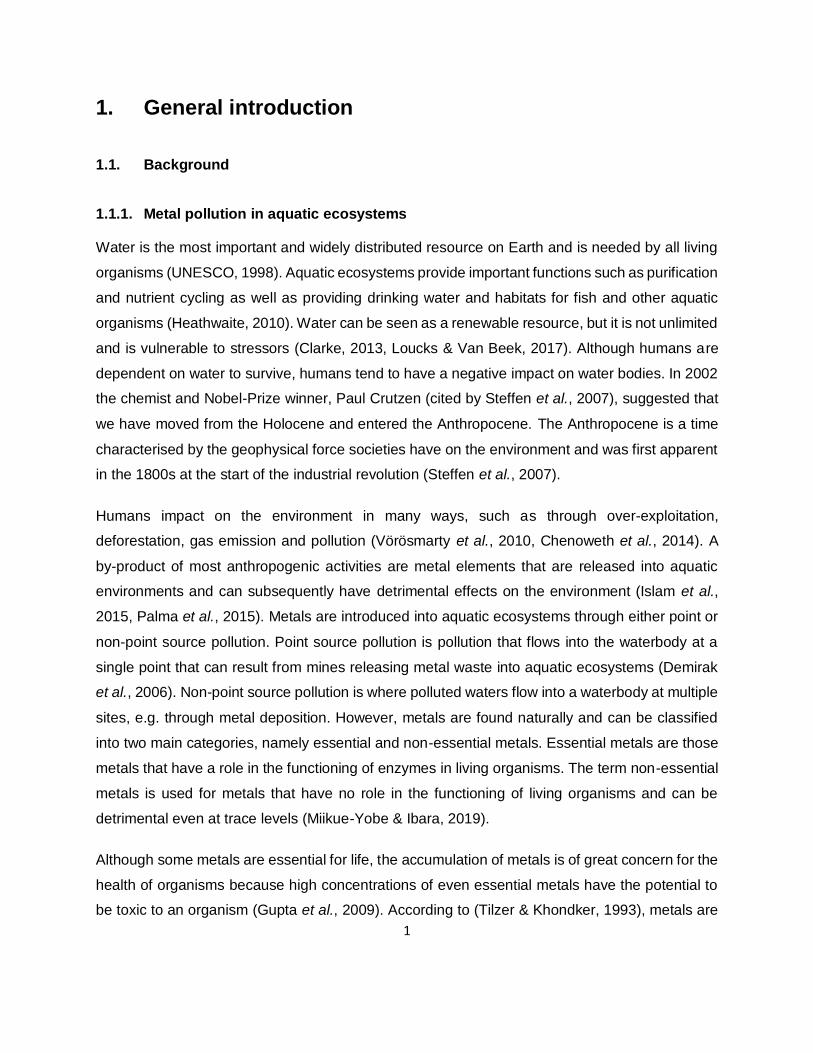
1.1.1. Metal pollution in aquatic ecosystems
Water is the most important and widely distributed resource on Earth and is needed by all living
organisms (UNESCO, 1998). Aquatic ecosystems provide important functions such as purification
and nutrient cycling as well as providing drinking water and habitats for fish and other aquatic
organisms (Heathwaite, 2010). Water can be seen as a renewable resource, but it is not unlimited
and is vulnerable to stressors (Clarke, 2013, Loucks & Van Beek, 2017). Although humans are
dependent on water to survive, humans tend to have a negative impact on water bodies. In 2002
the chemist and Nobel-Prize winner, Paul Crutzen (cited by Steffen et al., 2007), suggested that
we have moved from the Holocene and entered the Anthropocene. The Anthropocene is a time
characterised by the geophysical force societies have on the environment and was first apparent
in the 1800s at the start of the industrial revolution (Steffen et al., 2007).
Humans impact on the environment in many ways, such as through over-exploitation,
deforestation, gas emission and pollution (Vörösmarty et al., 2010, Chenoweth et al., 2014). A
by-product of most anthropogenic activities are metal elements that are released into aquatic
environments and can subsequently have detrimental effects on the environment (Islam et al.,
2015, Palma et al., 2015). Metals are introduced into aquatic ecosystems through either point or
non-point source pollution. Point source pollution is pollution that flows into the waterbody at a
single point that can result from mines releasing metal waste into aquatic ecosystems (Demirak
et al., 2006). Non-point source pollution is where polluted waters flow into a waterbody at multiple
sites, e.g. through metal deposition. However, metals are found naturally and can be classified
into two main categories, namely essential and non-essential metals. Essential metals are those
metals that have a role in the functioning of enzymes in living organisms. The term non-essential
metals is used for metals that have no role in the functioning of living organisms and can be
detrimental even at trace levels (Miikue-Yobe & Ibara, 2019).
Although some metals are essential for life, the accumulation of metals is of great concern for the
health of organisms because high concentrations of even essential metals have the potential to
be toxic to an organism (Gupta et al., 2009). According to (Tilzer & Khondker, 1993), metals are
2
non-biodegradable and can bioaccumulate in organisms that are exposed for a sufficient period
of time and have the potential to biomagnify throughout the food chain. Venugopal and Luckey
(1978) state that the presence of metals in organisms found in food can have serious health
implications for the human population. For example, lead can cause renal failure, mercury and
cadmium can cause kidney problems, whilst zinc and copper can lead to nephritis (Venugopal &
Luckey, 1978). Metal pollution is of great concern for aquatic ecosystems because of their ability
to build-up in the sediment and their negative impact on aquatic biota, local communities and
water quality (Demirak et al., 2006). It is therefore of utmost importance to detect metal pollution
in water bodies as early as possible.
1.1.2. Biomonitoring of ecosystems
Biomonitoring is a tool used to assess the environmental exposure to synthetic or natural
chemicals by using individual organism’s body fluids or tissue samples (Zhou et al., 2008, Li et
al., 2010, Gray et al., 2014). The basis of this technique is to use the knowledge that chemicals
leave a footprint after exposure (Zhou et al., 2008). By measuring the mark left by chemicals, it
can indicate the amount of synthetic or natural chemicals entering organisms in ecosystems
(Zhou et al., 2008). Biomonitoring is thus an important tool to assess if an ecosystem is polluted
or not and is commonly used globally. According to Li et al. (2010), biomonitoring is used to
observe the impact of external stressors on ecosystems over time and space.
Currently there are multiple biomonitoring tools employed for aquatic ecosystems, which include
bio-indicators, diversity indices, biotic indices, multimetric approaches, multivariate approaches
and functional approaches (Li et al., 2010). Biomonitoring helps to provide robust and sensitive
insights into the responses of an assemblage to natural and anthropogenic stressors (Karr, 1999,
Barbour & Yoder, 2000). Multivariate approaches are statistical analyses that help predict site-
specific fauna patterns when no environmental stress is present, and then compare the observed
fauna with the expected fauna (Li et al., 2010).
Functional approaches are divided into two groups: firstly, functional feeding groups and
secondly, multiple biological traits. Functional feeding groups (FFG) are one of the most important
components of the river continuum concept (RCC) (Vannote et al., 1980) and is used to assess
processes at ecosystem-level for rivers and wetlands (Bady et al., 2005). Biological traits are
closely related to the habitat characteristics as well as the functions of species (biological and
3
ecological) and can thus give insight into the function and structure of a biocoenosis (Haybach et
al., 2004). Biological traits include but are not limited to size, lifecycle, food and feeding habits
and reproduction of organisms (Marchini et al., 2008).
1.1.3. Bio-indicators of metal contamination in aquatic ecosystems
As mentioned previously, the use of bio-indicators is an important tool in biomonitoring,
particularly for metal contamination. Currently the health of aquatic ecosystems is assessed by
using bio-indicators (Markert et al., 2003, Li et al., 2010, Kuklina et al., 2013). According to
Pracheil et al. (2016), the bio-indicator approach is a bioassessment method that makes use of
aquatic organisms as early warning and stress indicators in aquatic ecosystems. The bio-indicator
approach involves measuring the response of an organism from molecular to community levels
(Adams & Greeley, 2000). Metal concentrations in tissues of organisms indicate past exposure to
metals through water and food sources (Terra et al., 2008).
All organisms can be used as bio-indicators, but depending on their lifecycle, they may have
different functions as bio-indicators. Organisms with longer lifespans can show long-term
exposures (McGeoch & Chown, 1998, Markert et al., 2003). Organisms with short lifespans show
short-term exposures and animals such as top predators are indicators for long-term exposure.
Bio-indication is also dependent on the interaction between organisms and their environments
(Markert, 2007). The different pathways along which organisms are exposed to metals play a
major role in the effectiveness of an organism as a bio-indicator (Markert, 2007). Organisms, such
as invertebrates, which live in the sediment of aquatic ecosystems, filter their food from the
sediment, thus absorbing higher concentrations of metals through feeding (Ahmad et al., 2010).
Metals accumulate in different concentrations across different aquatic organisms; similarly these
metals accumulate in different concentrations across different organs within a specific organism
(Karadede & Ünlü, 2000, Jezierska & Witeska, 2006, Vinodhini & Narayanan, 2008). In some
instances, the metal concentration will be at higher levels in the liver than, for example, in the
muscle tissue of the host, since the liver uses metallothionein which binds to the metals and is
important for the detoxification of metals (Sures et al., 1997, Vinodhini & Narayanan, 2008). This
accumulation can alter the levels of biochemical parameters in fish (Vinodhini & Narayanan,
2008).
4
Liver tissue is used for biomarker responses of fish, thus a comparison between metal
concentration and biomarker response can be made. Biomarkers are cellular or biochemical
responses to chemical or anthropogenic stress in an organism that can be measured (Strimbu &
Tavel, 2010). Metal accumulates differently in different organs of organisms. The gills of fish are
the point of entry for metals and thus indicate short-term exposures, the liver and kidneys are
used to detoxify metals and will thus also reflect short-term exposures (Vinodhini & Narayanan,
2008). When metals are not removed from the organism the metals will accumulate in the muscle
tissue of the fish, thus reflecting long-term accumulation (Vinodhini & Narayanan, 2008).
It is important to know the metal concentration in the muscle tissue of fish because humans
consume the muscle tissue as food source, thus humans will be exposed to metals through
consumption of fish (Jezierska & Witeska, 2006, Agah et al., 2009). The concentration of metals
in fish tissue can reflect either past exposure to metals through food sources or the water source
that the organisms are exposed to but it can also be both (Birungi et al., 2007).
This study focuses on Clarias gariepinus and its Helminth parasite fauna as bio-indicators of metal
exposure in an aquatic ecosystem. Clarias gariepinus is a commercially important fish species
that serves as a major food source in third world countries (Farombi et al., 2007). Clarias
gariepinus is omnivorous and feeds on different trophic levels, from plants (producers) to insects
(grazers and predators) to fish (predators) and even sometimes birds (predators) (Gamal et al.,
2012). They are a bottom-dwelling species that come into contact with the sediment in lakes and
rivers. While the fish swim along the sediment it stirs up the soil that releases metals back into
the water column (Calmano et al., 1990, Thornton et al., 1995). Clarias gariepinus has a long
lifespan and can live up to 15 years and more (Booth et al., 2010).
All the above-mentioned factors contribute to make this organism a suitable bio-indicator species
to investigate for metal exposure (Crafford & Avenant-Oldewage, 2010). Clarias gariepinus is
known to have high infection rates with parasites especially helminth parasites (Akinsanya &
Otubanjo, 2006). Parasites are found in all ecosystems on the planet and can be present in high
abundances in these ecosystems. Parasites generally feed on their host organisms, be it plants
or major predators, and as a result occupy higher levels on the food chain than their hosts
(Omacini et al., 2001, Shaw & Hochberg, 2001, Lafferty et al., 2006, Chen et al., 2008). According
to de Buron et al. (2009), the feeding habits of helminth parasites can reflect the relationship of
their hosts to their environment. Helminth parasites typically live in the gut of their hosts and
5
cannot build up the required fatty acids and as a result they must absorb the necessary nutrients
needed from their hosts (Bailey & Fairbairn, 1968, de Buron et al., 2009). The aforementioned
characteristics make parasites suitable for being good bio-indicators of anthropogenic pollution in
the environment (Sures, 2001). The United States’ Committee on Biological Markers of the
National Research Council (NRC, 1987) divided the biomarker responses of bio-indicators into
three classes, namely biomarkers of exposure, biomarkers of effect and biomarkers of
susceptibility. This study only focuses on the first two classes.
1.1.3.1. Biomarkers of exposure
Biomarkers of exposure is the measurement of the accumulation of pollution inside an organism
(bio-indicator) (Van der Oost et al., 2003). Biomarkers of exposure are used to document if an
organism or a population were exposed to a foreign substance and provide a connection between
exposure and internal dosimetry (Van der Oost et al., 2003). Bioaccumulation of a foreign
substance is considered to be a biomarker of exposure (Van der Oost et al., 2003).
1.1.3.2. Biomarkers of effect
A biomarker of effect is the possible health impairment or disease caused by pollution when
looking at measurable physiological, biochemical or other changes in the host organism (Van der
Oost et al., 2003). Van der Oost et al. (2003) state that biomarkers of effect are used to document
alterations of effects in the health of organisms due to external exposure to a foreign substance.
Environmental stressors, e.g. metal pollution directly affect organisms at molecular and cellular
levels (Downs et al., 2001). Many bioaccumulation studies fail to link a certain pollutant exposure
to the biological effects that it can elicit in an organism (Wepener et al., 2011). Biomarkers can be
used as early-warning signals to evaluate the effect of environmental changes on organisms at a
cellular level.
Van der Oost et al. (2003) state that a biomarker is a biological response to pollution that can be
evaluated by changes at a cellular level that cannot be detected when looking at an organism as
a whole. According to Shugart et al. (1992), a biomarker is the measurement of cellular
modifications caused by the accumulation of pollution in the fluids, cells or tissue of the host
species. In environmental science biomarkers can be used as sensitive indicators of pollution
entering species and the distribution of the toxicants through the cells of the organisms (Shugart

6
et al., 1992). In this study we will be focusing on three effect biomarkers, namely metallothionein
(MT), cellular energy allocation (CEA), and reduced glutathione (GSH).
Metallothioneins are non-enzymatic proteins that bind to particular metals (Amiard et al., 2006).
The chemical behaviour of the protein is dominated by their thiol group and it is normally saturated
by multiple atoms (Amiard et al., 2006). Although the function of MTs is still under debate, they
play a double role in organisms. The metal-binding capability of the protein firstly plays a role in
the homeostatic regulation of essential metals as they act as stores for the metals (Roesijadi &
Fowler, 1991). Secondly they play a role in the detoxification of non-essential trace metals gives
organisms a higher tolerance against metal pollution (Ritterhoff & Zauke, 1998). An increase in
MTs in organisms can be used as a biomarker for metal pollution in an environment.
When organisms are exposed to pollution, such as metals, the organism will lose available energy
(Smolders et al., 2004, Wepener et al., 2011). Organisms use energy to detoxify and remove
metals from their systems (Moolman et al., 2007). To determine the total amount of energy
organisms have available for functions such as growth and reproduction, cellular energy allocation
(CEA) is determined (Smolders et al., 2004). Reduced glutathione (GSH) is an important
biomarker due to GSH’s function of maintaining redox potentials as well as viability in cel ls of
organisms (Atli & Canli, 2007). The tripeptide is mainly present in the cells of an organism and is
glutathione (L-y-glutamyl-cysteinyl-glycine) in its reduced form and functions as a nucleophile (Atli
& Canli, 2007).
1.2. Hypotheses, aims and objectives
This study was done in the aquatic ecosystems of Ndumo Game Reserve (NGR) which includes
the Usuthu River system flowing through the reserve as well as two pans, namely Nyamithi Pan
and Shokwe Pan, located inside the reserve. Previous studies conducted in NGR found that C.
gariepinus was present in all the major water bodies (Smit et al., 2016). These studies also found
that all the sites had helminth parasite infections of the fish with some of the sites having higher
infection rates than the others (Smit et al., 2016). Due to the high numbers of C. gariepinus and
high infection rates, it is possible to test the effectiveness of the host and its helminth parasites
as bio-indicators. Three different aquatic ecosystems are used to assess the effectiveness of the
organisms as bio-indicators in lentic and lotic systems as well as fresh and saline water.
7
In the study two different lentic systems will be investigated, one being a temporary freshwater
pan called Shokwe Pan, and the second being a permanent saline pan called Nyamithi Pan. The
lotic system investigated is the Usuthu River on the border of South Africa and Mozambique. The
assessment of different aquatic habitats allows for a comparison of the effectiveness of the
selected bio-indicators and to study the potential host-parasite interactions to metal exposure.
1.2.1. Hypotheses
To evaluate the efficacy of C. gariepinus and its endohelminth parasite fauna as bio-indicators of
metals in different aquatic systems as well as to establish host-parasite interactions to metal the
following hypotheses have been set for this study:
Hypothesis 1: Because lentic systems function as natural sinks for metals, they will have higher
concentrations of metals than lotic systems. The concentrations of metals present in all sites of
the study will be below the international guidelines for target water quality as well as international
sediment quality guidelines (addressed in Chapter 2).
Hypothesis 2: The bioaccumulation of metals in C. gariepinus at all three sites will reflect the
environmental conditions of the sites, with both the lentic systems (fresh and saline) having higher
bioaccumulation factors than the lotic system. Clarias gariepinus will also bioaccumulate the non-
essential metals to higher levels than the essential metals (addressed in Chapter 3).
Hypothesis 3: The parasites will prove to be better bio-indicators of both essential and non-
essential metals than their hosts due to the bioconcentration and biomagnification of the metals
in the parasites (addressed in Chapter 3 and 4).
Hypothesis 4: The parasites in the intestines will have higher accumulation rates of metals than
the Contracaecum sp. in the body cavity due to the higher concentration of metals in the intestinal
tract (addressed in Chapter 4).
Hypothesis 5: There will be a gradient of metal accumulation in the nematode parasites with the
highest being in the parasites in the stomach due to the low pH making metals there more
bioavailable than in the rectum of the host (addressed in Chapter 4).
8
Hypothesis 6: An increase in endohelminth parasite numbers will alleviate the body burdens of
metals in the hosts thereby resulting in less stress experienced by the hosts to detoxify and
remove metals from their organs (addressed in Chapter 5).
1.2.2. Aims and objectives
The first aim of the study is to determine the metal concentration in the three different aquatic
ecosystems.
The second aim is to evaluate if C. gariepinus and their associated helminth parasites indicate
the same metal concentration trends as the environments they live in.
The final aim of the study is to evaluate the effect of parasites on their hosts by looking at biological
responses occurring in the hosts due to metal exposure and parasite infection.
To ensure that these aims are achieved, the following objectives were set:
● Determine the concentration of different metals in the environment by analysing water and
sediment samples.
● Determine the current status of the aquatic ecosystems of the protected area, namely Ndumo
Game Reserve, located in South Africa.
● Determine the concentration of metals in the host muscle and liver tissues by using standard
Inductively Coupled Plasma Mass Spectrometry (ICP-MS) analysis.
● Determine and compare the concentration of metals in the different helminth parasites to the
concentration in their hosts.
● Use fish energetics as biomarkers to determine if there are differences between infected and
uninfected catfish.
● Determine detoxification of metals through the measurement of the concentrations of
metallothioneins (MTs) and reduced glutathione (GSH).
9
1.2.3. Chapter layout
● Chapter 1: Provides the general background needed to understand the importance of the
study and gives an overview of why C. gariepinus was chosen as a bio-indicator for metal
pollution. The chapter gives a brief overview of previous research on the use of parasites as
bio-indicators and the effect of parasites on their hosts in terms of metal pollution.
● Chapter 2: Introduces the selected study area as well as the three sites selected for the study.
The chapter provides the current environmental concentrations of metals present in the
selected study area and compares these concentrations with guidelines and other aquatic
ecosystems in South Africa.
● Chapter 3: Compares the concentration of metals found in the host tissue with the reported
environmental concentration. By making use of biomagnification factors and statistical
analysis, the chapter provides evidence that C. gariepinus is a good bio-indicator for metal
pollution and that it reflects its environment.
● Chapter 4: Determines if parasites reflect the metal concentrations of their hosts and thus
determines the success of helminth parasites as bio-indicators of metal pollution. The chapter
gives a comparison of bioaccumulation of metals in parasites located in different parts of their
hosts. It compares bioaccumulation by parasites at different locations in their hosts to
determine if feeding styles affect bioaccumulation and to determine if parasites reflect the
metal concentrations of their hosts.
● Chapter 5: Investigates the effect of metal concentration on the biomarker responses of the
host as well as its parasites by comparing energetics, metallothioneins (MTs) and reduced
glutathione (GSH) detoxification rates of the different organisms. The chapter also
investigates the effect of parasites on their hosts regarding metal accumulation.
● Chapter 6: Provides a brief summary of the results obtained and the conclusions drawn as
well as recommendations for future studies.
1.3. Potential impact
This study will contribute to the general knowledge of parasite-host interactions by researching
the possibility of parasites removing metals from their hosts. It opens new possibilities of using
10
helminth parasites as bio-indicators of metal pollution that can assist with future biomonitoring of
aquatic ecosystems. It will also contribute to the conservation of aquatic systems in NGR by
providing the reserve management with recommendations for their specific aquatic systems. The
results of this study were presented at the Southern African Society of Aquatic Sciences
Conference in July 2019.
11
2. Current environmental metal concentrations of the
selected study area
2.1. Introduction
Floodplain rivers are one of the most dynamic ecosystems on Earth (Power et al., 1995). As rivers
ebb and flow, the floodplains are continually connected and disconnected from rivers (Power et
al., 1995). According to Power et al. (1995), these fluctuations in resources and habitats play a
major role in the functioning of a floodplain. Floodplains are formed when rivers or streams
undergo a flooding event and the water breaches the river channel onto the flat area surrounding
the river (Dykaar & Wigington, 2000, Grams & Schmidt, 2002, Jain et al., 2008, Damm &
Hagedorn, 2010). A floodplain consists of two parts, the first being the river (floodway) and the
second the surrounding area (flood fringe). The flood fringe consists of the area between the
floodway and the bluff lines of the area. Bluff lines, also known as valley walls, are the areas
where valley floors undergo an increase in elevation (Stephenson, 2002, Lord, 2011,
Prawiranegara, 2014). Floodplains are formed through two major natural processes namely
erosion and aggradation. Erosion is the process where the movement of water displaces parts of
the earth’s surface resulting in a loss of root depth, nutrients and water imbalances (Yang et al.,
2003). Aggradation is defined as the deposition of sediment from the river onto the surrounding
areas (Babault et al., 2005). Floodplains are ecosystems that provide services such as water
purification, building products as well as a food source for humans (King et al., 2009). Therefore,
floodplains are important ecosystems that need to be protected.
Globally, floodplains cover more than 2 x 10⁶ km2 of the earth’s surface, but this number is
declining drastically and floodplains are one of the most threatened ecosystems (Erwin, 2009).
The degradation of floodplains is linked with a decline in freshwater biodiversity due to habitat
alteration, pollution, flow regulation and invasive species. Dudgeon et al. (2006) classified the
threats to freshwater biodiversity according to five major categories: overexploitation, water
pollution, habitat degradation, species invasion and flow modification. Over the past decades, the
influence of human activity on the environment has increased drastically and therefore the
monitoring of water bodies is important (Bartram & Ballance, 1996). These facts indicate the
importance of studying water bodies such as rivers, dams, lakes and pans to ensure that these
12
water bodies are protected from pollution. Because of these threats there is an urgent need to
preserve existing floodplains as a resource (Erwin, 2009).
The Pongola River Floodplain (PRF) is situated on the Makhathini Flats in the northern part of
KwaZulu-Natal on the border with Mozambique (Brown et al., 2018). The floodplain is
approximately 13000 ha and starts at the Lower Phongolo River (floodway). The Phongolo River
is divided into an upper and lower part due to the construction of the Pongolapoort Dam in 1973
(Dube et al., 2015). According to Dube et al. (2015), the floodplain extends to the confluence with
the Usuthu River at Ndumo Game Reserve (NGR). The floodplain contains around 65 named and
25 unnamed pans, all with different roles and importance for the ecosystem (Brown et al., 2018).
Since the construction of the Pongolapoort Dam the sustainability of the floodplain is being
questioned (Heeg & Breen, 1982). Annual flood releases have been made since the construction
of the dam until October 2012 at the end of the dry season to help with the recession of floodplain
agriculture and to inundate the floodplain in NGR (Dube et al., 2015, Brown et al., 2018). The
floodplain plays an important role for people living in the area who mainly use it for agriculture, a
food source and grazing habitat for domestic animals (Dube et al., 2015). Historically, the main
source of water for the floodplain and pans of NGR emanated from the Phongolo River; however,
since the construction of the dam and cessation of controlled floods, the Usuthu River has been
the source of the majority of water in the NGR pans (Anderson, 2009, Brown et al., 2018).
The Usuthu River starts in Amsterdam, Mpumalanga, South Africa and flows in an easterly
direction through the Kingdom of Swaziland and into the Indian Ocean at Maputo Bay in
Mozambique (Nunes et al., 2017). The river forms the border between South Africa and
Mozambique and the 20 km northern border of NGR (Calverley & Downs, 2014). The confluence
of the Usuthu- and Phongolo rivers is situated in the NGR and forms the Maputo River (Romano,
1964). The Usuthu River sub-basin has a few tributaries in South Africa such as the Lusushwana,
Ngwempisi, Mkhondo and Mpuluzi and has a 16690 km2 catchment area (Kramer, 2003). Most
water from the upper catchment is used for forest plantations, urban and rural water requirements
as well as irrigation (Kramer, 2003). In Swaziland, water from the Usuthu River is used mostly for
human settlements and the irrigation of sugarcane and citrus plantations (Kramer, 2003). Kramer
(2003) states that the small population of people in the settlements next to the river will likely have
no significant water abstractions, but in dry seasons irrigation water allocations are increased and
13
can dry the river out completely. Anthropogenic activities such as coal mining and forestry in the
tributaries pose threats to the aquatic ecosystem of the Usuthu River.
Pollution from different sources flows into aquatic ecosystems through runoff (Kim & Kannan,
2007, Lucke & Nichols, 2015). These pollutants can have major effects on organisms using the
water (Trombulak & Frissell, 2000, Belfiore & Anderson, 2001, Livingstone, 2003, Valavanidis et
al., 2006). Natural aquatic ecosystems have the ability to remove such pollutants out of the water
through different processes (Ostroumov, 1998, Kivaisi, 2001, Heberer, 2002, Akcil & Koldas,
2006). These processes are critical to maintain a good quality of water to support aquatic
organisms and sustain life. Wetlands can reduce pollutants such as organic matter, inorganic
matter, pathogens and trace organics in water into harmless by-products (Kivaisi, 2001, Heberer,
2002, Kadlec & Wallace, 2008). The reduction in pollution of water in wetlands is caused by
complex mechanisms such as sedimentation, filtration, microbial interactions, chemical
precipitation and uptake by vegetation (Kadlec & Wallace, 2008). Unfortunately, these natural
processes can only reduce a certain amount of pollution whereafter the pollution agents such as
metals will enrich the aquatic ecosystems (Cheng et al., 2002, Rai, 2008, Förstner & Wittmann,
2012).
Although metals are naturally present in ecosystems, trace metals such as cadmium, copper,
manganese and many others are known to accumulate in the sediments of aquatic ecosystems
(Cheng et al., 2002, Rai, 2008, Förstner & Wittmann, 2012). Sediment acts as a sink for pollutants
that precipitate from the water column therefore lowering the level of pollution in the water
(Sutherland, 2000, Yi et al., 2011, Jiang et al., 2018). The metals adsorbed in the sediment
particles are considered as conservative pollutants but can be released back into the environment
through disturbances (Yi et al., 2011, Zhang et al., 2017, Vedolin et al., 2018). According to Yu et
al. (2001), sediment will act as carrier of pollutants and can thus be classified as a source of
pollution.
There are several metal-binding fractions in aquatic ecosystems. According to Gunn et al. (1988),
the metal-binding fractions are influenced by the pH, ionic strength, biological and chemical redox
reactions, redox potential and complexation reaction in the water column. The two most important
components of sediment for metal partitioning are Fe oxides and organic matter (Marcıas-Zamora
et al., 1999). An important phase in regulating the binding behaviour of metals as well as their
14
bioavailability is the oxidisable phase (Yu et al., 2001). Under the perfect conditions metals will
accumulate to dangerous levels in aquatic ecosystems (Yi et al., 2011).
The hypothesis for this chapter is that because lentic systems function as natural sinks for metals,
they will have higher concentrations of metals than the lotic system. Ndumo Game Reserve is not
located close to any major sources of pollution and thus the concentration of metals present in all
sites of the study will be below the international guidelines for target water quality as well as
international sediment quality guidelines. The aim for this chapter is to determine the
environmental quality of the ecosystems at the three selected sites, with the objective of
measuring metals in the major aquatic components, namely the water and sediment.
2.2. Materials and methods
2.2.1. Study area
Ndumo Game Reserve is a 10000 ha reserve situated in the northern part of KwaZulu-Natal on
the border of South Africa and Mozambique, east of Swaziland. Both the northern and eastern
boundaries of the park are natural river boundaries with the Usuthu River forming the northern
boundary and the Phongolo River the eastern boundary. The reserve was proclaimed as a
conservation site in 1924 because of the large numbers of hippopotami (Hippopotamus
amphibious) and is the only protected area on the PRF. According to Combrink (2004), NGR also
has the third highest population of Nile Crocodile in South Africa. The wetlands in NGR hold
unique biological biodiversity and is an accredited Ramsar sites (Wetlands of International
Importance) of South Africa because of the high biodiversity of bird species present (DEAT,
1996.).
Ndumo Game Reserve hosts many Red Data species, which include two Red Data fish species,
10 Red Data reptile species and four Red Data herbivore species. Most of these species are
dependent on the floodplain pans of NGR for food sources as well as habitat and shelter (DEAT,
1996.). Ndumo Game Reserve is the conservation area with the highest biodiversity of bird life in
South Africa with 430 species recorded (Stuart & Stuart, 2018). According to Heeg and Breen
(1982), 120 of these species are dependent on wetlands for survival, and 19 of them are classified
as Red Data water birds. Heeg and Breen (1982) found that the PRF houses the only South
15
African breeding colony of white pelicans. The floodplain also hosts one of only three breeding
areas for the open-billed stork.
2.2.2. Site selection
Three sites were selected in Ndumo Game Reserve (Fig. 2.1). One of them is a lotic system and
the other two are lentic systems, of which one is a freshwater and the other a saline system. The
first site is the Usuthu River, the second site is a temporary freshwater floodplain pan named
Shokwe Pan which is fed by the Usuthu River, and the third site is the largest permanent saline
pan named Nyamithi Pan. The site selection was based on the presence of both the host as well
as parasite infection at the sites (Smit et al., 2016, Svitin et al., 2019). Previous studies found
different parasite infection rates at the three sites (Svitin et al., 2019). The three sites were also
chosen because they are all different aquatic ecosystems.
16
Figure 2-1: Map of the protected Ramsar site of the Ndumo Game Reserve with the three selected
sites indicated on the map – the sites are the lotic system: Usuthu River, the freshwater pan:
Shokwe Pan and the saline pan: Nyamithi Pan.
2.2.3. Site description
2.2.3.1. Site 1: Usuthu River
The site consists of a 400 m stretch of deep fast-flowing water (Fig. 2.2A & B). On the riverbed
there are many reeds and overhanging vegetation. The site was accessible through a channel in
the reeds made by hippopotami. The site has a sandy substrate, with some submerged rocks.
17
2.2.3.2. Site 2: Shokwe Pan
Shokwe Pan is a temporary freshwater pan that receives its water from the Usuthu River when
the river is in flood (Fig. 2.2C & D). The pan is situated in the western region of NGR. Shokwe
Pan is classified as a lake with no outlet. The pan receives its water through rainfall and seasonal
flooding from the Usuthu River (Whittington et al., 2013). The pan is surrounded by Ficus
sycomorus (fig trees) on the west side and Vachellia xanthophloea (fever trees) on the east side
with reed beds. Access to the water is created by animals going in and out of the water. The pan
has a clay substrate with Nymphaeaceae (water lilies) all over the site.
2.2.3.3. Site 3: Nyamithi Pan
Nyamithi Pan is classified as a non-tidal, semi-permanent pan that gets water predominantly from
flooding in the Phongolo River system but can also receive water from the Usuthu River when in
flood (Whittington et al., 2013) (Fig. 2.2E & F). Since 2014 Nyamithi Pan had solely received water
from the Usuthu River because of no flood release from the Pongolapoort Dam. The lake is 4.4
km long from west to east and about 700 m at the widest part (Ezat et al., 2018). According to
Pooley (1982) the depth of Nyamithi Pan varies from 5 m during the rainy season to less than 1
m during the dry season. Nyamithi Pan has the highest density of crocodiles in NGR (Calverley
& Downs, 2015). The shallow nature of the lake results in higher temperatures than in the
Phongolo River channels (Calverley & Downs, 2014). Nyamithi Pan has permanent water
channels that are formed by the movement of hippopotami. The pan is surrounded by Vachellia
xanthophloea all around the banks with no reed beds present. Nyamithi Pan has no aquatic
vegetation with a very coarse substrate.
18
Figure 2-2: Photographs of the three selected sites and the typical marginal and aquatic
vegetation, showing firstly, the lotic system: Usuthu River (A & B), the lentic freshwater system:
Shokwe Pan (C & D) and the lentic saline system: Nyamithi Pan (E & F).
19
2.2.4. Sampling
Samples were collected during the rainy season of November 2018. Samples of water and
sediment were collected for metal analyses in triplicate for each site. Water samples were
collected in acid-washed polypropylene bottles and sediment samples were taken in acid-washed
glass bottles. All sediment and water samples were frozen and transported back to the laboratory
for further analysis.
2.2.5. Laboratory methods
2.2.5.1. Metal concentration in water samples
Fifty mL of water was filtered through cellulose nitrate filter paper (0.45 µm pore size). After
filtration the water was acidified to 1% nitric acid by adding 50 µL 65% nitric acid. The acidified
samples were then decanted into 50 mL amber glass bottles, labelled and sent for Inductively
Coupled Plasma Mass Spectrometry (ICP-MS) (Agilent technologies, 7500CE) analysis to
determine the dissolved metal concentrations for the following metals (Al, Fe, Mn, Co, Ni, Cu, Zn,
As, Se, Ag, Cd and Pb). The metal concentrations were expressed in µg/L. Equation derived from
Dahms et al., (2016).
Metal concentration (µg/L) = ICP-MS reading x 1000
2.2.5.2. Metal concentration in sediment samples
A known weight of each sediment sample from the survey was freeze-dried using a Labconco
FreeZone® Plus 6 Liter Cascade Console Freeze Dry System (7753030). Afterwards 0.2 g of the
dried sample was placed in Teflon tubes, and 2.5 mL nitric acid (HNO3) and 7.5 mL 32%
hydrochloric acid (HCl) were added to each sample. The samples were digested using an Ethos
Easy Maxi-44 Microwave Digestion system at 1800 W in 200˚C for 45 minutes. The digested
sediment was then filtered and diluted to 50 mL with 1% HNO3. The samples were then decanted
into amber glass bottles that were labelled and sent for analysis on the ICP-MS. All concentrations
of metals were converted into mg/kg. Equation derived from Dahms-Verster et al., (2016).
Metal concentration (mg/kg) = 𝐼𝐶𝑃−𝑀𝑆 𝑟𝑒𝑎𝑑𝑖𝑛𝑔
𝑆𝑎𝑚𝑝𝑙𝑒 𝑑𝑟𝑦 𝑚𝑎𝑠𝑠 (𝑔) x dilution volume (50 mL)
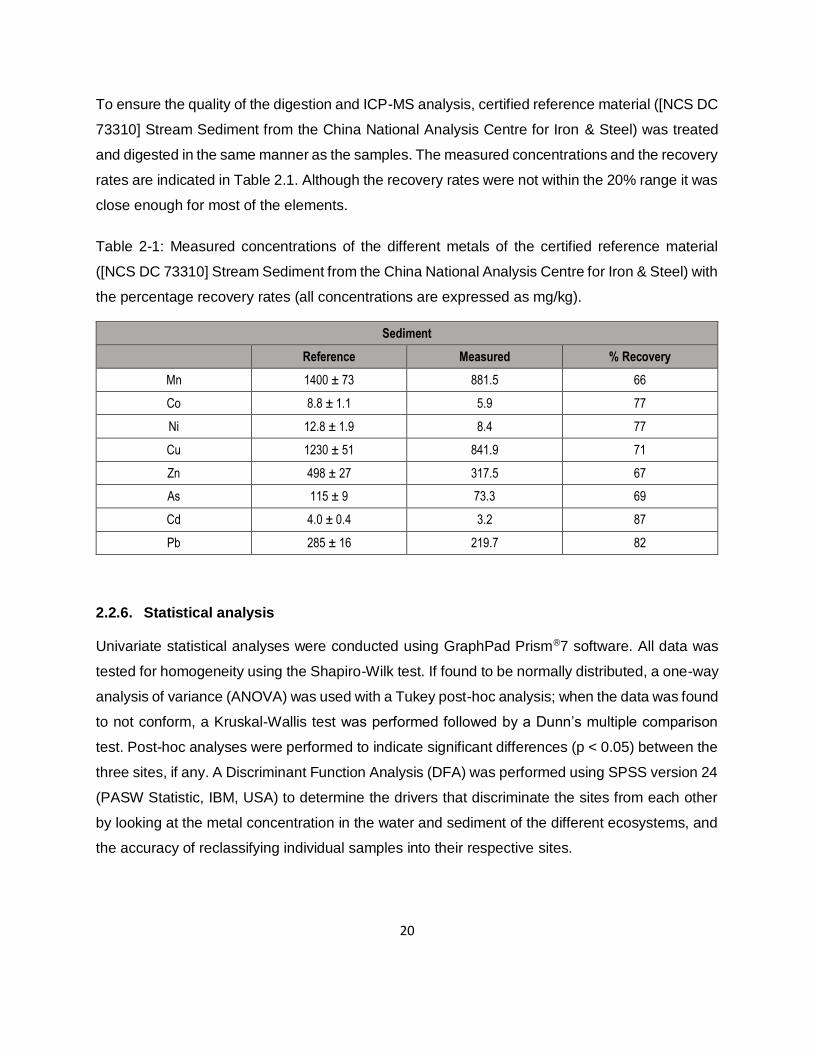
20
To ensure the quality of the digestion and ICP-MS analysis, certified reference material ([NCS DC
73310] Stream Sediment from the China National Analysis Centre for Iron & Steel) was treated
and digested in the same manner as the samples. The measured concentrations and the recovery
rates are indicated in Table 2.1. Although the recovery rates were not within the 20% range it was
close enough for most of the elements.
Table 2-1: Measured concentrations of the different metals of the certified reference material
([NCS DC 73310] Stream Sediment from the China National Analysis Centre for Iron & Steel) with
the percentage recovery rates (all concentrations are expressed as mg/kg).
Sediment
Reference Measured % Recovery
Mn 1400 ± 73 881.5 66
Co 8.8 ± 1.1 5.9 77
Ni 12.8 ± 1.9 8.4 77
Cu 1230 ± 51 841.9 71
Zn 498 ± 27 317.5 67
As 115 ± 9 73.3 69
Cd 4.0 ± 0.4 3.2 87
Pb 285 ± 16 219.7 82
2.2.6. Statistical analysis
Univariate statistical analyses were conducted using GraphPad Prism®7 software. All data was
tested for homogeneity using the Shapiro-Wilk test. If found to be normally distributed, a one-way
analysis of variance (ANOVA) was used with a Tukey post-hoc analysis; when the data was found
to not conform, a Kruskal-Wallis test was performed followed by a Dunn’s multiple comparison
test. Post-hoc analyses were performed to indicate significant differences (p < 0.05) between the
three sites, if any. A Discriminant Function Analysis (DFA) was performed using SPSS version 24
(PASW Statistic, IBM, USA) to determine the drivers that discriminate the sites from each other
by looking at the metal concentration in the water and sediment of the different ecosystems, and
the accuracy of reclassifying individual samples into their respective sites.
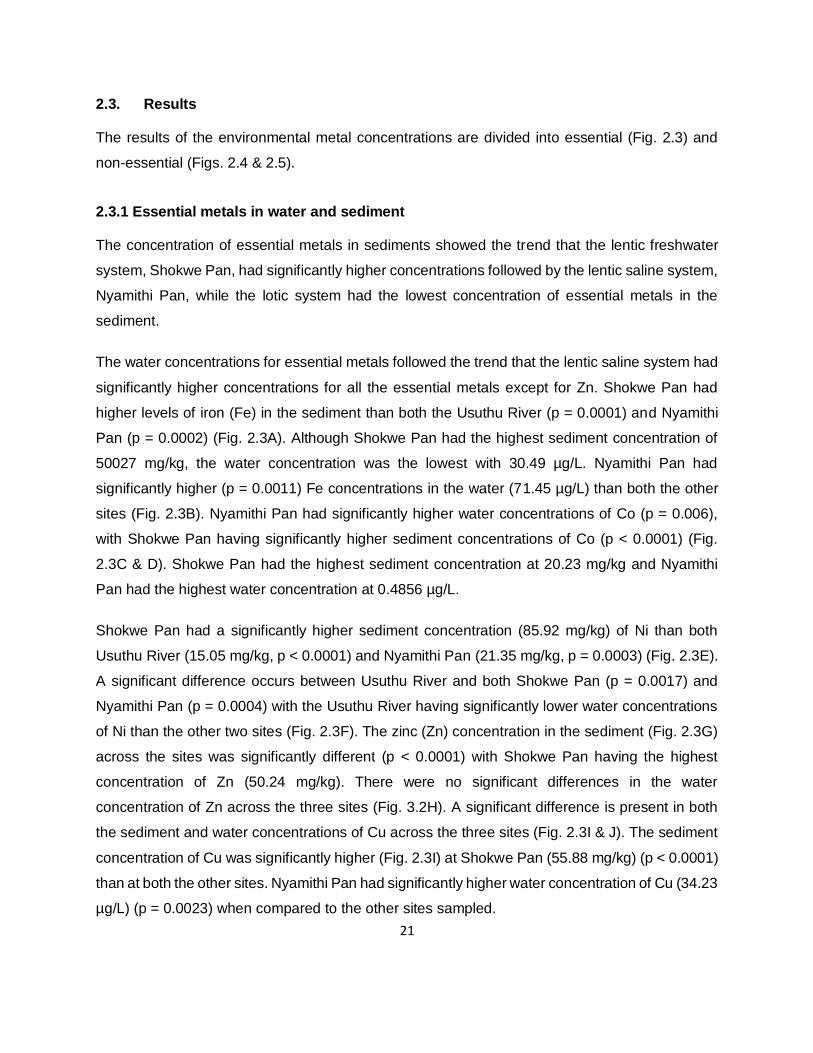
21
2.3. Results
The results of the environmental metal concentrations are divided into essential (Fig. 2.3) and
non-essential (Figs. 2.4 & 2.5).
2.3.1 Essential metals in water and sediment
The concentration of essential metals in sediments showed the trend that the lentic freshwater
system, Shokwe Pan, had significantly higher concentrations followed by the lentic saline system,
Nyamithi Pan, while the lotic system had the lowest concentration of essential metals in the
sediment.
The water concentrations for essential metals followed the trend that the lentic saline system had
significantly higher concentrations for all the essential metals except for Zn. Shokwe Pan had
higher levels of iron (Fe) in the sediment than both the Usuthu River (p = 0.0001) and Nyamithi
Pan (p = 0.0002) (Fig. 2.3A). Although Shokwe Pan had the highest sediment concentration of
50027 mg/kg, the water concentration was the lowest with 30.49 µg/L. Nyamithi Pan had
significantly higher (p = 0.0011) Fe concentrations in the water (71.45 µg/L) than both the other
sites (Fig. 2.3B). Nyamithi Pan had significantly higher water concentrations of Co (p = 0.006),
with Shokwe Pan having significantly higher sediment concentrations of Co (p < 0.0001) (Fig.
2.3C & D). Shokwe Pan had the highest sediment concentration at 20.23 mg/kg and Nyamithi
Pan had the highest water concentration at 0.4856 µg/L.
Shokwe Pan had a significantly higher sediment concentration (85.92 mg/kg) of Ni than both
Usuthu River (15.05 mg/kg, p < 0.0001) and Nyamithi Pan (21.35 mg/kg, p = 0.0003) (Fig. 2.3E).
A significant difference occurs between Usuthu River and both Shokwe Pan (p = 0.0017) and
Nyamithi Pan (p = 0.0004) with the Usuthu River having significantly lower water concentrations
of Ni than the other two sites (Fig. 2.3F). The zinc (Zn) concentration in the sediment (Fig. 2.3G)
across the sites was significantly different (p < 0.0001) with Shokwe Pan having the highest
concentration of Zn (50.24 mg/kg). There were no significant differences in the water
concentration of Zn across the three sites (Fig. 3.2H). A significant difference is present in both
the sediment and water concentrations of Cu across the three sites (Fig. 2.3I & J). The sediment
concentration of Cu was significantly higher (Fig. 2.3I) at Shokwe Pan (55.88 mg/kg) (p < 0.0001)
than at both the other sites. Nyamithi Pan had significantly higher water concentration of Cu (34.23
µg/L) (p = 0.0023) when compared to the other sites sampled.
22
Figure 2-3: Bar graphs showing the concentration (mean and SEM) of different essential metals
(Fe, Co, Ni, Zn, Cu) in both the sediment and water across the three sites located in Ndumo Game
Reserve (common superscripts are used to indicate significant differences between sites).
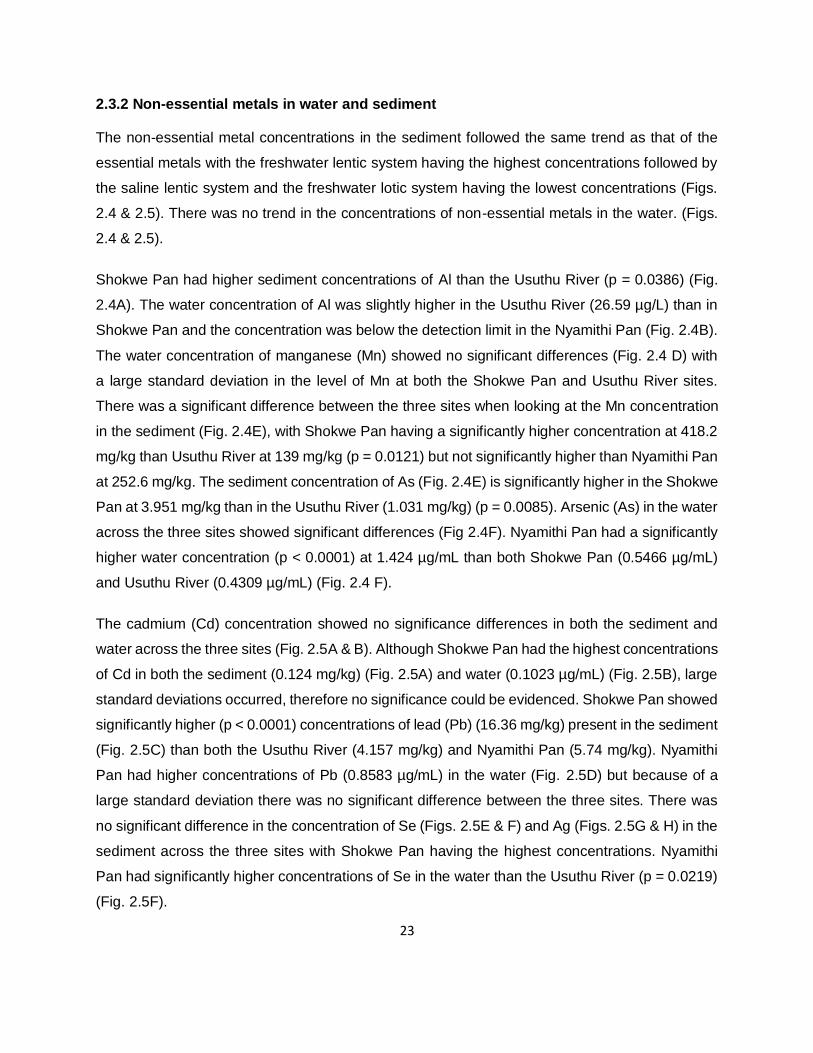
23
2.3.2 Non-essential metals in water and sediment
The non-essential metal concentrations in the sediment followed the same trend as that of the
essential metals with the freshwater lentic system having the highest concentrations followed by
the saline lentic system and the freshwater lotic system having the lowest concentrations (Figs.
2.4 & 2.5). There was no trend in the concentrations of non-essential metals in the water. (Figs.
2.4 & 2.5).
Shokwe Pan had higher sediment concentrations of Al than the Usuthu River (p = 0.0386) (Fig.
2.4A). The water concentration of Al was slightly higher in the Usuthu River (26.59 µg/L) than in
Shokwe Pan and the concentration was below the detection limit in the Nyamithi Pan (Fig. 2.4B).
The water concentration of manganese (Mn) showed no significant differences (Fig. 2.4 D) with
a large standard deviation in the level of Mn at both the Shokwe Pan and Usuthu River sites.
There was a significant difference between the three sites when looking at the Mn concentration
in the sediment (Fig. 2.4E), with Shokwe Pan having a significantly higher concentration at 418.2
mg/kg than Usuthu River at 139 mg/kg (p = 0.0121) but not significantly higher than Nyamithi Pan
at 252.6 mg/kg. The sediment concentration of As (Fig. 2.4E) is significantly higher in the Shokwe
Pan at 3.951 mg/kg than in the Usuthu River (1.031 mg/kg) (p = 0.0085). Arsenic (As) in the water
across the three sites showed significant differences (Fig 2.4F). Nyamithi Pan had a significantly
higher water concentration (p < 0.0001) at 1.424 µg/mL than both Shokwe Pan (0.5466 µg/mL)
and Usuthu River (0.4309 µg/mL) (Fig. 2.4 F).
The cadmium (Cd) concentration showed no significance differences in both the sediment and
water across the three sites (Fig. 2.5A & B). Although Shokwe Pan had the highest concentrations
of Cd in both the sediment (0.124 mg/kg) (Fig. 2.5A) and water (0.1023 µg/mL) (Fig. 2.5B), large
standard deviations occurred, therefore no significance could be evidenced. Shokwe Pan showed
significantly higher (p < 0.0001) concentrations of lead (Pb) (16.36 mg/kg) present in the sediment
(Fig. 2.5C) than both the Usuthu River (4.157 mg/kg) and Nyamithi Pan (5.74 mg/kg). Nyamithi
Pan had higher concentrations of Pb (0.8583 µg/mL) in the water (Fig. 2.5D) but because of a
large standard deviation there was no significant difference between the three sites. There was
no significant difference in the concentration of Se (Figs. 2.5E & F) and Ag (Figs. 2.5G & H) in the
sediment across the three sites with Shokwe Pan having the highest concentrations. Nyamithi
Pan had significantly higher concentrations of Se in the water than the Usuthu River (p = 0.0219)
(Fig. 2.5F).
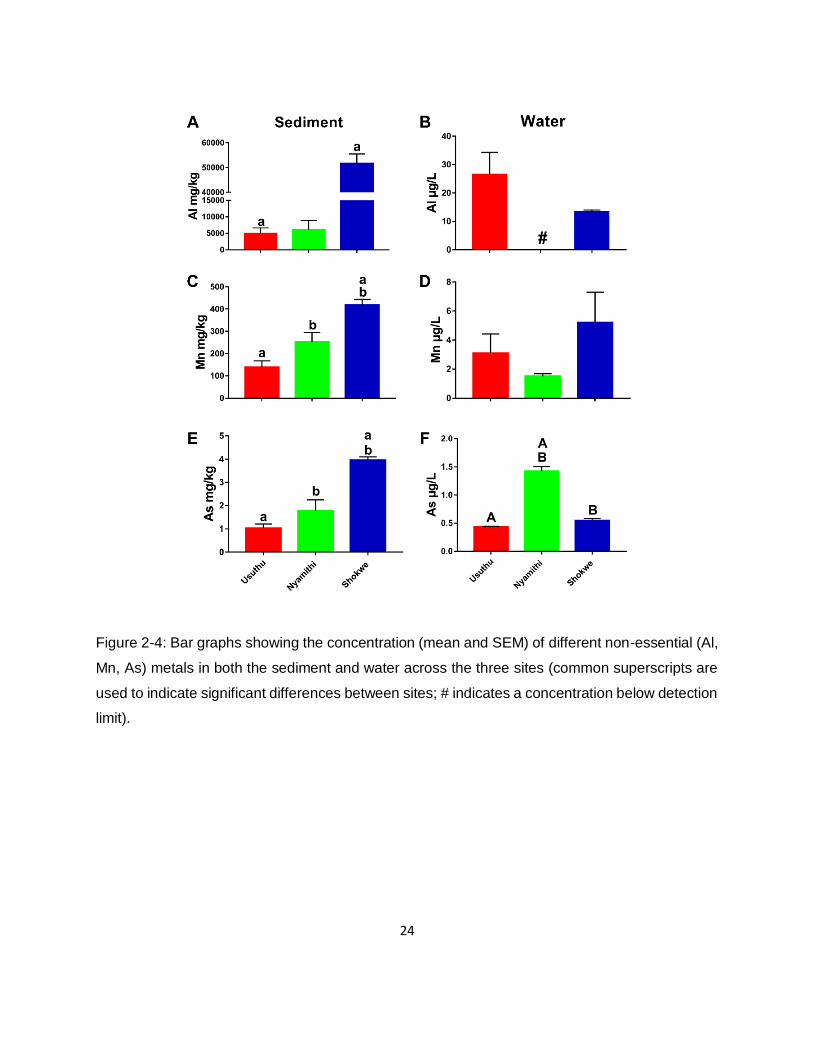
24
Figure 2-4: Bar graphs showing the concentration (mean and SEM) of different non-essential (Al,
Mn, As) metals in both the sediment and water across the three sites (common superscripts are
used to indicate significant differences between sites; # indicates a concentration below detection
limit).
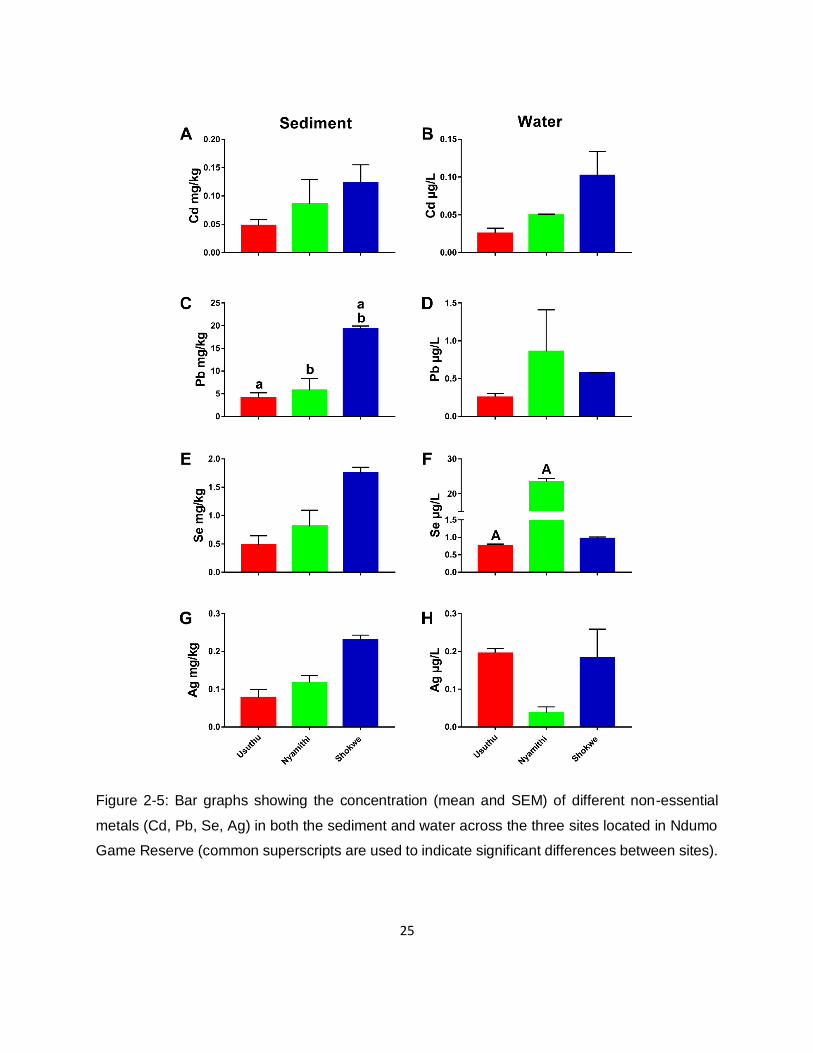
25
Figure 2-5: Bar graphs showing the concentration (mean and SEM) of different non-essential
metals (Cd, Pb, Se, Ag) in both the sediment and water across the three sites located in Ndumo
Game Reserve (common superscripts are used to indicate significant differences between sites).
26
A biplot of the canonical variates derived from the results of a Discriminant Function Analysis
(DFA) in Figure 2.7 shows the variation in the metal concentrations present in sediment samples
of the three sites in Ndumo Game Reserve. The structure matrix of the two functions can be seen
in Table 2.2. Functions 1 and 2 describe 100% of the variance in metal concentration at the
different sites. The first function (X axis) describes 77.8% of the variance, where the three sites
are separated by the concentration of metals in the sediment which was driven by a decrease in
Cd concentration and an increase in Al concentrations. The second function (y axis) describes
22.2% of the variance and was mainly driven by Co, Zn, Cu and As. There was a 100% accuracy
for the reclassification of the variant data to their predefined groups (Table 2.3).
Table 2-2: The structure matrix of the first two functions of a Discriminant Function Analysis (DFA)
using various metal concentrations present in the water from three different sites in Ndumo Game
Reserve (the largest absolute correlation between each variable and any discriminant function is
indicated in bold).
Structure Matrix
Metal % explained Cd Al Co Zn Cu As Fe Mn Ni Pb
Function
1 77.8 -0.439 0.057 0.006 -0.102 0.005 -0.056 0.056 0.116 -0.004 -0.119
2 22.2 -0.281 0.036 0.411 0.372 0.354 0.332 0.319 0.294 0.292 0.252
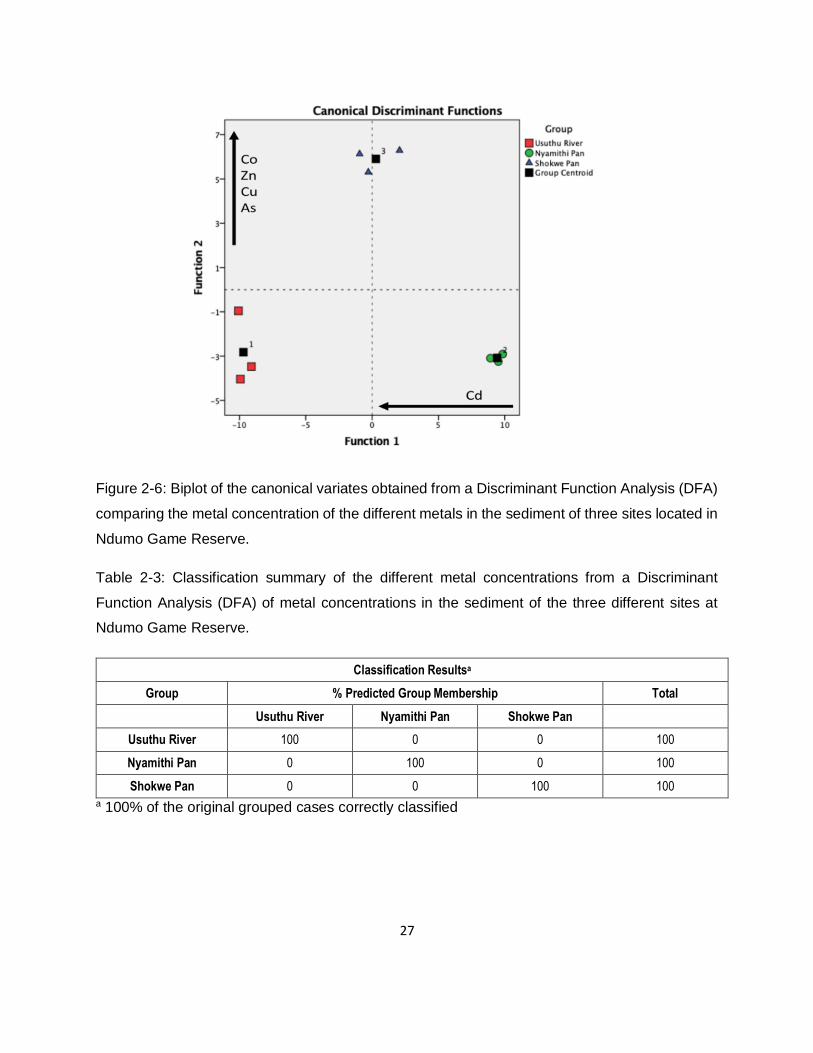
27
Figure 2-6: Biplot of the canonical variates obtained from a Discriminant Function Analysis (DFA)
comparing the metal concentration of the different metals in the sediment of three sites located in
Ndumo Game Reserve.
Table 2-3: Classification summary of the different metal concentrations from a Discriminant
Function Analysis (DFA) of metal concentrations in the sediment of the three different sites at
Ndumo Game Reserve.
Classification Resultsa
Group % Predicted Group Membership Total
Usuthu River Nyamithi Pan Shokwe Pan
Usuthu River 100 0 0 100
Nyamithi Pan 0 100 0 100
Shokwe Pan 0 0 100 100
a 100% of the original grouped cases correctly classified
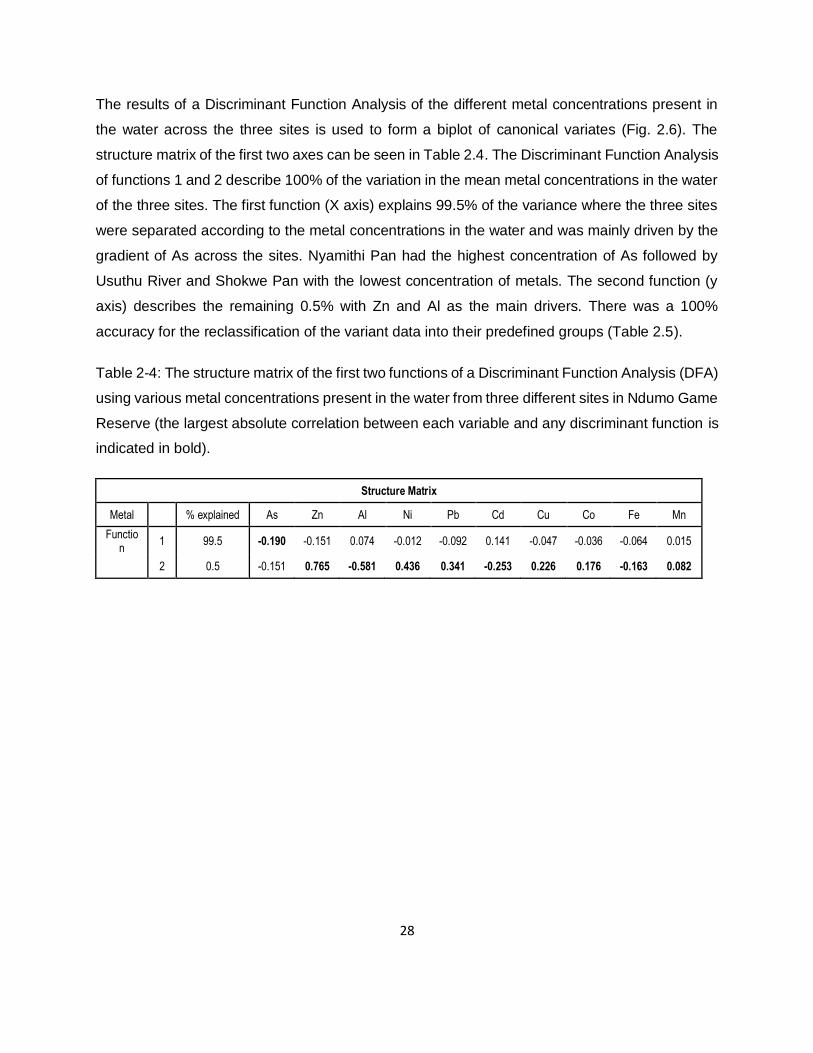
28
The results of a Discriminant Function Analysis of the different metal concentrations present in
the water across the three sites is used to form a biplot of canonical variates (Fig. 2.6). The
structure matrix of the first two axes can be seen in Table 2.4. The Discriminant Function Analysis
of functions 1 and 2 describe 100% of the variation in the mean metal concentrations in the water
of the three sites. The first function (X axis) explains 99.5% of the variance where the three sites
were separated according to the metal concentrations in the water and was mainly driven by the
gradient of As across the sites. Nyamithi Pan had the highest concentration of As followed by
Usuthu River and Shokwe Pan with the lowest concentration of metals. The second function (y
axis) describes the remaining 0.5% with Zn and Al as the main drivers. There was a 100%
accuracy for the reclassification of the variant data into their predefined groups (Table 2.5).
Table 2-4: The structure matrix of the first two functions of a Discriminant Function Analysis (DFA)
using various metal concentrations present in the water from three different sites in Ndumo Game
Reserve (the largest absolute correlation between each variable and any discriminant function is
indicated in bold).
Structure Matrix
Metal % explained As Zn Al Ni Pb Cd Cu Co Fe Mn
Function
1 99.5 -0.190 -0.151 0.074 -0.012 -0.092 0.141 -0.047 -0.036 -0.064 0.015
2 0.5 -0.151 0.765 -0.581 0.436 0.341 -0.253 0.226 0.176 -0.163 0.082
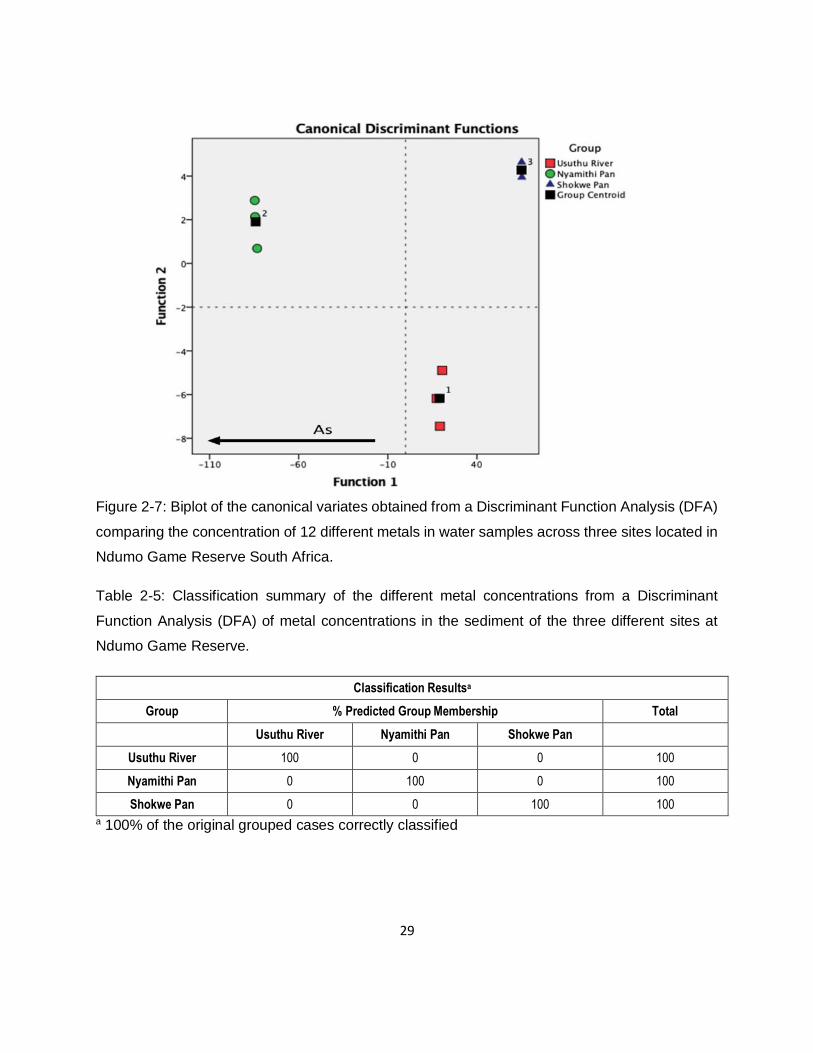
29
Figure 2-7: Biplot of the canonical variates obtained from a Discriminant Function Analysis (DFA)
comparing the concentration of 12 different metals in water samples across three sites located in
Ndumo Game Reserve South Africa.
Table 2-5: Classification summary of the different metal concentrations from a Discriminant
Function Analysis (DFA) of metal concentrations in the sediment of the three different sites at
Ndumo Game Reserve.
Classification Resultsa
Group % Predicted Group Membership Total
Usuthu River Nyamithi Pan Shokwe Pan
Usuthu River 100 0 0 100
Nyamithi Pan 0 100 0 100
Shokwe Pan 0 0 100 100 a 100% of the original grouped cases correctly classified
30
2.4. Discussion
In order to establish the condition of the aquatic ecosystem in NGR the sediment and water metal
concentrations were compared to guidelines. As there are currently no sediment guidelines for
South Africa (Gordon & Muller, 2010), the sediment in this study was compared with the Canadian
sediment guidelines (CCME, 2014). The water concentrations were compared to the South
African guideline for water quality set up by DWAF (1996), as well as the Australian, New Zealand
(Anzecc, 2000) and European quality guidelines (Cole et al., 1999).
The three aquatic sites were also compared with different aquatic ecosystems in South Africa as
well as two international floodplain pans namely the River Lahn and River Severn floodplains.
The lotic system was compared to three rivers in the Kruger National Park (KNP) because it is
the biggest conservation area in South Africa and the lentic systems were compared to the Nyl
River floodplain of South Africa and two international floodplains. The Nyl River floodplain is one
of South Africa’s largest floodplains (McCarthy et al., 2011). The concentrations of Zn, Cd, As and
Pb were lower at all three sites than the SQG of the CCME (2014).
When comparing the metal concentrations in the sediment of the lotic system in the study areas
to the two lentic systems as well as the three different rivers in the KNP, the lotic system had the
lowest concentrations of metal in the sediment compared to the lentic systems, because of the
flowing water flushing the sediment downstream (Extence et al., 2013, Meena et al., 2018). The
lotic system has a sandy substrate while the two lentic systems have a clay substrate; metals bind
to greater effect to a clay substrate than to a sandy substrate (Pekey, 2006).
Both the essential and non-essential metal concentrations of the sediment of the Usuthu River
lotic system are compared with the sediment levels of three different rivers (Olifants, Letaba and
Luvuvhu) located in the KNP in Table 2.4. The KNP is one of the most studied protected areas in
South Africa and there are results available of the metal concentrations of the main rivers (Gerber
et al., 2016). The three biggest east-flowing rivers were chosen to compare with the east-flowing
river of this study. The KNP is 332 km north-north-west of NGR. The Olifants River is known to
be one of the most mining-polluted rivers in South Africa (McCarthy, 2011).
Usuthu River had lower concentrations of both the essential and non-essential metals than the
Olifants and Luvuvhu Rivers. This is because the Usuthu River has no major mining activities in
its catchment area and is mainly used for small-scale agriculture. When comparing the Usuthu
31
River with the Letaba River, Usuthu River had higher concentrations of Ni and Pb, but lower
concentrations of the other metals. In comparing with the CCME (2014) it was found that all metal
concentrations in the sediment of the Usuthu River were below their guidelines and thus proves
that the Usuthu River is in a moderately good condition.
When comparing the metal concentrations of the two lentic systems of NGR to the lotic system it
was found that both the lentic systems had higher concentrations of all the metals than the lotic
system. This is because of the fact that metals that flow into a pan or lake adsorb to the sediment
and the sediment acts as a sink (Tendaupenyu & Magadza, 2019). The two lentic systems also
have a clay substrate where metals have more surface area to bind to and thus they bind more
than the lotic system’s sandy substrate (Pekey, 2006).
The two lentic systems were compared with each other in order to determine the effect of saline
on the bioaccumulation of metals. The freshwater lentic system had the highest concentrations of
all the metals in the sediment. The saline pan has high concentrations of salts that form complexes
with the metals, which make adsorption to the sediment more difficult (Wright & Zamuda, 1987,
Kumar et al., 2015).
The comparison of the metal concentrations in the sediment of the two lentic systems in NGR to
the floodplain of the Nyl River as well as to two international floodplains can be seen in Table 2.5.
Shokwe Pan had the higher concentrations of all the essential metals compared to the Nyl River
and the international floodplains. The elevated levels of concentration at Shokwe Pan could be
due to the geological qualities of the system. The concentrations of essential metals in the
sediment of Nyamithi Pan were lower than the Nyl River and the two international floodplains.
The salts in Nyamithi Pan play a big role in preventing the adsorption of metals to the sediment.
The concentrations of the non-essential metal manganese in the sediment of the two lentic pans
were well below the concentration in the Nyl River sediment. The Cd and Pb concentrations in
the two lentic systems were well below the concentrations in both the international floodplain sites.
The non-essential metals were also well below the concentrations for the CCME target sediment
guidelines (CCME, 2014).
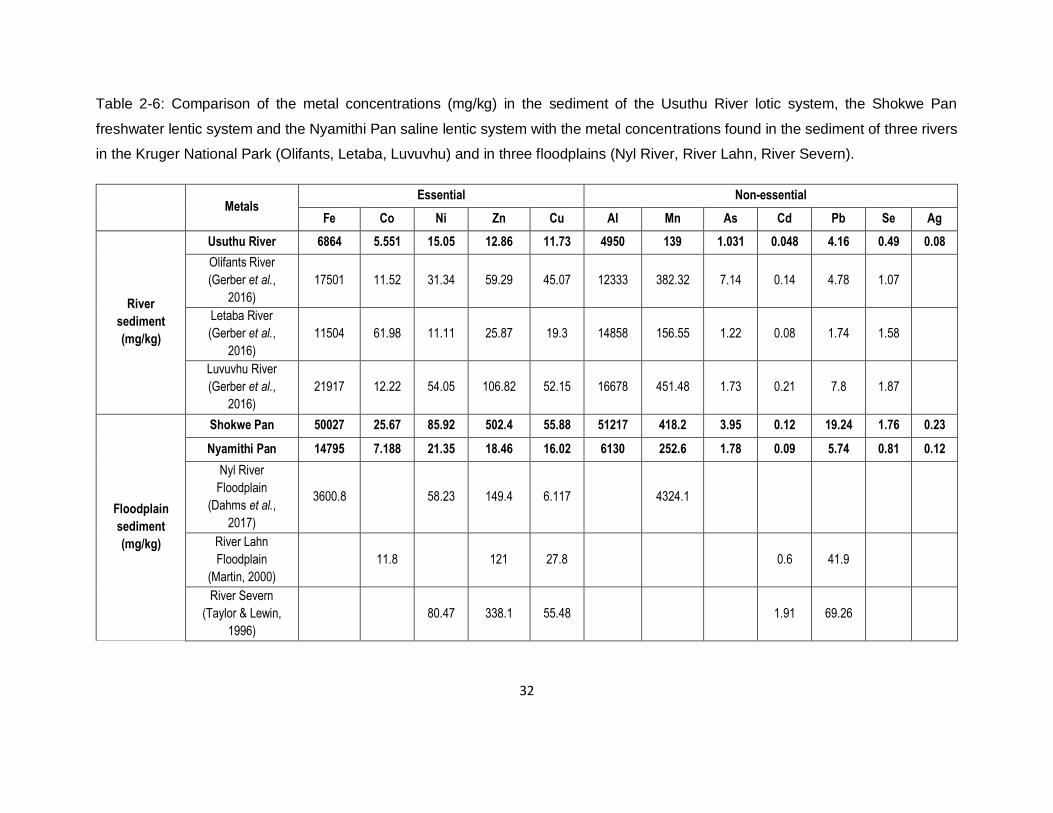
32
Table 2-6: Comparison of the metal concentrations (mg/kg) in the sediment of the Usuthu River lotic system, the Shokwe Pan
freshwater lentic system and the Nyamithi Pan saline lentic system with the metal concentrations found in the sediment of three rivers
in the Kruger National Park (Olifants, Letaba, Luvuvhu) and in three floodplains (Nyl River, River Lahn, River Severn).
Metals Essential Non-essential
Fe Co Ni Zn Cu Al Mn As Cd Pb Se Ag
River
sediment
(mg/kg)
Usuthu River 6864 5.551 15.05 12.86 11.73 4950 139 1.031 0.048 4.16 0.49 0.08
Olifants River
(Gerber et al.,
2016)
17501 11.52 31.34 59.29 45.07 12333 382.32 7.14 0.14 4.78 1.07
Letaba River
(Gerber et al.,
2016)
11504 61.98 11.11 25.87 19.3 14858 156.55 1.22 0.08 1.74 1.58
Luvuvhu River
(Gerber et al.,
2016)
21917 12.22 54.05 106.82 52.15 16678 451.48 1.73 0.21 7.8 1.87
Floodplain
sediment
(mg/kg)
Shokwe Pan 50027 25.67 85.92 502.4 55.88 51217 418.2 3.95 0.12 19.24 1.76 0.23
Nyamithi Pan 14795 7.188 21.35 18.46 16.02 6130 252.6 1.78 0.09 5.74 0.81 0.12
Nyl River
Floodplain
(Dahms et al.,
2017)
3600.8 58.23 149.4 6.117 4324.1
River Lahn
Floodplain
(Martin, 2000)
11.8 121 27.8 0.6 41.9
River Severn
(Taylor & Lewin,
1996)
80.47 338.1 55.48 1.91 69.26
33
When comparing the metal concentrations in the water across the three sites in NGR it can be
seen that for most of the metals the lotic system had the lowest concentrations in the water. The
lotic system has a continuous flow of water that carries metal concentrations downstream.
The study found that the saline lentic system had the highest concentration of all metals in the
water except for Al that was below detection level in the water of Nyamithi Pan. The high salt
concentrations in the water form complexes with the metals that make adsorption harder than in
fresh water and thus the metals stay in the water (Wright & Zamuda, 1987, Kumar et al., 2015).
Adsorption is possible in the freshwater lentic system and thus the lentic system has lower water
concentrations of metals than the saline lentic system. The concentration of all essential metals
except for Zn in the water of the three sites in NGR was below the TWQR of South Africa with Zn
being higher than the South African guidelines but lower than the Australian and European
guidelines.
The concentration of Fe at the three sites was very similar to the concentrations found in the three
rivers of the KNP (Table 2.6). Iron is found naturally in all ecosystems and is considered to be the
fourth most abundant metal in natural ecosystems and comprises 3.5% of the earth’s crust
(Mucha et al., 2003). Iron can also enter aquatic ecosystems through anthropogenic activities
such as mining (Mucha et al., 2003). There are no major mining activities in the catchment areas
of the Usuthu River. Currently there is no TWQR for Co in South Africa (DWAF, 1996), but the
concentration in the three study sites was lower than in the four rivers namely the Olifants, Letaba,
Luvuvhu and Nyl rivers (Table 2.6). Cobalt can be introduced into aquatic ecosystems naturally
through forest fires, seawater spray, volcanoes or through anthropogenic activities such as
burning fossil fuels or phosphate fertilisers (Zadnipryany et al., 2017). In the Ndumo area as well
as the Usuthu River catchment area there are small-scale subsistence farmers who use small
amounts of fertilisers as well as engage in small-scale burning of fossil fuels as heat or cooking
source.
Although there is no TWQR for Ni in South Africa the concentration of Ni across the three sites
was lower than the TWQR for Australia, America and Europe. The concentration of Ni in both
Shokwe and Nyamithi pans was higher than the concentration in the three KNP rivers (Table 2.6).
Nickel is released into aquatic ecosystems naturally from weathering of sandstone, slate and clay.
It can also be introduced into the environment through mining activities (Cempel & Nikel, 2006).
The Olifants River catchment area is full of mining activities that release mining effluence through
34
runoff into the environment (Gerber et al., 2016). There are no mining activities close to the NGR
or in the Usuthu River catchment area and thus the lower concentrations of Ni in the water.
The concentration of Cu was higher in the three sites than in the four rivers (Table 2.6). Nyamithi
Pan had the highest concentration of Cu present. Copper is an important trace element and is
used for enzyme functions (de Oliveira-Filho et al., 2004), and can be found at approximately 60
mg/kg in the earth’s surface (Flemming & Trevors, 1989). Anthropogenic activities such as mining
and burning of fossil fuels release Cu into the environment (de Oliveira-Filho et al., 2004).
The zinc concentrations in the water of all three sites were above the TWQR of South Africa which
is 2 µg/L for aquatic ecosystems. The concentrations fall within the range of the Australian TWQR
which is between 2.4 µg/L for 100% of species and 32 µg/L for 80% of species. The Zn
concentrations of the three sites were higher than in the three KNP rivers but lower than the
concentrations found in the Nyl River (Table 2.6). Zinc enters aquatic ecosystems naturally
through the weathering of rocks and sulphides (DWAF, 1996). Anthropogenic influences such as
exhaust fumes, fertilisers and insecticides can also contribute to zinc levels in aquatic ecosystems
through runoff (DWAF, 1996). There are no mining activities close to the NGR and very little use
of fertilisers close to NGR thus it is believed that the Zn concentrations were high due to geological
characteristics of the NGR.
The concentrations of the non-essential metals in the water of the three different sites in NGR
were compared to those of the three KNP rivers as well as the Nyl River (Table 2.5). The water
concentration of Al in the three sites was higher than the Target Water Quality Range (TWQR)
set by DWAF (DWAF, 1996) of 0.1 to 1.5 µg/L. Although the concentration was higher than the
TWQR it was still lower than the Olifants, Letaba, Luvuvhu and Nyl rivers of South Africa.
Aluminium is naturally abundant in ecosystems and comprises 8.1% of the earth’s crust (Tria et
al., 2007). Therefore, higher levels of aluminium can be the result of natural corrosion of the
earth’s crust. Anthropogenic activities such as the addition of Al salts to purify water and coal
combustion are also sources of Al in surface water (Tria et al., 2007). Ndumo Game Reserve is
not located close to any big coal combustion sites, but there is small-scale burning of coal for
cooking. According to WHO (2017) the concentration of Al in the water of the three sites, although
exceeding the TWQR, is still considered as tolerable for surface waters.
35
The TWQR for Mn in South Africa is a concentration of 180 µg/L. Therefore, all three sites were
well below the concentration set for TWQR in South Africa. The concentration of Mn in the three
sites was higher than the concentration of Mn in both the Olifants and Luvuvhu rivers but lower
than in the Letaba River and within the range of that of the Nyl River. Although Mn is released
into the environment through mining industries there is no evidence of that at the sites. The low
concentration of Mn in the water does not suggest Mn pollution at the selected sites.
The concentration of As in the water of all three sites exceeded the TWQR of South Africa. Arsenic
is released into the aquatic ecosystem through the natural weathering of As containing rocks or
ores (DWAF, 1996). Arsenic is a by-product of copper smelting (Ng et al., 2003), and is also a by-
product of insecticides or herbicides (Mohan et al., 1982, Alain et al., 1993). The increased levels
of As could be due to the herbicides and insecticides the locals use for their sustainable farming.
The concentration of Cd in the water of all three sites was below the TWQR of South Africa (0.15-
0.4 µg/mL) but a bit higher than the TWQR of both Australia (0.8 µg/mL) and Europe’s (<0.08-
0.25 µg/mL). The concentration of cadmium in all three sites was lower than the concentrations
in the KNP rivers (Table 2.7). Cadmium is normally found in association with other elements such
as Cu, Zn and sulphides, and enter aquatic ecosystems through natural weathering (DWAF,
1996). Mining and industrial activities release Cd into aquatic ecosystems through runoff (DWAF,
1996).
The concentrations of Pb in the water at the three sites were below the TWQR of South Africa
(1.2 µg/mL). The lead concentrations were also lower than in the four rivers (Table 2.5). Most lead
present in aquatic ecosystems is introduced through natural weathering of sulphide ores (DWAF,
1996). Anthropogenic activities such as sewage treatment and fuel combustions can also
introduce Pb into the environment (Gioia et al., 2010). The toxicity of lead is dependent on the pH
of the water body: the more alkaline the water the more the toxicity increases (DWAF, 1996). Only
the concentration of Se in Nyamithi Pan was higher than the concentrations found in the three
rivers of the KNP (Table 2.7). According to Lemly (2002), selenium is a natural element, but Se
pollution occurs worldwide through anthropogenic activities such as mining, agriculture and
industry.
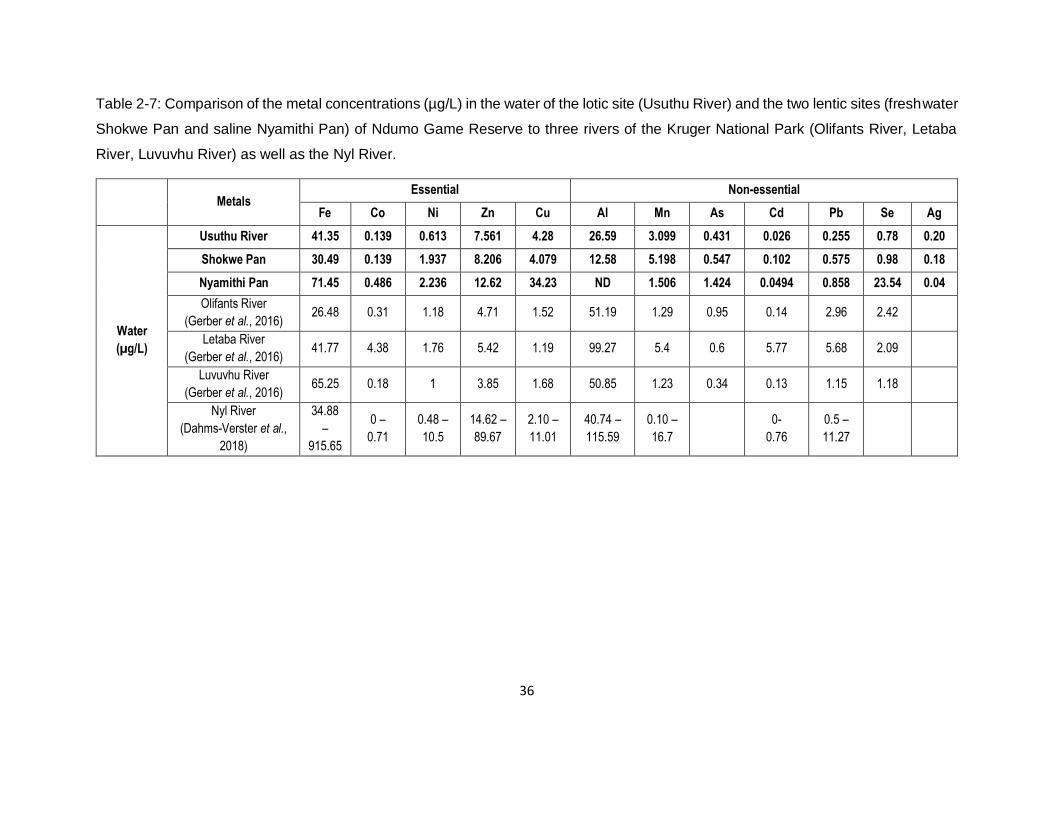
36
Table 2-7: Comparison of the metal concentrations (µg/L) in the water of the lotic site (Usuthu River) and the two lentic sites (freshwater
Shokwe Pan and saline Nyamithi Pan) of Ndumo Game Reserve to three rivers of the Kruger National Park (Olifants River, Letaba
River, Luvuvhu River) as well as the Nyl River.
Metals Essential Non-essential
Fe Co Ni Zn Cu Al Mn As Cd Pb Se Ag
Water
(µg/L)
Usuthu River 41.35 0.139 0.613 7.561 4.28 26.59 3.099 0.431 0.026 0.255 0.78 0.20
Shokwe Pan 30.49 0.139 1.937 8.206 4.079 12.58 5.198 0.547 0.102 0.575 0.98 0.18
Nyamithi Pan 71.45 0.486 2.236 12.62 34.23 ND 1.506 1.424 0.0494 0.858 23.54 0.04
Olifants River
(Gerber et al., 2016) 26.48 0.31 1.18 4.71 1.52 51.19 1.29 0.95 0.14 2.96 2.42
Letaba River
(Gerber et al., 2016) 41.77 4.38 1.76 5.42 1.19 99.27 5.4 0.6 5.77 5.68 2.09
Luvuvhu River
(Gerber et al., 2016) 65.25 0.18 1 3.85 1.68 50.85 1.23 0.34 0.13 1.15 1.18
Nyl River
(Dahms-Verster et al.,
2018)
34.88
–
915.65
0 –
0.71
0.48 –
10.5
14.62 –
89.67
2.10 –
11.01
40.74 –
115.59
0.10 –
16.7
0-
0.76
0.5 –
11.27
37
2.5. Conclusion
The hypothesis for this chapter was that because lentic systems function as natural sinks for
metals, they would have higher concentrations of metals than the lotic system, and that
concentrations of metals present in all sites of the study would be below the international
guidelines for target water quality as well as international sediment quality guidelines. This study
is the first to report on the environmental concentrations of metals in NGR. In the study it was
found that the freshwater lentic system had the highest concentrations of metals in the sediment
across the three sites followed by the saline lentic system whereas the lotic system had the lowest
concentrations of metals in the sediment. The metal concentrations in the water was the highest
in the saline lentic system. Although the lotic system did not have the lowest concentrations of all
the metals in the water it had the lowest overall concentrations of metals in the water.
All the metals were below the Canadian sediment quality range and most of the metal
concentrations in the water were found to be lower than the TWQR of South Africa. The essential
metal, Zn, was higher than the TWQR of South Africa but lower than the TWQR of Australia and
Europe. The non-essential metals, Al and As, had higher concentrations in the water at the three
sites than the TQWR of South Africa, and can thus be a source for concern in the aquatic
ecosystems. Overall the hypothesis can be accepted with the lentic systems having higher
environmental concentrations of both the essential and non-essential metals. Although the Al and
As concentrations in the water exceeded that of the TWQR of South Africa the hypothesis that
states that the metal concentrations in the study areas would be below the guidelines can still be
accepted.
Now that the environmental concentration of metals in the study sites is known it can be used to
determine the exposure of the environmental concentrations on the aquatic organisms in the
ecosystem, and their role as bio-indicators.
38
3. Bioaccumulation of essential and non-essential metals in
the tissues of the bio-indicator – Clarias gariepinus –
from three sites with differing abiotic metal profiles.
3.1. Introduction
As previously indicated metals can enter aquatic ecosystems through many different pathways,
ranging from geological weathering and atmospheric deposition to anthropogenic impacts such
as agricultural, industrial and residential waste products (Dhanakumar et al., 2015), where these
metals would be detrimental to organisms at high concentrations (Eneji et al., 2011). Scientists
use biomonitoring to investigate the presence of increased metals in aquatic ecosystems and
monitor these levels over time. Biomonitoring is the use of feral or transplanted organisms as an
early warning system for pollution of the environment, i.e. aquatic organisms in aquatic
ecosystems (Adams & Greeley, 2000). Fish are considered to be one of the best bio-indictors
used for biomonitoring of metal pollution in aquatic ecosystems (Authman et al., 2015).
Fish have long lifespans and can therefore integrate fluctuations of metals over an extended
period, where it is anticipated that the most abundant of the metals present will have higher
concentrations in older organisms (Lamas et al., 2007). Fish spend their entire lives in water and
can therefore be used for continuous monitoring of metals. Bioaccumulation in fish also improves
the accuracy of analysing trace metals near the detection limits and lowers the costs of the
analysis (Rainbow, 1998). Ayandiran et al. (2009) state that in a polluted environment, fish tend
to accumulate metals in their organs, which is supported by many previous studies which have
found that metals accumulate in organs such as the gonads, heart, kidney, bone, liver and brain,
but many studies focus on the edible muscle tissue (Avenant-Oldewage & Marx, 2000, Eneji et
al., 2011, Murtala et al., 2012, El-Moselhy et al., 2014).
Biomagnification is the increase in concentration of pollution in aquatic organisms across the
trophic levels of the environment up to the top predator (Thomann, 1989, Ribeiro et al., 2005,
Juncos et al., 2019). The accumulation patterns of metals for fish are dependent on both the
elimination and uptake rates (Mansour & Sidky, 2002). According to Brezonik et al. (1991) and
Burger et al. (2002), there are two main uptake routes for metals in fish. Firstly, the transport of
39
metals via ionic exchange through the gills of the fish; secondly, through ingestion, sediment and
food particles containing the metals passing through the digestive tract where the metals along
with nutrients are absorbed in the intestines of the fish. Previous studies have found that the latter
route can be considered as the most important (Fleischer et al., 1974, Bervoets et al., 2001,
Bervoets & Blust, 2003, Bury et al., 2003, Sauliutė & Svecevičius, 2015).
Clarias gariepinus (Burchell 1822) is a commercially important fish species that serves as a major
food source in third world countries (Farombi et al., 2007). According to Olufemi et al. (1991), the
catfish is widely distributed in the rivers, lakes and dams across the entire African continent. It is
considered that C. gariepinus is the most important tropical catfish species for aquaculture in
West Africa (Huisman & Richter, 1987, Gabriel et al., 2007, Oké & Goosen, 2019). Clarias
gariepinus can be considered to be a good bio-indicator of metal pollution, because, it is a bottom-
dwelling fish that comes into contact with the sediment regularly (Gamal et al., 2012). As the
catfish disturbs the sediment, metals are released back into the water column and the metals
become available for uptake (Simpson et al., 2002).
The sharptooth catfish is known to have a long lifespan with Booth et al. (2010) reporting catfish
of more than 15 years old. They are omnivores that feed on anything from plants to other
predators in the water body (Skelton, 2012). The catfish can endure harsh conditions and
therefore is able to survive and thrive even in highly polluted systems (Skelton, 2012). Clarias
gariepinus is a fish species without scales, which may contribute to higher metal accumulation in
the skin and muscle tissues of the fish (Coetzee et al., 2002). Furthermore, numerous previous
studies in several freshwater aquatic ecosystems across Africa have shown that C. gariepinus is
an important fish species which can be used for biomonitoring as it is able to accumulate and thus
reflect metal contamination in its direct environment (Coetzee et al., 2002, Asagba et al., 2008,
Crafford & Avenant-Oldewage, 2010, Eneji et al., 2011, Jooste et al., 2015).
This chapter serves to investigate the metal accumulation profiles in two tissues of C. gariepinus
from the three study sites to ascertain whether these catfish can reflect their unimpacted
environments (as shown in Chapter 2). The hypothesis for this chapter states that the
bioaccumulation of metals in C. gariepinus at all three sites will reflect the environmental
conditions of the sites, with both the lentic systems (fresh and saline) having higher
bioaccumulation factors than the lotic system. Clarias gariepinus will also bioaccumulate the non-
essential metals to higher levels than the essential metals. The aim of this chapter is to determine
40
the concentration of essential and non-essential metals in both the muscle and liver tissues of the
host C. gariepinus and to establish if these concentrations differ across the various types of
aquatic ecosystems.
3.2. Materials and methods
3.2.1. Study area and sampling
Sampling took place during November 2018 at sites within Shokwe and Nyamithi pans and along
the Usuthu River all located within the NGR (For detailed background and site descriptions refer
to Chapter 2 Sections 2.2.1 and 2.2.2, as well as Figs. 2.1 and 2.2).
3.2.2. Field collections
For the study 25 C. gariepinus individuals were collected at both Nyamithi and Shokwe pans and
24 at the Usuthu River. Different sampling techniques were used, including rod and reel and fyke
nets. Rod and reel sampling worked best at the lentic sites (Shokwe and Nyamithi pans) whilst
the fyke nets worked best at the lotic site (Usuthu River). As the catfish were collected, they were
placed in temporary holding/transport tanks and transported to the field station where they were
euthanised by severing the spinal cord (SOP NWU-00267-17-S5, see appendix 10). All sampling
procedures were approved by the NWU-AnimCare Committee (Ethics Committee on Animal
Care, Health and Safety in Research) (AREC-130913-015). The necessary muscle from the left
side of the catfish and liver tissues were sampled and placed in polypropylene tubes before
freezing (-20˚C) for later laboratory analysis.
3.2.3. Laboratory analysis of tissues and quality control
Samples were removed from the freezer and allowed to defrost prior to drying. A known weight
(~10 g) of both tissue types were freeze-dried using a Labconco FreeZone® Plus 6 Liter Cascade
Console Freeze Dry System (7753030). The dried tissue samples were reweighed (in order to
calculate the moisture content for wet weight comparisons if needed), whereafter 0.2 g of the
dried samples were placed into Teflon tubes and 2.5 mL nitric acid (HNO3) as well as 7.5 mL 32%
hydrochloric acid (HCl) were added to each tube. The samples and blanks (2.5 mL HNO3, 7.5 mL
32% HCl) were then digested using the Ethos Easy Maxi-44 Microwave Digestion system at 1800
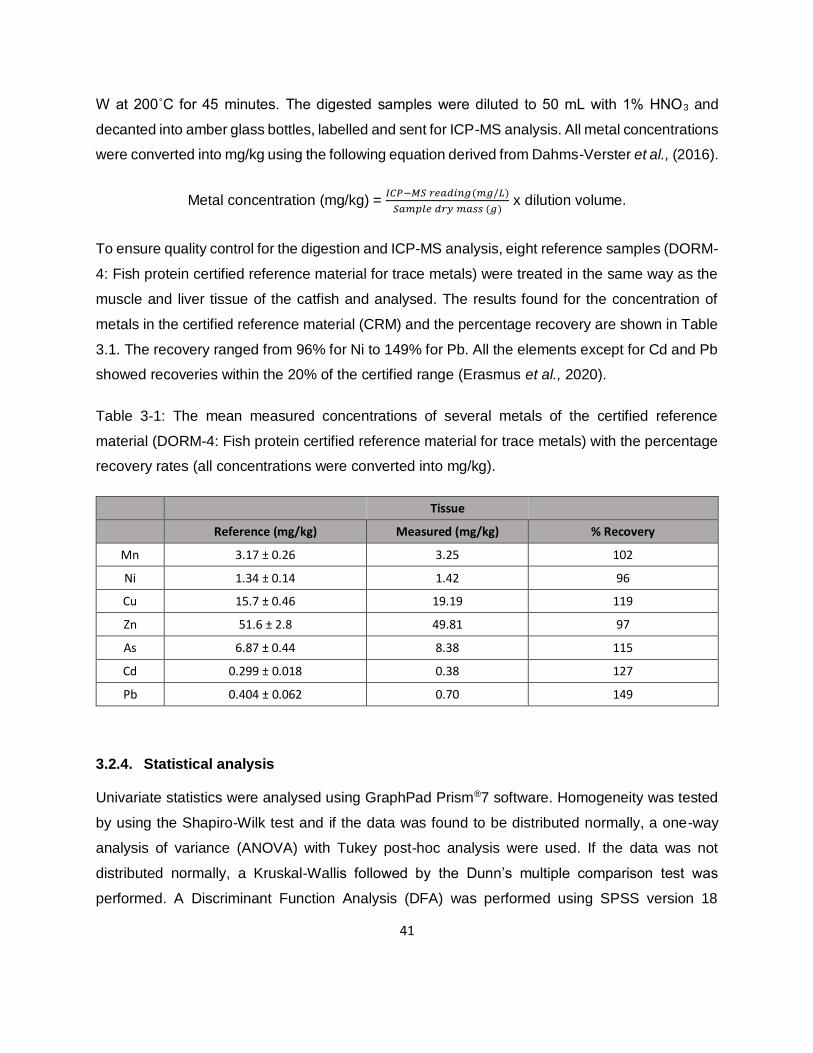
41
W at 200˚C for 45 minutes. The digested samples were diluted to 50 mL with 1% HNO3 and
decanted into amber glass bottles, labelled and sent for ICP-MS analysis. All metal concentrations
were converted into mg/kg using the following equation derived from Dahms-Verster et al., (2016).
Metal concentration (mg/kg) = 𝐼𝐶𝑃−𝑀𝑆 𝑟𝑒𝑎𝑑𝑖𝑛𝑔(𝑚𝑔/𝐿)
𝑆𝑎𝑚𝑝𝑙𝑒 𝑑𝑟𝑦 𝑚𝑎𝑠𝑠 (𝑔) x dilution volume.
To ensure quality control for the digestion and ICP-MS analysis, eight reference samples (DORM-
4: Fish protein certified reference material for trace metals) were treated in the same way as the
muscle and liver tissue of the catfish and analysed. The results found for the concentration of
metals in the certified reference material (CRM) and the percentage recovery are shown in Table
3.1. The recovery ranged from 96% for Ni to 149% for Pb. All the elements except for Cd and Pb
showed recoveries within the 20% of the certified range (Erasmus et al., 2020).
Table 3-1: The mean measured concentrations of several metals of the certified reference
material (DORM-4: Fish protein certified reference material for trace metals) with the percentage
recovery rates (all concentrations were converted into mg/kg).
Tissue
Reference (mg/kg) Measured (mg/kg) % Recovery
Mn 3.17 ± 0.26 3.25 102
Ni 1.34 ± 0.14 1.42 96
Cu 15.7 ± 0.46 19.19 119
Zn 51.6 ± 2.8 49.81 97
As 6.87 ± 0.44 8.38 115
Cd 0.299 ± 0.018 0.38 127
Pb 0.404 ± 0.062 0.70 149
3.2.4. Statistical analysis
Univariate statistics were analysed using GraphPad Prism®7 software. Homogeneity was tested
by using the Shapiro-Wilk test and if the data was found to be distributed normally, a one-way
analysis of variance (ANOVA) with Tukey post-hoc analysis were used. If the data was not
distributed normally, a Kruskal-Wallis followed by the Dunn’s multiple comparison test was
performed. A Discriminant Function Analysis (DFA) was performed using SPSS version 18
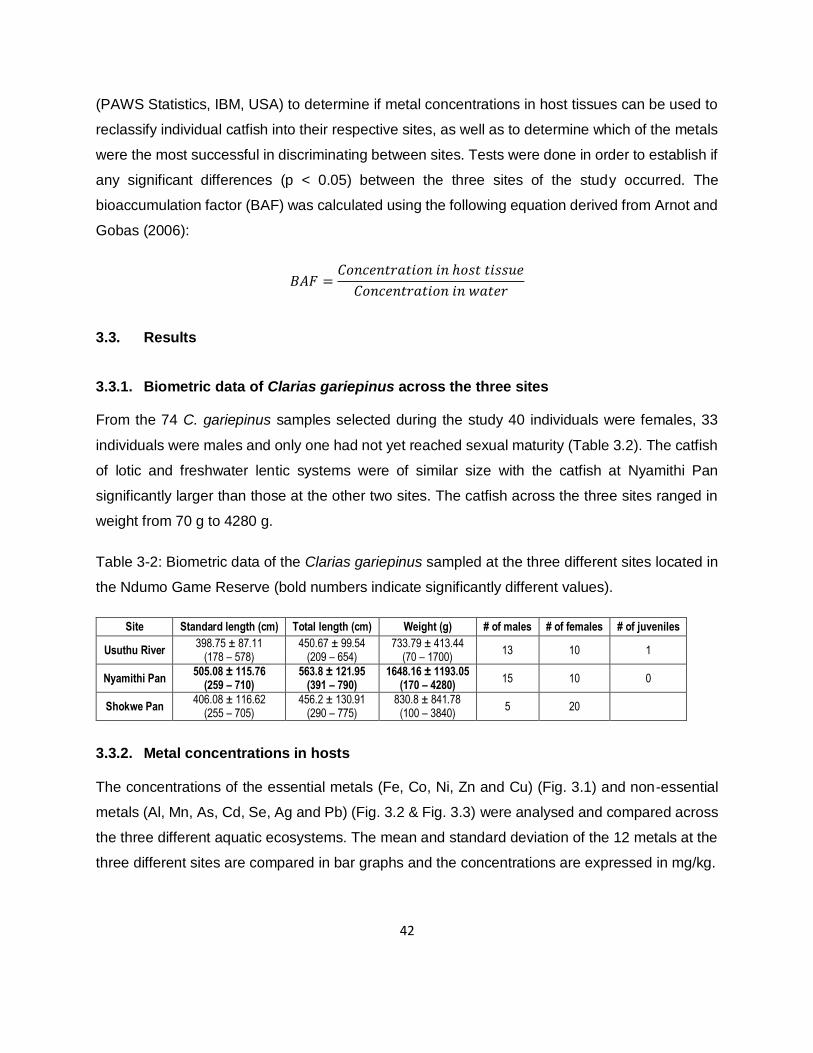
42
(PAWS Statistics, IBM, USA) to determine if metal concentrations in host tissues can be used to
reclassify individual catfish into their respective sites, as well as to determine which of the metals
were the most successful in discriminating between sites. Tests were done in order to establish if
any significant differences (p < 0.05) between the three sites of the study occurred. The
bioaccumulation factor (BAF) was calculated using the following equation derived from Arnot and
Gobas (2006):
𝐵𝐴𝐹 =𝐶𝑜𝑛𝑐𝑒𝑛𝑡𝑟𝑎𝑡𝑖𝑜𝑛 𝑖𝑛 ℎ𝑜𝑠𝑡 𝑡𝑖𝑠𝑠𝑢𝑒
𝐶𝑜𝑛𝑐𝑒𝑛𝑡𝑟𝑎𝑡𝑖𝑜𝑛 𝑖𝑛 𝑤𝑎𝑡𝑒𝑟
3.3. Results
3.3.1. Biometric data of Clarias gariepinus across the three sites
From the 74 C. gariepinus samples selected during the study 40 individuals were females, 33
individuals were males and only one had not yet reached sexual maturity (Table 3.2). The catfish
of lotic and freshwater lentic systems were of similar size with the catfish at Nyamithi Pan
significantly larger than those at the other two sites. The catfish across the three sites ranged in
weight from 70 g to 4280 g.
Table 3-2: Biometric data of the Clarias gariepinus sampled at the three different sites located in
the Ndumo Game Reserve (bold numbers indicate significantly different values).
Site Standard length (cm) Total length (cm) Weight (g) # of males # of females # of juveniles
Usuthu River 398.75 ± 87.11
(178 – 578) 450.67 ± 99.54
(209 – 654) 733.79 ± 413.44
(70 – 1700) 13 10 1
Nyamithi Pan 505.08 ± 115.76
(259 – 710) 563.8 ± 121.95
(391 – 790) 1648.16 ± 1193.05
(170 – 4280) 15 10 0
Shokwe Pan 406.08 ± 116.62
(255 – 705) 456.2 ± 130.91
(290 – 775) 830.8 ± 841.78
(100 – 3840) 5 20
3.3.2. Metal concentrations in hosts
The concentrations of the essential metals (Fe, Co, Ni, Zn and Cu) (Fig. 3.1) and non-essential
metals (Al, Mn, As, Cd, Se, Ag and Pb) (Fig. 3.2 & Fig. 3.3) were analysed and compared across
the three different aquatic ecosystems. The mean and standard deviation of the 12 metals at the
three different sites are compared in bar graphs and the concentrations are expressed in mg/kg.
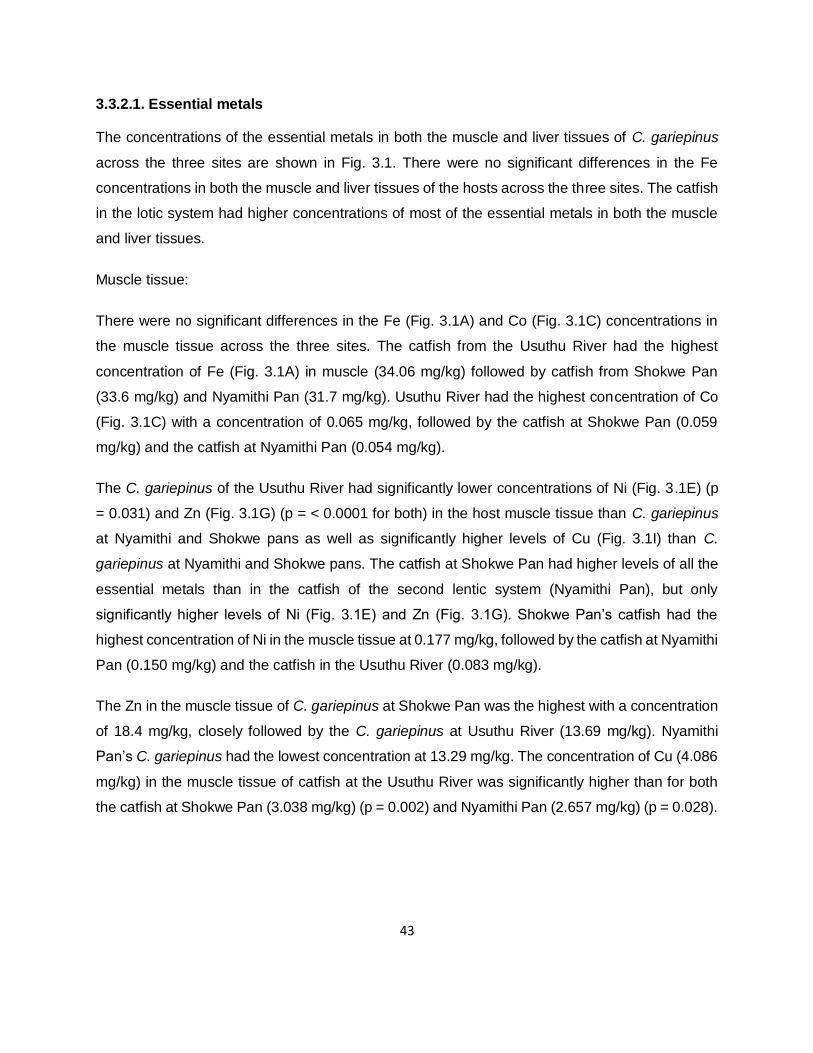
43
3.3.2.1. Essential metals
The concentrations of the essential metals in both the muscle and liver tissues of C. gariepinus
across the three sites are shown in Fig. 3.1. There were no significant differences in the Fe
concentrations in both the muscle and liver tissues of the hosts across the three sites. The catfish
in the lotic system had higher concentrations of most of the essential metals in both the muscle
and liver tissues.
Muscle tissue:
There were no significant differences in the Fe (Fig. 3.1A) and Co (Fig. 3.1C) concentrations in
the muscle tissue across the three sites. The catfish from the Usuthu River had the highest
concentration of Fe (Fig. 3.1A) in muscle (34.06 mg/kg) followed by catfish from Shokwe Pan
(33.6 mg/kg) and Nyamithi Pan (31.7 mg/kg). Usuthu River had the highest concentration of Co
(Fig. 3.1C) with a concentration of 0.065 mg/kg, followed by the catfish at Shokwe Pan (0.059
mg/kg) and the catfish at Nyamithi Pan (0.054 mg/kg).
The C. gariepinus of the Usuthu River had significantly lower concentrations of Ni (Fig. 3.1E) (p
= 0.031) and Zn (Fig. 3.1G) (p = < 0.0001 for both) in the host muscle tissue than C. gariepinus
at Nyamithi and Shokwe pans as well as significantly higher levels of Cu (Fig. 3.1I) than C.
gariepinus at Nyamithi and Shokwe pans. The catfish at Shokwe Pan had higher levels of all the
essential metals than in the catfish of the second lentic system (Nyamithi Pan), but only
significantly higher levels of Ni (Fig. 3.1E) and Zn (Fig. 3.1G). Shokwe Pan’s catfish had the
highest concentration of Ni in the muscle tissue at 0.177 mg/kg, followed by the catfish at Nyamithi
Pan (0.150 mg/kg) and the catfish in the Usuthu River (0.083 mg/kg).
The Zn in the muscle tissue of C. gariepinus at Shokwe Pan was the highest with a concentration
of 18.4 mg/kg, closely followed by the C. gariepinus at Usuthu River (13.69 mg/kg). Nyamithi
Pan’s C. gariepinus had the lowest concentration at 13.29 mg/kg. The concentration of Cu (4.086
mg/kg) in the muscle tissue of catfish at the Usuthu River was significantly higher than for both
the catfish at Shokwe Pan (3.038 mg/kg) (p = 0.002) and Nyamithi Pan (2.657 mg/kg) (p = 0.028).
44
Liver tissue:
The liver of the catfish had higher concentrations than the muscle tissue for all the essential metals
(Fig. 3.1). All the essential metals except Ni (Fig. 3.1F) were significantly higher in the liver than
in the muscle tissue. The concentrations of essential metals in the liver tissue of C. gariepinus
showed the highest concentrations of Fe (Fig. 3.1B), Co (Fig. 3.1D) and Cu (Fig. 3.1J) in the lotic
system (Usuthu River). The catfish of Usuthu River had Fe (Fig. 3.1B) concentrations of 1951
mg/kg followed by the catfish at both Nyamithi Pan (1800 mg/kg) and Shokwe Pan (1420 mg/kg).
The Co (Fig. 3.1D) concentrations followed the same trend with C. gariepinus of the Usuthu River
(0.913 mg/kg) having the significantly highest concentration followed by the C. gariepinus of
Nyamithi Pan (0.514 mg/kg) (p <0.0001) and Shokwe Pan (0.408 mg/kg) (P <0.0001). The
concentrations of Ni (Fig. 3.1F) and Zn (Fig. 3.1H) in Usuthu River’s catfish were lower than in
the Shokwe Pan’s catfish but still higher than the Nyamithi Pan’s catfish. The catfish of Nyamithi
Pan had the lowest concentrations of all the essential metals except Fe in the liver in comparison
to the catfish at the other two sites. The concentrations of Ni in the liver of C. gariepinus was
higher in Shokwe Pan than the C. gariepinus of both Usuthu River (0.156 mg/kg) and Nyamithi
Pan (0.249 mg/kg), but only significantly higher than the C. gariepinus at Nyamithi Pan (p =
0.0283).
Clarias gariepinus of Shokwe Pan had significantly higher Zn (89.58 mg/kg) concentrations
followed by C. gariepinus of both Usuthu River (70.52 mg/kg) (p < 0.0001) and Nyamithi Pan
(65.98 mg/kg) (p < 0.0001). Again, Usuthu River’s catfish had significantly higher concentrations
of Cu (58.45 mg/kg) compared to Shokwe Pan’s catfish (p = 0.028) and Nyamithi Pan’s catfish (p
= 0.0018). The fish at Shokwe Pan had the second highest concentration at 33.28 mg/kg and
Nyamithi Pan’s catfish had the lowest concentration at 8.049 mg/kg. The catfish which had
significantly greater muscle concentrations of the essential metals also had significantly higher
levels in the liver at the respective sites.
45
Figure 3-1: Bar graphs showing the mean concentration (± 1 SEM) of the different essential metals
(Fe, Co, Ni, Zn, Cu) in both the muscle and liver tissues (mg/kg) of the catfish Clarias gariepinus
from the Usuthu River and Nyamithi and Shokwe pans inside the Ndumo Game Reserve
(common superscripts for each of the tissues indicate significant differences between the sites).
46
3.3.2.2. Non-essential metals
When comparing the concentration of non-essential metals in the muscle and liver tissues of C.
gariepinus across the three sites (Fig. 3.2 & Fig. 3.3) the liver had significantly higher
concentrations of Al, Mn, Se and Ag than in the muscle tissue across all sites. The concentrations
of As, Cd and Pb were similar in the muscle tissue and the liver tissue at all sites. The catfish at
Shokwe had significantly higher concentrations of all the non-essential metals except for As, Se
and Ag in the muscle tissue. The catfish of Nyamithi had the lowest concentrations of all the non-
essential metals except for As and Ag in the muscle tissue.
Muscle tissue:
Aluminium (Fig. 3.2A) was the metal with the significantly highest (p < 0.0001) concentration in
the muscle tissue of C. gariepinus at Shokwe Pan (20.82 mg/kg) followed by that of C. gariepinus
at both Nyamithi Pan (14.35 mg/kg) and Usuthu River (14.19 mg/kg). Shokwe Pan’s catfish had
a Mn concentration (Fig. 3.2C) of 1.625 mg/kg in the muscle tissue which was significantly higher
than Usuthu River’s catfish (1.233 mg/kg) (p < 0.0001) and Nyamithi Pan’s catfish (1.188 mg/kg)
(p < 0.0001). The catfish at Nyamithi Pan had the highest concentration of As (Fig. 3.2E) in the
muscle tissue (0.197 mg/kg) which was significantly higher (p = 0.003) than the concentration in
the catfish at Shokwe Pan (0.139 mg/kg) but similar to the muscle tissue concentrations in catfish
from the Usuthu River (0.181 mg/kg).
Clarias gariepinus at Shokwe had significantly higher concentrations of Cd (Fig. 3.3 A) at 0.391
mg/kg than C. gariepinus from both the Nyamithi Pan (0.072 mg/kg) (p < 0.0001) and Usuthu
River (0.085 mg/kg) (p < 0.0001). The concentration of Pb (Fig. 3.3C) in the catfish was
significantly higher at Shokwe Pan (3.726 mg/kg) (p < 0.0001) than in the catfish at Usuthu River
(0.941 mg/kg) and in the catfish at Nyamithi Pan (0.798 mg/kg). Usuthu River’s catfish had the
highest concentrations of both Se (Fig. 3.3E) (0.229 mg/kg) and Ag (Fig. 3.3G) (0.031 mg/kg),
but not significantly present at both.
Liver tissue:
Clarias gariepinus of the lotic system had the highest concentrations of the non-essential metals,
Al (Fig. 3.2B), As (Fig. 3.2F) and Cd (Fig. 3.3B), in their liver tissue (Figs. 3.2 & 3.3). Usuthu
River’s catfish had a significantly higher Al (Fig. 3.2A) concentration in their liver at 24.72 mg/kg
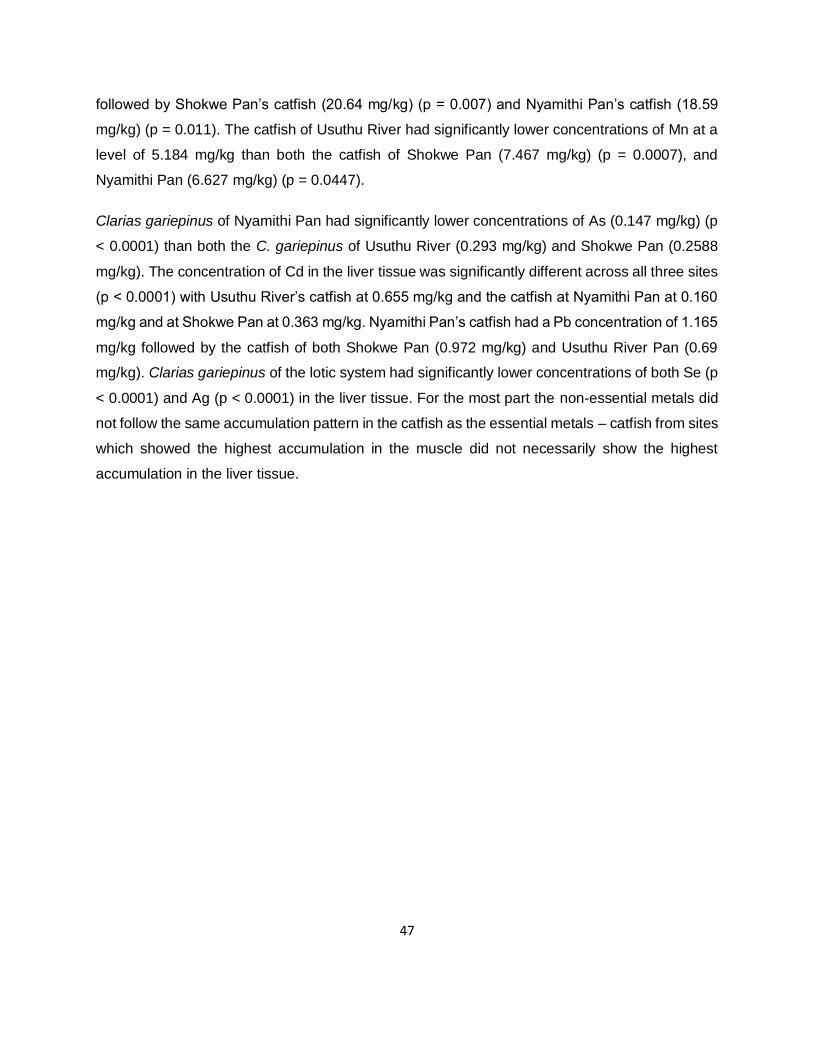
47
followed by Shokwe Pan’s catfish (20.64 mg/kg) (p = 0.007) and Nyamithi Pan’s catfish (18.59
mg/kg) (p = 0.011). The catfish of Usuthu River had significantly lower concentrations of Mn at a
level of 5.184 mg/kg than both the catfish of Shokwe Pan (7.467 mg/kg) (p = 0.0007), and
Nyamithi Pan (6.627 mg/kg) (p = 0.0447).
Clarias gariepinus of Nyamithi Pan had significantly lower concentrations of As (0.147 mg/kg) (p
< 0.0001) than both the C. gariepinus of Usuthu River (0.293 mg/kg) and Shokwe Pan (0.2588
mg/kg). The concentration of Cd in the liver tissue was significantly different across all three sites
(p < 0.0001) with Usuthu River’s catfish at 0.655 mg/kg and the catfish at Nyamithi Pan at 0.160
mg/kg and at Shokwe Pan at 0.363 mg/kg. Nyamithi Pan’s catfish had a Pb concentration of 1.165
mg/kg followed by the catfish of both Shokwe Pan (0.972 mg/kg) and Usuthu River Pan (0.69
mg/kg). Clarias gariepinus of the lotic system had significantly lower concentrations of both Se (p
< 0.0001) and Ag (p < 0.0001) in the liver tissue. For the most part the non-essential metals did
not follow the same accumulation pattern in the catfish as the essential metals – catfish from sites
which showed the highest accumulation in the muscle did not necessarily show the highest
accumulation in the liver tissue.
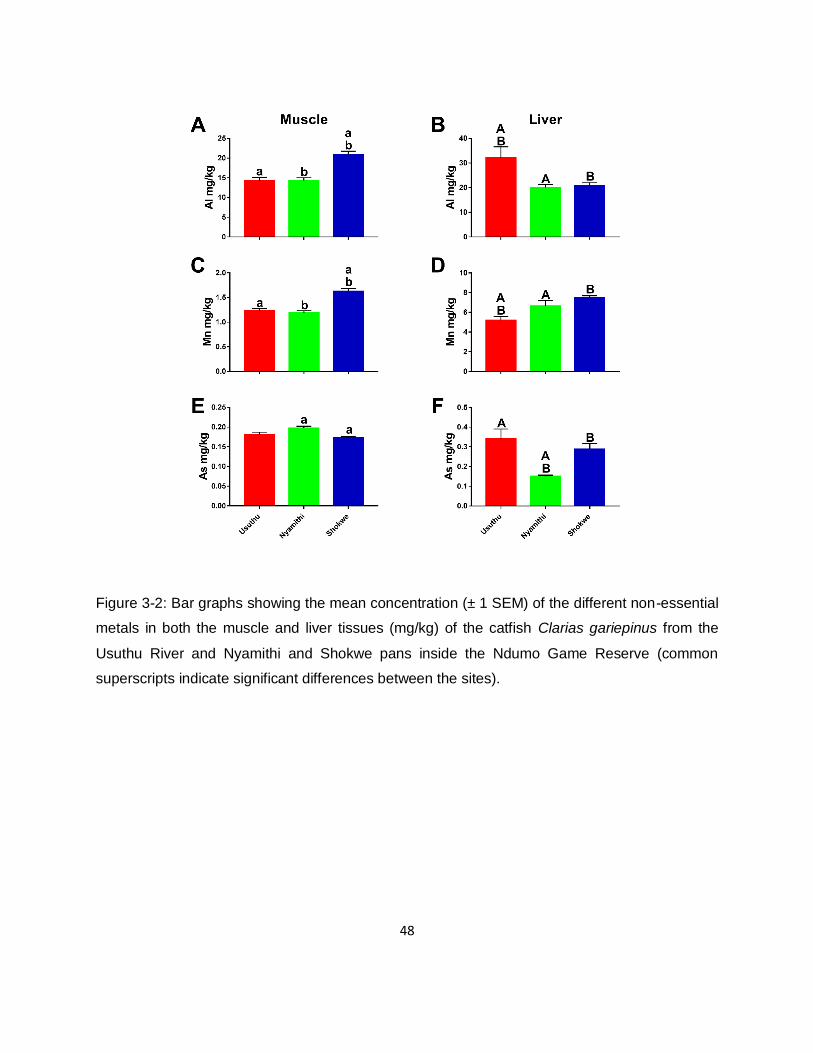
48
Figure 3-2: Bar graphs showing the mean concentration (± 1 SEM) of the different non-essential
metals in both the muscle and liver tissues (mg/kg) of the catfish Clarias gariepinus from the
Usuthu River and Nyamithi and Shokwe pans inside the Ndumo Game Reserve (common
superscripts indicate significant differences between the sites).
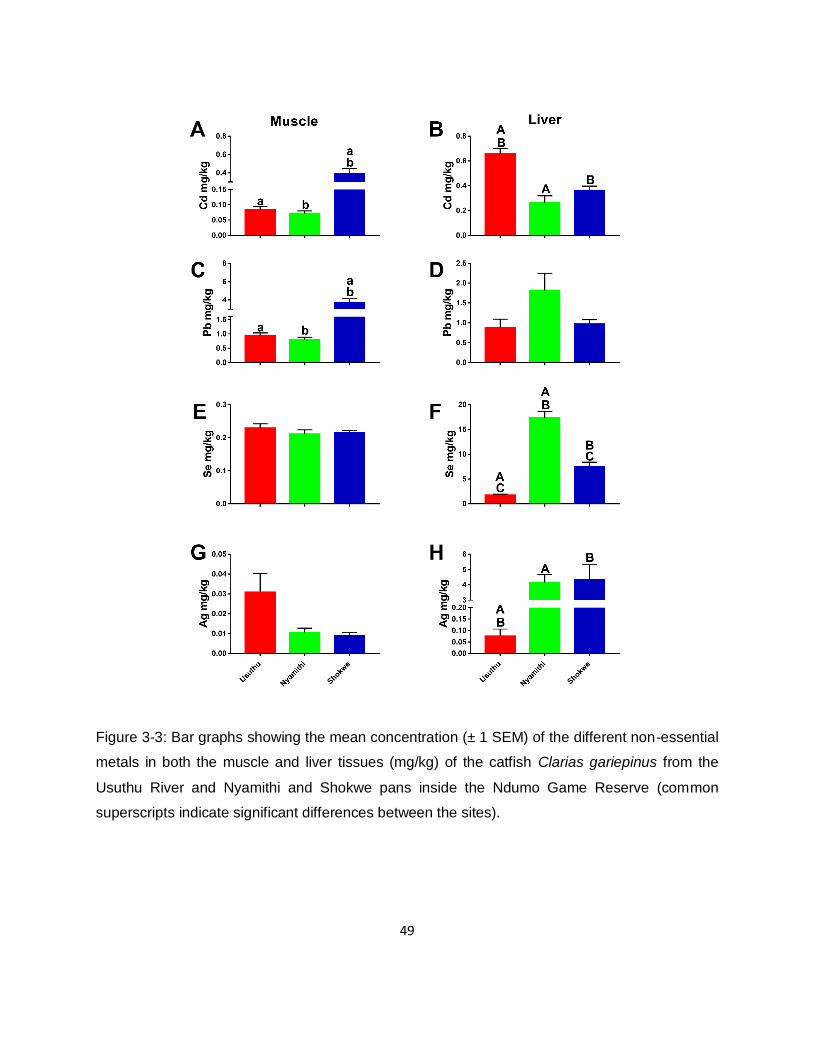
49
Figure 3-3: Bar graphs showing the mean concentration (± 1 SEM) of the different non-essential
metals in both the muscle and liver tissues (mg/kg) of the catfish Clarias gariepinus from the
Usuthu River and Nyamithi and Shokwe pans inside the Ndumo Game Reserve (common
superscripts indicate significant differences between the sites).
50
The results derived from a Discriminant Function Analysis are shown on a biplot (Fig 3.4) of the
canonical variates calculated during the analysis; functions 1 and 2 described 100% of the
variation in the metal concentrations in the muscle tissue of C. gariepinus. The first function (X
axis) explained 65.9% of the variance, which was mainly driven by an increase in the metals, Ag
(0.0778), Co (0.097) and Se (0.086). These drivers separated the lotic system from the rest of the
groups indicating significantly higher concentrations of the metals. The second function (Y axis)
explained 34.1% of the variance through the metals, Pb (0.390), Mn (0.371) and Cd (0.336).
These drivers separated Shokwe Pan from Usuthu River and Nyamithi Pan, with Shokwe Pan
having higher concentrations of Pb, Mn, As and Zn followed by Usuthu River and then Nyamithi
Pan. There was a 96.1% accuracy for the reclassification success for individual catfish into their
predefined groups.
Table 3-3: The structure matrix of the first two functions of a Discriminant Function Analysis (DFA),
using the various metal concentrations present in the muscle tissue of Clarias gariepinus from the
three different sites in Ndumo Game Reserve (the largest absolute correlation between each
variable and any discriminant function is indicated in bold).
Structure Matrix
Metal % explained Ag Co Se Pb Mn Cd As Zn Al Fe Ni Cu
Function 1 65.9 .0778 .097 .086 -.254 -.174 -.234 .018 -0.148 -.162 .04 -.097 .077
2 34.1 .255 .064 -.011 .390 .371 .336 -.205 .185 .181 .138 -.107 .104
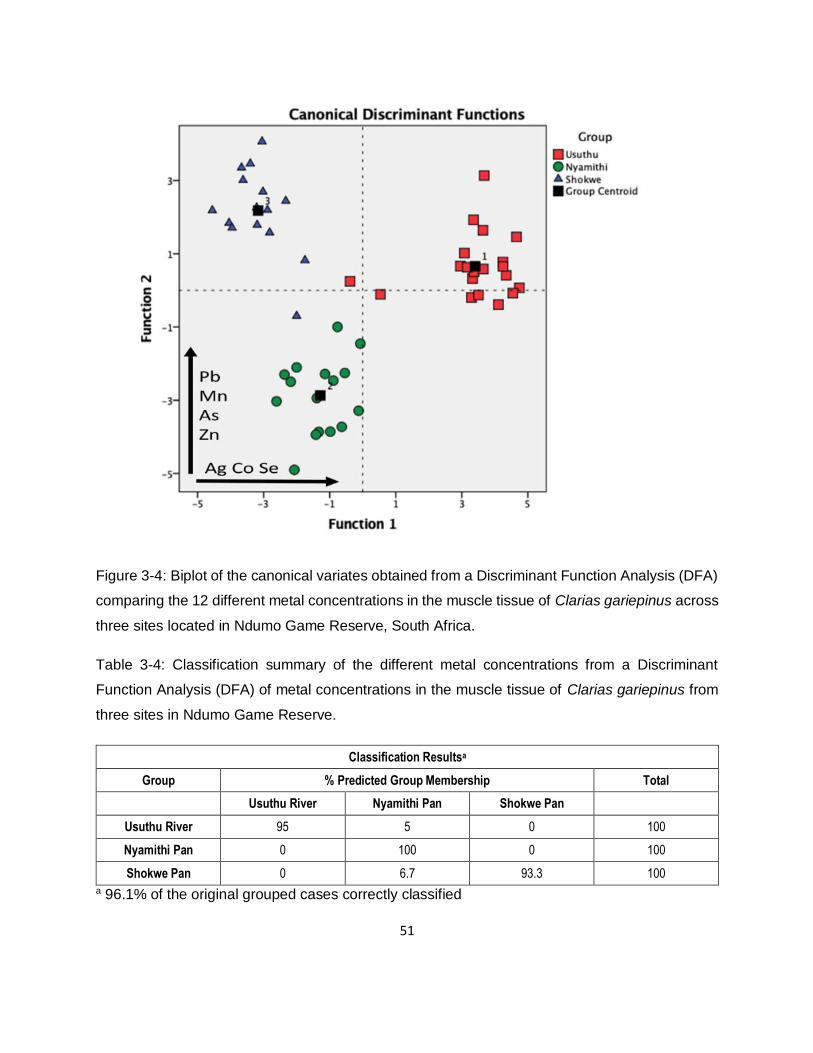
51
Figure 3-4: Biplot of the canonical variates obtained from a Discriminant Function Analysis (DFA)
comparing the 12 different metal concentrations in the muscle tissue of Clarias gariepinus across
three sites located in Ndumo Game Reserve, South Africa.
Table 3-4: Classification summary of the different metal concentrations from a Discriminant
Function Analysis (DFA) of metal concentrations in the muscle tissue of Clarias gariepinus from
three sites in Ndumo Game Reserve.
Classification Resultsa
Group % Predicted Group Membership Total
Usuthu River Nyamithi Pan Shokwe Pan
Usuthu River 95 5 0 100
Nyamithi Pan 0 100 0 100
Shokwe Pan 0 6.7 93.3 100
a 96.1% of the original grouped cases correctly classified
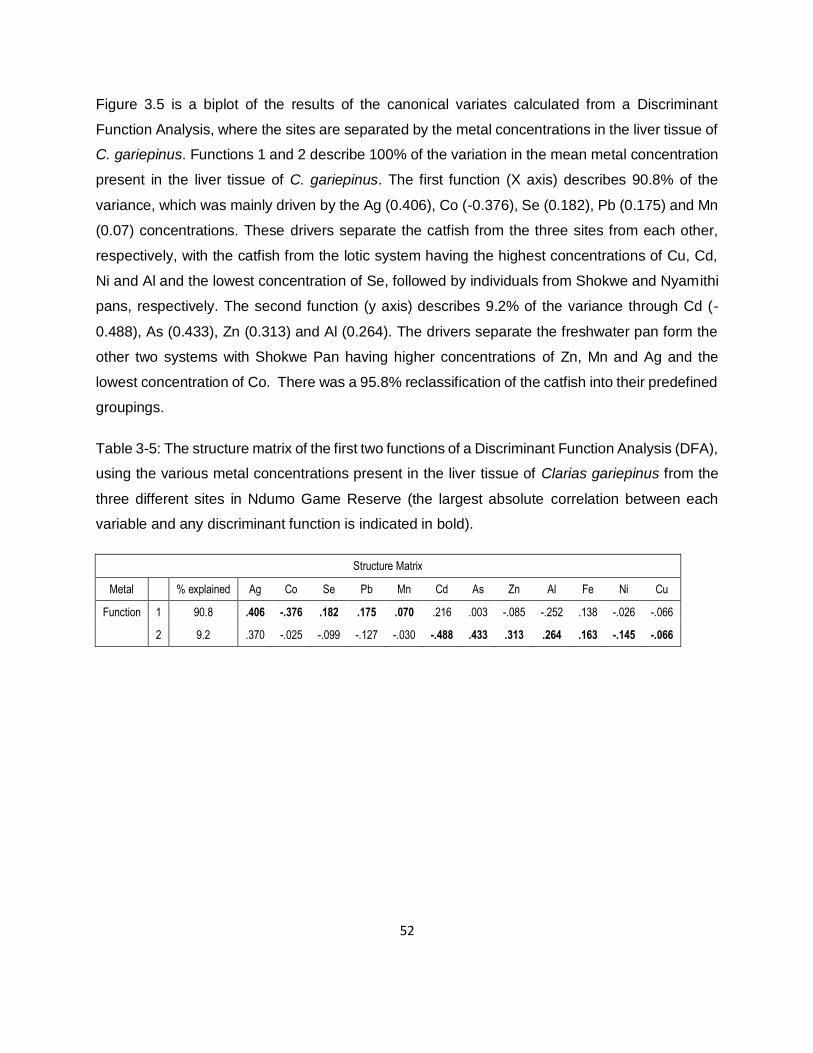
52
Figure 3.5 is a biplot of the results of the canonical variates calculated from a Discriminant
Function Analysis, where the sites are separated by the metal concentrations in the liver tissue of
C. gariepinus. Functions 1 and 2 describe 100% of the variation in the mean metal concentration
present in the liver tissue of C. gariepinus. The first function (X axis) describes 90.8% of the
variance, which was mainly driven by the Ag (0.406), Co (-0.376), Se (0.182), Pb (0.175) and Mn
(0.07) concentrations. These drivers separate the catfish from the three sites from each other,
respectively, with the catfish from the lotic system having the highest concentrations of Cu, Cd,
Ni and Al and the lowest concentration of Se, followed by individuals from Shokwe and Nyamithi
pans, respectively. The second function (y axis) describes 9.2% of the variance through Cd (-
0.488), As (0.433), Zn (0.313) and Al (0.264). The drivers separate the freshwater pan form the
other two systems with Shokwe Pan having higher concentrations of Zn, Mn and Ag and the
lowest concentration of Co. There was a 95.8% reclassification of the catfish into their predefined
groupings.
Table 3-5: The structure matrix of the first two functions of a Discriminant Function Analysis (DFA),
using the various metal concentrations present in the liver tissue of Clarias gariepinus from the
three different sites in Ndumo Game Reserve (the largest absolute correlation between each
variable and any discriminant function is indicated in bold).
Structure Matrix
Metal % explained Ag Co Se Pb Mn Cd As Zn Al Fe Ni Cu
Function 1 90.8 .406 -.376 .182 .175 .070 .216 .003 -.085 -.252 .138 -.026 -.066
2 9.2 .370 -.025 -.099 -.127 -.030 -.488 .433 .313 .264 .163 -.145 -.066
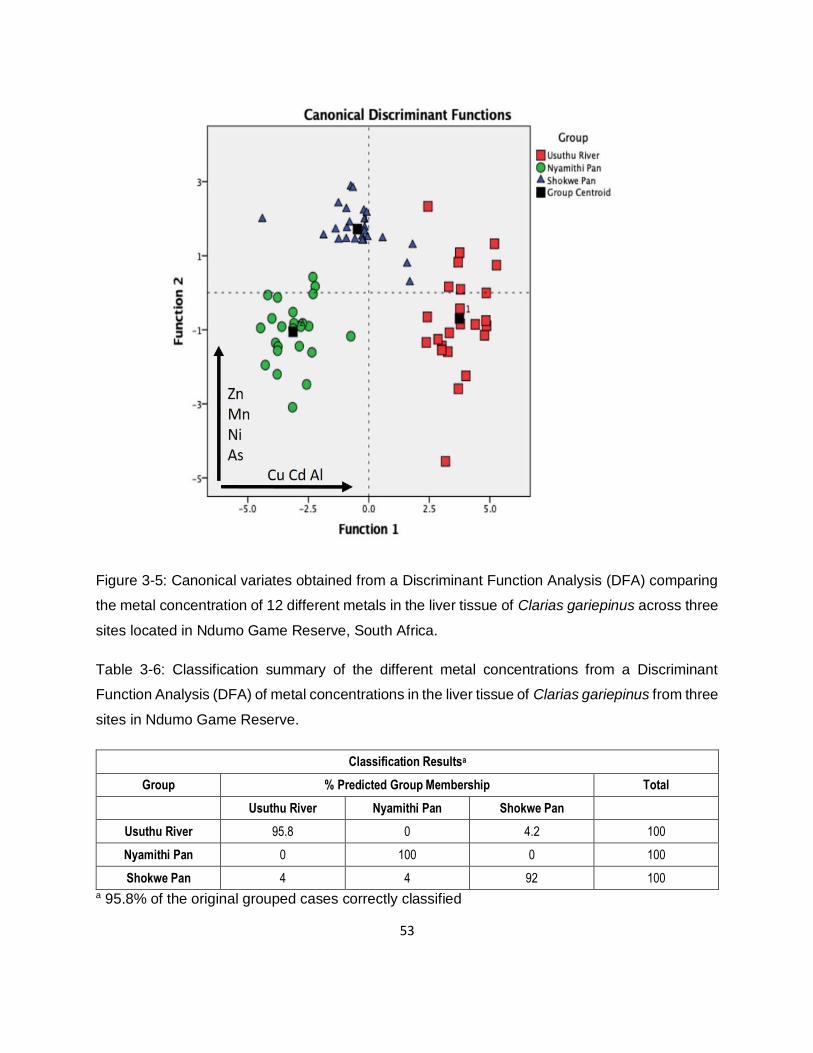
53
Figure 3-5: Canonical variates obtained from a Discriminant Function Analysis (DFA) comparing
the metal concentration of 12 different metals in the liver tissue of Clarias gariepinus across three
sites located in Ndumo Game Reserve, South Africa.
Table 3-6: Classification summary of the different metal concentrations from a Discriminant
Function Analysis (DFA) of metal concentrations in the liver tissue of Clarias gariepinus from three
sites in Ndumo Game Reserve.
Classification Resultsa
Group % Predicted Group Membership Total
Usuthu River Nyamithi Pan Shokwe Pan
Usuthu River 95.8 0 4.2 100
Nyamithi Pan 0 100 0 100
Shokwe Pan 4 4 92 100 a 95.8% of the original grouped cases correctly classified
54
3.3.3. Bioaccumulation factors of essential and non-essential metals (BAF)
The BAF of both essential and non-essential metals in muscle and liver tissues are shown in
Table 3.7. In order to assist with interpretation, the classification system according to Arnot and
Gobas (2006) was used where a substance is bioaccumulative when it has a BAF ≥ 2000, and
very bioaccumulative with a BAF ≥ 5000. It is evident that the BAF of the liver is higher than the
BAF of the muscle tissue.
In the muscle samples there was a BAF range of 83 to 6511 for all the metals across the three
sites. Nickel had the lowest BAF with an average of 211 across the three sites. Cadmium had the
highest BAF in the muscle tissue with an average of 5523 across the three sites. For the BAF in
the liver tissue of C. gariepinus (Table 3.7) the samples had a range from 60 to 47177. The BAF
of Ni, Al, As and Pb was similar between the muscle and liver tissue. For all the other metals the
liver had a higher BAF than the muscle tissue. The muscle tissues of the C. gariepinus across the
three sites were bioaccumulative for Zn, Al, Cd and Pb. The liver tissue was bioaccumulative for
Co, Al, Mn, Cd, Pb and Se and very bioaccumulative for Fe, Zn, Cu and Ag.
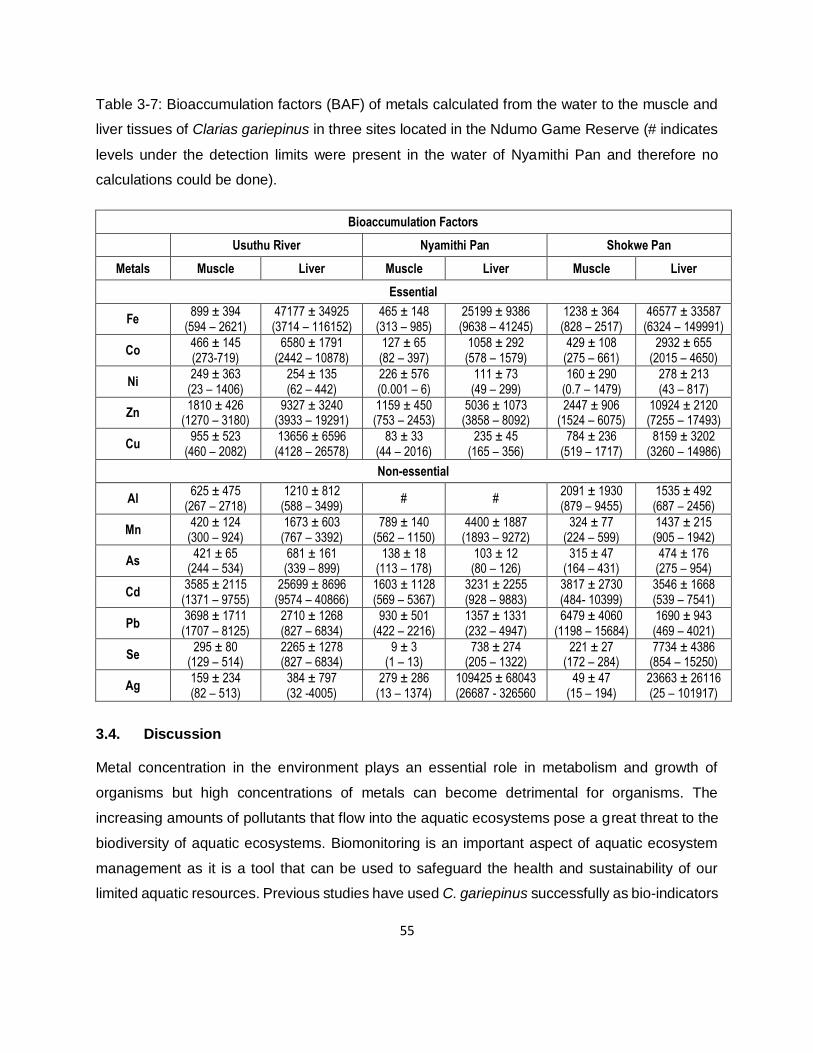
55
Table 3-7: Bioaccumulation factors (BAF) of metals calculated from the water to the muscle and
liver tissues of Clarias gariepinus in three sites located in the Ndumo Game Reserve (# indicates
levels under the detection limits were present in the water of Nyamithi Pan and therefore no
calculations could be done).
Bioaccumulation Factors
Usuthu River Nyamithi Pan Shokwe Pan
Metals Muscle Liver Muscle Liver Muscle Liver
Essential
Fe 899 ± 394
(594 – 2621) 47177 ± 34925 (3714 – 116152)
465 ± 148 (313 – 985)
25199 ± 9386 (9638 – 41245)
1238 ± 364 (828 – 2517)
46577 ± 33587 (6324 – 149991)
Co 466 ± 145 (273-719)
6580 ± 1791 (2442 – 10878)
127 ± 65 (82 – 397)
1058 ± 292 (578 – 1579)
429 ± 108 (275 – 661)
2932 ± 655 (2015 – 4650)
Ni 249 ± 363
(23 – 1406) 254 ± 135 (62 – 442)
226 ± 576 (0.001 – 6)
111 ± 73 (49 – 299)
160 ± 290 (0.7 – 1479)
278 ± 213 (43 – 817)
Zn 1810 ± 426
(1270 – 3180) 9327 ± 3240
(3933 – 19291) 1159 ± 450 (753 – 2453)
5036 ± 1073 (3858 – 8092)
2447 ± 906 (1524 – 6075)
10924 ± 2120 (7255 – 17493)
Cu 955 ± 523
(460 – 2082) 13656 ± 6596
(4128 – 26578) 83 ± 33
(44 – 2016) 235 ± 45
(165 – 356) 784 ± 236
(519 – 1717) 8159 ± 3202
(3260 – 14986)
Non-essential
Al 625 ± 475
(267 – 2718) 1210 ± 812
(588 – 3499) # #
2091 ± 1930 (879 – 9455)
1535 ± 492 (687 – 2456)
Mn 420 ± 124
(300 – 924) 1673 ± 603
(767 – 3392) 789 ± 140
(562 – 1150) 4400 ± 1887
(1893 – 9272) 324 ± 77
(224 – 599) 1437 ± 215 (905 – 1942)
As 421 ± 65
(244 – 534) 681 ± 161 (339 – 899)
138 ± 18 (113 – 178)
103 ± 12 (80 – 126)
315 ± 47 (164 – 431)
474 ± 176 (275 – 954)
Cd 3585 ± 2115
(1371 – 9755) 25699 ± 8696
(9574 – 40866) 1603 ± 1128 (569 – 5367)
3231 ± 2255 (928 – 9883)
3817 ± 2730 (484- 10399)
3546 ± 1668 (539 – 7541)
Pb 3698 ± 1711
(1707 – 8125) 2710 ± 1268 (827 – 6834)
930 ± 501 (422 – 2216)
1357 ± 1331 (232 – 4947)
6479 ± 4060 (1198 – 15684)
1690 ± 943 (469 – 4021)
Se 295 ± 80
(129 – 514) 2265 ± 1278 (827 – 6834)
9 ± 3 (1 – 13)
738 ± 274 (205 – 1322)
221 ± 27 (172 – 284)
7734 ± 4386 (854 – 15250)
Ag 159 ± 234 (82 – 513)
384 ± 797 (32 -4005)
279 ± 286 (13 – 1374)
109425 ± 68043 (26687 - 326560
49 ± 47 (15 – 194)
23663 ± 26116 (25 – 101917)
3.4. Discussion
Metal concentration in the environment plays an essential role in metabolism and growth of
organisms but high concentrations of metals can become detrimental for organisms. The
increasing amounts of pollutants that flow into the aquatic ecosystems pose a great threat to the
biodiversity of aquatic ecosystems. Biomonitoring is an important aspect of aquatic ecosystem
management as it is a tool that can be used to safeguard the health and sustainability of our
limited aquatic resources. Previous studies have used C. gariepinus successfully as bio-indicators
56
of pollution in polluted systems. The aim of the study was to investigate the use of C. gariepinus
as a bio-indicator of metals in three different aquatic systems, two lentic and one lotic; reflecting
natural conditions as closely as possible; and to ascertain the bioaccumulative properties of
muscle and liver tissue for both essential and non-essential metals.
Barwick and Maher (2003) state that although muscle tissues do not accumulate metals to the
highest levels in comparison with other organs of an organism, it is important to investigate their
accumulation due to the high rate of human consumption. In this study it was evident that even in
natural (non-polluted) systems fish will bioaccumulate essential and non-essential metals in their
muscle and liver tissue, with the liver accumulating most of the metals at higher levels. Fish have
the ability to regulate metal concentrations in their tissues until a certain level whereafter the
metals will accumulate in the different organs of the organism (Heath, 2018). The concentration
of metals in C. gariepinus was found to be higher in the Usuthu River catfish than in the two lentic
systems with the catfish at Nyamithi Pan having the lowest concentrations of metals.
Clarias gariepinus in the study had the highest concentrations of Fe, Zn and Al across the three
sites which can be due to the fact that Fe and Al are two of the most abundant elements in nature
along with Zn that is very common (Jones & Das, 1960, Faust, 2018). Although Fe, Al and Zn can
be released into the environment through anthropogenic activities, in this study it is believed to
be due to the natural weathering of rocks in the area of the sites. Previous studies found the same
trends of Fe, Zn and Al having the highest concentrations in the fish studied (Grobler et al., 1994,
Gerber et al., 2016).
When looking at the bioaccumulation of the different metals in the muscle and liver tissues of the
host it was found that Ni, Al, As and Pb had similar BAFs in both the liver and muscle tissue. As
the bioaccumulation of metals is dependent on the availability of metals in the environment (Arnot
& Gobas, 2006), the low environmental concentration in this study can be the reason for the low
bioaccumulation in catfish. According to a European Commission Directive (EC, 2013) Zn, Cd,
Pb and Al are bioaccumulative in the muscle tissue of the hosts. Muscle tissue reflects exposure
to metals over a longer period of time. Cadmium and lead are two of the most dangerous metals
that can cause fatalities of organisms when accumulating to a high level. Major causes of Cd and
Pb pollution in ecosystems are mining activities, sewage treatment and fertiliser applications
(Satarug et al., 2003).
57
In the liver tissue of C. gariepinus Co, Al, Mn, Cd, Pb and Se were classified as bioaccumulative
according to a European Commission Directive (EC, 2013) with Fe, Zn, Cu and Ag classified as
very bioaccumulative. The liver tissue reflects more recent exposures of metals from the
environment and can thus be used as an early warning indicator of metal pollution. The liver
functions as detoxification mechanism and binds to non-essential metals (Bremner, 1987, Seixas
et al., 2007), thus accumulating metals to higher levels than the muscle tissue. Chen and Chen
(1999) found that toxic metals (Cd and Pb) accumulate at higher levels in the liver because of the
liver’s role in regulating metals.
There is currently no information on the concentrations of metals in the environment of NGR. To
evaluate the metal concentrations found in the study they were compared to historical data on
metal concentrations in C. gariepinus of aquatic ecosystems at other areas throughout South
Africa (Tables 3.8 and 3.9). The Vaal River system and the Olifants River system are known to
be located in mining districts (Coetzee et al., 2002, Crafford & Avenant-Oldewage, 2010, 2011,
Jooste et al., 2015). The Nylsvlei floodplain is classified as a Ramsar site just like NGR and can
thus be a good comparison site for this study (Greenfield et al., 2012, Musa et al., 2017). The Fe,
Co, Ni and Zn concentrations in the muscle tissue of the host at the study sites were well below
the concentrations at the other sites indicated in Tables 3.8 and 3.9 (Coetzee et al., 2002, Crafford
& Avenant-Oldewage, 2010, 2011, Jooste et al., 2015, Musa et al., 2017).
The copper concentration in the host muscle tissue was similar to the concentrations found in the
Vaal river system (Crafford & Avenant-Oldewage, 2010, 2011) and at the Phalaborwa Barrage
and Flag Boshielo Dam (Jooste et al., 2015) but lower than at the rest of the sites. The Mn
concentration in the muscle and liver tissue at NGR was similar to the concentrations in the
muscle tissue of the Vaal River Barrage (Crafford & Avenant-Oldewage, 2011). The rest of the
non-essential metals at the study sites were at lower concentration in the muscle and liver tissues
in comparison to the other sites in Tables 3.8.
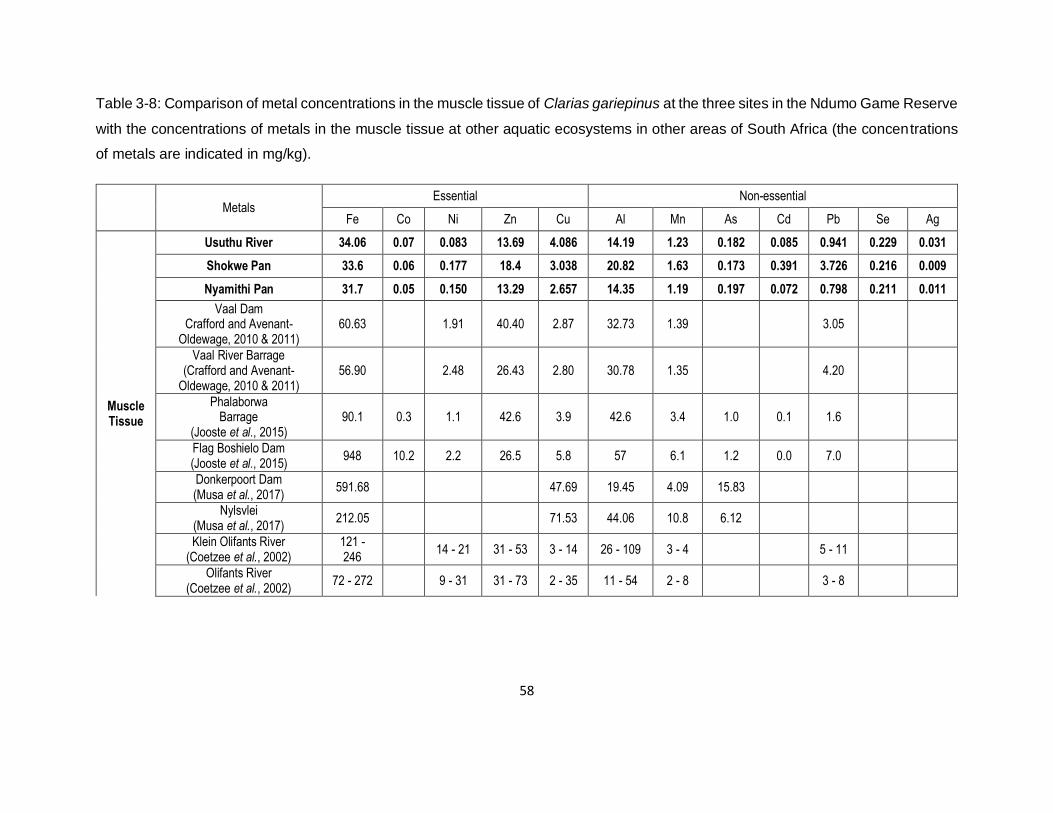
58
Table 3-8: Comparison of metal concentrations in the muscle tissue of Clarias gariepinus at the three sites in the Ndumo Game Reserve
with the concentrations of metals in the muscle tissue at other aquatic ecosystems in other areas of South Africa (the concentrations
of metals are indicated in mg/kg).
Metals Essential Non-essential
Fe Co Ni Zn Cu Al Mn As Cd Pb Se Ag
Muscle Tissue
Usuthu River 34.06 0.07 0.083 13.69 4.086 14.19 1.23 0.182 0.085 0.941 0.229 0.031
Shokwe Pan 33.6 0.06 0.177 18.4 3.038 20.82 1.63 0.173 0.391 3.726 0.216 0.009
Nyamithi Pan 31.7 0.05 0.150 13.29 2.657 14.35 1.19 0.197 0.072 0.798 0.211 0.011
Vaal Dam Crafford and Avenant-
Oldewage, 2010 & 2011) 60.63 1.91 40.40 2.87 32.73 1.39 3.05
Vaal River Barrage (Crafford and Avenant-
Oldewage, 2010 & 2011) 56.90 2.48 26.43 2.80 30.78 1.35 4.20
Phalaborwa Barrage
(Jooste et al., 2015) 90.1 0.3 1.1 42.6 3.9 42.6 3.4 1.0 0.1 1.6
Flag Boshielo Dam (Jooste et al., 2015)
948 10.2 2.2 26.5 5.8 57 6.1 1.2 0.0 7.0
Donkerpoort Dam (Musa et al., 2017)
591.68 47.69 19.45 4.09 15.83
Nylsvlei (Musa et al., 2017)
212.05 71.53 44.06 10.8 6.12
Klein Olifants River (Coetzee et al., 2002)
121 - 246
14 - 21 31 - 53 3 - 14 26 - 109 3 - 4 5 - 11
Olifants River (Coetzee et al., 2002)
72 - 272 9 - 31 31 - 73 2 - 35 11 - 54 2 - 8 3 - 8
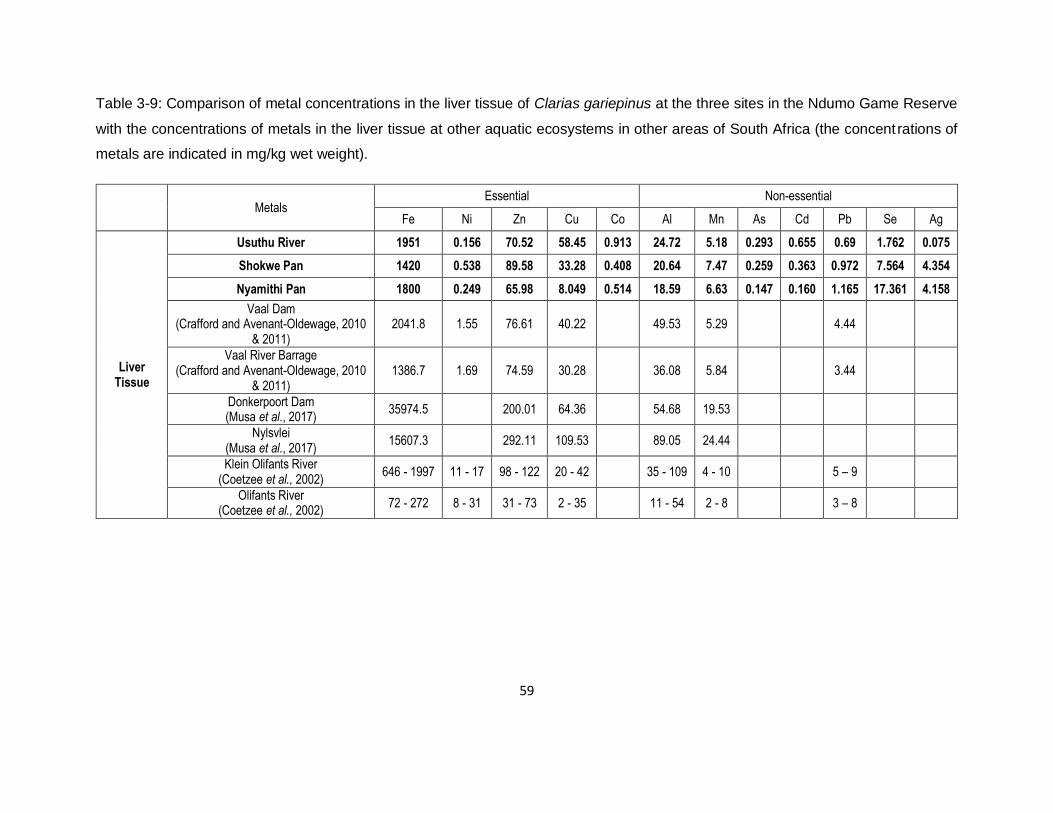
59
Table 3-9: Comparison of metal concentrations in the liver tissue of Clarias gariepinus at the three sites in the Ndumo Game Reserve
with the concentrations of metals in the liver tissue at other aquatic ecosystems in other areas of South Africa (the concentrations of
metals are indicated in mg/kg wet weight).
Metals Essential Non-essential
Fe Ni Zn Cu Co Al Mn As Cd Pb Se Ag
Liver Tissue
Usuthu River 1951 0.156 70.52 58.45 0.913 24.72 5.18 0.293 0.655 0.69 1.762 0.075
Shokwe Pan 1420 0.538 89.58 33.28 0.408 20.64 7.47 0.259 0.363 0.972 7.564 4.354
Nyamithi Pan 1800 0.249 65.98 8.049 0.514 18.59 6.63 0.147 0.160 1.165 17.361 4.158
Vaal Dam (Crafford and Avenant-Oldewage, 2010
& 2011) 2041.8 1.55 76.61 40.22 49.53 5.29 4.44
Vaal River Barrage (Crafford and Avenant-Oldewage, 2010
& 2011) 1386.7 1.69 74.59 30.28 36.08 5.84 3.44
Donkerpoort Dam (Musa et al., 2017)
35974.5 200.01 64.36 54.68 19.53
Nylsvlei (Musa et al., 2017)
15607.3 292.11 109.53 89.05 24.44
Klein Olifants River (Coetzee et al., 2002)
646 - 1997 11 - 17 98 - 122 20 - 42 35 - 109 4 - 10 5 – 9
Olifants River (Coetzee et al., 2002)
72 - 272 8 - 31 31 - 73 2 - 35 11 - 54 2 - 8 3 – 8
60
There were clear differences in the metal concentrations of the catfish in the lotic system – Usuthu
River had the higher Fe, Co and Cu concentrations in the host in both the muscle and liver tissue.
All three of these essential elements are naturally present in the environment and can enter the
aquatic ecosystems due to natural weathering of rocks (Chen et al., 2000, Shrivastava, 2009).
For the non-essential metals, the catfish in the lotic system had lower concentrations of Al, Mn,
As, Cd and Pb than at least one lentic system in both the muscle and liver tissues of the host.
The catfish in the lotic system had the highest concentration of Se and Ag in the muscle tissue of
the host, but the lowest concentration in the liver of the host. Lotic systems continuously flush the
sediment downstream and thus limit the metal binding capacity at a specific site in the system
(Orr et al., 2006). Lentic systems act as a sink for non-essential metals and can thus be readily
available for bioaccumulation (Adams et al., 1980, Pinedo-Hernández et al., 2015, Meena et al.,
2018). Fish in lentic systems are also confined to a smaller waterbody than fish in lotic systems
and thus accumulate metals at higher levels.
In this study two different lentic ecosystems were investigated: the first being a freshwater pan
(Shokwe) and the second a saline pan (Nyamithi). The freshwater pan had the highest
concentrations of all metals (essential and non-essential) in the muscle and liver tissues of the
hosts. In saline water the chloride forms complexes with metals, which make the metals less
bioavailable for uptake by organisms (Wright & Zamuda, 1987, Kumar et al., 2015). Metals,
whether essential or non-essential, have many possible sources and effects on organisms when
accumulating to high levels. Iron is one of the most abundant and important essential metals in
the geosphere (Faust, 2018). The highest concentrations of Fe were present in the liver of the
fish which coincide with various previous studies (Crafford & Avenant-Oldewage, 2010, Osman
& Kloas, 2010, Sunjog et al., 2019). Ibrahim and Omar (2013) state that Fe accumulates in the
liver as hemosiderin and ferritin (proteins to which Fe binds). The high levels of Fe in the host can
be as a result of Fe being abundant in the environment. Cobalt is a by-product of industrial waste
(Barałkiewicz & Siepak, 1999). According to the Agency for Toxic Substances and Disease
Registry ATSDR (2013b) an excess Co causes cardiovascular, respiratory, haematological as
well as developmental issues in humans.
Just like other essential metals, Ni becomes detrimental for organisms at high concentrations
(Pickering, 1974). Nickel and Zn are by-products of many industrial activities and mining activities
(Mudd, 2010), which are not very common close to Ndumo Game Reserve. According to Javed
61
and Usmani (2013) metals will accumulate in the liver as a result of the presence of
metallothioneins (MTs) that bind to Zn. As the World Health Organization (2017) set the limit of
Zn for human consumption at 100 mg/kg, the concentrations at the three sites were well below
the limit. Exceeding the limit can alter the health of organisms and can cause anaemia or pancreas
damage (ATSDR, 2013c).
The presence of copper in water is due to natural weathering of rocks, or activities such as
agriculture and the use of pesticides (Shrivastava, 2009). Although the concentration of Cu in the
muscle tissues was high across the three sites, it was still lower than the limit of 30 mg/kg set for
consumption by the World Health Organization WHO (2017). Although Cu is essential for good
health, exceeding the limit can cause damage in gills, liver and kidneys (Javed & Usmani, 2013).
Aluminium is one of the most used metals on Earth because of its light weight-to-strength ratio as
well as its ability to resist corrosion (Jones & Das, 1960). Smelting of Al is the main source of
aluminium pollution and causes acid rains (Arnesen et al., 1995). An excess of Al accumulation
in an organism causes respiratory disturbances (Alwan et al., 2009).
A major source of Mn pollution is municipal wastewater discharge as well as sewage water.
According to the Ndumo Game Reserve’s Integrated Management Plan (2009) the sewage
treatment in the Ndumo Game Reserve is through septic tanks and French drain systems that are
known to cause pollution of ground waters. They are not up to standard and can be the cause of
the elevated levels of Mn in the ecosystem. According to Javed and Usmani (2013), exposure to
Mn will cause lung, liver and vascular disturbances. The concentrations present in the muscle
tissue of the three sites exceeded the limit for consumption set by WHO (2017) which is 1 mg/kg.
Arsenic is detected in low concentrations in all environmental matrices (ATSDR, 2013a). An
excess of As can have serious health effects and can affect virtually all organ systems
(Tchounwou et al., 2012). High levels of Cd are known to target the blood vessels of organisms
and can lead to death (Tchounwou et al., 2012). Lead is present in small quantities in the earth’s
crust (Tchounwou et al., 2012). The limit for consumption set by the WHO (2017) for Pb is 0.5
mg/kg which means all three our sites exceeded the limits. High concentrations of Pb can have
serious health implications for organisms. The nervous system is targeted by Pb poisoning and
can lead to death at extremely high concentrations (Tchounwou et al., 2012). Selenium is a natural
trace element that is released into the environment through anthropogenic activities such as
mining, agricultural, industrial and petrochemical operations (Lemly, 2004).
62
3.5. Conclusion
This is the first study reporting the metal concentrations of fish from the floodplains of the NGR
as well as in the lower Usuthu River system. The study found that C. gariepinus accumulated
metals even when present in aquatic ecosystems close to a natural condition. There were clear
spatial differences in the accumulation of metals with the catfish in the lotic system accumulating
the essential metals to higher levels than in the two lentic systems. The catfish in the lotic system
had the lowest accumulation of the non-essential metals. It was also clear that salinity played a
role in the accumulation of metals with the catfish in the freshwater lentic system accumulating all
metals to higher concentrations than the catfish in the saline lentic system, however metal
concentrations in this saline water were predominantly higher than the freshwater systems.
The hypotheses of this chapter stated that the bioaccumulation of metals in C. gariepinus would
reflect the environmental conditions of the sites, with both the lentic systems (fresh and saline)
having higher bioaccumulation factors than the lotic systems and secondly that C. gariepinus
would bioaccumulate the non-essential metals to higher levels than the essential metals The first
hypothesis of this chapter is rejected because the catfish in the lotic system had higher BAFs than
the catfish in the saline lentic system and higher BAFs for some metals than the catfish in the
freshwater lentic system.
The second hypothesis is also partially rejected as only Cd and Pb were bioaccumulated to higher
levels than the essential metals.
Clarias gariepinus has proven to be a good bio-indicator of metal concentrations even in a non-
polluted ecosystem. Now that the bioaccumulation of C. gariepinus at the three aquatic
ecosystems is known it can be used to see if endohelminth parasites will accumulate metals to a
greater degree than their hosts and thus potentially be better bio-indicators of metal pollution.
63
4. Bioaccumulation of metals in endohelminth parasites of
Clarias gariepinus: correlation with host accumulation,
ecosystem type and infection site location-specific
accumulation patterns.
4.1. Introduction
Parasites are organisms which are dependent on host individuals for survival, whether as a food
source, a safe environment to survive in or a place to complete their life cycle (Lafferty & Kuris,
1999, Pietrock & Marcogliese, 2003, Sures et al., 2017). Parasites can be found in all ecosystems
of the world and are present in abundance (Sures, 2001, Vázquez et al., 2005). Parasites are
functionally important organisms, particularly in aquatic communities with regard to their trophic
level in the food web making them useful bio-indicators for anthropogenic pollution (Sures, 2004).
Mackenzie (1999) states that there are three reasons to use parasites as bio-indicators: firstly,
there are many more parasitic than free-living species (biological diversity); secondly, some
parasites have complex life cycles (occupying multiple hosts) which can increase the number of
potential indicators; and lastly, some parasites are sensitive to changes in their environment. For
these reasons parasites are considered to be good bio-indicators of the health of an ecosystem
(Sures, 2003, Sures, 2004, Marcogliese, 2005, Marcogliese & Pietrock, 2011, Sures et al., 2017)
Sures et al. (2017) state, that from all the studies conducted on parasites as biological indicators,
it has been found that parasites can be utilised in three different ways; the first of which as
parasites and biomarkers, where the effect of parasites on the physiological homeostasis of the
host is investigated (Sures, 2004, Sures et al., 2017). Organisms have a physiological response
to the uptake and accumulation of environmental pollutants (Sures et al., 2017). Sures et al.
(2017) also mention that the interaction of parasites and pollutant-induced biomarker responses
of their host has been receiving increased awareness and has been investigated as early as 1977
by Boyce and Yamada (1977), where the studies found that parasite infections had an effect on
the resistance of their hosts towards environmental chemicals.
The second way in which parasites is being used, are as effect indicators by focusing on the
populations and community structure of parasites as well as individual parasitic organisms (Sures,
64
2004). Single organisms are used by looking at the effect of direct toxicity on the free-living larval
stages (Sures, 2004). Numerous studies have found that pollutants such as metals bind to
receptors causing the deactivation of enzymes causing fatalities of both the host and its parasites
(Pietrock & Marcogliese, 2003, Sibley, 2004, Avilán et al., 2011, Osman et al., 2012). Many
studies have been conducted on the effect of environmental pollution on the changes in
population and communities of parasites within their hosts (Kennedy, 1997, Lafferty & Kuris, 1999,
Mackenzie, 1999, Vidal-Martinez et al., 2010).
Despite the many studies that have been conducted, only limited parasite populations indicated
predictable changes due to environmental pollution; however, the general consensus is that
pollution does have an effect on parasite populations and communities both at host level and
directly (Sures, 2004).
Lastly, parasites are also used as accumulation indicators of pollution in aquatic ecosystems
(Sures, 2004). Pollution can be fatal to the organisms present in polluted systems thus resulting
in certain organisms being absent in some systems. Certain organisms have a higher tolerance
for pollution and have the ability to accumulate pollutants (Sures et al., 1999, Sures, 2003). Most
studies up until now have focused on metal pollution, with a few cases focusing on organic
pollutants (Sures, 2004, Sures et al., 2017). Studies have found that parasites with a low
percentage of fat are unable to bio-concentrate lipophilic substances such as organic pollutants
(Heinonen et al., 1999, Heinonen et al., 2000, Ruus et al., 2001). Parasites can also alter the
uptake of metals of their hosts (Boyce & Yamada, 1977, Bergey et al., 2002, Sures, 2003, Sures,
2004, Sures et al., 2017). Evans et al. (2001) found that Digenea infection in hosts causes
destruction of the hepatopancreas cells, which reduces the capacity of hosts to store metals.
To date more than 50 different species of parasites have been studied for their bioaccumulation
properties; these parasites belong predominantly to four endohelminth taxa (Cestoda, Nematoda,
Acanthocephala and Digenea) (Sures et al., 2017). Studies found that freshwater
acanthocephalans and cestodes had the greatest capacity to accumulate various elements to
high levels (Sures et al., 2017). However, many of these studies have been done in Europe where
Acanthocephala are particularly abundant, which is not the case for Africa, with a distinct lack of
spiny-headed worms in freshwater ecosystems (Boomker, 1994). Previous studies conducted
within the Ndumo Game Reserve (NGR) have found four different intestinal helminth parasites
and one body cavity helminth parasite in Clarias gariepinus, which includes two Cestodes
65
(Proteocephalus sp. Weinland, 1858 and Tetracampos ciliotheca Wedl, 1861) and three
Nematodes (Contracaecum sp. Railliet and Henry, 1912, Procamallanus pseudolaeviconchus
Moravec et Van As, 2015 and Paracamallanus cyathopgharynx Baylis, 1923) (Smit et al., 2016,
Svitin et al., 2019).
The two cestode species (T. ciliotheca and Proteocephalus sp.) are found in the intestine of their
intermediate hosts. Cestode species feed by absorbing nutrients and pollutants from their host
through their teguments and membranes (Dalton et al., 2004). Two of the nematode species are
also to be found in the digestive tract of C. gariepinus: the first species, P. pseudolaeviconchus,
is found in the stomach (Svitin et al., 2019) and the second, Pa. cyathopgharynx, is found in the
rectum (Svitin et al., 2019). The third, a Contracaecum sp., is found in the body cavity of the host
(Barson, 2004). Both species found in the intestinal tract absorb nutrients and pollutants through
their tegument and membranes (Hassan et al., 2016), whereas the body cavity species feed on
the blood and tissue of the host (Barson, 2004).
It was hypothesised that the endohelminth parasites of C. gariepinus would prove to be better
bio-indicators of both essential and non-essential metals than their hosts due to the
bioconcentration and biomagnification of metals in the endohelminth parasites. It was also
hypothesised that the endohelminth parasites in the intestines would have higher accumulation
rates for metals than the Contracaecum sp. in the body cavity due to higher concentrations of
metals in the intestinal tract. Lastly, it was hypothesised that there would be a gradient of metal
accumulation in the nematode parasites with the highest being in the stomach due to the low pH
making metals there more bioavailable than in the rectum of the hosts.
To test these hypotheses, the aim of this chapter is to determine the concentrations of metals in
the parasites and to evaluate the use of different helminth parasites as bio-indicators of both
essential and non-essential metals to establish if these parasites can be used for bioaccumulation
studies. In this study we compared the accumulation capacity of all the endohelminth parasites
found in C. gariepinus to see if the position of the parasites in the host played a role in the
accumulation capacity of the parasites. This part of the study also examined the effect of parasite
infection and accumulation on host accumulation and vice versa.
66
4.2. Materials and methods
4.2.1. Field collection
Following euthanisation of the hosts (described in Chapter 3 Section 3.2.2), their body cavities
were inspected for the presence of Contracaecum sp. (Fig. 4.1A, B). When found, these parasites
were then collected, and all the organs removed to gain access to the gastrointestinal tract of the
host. The digestive system was removed from the esophagus to the anus and thoroughly checked
under a dissection microscope for the presence of helminth parasites. The parasites collected,
included P. pseudolaeviconchus in the stomach (Fig. 4.1C), two different cestode species: T.
ciliotheca and Proteocephalus sp. in the intestine (Fig. 4.1D, E, F) and Pa. cyathopgharynx in the
rectum (Fig. 4.1G). Collected parasites were counted and frozen for further analyses.
4.2.2. Laboratory analysis of the body cavity nematode (Contracaecum sp.) and quality
control
In order to get sufficient weight (0.05 g – 0.2 g) for metal analysis, individual parasites were
pooled. Thereafter the metal concentration was analysed in the same manner as that of the host
tissue (described in Chapter 3 Section 3.2.3). The quality control for the digestion and ICP-MS
analysis of the Contracaecum sp. was assessed in the same way as that of the host tissue. The
Certified Reference Material (CRM) (DORM-4: Fish protein certified reference material for trace
metals); results and recoveries are shown in Table 3.1 (refer to Chapter 3 Section 3.2.3).
Recoveries ranged from 96% for Ni to 149% for Pb.
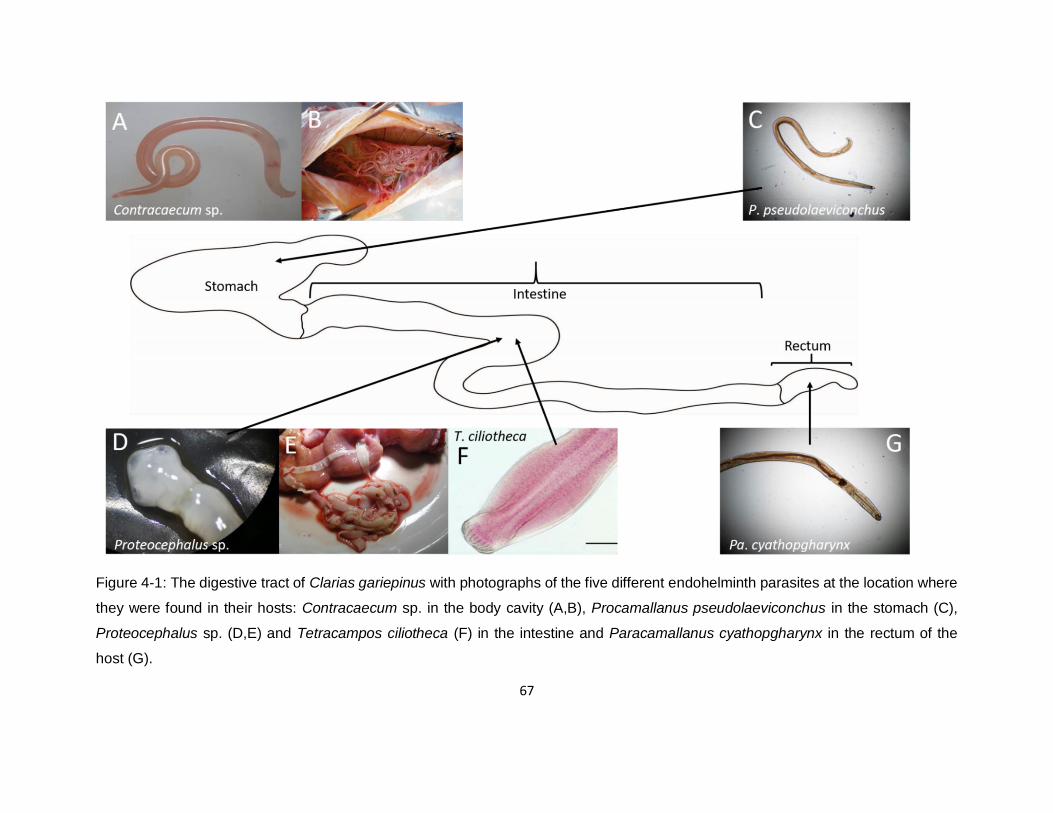
67
Figure 4-1: The digestive tract of Clarias gariepinus with photographs of the five different endohelminth parasites at the location where
they were found in their hosts: Contracaecum sp. in the body cavity (A,B), Procamallanus pseudolaeviconchus in the stomach (C),
Proteocephalus sp. (D,E) and Tetracampos ciliotheca (F) in the intestine and Paracamallanus cyathopgharynx in the rectum of the
host (G).
68
4.2.3. Laboratory analysis of collected gastro-intestinal helminth parasites
Since the sizes of the different gastro-intestinal species of parasites are so small, it was decided
to pool samples of P. pseudolaeviconchus, T. ciliotheca and Pa. cyathopgharynx to provide
enough weight for digestions (0.0004 g – 0.01 g) (Table 4.1). Proteocephalus sp. had enough
weight not to be pooled but was only present at Nyamithi Pan. Pooled samples were weighed and
placed in different wells of a Teflon heat block, and 1 mL 65% HNO3 was added. The heat block
was then placed in an oven at 70˚C for 24 hours. Following cooling, the sample in each well was
removed with a clean sterile pipette and placed in a 15 mL polypropylene tube, and then diluted
with 1% HNO3 to a volume of 10 mL. The digested samples were labelled and sent for ICP-MS
analysis. All metal concentrations were converted to mg/kg. To ensure quality control for the
digestion and ICP-MS analysis CRM (DORM-4: Fish protein certified reference material for trace
metals) was treated in the same way as for the different parasite species, as set out above. The
results for the concentration of metals in the CRM and the percentage recovery are shown in
Table 4.2. The recoveries ranged from 91% for As to 161% for Pb.
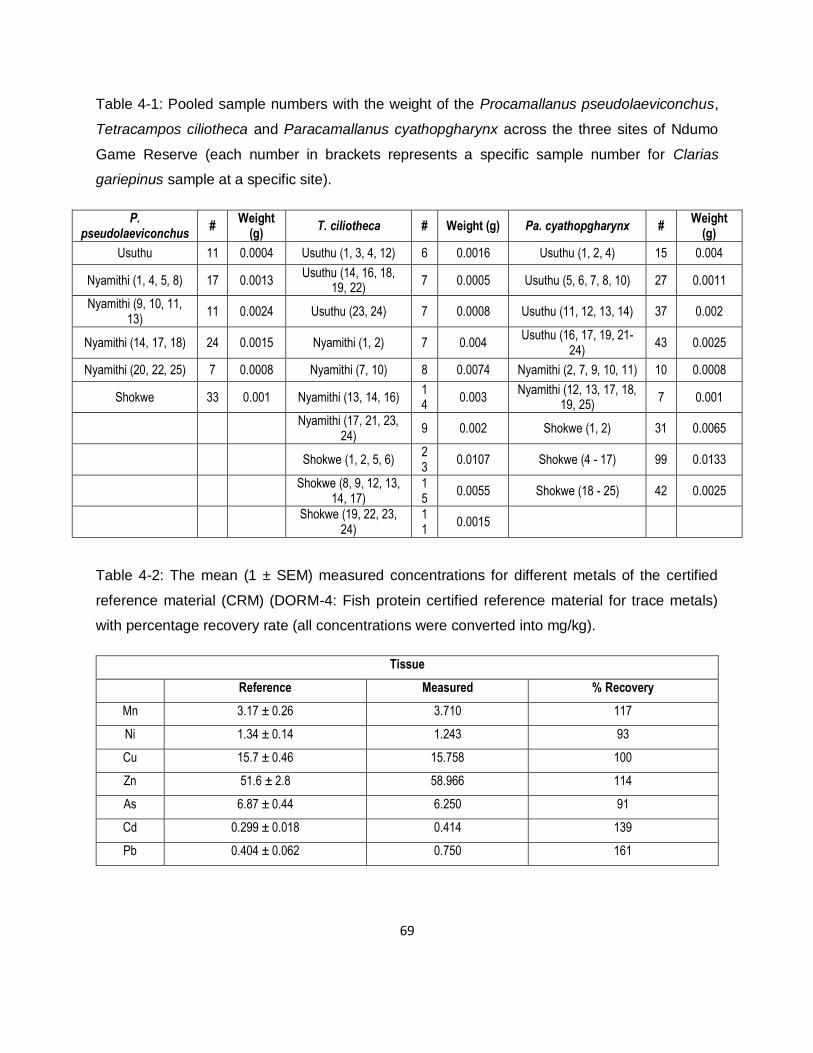
69
Table 4-1: Pooled sample numbers with the weight of the Procamallanus pseudolaeviconchus,
Tetracampos ciliotheca and Paracamallanus cyathopgharynx across the three sites of Ndumo
Game Reserve (each number in brackets represents a specific sample number for Clarias
gariepinus sample at a specific site).
P. pseudolaeviconchus
# Weight
(g) T. ciliotheca # Weight (g) Pa. cyathopgharynx #
Weight (g)
Usuthu 11 0.0004 Usuthu (1, 3, 4, 12) 6 0.0016 Usuthu (1, 2, 4) 15 0.004
Nyamithi (1, 4, 5, 8) 17 0.0013 Usuthu (14, 16, 18,
19, 22) 7 0.0005 Usuthu (5, 6, 7, 8, 10) 27 0.0011
Nyamithi (9, 10, 11, 13)
11 0.0024 Usuthu (23, 24) 7 0.0008 Usuthu (11, 12, 13, 14) 37 0.002
Nyamithi (14, 17, 18) 24 0.0015 Nyamithi (1, 2) 7 0.004 Usuthu (16, 17, 19, 21-
24) 43 0.0025
Nyamithi (20, 22, 25) 7 0.0008 Nyamithi (7, 10) 8 0.0074 Nyamithi (2, 7, 9, 10, 11) 10 0.0008
Shokwe 33 0.001 Nyamithi (13, 14, 16) 14
0.003 Nyamithi (12, 13, 17, 18,
19, 25) 7 0.001
Nyamithi (17, 21, 23,
24) 9 0.002 Shokwe (1, 2) 31 0.0065
Shokwe (1, 2, 5, 6) 23
0.0107 Shokwe (4 - 17) 99 0.0133
Shokwe (8, 9, 12, 13,
14, 17) 15
0.0055 Shokwe (18 - 25) 42 0.0025
Shokwe (19, 22, 23,
24) 11
0.0015
Table 4-2: The mean (1 ± SEM) measured concentrations for different metals of the certified
reference material (CRM) (DORM-4: Fish protein certified reference material for trace metals)
with percentage recovery rate (all concentrations were converted into mg/kg).
Tissue
Reference Measured % Recovery
Mn 3.17 ± 0.26 3.710 117
Ni 1.34 ± 0.14 1.243 93
Cu 15.7 ± 0.46 15.758 100
Zn 51.6 ± 2.8 58.966 114
As 6.87 ± 0.44 6.250 91
Cd 0.299 ± 0.018 0.414 139
Pb 0.404 ± 0.062 0.750 161
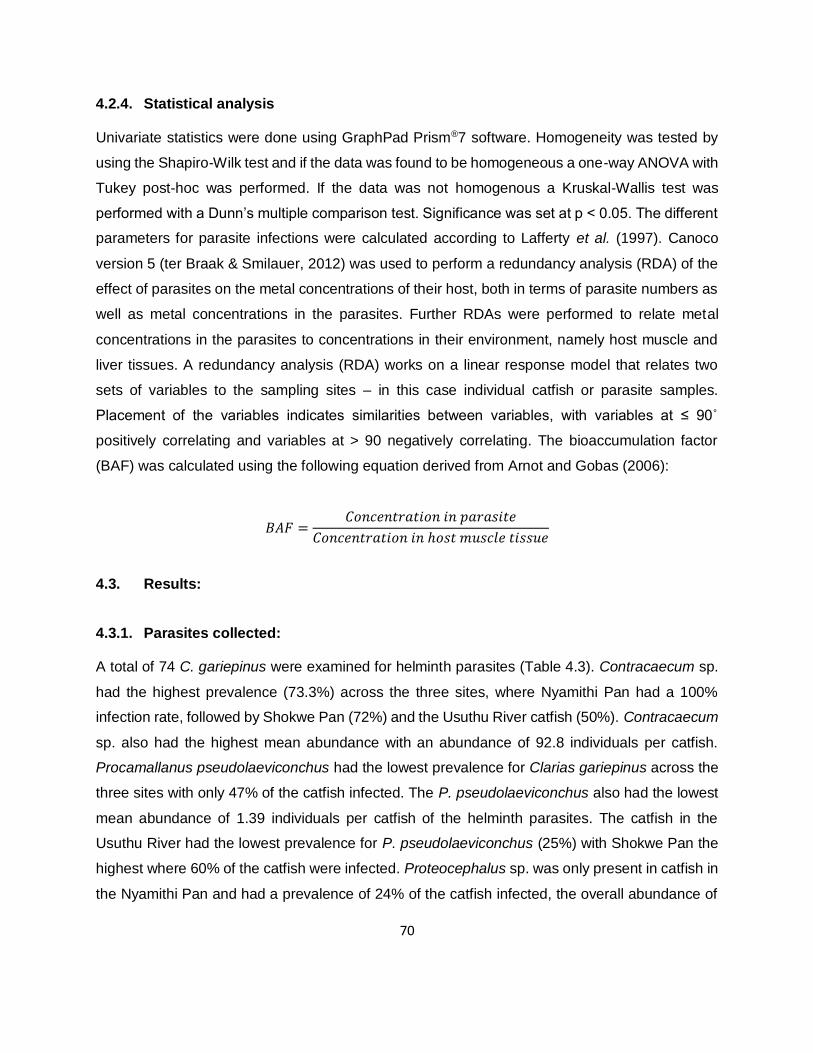
70
4.2.4. Statistical analysis
Univariate statistics were done using GraphPad Prism®7 software. Homogeneity was tested by
using the Shapiro-Wilk test and if the data was found to be homogeneous a one-way ANOVA with
Tukey post-hoc was performed. If the data was not homogenous a Kruskal-Wallis test was
performed with a Dunn’s multiple comparison test. Significance was set at p < 0.05. The different
parameters for parasite infections were calculated according to Lafferty et al. (1997). Canoco
version 5 (ter Braak & Smilauer, 2012) was used to perform a redundancy analysis (RDA) of the
effect of parasites on the metal concentrations of their host, both in terms of parasite numbers as
well as metal concentrations in the parasites. Further RDAs were performed to relate metal
concentrations in the parasites to concentrations in their environment, namely host muscle and
liver tissues. A redundancy analysis (RDA) works on a linear response model that relates two
sets of variables to the sampling sites – in this case individual catfish or parasite samples.
Placement of the variables indicates similarities between variables, with variables at ≤ 90˚
positively correlating and variables at > 90 negatively correlating. The bioaccumulation factor
(BAF) was calculated using the following equation derived from Arnot and Gobas (2006):
𝐵𝐴𝐹 =𝐶𝑜𝑛𝑐𝑒𝑛𝑡𝑟𝑎𝑡𝑖𝑜𝑛 𝑖𝑛 𝑝𝑎𝑟𝑎𝑠𝑖𝑡𝑒
𝐶𝑜𝑛𝑐𝑒𝑛𝑡𝑟𝑎𝑡𝑖𝑜𝑛 𝑖𝑛 ℎ𝑜𝑠𝑡 𝑚𝑢𝑠𝑐𝑙𝑒 𝑡𝑖𝑠𝑠𝑢𝑒
4.3. Results:
4.3.1. Parasites collected:
A total of 74 C. gariepinus were examined for helminth parasites (Table 4.3). Contracaecum sp.
had the highest prevalence (73.3%) across the three sites, where Nyamithi Pan had a 100%
infection rate, followed by Shokwe Pan (72%) and the Usuthu River catfish (50%). Contracaecum
sp. also had the highest mean abundance with an abundance of 92.8 individuals per catfish.
Procamallanus pseudolaeviconchus had the lowest prevalence for Clarias gariepinus across the
three sites with only 47% of the catfish infected. The P. pseudolaeviconchus also had the lowest
mean abundance of 1.39 individuals per catfish of the helminth parasites. The catfish in the
Usuthu River had the lowest prevalence for P. pseudolaeviconchus (25%) with Shokwe Pan the
highest where 60% of the catfish were infected. Proteocephalus sp. was only present in catfish in
the Nyamithi Pan and had a prevalence of 24% of the catfish infected, the overall abundance of
71
Proteocephalus sp. was 0.8 individuals per catfish. The prevalence of T. ciliotheca in C.
gariepinus was 54.1% with a mean abundance of 7.13 individuals per catfish across the three
sites. The T. ciliotheca at Nyamithi Pan had the highest prevalence (60%) and abundance (3.96)
followed by Shokwe Pan (56%, 0.64) and Usuthu River (45.8%, 0.83). Paracamallanus
cyathopgharynx had the second highest prevalence (71.6%) across the three sites. Nyamithi Pan
had the lowest prevalence of Pa. cyathopgharynx (44%) followed by Usuthu River (79.2%) and
Shokwe Pan (92%).
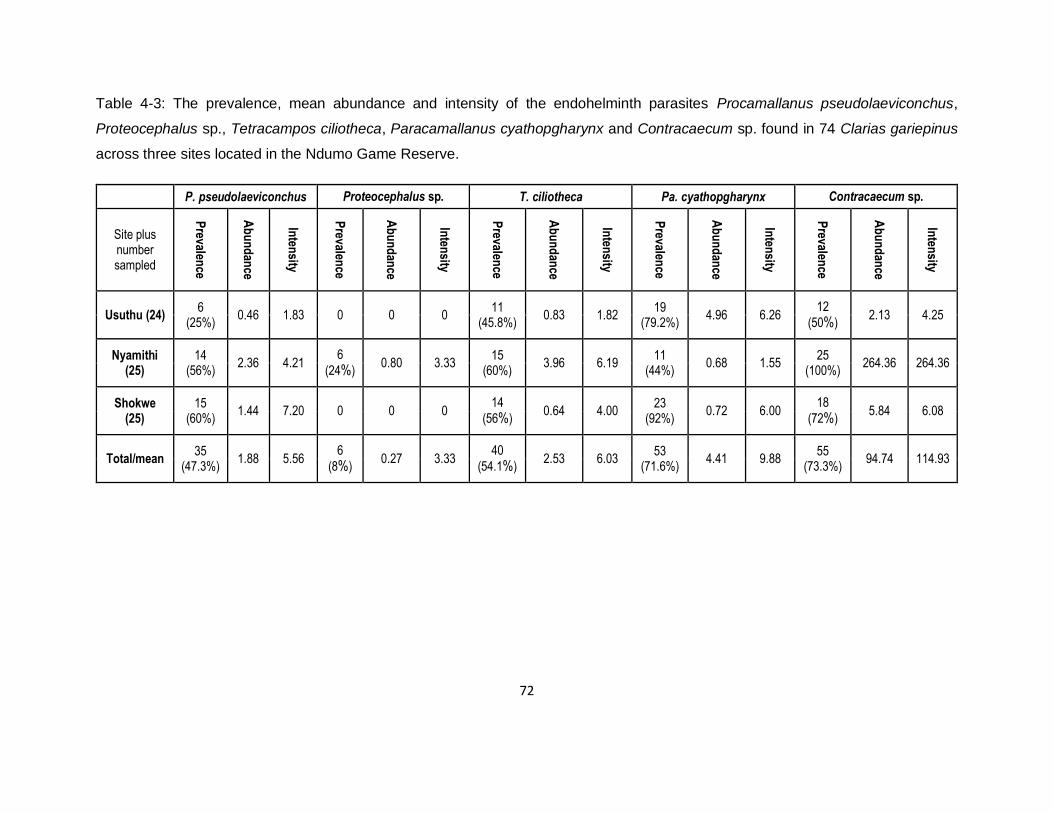
72
Table 4-3: The prevalence, mean abundance and intensity of the endohelminth parasites Procamallanus pseudolaeviconchus,
Proteocephalus sp., Tetracampos ciliotheca, Paracamallanus cyathopgharynx and Contracaecum sp. found in 74 Clarias gariepinus
across three sites located in the Ndumo Game Reserve.
P. pseudolaeviconchus Proteocephalus sp. T. ciliotheca Pa. cyathopgharynx Contracaecum sp.
Site plus number sampled
Prevalen
ce
Ab
un
dan
ce
Inten
sity
Prevalen
ce
Ab
un
dan
ce
Inten
sity
Prevalen
ce
Ab
un
dan
ce
Inten
sity
Prevalen
ce
Ab
un
dan
ce
Inten
sity
Prevalen
ce
Ab
un
dan
ce
Inten
sity
Usuthu (24) 6
(25%) 0.46 1.83 0 0 0
11 (45.8%)
0.83 1.82 19
(79.2%) 4.96 6.26
12
(50%) 2.13 4.25
Nyamithi (25)
14 (56%)
2.36 4.21 6
(24%) 0.80 3.33
15 (60%)
3.96 6.19 11
(44%) 0.68 1.55
25 (100%)
264.36 264.36
Shokwe (25)
15 (60%)
1.44 7.20 0 0 0 14
(56%) 0.64 4.00
23 (92%)
0.72 6.00 18
(72%) 5.84 6.08
Total/mean 35
(47.3%) 1.88 5.56
6
(8%) 0.27 3.33
40
(54.1%) 2.53 6.03
53 (71.6%)
4.41 9.88 55
(73.3%) 94.74 114.93
73
4.3.2. Essential metal concentrations in parasites:
The concentration of iron (Fe) in all the different parasites across the three sites was higher than
in the host muscle tissue but lower than in the liver (Fig. 4.2A, B, C). Contracaecum sp. had
significantly lower concentrations of Fe than the other parasites from both the Usuthu River and
Shokwe Pan sites. T. ciliotheca, had the highest concentration of Fe at both the Usuthu River and
Shokwe Pan sites. Whereas Pa. cyathopgharynx had the highest concentrations of Fe at Nyamithi
Pan (Fig. 4.2B), the Proteocephalus sp. had significantly lower concentrations of Fe than the other
parasites at Nyamithi Pan Fig. 4.2B).
Cobalt concentrations in the different parasites were higher than the concentrations of Co found
in the host muscle and liver tissue (Fig. 4.2D, E, F). There was no significant difference in Co
concentrations in the different parasites at any of the sites. Once again T. ciliotheca had the
highest concentrations of Co at the three sites, whereas Proteocephalus sp. had the lowest
concentration of Co at the Nyamithi Pan site (Fig. 4.2E).
The concentration of nickel (Fig. 4.2G, H, I) in the different parasites was higher than the
concentrations in the host muscle tissue across the three sites. At the Nyamithi Pan site
Proteocephalus sp. was the only parasite with a lower concentration than in the host liver tissue
(Fig. 4.2H). There was no significant difference in the Ni concentrations in the different parasites
at both Usuthu River and Shokwe Pan sites with Contracaecum sp. parasites having the lowest
concentration of Ni. At both the Usuthu River and Nyamithi Pan sites the Pa. cyathopgharynx had
the highest concentration of Ni. The Proteocephalus sp. had significantly lower concentrations
than all the other parasites and even lower concentrations than in the host muscle tissue.
Concentrations of Zn in all parasites across all sites were higher than the host muscle tissue
concentrations and only the Proteocephalus sp. and Contracaecum sp. at both Nyamithi Pan and
Shokwe Pan had lower concentrations than the host liver tissue (Fig. 4.3A, B, C). The
Contracaecum sp. had significantly lower concentrations of Zn at both the Usuthu River (Fig.
4.3A) and Shokwe Pan (Fig. 4.3C) sites with only the Proteocephalus sp. having lower
concentrations than the Contracaecum sp. at Nyamithi Pan (Fig 4.3B). Both the P.
pseudolaeviconchus and Pa. cyathopgharynx parasites had higher concentrations of Zn at all
three sites with the T. ciliotheca having higher concentrations of Zn at the Usuthu River site.
74
The copper (Cu) concentrations in the parasites across the three sites were higher than in the
host muscle tissue except for Proteocephalus sp., at Nyamithi (Fig. 4.3D, E, F). At both the Usuthu
River and Shokwe Pan sites the parasites had lower concentrations of Cu than present in the
host’s liver tissue. There was no significant difference in the concentration of Cu between the
different parasites at the Shokwe Pan site; only Contracaecum sp. had lower concentrations at
the Usuthu River site. The two intestinal nematodes (P. pseudolaeviconchus and Pa.
cyathopgharynx) and a single cestode species (T. ciliotheca) had very similar concentrations of
Cu at the three sites.
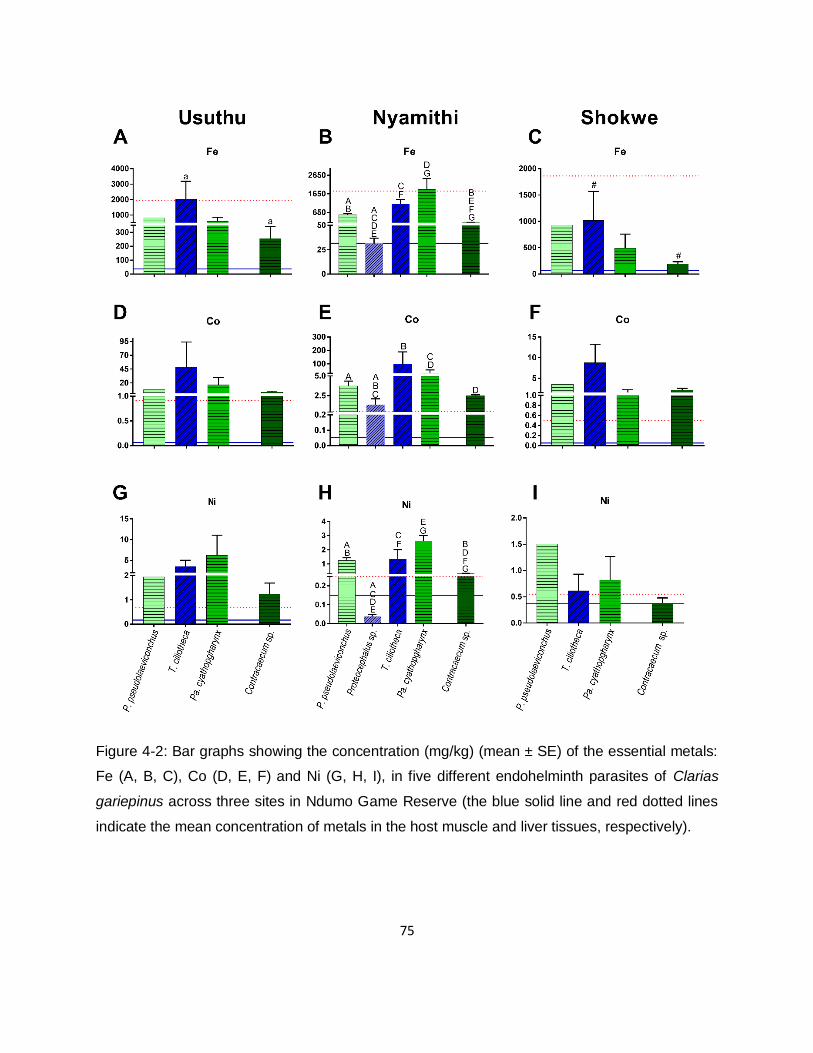
75
Figure 4-2: Bar graphs showing the concentration (mg/kg) (mean ± SE) of the essential metals:
Fe (A, B, C), Co (D, E, F) and Ni (G, H, I), in five different endohelminth parasites of Clarias
gariepinus across three sites in Ndumo Game Reserve (the blue solid line and red dotted lines
indicate the mean concentration of metals in the host muscle and liver tissues, respectively).
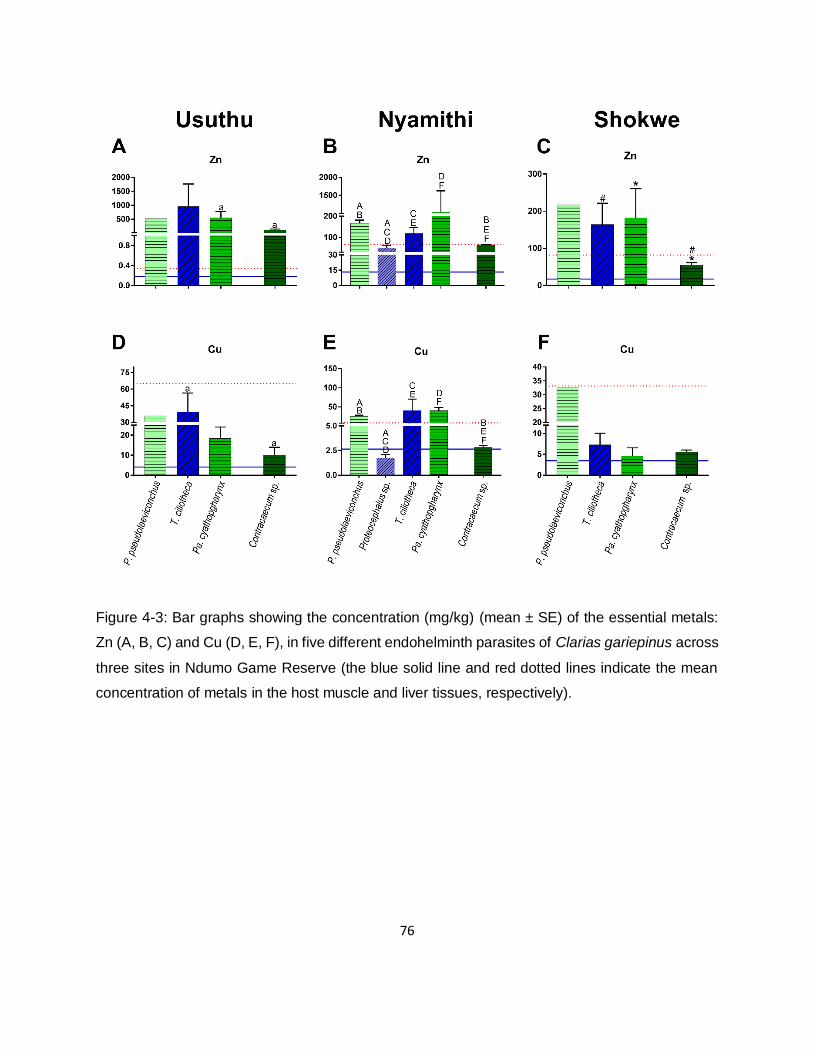
76
Figure 4-3: Bar graphs showing the concentration (mg/kg) (mean ± SE) of the essential metals:
Zn (A, B, C) and Cu (D, E, F), in five different endohelminth parasites of Clarias gariepinus across
three sites in Ndumo Game Reserve (the blue solid line and red dotted lines indicate the mean
concentration of metals in the host muscle and liver tissues, respectively).
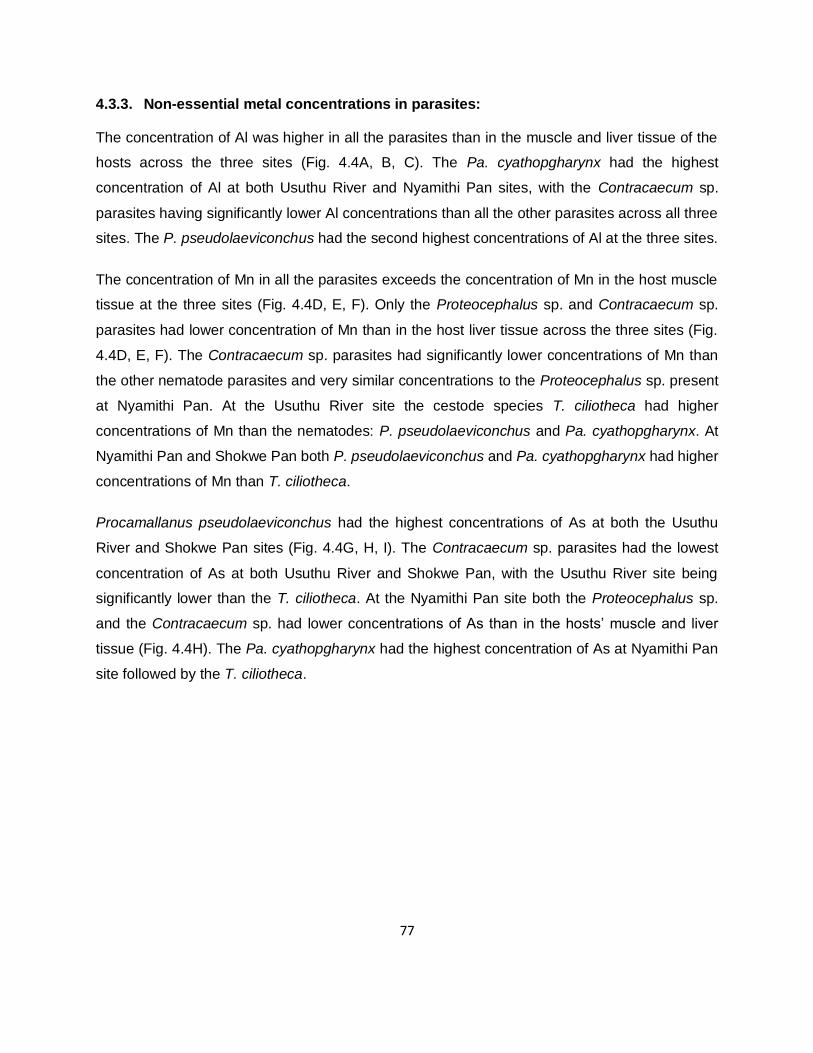
77
4.3.3. Non-essential metal concentrations in parasites:
The concentration of Al was higher in all the parasites than in the muscle and liver tissue of the
hosts across the three sites (Fig. 4.4A, B, C). The Pa. cyathopgharynx had the highest
concentration of Al at both Usuthu River and Nyamithi Pan sites, with the Contracaecum sp.
parasites having significantly lower Al concentrations than all the other parasites across all three
sites. The P. pseudolaeviconchus had the second highest concentrations of Al at the three sites.
The concentration of Mn in all the parasites exceeds the concentration of Mn in the host muscle
tissue at the three sites (Fig. 4.4D, E, F). Only the Proteocephalus sp. and Contracaecum sp.
parasites had lower concentration of Mn than in the host liver tissue across the three sites (Fig.
4.4D, E, F). The Contracaecum sp. parasites had significantly lower concentrations of Mn than
the other nematode parasites and very similar concentrations to the Proteocephalus sp. present
at Nyamithi Pan. At the Usuthu River site the cestode species T. ciliotheca had higher
concentrations of Mn than the nematodes: P. pseudolaeviconchus and Pa. cyathopgharynx. At
Nyamithi Pan and Shokwe Pan both P. pseudolaeviconchus and Pa. cyathopgharynx had higher
concentrations of Mn than T. ciliotheca.
Procamallanus pseudolaeviconchus had the highest concentrations of As at both the Usuthu
River and Shokwe Pan sites (Fig. 4.4G, H, I). The Contracaecum sp. parasites had the lowest
concentration of As at both Usuthu River and Shokwe Pan, with the Usuthu River site being
significantly lower than the T. ciliotheca. At the Nyamithi Pan site both the Proteocephalus sp.
and the Contracaecum sp. had lower concentrations of As than in the hosts’ muscle and liver
tissue (Fig. 4.4H). The Pa. cyathopgharynx had the highest concentration of As at Nyamithi Pan
site followed by the T. ciliotheca.
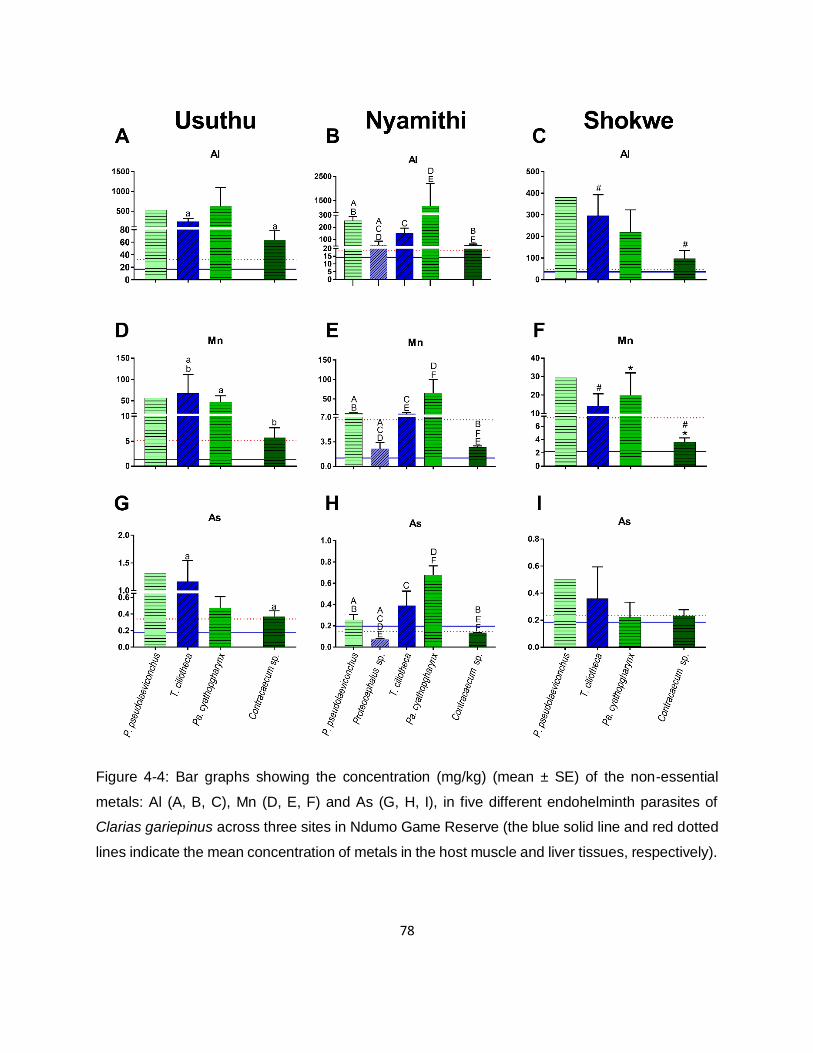
78
Figure 4-4: Bar graphs showing the concentration (mg/kg) (mean ± SE) of the non-essential
metals: Al (A, B, C), Mn (D, E, F) and As (G, H, I), in five different endohelminth parasites of
Clarias gariepinus across three sites in Ndumo Game Reserve (the blue solid line and red dotted
lines indicate the mean concentration of metals in the host muscle and liver tissues, respectively).
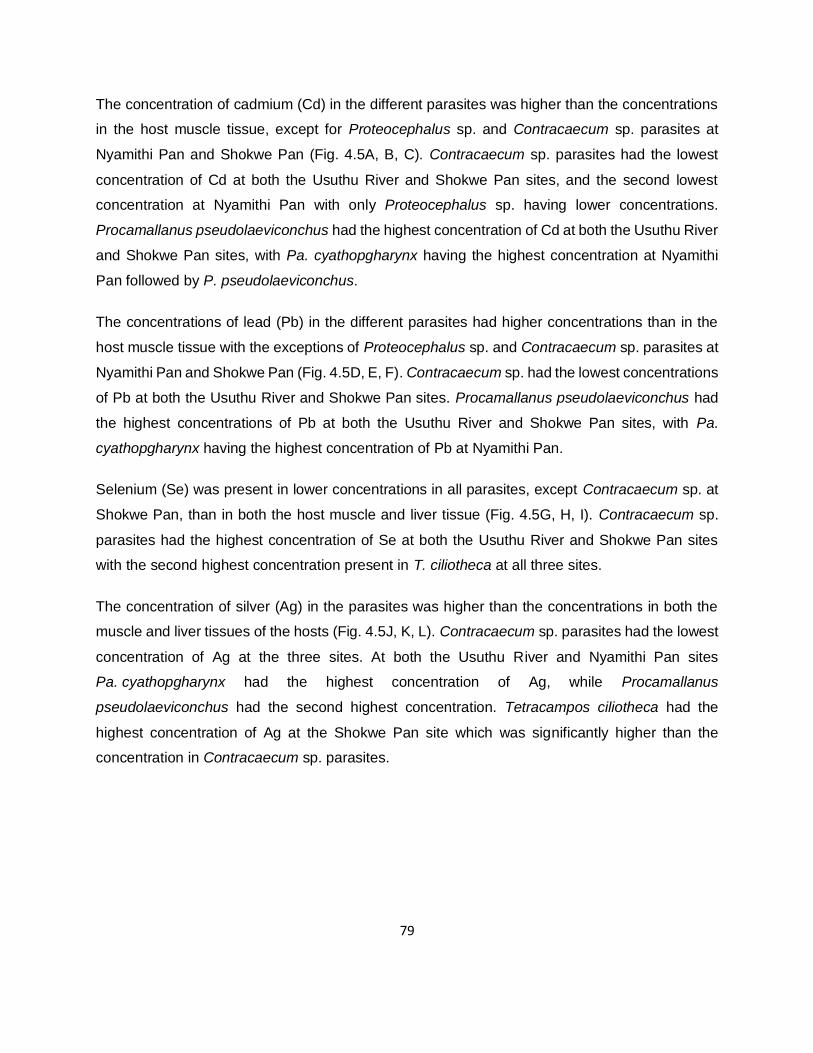
79
The concentration of cadmium (Cd) in the different parasites was higher than the concentrations
in the host muscle tissue, except for Proteocephalus sp. and Contracaecum sp. parasites at
Nyamithi Pan and Shokwe Pan (Fig. 4.5A, B, C). Contracaecum sp. parasites had the lowest
concentration of Cd at both the Usuthu River and Shokwe Pan sites, and the second lowest
concentration at Nyamithi Pan with only Proteocephalus sp. having lower concentrations.
Procamallanus pseudolaeviconchus had the highest concentration of Cd at both the Usuthu River
and Shokwe Pan sites, with Pa. cyathopgharynx having the highest concentration at Nyamithi
Pan followed by P. pseudolaeviconchus.
The concentrations of lead (Pb) in the different parasites had higher concentrations than in the
host muscle tissue with the exceptions of Proteocephalus sp. and Contracaecum sp. parasites at
Nyamithi Pan and Shokwe Pan (Fig. 4.5D, E, F). Contracaecum sp. had the lowest concentrations
of Pb at both the Usuthu River and Shokwe Pan sites. Procamallanus pseudolaeviconchus had
the highest concentrations of Pb at both the Usuthu River and Shokwe Pan sites, with Pa.
cyathopgharynx having the highest concentration of Pb at Nyamithi Pan.
Selenium (Se) was present in lower concentrations in all parasites, except Contracaecum sp. at
Shokwe Pan, than in both the host muscle and liver tissue (Fig. 4.5G, H, I). Contracaecum sp.
parasites had the highest concentration of Se at both the Usuthu River and Shokwe Pan sites
with the second highest concentration present in T. ciliotheca at all three sites.
The concentration of silver (Ag) in the parasites was higher than the concentrations in both the
muscle and liver tissues of the hosts (Fig. 4.5J, K, L). Contracaecum sp. parasites had the lowest
concentration of Ag at the three sites. At both the Usuthu River and Nyamithi Pan sites
Pa. cyathopgharynx had the highest concentration of Ag, while Procamallanus
pseudolaeviconchus had the second highest concentration. Tetracampos ciliotheca had the
highest concentration of Ag at the Shokwe Pan site which was significantly higher than the
concentration in Contracaecum sp. parasites.
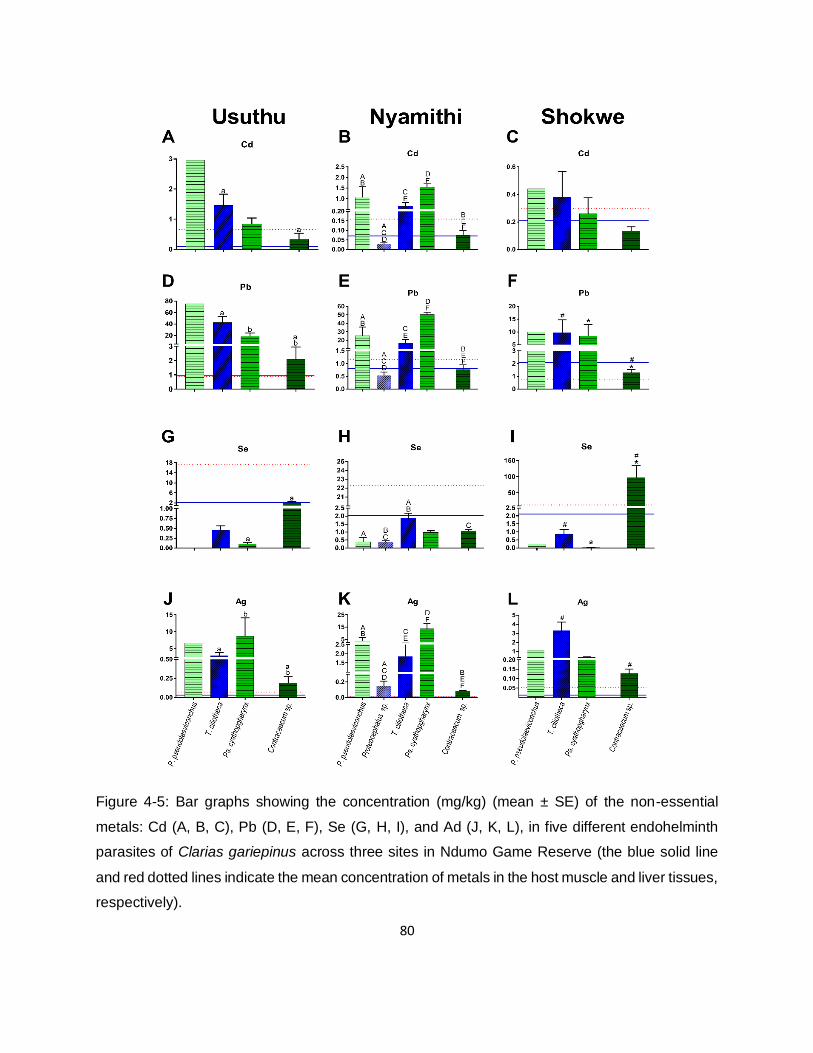
80
Figure 4-5: Bar graphs showing the concentration (mg/kg) (mean ± SE) of the non-essential
metals: Cd (A, B, C), Pb (D, E, F), Se (G, H, I), and Ad (J, K, L), in five different endohelminth
parasites of Clarias gariepinus across three sites in Ndumo Game Reserve (the blue solid line
and red dotted lines indicate the mean concentration of metals in the host muscle and liver tissues,
respectively).
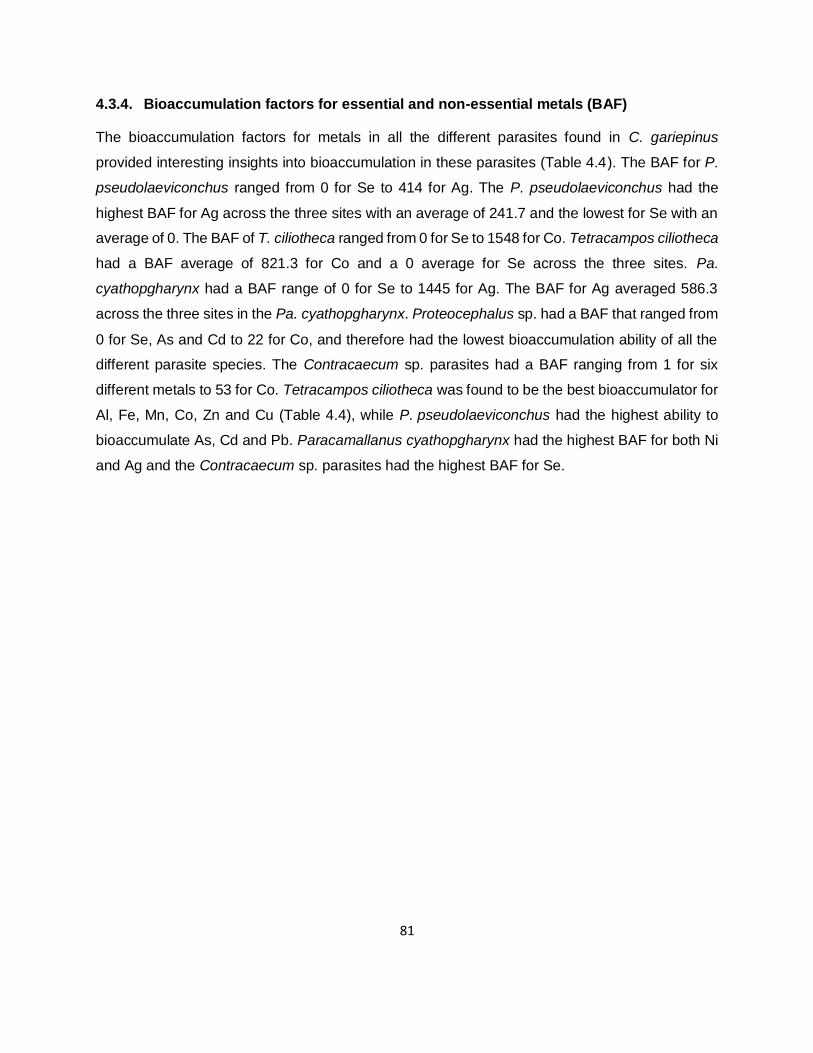
81
4.3.4. Bioaccumulation factors for essential and non-essential metals (BAF)
The bioaccumulation factors for metals in all the different parasites found in C. gariepinus
provided interesting insights into bioaccumulation in these parasites (Table 4.4). The BAF for P.
pseudolaeviconchus ranged from 0 for Se to 414 for Ag. The P. pseudolaeviconchus had the
highest BAF for Ag across the three sites with an average of 241.7 and the lowest for Se with an
average of 0. The BAF of T. ciliotheca ranged from 0 for Se to 1548 for Co. Tetracampos ciliotheca
had a BAF average of 821.3 for Co and a 0 average for Se across the three sites. Pa.
cyathopgharynx had a BAF range of 0 for Se to 1445 for Ag. The BAF for Ag averaged 586.3
across the three sites in the Pa. cyathopgharynx. Proteocephalus sp. had a BAF that ranged from
0 for Se, As and Cd to 22 for Co, and therefore had the lowest bioaccumulation ability of all the
different parasite species. The Contracaecum sp. parasites had a BAF ranging from 1 for six
different metals to 53 for Co. Tetracampos ciliotheca was found to be the best bioaccumulator for
Al, Fe, Mn, Co, Zn and Cu (Table 4.4), while P. pseudolaeviconchus had the highest ability to
bioaccumulate As, Cd and Pb. Paracamallanus cyathopgharynx had the highest BAF for both Ni
and Ag and the Contracaecum sp. parasites had the highest BAF for Se.
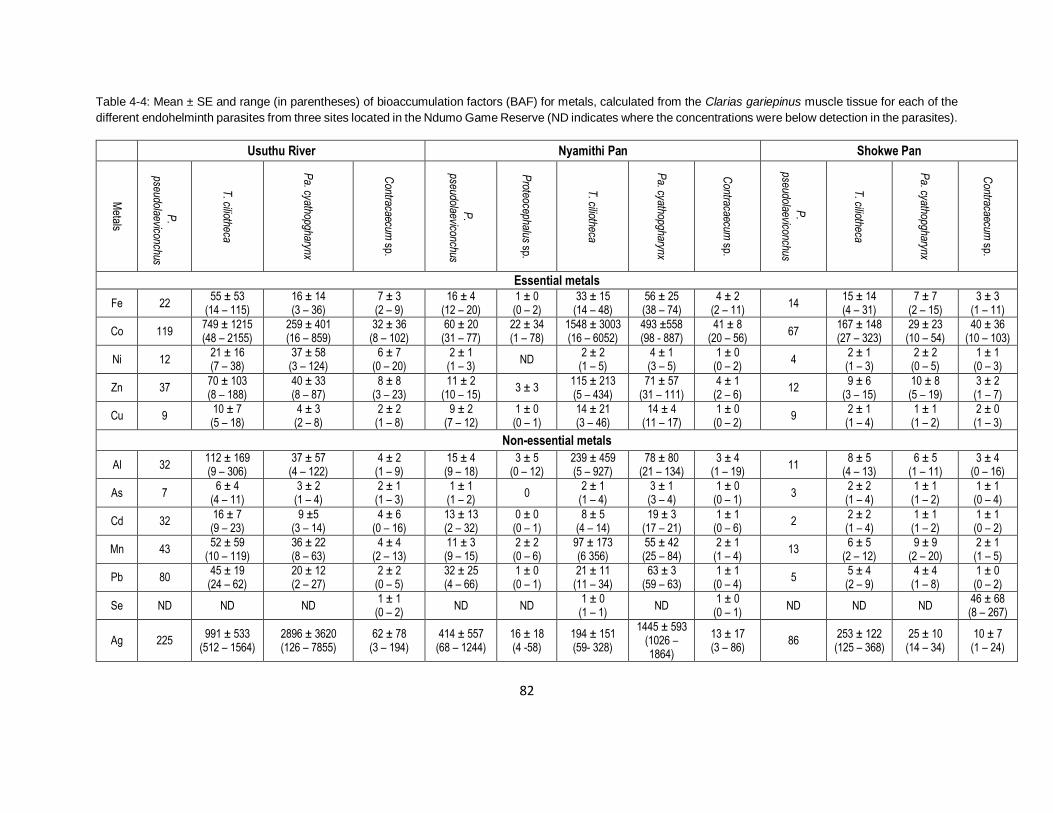
82
Table 4-4: Mean ± SE and range (in parentheses) of bioaccumulation factors (BAF) for metals, calculated from the Clarias gariepinus muscle tissue for each of the
different endohelminth parasites from three sites located in the Ndumo Game Reserve (ND indicates where the concentrations were below detection in the parasites).
Usuthu River Nyamithi Pan Shokwe Pan
Metals
P.
pseudolaeviconchus
T. ciliotheca
Pa. cyathopgharynx
Contracaecum
sp.
P.
pseudolaeviconchus
Proteocephalus sp.
T. ciliotheca
Pa. cyathopgharynx
Contracaecum
sp.
P.
pseudolaeviconchus
T. ciliotheca
Pa. cyathopgharynx
Contracaecum
sp.
Essential metals
Fe 22 55 ± 53
(14 – 115) 16 ± 14 (3 – 36)
7 ± 3 (2 – 9)
16 ± 4 (12 – 20)
1 ± 0 (0 – 2)
33 ± 15 (14 – 48)
56 ± 25 (38 – 74)
4 ± 2 (2 – 11)
14 15 ± 14 (4 – 31)
7 ± 7 (2 – 15)
3 ± 3 (1 – 11)
Co 119 749 ± 1215 (48 – 2155)
259 ± 401 (16 – 859)
32 ± 36 (8 – 102)
60 ± 20 (31 – 77)
22 ± 34 (1 – 78)
1548 ± 3003 (16 – 6052)
493 ±558 (98 - 887)
41 ± 8 (20 – 56)
67 167 ± 148 (27 – 323)
29 ± 23 (10 – 54)
40 ± 36 (10 – 103)
Ni 12 21 ± 16 (7 – 38)
37 ± 58 (3 – 124)
6 ± 7 (0 – 20)
2 ± 1 (1 – 3)
ND 2 ± 2
(1 – 5) 4 ± 1 (3 – 5)
1 ± 0 (0 – 2)
4 2 ± 1 (1 – 3)
2 ± 2 (0 – 5)
1 ± 1 (0 – 3)
Zn 37 70 ± 103 (8 – 188)
40 ± 33 (8 – 87)
8 ± 8 (3 – 23)
11 ± 2 (10 – 15)
3 ± 3 115 ± 213 (5 – 434)
71 ± 57 (31 – 111)
4 ± 1 (2 – 6)
12 9 ± 6
(3 – 15) 10 ± 8 (5 – 19)
3 ± 2 (1 – 7)
Cu 9 10 ± 7 (5 – 18)
4 ± 3 (2 – 8)
2 ± 2 (1 – 8)
9 ± 2 (7 – 12)
1 ± 0 (0 – 1)
14 ± 21 (3 – 46)
14 ± 4 (11 – 17)
1 ± 0 (0 – 2)
9 2 ± 1 (1 – 4)
1 ± 1 (1 – 2)
2 ± 0 (1 – 3)
Non-essential metals
Al 32 112 ± 169 (9 – 306)
37 ± 57 (4 – 122)
4 ± 2 (1 – 9)
15 ± 4 (9 – 18)
3 ± 5 (0 – 12)
239 ± 459 (5 – 927)
78 ± 80 (21 – 134)
3 ± 4 (1 – 19)
11 8 ± 5
(4 – 13) 6 ± 5
(1 – 11) 3 ± 4
(0 – 16)
As 7 6 ± 4
(4 – 11) 3 ± 2
(1 – 4) 2 ± 1
(1 – 3) 1 ± 1
(1 – 2) 0
2 ± 1 (1 – 4)
3 ± 1 (3 – 4)
1 ± 0 (0 – 1)
3 2 ± 2 (1 – 4)
1 ± 1 (1 – 2)
1 ± 1 (0 – 4)
Cd 32 16 ± 7 (9 – 23)
9 ±5 (3 – 14)
4 ± 6 (0 – 16)
13 ± 13 (2 – 32)
0 ± 0 (0 – 1)
8 ± 5 (4 – 14)
19 ± 3 (17 – 21)
1 ± 1 (0 – 6)
2 2 ± 2 (1 – 4)
1 ± 1 (1 – 2)
1 ± 1 (0 – 2)
Mn 43 52 ± 59
(10 – 119) 36 ± 22 (8 – 63)
4 ± 4 (2 – 13)
11 ± 3 (9 – 15)
2 ± 2 (0 – 6)
97 ± 173 (6 356)
55 ± 42 (25 – 84)
2 ± 1 (1 – 4)
13 6 ± 5
(2 – 12) 9 ± 9
(2 – 20) 2 ± 1 (1 – 5)
Pb 80 45 ± 19
(24 – 62) 20 ± 12 (2 – 27)
2 ± 2 (0 – 5)
32 ± 25 (4 – 66)
1 ± 0 (0 – 1)
21 ± 11 (11 – 34)
63 ± 3 (59 – 63)
1 ± 1 (0 – 4)
5 5 ± 4 (2 – 9)
4 ± 4 (1 – 8)
1 ± 0 (0 – 2)
Se ND ND ND 1 ± 1
(0 – 2) ND ND
1 ± 0 (1 – 1)
ND 1 ± 0
(0 – 1) ND ND ND
46 ± 68 (8 – 267)
Ag 225 991 ± 533
(512 – 1564) 2896 ± 3620 (126 – 7855)
62 ± 78 (3 – 194)
414 ± 557 (68 – 1244)
16 ± 18 (4 -58)
194 ± 151 (59- 328)
1445 ± 593 (1026 – 1864)
13 ± 17 (3 – 86)
86 253 ± 122 (125 – 368)
25 ± 10 (14 – 34)
10 ± 7 (1 – 24)
83
4.3.5. Correlations between essential and non-essential metal concentrations in parasite
species and the environmental and host muscle and liver concentrations
The Spearman’s correlation coefficient for all metals in all parasite species in relation to their
environment the host muscle and liver tissue concentrations as well as to their hosts environment
the water and sediment can be found in Table 4.5 and Table 4.6. The data suggest that for
essential metals, P. pseudolaeviconchus and Contracaecum sp. have a negative relationship with
corresponding water concentrations, whereas the correlations for Zn and Cu and Fe were
significant in these two species, respectively. The opposite is true for T. ciliotheca and Pa.
cyathopgharynx where parasite essential metal concentrations were positively correlated with
levels in the water and for Co significantly so in both species. For the non-essential metals,
P. pseudolaeviconchus and Contracaecum sp. had a negative relationship with corresponding
water concentrations, whereas the correlations for Cd and Mn in P. pseudolaeviconchus and Mn
and Se in Contracaecum sp was significantly positive. Tetracampos ciliotheca had positive
correlations for Cd and Ag, while Pa. cyathopgharynx had positive correlations for As, Pb and Se
but a negative correlation for Ag.
The essential metals in P. pseudolaeviconchus, T. ciliotheca, Pa. cyathopgharynx and
Contracaecum sp. had a positive relationship corresponding with the sediment. Procamallanus
pseudolaeviconchus had correlations with Co; T. ciliotheca had positive correlations for both Fe;
and Ni; Pa. cyathopgharynx had a positive correlation for Ni; and Contracaecum sp. had positive
correlations for both Co and Zn. The non-essential metals P. pseudolaeviconchus, T. ciliotheca,
Pa. cyathopgharynx and Contracaecum sp. had positive relationships with the corresponding
sediment, and the negative correlations were between T. ciliotheca and the sediment for Ag. P.
pseudolaeviconchus had positive correlations for Cd and Pb; T. ciliotheca had positive
correlations with As, Cd and Pb; Pa. cyathopgharynx had positive correlations for both Se and Ag
and Contracaecum sp. only had a positive correlation for Se. The correlation of the concentration
of essential and non-essential metals in the four different parasites and their concentrations in
both the host muscle and liver tissue showed some significance (Table 4.6).
The essential metals only had significantly negative correlations between the parasites and the
host muscle tissue. Tetracampos ciliotheca had a negative correlation for Ni, and Pa.
cyathopgharynx had negative correlations for both Fe and Zn. Procamallanus
84
pseudolaeviconchus and Contracaecum sp. had no significant correlations between their
concentration of essential metals and the concentration in the host muscle tissue. The essential
metals in P. pseudolaeviconchus and Contracaecum sp. had no significant relationships with their
corresponding muscle tissue, while T. ciliotheca and Camallanus sp. had a negative relationship
with the corresponding muscle tissue. Tetracampos ciliotheca had a negative correlation for Ni,
and Pa. cyathopgharynx for Fe and Zn.
The non-essential metals in P. pseudolaeviconchus and Contracaecum sp. had positive
relationships with their corresponding muscle tissue. Sellenium in P. pseudolaeviconchus and As,
Cd and Pb in Contracaecum sp., Paracamallanus cyathopgharynx and Contracaecum sp. had
negative relationship with corresponding muscle tissue. Cadmium, Mn and Pb in Pa.
cyathopgharynx and Mn in Contracaecum sp. had negative correlations with the muscle tissue of
the hosts. The essential metals, Ni and Co respectively, in T. ciliotheca and Contracaecum sp.
had negative relationships with the concentration in their corresponding host liver tissues. The
non-essential metals, Cd and Pb respectively, in P. pseudolaeviconchus and Contracaecum sp.
had positive relationships with that in the corresponding liver tissue.
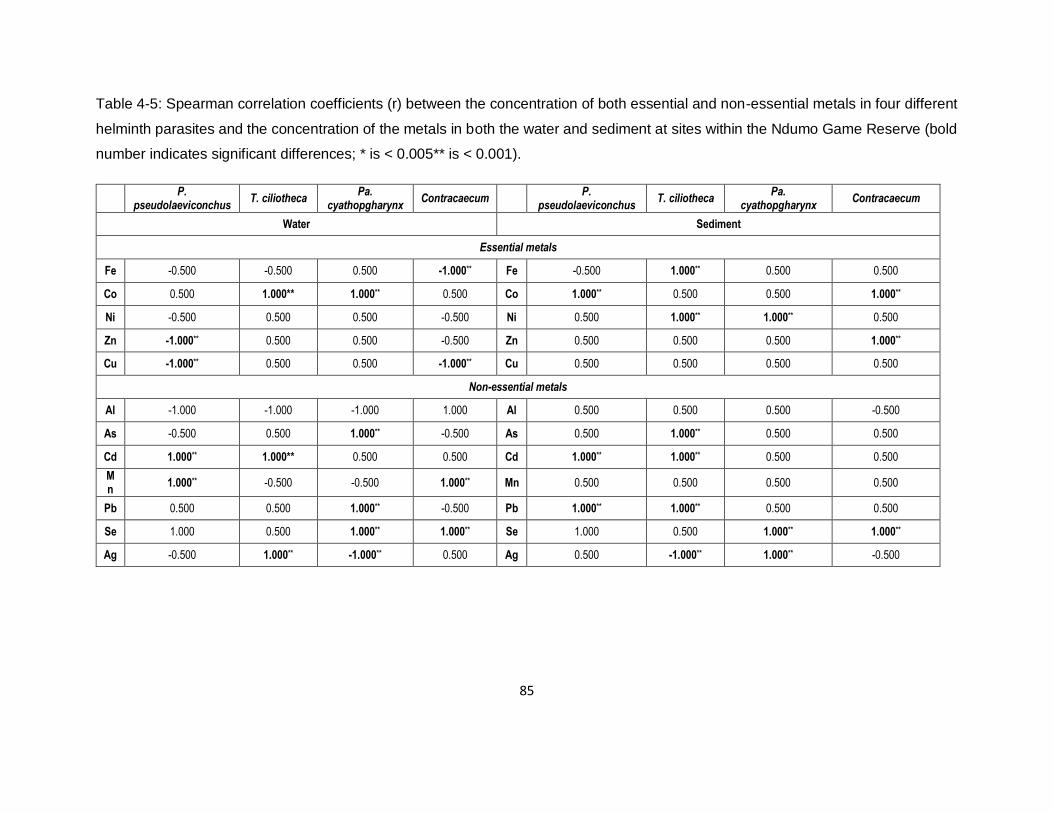
85
Table 4-5: Spearman correlation coefficients (r) between the concentration of both essential and non-essential metals in four different
helminth parasites and the concentration of the metals in both the water and sediment at sites within the Ndumo Game Reserve (bold
number indicates significant differences; * is < 0.005** is < 0.001).
P.
pseudolaeviconchus T. ciliotheca
Pa. cyathopgharynx
Contracaecum P.
pseudolaeviconchus T. ciliotheca
Pa. cyathopgharynx
Contracaecum
Water Sediment
Essential metals
Fe -0.500 -0.500 0.500 -1.000** Fe -0.500 1.000** 0.500 0.500
Co 0.500 1.000** 1.000** 0.500 Co 1.000** 0.500 0.500 1.000**
Ni -0.500 0.500 0.500 -0.500 Ni 0.500 1.000** 1.000** 0.500
Zn -1.000** 0.500 0.500 -0.500 Zn 0.500 0.500 0.500 1.000**
Cu -1.000** 0.500 0.500 -1.000** Cu 0.500 0.500 0.500 0.500
Non-essential metals
Al -1.000 -1.000 -1.000 1.000 Al 0.500 0.500 0.500 -0.500
As -0.500 0.500 1.000** -0.500 As 0.500 1.000** 0.500 0.500
Cd 1.000** 1.000** 0.500 0.500 Cd 1.000** 1.000** 0.500 0.500
Mn
1.000** -0.500 -0.500 1.000** Mn 0.500 0.500 0.500 0.500
Pb 0.500 0.500 1.000** -0.500 Pb 1.000** 1.000** 0.500 0.500
Se 1.000 0.500 1.000** 1.000** Se 1.000 0.500 1.000** 1.000**
Ag -0.500 1.000** -1.000** 0.500 Ag 0.500 -1.000** 1.000** -0.500
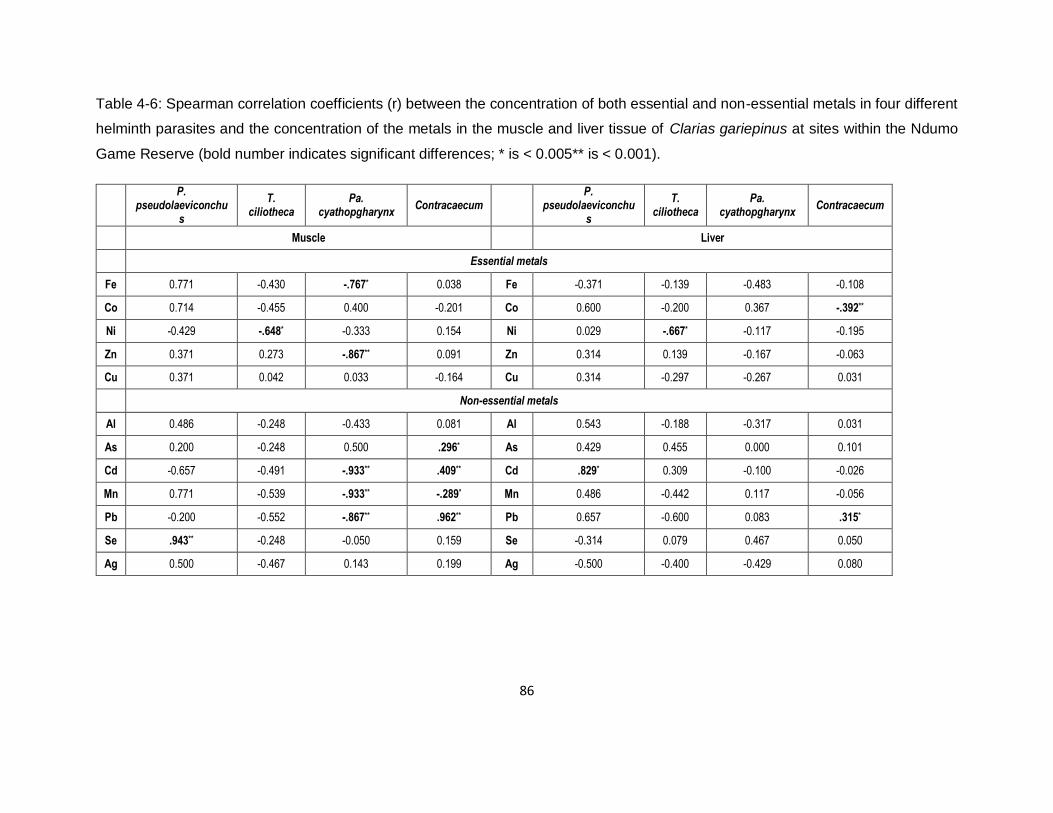
86
Table 4-6: Spearman correlation coefficients (r) between the concentration of both essential and non-essential metals in four different
helminth parasites and the concentration of the metals in the muscle and liver tissue of Clarias gariepinus at sites within the Ndumo
Game Reserve (bold number indicates significant differences; * is < 0.005** is < 0.001).
P.
pseudolaeviconchus
T. ciliotheca
Pa. cyathopgharynx
Contracaecum P.
pseudolaeviconchus
T. ciliotheca
Pa. cyathopgharynx
Contracaecum
Muscle Liver
Essential metals
Fe 0.771 -0.430 -.767* 0.038 Fe -0.371 -0.139 -0.483 -0.108
Co 0.714 -0.455 0.400 -0.201 Co 0.600 -0.200 0.367 -.392**
Ni -0.429 -.648* -0.333 0.154 Ni 0.029 -.667* -0.117 -0.195
Zn 0.371 0.273 -.867** 0.091 Zn 0.314 0.139 -0.167 -0.063
Cu 0.371 0.042 0.033 -0.164 Cu 0.314 -0.297 -0.267 0.031
Non-essential metals
Al 0.486 -0.248 -0.433 0.081 Al 0.543 -0.188 -0.317 0.031
As 0.200 -0.248 0.500 .296* As 0.429 0.455 0.000 0.101
Cd -0.657 -0.491 -.933** .409** Cd .829* 0.309 -0.100 -0.026
Mn 0.771 -0.539 -.933** -.289* Mn 0.486 -0.442 0.117 -0.056
Pb -0.200 -0.552 -.867** .962** Pb 0.657 -0.600 0.083 .315*
Se .943** -0.248 -0.050 0.159 Se -0.314 0.079 0.467 0.050
Ag 0.500 -0.467 0.143 0.199 Ag -0.500 -0.400 -0.429 0.080
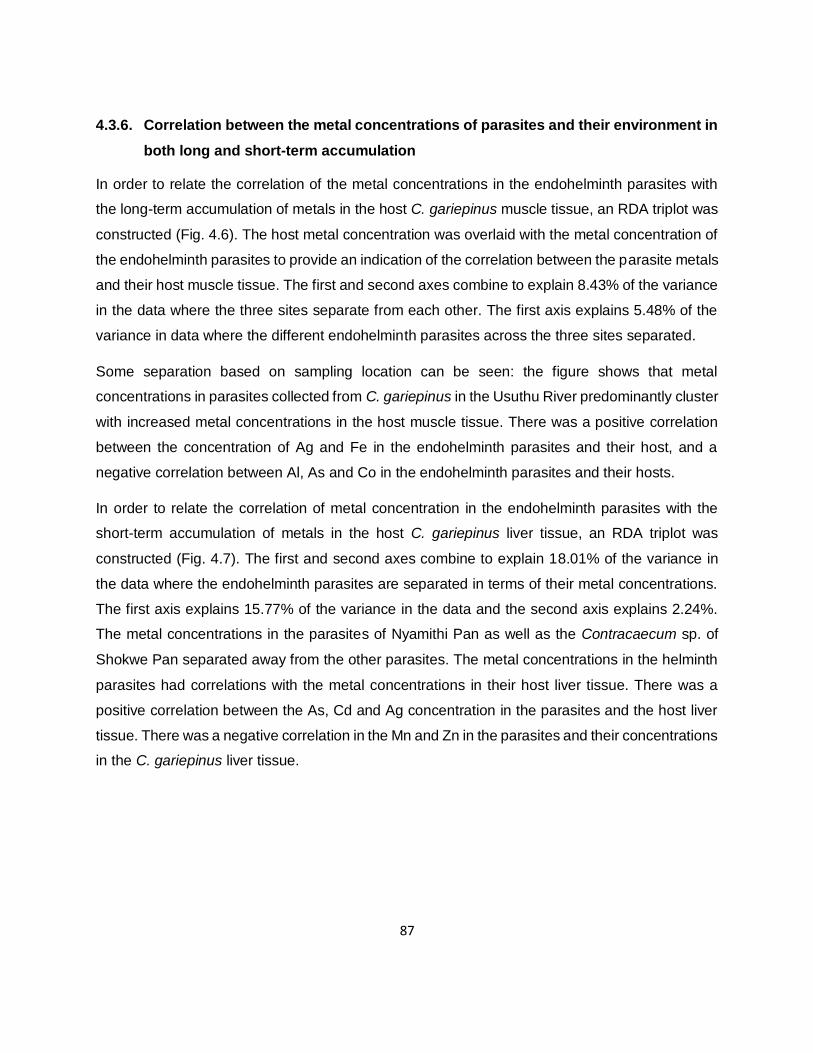
87
4.3.6. Correlation between the metal concentrations of parasites and their environment in
both long and short-term accumulation
In order to relate the correlation of the metal concentrations in the endohelminth parasites with
the long-term accumulation of metals in the host C. gariepinus muscle tissue, an RDA triplot was
constructed (Fig. 4.6). The host metal concentration was overlaid with the metal concentration of
the endohelminth parasites to provide an indication of the correlation between the parasite metals
and their host muscle tissue. The first and second axes combine to explain 8.43% of the variance
in the data where the three sites separate from each other. The first axis explains 5.48% of the
variance in data where the different endohelminth parasites across the three sites separated.
Some separation based on sampling location can be seen: the figure shows that metal
concentrations in parasites collected from C. gariepinus in the Usuthu River predominantly cluster
with increased metal concentrations in the host muscle tissue. There was a positive correlation
between the concentration of Ag and Fe in the endohelminth parasites and their host, and a
negative correlation between Al, As and Co in the endohelminth parasites and their hosts.
In order to relate the correlation of metal concentration in the endohelminth parasites with the
short-term accumulation of metals in the host C. gariepinus liver tissue, an RDA triplot was
constructed (Fig. 4.7). The first and second axes combine to explain 18.01% of the variance in
the data where the endohelminth parasites are separated in terms of their metal concentrations.
The first axis explains 15.77% of the variance in the data and the second axis explains 2.24%.
The metal concentrations in the parasites of Nyamithi Pan as well as the Contracaecum sp. of
Shokwe Pan separated away from the other parasites. The metal concentrations in the helminth
parasites had correlations with the metal concentrations in their host liver tissue. There was a
positive correlation between the As, Cd and Ag concentration in the parasites and the host liver
tissue. There was a negative correlation in the Mn and Zn in the parasites and their concentrations
in the C. gariepinus liver tissue.
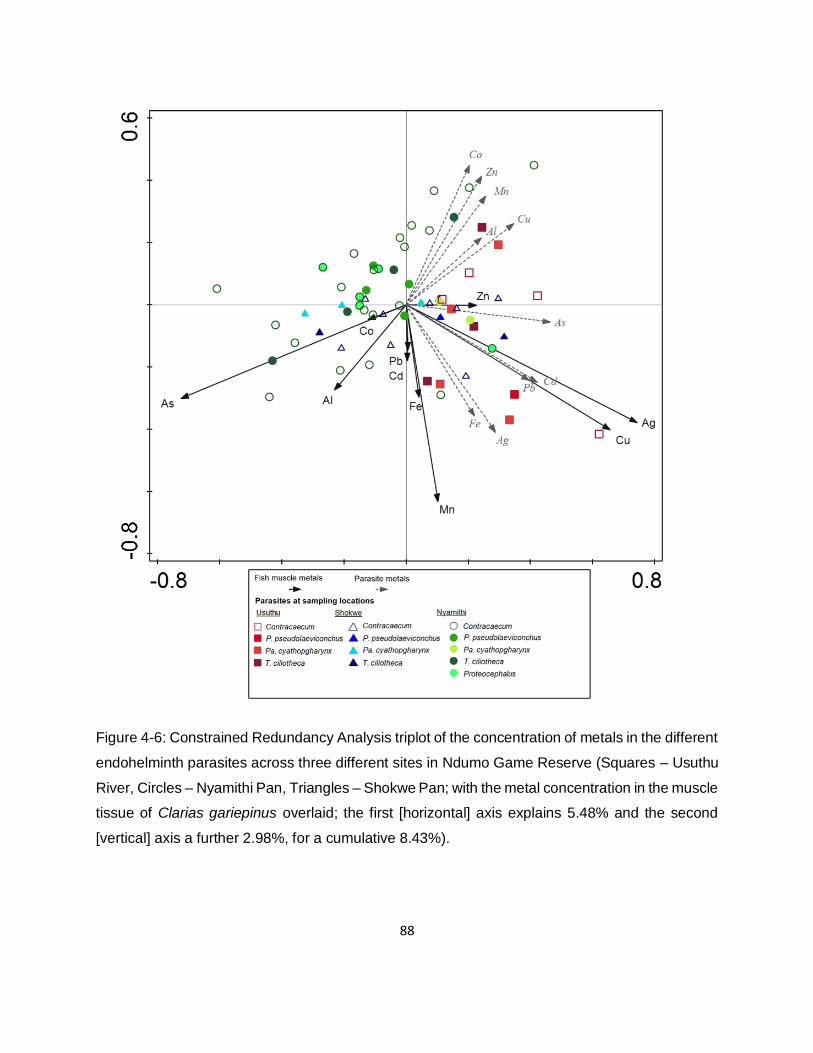
88
Figure 4-6: Constrained Redundancy Analysis triplot of the concentration of metals in the different
endohelminth parasites across three different sites in Ndumo Game Reserve (Squares – Usuthu
River, Circles – Nyamithi Pan, Triangles – Shokwe Pan; with the metal concentration in the muscle
tissue of Clarias gariepinus overlaid; the first [horizontal] axis explains 5.48% and the second
[vertical] axis a further 2.98%, for a cumulative 8.43%).
89
Figure 4-7: Constrained Redundancy Analysis triplot of the concentration of metals in the different
endohelminth parasites across three different sites in Ndumo Game Reserve (Squares – Usuthu
River, Circles – Nyamithi Pan, Triangles – Shokwe Pan; with the metal concentration in the liver
tissue of Clarias gariepinus overlaid; the first [horizontal] axis explains 15.77% and the second
[vertical] axis a further 2.24%, for a cumulative 18.01%).
4.4. Discussion
This chapter focused on the accumulation of metals in different endohelminth parasites located
in different parts of their host C. gariepinus. The metal concentration found in the different
endohelminth parasites was compared firstly with the metal concentrations in the environment of
the C. gariepinus (chapter 3 section 3.3) and secondly the concentrations in their ecosystem
(Chapter 2 section 2.3).
The Clarias gariepinus in the Ndumo Game Reserve area were infected with five different
helminth parasites that consisted of three species of nematodes (Contracaecum sp.,
P. pseudolaeviconchus and Pa. cyathopgharynx) and two species of cestodes (Proteocephalus
sp. and T. ciliotheca). The high prevalence and abundance of parasites in Nyamithi Pan are most
likely due to the fact that Nyamithi Pan is a permanent pan with high numbers of intermediate
90
hosts (copepods) (Smit et al., 2016). A permanent pan has water throughout the wet and dry
seasons and thus the intermediate hosts can multiply to higher levels than in temporary pans
(Williams & Bunkley-Williams, 2019). The low number of parasites in the lotic system of Usuthu
River is possibly because catfish is not confined to a small space and can move around, making
infections difficult. In order for the endohelminth parasites in the study to complete their life cycles
water birds act as definitive hosts; thus if there is no water the lifecycle cannot be completed in
temporary pans (Garbin et al., 2019).
Procamallanus pseudolaeviconchus across the three sites had a similar prevalence than in
previous studies (Mashego, 1981, Boomker, 1982, Boomker, 1994). Moravec (1975) stated that
P. pseudolaeviconchus was a widespread parasite in African freshwater fishes and was found in
the stomach of their hosts. Previous studies found a lower prevalence of Pa. cyathopgharynx in
C. gariepinus than present in this study (Boomker, 1982, Mashego, 1989, Boomker, 1994, Gulelat
et al., 2013). The prevalence of Contracaecum sp. was similar to prevalence found by Mashego
(1989) who found a prevalence ranging from 10 to 100% across nine sites, with five sites having
a prevalence between 65 and 78%. The Contracaecum sp. was located in the body cavity of their
hosts. All the nematodes have copepods as intermediate hosts and their abundance is directly
related to the abundance of copepods present in the ecosystem.
The prevalence of the cestodes (Proteocephalus sp. and T. ciliotheca) was very similar to the
prevalence found by Madanire-Moyo and Avenant-Oldewage (2013) in C. gariepinus of the Vaal
Dam. The study found that out of the 12 metals analysed all, except As and Se, were found at
higher levels than in their hosts. However, there was a difference in the range of accumulation
between the different parasites. The first nematode species was Contracaecum sp. located in the
body cavity of its hosts. The study found similar concentrations of metal than Otachi et al. (2014)
found in Contracaecum sp. from Oreochromis leucostictus from Lake Naivasha in Kenya. The
Contracaecum sp. were found to accumulate metals at higher levels than their host muscle tissue,
but lower than the other helminth parasites. This is believed to be because of the location of the
Contracaecum sp. in the body cavity of their hosts and the feeding mechanisms being used
(Otachi et al., 2014). Contracaecum sp. feed on the blood and tissue of their hosts and do not
absorb nutrients through their skin (Otachi et al., 2014).
The second nematode P. pseudolaeviconchus is located in the stomach of its host. The only
previous study conducted on P. pseudolaeviconchus as a bioaccumulator of metal was that of
91
Akinsanya and Kuton (2016). They found that the P. pseudolaeviconchus of Synodontis clarias in
the Lekki Lagoon in Nigeria accumulated Fe (BAF = 1.37) and Pb (BAF = 23.167) at high levels.
In this study it is evident that along with those two metals P. pseudolaeviconchus accumulated
most metals at higher levels than their hosts. The last nematode Pa. cyathopgharynx is located
in the rectum of its hosts. No previous studies have been conducted on Pa. cyathopgharynx as
bioaccumulator of metals. In this study we found that Pa. cyathopgharynx had similar
accumulation rates than P. pseudolaeviconchus. As the Pa. cyathopgharynx is located in the
rectum of its hosts, it is located on the opposite side of the intestinal tract than P.
pseudolaeviconchus. This shows that the position in the intestinal tract does not play a major role
in helminth parasites’ ability to accumulate metals.
Two different species of cestodes (Proteocephalus sp., T. ciliotheca) were analysed in this study
and it was found that T. ciliotheca had the best bioaccumulation rate. Cestodes absorb nutrients
and pollutants through their tegument and membranes (Izvekova et al., 1997). The cestodes in
this study showed bioaccumulation of both Ag and Co at levels not yet recorded in any previous
studies. In this study we found that the cestode T. ciliotheca had the highest bioaccumulation
ability that is consistent with previous studies (Sures et al., 2017). It can however be seen that
the cestode, Proteocephalus sp., had the lowest bioaccumulation ability. This consequently
illustrates that different species of cestodes have different abilities to accumulate metals and that
not all cestodes will be good bio-indicators of metals.
It was also found that the nematode species P. pseudolaeviconchus and Pa. cyathopgharynx
proved to be adequate species to be bio-indicator species of metal pollution. The study found
significant correlations between the concentrations of essential and non-essential metals in the
different parasites and in the environment. The essential metals in the water had a predominantly
negative correlation, with only Co having positive correlations with T. ciliotheca and Pa.
cyathopgharynx. It is possible that when the concentrations of essential metals are low in the
environment the parasite will store the essential metals in their tissue. The non-essential metals
had positive correlations between the environmental concentrations and the parasite
concentrations. This is because parasites cannot use non-essential metals, which in turn
accumulate in the parasites. The essential metal concentrations in the sediment had positive
correlations with the concentrations in the different parasites.
92
The different helminth parasites showed negative correlations for the essential metals in both the
host muscle and liver tissues. This is because of the competition between the parasite and their
hosts for the essential metals (Sures, 2002). These results are supported by the results found by
many previous studies (Szefer et al., 1998, Sures, 2002, Oyoo‐Okoth et al., 2010). For the non-
essential metals Contracaecum sp. had significantly positive correlations with As, Cd and Pb in
the muscle tissue which is in line with the results of Leite et al. (2017) where Contracaecum sp.
parasitised Acestrorhynchus lacustris. Procamallanus pseudolaeviconchus had a positive
correlation for Se and the host muscle tissue that was in line with the findings of Morris et al.
(2016).
There was a significant negative correlation between the concentration of Cd, Mn and Pb in
Pa. cyathopgharynx and their concentration in the host muscle tissue.
Procamallanus pseudolaeviconchus had a positive correlation for Cd compared to the liver
concentrations. This is supported by a study done by Thielen et al. (2004) on Pomphorhynchus
laevis in barbel, who found that P. laevis bioaccumulate Cd at higher levels than in their host liver
tissue. Contracaecum sp. had a positive correlation for Pb in the liver tissue of their hosts.
Correlation analyses in this study showed some associations between the metal concentrations
in the host tissue and the abundance of helminth parasites. For essential metals it was found that
no significant correlations were found for Fe and Ni, which can be due to the abundance of Fe
and Ni found in the environment (Chapter 2 section 2.3) being enough to support both host and
parasites. The same results were found by Oyoo-Okoth et al. (2010) through the metal partitioning
in cestode Ligula intestinalis in Rastrineobola argentea. Most significant correlations were found
to be between the liver tissue of the host and the abundance of parasites.
There was a negative correlation between the catfish liver and number of parasites for Co for both
P. pseudolaeviconchus and Contracaecum sp. The same negative correlation for Co was found
by Sures (2002) between Acanthocephalus lucii and their host Perca fluviatilis and Thielen et al.
(2004) between Pomphorhynchus laevis and their host barbel as well as Oyoo-Okoth et al. (2010)
between Ligula intestinalis and their host Rastrineobola argentea. This negative correlation is
believed to be due to competition between host and parasites for the essential element Co (Sures,
2002, Thielen et al., 2004, Oyoo‐Okoth et al., 2010). The positive correlation between the Zn
concentration of T. ciliotheca in the muscle and Pa. cyathopgharynx in the liver is supported by
the findings of Oyoo‐Okoth et al. (2010) and Oyoo-Okoth et al. (2012) who found the same
93
correlations of Zn between Ligula intestinalis and their host Rastrineobola argentea. Parasites
absorb binding proteins from their hosts, which in turn mess with the detoxification of some metals
in the host, that can lead to higher levels of Zn in the host (Oyoo-Okoth et al., 2012).
Copper had significantly negative correlations for both T. ciliotheca and Contracaecum sp.
between the concentration in the liver and number of parasites. This result is supported by findings
from Alonso et al. (2004) and Jankovská et al. (2012) who found a negative correlation between
Moniezia expansa and their host sheep. Paracamallanus cyathopgharynx had a positive
correlation for Cu between the liver and number of parasites. All the non-essential metals in this
study showed significant correlations for at least one parasite. Aluminium showed a positive
correlation between concentration in the muscle tissue of the host and the number of P.
pseudolaeviconchus, and a negative correlation between concentration in the liver and the
number of Contracaecum sp. Paracamallanus cyathopgharynx had a positive correlation between
the concentration of Mn in the host muscle tissue and the number of parasites. These findings
are supported by Thielen et al. (2004) who found a positive correlation between Pomphorhynchus
laevis and their host barbel in that both Mg and Mn positively correlate with the concentration in
the muscle tissue.
4.5. Conclusion
This study is one of the first studies to focus on the metal accumulation in different parasite
species at different aquatic ecosystems. This study found that the different aquatic systems of
NGR had different parasite loads, and that the type of aquatic system played a role in the
bioaccumulation of metals by the parasites. The study also found that that there was no gradient
present for metal accumulation through the intestinal tract. The first hypothesis stated that the
parasites in the intestines would have higher accumulation rates for metals than the
Contracaecum sp. in the body cavity due to the higher concentration of metals in the intestinal
tract. This hypothesis was accepted because Contracaecum sp. had the lowest BAF of all the
endohelminth parasites.
The second hypothesis stated that there would be a gradient of metal accumulation in the
endohelminth parasites with the highest being in the parasites in the stomach due to the low pH
making metals more bio-available than in the rectum of the host. This hypothesis was rejected as
the study found that the position in the intestinal tract did not play a significant role in the
94
bioaccumulation ability of the parasites, with the Pa. cyathopgharynx having similar BAF than the
P. pseudolaeviconchus. Now that the accumulation of metals from the environment into C.
gariepinus and then into their endohelminth parasites have been established, the next chapter of
this dissertation focuses on the biological responses of C. gariepinus to metal exposure as well
as determine if endohelminth parasites have an effect on the biological responses of their hosts.
95
5. Host-parasite systems: interactions of parasite load,
biomarkers of exposure and biomarkers of effect
5.1. Introduction
The increase of anthropogenic stress on aquatic ecosystems can have adverse effects (acute or
chronic) on the well-being of organisms in aquatic ecosystems (Adams & Greeley, 2000, Van der
Oost et al., 2003, Palma et al., 2015, Gerber et al., 2018). The presence of pollutants such as
metals and organochlorine pesticides in aquatic ecosystems does not in itself indicate detrimental
effects on organisms (Van der Oost et al., 2003). According to Sevcikova et al. (2011) metals are
an important contaminant because they accumulate in aquatic organisms. It is thus of utmost
importance to make a connection between levels of exposure and internal effects (Van der Oost
et al., 2003). Van der Oost et al. (2003) state that the detrimental effect of pollution of organisms
is difficult to detect, because the effects only manifest after long periods of time. Bucheli and Fent
(1995) state that these early warning indicators were established and called biomarkers.
The term biomarker is derived from “biological markers” (Strimbu & Tavel, 2010). Biomarkers
have many definitions; the definition used in this chapter is the definition of Shugart et al. (1992)
who state that a biomarker is a cellular or biochemical response to a chemical or anthropogenic
stress in an organism that can be measured. Biomarkers can therefore be used to determine the
biological responses of organisms to metals that are accumulated in the organisms from the
environment (Wepener et al., 2011, Sures et al., 2015, Gerber et al., 2018).
Previous studies have successfully measured the response of Clarias gariepinus to pollutant
exposures (Farombi et al., 2007, Du Preez & Wepener, 2016). Since the early 2000s numerous
studies have focused on the effect of parasites on the biological response of their hosts to pollution
(Morley et al., 2006, Sures, 2006, 2008, Morley, 2010). For example, in a study of Sanchez et al.
(2016) it was demonstrated that parasites cause an increase in resistance to arsenic in their hosts.
Freshwater clams with digenean trematodes were less affected by pentachlorophenol and had
lower mortalities than uninfected clams (Heinonen et al., 2001). Chen et al. (2015) found that
gammarids infected with acanthocephalans had higher levels of glycogen.
Biomarkers are often divided into biomarkers of exposure and biomarkers of effect (Shugart et
al., 1992, Van der Oost et al., 2003). A biomarker of exposure is defined as the detection and
96
quantification of an external substance, its metabolite or the product of an interaction between
organism cells and a xenobiotic that can be quantified (Van der Oost et al., 2003). The biomarker
of exposure chosen for this study is the metal concentrations in C. gariepinus and the
endohelminth parasites. In this study we found that C. gariepinus have bioaccumulated metals to
much higher levels than the metals in the environment (Chapter 3). The study also found that the
different endohelminth parasites bioaccumulate metals to even higher levels than their hosts
(Chapter 4).
Biomarkers of effect are defined as the potential health impairment caused by toxicants that can
be measured as physiological, biochemical or other changes in an organism (Van der Oost et al.,
2003). The biomarkers of effect chosen for this study are the effect of the endohelminth parasites
infection on their hosts (infected vs. uninfected).
According to Marcogliese and Pietrock (2011), parasites are natural stressors for their hosts and
have negative impacts on their hosts. Sindermann (1987) states that parasites can have lethal
and sub-lethal effects on their hosts. The lethal effects of parasites only occur at enormously high
infection rates. Sub-lethal effects of parasites include but are not limited to disruption of organ
functions, growth impairment, skeletal deformation, deficiencies in nutrients, reproductive failure
and cardiac problems (Sindermann, 1987).
Although it is a fact that parasites have negative effects on their hosts, there are some
contradictory cases where parasites are reported to have positive effects on their hosts (Sures et
al., 2017). Sures et al. (2017) state that theoretically you would expect a lesser amount of effects
of pollution on an organism if concentrations of pollutants in an organism are reduced by
parasites. Endohelminth parasites accumulate metals to higher concentrations than their hosts
(Sures et al., 2017).
Previous studies found that parasites had an effect on biomarkers of effect responses such as on
the synthesis of metallothioneins (MTs) in the host organism (Baudrimont et al., 2006, Baudrimont
& De Montaudouin, 2007). Metallothioneins (MTs), the non-enzymatic reduced glutathione (GSH)
and cellular energy allocation (CEA) of the host can be impacted by parasite infections. According
to Mijošek et al. (2019) the main role of the protein, MT, is to regulate essential metals and detoxify
non-essential metals. Metallothioneins bind to multiple metals and thus, in a polluted system (with
a mixture of metals), it is impossible to connect an increase in MTs to a specific element (Mijošek
et al., 2019). Although you cannot connect MTs to a specific element, the MTs will still be induced
97
by an increase in metals in the environment; thus MTs can be used as an early indicator of metal
pollution.
The function of GSH is to synthesise proteins and DNA, help with amino acid transport as well as
defend against oxidising and potentially harmful metals (Atli & Canli, 2007). Reduced glutathione’s
key role is to assist in the detoxification of xenobiotics in an organism and it can thus be an
effective biomarker (Van der Oost et al., 2003). Many previous studies have used GSH to
determine the oxidative stress of fish to metal concentrations (Farombi et al., 2007, Doherty et
al., 2010, Otitoloju & Olagoke, 2011, Saliu & Bawa-Allah, 2012). These studies found that the
GSH levels in organisms increase with an increase in metal accumulation.
The CEA is an indicator of the energy utilisation of cells in stress-induced conditions (Smolders
et al., 2004, Gerber et al., 2018). Previous studies found that the CEA of an organism decreases
significantly under high environmental stress (De Coen & Janssen, 2003, Moolman et al., 2007,
Wang et al., 2012), and also found that an increase in metal pollution causes a decrease in cellular
energy budget of fish (Smolders et al., 2003, Smolders et al., 2004, Moolman et al., 2007, Gerber
et al., 2018, Louis et al., 2019)
The aim of this chapter is to determine the biological responses (CEA, MTs and GSH) to metal
concentrations in both C. gariepinus and their associated endohelminth parasites, and to evaluate
the possible positive effect of an increase in endohelminth parasite numbers on the biological
responses to metal accumulation of their hosts. It was hypothesised that an increase in
endohelminth parasite numbers would alleviate the body burdens of metals in the hosts thereby
resulting in less stress experienced by the hosts to detoxify and remove metals from their organs.
5.2. Materials and methods
5.2.1. Sampling
Approximately 1 g of the muscle and liver tissues from the catfish used in chapter 3 was dissected
and placed in polypropylene tubes and frozen, the frozen samples were transported back to the
laboratory and stored at -80˚C in a freezer. The endohelminth parasite infection rates in this study
were not high enough to have enough sample mass to determine both the metal accumulation
(Chapter 4) as well as the biological responses. Only the Contracaecum sp. at Nyamithi Pan had
98
enough sampled mass per individual host to determine the three biological responses of the study
and Shokwe Pan had enough Contracaecum sp. to determine their CEA.
5.2.2. Biomarker of exposure
The metal concentrations in C. gariepinus was determined in Chapter 3 sections 3.2.2 and 3.2.3
and the metal concentrations in the endohelminth parasites were determined in Chapter 4
sections 4.2.1 to 4.2.3 by using standard ICP-MS analysis.
5.2.3. Tissue preparation for biomarkers of effect
Samples were taken out of the -80˚C freezer and allowed to defrost on ice; approximately 0.2 g
of either catfish liver or whole Contracaecum sp. samples were placed in Eppendorf tubes labelled
A and B, for GSH and MT analysis, respectively; a further 0.2 g of the Contracaecum sp. and
catfish muscle tissue were placed in Eppendorf tubes labelled C and D, respectively. All samples
were homogenised on ice using the Velp Scientifica™ OV5 homogeniser and centrifuged using
the Lasec HERMLE Z32 HK centrifuge.
Eppendorf A was homogenised in 2000 µL of General Homogenising Buffer (GHB) (made up of
0.1 M potassium phosphate buffer (pH 7.4), KCl, 0.001 M ethylene diamine tetraacetate (EDTA),
0.0001 M phenylmethanesulfonyl fluoride solution and 20% glycerol) and centrifuged at 5590 G
for 10 minutes at 4˚C and 50 µL of the supernatant taken for GSH analysis.
Eppendorf B was homogenised in 1000 µL Homogenising Buffer (made up of Tris buffer with
0.006 mM leupeptine, 0.0005 M phenylmethylsulphynolflouride and 0.01% b-mercaptoethanol),
and then centrifuged at 30 000 G and the supernatant used for MT analysis.
Eppendorf C was homogenised in 1000 µL deionised water and Eppendorf D in 1000 µL ETS
Homogenising Buffer (made up of 0.1 M Tris-HCl (pH 8.5), 0.2% (v/v) Triton X-100, 15% (w/v)
polyvinylpyrrolidone and 153 µM magnesium sulfate (MgSO4); both were centrifuged at 2938 G
for 10 minutes and the supernatant used for the different analyses. Supernatant for Eppendorf C
was divided into protein, lipid and glycogen analysis, and the supernatant of Eppendorf D was
used for the determination of the electron transport activity.
99
5.2.4. Biomarker of effect
To determine GSH, the method of Cohn and Lyle (1966) was followed, where 75 µL phosphoric
acid is added to 500 µL of sample in Eppendorf A and left on ice for 10 minutes to let proteins
precipitate. After incubation the samples were centrifuged at 500 G at 4˚C for 10 minutes. One
hundred µL of the supernatant was added to 1 mL of deionised water in a new Eppendorf tube
and mixed. Six µL of each sample was loaded onto a 96 well polyethylene microtiter plate in
triplicate and 232 µL sodium phosphate buffer and 12 µL o-phthalaldehyde was added and left to
incubate in the dark for 15 minutes at room temperature. The fluorescence was measured at 420
nm resulting from excitation at 350 nm on an analytical and diagnostic microplate reader. To
determine the protein concentrations of the supernatant the method described by Bradford (1976)
was used in the calculations.
The methodology of Viarengo et al. (1997) and Viarengo et al. (1999) was adapted using the
modifications by Atli and Canli (2008) and Fernandes et al. (2008) and was used to assess the
metallothionein (MT) content. Five hundred µL of supernatant was taken from Eppendorf B and
placed into a new sterile Eppendorf tube (2.5 mL). Five hundred µL of cold (4˚C) absolute ethanol
and 40 µL chloroform were added, vortexed and centrifuged at 2750 G at 4˚C for 10 minutes.
Afterwards, three volumes of cold absolute ethanol were added, vortexed and then stored at -
20˚C until a pellet formed. After pellet formation, the supernatant was decanted and the pellet
washed twice with 1 mL of washing buffer (87% ethanol, 1% chloroform, 12% homogenising
buffer) and then vortexed and centrifuged at 500 G at 4˚C for 20 minutes. The washed pellet was
dried using compressed air, and 300 µL of Tris-ethylene diamine tetraacetate (EDTA) were added
and vortexed. Fifteen µL of each of the samples were added to 96 well polyethylene microtiter
plates in triplicate along with 210 µL Ellman’s reagent. The microplate was incubated at room
temperature for 15 minutes. The absorbance was measured using a Berthold Tristar LB 941
Germany analytical and diagnostic microplate reader at 412 nm. Reduced glutathione (GSH)
stock solution was used to prepare a calibration curve. The standard curve was used to calculate
MT concentration in nM.mg-1 protein. To determine the protein concentrations of the supernatant
the method described by Bradford (1976) was used in the calculations.
5.2.5. Cellular energy allocation in muscle tissue
Eppendorf tubes labelled C and D were used to determine the CEA. The method used to calculate
the CEA was adapted from De Coen and Janssen (1997) and De Coen and Janssen (2003).
100
5.2.5.1. Energy available (Ea)
To determine the energy allocation available for organisms, one must determine the glycogen,
lipids and proteins present in the muscle tissue (Eppendorf C).
The glycogen was determined with a phenol-sulfuric microassay adapted from Rasouli et al.
(2014). Samples were prepared according to the method of Rasouli et al. (2015). Fifty milligrams
of muscle sample were placed in 2 mL Eppendorf tubes and 200 µL of 30% KOH added. The
Eppendorf tubes were then incubated in a water bath for 10 minutes at 95˚C. Samples were left
until room temperature was achieved and 275 µL ethanol was added. The samples were vortexed
and centrifuged for 10 minutes at 1700 G at room temperature. The supernatant was discarded,
and the pellet re-suspended in 2 mL deionised water. Fifty µL sample was added to a 2 mL
Eppendorf tube and 50 µL deionised water, 100 µL 6.5% phenol and 500 µL H2SO4 added. The
samples were vortexed and left for 30 minutes. The samples were then loaded in triplicate onto
96 well polyethylene microtiter plates and the absorbance measured at 492 nm, with glycogen
used as standard.
The total protein content was determined according to the method of Bradford (1976), where 5
µL of the homogenate was added to 245 µL Bradford reagent. It was left for 5 minutes and then
the absorbance measured at 595 nm using the microplate reader Tristar LB 941 from Berthold
technologies.
The total lipids were extracted using the method of Bligh and Dyer (1959). Two hundred and fifty
µL of homogenate was added to 500 µL of chloroform and vortexed. After the first vortex, 500 µL
methanol and 250 µL deionised water was added and vortexed again. The samples were then
centrifuged for 5 minutes at 3000 G (4˚C) using the Lasec HERMLE Z32 HK centrifuge. After
centrifugation 100 µL organic phase (bottom layer) was placed into glass tubes – one tube for
every sample and one extra blank tube that contained 100 µL chloroform. Five hundred µL H2SO4
was added to all the glass tubes and covered with foil. The tubes were then incubated at 200˚C
for 15 minutes in a MINILAB oven. After incubation, 1 mL deionised water was added and allowed
to cool. When the samples reached room temperature, they were placed in triplicate onto 96 well
polyethylene microtiter plates. The absorbance was measured by using an analytical and
diagnostic microplate reader at 360 nm.
101
5.2.5.2. Energy consumption (Ec)
The samples in Eppendorf D were used to determine the cellular respiration rate, also known as
energy consumption, by measuring the ETS activity. Twenty-five µL of the ETS homogenising
buffer was placed in triplicate at the beginning of the microplate as blanks. After centrifugations,
25 µL of the supernatant were taken and placed in triplicate onto a 96 well polyethylene microtiter
plate and 75 µL BSS (0.3% [v/v] Triton X-100) was added. Twenty-five µL of the NAD(P)H solution
was then added to the mixture, and the reaction started by adding 50 µL INT (p-
iodonitrotetrazolium violet/chloride). The mixture was then placed in the microplate reader and
the absorbance measured at 490 nm (20˚C) at one-minute intervals for a five-minute period. The
data were then used to construct a curve for each sample.
5.2.5.3. CEA calculations
The different Ea fractions for the individual organisms were transformed into energetic equivalents
by using the enthalpy of combustion (De Coen & Janssen, 1997). These values were as follows:
glycogen (17500 mJ.mg-1), proteins (24000 mJ.mg-1) and lipids (500 mJ.mg-1). The Ec was
determined by using the ETS data which used the theoretical stoichiometric relationship. The
relationship states that for each 2 µmol of formazan formed, 1 µmol of oxygen is consumed. The
quantity of oxygen consumed was transformed into an energy value by using the oxyenthalpic
equivalents that equals 484 kJ/mol O2. The total net energy budget was then determined using
the following equation derived from De Coen & Janssen, (1997):
CEA = Ea – Ec
Where: Ea = Eglycogen + Eproteins + Elipids
Ec = EETS
5.2.6. Statistical analysis
All data that was recorded was then analysed to determine the effect of metals on the biological
responses of C. gariepinus and its associated endohelminth parasites, and then to determine the
interaction between an increase in parasite numbers on the biological response of and metal
accumulation in their hosts. GraphPad Prism® 7 software was used to perform statistical analysis
on the biomarker responses and reported as mean ± 1 SEM (standard error of the mean).
102
Homogeneity was tested by using the Shapiro-Wilk test and if the data was found to be distributed
normally, a one-way ANOVA with Tukey post-hoc analysis was used. If the data was not
distributed normally, a Kruskal-Wallis followed by the Dunn’s multiple comparison test was
performed. Student T-test was performed where needed to calculate significant differences.
Significance was set at p < 0.05. Canoco version 5 (ter Braak & Smilauer, 2012) was used to form
a Redundancy Analysis (RDA) of the effect of metals’ concentrations on the biomarker response
of C. gariepinus and their associated endohelminth parasites and to determine the interaction of
an increase in parasites numbers on the biological response of their hosts. A Redundancy
Analysis (RDA) works on a linear response model that relates two variables to the sampling sites.
Placement of the variables indicates similarities between variables, with variables at ≤ 90˚
positively correlating and variables at > 90 negatively correlating.
5.3. Results
5.3.1. Biomarkers of effect
Endohelminth parasite infection had significant effect on some of the metal concentrations in both
the muscle and liver tissues of the host located in the lotic system of the Usuthu River (Table 5.1).
Where significant differences occurred the infected catfish always had higher metal
concentrations than the uninfected catfish. There were no significant differences in the essential
metal concentrations in the muscle tissue, and only T. ciliotheca had a significant effect on the Co
concentrations in the liver tissue with the infected catfish having higher concentrations. Only
P. pseudolaeviconchus showed significant differences in the concentration of metals in the
muscle tissue of the host with Al (p = 0.0183) and Ag (p = 0.033) being significantly higher in the
infected catfish (Table 5.1). In the liver tissue P. pseudolaeviconchus had a significant effect on
the Al (p = 0.0472), T. ciliotheca on Co (p = 0.0218) and Se (p = 0.0352), Pa. cyathopgharynx on
Mn (p = 0.0024) and Cd (p = 0.012) and Contracaecum sp. on Ag (p = 0.0284) (Table 5.1).
The endohelminth parasites had significant effect on some of the host metal concentrations in
both the muscle and liver tissues at Shokwe Pan (Table 5.2). In terms of the essential metals only
T. ciliotheca had a significant effect on the Co (p = 0.0211) in the muscle tissue of the host, and
Contracaecum sp. on the Fe (p = 0.0474) and Zn (p = 0.0171). For the non-essential metals there
were no significant differences in the muscle tissue of the host with only the Contracaecum sp.
having a significant effect for Cd (p = 0.0474) and Pb (p = 0.0474) on the liver concentrations of
103
C. gariepinus (Table 5.2). As all C. gariepinus at Nyamithi Pan were infected by Contracaecum
sp. no correlation between the metal concentrations in infected and uninfected catfish could be
made (Table 5.3). In terms of the concentrations of metals in the muscle tissue of the host there
were no significant differences in the concentration of essential metals between the infected and
uninfected catfish for all the endohelminth parasites.
The non-essential metals in the muscle showed the same trend as was observed at Usuthu River
and Shokwe Pan, with the infected C. gariepinus having higher concentrations of the metals
where significant differences occurred. Procamallanus pseudolaeviconchus had a significant
effect on the Co (p = 0.0333) concentrations in the liver tissue of C. gariepinus. Clarias gariepinus
infected with T. ciliotheca had significantly higher concentrations of Zn (p = 0.0369) in their liver
tissues than in the uninfected hosts. Paracamallanus cyathopgharynx had a significant effect on
the Ni (p = 0.0211) concentrations in the host at Nyamithi Pan.
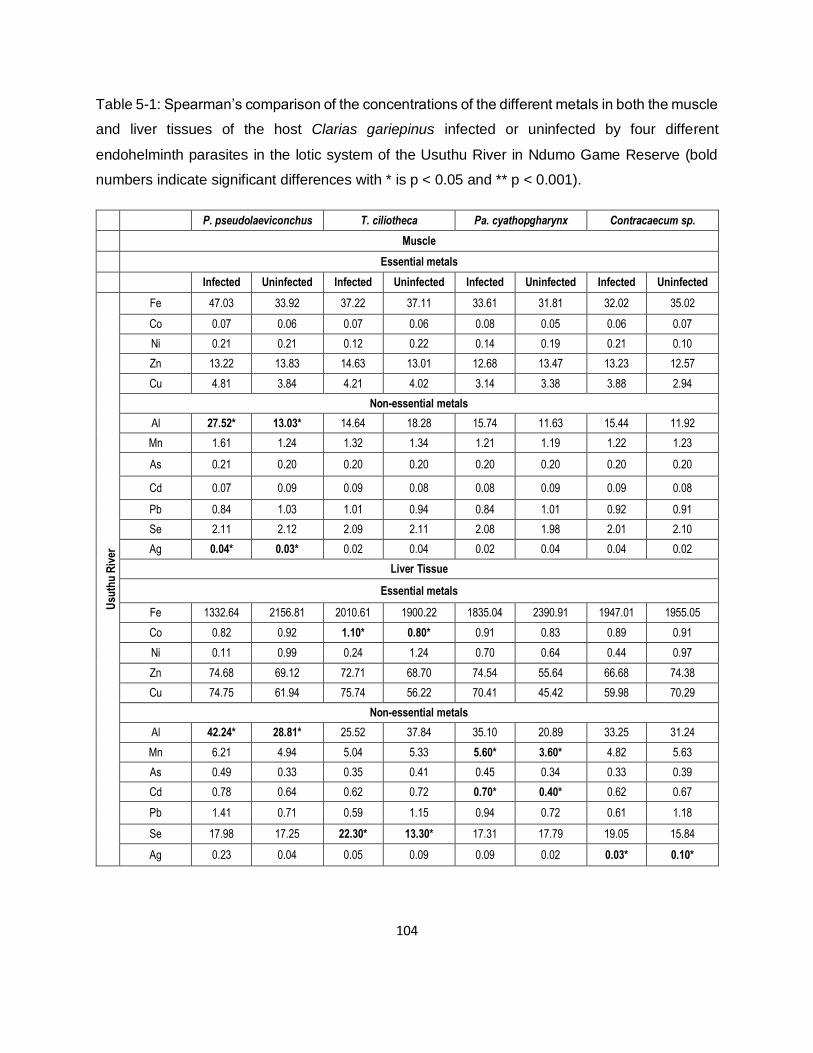
104
Table 5-1: Spearman’s comparison of the concentrations of the different metals in both the muscle
and liver tissues of the host Clarias gariepinus infected or uninfected by four different
endohelminth parasites in the lotic system of the Usuthu River in Ndumo Game Reserve (bold
numbers indicate significant differences with * is p < 0.05 and ** p < 0.001).
P. pseudolaeviconchus T. ciliotheca Pa. cyathopgharynx Contracaecum sp.
Muscle
Essential metals
Infected Uninfected Infected Uninfected Infected Uninfected Infected Uninfected
Usu
thu
Riv
er
Fe 47.03 33.92 37.22 37.11 33.61 31.81 32.02 35.02
Co 0.07 0.06 0.07 0.06 0.08 0.05 0.06 0.07
Ni 0.21 0.21 0.12 0.22 0.14 0.19 0.21 0.10
Zn 13.22 13.83 14.63 13.01 12.68 13.47 13.23 12.57
Cu 4.81 3.84 4.21 4.02 3.14 3.38 3.88 2.94
Non-essential metals
Al 27.52* 13.03* 14.64 18.28 15.74 11.63 15.44 11.92
Mn 1.61 1.24 1.32 1.34 1.21 1.19 1.22 1.23
As 0.21 0.20 0.20 0.20 0.20 0.20 0.20 0.20
Cd 0.07 0.09 0.09 0.08 0.08 0.09 0.09 0.08
Pb 0.84 1.03 1.01 0.94 0.84 1.01 0.92 0.91
Se 2.11 2.12 2.09 2.11 2.08 1.98 2.01 2.10
Ag 0.04* 0.03* 0.02 0.04 0.02 0.04 0.04 0.02
Liver Tissue
Essential metals
Fe 1332.64 2156.81 2010.61 1900.22 1835.04 2390.91 1947.01 1955.05
Co 0.82 0.92 1.10* 0.80* 0.91 0.83 0.89 0.91
Ni 0.11 0.99 0.24 1.24 0.70 0.64 0.44 0.97
Zn 74.68 69.12 72.71 68.70 74.54 55.64 66.68 74.38
Cu 74.75 61.94 75.74 56.22 70.41 45.42 59.98 70.29
Non-essential metals
Al 42.24* 28.81* 25.52 37.84 35.10 20.89 33.25 31.24
Mn 6.21 4.94 5.04 5.33 5.60* 3.60* 4.82 5.63
As 0.49 0.33 0.35 0.41 0.45 0.34 0.33 0.39
Cd 0.78 0.64 0.62 0.72 0.70* 0.40* 0.62 0.67
Pb 1.41 0.71 0.59 1.15 0.94 0.72 0.61 1.18
Se 17.98 17.25 22.30* 13.30* 17.31 17.79 19.05 15.84
Ag 0.23 0.04 0.05 0.09 0.09 0.02 0.03* 0.10*
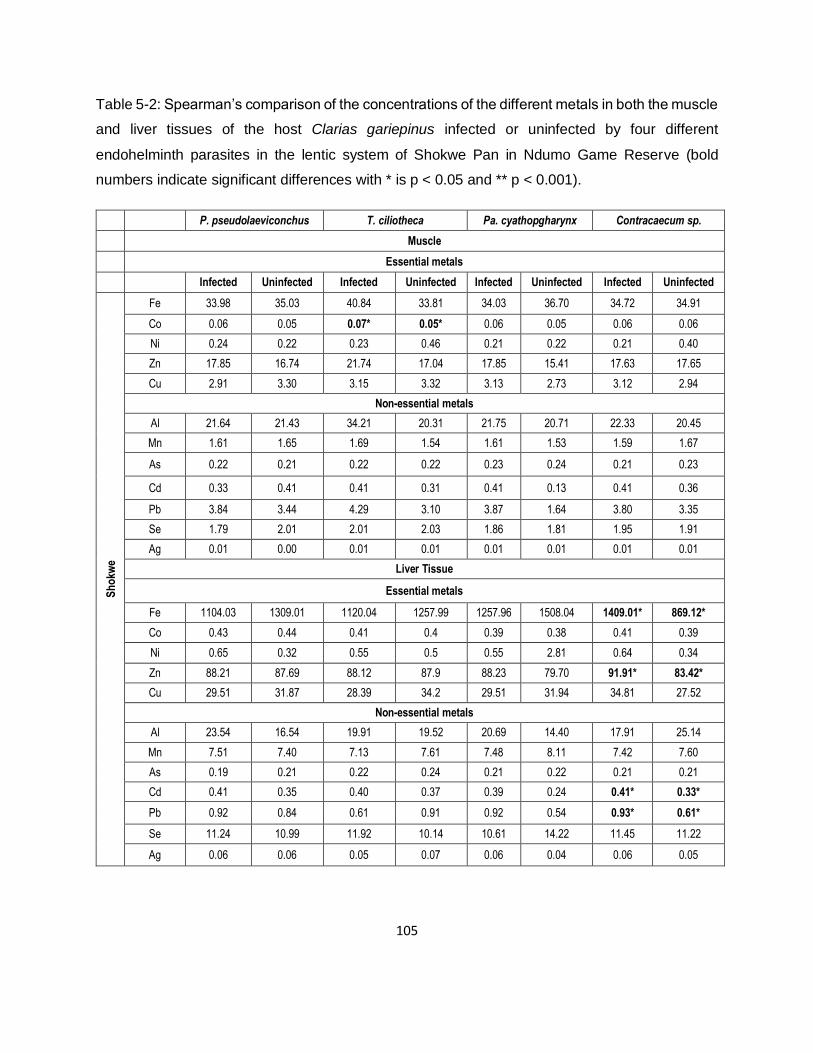
105
Table 5-2: Spearman’s comparison of the concentrations of the different metals in both the muscle
and liver tissues of the host Clarias gariepinus infected or uninfected by four different
endohelminth parasites in the lentic system of Shokwe Pan in Ndumo Game Reserve (bold
numbers indicate significant differences with * is p < 0.05 and ** p < 0.001).
P. pseudolaeviconchus T. ciliotheca Pa. cyathopgharynx Contracaecum sp.
Muscle
Essential metals
Infected Uninfected Infected Uninfected Infected Uninfected Infected Uninfected
Sh
okw
e
Fe 33.98 35.03 40.84 33.81 34.03 36.70 34.72 34.91
Co 0.06 0.05 0.07* 0.05* 0.06 0.05 0.06 0.06
Ni 0.24 0.22 0.23 0.46 0.21 0.22 0.21 0.40
Zn 17.85 16.74 21.74 17.04 17.85 15.41 17.63 17.65
Cu 2.91 3.30 3.15 3.32 3.13 2.73 3.12 2.94
Non-essential metals
Al 21.64 21.43 34.21 20.31 21.75 20.71 22.33 20.45
Mn 1.61 1.65 1.69 1.54 1.61 1.53 1.59 1.67
As 0.22 0.21 0.22 0.22 0.23 0.24 0.21 0.23
Cd 0.33 0.41 0.41 0.31 0.41 0.13 0.41 0.36
Pb 3.84 3.44 4.29 3.10 3.87 1.64 3.80 3.35
Se 1.79 2.01 2.01 2.03 1.86 1.81 1.95 1.91
Ag 0.01 0.00 0.01 0.01 0.01 0.01 0.01 0.01
Liver Tissue
Essential metals
Fe 1104.03 1309.01 1120.04 1257.99 1257.96 1508.04 1409.01* 869.12*
Co 0.43 0.44 0.41 0.4 0.39 0.38 0.41 0.39
Ni 0.65 0.32 0.55 0.5 0.55 2.81 0.64 0.34
Zn 88.21 87.69 88.12 87.9 88.23 79.70 91.91* 83.42*
Cu 29.51 31.87 28.39 34.2 29.51 31.94 34.81 27.52
Non-essential metals
Al 23.54 16.54 19.91 19.52 20.69 14.40 17.91 25.14
Mn 7.51 7.40 7.13 7.61 7.48 8.11 7.42 7.60
As 0.19 0.21 0.22 0.24 0.21 0.22 0.21 0.21
Cd 0.41 0.35 0.40 0.37 0.39 0.24 0.41* 0.33*
Pb 0.92 0.84 0.61 0.91 0.92 0.54 0.93* 0.61*
Se 11.24 10.99 11.92 10.14 10.61 14.22 11.45 11.22
Ag 0.06 0.06 0.05 0.07 0.06 0.04 0.06 0.05
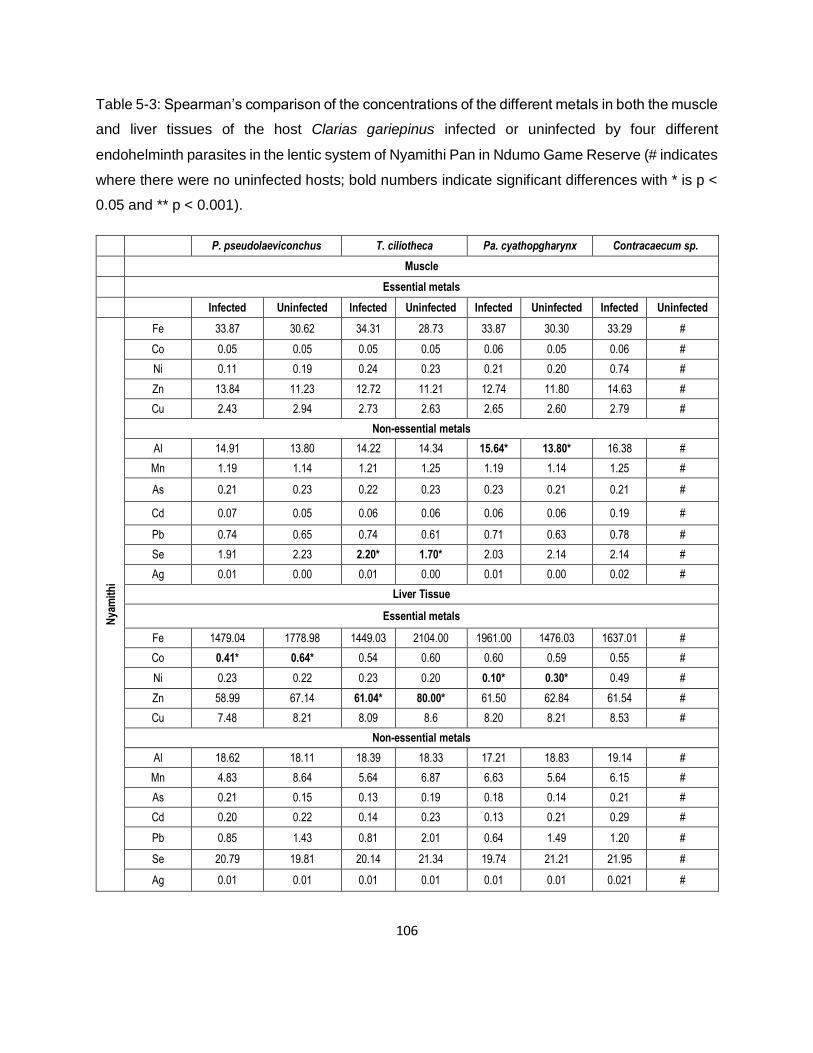
106
Table 5-3: Spearman’s comparison of the concentrations of the different metals in both the muscle
and liver tissues of the host Clarias gariepinus infected or uninfected by four different
endohelminth parasites in the lentic system of Nyamithi Pan in Ndumo Game Reserve (# indicates
where there were no uninfected hosts; bold numbers indicate significant differences with * is p <
0.05 and ** p < 0.001).
P. pseudolaeviconchus T. ciliotheca Pa. cyathopgharynx Contracaecum sp.
Muscle
Essential metals
Infected Uninfected Infected Uninfected Infected Uninfected Infected Uninfected
Nya
mit
hi
Fe 33.87 30.62 34.31 28.73 33.87 30.30 33.29 #
Co 0.05 0.05 0.05 0.05 0.06 0.05 0.06 #
Ni 0.11 0.19 0.24 0.23 0.21 0.20 0.74 #
Zn 13.84 11.23 12.72 11.21 12.74 11.80 14.63 #
Cu 2.43 2.94 2.73 2.63 2.65 2.60 2.79 #
Non-essential metals
Al 14.91 13.80 14.22 14.34 15.64* 13.80* 16.38 #
Mn 1.19 1.14 1.21 1.25 1.19 1.14 1.25 #
As 0.21 0.23 0.22 0.23 0.23 0.21 0.21 #
Cd 0.07 0.05 0.06 0.06 0.06 0.06 0.19 #
Pb 0.74 0.65 0.74 0.61 0.71 0.63 0.78 #
Se 1.91 2.23 2.20* 1.70* 2.03 2.14 2.14 #
Ag 0.01 0.00 0.01 0.00 0.01 0.00 0.02 #
Liver Tissue
Essential metals
Fe 1479.04 1778.98 1449.03 2104.00 1961.00 1476.03 1637.01 #
Co 0.41* 0.64* 0.54 0.60 0.60 0.59 0.55 #
Ni 0.23 0.22 0.23 0.20 0.10* 0.30* 0.49 #
Zn 58.99 67.14 61.04* 80.00* 61.50 62.84 61.54 #
Cu 7.48 8.21 8.09 8.6 8.20 8.21 8.53 #
Non-essential metals
Al 18.62 18.11 18.39 18.33 17.21 18.83 19.14 #
Mn 4.83 8.64 5.64 6.87 6.63 5.64 6.15 #
As 0.21 0.15 0.13 0.19 0.18 0.14 0.21 #
Cd 0.20 0.22 0.14 0.23 0.13 0.21 0.29 #
Pb 0.85 1.43 0.81 2.01 0.64 1.49 1.20 #
Se 20.79 19.81 20.14 21.34 19.74 21.21 21.95 #
Ag 0.01 0.01 0.01 0.01 0.01 0.01 0.021 #
107
5.3.2. Correlations between the number of parasites and metal concentration in host
muscle tissue
The correlation between the number of parasites and the concentrations of the essential and non-
essential metals in both the muscle and liver tissues of Clarias gariepinus is shown in Table 5.4.
Iron and cobalt had positive correlations for P. pseudolaeviconchus, T. ciliotheca and Pa.
cyathopgharynx but a negative correlation for Contracaecum sp. Paracamallanus
cyathopgharynx had a negative correlation for Ni with the other three parasites having positive
correlations. There was a significant positive correlation for the number of T. ciliotheca and the
concentration of Zn in the host and the rest of the parasites had almost no correlations.
Paracamallanus cyathopgharynx and T. ciliotheca had a positive correlation with Cu where P.
pseudolaeviconchus and Contracaecum sp. had negative correlations.
The correlation between the parasite infection rate and the concentration of non-essential metals
is indicated in Table 5.4. Al and Mn were positive in P. pseudolaeviconchus, T. ciliotheca and
Pa. cyathopgharynx with P. pseudolaeviconchus being significant for Al and Pa. cyathopgharynx
being significant for Mn. Both the correlations for Al and Mn were negative in Contracaecum sp.
Arsenic had a significant positive correlation with Contracaecum sp. Procamallanus
pseudolaeviconchus had no significant correlation for the different non-essential metals, but
positive correlations for Cd, Pb and Ag and a negative correlation for Se.
Tetracampos ciliotheca had no significant correlations but had positive correlations for Cd, Pb
and Se and a negative correlation for Ag. Paracamallanus cyathopgharynx had a significant
positive correlation for Pb and positive correlations for Cd and Ag and a negative correlation for
Se. Contracaecum sp. had significantly negative correlations for both Cd and Pb as well as a
slightly negative correlation for Ag and a slightly positive correlation for Se.
5.3.3. Correlations between the number of parasites and metal concentrations in host
liver tissue
The Spearman’s correlation between the number of parasites and the concentrations of the
essential and non-essential metals in both the muscle and liver tissues of Clarias gariepinus from
all the sites together are shown in Table 5.4. Procamallanus pseudolaeviconchus had negative
correlations for all the essential metals compared to the concentrations of the metals in the host
liver tissue, the only significant correlation was for Co. Tetracampos ciliotheca had negative
108
correlations for all the essential metals but only the correlation of Cu was significant.
Paracamallanus cyathopgharynx had significant positive correlations for both Zn and Cu, and a
slightly positive correlation for Co and negative correlations for Fe and Ni. Contracaecum sp. had
significantly negative correlations for Co, Zn and Cu, a slightly negative correlation for Ni and
slightly positive correlation for Fe.
Procamallanus pseudolaeviconchus had no significant correlations with the non-essential metals
in Table 5.4, but had negative correlations with Mn and As and a positive correlation with Al.
Tetracampos ciliotheca had negative correlations for Al, Mn and As with, As being significant.
Paracamallanus cyathopgharynx had positive correlations for Al, Mn and As with As being
significant. Contracaecum sp. had significantly negative correlations for both Al and As and a
slightly positive correlation for Mn. Procamallanus pseudolaeviconchus had no significant
correlations, with Cd and Ag having slightly negative correlations and Pb and Se having slightly
positive correlations. Tetracampos ciliotheca had significantly positive correlations for Se and a
significantly negative correlation for Cd, and slightly negative correlations for both Pb and Ag.
Paracamallanus cyathopgharynx had significantly positive correlations for Cd, and negative
correlations for Se and Ag, and slightly negative correlations for Pb. Contracaecum sp. also had
significant correlations for Cd and Ag (both negative) and Se (positive) with Pb having a slightly
negative correlation.
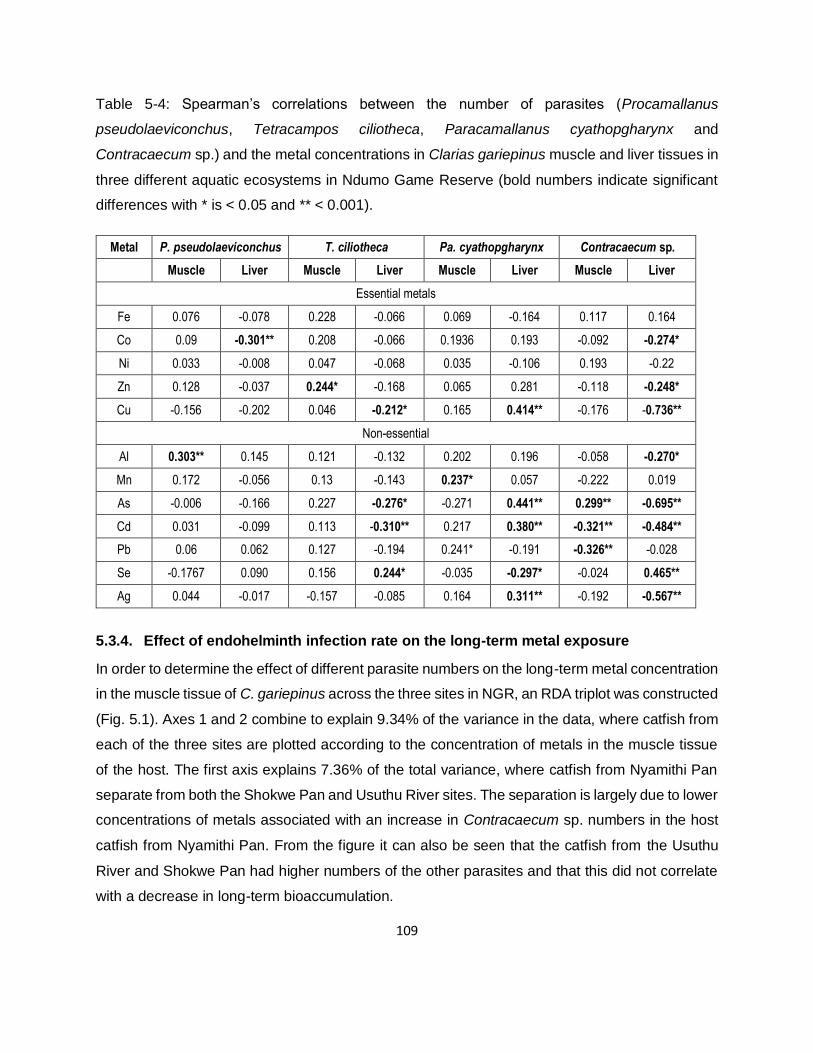
109
Table 5-4: Spearman’s correlations between the number of parasites (Procamallanus
pseudolaeviconchus, Tetracampos ciliotheca, Paracamallanus cyathopgharynx and
Contracaecum sp.) and the metal concentrations in Clarias gariepinus muscle and liver tissues in
three different aquatic ecosystems in Ndumo Game Reserve (bold numbers indicate significant
differences with * is < 0.05 and ** < 0.001).
Metal P. pseudolaeviconchus T. ciliotheca Pa. cyathopgharynx Contracaecum sp.
Muscle Liver Muscle Liver Muscle Liver Muscle Liver
Essential metals
Fe 0.076 -0.078 0.228 -0.066 0.069 -0.164 0.117 0.164
Co 0.09 -0.301** 0.208 -0.066 0.1936 0.193 -0.092 -0.274*
Ni 0.033 -0.008 0.047 -0.068 0.035 -0.106 0.193 -0.22
Zn 0.128 -0.037 0.244* -0.168 0.065 0.281 -0.118 -0.248*
Cu -0.156 -0.202 0.046 -0.212* 0.165 0.414** -0.176 -0.736**
Non-essential
Al 0.303** 0.145 0.121 -0.132 0.202 0.196 -0.058 -0.270*
Mn 0.172 -0.056 0.13 -0.143 0.237* 0.057 -0.222 0.019
As -0.006 -0.166 0.227 -0.276* -0.271 0.441** 0.299** -0.695**
Cd 0.031 -0.099 0.113 -0.310** 0.217 0.380** -0.321** -0.484**
Pb 0.06 0.062 0.127 -0.194 0.241* -0.191 -0.326** -0.028
Se -0.1767 0.090 0.156 0.244* -0.035 -0.297* -0.024 0.465**
Ag 0.044 -0.017 -0.157 -0.085 0.164 0.311** -0.192 -0.567**
5.3.4. Effect of endohelminth infection rate on the long-term metal exposure
In order to determine the effect of different parasite numbers on the long-term metal concentration
in the muscle tissue of C. gariepinus across the three sites in NGR, an RDA triplot was constructed
(Fig. 5.1). Axes 1 and 2 combine to explain 9.34% of the variance in the data, where catfish from
each of the three sites are plotted according to the concentration of metals in the muscle tissue
of the host. The first axis explains 7.36% of the total variance, where catfish from Nyamithi Pan
separate from both the Shokwe Pan and Usuthu River sites. The separation is largely due to lower
concentrations of metals associated with an increase in Contracaecum sp. numbers in the host
catfish from Nyamithi Pan. From the figure it can also be seen that the catfish from the Usuthu
River and Shokwe Pan had higher numbers of the other parasites and that this did not correlate
with a decrease in long-term bioaccumulation.
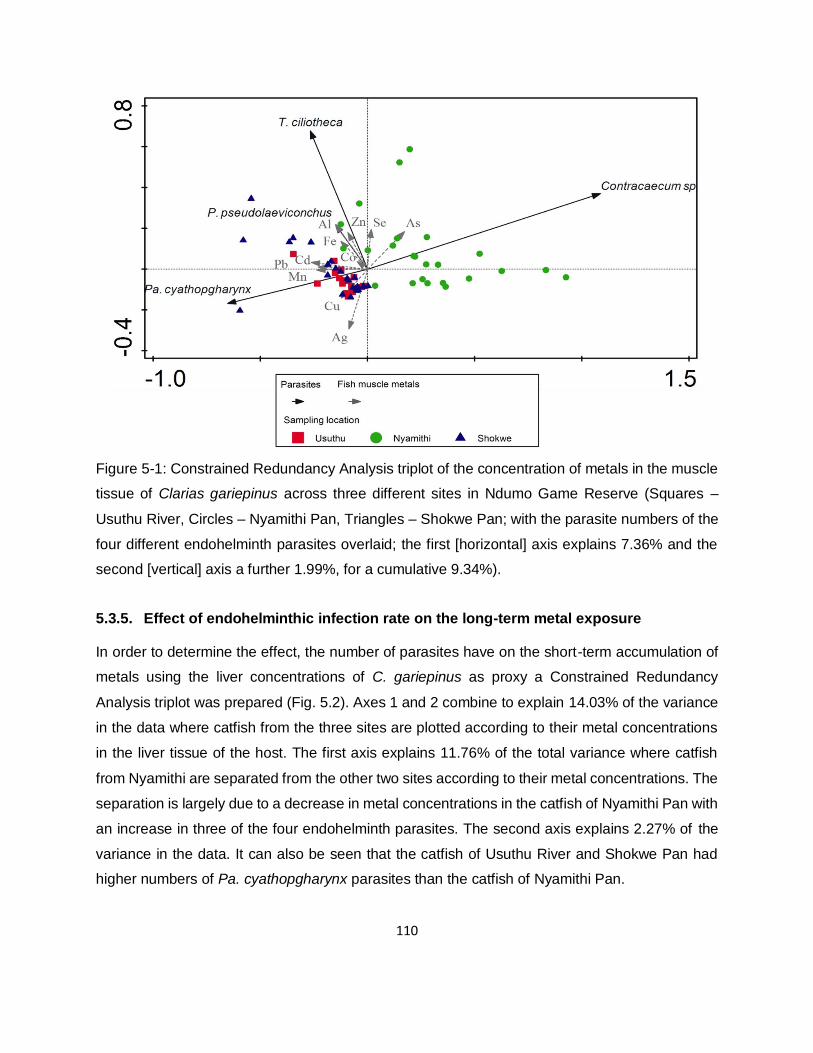
110
Figure 5-1: Constrained Redundancy Analysis triplot of the concentration of metals in the muscle
tissue of Clarias gariepinus across three different sites in Ndumo Game Reserve (Squares –
Usuthu River, Circles – Nyamithi Pan, Triangles – Shokwe Pan; with the parasite numbers of the
four different endohelminth parasites overlaid; the first [horizontal] axis explains 7.36% and the
second [vertical] axis a further 1.99%, for a cumulative 9.34%).
5.3.5. Effect of endohelminthic infection rate on the long-term metal exposure
In order to determine the effect, the number of parasites have on the short-term accumulation of
metals using the liver concentrations of C. gariepinus as proxy a Constrained Redundancy
Analysis triplot was prepared (Fig. 5.2). Axes 1 and 2 combine to explain 14.03% of the variance
in the data where catfish from the three sites are plotted according to their metal concentrations
in the liver tissue of the host. The first axis explains 11.76% of the total variance where catfish
from Nyamithi are separated from the other two sites according to their metal concentrations. The
separation is largely due to a decrease in metal concentrations in the catfish of Nyamithi Pan with
an increase in three of the four endohelminth parasites. The second axis explains 2.27% of the
variance in the data. It can also be seen that the catfish of Usuthu River and Shokwe Pan had
higher numbers of Pa. cyathopgharynx parasites than the catfish of Nyamithi Pan.
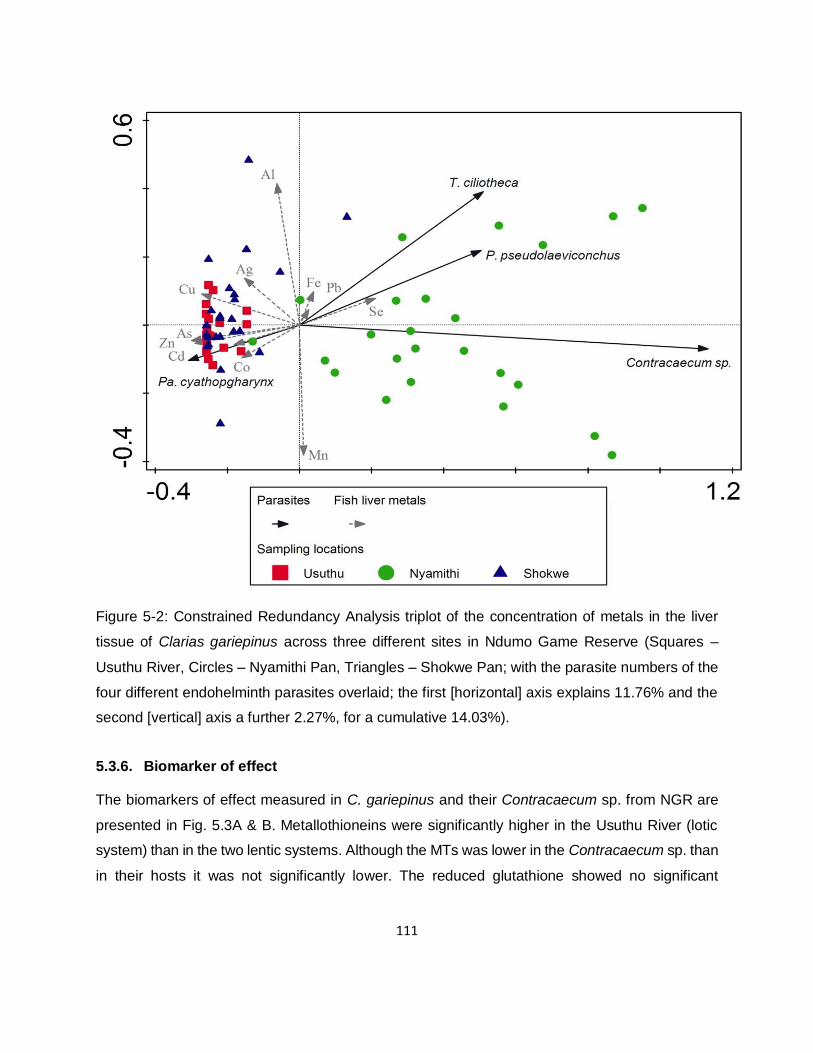
111
Figure 5-2: Constrained Redundancy Analysis triplot of the concentration of metals in the liver
tissue of Clarias gariepinus across three different sites in Ndumo Game Reserve (Squares –
Usuthu River, Circles – Nyamithi Pan, Triangles – Shokwe Pan; with the parasite numbers of the
four different endohelminth parasites overlaid; the first [horizontal] axis explains 11.76% and the
second [vertical] axis a further 2.27%, for a cumulative 14.03%).
5.3.6. Biomarker of effect
The biomarkers of effect measured in C. gariepinus and their Contracaecum sp. from NGR are
presented in Fig. 5.3A & B. Metallothioneins were significantly higher in the Usuthu River (lotic
system) than in the two lentic systems. Although the MTs was lower in the Contracaecum sp. than
in their hosts it was not significantly lower. The reduced glutathione showed no significant
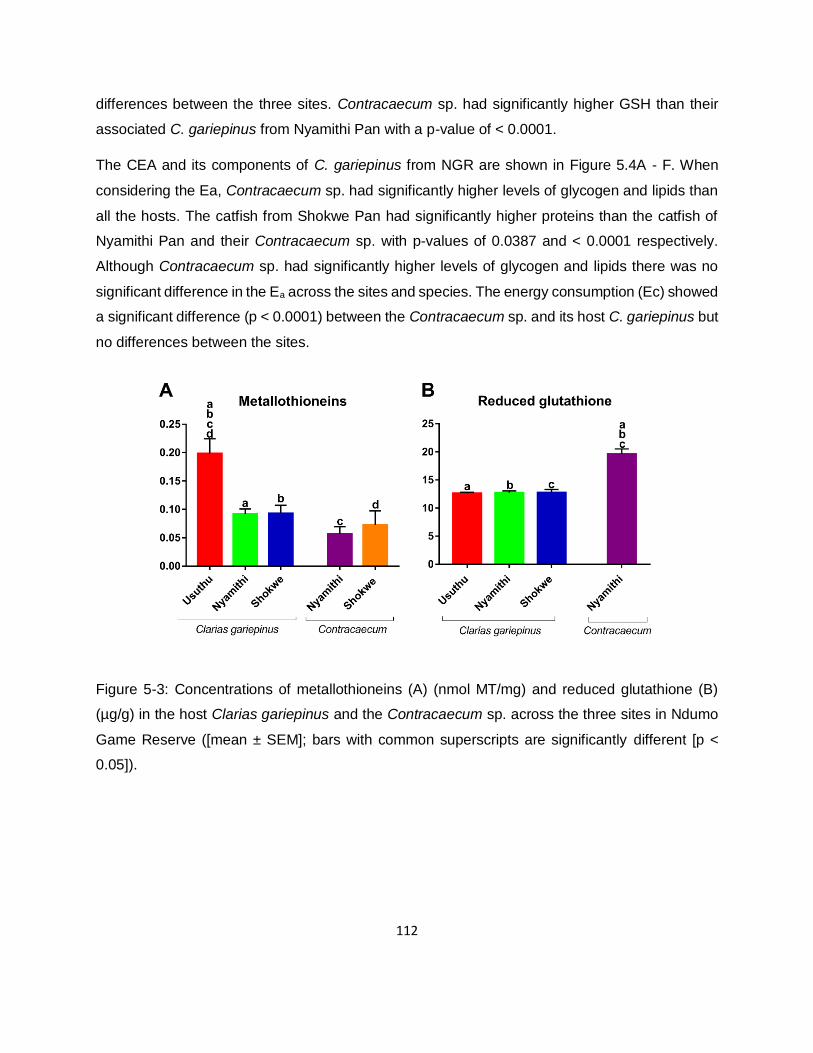
112
differences between the three sites. Contracaecum sp. had significantly higher GSH than their
associated C. gariepinus from Nyamithi Pan with a p-value of < 0.0001.
The CEA and its components of C. gariepinus from NGR are shown in Figure 5.4A - F. When
considering the Ea, Contracaecum sp. had significantly higher levels of glycogen and lipids than
all the hosts. The catfish from Shokwe Pan had significantly higher proteins than the catfish of
Nyamithi Pan and their Contracaecum sp. with p-values of 0.0387 and < 0.0001 respectively.
Although Contracaecum sp. had significantly higher levels of glycogen and lipids there was no
significant difference in the Ea across the sites and species. The energy consumption (Ec) showed
a significant difference (p < 0.0001) between the Contracaecum sp. and its host C. gariepinus but
no differences between the sites.
Figure 5-3: Concentrations of metallothioneins (A) (nmol MT/mg) and reduced glutathione (B)
(µg/g) in the host Clarias gariepinus and the Contracaecum sp. across the three sites in Ndumo
Game Reserve ([mean ± SEM]; bars with common superscripts are significantly different [p <
0.05]).
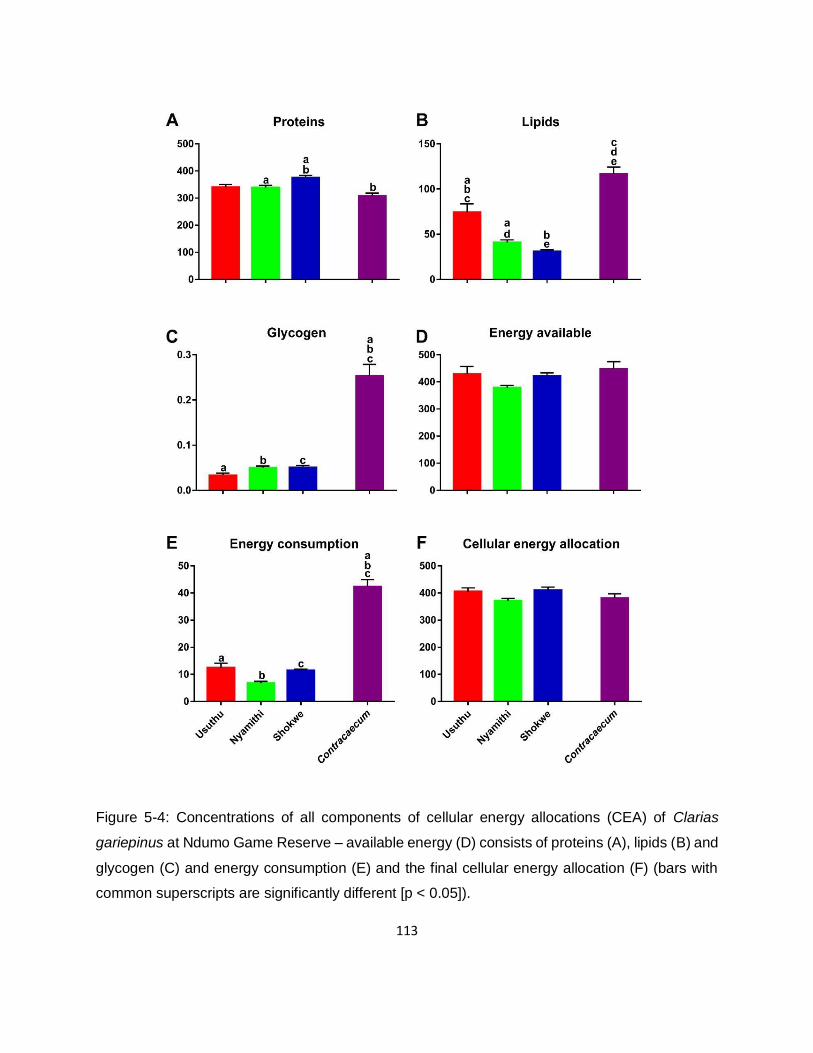
113
Figure 5-4: Concentrations of all components of cellular energy allocations (CEA) of Clarias
gariepinus at Ndumo Game Reserve – available energy (D) consists of proteins (A), lipids (B) and
glycogen (C) and energy consumption (E) and the final cellular energy allocation (F) (bars with
common superscripts are significantly different [p < 0.05]).
114
5.3.7. Biological response of Clarias gariepinus in terms of endohelminth parasite
infection
There was no significance present in the biological response in the host Clarias gariepinus
between the catfish infected with endohelminth parasites and uninfected catfish when all the sites’
data are combined (Table 5.5). The CEA showed a trend of being higher in the uninfected catfish;
the uninfected catfish had slightly higher available energy and higher energy consumption. The
metallothioneins’ activity in the uninfected hosts was also slightly higher than in the infected hosts
with the GSH being slightly higher in the infected catfish.
The C. gariepinus infected with P. pseudolaeviconchus at Usuthu River had a significantly higher
concentration of glycogen (p = 0.0344) and those infected with Contracaecum sp. had significantly
higher lipids (p < 0.0001) than the uninfected catfish. The C. gariepinus infected with P.
pseudolaeviconchus at Shokwe Pan had significantly higher MT concentrations (p = 0.0315) than
the uninfected hosts. There were no significant differences in the biological responses of the
infected and the uninfected C. gariepinus at Nyamithi Pan.
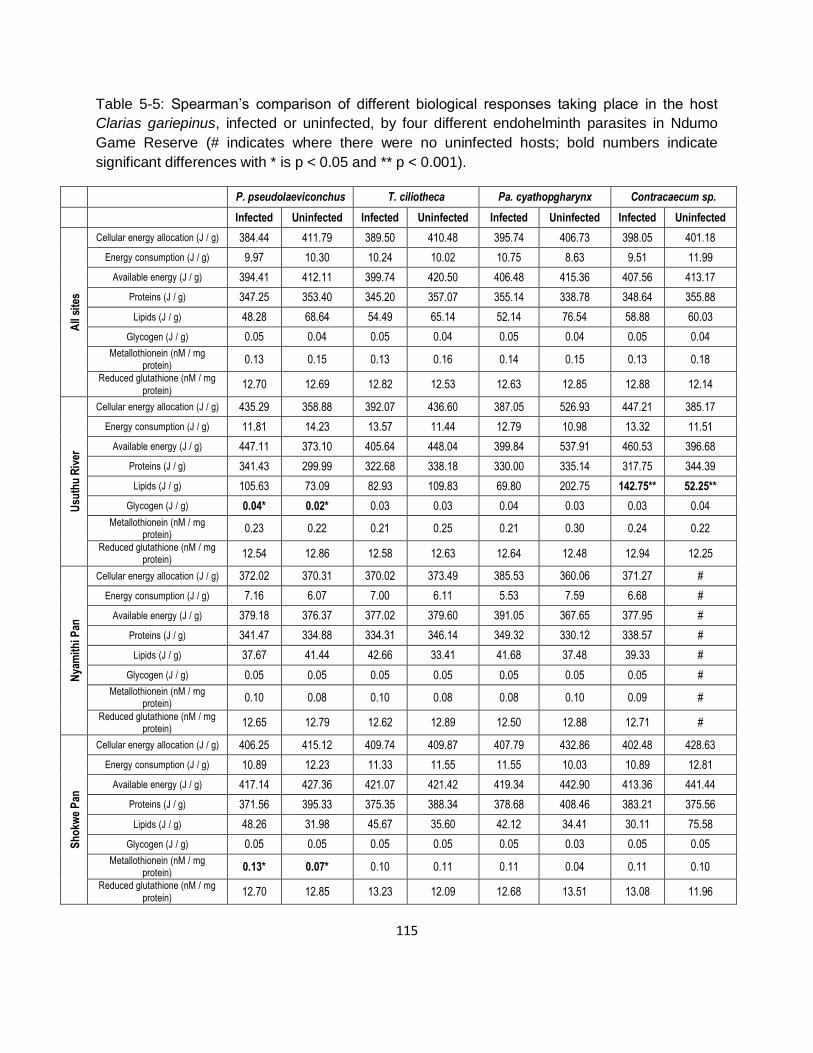
115
Table 5-5: Spearman’s comparison of different biological responses taking place in the host
Clarias gariepinus, infected or uninfected, by four different endohelminth parasites in Ndumo
Game Reserve (# indicates where there were no uninfected hosts; bold numbers indicate
significant differences with * is p < 0.05 and ** p < 0.001).
P. pseudolaeviconchus T. ciliotheca Pa. cyathopgharynx Contracaecum sp.
Infected Uninfected Infected Uninfected Infected Uninfected Infected Uninfected
All
site
s
Cellular energy allocation (J / g) 384.44 411.79 389.50 410.48 395.74 406.73 398.05 401.18
Energy consumption (J / g) 9.97 10.30 10.24 10.02 10.75 8.63 9.51 11.99
Available energy (J / g) 394.41 412.11 399.74 420.50 406.48 415.36 407.56 413.17
Proteins (J / g) 347.25 353.40 345.20 357.07 355.14 338.78 348.64 355.88
Lipids (J / g) 48.28 68.64 54.49 65.14 52.14 76.54 58.88 60.03
Glycogen (J / g) 0.05 0.04 0.05 0.04 0.05 0.04 0.05 0.04
Metallothionein (nM / mg protein)
0.13 0.15 0.13 0.16 0.14 0.15 0.13 0.18
Reduced glutathione (nM / mg
protein) 12.70 12.69 12.82 12.53 12.63 12.85 12.88 12.14
Usu
thu
Riv
er
Cellular energy allocation (J / g) 435.29 358.88 392.07 436.60 387.05 526.93 447.21 385.17
Energy consumption (J / g) 11.81 14.23 13.57 11.44 12.79 10.98 13.32 11.51
Available energy (J / g) 447.11 373.10 405.64 448.04 399.84 537.91 460.53 396.68
Proteins (J / g) 341.43 299.99 322.68 338.18 330.00 335.14 317.75 344.39
Lipids (J / g) 105.63 73.09 82.93 109.83 69.80 202.75 142.75** 52.25**
Glycogen (J / g) 0.04* 0.02* 0.03 0.03 0.04 0.03 0.03 0.04
Metallothionein (nM / mg protein)
0.23 0.22 0.21 0.25 0.21 0.30 0.24 0.22
Reduced glutathione (nM / mg protein)
12.54 12.86 12.58 12.63 12.64 12.48 12.94 12.25
Nya
mit
hi P
an
Cellular energy allocation (J / g) 372.02 370.31 370.02 373.49 385.53 360.06 371.27 #
Energy consumption (J / g) 7.16 6.07 7.00 6.11 5.53 7.59 6.68 #
Available energy (J / g) 379.18 376.37 377.02 379.60 391.05 367.65 377.95 #
Proteins (J / g) 341.47 334.88 334.31 346.14 349.32 330.12 338.57 #
Lipids (J / g) 37.67 41.44 42.66 33.41 41.68 37.48 39.33 #
Glycogen (J / g) 0.05 0.05 0.05 0.05 0.05 0.05 0.05 #
Metallothionein (nM / mg protein)
0.10 0.08 0.10 0.08 0.08 0.10 0.09 #
Reduced glutathione (nM / mg protein)
12.65 12.79 12.62 12.89 12.50 12.88 12.71 #
Sh
okw
e P
an
Cellular energy allocation (J / g) 406.25 415.12 409.74 409.87 407.79 432.86 402.48 428.63
Energy consumption (J / g) 10.89 12.23 11.33 11.55 11.55 10.03 10.89 12.81
Available energy (J / g) 417.14 427.36 421.07 421.42 419.34 442.90 413.36 441.44
Proteins (J / g) 371.56 395.33 375.35 388.34 378.68 408.46 383.21 375.56
Lipids (J / g) 48.26 31.98 45.67 35.60 42.12 34.41 30.11 75.58
Glycogen (J / g) 0.05 0.05 0.05 0.05 0.05 0.03 0.05 0.05
Metallothionein (nM / mg protein)
0.13* 0.07* 0.10 0.11 0.11 0.04 0.11 0.10
Reduced glutathione (nM / mg
protein) 12.70 12.85 13.23 12.09 12.68 13.51 13.08 11.96
116
5.3.8. Biomarker response of C. gariepinus in relation to accumulated metal
concentrations
In order to determine the effect that metals have over the long term in C. gariepinus across the
three sites in NGR, an RDA was done and the triplot is shown in Fig. 5.5. Axes 1 and 2 combine
to explain 17.89% of the variance in the data, where catfish from each of the three sites are plotted
according to the concentrations of metals in their muscle tissue. Axis 1 explains 11.28% of the
total variance, where catfish from Nyamithi Pan separate to the left, according to their energy
reserves with the catfish in Nyamithi Pan having less energy than those at the other two systems.
Axis 2 explains 6.61% of the variance in the total data with Usuthu River separating down with an
increase in Cu, Ag and As concentrations and higher MTs, and Shokwe Pan separating to the top
with an increase in most of the metals as well as an increase in CEA and GSH.
In order to determine the effect that metals have over a short term in C. gariepinus across three
sites in NGR, an RDA triplot was done and the triplot is shown in Fig. 5.6. Axes 1 and 2 combine
to explain 14.12% of the total variance in the data, where catfish from each of the three sites are
plotted according to the concentration of metals in the liver tissue of the host. The first axis
explains 8.43% of the total variance, where catfish from the lotic system (Usuthu River) separates
from both the lentic systems (Nyamithi and Shokwe pans). The separation is largely due to an
increase in Cu, Co and Cd metal concentrations in the liver associated with an increase in MTs.
The second axis explains 5.69% of the total variance in the data. The separation on the second
axis is due to an increase in most of the metal concentrations which is associated with a decrease
in CEA and GSH, but an increase in MTs and increased energy consumption.
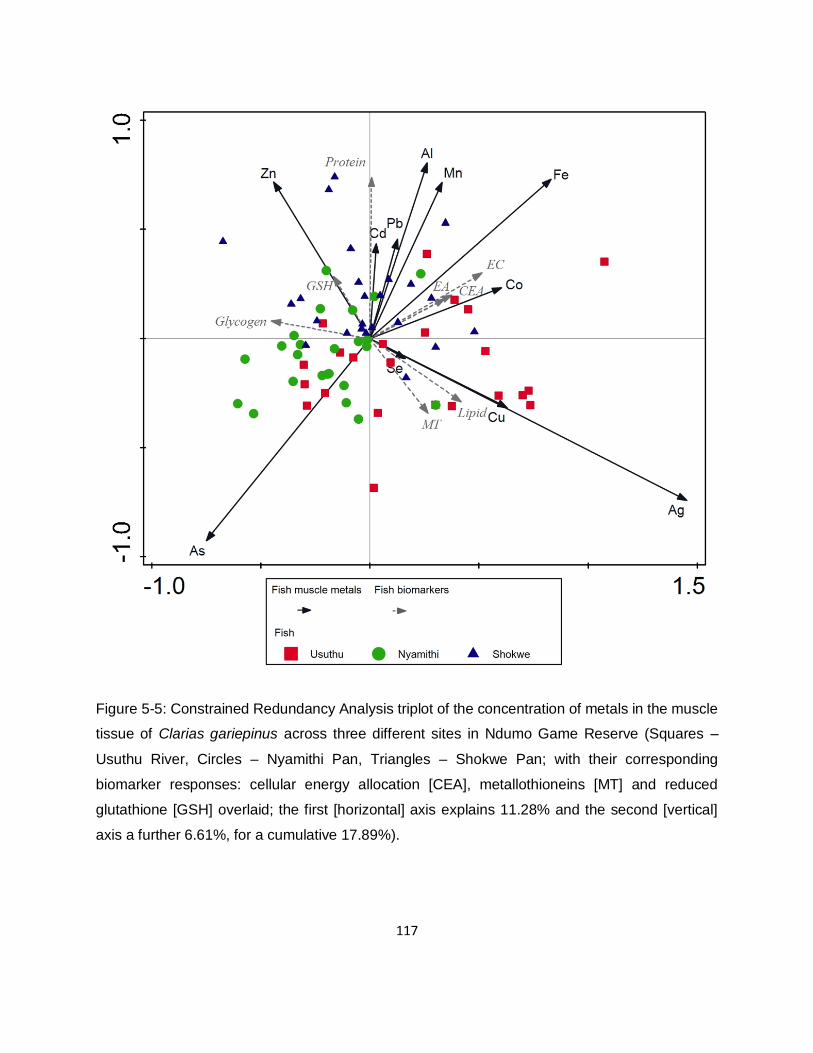
117
Figure 5-5: Constrained Redundancy Analysis triplot of the concentration of metals in the muscle
tissue of Clarias gariepinus across three different sites in Ndumo Game Reserve (Squares –
Usuthu River, Circles – Nyamithi Pan, Triangles – Shokwe Pan; with their corresponding
biomarker responses: cellular energy allocation [CEA], metallothioneins [MT] and reduced
glutathione [GSH] overlaid; the first [horizontal] axis explains 11.28% and the second [vertical]
axis a further 6.61%, for a cumulative 17.89%).
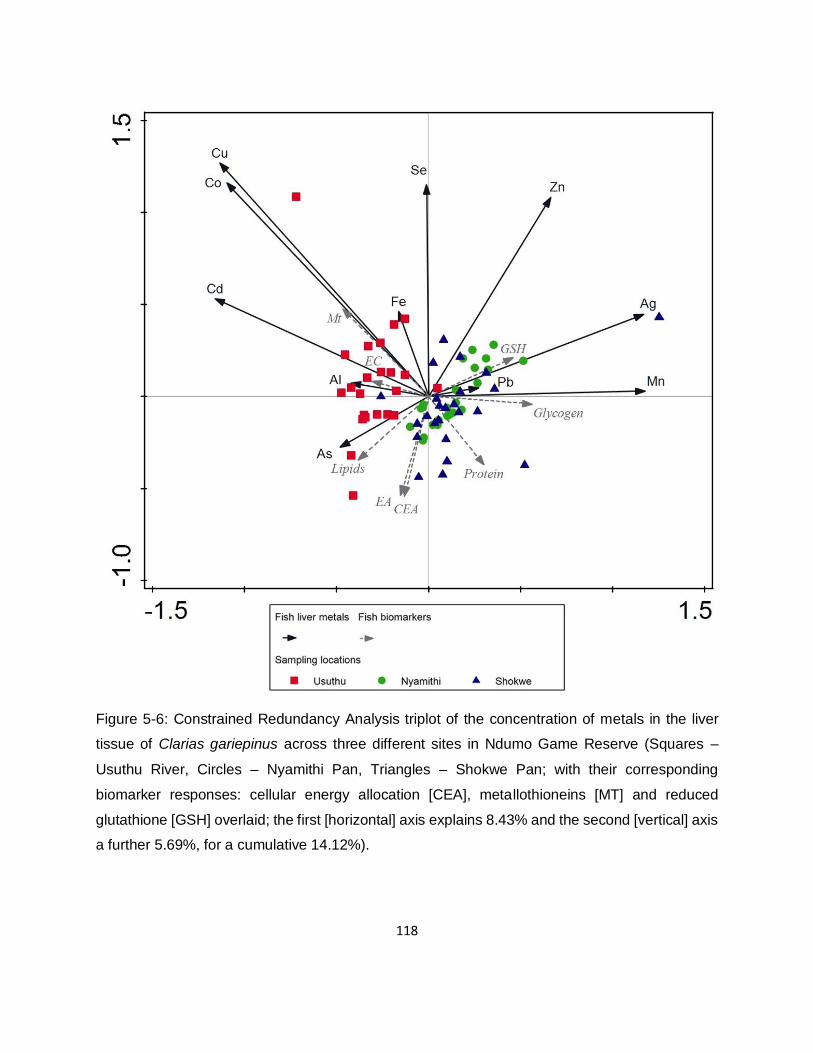
118
Figure 5-6: Constrained Redundancy Analysis triplot of the concentration of metals in the liver
tissue of Clarias gariepinus across three different sites in Ndumo Game Reserve (Squares –
Usuthu River, Circles – Nyamithi Pan, Triangles – Shokwe Pan; with their corresponding
biomarker responses: cellular energy allocation [CEA], metallothioneins [MT] and reduced
glutathione [GSH] overlaid; the first [horizontal] axis explains 8.43% and the second [vertical] axis
a further 5.69%, for a cumulative 14.12%).
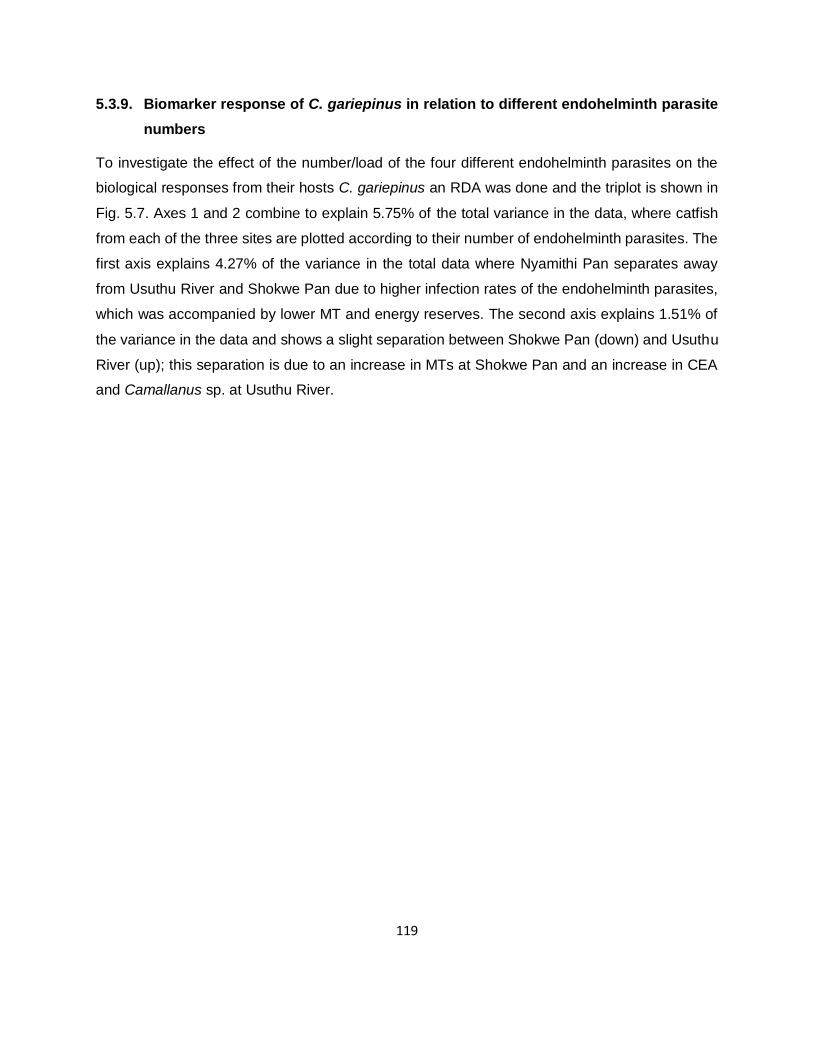
119
5.3.9. Biomarker response of C. gariepinus in relation to different endohelminth parasite
numbers
To investigate the effect of the number/load of the four different endohelminth parasites on the
biological responses from their hosts C. gariepinus an RDA was done and the triplot is shown in
Fig. 5.7. Axes 1 and 2 combine to explain 5.75% of the total variance in the data, where catfish
from each of the three sites are plotted according to their number of endohelminth parasites. The
first axis explains 4.27% of the variance in the total data where Nyamithi Pan separates away
from Usuthu River and Shokwe Pan due to higher infection rates of the endohelminth parasites,
which was accompanied by lower MT and energy reserves. The second axis explains 1.51% of
the variance in the data and shows a slight separation between Shokwe Pan (down) and Usuthu
River (up); this separation is due to an increase in MTs at Shokwe Pan and an increase in CEA
and Camallanus sp. at Usuthu River.
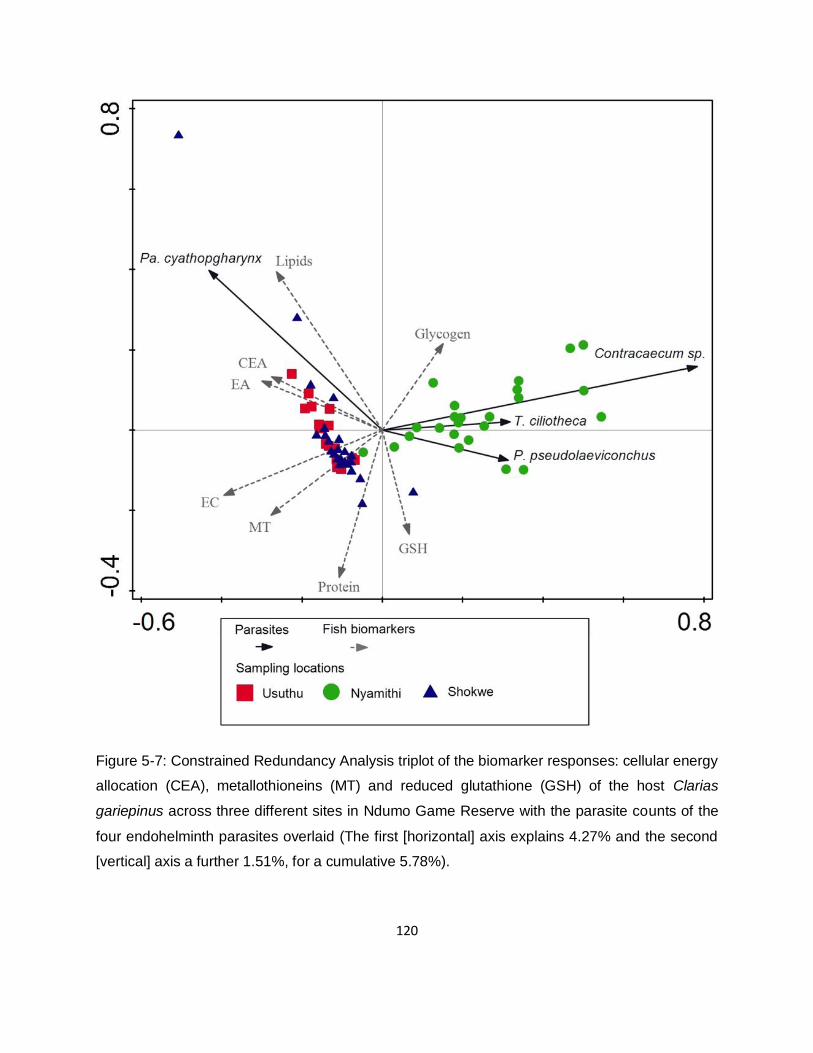
120
Figure 5-7: Constrained Redundancy Analysis triplot of the biomarker responses: cellular energy
allocation (CEA), metallothioneins (MT) and reduced glutathione (GSH) of the host Clarias
gariepinus across three different sites in Ndumo Game Reserve with the parasite counts of the
four endohelminth parasites overlaid (The first [horizontal] axis explains 4.27% and the second
[vertical] axis a further 1.51%, for a cumulative 5.78%).
121
5.3.10. Biological response of Contracaecum sp. in relation to their accumulation and their
environment (host accumulation)
To determine the effect of metal concentrations in the Contracaecum sp. at Nyamithi Pan, on their
biomarkers (CEA, MTs and GSH) an RDA was done and the triplot is shown in Fig. 5.8, where
the catfish is plotted according to their metal concentrations. The first and second axes combine
to explain 36.08% of the variance in the total data, where the parasites are separated by their
metal concentrations, as those individuals with a greater MT response accumulated less metals
but also had less energy reserves. The first axis explains 19.24% of the total variance in data,
where the parasites are separated according to their biological responses. The parasites with low
concentrations of the different metals showed an increase in the total CEA as well as an increase
in available energy. The C. gariepinus and the parasites with an increase in Pb and Cd metal
concentrations had an increase in GSH response and higher energy consumption. The parasites
with an increase in MTs showed a decrease in most of the metal concentrations.
122
Figure 5-8: Unconstrained Redundancy Analysis triplot of the concentration of metals in
Contracaecum sp. across two different sites in Ndumo Game Reserve with their biomarker
responses: cellular energy allocation (CEA), metallothioneins (MT) and reduced glutathione
(GSH) overlaid (The first [horizontal] axis explains 19.49% and the second [vertical] axis a further
17.11%, for a cumulative 36.08%).
123
The RDA triplot constructed in Figure 5.9 indicates the long-term effect of concentration of metals
accumulating in the environment of Contracaecum sp. (in the muscle tissue of C. gariepinus) on
the biomarker responses of the Contracaecum sp. Axes 1 and 2 combine to explain 37.90% of
the total variance in the data. Axis 1 explains 24.77% of the variance in data where the parasites
are separated by their biomarker response. The second axis explains 13.13% of the total variance
where the parasites are separated due to the concentration of metals in their environment.
Contracaecum sp. present in C. gariepinus with higher concentrations of Pb and Cd had higher
GSH response and energy consumption. The parasites with the highest CEA, especially available
energy as well as MT response, were present in the hosts with lower concentrations of most of
the metals.
In order to investigate the biological responses (CEA, MT and GSH) of Contracaecum sp. to the
short-term metal concentrations in their environment an RDA was done and the triplot is shown
in Fig. 5.10 where Contracaecum sp. is plotted according to the metal concentrations in their host
liver tissue. The first and second axes combine to explain 42.47% of the total variance in the data.
The first axis explains 23.14% of the variance with the parasites being separated by their
biological responses. The Contracaecum sp. parasites separate equally with nine individuals
separating left, because of an increase in available energy with an increase in Se, Zn and As in
their host liver tissue. The second axis explains 19.13% of the variance in the data where the
parasites are separated by the concentration of metals present in their environment. The parasites
present in hosts with higher concentrations of metals had higher MT responses. The parasites
with higher CEA, especially available energy, were present in catfish with lower concentrations of
most of the metals.
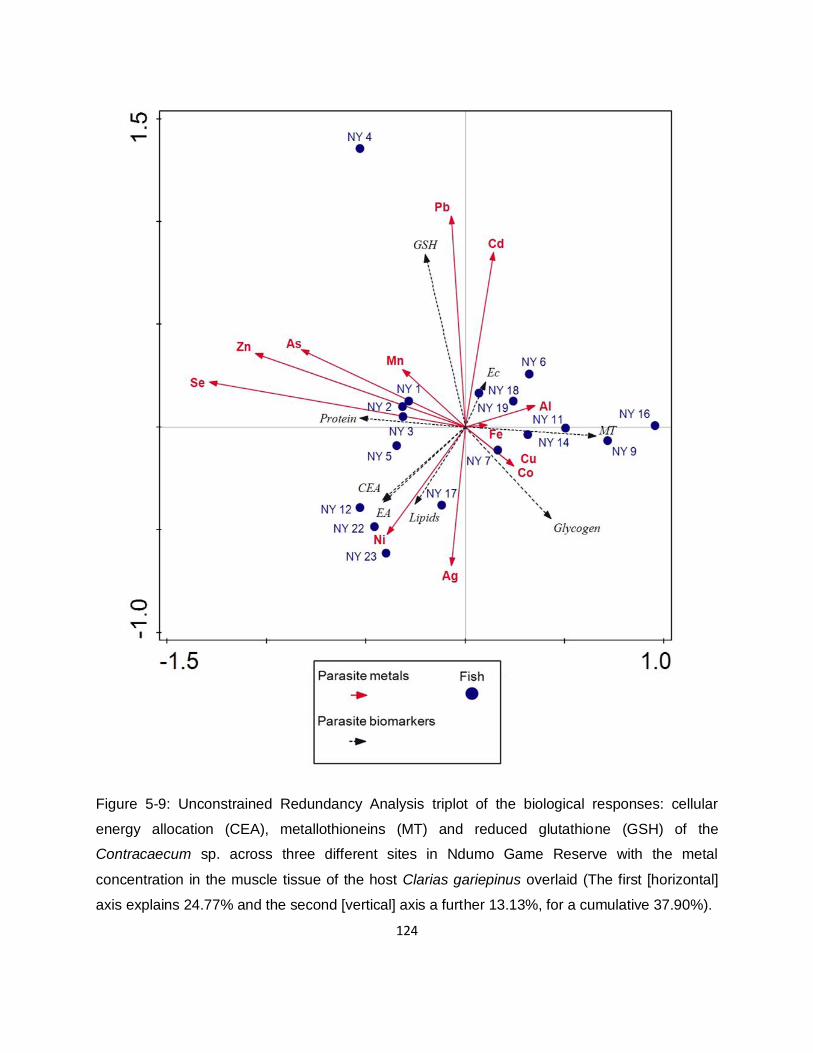
124
Figure 5-9: Unconstrained Redundancy Analysis triplot of the biological responses: cellular
energy allocation (CEA), metallothioneins (MT) and reduced glutathione (GSH) of the
Contracaecum sp. across three different sites in Ndumo Game Reserve with the metal
concentration in the muscle tissue of the host Clarias gariepinus overlaid (The first [horizontal]
axis explains 24.77% and the second [vertical] axis a further 13.13%, for a cumulative 37.90%).
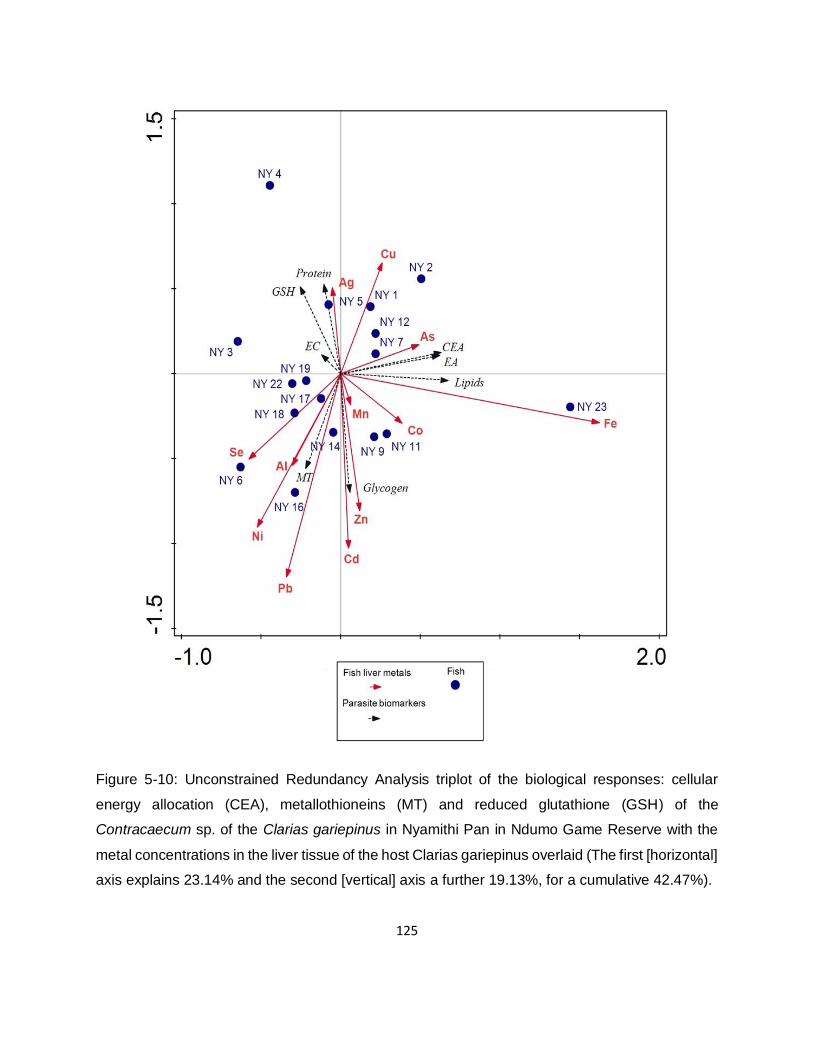
125
Figure 5-10: Unconstrained Redundancy Analysis triplot of the biological responses: cellular
energy allocation (CEA), metallothioneins (MT) and reduced glutathione (GSH) of the
Contracaecum sp. of the Clarias gariepinus in Nyamithi Pan in Ndumo Game Reserve with the
metal concentrations in the liver tissue of the host Clarias gariepinus overlaid (The first [horizontal]
axis explains 23.14% and the second [vertical] axis a further 19.13%, for a cumulative 42.47%).
126
5.4. Discussion
Pollutants such as metals are known to cause stress in organisms that can be quantified by
measuring biological responses at cellular levels (Gerber et al., 2018). Along with pollution
parasites will also cause stress to their hosts by taking up nutrients from their hosts. Many
previous studies have found that parasites will have negative effects on the biological response
of their hosts. In recent times studies have started to focus on the possible positive effect of
parasites on their hosts in terms of biological responses to pollutants. This study focussed on the
biological responses of both C. gariepinus and Contracaecum sp. to the metal concentrations in
their environment, both in the short and long term, to evaluate the possible positive effect of
endohelminth parasites on the biological responses of their hosts.
5.4.1. Effect of endohelminth parasites on their host biomarker responses
Parasites are dependent on energy from their hosts for their development, growth and
reproduction (Barber, 2005). Parasite infection can alter their hosts’ use of energy, having a
negative effect on the host (Robar et al., 2011). Parasitisation can therefore interfere with host
growth rate, swimming behaviour and maturation time (Walkey & Meakins, 1970). Organisms
infected with parasites in a polluted system will thus have to use almost all of their energy to
survive but will have no energy for growth and reproduction (Marcogliese & Pietrock, 2011). Since
the early 2000s researchers have started to investigate the effects of parasites on the biomarkers
of their hosts in polluted systems (Morley et al., 2006, Sures, 2006, 2008, Morley, 2010).
Although many studies have proven the negative effect of parasites and pollution on their hosts,
some studies have found positive effects of parasites on their host in terms of pollutants (Sures
et al., 2017). It is believed that at a certain infection rate, parasites can reduce pollutant stress on
their hosts sufficiently to have a beneficial effect on the host. Parasites remove metals and other
pollutants from their hosts lowering the energy required by the hosts to detoxify and remove the
pollutants themselves. Parasites such as some acanthocephalans and cestodes species are
known to lower metal concentrations in their hosts through biomagnification (Sures et al., 2017).
The decrease in metals in the host organisms will cause less stress on the hosts through pollution,
but the hosts still undergo stress caused by the parasite infection. When the stress caused by the
parasite infection is lower than the stress the metals would have had on the hosts the parasite
infection can be seen to have a positive effect on the host.
127
5.4.2. Biomarker of exposure
In this study positive correlations were found between the number of T. ciliotheca, Pa.
cyathopgharynx and Contracaecum sp. and the short-term metal accumulation in their hosts, as
well as between Contracaecum sp. and the long-term metal exposure in their hosts.
In this study a negative correlation was shown between the number of T. ciliotheca and
Contracaecum sp. and the concentration of Cd in the liver, and between Contracaecum sp. and
the concentration in the muscle tissue. This supports the findings of Sures (1996) and Sures et
al. (1997) who found that acanthocephalans (parasites) reduce the uptake of Cd by their hosts.
However, this study also found a positive correlation between the number of Pa. cyathopgharynx
and the concentration of Cd in the liver of the host.
The study found that in the short term parasites can have a positive effect on the host metals with
an increase in the number of T. ciliotheca, P. pseudolaeviconchus and Contracaecum sp. leading
to a decrease in metal concentration in the liver tissue of the host. In the short term parasites and
hosts compete for the essential metals needed by both the host and parasite species.
Endohelminth parasites have adapted to absorb nutrients at higher levels than their hosts to
ensure survival (Dalton et al., 2004). Endohelminth parasites developed an acellular epithelial
syncytium, to help absorb nutrients (and metals) from their host’s digestive tract (Dalton et al.,
2004). Helminth parasites are also not able to produce their own cholesterol or fatty acids, and
thus evolved to be efficient in absorbing them from their hosts (Sures & Siddall, 1999).
The study also found that an increase in Contracaecum sp. parasites in a host species will have
a positive effect on the metal concentrations inside the host muscle tissue over a long term. The
higher the number of Contracaecum sp. parasites in a host the lower the concentrations of the
metals, both essential and non-essential, present in the host. According to Sures and Siddall
(1999) the accumulation of metals in helminth parasites will affect the hosts’ ability to metabolise
pollutants. Parasites will act as a sink for metals in the long term by accumulating the metals
(Sures et al., 2017). Gabrashanska and Nedeva (1996) state that the uptake of metals by
parasites is considered as an efflux of metals from their hosts and therefore reduces the
concentrations inside the hosts. These results are supported by many previous studies that also
found a decrease in the metal concentration in the host liver with an increase in different cestode
128
species numbers (Oyoo-Okoth et al., 2010, Brázová et al., 2012, Khalil et al., 2014) and (Evans
et al., 2001, Hursky & Pietrock, 2015) for different intestinal nematode species.
5.4.3. Biomarker of effect
Induction of metallothionein stress proteins are caused by an increase in intracellular and
intercellular metal (essential and non-essential) concentrations (Thiele, 1992). According to
Hamer (1986), the importance of MTs as a biomarker is increasing because most living organisms
possess the necessary protein to synthesise MT and thus MTs can be measured in almost all
organisms. Metallothioneins in organisms increase when concentrations of metals increase
(Hamer, 1986, Viarengo et al., 1999, Van der Oost et al., 2003, Dahms-Verster et al., 2019,
Mijošek et al., 2019). In this study it was found that the MT concentrations did not show the same
trend, as the catfish in the Usuthu River that had the lowest environmental metal concentrations
had the highest MT concentrations. This shows that MT concentrations can be affected by more
than just the metal concentrations in the environment.
The reason for the increased levels of MTs is thought to be because of lower endohelminth
parasite numbers in the lotic system. This is supported by Baudrimont and De Montaudouin
(2007) who found that uninfected fish had approximately fourfold higher concentrations of MTs
than infected fish. The MT levels correlate with the endohelminth numbers at the two lentic
systems with the saline system having the highest number of parasites and the lowest MT
concentrations. Metallothioneins’ concentrations increase with the initial exposure to metals in
their environment to help detoxify and remove the metals from the hosts (Bremner, 1987, Van der
Oost et al., 2003, Baudrimont & De Montaudouin, 2007). As arsenic accumulation increases over
time the MT concentrations in the organism tend to stabilise and stay at a constant level
(Baudrimont et al., 2003, Cho et al., 2008). Metallothioneins also compete with GSH to bind with
pollutants, thus an increase in GSH leads to a decrease in MTs.
In this study it was found that Contracaecum sp. had higher concentrations of GSH than their
hosts. Reduced glutathione is a non-protein tripeptide that consists of a g-glutamine, a cysteine
and a glycine, that can be conjugated in the beginning of the formation of mercapturic acid
(George, 1994). Its two main functions are detoxification and acting as an antioxidant (Stegeman
et al., 1992). Reduced glutathione is a major detoxification mechanism of helminth parasites
(Brophy & Barrett, 1990).
129
The GSH concentrations in the study correlate negatively with the MT concentrations found, i.e.
when MTs increase the GSHs decrease and vice versa. With an initial increase in metal
concentrations the GSH concentrations decrease as the MT concentrations increase due to the
competition for resources (Van der Oost et al., 2003, Gerber et al., 2018). Contracaecum sp. had
elevated GSH levels due to the low MT concentrations. As MT’s concentrations reach a stable
level over the time of the exposure the GSH will increase in the organism (Van der Oost et al.,
2003). At higher concentrations of metals GSH have an affinity for Cd and Pb so that if the
concentration of these metals increase the GSH concentration also increases (Dudley et al.,
1985).
Reduced glutathione is also part of the anti-oxidant system in organisms and helps combat
oxidative stress with reactive oxygen species (ROS) forming due to pollutants (Gerber et al.,
2018). Organisms use their cellular energy allocation for important functions such as growth and
reproduction. With the accumulation of pollutants such as metals, organisms must use their
available energy to detoxify and remove pollutants from their tissues. As metals increase both in
the short and long term, the CEA of organisms tends to decrease, as the organisms spend energy
in the detoxification and excretion of metals due to the “chronic” exposure to metals (Smolders et
al., 2004, Ibrahim, 2006, Moolman et al., 2007, Bednarska et al., 2013).
As the accumulation of metals increase over time the glycogen decreases, but protein levels
increase, this is because the readily available energy (glycogen) is used to remove metals from
the organisms. This is supported by the findings of previous studies (Schramm et al., 1998,
Smolders et al., 2004, Heath, 2018). The proteins are believed to be at elevated levels because
organisms use the readily available energy reserves before using proteins (Smolders et al., 2004).
Smolders et al. (2004) state that low levels of pollution cause an increase in protein synthesis (for
detoxification). Lipids have a negative correlation with increased metal exposure – a decrease in
lipids due to metal exposure has been documented numerous times (Sancho et al., 1998, Handy
et al., 1999, Smolders et al., 2004). Handy et al. (1999) found that the decrease in lipids was due
to the organism having to use reserve energy for bodily functions, while the available energy was
being used to detoxify metals.
130
5.5. Conclusion
This study was the first study to look at the biomarker responses in Contracaecum sp. on metal
accumulations as well as to determine the effect of Contracaecum sp. on their host biomarker
response. In this study it was found that as the concentrations of metals in an organism (both)
host and Contracaecum sp. increased the MT response. It was seen that with an increase in
parasite infection there was a decrease in MT concentration in the host organism which supports
the hypothesis that an increase in parasite load will decrease the effect of metals on the hosts.
But overall it was found that the organisms with the highest parasite infections also had the lowest
available energy and overall CEA levels. It is thus a “catch-22” where an increase in parasites
helps deal with the effect of metals on their host, but at a cost to the energy budget of the host.
131
6. Conclusion and recommendations
6.1. Conclusion
Most freshwater ecosystems on Earth are threatened by anthropogenic activities such as mining
and agriculture that release metals into the environment. Over the last decade, research on the
effects of human impact on aquatic ecosystems, both lentic and lotic, has increased dramatically.
Bio-indicators are currently being used to assess the health of aquatic ecosystems, with parasites
gaining increasing attention due to the possibility of using them as early warning bio-indicators.
The aims of the study were firstly to determine the metal concentrations in three different aquatic
ecosystems, secondly to determine if the different ecosystem types have an impact on the
bioaccumulation of metals in Clarias gariepinus, thirdly to determine if different helminth parasites
can act as early warning bio-indicators for metal pollution, and lastly to see if endohelminth
parasites affect the biological responses of their hosts to metal accumulation.
6.1.1. Lentic aquatic ecosystems
6.1.1.1. Freshwater lentic ecosystem (Shokwe Pan)
Water and sediment samples were collected in triplicate at the Shokwe Pan in November 2018.
The study found that Shokwe Pan had the highest concentrations of all the different metals in the
sediment in comparison with the saline lentic system and the lotic system. Lentic systems are
known to act as a sink for metals. Although the concentrations of metals in the water of Shokwe
Pan were the highest of the three sites in the study, it was still below the target water quality
guidelines. Shokwe Pan had higher concentrations of most metals (Se, Pb, Cd, As and Mn) than
the lotic system, but lower concentrations of Al and similar concentrations of Ag. The freshwater
lentic system had lower water concentrations of all metals except for Al than the saline lentic
system. Although the water at Shokwe Pan had higher concentrations of Al, Zn and As than the
TWQR, the environmental concentrations of metals of Shokwe Pan were found to be in a natural
condition with little to no anthropogenic impact.
Clarias gariepinus in Shokwe Pan had the highest concentrations of Zn, Ni, Pb, Cd, Mn and Al in
their muscle tissue which reflects the environmental concentrations. Muscle tissue indicates
132
accumulation over a longer period and indicates a positive relationship with the sediment
concentrations. The bioaccumulation factors for Fe, Co, Zn, Cu, As, Cd, Pb and Se of the catfish
in Shokwe Pan were higher than those of the saline lentic pan, the salt in the saline pan binds to
the metals forming complexes and complicate metal accumulation. Shokwe Pan also had higher
BAFs for Fe, Zn, Al, Cd and Pb than the lotic system, the lentic systems had the highest
environmental concentrations of metals, thus metals was readily available for bioaccumulation.
The metal concentrations in the liver tissue of C. gariepinus was higher for Ni, Zn, Mn, Pb, Se and
Ag than in the lotic system and higher for Ni, Zn, Cu, Mn, As and Cd than in the saline lentic
system. Therefore, the bioaccumulation of metals over the long and short term was the highest in
the freshwater lentic system.
The parasite infections in the freshwater lentic system, Shokwe Pan had the highest prevalence
for both the Procamallanus sp. and Camallanus sp. Shokwe Pan had a higher number of parasites
than the lotic system but less than the saline lentic pan. Shokwe Pan is a temporary pan that dries
up during the dry season. This kills the intermediate hosts of the parasites negatively influencing
the parasite numbers in the pan. Tetracampos sp. (cestode) had the highest concentrations of
Fe, Co, and Ag, with Procamallanus sp. having the highest concentrations of Ni, Zn, Cu, Al, Mn,
As, Cd and Pb, and Contracaecum sp. for Se. The BAFs of the four different endohelminth
parasites show that Tetracampos sp. had the highest BAF for Fe, Co, Cd, Pb and Ag with
Procamallanus sp. having the highest for Ni, Zn, Cu, Al, As, Cd, Mn and Pb. Procamallanus sp.
was therefore the helminth parasite with the best bioaccumulation of metals in the freshwater
lentic system.
6.1.1.2. Saline lentic ecosystem (Nyamithi Pan)
Water and sediment samples were collected in triplicate from Nyamithi Pan in November 2018.
The present study found that Nyamithi Pan had higher concentrations of all the metals in the
sediment than the lotic system. The freshwater lentic system of Shokwe Pan, had the highest
levels of all the metals in the sediment. Nyamithi Pan is a permanent saline pan where the pan
acts as a sink for the metals, but the salt in the water form complexes with the metals and therefore
makes sediment adsorptions more difficult than in a freshwater pan. Nyamithi Pan had the highest
water concentrations of all the essential metals across the three sites as well as the highest water
concentrations of the non-essential metals: As, Pb and Se. Nyamithi Pan also had the lowest
concentrations of Al, Mg and Ag with Al being below detection limits.
133
The salt in the water binds to metals and keeps the metals from being adsorbed by the sediment
and therefore keeping the concentrations higher in the water. Although the concentrations of
metals in the water were the highest in Nyamithi Pan, it was not above the TQWR. Thus, the
environmental concentrations at Nyamithi Pan showed no anthropogenic disturbances. The C.
gariepinus at Nyamithi Pan had the lowest concentrations of most of the metals in the muscle
tissue. This is due to a combination of the lower concentrations of metals in the sediment of the
pan and the salt in the water of the pan forming complexes with the metals and making it harder
for uptake by the organisms.
The BAF for Nyamithi Pan was the lowest in terms of the concentrations of Fe, Co, Zn, Cu, As,
Cd, Pb and Se in the muscle and liver tissues of C. gariepinus. Clarias gariepinus at Nyamithi
Pan had the highest BAF for Mn and Ag compared with the other sites. The bioaccumulation
factors show that in a saline pan, bioaccumulations are more difficult than in fresh water. The
concentrations of Ni, Zn, Cu, As and Cd were also lower in the liver tissue than in the liver tissue
of catfish from the other two sites. It is therefore evident that saline lentic systems accumulate
metals less than its freshwater counterpart and even less than the lotic system.
The parasite infections in the saline water lentic system, Nyamithi Pan had the highest prevalence
for both the Tetracampos sp. and Contracaecum sp. Nyamithi Pan had the highest numbers of
parasites in comparison with the other two sites. Nyamithi Pan is a permanent saline pan, which
means that the intermediate hosts of the parasites can multiply throughout the year, positively
influencing the parasite numbers in the pan.
Tetracampos sp. had the highest concentrations of Co and Se, with Camallanus sp. having the
highest concentrations of Fe, Ni, Zn, Al, Mn, As, Cd, Pb and Ag. The BAFs of the five
endohelminth parasites located at Nyamithi Pan showed that Tetracampos sp. had the highest
BAFs for Co, Zn, Cu, Al, Mn and Se, with Camallanus sp. having the highest for BAFs for Fe, Ni,
Cu, As, Cd, Pb and Ag. Therefore, in the saline lentic system, the Camallanus sp. had the highest
bioaccumulation.
6.1.2. Lotic aquatic ecosystem (Usuthu River)
Water and sediment samples were collected in triplicate from the Usuthu River in November 2018.
The study found that the Usuthu River had the lowest concentrations of all the metals in the
134
sediment. Lotic systems flush the sediment downstream as a result of the running water,
preventing adsorption of metals. The lotic system had the lowest concentrations of Ni, As, Cd, Pb
and Se in the water when compared to the other two sites. The Usuthu River had the highest
concentrations of Al and Ag in the water. The water transports pollutants over great distances and
therefore diluting the metals to lower concentrations. Both the sediment and water concentrations
were well below the target quality guidelines and it is therefore safe to say that the lower Usuthu
River is in natural conditions without any major anthropogenic impact. The C. gariepinus in the
Usuthu River had the highest concentrations of Fe, Co, Cu, Se and Ag in their muscle tissue. For
the rest of the metals, the freshwater lentic system had the highest concentrations while the
freshwater lotic system and saline lentic system had very similar concentrations of the metals.
The C. gariepinus in the freshwater lotic system had the highest concentrations of Fe, Co, Cu, Al,
As and Cd in their liver tissue in comparison to C. gariepinus in the other systems. The BAFs of
C. gariepinus in the freshwater lotic system were the highest for Co, Ni, As and Se proving to
have higher BAFs than the C. gariepinus located in the saline lentic pan. The lotic system had the
lowest parasite numbers when compared to the other two sites. This can be as a result of the lotic
system not being confined and having larger areas for the catfish to swim and more places where
the intermediate hosts can live; therefore a smaller chance of infection.
The Tetracampos sp. in the C. gariepinus of the lotic system had the highest concentrations of
Fe, Co, Zn, Cu and Mn; with the Procamallanus sp. having the highest concentrations of As, Cd
and Pb; and the Camallanus sp. the highest concentrations for Ni, Al and Ag. The BAFs of the
different endohelminth parasites show that the Tetracampos sp. had the highest BAFs for Fe, Co,
Zn, Al and Mn, with the Camallanus sp. having the highest BAFs for Ni and Ag and the
Procamallanus sp. the highest for As, Cd and Pb proving that the Tetracampos sp. had the highest
bioaccumulation properties in the lotic system.
6.1.3. Parasites and biomarkers
The present study found that parasites plays an important role in the biomarker response of their
hosts, with the first impact being the stress caused by the parasites themselves. Infected fish are
more stressed due to high infection rates, which in turn cause an increase in energy usage by the
fish. The parasites also feed on nutrients required by the fish for normal bodily functions, this
cause even more stress on the fish. High metal concentrations can affect the biomarker response
135
of both the hosts as well as the parasites in different ways. The study found that C. gariepinus
produces higher levels of MTs when exposed to higher levels of metals while the Contracaecum
sp. produces higher levels of GSH at higher metal concentrations. Parasites are known to
bioaccumulate metals from their hosts by removing metals from their hosts. Parasites can
therefore have a positive effect on the biological response of their hosts to metal concentrations.
The study found that hosts with the highest number of parasites had the lowest MT production,
this indicates that the parasites had an effect on the biological response of their hosts to metal
concentrations. Although the host with the highest number of parasites had the lowest
concentrations of MTs they also had the lowest available energy as well as the lowest overall
CEA levels. The stress caused by the parasite infection thus had the greater effect on their hosts
than higher metal concentrations.
6.1.4. General conclusions
● This is the first study to determine the metal concentrations in different aquatic ecosystems
of the Ndumo Game Reserve. The study found that all three of the sites were in natural
conditions without any major anthropogenic impact.
● The freshwater lentic system had the highest concentrations of metals in the sediment
followed by the saline lentic system and the freshwater lotic system which had the lowest
concentrations of metals in the sediment.
● The saline lentic system had the highest concentrations of essential metals in the water
with the freshwater lentic system having the highest concentrations of most of the non-
essential metals and the freshwater lotic system having the lowest concentrations of most
of the essential metals in the water.
● The freshwater lentic system had the highest concentrations of metals present in the
muscle tissue of C. gariepinus, followed by the freshwater lotic system and lastly the saline
lentic system having the lowest concentrations of metals in the muscle tissue of C.
gariepinus.
● The freshwater lotic system had the highest concentrations of metals in the liver tissue of
C. gariepinus followed by the by the freshwater lentic system and the saline lentic system
having the lowest concentrations in the liver of C. gariepinus.
136
● The saline lentic system had the highest number of parasites across the three different
sites and even having a cestode species (Proteocephalus sp.) which was not present at
any of the other sites.
● It was important to analyse all the different endohelminth parasites as bio-indicators for
metals because different parasites accumulate different metals better.
● A high number of Contracaecum sp. in a host will remove metals from the host and lower
the bioaccumulations of the metals in the host muscle tissue.
● Procamallanus sp. had the highest bioaccumulation rates in the freshwater lentic system.
● Camallanus sp. had the highest bioaccumulation rates in the saline lentic system.
● Tetracampos sp. had the highest bioaccumulation rates in the freshwater lotic system.
● An increase in parasite load will cause a decrease in the biological response to metals by
lowering the MT response of the host due to the removal of metals.
● Hosts with the highest number of parasites have the lowest amount of CEA and therefore
they have less metals to deal with, but the parasites drain their energy.
6.2. Hypotheses
Hypothesis 1: Because lentic systems function as natural sinks for metals, they will have higher
concentrations of metals than lotic systems. The concentrations of metals present in all sites of
the study will be below the international guidelines for target water quality as well as international
sediment quality guidelines.
After the analysis of the water and sediment samples of the three sites, it was found that the
freshwater lentic system had the highest concentrations of all the metals in the sediment and most
metals in the water. It was only found that the saline lentic system had the highest concentrations
of most of the metals in the water when compared to the other two sites. It was also found that
both the water and sediment concentrations were below the TWQR and therefore the three sites
were in natural conditions with no major metal pollution present. Therefore, the two lentic systems
had higher metal concentrations in the environment and as a result the hypothesis is accepted.
Hypothesis 2: The bioaccumulation of metals in C. gariepinus at all three sites will reflect the
environmental conditions of the sites, with both the lentic systems (fresh and saline) having higher
bioaccumulation factors than the lotic system. Clarias gariepinus will also bioaccumulate the non-
essential metals to higher levels than the essential metals.
137
After analysing the metal concentrations in both the muscle and liver tissue of the C. gariepinus
from the three different sites and comparing them with the water concentrations, it was found that
the freshwater pan had the highest bioaccumulation rate in the organisms as was expected. It
was found that the freshwater lotic system had higher bioaccumulation rates than the saline lentic
system because of the salt forming complexes with the metals. Therefore, the hypothesis is
rejected as only one lentic system had higher BAFs.
Hypothesis 3: The parasites will prove to be better bio-indicators of both essential and non-
essential metals than their hosts due to the bioconcentration and biomagnification of the metals
in the parasites.
The metal concentrations in the five different endohelminth parasites were determined and
compared to the concentrations in both the host muscle and liver tissues. It was found that all
endohelminth parasites had higher concentrations of the different metals than their host muscle
tissue and higher than the liver tissue for most of the metals. Therefore, the hypothesis is
accepted.
Hypothesis 4: The parasites in the intestines will have higher accumulation rates of metals than
the Contracaecum sp. in the body cavity due to the higher concentration of metals in the intestinal
tract.
After the metal concentrations in the endoparasites were determined, they were compared with
each other to determine if a difference in accumulation had occurred. It was found that the
nematode Contracaecum sp. located in the body cavity had the lowest concentrations of all metals
except for Se. Therefore, the hypothesis is accepted as there was a clear difference in
accumulation of the parasites in the intestines than the body cavity parasites, with the parasites
in the intestines having higher concentrations of metals than the Contracaecum sp. in the body
cavity.
Hypothesis 5: There will be a gradient of metal accumulation in the nematode parasites with the
highest being in the parasites in the stomach due to the low pH making metals there more
bioavailable than in the rectum of the host.
When comparing the metal accumulation of the endohelminth parasites in the intestines of the
hosts we found that the different parasites accumulated different metals to higher concentrations
138
with no specific parasite accumulating metals to higher levels. Therefore, the hypothesis is
rejected as the location of parasites in their hosts did not have an effect on their accumulation
rates,
Hypothesis 6: An increase in endohelminth parasite numbers will alleviate the body burdens of
metals in the hosts thereby resulting in less stress experienced by the hosts to detoxify and
remove metals from their organs.
To analyse the effect of parasites on the biomarker responses of their hosts, the biomarker
responses of the hosts were compared between hosts with low parasite numbers and ones with
high parasite numbers. The study found that with an increase in parasite numbers, there was a
decrease in the metallothionein production in hosts as well as a decrease in available energy and
total cellular energy allocation. Therefore, the hypothesis is accepted as an increase in parasite
numbers lowers the MT’s production. It is also important to note that this advantage to the hosts
comes with a decrease in energy and may not necessarily be beneficial for the hosts.
6.3. Recommendations
For future studies, the author recommends that the following aspects be considered for inclusion:
● Conducting the study over different seasons as the parasite infections may be different.
● Increasing the number of hosts to 30 per site to ensure the collection of enough of the
endohelminth parasites to have more replicates for metal and biomarker analysis.
● Use different host species as different species have different parasite infection rates.
● Conduct the same type of study with different types of parasites to compare different
parasites effects on their hosts.
● Including more biomarkers in the study to search for more effects of parasites on their
hosts’ biomarkers and to be able to make a better case for the positive effect of parasites
on their hosts in the presence of metal pollution.
139
References
Adams, S. & Greeley, M. 2000. Ecotoxicological indicators of water quality: using multi-response
indicators to assess the health of aquatic ecosystems. Water, air, and soil pollution, 123(1-4):103-
115.
Adams, T.G., Atchison, G.J. & Vetter, R.J. 1980. The impact of an industrially contaminated lake
on heavy metal levels in its effluent stream. Hydrobiologia, 69(1-2):187-193.
Agah, H., Leermakers, M., Elskens, M., Fatemi, S.M.R. & Baeyens, W. 2009. Accumulation of
trace metals in the muscle and liver tissues of five fish species from the Persian Gulf.
Environmental monitoring and assessment, 157(1-4):499-514.
Ahmad, M., Islam, S., Rahman, M., Haque, M. & Islam, M. 2010. Heavy metals in water, sediment
and some fishes of Buriganga River, Bangladesh. International journal of environmental
research, 4(2):321-332.
Akcil, A. & Koldas, S. 2006. Acid Mine Drainage (AMD): causes, treatment and case studies.
Journal of cleaner production, 14:1139-1145.
Akinsanya, B. & Kuton, M.P. 2016. Bioaccumulation of heavy metals and parasitic fauna in
Synodontis clarias (Linnaeus, 1758) and Chrysichthys nigrodigitatus (Lacepede, 1803) from Lekki
Lagoon, Lagos, Nigeria. Asian Pacific journal of tropical disease, 6(8):615-621.
Akinsanya, B. & Otubanjo, O.A. 2006. Helminth parasites of Clarias gariepinus (Clariidae) in
Lekki Lagoon, Lagos, Nigeria. Revista de biología tropical, 54(1):93-99.
Alain, G., Tousignant, J. & Rozenfarb, E. 1993. Chronic arsenic toxicity. International journal of
dermatology, 32(12):899-901.
Alonso, M.L., Montaña, F.P., Miranda, M., Castillo, C., Hernández, J. & Benedito, J.L. 2004.
Interactions between toxic (As, Cd, Hg and Pb) and nutritional essential (Ca, Co, Cr, Cu, Fe, Mn,
Mo, Ni, Se, Zn) elements in the tissues of cattle from NW Spain. Biometals, 17(4):389-397.
Alwan, S., Hadi, A. & Shokr, A. 2009. Alterations in hematological parameters of fresh water
fish, Tilapia zillii, exposed to aluminum. Journal of science and its applications, 3(1):12-19.
140
Amiard, J.-C., Amiard-Triquet, C., Barka, S., Pellerin, J. & Rainbow, P. 2006. Metallothioneins
in aquatic invertebrates: their role in metal detoxification and their use as biomarkers. Aquatic
toxicology, 76(2):160-202.
Anderson, R. 2009. Fluvial dynamics of the Usuthu River and Banzi Pan, Ndumo Game Reserve.
Pretoria: University of Pretoria. (Dissertation – BSc Hons).
ANZECC (Australian and New Zealand Environment and Conservation Council) & ARMCANZ
(Agriculture and Resource Management Council of Australia and New Zealand). 2000. Australian
and New Zealand guidelines for fresh and marine water quality. Canberra.
https://www.waterquality.gov.au/sites/default/files/documents/anzecc-armcanz-2000-guidelines-
vol1.pdf Date of access: 10 Jun. 2019.
Arnesen, A., Abrahamsen, G., Sandvik, G. & Krogstad, T. 1995. Aluminium-smelters and fluoride
pollution of soil and soil solution in Norway. Science of the total environment, 163(1-3):39-53.
Arnot, J.A. & Gobas, F.A. 2006. A review of bioconcentration factor (BCF) and bioaccumulation
factor (BAF) assessments for organic chemicals in aquatic organisms. Environmental reviews,
14(4):257-297.
Asagba, S.O., Eriyamremu, G.E. & Igberaese, M.E. 2008. Bioaccumulation of cadmium and its
biochemical effect on selected tissues of the catfish (Clarias gariepinus). Fish physiology and
biochemistry, 34(1):61-69.
Atli, G. & Canli, M. 2007. Enzymatic responses to metal exposures in a freshwater fish
Oreochromis niloticus. Comparative biochemistry and physiology part C: toxicology &
pharmacology, 145(2):282-287.
Atli, G. & Canli, M. 2008. Responses of metallothionein and reduced glutathione in a freshwater
fish Oreochromis niloticus following metal exposures. Environmental toxicology and
pharmacology, 25(1):33-38.
ATSDR (Agency for Toxic Substances and Disease Registry). 2013a. Toxicological profile for
arsenic. U.S. Department of Health & Human Services, Atlanta, Georgia.
141
ATSDR (Agency for Toxic Substances and Disease Registry). 2013b. Toxicological profile for
cobalt. U.S. Department of Health & Human Services, Atlanta, Georgia.
ATSDR (Agency for Toxic Substances and Disease Registry). 2013c. Toxicological profile for
zinc. U.S. Department of Health & Human Services, Atlanta, Georgia.
Authman, M.M., Zaki, M.S., Khallaf, E.A. & Abbas, H.H. 2015. Use of fish as bio-indicator of the
effects of heavy metals pollution. Journal of aquaculture research & development, 6(4):1-13.
Avenant-Oldewage, A. & Marx, H. 2000. Bioaccumulation of chromium, copper and iron in the
organs and tissues of Clarias gariepinus in the Olifants River, Kruger National Park. Water SA,
26(4):569-582.
Avilán, L., Gualdrón-López, M., Quiñones, W., González-González, L., Hannaert, V., Michels,
P.A. & Concepción, J.-L. 2011. Enolase: a key player in the metabolism and a probable virulence
factor of trypanosomatid parasites: perspectives for its use as a therapeutic target. Enzyme
research, doi:10.4061/2011/932549.
Ayandiran, T., Fawole, O., Adewoye, S. & Ogundiran, M. 2009. Bioconcentration of metals in
the body muscle and gut of Clarias gariepinus exposed to sublethal concentrations of soap and
detergent effluent. Journal of cell and animal biology, 3(8):113-118.
Babault, J., Bonnet, S., Crave, A. & Van den Driessche, J. 2005. Influence of piedmont
sedimentation on erosion dynamics of an uplifting landscape: an experimental approach.
Geology, 33(4):301-304.
Bady, P., Dolédec, S., Fesl, C., Gayraud, S., Bacchi, M. & Schöll, F. 2005. Use of invertebrate
traits for the biomonitoring of European large rivers: the effects of sampling effort on genus
richness and functional diversity. Freshwater biology, 50:159-173.
Bailey, H.H. & Fairbairn, D. 1968. Lipid metabolism in helminth parasites: V. Absorption of fatty
acids and monoglycerides from micellar solution by Hymenolepis diminuta (Cestoda).
Comparative biochemistry and physiology, 26:819-836.
Barałkiewicz, D. & Siepak, J. 1999. Chromium, nickel and cobalt in environmental samples and
existing legal norms. Polish journal of environmental studies, 8(4):201-208.
142
Barber, I. 2005. Parasites grow larger in faster growing fish hosts. International journal for
parasitology, 35(2):137-143.
Barbour, M. & Yoder, C. 2000. The multimetric approach to bioassessment, as used in the United
States of America: assessing the biological quality of fresh waters: RIVPACS and other
techniques. (In Proceedings of an International Workshop held in Oxford, UK, on 16-18
September 1997. Freshwater Biological Association (FBA). p. 281-292).
Barson, M. 2004. The occurrence of Contracaecum sp. larvae (Nematoda: Anisakidae) in the
catfish Clarias gariepinus (Burchell) from Lake Chivero, Zimbabwe. Onderstepoort journal of
veterinary research, 71(1):35-39.
Bartram, J. & Ballance, R., eds. 1996. Water quality monitoring: a practical guide to the design
and implementation of freshwater quality studies and monitoring programmes. UNEP/WHO.
https://www.who.int/water_sanitation_health/resourcesquality/waterqualmonitor.pdf Date of
access: 29 Nov. 2019.
Barwick, M. & Maher, W. 2003. Biotransference and biomagnification of selenium copper,
cadmium, zinc, arsenic and lead in a temperate seagrass ecosystem from Lake Macquarie
Estuary, NSW, Australia. Marine environmental research, 56:471-502.
Baudrimont, M., Andres, S., Durrieu, G. & Boudou, A. 2003. The key role of metallothioneins in
the bivalve Corbicula fluminea during the depuration phase, after in situ exposure to Cd and Zn.
Aquatic toxicology, 63:89-102.
Baudrimont, M. & De Montaudouin, X. 2007. Evidence of an altered protective effect of
metallothioneins after cadmium exposure in the digenean parasite-infected cockle (Cerastoderma
edule). Parasitology, 134(2):237-245.
Baudrimont, M., De Montaudouin, X. & Palvadeau, A. 2006. Impact of digenean parasite infection
on metallothionein synthesis by the cockle (Cerastoderma edule): a multivariate field monitoring.
Marine pollution bulletin, 52(5):494-502.
143
Bednarska, A.J., Stachowicz, I. & Kuriańska, L. 2013. Energy reserves and accumulation of
metals in the ground beetle Pterostichus oblongopunctatus from two metal-polluted gradients.
Environmental science and pollution research, 20(1):390-398.
Belfiore, N.M. & Anderson, S.L. 2001. Effects of contaminants on genetic patterns in aquatic
organisms: a review. Mutation research-reviews in mutation research, 489(2-3):97-122.
Bergey, L., Weis, J.S. & Weis, P. 2002. Mercury uptake by the estuarine species Palaemonetes
pugio and Fundulus heteroclitus compared with their parasites, Probopyrus pandalicola and
Eustrongylides sp. Marine pollution bulletin, 44(10):1046-1050.
Bervoets, L. & Blust, R. 2003. Metal concentrations in water, sediment and gudgeon (Gobio
gobio) from a pollution gradient: relationship with fish condition factor. Environmental pollution,
126(1):9-19.
Bervoets, L., Blust, R. & Verheyen, R. 2001. Accumulation of metals in the tissues of three
spined stickleback (Gasterosteus aculeatus) from natural fresh waters. Ecotoxicology and
environmental safety, 48(2):117-127.
Birungi, Z., Masola, B., Zaranyika, M., Naigaga, I. & Marshall, B. 2007. Active biomonitoring of
trace heavy metals using fish (Oreochromis niloticus) as bioindicator species. The case of
Nakivubo wetland along Lake Victoria. Physics and chemistry of the earth, parts A/B/C, 32:1350-
1358.
Bligh, E.G. & Dyer, W.J. 1959. A rapid method of total lipid extraction and purification. Canadian
journal of biochemistry and physiology, 37(8):911-917.
Boomker, J.D.F. 1982. Parasites of South African freshwater fish: I. Some nematodes of the
catfish [Clarias gariepinus (Burchell, 1822)] from the Hartbeespoort Dam. The Onderstepoort
journal of veterinary research, 49(1):41-51.
Boomker, J.D.F. 1994. Parasites of South African freshwater fish: VI. Nematode parasites of
some fish species in the Kruger National Park. The Onderstepoort journal of veterinary research,
61(1):35-43.
144
Booth, A.J., Traas, G.R.L. & Weyl, O.L.F. 2010. Adult African sharptooth catfish, Clarias
gariepinus, population dynamics in a small invaded warm-temperate impoundment. African
zoology, 45(2):299-308.
Boyce, N.P. & Yamada, S.B. 1977. Effects of a parasite, Eubothrium salvelini (Cestoda:
Pseudophyllidea), on the resistance of juvenile sockeye salmon, Oncorhynchus nerka, to zinc.
Journal of the Fisheries Board of Canada, 34(5):706-709.
Bradford, M.M. 1976. A rapid and sensitive method for the quantitation of microgram quantities
of protein utilizing the principle of protein-dye binding. Analytical biochemistry, 72(1-2):248-254.
Brázová, T., Torres, J., Eira, C., Hanzelová, V., Miklisová, D. & Šalamún, P. 2012. Perch and its
parasites as heavy metal biomonitors in a freshwater environment: the case study of the Ružín
water reservoir, Slovakia. Sensors, 12(3):3068-3081.
Bremner, I. 1987. Interactions between metallothionein and trace elements. Progress in food &
nutrition science, 11(1):1-37.
Brezonik, P.L., King, S.O. & Mach, C.E. 1991. The influence of water chemistry on trace metal
bioavailability and toxicity to aquatic organisms. (In Newman, M.C. & McIntosh, A.W. eds. Metal
ecotoxicology: concepts and applications. Chelsea, Michigan: Lewis Publishers. p. 1-31).
(Advances in trace substances research).
Brophy, P. & Barrett, J. 1990. Glutathione transferase in helminths. Parasitology, 100(2):345-
349.
Brown, C., Joubert, A., Tlou, T., Birkhead, A., Marneweck, G., Paxton, B. & Singh, A. 2018. The
Pongola Floodplain, South Africa–part 2: holistic environmental flows assessment. Water SA,
44(4):746-759.
Bucheli, T.D. & Fent, K. 1995. Induction of cytochrome P450 as a biomarker for environmental
contamination in aquatic ecosystems. Critical reviews in environmental science and technology,
25(3):201-268.
145
Burger, J., Gaines, K.F., Boring, C.S., Stephens, W.L., Snodgrass, J., Dixon, C., McMahon, M.,
Shukla, S., Shukla, T. & Gochfeld, M. 2002. Metal levels in fish from the Savannah River:
potential hazards to fish and other receptors. Environmental research, 89(1):85-97.
Bury, N.R., Walker, P.A. & Glover, C.N. 2003. Nutritive metal uptake in teleost fish. Journal of
experimental biology, 206(Pt 1):11-23.
Calmano, W., Ahlf, W. & Förstner, U. 1990. Exchange of heavy metals between sediment
components and water. (In Broekaert, J.A.C., Güçer, Ş. & Adams, F., eds. Metal speciation in
the environment. Berlin: Springer. p. 523-543).
Calverley, P.M. & Downs, C.T. 2014. Habitat use by Nile crocodiles in Ndumo Game Reserve,
South Africa: a naturally patchy environment. Herpetologica, 70(4):426-438.
Calverley, P.M. & Downs, C.T. 2015. Movement and home range of Nile Crocodiles in Ndumo
Game Reserve, South Africa. Koedoe, 57(1):1-13.
CCME (Canadian Council of Ministers of the Environment). 2014. Canadian Environmental
Quality Guidelines. http://ceqg-rcqe.ccme.ca/en/index.html Date of access: 1 Jul. 2019.
Cempel, M. & Nikel, G. 2006. Nickel: a review of its sources and environmental toxicology.
Polish journal of environmental studies, 15(3):375-382.
Chen, H.-W., Liu, W.-C., Davis, A. & Jordán, F. 2008. Network position of hosts in food webs
and their parasite diversity. Oikos, 117(12):1847-1855.
Chen, H.-Y., Grabner, D. S., Nachev, M., Shih, H.-H. & Sures, B. 2015. Effects of the
acanthocephalan Polymorphus minutus and the microsporidian Dictyocoela duebenum on energy
reserves and stress response of cadmium exposed Gammarus fossarum. PeerJ, 3(10):e1353.
doi:10.7717/peerj.1353.
Chen, J., Blume, H.-P. & Beyer, L. 2000. Weathering of rocks induced by lichen colonization: a
review. Catena, 39(2):121-146.
Chen, M.-H. & Chen, C.-Y. 1999. Bioaccumulation of sediment-bound heavy metals in grey
mullet, Liza macrolepis. Marine pollution bulletin, 39:239-244.
146
Cheng, S., Grosse, W., Karrenbrock, F. & Thoennessen, M. 2002. Efficiency of constructed
wetlands in decontamination of water polluted by heavy metals. Ecological engineering,
18(3):317-325.
Chenoweth, J., Hadjikakou, M. & Zoumides, C. 2014. Quantifying the human impact on water
resources: a critical review of the water footprint concept. Hydrology and earth system sciences,
18(6):2325-2342.
Cho, Y. S., Lee, S. Y., Kim, K.-Y., Bang, I.C., Kim, D.S. & Nam, Y.K. 2008. Gene structure and
expression of metallothionein during metal exposures in Hemibarbus mylodon. Ecotoxicology
and environmental safety, 71(1):125-137.
Clarke, R. 2013. Water: the international crisis. https://doi.org/10.4324/9781315070261 Date
of access: 24 Jul. 2019.
Coetzee, L., Du Preez, H. & Van Vuren, J. 2002. Metal concentrations in Clarias gariepinus and
Labeo umbratus from the Olifants and Klein Olifants River, Mpumalanga, South Africa: zinc,
copper, manganese, lead, chromium, nickel, aluminium and iron. Water SA, 28(4):433-448.
Cohn, V.H. & Lyle, J. 1966. A fluorometric assay for glutathione. Analytical biochemistry,
14(3):434-440.
Cole, S., Codling, I., Zabel, T., Zabel, T., Nature, E. & Heritage, S.N. 1999. Guidelines for
managing water quality impacts within UK European marine sites. Report prepared by WRc for
UK Marine SACs project.
Combrink, A.S. 2004. Population survey of Crocodylus niloticus (Nile crocodile) at Lake Sibaya,
Republic of South Africa. Pietermaritzburg: University of KwaZulu-Natal. (Dissertation – Master
of Environment and Development).
Crafford, D. & Avenant-Oldewage, A. 2010. Bioaccumulation of non-essential trace metals in
tissues and organs of Clarias gariepinus (sharptooth catfish) from the Vaal River system:
strontium, aluminium, lead and nickel. Water SA, 36(5):621-640.
147
Crafford, D. & Avenant-Oldewage, A. 2011. Uptake of selected metals in tissues and organs of
Clarias gariepinus (sharptooth catfish) from the Vaal River System: chromium, copper, iron,
manganese and zinc. Water SA, 37(2):181-200.
Dahms, S., Baker, N. & Greenfield, R. 2017. Ecological risk assessment of trace elements in
sediment: a case study from Limpopo, South Africa. Ecotoxicology and environmental safety,
135:106-114.
Dahms-Verster, S., Baker, N. & Greenfield, R. 2018. A multivariate examination of ‘artificial
mussels’ in conjunction with spot water tests in freshwater ecosystems. Environmental monitoring
and assessment, 190(7):427. doi:10.1007/s10661-018-6764-6.
Dahms-Verster, S., Nel, A., Van Vuren, J. & Greenfield, R. 2019. Biochemical responses
revealed in an amphibian species after exposure to a forgotten contaminant: an integrated
biomarker assessment. Environmental toxicology and pharmacology, 73:103272.
doi:10.1016/j.etap.2019.103272
Dalton, J.P., Skelly, P. & Halton, D.W. 2004. Role of the tegument and gut in nutrient uptake by
parasitic platyhelminths. Canadian journal of zoology, 82(2):211-232.
Damm, B. & Hagedorn, J. 2010. Holocene floodplain formation in the southern Cape region,
South Africa. Geomorphology, 122(3-4):213-222.
DEAT (Department of Environmental Affairs and Tourism). 1996. Ndumo Game Reserve, South
Africa: information sheet for the site designated to the List of Wetlands of International Importance
in terms of the Convention on Wetlands of International Importance especially as Waterfowl
Habitat. South African Wetlands Conservation Programme. Document No: 24/21/3/3/3/15.
Pretoria.
De Buron, I., James, E., Riggs-Gelasco, P.J., Ringwood, A.H., Rolando, E. & Richardson, D.
2009. Overview of the status of heavy metal accumulation by helminths with a note on the use
of in vitro culture of adult acanthocephalans to study the mechanisms of bioaccumulation.
Neotropical helminthology, 3:101-110.
148
De Coen, W.M. & Janssen, C. 1997. The use of biomarkers in Daphnia magna toxicity testing:
IV. Cellular energy allocation: a new methodology to assess the energy budget of toxicant-
stressed Daphnia populations. Journal of aquatic ecosystem stress and recovery, 6(1):43-55.
De Coen, W.M. & Janssen, C.R. 2003. The missing biomarker link: relationships between effects
on the cellular energy allocation biomarker of toxicant‐stressed Daphnia magna and
corresponding population characteristics. Environmental toxicology and chemistry: an
international journal, 22:1632-1641.
De Oliveira-Filho, E.C., Lopes, R.M. & Paumgartten, F.J.R. 2004. Comparative study on the
susceptibility of freshwater species to copper-based pesticides. Chemosphere, 56:369-374.
Demirak, A., Yilmaz, F., Tuna, A.L. & Ozdemir, N. 2006. Heavy metals in water, sediment and
tissues of Leuciscus cephalus from a stream in southwestern Turkey. Chemosphere, 63:1451-
1458.
Dhanakumar, S., Solaraj, G. & Mohanraj, R. 2015. Heavy metal partitioning in sediments and
bioaccumulation in commercial fish species of three major reservoirs of river Cauvery delta region,
India. Ecotoxicology and environmental safety, 113:145-151.
Doherty, V., Ogunkuade, O. & Kanife, U. 2010. Biomarkers of oxidative stress and heavy metal
levels as indicators of environmental pollution in some selected fishes in Lagos, Nigeria.
American-Eurasian journal of agricultural & environmental sciences, 7(3):359-365.
Downs, C.A., Dillon, R.T., Jr., Fauth, J.E. & Woodley, C.M. 2001. A molecular biomarker system
for assessing the health of gastropods (Ilyanassa obsoleta) exposed to natural and anthropogenic
stressors. Journal of experimental marine biology and ecology, 259:189-214.
Du Preez, G. & Wepener, V. 2016. Influence of mining pollution on metal bioaccumulation and
biomarker responses in cave dwelling fish, Clarias gariepinus. Bulletin of environmental
contamination and toxicology, 97:18-23.
Dube, T., Wepener, V., Van Vuren, J., Smit, N. & Brendonck, L. 2015. The case for
environmental flow determination for the Phongolo River, South Africa. African journal of aquatic
science, 40(3):269-276.
149
Dudgeon, D., Arthington, A.H., Gessner, M.O., Kawabata, Z.-I., Knowler, D.J., Lévêque, C.,
Naiman, R.J., Prieur-Richard, A.-H., Soto, D. & Stiassny, M.L. 2006. Freshwater biodiversity:
importance, threats, status and conservation challenges. Biological reviews, 81(2):163-182.
Dudley, R.E., Gammal, L.M. & Klaassen, C.D. 1985. Cadmium-induced hepatic and renal injury
in chronically exposed rats: likely role of hepatic cadmium-metallothionein in nephrotoxicity.
Toxicology and applied pharmacology, 77(3):414-426.
DWAF (Department of Water Affairs and Forestry) 1996. South African water quality guidelines,
vol. 7: Aquatic Ecosystems. Pretoria: The Government Printer.
Dykaar, B.B. & Wigington, P.J., Jr. 2000. Floodplain formation and cottonwood colonization
patterns on the Willamette River, Oregon, USA. Environmental management, 25(1):87-104.
EC (European Commission). 2013. Directive 2013/39/EU of the European Parliament and of the
Council of 12 August 2013 amending Directives 2000/60/EC and 2008/105/EC as regards priority
substances in the field of water policy. https://eur-
lex.europa.eu/LexUriServ/LexUriServ.do?uri=OJ:L:2013:226:0001:0017:EN:PDF Date of
access: 29 Nov. 2019.
El-Moselhy, K.M., Othman, A., Abd El-Azem, H. & El-Metwally, M. 2014. Bioaccumulation of
heavy metals in some tissues of fish in the Red Sea, Egypt. Egyptian journal of basic and applied
sciences, 1(2):97-105.
Eneji, I.S., Sha’Ato, R. & Annune, P. 2011. Bioaccumulation of heavy metals in fish (Tilapia zilli
and Clarias gariepinus) organs from River Benue, North-Central Nigeria. Pakistan journal of
analytical & environmental chemistry, 12:25-31.
Erwin, K.L. 2009. Wetlands and global climate change: the role of wetland restoration in a
changing world. Wetlands ecology and management, 17:71-84.
Evans, D., Irwin, S. & Fitzpatrick, S. 2001. The effect of digenean (Platyhelminthes) infections
on heavy metal concentrations in Littorina littorea. Journal of the Marine Biological Association
of the United Kingdom, 81:349-350.
150
Extence, C.A., Chadd, R.P, England, J., Dunbar, M.J., Wood, P.J. & Taylor, E.D. 2013. The
assessment of fine sediment accumulation in rivers using macro‐invertebrate community
response. River research and applications, 29(1):17-55.
Ezat, M.A., Fritsch, C.J. & Downs, C.T. 2018. Use of an unmanned aerial vehicle (drone) to
survey Nile crocodile populations: a case study at Lake Nyamithi, Ndumo game reserve, South
Africa. Biological conservation, 223:76-81.
Farombi, E., Adelowo, O. & Ajimoko, Y. 2007. Biomarkers of oxidative stress and heavy metal
levels as indicators of environmental pollution in African cat fish (Clarias gariepinus) from Nigeria
Ogun River. International journal of environmental research and public health, 4(2):158-165.
Faust, B.C. 2018. A review of the photochemical redox reactions of iron (III) species in
atmospheric, oceanic, and surface waters: influences on geochemical cycles and oxidant
formation. (In Helz, G.R., Zepp, R.G. & Crosby, D.G., eds. Aquatic and surface photochemistry.
Boca Raton: CRC Press. p. 3-38).
Fernandes, D., Zanuy, S., Bebianno, M.J. & Porte, C. 2008. Chemical and biochemical tools to
assess pollution exposure in cultured fish. Environmental pollution, 152(1):138-146.
Fleischer, M., Sarofim, A. F., Fassett, D.W., Hammond, P., Shacklette, H.T., Nisbet, I.C. &
Epstein, S. 1974. Environmental impact of cadmium: a review by the Panel on Hazardous Trace
Substances. Environmental health perspectives, 7:253-323.
Flemming, C. & Trevors, J. 1989. Copper toxicity and chemistry in the environment: a review.
Water, air, and soil pollution, 44(1-2):143-158.
Förstner, U. & Wittmann, G.T. 2012. Metal pollution in the aquatic environment. Berlin: Springer.
Gabrashanska, M. & Nedeva, I. 1996. Content of heavy metals in the system fish-cestodes.
Parassitologia, 38:58.
Gabriel, U., Akinrotimi, O., Bekibele, D., Onunkwo, D. & Anyanwu, P. 2007. Locally produced
fish feed: potentials for aquaculture development in subsaharan Africa. African journal of
agricultural research, 2(7):287-295.
151
Gamal, A., Elsheikh, E. & Nasr, E. 2012. Morphological adaptation of the buccal cavity in relation
to feeding habits of the omnivorous fish Clarias gariepinus: a scanning electron microscopic study.
The journal of basic & applied zoology, 65:191-198.
Garbin, L., Diaz, J., Morgenthaler, A., Millones, A., Kuba, L., Fuchs, D. & Navone, G. 2019.
Cormorant pellets as a tool for the knowledge of parasite-intermediate host associations and
nematode diversity in the environment. Helminthologia, 56(4):296-302.
George, S.G. 1994. Enzymology and molecular biology of phase II xenobiotic-conjugating
enzymes in fish. (In Malins, D.C. & Ostrander, G.K. eds. Aquatic toxicology: molecular,
biochemical and cellular perspectives. Boca Raton: CRC Press. p. 37-85).
Gerber, R., Smit, N., Van Vuren, J.H., Ikenaka, Y. & Wepener, V. 2018. Biomarkers in tigerfish
(Hydrocynus vittatus) as indicators of metal and organic pollution in ecologically sensitive
subtropical rivers. Ecotoxicology and environmental safety, 157:307-317.
Gerber, R., Smit, N.J., Van Vuren, J.H. & Wepener, V. 2016. Metal concentrations in Hydrocynus
vittatus (Castelnau 1861) populations from a premier conservation area: relationships with
environmental concentrations. Ecotoxicology and environmental safety, 129:91-102.
Gioia, S.M., Babinski, M., Weiss, D.J. & Kerr, A.A. 2010. Insights into the dynamics and sources
of atmospheric lead and particulate matter in São Paulo, Brazil, from high temporal resolution
sampling. Atmospheric research, 98:478-485.
Gordon, A. & Muller, W. 2010. Developing sediment quality guidelines for South Africa. PHASE
1: Identification of international best practice and applications for South Africa to develop a
research and implementation framework. Report to the Water Research Commission.
http://www.wrc.org.za/wp-content/uploads/mdocs/KV%20242-
10%20Conservation%20of%20Water%20Ecosystems.pdf Date of access: 29 Nov. 2019.
Grams, P.E. & Schmidt, J.C. 2002. Streamflow regulation and multi-level flood plain formation:
channel narrowing on the aggrading Green River in the eastern Uinta Mountains, Colorado and
Utah. Geomorphology, 44(3):337-360.
152
Gray, C., Baird, D.J., Baumgartner, S., Jacob, U., Jenkins, G.B., O'Gorman, E.J., Lu, X., Ma, A.,
Pocock, M.J. & Schuwirth, N. 2014. Ecological networks: the missing links in biomonitoring
science. Journal of applied ecology, 51(5):1444-1449.
Greenfield, R., Van Vuren, J. & Wepener, V. 2012. Heavy metal concentrations in the water of
the Nyl River system, South Africa. African journal of aquatic science, 37(2):219-224.
Grobler, D., Kempster, P. & Van der Merwe, L. 1994. A note on the occurrence of metals in the
Olifants River, Eastern Transvaal, South Africa. Water SA, 20:195-203.
Gulelat, Y., Yimer, E., Asmare, K. & Bekele, J. 2013. Study on parasitic helminths infecting three
fish species from Koka reservoir, Ethiopia. SINET: Ethiopian journal of science, 36(2):73-80.
Gunn, A.M., Winnard, D.A. & Hunt, D.T. 1988. Trace metal speciation in sediment and soils. (In
Kramer, J.R. & Allen, H.E., eds. Metal speciation: theory, analysis and application. Boca Raton:
Lewis Publications. p. 261-294).
Gupta, A., Rai, D.K., Pandey, R.S. & Sharma, B. 2009. Analysis of some heavy metals in the
riverine water, sediments and fish from river Ganges at Allahabad. Environmental monitoring and
assessment, 157(1-4):449-458.
Hamer, D.H. 1986. Metallothionein. Annual review of biochemistry, 55:913-951.
Handy, R., Sims, D., Giles, A., Campbell, H. & Musonda, M. 1999. Metabolic trade-off between
locomotion and detoxification for maintenance of blood chemistry and growth parameters by
rainbow trout (Oncorhynchus mykiss) during chronic dietary exposure to copper. Aquatic
toxicology, 47:23-41.
Hassan, A.H., Al-Zanbagi, N.A. & Al-Nabati, E.A. 2016. Impact of nematode helminthes on metal
concentrations in the muscles of Koshar fish, Epinephelus summana, in Jeddah, Saudi Arabia.
Journal of basic & applied zoology, 74:56-61.
Haybach, A., Schöll, F., König, B. & Kohmann, F. 2004. Use of biological traits for interpreting
functional relationships in large rivers. Limnologica, 34(4):451-459.
153
Heath, A.G. 2018. Water pollution and fish physiology. Boca Raton: CRC press.
doi.10.1201/9780203718896
Heathwaite, A. 2010. Multiple stressors on water availability at global to catchment scales:
understanding human impact on nutrient cycles to protect water quality and water availability in
the long term. Freshwater biology, 55(1):241-257.
Heberer, T. 2002. Occurrence, fate, and removal of pharmaceutical residues in the aquatic
environment: a review of recent research data. Toxicology letters, 131(1-2):5-17.
Heeg, J. & Breen, C.M. 1982. Man and the Pongolo floodplain.
https://researchspace.csir.co.za/dspace/bitstream/handle/10204/2417/SANSP%20056.pdf?sequ
ence=1&isAllowed=y Date of access: 30 Nov. 2019.
Heinonen, J., Kukkonen, J. & Holopainen, I. 2000. Toxicokinetics of 2, 4, 5-trichlorophenol and
benzo (a) pyrene in the clam Pisidium amnicum: effects of seasonal temperatures and trematode
parasites. Archives of environmental contamination and toxicology, 39(3):352-359.
Heinonen, J., Kukkonen, J.V. & Holopainen, I.J. 1999. The effects of parasites and temperature
on the accumulation of xenobiotics in a freshwater clam. Ecological applications, 9(2):475-481.
Heinonen, J., Kukkonen, J.V. & Holopainen, I.J. 2001. Temperature‐and parasite‐induced
changes in toxicity and lethal body burdens of pentachlorophenol in the freshwater clam Pisidium
amnicum. Environmental toxicology and chemistry: an international journal, 20(12):2778-2784.
Huisman, E. & Richter, C. 1987. Reproduction, growth, health control and aquacultural potential
of the African catfish, Clarias gariepinus (Burchell 1822). Aquaculture, 63(1-4):1-14.
Hursky, O. & Pietrock, M. 2015. Intestinal nematodes affect selenium bioaccumulation, oxidative
stress biomarkers, and health parameters in juvenile rainbow trout (Oncorhynchus mykiss).
Environmental science & technology, 49(4):2469-2476.
Ibrahim, A.T.A. & Omar, H.M. 2013. Seasonal variation of heavy metals accumulation in muscles
of the African Catfish Clarias gariepinus and in River Nile water and sediments at Assiut
Governorate, Egypt. Journal of biology and earth sciences, 3(2):B236-B248.
154
Ibrahim, M.M. 2006. Energy allocation patterns in Biomphalaria alexandrina snails in response
to cadmium exposure and Schistosoma mansoni infection. Experimental parasitology, 112(1):31-
36.
Islam, M.S., Ahmed, M.K., Raknuzzaman, M., Habibullah-Al-Mamun, M. & Islam, M.K. 2015.
Heavy metal pollution in surface water and sediment: a preliminary assessment of an urban river
in a developing country. Ecological indicators, 48:282-291.
Izvekova, G., Kuperman, B. & Kuz'mina, V. 1997. Digestion and digestive-transport surfaces in
cestodes and their fish hosts. Comparative biochemistry and physiology part A: physiology,
118(4):1165-1171.
Jain, V., Fryirs, K. & Brierley, G. 2008. Where do floodplains begin? The role of total stream
power and longitudinal profile form on floodplain initiation processes. Geological Society of
America bulletin, 120(1-2):127-141.
Jankovská, I., Száková, J., Lukešová, D., Langrová, I., Válek, P., Vadlejch, J., Čadková, Z. &
Petrtýl, M. 2012. Effect of lead in water on the absorption of copper, iron, manganese and zinc
by sheep (Ovis aries) infected with sheep tapeworm (Moniezia expansa). Experimental
parasitology, 131(1):52-56.
Javed, M. & Usmani, N. 2013. Assessment of heavy metal (Cu, Ni, Fe, Co, Mn, Cr, Zn) pollution
in effluent dominated rivulet water and their effect on glycogen metabolism and histology of
Mastacembelus armatus. SpringerPlus, 2(1):390. doi:10.1186/2193-1801-2-390
Jezierska, B. & Witeska, M. 2006. The metal uptake and accumulation in fish living in polluted
waters. (In Twardowska, I., Allen, H.E., Häggblom, M.M. & Stefaniak, S. eds. Soil and water
pollution monitoring, protection and remediation. Springer. p. 107-114). (NATO science series,
69).
Jiang, Z., Xu, N., Liu, B., Zhou, L., Wang, J., Wang, C., Dai, B. & Xiong, W. 2018. Metal
concentrations and risk assessment in water, sediment and economic fish species with various
habitat preferences and trophic guilds from Lake Caizi, Southeast China. Ecotoxicology and
environmental safety, 157:1-8.
155
Jones, W. & Das, P. 1960. The mechanical properties of aluminium-lithium alloys. Journal of
the Institute of Metals, 88:435-443.
Jooste, A., Marr, S.M., Addo-Bediako, A. & Luus-Powell, W.J. 2015. Sharptooth catfish shows
its metal: a case study of metal contamination at two impoundments in the Olifants River, Limpopo
river system, South Africa. Ecotoxicology and environmental safety, 112:96-104.
Juncos, R., Arcagni, M., Squadrone, S., Rizzo, A., Arribére, M., Barriga, J., Battini, M., Campbell,
L., Brizio, P. & Abete, M. 2019. Interspecific differences in the bioaccumulation of arsenic of
three Patagonian top predator fish: organ distribution and arsenic speciation. Ecotoxicology and
environmental safety, 168:431-442.
Kadlec, R.H. & Wallace, S. 2008. Treatment wetlands. 2nd ed. Boca Raton: CRC Press.
Karadede, H. & Ünlü, E. 2000. Concentrations of some heavy metals in water, sediment and
fish species from the Atatürk Dam Lake (Euphrates), Turkey. Chemosphere, 41:1371-1376.
Karr, J.R. 1999. Defining and measuring river health. Freshwater biology, 41:221-234.
Kennedy, C. 1997. Freshwater fish parasites and environmental quality: an overview and
caution. Parassitologia, 39(3):249-254.
Khalil, M., Furness, D.N., Zholobenko, V. & Hoole, D. 2014. Effect of tapeworm parasitisation on
cadmium toxicity in the bioindicator copepod, Cyclops strenuus. Ecological indicators, 37:21-26.
Kim, S.-K. & Kannan, K. 2007. Perfluorinated acids in air, rain, snow, surface runoff, and lakes:
relative importance of pathways to contamination of urban lakes. Environmental science &
technology, 41:8328-8334.
King, S.L., Sharitz, R.R., Groninger, J.W. & Battaglia, L.L. 2009. The ecology, restoration, and
management of southeastern floodplain ecosystems: a synthesis. Wetlands, 29:624-634.
Kivaisi, A. K. 2001. The potential for constructed wetlands for wastewater treatment and reuse
in developing countries: a review. Ecological engineering, 16(4):545-560.
Kramer, A. 2003. Managing freshwater ecosystems of international water resources: the case
of the Maputo River in Mozambique (Working Paper on Management in Environmental Planning).
156
http://www.jav.tu-berlin.de/fileadmin/a0731/uploads/publikationen/workingpapers/wp00703.pdf
Date of access: 30 Nov. 2019.
Kuklina, I., Kouba, A. & Kozák, P. 2013. Real-time monitoring of water quality using fish and
crayfish as bio-indicators: a review. Environmental monitoring and assessment, 185(6):5043-
5053.
Kumar, V., Sinha, A.K., Rodrigues, P.P., Mubiana, V.K., Blust, R. & De Boeck, G. 2015. Linking
environmental heavy metal concentrations and salinity gradients with metal accumulation and
their effects: a case study in 3 mussel species of Vitória estuary and Espírito Santo bay, Southeast
Brazil. Science of the total environment, 523:1-15.
Lafferty, K.D. Dobson, A.P. & Kuris, A.M. 2006. Parasites dominate food web links. Proceedings
of the National Academy of Sciences of the United States of America, 103(30):11211-11216.
Lafferty, K.D. & Kuris, A.M. 1999. How environmental stress affects the impacts of parasites.
Limnology and oceanography, 44(3):925-931.
Lafferty, K., Shostak, A., Bush, A. & Lotz, J. 1997. Parasitology meets ecology on its own terms:
Margolis et al. revisited. The journal of parasitology, 83(4):575-583.
Lamas, S., Fernández, J., Aboal, J. & Carballeira, A. 2007. Testing the use of juvenile Salmo
trutta L. as biomonitors of heavy metal pollution in freshwater. Chemosphere, 67(2):221-228.
Leite, L.A., Pedro, N.H., De Azevedo, R.K., Kinoshita, A., Gennari, R.F., Watanabe, S. &
Abdallah, V.D. 2017. Contracaecum sp. parasitizing Acestrorhynchus lacustris as a bioindicator
for metal pollution in the Batalha River, southeast Brazil. Science of the total environment,
575:836-840.
Lemly, A.D. 2002. Selenium assessment in aquatic ecosystems: a guide for hazard evaluation
and water quality criteria. New York: Springer. (Springer series on environmental management).
Lemly, A.D. 2004. Aquatic selenium pollution is a global environmental safety issue.
Ecotoxicology and environmental safety, 59(1):44-56.
157
Li, L., Zheng, B. & Liu, L. 2010. Biomonitoring and bioindicators used for river ecosystems:
definitions, approaches and trends. Procedia environmental sciences, 2:1510-1524.
Livingstone, D. 2003. Oxidative stress in aquatic organisms in relation to pollution and
aquaculture. Revue de médecine vétérinaire, 154(6):427-430.
Lord, W.B. 1994. Flood hazard delineation: the one percent standard. Water resources update,
95(Spring):36-39.
Loucks, D.P. & Van Beek, E. 2017. Water resource systems planning and management: an
introduction to methods, models, and applications. New York: Springer.
Louis, F., Devin, S., Giambérini, L., Potet, M., David, E. & Pain-Devin, S. 2019. Energy allocation
in two dreissenid species under metal stress. Environmental pollution, 245:889-897.
Lucke, T. & Nichols, P.W. 2015. The pollution removal and stormwater reduction performance
of street-side bioretention basins after ten years in operation. Science of the total environment,
536:784-792.
Macías-Zamora, J., Villaescusa-Celaya, J., Muñoz-Barbosa, A. & Gold-Bouchot, G. 1999. Trace
metals in sediment cores from the Campeche shelf, Gulf of Mexico. Environmental pollution,
104(1):69-77.
MacKenzie, K. 1999. Parasites as pollution indicators in marine ecosystems: a proposed early
warning system. Marine pollution bulletin, 38(11):955-959.
Madanire-Moyo, G. & Avenant-Oldewage, A. 2013. Occurrence of Tetracampos ciliotheca and
Proteocephalus glanduligerus in Clarias gariepinus (Burchell, 1822) collected from the Vaal Dam,
South Africa. Onderstepoort journal of veterinary research, 80(1):1-5.
Mansour, S. & Sidky, M. 2002. Ecotoxicological studies: 3. Heavy metals contaminating water
and fish from Fayoum Governorate, Egypt. Food chemistry, 78(1):15-22.
Marchini, A., Munari, C. & Mistri, M. 2008. Functions and ecological status of eight Italian lagoons
examined using biological traits analysis (BTA). Marine pollution bulletin, 56(6):1076-1085.
158
Marcogliese, D.J. 2005. Parasites of the superorganism: are they indicators of ecosystem
health? International journal for parasitology, 35(7):705-716.
Marcogliese, D.J. & Pietrock, M. 2011. Combined effects of parasites and contaminants on
animal health: parasites do matter. Trends in parasitology, 27(3):123-130.
Markert, B. 2007. Definitions and principles for bioindication and biomonitoring of trace metals
in the environment. Journal of trace elements in medicine and biology, 21(S1):77-82.
Markert, B.A., Breure, A.M. & Zechmeister, H.G., eds. 2003. Bioindicators and biomonitors.
Philadelphia: Elsevier. (Trace metals and other contaminants in the environment, 6).
Martin, C.W. 2000. Heavy metal trends in floodplain sediments and valley fill, River Lahn,
Germany. Catena, 39(1):53-68.
Mashego, J. 1981. Observations on the prevalence of nematode parasites of the catfish, Clarias
gariepinus (Burchell 1811), in Lebowa, South Africa. South African journal of wildlife research,
11(2):46-48.
Mashego, S. 1989. Nematode parasites of Barbus species in Lebowa and Venda, South Africa.
South African journal of wildlife research, 19(1):35-37.
McCarthy, T.S. 2011. The impact of acid mine drainage in South Africa. South African journal
of science, 107(5-6):1-7.
McCarthy, T. S., Tooth, S., Jacobs, Z., Rowberry, M.D., Thompson, M., Brandt, D., Hancox, P.J.,
Marren, P.M., Woodborne, S. & Ellery, W.N. 2011. The origin and development of the Nyl River
floodplain wetland, Limpopo Province, South Africa: trunk-tributary river interactions in a dryland
setting. South African geographical journal, 93(2):172-190.
McGeoch, M.A. & Chown, S.L. 1998. Scaling up the value of bioindicators. Trends in ecology &
evolution, 13(2):46-47.
Meena, R.A.A., Sathishkumar, P., Ameen, F., Yusoff, A.R.M. & Gu, F.L. 2018. Heavy metal
pollution in immobile and mobile components of lentic ecosystems: a review. Environmental
science and pollution research, 25(5):4134-4148.
159
Miikue-Yobe, T. & Ibara, U. 2019. Determination of Pb, Hg, Cd, Cu, Ni and V in Periwinkle
(Tympanotonus fuscatus), Crab (Callinectes pali) and Fish (Rhodeus amarus) from Bodo River.
International journal of pure & applied bioscience, 7:14-21.
Mijošek, T., Marijić, V.F., Dragun, Z., Krasnići, N., Ivanković, D. & Erk, M. 2019. Evaluation of
multi-biomarker response in fish intestine as an initial indication of anthropogenic impact in the
aquatic karst environment. Science of the total environment, 660:1079-1090.
Mohan, M.S., Zingaro, R.A., Micks, P. & Clark, P.J. 1982. Analysis and speciation of arsenic in
herbicide-treated soils by DC helium emission spectrometry. International journal of
environmental analytical chemistry, 11:175-187.
Moolman, L., Van Vuren, J. & Wepener, V. 2007. Comparative studies on the uptake and effects
of cadmium and zinc on the cellular energy allocation of two freshwater gastropods.
Ecotoxicology and environmental safety, 68(3):443-450.
Moravec, F. 1975. The development of Procamallanus laeviconchus (Wedl, 1862) (Nematoda:
Camallanidae). Acta Societatis Zoologicae Bohemoslovacae, 39:23-38.
Morley, N. 2010. Interactive effects of infectious diseases and pollution in aquatic molluscs.
Aquatic toxicology, 96(1):27-36.
Morley, N., Lewis, J. & Hoole, D. 2006. Pollutant-induced effects on immunological and
physiological interactions in aquatic host-trematode systems: implications for parasite
transmission. Journal of helminthology, 80(2):137-149.
Morris, T., Avenant-Oldewage, A., Lamberth, S. & Reed, C. 2016. Shark parasites as bio-
indicators of metals in two South African embayments. Marine pollution bulletin, 104(1-2):221-
228.
Mucha, A.P., Vasconcelos, M.T.S. & Bordalo, A.A. 2003. Macrobenthic community in the Douro
estuary: relations with trace metals and natural sediment characteristics. Environmental pollution,
121(2):169-180.
Mudd, G.M. 2010. Global trends and environmental issues in nickel mining: sulfides versus
laterites. Ore geology reviews, 38(1-2):9-26.
160
Murtala, B.A., Abdul, W.O. & Akinyemi, A.A. 2012. Bioaccumulation of heavy metals in fish
(Hydrocynus forskahlii, Hyperopisus bebe occidentalis and Clarias gariepinus) organs in
downstream Ogun coastal water, Nigeria. Journal of agricultural science, 4(11):51-59.
Musa, R., Gerber, R. & Greenfield, R. 2017. A multivariate analysis of metal concentrations in
two fish species of the Nyl River System, Limpopo Province, South Africa. Bulletin of
environmental contamination and toxicology, 98(6):817-823.
Ng, J.C., Wang, J. & Shraim, A. 2003. A global health problem caused by arsenic from natural
sources. Chemosphere, 52(9):1353-1359.
NRC (National Research Council). 1987. Biological markers in environmental health research.
Environmental health perspectives, 74:3-9. doi:10.1289/ehp.74-1474499
https://www.ncbi.nlm.nih.gov/pmc/articles/PMC1474499/pdf/envhper00433-0008.pdf Date of
access: 29 Nov. 2019.
Nunes, A.L., Zengeya, T.A., Hoffman, A.C., Measey, G.J. & Weyl, O.L. 2017. Distribution and
establishment of the alien Australian redclaw crayfish, Cherax quadricarinatus, in South Africa
and Swaziland. PeerJ, 5:e3135. doi:10.7717/peerj.3135.
Oké, V. & Goosen, N.J. 2019. The effect of stocking density on profitability of African catfish
(Clarias gariepinus) culture in extensive pond systems. Aquaculture, 507:385-392.
Olufemi, B., Akinlabi, D. & Agbede, S. 1991. Aerobic bacterial pathogens isolated from the
African catfish Clarias gariepinus. Tropical veterinarian, 9:177-180.
Omacini, M., Chaneton, E.J., Ghersa, C.M. & Müller, C.B. 2001. Symbiotic fungal endophytes
control insect host-parasite interaction webs. Nature, 409(6816):78-81.
Orr, P.L., Guiguer, K.R. & Russel, C.K. 2006. Food chain transfer of selenium in lentic and lotic
habitats of a western Canadian watershed. Ecotoxicology and environmental safety, 63(2):175-
188.
Osman, A., Wang, C.K., Winter, A., Loukas, A., Tribolet, L., Gasser, R.B. & Hofmann, A. 2012.
Hookworm SCP/TAPS protein structure: a key to understanding host-parasite interactions and
developing new interventions. Biotechnology advances, 30(3):652-657.
161
Osman, A.G. & Kloas, W. 2010. Water quality and heavy metal monitoring in water, sediments,
and tissues of the African Catfish Clarias gariepinus (Burchell, 1822) from the River Nile, Egypt.
Journal of environmental protection, 1(4):389-400.
Ostroumov, S. 1998. Biological filtering and ecological machinery for self-purification and
bioremediation in aquatic ecosystems: towards a holistic view. Rivista di biologia, 91(2):221-232.
Otachi, E.O., Körner, W., Avenant-Oldewage, A., Fellner-Frank, C. & Jirsa, F. 2014. Trace
elements in sediments, blue spotted tilapia Oreochromis leucostictus (Trewavas, 1933) and its
parasite Contracaecum multipapillatum from Lake Naivasha, Kenya, including a comprehensive
health risk analysis. Environmental science and pollution research, 21:7339-7349.
Otitoloju, A. & Olagoke, O. 2011. Lipid peroxidation and antioxidant defense enzymes in Clarias
gariepinus as useful biomarkers for monitoring exposure to polycyclic aromatic hydrocarbons.
Environmental monitoring and assessment, 182(1-4):205-213.
Oyoo-Okoth, E., Admiraal, W., Osano, O., Hoitinga, L. & Kraak, M.H. 2010. Metal specific
partitioning in a parasite-host assemblage of the cestode Ligula intestinalis and the cyprinid fish
Rastrineobola argentea. Science of the total environment, 408:1557-1562.
Oyoo-Okoth, E., Admiraal, W., Osano, O., Kraak, M.H., Gichuki, J. & Ogwai, C. 2012. Parasites
modify sub-cellular partitioning of metals in the gut of fish. Aquatic toxicology, 106:76-84.
Oyoo‐Okoth, E., Wim, A., Osano, O., Kraak, M.H., Ngure, V., Makwali, J. & Orina, P.S. 2010.
Use of the fish endoparasite Ligula intestinalis (L., 1758) in an intermediate cyprinid host
(Rastreneobola argentea) for biomonitoring heavy metal contamination in Lake Victoria, Kenya.
Lakes & reservoirs: research & management, 15(1):63-73.
Palma, P., Ledo, L. & Alvarenga, P. 2015. Assessment of trace element pollution and its
environmental risk to freshwater sediments influenced by anthropogenic contributions: the case
study of Alqueva reservoir (Guadiana Basin). Catena, 128:174-184.
doi.10.1016/j.catena.2015.02.002
Pekey, H. 2006. Heavy metal pollution assessment in sediments of the Izmit Bay, Turkey.
Environmental monitoring and assessment, 123(1-3):219-231.
162
Pickering, Q.H. 1974. Chronic toxicity of nickel to the fathead minnow. Journal (Water Pollution
Control Federation), 46:760-765.
Pietrock, M. & Marcogliese, D.J. 2003. Free-living endohelminth stages: at the mercy of
environmental conditions. Trends in parasitology, 19(7):293-299.
Pinedo-Hernández, J., Marrugo-Negrete, J. & Díez, S. 2015. Speciation and bioavailability of
mercury in sediments impacted by gold mining in Colombia. Chemosphere, 119:1289-1295.
Pooley, A. 1982. The status of African crocodiles in 1980. (In Crocodiles. Proceedings of the
5th Working Meeting of the IUCN/SSC Crocodile Specialist Group, Gainesville, Florida. Gland,
Switzerland: IUCN Publications. p. 174-228).
Power, M.E., Parker, G., Dietrich, W.E. & Sun, A. 1995. How does floodplain width affect
floodplain river ecology? A preliminary exploration using simulations. Geomorphology, 13:301-
317.
Pracheil, B.M., Adams, S.M., Bevelhimer, M.S., Fortner, A.M., Greeley, M.S., Murphy, C.A.,
Mathews, T.J. & Peterson, M.J. 2016. Relating fish health and reproductive metrics to
contaminant bioaccumulation at the Tennessee Valley Authority Kingston coal ash spill site.
Ecotoxicology, 25:1136-1149.
Prawiranegara, M. 2014. Spatial multi-criteria analysis (SMCA) for basin-wide flood risk
assessment as a tool in improving spatial planning and urban resilience policy making: a case
study of Marikina river basin, metro Manila-Philippines. Procedia-Social and behavioral sciences,
135:18-24.
Rai, P.K. 2008. Heavy metal pollution in aquatic ecosystems and its phytoremediation using
wetland plants: an ecosustainable approach. International journal of phytoremediation,
10(2):133-160.
Rainbow, P.S. 1998. Phylogeny of trace metal accumulation in crustaceans. (In Langston, W.J.
& Bebianno, M.J., eds. Metal metabolism in aquatic environments. Berlin: Springer. p. 285-319).
(Ecotoxicology series, 7).
163
Rasouli, M., Ostovar-Ravari, A. & Shokri-Afra, H. 2014. Characterization and improvement of
phenol-sulfuric acid microassay for glucose-based glycogen. European review for medical and
pharmacological sciences, 18(14):2020-2024.
Rasouli, M., Shokri-Afra, H. & Ostovar-Ravari, A. 2015. A new protocol for separation of acid
soluble and insoluble fractions from total glycogen and simultaneous measurements. European
review for medical and pharmacological sciences, 19(10):1785-1789.
Ribeiro, C.O., Vollaire, Y., Sanchez-Chardi, A. & Roche, H. 2005. Bioaccumulation and the
effects of organochlorine pesticides, PAH and heavy metals in the Eel (Anguilla anguilla) at the
Camargue Nature Reserve, France. Aquatic toxicology, 74(1):53-69.
Ritterhoff, J. & Zauke, G.-P. 1998. Potential role of metal-binding proteins in cadmium
detoxification in Themisto libellula (Mandt) and Themisto abyssorum Boeck from the Greenland
Sea. Marine environmental research, 45(2):179-191.
Robar, N., Murray, D.L. & Burness, G. 2011. Effects of parasites on host energy expenditure:
the resting metabolic rate stalemate. Canadian journal of zoology, 89(11):1146-1155.
Roesijadi, G. & Fowler, B. 1991. Purification of invertebrate metallothioneins. Methods in
enzymology, 205:263-273.
Romano, M.P. 1964. The water resources of the Maputo (Southern Mozambique). South African
journal of science, 60(8):245-251.
Ruus, A., Skaare, J. & Ingebrigtsen, K. 2001. Accumulation of the lipophilic environmental
contaminant lindane in metacercariae of Bucephaloides gracilescens (Trematoda, Bucephalidae)
in the central nervous system of bullrout Myoxocephalus scorpius. Diseases of aquatic
organisms, 48(1):75-77.
Saliu, J.K. & Bawa-Allah, K.A. 2012. Toxicological effects of lead and zinc on the antioxidant
enzyme activities of post juvenile Clarias gariepinus. Resources and environment, 2(1):21-26.
Sanchez, M.I., Pons, I., Martinez-Haro, M., Taggart, M.A., Lenormand, T. & Green, A.J. 2016.
When parasites are good for health: cestode parasitism increases resistance to arsenic in brine
shrimps. PLoS pathogens, 12(3):e1005459.
164
Sancho, E., Ferrando, M. & Andreu, E. 1998. Effects of sublethal exposure to a pesticide on
levels of energetic compounds in Anguilla anguilla. Journal of environmental science & health.
Part B. Pesticides, food contaminants, and agricultural wastes, 33(4):411-424.
Satarug, S., Baker, J.R., Urbenjapol, S., Haswell-Elkins, M., Reilly, P.E., Williams, D.J. & Moore,
M.R. 2003. A global perspective on cadmium pollution and toxicity in non-occupationally exposed
population. Toxicology letters, 137:65-83.
Sauliutė, G. & Svecevičius, G. 2015. Heavy metal interactions during accumulation via direct
route in fish: a review. Zoology and ecology, 25:77-86.
Schramm, M., Muller, E. & Triebskorn, R. 1998. Brown trout Salmo trutta f. Fario liver
ultrastructure as a biomarker for assessment of small stream pollution. Biomarkers, 3(2):93-108.
Seixas, T.G., Kehrig, H.D. A., Fillmann, G., Di Beneditto, A.P.M., Souza, C.M., Secchi, E.R.,
Moreira, I. & Malm, O. 2007. Ecological and biological determinants of trace elements
accumulation in liver and kidney of Pontoporia blainvillei. Science of the total environment, 385(1-
3):208-220.
Sevcikova, M., Modra, H., Slaninova, A. & Svobodova, Z. 2011. Metals as a cause of oxidative
stress in fish: a review. Veterinární medicína, 56(11):537-546.
Shaw, M.R. & Hochberg, M.E. 2001. The neglect of parasitic Hymenoptera in insect conservation
strategies: the British fauna as a prime example. Journal of Insect Conservation, 5:253-263.
Shrivastava, A. 2009. A review on copper pollution and its removal from water bodies by pollution
control technologies. Indian journal of environmental protection, 29(6):552-560.
Shugart, L.R., McCarthy, J.F. & Halbrook, R.S. 1992. Biological markers of environmental and
ecological contamination: an overview. Risk analysis, 12:353-360.
Sibley, L. 2004. Intracellular parasite invasion strategies. Science, 304(5668):248-253.
Simpson, S.L., Pryor, I.D., Mewburn, B.R., Batley, G.E. & Jolley, D. 2002. Considerations for
capping metal-contaminated sediments in dynamic estuarine environments. Environmental
science & technology, 36(17):3772-3778.
165
Sindermann, C.J. 1987. Effects of parasites on fish populations: practical considerations.
International journal for parasitology, 17(2):371-382.
Skelton, P.H. 2012. A complete guide to the freshwater fishes of Southern Africa. 2nd ed. South
Africa: Penguin Random House.
Smit, N., Vlok, W., Van Vuren, J.H. J., Du Preez, L., Van Eeden, E. S., O'Brien, G. & Wepener,
V. 2016. Socio-ecological system management of the lower Phongolo river and floodplain using
relative risk methodology: report to the Water Research Commission. Gezina, South Africa:
Water Research Commission.
Smolders, R., Bervoets, L., De Coen, W. & Blust, R. 2004. Cellular energy allocation in zebra
mussels exposed along a pollution gradient: linking cellular effects to higher levels of biological
organization. Environmental pollution, 129(1):99-112.
Smolders, R., De Boeck, G. & Blust, R. 2003. Changes in cellular energy budget as a measure
of whole effluent toxicity in zebrafish (Danio rerio). Environmental toxicology and chemistry,
22(4):890-899.
Steffen, W., Crutzen, P.J. & McNeill, J.R. 2007. The Anthropocene: are humans now
overwhelming the great forces of nature? AMBIO: A journal of the human environment,
36(8):614-622.
Stegeman, J.J., Brower, M., Di Giulio, R.T., Förlin, L., Fowler, B.A., Sanders, B.Μ. & Van Veld,
P.A. 1992. Molecular responses to environmental contamination: enzyme and protein systems
as indicators of chemical exposure and effect. (In Huggett, R.J., Kimerle, R.A., Mehrle, P.P., Jr.
& Bergman, H.L. eds. Biomarkers: biochemical, physiological, and histological markers of
anthropogenic stress. Boca Raton, FL: CRC Press. p. 235-335).
Stephenson, D. 2002. Integrated flood plain management strategy for the Vaal. Urban water,
4(4):423-428.
Strimbu, K. & Tavel, J.A. 2010. What are biomarkers? Current opinion in HIV and AIDS,
5(6):463-466.
166
Stuart, C. & Stuart, M. 2018. Stuart's Field Guide to National Parks & Nature Reserves of South
Africa. 2nd ed. Cape Town: Struik Nature,
Sunjog, K., Kolarević, S., Kračun-Kolarević, M., Višnjić-Jeftić, Ž., Gačić, Z., Lenhardt, M. &
Vuković-Gačić, B. 2019. Seasonal variation in metal concentration in various tissues of the
European chub (Squalius cephalus L.). Environmental science and pollution research, 26:9232-
9243.
Sures, B. 1996. Untersuchungen zur Schwermetallakkumulation von Helminthen im Vergleich
zu ihren aquatischen Wirten [“Studies on heavy metal accumulation in helminths as compared
with their aquatic hosts”]. Karlsruhe: Universität Karlsruhe. (Dissertation – PhD).
Sures, B. 2001. The use of fish parasites as bioindicators of heavy metals in aquatic ecosystems:
a review. Aquatic ecology, 35(2):245-255.
Sures, B. 2002. Competition for minerals between Acanthocephalus lucii and its definitive host
perch (Perca fluviatilis). International journal for parasitology, 32(9):1117-1122.
Sures, B. 2003. Accumulation of heavy metals by intestinal helminths in fish: an overview and
perspective. Parasitology, 126(7):S53-S60.
Sures, B. 2004. Environmental parasitology: relevancy of parasites in monitoring environmental
pollution. Trends in parasitology, 20(4):170-177.
Sures, B. 2006. How parasitism and pollution affect the physiological homeostasis of aquatic
hosts. Journal of helminthology, 80(2):151-157.
Sures, B. 2008. Environmental parasitology: interactions between parasites and pollutants in the
aquatic environment. Parasite, 15(3):434-438.
Sures, B., Nachev, M., Selbach, C. & Marcogliese, D.J. 2017. Parasite responses to pollution:
what we know and where we go in ‘Environmental Parasitology’. Parasites & vectors, 10(1):65.
doi:10.1186/s13071-017-2001-3.
167
Sures, B., Ruchter, N. & Zimmermann, S. 2015. Biological effects of PGE on aquatic organisms.
(In Zereini, F. & Wiseman, C.L.S. eds. Platinum metals in the environment. Berlin: Springer. p.
383-400).
Sures, B. & Siddall, R. 1999. Pomphorhynchus laevis: the intestinal acanthocephalan as a lead
sink for its fish host, chub (Leuciscus cephalus). Experimental parasitology, 93(2):66-72.
Sures, B., Steiner, W., Rydlo, M. & Taraschewski, H. 1999. Concentrations of 17 elements in
the zebra mussel (Dreissena polymorpha), in different tissues of perch (Perca fluviatilis), and in
perch intestinal parasites (Acanthocephalus lucii) from the subalpine lake Mondsee, Austria.
Environmental toxicology and chemistry, 18(11):2574-2579.
Sures, B., Taraschewski, H. & Rokicki, J. 1997. Lead and cadmium content of two cestodes,
Monobothrium wageneri and Bothriocephalus scorpii, and their fish hosts. Parasitology research,
83(6):618-623.
Sutherland, R. 2000. Depth variation in copper, lead, and zinc concentrations and mass
enrichment ratios in soils of an urban watershed. Journal of environmental quality, 29:1414-1422.
Svitin, R., Truter, M., Kudlai, O., Smit, N. J. & Du Preez, L. 2019. Novel information on the
morphology, phylogeny and distribution of camallanid nematodes from marine and freshwater
hosts in South Africa, including the description of Camallanus sodwanaensis n. sp. International
journal for parasitology: parasites and wildlife, 10:263-273.
Szefer, P., Rokicki, J., Frelek, K., Skóra, K. & Malinga, M. 1998. Bioaccumulation of selected
trace elements in lung nematodes, Pseudalius inflexus, of harbor porpoise (Phocoena phocoena)
in a Polish zone of the Baltic Sea. Science of the total environment, 220(1):19-24.
Taylor, M.P. & Lewin, J. 1996. River behaviour and Holocene alluviation: the River Severn at
Welshpool, mid‐Wales, UK. Earth surface processes and landforms, 21:77-91.
Tchounwou, P.B., Yedjou, C.G., Patlolla, A.K. & Sutton, D.J. 2012. Heavy metal toxicity and the
environment. Molecular, clinical and environmental toxicology, 101:133-164. doi.10.1007/978-3-
7643-8340-4_6
168
Tendaupenyu, P. & Magadza, C.H. 2019. Enrichment and geoaccumulation of metals in the
superficial sediments of Lake Chivero, Zimbabwe. Lakes & reservoirs: research & management,
24:275-286. doi.10.1111/lre.12282
Ter Braak, C.J. & Smilauer, P. 2012. Canoco reference manual and user's guide: software for
ordination, version 5.0. https://library.wur.nl/WebQuery/wurpubs/431861 Date of access: 30
Nov. 2019.
Terra, B.F., Araújo, F.G., Calza, C. F., Lopes, R.T. & Teixeira, T.P. 2008. Heavy metal in tissues
of three fish species from different trophic levels in a tropical Brazilian river. Water, air, and soil
pollution, 187(1-4):275-284.
Thiele, D.J. 1992. Metal-regulated transcription in eukaryotes. Nucleic acids research,
20(6):1183.
Thielen, F., Zimmermann, S., Baska, F., Taraschewski, H. & Sures, B. 2004. The intestinal
parasite Pomphorhynchus laevis (Acanthocephala) from barbel as a bioindicator for metal
pollution in the Danube River near Budapest, Hungary. Environmental pollution, 129:421-429.
Thomann, R.V. 1989. Bioaccumulation model of organic chemical distribution in aquatic food
chains. Environmental science & technology, 23(6):699-707.
Thornton, J., McComb, A. & Ryding, S. 1995. The role of sediments. (In McComb, A. ed.
Eutrophic shallow estuaries and lagoons. Boca Raton: CRC Press. p. 205-233).
Tilzer, M. & Khondker, M. 1993. Hypertrophic and polluted freshwater ecosystems: ecological
basis for water resource management. (In Proceedings of an international symposium on
limnology held in Dhaka, Bangladesh, 25- 28 November 1991. Bangladesh: Dept. of Botany,
Dhaka University).
Tria, J., Butler, E.C., Haddad, P.R. & Bowie, A.R. 2007. Determination of aluminium in natural
water samples. Analytica chimica acta, 588:153-165.
Trombulak, S.C. & Frissell, C.A. 2000. Review of ecological effects of roads on terrestrial and
aquatic communities. Conservation biology, 14:18-30.
169
UNESCO (United Nations Educational, Scientific and Cultural Organization). 1998. World water
resources: a new appraisal and assessment for the 21st century: a summary of the monograph
World water resources. Milton-Keyes, UK: RPL Design.
https://unesdoc.unesco.org/ark:/48223/pf0000112671 Date of access: 30 Nov. 2019.
Valavanidis, A., Vlahogianni, T., Dassenakis, M. & Scoullos, M. 2006. Molecular biomarkers of
oxidative stress in aquatic organisms in relation to toxic environmental pollutants. Ecotoxicology
and environmental safety, 64(2):178-189.
Van der Oost, R., Beyer, J. & Vermeulen, N.P. 2003. Fish bioaccumulation and biomarkers in
environmental risk assessment: a review. Environmental toxicology and pharmacology, 13:57-
149.
Vannote, R.L., Minshall, G.W., Cummins, K.W., Sedell, J.R. & Cushing, C.E. 1980. The river
continuum concept. Canadian journal of fisheries and aquatic sciences, 37:130-137.
Vázquez, D.P., Poulin, R., Krasnov, B.R. & Shenbrot, G.I. 2005. Species abundance and the
distribution of specialization in host–parasite interaction networks. Journal of animal ecology,
74:946-955.
Vedolin, M., Teophilo, C., Turra, A. & Figueira, R. 2018. Spatial variability in the concentrations
of metals in beached microplastics. Marine pollution bulletin, 129(2):487-493.
Venugopal, B. & Luckey, T.D. 1978. Metal toxicity in mammals, vol. 2: chemical toxicity of metals
and metalloids. New York: Plenum Press.
Viarengo, A., Burlando, B., Dondero, F., Marro, A. & Fabbri, R. 1999. Metallothionein as a tool
in biomonitoring programmes. Biomarkers, 4(6):455-466.
Viarengo, A., Ponzano, E., Dondero, F. & Fabbri, R. 1997. A simple spectrophotometric method
for metallothionein evaluation in marine organisms: an application to Mediterranean and Antarctic
molluscs. Marine environmental research, 44(1):69-84.
Vidal-Martinez, V.M., Pech, D., Sures, B., Purucker, S.T. & Poulin, R. 2010. Can parasites really
reveal environmental impact? Trends in parasitology, 26(1):44-51.
170
Vinodhini, R. & Narayanan, M. 2008. Bioaccumulation of heavy metals in organs of fresh water
fish Cyprinus carpio (Common carp). International journal of environmental science & technology,
5(2):179-182.
Vörösmarty, C.J., McIntyre, P.B., Gessner, M.O., Dudgeon, D., Prusevich, A., Green, P., Glidden,
S., Bunn, S.E., Sullivan, C.A., Liermann, C.R. & Davies, P.M. 2010. Global threats to human
water security and river biodiversity. Nature, 467(7315):555-561.
Walkey, M. & Meakins, R. 1970. An attempt to balance the energy budget of a host-parasite
system. Journal of fish biology, 2(4):361-372.
Wang, X., Wang, L., Yao, C., Qiu, L., Zhang, H., Zhi, Z. & Song, L. 2012. Alternation of immune
parameters and cellular energy allocation of Chlamys farreri under ammonia-N exposure and
Vibrio anguillarum challenge. Fish & shellfish immunology, 32(5):741-749.
Wepener, V.V., Van Dyk, C., Bervoets, L., O’Brien, G., Covaci, A. & Cloete, Y. 2011. An
assessment of the influence of multiple stressors on the Vaal River, South Africa. Physics and
chemistry of the earth, 36:949-962.
Whittington, M., Malan, G. & Panagos, M.D. 2013. Trends in waterbird diversity at Banzi, Shokwe
and Nyamithi pans, Ndumo Game Reserve, South Africa. Ostrich, 84(1):47-61.
WHO (World Health Organization). 2017. Guidelines for drinking-water quality. 4th ed.
https://apps.who.int/iris/bitstream/handle/10665/254637/9789241549950-eng.pdf?sequence=1
Date of access: 29 Nov. 2019.
Williams, E.H., Jr. & Bunkley-Williams, L. 2019. Life cycle and life history strategies of parasitic
Crustacea. (In Smit, N.J., Bruce, N.L. & Hadfield, K.A., eds. Parasitic Crustacea. Berlin:
Springer. p. 179-266).
Wright, D.A. & Zamuda, C.D. 1987. Copper accumulation by two bivalve molluscs: salinity effect
is independent of cupric ion activity. Marine environmental research, 23(1):1-14.
Yang, D., Kanae, S., Oki, T., Koike, T. & Musiake, K. 2003. Global potential soil erosion with
reference to land use and climate changes. Hydrological processes, 17(14):2913-2928.
171
Yi, Y., Yang, Z. & Zhang, S. 2011. Ecological risk assessment of heavy metals in sediment and
human health risk assessment of heavy metals in fishes in the middle and lower reaches of the
Yangtze River basin. Environmental pollution, 159(10):2575-2585.
Yu, K.-C., Tsai, L.-J., Chen, S.-H. & Ho, S.-T. 2001. Correlation analyses on binding behavior of
heavy metals with sediment matrices. Water research, 35(10):2417-2428.
Zadnipryany, I.Z., Tretiakova, O.T. & Zukow, W. 2017. Experimental review of cobalt induced
cardiomyopathy. Russian open medical journal, 6(1). doi:10.15275/rusomj.2017.0103
Zhang, G., Bai, J., Xiao, R., Zhao, Q., Jia, J., Cui, B. & Liu, X. 2017. Heavy metal fractions and
ecological risk assessment in sediments from urban, rural and reclamation-affected rivers of the
Pearl River Estuary, China. Chemosphere, 184:278-288.
Zhou, Q., Zhang, J., Fu, J., Shi, J. & Jiang, G. 2008. Biomonitoring: an appealing tool for
assessment of metal pollution in the aquatic ecosystem. Analytica chimica acta, 606(2):135-150.
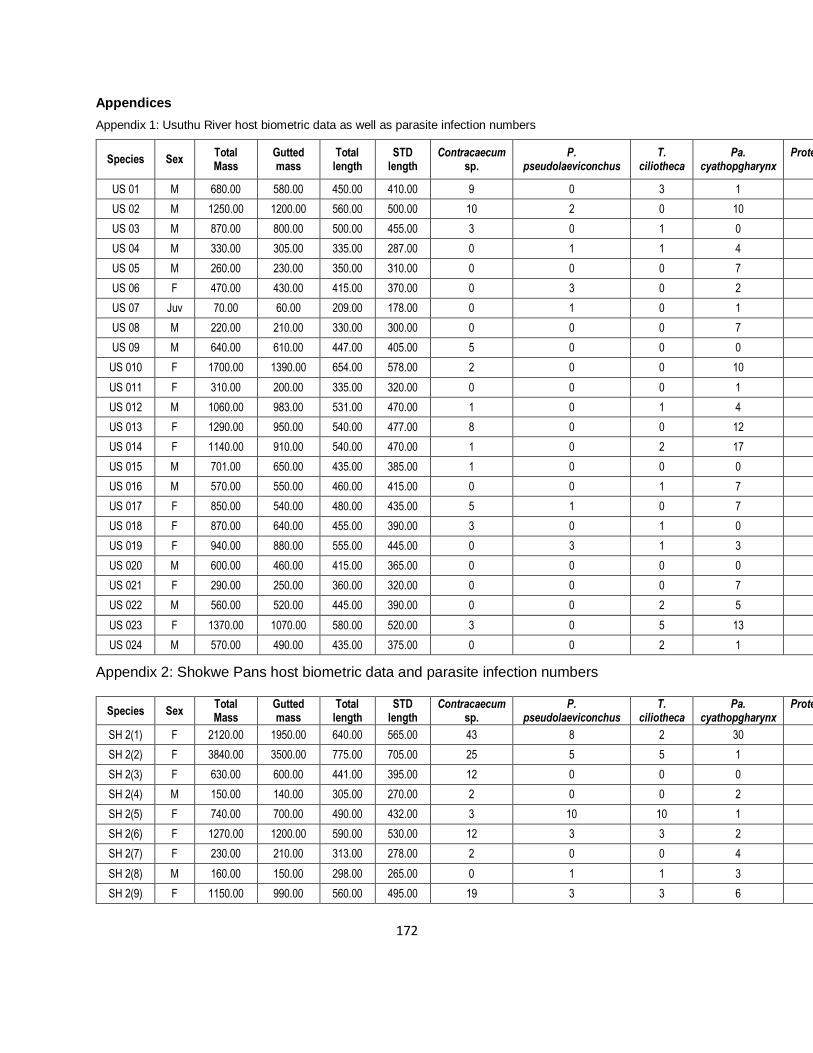
172
Appendices
Appendix 1: Usuthu River host biometric data as well as parasite infection numbers
Species Sex Total Mass
Gutted mass
Total length
STD length
Contracaecum sp.
P. pseudolaeviconchus
T. ciliotheca
Pa. cyathopgharynx
Proteocephalus sp.
US 01 M 680.00 580.00 450.00 410.00 9 0 3 1 0
US 02 M 1250.00 1200.00 560.00 500.00 10 2 0 10 0
US 03 M 870.00 800.00 500.00 455.00 3 0 1 0 0
US 04 M 330.00 305.00 335.00 287.00 0 1 1 4 0
US 05 M 260.00 230.00 350.00 310.00 0 0 0 7 0
US 06 F 470.00 430.00 415.00 370.00 0 3 0 2 0
US 07 Juv 70.00 60.00 209.00 178.00 0 1 0 1 0
US 08 M 220.00 210.00 330.00 300.00 0 0 0 7 0
US 09 M 640.00 610.00 447.00 405.00 5 0 0 0 0
US 010 F 1700.00 1390.00 654.00 578.00 2 0 0 10 0
US 011 F 310.00 200.00 335.00 320.00 0 0 0 1 0
US 012 M 1060.00 983.00 531.00 470.00 1 0 1 4 0
US 013 F 1290.00 950.00 540.00 477.00 8 0 0 12 0
US 014 F 1140.00 910.00 540.00 470.00 1 0 2 17 0
US 015 M 701.00 650.00 435.00 385.00 1 0 0 0 0
US 016 M 570.00 550.00 460.00 415.00 0 0 1 7 0
US 017 F 850.00 540.00 480.00 435.00 5 1 0 7 0
US 018 F 870.00 640.00 455.00 390.00 3 0 1 0 0
US 019 F 940.00 880.00 555.00 445.00 0 3 1 3 0
US 020 M 600.00 460.00 415.00 365.00 0 0 0 0 0
US 021 F 290.00 250.00 360.00 320.00 0 0 0 7 0
US 022 M 560.00 520.00 445.00 390.00 0 0 2 5 0
US 023 F 1370.00 1070.00 580.00 520.00 3 0 5 13 0
US 024 M 570.00 490.00 435.00 375.00 0 0 2 1 0
Appendix 2: Shokwe Pans host biometric data and parasite infection numbers
Species Sex Total Mass
Gutted mass
Total length
STD length
Contracaecum sp.
P. pseudolaeviconchus
T. ciliotheca
Pa. cyathopgharynx
Proteocephalus sp.
SH 2(1) F 2120.00 1950.00 640.00 565.00 43 8 2 30 0
SH 2(2) F 3840.00 3500.00 775.00 705.00 25 5 5 1 0
SH 2(3) F 630.00 600.00 441.00 395.00 12 0 0 0 0
SH 2(4) M 150.00 140.00 305.00 270.00 2 0 0 2 0
SH 2(5) F 740.00 700.00 490.00 432.00 3 10 10 1 0
SH 2(6) F 1270.00 1200.00 590.00 530.00 12 3 3 2 0
SH 2(7) F 230.00 210.00 313.00 278.00 2 0 0 4 0
SH 2(8) M 160.00 150.00 298.00 265.00 0 1 1 3 0
SH 2(9) F 1150.00 990.00 560.00 495.00 19 3 3 6 0
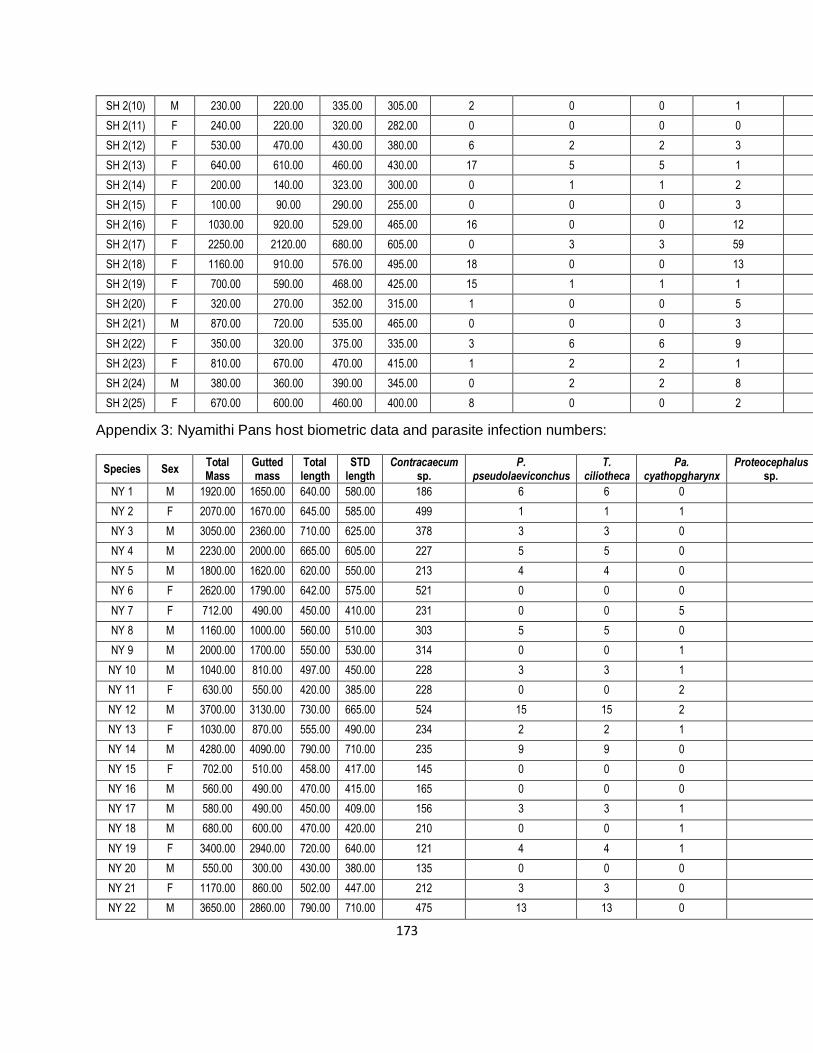
173
SH 2(10) M 230.00 220.00 335.00 305.00 2 0 0 1 0
SH 2(11) F 240.00 220.00 320.00 282.00 0 0 0 0 0
SH 2(12) F 530.00 470.00 430.00 380.00 6 2 2 3 0
SH 2(13) F 640.00 610.00 460.00 430.00 17 5 5 1 0
SH 2(14) F 200.00 140.00 323.00 300.00 0 1 1 2 0
SH 2(15) F 100.00 90.00 290.00 255.00 0 0 0 3 0
SH 2(16) F 1030.00 920.00 529.00 465.00 16 0 0 12 0
SH 2(17) F 2250.00 2120.00 680.00 605.00 0 3 3 59 0
SH 2(18) F 1160.00 910.00 576.00 495.00 18 0 0 13 0
SH 2(19) F 700.00 590.00 468.00 425.00 15 1 1 1 0
SH 2(20) F 320.00 270.00 352.00 315.00 1 0 0 5 0
SH 2(21) M 870.00 720.00 535.00 465.00 0 0 0 3 0
SH 2(22) F 350.00 320.00 375.00 335.00 3 6 6 9 0
SH 2(23) F 810.00 670.00 470.00 415.00 1 2 2 1 0
SH 2(24) M 380.00 360.00 390.00 345.00 0 2 2 8 0
SH 2(25) F 670.00 600.00 460.00 400.00 8 0 0 2 0
Appendix 3: Nyamithi Pans host biometric data and parasite infection numbers:
Species Sex Total Mass
Gutted mass
Total length
STD length
Contracaecum sp.
P. pseudolaeviconchus
T. ciliotheca
Pa. cyathopgharynx
Proteocephalus sp.
NY 1 M 1920.00 1650.00 640.00 580.00 186 6 6 0
NY 2 F 2070.00 1670.00 645.00 585.00 499 1 1 1
NY 3 M 3050.00 2360.00 710.00 625.00 378 3 3 0
NY 4 M 2230.00 2000.00 665.00 605.00 227 5 5 0
NY 5 M 1800.00 1620.00 620.00 550.00 213 4 4 0
NY 6 F 2620.00 1790.00 642.00 575.00 521 0 0 0
NY 7 F 712.00 490.00 450.00 410.00 231 0 0 5
NY 8 M 1160.00 1000.00 560.00 510.00 303 5 5 0
NY 9 M 2000.00 1700.00 550.00 530.00 314 0 0 1
NY 10 M 1040.00 810.00 497.00 450.00 228 3 3 1
NY 11 F 630.00 550.00 420.00 385.00 228 0 0 2
NY 12 M 3700.00 3130.00 730.00 665.00 524 15 15 2
NY 13 F 1030.00 870.00 555.00 490.00 234 2 2 1
NY 14 M 4280.00 4090.00 790.00 710.00 235 9 9 0
NY 15 F 702.00 510.00 458.00 417.00 145 0 0 0
NY 16 M 560.00 490.00 470.00 415.00 165 0 0 0
NY 17 M 580.00 490.00 450.00 409.00 156 3 3 1
NY 18 M 680.00 600.00 470.00 420.00 210 0 0 1
NY 19 F 3400.00 2940.00 720.00 640.00 121 4 4 1
NY 20 M 550.00 300.00 430.00 380.00 135 0 0 0
NY 21 F 1170.00 860.00 502.00 447.00 212 3 3 0
NY 22 M 3650.00 2860.00 790.00 710.00 475 13 13 0
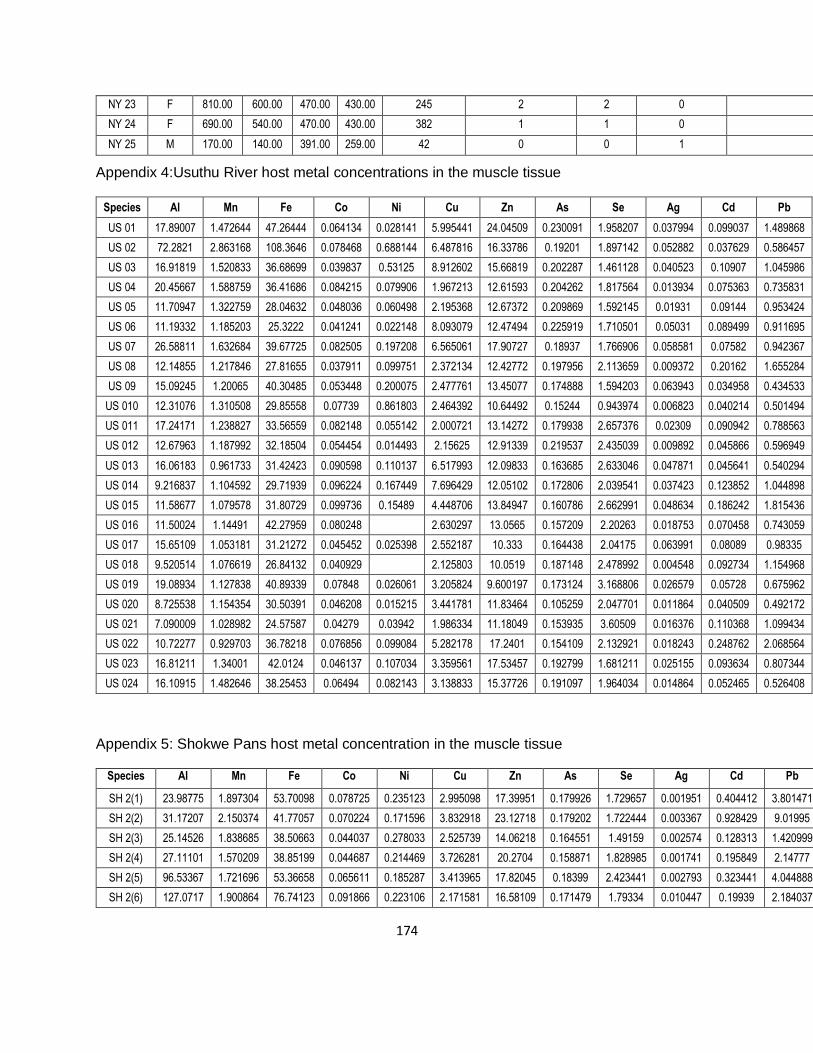
174
NY 23 F 810.00 600.00 470.00 430.00 245 2 2 0
NY 24 F 690.00 540.00 470.00 430.00 382 1 1 0
NY 25 M 170.00 140.00 391.00 259.00 42 0 0 1
Appendix 4:Usuthu River host metal concentrations in the muscle tissue
Species Al Mn Fe Co Ni Cu Zn As Se Ag Cd Pb
US 01 17.89007 1.472644 47.26444 0.064134 0.028141 5.995441 24.04509 0.230091 1.958207 0.037994 0.099037 1.489868
US 02 72.2821 2.863168 108.3646 0.078468 0.688144 6.487816 16.33786 0.19201 1.897142 0.052882 0.037629 0.586457
US 03 16.91819 1.520833 36.68699 0.039837 0.53125 8.912602 15.66819 0.202287 1.461128 0.040523 0.10907 1.045986
US 04 20.45667 1.588759 36.41686 0.084215 0.079906 1.967213 12.61593 0.204262 1.817564 0.013934 0.075363 0.735831
US 05 11.70947 1.322759 28.04632 0.048036 0.060498 2.195368 12.67372 0.209869 1.592145 0.01931 0.09144 0.953424
US 06 11.19332 1.185203 25.3222 0.041241 0.022148 8.093079 12.47494 0.225919 1.710501 0.05031 0.089499 0.911695
US 07 26.58811 1.632684 39.67725 0.082505 0.197208 6.565061 17.90727 0.18937 1.766906 0.058581 0.07582 0.942367
US 08 12.14855 1.217846 27.81655 0.037911 0.099751 2.372134 12.42772 0.197956 2.113659 0.009372 0.20162 1.655284
US 09 15.09245 1.20065 40.30485 0.053448 0.200075 2.477761 13.45077 0.174888 1.594203 0.063943 0.034958 0.434533
US 010 12.31076 1.310508 29.85558 0.07739 0.861803 2.464392 10.64492 0.15244 0.943974 0.006823 0.040214 0.501494
US 011 17.24171 1.238827 33.56559 0.082148 0.055142 2.000721 13.14272 0.179938 2.657376 0.02309 0.090942 0.788563
US 012 12.67963 1.187992 32.18504 0.054454 0.014493 2.15625 12.91339 0.219537 2.435039 0.009892 0.045866 0.596949
US 013 16.06183 0.961733 31.42423 0.090598 0.110137 6.517993 12.09833 0.163685 2.633046 0.047871 0.045641 0.540294
US 014 9.216837 1.104592 29.71939 0.096224 0.167449 7.696429 12.05102 0.172806 2.039541 0.037423 0.123852 1.044898
US 015 11.58677 1.079578 31.80729 0.099736 0.15489 4.448706 13.84947 0.160786 2.662991 0.048634 0.186242 1.815436
US 016 11.50024 1.14491 42.27959 0.080248 2.630297 13.0565 0.157209 2.20263 0.018753 0.070458 0.743059
US 017 15.65109 1.053181 31.21272 0.045452 0.025398 2.552187 10.333 0.164438 2.04175 0.063991 0.08089 0.98335
US 018 9.520514 1.076619 26.84132 0.040929 2.125803 10.0519 0.187148 2.478992 0.004548 0.092734 1.154968
US 019 19.08934 1.127838 40.89339 0.07848 0.026061 3.205824 9.600197 0.173124 3.168806 0.026579 0.05728 0.675962
US 020 8.725538 1.154354 30.50391 0.046208 0.015215 3.441781 11.83464 0.105259 2.047701 0.011864 0.040509 0.492172
US 021 7.090009 1.028982 24.57587 0.04279 0.03942 1.986334 11.18049 0.153935 3.60509 0.016376 0.110368 1.099434
US 022 10.72277 0.929703 36.78218 0.076856 0.099084 5.282178 17.2401 0.154109 2.132921 0.018243 0.248762 2.068564
US 023 16.81211 1.34001 42.0124 0.046137 0.107034 3.359561 17.53457 0.192799 1.681211 0.025155 0.093634 0.807344
US 024 16.10915 1.482646 38.25453 0.06494 0.082143 3.138833 15.37726 0.191097 1.964034 0.014864 0.052465 0.526408
Appendix 5: Shokwe Pans host metal concentration in the muscle tissue
Species Al Mn Fe Co Ni Cu Zn As Se Ag Cd Pb
SH 2(1) 23.98775 1.897304 53.70098 0.078725 0.235123 2.995098 17.39951 0.179926 1.729657 0.001951 0.404412 3.801471
SH 2(2) 31.17207 2.150374 41.77057 0.070224 0.171596 3.832918 23.12718 0.179202 1.722444 0.003367 0.928429 9.01995
SH 2(3) 25.14526 1.838685 38.50663 0.044037 0.278033 2.525739 14.06218 0.164551 1.49159 0.002574 0.128313 1.420999
SH 2(4) 27.11101 1.570209 38.85199 0.044687 0.214469 3.726281 20.2704 0.158871 1.828985 0.001741 0.195849 2.14777
SH 2(5) 96.53367 1.721696 53.36658 0.065611 0.185287 3.413965 17.82045 0.18399 2.423441 0.002793 0.323441 4.044888
SH 2(6) 127.0717 1.900864 76.74123 0.091866 0.223106 2.171581 16.58109 0.171479 1.79334 0.010447 0.19939 2.184037
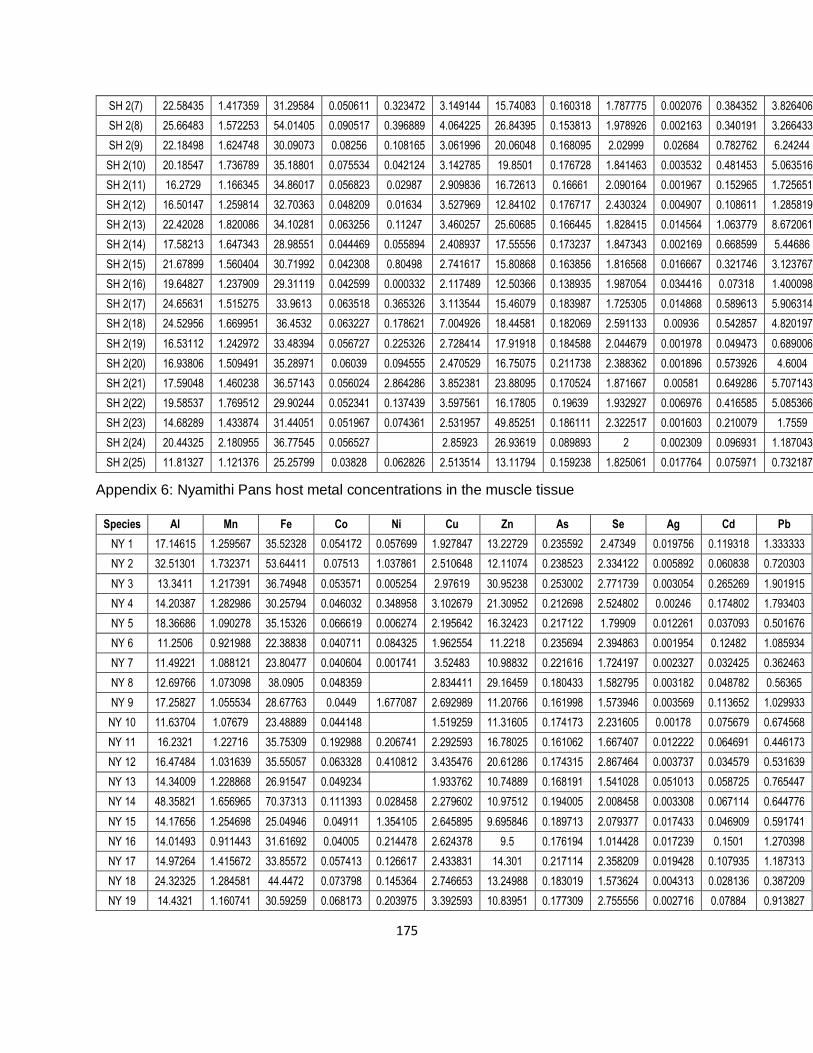
175
SH 2(7) 22.58435 1.417359 31.29584 0.050611 0.323472 3.149144 15.74083 0.160318 1.787775 0.002076 0.384352 3.826406
SH 2(8) 25.66483 1.572253 54.01405 0.090517 0.396889 4.064225 26.84395 0.153813 1.978926 0.002163 0.340191 3.266433
SH 2(9) 22.18498 1.624748 30.09073 0.08256 0.108165 3.061996 20.06048 0.168095 2.02999 0.02684 0.782762 6.24244
SH 2(10) 20.18547 1.736789 35.18801 0.075534 0.042124 3.142785 19.8501 0.176728 1.841463 0.003532 0.481453 5.063516
SH 2(11) 16.2729 1.166345 34.86017 0.056823 0.02987 2.909836 16.72613 0.16661 2.090164 0.001967 0.152965 1.725651
SH 2(12) 16.50147 1.259814 32.70363 0.048209 0.01634 3.527969 12.84102 0.176717 2.430324 0.004907 0.108611 1.285819
SH 2(13) 22.42028 1.820086 34.10281 0.063256 0.11247 3.460257 25.60685 0.166445 1.828415 0.014564 1.063779 8.672061
SH 2(14) 17.58213 1.647343 28.98551 0.044469 0.055894 2.408937 17.55556 0.173237 1.847343 0.002169 0.668599 5.44686
SH 2(15) 21.67899 1.560404 30.71992 0.042308 0.80498 2.741617 15.80868 0.163856 1.816568 0.016667 0.321746 3.123767
SH 2(16) 19.64827 1.237909 29.31119 0.042599 0.000332 2.117489 12.50366 0.138935 1.987054 0.034416 0.07318 1.400098
SH 2(17) 24.65631 1.515275 33.9613 0.063518 0.365326 3.113544 15.46079 0.183987 1.725305 0.014868 0.589613 5.906314
SH 2(18) 24.52956 1.669951 36.4532 0.063227 0.178621 7.004926 18.44581 0.182069 2.591133 0.00936 0.542857 4.820197
SH 2(19) 16.53112 1.242972 33.48394 0.056727 0.225326 2.728414 17.91918 0.184588 2.044679 0.001978 0.049473 0.689006
SH 2(20) 16.93806 1.509491 35.28971 0.06039 0.094555 2.470529 16.75075 0.211738 2.388362 0.001896 0.573926 4.6004
SH 2(21) 17.59048 1.460238 36.57143 0.056024 2.864286 3.852381 23.88095 0.170524 1.871667 0.00581 0.649286 5.707143
SH 2(22) 19.58537 1.769512 29.90244 0.052341 0.137439 3.597561 16.17805 0.19639 1.932927 0.006976 0.416585 5.085366
SH 2(23) 14.68289 1.433874 31.44051 0.051967 0.074361 2.531957 49.85251 0.186111 2.322517 0.001603 0.210079 1.7559
SH 2(24) 20.44325 2.180955 36.77545 0.056527 2.85923 26.93619 0.089893 2 0.002309 0.096931 1.187043
SH 2(25) 11.81327 1.121376 25.25799 0.03828 0.062826 2.513514 13.11794 0.159238 1.825061 0.017764 0.075971 0.732187
Appendix 6: Nyamithi Pans host metal concentrations in the muscle tissue
Species Al Mn Fe Co Ni Cu Zn As Se Ag Cd Pb
NY 1 17.14615 1.259567 35.52328 0.054172 0.057699 1.927847 13.22729 0.235592 2.47349 0.019756 0.119318 1.333333
NY 2 32.51301 1.732371 53.64411 0.07513 1.037861 2.510648 12.11074 0.238523 2.334122 0.005892 0.060838 0.720303
NY 3 13.3411 1.217391 36.74948 0.053571 0.005254 2.97619 30.95238 0.253002 2.771739 0.003054 0.265269 1.901915
NY 4 14.20387 1.282986 30.25794 0.046032 0.348958 3.102679 21.30952 0.212698 2.524802 0.00246 0.174802 1.793403
NY 5 18.36686 1.090278 35.15326 0.066619 0.006274 2.195642 16.32423 0.217122 1.79909 0.012261 0.037093 0.501676
NY 6 11.2506 0.921988 22.38838 0.040711 0.084325 1.962554 11.2218 0.235694 2.394863 0.001954 0.12482 1.085934
NY 7 11.49221 1.088121 23.80477 0.040604 0.001741 3.52483 10.98832 0.221616 1.724197 0.002327 0.032425 0.362463
NY 8 12.69766 1.073098 38.0905 0.048359 2.834411 29.16459 0.180433 1.582795 0.003182 0.048782 0.56365
NY 9 17.25827 1.055534 28.67763 0.0449 1.677087 2.692989 11.20766 0.161998 1.573946 0.003569 0.113652 1.029933
NY 10 11.63704 1.07679 23.48889 0.044148 1.519259 11.31605 0.174173 2.231605 0.00178 0.075679 0.674568
NY 11 16.2321 1.22716 35.75309 0.192988 0.206741 2.292593 16.78025 0.161062 1.667407 0.012222 0.064691 0.446173
NY 12 16.47484 1.031639 35.55057 0.063328 0.410812 3.435476 20.61286 0.174315 2.867464 0.003737 0.034579 0.531639
NY 13 14.34009 1.228868 26.91547 0.049234 1.933762 10.74889 0.168191 1.541028 0.051013 0.058725 0.765447
NY 14 48.35821 1.656965 70.37313 0.111393 0.028458 2.279602 10.97512 0.194005 2.008458 0.003308 0.067114 0.644776
NY 15 14.17656 1.254698 25.04946 0.04911 1.354105 2.645895 9.695846 0.189713 2.079377 0.017433 0.046909 0.591741
NY 16 14.01493 0.911443 31.61692 0.04005 0.214478 2.624378 9.5 0.176194 1.014428 0.017239 0.1501 1.270398
NY 17 14.97264 1.415672 33.85572 0.057413 0.126617 2.433831 14.301 0.217114 2.358209 0.019428 0.107935 1.187313
NY 18 24.32325 1.284581 44.4472 0.073798 0.145364 2.746653 13.24988 0.183019 1.573624 0.004313 0.028136 0.387209
NY 19 14.4321 1.160741 30.59259 0.068173 0.203975 3.392593 10.83951 0.177309 2.755556 0.002716 0.07884 0.913827
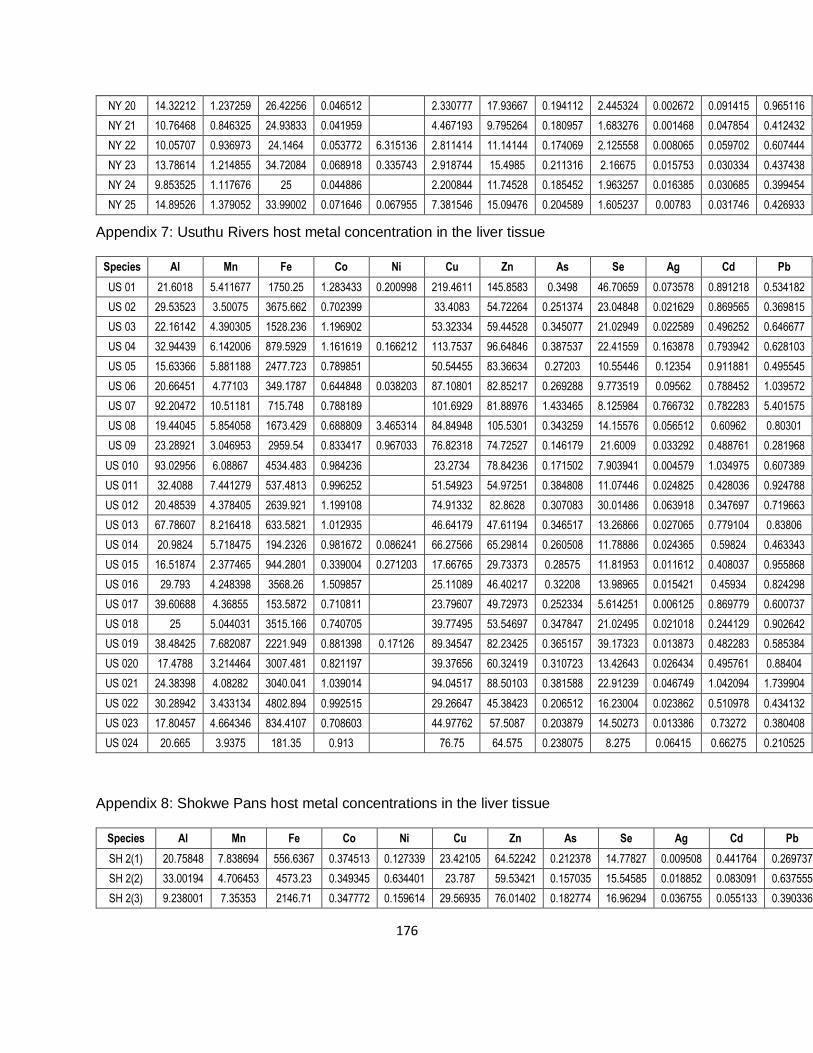
176
NY 20 14.32212 1.237259 26.42256 0.046512 2.330777 17.93667 0.194112 2.445324 0.002672 0.091415 0.965116
NY 21 10.76468 0.846325 24.93833 0.041959 4.467193 9.795264 0.180957 1.683276 0.001468 0.047854 0.412432
NY 22 10.05707 0.936973 24.1464 0.053772 6.315136 2.811414 11.14144 0.174069 2.125558 0.008065 0.059702 0.607444
NY 23 13.78614 1.214855 34.72084 0.068918 0.335743 2.918744 15.4985 0.211316 2.16675 0.015753 0.030334 0.437438
NY 24 9.853525 1.117676 25 0.044886 2.200844 11.74528 0.185452 1.963257 0.016385 0.030685 0.399454
NY 25 14.89526 1.379052 33.99002 0.071646 0.067955 7.381546 15.09476 0.204589 1.605237 0.00783 0.031746 0.426933
Appendix 7: Usuthu Rivers host metal concentration in the liver tissue
Species Al Mn Fe Co Ni Cu Zn As Se Ag Cd Pb
US 01 21.6018 5.411677 1750.25 1.283433 0.200998 219.4611 145.8583 0.3498 46.70659 0.073578 0.891218 0.534182
US 02 29.53523 3.50075 3675.662 0.702399 33.4083 54.72264 0.251374 23.04848 0.021629 0.869565 0.369815
US 03 22.16142 4.390305 1528.236 1.196902 53.32334 59.44528 0.345077 21.02949 0.022589 0.496252 0.646677
US 04 32.94439 6.142006 879.5929 1.161619 0.166212 113.7537 96.64846 0.387537 22.41559 0.163878 0.793942 0.628103
US 05 15.63366 5.881188 2477.723 0.789851 50.54455 83.36634 0.27203 10.55446 0.12354 0.911881 0.495545
US 06 20.66451 4.77103 349.1787 0.644848 0.038203 87.10801 82.85217 0.269288 9.773519 0.09562 0.788452 1.039572
US 07 92.20472 10.51181 715.748 0.788189 101.6929 81.88976 1.433465 8.125984 0.766732 0.782283 5.401575
US 08 19.44045 5.854058 1673.429 0.688809 3.465314 84.84948 105.5301 0.343259 14.15576 0.056512 0.60962 0.80301
US 09 23.28921 3.046953 2959.54 0.833417 0.967033 76.82318 74.72527 0.146179 21.6009 0.033292 0.488761 0.281968
US 010 93.02956 6.08867 4534.483 0.984236 23.2734 78.84236 0.171502 7.903941 0.004579 1.034975 0.607389
US 011 32.4088 7.441279 537.4813 0.996252 51.54923 54.97251 0.384808 11.07446 0.024825 0.428036 0.924788
US 012 20.48539 4.378405 2639.921 1.199108 74.91332 82.8628 0.307083 30.01486 0.063918 0.347697 0.719663
US 013 67.78607 8.216418 633.5821 1.012935 46.64179 47.61194 0.346517 13.26866 0.027065 0.779104 0.83806
US 014 20.9824 5.718475 194.2326 0.981672 0.086241 66.27566 65.29814 0.260508 11.78886 0.024365 0.59824 0.463343
US 015 16.51874 2.377465 944.2801 0.339004 0.271203 17.66765 29.73373 0.28575 11.81953 0.011612 0.408037 0.955868
US 016 29.793 4.248398 3568.26 1.509857 25.11089 46.40217 0.32208 13.98965 0.015421 0.45934 0.824298
US 017 39.60688 4.36855 153.5872 0.710811 23.79607 49.72973 0.252334 5.614251 0.006125 0.869779 0.600737
US 018 25 5.044031 3515.166 0.740705 39.77495 53.54697 0.347847 21.02495 0.021018 0.244129 0.902642
US 019 38.48425 7.682087 2221.949 0.881398 0.17126 89.34547 82.23425 0.365157 39.17323 0.013873 0.482283 0.585384
US 020 17.4788 3.214464 3007.481 0.821197 39.37656 60.32419 0.310723 13.42643 0.026434 0.495761 0.88404
US 021 24.38398 4.08282 3040.041 1.039014 94.04517 88.50103 0.381588 22.91239 0.046749 1.042094 1.739904
US 022 30.28942 3.433134 4802.894 0.992515 29.26647 45.38423 0.206512 16.23004 0.023862 0.510978 0.434132
US 023 17.80457 4.664346 834.4107 0.708603 44.97762 57.5087 0.203879 14.50273 0.013386 0.73272 0.380408
US 024 20.665 3.9375 181.35 0.913 76.75 64.575 0.238075 8.275 0.06415 0.66275 0.210525
Appendix 8: Shokwe Pans host metal concentrations in the liver tissue
Species Al Mn Fe Co Ni Cu Zn As Se Ag Cd Pb
SH 2(1) 20.75848 7.838694 556.6367 0.374513 0.127339 23.42105 64.52242 0.212378 14.77827 0.009508 0.441764 0.269737
SH 2(2) 33.00194 4.706453 4573.23 0.349345 0.634401 23.787 59.53421 0.157035 15.54585 0.018852 0.083091 0.637555
SH 2(3) 9.238001 7.35353 2146.71 0.347772 0.159614 29.56935 76.01402 0.182774 16.96294 0.036755 0.055133 0.390336
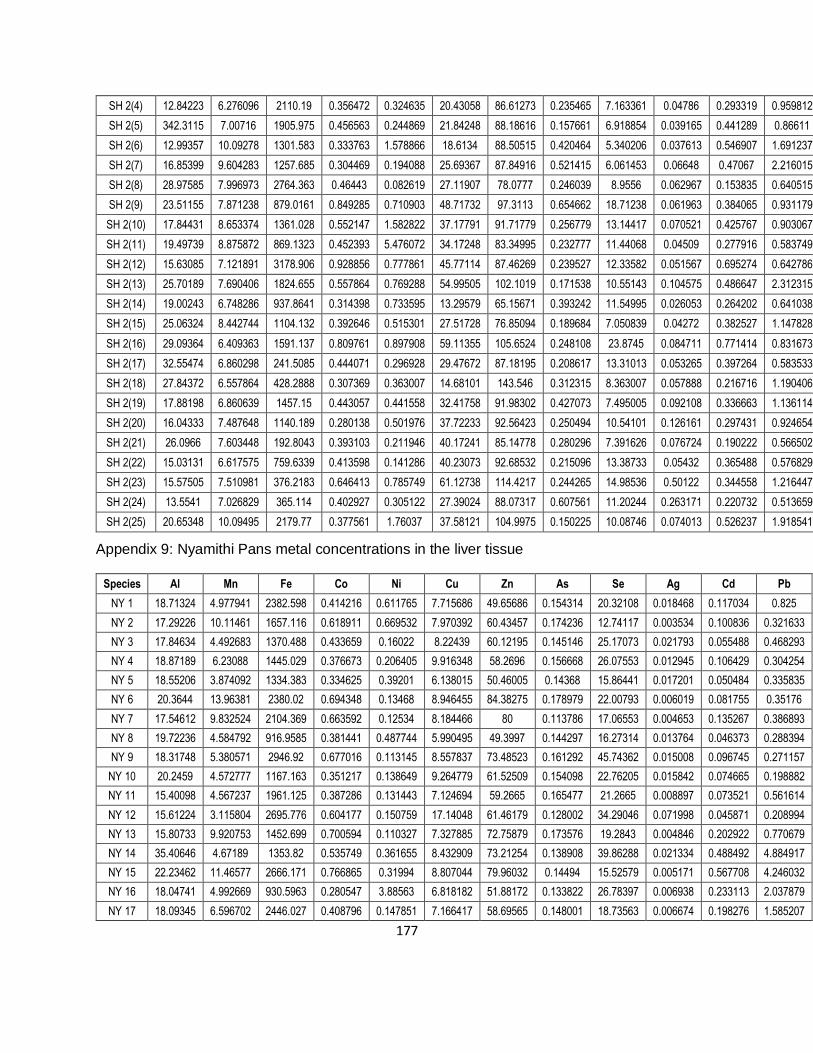
177
SH 2(4) 12.84223 6.276096 2110.19 0.356472 0.324635 20.43058 86.61273 0.235465 7.163361 0.04786 0.293319 0.959812
SH 2(5) 342.3115 7.00716 1905.975 0.456563 0.244869 21.84248 88.18616 0.157661 6.918854 0.039165 0.441289 0.86611
SH 2(6) 12.99357 10.09278 1301.583 0.333763 1.578866 18.6134 88.50515 0.420464 5.340206 0.037613 0.546907 1.691237
SH 2(7) 16.85399 9.604283 1257.685 0.304469 0.194088 25.69367 87.84916 0.521415 6.061453 0.06648 0.47067 2.216015
SH 2(8) 28.97585 7.996973 2764.363 0.46443 0.082619 27.11907 78.0777 0.246039 8.9556 0.062967 0.153835 0.640515
SH 2(9) 23.51155 7.871238 879.0161 0.849285 0.710903 48.71732 97.3113 0.654662 18.71238 0.061963 0.384065 0.931179
SH 2(10) 17.84431 8.653374 1361.028 0.552147 1.582822 37.17791 91.71779 0.256779 13.14417 0.070521 0.425767 0.903067
SH 2(11) 19.49739 8.875872 869.1323 0.452393 5.476072 34.17248 83.34995 0.232777 11.44068 0.04509 0.277916 0.583749
SH 2(12) 15.63085 7.121891 3178.906 0.928856 0.777861 45.77114 87.46269 0.239527 12.33582 0.051567 0.695274 0.642786
SH 2(13) 25.70189 7.690406 1824.655 0.557864 0.769288 54.99505 102.1019 0.171538 10.55143 0.104575 0.486647 2.312315
SH 2(14) 19.00243 6.748286 937.8641 0.314398 0.733595 13.29579 65.15671 0.393242 11.54995 0.026053 0.264202 0.641038
SH 2(15) 25.06324 8.442744 1104.132 0.392646 0.515301 27.51728 76.85094 0.189684 7.050839 0.04272 0.382527 1.147828
SH 2(16) 29.09364 6.409363 1591.137 0.809761 0.897908 59.11355 105.6524 0.248108 23.8745 0.084711 0.771414 0.831673
SH 2(17) 32.55474 6.860298 241.5085 0.444071 0.296928 29.47672 87.18195 0.208617 13.31013 0.053265 0.397264 0.583533
SH 2(18) 27.84372 6.557864 428.2888 0.307369 0.363007 14.68101 143.546 0.312315 8.363007 0.057888 0.216716 1.190406
SH 2(19) 17.88198 6.860639 1457.15 0.443057 0.441558 32.41758 91.98302 0.427073 7.495005 0.092108 0.336663 1.136114
SH 2(20) 16.04333 7.487648 1140.189 0.280138 0.501976 37.72233 92.56423 0.250494 10.54101 0.126161 0.297431 0.924654
SH 2(21) 26.0966 7.603448 192.8043 0.393103 0.211946 40.17241 85.14778 0.280296 7.391626 0.076724 0.190222 0.566502
SH 2(22) 15.03131 6.617575 759.6339 0.413598 0.141286 40.23073 92.68532 0.215096 13.38733 0.05432 0.365488 0.576829
SH 2(23) 15.57505 7.510981 376.2183 0.646413 0.785749 61.12738 114.4217 0.244265 14.98536 0.50122 0.344558 1.216447
SH 2(24) 13.5541 7.026829 365.114 0.402927 0.305122 27.39024 88.07317 0.607561 11.20244 0.263171 0.220732 0.513659
SH 2(25) 20.65348 10.09495 2179.77 0.377561 1.76037 37.58121 104.9975 0.150225 10.08746 0.074013 0.526237 1.918541
Appendix 9: Nyamithi Pans metal concentrations in the liver tissue
Species Al Mn Fe Co Ni Cu Zn As Se Ag Cd Pb
NY 1 18.71324 4.977941 2382.598 0.414216 0.611765 7.715686 49.65686 0.154314 20.32108 0.018468 0.117034 0.825
NY 2 17.29226 10.11461 1657.116 0.618911 0.669532 7.970392 60.43457 0.174236 12.74117 0.003534 0.100836 0.321633
NY 3 17.84634 4.492683 1370.488 0.433659 0.16022 8.22439 60.12195 0.145146 25.17073 0.021793 0.055488 0.468293
NY 4 18.87189 6.23088 1445.029 0.376673 0.206405 9.916348 58.2696 0.156668 26.07553 0.012945 0.106429 0.304254
NY 5 18.55206 3.874092 1334.383 0.334625 0.39201 6.138015 50.46005 0.14368 15.86441 0.017201 0.050484 0.335835
NY 6 20.3644 13.96381 2380.02 0.694348 0.13468 8.946455 84.38275 0.178979 22.00793 0.006019 0.081755 0.35176
NY 7 17.54612 9.832524 2104.369 0.663592 0.12534 8.184466 80 0.113786 17.06553 0.004653 0.135267 0.386893
NY 8 19.72236 4.584792 916.9585 0.381441 0.487744 5.990495 49.3997 0.144297 16.27314 0.013764 0.046373 0.288394
NY 9 18.31748 5.380571 2946.92 0.677016 0.113145 8.557837 73.48523 0.161292 45.74362 0.015008 0.096745 0.271157
NY 10 20.2459 4.572777 1167.163 0.351217 0.138649 9.264779 61.52509 0.154098 22.76205 0.015842 0.074665 0.198882
NY 11 15.40098 4.567237 1961.125 0.387286 0.131443 7.124694 59.2665 0.165477 21.2665 0.008897 0.073521 0.561614
NY 12 15.61224 3.115804 2695.776 0.604177 0.150759 17.14048 61.46179 0.128002 34.29046 0.071998 0.045871 0.208994
NY 13 15.80733 9.920753 1452.699 0.700594 0.110327 7.327885 72.75879 0.173576 19.2843 0.004846 0.202922 0.770679
NY 14 35.40646 4.67189 1353.82 0.535749 0.361655 8.432909 73.21254 0.138908 39.86288 0.021334 0.488492 4.884917
NY 15 22.23462 11.46577 2666.171 0.766865 0.31994 8.807044 79.96032 0.14494 15.52579 0.005171 0.567708 4.246032
NY 16 18.04741 4.992669 930.5963 0.280547 3.88563 6.818182 51.88172 0.133822 26.78397 0.006938 0.233113 2.037879
NY 17 18.09345 6.596702 2446.027 0.408796 0.147851 7.166417 58.69565 0.148001 18.73563 0.006674 0.198276 1.585207
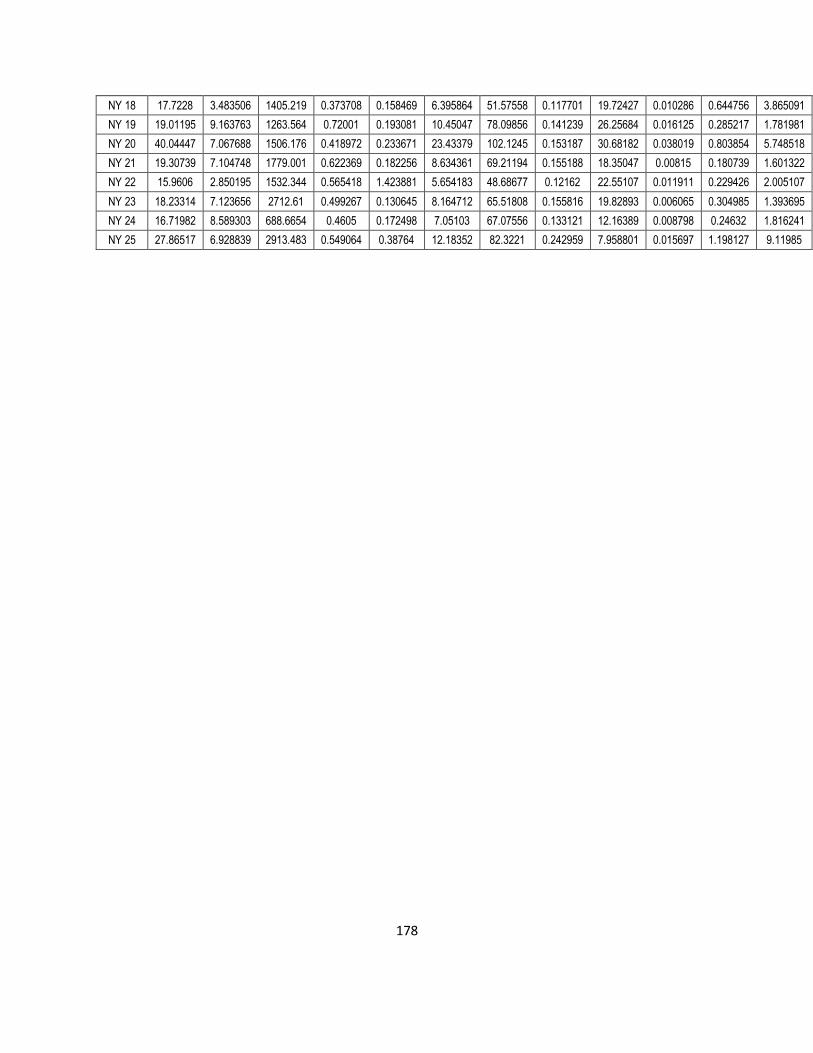
178
NY 18 17.7228 3.483506 1405.219 0.373708 0.158469 6.395864 51.57558 0.117701 19.72427 0.010286 0.644756 3.865091
NY 19 19.01195 9.163763 1263.564 0.72001 0.193081 10.45047 78.09856 0.141239 26.25684 0.016125 0.285217 1.781981
NY 20 40.04447 7.067688 1506.176 0.418972 0.233671 23.43379 102.1245 0.153187 30.68182 0.038019 0.803854 5.748518
NY 21 19.30739 7.104748 1779.001 0.622369 0.182256 8.634361 69.21194 0.155188 18.35047 0.00815 0.180739 1.601322
NY 22 15.9606 2.850195 1532.344 0.565418 1.423881 5.654183 48.68677 0.12162 22.55107 0.011911 0.229426 2.005107
NY 23 18.23314 7.123656 2712.61 0.499267 0.130645 8.164712 65.51808 0.155816 19.82893 0.006065 0.304985 1.393695
NY 24 16.71982 8.589303 688.6654 0.4605 0.172498 7.05103 67.07556 0.133121 12.16389 0.008798 0.24632 1.816241
NY 25 27.86517 6.928839 2913.483 0.549064 0.38764 12.18352 82.3221 0.242959 7.958801 0.015697 1.198127 9.11985
179
Appendix 10: SOP: NWU-00267-17-S5

180

181
182

183

184
185

186

187
188

189

190
191

192

193
194

195

196
197

198
Related Documents


![An Appraisal of Introduced African Catfish Clarias ... · of introduced African catfish is poorly understood [2,4]. African sharptooth catfish Clarias gariepinus is arguably the most](https://static.cupdf.com/doc/110x72/5eaeac3e62773f09dd34694f/an-appraisal-of-introduced-african-catfish-clarias-of-introduced-african-catfish.jpg)