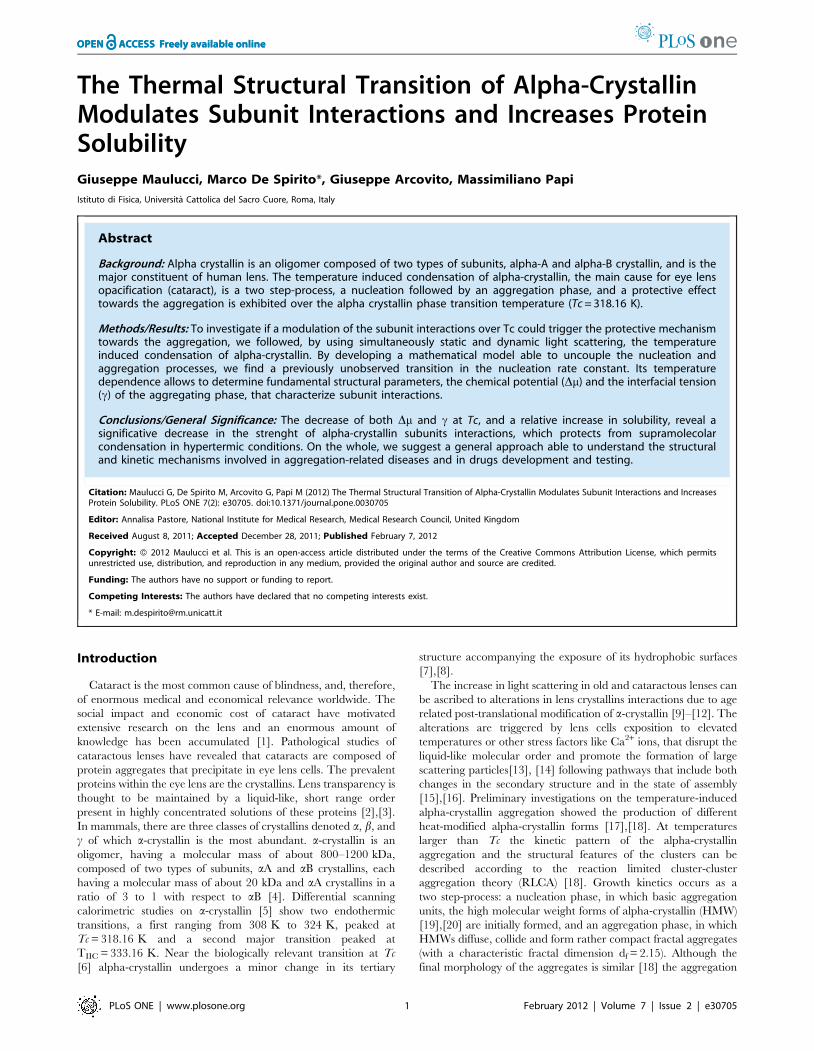
The Thermal Structural Transition of Alpha-Crystallin Modulates Subunit Interactions and Increases Protein Solubility Giuseppe Maulucci, Marco De Spirito*, Giuseppe Arcovito, Massimiliano Papi Istituto di Fisica, Universita ` Cattolica del Sacro Cuore, Roma, Italy Abstract Background: Alpha crystallin is an oligomer composed of two types of subunits, alpha-A and alpha-B crystallin, and is the major constituent of human lens. The temperature induced condensation of alpha-crystallin, the main cause for eye lens opacification (cataract), is a two step-process, a nucleation followed by an aggregation phase, and a protective effect towards the aggregation is exhibited over the alpha crystallin phase transition temperature (Tc = 318.16 K). Methods/Results: To investigate if a modulation of the subunit interactions over Tc could trigger the protective mechanism towards the aggregation, we followed, by using simultaneously static and dynamic light scattering, the temperature induced condensation of alpha-crystallin. By developing a mathematical model able to uncouple the nucleation and aggregation processes, we find a previously unobserved transition in the nucleation rate constant. Its temperature dependence allows to determine fundamental structural parameters, the chemical potential (Dm) and the interfacial tension (c) of the aggregating phase, that characterize subunit interactions. Conclusions/General Significance: The decrease of both Dm and c at Tc, and a relative increase in solubility, reveal a significative decrease in the strenght of alpha-crystallin subunits interactions, which protects from supramolecolar condensation in hypertermic conditions. On the whole, we suggest a general approach able to understand the structural and kinetic mechanisms involved in aggregation-related diseases and in drugs development and testing. Citation: Maulucci G, De Spirito M, Arcovito G, Papi M (2012) The Thermal Structural Transition of Alpha-Crystallin Modulates Subunit Interactions and Increases Protein Solubility. PLoS ONE 7(2): e30705. doi:10.1371/journal.pone.0030705 Editor: Annalisa Pastore, National Institute for Medical Research, Medical Research Council, United Kingdom Received August 8, 2011; Accepted December 28, 2011; Published February 7, 2012 Copyright: ß 2012 Maulucci et al. This is an open-access article distributed under the terms of the Creative Commons Attribution License, which permits unrestricted use, distribution, and reproduction in any medium, provided the original author and source are credited. Funding: The authors have no support or funding to report. Competing Interests: The authors have declared that no competing interests exist. * E-mail: [email protected] Introduction Cataract is the most common cause of blindness, and, therefore, of enormous medical and economical relevance worldwide. The social impact and economic cost of cataract have motivated extensive research on the lens and an enormous amount of knowledge has been accumulated [1]. Pathological studies of cataractous lenses have revealed that cataracts are composed of protein aggregates that precipitate in eye lens cells. The prevalent proteins within the eye lens are the crystallins. Lens transparency is thought to be maintained by a liquid-like, short range order present in highly concentrated solutions of these proteins [2],[3]. In mammals, there are three classes of crystallins denoted a, b, and c of which a-crystallin is the most abundant. a-crystallin is an oligomer, having a molecular mass of about 800–1200 kDa, composed of two types of subunits, aA and aB crystallins, each having a molecular mass of about 20 kDa and aA crystallins in a ratio of 3 to 1 with respect to aB [4]. Differential scanning calorimetric studies on a-crystallin [5] show two endothermic transitions, a first ranging from 308 K to 324 K, peaked at Tc = 318.16 K and a second major transition peaked at T IIC = 333.16 K. Near the biologically relevant transition at Tc [6] alpha-crystallin undergoes a minor change in its tertiary structure accompanying the exposure of its hydrophobic surfaces [7],[8]. The increase in light scattering in old and cataractous lenses can be ascribed to alterations in lens crystallins interactions due to age related post-translational modification of a-crystallin [9]–[12]. The alterations are triggered by lens cells exposition to elevated temperatures or other stress factors like Ca 2+ ions, that disrupt the liquid-like molecular order and promote the formation of large scattering particles[13], [14] following pathways that include both changes in the secondary structure and in the state of assembly [15],[16]. Preliminary investigations on the temperature-induced alpha-crystallin aggregation showed the production of different heat-modified alpha-crystallin forms [17],[18]. At temperatures larger than Tc the kinetic pattern of the alpha-crystallin aggregation and the structural features of the clusters can be described according to the reaction limited cluster-cluster aggregation theory (RLCA) [18]. Growth kinetics occurs as a two step-process: a nucleation phase, in which basic aggregation units, the high molecular weight forms of alpha-crystallin (HMW) [19],[20] are initially formed, and an aggregation phase, in which HMWs diffuse, collide and form rather compact fractal aggregates (with a characteristic fractal dimension d f = 2.15). Although the final morphology of the aggregates is similar [18] the aggregation PLoS ONE | www.plosone.org 1 February 2012 | Volume 7 | Issue 2 | e30705

Welcome message from author
This document is posted to help you gain knowledge. Please leave a comment to let me know what you think about it! Share it to your friends and learn new things together.
Transcript
The Thermal Structural Transition of Alpha-CrystallinModulates Subunit Interactions and Increases ProteinSolubilityGiuseppe Maulucci, Marco De Spirito*, Giuseppe Arcovito, Massimiliano Papi
Istituto di Fisica, Universita Cattolica del Sacro Cuore, Roma, Italy
Abstract
Background: Alpha crystallin is an oligomer composed of two types of subunits, alpha-A and alpha-B crystallin, and is themajor constituent of human lens. The temperature induced condensation of alpha-crystallin, the main cause for eye lensopacification (cataract), is a two step-process, a nucleation followed by an aggregation phase, and a protective effecttowards the aggregation is exhibited over the alpha crystallin phase transition temperature (Tc = 318.16 K).
Methods/Results: To investigate if a modulation of the subunit interactions over Tc could trigger the protective mechanismtowards the aggregation, we followed, by using simultaneously static and dynamic light scattering, the temperatureinduced condensation of alpha-crystallin. By developing a mathematical model able to uncouple the nucleation andaggregation processes, we find a previously unobserved transition in the nucleation rate constant. Its temperaturedependence allows to determine fundamental structural parameters, the chemical potential (Dm) and the interfacial tension(c) of the aggregating phase, that characterize subunit interactions.
Conclusions/General Significance: The decrease of both Dm and c at Tc, and a relative increase in solubility, reveal asignificative decrease in the strenght of alpha-crystallin subunits interactions, which protects from supramolecolarcondensation in hypertermic conditions. On the whole, we suggest a general approach able to understand the structuraland kinetic mechanisms involved in aggregation-related diseases and in drugs development and testing.
Citation: Maulucci G, De Spirito M, Arcovito G, Papi M (2012) The Thermal Structural Transition of Alpha-Crystallin Modulates Subunit Interactions and IncreasesProtein Solubility. PLoS ONE 7(2): e30705. doi:10.1371/journal.pone.0030705
Editor: Annalisa Pastore, National Institute for Medical Research, Medical Research Council, United Kingdom
Received August 8, 2011; Accepted December 28, 2011; Published February 7, 2012
Copyright: � 2012 Maulucci et al. This is an open-access article distributed under the terms of the Creative Commons Attribution License, which permitsunrestricted use, distribution, and reproduction in any medium, provided the original author and source are credited.
Funding: The authors have no support or funding to report.
Competing Interests: The authors have declared that no competing interests exist.
* E-mail: [email protected]
Introduction
Cataract is the most common cause of blindness, and, therefore,
of enormous medical and economical relevance worldwide. The
social impact and economic cost of cataract have motivated
extensive research on the lens and an enormous amount of
knowledge has been accumulated [1]. Pathological studies of
cataractous lenses have revealed that cataracts are composed of
protein aggregates that precipitate in eye lens cells. The prevalent
proteins within the eye lens are the crystallins. Lens transparency is
thought to be maintained by a liquid-like, short range order
present in highly concentrated solutions of these proteins [2],[3].
In mammals, there are three classes of crystallins denoted a, b, and
c of which a-crystallin is the most abundant. a-crystallin is an
oligomer, having a molecular mass of about 800–1200 kDa,
composed of two types of subunits, aA and aB crystallins, each
having a molecular mass of about 20 kDa and aA crystallins in a
ratio of 3 to 1 with respect to aB [4]. Differential scanning
calorimetric studies on a-crystallin [5] show two endothermic
transitions, a first ranging from 308 K to 324 K, peaked at
Tc = 318.16 K and a second major transition peaked at
TIIC = 333.16 K. Near the biologically relevant transition at Tc
[6] alpha-crystallin undergoes a minor change in its tertiary
structure accompanying the exposure of its hydrophobic surfaces
[7],[8].
The increase in light scattering in old and cataractous lenses can
be ascribed to alterations in lens crystallins interactions due to age
related post-translational modification of a-crystallin [9]–[12]. The
alterations are triggered by lens cells exposition to elevated
temperatures or other stress factors like Ca2+ ions, that disrupt the
liquid-like molecular order and promote the formation of large
scattering particles[13], [14] following pathways that include both
changes in the secondary structure and in the state of assembly
[15],[16]. Preliminary investigations on the temperature-induced
alpha-crystallin aggregation showed the production of different
heat-modified alpha-crystallin forms [17],[18]. At temperatures
larger than Tc the kinetic pattern of the alpha-crystallin
aggregation and the structural features of the clusters can be
described according to the reaction limited cluster-cluster
aggregation theory (RLCA) [18]. Growth kinetics occurs as a
two step-process: a nucleation phase, in which basic aggregation
units, the high molecular weight forms of alpha-crystallin (HMW)
[19],[20] are initially formed, and an aggregation phase, in which
HMWs diffuse, collide and form rather compact fractal aggregates
(with a characteristic fractal dimension df = 2.15). Although the
final morphology of the aggregates is similar [18] the aggregation
PLoS ONE | www.plosone.org 1 February 2012 | Volume 7 | Issue 2 | e30705
kinetics are completely different below and above Tc, together with
the size of the HMW, and their repulsive energy barrier (Eb). An
abrupt increase in Eb above Tc reveals a mechanism that
markedly protects from aggregation preserving the transparency
of the lens [18]. However, the structural modification which
occurs at Tc, and its relationship with the exhibited protective
effect is still missing.
Here, we investigate if a modulation of the subunit interactions
over Tc could trigger the protective mechanism towards the
aggregation. To this aim we followed, by using static and dynamic
light scattering, the temperature induced condensation of alpha-
crystallin. Using a mathematical model which uncouples the
nucleation phase and the aggregation phase, we find a previously
unobserved transition in the nucleation rate constant. The analysis
of nucleation rate constant, according to the classical nucleation
theory, allows to rule out a structural modification which leads to a
decrease in a -crystallin subunits interaction strengths, and a
correspondent increase in alpha crystallin solubility which
ultimately protects from supramolecolar condensation.
Materials and Methods
1. Kinetic model of alpha crystallin aggregationPopulation balances (PBE) are general equations describing the
time evolution of CMD, applicable to a variety of particulate
systems [21]. Aggregation in homogeneously mixed colloidal
dispersions can conveniently be described by PBE, which use mass
as the internal coordinate for representing aggregates undergoing
birth and death events. These events lead to the formation and
disappearance of aggregates of mass m. Indicating with ni (t) the
number of aggregates of mass m = i m0 at time t (i.e. the CMD)
population balance equations have the following form:
_nnp(t)~1
2
Xp
j~1
KAp{j,j np{j(t)nj(t){np(t)
X?j~1
KAp,j nj(t)
p~1,::::::,Nagg
ð1Þ
where the two terms on the right-hand side represent the rate of
birth and death of units of mass m = i m0 per unit volume,
respectively. The first one represents the production of aggregates
of mass m = i m0 by aggregation of two smaller aggregates of mass
m9 and m2m9, while the second considers the loss of particles of
mass m due to aggregation with any other aggregate of mass m9. Kij
is the aggregation rate between two particles of mass i m0 and jm0.
However, the application of equation (1) to proteins systems is
often insufficient because it lacks the modellization of diverse
protein related phenomena, like nucleation of basic aggregating
units.
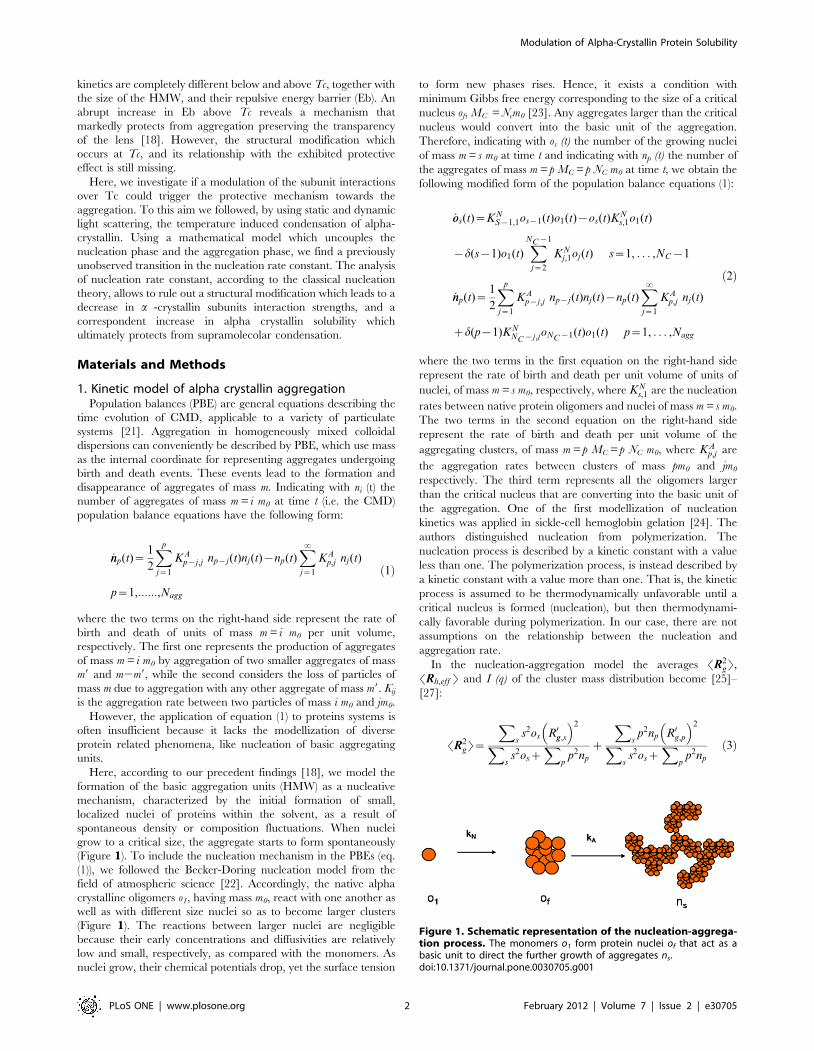
Here, according to our precedent findings [18], we model the
formation of the basic aggregation units (HMW) as a nucleative
mechanism, characterized by the initial formation of small,
localized nuclei of proteins within the solvent, as a result of
spontaneous density or composition fluctuations. When nuclei
grow to a critical size, the aggregate starts to form spontaneously
(Figure 1). To include the nucleation mechanism in the PBEs (eq.
(1)), we followed the Becker-Doring nucleation model from the
field of atmospheric science [22]. Accordingly, the native alpha
crystalline oligomers o1, having mass m0, react with one another as
well as with different size nuclei so as to become larger clusters
(Figure 1). The reactions between larger nuclei are negligible
because their early concentrations and diffusivities are relatively
low and small, respectively, as compared with the monomers. As
nuclei grow, their chemical potentials drop, yet the surface tension
to form new phases rises. Hence, it exists a condition with
minimum Gibbs free energy corresponding to the size of a critical
nucleus of, MC = Ncm0 [23]. Any aggregates larger than the critical
nucleus would convert into the basic unit of the aggregation.
Therefore, indicating with os (t) the number of the growing nuclei
of mass m = s m0 at time t and indicating with np (t) the number of
the aggregates of mass m = p MC = p NC m0 at time t, we obtain the
following modified form of the population balance equations (1):
_oos(t)~KNS{1,1os{1(t)o1(t){os(t)K
Ns,1o1(t)
{d(s{1)o1(t)XNC{1
j~2
KNj,1oj(t) s~1, . . . ,NC{1
_nnp(t)~1
2
Xp
j~1
KAp{j,j np{j(t)nj(t){np(t)
X?j~1
KAp,j nj(t)
zd(p{1)KNNC{j,joNC{1(t)o1(t) p~1, . . . ,Nagg
ð2Þ
where the two terms in the first equation on the right-hand side
represent the rate of birth and death per unit volume of units of
nuclei, of mass m = s m0, respectively, where KNs,1 are the nucleation
rates between native protein oligomers and nuclei of mass m = s m0.
The two terms in the second equation on the right-hand side
represent the rate of birth and death per unit volume of the
aggregating clusters, of mass m = p MC = p NC m0, where KAp,j are
the aggregation rates between clusters of mass pm0 and jm0
respectively. The third term represents all the oligomers larger
than the critical nucleus that are converting into the basic unit of
the aggregation. One of the first modellization of nucleation
kinetics was applied in sickle-cell hemoglobin gelation [24]. The
authors distinguished nucleation from polymerization. The
nucleation process is described by a kinetic constant with a value
less than one. The polymerization process, is instead described by
a kinetic constant with a value more than one. That is, the kinetic
process is assumed to be thermodynamically unfavorable until a
critical nucleus is formed (nucleation), but then thermodynami-
cally favorable during polymerization. In our case, there are not
assumptions on the relationship between the nucleation and
aggregation rate.
In the nucleation-aggregation model the averages SR2gT,
SRh,eff T and I (q) of the cluster mass distribution become [25]–
[27]:
SR2gT~
Xss2os R0g,s
� �2
Xss2osz
Xp
p2np
z
Xsp2np R0g,p
� �2
Xss2osz
Xp
p2np
ð3Þ
Figure 1. Schematic representation of the nucleation-aggrega-tion process. The monomers o1 form protein nuclei of that act as abasic unit to direct the further growth of aggregates ns.doi:10.1371/journal.pone.0030705.g001
Modulation of Alpha-Crystallin Protein Solubility
PLoS ONE | www.plosone.org 2 February 2012 | Volume 7 | Issue 2 | e30705
Where R0g,s and Rg,p are the corresponding gyration radii of the
oligomers of mass s and aggregates of mass pm0,
SRh,eff T~
Xss2os
Xp
p2npSp(q)Xss2os R0h,s
� �{1
zX
pp2npSp(q)(Rh,p){1
ð4Þ
Where R9h,s, Rh,p are the corresponding hydrodynamic radii of the
oligomers of mass sm0 and aggregates of mass pm0, and Sp (q)
represents the structure factor of the aggregates of mass pm0, and
I qð Þ~K ’ m20
Xss2oszM2
C
Xp
p2npSp qð Þ� �
: ð5Þ
Rh,p, the hydrodynamic radii of the oligomers of mass s and
aggregates of mass pm0 and fractal dimension df, have the following
expression [27]
Rh,i~iRp 1zNnn
2z
4pa
bz24bz2{2bz2� �
z4pc
c
j
Rp
� �df {1"
Cdf {1
c
� �1{Cinc
4Rp
j
� �c
,df {1
c
� �� ��{1ð6Þ
Where Rp is the hydrodynamic radius of the basic unit of the
aggregation, j~aRpi1
df is the cut-off length, and the constant aequals 1.45 and 1.55 for DLCA and RLCA clusters, respectively.
The parameters a, b, c, Nnn, and c are a function of the number of
particles in the cluster and the empirical parameters d, e, and f take
different values for the different parameters and C and Cinc are the
Euler gamma function and incomplete gamma function, respec-
tively. The values of the parameters are reported in [28].
The gyration radii Rg,p of the oligomers of mass s and
aggregates of mass p have instead the following expression [29]
Rg,i~R2g,pz
R2p
2i4Nnnz
4pa
bz54bz5{2bz5� �� �
z
4pcR2p
2ic
j
Rp
� �df z2
Cdf z2
c
� �1{Cinc
4Rp
j
� �c
,df z2
c
� �� � ð7Þ
where Rg, p is the primary particle radius of gyration (for a sphere
Rg,p~ffiffiffiffiffiffiffiffi3=5
pRp):
2.Preparation of a-crystallin suspensionsa-crystallin from bovine eye lens was prepared according to
Andreasi et al. [19].
The a-crystallin fractions suspended in 10 mM Tris-HCl buffer,
pH 7.4, were thoroughly mixed and pooled together. The purified
protein was divided into aliquots and kept in the same buffer at
20uC until used. Just before the experiment, the samples were
thawed and centrifuged at 5000 g (Eppendorf 5418) for 30 min at
4uC, and the supramolecular aggregates already formed were
discarded. The super-natant was filtered through a 0:22_m
Millipore low-retention filter directly into the measuring cuvette.
Protein concentration was determined by using an absorption
coefficient of A 1 cm0.1% = 0,81 at 280 nm [2]. Aggregation of a-
crystallin (1.0 mg/ml) was induced by quenching samples at the
desiderated temperature and by the addition of 16 mM CaCl2.
Indeed heating provokes the generation of particularly reactive
isoforms of a-crystallin [5] and calcium ions stabilize the
aggregates while they are forming and allow their continuous
growth [13]. The whole set of measurements have been performed
on different aliquots of the same sample. Five aggregations process
for each temperature have been followed.
3. Static light scatteringStatic light scattering [30] measures the time-averaged intensity
I(q) scattered from a sample as a function of the scattering wave
vector:
q~4pn
l0sen
q
2
� �ð8Þ
Where l0 is the incident light wavelength, n is the refractive index
of the solution, and h is the scattering angle.
The measured scattering intensity from aggregating particles
can be written as:
I qð Þ!SMm2n mð ÞSi qð ÞP qð Þ ð9Þ
where the contribution M2S(qRG) from a single cluster of mass M
and radius of gyration RG is weighted over cluster-mass
distribution N(M), and P(q) is the form factor of the primary
particle. The structure factor S of the aggregates can be obtained
analytically by Fourier transforming the pair-correlation function
of fractal objects [31]. Its normalized form with S (0) = 1 is given
by the equation:
Si qð Þ~ 1z2
3df
qRg,i
� �2� �{
df2
ð10Þ
where the dependence on the product qRG only follows the scale
invariance of the cluster. Two asymptotic behaviours of the
structure factor, corresponding to different experimental condi-
tions, can be found during aggregation [26],[31],[32]:
Si qð Þ!1 qRg%1
qRg
� �{df qRg&1
"ð11Þ
When clusters can be considered like point sources, i.e., qRG%1,
static light-scattering intensity measurements can be used to
determine the time evolution of the average cluster mass:
I tð Þ!P
m n mð Þm2~ �MM: When most clusters are large enough
to have qRG&1, the fractal dimension df can be directly
determined by measuring scattered intensity versus wave vector
q : I qð Þ!q{df : In the cross-over region qRG,1, the full
expression in eq.9 must be used.
4. Dynamic light scatteringDynamic light scattering [33] measures the time autocorrelation
function of the scattering intensity I(t). The normalized autocor-
relation function is defined as:
G2 tð Þ~SI(0)I(t)TSIT2
ð12Þ
where t is the delay time and the angular brackets indicate the
ensemble average.
The time dependence of the scattered intensity results from local
density fluctuations as a consequence of the diffusive motion of the
Modulation of Alpha-Crystallin Protein Solubility
PLoS ONE | www.plosone.org 3 February 2012 | Volume 7 | Issue 2 | e30705
clusters. The autocorrelation function of these density fluctuations
g1(t) can be derived from G2 using the Siegert relation:
G2 tð Þ~1zBg1 tð Þ2 ð13Þ
where B is an instrumental constant.
For monodisperse point particles, the density autocorrelation
function decays exponentially in time as g1 tð Þ~e{Ct, where the
decay rate C depends on the particle translational diffusion
coefficient according to C= Dq2. In the case of aggregating
particles, deviations from the monoexponential decay are observed
because of cluster polydispersity and rotational diffusion effects.
In this condition, the derivative of g1 for t?0 measures the
average decay rate of the clusters:
SCT~d ln g1 tð Þ
dt
t~0
ð14Þ
To determine �CC experimentally, we fitted the logarithm of the
measured autocorrelation function g1, to a third-order polynomial,
according to the cumulant expansion [34]:
ln g1 tð Þ~{C1tz1
2!C2t2{
1
3!C3t3zo(t4) ð15Þ
where we assumed SCT~C1:In aggregating systems, because of cluster-mass polydispersity,
what we actually measure is an average effective diffusion
coefficient that can be expressed as:
SDeff T~�CC
q2~
Smn mð Þm2S qRGð ÞDeff
Smn mð Þm2S qRGð Þ ð16Þ
The average effective hydrodynamic radius SRh,eff T can be
obtained using Einstein Relation
SRh,eff T~kBT
6pgSDh,eff Tð17Þ
5. Light-scattering measurementsStatic and dynamic light-scattering measurements were per-
formed concurrently during a-crystallin aggregation by using a
computer-interfaced scattering system ALV-5000 (ALV GmbH,
Langen, Germany). A vertically polarized monochromatic light
source at 632.8 nm produced by an NEC He-Ne 50 mW laser was
used. The sample was contained in a cylindrical quartz cuvette (1-
cm diameter) enclosed in a vat filled with toluene as optical
matching fluid. Sample temperature was controlled within
60.01uC by means of a Julabo HC Thermostat and measured
with a Ptl00 thermometer. Photons scattered by the sample were
revealed by a single photon photomultiplier mounted on the
rotating arm of the goniometer.
The photopulses were sent to a 256-channel digital autocorre-
lator (ALV-5000) that performed a hardware autocorrelation
function of the photopulses with a logarithmic spacing of delay
times starting from 0.2 ms. Counts per second were used to
measure the scattered intensity during the aggregation.
Data were collected from several scattering angles (usually
eight) ranging from 30u to 150u, corresponding to wave vectors
0.46*105,q,2.5*105 cm21. Because the measurements were
performed during the aggregation process, data are a function
of both scattering vector q and aggregation time t. The slow
rate of the a-crystallin aggregation and the high values of
scattered intensity usually allowed an average collecting time of
30 s, sufficient to obtain a good measure of the intensity
autocorrelation function before the system could change
significantly.
Results and Discussion
1. Determination of nucleation and aggregation rateconstant
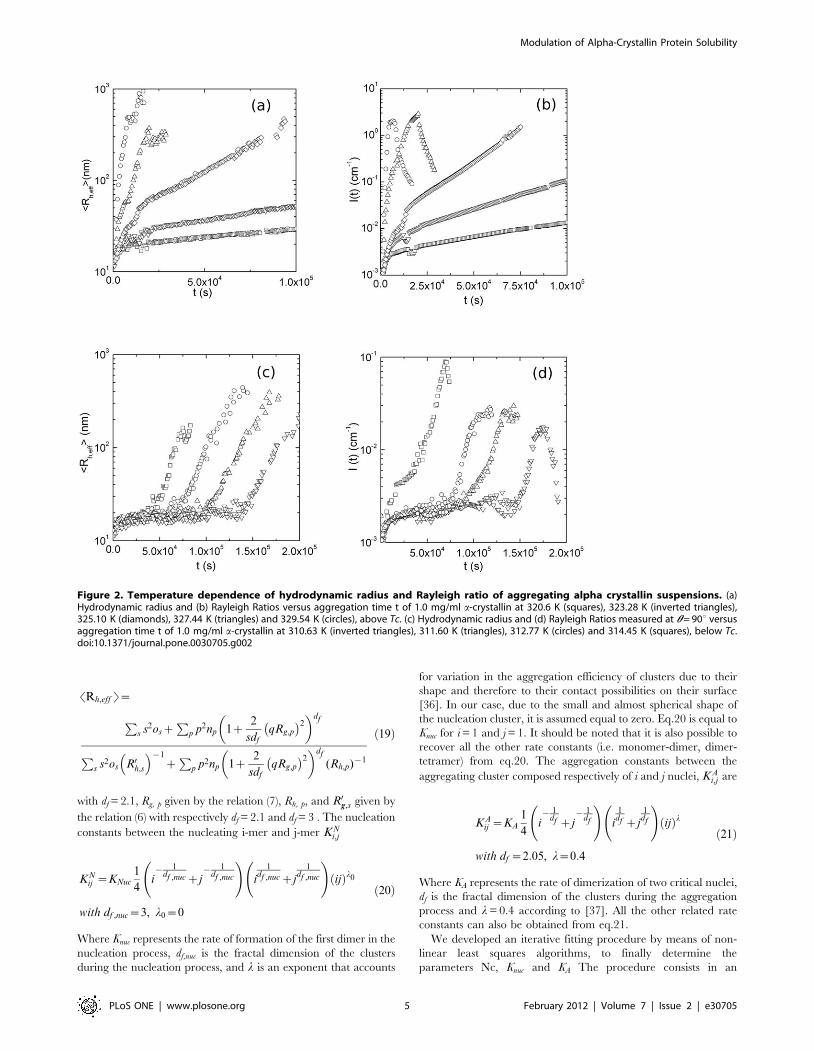
To characterize the extent of the aggregation process, we
performed dynamic light scattering experiments by measuring the
time evolution of the intensity weighted average hydrodynamic
radius of the clusters SRh,eff T already reported in [18], determined
according to Eq.(17), and of the Rayleigh Ratios I (q), measured at
h = 90u, not reported in [18]. The results for samples at different
temperatures above Tc = 318.16 K, are shown in Figure 2a–b.
After an initial, fast, increase of SRh,eff T, a second, slower,
exponential growth, is observed. The first increase of SRh,eff T is
ascribed to the initial conversion of the protein from the native to
the heat- and calcium-induced conformers, that rapidly bind to
form high molecular weight species (HMW) [18],[20]. The second
exponential growth is instead consistent with an RLCA process
where HMWs after a large number of collisions can stick together
[19],[35]. By decreasing temperature below Tc the time evolution
of the aggregation process undergoes to a dramatic modification
(Figure 2c–d). Basic aggregation units are formed over a longer
time and their average size is smaller, then an exponential increase
of the hydrodynamic radius and the Rayleigh ratios, is still
observed. Above and below Tc the aggregations are well
characterized in the framework of RLCA theory: although the
final morphology of the aggregates is similar, the aggregation
kinetics seem completely different [18]. As we have seen we can
compare the experimentally accessible quantities as I(q) and
SRh,eff T with those computed from the cluster mass distribution ni
according to the nucleation-aggregation process. We developed an
iterative procedure that, combining SLS and DLS data, namely
I(q) and SRh,eff T, allows us to discriminate among different kinetic
models. Indeed, by using kinetics evolution of both I(q) and
SRh,eff T in the computation of PBE equations, we can account for
two different averages of the distribution and we actually include
information about the distribution width and shape. In order to
compute I(q) and SRh,eff T, we need to know the structural features
of the aggregates forming in the nucleation and in the aggregation
process.
During the initial growth, ascribed to the nucleation process, we
assume that particles have a spherical shape (df, nuc = 3), and in the
second step, corresponding to the aggregation process, clusters
have a random fractal shape of dimension df = 2.1 [18],[19].
Substituting eq.(10) in eq.(5) we will have as a theoretical
expression for I(q):
I(q)~
K 0 m20
Xss2oszM2
C
Xp
p2np 1z2
3df
qRg,p
� �2
� �{df2
0B@
1CA ð18Þ
with the Rg, p given by relation (7) and df = 2.1.
Further, substituting eq.(5) in eq.(4), we will have as a theoretical
expression for SRh,eff T:
Modulation of Alpha-Crystallin Protein Solubility
PLoS ONE | www.plosone.org 4 February 2012 | Volume 7 | Issue 2 | e30705
SRh,eff T~
Ps s2osz
Pp p2np 1z
2
sdf
qRg,p
� �2� �df
Ps s2os R0h,s
� �{1
zP
p p2np 1z2
sdf
qRg,p
� �2� �df
(Rh,p){1
ð19Þ
with df = 2.1, Rg, p given by the relation (7), Rh, p, and R0g,s given by
the relation (6) with respectively df = 2.1 and df = 3 . The nucleation
constants between the nucleating i-mer and j-mer KNi,j
KNij ~KNuc
1
4i{ 1
df ,nuczj{ 1
df ,nuc
!i
1df ,nuczj
1df ,nuc
!ijð Þl0
with df ,nuc~3, l0~0
ð20Þ
Where Knuc represents the rate of formation of the first dimer in the
nucleation process, df,nuc is the fractal dimension of the clusters
during the nucleation process, and l is an exponent that accounts
for variation in the aggregation efficiency of clusters due to their
shape and therefore to their contact possibilities on their surface
[36]. In our case, due to the small and almost spherical shape of
the nucleation cluster, it is assumed equal to zero. Eq.20 is equal to
Knuc for i = 1 and j = 1. It should be noted that it is also possible to
recover all the other rate constants (i.e. monomer-dimer, dimer-
tetramer) from eq.20. The aggregation constants between the
aggregating cluster composed respectively of i and j nuclei, KAi,j are
KAij ~KA
1
4i{ 1
df zj{ 1
df
!i
1df zj
1df
!ijð Þl
with df ~2:05, l~0:4
ð21Þ
Where KA represents the rate of dimerization of two critical nuclei,
df is the fractal dimension of the clusters during the aggregation
process and l = 0.4 according to [37]. All the other related rate
constants can also be obtained from eq.21.
We developed an iterative fitting procedure by means of non-
linear least squares algorithms, to finally determine the
parameters Nc, Knuc and KA The procedure consists in an
Figure 2. Temperature dependence of hydrodynamic radius and Rayleigh ratio of aggregating alpha crystallin suspensions. (a)Hydrodynamic radius and (b) Rayleigh Ratios versus aggregation time t of 1.0 mg/ml a-crystallin at 320.6 K (squares), 323.28 K (inverted triangles),325.10 K (diamonds), 327.44 K (triangles) and 329.54 K (circles), above Tc. (c) Hydrodynamic radius and (d) Rayleigh Ratios measured at h = 90u versusaggregation time t of 1.0 mg/ml a-crystallin at 310.63 K (inverted triangles), 311.60 K (triangles), 312.77 K (circles) and 314.45 K (squares), below Tc.doi:10.1371/journal.pone.0030705.g002
Modulation of Alpha-Crystallin Protein Solubility
PLoS ONE | www.plosone.org 5 February 2012 | Volume 7 | Issue 2 | e30705
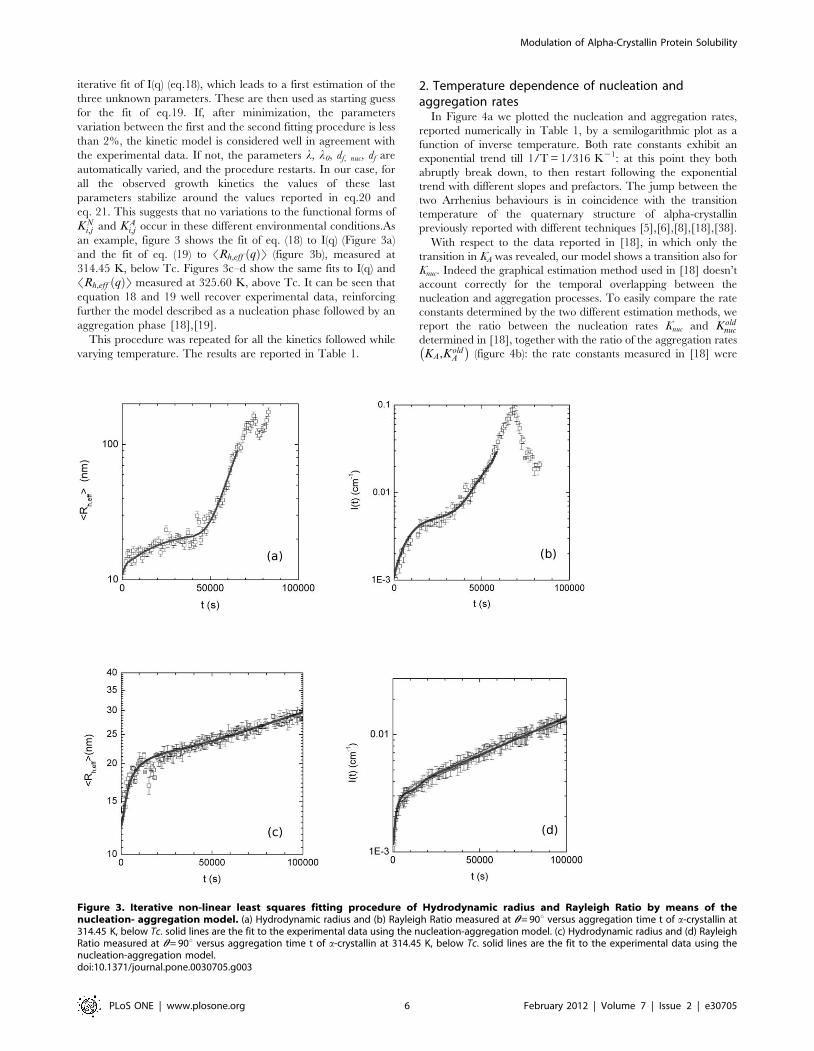
iterative fit of I(q) (eq.18), which leads to a first estimation of the
three unknown parameters. These are then used as starting guess
for the fit of eq.19. If, after minimization, the parameters
variation between the first and the second fitting procedure is less
than 2%, the kinetic model is considered well in agreement with
the experimental data. If not, the parameters l, l0, df, nuc, df are
automatically varied, and the procedure restarts. In our case, for
all the observed growth kinetics the values of these last
parameters stabilize around the values reported in eq.20 and
eq. 21. This suggests that no variations to the functional forms of
KNi,j and KA
i,j occur in these different environmental conditions.As
an example, figure 3 shows the fit of eq. (18) to I(q) (Figure 3a)
and the fit of eq. (19) to SRh,eff qð ÞT (figure 3b), measured at
314.45 K, below Tc. Figures 3c–d show the same fits to I(q) and
SRh,eff qð ÞT measured at 325.60 K, above Tc. It can be seen that
equation 18 and 19 well recover experimental data, reinforcing
further the model described as a nucleation phase followed by an
aggregation phase [18],[19].
This procedure was repeated for all the kinetics followed while
varying temperature. The results are reported in Table 1.
2. Temperature dependence of nucleation andaggregation rates
In Figure 4a we plotted the nucleation and aggregation rates,
reported numerically in Table 1, by a semilogarithmic plot as a
function of inverse temperature. Both rate constants exhibit an
exponential trend till 1/T = 1/316 K21: at this point they both
abruptly break down, to then restart following the exponential
trend with different slopes and prefactors. The jump between the
two Arrhenius behaviours is in coincidence with the transition
temperature of the quaternary structure of alpha-crystallin
previously reported with different techniques [5],[6],[8],[18],[38].
With respect to the data reported in [18], in which only the
transition in KA was revealed, our model shows a transition also for
Knuc. Indeed the graphical estimation method used in [18] doesn’t
account correctly for the temporal overlapping between the
nucleation and aggregation processes. To easily compare the rate
constants determined by the two different estimation methods, we
report the ratio between the nucleation rates Knuc and Koldnuc
determined in [18], together with the ratio of the aggregation rates
KA,KoldA
� �(figure 4b): the rate constants measured in [18] were
Figure 3. Iterative non-linear least squares fitting procedure of Hydrodynamic radius and Rayleigh Ratio by means of thenucleation- aggregation model. (a) Hydrodynamic radius and (b) Rayleigh Ratio measured at h = 90u versus aggregation time t of a-crystallin at314.45 K, below Tc. solid lines are the fit to the experimental data using the nucleation-aggregation model. (c) Hydrodynamic radius and (d) RayleighRatio measured at h = 90u versus aggregation time t of a-crystallin at 314.45 K, below Tc. solid lines are the fit to the experimental data using thenucleation-aggregation model.doi:10.1371/journal.pone.0030705.g003
Modulation of Alpha-Crystallin Protein Solubility
PLoS ONE | www.plosone.org 6 February 2012 | Volume 7 | Issue 2 | e30705
systematically underestimated by a factor ,2 for the nucleation
constants and by a factor ,300 for the aggregation constants.
Indeed, the aggregation process starts when the first nuclei are
formed, and if nucleation and aggregation constant have similar
values, it is possible to estimate wrongly the naturally separated
contributes. Such error, in our case, is higher above Tc, where
nucleation and aggregation rates are effectively very similar
(figure 4b).
Through the determination of rate constants at different
temperatures, we can quantify the activation free energies and
entropies, for both the nucleation and aggregation process.
Indeed, temperature dependence of the rate constants is assumed
to follow the Arrhenius law in the regions where the exponential
trends are detected [39],
kA~Aagg exp {EaggA�RT
� �ð24Þ
Figure 4. Temperature dependence of the rate constants, activation free energies and entropies of the nucleative and aggregativeprocesses. (a) Arrhenius Plot of the aggregation and nucleation rates Knuc (squares), KA (circles) determined by the nucleation-aggregation model.Solid lines are exponential fit to the data. 1/Tc is indicated by a dashed line (b) Ratio of the nucleation rates determined in this article, Knuc, and Kold
nuc
determined in [18] (open circles), togheter with the Ratio of the aggregation rates determined in this article, KA, and KoldA determined in [18]
(squares). (c) Graphical representation of the nucleation-aggregation process in a free energy landscape below and above Tc. The free energy isreported as function of a reaction coordinate j that represents the progress of the process. At each minimum corresponds a stable state. ValuesDGN,DGBT
Agg,DGATAgg, DDG~DGAT{DGBT for are graphically shown. (d) Critical Radius Rc in function of temperature. Tc is indicated by a dashed line.
doi:10.1371/journal.pone.0030705.g004
Table 1. Knuc, KA and Rc values obtained at different T. Rc wascalculated from Nc.
T (K) Knuc(s21
M21
) KA(s21
M21
) RC(nm)
310.660.01 (1.0760.05)?1025 (7.5360.52)?1023 22.261.1
311.660.01 (2.1860.11)?1025 (8.3960.5)?1023 23.561.4
312.760.01 (2.9360.15)?1025 (1.1560.08)?1022 20.861.3
314.460.01 (5.0860.21)?1025 (1.0260.04)?1022 22.261.4
320.660.01 (1.0660.05)?1024 (8.5360.53)?1024 26.061.7
323.860.01 (2.1560.11)?1024 (5.3160.40)?1023 25.961.7
325.360.01 (3.0560.27)?1024 (8.0660.44)?1023 29.161.7
327.360.01 (6.2760.59)?1024 (4.0160.22)?1022 29.161.5
329.560.01 (1.0260.08)?1023 (1.5760.08)?1021 29.161.9
doi:10.1371/journal.pone.0030705.t001
Modulation of Alpha-Crystallin Protein Solubility
PLoS ONE | www.plosone.org 7 February 2012 | Volume 7 | Issue 2 | e30705
kN~Anuc exp {ENA�RT
� �ð25Þ
Where Aagg, Anuc are prefactors and EaggA and EN
A are respectively
the energy of activation of formation of the first dimer in the
nucleation process and the energy of activation of dimerization of
the two critical nuclei.
In the two regions, the slopes of the straight line in Figure 4a
determine the activation energies below and above Tc, which are
reported in Table 2. EaggA obtained in the previous article [18]
were 33,8 and 137,6 kcal/mol, and are refined in this model,
where temperature dependent underestimation of rate constant
doesn’t occur.
3. Temperature dependence of the activation freeenergies and entropies of the nucleative and aggregativeprocesses
We analyzed the results obtained for both the nucleative and
aggregative dimerizations in the framework of the transition state
theory [23],[40]. We assume that one monomer can bind to the
other only when it is inside a reaction volume v with a
characteristic size l%v1=3: We also assume that the monomers
entering the reaction volume can actually bind to the other only if
these monomers are in the appropriate activation state. The
probability of the occurrence of such a state is exp {DG
kBT
� �,
where the change in free energy associated with the activation
process is DG . Thus the dimerization rate can be written as
kD~Cexp {DG
RT
� �ð26Þ
Where C is the number of monomers entering the reaction volume
per unit time. To estimate C, it must be noted note that the rate
with which monomers enter a certain volume is equal to the rate
with which they leave this same volume. The average number of
monomers in a volume v at any moment of time is cv. These
monomers are in a constant brownian motion and diffuse out of
this volume in a time t%l2.
D%v2s
.D to be replaced by others.
Thus the number of monomers entering the reaction volume per
unit time is cn/t and therefore
C%cv13D ð27Þ
It is reasonable to assume that the size of the reaction volume is of
the order of the size of a monomer.
Substituting Eq. 26 into Eq. 27, and using the thermodynamic
relation DG = EA2T DS, where DS is the change in the entropy
associated with the activation process, we obtain
kD~cv13Dexp
DS
R
� �exp {
EA
RT
� �ð28Þ
Eq. 27 permits a physicochemical interpretation of the significance
of the parameters A and EA, as obtained from the experimental
measurements of kD(T). One can see indeed, by comparison of Eq.
27 and Eq. 23–24, that the activation entropy DS is related to the
parameter A by the relation
DS~RlnA
cv13D
!ð29Þ
In the case of the nucleation process the diffusion coefficient D (of
the free alpha crystalline oligomer) is 3.6 1027 cm2/sec21 (for
RH = 10 nm). The reaction volume size l~n13 can be assumed to
be of the order of the dimension of the a-crystallin, namely 10 nm.
Thus, we estimated the changes in the entropy associated with the
activation process below and above Tc, both for the nucleation and
the aggregation, namely TDSBTN ,TDSAT
N ,TDSBTA ,TDSAT
A at
300 K, reported in Table 2. Although the values used to calculate
the activation entropy are not known, especially in this last case,
even a factor of 10 uncertainty in the magnitude of A=n13
introduces an error of only 2.7RT = 1.6 kcal/mol in TDS, which is
less than 4% of the total values. Note that, in comparison with the
uncertainty in v13, the error in the numerical value of A caused by a
poorly known monomer concentration c produces an insignificant
effect on the deduced value of the activation entropy DS [40]. In
Table 2 changes in free energy associated with the activation
processes are also reported, DG = EA2T DS calculated at 300 K.
The free energies associated with the activation processes are
,10 kcal/mol, which is a relatively small quantity, so that the
probability for an activated state occurring, exp {DG
RT
� �%10{5,
is sufficiently large for the reaction to take place within the
observed rate. However, this small free energy originates from the
difference between the much larger activation energy and the
entropy contribution, which goes from 40 to 130 Kcal/mol. The
change in the free energy of activation with temperature,
DDG =DGAT2DGBT, is 1.1 kcal/mol for the nucleation process
and 8.2 Kcal/mol for the aggregation process. Below Tc, the free
energy of activation of the nucleation process is nearly two times
the free energy of activation of the aggregation process. Above Tc,
while DGN stays almost unchanged, DGATAgg, the free energy of
activation of the aggregation process above Tc, is nearly two times
larger than DGBTAgg: Therefore, the probability that an activated
state occurs in the nucleation process is nearly the same above and
below Tc, whereas the probability that an activated state occurs in
the aggregation process switches from exp {DG
RT
� �%10{5 down
to exp {DG
RT
� �%10{11 at Tc. In Figure 4c, a schematic
representation of the nucleation-aggregation process in a free
energy landscape below and above Tc is reported. The free energy
is reported as function of a reaction coordinate j that represents
the progress of the process. At each minimum corresponds a stable
state. Values for DGN,DGBTAgg,DGAT
Agg, DDG~DGAT{DGBT are
graphically shown. It is clear that activated states above and below
Tc differ significantly in both energy and entropy, suggesting a
Table 2. Activation energies, activation entropies andactivation free energies for the nucleation and aggregationprocess (values are expressed in kcal/M21).
Nucleation Aggregation
EA TDS DG EA TDS DG
T,Tc 62.861.8 50.663.0 12.261.1 42.461.2 34.862.0 7.660.7
T.Tc 60.761.8 47.462.8 13.361.2 131.063.9 115.266.9 15.861.4
doi:10.1371/journal.pone.0030705.t002
Modulation of Alpha-Crystallin Protein Solubility
PLoS ONE | www.plosone.org 8 February 2012 | Volume 7 | Issue 2 | e30705
substantial difference in structure: indeed, as reported in Figure 4d,
in correspondence of Tc, critical nuclei increase their radii from
,23 nm to ,28 nm. Above Tc, Nc is two times larger than below
Tc, and we could estimate that the number of critical nuclei is near
1/2 of the number of critical nuclei below Tc, because the total
mass is conserved and the nucleation rate does not vary
appreciably. Thus, Nc increases, leading to the formation of a
lesser number of critical nuclei.
4. Temperature dependence of protein-solutioninterfacial tension and the nucleus chemical potential
Thermodynamic structural features, as the protein-solution
interfacial tension c and the nucleus density times the nucleus
chemical potential rDm, above and below Tc, can be recovered
from the knowledge of R* and DG* following the classical
nucleation theory. Classical nucleation theory (CNT) [39]
expresses the rate per unit volume kN as the product of an
exponential factor and a pre-exponential factor A
kN~A exp({DG�=kbT) ð30Þ
The exponential factor is exp({DG�=kbT) where DG* is the free
energy cost of creating the critical nucleus, the nucleus at the top
of the barrier.
CNT treats the nucleus as if it were a macroscopic phase. If we
restrict ourselves to the nucleation of one fluid inside the bulk of
another phase, then the nucleus is spherical and its free energy has
just two terms: a bulk and a surface term. If the nucleus has a
radius R then the bulk term is the free energy change involved in
creating a sphere of radius R of the new phase. The surface term is
the free-energy cost of the interface at the surface of this sphere.
Thus the free energy is
DG~{4p
3R3rnDmz4pR2c ð31Þ
Where Dm is the difference between the chemical potential of the
phase where the nucleus is forming, and the chemical potential of
the phase nucleating, c is the interfacial tension, rn is the number
density of the nucleating phases. The free energy at the top of the
barrier DG* is easily found by setting the derivative of DG to zero.
Then we have
DG�~16p
3
c3
rnDmð Þ2ð32Þ
This occurs for a critical nucleus of radius
R�~2c
(rnDm)ð33Þ
The minimum (reversible) work of nucleus formation is maximized
for R,R*. The critical nucleus is therefore in unstable equilibri-
um, i.e. nuclei larger than R* grow spontaneously. Thus, in order
for the new phase to be formed (i.e. irreversible aggregation to
occur), the system must first overcome a free energy barrier and
form a critical nucleus. Thereafter, the new phase occurs
spontaneously (i.e. irreversible aggregation starts). Knowing DG*
and R* is therefore possible to determine c and Dm. In our case we
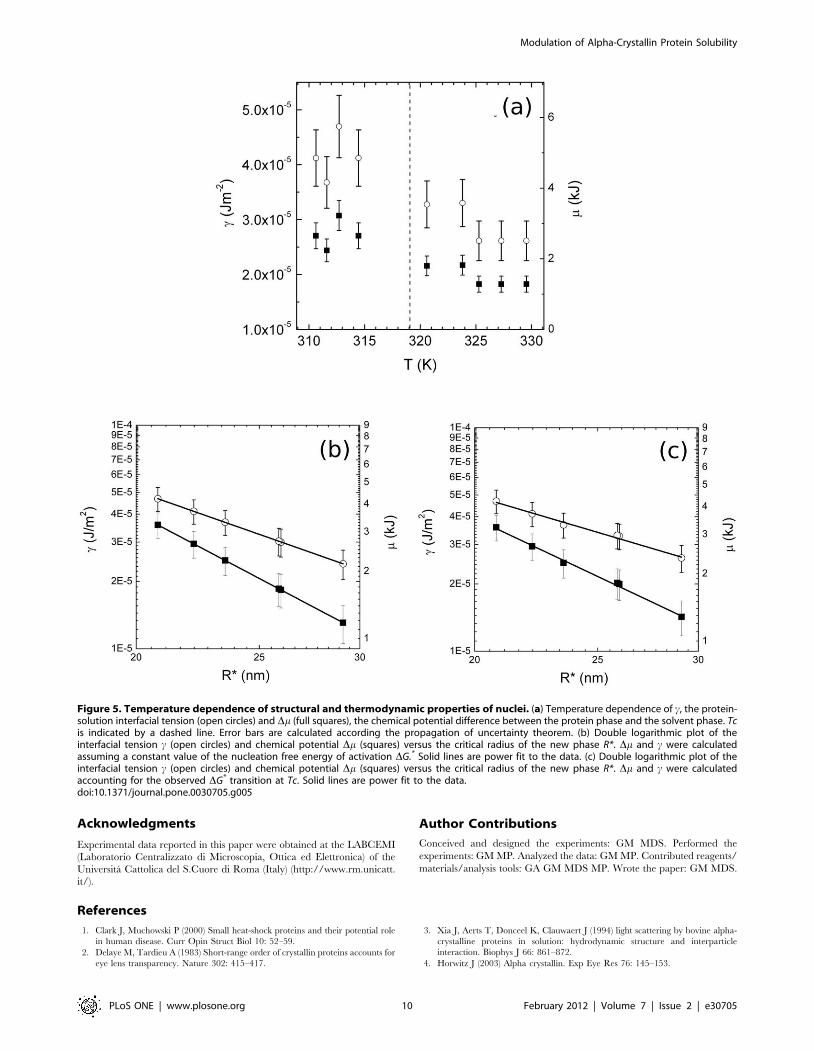
observe a decrease of both c and Dm in correspondence of Tc
(Figure 5a). c ranges from values typical of mercury, below Tc, to
values typical of ethanol. Thus, the free energy strength of the
bonds that hold protein molecules together on the surface becomes
,40% smaller above the transition temperature. Accordingly,
being negligible the variation of r measured by SAXS data
(Maulucci et al., in preparation), when the aggregation rate is
reduced, the free energy strength of the bonds that hold protein
molecules together in the bulk of the nucleus becomes nearly
,50% smaller.
To rule out analytically the abrupt change of these thermody-
namic quantities we proceed as follows: from equations (31) and
(32) it is possible to see that if no transition occurs (i.e. DG* is
constant) c*R �{2 and Dm*R�{3 where c is the interfacial
tension and Dm is the chemical potential and R* the critical radius
of the new phase. At the transition, the abrupt variation of the
nucleation free energy of activation DG* alter this trend leading to
a variation of the characteristic exponent, i.e. c*R{2{a andDm*R{3{a:
In fig. 5b a plot in double logarithmic scale of Dm (squares) and c(open circles) vs R*(fig. 1B), calculated assuming a constant value of
DG* is reported. The exponents determined fitting c values with a
power law c*R�{a and Dm values with Dm*R�{b are, as
expected, a = (1.9960.05) and b = (3.0060.06). In Fig. 5c the
same plot of Dm and c vs R*, calculated accounting for the
observed DG* transition at Tc, is reported. The exponents
determined fitting c values with a power law c*R�{c and Dmvalues with Dm*R�{d are now c = (1.6860.05) and d =
(2.6860.06). Therefore a in both cases is equal to 0.3260.06,
and the exponent variation is a consequence of the phase
transition.
5. ConclusionsThe temperature induced condensation of alpha-crystallin, the
main cause for lens opacification, is as a two step-process, a
nucleation followed by an aggregation phase, and a protective
effect towards the aggregation is exhibited over the alpha
crystallin phase transition temperature (Tc = 318.16 K). In this
work we showed how a modulation of the subunit interactions
over Tc triggers the protective mechanism towards its self-
aggregation. At the transition temperature, protein interactions
become looser. Indeed a decrease of both interfacial tension and
chemical potential (Figure 5) is observed, which corresponds to a
net increase of solubility of alpha crystallin X~eDmkT from ,0.35
to ,0.65. This increase leads critical nuclei to change their radii
from ,23 nm to ,28 nm, determining a reduction of their
number above Tc. The structural reconformation of the nucleus
has a dramatic consequence in both the kinetics of nucleation
and aggregation: the free energy barrier that must be overcome
to form nuclei, and then aggregates, increases. Precipitation of
the protein is therefore inhibited. Therefore an important
missing link between the structural modification and the
protective effect is found: the alpha crystallin phase transition,
abruptly decreasing the strength of subunit interactions,
markedly protects from aggregation above Tc, preserving the
transparency of the lens.
On the whole, the simultaneous determination of kinetic and
thermodynamic quantities, using population balance equations,
give a mathematical framework useful to develop kinetic models of
the aggregation processes, and can be a valuable tool in
characterizing effects of several biomolecules on lens proteins
supramolecular aggregation: biomolecules can inhibit the aggre-
gation by reducing simply the kinetic constants, or by functionally
altering the structure of HMW. Evaluating these different
contributions may be decisive in understanding the mechanisms
involved in aggregation-related diseases and in pharmaceutical
development and testing.
Modulation of Alpha-Crystallin Protein Solubility
PLoS ONE | www.plosone.org 9 February 2012 | Volume 7 | Issue 2 | e30705
Acknowledgments
Experimental data reported in this paper were obtained at the LABCEMI
(Laboratorio Centralizzato di Microscopia, Ottica ed Elettronica) of the
Universita Cattolica del S.Cuore di Roma (Italy) (http://www.rm.unicatt.
it/).
Author Contributions
Conceived and designed the experiments: GM MDS. Performed the
experiments: GM MP. Analyzed the data: GM MP. Contributed reagents/
materials/analysis tools: GA GM MDS MP. Wrote the paper: GM MDS.
References
1. Clark J, Muchowski P (2000) Small heat-shock proteins and their potential role
in human disease. Curr Opin Struct Biol 10: 52–59.
2. Delaye M, Tardieu A (1983) Short-range order of crystallin proteins accounts for
eye lens transparency. Nature 302: 415–417.
3. Xia J, Aerts T, Donceel K, Clauwaert J (1994) light scattering by bovine alpha-
crystalline proteins in solution: hydrodynamic structure and interparticle
interaction. Biophys J 66: 861–872.
4. Horwitz J (2003) Alpha crystallin. Exp Eye Res 76: 145–153.
Figure 5. Temperature dependence of structural and thermodynamic properties of nuclei. (a) Temperature dependence of c, the protein-solution interfacial tension (open circles) and Dm (full squares), the chemical potential difference between the protein phase and the solvent phase. Tcis indicated by a dashed line. Error bars are calculated according the propagation of uncertainty theorem. (b) Double logarithmic plot of theinterfacial tension c (open circles) and chemical potential Dm (squares) versus the critical radius of the new phase R*. Dm and c were calculatedassuming a constant value of the nucleation free energy of activation DG.* Solid lines are power fit to the data. (c) Double logarithmic plot of theinterfacial tension c (open circles) and chemical potential Dm (squares) versus the critical radius of the new phase R*. Dm and c were calculatedaccounting for the observed DG* transition at Tc. Solid lines are power fit to the data.doi:10.1371/journal.pone.0030705.g005
Modulation of Alpha-Crystallin Protein Solubility
PLoS ONE | www.plosone.org 10 February 2012 | Volume 7 | Issue 2 | e30705
5. Walsh M, Sen AC, Chakrabarti B (1991) Micellar subunit assembly in a three-
layer model of oligomeric alpha-crystallin. J Biol Chem 266: 20079–20084.6. Raman B, Rao CM (1997) Chaperone-like activity and temperature-induced
structural changes of alpha-crystallin. J Biol Chem 272: 23559–23564.
7. Ramakrishna B, Ramakrishna T, Rao CM (1995) temperature dependentchaperone-like activity of alpha-crystallin. FEBS lett. pp 133–136.
8. Raman B, Rao CM (1994) Chaperone-like activity and quaternary structure ofalpha-crystalline. J Biol Chem 269: 27264–27268.
9. Garland D, Duglas-Tabor Y, Jimenez-Asensio J, Datiles M, Magno B (1996)
The nucleus of the human lens: demonstration of a highly characteristic proteinpattern by two-dimensional electrophoresis and introduction of a new method of
lens dissection. Exp Eye Res 62: 285–291.10. Santini SA, Mordente A, Meucci E, Miggiano GA, Martorana G (1992)
Conformational stability of bovine alpha-crystallin. Evidence for destabilizingeffect of Ascorbate. Biochem J 287: 107–112.
11. Luthra M, Balasubramanian D (1993) Non-enzymatic glycation alters protein
structure and stability. A study of two eye lens crystallins. J Biol Chem 268:18119–18127.
12. Miesbauer RL, Zhou X, Yang Z, Yang Z, Sun Y, et al. (1994) Post-translationalmodifications of water-soluble human lens crystallins from young adults. J Biol
Chem 269: 12494–12502.
13. Jedziniak JA, Kinoshita JH, Yates EM, Hocker LO, Benedek GB (1972)Calcium-induced aggregation of bovine lens alpha crystallins. Invest Ophthal-
mol 11: 905–915.14. Guptasarma P, Balasubramanian D, Matsugo S, Saito I (1992) hydroxyl radical
damage to proteins, with special reference to the crystallins. Biochemistry 31:4296–4303.
15. Doss-Pepe EW, Carew EL, Koretz JL (1998) Studies of the denaturation
patterns of bovine alpha-crystallin using an ionic denaturant, guanidinehydrochloride and a non-ionic denaturant, urea. Exp Eye Res 67: 657–679.
16. Putilina T, Skouri-Panet F, Prat K, Lubsen NH, Tardieu A (2003) Sub-unitexchange demonstrates a differential chaperone activity of calf-alpha crystallin
towards beta-low- and individual gamma crystallins. J Biol Chem 278:
27264–27268.17. Horwitz J, Huang Q, Ding L (2004) The native oligomeric organization of
alpha-crystallin, is it necessary for its chaperone function? Exp Eye Res 79(6):817–821.
18. Maulucci G, Papi M, Arcovito G, De Spirito M (2011) The thermal structuraltransition of alpha-crystallin inhibits the heat induced self-aggregation. PLoS
One 6(5): e18906.
19. Andreasi Bassi F, Arcovito G, De Spirito M, Mordente A, Martorana G (1995)Self-similarity properties of alpha-crystalline supramolecular aggregates.
Biophys J 69: 2720–2727.20. Kramps HA, Stols ALH, Hoenders HJ, Groot KD (1975) On the quatemary
structure of high-molecular-weight proteins from the bovine eye lens.
Eur J Biochem 50: 503–509.
21. Ramkrishna B (2000) Population Balance. San Diego: Academic Press.
22. Seinfeld JH, Pandis SP (1998) Atmospheric chemistry and physics. New York:John Wiley and sons.
23. Debenedetti PG (1996) Metastable liquids: concepts and principles. Princeton:
Princeton University Press.24. Eaton WA, Hofrichter J (1990) Sickle cell hemoglobin polymerization. Adv Prot
Chem 40: 63–279.25. Maulucci G, De Spirito M, Arcovito G, Boffi F, Congiu Castellano A, et al.
(2005) Particle Size Distribution in DMPC Vesicles Solutions Undergoing
Different sonication times. Biophys J 88: 3545–3550.26. Papi M, Maulucci G, De Spirito M, Missori M, Arcovito G, et al. (2010)
Ristocetin-induced self-aggregation of von Willebrand factor. Eur Biophys J39(12): 1597–1603.
27. Lattuada M, Wu H, Morbidelli M (2003) Hydrodynamic radius of fractalclusters. J Colloid Interface Sci 268: 96–105.
28. Zhu P, Napper D (1994) Studies of aggregation kinetics of polystyrene latices
sterically stabilized by poly(N-isopropylacrylamide). Phys Rev E: Stat, Nonlin-ear, Soft Matter Phys 50: 1360–1366.
29. Tirado-Miranda M, Schmitt A, Callejas-Fernandez J, Fernandez-Barbero A(2003) the aggregation behavior of protein-coated colloidal particles: a light
scattering study. Eur Biophys J 32: 128–136.
30. Kerker M (1969) The Scattering of Light and other electromagnetic radiations.New York: Academic Press.
31. Chen SH, Teixeira J (1986) Structure and fractal dimension of protein-detergentcomplexes. Phys Rev Lett 57: 2583–2586.
32. Weitz D, Lin MY (1986) Dynamic Scaling of Cluster-Mass Distributions inKinetic Colloid Aggregation. Phys Rev Lett 57: 2037–2040.
33. Berne B, Pecora R (1976) Dynamic Light Scattering. New York: John Wiley and
sons.34. Koppel DE (1972) Analysis of macromolecular polydispersity in intensity
correlation spectroscopy: the method of cumulants. J Chem Phys. pp4814–4820.
35. Parasassi T, De Spirito M, Mei G, Brunelli R, Greco G, et al. (2008) Low density
lipoprotein misfolding and amyloidogenesis. FASEB J 22(7): 2350–2356.36. Thorn M, Seesselberg M (1994) Dynamic scaling in colloidal aggregation:
comparison of experimental data with results of stochastic simulations. Phys RevLett 72: 3622–3625.
37. De Hoog E, Kegel W, van Blaaderen A, Lekkerkerker HNW (2001) Directobservation of crystallization and aggregation in phase-separating colloid-
polymer suspension. Phys Rev E 64: 021407.
38. Biosca J, Travers F, Barman T (1983) A jump in an Arrhenius plot can be theconsequence of a phase transition. FEBS lett 153: 217–220.
39. Lasaga AC (1998) Kinetic Theory. Princeton: Princeton University Press.40. Kusumoto Y, Lomakin A, Teplow DB, Benedek GB (1998) Temperature
dependence of amyloid beta-protein fibrillization. Proc Nat Acad Sci USA 95:
12277–12282.
Modulation of Alpha-Crystallin Protein Solubility
PLoS ONE | www.plosone.org 11 February 2012 | Volume 7 | Issue 2 | e30705
Related Documents