CONSUMER EXPECTATIONS & HOW TO GROW WITH SUSTAINABILITY THE SUSTAINABILITY IMPERATIVE Claudia Suárez-Gapp The Nielsen Company June 14 2016

Welcome message from author
This document is posted to help you gain knowledge. Please leave a comment to let me know what you think about it! Share it to your friends and learn new things together.
Transcript
CONSUMER EXPECTATIONS & HOW TO GROW
WITH SUSTAINABILITY
THE SUSTAINABILITY IMPERATIVE
Claudia Suárez-Gapp
The Nielsen Company
June 14 2016
Co
pyri
gh
t ©
20
15
Th
e N
iels
en
Co
mp
an
y.
Co
nfi
de
nti
al
an
d p
rop
rie
tary
.
2
DEFINING SUSTAINABILITY
ENVIRONMENTAL SOCIAL GOVERNANCE
Co
pyri
gh
t ©
20
15
Th
e N
iels
en
Co
mp
an
y.
Co
nfi
de
nti
al
an
d p
rop
rie
tary
.
3
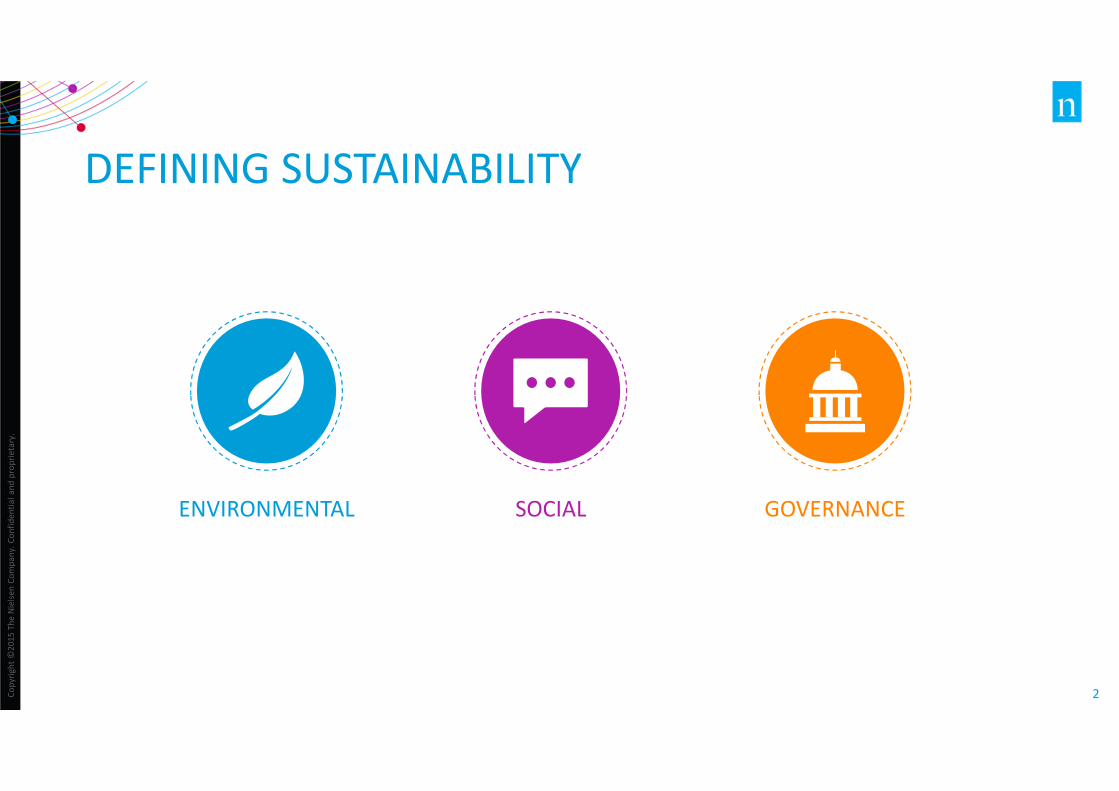
INCREASING GLOBAL EMPHASIS & POLITICAL
IMPERATIVE
Take a look at the video https://www.youtube.com/watch?v=RpqVmvMCmp0
.
WHAT DO WE KNOW?
Co
pyri
gh
t ©
20
15
Th
e N
iels
en
Co
mp
an
y.
Co
nfi
de
nti
al
an
d p
rop
rie
tary
.
5
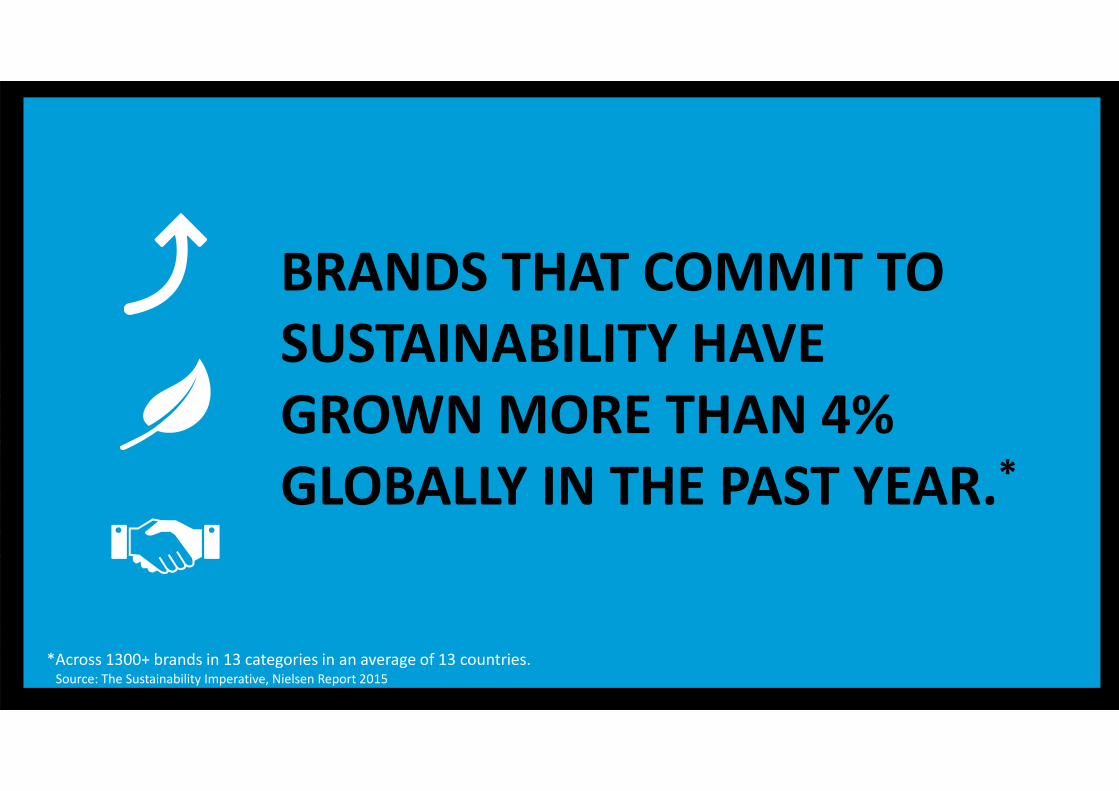
BRANDS THAT COMMIT TO
SUSTAINABILITY HAVE
GROWN MORE THAN 4%
GLOBALLY IN THE PAST YEAR.*
*Across 1300+ brands in 13 categories in an average of 13 countries.Source: The Sustainability Imperative, Nielsen Report 2015
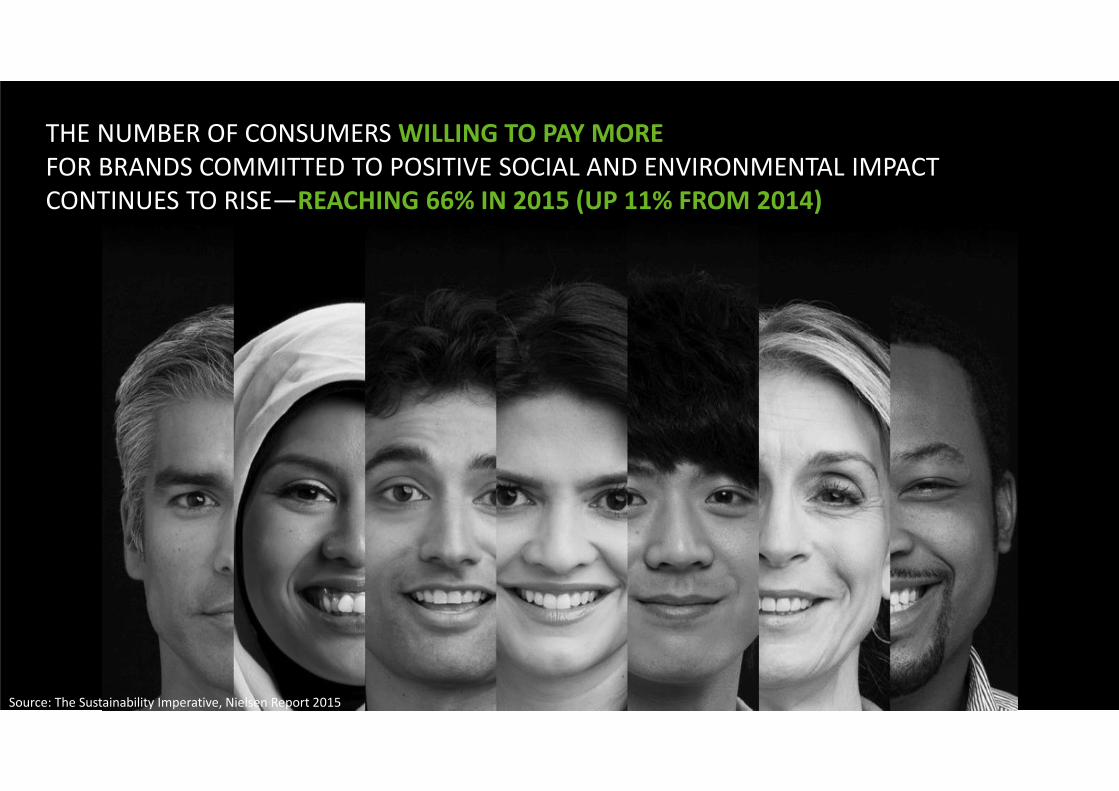
THE NUMBER OF CONSUMERS WILLING TO PAY MORE
FOR BRANDS COMMITTED TO POSITIVE SOCIAL AND ENVIRONMENTAL IMPACT
CONTINUES TO RISE—REACHING 66% IN 2015 (UP 11% FROM 2014)
Source: The Sustainability Imperative, Nielsen Report 2015
Co
pyri
gh
t ©
20
15
Th
e N
iels
en
Co
mp
an
y.
Co
nfi
de
nti
al
an
d p
rop
rie
tary
.
7
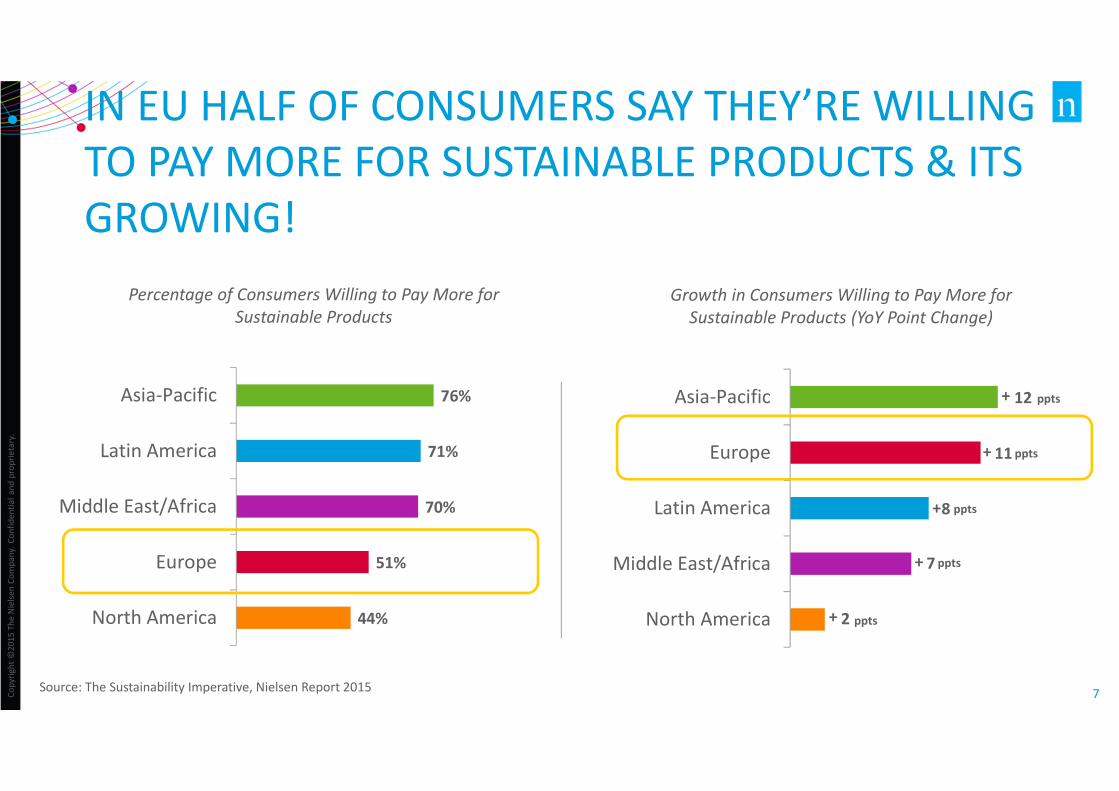
IN EU HALF OF CONSUMERS SAY THEY’RE WILLING
TO PAY MORE FOR SUSTAINABLE PRODUCTS & ITS
GROWING!
Source: The Sustainability Imperative, Nielsen Report 2015
44%
51%
70%
71%
76%
North America
Europe
Middle East/Africa
Latin America
Asia-Pacific
Percentage of Consumers Willing to Pay More for
Sustainable Products
Growth in Consumers Willing to Pay More for
Sustainable Products (YoY Point Change)
2
7
8
11
12
North America
Middle East/Africa
Latin America
Europe
Asia-Pacific
+
ppts
ppts
ppts
ppts
ppts
+
+
+
+
Co
pyri
gh
t ©
20
15
Th
e N
iels
en
Co
mp
an
y.
Co
nfi
de
nti
al
an
d p
rop
rie
tary
.
8
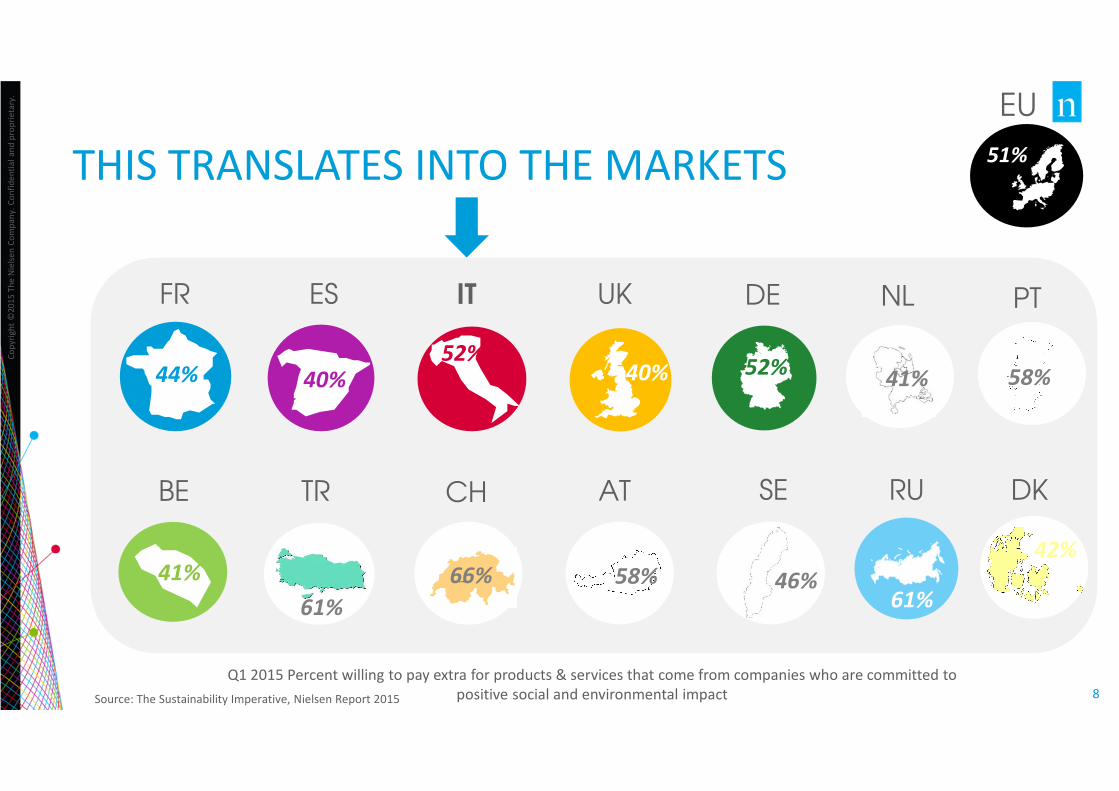
THIS TRANSLATES INTO THE MARKETS
FR ES IT
TR
41%
BE
EU
44% 40%
52%
61%
51%
Q1 2015 Percent willing to pay extra for products & services that come from companies who are committed to
positive social and environmental impact
NL UK DE
CH AT SE RU
40% 52%
61%
PT
DK
41% 58%
66% 58% 46%
42%
Source: The Sustainability Imperative, Nielsen Report 2015

WHERE DOES THE INTEREST LIE?

Co
pyri
gh
t ©
20
15
Th
e N
iels
en
Co
mp
an
y.
Co
nfi
de
nti
al
an
d p
rop
rie
tary
.
10
CONSUMERS UNDER 34 ARE WILLING TO PAY
MORE
GROWING:
GENERATION Z
72%
MOST LIKELY TO BUY:
MILLENNIALS
73%
DON’T FORGET:
BABY BOOMERS
51%
Source: The Sustainability Imperative, Nielsen Report 2015
Co
pyri
gh
t ©
20
15
Th
e N
iels
en
Co
mp
an
y.
Co
nfi
de
nti
al
an
d p
rop
rie
tary
.
11
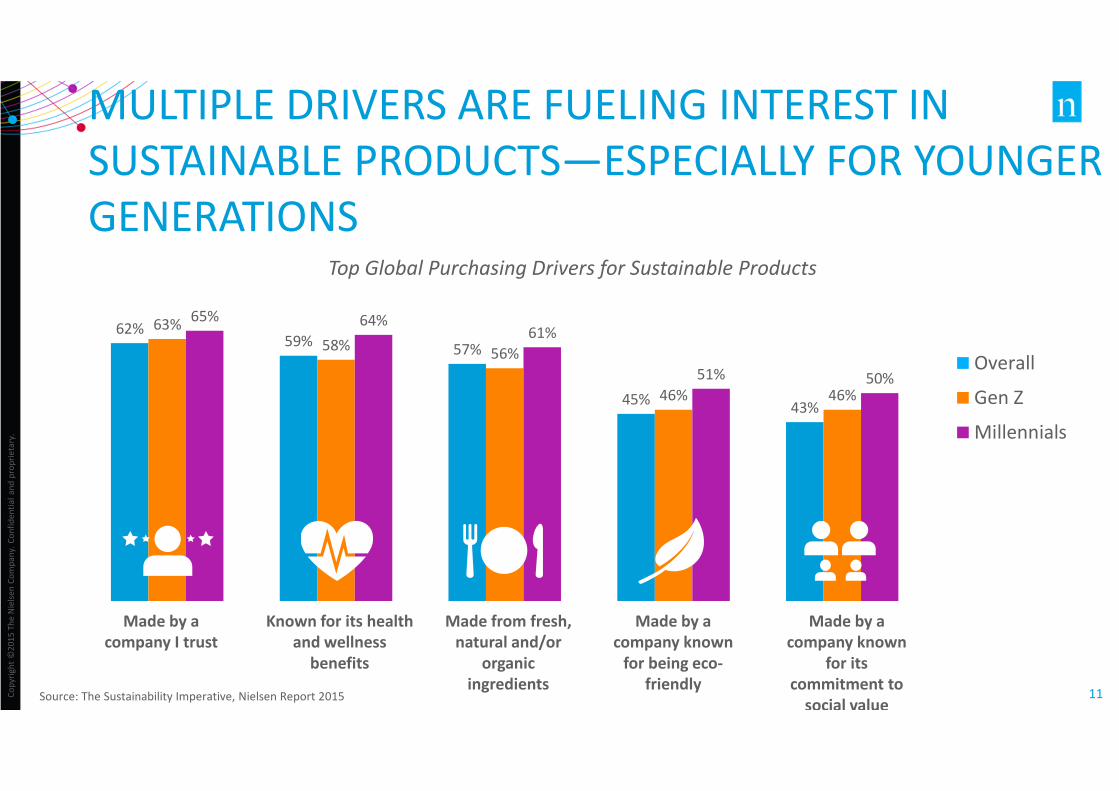
62%59%
57%
45%43%
63%
58%56%
46% 46%
65% 64%61%
51% 50%Overall
Gen Z
Millennials
MULTIPLE DRIVERS ARE FUELING INTEREST IN
SUSTAINABLE PRODUCTS—ESPECIALLY FOR YOUNGER
GENERATIONSTop Global Purchasing Drivers for Sustainable Products
Source: The Sustainability Imperative, Nielsen Report 2015
Made by a
company I trust
Known for its health
and wellness
benefits
Made from fresh,
natural and/or
organic
ingredients
Made by a
company known
for being eco-
friendly
Made by a
company known
for its
commitment to
social value

Co
pyri
gh
t ©
20
15
Th
e N
iels
en
Co
mp
an
y.
Co
nfi
de
nti
al
an
d p
rop
rie
tary
.
12
MARKETS VARY ON TRUST HIGHLIGHTING THE
NEED TO UNDERSTAND COUNTRY SPECIFICITIES
FR ES IT
TR
38%
BE
38% 55%
53%
71%
51%
NL UK DE
CH AT SE RU
39% 61%
48%
PT
DK
35% 54%
51% 61% 50%
40%
Source: The Sustainability Imperative, Nielsen Report 2015

Co
pyri
gh
t ©
20
15
Th
e N
iels
en
Co
mp
an
y.
Co
nfi
de
nti
al
an
d p
rop
rie
tary
.
13
WHAT IS THE KEY SUSTAINABILITY PURCHASING
DRIVER FOR EUROPEAN CONSUMERS?
FRESH, NATURAL,
ORGANIC INGREDIENTS
FRESH, NATURAL, ORGANIC INGREDIENTS ARE
PARAMOUNT TO 52% OF EUROPEAN
RESPONDENTS.
Source: The Sustainability Imperative, Nielsen Report 2015
Co
pyri
gh
t ©
20
15
Th
e N
iels
en
Co
mp
an
y.
Co
nfi
de
nti
al
an
d p
rop
rie
tary
.
14
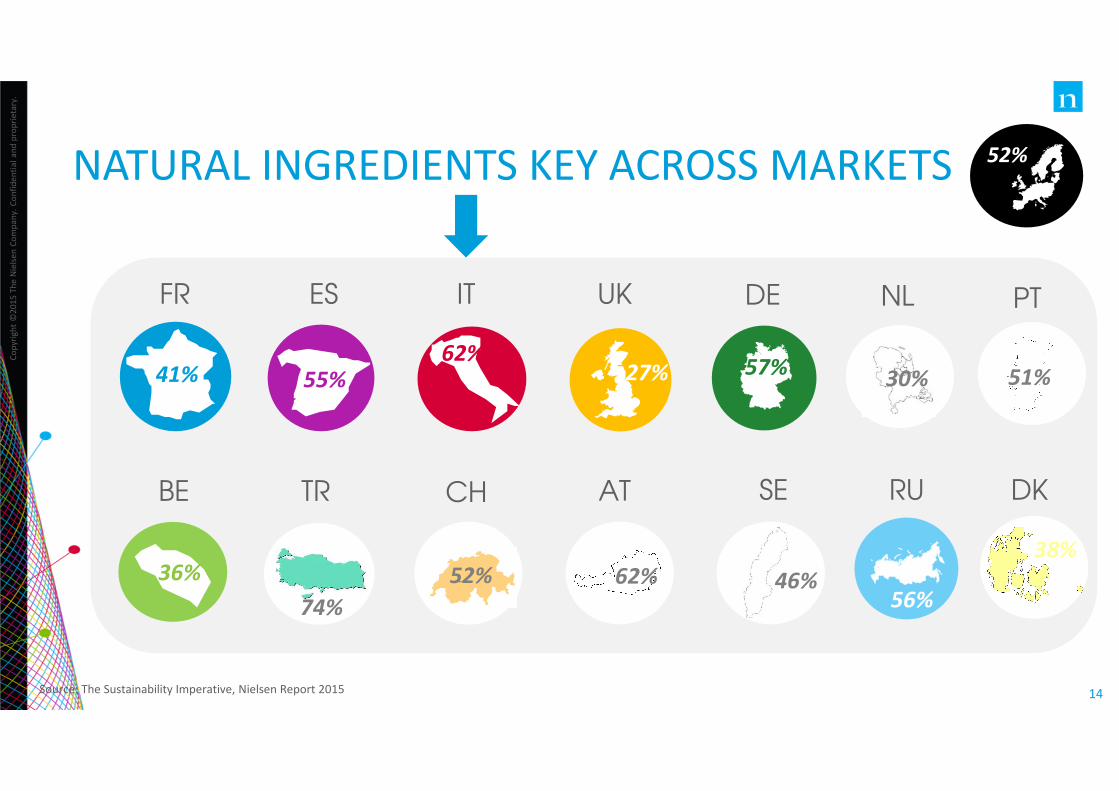
NATURAL INGREDIENTS KEY ACROSS MARKETS
FR ES IT
TR
36%
BE
41% 55%
62%
74%
52%
NL UK DE
CH AT SE RU
27% 57%
56%
PT
DK
30% 51%
52% 62% 46%
38%
Source: The Sustainability Imperative, Nielsen Report 2015
THE CURRENT STATE OF “SUSTAINABLE”
COMMUNICATION
Co
pyri
gh
t ©
20
15
Th
e N
iels
en
Co
mp
an
y.
Co
nfi
de
nti
al
an
d p
rop
rie
tary
.
16
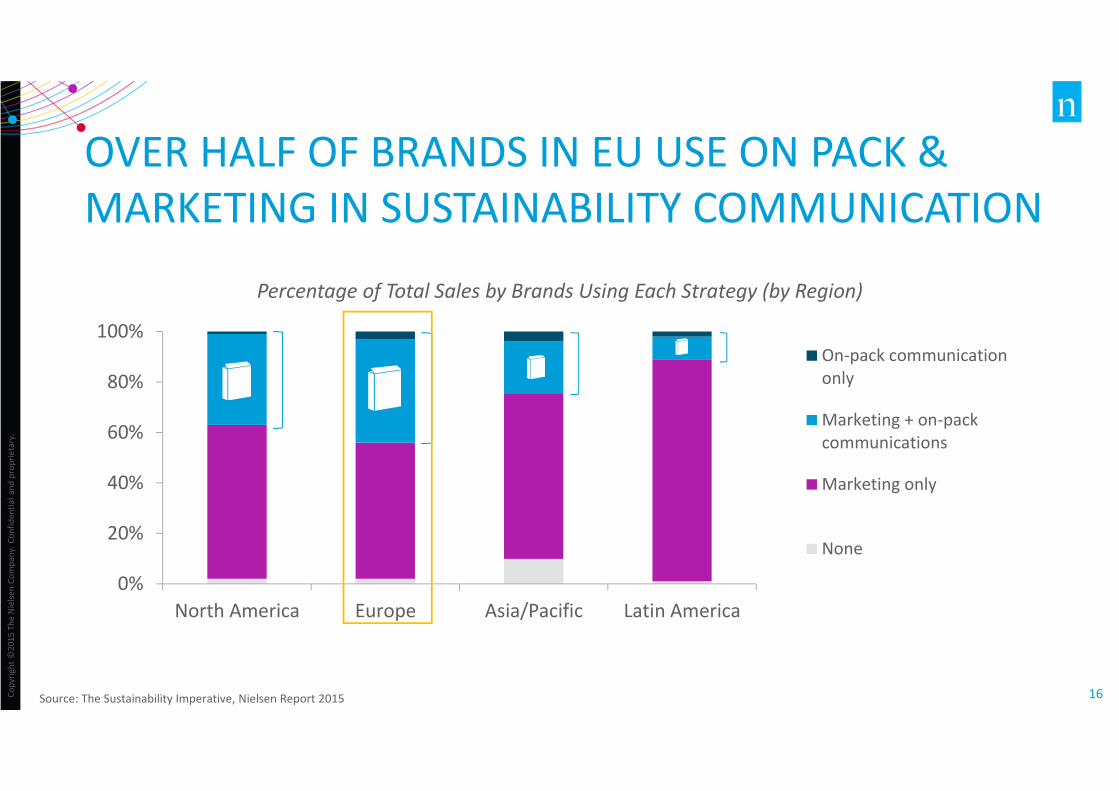
OVER HALF OF BRANDS IN EU USE ON PACK &
MARKETING IN SUSTAINABILITY COMMUNICATION
Percentage of Total Sales by Brands Using Each Strategy (by Region)
0%
20%
40%
60%
80%
100%
North America Europe Asia/Pacific Latin America
On-pack communication
only
Marketing + on-pack
communications
Marketing only
None
Source: The Sustainability Imperative, Nielsen Report 2015
Co
pyri
gh
t ©
20
15
Th
e N
iels
en
Co
mp
an
y.
Co
nfi
de
nti
al
an
d p
rop
rie
tary
.
17
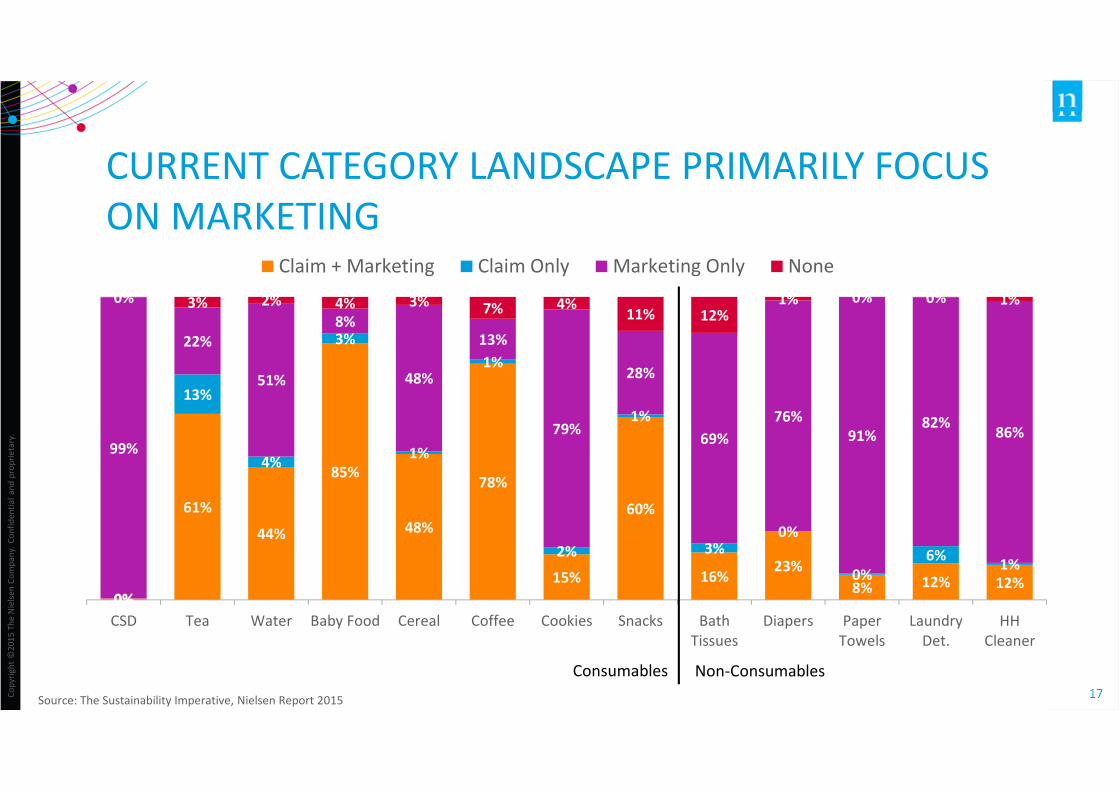
CURRENT CATEGORY LANDSCAPE PRIMARILY FOCUS
ON MARKETING
Source: The Sustainability Imperative, Nielsen Report 2015
0%
61%
44%
85%
48%
78%
15%
60%
16%23%
8% 12% 12%0%
13%
4%
3%
1%
1%
2%
1%
3%0%
0%
6%1%
99%
22%
51%
8%
48%
13%
79%
28%
69%
76%
91%82%
86%
0% 3% 2% 4% 3% 7% 4%11% 12%
1% 0% 0% 1%
CSD Tea Water Baby Food Cereal Coffee Cookies Snacks Bath
Tissues
Diapers Paper
Towels
Laundry
Det.
HH
Cleaner
Claim + Marketing Claim Only Marketing Only None
Consumables Non-Consumables
Co
pyri
gh
t ©
20
12
Th
e N
iels
en
Co
mp
an
y.
Co
nfi
de
nti
al a
nd
pro
pri
eta
ry.
18
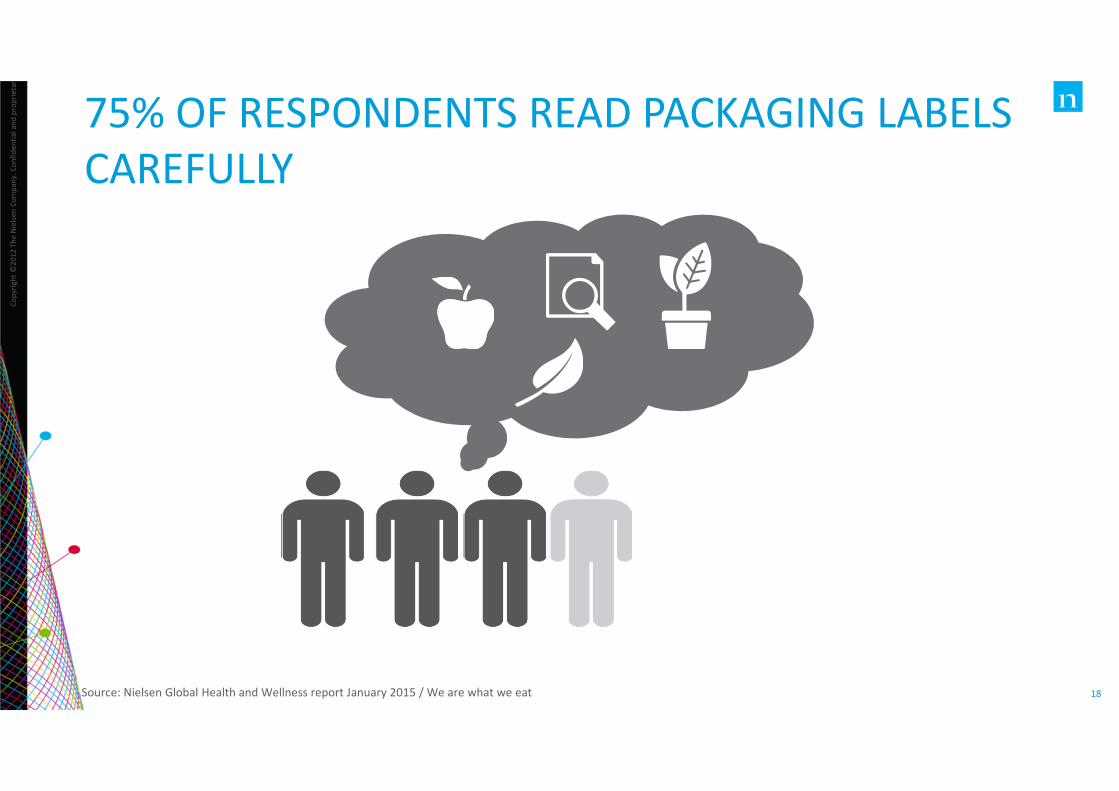
75% OF RESPONDENTS READ PACKAGING LABELS
CAREFULLY
Source: Nielsen Global Health and Wellness report January 2015 / We are what we eat
Co
pyri
gh
t ©
20
12
Th
e N
iels
en
Co
mp
an
y.
Co
nfi
de
nti
al a
nd
pro
pri
eta
ry.
19
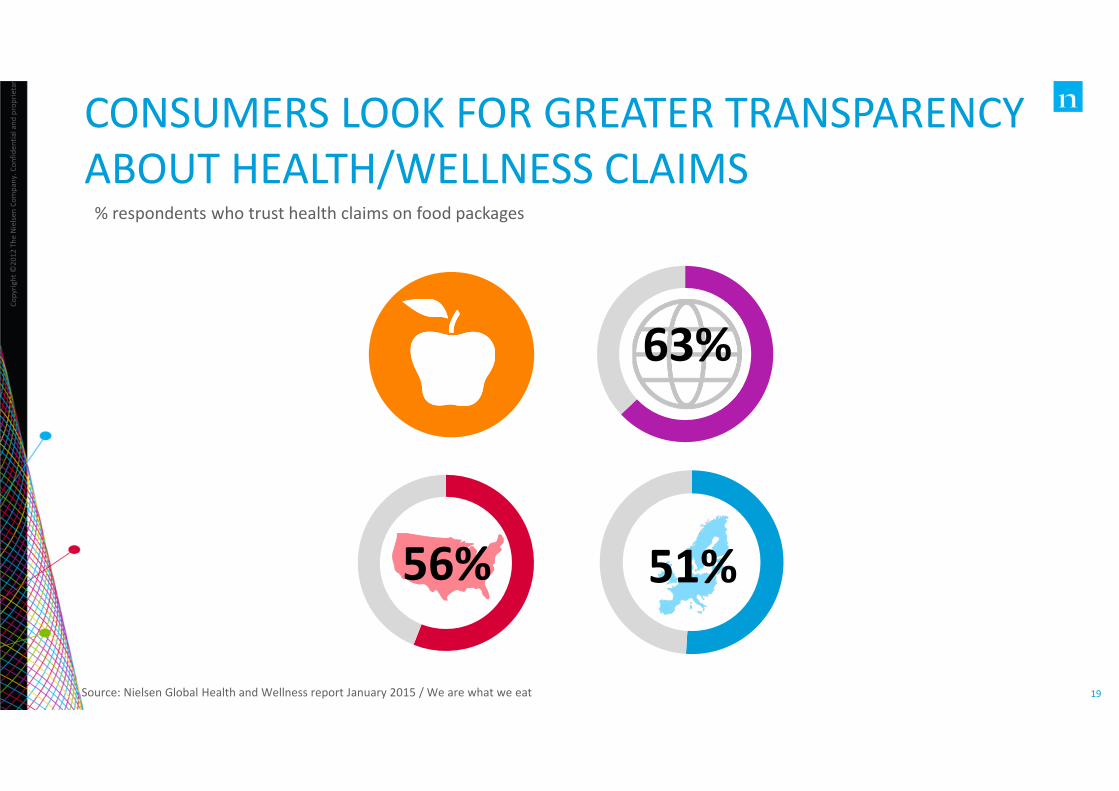
CONSUMERS LOOK FOR GREATER TRANSPARENCY
ABOUT HEALTH/WELLNESS CLAIMS
Source: Nielsen Global Health and Wellness report January 2015 / We are what we eat
% respondents who trust health claims on food packages
63%
56% 51%

Co
pyri
gh
t ©
20
12
Th
e N
iels
en
Co
mp
an
y.
Co
nfi
de
nti
al a
nd
pro
pri
eta
ry.
20
FAIR TRADE/
SUSTAINABLY
SOURCED
38% SAY FAIR TRADE IS VERY IMPORTANT,
FOLLOWED BY:
ORGANIC 36%
HIGH PROTEIN 34%
FORTIFICATION 31%
AMONG THE FOLLOWING HEALTH ATTRIBUTES, WHICH
IS MOST IMPORTANT TO MILLENNIALS WHEN MAKING
A PURCHASE?
Source: Nielsen Global Generational Lifestyles Report, 2015
Co
pyri
gh
t ©
20
15
Th
e N
iels
en
Co
mp
an
y.
Co
nfi
de
nti
al
an
d p
rop
rie
tary
.
21
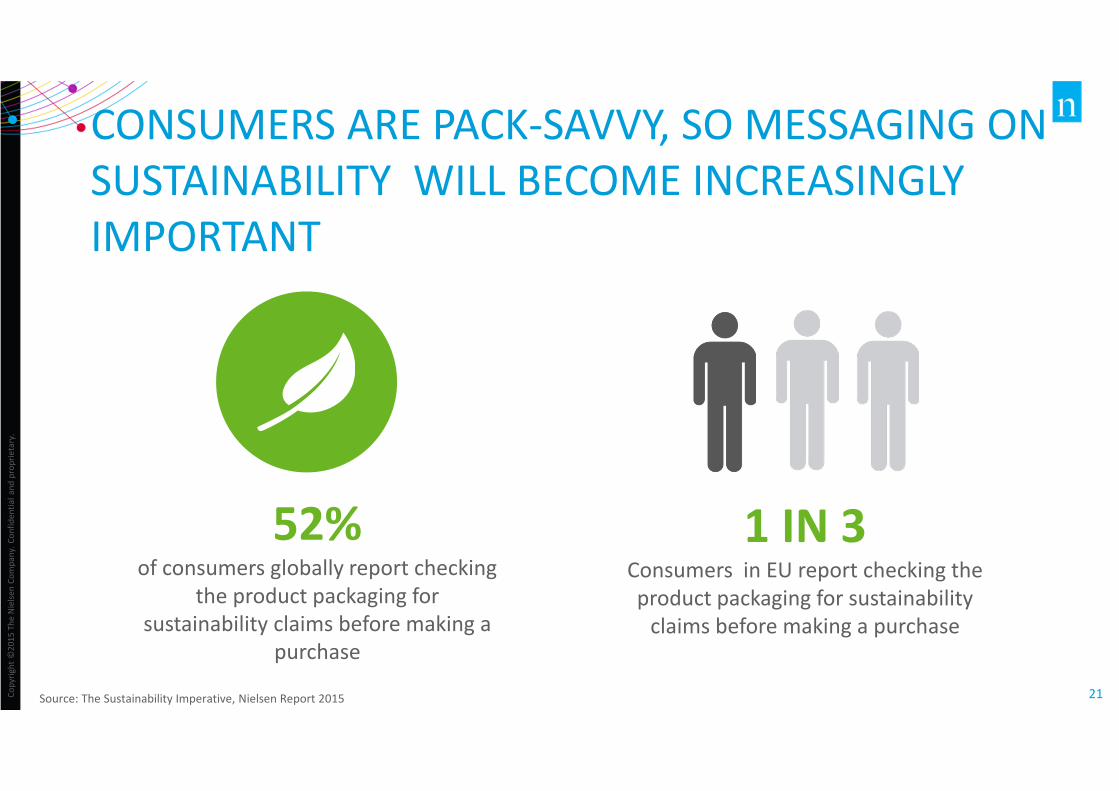
CONSUMERS ARE PACK-SAVVY, SO MESSAGING ON
SUSTAINABILITY WILL BECOME INCREASINGLY
IMPORTANT
52%of consumers globally report checking
the product packaging for
sustainability claims before making a
purchase
1 IN 3 Consumers in EU report checking the
product packaging for sustainability
claims before making a purchase
Source: The Sustainability Imperative, Nielsen Report 2015
GROWTH AREAS FOR
SUSTAINABILITY
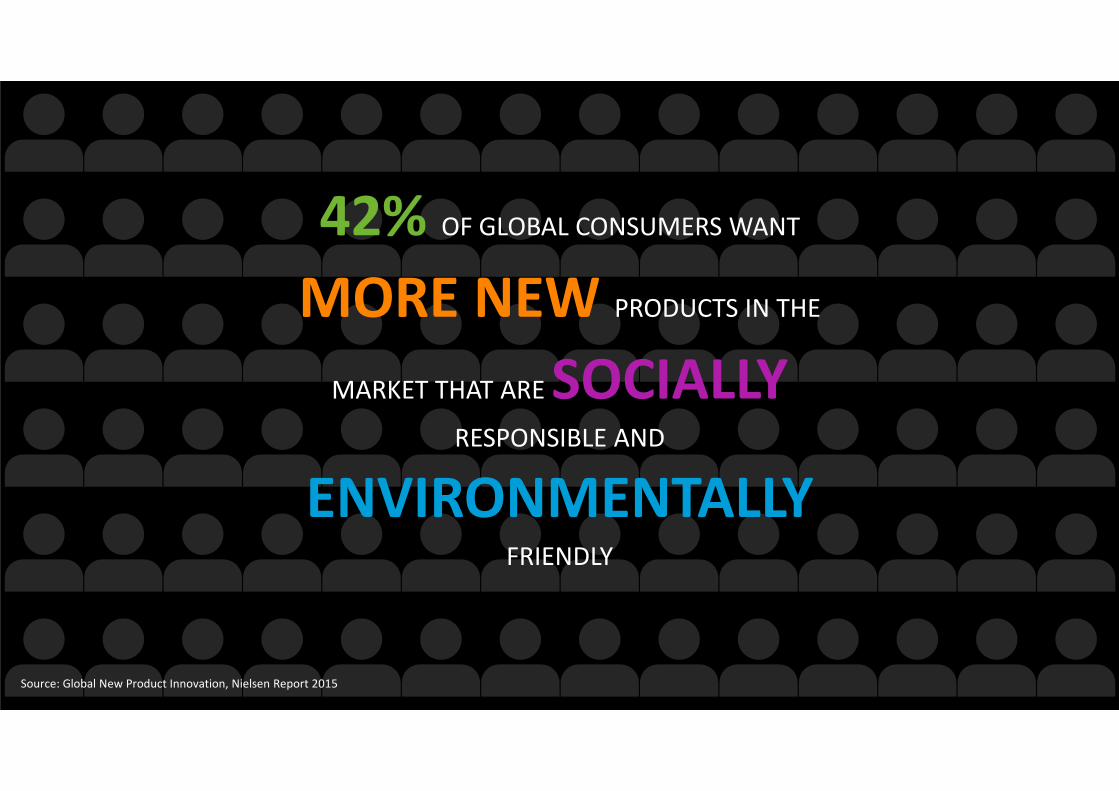
42% OF GLOBAL CONSUMERS WANT
MORE NEW PRODUCTS IN THE
MARKET THAT ARE SOCIALLYRESPONSIBLE AND
ENVIRONMENTALLYFRIENDLY
Source: Global New Product Innovation, Nielsen Report 2015
Co
pyri
gh
t ©
20
15
Th
e N
iels
en
Co
mp
an
y.
Co
nfi
de
nti
al
an
d p
rop
rie
tary
.
24
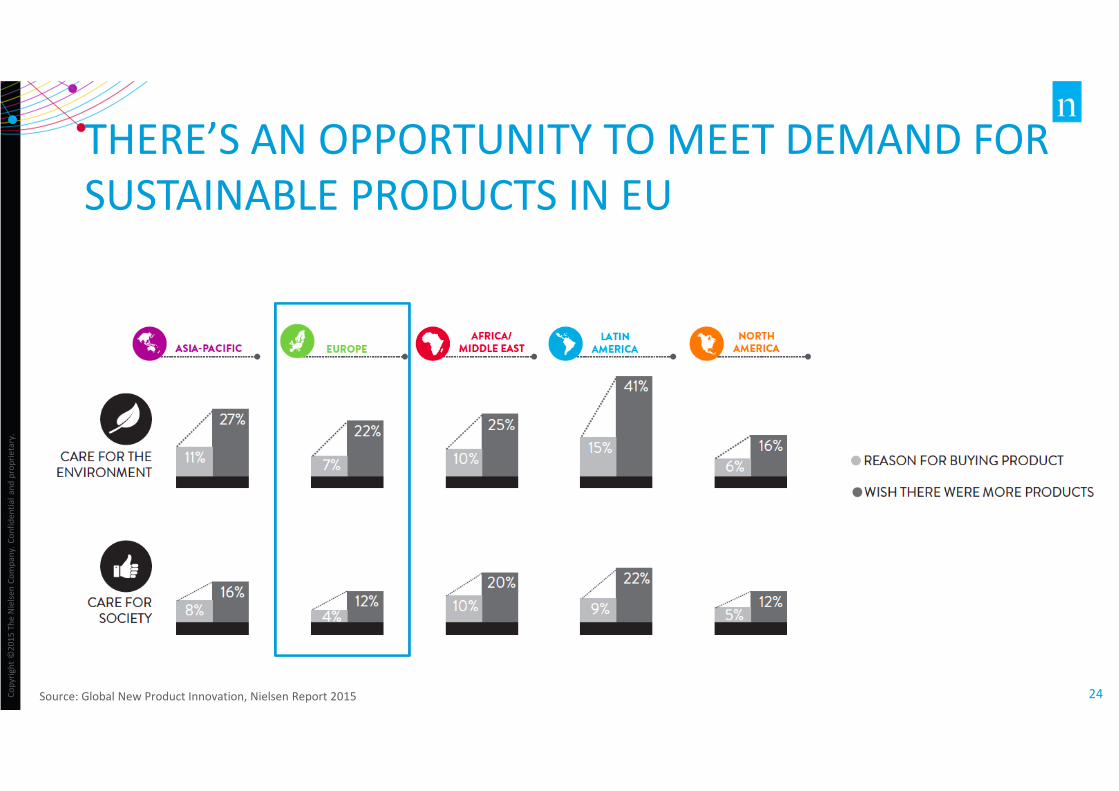
THERE’S AN OPPORTUNITY TO MEET DEMAND FOR
SUSTAINABLE PRODUCTS IN EU
Source: Global New Product Innovation, Nielsen Report 2015
Co
pyri
gh
t ©
20
15
Th
e N
iels
en
Co
mp
an
y.
Co
nfi
de
nti
al
an
d p
rop
rie
tary
.
25
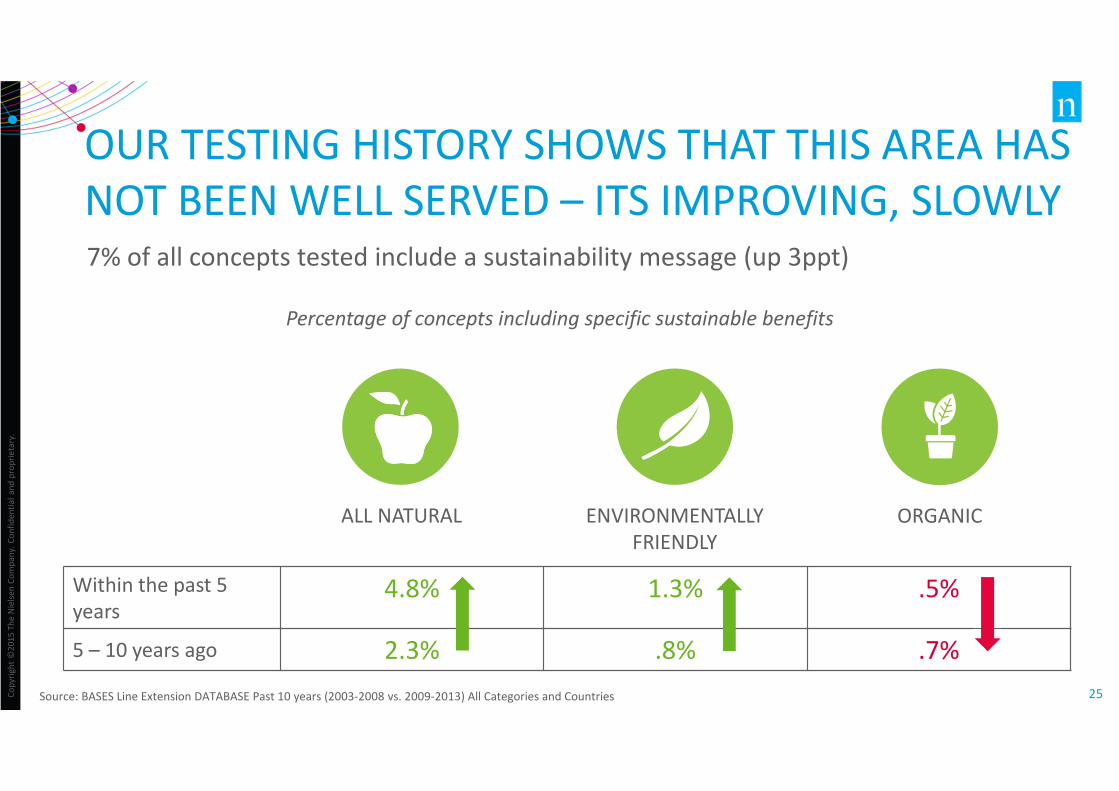
OUR TESTING HISTORY SHOWS THAT THIS AREA HAS
NOT BEEN WELL SERVED – ITS IMPROVING, SLOWLY7% of all concepts tested include a sustainability message (up 3ppt)
Source: BASES Line Extension DATABASE Past 10 years (2003-2008 vs. 2009-2013) All Categories and Countries
Percentage of concepts including specific sustainable benefits
ENVIRONMENTALLY
FRIENDLY
ALL NATURAL ORGANIC
Within the past 5
years4.8% 1.3% .5%
5 – 10 years ago 2.3% .8% .7%

YOUR BUSINESS – AND REPUTATION –
DEPEND ON IT
Co
pyri
gh
t ©
20
15
Th
e N
iels
en
Co
mp
an
y.
Co
nfi
de
nti
al
an
d p
rop
rie
tary
.
27
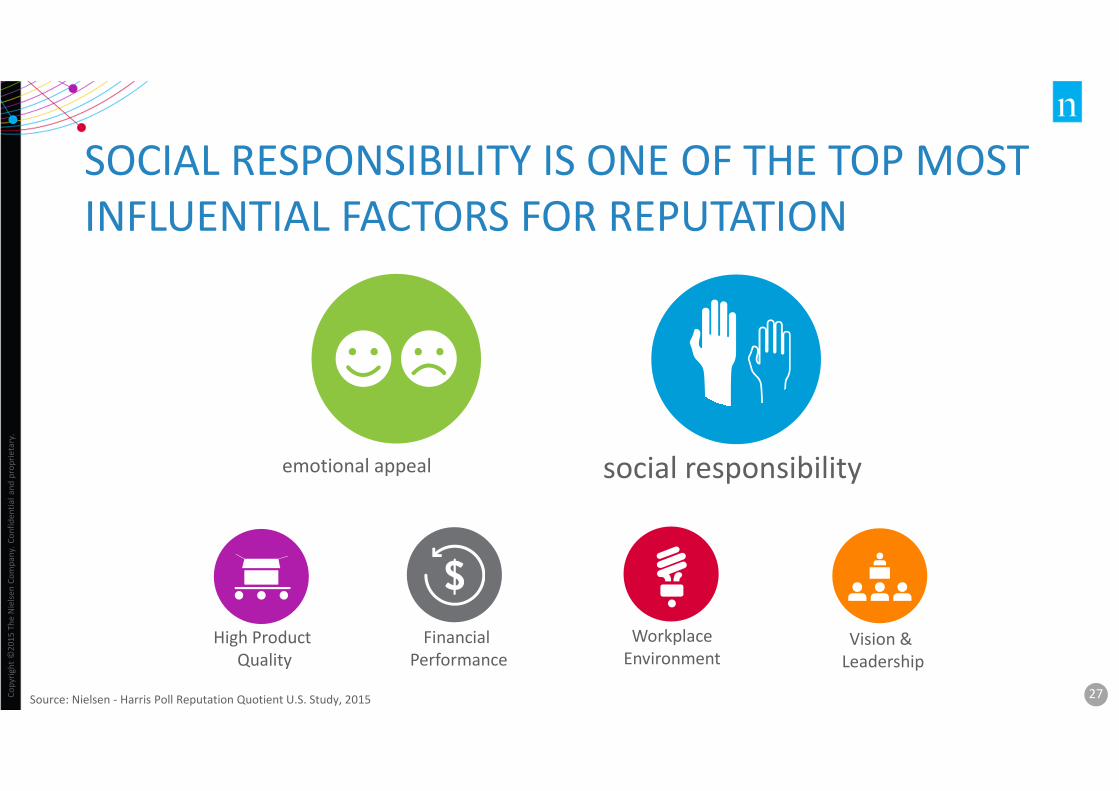
SOCIAL RESPONSIBILITY IS ONE OF THE TOP MOST
INFLUENTIAL FACTORS FOR REPUTATION
emotional appeal
Financial
PerformanceVision &
Leadership
Workplace
Environment
High Product
Quality
social responsibility
Source: Nielsen - Harris Poll Reputation Quotient U.S. Study, 2015
Co
pyri
gh
t ©
20
15
Th
e N
iels
en
Co
mp
an
y.
Co
nfi
de
nti
al
an
d p
rop
rie
tary
.
28
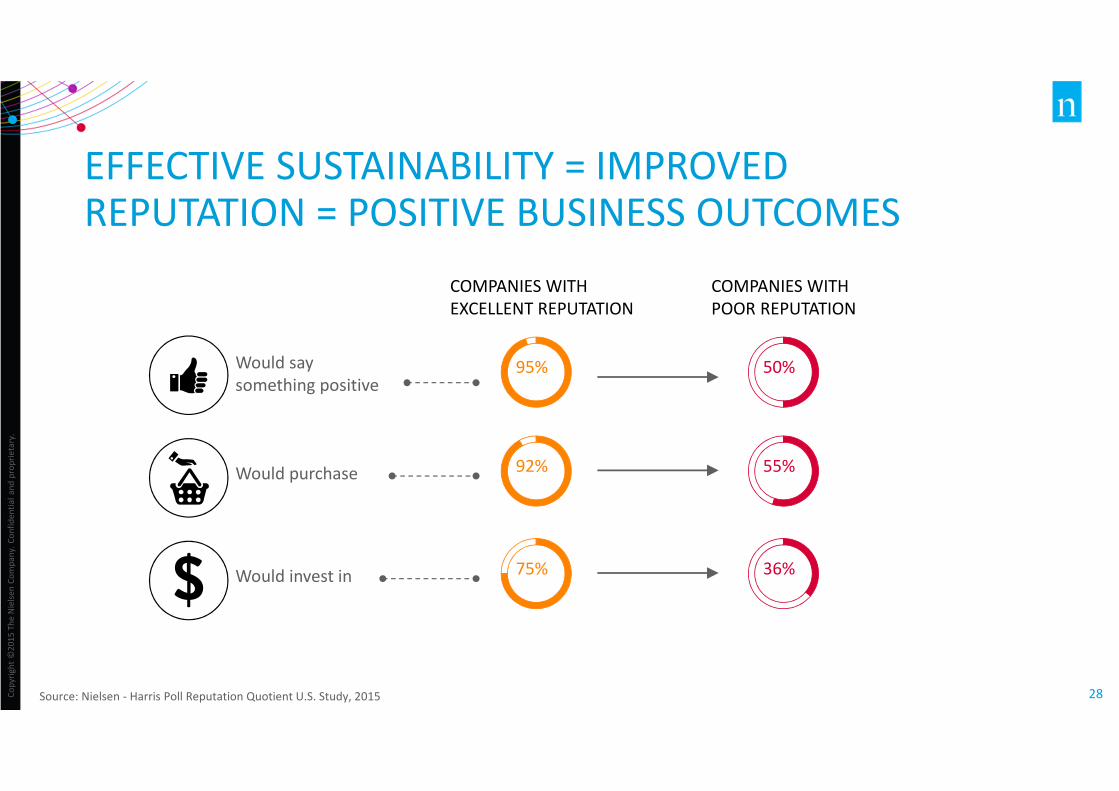
EFFECTIVE SUSTAINABILITY = IMPROVED REPUTATION = POSITIVE BUSINESS OUTCOMES
Source: Nielsen - Harris Poll Reputation Quotient U.S. Study, 2015
Would say
something positive
Would purchase
Would invest in
COMPANIES WITH
EXCELLENT REPUTATION
COMPANIES WITH
POOR REPUTATION
95%
92%
75%
50%
55%
36%

Co
pyri
gh
t ©
20
15
Th
e N
iels
en
Co
mp
an
y.
Co
nfi
de
nti
al
an
d p
rop
rie
tary
.
29
67% OF GLOBAL CONSUMERS
WANT TO WORK for
COMPANIES that are GIVING
BACK to SOCIETYSource: Global Shopper survey - Nielsen Report Q1 - 2015
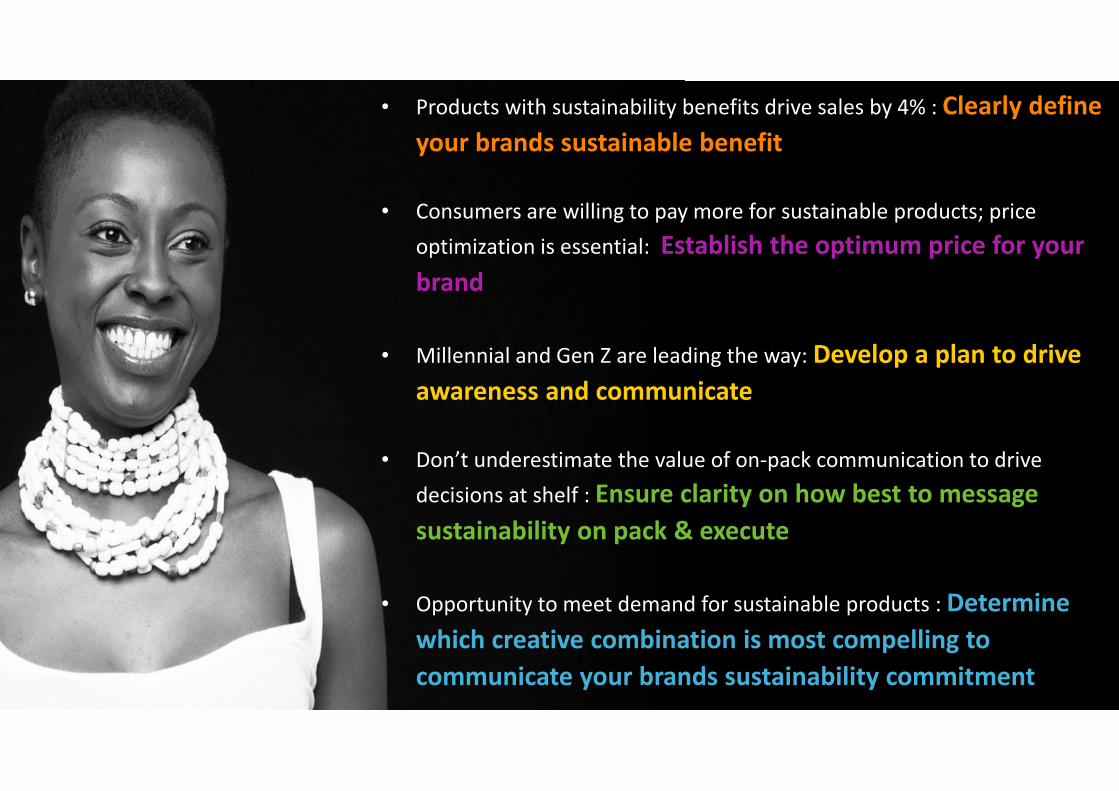
• Products with sustainability benefits drive sales by 4% : Clearly define
your brands sustainable benefit
• Consumers are willing to pay more for sustainable products; price
optimization is essential: Establish the optimum price for your
brand
• Millennial and Gen Z are leading the way: Develop a plan to drive
awareness and communicate
• Don’t underestimate the value of on-pack communication to drive
decisions at shelf : Ensure clarity on how best to message
sustainability on pack & execute
• Opportunity to meet demand for sustainable products : Determine
which creative combination is most compelling to
communicate your brands sustainability commitment
THANK YOU
[email protected] FIND OUT MORE OF WHAT WE DO AT NIELSEN CLICK :
HTTPS://WWW.YOUTUBE.COM/WATCH?V=EF6IOXR-SJU&FEATURE=YOUTU.BE
Co
pyri
gh
t ©
20
14
Th
e N
iels
en
Co
mp
an
y.
Co
nfi
de
nti
al a
nd
pro
pri
eta
ry.
32
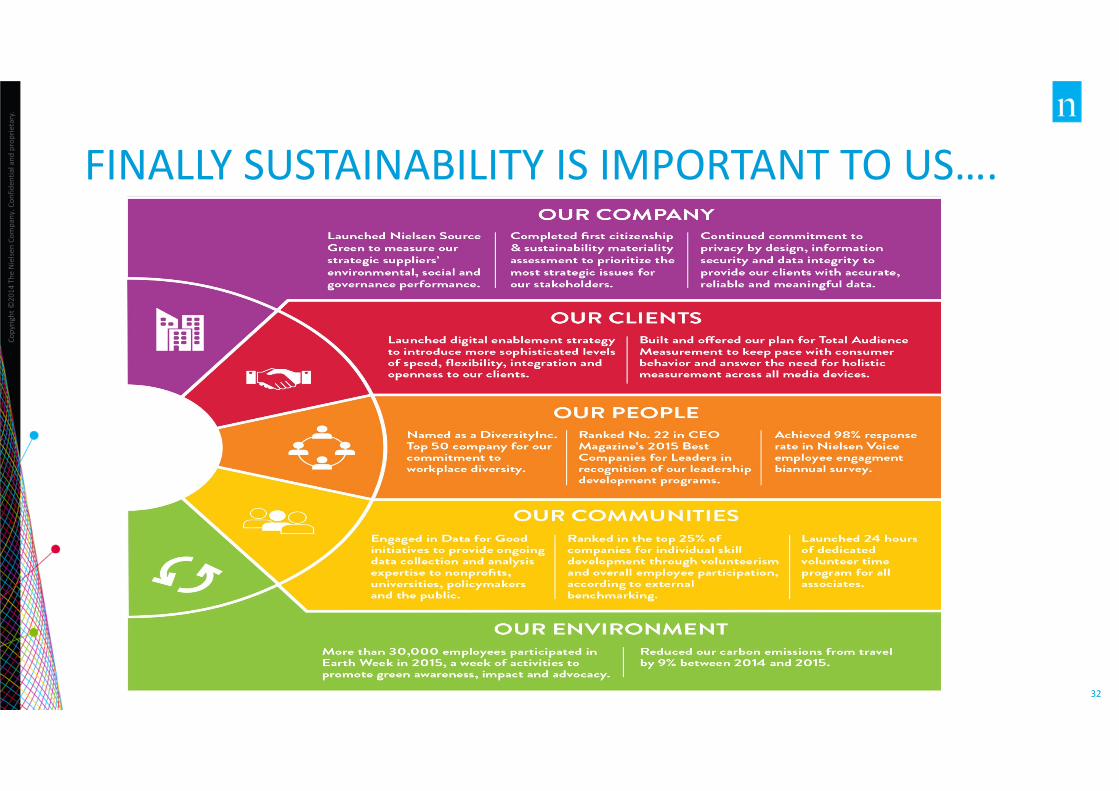
FINALLY SUSTAINABILITY IS IMPORTANT TO US….
Related Documents