The Stock Market Valuation of Research and Development Expenditures LOUIS K. C. CHAN, JOSEF LAKONISHOK, and THEODORE SOUGIANNIS* ABSTRACT We examine whether stock prices fully value firms’ intangible assets, specifically research and development ~R&D!. Under current U.S. accounting standards, fi- nancial statements do not report intangible assets and R&D spending is expensed. Nonetheless, the average historical stock returns of firms doing R&D matches the returns of firms without R&D. However, the market is apparently too pessimistic about beaten-down R&D-intensive technology stocks’ prospects. Companies with high R&D to equity market value ~which tend to have poor past returns! earn large excess returns. A similar relation exists between advertising and stock returns. R&D intensity is positively associated with return volatility. THE MARKET VALUE OF A FIRM’ S SHARES ultimately ref lects the value of all its net assets. When most of the assets are physical, such as plant and equipment, the link between asset values and stock prices is relatively apparent. In modern economies, however, a large part of a firm’s value may ref lect its intangible assets, such as brand names. Under generally accepted U.S. accounting prin- ciples, many types of intangible assets are not reported in firms’ financial state- ments. When a firm has large amounts of such intangibles, the lack of accounting information generally complicates the task of equity valuation. One type of intangible asset, business research and development ~R&D! activity, has lately been the subject of much attention. In part, the interest ref lects recent widespread technological change, together with the dazzling growth of science- and knowledge-based industries, which are especially ac- tive in R&D. For example, at year-end 1999, the technology sector and the pharmaceuticals industry together account for roughly 40 percent of the value * Chan is from the University of Illinois at Urbana-Champaign, Lakonishok is from the University of Illinois at Urbana-Champaign and NBER, and Sougiannis is from the University of Illinois at Urbana-Champaign and the Athens Laboratory of Business Administration ~ALBA!. We thank Kent Daniel, Werner DeBondt, Baruch Lev, Elizabeth Oltheten,Andrei Shleifer, René Stulz, Ian Tonks, an anonymous referee, and participants in seminars at the American Ac- counting Association 1999 meetings, American Finance Association 2000 meetings, Cornell Uni- versity, European Finance Association 1999 meetings, European Financial Management Association 2000 meetings, Indiana University, INSEAD, London Business School, the London School of Economics Financial Markets Group Conference on the Valuation of Technology Stocks, Michigan State University, Ohio State University, University of Florida, University of Illinois, University of Michigan, the NBER Behavioral Finance-Asset Pricing Fall 1998 meetings for comments, and Konan Chan for research assistance. THE JOURNAL OF FINANCE • VOL. LVI, NO. 6 • DEC. 2001 2431

Welcome message from author
This document is posted to help you gain knowledge. Please leave a comment to let me know what you think about it! Share it to your friends and learn new things together.
Transcript
The Stock Market Valuation of Researchand Development Expenditures
LOUIS K. C. CHAN, JOSEF LAKONISHOK, andTHEODORE SOUGIANNIS*
ABSTRACT
We examine whether stock prices fully value firms’ intangible assets, specificallyresearch and development ~R&D!. Under current U.S. accounting standards, fi-nancial statements do not report intangible assets and R&D spending is expensed.Nonetheless, the average historical stock returns of firms doing R&D matches thereturns of firms without R&D. However, the market is apparently too pessimisticabout beaten-down R&D-intensive technology stocks’ prospects. Companies withhigh R&D to equity market value ~which tend to have poor past returns! earn largeexcess returns. A similar relation exists between advertising and stock returns.R&D intensity is positively associated with return volatility.
THE MARKET VALUE OF A FIRM’S SHARES ultimately ref lects the value of all its netassets. When most of the assets are physical, such as plant and equipment, thelink between asset values and stock prices is relatively apparent. In moderneconomies, however, a large part of a firm’s value may ref lect its intangibleassets, such as brand names. Under generally accepted U.S. accounting prin-ciples, many types of intangible assets are not reported in firms’ financial state-ments. When a firm has large amounts of such intangibles, the lack of accountinginformation generally complicates the task of equity valuation.
One type of intangible asset, business research and development ~R&D!activity, has lately been the subject of much attention. In part, the interestref lects recent widespread technological change, together with the dazzlinggrowth of science- and knowledge-based industries, which are especially ac-tive in R&D. For example, at year-end 1999, the technology sector and thepharmaceuticals industry together account for roughly 40 percent of the value
* Chan is from the University of Illinois at Urbana-Champaign, Lakonishok is from theUniversity of Illinois at Urbana-Champaign and NBER, and Sougiannis is from the Universityof Illinois at Urbana-Champaign and the Athens Laboratory of Business Administration ~ALBA!.We thank Kent Daniel, Werner DeBondt, Baruch Lev, Elizabeth Oltheten, Andrei Shleifer, RenéStulz, Ian Tonks, an anonymous referee, and participants in seminars at the American Ac-counting Association 1999 meetings, American Finance Association 2000 meetings, Cornell Uni-versity, European Finance Association 1999 meetings, European Financial ManagementAssociation 2000 meetings, Indiana University, INSEAD, London Business School, the LondonSchool of Economics Financial Markets Group Conference on the Valuation of Technology Stocks,Michigan State University, Ohio State University, University of Florida, University of Illinois,University of Michigan, the NBER Behavioral Finance-Asset Pricing Fall 1998 meetings forcomments, and Konan Chan for research assistance.
THE JOURNAL OF FINANCE • VOL. LVI, NO. 6 • DEC. 2001
2431
of the S&P 500 index. Equally strikingly, the amount of R&D spending insome major technology industries is larger than their earnings. Finally, firmsare required by U.S. accounting standards to disclose their R&D expendi-tures in their financial statements, unlike many other kinds of spending onintangible assets.
The rise in the importance of technology-oriented companies raises thequestion of whether their stock market values ref lect their intangible R&Dcapital. In an efficient market, the stock price impounds the value of a firm’sR&D capital ~along with other intangible assets!, so there is no associationbetween R&D intensity and future stock returns. On the other hand, manyR&D-intensive firms have few tangible assets. Instead, their prospects aretied to the success of new, untested technologies and hence are highly un-predictable. Large expenditures are usually required at the outset, and theoutcome of many research projects is far from assured. The benefits, if any,are likely to materialize only much later, and the life-cycles of resultingproducts may be quite short. Finally, accounting information about a firm’sR&D activity is generally of limited usefulness. Firms have some leeway inidentifying what counts as an R&D cost and all of a firm’s R&D spending isreported as one aggregate item. More important, as a result of the expens-ing convention for R&D, some yardsticks commonly used by investors, suchas price-earnings ratios and market-to-book ratios, may be misstated. Inparticular, many R&D-intensive companies may appear to be priced at un-justifiably high multiples, so they appear to be “expensive” by such criteria.
These complications raise the possibility that stock prices do not fully in-corporate the value of R&D capital. Some authors ~Porter ~1992!, Hall ~1993!,and Hall and Hall ~1993!! suggest that investors have short time horizons sothey fail to anticipate the rewards from long-term investments such as R&D.Underpricing may also arise if investors mechanically accept firms’ finan-cial statements at face value without adjusting for the long-term benefits ofR&D ~the “functional fixation hypothesis” in the accounting literature!. Thismay be the case if investors, for example, value an R&D-intensive firm at afixed multiple of its reported book value. Certainly, investors’ ardor for tech-nology stocks in recent years ref lected their belief that R&D-intensive tech-nology stocks are undervalued.
In contrast, many observers have suggested that investors overestimatethe benefits from R&D, so valuations attached to R&D-intensive technologystocks are excessive. There is wide coverage of technology firms by the pop-ular media and intensive marketing efforts devoted to these stocks by theinvestment industry. As a result, the market may be overly optimistic aboutthe technological breakthroughs that are touted by R&D-intensive firms ~suchas a biotechnology firm’s promise to deliver a cure for cancer!. Further, if itis the case that many firms’ R&D investments are not profitable ~as Jensen~1993! suggests! but investors systematically overlook this possibility, over-valuation may arise.
Accounting variables are widely used by the investment community indetermining a firm’s cost of capital. In this respect, failing to incorporate thevalue of a firm’s intangible assets can affect its cost of capital. For example,
2432 The Journal of Finance
bond covenants are generally tied to reported earnings or the book value ofequity and assets. Since these accounting numbers do not ref lect intangibleassets, R&D-intensive firms may appear to be more highly leveraged than isthe case and may face a higher cost of debt. Additionally, the ratio of book-to-market values is widely used as a measure of a firm’s growth opportuni-ties. If lenders and investors disregard a firm’s intangible assets in assessingthe book-to-market ratio, they may misstate its growth opportunities, andthereby the systematic risk, of an R&D-intensive firm.1
This paper documents the importance of firms’ R&D capital, and investi-gates whether the stock market appropriately accounts for the value of R&Dexpenditures. Section I of the paper provides evidence on the importance ofR&D spending, and gauges the impact of expensing R&D on standard val-uation measures such as earnings yields and book-to-market ratios. We alsoreport measures of the stock of R&D capital. Section II discusses whethermeasures of R&D intensity, including R&D spending relative to sales or rel-ative to market value of equity, are related to future stock returns. SectionIII checks whether our results are robust to a variety of risk-adjustmentprocedures, including controls for confounding effects due to firm size, book-to-market, and past returns. Also in this section we extend our analysis toanother important form of intangible capital, advertising expenditures. Thelack of accounting disclosure about firms’ R&D, in addition to having possi-ble effects on stock prices, may also inf luence the level of investors’ uncer-tainty. Accordingly, in Section IV we explore whether the volatility of stockreturns is related to R&D. A final section contains the summary andconclusions.
Although many investors are enamored with technology stocks and be-lieve them to be superior investments, the historical evidence suggests other-wise. The average return on stocks that do R&D is comparable to the returnon stocks with no R&D. The absence of any differences is consistent with thenotion that the market price on average incorporates fully the benefits ofR&D spending. The strongest signs of an association between R&D intensityand future returns come from stocks with high R&D relative to market valueof equity ~that tend to have experienced poor returns in the past!. Excessreturns for this category of stocks average 6.12 percent per year over thepostformation period. The market apparently gives insufficient credit to pastlosers who are spending heavily on R&D. Such firms probably face strongpressures to cut R&D and improve earnings. Their reluctance to do so, how-ever, may ref lect their managers’ confidence that future prospects are not sobleak. Nonetheless, the market tends to overlook such signals ~just as ittends to discount other indicators of managers’ optimism such as stock re-purchases and insider trades!.2 Our exploratory investigation of the effects
1 See, for example, Berk, Green, and Naik ~1999! for a discussion of how a firm’s expectedreturn and risk dynamics are affected by its asset base and growth options in an equilibriummodel.
2 See, for example, Ikenberry, Lakonishok, and Vermaelen ~1995! for evidence on the stockprice effects of share repurchases, and Lakonishok and Lee ~2001! for evidence on insider trading.
R&D and Stock Returns 2433
on stock returns of another important intangible asset, advertising, uncov-ers very similar patterns as with R&D.
Although R&D intensity in general and stock returns are unrelated, thisdoes not imply that the current accounting treatment of R&D is fully infor-mative, or that there are no costs from the limited disclosure of such activity.We provide some evidence that R&D intensity is positively associated withreturn volatility. Insofar as the association ref lects, at least in part, inves-tors’ lack of information about firms’ R&D activity, there may be benefitsfrom more detailed disclosure about R&D in accounting statements.
I. The Importance of R&D Spending
A. Measures of R&D Intensity
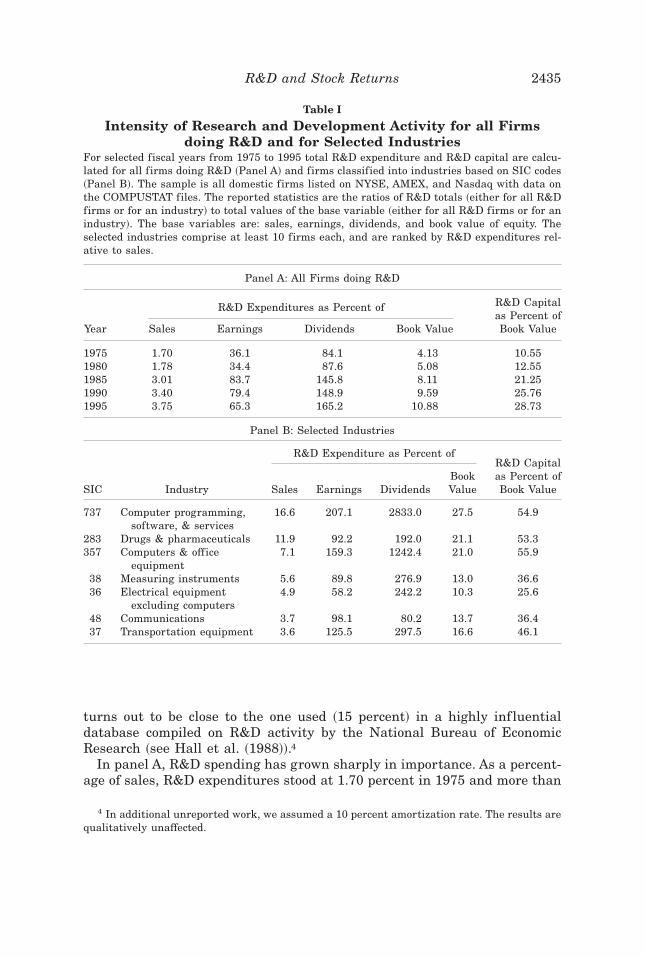
Table I provides summary statistics on R&D expenditures ~total outlays,representing the amount charged against income under current U.S. account-ing procedures!, and the estimated stock of R&D capital. R&D spending isexpressed relative to either total sales, earnings ~net income!, total divi-dends, or book value of equity. The stock of R&D capital is compared to thebook value of equity. In each of these ratios, we aggregate separately theitems in the numerator and denominator. The virtue of this procedure ~com-pared to calculating the average of the ratios across firms! is that it is in-sensitive to outlier cases where a firm has very low or no earnings, for example.An added advantage is that the calculation corresponds directly to the resultof a capitalization-weighted portfolio investment strategy.3
Each firm’s R&D capital is estimated from its past history of R&D expen-ditures as follows. The existing literature suggests no consensus on esti-mates for the useful life of expenditures and the amortization rate. Lev andSougiannis ~1996! estimate the impact of current and past R&D spending onearnings across a variety of industries. These estimates thereby measurethe proportion of past spending that is still productive in a given year. Basedon their estimates, we adopt the following tractable approximation of thestock of R&D capital, RDCit for firm i in year t based on current and pastR&D expenditure ~RDit !:
RDCit 5 RDit 1 0.8 * RDit21 1 0.6 * RDit22 1 0.4 * RDit23 1 0.2 * RDit24. ~1!
Effectively we assume that the productivity of each dollar of spending de-clines linearly by 20 percent a year. Our assumed capital amortization rate
3 All financial information is taken from the COMPUSTAT Active and Research files. R&Dexpenditure is annual data item 46; sales is annual data item 12; net income is annual dataitem 172; dividends to common equity are measured as annual data item 21; book value ofcommon equity is annual data item 60. Market value of common equity ~price per share timesnumber of shares outstanding! is from the CRSP Stock Return files.
2434 The Journal of Finance
turns out to be close to the one used ~15 percent! in a highly inf luentialdatabase compiled on R&D activity by the National Bureau of EconomicResearch ~see Hall et al. ~1988!!.4
In panel A, R&D spending has grown sharply in importance. As a percent-age of sales, R&D expenditures stood at 1.70 percent in 1975 and more than
4 In additional unreported work, we assumed a 10 percent amortization rate. The results arequalitatively unaffected.
Table I
Intensity of Research and Development Activity for all Firmsdoing R&D and for Selected Industries
For selected fiscal years from 1975 to 1995 total R&D expenditure and R&D capital are calcu-lated for all firms doing R&D ~Panel A! and firms classified into industries based on SIC codes~Panel B!. The sample is all domestic firms listed on NYSE, AMEX, and Nasdaq with data onthe COMPUSTAT files. The reported statistics are the ratios of R&D totals ~either for all R&Dfirms or for an industry! to total values of the base variable ~either for all R&D firms or for anindustry!. The base variables are: sales, earnings, dividends, and book value of equity. Theselected industries comprise at least 10 firms each, and are ranked by R&D expenditures rel-ative to sales.
Panel A: All Firms doing R&D
R&D Expenditures as Percent of
Year Sales Earnings Dividends Book Value
R&D Capitalas Percent ofBook Value
1975 1.70 36.1 84.1 4.13 10.551980 1.78 34.4 87.6 5.08 12.551985 3.01 83.7 145.8 8.11 21.251990 3.40 79.4 148.9 9.59 25.761995 3.75 65.3 165.2 10.88 28.73
Panel B: Selected Industries
R&D Expenditure as Percent of
SIC Industry Sales Earnings DividendsBookValue
R&D Capitalas Percent ofBook Value
737 Computer programming,software, & services
16.6 207.1 2833.0 27.5 54.9
283 Drugs & pharmaceuticals 11.9 92.2 192.0 21.1 53.3357 Computers & office
equipment7.1 159.3 1242.4 21.0 55.9
38 Measuring instruments 5.6 89.8 276.9 13.0 36.636 Electrical equipment
excluding computers4.9 58.2 242.2 10.3 25.6
48 Communications 3.7 98.1 80.2 13.7 36.437 Transportation equipment 3.6 125.5 297.5 16.6 46.1
R&D and Stock Returns 2435
doubled by 1995 to 3.75 percent.5 As R&D intensive firms tend to pay littleor no dividends, R&D expenditures are as much as 1.65 times cash divi-dends to shareholders. R&D capital represents an important intangible as-set that is not represented on firms’ balance sheets, accounting for fully29 percent of the book value of common equity in 1995.6 This number sug-gests that many technology-oriented stocks would appear less expensive iftheir intangible R&D assets were added to their book values.7
R&D spending is heavily concentrated in technology and science-orientedindustries. As an illustration, panel B of Table I breaks out several indus-tries ~defined by two-digit or three-digit SIC codes! of particular interestand ranks them by 1995 R&D spending relative to industry sales. By far thehighest ratio of spending is found in industry 737 ~computer programming,software, and services!.8 R&D costs in this industry represent about 17 per-cent of sales and two times earnings. Next in the industry ranking is thedrugs and pharmaceuticals industry ~SIC codes beginning with 283!, whereR&D is about 12 percent of industry sales. Perhaps the recent popular im-pression that heavy R&D spending is associated with superior stock priceperformance stems in large part from the success of a few large, well-knowncompanies drawn from these industries, such as Microsoft and Merck, overour sample period.
As a percentage of earnings, R&D expenditures vary from 58 percent inindustry 36 to 207 percent in industry 737. The stock of R&D capital is alsolarge relative to the accounting book value of equity. The magnitude of thesefigures suggests that expensing R&D costs may distort conventional valua-tion yardsticks such as price-earnings or price-to-book ratios.
5 It has been argued that the growth in R&D may be overstated to the extent that firmsrelabel other expenses as R&D in order to qualify for tax credits ~see, for example, the litera-ture surveyed in Hall and van Reenen ~1999!!. From the standpoint of investors evaluating thebenefits from R&D, such reallocation further complicates the valuation problem.
6 Note that the estimated capital stock is based on the actual outlays incurred, so the capitalis valued at cost. Assuming some rate of return on R&D over the cost of capital would lead toan even larger intangible asset.
7 Not all firms carry out R&D: On average about 40 percent of firms report some value forR&D expenditures. Nonetheless, even when the comparison is relative to the entire set of U.S.firms, the importance of R&D outlays is impressive: Expenditures in 1995 are about 81 percentof all firms’ dividends, for example.
8 Under current accounting rules, software research costs are expensed, as in other indus-tries, but the costs of development for software are capitalized. Development refers to the trans-lation of research findings into plans or designs for new products or processes. In general, firmsare not required to report separately their expenses for research and for development. A briefperusal of the financial statements of several large, well-known software companies suggests,however, that in many cases, effectively all their software R&D costs are expensed as incurred~at least over our sample period!. For example, Microsoft’s balance sheet indicates that all R&Dcosts are expensed and that the development portion is not material. Netscape and Symantecreport similarly. For 1994, Lotus charged $159 million of R&D costs to operations and capital-ized $36 million of development costs. It reported that capitalized software costs were amor-tized on a straight-line basis over the specific product’s economic life, generally three years.
2436 The Journal of Finance
B. The Impact of Expensing R&D Costs
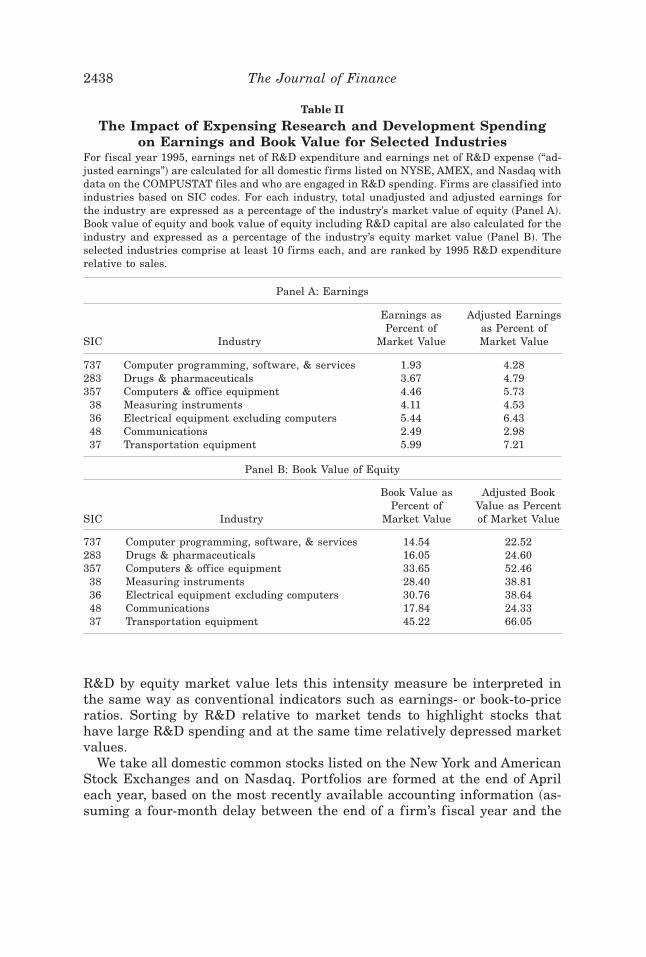
To explore further the impact on commonly used valuation measures, wecompare earnings under the current practice of immediately expensing R&Dspending with “adjusted earnings” calculated using an estimate of R&D ex-pense.9 Similarly we compare the book value of common equity with a mea-sure of book value ~“adjusted book value”! that adds to the accounting bookvalue the value of R&D capital.
The results in Table II for R&D-intensive industries highlight the po-tential distortions from immediately expensing R&D. The amortization ad-justment is especially striking for industry 737 ~computer programming,software, and services!. In panel A, the 1995 price-earnings ratio usingreported earnings for this industry is 51.8 whereas the ratio based onadjusted earnings is less than half this amount ~23.4!. Similarly, the indus-try’s price-to-book ratio comes down from 6.9 to 4.4 when R&D capitalis accounted for in Panel B. Arguably, our assumption of a five-year lifefor R&D expenditures may be too long, given the short product cycles inthe software industry. In the drugs and pharmaceuticals industry ~indus-try 283!, on the other hand, five years may not be long enough. Even inthis industry, however, the amortization adjustments to earnings and bookvalue are quite dramatic. With the adjustment, the price-earnings ratiocomes down from 27.2 to 20.9, and the price-to-book ratio changes from 6.2to 4.1.
In summary, R&D activity represents a significant and growing portion offirm resources. In several industries that are highly R&D intensive, thepractice of immediately expensing R&D outlays can have a substantial dis-tortionary effect on earnings and book values. If investors mechanically ar-rive at valuations based on such reported earnings or book values, the degreeof mispricing can be substantial.
II. R&D Activity and Stock Returns
To see if the stock market correctly recognizes the expected future benefitsfrom R&D spending, this paper implements an investment strategy basedon R&D intensity. We first measure R&D intensity as R&D expendituresrelative to sales. This variable is widely used in practice as an indicator ofhow much resources a firm devotes to R&D ~see, for example, the Value LineInvestment Survey!. Our second measure of intensity, the ratio of R&D ex-penditures to the market value of equity, is more in keeping with manyindicators that are widely used in financial economics. In particular, scaling
9 Corresponding to equation ~1!, R&D expense REit is the periodic amortization of the R&Dcapital stock:
REit 5 0.2 * ~RDit21 1 RDit22 1 RDit23 1 RDit24 1 RDit25!.
R&D and Stock Returns 2437
R&D by equity market value lets this intensity measure be interpreted inthe same way as conventional indicators such as earnings- or book-to-priceratios. Sorting by R&D relative to market tends to highlight stocks thathave large R&D spending and at the same time relatively depressed marketvalues.
We take all domestic common stocks listed on the New York and AmericanStock Exchanges and on Nasdaq. Portfolios are formed at the end of Aprileach year, based on the most recently available accounting information ~as-suming a four-month delay between the end of a firm’s fiscal year and the
Table II
The Impact of Expensing Research and Development Spendingon Earnings and Book Value for Selected Industries
For fiscal year 1995, earnings net of R&D expenditure and earnings net of R&D expense ~“ad-justed earnings”! are calculated for all domestic firms listed on NYSE, AMEX, and Nasdaq withdata on the COMPUSTAT files and who are engaged in R&D spending. Firms are classified intoindustries based on SIC codes. For each industry, total unadjusted and adjusted earnings forthe industry are expressed as a percentage of the industry’s market value of equity ~Panel A!.Book value of equity and book value of equity including R&D capital are also calculated for theindustry and expressed as a percentage of the industry’s equity market value ~Panel B!. Theselected industries comprise at least 10 firms each, and are ranked by 1995 R&D expenditurerelative to sales.
Panel A: Earnings
SIC Industry
Earnings asPercent of
Market Value
Adjusted Earningsas Percent ofMarket Value
737 Computer programming, software, & services 1.93 4.28283 Drugs & pharmaceuticals 3.67 4.79357 Computers & office equipment 4.46 5.73
38 Measuring instruments 4.11 4.5336 Electrical equipment excluding computers 5.44 6.4348 Communications 2.49 2.9837 Transportation equipment 5.99 7.21
Panel B: Book Value of Equity
SIC Industry
Book Value asPercent of
Market Value
Adjusted BookValue as Percentof Market Value
737 Computer programming, software, & services 14.54 22.52283 Drugs & pharmaceuticals 16.05 24.60357 Computers & office equipment 33.65 52.46
38 Measuring instruments 28.40 38.8136 Electrical equipment excluding computers 30.76 38.6448 Communications 17.84 24.3337 Transportation equipment 45.22 66.05
2438 The Journal of Finance
release of its financial statements!.10 Eligible stocks are ranked by a mea-sure of R&D intensity and assigned to one of five portfolios. Since we focuson valuation effects over longer horizons, we calculate equally weighted an-nual buy-and-hold returns over each of the three years following portfolioformation.11 In addition, the tables report several characteristics of eachportfolio.
A. Portfolio Results Based on R&D Relative to Sales
Table III provides results for portfolios sorted by R&D intensity relative tosales. Although it is commonly thought that firms doing R&D, such as tech-nology companies, provide superior stock price performance, the raw return~Panel A! of firms that carry out R&D is on average no different from thoseof firms without R&D. Averaging over all the five groups of stocks doingR&D, for example, the mean annual return in the three years followingportfolio formation is 19.65 percent, compared to 19.50 percent for firmswithout R&D. Put another way, run-of-the-mill cement and utility stocks onaverage did as well as highly-touted technology stocks. The similarity be-tween the average returns of stocks with and without R&D is consistentwith the hypothesis that the market on average correctly values any futurebenefits from research spending.
When we look within the group of firms engaged in research activity, thereis little if any relation between R&D relative to sales and future returns inPanel A. Raw returns are roughly the same across the five portfolios. Overthe three postformation years, for example, the most R&D-intensive port-folio, quintile 5, earns an average annual return of 19.52 percent, comparedto the overall average of 19.65 percent per year for all R&D firms.
Firms with a high rank by R&D relative to sales tend to be glamour stocks,with lower ratios of book-to-market equity, sales-to-price, dividends, andearnings-to-price ~Panel D!. On this basis, earlier research ~Chan, Hamao,and Lakonishok ~1991!, Fama and French ~1992!, Lakonishok, Shleifer, andVishny ~1994!! raises the presumption that these stocks have historicallyearned comparatively low returns. Yet, as Panel A indicates, their averagereturns are similar to those of the other portfolios. It would thus appear thatone set of glamour stocks, namely highly R&D-intensive stocks, do not havethe relatively poor returns that usually accompanied glamour investing.
10 The sample is not limited to firms whose fiscal years end in December. In the case of firmswith fiscal years not ending in December, their accounting data will be less up-to-date as of theportfolio formation date, given our assumed publication delay. However, most firms in the R&Dsample ~roughly 59 percent of the observations! have fiscal years that end in December.
11 When a stock is delisted in the course of a year after portfolio formation, we pick up theCRSP delisting return if it is available. Thereafter we splice the stock’s return with the returnon the value-weighted market index until the next portfolio formation date. Our analysis oflong-horizon returns for a large sample of firms over an extended period differentiates us fromother related studies. For example, Chan, Martin, and Kensinger ~1990! look at returns on daysaround announcements of R&D plans for 95 firms from 1979 to 1985.
R&D and Stock Returns 2439
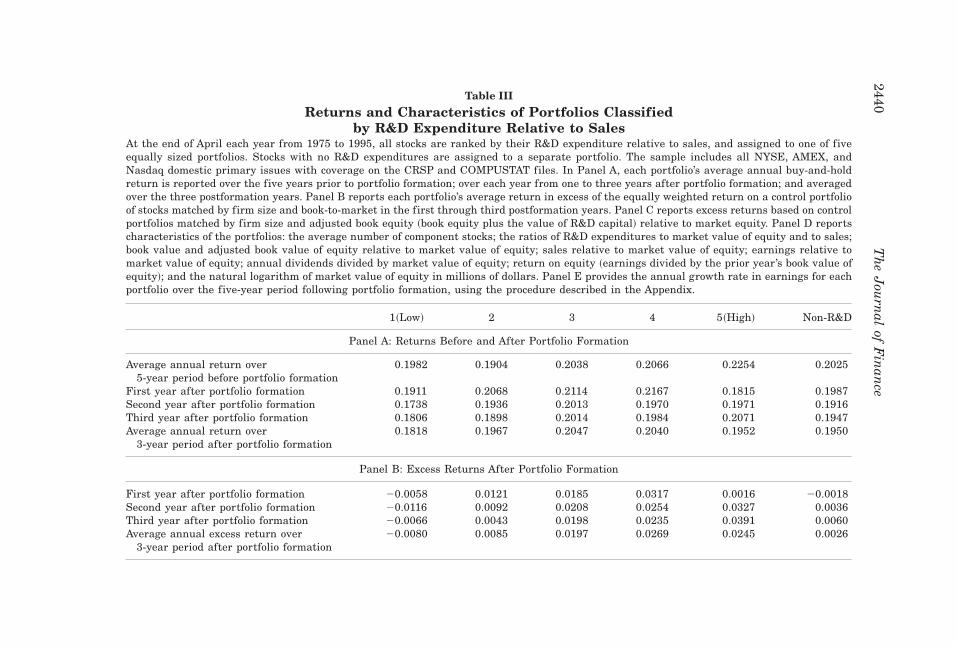
Table III
Returns and Characteristics of Portfolios Classifiedby R&D Expenditure Relative to Sales
At the end of April each year from 1975 to 1995, all stocks are ranked by their R&D expenditure relative to sales, and assigned to one of fiveequally sized portfolios. Stocks with no R&D expenditures are assigned to a separate portfolio. The sample includes all NYSE, AMEX, andNasdaq domestic primary issues with coverage on the CRSP and COMPUSTAT files. In Panel A, each portfolio’s average annual buy-and-holdreturn is reported over the five years prior to portfolio formation; over each year from one to three years after portfolio formation; and averagedover the three postformation years. Panel B reports each portfolio’s average return in excess of the equally weighted return on a control portfolioof stocks matched by firm size and book-to-market in the first through third postformation years. Panel C reports excess returns based on controlportfolios matched by firm size and adjusted book equity ~book equity plus the value of R&D capital! relative to market equity. Panel D reportscharacteristics of the portfolios: the average number of component stocks; the ratios of R&D expenditures to market value of equity and to sales;book value and adjusted book value of equity relative to market value of equity; sales relative to market value of equity; earnings relative tomarket value of equity; annual dividends divided by market value of equity; return on equity ~earnings divided by the prior year’s book value ofequity!; and the natural logarithm of market value of equity in millions of dollars. Panel E provides the annual growth rate in earnings for eachportfolio over the five-year period following portfolio formation, using the procedure described in the Appendix.
1~Low! 2 3 4 5~High! Non-R&D
Panel A: Returns Before and After Portfolio Formation
Average annual return over5-year period before portfolio formation
0.1982 0.1904 0.2038 0.2066 0.2254 0.2025
First year after portfolio formation 0.1911 0.2068 0.2114 0.2167 0.1815 0.1987Second year after portfolio formation 0.1738 0.1936 0.2013 0.1970 0.1971 0.1916Third year after portfolio formation 0.1806 0.1898 0.2014 0.1984 0.2071 0.1947Average annual return over
3-year period after portfolio formation0.1818 0.1967 0.2047 0.2040 0.1952 0.1950
Panel B: Excess Returns After Portfolio Formation
First year after portfolio formation 20.0058 0.0121 0.0185 0.0317 0.0016 20.0018Second year after portfolio formation 20.0116 0.0092 0.0208 0.0254 0.0327 0.0036Third year after portfolio formation 20.0066 0.0043 0.0198 0.0235 0.0391 0.0060Average annual excess return over
3-year period after portfolio formation20.0080 0.0085 0.0197 0.0269 0.0245 0.0026
2440T
he
Jou
rnal
ofF
inan
ce

Panel C: Excess Returns Based on Adjusted Book Value
First year after portfolio formation 20.0063 0.0095 0.0154 0.0265 20.0034 20.0018Second year after portfolio formation 20.0130 0.0073 0.0165 0.0185 0.0245 0.0036Third year after portfolio formation 20.0075 0.0020 0.0155 0.0173 0.0310 0.0060Average annual excess return over
3-year period after portfolio formation20.0089 0.0063 0.0158 0.0208 0.0174 0.0026
Panel D: Characteristics of Portfolios
Average number of firms 237.8 238.0 238.3 238.3 238.6 1856.5R&D to sales 0.0046 0.0136 0.0289 0.0571 0.2262 0.0000R&D to market value 0.0130 0.0321 0.0569 0.0807 0.1088 0.0000Book-to-market 0.8997 0.8511 0.8001 0.7033 0.5408 0.9008Adjusted book-to-market 0.9850 0.9754 0.9796 0.9396 0.8178 0.9008Sales-to-market 3.1756 2.5879 2.3021 1.7118 1.0297 2.7738Earnings-to-price 0.0800 0.0759 0.0684 0.0537 0.0058 0.0797Dividend yield 0.0258 0.0243 0.0208 0.0153 0.0057 0.0257Return on equity 0.1088 0.1090 0.1069 0.0983 0.0183 0.1060Log Size 4.6863 4.6456 4.5959 4.5396 4.2323 4.4437
Panel E: Average Annual Growth Rates after Portfolio Formation
Annual earnings growth over5 postformation years
0.0728 0.1083 0.1084 0.0772 0.1424 0.1015
R&
Dan
dS
tockR
eturn
s2441
Panels B and C take the differences across portfolios in their value–glamour orientation into account. We follow the general approach in theliterature and control for size and book-to-market effects.12 Specifically, inPanel B each stock in a portfolio is assigned a control portfolio based on itsranking by size and by book-to-market. There are a total of 30 control port-folios, corresponding to five possible ranks by book-to-market and six possi-ble ranks by size. The ranking by book-to-market is based on quintilebreakpoints over all stocks. The breakpoints for size are based on NYSEissues only. The size categories are as follows: Groups 1 to 4 correspond tothe largest four quintiles, respectively, of market capitalization; group 5 isthe next-to-smallest decile and group 6 is the bottom decile. The additionalbreakdown of the bottom quintile of firms ref lects the fact that many of thestocks who are active in R&D are small. Further, since the breakpoints forthe size classification are based on NYSE stocks only, the bottom quintilecomprises numerous firms. Each stock’s return is measured net of the buy-and-hold return on its control portfolio.
If investors recognize that a firm’s assets should include its intangibles,then firms should be matched on the basis of size and adjusted book-to-market ratios, where book equity values are adjusted to incorporate the valueof R&D. This is done in Panel C, which otherwise follows the same proce-dure as Panel B.13
Stocks that are highly R&D intensive tend to earn positive excess returnsin the postformation period, although the excess returns are generally notlarge. In Panel B, for instance, the mean excess return on the highest-ranked portfolio is 2.45 percent per year over the three postformation years.14
Including R&D capital in book equity knocks the average excess return overthe postformation period down to 1.74 percent in Panel C.15
Panel E of Table III looks directly at the future operating performance ofthe different portfolios. The details behind the calculations are provided inthe Appendix. The average annual growth rate in earnings over the fivepostformation years is virtually the same for stocks with R&D and withoutR&D ~the means across all stocks with R&D and all stocks without R&D are
12 For evidence that size and book-to-market are important factors for stock returns, seeFama and French ~1992! and Chan, Karceski, and Lakonishok ~1998!.
13 Adjusted book-to-market ratios, with R&D capital included, spread out returns even morethan the unadjusted book-to-market variable. Sorting all stocks ~with and without R&D! byadjusted book-to-market ratios into 10 portfolios produces an average spread in size-adjustedreturns of 5.9 percent between the extreme deciles in the first subsequent year, compared to5.1 percent based on unadjusted ratios. The adjusted ratio produces larger spreads every yearcompared to the unadjusted ratio up to five years following portfolio formation.
14 When we measure returns over longer horizons in order to give investors enough time tocorrect any initial mispricing, the excess returns are similar in magnitude.
15 The excess returns in Panels B and C are also not large relative to their standard errors.For example, in Panel B the highest-ranked quintile portfolio has a t-statistic of 0.96 for theaverage annual excess return over the three postformation years ~where the standard error isadjusted for serial correlation induced by overlapping observations!.
2442 The Journal of Finance
10.18 percent and 10.15 percent, respectively!.16 The growth rate of earn-ings is notably higher only in the case of the most R&D-intensive stocks~quintile portfolio 5!. For this quintile, the average growth rate for earningsis 14.24 percent. The high growth rate is partly due to the fact that thesestocks on average have the lowest base-year earnings ~relative to price! of allthe portfolios.
One important lesson from Table III thus seems to be that simply doingR&D by itself does not, on average, give rise to differential stock price per-formance. Since R&D-intensive stocks tend to be glamour stocks with rela-tively low book-to-market ratios ~even after their book equity values areadjusted to include R&D capital!, they might be presumed to earn below-average returns. Rather, Table III says that within the set of such glamourstocks, there are some stocks with large R&D spending whose returns arenot lower than average. Putting these together gives rise to our result thata glamour stock that is highly active in R&D earns a slightly higher returnthan other glamour stocks.
B. Portfolio Results Based on R&D Relative to Market Value
Table IV reports results for portfolios sorted by R&D expenditures rela-tive to market value of equity. In general, the two measures of R&D inten-sity are correlated ~Panel D!. However, many firms that are highly R&Dintensive relative to sales ~such as pharmaceutical firms! do not rank highlyon the basis of R&D relative to market equity. Rather, the portfolio of stocksranked highest by R&D relative to market tends to be populated by stockswith poor past returns ~or “losers”!. Over the five years prior to portfolioformation, the average annual return of stocks ranked in the top quintile byR&D relative to market is only 9.89 percent ~Panel A of Table IV!. In com-parison, stocks with no R&D have an average return over the same period of20.25 percent per year. Additionally, the earnings of stocks in quintile 5 aredepressed, as ref lected by their average earnings-to-price ratio or their av-erage return on equity, which are the lowest in the table.
The stocks in the top quintile portfolio perform well in the years followingportfolio formation. High R&D firms earn on average a return of 26.47 per-cent in the first subsequent year, compared to 19.87 percent for stocks withno R&D. The superior performance continues over the three postformationyears. The average annual rate of return over the three postformation yearsis 26.19 percent for the top R&D quintile and the spread between the twoextreme quintiles ~11.08 percent per year on average over this period! is alsolarge. The rebound for extreme past losers echoes the pattern uncovered by
16 Note, however, that our calculation of growth rates differs from the usual measure ofgrowth in earnings per share. In particular our calculated growth rates ref lect how muchearnings an investor is entitled to per dollar of initial investment. Further we assume a buy-and-hold investment strategy, so the growth rates include the reinvestment of dividends. Theaverage dividend yield is 1.84 percent for R&D stocks and 2.57 percent for stocks with no R&D.
R&D and Stock Returns 2443
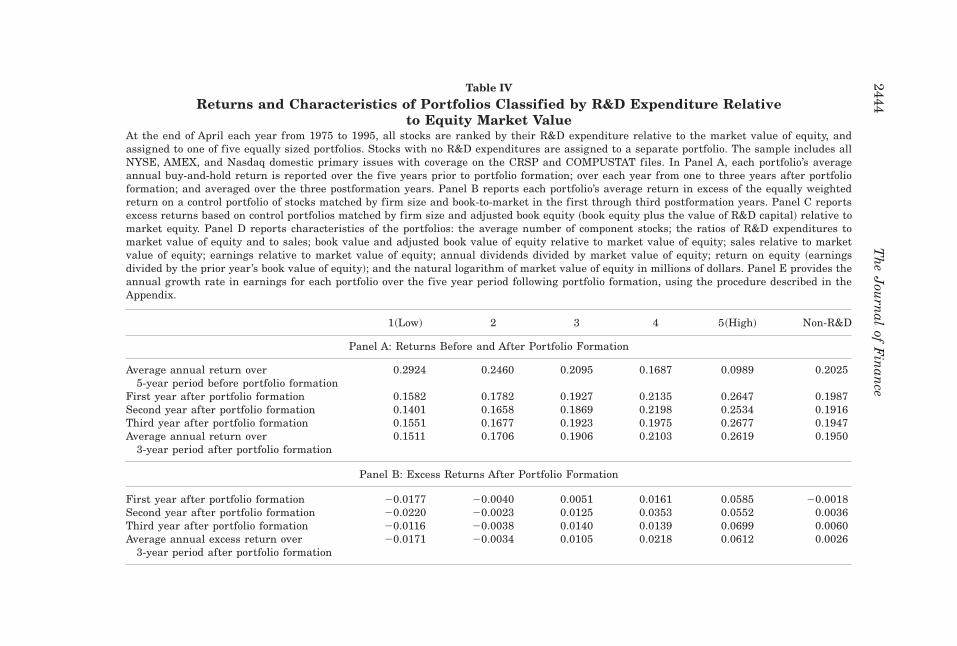
Table IV
Returns and Characteristics of Portfolios Classified by R&D Expenditure Relativeto Equity Market Value
At the end of April each year from 1975 to 1995, all stocks are ranked by their R&D expenditure relative to the market value of equity, andassigned to one of five equally sized portfolios. Stocks with no R&D expenditures are assigned to a separate portfolio. The sample includes allNYSE, AMEX, and Nasdaq domestic primary issues with coverage on the CRSP and COMPUSTAT files. In Panel A, each portfolio’s averageannual buy-and-hold return is reported over the five years prior to portfolio formation; over each year from one to three years after portfolioformation; and averaged over the three postformation years. Panel B reports each portfolio’s average return in excess of the equally weightedreturn on a control portfolio of stocks matched by firm size and book-to-market in the first through third postformation years. Panel C reportsexcess returns based on control portfolios matched by firm size and adjusted book equity ~book equity plus the value of R&D capital! relative tomarket equity. Panel D reports characteristics of the portfolios: the average number of component stocks; the ratios of R&D expenditures tomarket value of equity and to sales; book value and adjusted book value of equity relative to market value of equity; sales relative to marketvalue of equity; earnings relative to market value of equity; annual dividends divided by market value of equity; return on equity ~earningsdivided by the prior year’s book value of equity!; and the natural logarithm of market value of equity in millions of dollars. Panel E provides theannual growth rate in earnings for each portfolio over the five year period following portfolio formation, using the procedure described in theAppendix.
1~Low! 2 3 4 5~High! Non-R&D
Panel A: Returns Before and After Portfolio Formation
Average annual return over5-year period before portfolio formation
0.2924 0.2460 0.2095 0.1687 0.0989 0.2025
First year after portfolio formation 0.1582 0.1782 0.1927 0.2135 0.2647 0.1987Second year after portfolio formation 0.1401 0.1658 0.1869 0.2198 0.2534 0.1916Third year after portfolio formation 0.1551 0.1677 0.1923 0.1975 0.2677 0.1947Average annual return over
3-year period after portfolio formation0.1511 0.1706 0.1906 0.2103 0.2619 0.1950
Panel B: Excess Returns After Portfolio Formation
First year after portfolio formation 20.0177 20.0040 0.0051 0.0161 0.0585 20.0018Second year after portfolio formation 20.0220 20.0023 0.0125 0.0353 0.0552 0.0036Third year after portfolio formation 20.0116 20.0038 0.0140 0.0139 0.0699 0.0060Average annual excess return over
3-year period after portfolio formation20.0171 20.0034 0.0105 0.0218 0.0612 0.0026
2444T
he
Jou
rnal
ofF
inan
ce
Panel C: Excess Returns Based on Adjusted Book Value
First year after portfolio formation 20.0182 20.0063 0.0014 0.0105 0.0542 20.0018Second year after portfolio formation 20.0231 20.0035 0.0078 0.0284 0.0464 0.0036Third year after portfolio formation 20.0122 20.0060 0.0100 0.0076 0.0611 0.0060Average annual excess return over
3-year period after portfolio formation20.0178 20.0053 0.0064 0.0155 0.0539 0.0026
Panel D: Characteristics of Portfolios
Average number of firms 237.8 238.0 238.3 238.3 238.6 1856.5R&D to sales 0.0210 0.0461 0.0660 0.0838 0.1137 0.0000R&D to market value 0.0068 0.0188 0.0358 0.0644 0.1655 0.0000Book-to-market 0.5832 0.6626 0.7020 0.7934 1.0523 0.9008Adjusted book-to-market 0.6106 0.7290 0.8168 0.9850 1.5540 0.9008Sales-to-market 1.6223 1.8656 1.9622 2.2467 3.1035 2.7738Earnings-to-price 0.0651 0.0666 0.0618 0.0590 0.0311 0.0797Dividend yield 0.0196 0.0200 0.0189 0.0179 0.0155 0.0257Return on equity 0.1252 0.1129 0.0966 0.0779 0.0288 0.1060Log size 5.0420 4.7837 4.6911 4.4042 3.7802 4.4437
Panel E: Average Annual Growth Rates after Portfolio Formation
Annual earnings growth over5 postformation years
0.0730 0.0641 0.0644 0.0985 0.1713 0.1015
R&
Dan
dS
tockR
eturn
s2445
DeBondt and Thaler ~1985!. Firms with a history of poor performance maybe subject to the kinds of extrapolative biases noted in the earlier literature.In particular, the market may discount too heavily the possibility of theirfuture recovery. La Porta et al. ~1997!, for example, find a pattern of positiveprice reactions for value stocks around future earnings announcement dates,supporting the hypothesis that investors are too pessimistic about these firms.
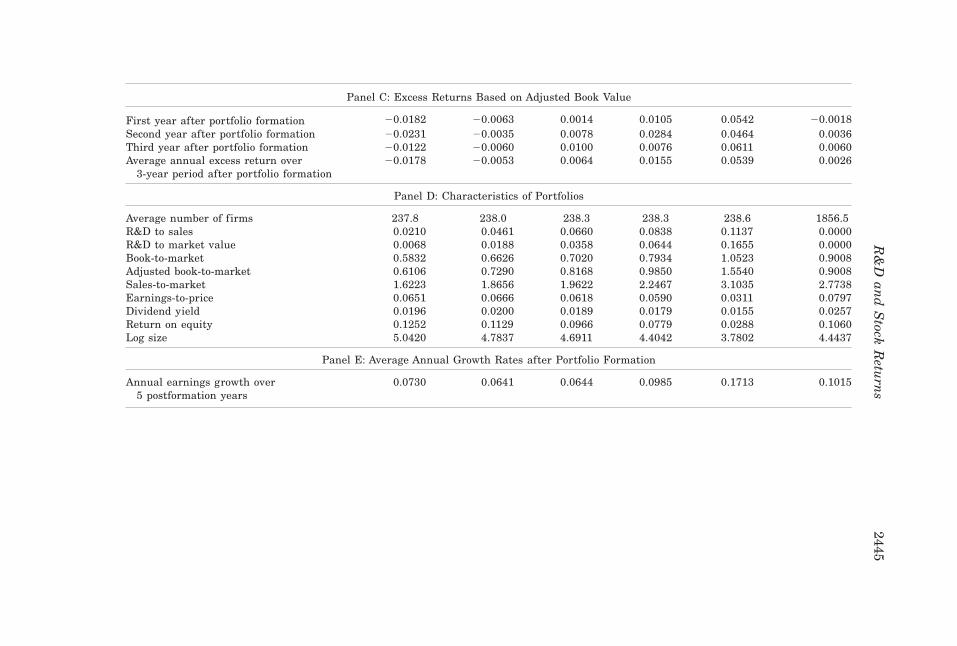
In the case of stocks with high R&D intensity relative to market value,however, there is more to the story than just the subsequent recovery of pastlosers. Even after adjusting for size and book-to-market ~Panels B and C!,their returns are still high.17 In Panel B, over the postformation period,quintile portfolio 5 has an average excess return of 6.12 percent per year,yielding a mean spread of 7.83 percent per year between the extreme quin-tiles.18 Excess returns based on adjusted book-to-market ratios ~Panel C! tella similar story.19
One possible explanation for the excess returns on firms with high R&D tomarket equity draws from related evidence that the market underreacts tomanagers’ signals ~see, for example, Ikenberry et al. ~1995!, Loughran andRitter ~1995!, and Lakonishok and Lee ~2001!!. Despite their poor perfor-mance, the firms in the top quintile portfolio spend a large portion of sales~in excess of 11 percent! on R&D. Their managers’ willingness to maintainR&D spending represents a vote of confidence that the firms’ future oppor-tunities might improve. Their beliefs are all the more credible because R&Dspending directly depresses earnings, so their choice is not without pain.The growth rates in Panel E of the table support the extent of the regainedprofitability for the top quintile of R&D-intensive stocks. For this group,earnings over the five years following portfolio formation grow by 17.13 per-cent, compared to 10.15 percent for firms with no R&D.
The nature of the investor clientele for R&D-intensive technology compa-nies may be an additional factor in determining stock prices. In particular,R&D-intensive firms who are past losers tend to be sold off by growth-oriented investors. Many value investors, on the other hand, stay away fromtechnology stocks in general because they do not view such stocks as part oftheir natural investment domain. Additionally, value investors may not be
17 The results in Fama and French ~1996! suggest that once size and book-to-market arecontrolled for, long-term past losers do not earn excess returns. Lev and Sougiannis ~1996!,using a procedure different from ours, also find that R&D relative to market equity predictsfuture returns. They use the Fama and MacBeth ~1973! methodology and estimate cross-sectional regressions of stock returns on beta, size, book-to-market, leverage, earnings yield,and the ratio of R&D capital to market equity. The coefficient on the R&D variable is positiveand statistically significant.
18 The t-statistic for the average excess return on the top quintile portfolio over the threepostformation years is 2.68. Excess returns over the five years following portfolio formation areof comparable magnitude.
19 Earlier research suggests that anomalous patterns in returns are typically more pro-nounced for small stocks. This turns out to be so for R&D relative to market as well. Over thethree postformation years, the average excess return is 9.89 percent per year for the highest-ranked R&D portfolio of firms in the bottom decile of market capitalization.
2446 The Journal of Finance
drawn to technology stocks because they tend to look expensive under con-ventional criteria. The upshot is that there may be potentially more severeunderpricing when R&D-intensive stocks experience poor performance.
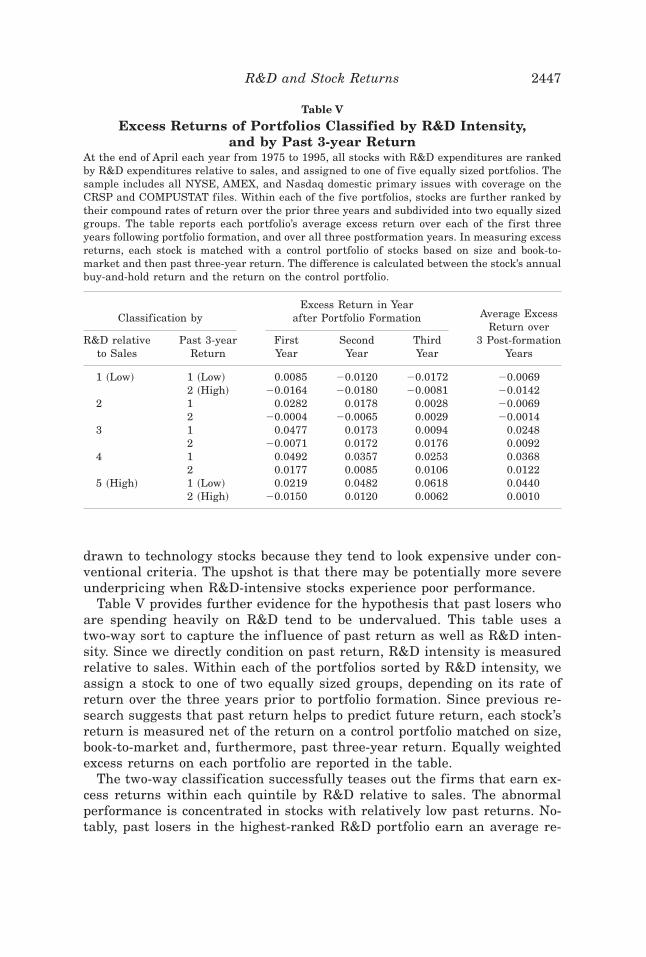
Table V provides further evidence for the hypothesis that past losers whoare spending heavily on R&D tend to be undervalued. This table uses atwo-way sort to capture the inf luence of past return as well as R&D inten-sity. Since we directly condition on past return, R&D intensity is measuredrelative to sales. Within each of the portfolios sorted by R&D intensity, weassign a stock to one of two equally sized groups, depending on its rate ofreturn over the three years prior to portfolio formation. Since previous re-search suggests that past return helps to predict future return, each stock’sreturn is measured net of the return on a control portfolio matched on size,book-to-market and, furthermore, past three-year return. Equally weightedexcess returns on each portfolio are reported in the table.
The two-way classification successfully teases out the firms that earn ex-cess returns within each quintile by R&D relative to sales. The abnormalperformance is concentrated in stocks with relatively low past returns. No-tably, past losers in the highest-ranked R&D portfolio earn an average re-
Table V
Excess Returns of Portfolios Classified by R&D Intensity,and by Past 3-year Return
At the end of April each year from 1975 to 1995, all stocks with R&D expenditures are rankedby R&D expenditures relative to sales, and assigned to one of five equally sized portfolios. Thesample includes all NYSE, AMEX, and Nasdaq domestic primary issues with coverage on theCRSP and COMPUSTAT files. Within each of the five portfolios, stocks are further ranked bytheir compound rates of return over the prior three years and subdivided into two equally sizedgroups. The table reports each portfolio’s average excess return over each of the first threeyears following portfolio formation, and over all three postformation years. In measuring excessreturns, each stock is matched with a control portfolio of stocks based on size and book-to-market and then past three-year return. The difference is calculated between the stock’s annualbuy-and-hold return and the return on the control portfolio.
Classification byExcess Return in Year
after Portfolio Formation
R&D relativeto Sales
Past 3-yearReturn
FirstYear
SecondYear
ThirdYear
Average ExcessReturn over
3 Post-formationYears
1 ~Low! 1 ~Low! 0.0085 20.0120 20.0172 20.00692 ~High! 20.0164 20.0180 20.0081 20.0142
2 1 0.0282 0.0178 0.0028 20.00692 20.0004 20.0065 0.0029 20.0014
3 1 0.0477 0.0173 0.0094 0.02482 20.0071 0.0172 0.0176 0.0092
4 1 0.0492 0.0357 0.0253 0.03682 0.0177 0.0085 0.0106 0.0122
5 ~High! 1 ~Low! 0.0219 0.0482 0.0618 0.04402 ~High! 20.0150 0.0120 0.0062 0.0010
R&D and Stock Returns 2447
turn of 4.40 percent per year over the postformation period after controllingfor size, book-to-market, and past return. The results suggest that any mis-pricing of R&D stocks is more likely to be associated with firms with poorpast performance.
III. Additional Results
A. Alternative Risk Adjustment Procedures
It is possible that any excess returns earned by R&D-intensive stocks re-f lect risk differentials ~beyond what is picked up by our control portfolioprocedures!. In this section, we check for this possibility by applying a va-riety of risk-adjustment procedures. The procedures include a version of theFama and French ~1993, 1996! multifactor model to adjust for risk sensitiv-ities; Fama and MacBeth ~1973! cross-sectional regressions that account fordifferences in firm characteristics; Sharpe ratios; and performance across upand down markets. Since the sort by R&D relative to market equity showsthe strongest traces of abnormal performance, we focus on this measure ofR&D intensity.
Stocks that are highly ranked by R&D to market equity generally havelow past returns, so their subsequent returns may be confounded by thereversals generally experienced by past losers. Further, past returns over anintermediate horizon of less than a year may be another factor that predictsfuture returns ~see Chan, Jegadeesh, and Lakonishok ~1996!!. To control forthese effects, in addition to size and book-to-market, in Table VI we estimatetime series regressions of the form
Rpt 2 Rft 5 ap 1 bp @RMt 2 Rft # 1 sp SMBt 1 hp HMLt 1 wpWMLt
1 dpUMDt 1 ept .~2!
The model is estimated using monthly returns from each of the first threeyears following portfolio formation. Here Rpt 2 Rft is the monthly return onportfolio p in excess of the Treasury bill rate in month t, RMt 2 Rft is theexcess return on the value-weighted market index, and SMBt , HMLt are thereturns on the Fama and French ~1993! factor-mimicking portfolios for sizeand book-to-market, respectively. The factors WMLt and UMDt pick up theeffect of long-term and intermediate-term past returns ~measured over non-overlapping horizons!, respectively. Each is the difference between the re-turns in month t on a portfolio of past winners and a portfolio of past losers.Past winners ~losers! are defined to be the stocks ranked in the top ~bottom!quintile by their past returns beginning five years ago and ending one yearago in the case of WMLt . For UMDt , past winners and losers are defined bypast return beginning seven months and ending one month ago.20
20 For details on the construction of WMLt and UMDt , see Chan et al. ~1998!.
2448 The Journal of Finance
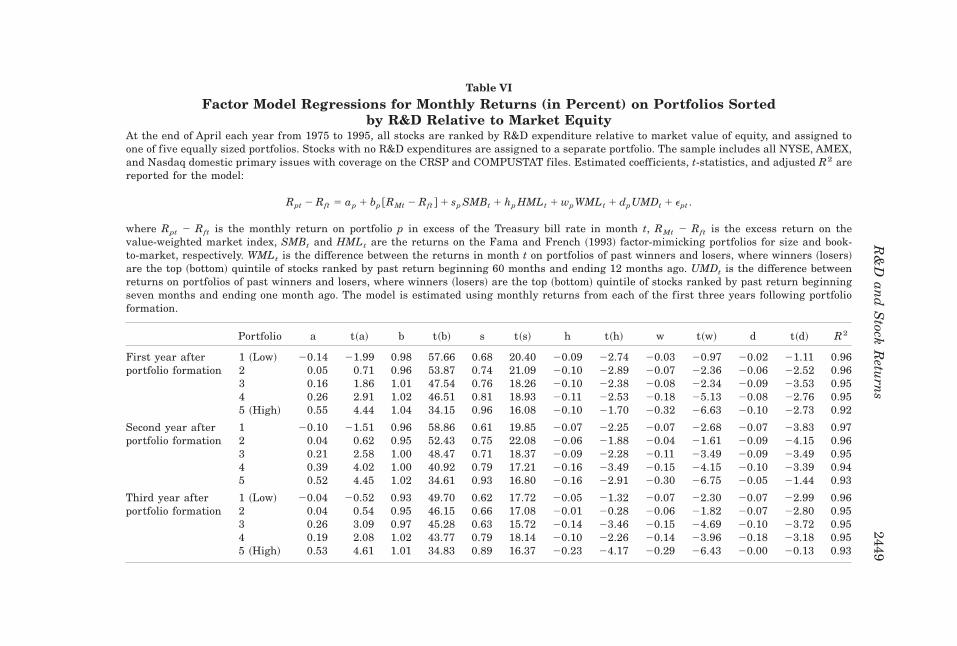
Table VI
Factor Model Regressions for Monthly Returns (in Percent) on Portfolios Sortedby R&D Relative to Market Equity
At the end of April each year from 1975 to 1995, all stocks are ranked by R&D expenditure relative to market value of equity, and assigned toone of five equally sized portfolios. Stocks with no R&D expenditures are assigned to a separate portfolio. The sample includes all NYSE, AMEX,and Nasdaq domestic primary issues with coverage on the CRSP and COMPUSTAT files. Estimated coefficients, t-statistics, and adjusted R2 arereported for the model:
Rpt 2 Rft 5 ap 1 bp @RMt 2 Rft # 1 sp SMBt 1 hp HMLt 1 wpWMLt 1 dpUMDt 1 ept .
where Rpt 2 Rft is the monthly return on portfolio p in excess of the Treasury bill rate in month t, RMt 2 Rft is the excess return on thevalue-weighted market index, SMBt and HMLt are the returns on the Fama and French ~1993! factor-mimicking portfolios for size and book-to-market, respectively. WMLt is the difference between the returns in month t on portfolios of past winners and losers, where winners ~losers!are the top ~bottom! quintile of stocks ranked by past return beginning 60 months and ending 12 months ago. UMDt is the difference betweenreturns on portfolios of past winners and losers, where winners ~losers! are the top ~bottom! quintile of stocks ranked by past return beginningseven months and ending one month ago. The model is estimated using monthly returns from each of the first three years following portfolioformation.
Portfolio a t~a! b t~b! s t~s! h t~h! w t~w! d t~d! R2
First year after 1 ~Low! 20.14 21.99 0.98 57.66 0.68 20.40 20.09 22.74 20.03 20.97 20.02 21.11 0.96portfolio formation 2 0.05 0.71 0.96 53.87 0.74 21.09 20.10 22.89 20.07 22.36 20.06 22.52 0.96
3 0.16 1.86 1.01 47.54 0.76 18.26 20.10 22.38 20.08 22.34 20.09 23.53 0.954 0.26 2.91 1.02 46.51 0.81 18.93 20.11 22.53 20.18 25.13 20.08 22.76 0.955 ~High! 0.55 4.44 1.04 34.15 0.96 16.08 20.10 21.70 20.32 26.63 20.10 22.73 0.92
Second year after 1 20.10 21.51 0.96 58.86 0.61 19.85 20.07 22.25 20.07 22.68 20.07 23.83 0.97portfolio formation 2 0.04 0.62 0.95 52.43 0.75 22.08 20.06 21.88 20.04 21.61 20.09 24.15 0.96
3 0.21 2.58 1.00 48.47 0.71 18.37 20.09 22.28 20.11 23.49 20.09 23.49 0.954 0.39 4.02 1.00 40.92 0.79 17.21 20.16 23.49 20.15 24.15 20.10 23.39 0.945 0.52 4.45 1.02 34.61 0.93 16.80 20.16 22.91 20.30 26.75 20.05 21.44 0.93
Third year after 1 ~Low! 20.04 20.52 0.93 49.70 0.62 17.72 20.05 21.32 20.07 22.30 20.07 22.99 0.96portfolio formation 2 0.04 0.54 0.95 46.15 0.66 17.08 20.01 20.28 20.06 21.82 20.07 22.80 0.95
3 0.26 3.09 0.97 45.28 0.63 15.72 20.14 23.46 20.15 24.69 20.10 23.72 0.954 0.19 2.08 1.02 43.77 0.79 18.14 20.10 22.26 20.14 23.96 20.18 23.18 0.955 ~High! 0.53 4.61 1.01 34.83 0.89 16.37 20.23 24.17 20.29 26.43 20.00 20.13 0.93
R&
Dan
dS
tockR
eturn
s2449
The factor model ~2! also helps to remedy one drawback to excess returnsbased on control portfolios matched by size and book-to-market ratio. Inparticular, the matching procedure for control portfolios relies on measuredbook values that do not include the value of intangible assets, or alterna-tively requires assumptions about the amortization rate for R&D. Addition-ally, if technology stocks always behave like growth stocks regardless of theirbook-to-market ratios, the adjustment based on matching portfolios may bemisleading.
The evidence in Daniel and Titman ~1997! suggests an alternative to usingfactor loadings as a stock’s risk exposures. In particular, firm characteristicssuch as size, book-to-market, and past returns may yield better risk measures.To implement this approach, we estimate annual cross-sectional regres-sions of stock returns on f irm size ~in logarithms!, adjusted book-to-market ratio, R&D intensity relative to market, and past returns. Theestimated coefficients are then averaged over time. The results from thefactor model and the model using firm attributes turn out to be qualitativelysimilar; so, for the sake of brevity, we concentrate on the factor modeladjustment.
Given their poor past performance, stocks with high R&D relative to mar-ket tend to have comparatively large negative loadings on WML and, in thefirst year, on UMD in Table VI. Even after controlling for the five factors,there are notable differences in alphas across the quintile portfolios. In par-ticular, the alpha for the top quintile portfolio is large and statistically sig-nificant in each of the three postformation years. Over the first postformationyear, the excess performance for the top quintile is 0.55 percent per month.21
The spread between the extreme quintiles’ alphas is 0.69 percent per monthin the first year ~or an annualized spread of 8.28 percent!. The spread con-tinues to be large in the second and third postformation years as well ~theyare 7.44 percent and 6.84 percent per year, respectively!.22 To sum up, ourearlier findings are not sensitive to how we adjust for size and book-to-market effects. Further, the abnormal performance of stocks with high R&Dto market is not solely driven by return reversals associated with past losers.
Other measures of risk-adjusted performance also suggest that the largereturns on the portfolio with high R&D intensity relative to market are notentirely due to risk. The Sharpe ratio of the top quintile portfolio, for exam-ple, is 0.85 ~based on annual returns over the first postformation year!. Thecorresponding Sharpe ratio for the market index is 0.53. If risk is measuredas potential losses during down markets, the top quintile portfolio is also not
21 In comparison, the alpha for R&D quintile portfolio 4 is lower. Note, however, that in thetop quintile portfolio R&D spending as a fraction of market value is much higher than in theother groups, averaging 16.55 percent ~see Panel D of Table IV!.
22 It might be argued that abnormal performance shows up because the factor model does apoor job of describing the returns on stocks making up the top quintile portfolio based on R&Dto market. However, Fama and French ~1996! find no evidence of abnormal performance froma three-factor model applied to small stocks with high book-to-market ratios, or to extreme pastlosers. Hence, it is not likely that the alphas in Table VI ref lect a misspecified factor model.
2450 The Journal of Finance
very risky. For example, across all down-market months ~where the returnon the market is below the Treasury bill rate! the average return on the topquintile portfolio over the Treasury bill rate is 22.60 percent per month. Thecorresponding average for the market index is 23.25 percent per month. Inup markets, the average return over the T-bill rate is 5.32 percent and 3.28percent per month for the top quintile portfolio and the market, respectively.23
B. Advertising and Stock Returns
Although the promise of technological breakthroughs has pushed R&Dcapital into the limelight, there are other forms of intangible capital as well.In this subsection, we provide an exploratory analysis of another commonform of investment in intangible capital, namely, advertising. Like researchand development spending, advertising expenditures have some elements oflong-term investment ~although the effective lifetime of advertising expen-ditures may be comparatively shorter!. Advertising expenditures are alsoexpensed. Empirically, advertising represents a smaller component of aggre-gate sales or earnings compared to R&D. Advertising makes up about 0.9 per-cent of total 1995 sales of all firms, whereas R&D accounts for almost twiceas much ~1.7 percent!. Our objective here is to see if the patterns uncoveredin our analysis of R&D extend to advertising.
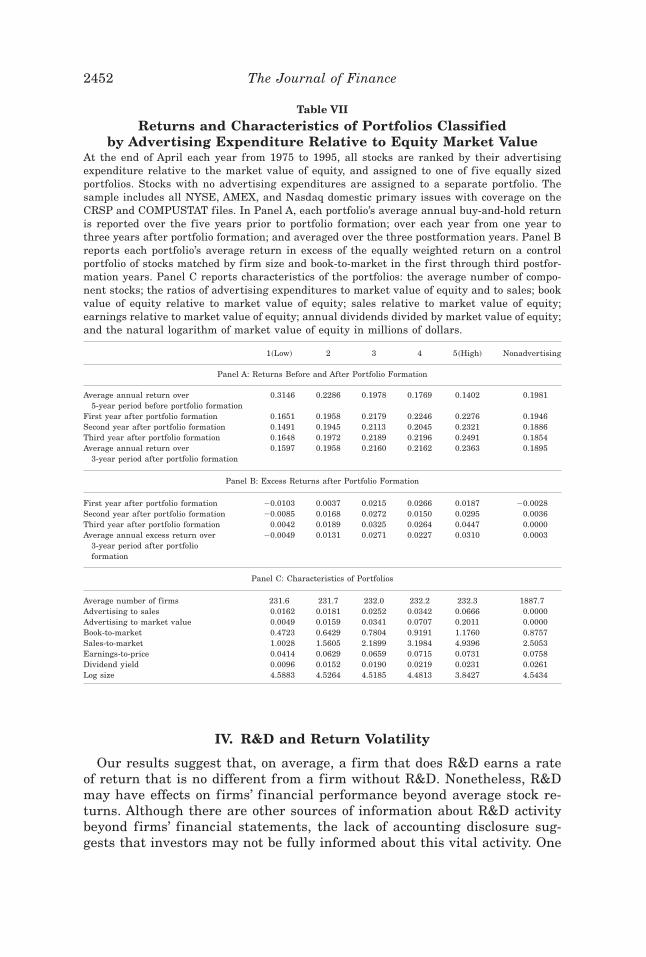
Table VII provides results for portfolios sorted by advertising expendi-tures relative to market value of equity.24 The number of firms that do ad-vertising is roughly the same as those doing R&D ~about 1,200 firms onaverage each year report nonzero expense for either advertising or R&D!.For the firms engaged in advertising, their average return over the threepostformation years ~20.46 percent! is slightly higher than that of firms with-out advertising ~18.95 percent!. The difference may ref lect the fact that firmswho do advertising tend to be concentrated in certain industries.25
The results for advertising expenditures relative to market essentially agreewith our findings for R&D relative to market. For example, over the threeyears following portfolio formation, the firms in quintile portfolio 5 have anaverage excess return of 3.10 percent per year. Advertising-intensive firmswith poor past performance also face strong pressures to cut costs. Whensuch firms keep investing in their franchise value through advertising de-spite these pressures, they are more likely to represent cases of relativeundervaluation. Nonetheless, these cases are overlooked by the market.
23 Our analysis controls for all the sources of risk that have been uncovered in the empiricalliterature, using a variety of methodologies. There is always a possibility, however, that some~yet to be identified! source of risk has been omitted. As a consequence, the persistence of excessreturns may be an indication of misspecification of the asset pricing models.
24 As is the case with R&D relative to sales, the sort by advertising to sales does not producenotable differences in future returns across portfolios. Accordingly, for the sake of brevity, theseresults are omitted.
25 Compared to the set of firms doing R&D, the firms engaged in advertising, for example,include a larger number of financial institutions, securities firms, media and broadcastingcompanies, and firms in consumer goods industries.
R&D and Stock Returns 2451
IV. R&D and Return Volatility
Our results suggest that, on average, a firm that does R&D earns a rateof return that is no different from a firm without R&D. Nonetheless, R&Dmay have effects on firms’ financial performance beyond average stock re-turns. Although there are other sources of information about R&D activitybeyond firms’ financial statements, the lack of accounting disclosure sug-gests that investors may not be fully informed about this vital activity. One
Table VII
Returns and Characteristics of Portfolios Classifiedby Advertising Expenditure Relative to Equity Market Value
At the end of April each year from 1975 to 1995, all stocks are ranked by their advertisingexpenditure relative to the market value of equity, and assigned to one of five equally sizedportfolios. Stocks with no advertising expenditures are assigned to a separate portfolio. Thesample includes all NYSE, AMEX, and Nasdaq domestic primary issues with coverage on theCRSP and COMPUSTAT files. In Panel A, each portfolio’s average annual buy-and-hold returnis reported over the five years prior to portfolio formation; over each year from one year tothree years after portfolio formation; and averaged over the three postformation years. Panel Breports each portfolio’s average return in excess of the equally weighted return on a controlportfolio of stocks matched by firm size and book-to-market in the first through third postfor-mation years. Panel C reports characteristics of the portfolios: the average number of compo-nent stocks; the ratios of advertising expenditures to market value of equity and to sales; bookvalue of equity relative to market value of equity; sales relative to market value of equity;earnings relative to market value of equity; annual dividends divided by market value of equity;and the natural logarithm of market value of equity in millions of dollars.
1~Low! 2 3 4 5~High! Nonadvertising
Panel A: Returns Before and After Portfolio Formation
Average annual return over5-year period before portfolio formation
0.3146 0.2286 0.1978 0.1769 0.1402 0.1981
First year after portfolio formation 0.1651 0.1958 0.2179 0.2246 0.2276 0.1946Second year after portfolio formation 0.1491 0.1945 0.2113 0.2045 0.2321 0.1886Third year after portfolio formation 0.1648 0.1972 0.2189 0.2196 0.2491 0.1854Average annual return over
3-year period after portfolio formation0.1597 0.1958 0.2160 0.2162 0.2363 0.1895
Panel B: Excess Returns after Portfolio Formation
First year after portfolio formation 20.0103 0.0037 0.0215 0.0266 0.0187 20.0028Second year after portfolio formation 20.0085 0.0168 0.0272 0.0150 0.0295 0.0036Third year after portfolio formation 0.0042 0.0189 0.0325 0.0264 0.0447 0.0000Average annual excess return over
3-year period after portfolioformation
20.0049 0.0131 0.0271 0.0227 0.0310 0.0003
Panel C: Characteristics of Portfolios
Average number of firms 231.6 231.7 232.0 232.2 232.3 1887.7Advertising to sales 0.0162 0.0181 0.0252 0.0342 0.0666 0.0000Advertising to market value 0.0049 0.0159 0.0341 0.0707 0.2011 0.0000Book-to-market 0.4723 0.6429 0.7804 0.9191 1.1760 0.8757Sales-to-market 1.0028 1.5605 2.1899 3.1984 4.9396 2.5053Earnings-to-price 0.0414 0.0629 0.0659 0.0715 0.0731 0.0758Dividend yield 0.0096 0.0152 0.0190 0.0219 0.0231 0.0261Log size 4.5883 4.5264 4.5185 4.4813 3.8427 4.5434
2452 The Journal of Finance
consequence may be a high degree of uncertainty surrounding an R&D-intensive firm’s future prospects. As a result, the volatility of returns mayrise with R&D spending, thereby imposing real costs on investors and pos-sibly affecting the cost of capital for R&D-intensive firms.
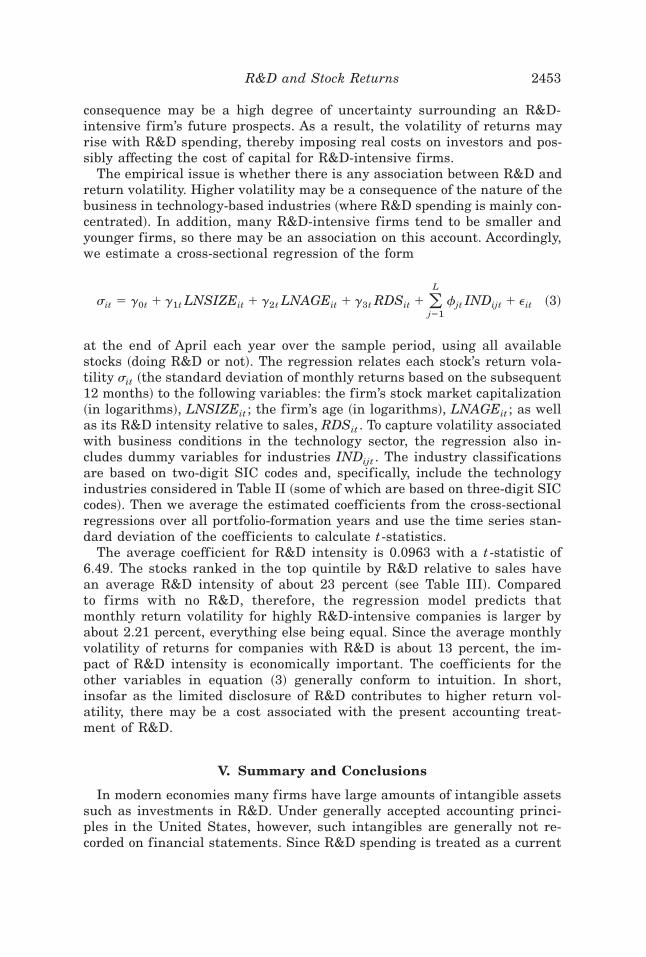
The empirical issue is whether there is any association between R&D andreturn volatility. Higher volatility may be a consequence of the nature of thebusiness in technology-based industries ~where R&D spending is mainly con-centrated!. In addition, many R&D-intensive firms tend to be smaller andyounger firms, so there may be an association on this account. Accordingly,we estimate a cross-sectional regression of the form
sit 5 g0t 1 g1t LNSIZEit 1 g2t LNAGEit 1 g3t RDSit 1 (j51
L
fjt INDijt 1 eit ~3!
at the end of April each year over the sample period, using all availablestocks ~doing R&D or not!. The regression relates each stock’s return vola-tility sit ~the standard deviation of monthly returns based on the subsequent12 months! to the following variables: the firm’s stock market capitalization~in logarithms!, LNSIZEit ; the firm’s age ~in logarithms!, LNAGEit ; as wellas its R&D intensity relative to sales, RDSit . To capture volatility associatedwith business conditions in the technology sector, the regression also in-cludes dummy variables for industries INDijt . The industry classificationsare based on two-digit SIC codes and, specifically, include the technologyindustries considered in Table II ~some of which are based on three-digit SICcodes!. Then we average the estimated coefficients from the cross-sectionalregressions over all portfolio-formation years and use the time series stan-dard deviation of the coefficients to calculate t-statistics.
The average coefficient for R&D intensity is 0.0963 with a t-statistic of6.49. The stocks ranked in the top quintile by R&D relative to sales havean average R&D intensity of about 23 percent ~see Table III!. Comparedto firms with no R&D, therefore, the regression model predicts thatmonthly return volatility for highly R&D-intensive companies is larger byabout 2.21 percent, everything else being equal. Since the average monthlyvolatility of returns for companies with R&D is about 13 percent, the im-pact of R&D intensity is economically important. The coefficients for theother variables in equation ~3! generally conform to intuition. In short,insofar as the limited disclosure of R&D contributes to higher return vol-atility, there may be a cost associated with the present accounting treat-ment of R&D.
V. Summary and Conclusions
In modern economies many firms have large amounts of intangible assetssuch as investments in R&D. Under generally accepted accounting princi-ples in the United States, however, such intangibles are generally not re-corded on financial statements. Since R&D spending is treated as a current
R&D and Stock Returns 2453
expense, there can be potentially large effects on many firms’ financial state-ments. This paper addresses the question of whether stock prices appropri-ately incorporate the value of firms’ R&D investments.
The high level of spending on R&D suggests that large distortions canarise from expensing rather than capitalizing R&D costs. If investors fail toadjust standard valuation measures such as price-to-earnings or price-to-book ratios for the long-term benefits of R&D, potentially severe mispricingcan arise.
Our evidence does not support a direct link between R&D spending andfuture stock returns. In the three-year period following portfolio formation,stocks doing R&D have an average return of 19.65 percent per year, andstocks doing no R&D have an average return of 19.50 percent. Thus it doesnot appear that, historically, a highly touted technology stock on averageoutperformed a more mundane cement company. This finding is consistentwith the hypothesis that the stock price incorporates investors’ unbiasedbeliefs about the value of R&D.
For firms engaged in R&D, the evidence on an association between R&Dintensity measured relative to sales and future returns is not strong. Theclearest evidence that high R&D plays a distinctive role arises from stockswith high R&D relative to the market value of equity. Their average excessreturn over the following three years is 6.12 percent per year. Stocks rankedhighly by R&D relative to market equity generally tend to be past losers.Firms that spend heavily on R&D despite poor past performance and pres-sures to cut costs represent instances where managers are relatively opti-mistic about the firms’ future prospects. However, the market tends to discountthis information and appears to be sluggish in revising its expectations. Ourfindings are not sensitive to how returns are adjusted for effects due to size,book-to-market, and return reversal effects. Further, we obtain similar re-sults for spending on another type of intangible asset, advertising.
Although the historical record reveals little difference between the aver-age stock price performance of R&D stocks and stocks with no R&D, thismay not be the end of the story. We provide evidence that R&D intensity isassociated with return volatility, after controlling for firm size, age, andindustry effects. Even if market prices on average incorporate the futurebenefits from R&D, the lack of accounting information on such an importantintangible asset may impose real costs on investors through increased volatility.
Appendix: Growth Rates of Portfolio Earnings
This Appendix describes how we construct measures of operating perfor-mance for a portfolio. In the text, we report returns based on a buy-and-holdstrategy, where the composition of the portfolio is revised each year. In par-allel with this strategy, we calculate growth rates in portfolio earnings, basedon the ideas in Givoly and Lakonishok ~1993!, as well as Ikenberry andLakonishok ~1993!. The procedure is as follows ~see also the description inChan, Karceski, and Lakonishok ~2000!!. In year t, we select stocks for a
2454 The Journal of Finance
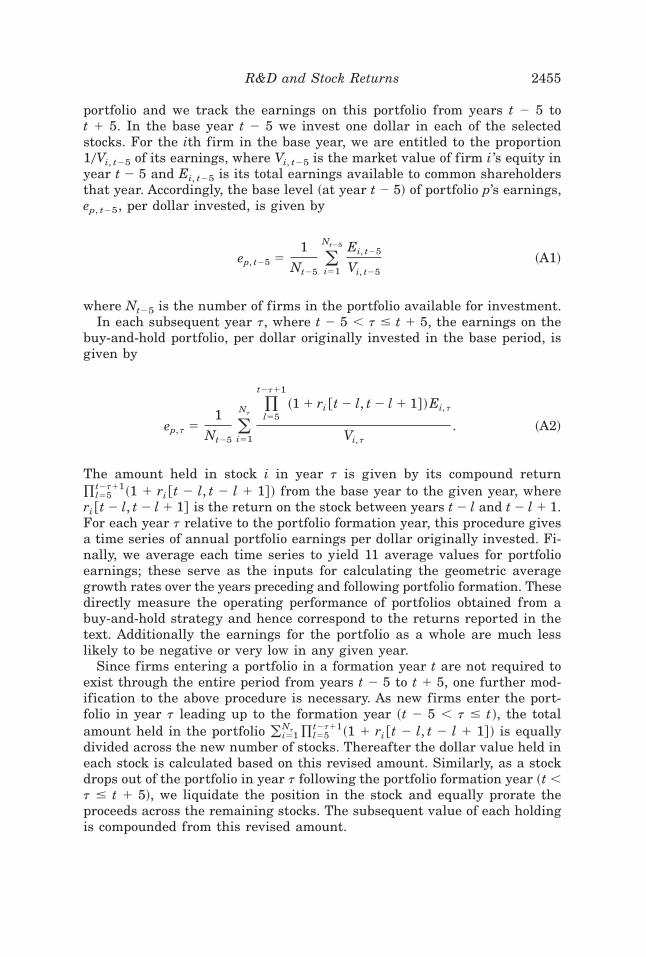
portfolio and we track the earnings on this portfolio from years t 2 5 tot 1 5. In the base year t 2 5 we invest one dollar in each of the selectedstocks. For the ith firm in the base year, we are entitled to the proportion10Vi, t25 of its earnings, where Vi, t25 is the market value of firm i ’s equity inyear t 2 5 and Ei, t25 is its total earnings available to common shareholdersthat year. Accordingly, the base level ~at year t 2 5! of portfolio p’s earnings,ep, t25, per dollar invested, is given by
ep, t25 51
Nt25(i51
Nt25 Ei, t25
Vi, t25~A1!
where Nt25 is the number of firms in the portfolio available for investment.In each subsequent year t, where t 2 5 , t # t 1 5, the earnings on the
buy-and-hold portfolio, per dollar originally invested in the base period, isgiven by
ep, t 51
Nt25(i51
Nt)l55
t2t11
~1 1 ri @t 2 l, t 2 l 1 1# !Ei, t
Vi, t
. ~A2!
The amount held in stock i in year t is given by its compound return)l55
t2t11~1 1 ri @t 2 l, t 2 l 1 1# ! from the base year to the given year, whereri @t 2 l, t 2 l 1 1# is the return on the stock between years t 2 l and t 2 l 1 1.For each year t relative to the portfolio formation year, this procedure givesa time series of annual portfolio earnings per dollar originally invested. Fi-nally, we average each time series to yield 11 average values for portfolioearnings; these serve as the inputs for calculating the geometric averagegrowth rates over the years preceding and following portfolio formation. Thesedirectly measure the operating performance of portfolios obtained from abuy-and-hold strategy and hence correspond to the returns reported in thetext. Additionally the earnings for the portfolio as a whole are much lesslikely to be negative or very low in any given year.
Since firms entering a portfolio in a formation year t are not required toexist through the entire period from years t 2 5 to t 1 5, one further mod-ification to the above procedure is necessary. As new firms enter the port-folio in year t leading up to the formation year ~t 2 5 , t # t!, the totalamount held in the portfolio (i51
Nt )l55t2t11~1 1 ri @t 2 l, t 2 l 1 1# ! is equally
divided across the new number of stocks. Thereafter the dollar value held ineach stock is calculated based on this revised amount. Similarly, as a stockdrops out of the portfolio in year t following the portfolio formation year ~t ,t # t 1 5!, we liquidate the position in the stock and equally prorate theproceeds across the remaining stocks. The subsequent value of each holdingis compounded from this revised amount.
R&D and Stock Returns 2455
REFERENCES
Berk, Jonathan B., Richard C. Green, and Vasant Naik, 1999, Optimal investment, growthoptions, and security returns, Journal of Finance 54, 1553–1607.
Chan, Louis K. C., Yasushi Hamao, and Josef Lakonishok, 1991, Fundamentals and stock re-turns in Japan, Journal of Finance 46, 1739–1764.
Chan, Louis K. C., Narasimhan Jegadeesh, and Josef Lakonishok, 1996, Momentum strategies,Journal of Finance 51, 1681–1713.
Chan, Louis K. C., Jason Karceski, and Josef Lakonishok, 1998, The risk and return fromfactors, Journal of Financial and Quantitative Analysis 33, 159–188.
Chan, Louis K. C., Jason Karceski, and Josef Lakonishok, 2000, New paradigm or same oldhype in equity investing? Financial Analysts Journal 56, 23–36.
Chan, Su Han, John D. Martin, and John W. Kensinger, 1990, Corporate research and devel-opment expenditures and share value, Journal of Financial Economics 26, 255–276.
Daniel, Kent, and Sheridan Titman, 1997, Evidence on the characteristics of cross-sectionalvariation in stock returns, Journal of Finance 52, 1–33.
DeBondt, Werner F. M., and Richard Thaler, 1985, Does the stock market overreact? Journal ofFinance 40, 793–805.
Fama, Eugene F., and Kenneth R. French, 1992, The cross section of expected stock returns,Journal of Finance 47, 427–465.
Fama, Eugene F., and Kenneth R. French, 1993, Common risk factors in the returns on stocksand bonds, Journal of Financial Economics 33, 3–56.
Fama, Eugene F., and Kenneth R. French, 1996, Multifactor explanations of asset pricing anom-alies, Journal of Finance 51, 55–84.
Fama, Eugene F., and James MacBeth, 1973, Risk, return and equilibrium: Empirical tests,Journal of Political Economy 81, 607–636.
Givoly, Dan, and Josef Lakonishok, 1993, Earning growth and the firm-size anomaly, in John B.Guerard, Jr. and Mustafa N. Gultekin eds.: Handbook of Security Analyst Forecasting andAsset Allocation ~JAI Press, Greenwich, CT!.
Hall, Bronwyn H., 1993, The stock market’s valuation of R&D investment during the 1980’s,American Economic Review 83, 259–264.
Hall, Bronwyn H., Clint Cummins, Elizabeth S. Laderman, and Joy Mundy, 1988, The R&Dmaster file documentation, NBER technical working paper 72.
Hall, Bronwyn H., and Robert E. Hall, 1993, The value and performance of U.S. corporations,Brookings Papers on Economic Activity 1, 1–34.
Hall, Bronwyn H., and John van Reenen, 1999, How effective are fiscal incentives for R&D? Areview of the evidence, NBER working paper 7098.
Ikenberry, David, and Josef Lakonishok, 1993, Corporate governance through the proxy contest:Evidence and implications, Journal of Business 66, 405–435.
Ikenberry, David, Josef Lakonishok, and Theo Vermaelen, 1995, Market underreaction to openmarket share repurchases, Journal of Financial Economics 39, 181–208.
Jensen, Michael C., 1993, The modern industrial revolution, exit, and the failure of internalcontrol systems, Journal of Finance 48, 831–880.
Lakonishok, Josef, and Inmoo Lee, 2001, Are insiders’ trades informative? Review of FinancialStudies 14, 79–111.
Lakonishok, Josef, Andrei Shleifer, and Robert W. Vishny, 1994, Contrarian investment, extrap-olation, and risk, Journal of Finance 49, 1541–1578.
LaPorta, Rafael, Josef Lakonishok, Andrei Shleifer, and Robert Vishny, 1997, Good news forvalue stocks: Further evidence on market efficiency, Journal of Finance 52, 859–874.
Lev, Baruch, and Theodore Sougiannis, 1996, The capitalization, amortization, and value-relevance of R&D, Journal of Accounting & Economics 21, 107–138.
Loughran, Tim, and Jay R. Ritter, 1995, The new issues puzzle, Journal of Finance 50, 23–51.Porter, Michael E., 1992, Capital disadvantage: America’s failing capital investment system,
Harvard Business Review 70, 65–82.
2456 The Journal of Finance
Related Documents


