Valuation of Lego DCF, Fourier analysis and Monte Carlo Simulation 0 2000 4000 6000 8000 10000 12000 14000 16000 -2000 3000 8000 13000 18000 23000 28000 33000 38000 1995 1996 1997 1998 1999 2000 2001 2002 2003 2004 2005 2006 2007 2008 2009 2010 2011 2012 2013 2014 2015 Avg # FTE DKK mn Net profits Revenue Avg # FTE MASTER THESIS Per Elsted Hansen Copenhagen Business School cand.merc. Finance and Strategic Management Submitted: May 6, 2016 Thesis advisor dr. merc. Finn Østrup Pages Characters 79.2 180.112

Welcome message from author
This document is posted to help you gain knowledge. Please leave a comment to let me know what you think about it! Share it to your friends and learn new things together.
Transcript

Valuation of Lego
DCF, Fourier analysis and
Monte Carlo Simulation
0
2000
4000
6000
8000
10000
12000
14000
16000
-2000
3000
8000
13000
18000
23000
28000
33000
38000
199
5
199
6
199
7
199
8
199
9
200
0
200
1
200
2
200
3
200
4
200
5
200
6
200
7
200
8
200
9
201
0
201
1
201
2
201
3
201
4
201
5
Avg
# F
TE
DK
K m
n
Net profits Revenue Avg # FTE
MASTER THESIS
Per Elsted Hansen
Copenhagen Business School
cand.merc.
Finance and Strategic Management
Submitted: May 6, 2016
Thesis advisor
dr. merc. Finn Østrup
Pages Characters 79.2 180.112

ABSTRACT
This thesis aims at estimating a fair value of Lego. The discounted cash flow model serves as the overall
guideline in relation to the computational valuation. Thirty financial statements from 2006 to 2015 are
reformulated and analyzed – ten statements from Lego and a sum of twenty from Lego’s largest
competitors Hasbro and Mattel. The case of Lego is interesting because in just ten years, the firm went
from near-bankruptcy to becoming the second largest toy-manufacturing firm in the world measured by
revenue. In addition, Lego is an unlisted firm and having no access to the inner workings in the research
of Lego proves to be a challenge during the process. The research relies heavily on historical public
record data and information asymmetry is therefor expected, which may yield a ‘less true’ valuation than
otherwise possible. Lego’s famous product, the Lego Brick, is today the single most sold toy product
across the global toy and games industry.
A strategic analysis is conducted on macro and micro levels, while meso level analysis in general is
avoided due to the sheer scale and scope of Lego.
In the practical part of forecasting time series data (10-year government bond interest rates, revenue and
NOPLAT), the data was first checked to rule out randomness by using Fisher’s Kappa test statistic, as
well as Bartlett’s Kolmogorov-Smirnov test statistic. Depending on results, Fourier analysis is employed
to reveal any periodicity, and later benchmarked against various regression models. However, for the
data at hand, and although only in a minor degree, Fourier transformation proves to be inferior compared
to the regression model. In accordance with the research design chosen, regression modeling takes the
precedence over Fourier analysis.
After benchmarking, forecasting and calculating the final valuation, it is put into perspective against peer
firms. In addition, to try simulating “what if scenarios” of possible enterprise values, the thesis
incorporates Monte Carlo modeling on one and two dimensions.
The resulting valuation is found to be DKK ~460bn using 10 year budget from 2016-2025. The strategical
analysis indicates an exciting future for Lego, which gives credit to the valuation, and as such, it is
assumed that the valuation is fair given the limitations of thesis.

1
1 Index
1 Index .................................................................................................................................. 1 1.1 List of tables ................................................................................................................. 4 1.2 List of figures ................................................................................................................ 5
2 Introduction and research design ................................................................................... 8 2.1 Background ................................................................................................................... 8 2.2 Motivation and research question ............................................................................... 10 2.3 Structure ...................................................................................................................... 10 2.4 Methodology and delimitation .................................................................................... 10 2.5 Scientific framework .................................................................................................. 12
2.5.1 Science theory ................................................................................................... 12 2.5.2 Reflection on models for strategic analysis ...................................................... 18 2.5.3 Time Series Analysis ........................................................................................ 20
2.5.3.1 Fourier analysis in brief ........................................................................ 21 2.5.3.1.1 Wave, frequency, amplitude and phase ................................. 21 2.5.3.1.2 Fourier Transform applied on constructed data .................... 25 2.5.3.1.3 Testing for randomness ......................................................... 26 2.5.3.1.4 Inverse Fourier Transform ..................................................... 28
2.5.4 Monte Carlo Simulation in brief ....................................................................... 29
3 Strategic Analysis ........................................................................................................... 31 3.1 Firm introduction ........................................................................................................ 31
3.1.1 History of firm in strategic perspective ............................................................. 31 3.1.2 Products ............................................................................................................. 41
3.2 Market environment .................................................................................................... 43 3.2.1 Market outlook and competitive situation ........................................................ 43 3.2.2 Macro environment ........................................................................................... 47
3.2.2.1 Socio-cultural ........................................................................................ 48 3.2.2.1.1 Short product life cycles, digitization/mediatization of toys . 48
3.2.2.2 Legal ..................................................................................................... 49 3.2.2.2.1 Safety and product recalls ..................................................... 49 3.2.2.2.2 Intellectual Property Rights ................................................... 50
3.2.2.3 Technology ........................................................................................... 52 3.2.2.3.1 Oil .......................................................................................... 52
3.2.3 Micro environment ............................................................................................ 54 3.2.3.1 System of Play ...................................................................................... 54 3.2.3.2 Brand .................................................................................................... 56 3.2.3.3 Stores + ambassadors ............................................................................ 57 3.2.3.4 Production capabilities ......................................................................... 58

2
3.3 Summary ..................................................................................................................... 59
4 Financial Analysis ........................................................................................................... 59 4.1 Accounting policies and reformulation notes ............................................................. 59 4.2 Reformulation of balance sheets ................................................................................. 61
4.2.1 Operating cash ................................................................................................... 62 4.2.2 Operating leases ................................................................................................ 62
4.3 Reformulation of income statements .......................................................................... 64 4.4 Profitability analysis ................................................................................................... 64
4.4.1 Peer performance comparison ........................................................................... 65 4.4.2 Profitability drivers ........................................................................................... 66
4.4.2.1 Invested Capital, IC .............................................................................. 68 4.4.2.2 Return on Invested Capital ................................................................... 69 4.4.2.3 Net operating profit less adjusted taxes, NOPLAT .............................. 70 4.4.2.4 Asset turnover ratio and inverse ........................................................... 71 4.4.2.5 Net operating profit margin, NOPM ..................................................... 72
4.5 Summary ..................................................................................................................... 72
5 Valuation of Lego ........................................................................................................... 75 5.1 Discounted Cash flow model ...................................................................................... 75
5.1.1 Weighted Average Cost of Capital, WACC ..................................................... 76 5.1.1.1 Corporate tax rate ................................................................................. 77 5.1.1.2 Risk-free interest rate ............................................................................ 77
5.1.1.2.1 Results of white noise test for risk-free interest rate ............. 78 5.1.1.2.2 Forecasting of the interest rate .............................................. 79
5.1.1.3 Corporate default spread ....................................................................... 82 5.1.1.4 Cost of debt ........................................................................................... 82 5.1.1.5 Capital structure for Lego ..................................................................... 83 5.1.1.6 Beta of equity ........................................................................................ 83 5.1.1.7 Expected market risk premium ............................................................. 84 5.1.1.8 Cost of equity ........................................................................................ 85 5.1.1.9 Adjusted WACC ................................................................................... 85
5.2 Budgeting .................................................................................................................... 86 5.3 Valuation with DCF .................................................................................................... 87
5.3.1 Sensitivity analysis with Monte Carlo simulation ............................................ 87 5.3.2 Comparison with peer companies ..................................................................... 88
6 Conclusion ....................................................................................................................... 91 6.1 Future research ............................................................................................................ 92
7 References ....................................................................................................................... 94
8 Appendix ....................................................................................................................... 105 8.1 Organizational Chart ................................................................................................. 105

3
8.2 Macro, Meso, and Micro Environment ..................................................................... 106 8.3 Matlab Source Code for Fourier Transform ............................................................. 107 8.4 Fisher’s Test for Significance – Distribution Table ................................................. 109 8.5 R-language Source Code for producing Fisher’s Test of significance table ............ 112 8.6 Condensed History of Lego ...................................................................................... 113 8.7 Top products in the traditional toy and games industry ........................................... 114 8.8 Global market size in retails sales prices and projected growth ............................... 117 8.9 Lego Brand ............................................................................................................... 118 8.10 Brand reputation ..................................................................................................... 119 8.11 Firm concentration ratio ......................................................................................... 120 8.12 Line items Reclassification ..................................................................................... 121 8.13 Income statements, Balance Sheets and Reformulation ......................................... 122
8.13.1 Income ratios ................................................................................................. 138 8.13.2 Capitalized Operating Leases ........................................................................ 139 8.13.3 Du Pont framework breakdown – level 1 & 2 .............................................. 140 8.13.4 Du Pont Ratios .............................................................................................. 143 8.13.5 Invested Capital line items ............................................................................ 144 8.13.6 Net operating profit less adjusted taxes, NOPLAT ....................................... 147
8.14 Normal Distribution of the 10-year Danish Government Bond ............................. 148 8.15 Calculation of WACC ............................................................................................. 148 8.16 Budgeting notes ...................................................................................................... 149 8.17 Budget ..................................................................................................................... 151 8.18 Sensitivity analysis ................................................................................................. 152
4
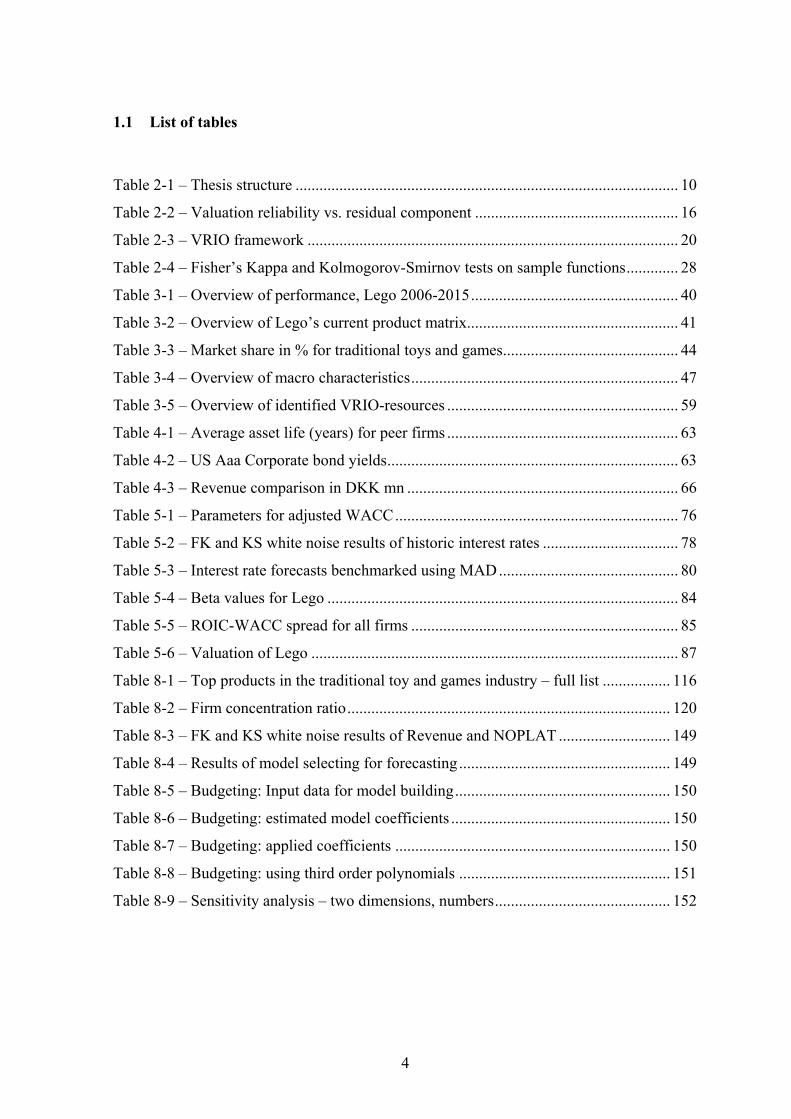
1.1 List of tables
Table 2-1 – Thesis structure ................................................................................................ 10
Table 2-2 – Valuation reliability vs. residual component ................................................... 16
Table 2-3 – VRIO framework ............................................................................................. 20
Table 2-4 – Fisher’s Kappa and Kolmogorov-Smirnov tests on sample functions ............. 28
Table 3-1 – Overview of performance, Lego 2006-2015 .................................................... 40
Table 3-2 – Overview of Lego’s current product matrix ..................................................... 41
Table 3-3 – Market share in % for traditional toys and games............................................ 44
Table 3-4 – Overview of macro characteristics ................................................................... 47
Table 3-5 – Overview of identified VRIO-resources .......................................................... 59
Table 4-1 – Average asset life (years) for peer firms .......................................................... 63
Table 4-2 – US Aaa Corporate bond yields ......................................................................... 63
Table 4-3 – Revenue comparison in DKK mn .................................................................... 66
Table 5-1 – Parameters for adjusted WACC ....................................................................... 76
Table 5-2 – FK and KS white noise results of historic interest rates .................................. 78
Table 5-3 – Interest rate forecasts benchmarked using MAD ............................................. 80
Table 5-4 – Beta values for Lego ........................................................................................ 84
Table 5-5 – ROIC-WACC spread for all firms ................................................................... 85
Table 5-6 – Valuation of Lego ............................................................................................ 87
Table 8-1 – Top products in the traditional toy and games industry – full list ................. 116
Table 8-2 – Firm concentration ratio ................................................................................. 120
Table 8-3 – FK and KS white noise results of Revenue and NOPLAT ............................ 149
Table 8-4 – Results of model selecting for forecasting ..................................................... 149
Table 8-5 – Budgeting: Input data for model building ...................................................... 150
Table 8-6 – Budgeting: estimated model coefficients ....................................................... 150
Table 8-7 – Budgeting: applied coefficients ..................................................................... 150
Table 8-8 – Budgeting: using third order polynomials ..................................................... 151
Table 8-9 – Sensitivity analysis – two dimensions, numbers ............................................ 152

5
1.2 List of figures
Figure 2-1 – Angular frequency .......................................................................................... 22
Figure 2-2 – Plot of wave functions .................................................................................... 22
Figure 2-3 – Plots of sample wave functions and periodograms ......................................... 26
Figure 2-4 – Inverse Fourier transform of sin(2 ) .............................................................. 28
Figure 3-1 – Kiddikraft cubes and Lego bricks ................................................................... 34
Figure 3-2 – Lego revenue, profits and average full-time employee count 1995-2005 ...... 38
Figure 3-3 – Top products in the traditional toy and games industry.................................. 45
Figure 3-4 – Global market size in retails sales prices and projected growth ..................... 46
Figure 3-5 – Population by region, CAGR and GCP .......................................................... 47
Figure 3-6 – IPR infringement cases in the EU ................................................................... 51
Figure 3-7 – Europe Brent crude oil spot prices 1987-2015 ............................................... 53
Figure 3-8 – Brand reputation 2011-Q12016 ...................................................................... 57
Figure 4-1 – Adapted Du Pont framework .......................................................................... 64
Figure 4-2 – Revenue growth compared to previous year................................................... 65
Figure 4-3 – Du Pont framework profitability drivers for all peers .................................... 68
Figure 4-4 – Lego, line items of Invested Capital ............................................................... 69
Figure 4-5 – ROIC, NOPLAT and Invested Capital growth YoY ...................................... 70
Figure 4-6 – Lego, financial statement items as a ratio of operating revenue. .................... 70
Figure 4-7 – Comparison of Asset turnover ratio and inverse ATR ................................... 72
Figure 4-8 – Net operating profit margin for all peers ........................................................ 72
Figure 5-1 – 10-year Danish government bond, nominal (1987/1/1 - 2015/12/1) .............. 77
Figure 5-2 – Fourier Transform Periodogram of interest rates (frequency (x), power (y)) 79
Figure 5-3 – Inverse Fourier Transform of 10-year Danish government bond ................... 79
Figure 5-4 – Interest rate OLS estimation and forecast ....................................................... 80
Figure 5-5 – Interest rate Fourier Transform estimation and forecast ................................. 80
Figure 5-6 – 10 year interest rate forecast using Detrending 5:1 (2010-2014 : 2015) ........ 81
Figure 5-7 – EV sensitivity analysis – two dimensions ...................................................... 88
Figure 5-8 – EV, Hasbro, Mattel in DKK bn ...................................................................... 88
Figure 8-1 – LEGO A/S - Ownership structure 2015 ........................................................ 105
Figure 8-2 – Macro, meso, and micro environment .......................................................... 106
Figure 8-3 – Fisher’s test of significance critical values ................................................... 109

6
Figure 8-4 – The Lego Brand Framework ......................................................................... 118
Figure 8-5 – Normal distribution 10-year Danish government bond ................................ 148
Figure 8-6 – Normal distribution plot EV ......................................................................... 152
Figure 8-7 – Sensitivity analysis – one dimension ............................................................ 152
7
PART I
Introductory Remarks

8
2 Introduction and research design
2.1 Background
The valuation process is an interesting but also challenging endeavor. While many
approaches exist to determine the value of a firm, valuation practice is often misunderstood:
According to Damodaran (2013), a well-known scholar in the field, firm valuation is often
misconstrued as an objective search for a true and precise value and where quantitative
methods over qualitative ones yield better results. However, practical valuation is typically
encompassed with human bias, thus preventing an objective valuation. Damodaran (2013)
continues to argue that instead of being too focused on objectivity, one should be concerned
with bias magnitude. The debate on quantitative versus qualitative research methods has
been ongoing for decades (Guba & Lincoln, 1994; Sale, Lohfeld, & Brazil, 2002), and
arguments for one or the other, or a combination exist (Fine & Elsbach, 2000; Shah &
Corley, 2006). In reflection, it can be argued that depending on which epistemological and
ontological school the valuation practitioner abides by, in fact a true and precise valuation is
achievable just by using quantitative methods (Creswell, 2003; Guba, 1990). The positivistic
paradigm subscribes to such reality by disregarding human interference as well as bias in
research methods (Guba, 1990). In contrast, this thesis abides by the neo-positivistic
paradigm, which reckons that all questions have true answers but verification of truth is
impossible because of human bias as well as lack of empirical testing on such truth.
Valuation requires one to look at current value, how value is and will be created, as well as
be sustained and for how long (Brealey, Myers, & Allen, 2011; Damodaran, 2013; Koller,
Goedhart, & Wessels, 2010). For reasons mentioned, one can simply not practice valuation
just by working with quantitative data from e.g. financial statements but is necessarily forced
to incorporate qualitative data detailing strategy, market and future perspectives as well.
While the human bias factor is established as a valuation challenge, information asymmetry
generates another factor to worry about – as firms differ on many parameters (e.g. scope and
scale, market, customers and more), so do information and availability of such. Economic
theory describes an inverse relationship between perceived uncertainty and pay-off for risk
averse investors, i.e. the more risk, the higher a pay-off required (Baker, Jensen, & Murphy,
1988). Studies of information asymmetry reveal that firms in imperfect markets are
perceived more risky by investors than peers under perfect market conditions (Armstrong,
Core, Taylor, & Verrecchia, 2011). The aspect of information asymmetry makes valuing

9
non-public firms both a challenging but also an interesting endeavor. Non-public firms are
not facing same reporting requirements and scrutiny as their public counterparts (Michaely
& Roberts, 2012), therefore fueling the perceived information asymmetry as seen from an
external point of view (Cohen & Dean, 2005). Lego, the famous Danish toy-manufacturing
firm is a privately held entity, which makes the firm an interesting case for valuation for
aforementioned reasons.
Founded in 1916, Lego can celebrate 100 years of operation in 2016 – though
not with manufacturing of toys at first. Initially founded as a carpentry shop, toy
manufacturing only began in 1932, while the Lego brick was not introduced until 1949. Only
a few times in its long history, has Lego lost money – the latest in 2004, nearly bankrupting
the firm. During the last 10-12 years, Lego has been through massive lay-offs and new-
hirings, out-sourcing, in-sourcing, divestitures, an oil crisis and the 2008 global financial
crisis. Nevertheless, Lego has managed to increase both top- and bottom-line and surpass
past performance consistently since 2004. In 2014, Lego reached position as the second
largest toy-manufacturing firm in the world, fiercely competing to beat current number one,
Mattel, USA. In 2014, for the first time in Lego’s history, the firm generated more revenue
in its second fiscal quarter than the world’s number one. Lego continued being the lead over
Mattel in its second quarter of 2015 but was still holding second position when measured in
terms of revenue on a yearly basis with translated currency. Lego booked revenues in 2015
close to DKK 36bn with products sold in more than 140 countries (LEGO, 2015a). Lego’s
initial toy products were made of wooden materials. Today, plastic construction bricks and
elements are the main products for Lego with about 72 billion pieces produced in 2015. Even
though plastic material was patented in 1856 (Parkes, 1862), it took nearly one hundred years
before plastic toys became a mass-market category. Lego’s first plastic toy became available
in 1949 – almost 17 years after its first wooden toy product had reached the shelves. As of
2015, the firm has produced more than 8321 billion plastic bricks and elements since 1949
(LEGO, 2016a), equal to around 120 bricks and elements for each of the 7 billion people on
earth. The firm has close to 14,000 full-time employees with own production facilities in
Denmark, Hungary, Czech Republic, Mexico and a new production facility under
construction in China scheduled for prime-time in 2017.
1 Estimated number based on 2014 reported numbers of 760 billion elements plus 2015 production of 72 billion elements.
10
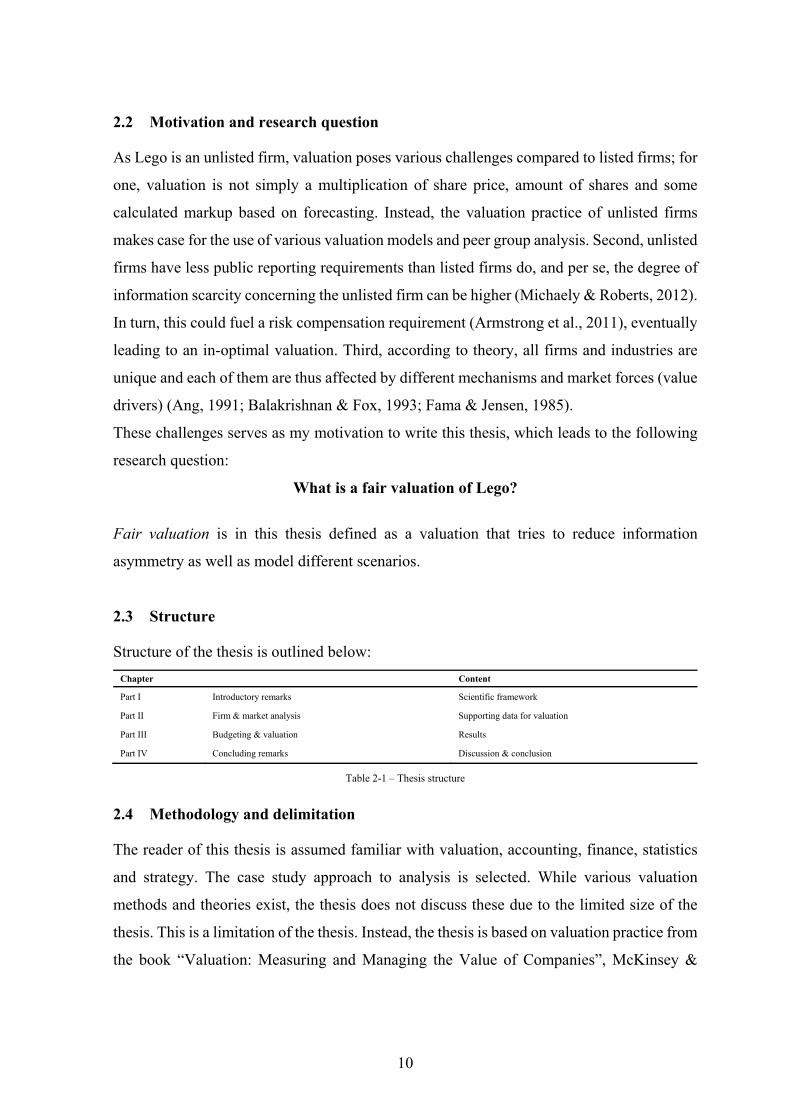
2.2 Motivation and research question
As Lego is an unlisted firm, valuation poses various challenges compared to listed firms; for
one, valuation is not simply a multiplication of share price, amount of shares and some
calculated markup based on forecasting. Instead, the valuation practice of unlisted firms
makes case for the use of various valuation models and peer group analysis. Second, unlisted
firms have less public reporting requirements than listed firms do, and per se, the degree of
information scarcity concerning the unlisted firm can be higher (Michaely & Roberts, 2012).
In turn, this could fuel a risk compensation requirement (Armstrong et al., 2011), eventually
leading to an in-optimal valuation. Third, according to theory, all firms and industries are
unique and each of them are thus affected by different mechanisms and market forces (value
drivers) (Ang, 1991; Balakrishnan & Fox, 1993; Fama & Jensen, 1985).
These challenges serves as my motivation to write this thesis, which leads to the following
research question:
What is a fair valuation of Lego?
Fair valuation is in this thesis defined as a valuation that tries to reduce information
asymmetry as well as model different scenarios.
2.3 Structure
Structure of the thesis is outlined below:
Chapter Content
Part I Introductory remarks Scientific framework
Part II Firm & market analysis Supporting data for valuation
Part III Budgeting & valuation Results
Part IV Concluding remarks Discussion & conclusion
Table 2-1 – Thesis structure
2.4 Methodology and delimitation
The reader of this thesis is assumed familiar with valuation, accounting, finance, statistics
and strategy. The case study approach to analysis is selected. While various valuation
methods and theories exist, the thesis does not discuss these due to the limited size of the
thesis. This is a limitation of the thesis. Instead, the thesis is based on valuation practice from
the book “Valuation: Measuring and Managing the Value of Companies”, McKinsey &

11
Company by Koller et al., (2010) as well as incorporates best valuation practice suggested
by Damodaran (2013).
Only LEGO A/S (Lego) is valued while affiliated entities, Kirkbi A/S, the
LEGO Foundation and LEGO Invest A/S2 are not included in the valuation. For the sake of
scope, this thesis will largely consider peer firms, Hasbro and Mattel as Lego’s competitors
and therefor only benchmark Lego against these two firms. Lego changed accounting
policies in 2007 to International Financial Reporting Standards (IFRS). A few numbers from
pre-IFRS periods are used if said change to IFRS do not impact results. In accordance
thereof, financial statement analysis only considers the period 2006-2015, while earlier
financial statements and numbers are included for historic perspective. All financial
statements are audited, except for various items in the financial statements for 2015 for peer
firms Hasbro and Mattel, as they were not published at the time of writing. Instead,
respective SEC 10-K filings with only minor unaudited items are employed. The overall
impact is considered minor or non-existent.
The strategic analysis employs data from before and after 2006-2015 even if the financial
statement analysis covers only the period 2006-2015. This is chosen for the thesis to provide
more perspective and thoroughness than otherwise possible.
Data of different type and origin has been collected and employed but the thesis lacks access
to primary data. Lego has declined requests for any information other than public record
information, such as external financial statements, and various third-party interviews with
the CEO of Lego. In contrast, and in a real world scenario, a prospective investor would in
the spirit of good due-diligence, require access to primary data such as internal financial
statements, inner workings, contractual obligations and more to reduce risk (Perry & Herd,
2004). In gist, a prospective investor would necessarily need to conduct interviews with
internal and external firm stakeholders, including management, employees, suppliers and
customers to illuminate potential problems as well as opportunities. A lack of access to
information about the inner workings of Lego such as internal financial statements and areas
of future strategic interest, will, all else equal, affect the valuation and may give a less
2 Organizational chart available in appendix 8.1

12
accurate valuation than would have been possible otherwise. Essentially, primary data
scarcity necessarily lead to a less thorough due-diligence than otherwise, which can result in
a market valuation surrounded with higher uncertainty.
Secondary data obtained involves market reports, third-party interviews, articles and various
websites. Typically, secondary data has the disadvantage of lower validity as the data is often
produced for other purposes than e.g. answering the research question at hand (Kvale &
Brinkmann, 2009). However, even though data is not produced with the sole purpose of
answering the research question, secondary data is used for obtaining perspective and
allowing for reflection. Before any data is used, a critical, though subjective assessment has
been employed and all data is used with the aim of answering the research question. Layers
of both quantitative and qualitative data are examined. Research data is considered a mix of
quantitative and qualitative data. Market reports are of statistical nature and may produce
skewed numbers.
Peer group analysis is comprised of the firms that Lego itself deems main competitors,
specifically US firms Hasbro and Mattel. Analysis of major patent infringement cases and
mainstream media have pinpointed a few additional competitors. However, it is deemed out
of scale and scope of this thesis to incorporate other firms for peer group analysis and data
usage, albeit many firms are competing with Lego in the arena “time spent in playing and
learning”. In relation hereof, Lego mentions for example the computer gaming industry as
a competing force (Knudstorp, 2014). The peer group analysis is limited to only two major
firms and calculation of values, such as beta and comparison of benchmark numbers are c.
p. limited in nature.
2.5 Scientific framework
2.5.1 Science theory
The underlying research methodology for this thesis is based on the neo-positivistic
paradigm described by E. Guba (1990). This paradigm reckons all questions have true
answers, but as human beings, we reckon it is impossible to verify whether an answer is in
fact true or not; human beings are affected, perhaps even constrained, by their values, beliefs,
emotions, cognitive abilities and other biological features. The end goal is always to reach
13
truth, but it is fully accepted that the truth is not verifiable with the neo-positivistic paradigm.
Other paradigms exist including positivism, which has different opinions on truth, but it is
out of the scope to deal in depth with these here. In contrast to the natural sciences, social
sciences rarely, if ever, allow one to put up a formula for predicting outcome of a given
scenario and expect it to hold true later or in different settings. To illustrate this, it is difficult
to predict the behavior of an entity, such as a firm – simply for the reasons that a given firm
is not a well-defined construct, comes in many forms and sizes, let alone has more or less
unpredictable behavior at any given time and in any given environment. In other words,
albeit an assumption, most firms are not part of a simple homogenous mass of similar size,
technology, competitive situation, and environment etc., and so firms naturally varies. In the
case of Lego, firm management might decide to increase production output, but it is not
easily predictable how, when, where or whether this will happen, let alone what impacts will
be. These challenges are in contrast to the underlying mechanisms of natural sciences like
physics and chemistry, which often adheres to the positivistic paradigm. In natural sciences,
a given object is typically well defined and described by laws, and therefore has very
predictable behavior in both time and environment, for example heating a water molecule to
100°C will cause it to vaporize under normal circumstances. The positivistic paradigm
subscribes to the idea that a true answer is obtainable (even by humans) – and in order to
verify truth any scientific postulate must be quantifiable, reproducible, objective and
unequivocal (Kvale & Brinkmann, 2009). In economic sciences, however, reproduction,
quantification and equivocality of scientific postulates can be a difficult venture, as entities
researched (like firms and markets) can exhibit a heterogeneity that develops and adjusts
over time. The behavior of such entities are therefore not easy – perhaps even impossible –
to fully determine antecedently. Instead, the researcher must rely to some extent on
prediction and forecasting instead (Kvale & Brinkmann, 2009). Friedman (1953) argued that
what really matters are empirical observations for comparison of predictions. The variation
within firms and industries may lead to scenarios where an external (or internal) factor, i.e.
value driver has an effect on one firm or industry, but perhaps less on others. A simplified
example hereof could be that age and educational level of children has a major influence on
revenue generated in one toy firm, where factors such as geography and income level may
play an impactful role in others. Deciding which value drivers are optimal to include for
valuation is therefore challenging. Furthermore, verification of empirical data can pose

14
challenges for reasons of the heterogeneity scenario described above; in philosophical sense,
if all firms are unique, a true empirical verification is impossible, as there is no prior and
equal firm to compare to. Instead, one must rely on similar (peer) firms and scenarios at best,
for comparison. Determining what information is relevant and accurate, adds an additional
layer of complexity. Contrary to the public firm, an unlisted one can itself determine – with
the exception of annual reporting and other mandatory regulated reporting - if, when and
how much data to disclose publicly. This leads to situations where one party may have more
information than others do. The point here is that information asymmetry (market
inefficiency) is likely to have an influence on valuation. In relation hereof, Healy & Palepu’s
(2001) review on empirical literature related to financial disclosures, information asymmetry
and capital markets, provides a number of relevant insights: Financial disclosure is linked to
firm ownership, stock performance and coverage by financial analysts. For example, it is
argued that analysts reduce market inefficiency, assumingly by the incorporation of timely
market data in forecasting models, in contrast to simple time series models (Brown & Rozeff,
1978; Fried & Givoly, 1982). On the other hand, financial analysts are arguably ‘burdened’
by incentive structures as for example was seen during the dotcom bubble, where analysts
hyped the securities they owned themselves (Ljungqvist & Wilhelm, 2003). Moreover,
Healy & Palepu’s review tells us that financial disclosure is in general informative to
investors, but actual value of information varies with micro and macro factors and that
managerial choice of such disclosure is associated with capital market considerations,
contracting decisions as well as political costs. Hendrikse (2003, p. 158) mentions that
“informational advantage can be used at the other party’s expense”, which extrapolated to
valuation practice, can lead to in-optimal parameter estimations in the valuation model,
resulting in erroneous valuation. Simply put, an asset holder (e.g. Lego’s owners) could
choose to withhold information relevant to the investor and thereby achieve a higher
valuation price at the expense of an investor. The asset holder could for example choose to
withhold information about future growth, perhaps even exaggerate to achieve a better
valuation. On the other hand, if an investor believes not all information is available, the
investor could perceive the asset as more risky and rationally demand compensation. Various
studies have found empirical evidence that information asymmetry in fact impacts the
valuation of firms under imperfect market competitions by affecting the cost of capital factor
upwards (Armstrong et al., 2011; Lambert, Leuz, & Verrecchia, 2012). Similar findings by

15
Francis, Nanda & Olsson (2008) indicates that voluntary disclosures lead to a lower cost of
capital. In essence, the cost of capital factor is a measure of risk and can amongst others, be
used to discount future cash flows of assets for profitability evaluation purposes. According
to generally accepted economic theory, the higher a cost of capital factor the more risky an
asset is perceived and vice versa (Modigliani & Miller, 1958). Fons, Levy & Sarnat, Myers
(1994; 1994; 1968) concluded that most investors are risk averse thus requiring
compensation for risk taking. Juxtaposing a relationship between risk and compensation to
valuation, additional risk due to information asymmetry would result in a lower valuation at
the expense of the seller (e.g. Lego’s owners). However, not all investors are risk averse, but
instead have different risk attitudes and in accordance, compensation for risk-taking will
vary. As such, the valuation should reflect on the risk profile. Conversely, in perfectly
competitive markets, information asymmetry seems to have no effect on the cost of capital,
instead the average precision of data obtained by the investors is the driving force (Lambert
et al., 2012). The competitive landscape is therefore important to take into account when
conducting valuations, as the cost of capital factor might be influenced. Koller et al., (2010),
describes the principles behind valuation as a binary concept of value creation and value
conservation, where the driver of value creation is a mix of growth and return on invested
capital (ROIC) relative to cost of capital and furthermore, that cash-flow decreasing
activities destroy value. It then follows that such value creating or destroying activities in
relation to firm value must be constrained by the dynamics of the market environment in
which the firm operates. I will therefore assume a cause-and-effect relationship between
drivers of value creation/destruction and a given firm is deterministic of valuation. It follows
then, that a correct identification and estimation of value drivers will cp. provide a true
valuation as correctly identifying and estimating these value drivers will allow for zero
residual effects. However, correct identification and estimation is not an easy undertaking,
and perhaps even impossible considering that in theory an infinite amount of possible value
drivers can affect a given firm. In addition, when implications of the aforementioned
information asymmetry, human bias and neo-positivistic mindset is reviewed, the result is
basically that one cannot know whether the valuation is correct, but instead should assume
the valuation is likely encompassed with errors. A simple equation to illustrate the cause-
effect relationship mathematically can be written like so:
lim→
∓∞for all
(1)

16
Own creation
For a given time, , is a single true and fair value of a firm, comprised of a correctly
estimated amount of -value drivers, and remainder as possible residual effects
(information asymmetry). For V to be true and fair, there be must zero residual effects. Due
to infinity (i.e. an infinite amount of possible value drivers), it will be impractical to ever
reach a true and fair value of a firm using equation (1), as verification and a result is
impossible to obtain if one can continue to add more parameters that may affect the
valuation. Further, the equation results in at least a few more mathematical implications such
as negative values of suggesting that an investor would require payment in order to acquire
the asset or firm. In addition, problems about negative and positive infinity springs to mind.
For practical reasons, ignoring infinity is required but in general it is out of the scope of this
thesis to deal with these implications for conveying the assumption that, the more of correct
value drivers identified, all else equal, a with less uncertainty can be calculated. In simple
terms, the equation suggests that the more correctly interpreted data ( -value drivers)
obtained, the higher accuracy of can be achieved, whereas unexplained phenomena and
information asymmetry (i.e. untrue valuation), is captured in the residual . Applying
equation (1) to an illustrative example could yield the following:
amountofcustomers*customerexpenditure*averagebuyingrate
futureperformance= USD 10bn (2)
As can be seen from the example, a few parameters are included to calculate a valuation but
it is impossible to empirically verify whether residual effects are present or not, thus failing
to conclude if this model provides true and correct valuation. Equation (1) implies that a
valuation could be over-, underestimated or correct depending on the value of . The
following table serves an illustration of this implication between the valuation and residual
effects in economic terms in equation (1):
Residual effects Valuation
Overestimated
Underestimated
True
Table 2-2 – Valuation reliability vs. residual component
Correlation between residual effects and valuation reliability if residual effects are measured in economic terms. Own creation.

17
This is in line with the neo-positivistic paradigm, where it is generally accepted that a
phenomenon (here in relation to value drivers) is impossible to describe in complete even if
the phenomenon in itself is complete (Cook, Campbell, & Day, 1979). Adhering to the neo-
positivistic mindset, the result is a situation, where it is considered impossible to verify
whether a valuation is correct or not, even when the contract between two parties is agreed
upon. Instead, one is necessarily forced to assume presence of residual (unexplained) effects
– and in equation (1), this effect is captured with the component. Juxtaposing this to
real life, a valuation is no better than the due diligence behind. Applying the positivistic
mindset, the proposed equation (1) could instead look like this, having no
unaccounted/unexplained phenomena :
(3)
Own creation
With the aforementioned problems of quantification, reproducibility, objectivity and
indisputability of scientific postulation that are required to use this equation, it will simply
not be applicable in the social sciences for mentioned reasons. Considering the applicability
of equation (3) with the neo-positivistic mindset will cause problems, as verification of
whatever result (valuation), is still impossible. Even though equation (3) is a construct that
try to explain a correlation between valuation and value drivers, it might not even be valid
in the first place – i.e. results might not be reproducible at all. E. Guba (1990) argued in the
sense of epistemology that the ideal of the neo-positivist is to seek objectivity and to try to
minimize human bias. Guba further argued that in order to approximate this, benchmarking
and applying multiple methods for scientific investigations is essential. In addition, any
scientific investigations should occur in natural settings.
A term from the field of entrepreneurship coined discontinuous innovation
(DI) describes a theory that when one acquires and examines knowledge, new ideas are
formed in the process (Gertsen, Lassen, & Hansen, 2008). This process is often non-linear
but instead argues for iteration and re-iteration. Juxtaposed to the realm of due diligence and
valuation the result of the DI process could be that e.g. new markets, different forecasting
methods and predictions are developed during knowledge acquisition process (Carrero,
Peiro, & Salanova, 2000; Damanpour, 1996). The DI methodology is typically applicable
for investigation of new business ideas and developing businesses from “ground up”
18
(Veryzer, 1998). In order to test and benchmark assumptions about the future of a firm like
Lego, i.e. budgeting and forecasting, an iterative tactic such as the discontinuous innovation
approach is assumed useful, as it will allow one to modify and adapt the assumptions along
the way. The DI approach inspires for creation of knowledge and can possibly help to
illustrate drawbacks, advantages, and opportunities of a given firm, perhaps resulting in a
more complete valuation. On the other hand, the DI approach is a balance between
objectivity and subjectivity in the sense that, the DI operator could manufacture own ideas,
i.e. thinking too much out of the box in a given situation instead of adhering to factual data
at hand. In such situations, the quality of acquired knowledge could suffer and thereby affect
the quality of the valuation. It is paramount to highlight that the DI approach is only applied
in general, all while adhering strictly to the principles of reliability and validity in order to
obtain quality and robustness of the thesis. Reliability deals with the question of
reproducibility i.e. can the same result be achieved again at a different point of time by other
researchers? Reliability of data that stems directly from people, goes against the quest of
reaching objectivity; people might be affected by the settings in which they provide an
answer to a certain question and today’s answer might not be the same as tomorrow’s, thus
violating the rule of reliability. Further, the DI operator may introduce bias – both in the
interpretation phase but also when acquiring data. Validity asks the question if a method is
actually investigating what it claims, i.e. can a conclusion be obtained using the specified
method. Conversely, the quality criteria for the neo-positivist does not stop with reliability
and validity but also requires a discussion of any challenges emerged in the quest to honor
these criteria. Accordingly, the valuation will be benchmarked with sensitivity analyses,
calculated with various methods and any challenges in relation to obtaining quality requires
discussion and reflection. Even with these precautions, it is imperative to realize that whether
the valuation is correct or not will be impossible to determine but instead a fair valuation can
be proposed.
2.5.2 Reflection on models for strategic analysis
Grant argues that successful strategies can be measured by ‘implementation effectiveness’
of “simple, consistent, long-term goals”, a “profound understanding of the competitive
environment”, and “objective appraisal of resources” (2010, p. 12). This serves as the
underpinnings for the strategic analysis (as well as the financial analysis). To highlight non-

19
economic factors that are thought to lead to value creation (or destruction), strategic
perspectives are included3 but only on a firm (micro-level) and market level (macro-level).
The analysis is in risk of providing full transparency for given reasons; 1) Lego’s large scope
and scale of operations with footprints in more than 140 countries, 2) due to the limitation
requirements of the thesis. Therefore, meso-level research is entirely avoided. As argued by
various scholars, every market and country have unique characteristics and conversely the
impact on Lego as a firm will vary with the market/country (Ang, 1991; Balakrishnan &
Fox, 1993; Fama & Jensen, 1985). Lacking access to primary data concerning each market
and detailed operations of Lego, such impact is assumed difficult to gauge apart from an
overall and general fashion. Since market size and other general industry data can be “easily”
obtained, strategic analysis on macro level is included but only where factors are deemed
highly relevant. Micro level data has to do with the internals of the firm and has in general
been easy to obtain as well. The contribution to value creation or destruction of both analyses
can be derived. However, I assume this can only at best be on a general level. In the selection
process of models, the Five Forces framework described by Porter (1979) was considered
for the meso level analysis to pinpoint supplier and buyer factors as well as the interrelation
between global and local aspects of firm and market. However, Five Forces focus solely on
the meso level to explain competitive advantage and value creation (destruction) and fails to
include macro and micro levels (Barney, 1995). Lack of meso level analysis, is assumed to
fuel the challenges with information asymmetry and may affect the valuation negatively. In
gist, the same argumentation may hold true for research for the macro and micro level, where
firm performance on a micro level market is unknown, and impact on firm in a macro level
context is unknown as well.
The discussion and analysis takes its onset from the concepts in the
STEEP/PESTLE framework for macro level and follows up with VRIN/VRIO for micro
level. The VRIN framework classifies a firm’s resources and capabilities by four parameters,
‘Value’, ‘Rarity’, ‘Imitation cost’ and ‘Non-substitutable’ to explain competitive advantage.
VRIN was originally described by Barney (1991, 1995) and later modified by Rothaermel
(2015) to VRIO to ask the question “is the capability/resource exploitable by the
Organization?”. An overview of the VRIO framework is provided here:
3 A generalized overview of the various levels which served as founded for the analysis is provided in appendix 8.2.

20
Valuable Rare Costly to imitate Exploitable by the organization Implication Economic performance
No Competitive disadvantage Below normal
Yes No Competitive parity Normal
Yes Yes No Temporary comp. advantage Above normal
Yes Yes Yes Yes Sustained comp. advantage Above normal
Table 2-3 – VRIO framework
Source: Based on Barney (1991, 1995) adapted by Rothaermel (2015, p. 105)
As can be seen from the table, competitive advantage and economic performance are
correlated to the four parameters. The most elementary resources/capabilities are financial,
physical and human capital (Robert M. Grant, 2010, p. 155) and as such the analysis will
take its onset there. Arguably, the VRIO framework can be seen as limited and simplistic
requiring only four parameters to describe competitive advantage and economic
performance. On the other hand, it is assumed a good fit to provide an overview of the
internals of Lego. Only resources/capabilities with attributes assumed at least ‘valuable’ are
included in the analysis, as it is assumed the economic performance of Lego is not ‘below
normal’ in the period researched.
Sometimes it is seen that other analyzes of firms include a ‘SWOT’ framework
in conjunction with, micro, macro and meso level analysis. The SWOT framework relates
internal and external environments in a ‘strength, weakness, opportunity or threat”
categorization. As argued by Grant (2010), the SWOT taxonomy is arbitrary in nature as
parameters can be seen from multiple angles, therefore making the framework limited. For
this reason, SWOT is excluded from the analysis.
2.5.3 Time Series Analysis
The following section will give a brief description of time series analysis. One of the
challenges that arise when working parameters of time nature is the involvement of future
aspects, making estimation and prediction difficult. In relation to valuation where ‘growth’
is one key component for value creation, it follows that optimal forecasting of growth is a
necessity in order to reduce residual effects. Time series data can be approximated with
various methods – among others are regression techniques and moving averages. However,
depending on data complexity like linearity, periodicity and randomness, not all methods
work equally well resulting in non-optimal approximation or increased residuals (Newbold,
Carlson, & Thorne, 2010). Moreover, time series data can exhibit large random fluctuations
21
and applying regression methods to such data for forecasting can lead to a low coefficient of
determination. In turn, phenomena such as fluctuations and randomness may fuel the
perception of information asymmetry which all else equal will decrease firm valuation. The
following section will dive into forecasting of time series by exploiting Fourier analysis.
2.5.3.1 Fourier analysis in brief
The idea behind Fourier analysis is to transform any data in the time series domain into a
frequency domain. This transformation is generally referred to as a Fourier Transform (FT).
FT are often applied within physics, chemistry and engineering but in economics it has found
practice too, including option valuation (Carr & Madan, 1999), demand forecasting (Fumi,
Pepe, Scarabotti, & Schiraldi, 2013) and modelling of inflation rates (Omekara, Ekpenyong,
& Ekerete, 2013). Fourier analysis is attributed to the French mathematician Jean-Baptiste
J. Fourier, whom discovered some 200 years ago that general functions can be described as
a sum of sinusoids (Coppel, 1969). The beauty of the discovery by Fourier is that many
functions, even complex functions with seemingly stochastic features, can be approximated.
FT works by employing algorithmic decomposition of data from the time series domain to
complex numbers, which are eventually transformed into frequency domain data comprising
amplitude, phase and frequency (Matsuda, 2004). Applied correctly, the FT can reveal
periodicity or harmonic oscillations in the transformed data (Bloomfield, 2000; Duhamel &
Vetterli, 1990; Fumi et al., 2013). The periodicity can then be factored into the valuation
model, if appropriate. Algorithms for calculating the FT exist in many variants typically with
the goal of being computationally fast, hence referred to as Fast Fourier Transform (FFT)
algorithms (Bloomfield, 2000; Duhamel & Vetterli, 1990). For this thesis, computer
programs, Microsoft Excel 2013 (Excel) and MathWorks MATLAB R2015a (Matlab) are
used interchangeably for Fourier analysis while the FT was done solely in Matlab for
algorithmic consistency. Before demonstrating the applicability of Fourier Transform of
functions, a few concepts related to Fourier analysis and the study of functions are described.
2.5.3.1.1 Wave, frequency, amplitude and phase
When transforming time series data into a frequency spectrum, trigonometric functions sine
and cosine are used. A brief brush-up on basic trigonometry is included to serve as a
foundation for the more advanced concept of Fourier analysis. Time series data or signals
22
can be viewed as wave functions, and in turn simple circles. Circles can be measured in angle
degrees, e.g. 360 degrees for a full circle. However, for the sake of simplicity when working
with Fourier analysis, it is convention to use radians instead of degrees to measure circles. 1
circle of 360° is equal to 2 radians, i.e. 360° 2 ∗ 3.14159 6.28319 , then
1 ° 57.2958°, and 1°°
0.01745 .
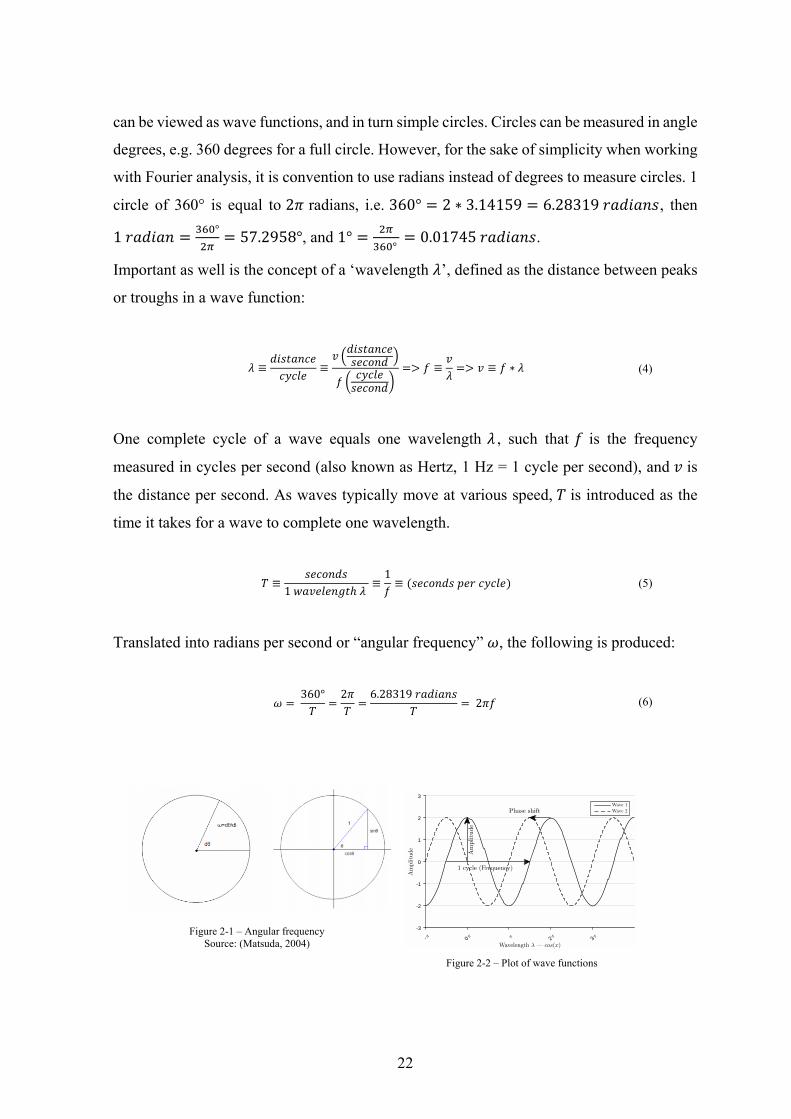
Important as well is the concept of a ‘wavelength ’, defined as the distance between peaks
or troughs in a wave function:
≡ ≡ ≡ ≡ ∗ (4)
One complete cycle of a wave equals one wavelength , such that is the frequency
measured in cycles per second (also known as Hertz, 1 Hz = 1 cycle per second), and is
the distance per second. As waves typically move at various speed, is introduced as the
time it takes for a wave to complete one wavelength.
≡1
≡1≡ (5)
Translated into radians per second or “angular frequency” , the following is produced:
360° 2 6.28319
2 (6)
Figure 2-1 – Angular frequency Source: (Matsuda, 2004)
Figure 2-2 – Plot of wave functions
Wavelength λ — cos(x)-π 0π π 2π 3π
Amplitude
-3
-2
-1
0
1
2
3
Amplitude
Phase shift
1 cycle (Frequency)
Wave 1
Wave 2

23
Figure 2-1 shows the relation between angular frequency and circles, as well the relation
between angle and periodic sine and cosine waves. Figure 2-2 shows samples of two
cosine waves both with a frequency of 1 Hz. Wave #1 starts at 0.5 and completes
full cycle at 1.5 , and again 1.5 until 3.5 and so on. Wave #2 shows the same
wave function just shifted left to 1.5 , meaning that the wave starts earlier. This shift is
referred to as a phase-shift and can be in any direction. In generalized format, wave functions
can be described mathematically (Young, Freedman, Ford, Sears, & Zemansky, 2012, p.
477):
∗ cos 2 ∗ cos (7)
Where is the amplitude and is the phase (starting point in radians). In other words, the
amplitude reveals the magnitude or height of the wave function, phase-shift indicates starting
point, and frequency determines the harmonic occurrence. Combining frequency and
magnitude reveals pattern(s), which then can be used for inputs in forecasting. The wave
functions in figure 2-2 can be described mathematically by the following:
2 ∗ cos 2 ∗ 1 ∗ 1 0 2 ∗ 2 ∗ 1 ∗ 1 1.5
Calculating angular frequency for we get 2 ∗ 1 2 or 2 radians per
second. yields the following: 1 second/cycle. An arbitrary wave of e.g. 12
Hz, gives 24 75.396 per second and period
0.0833 seconds/cycle. Fast forwarding, an adapted generalized form of a Fourier
transformed time series is shown below (Davis, 1941, p. 63),
cos sin (8)
12
(9)
1cos (10)
1sin (11)

24
where is a point in time and a function is comprised of a mean term and sum of
harmonic components, cosine and sine waves. The challenging part is to model , and
coefficients and as can be seen, the FT decomposes time series data into a sum of
sinusoids revealing the coefficients. The coefficients are represented by complex numbers.
The basic intuition behind above definitions is this: Let2 2 ⟹ , meaning
equals one half-cycle keeping in mind that 2 is full cycle of a given wave. By integrating
from – → , a full cycle of the time domain function (i.e. from – → 0 and from
0 → , in total 2 2 ) can be transformed and represented as frequency, amplitude
and phase. Next, the sampling rate Hz (samples/second) is important to consider as well,
as incorrect sampling rate can distort the approximation of FT. This distortion is referred to
as aliasing and may be avoided by using only half (N/2) of the sampled data (N) according
to the Nyquist-Shannon rule (Matsuda, 2004, p. 62). This rule is not described however as it
is out of scope.
1Δ
(12)
Now, the list of complex numbers produced by the FT, needs treatment to extract phase and
amplitude. Excel contain simple functions to extract phase and amplitude from
complex numbers , although Matlab can be used as well but Excel was chosen for
simplicity:
(13)
/2 (14)
Where IMARGUMENT returns the angle degree in radians equal to tan / or phase
, where is the imaginary coefficient of the complex number and the real, e.g.
"10 12i" 0.876 radians. IMABS returns an absolute value, such that
IMABS is equal to √ , e.g. "10 12 " 15.621 , which yields the
amplitude. Conversely, it is out of the scope to dive more into the mathematical definitions
here. Instead, this thesis rely on the computational power of Matlab and Excel to do the “hard
work”. All calculations are available in the Excel file.

25
2.5.3.1.2 Fourier Transform applied on constructed data
Below, in figure 2-3, are so-called periodograms (FT Periodogram) of various
transformations into the frequency domain using samples of time series data, i.e. the ‘Raw
Plots’. Although the time series are artificial functions that resembles perhaps unreal data in
relation to valuation, the capabilities of the Fourier Transform is evident, I believe. The
periodograms reveal a clear indication of periodicity, i.e. recurring events that “stand out”.
In the periodograms this is shown in the form of peeks at different frequencies (x-axis) of
some magnitude (y-axis) corresponding to the original functions. Such data recurrence will
‘ceteris paribus’ increase reliability in the forecasting model, if one knows that in ‘x’ time
‘y’ will reoccur, e.g. an interest rate may drop/increase or sales will go down/up and so on.
Plot # ∗ Raw Plot FT Periodogram
1) 1 Hz (1 amp) No Gaussian noise
0 1 2 3 4 5 6 7 8 9 100
100
200
300
400
500
600
2) 100 Hz (2 amps) 12 Hz (1 amp) No Gaussian noise
3)
100 Hz (2 amps) 12 Hz (1 amp)
+ 6 * Gaussian noise
0 500 1000 1500 2000 2500 3000-25
-20
-15
-10
-5
0
5
10
15
20
25
12 20 40 60 80 100 1200
200
400
600
800
1000
1200
1400
4) Pure Gaussian noise
0 50 100 150 200 250 300 350 400 450 5000
1
2
3
4
5
6
7
5)
1.2 Hz (1 amp) 0.8 Hz (2 amps) + 1 * Gaussian noise
0 500 1000 1500 2000 2500 3000-6
-4
-2
0
2
4
6
0 0.2 0.4 0.6 0.8 1 1.2 1.4 1.6 1.8 20
500
1000
1500
2000
2500
3000
0 500 1000 1500 2000 2500 3000-1
-0.8
-0.6
-0.4
-0.2
0
0.2
0.4
0.6
0.8
1
0 500 1000 1500 2000 2500 3000-3
-2
-1
0
1
2
3
12 20 40 60 80 100 1200
200
400
600
800
1000
1200
1400
1600
1800
0 500 1000 1500 2000 2500 3000-4
-3
-2
-1
0
1
2
3
4

26
Figure 2-3 – Plots of sample wave functions and periodograms
All functions were mapped in 3 second windows using a sampling rate of 1,000 – in total 3,000 samples to avoid aliasing although the sampling rate could easily be less given the simple constructed signals. The source code is available for inspection in Appendix 8.3.
In accordance with the science theory, the FT shown here was ‘stress tested’ by introducing
Gaussian noise4 in some of the time series. While the raw plots containing Gaussian noise
look random, the randomness is downplayed at varying degrees in the corresponding
periodograms and instead indications of harmonic data are displayed. As specified, the
functions plotted are known beforehand to contain periodicity so the revelation by the FT
does not come as a surprise. In real life, however, a mathematical notion of a wave function
for time series is typically not revealed so periodicity is not quantified beforehand. In gist,
FT is only able to approximate a function as well as reveal an approximate periodicity if any
(Matsuda, 2004). In other words, FT could be thought of as “function approximation”. As
mentioned earlier, FT has successfully been applied on real life economic data, as well as
being used extensively in the physics and engineering fields. In contrast to the rest of the
plots in figure 2-3, the time series data in Plot #4 consists of pure Gaussian noise. By using
visual inspection, it would be easy to conclude that the wave function is random, as there are
many peeks shown and none are distinct. In accordance with the validity criteria and instead
of relying solely on visual inspection, the analysis use proven statistical methods to test data
and quantify randomness. The next section will briefly describe the methods selected to
check for randomness in time series data.
2.5.3.1.3 Testing for randomness
To check time series for randomness (white noise), a null hypothesis is created, i.e. “is
the data white noise”. As shown by Davis and Fuller (1941; 1996), Fisher’s Kappa (FK) test
statistic (Fisher, 1929) can be used to test for randomness. The equation below is from Fuller
(1996, p. 363),
1m
or adapted 1 2 ∗
∑ (15)
4 Matlab’s built-in function to produce randomized noise from a standard normal distribution was used

27
where is the largest periodogram value of a sample with periodogram values having
two degrees of freedom. The FK test statistic is compared against the Fisher distribution in
Fuller (1996, p. 364). In similar fashion, Bartlett’s Kolmogorov-Smirnov (KS) test statistic
to test for white noise is employed (Massey, 1951; Smirnov, 1948). The KS test extracts
similarity value between two distributions ( and ) and reveals the maximum
discrepancy between the two:
| | (16)
is then compared against critical values to either reject or accept the null hypothesis. KS
critical values are calculated using ‐leve l 5% = 1.36
and ‐leve l 1% =
1.63
(Massey, 1951; Smirnov, 1948). FK is generally better at handling a single
sinusoid that is noise-buried, while KS is more sensitive to broad discrepancies in the white
noise spectrum (Massey, 1951; Shimshoni, 1971). It is therefore expected that small sample
sizes may yield mixed results. For these reasons, both tests are conducted in the practical
part of analyzing time series data in later chapters. If both the FK test statistic is larger than
a threshold value at indicated ‐levels, and the KS test statistic as well exceeds threshold
values, then is rejected and further analysis using Fourier Transform is avoided. Critical
values for KS was taken from Massey (1951). For FK critical values, it was necessary to run
a custom created software program to create a distribution table for the purpose, as published
tables (Fuller, 1996; Nowroozi, 1967; Shimshoni, 1971) lacked critical values for the data
sizes investigated. The source code for the software as well as the FK distribution table are
located in Appendix 8.4 + 8.5. In reference to the sample plots above in figure 2-3, the
following results are revealed, where the test statistics were calculated on the sample
functions to illustrate applicability of white noise testing:
Plot Function Fisher’s Kappa Kolmogorov-Smirnov Outcome Critical values
Plot #1 1 Hz (1 amp) No Gaussian noise
1499.000 (<0.0001)
0.999 (<0.0001)
Reject H0
Fisher’s Kappa: 5%:10.9610 1%:12.585
Kolmogorov-Smirnov:
5%:0.02483 1%:0.02976
Plot #2 100 Hz (2 amps) 12 Hz (1 amp) No Gaussian noise
1199.200 (<0.0001)
0.800 (<0.0001)
Reject H0
Plot #3 100 Hz (2 amps) 12 Hz (1 amp)
+ 6 * Gaussian noise
68.146 (<0.0001)
0.048 (0.002)
Reject H0
Plot #4 Pure Gaussian noise 7.202
(0.675) 0.019
(0.653) H0 cannot be rejected

28
Plot #5 1.2 Hz (1 amp) 0.8 Hz (2 amps) + 1 * Gaussian noise
696.387 (<0.0001)
0.720 (<0.0001)
Reject H0
Table 2-4 – Fisher’s Kappa and Kolmogorov-Smirnov tests on sample functions
P-values in brackets. Critical values are shown for n=3000.
As outlined in Table 2-4, and in line with the expected results, FK and KS numerical analysis
produce the same conclusions as the visual inspection of the periodograms in Figure 2-3. All
plots except for Plot #4 show test values well above the critical values arguing for non-
randomness in the sampled time series data. These tests will be conducted in later analysis
and are deemed reliable in assessing the periodicity of time series data.
2.5.3.1.4 Inverse Fourier Transform
Once a wave function or signal is decomposed, it can be transformed back into a close
approximation of the original by taking the inverse of the FT. The following shows an
inverse Fourier Transform (IFT):
0 500 1000 1500 2000 2500 3000-1
-0.8
-0.6
-0.4
-0.2
0
0.2
0.4
0.6
0.8
1
Original raw dataInverse Fourier transform
Figure 2-4 – Inverse Fourier transform of sin(2 )
Samples, n = 3000
The inverse matches the original signal perfectly. To be fair, the wave function is simple and
has a large sample of periodic data. However, IFT of other signals with more stochastic
appearance is approximated nicely as demonstrated later in the case analysis. Both FK and
KS tests demonstrate capability at detecting randomness, and FT demonstrates capabilities
at extracting cyclical patterns. It being understood, however, that FT exhibits a few
challenges, 1) the FT is constrained by the stochastic features of the underlying data, and
therefore mixed results can happen and 2) forecasting with FT cannot be used to predict the
future but only at best yield an approximation based on historic data. On the other hand, FT
has shown to produce reliable results in other studies. In light of the science theory described

29
and given the above challenges, FT is benchmarked to determine which forecasting tool
provides better for the time series at hand.
2.5.4 Monte Carlo Simulation in brief
For conducting sensitivity analysis on results, a Monte Carlo (MC) approach (Metropolis &
Ulam, 1949) is used to provide a list of all possible scenarios within certain range. The range
is defined based on prior data, while keeping in mind the arguments by Brealey et al., (2011)
on the ‘Garbage-In, Garbage-Out’ principle. It is understood that MC scenarios generated,
are not based on the likelihood that a given scenario will or can happen in real life. The MC
simulation is provided purely in the sense of ‘what if scenarios’, rather than ‘reasonable will-
happen scenarios’. That being said, all MC scenarios modelled are based on parameters that
are assumed to be in “sensible” ranges, although results may not yield reasonable scenarios.
To try to achieve balanced MC scenarios, selected parameters in the MC simulation will
follow a standard normal distribution, albeit recognized that Lego may not be a suitable
candidate to follow such distribution at all.

30
PART II
Firm & Market Analysis
31
3 Strategic Analysis
The purpose of this chapter is to assess non-financial value drivers parameters that affect
Lego. These value drivers are kept in mind in later chapters to align budgeting and
forecasting models. Lego (LEGO A/S) is privately owned by Kirkbi A/S and the LEGO
Foundation. The Kirk family, third generation of the original founder, Ole Kirk Christiansen,
controls all entities. Lego operates in the industry for traditional toys and games5 on a global
scale and with a focus on the construction toys segment. Majority of the firm’s income stem
from the construction toys segment. A “rundown” of Lego, the firm’s history and growth
during more than 80 years of operation in the toy manufacturing industry is included and
considered important to help illuminate the inner workings of the firm in strategic
perspective later on. A description of the firm’s strategy, perspectives and possibilities is
incorporated. For a summarized overview of the Lego history, see Appendix 8.6.
3.1 Firm introduction
3.1.1 History of firm in strategic perspective
In 1891, Mr. Ole Kirk Christiansen (OKC), the yet-to-become-founder of Lego, was born as
the 10th son of an underprivileged family from Jutland. When OKC was still a young man,
his older brother trained him in carpentry. After a few years of training, OKC went abroad
for five years to further his skills and gain experience with the carpentry industry. In 1916,
he returned to set up a carpentry shop in Billund, Denmark called “Billund Maskinsnedkeri
og Tømrerforretning” (The Billund Carpentry Shop and Lumberyard). The carpentry shop
did general carpentry work, mainly building construction. During OKC’s time abroad, he
met his wife to-be, Kirstine Sørensen. Together they had four sons.
In 1924, two of the sons, Godtfred Kirk Christiansen (GKC) and Karl Georg
Kirk Christiansen played around in the carpentry shop with some wood shavings and a hot
glue gun. A fire was accidently started by the two boys and the carpentry shop and nearby
residence of the family was lost. Following the fire, OKC had an architect draw up plans for
a new and larger building featuring shop and residence for the family. During the 1920’s the
5 The thesis sticks to the definition from Euromonitor of the market. This is for consistency and to use numbers later on for forecasting and projection. “This is the aggregation of baby (0-18 months), infant (19-36 months), pre-school (3-4 years), construction, arts & crafts, scientific/educational, dressing up & role play, dolls & accessories, action figures & accessories, plush, model vehicles, radio/remote control toys, games & puzzles, outdoor & sports toys, ride-on vehicles and other traditional toys and games. Traditional toys and games are objects of play which do not involve a video game component. (Euromonitor, 2015d)”
32
carpentry shop became well-known for its quality work and despite a few larger projects
were commissioned, the business was often close to bankruptcy – mainly due to lack of
demand (Hughes, 2010). In perspective hereof, Billund’s population was only around 300 in
1930.
In 1930, the Great Depression reached Denmark shortly after the US Stock
Market crash in October 1929. The Christiansen family struggled even harder to survive with
almost no carpentry work commissioned. To relief the situation, OKC switched strategy
from general carpentry work and instead started to make minor households items, including
Christmas tree stands, stepladders, and more – all of which were mainly sold to farmers in
neighboring areas (Mortensen, 2012). 1932 turned out to be an eventful year in the history
of the Christiansen family; OKC’s wife dies leaving him to raise their sons alone. Same year,
a lightning strikes and the carpentry shop is once again lost in a fire. According to history
(Hughes, 2010; LEGO, 2012b; Mortensen, 2012), OKC found inspiration amidst the
‘challenging’ situation of being a single parent; by using some leftover wooden materials
from the carpentry shop he created a wooden toy for his sons to play with. He noticed his
sons enjoyed the toy – the basics for wooden toy manufacturing was established. Same year
(1932), GKC, now twelve years old, joins the family business.
Kiddikraft a competing British firm also started producing wooden toys. As
Lego had its struggling beginnings so did Kiddikraft and was also near bankruptcy mainly
caused by lack of demand (Saunter & Hughes, 2008). Besides wooden materials,
Kiddikraft’s founder, Mr. Hilary Fisher Page experimented with plastics as he was unhappy
with the wooden materials for “hygienic reasons” (Saunter & Hughes, 2008). As Page
described it much later (1946) “ [...] for generations we have tried to find some type of paint
or enamel which cannot be sucked or gnawed off, in view of the fact that practically every
toy or plaything given to a baby or a young child goes straight to his mouth. […] ”. In 1939,
Page filed a patent for the invention of the first plastic brick and would later be awarded
several other patents related to plastic bricks (Page, 1940, 1949).
In 1934, the Billund carpentry had grown to seven employees (Mortensen,
2012) and main products were toys and various household items – all made of wooden
materials. The firm took a name change to Lego Fabrikken Billund, Fabrik for Trævare og
Legetøj (The Lego Factory Billund for Wood ware and Toys). “Lego” is a contraction of the
two Danish words, Leg Godt (Play Well). Unbeknownst to OKC at the time, Lego is also

33
Latin for “to gather, collect, select”, and more loosely interpreted, “put together”. By 1939,
Lego had grown to 10 employees and for the first time, started to be profitable (LEGO,
2012b). World War II breaks out. Before the war, Germany was the largest exporter of toys
to Denmark. As the war intensified, German firms shifted to production of war related
equipment and German toy exports grinded to a halt. Danish toy manufacturing firms (Lego
and a few others) would eventually more or less occupy the entire Danish market space
themselves now that German firms had stopped exporting.
The 1940’s signals a pivotal point for Lego; in 1942, the firm had grown to 15
employees. The carpentry shop burned down for the third time6 and OKC decided to have a
new and larger building constructed – this time featuring assembly line production. By 1943,
Lego had grown to around 40 employees – still producing wooden toys and household items.
During the war, it was common with shortages of various raw materials including crude oil,
iron, coal and other materials. When the war ended, raw materials for plastic7 became readily
available again, and the demand for plastic surged, not only for toys but also in use for other
consumer items. Kiddikraft had at this point been working with plastic toys for almost a
decade and naturally had a head start. Kiddikraft introduced product lines called Sensible
Toys, including the Interlocking Building Cubes, also known as Bri-Plax. Mr. Page invented
the Bri-Plax and patented the building blocks before the war broke out.
In 1947, the arrival of a plastic injection-molding machine takes place at Lego
after OKC had seen a demonstration of the machine’s capabilities at a tradeshow. Soon after,
Lego began production and introduced its first line of plastic toys. Mr. Page visited Lego in
Billund and Lego received both samples and drawings of Kiddikraft’s toys. Lego (perhaps)
felt inspired as the firm two years later, in 1949, launched its own plastic bricks called the
Automatic Binding Bricks – which were remarkably similar to Page’s Interlocking Building
Cubes (LEGO, 1997). Arguably, the Automatic Bindings Bricks laid the foundations for the
“Lego Empire”, in the sense that majority of Lego’s products would later be based on the
concept of assembling and disassembling bricks for play and learning. Besides the
Automatic Binding Bricks, Lego continued to produce wooden toys but also a few other
plastic toys without the binding functionality. In 1948, Lego had grown to 50 employees. At
6 A short circuit in the electrical installations caused the fire. 7 Crude oil is the main component of plastic, but plastic includes other components as well that varies depending on the type of plastic

34
the end of 1949, the firm produced around 200 different plastic and wooden toy items,
including the Automatic Binding Brick.
In 1951, half of the firm’s output was plastic toys (Knowledge@Wharton,
2012) – most of the toys were not plastic bricks but instead larger plastic items such as plastic
cars and tractors. In 1953, Automatic Binding Bricks were renamed LEGO Mursten (“LEGO
Bricks”). However, only around 5% of total sales were LEGO Bricks (Saunter & Hughes,
2008) at that time. Two years later, the “System of Play” philosophy was born, which
essentially put Lego bricks into a more formal “play system” enabling play with multiple
but different Lego product sets at once. The aim was to increase value of play. The System
of Play idea was sparked after GKC met a toy buyer from Denmark who expressed concerns
that most toys were “[…] ’one-off’ items and […] no cohesive toy system available”
(Hughes, 2010). The philosophy of putting play in system was quite unheard of at the time
but GKC picked up the idea. Mr. Page did not take much notice of the LEGO Bricks, perhaps
because he was occupied with trying to successfully commercialize his own Bri-Plax
products at that time (Saunter & Hughes, 2008). After years of struggling financially with
his business, Mr. Page committed suicide in 1957. Kiddikraft, however, continued to operate
for another twenty years. In 1957, GKC was appointed managing director of Lego. By 1958,
Lego had grown to 140 employees. Same year, Lego was granted a patent for the “stud-and-
tube” coupling system that is used in Lego bricks today. The previous Lego bricks lacked
what Lego refers to as “clutch power”. Without clutch power, the bricks could easily fall
apart. With the stud-and-tube bricks (shown below) binding power between the bricks would
be stronger and at the same time be easy to assemble and disassemble.
Figure 3-1 – Kiddikraft cubes and Lego bricks
Left: Interlocking Building Cubes from Kiddikraft. Right: The Automatic Binding Brick from 1958 by Lego featuring studs and tubes for better interlocking mechanism than Lego’s previous bricks due to friction.
35
Looking at the figure above, the bricks look somewhat similar. Years later, Lego described
the design process as follows: “With the cooperation of a tooling works in Copenhagen, we
modified the design of the Kiddikraft brick, and molds were made. The modifications in
relation to the Kiddikraft bricks included straightening round corners and converting inches
to cm and mm, which altered the size of the brick by approx. 0.1 mm in relation to the
Kiddikraft brick. The studs on the bricks were also flattened on top.” (LEGO, 1997).
At the beginning of the 1960’s, Lego employed around 450 people and at the
end of the decade around 850. During that period, expansion continued with five new sales
offices in Europe, a production factory in Germany, and total sales in 42 countries. In 1960,
the wooden toys product lines were entirely discontinued after a fire stroke the wooden toys
manufacturing department for the fourth time in Lego’s history. By discontinuing the
wooden toys production, Lego became strategically more focused, as it now “only” had to
be concerned with plastic toys. Research of British manufacturing firms has shown that
product diversity does not equate profitability (R. M. Grant, Jammine, & Thomas, 1988).
Following the discontinuation of wooden toys, all non-“System of Play” toys were
discontinued entirely and upwards 90 % of the entire toy product line was removed (Kipp &
Robertson, 2013). When Lego closed down the production of wooden toys, GKC’s brothers,
Karl Georg and Gerhard set up a new firm called Bilofix, resuming wooden toys production
outside of Lego.
Lego established sales in the USA and Canada in 1961 via an exclusive license
and distribution agreement with Samsonite Corporation8. In 1965, Samsonite Corp. erected
a production facility in the USA entirely devoted to production of Lego toys. At this time,
production of Lego elements were globally 706 million. Due to a disagreement between
Lego and Samsonite, the license agreement ended in 1972. Instead, Lego established its own
sales office, to handle sales for the North-American market, although Samsonite kept
distribution rights for Canada until 1984. In 1968, Lego opened its first theme park called
LEGOLAND in Denmark – which was visited by more than 500,000 people in its first
season, and a combined 5 million visitors six years later displaying the interest for Lego.
In the 1970’s expansion continued – Lego had grown to 3,000 employees with
more offices and sales channels established around the world. In 1972, global production
8 Samsonite Corp. is today known for manufacturing luggage items and suitcases.

36
reached 1.8 billion Lego elements per year. In 1977, Kjeld Kirk Kristiansen (KKK), GKC’s
son, joins management of Lego. Kiddikraft was sold to Hestair, a conglomerate producing
various toys and consumer stationary. At this time, Kiddikraft had 30 patents, which Lego
acquired in 1981 in full as it entered legal battles with US firm Tyco9. In 1978, LEGO Mini
Figures were introduced. Mini figures are essentially miniaturized plastic figures of various
sorts like firefighters, police officers, astronauts and more. Simultaneously, the entire line of
Lego products were scaled to a more natural height/width ratio to be more in harmony with
the proportions of mini figures. Previously, without the scaling, Mini Figures products could
be taller than some product sets, for example buildings and machinery. The “scaling move”
may seem insignificant at first but before that, the interoperability/System of Play was not
optimal as the Mini Figures would not fit well with particular products and therefore take
away “play value” from owning certain product sets (Kipp & Robertson, 2013; D. C.
Robertson & Breen, 2013). With Lego’s strategic move to scale of all its product sets to a
common ratio, customers were now able to mix all product sets across product lines. The
key point here is that, the more product sets a customer bought even more value than
previously could now be derived by combining with previously acquired Lego sets.
Arguably, the scaling move further strengthened the System of Play, as all products would
now be proportional as well as compatible and playable across product lines.
In the years, 1978-1983 the firm showed a 14 % revenue growth every year.
KKK took over as CEO in 1979 and in 1983, the patent for the stud-and-tube coupling
system expired but the ideas described in the patent still remains the foundation for Lego
bricks sold today. Lego had grown to 3,700 employees worldwide and two years later in
1985 to 5,000 with the majority of the employees situated in Billund (around 3,000 in total).
Lego started a collaboration with the Massachusetts Institute of Technology Media Lab,
USA (MIT). The aim was to understand technology and learning processes better and to
enable Lego to introduce new products in the educational space. In 1986, the collaboration
enabled Lego to introduce its first learning product called “LEGO Technic Control” to
various schools in the USA. The product enabled users to program behavior of their Lego
constructions via a computer. The product however, required technical knowledge of
computers and programming and was not easily playable by students without a fair amount
9 Tyco was a firm marketing toy bricks similar to the Lego bricks

37
of learning. The introduction of Technic products in conjunction with computers marks
Lego’s first entry into the digital age. Also in 1986, GKC resigned as chair and KKK took
over. In 1987, Lego products were available in 115 countries and the firm had grown to
6,000 employees, all while steadily introducing new products. Overall the 1980’s signified
growth but also changes in the markets, including the advent of the digital age, shorter
product life cycles, consolidation among Lego’s larger customers and competitors
outsourcing (Lunde, 2012). According to Grant (2010), changes in demand growth and
technology over an industry’s life cycle, will naturally have implications on both competition
and competitive advantage for the players within said industry. Since the toy industry have
shown to be generally fast paced and short-cycled, it generally requires firms to foster a high
degree of innovation to avoid falling behind competition. In 1987, Lego internally indicated,
that the firm was in beginning trouble due to market changes all while employee growth and
revenue continued (Lunde, 2012). The trouble became evident in the 1990’s as Lego faced
economic turmoil and entered a decade signified by major strategic changes. In 1990, Lego
became one of the world’s 10 largest toy manufacturers (Mortensen, 2012), and had grown
to around 7,500 employees in 1991. In 1993, KKK steps down temporarily because of
illness; a constituted CEO takes over but no real leadership is evident (Lunde, 2012). Lego
continued on its growth path but profitability and revenue did not follow and were more or
less stagnant. From the side it became apparent to KKK that Lego required changes – in his
own words KKK described the organization as “rigid and too focused on reporting” (Lunde,
2012). In 1994, KKK recovered and returned to Lego. In his absence, Lego had grown to
8,800 employees but economic results were still lacking. Meanwhile, Lego continued to
spew out new products in steady pace. KKK returned to Lego with new ideas and a plan
called Compass Management. The sole purpose of this plan was to inspire for creativity and
revitalize energy within the firm. Compass Management also aimed at ending bureaucracy
and centralization, enabling employees to act more on their own. Despite full of good
intentions, the plan failed and was perceived by Lego employees as uninspiring and lack of
visions (Lunde, 2012). In an interview to a Danish media in May 1995, KKK said the
following about his thoughts for the next 10 years: “We will sell double of what we do today,
perhaps three times as much and our employee count will grow 50-100 %. Today, half of
our employees are in Billund - most of the growth will occur on the factories abroad –
Switzerland, USA, Korea etc. Hopefully will we at that time have opened four new
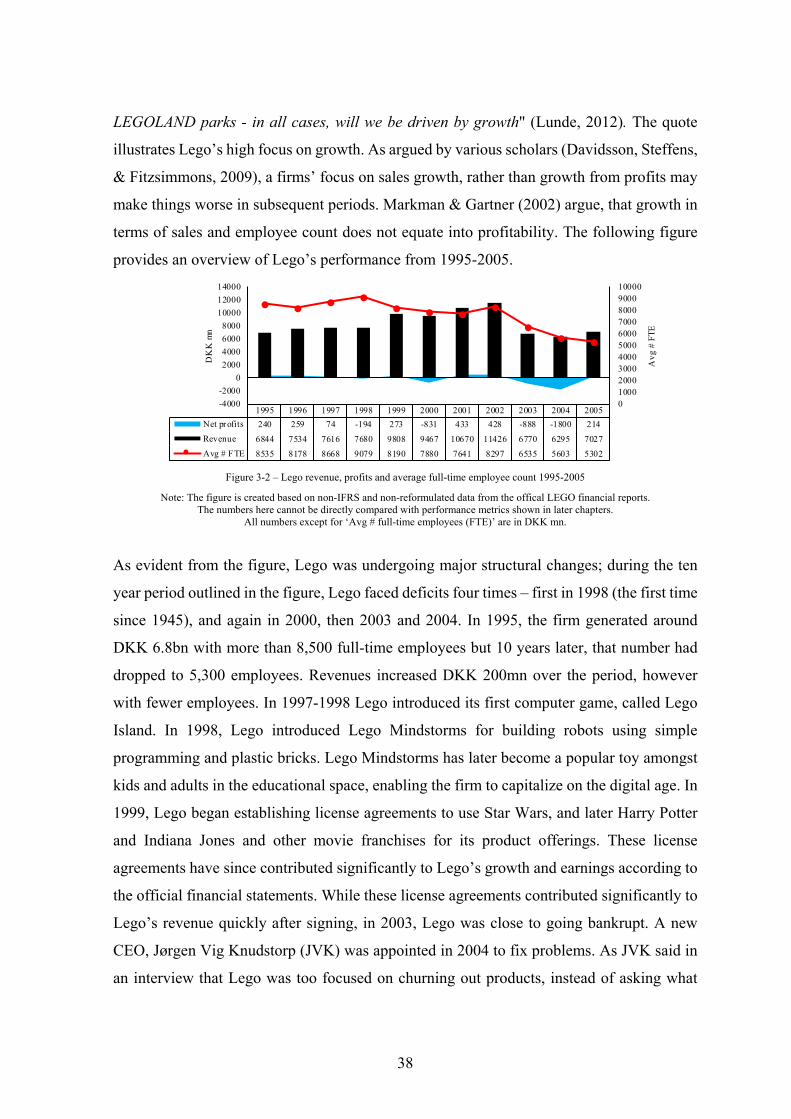
38
LEGOLAND parks - in all cases, will we be driven by growth" (Lunde, 2012). The quote
illustrates Lego’s high focus on growth. As argued by various scholars (Davidsson, Steffens,
& Fitzsimmons, 2009), a firms’ focus on sales growth, rather than growth from profits may
make things worse in subsequent periods. Markman & Gartner (2002) argue, that growth in
terms of sales and employee count does not equate into profitability. The following figure
provides an overview of Lego’s performance from 1995-2005.
1995 1996 1997 1998 1999 2000 2001 2002 2003 2004 2005
Net profits 240 259 74 -194 273 -831 433 428 -888 -1800 214
Revenue 6844 7534 7616 7680 9808 9467 10670 11426 6770 6295 7027
Avg # FTE 8535 8178 8668 9079 8190 7880 7641 8297 6535 5603 5302
010002000300040005000600070008000900010000
-4000
-2000
0
2000
4000
6000
8000
10000
12000
14000
Avg
# F
TE
DK
K m
n
Figure 3-2 – Lego revenue, profits and average full-time employee count 1995-2005
Note: The figure is created based on non-IFRS and non-reformulated data from the offical LEGO financial reports. The numbers here cannot be directly compared with performance metrics shown in later chapters.
All numbers except for ‘Avg # full-time employees (FTE)’ are in DKK mn.
As evident from the figure, Lego was undergoing major structural changes; during the ten
year period outlined in the figure, Lego faced deficits four times – first in 1998 (the first time
since 1945), and again in 2000, then 2003 and 2004. In 1995, the firm generated around
DKK 6.8bn with more than 8,500 full-time employees but 10 years later, that number had
dropped to 5,300 employees. Revenues increased DKK 200mn over the period, however
with fewer employees. In 1997-1998 Lego introduced its first computer game, called Lego
Island. In 1998, Lego introduced Lego Mindstorms for building robots using simple
programming and plastic bricks. Lego Mindstorms has later become a popular toy amongst
kids and adults in the educational space, enabling the firm to capitalize on the digital age. In
1999, Lego began establishing license agreements to use Star Wars, and later Harry Potter
and Indiana Jones and other movie franchises for its product offerings. These license
agreements have since contributed significantly to Lego’s growth and earnings according to
the official financial statements. While these license agreements contributed significantly to
Lego’s revenue quickly after signing, in 2003, Lego was close to going bankrupt. A new
CEO, Jørgen Vig Knudstorp (JVK) was appointed in 2004 to fix problems. As JVK said in
an interview that Lego was too focused on churning out products, instead of asking what

39
customers wanted and focusing on the core business (Knudstorp, 2014). JVK shifted the
view from growth to profitability. Lego outsourced major parts of its manufacturing
capabilities in 2006-2007 to Flextronics, a large manufacturing company in order to reduce
costs further. However, this led to quality issues in the production but also to the loss of
production skills – something which later was pointed out by JVK as part of Lego’s core
competences (Knudstorp, 2014). In light of this, Lego started insourcing manufacturing
again in 2008-2009 but this time with a higher emphasis on low-wage countries than
previously (Larsen, Pedersen, & Slepniov, 2010) to stay in ‘the game’ as competition were
increasingly using China and other low-wage countries for production of their toys.
In 2010, Lego introduced the online computer game “Lego Universe” based
on a part freemium / part subscription-based business model. The game reached almost 2
million users before it was shut down in January 2012. Despite positive feedback Lego was
unable to develop a “satisfactory revenue model” for the game (Simonsen, 2011);
essentially, majority of the 2 million users were non-paying with Lego only being able to
convert a minor fraction into paying users. In 2014, Lego released a movie franchise called
The Lego Movie in cooperation with Warner Bros. Pictures’ animation studio. The Lego
Movie had a high impact on Lego’s subsequent financial result and Lego stated that the
movie drove an increase in sales in the first half of 2015 by almost DKK 1bn compared to
the first half of 2014. A movie sequel is planned for 2017. In 2015, TT Games10 introduced
“Lego Worlds”, an online computer game franchising the idea behind Lego bricks, mini
figures and other elements from the Lego brand. Lego Worlds is similar to the popular
computer game called Minecraft. Minecraft was originally developed in Sweden but
acquired by the US computer software giant Microsoft in 2014 for USD 2.5bn. Both games
allow users to build and model digital worlds; Minecraft uses computer-modelled cubes, and
Lego Worlds uses computer-modelled Lego bricks. Media has commented that the
differences between the two games are hard to point out (Gilbert, 2015) while others see
LEGO Worlds as a more advanced computer game (A. Robertson, 2015). In September
2015, Lego launched the “Toys-to-life” product called LEGO Dimensions. Toys-to-life
products combine “offline” play with computer games. Other firms’ including Activision,
Disney and Nintendo have also launched products in the Toys-to-life genre. The Lego
10 Some of the Lego employees who originally developed LEGO Universe at Lego founded TT Games. In 2007, Warner Bros. acquired TT Games.

40
Dimension game was well received and provided a strong revenue boost for Lego during the
holiday season of 2015.
According to Lego, the firm’s main competitors today are American firms Mattel, famous
for Barbie products, and Hasbro with action figure products and board games like Monopoly,
Scrabble and Yahtzee. Though Lego mentions these firms as main competitors, other firms
such as the computer software giant Microsoft and the computer gaming industry are also
competing in the market for toys and playing. Table 3-1 gives an overview of Lego’s
economic performance from 2006 until 2015.
Performance - DKK mn - Dec 31 2006 2007 2008 2009 2010 2011 2012 2013 2014 2015
Revenue 7798 8027 9526 11661 16014 18731 23405 25294 28578 35780
Δ % 3% 19% 22% 37% 17% 25% 8% 13% 25%
Gross profit 4957 5606 6678 8459 11956 13653 17176 18469 21270 26820
Δ % 13% 19% 27% 41% 14% 26% 8% 15% 26%
EBITDA 1263 1752 2465 3403 5687 6422 8749 9268 10826 13538
Δ % 39% 41% 38% 67% 13% 36% 6% 17% 25%
EBIT 1325 1499 2175 2974 5081 5785 8095 8504 9879 12457
Δ % 13% 45% 37% 71% 14% 40% 5% 16% 26%
NOPLAT 1334 1104 1608 2288 3890 4372 6077 6359 7360 9459
Δ % -17% 46% 42% 70% 12% 39% 5% 16% 29%
FTE 4908 4199 5388 7286 8365 9374 10400 11755 12582 13974
Δ % -14% 28% 35% 15% 12% 11% 13% 7% 11%
Yearly production (in billions) 19 20 25 31 36 36 46 55 60 72
Revenue (DKK) / element 0.41 0.40 0.38 0.38 0.44 0.52 0.51 0.46 0.48 0.50
Δ % -2% -5% -1% 18% 17% -2% -10% 4% 4%
Table 3-1 – Overview of performance, Lego 2006-2015
All production numbers are averaged, and 2007-2008 production numbers are estimated. Economic data is reformulated. The reformulation model employed is explained in later chapters. Numbers are rounded for display.
As can be seen from the table, Lego has shown consistent growth since 2006 quadrupling
the top-line, and almost eight doubling the bottom-line, while setting records each year in
the history of Lego. Employee count went from around 5,000 employees to almost 14,000
full time employees. While Lego generates revenue on other products than Lego plastic
elements, an isolated view on its revenue (DKK) per plastic element indicates that for each
element produced, Lego generates around DKK 0.5, equivalent to an almost 20 % increase
from 2006. Summing up the last 10 years since 2005, Lego has returned to profitability and
produced record-breaking results. Focus has shifted towards in-house production and
continued emphasis on quality and core business, more licensed franchises, digital offerings,
more of own shops, as well as more production facilities to cater for increasing demand. The

41
firm’s main activities are development, production, marketing and sale of play products
(LEGO, 2015a). The following section outlines the products that Lego is currently involved
with.
3.1.2 Products
Lego’s products are all targeted at persons aged from 18 months and up. According to the
firm, the core business offerings are, however, aimed at children in the age 18 months to 11
years old but in general, Lego’s products can be used by anyone, though it is not the focus
of the firm (LEGO, 2015b). All product ranges encourages play and aim to stimulate learning
and skills (LEGO, 2015b). These toys are also referred to as STEAM toys and are toys that
combine play with science, technology, engineering, arts and math. Other firms also produce
STEAM toys, which is covered in later sections. The range of products include both physical
products based on the traditional plastic bricks but also digital offerings such as computer
and smartphone games through third parties. Besides traditional bricks, Lego offers
additional compatible elements like plastic wheels, mini figures, motors, sensors and more.
Some of Lego’s product sets are based on movie franchises including Indiana Jones, Star
Wars as well as Marvels’ (owned by Disney) and DC Comics’ (Warner Bros.) super heroes’
themes featuring characters like Batman, Superman and others. The table below provides an
overview of the products.
Area Description Target (years)
Pre-school Duplo bricks 1.5-5
Juniors Brick sets as transitional products to convert Duplo users to Lego brick users 4-7
Classic Brick set without instruction manuals 4+
Play themes Brick sets based on movies, books, and stories 5+
Bricks & More Lego and Duplo bricks in bulk (buckets of bricks) 4+
Advanced Brick sets with a “technical touch” - for building e.g. cars, planes, and robots 10+
Education Products for class rooms and after school programs (pre-school, elem. and middle school) Students / teachers
Board games A combination of social play and bricks. Users build the games out of bricks, then play 7+
Digital Digital offerings for computers, smartphones and consoles 7+
Table 3-2 – Overview of Lego’s current product matrix
For the ‘Pre-school’ target group Lego offers the Duplo products. In essence, Duplo is
oversized Lego bricks (i.e. twice the size of standard bricks) aimed at 18 months - 5 year
olds. The dimension is an important aspect for that particular age group. The age is particular
known for putting toys in their mouth (Saunter & Hughes, 2008). The size of Duplo bricks
prevents the kids from swallowing the toys making Duplo safe to play with and therefore
42
allowing Lego to aim products at this market. Duplo bricks and standard bricks can be used
interchangeably as the stud-and-tube coupling between the two types are compatible. The
Classic product lines are simply product sets consisting of bricks but without the instruction
manuals that many of the Lego product sets feature – the aim is to inspire for creativity. Play
Themes comprise the largest product offering from the firm. Play themes are built around a
story, and include themes like the Star Wars universe, Jurassic Park and others, where some
are licensed and others developed in-house. Advanced offerings include Technic and
Mindstorms and are found in the STEAM toy category. The age range is from 10 years and
up and the products require more skill and time to assemble than the average brick sets.
Technic brick sets are bricks with technical features like pneumatic systems and motors.
Mindstorms enables the user to build and program behavior of robots by employing various
sensors for motion, sound and light. In addition, Mindstorms can be controlled with
computers and smartphones. Educational products are targeted at pre-school, elementary and
middle school students and teachers. Using a pre-developed curriculum in conjunction with
various Lego bricks, educational products teach topics such as math, language, architecture,
engineering, science and more and therefore falls within the STEAM category of toy
products. Board games comprise of games in the same spirit as Monopoly, Ludo and similar.
The difference here is that users have to build the games before they can play. Finally, Digital
offerings comprise computer and console games like Lego Star Wars, the relatively new
online game Lego Worlds and the Toys-to-life game, Dimensions. Dimensions is Lego’s
product offering that combines offline and online play in one concept. The product includes;
1) a computer game for popular gaming platforms 2) an interface between the computer (or
console) called a “Toy Pad” and 3) classic Lego bricks some of which contain near-field
communication technology that can be recognized by the computer game once moved to the
Toy Pad. The idea is that consumers build game characters in the real world that are then
playable in the computer game. The “starter pack” contains the three items described.
‘Upgrades’ can be added later on including new characters and options. Considering that the
starter pack is around USD 100 and additional packs are around USD 30 at the time of
writing, it is a relatively expensive product considering that the average toy price for example
is around USD 10 in the USA (Toy Industry Association, 2015). No computer games are
developed or owned by Lego itself, essentially leaving this part into the hands of others. TT
Games, owned by Warner Bros., is developing majority of the Lego franchise computer

43
games. The digital offerings are generally available on different platforms including
computers, tablets, and smartphones and popular gaming consoles like Sony PlayStation,
Microsoft Xbox and Nintendo Wii. According to Lego, the aim of the digital offerings is to
“provide digital content, play experiences, and tools that inspire and motivate children to
live and share stories of their own creation.” (LEGO, 2015b, p. 5).
3.2 Market environment
The following sections contain a discussion of risk factors and likely drivers of value
creation (destruction), which is assumed to affect Lego and in general the toy industry. As
Lego operates in the industry for traditional toys and games and more narrowly in the
category for construction toys both segments are considered when deemed relevant. An
outlook of the future is included. The analysis will correlate and serve as foundation for the
actual budgeting and valuation in later chapters. Factors such as currency fluctuations,
recessions, and impacts of corporate taxation are not included. While these characteristics
have impact on many, if not all, firms, they are assumed too general to describe here. The
discussion and analysis takes its onset at the macro level and follows up with a micro level
analysis.
3.2.1 Market outlook and competitive situation
According to Euromonitor, 60 different firms accounted for 50.20 % of the traditional toys
and games sub-segment equivalent to USD 43bn RSP in 2014. Private label firms (1.9 %)
and others (47.9 %) aggregated the rest. Using the Herfindahl–Hirschman Index (Herfindahl,
1950; Hirschman, 1945, 1964) to calculate firm concentration tells us that the traditional
toys and games industry ranges in perfect competition with the HHI = 2.81%11 for the top
60 firms and within this group, HHI equals 11.16 %, which still ranges in the perfect
competition category. The insight tell us initially that in order to stay profitable under these
market conditions, a high degree of innovation is required. However, competition amongst
11 The HHI number was calculated using the 60 largest firms’ market shares as reported by Euromonitor, accounting for 50.2 % of the total market shares. Euromonitor aggregates both ‘private label’ (1.9%) and ‘others’ (47.9%) which makes it impossible to calculate the HHI precisely. Nevertheless it is fair to assume the concentration ratio will go down as all numbers are reported in descending order. For calculations, please see appendix 8.11.

44
the largest firms tells us that the three firms (Mattel, Hasbro and Lego) combined cover
54.2% of firm shares, which c.p. increases the firm concentration ratio on supply side.
Firm HQ Products 200
8 200
9 201
0 201
1 201
2 201
3 201
4
Mattel USA Barbie dolls, Fisher-Price, Mega Bloks, STEAM toys
12.0 12.0 12.2 12.1 12.2 12.0 11.7
Hasbro USA Action figures, board games (Monopoly, Yahtzee) 8.5 8.7 8.4 8.2 7.8 7.8 8.0 LEGO Denmark Lego bricks, STEAM toys 3.6 4.3 4.9 5.5 6.3 6.8 7.5 BANDAI NAMCO Japan Various toys, video games arcades and anime 1.8 2.0 2.2 2.3 2.2 1.9 2.0 Takara Tomy Japan Action figures, STEAM toys 2.2 2.4 2.5 2.8 2.5 2.1 1.9
Vtech Hong Kong
Various infant learning toys 1.4 1.4 1.4 1.5 1.6 1.8 1.8
Hallmark Cards USA Crayola, greeting cards and gift cards 1.4 1.7 1.6 1.5 1.6 1.6 1.6 MGA Entertainment
USA Bratz dolls 1.3 1.2 1.3 1.4 1.4 1.4 1.4
Brandstätter Germany Playmobil 1.1 1.1 1.1 1.1 1.1 1.1 1.2 LeapFrog USA Interactive and electronic learning toys 1.0 1.0 1.1 1.2 1.3 1.3 1.2 Spin Master Canada Meccano STEAM toys, and other 1.0 1.3 1.5 1.3 1.1 1.2 1.2 Simba-Dickie Germany Various and plastic toys wooden toys 0.9 0.9 0.9 1.0 1.0 1.0 1.0
Table 3-3 – Market share in % for traditional toys and games
Own creation. The figure shows list sorted firm shares in percent from 2008-2014 (latest available data). The list covers 40 % of the worldwide market equivalent to USD 34bn Retail Selling Price (RSP12). Lego overtook Hasbro in 2014 in terms of revenue and the
numbers here reflect retail sales prices and cannot be compared directly. Source: (Euromonitor, 2015a)
The figure above shows the distribution of firms by market share in percent in the traditional
toys and games sub-segment, with various firms operating in the STEAM toys category and
thus in direct competition with Lego. As can be seen, Mattel, Hasbro and Lego captures four-
five times the market share compared to the nearest firm BANDAI NAMCO having “only”
2.0 %. As indicated, a large number of firms exist in the traditional toys and games sub-
segment. Other firms in the construction toys segment sell plastic bricks similar to those of
Lego as the main patents for Lego bricks have expired. Even with direct competition, Lego
remains dominant in the construction toys segment.
According to Lego (2015a), USA is the largest market for Lego, followed by the Western
Europe region. Those regions account for a combined projected sales volume of 70 %
(Euromonitor, 2015b). Major markets within the Western European region include UK,
France, Germany, and Italy, which in 2015 saw double digit growth (LEGO, 2015a). Lego
in China also experienced double digit growth in 2015 and is the single largest Asian market
for Lego (Euromonitor, 2015b). Central and Northern European countries followed by single
digit growth in 2015. Growth is expected to continue on Lego’s major markets in the coming
years, and Asia Pacific will contribute significantly as well.
12Euromonitor: “Historic regional/global values are the aggregation of local currency country data at current prices converted into the common currency using y-o-y exchange rates”

45
Top selling products in 2015 were core products (Lego Bricks and Duplo) but new products
like Lego Dimensions showed good performance as well (LEGO, 2015a) and is expected to
grow in the coming years. The most popular toy within the traditional toys and games sub-
segment are the Lego Brick products, which accounted for almost 8 % of the entire brand
share value RSP in 2014 (Euromonitor, 2015a). In addition, Lego bricks brand share RSP is
more than twice the size (USD 6058mn RSP) of the next competing product, Fisher-Price
from Mattel (USD 2823mn RSP). Mattel’s Mega Bloks account for around 10 % the size of
Lego’s total USD 6bn RSP but the Mega Bloks has been doubling over the period signaling
general popularity of the bricks ‘idea’. Historically Lego has dominated the construction
toys segment and is expected to continue capturing most of the market in the near future
(Euromonitor, 2015b). The following figure provides an overview of the most popular
products sold in the toys and games industry measured by USD mn RSP.
Figure 3-3 – Top products in the traditional toy and games industry
Own creation. 11 of the most popular products are included here – Mega Bloks is the smallest of them all. For more products and numbers, please refer to Appendix 8.7.
The values are provided are in USD mn RSP. Source data (Euromonitor, 2015a)
As can been seen from the figure, Lego Bricks are well ahead of competition when measured
on single product sales. Over the period, Lego is steadily growing. The figure above
illustrates that Lego continued to grow over the period, and that it has the single most popular
item in the toys industry.
According to the latest estimates from Euromonitor (2015b), the total (global)
market size in retail sales for toys and games is USD 151.2bn in RSP, whereas the traditional
toys and games sub-segment accounts for USD 85.1bn RSP including construction toys
accounting for USD 8.3bn RSP worldwide. The following figure shows projected growth
over the next 10 years, roughly indicating a yearly USD 2.7bn RSP growth in the traditional
01000200030004000500060007000
2008 2009 2010 2011 2012 2013 2014
USD
mn
Lego LEGO Fisher-Price Mattel Barbie Mattel Crayola Hallmark Cards
VTech Vtech Playmobil Brandstätter Hot Wheels Mattel Monster High Mattel
Playskool Hasbro Nerf Hasbro Mega Bloks Mattel
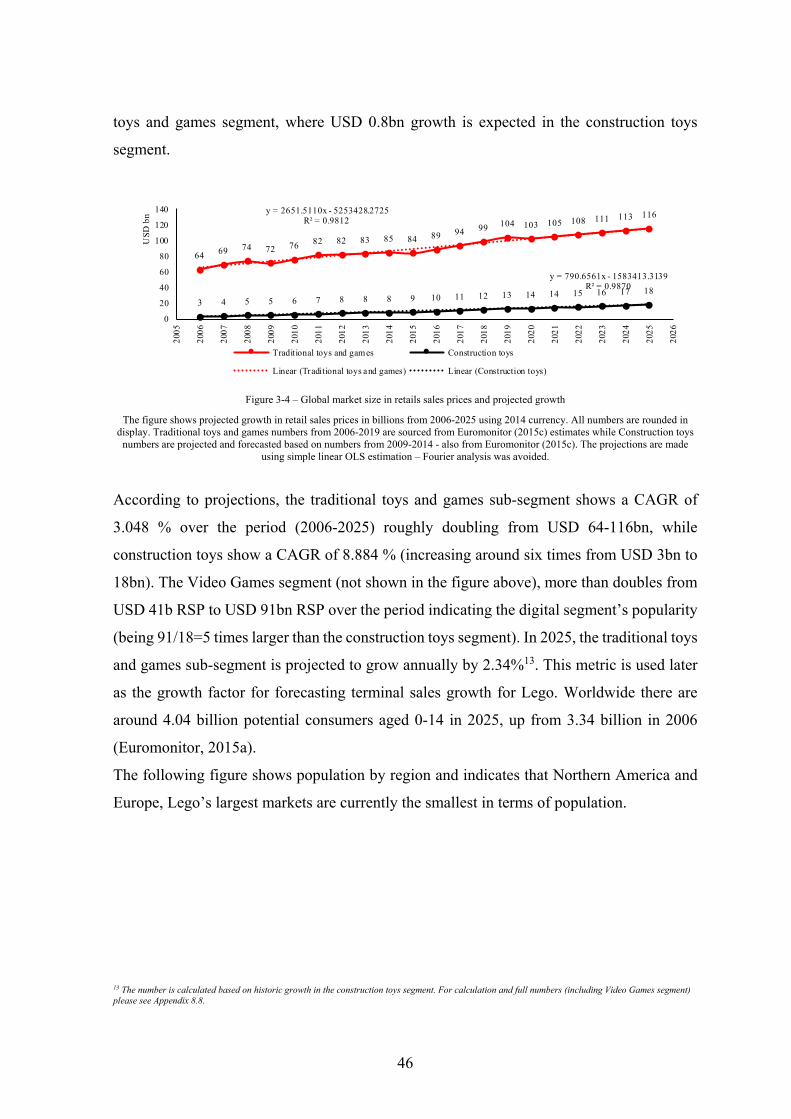
46
toys and games segment, where USD 0.8bn growth is expected in the construction toys
segment.
64 69 74 72 76 82 82 83 85 84 89 94 99 104 103 105 108 111 113 116
3 4 5 5 6 7 8 8 8 9 10 11 12 13 14 14 15 16 17 18
y = 2651.5110x - 5253428.2725R² = 0.9812
y = 790.6561x - 1583413.3139R² = 0.9870
0
20
40
60
80
100
120
140
200
5
200
6
200
7
200
8
200
9
201
0
201
1
201
2
201
3
201
4
201
5
201
6
201
7
201
8
201
9
202
0
202
1
202
2
202
3
202
4
202
5
202
6
US
D b
n
Traditional toys and games Construction toys
Linear (Traditional toys and games) Linear (Construction toys)
Figure 3-4 – Global market size in retails sales prices and projected growth
The figure shows projected growth in retail sales prices in billions from 2006-2025 using 2014 currency. All numbers are rounded in display. Traditional toys and games numbers from 2006-2019 are sourced from Euromonitor (2015c) estimates while Construction toys
numbers are projected and forecasted based on numbers from 2009-2014 - also from Euromonitor (2015c). The projections are made using simple linear OLS estimation – Fourier analysis was avoided.
According to projections, the traditional toys and games sub-segment shows a CAGR of
3.048 % over the period (2006-2025) roughly doubling from USD 64-116bn, while
construction toys show a CAGR of 8.884 % (increasing around six times from USD 3bn to
18bn). The Video Games segment (not shown in the figure above), more than doubles from
USD 41b RSP to USD 91bn RSP over the period indicating the digital segment’s popularity
(being 91/18=5 times larger than the construction toys segment). In 2025, the traditional toys
and games sub-segment is projected to grow annually by 2.34%13. This metric is used later
as the growth factor for forecasting terminal sales growth for Lego. Worldwide there are
around 4.04 billion potential consumers aged 0-14 in 2025, up from 3.34 billion in 2006
(Euromonitor, 2015a).
The following figure shows population by region and indicates that Northern America and
Europe, Lego’s largest markets are currently the smallest in terms of population.
13 The number is calculated based on historic growth in the construction toys segment. For calculation and full numbers (including Video Games segment) please see Appendix 8.8.
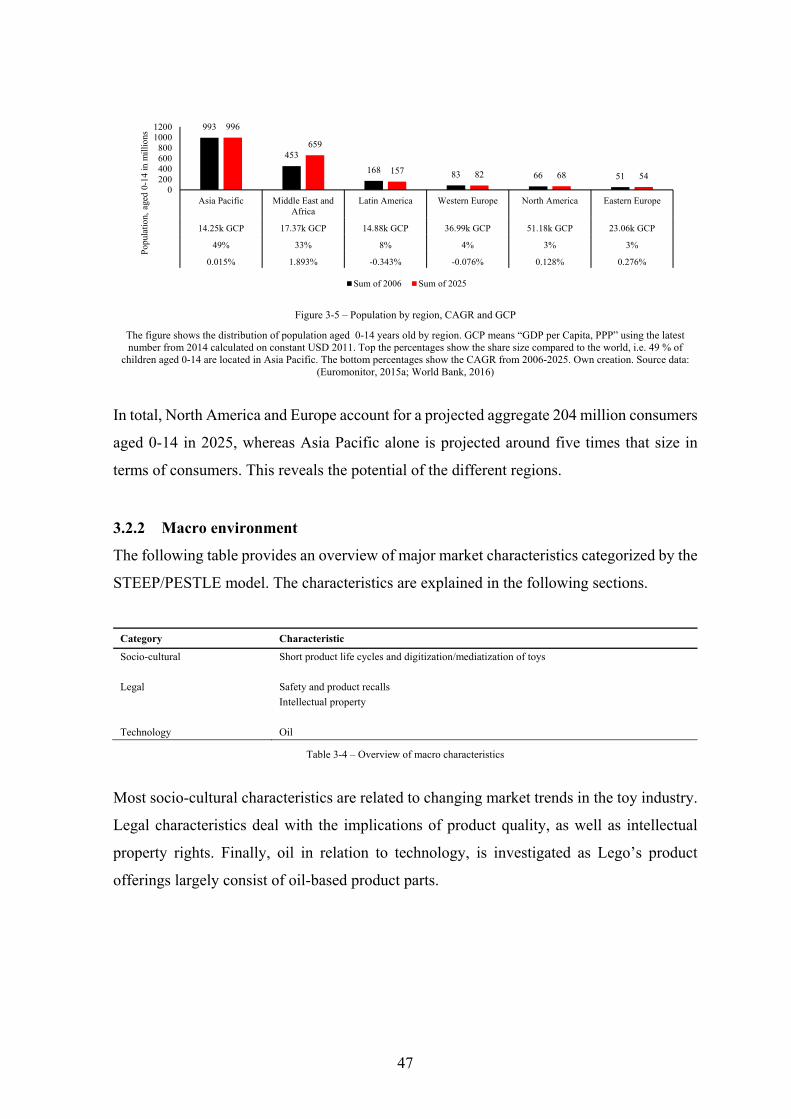
47
Figure 3-5 – Population by region, CAGR and GCP
The figure shows the distribution of population aged 0-14 years old by region. GCP means “GDP per Capita, PPP” using the latest number from 2014 calculated on constant USD 2011. Top the percentages show the share size compared to the world, i.e. 49 % of
children aged 0-14 are located in Asia Pacific. The bottom percentages show the CAGR from 2006-2025. Own creation. Source data: (Euromonitor, 2015a; World Bank, 2016)
In total, North America and Europe account for a projected aggregate 204 million consumers
aged 0-14 in 2025, whereas Asia Pacific alone is projected around five times that size in
terms of consumers. This reveals the potential of the different regions.
3.2.2 Macro environment
The following table provides an overview of major market characteristics categorized by the
STEEP/PESTLE model. The characteristics are explained in the following sections.
Category Characteristic
Socio-cultural Short product life cycles and digitization/mediatization of toys
Legal Safety and product recalls
Intellectual property
Technology Oil
Table 3-4 – Overview of macro characteristics
Most socio-cultural characteristics are related to changing market trends in the toy industry.
Legal characteristics deal with the implications of product quality, as well as intellectual
property rights. Finally, oil in relation to technology, is investigated as Lego’s product
offerings largely consist of oil-based product parts.
993
453
168 83 66 51
996
659
157 82 68 54
0200400600800
10001200
Asia Pacific Middle East andAfrica
Latin America Western Europe North America Eastern Europe
14.25k GCP 17.37k GCP 14.88k GCP 36.99k GCP 51.18k GCP 23.06k GCP
49% 33% 8% 4% 3% 3%
0.015% 1.893% -0.343% -0.076% 0.128% 0.276%
Pop
ulat
ion,
age
d 0-
14 in
mill
ions
Sum of 2006 Sum of 2025

48
3.2.2.1 Socio-cultural
3.2.2.1.1 Short product life cycles, digitization/mediatization of toys
Short product life cycles as well as seasonality continues to be a challenge for firms in the
toy industry. According to Lego, approximately 60 % of sales every year come from new
products. The firm explains that: “[…] positive results are closely related to the constant
and innovative expansion of the product portfolio […]” (LEGO, 2012a, 2013a, 2014,
2015a). This goes well in hand with the competitive landscape previously described,
fostering a high degree of innovation. Lego has constantly introduced new products and
innovation throughout its entire history (Mortensen, 2012) but prior to Lego’s turnaround in
2003-2004, the firm’s management ascribed long periods spent on product development as
one of the reasons for the firm’s losses (D. C. Robertson & Breen, 2013). Johnson (2001)
explains that “The toy industry faces relentless change and an unpredictable buying public,
which creates immense challenges in anticipating best sellers and predicting volume. Like
the high-technology industry, toys also suffer from many supply chain ailments including
short product life, rapid product turnover, and seasonal demand”. Research from 2005 finds
that supply-chain management ‘know-how’ in the toy industry lacks capabilities at handling
seasonality and volatility (Wong, Arlbjørn, & Johansen, 2005). In fact, seasonal demand has
challenged Lego’s supply chain towards Christmas in various years since 2005, causing the
firm to report ‘sold out, out of stock’ on items such as Duplo, City, Star Wars and Technic
(Andersen, 2005; Berger, 2014; Carstensen, 2006; Haugaard, 2007; Henriksen, 2010; Ildor,
2015; Jørgensen, 2012).
Internet, movies and computer games, referred to as the ‘mediatization and
digitization challenge’ produce another threat (or opportunity) for toy firms as consumers
have more options for leisure time activities than possible just 10-20 years ago (Hjarvard,
2004). According to the Lego annual reports a large part of the firm’s revenue stems from
license agreements signed with the movie industry. In December 2015, the movie “Star
Wars: The Force Awakens” was released. As mentioned earlier, Lego has franchised the Star
Wars brand, and similar to previous Star Wars movies, the new movie release is expected to
impact the toy industry positively (Euromonitor, 2015c). Moreover, Lego has franchised
popular movie themes like Harry Potter, Indiana Jones, Batman and Spiderman. Three movie
studios, The Walt Disney Company (Disney), Sony and Warner Brothers (WB, owned by
Time Warner), control majority of popular movie themes franchised (IMDB, 2016). These

49
studios often release new movies and spillover effects have historically been seen in the toy
and games industry. Lego does not publicly disclose details about its license arrangements,
i.e. when/if they will cease to exist. As the Lego Star Wars franchise is major revenue stream
for Lego (LEGO, 2015a), it makes the firm’s revenue vulnerable to large decreases should
the license agreements terminate. Lego’s own movie in collaboration with WB, The Lego
Movie has previously fueled revenue growth for the firm.
Traditional bricks and toys are typically products that can be played/used solo
or together with others but it requires physical presence of all participants. Modern computer
games connected to the internet, offers solo as well as the ‘social aspect’ but does not require
physical presence and in theory be played anywhere and across geographic and demographic
borders as long as internet is present. Lego tries to capture the best of both worlds with its
Toys-to-life product, Lego Dimensions. The game is anticipated to generate large revenue
streams for the firm in the coming years (Euromonitor, 2016) and was according to Lego
well-received at launch (LEGO, 2015a).
These findings indicate that innovation, agile product development, digital and media
offerings, as well as franchised movie themes are resources to growth and valuation creation.
3.2.2.2 Legal
3.2.2.2.1 Safety and product recalls
The European and North American safety regulations for toys have a major impact on the
toy industry and can result in product recalls as well as ban of products. For example, a
component in one of Lego’s products could be determined hazardous forcing both a product
recall, but also force the firm to find a replacement component, which is extremely
expensive. In 2010, concerns surfaced about a chemical called Bisphenol A (BPA). BPA is
a chemical that hardens plastic and is found in Lego’s Duplo products. BPA has been linked
to cancer, decreased reproduction capability, and more. According to Lego, a ban of BPA
would force Lego to shut down its entire Duplo product line, which is a major revenue driver
for the firm (Mainz, 2010). Reports from the European Food Safety Authority have however
concluded that BPA poses no risks to consumers at current exposure levels (EFSA, 2015).
The BPA issue did not force Lego to shut down the Duplo line but bad press and media may
create trust issues and reduce customers’ incentive to buy products if they are perceived

50
unsafe. In 2009, Lego recalled a remote control containing a battery in danger of overheating;
although the impact in this case was limited, product recalls in general can be extremely
expensive and may have a major impact on results (LEGO, 2009b). Since 2009, Lego has
had zero product recalls. With Lego’s new factory in China scheduled for major production
in 2017, the firm is arguably subduing itself to increased risk exposure. According to studies
by various scholars, Asia poses extraordinary challenges compared to more developed parts
of the world. Anwar (2014) finds that most of recalled toys are manufactured in China, and
in addition, Ahsan & Gunawan (2014) find that “kids’ products are recalled due to design
and manufacturing faults, and for all types of products most recalls are initiated by the
manufacturer.”. The situation signals that Asia on one hand is interesting given the growth
opportunities but on the other may pose risk for the firm. As Lego is setting up its own
factory, it is assumed that the risk exposure can be controlled.
3.2.2.2.2 Intellectual Property Rights
A recent report from the European Union Intellectual Property Office (OHIM, 2015)
estimates that DKK ~10.5bn are annually lost in sales across firms in the EU toys and games
sector due to counterfeiting products. This equals 13.2 % of losses in the entire toys and
games sector, which was valued at DKK ~79bn in 2014. An additional DKK ~6.8bn in sales
were lost in related sectors (OHIM, 2015). In 2014, EU Customs seized toys equivalent to
only DKK ~320mn. Toys are the second largest category of products (10%) detained at the
EU customs due to IPR infringement, while cigarettes account for 35 % (European
Commission, 2015). According to the European Commission, China is the main country of
provenance of suspected goods infringing IPR in the EU. Upwards 80 % of detained products
in EU customs in 2014 came from China, closely followed by 8 % originating from Hong
Kong (European Commission, 2015). The following figure shows the total number IPR
infringement cases recorded in the EU from 2007.
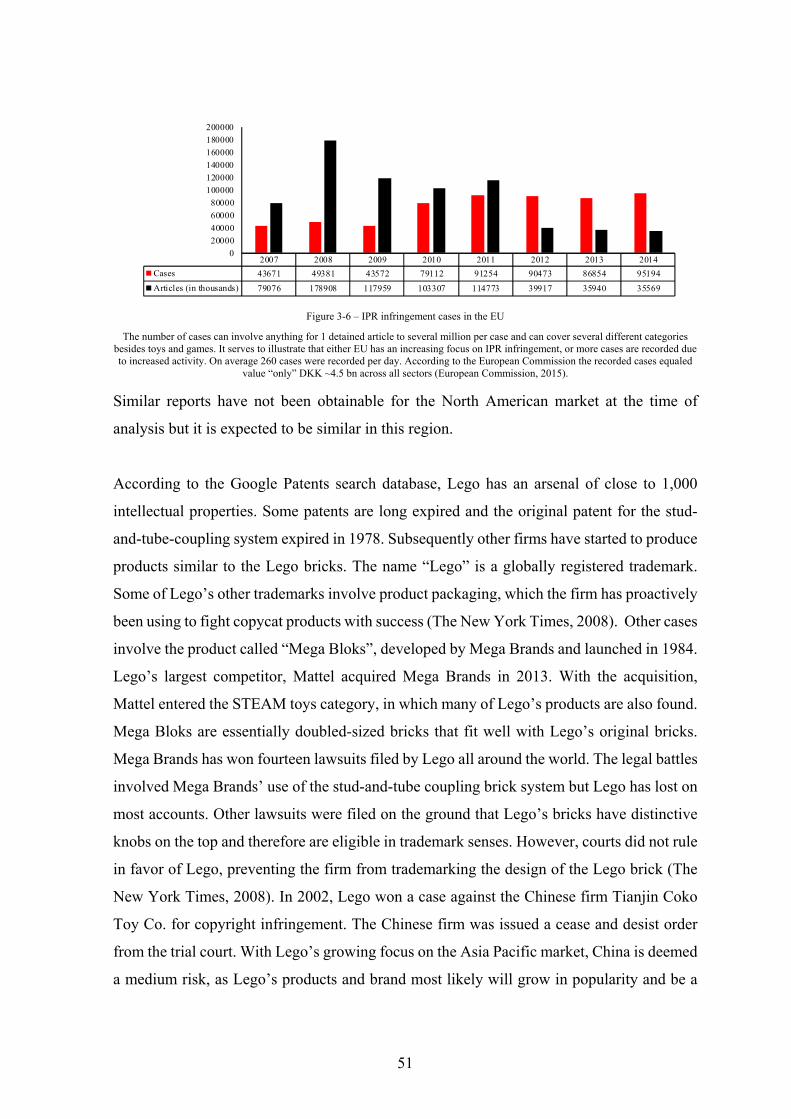
51
2007 2008 2009 2010 2011 2012 2013 2014
Cases 43671 49381 43572 79112 91254 90473 86854 95194
Articles (in thousands) 79076 178908 117959 103307 114773 39917 35940 35569
0
20000
40000
60000
80000
100000
120000
140000
160000
180000
200000
Figure 3-6 – IPR infringement cases in the EU
The number of cases can involve anything for 1 detained article to several million per case and can cover several different categories besides toys and games. It serves to illustrate that either EU has an increasing focus on IPR infringement, or more cases are recorded due to increased activity. On average 260 cases were recorded per day. According to the European Commission the recorded cases equaled
value “only” DKK ~4.5 bn across all sectors (European Commission, 2015).
Similar reports have not been obtainable for the North American market at the time of
analysis but it is expected to be similar in this region.
According to the Google Patents search database, Lego has an arsenal of close to 1,000
intellectual properties. Some patents are long expired and the original patent for the stud-
and-tube-coupling system expired in 1978. Subsequently other firms have started to produce
products similar to the Lego bricks. The name “Lego” is a globally registered trademark.
Some of Lego’s other trademarks involve product packaging, which the firm has proactively
been using to fight copycat products with success (The New York Times, 2008). Other cases
involve the product called “Mega Bloks”, developed by Mega Brands and launched in 1984.
Lego’s largest competitor, Mattel acquired Mega Brands in 2013. With the acquisition,
Mattel entered the STEAM toys category, in which many of Lego’s products are also found.
Mega Bloks are essentially doubled-sized bricks that fit well with Lego’s original bricks.
Mega Brands has won fourteen lawsuits filed by Lego all around the world. The legal battles
involved Mega Brands’ use of the stud-and-tube coupling brick system but Lego has lost on
most accounts. Other lawsuits were filed on the ground that Lego’s bricks have distinctive
knobs on the top and therefore are eligible in trademark senses. However, courts did not rule
in favor of Lego, preventing the firm from trademarking the design of the Lego brick (The
New York Times, 2008). In 2002, Lego won a case against the Chinese firm Tianjin Coko
Toy Co. for copyright infringement. The Chinese firm was issued a cease and desist order
from the trial court. With Lego’s growing focus on the Asia Pacific market, China is deemed
a medium risk, as Lego’s products and brand most likely will grow in popularity and be a
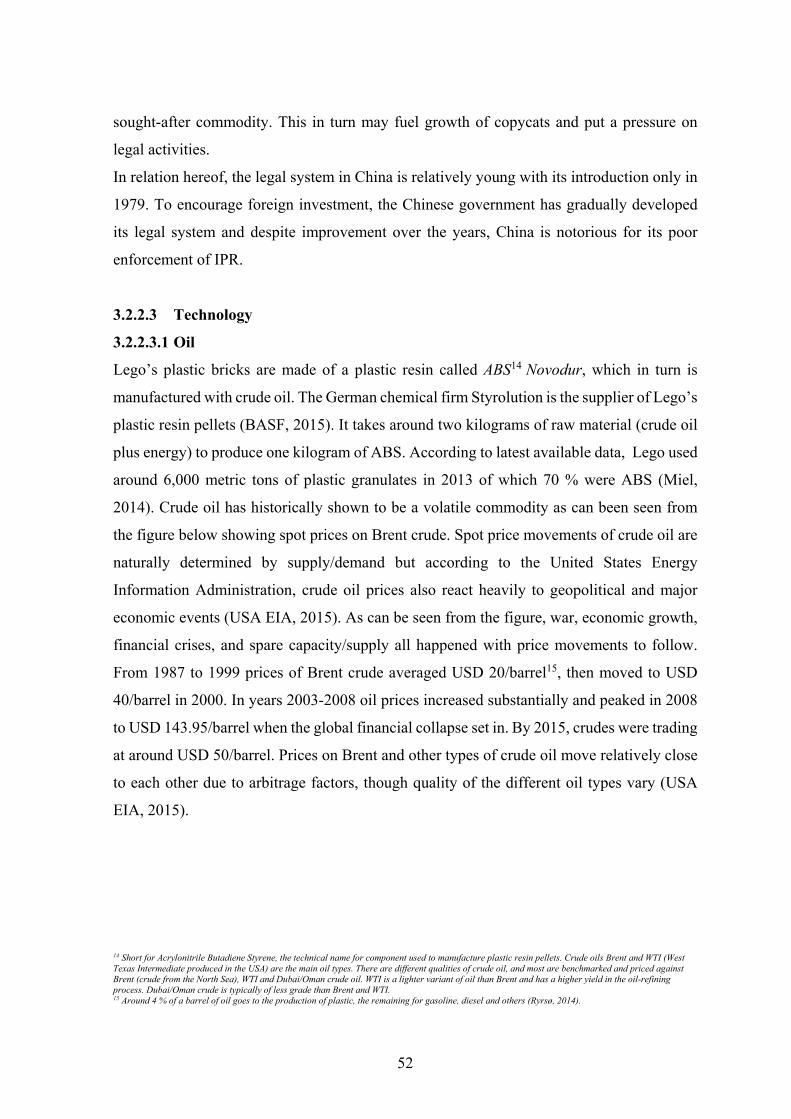
52
sought-after commodity. This in turn may fuel growth of copycats and put a pressure on
legal activities.
In relation hereof, the legal system in China is relatively young with its introduction only in
1979. To encourage foreign investment, the Chinese government has gradually developed
its legal system and despite improvement over the years, China is notorious for its poor
enforcement of IPR.
3.2.2.3 Technology
3.2.2.3.1 Oil
Lego’s plastic bricks are made of a plastic resin called ABS14 Novodur, which in turn is
manufactured with crude oil. The German chemical firm Styrolution is the supplier of Lego’s
plastic resin pellets (BASF, 2015). It takes around two kilograms of raw material (crude oil
plus energy) to produce one kilogram of ABS. According to latest available data, Lego used
around 6,000 metric tons of plastic granulates in 2013 of which 70 % were ABS (Miel,
2014). Crude oil has historically shown to be a volatile commodity as can been seen from
the figure below showing spot prices on Brent crude. Spot price movements of crude oil are
naturally determined by supply/demand but according to the United States Energy
Information Administration, crude oil prices also react heavily to geopolitical and major
economic events (USA EIA, 2015). As can be seen from the figure, war, economic growth,
financial crises, and spare capacity/supply all happened with price movements to follow.
From 1987 to 1999 prices of Brent crude averaged USD 20/barrel15, then moved to USD
40/barrel in 2000. In years 2003-2008 oil prices increased substantially and peaked in 2008
to USD 143.95/barrel when the global financial collapse set in. By 2015, crudes were trading
at around USD 50/barrel. Prices on Brent and other types of crude oil move relatively close
to each other due to arbitrage factors, though quality of the different oil types vary (USA
EIA, 2015).
14 Short for Acrylonitrile Butadiene Styrene, the technical name for component used to manufacture plastic resin pellets. Crude oils Brent and WTI (West Texas Intermediate produced in the USA) are the main oil types. There are different qualities of crude oil, and most are benchmarked and priced against Brent (crude from the North Sea), WTI and Dubai/Oman crude oil. WTI is a lighter variant of oil than Brent and has a higher yield in the oil-refining process. Dubai/Oman crude is typically of less grade than Brent and WTI. 15 Around 4 % of a barrel of oil goes to the production of plastic, the remaining for gasoline, diesel and others (Ryrsø, 2014).
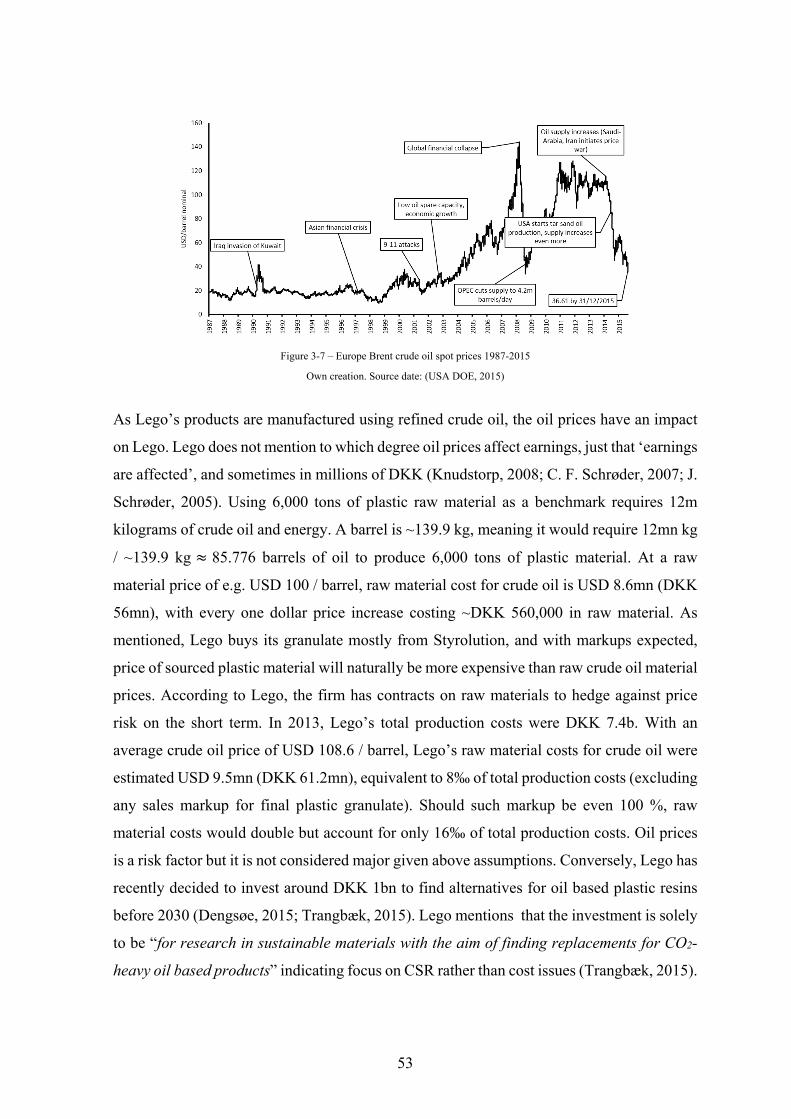
53
Figure 3-7 – Europe Brent crude oil spot prices 1987-2015
Own creation. Source date: (USA DOE, 2015)
As Lego’s products are manufactured using refined crude oil, the oil prices have an impact
on Lego. Lego does not mention to which degree oil prices affect earnings, just that ‘earnings
are affected’, and sometimes in millions of DKK (Knudstorp, 2008; C. F. Schrøder, 2007; J.
Schrøder, 2005). Using 6,000 tons of plastic raw material as a benchmark requires 12m
kilograms of crude oil and energy. A barrel is ~139.9 kg, meaning it would require 12mn kg
/ ~139.9 kg 85.776 barrels of oil to produce 6,000 tons of plastic material. At a raw
material price of e.g. USD 100 / barrel, raw material cost for crude oil is USD 8.6mn (DKK
56mn), with every one dollar price increase costing ~DKK 560,000 in raw material. As
mentioned, Lego buys its granulate mostly from Styrolution, and with markups expected,
price of sourced plastic material will naturally be more expensive than raw crude oil material
prices. According to Lego, the firm has contracts on raw materials to hedge against price
risk on the short term. In 2013, Lego’s total production costs were DKK 7.4b. With an
average crude oil price of USD 108.6 / barrel, Lego’s raw material costs for crude oil were
estimated USD 9.5mn (DKK 61.2mn), equivalent to 8‰ of total production costs (excluding
any sales markup for final plastic granulate). Should such markup be even 100 %, raw
material costs would double but account for only 16‰ of total production costs. Oil prices
is a risk factor but it is not considered major given above assumptions. Conversely, Lego has
recently decided to invest around DKK 1bn to find alternatives for oil based plastic resins
before 2030 (Dengsøe, 2015; Trangbæk, 2015). Lego mentions that the investment is solely
to be “for research in sustainable materials with the aim of finding replacements for CO2-
heavy oil based products” indicating focus on CSR rather than cost issues (Trangbæk, 2015).

54
Overall, the price of oil as well the usage of oil in production is considered a low risk factor
for Lego.
3.2.3 Micro environment
The micro level environment is analyzed using the VRIO framework. According to Lego,
the firm’s strategy is focused on innovation and globalization of the System of Play (SP)
products (LEGO, 2015b). Lego aims to 1) grow existing core business (i.e. products aimed
at 1½-11 years old) and 2) develop new product lines to keep up with innovation pace, 3)
expand presence globally so that the firm eventually is in every country. Moreover, Lego
tries to leverage digitalization by combining physical play with digital play aiming to make
physical play more “attractive and exciting” (LEGO, 2015b). In accordance with the VRIO
framework model, the following sections describe the resources that are considered the most
relevant at explaining Lego’s economic performance.
3.2.3.1 System of Play
Many of Lego’s products before the SP philosophy was developed, were not interoperable
in the sense that they did not “fit well” together. Some products were in wooden materials,
others in plastic, some were without stud-and-tubes, and some in different dimensions
hereby causing lack of consistency and focus in product lines. By introducing the System of
Play, it enabled the customer to buy e.g. a Lego farm product set at one time, and then
combine this with e.g. a Lego airplane set at another time. In essence, the customer would
derive “play value” from the farm product set itself, but adding play value by utilizing and
combining it with other product sets. Once a customer has bought a Lego brick set,
purchasing a new product that does not fit well with the Lego product may induce a perceived
loss of value. In simple terms, the perceived value of buying e.g. two Lego’s brick sets may
be “1” for each (in total 2), but the ‘play combination’ may equal a perceived total value
greater than “2”. Should this hold true, the SP assumingly fosters the creation of a
(perceived) lock-in situation. Such situation would reduce customers wanting to purchase
other toy products, as customers would lose additional play value from not buying Lego
toys. However, perception may change and customers are in general assumed to have low
switching costs enabling them to find other suppliers of toys (and even plastic bricks), which
work against the lock-in. Moreover, low switching costs will according to theory, lower

55
prices (Farrell & Klemperer, 2007; Hendrikse, 2003). From a seller’s point-of-view the play
system enables a ‘cross selling’ strategy. Cross selling is the encouragement of a customer
to buy product A but also product B from Lego. As argued by scholars Knott, Hayes and
Neslin (2002), the challenge of cross selling lie in determining which products to target to
which customers. Knott, Hayes and Neslin’s research found that the single most crucial
predictor for determining which product is bought next by a customer is the customer’s
current product ownership. These findings go well in hand with that of other scholars in the
field, who find that profitability of marketing effects can be increased by utilizing purchasing
history to increase cross-selling (Rossi, McCulloch, & Allenby, 1996). Juxtaposing these
findings to the case of Lego, it illustrates why System of Play is an important strategic
decision for the firm. It can be argued, that SP enables Lego to optimize marketing efforts
and lower marketing costs in the sense that Lego customers’ existing product purchases
would encourage them to buy more products from Lego with less marketing efforts.
Additional purchases will facilitate increased play value for customers and eventually
generate more revenue for Lego. Furthermore, it can be argued that the strategy of SP also
established foundations for a “technology ecosystem”. The standardized stud-and-tube-
coupling mechanism on bricks by Lego have introduced competitors to create compatible
bricks (i.e. bricks that fit with Lego bricks, e.g. MegaBloks). In contrast to customized
technology, well-known (standardized) technology assumingly fosters easier product
adoption by leveraging on behavioral aspects of a given consumer: from game theory, the
optimal choice is the one with the highest pay-off in a given situation (J. Nash, 1951).
Comparing learning curves for successful usage of two substitutable products where one is
well-known (i.e. less steep learning curve), and assuming a steeper learning curve is equal
to lower pay-off, consumers will favor the “flatter learning curve product” as the pay-off
here will be higher. Of course, this is a simplified scenario and other consumer aspects may
work in opposite directions. For instance, consumers’ willingness to improve cognitive
abilities by challenging themselves using “steeper learning curve products” may encourage
users to buy new and different products. In gist, Lego’s real goal may be to find the right
combination of learning (challenges) and play for a given customer group.
From a co-development perspective (i.e. other players that leverage existing
technology to build their own products), standardization c. p. enables easier adoption.
Examples hereof includes Microsoft’s Robotics Studio, a software package that allows

56
software programmers to develop programs and logic for the LEGO Mindstorms product
sets. Microsoft essentially exploits existing technology (Lego bricks) to develop their own
products. In contrast, if SP comprised of parts with differing sizes and interfaces, adoption
by other firms would c. p. be slower (and perhaps lower too) and more costly due to a
“steeper learning curve” (i.e. more parameters to account for). A good example of such
anomaly was the “Lego Galidor” series, essentially products that did not work well with
existing Lego products by employing many new plastic parts. Some of these parts would
only work with the product set in which they were sold (Feloni, 2014). Eventually, the Lego
Galidor series was discontinued because it did not fit well with the SP philosophy, hindered
cross-selling, taking away play value etc.
Other firms and institutions embrace the System of Play philosophy by using
Lego products in areas such as education, design and architecture. Furthermore, Lego bricks
and mini figures are used in both computer games and movies. Essentially, System of Play
has fostered the creation of a mini eco-system where disparate stakeholders derive and create
value from Lego’s product offerings. In my point of view, this is where the real value of
Lego lies: System of Play is a well-known and more or less standardized technology that 1)
is c. p. very simple in form and function and 2) allows for “unlimited” creativity, and in the
end foster a competitive advantage for Lego. In summary, System of Play is arguably, one
of the (if not the one) most valuable, rare, and costly to imitate resource developed as well
as exploited by Lego. All products from the firm work together across product lines, enabling
easy cross selling, foster increased play and learning value all while assumingly lowering
marketing costs (as explained in previous sections). According to VRIO theory, when all
four parameters are fulfilled, sustained competitive advantage can be achieved.
3.2.3.2 Brand
Lego has established a brand name with a long history since 1932. The brand signals amongst
others quality and good and safe products according to the brand values promoted by Lego
(Appendix 8.9). The following figure shows a development of ‘reputation’ over time
measured by the Reputation Institute (2016).

57
Figure 3-8 – Brand reputation 2011-Q12016
The figure list the most reputed brands in aggregated view with summed and average reputation for the period 2011-Q12016. The higher the score the better. The numbers are calculated based on global top 10 brands in the world per year. For more info on the
numbers please see Appendix 8.10. Data: (Reputation Institute, 2016)
Lego is ranking in the Top 10 in all years and is on average no. 5 on a global scale. No other
toy firms exist on the list. On a regional level, Lego is on average the most reputed brand in
North America, typically scoring first or second place. The same holds true for Europe
(Reputation Institute, 2016). However, in Latin America and Asia Pacific the firm is not
even in Top 5 over the period. Arguably, the Lego brand is valuable as it is difficult achieve
that level of reputation. It is rare as in no other construction toy firm ranks in top 100
(Nintendo, Japan is the closest here, but this firm resides in the video games segment).
Further, achieving the same level of reputation is assumed costly. The brand is a VRIO-
resource.
3.2.3.3 Stores + ambassadors
Arguably, Lego’s brand stores are an important resource for the firm, given the short product
life cycles in the industry. By having direct access to consumers through own stores (and not
through independent retailers), it may enable Lego to capture market trends in relation to its
products from first hand. This in turn may provide valuable feedback for product innovation
and design teams at Lego. Lego currently operates 112 stores around the globe and expects
to continue investing in this part of the supply chain. The stores promote only Lego branded
products and therefore eliminates ‘in-store’ competition. However, just as operating own
stores and promoting own products may enable direct access to consumers as well as lower
the overall bargaining power of retailers, it may also increase the risk of losing retailers if
they fear direct competition from Lego. Lego’s brand stores are assumed valuable, costly to
imitate (requires capex), and ‘somewhat’ rare as most toy firms sell products through
473 469 469 464 461 460
387 387 384
311 231
78 75
78.83 78.14
78.13 77.29
76.78
76.72 77.39
77.34 76.70
77.63 76.84
77.56 75.21 73.00
74.00
75.00
76.00
77.00
78.00
79.00
80.00
050
100150200250300350400450500
Summed reputation Avg reputation

58
independent retailers. Brand ambassadors include Lego’s six LEGOLAND theme parks
operated by Merlin Entertainments (ME), plus an additional three scheduled to open 2016-
2018 in Dubai, Japan, Korea, and perhaps China or USA (exact schedule unknown). In
addition, thirteen Lego Discovery Centers (indoor Lego attractions), also acts as
ambassadors for the Lego brand. The new theme parks will cost around USD 300m a piece
and for competitors would be costly to replicate. In 2015, 12.1 million visitors experienced
the existing theme parks, generating GBP 429m. ME announced in their latest financial
reporting, that they “[…] firmly believe that there is scope for over 20 parks worldwide”
(Merlin Entertainments, 2015). None of Lego’s major competitors operate theme parks
besides Disney, who operates the most popular theme parks and attractions in the world with
a combined 134m visitors per year (TEA, 2015). Lego’s brand stores and ambassadors are
assumed VRIO resources.
3.2.3.4 Production capabilities
According to the financial statements, Lego has large cash reserves. This allows the firm to
react on market changes, invest in innovation and production capabilities. Production of
plastic toys ‘in-house’ requires large capital expenditures, which may decrease the threat of
new competition. For example, Lego’s factory in China is projected to cost a 3 digit million
figure EUR once completed in 2017 (LEGO, 2013b). The factory will cover 120,000 square
meters and employ 2,000 workers. For industry entrants and existing competition, out-
sourcing of production is possible but as indicated earlier, high quality and safety is key
aspects of the toy industry. Many firms, including Mattel and Hasbro are already producing
in low-wage countries like China to keep costs down. However, especially in China, safety
and quality concerns have historically been low; outsourcing of production arguably yields
a risk for new competitors. I consider Lego’s production capabilities a VRIO resource for
these reasons.
The following table provides an overview of the identified VRIO resources. The VRIO
resources may according to theory on the topic, explain the economic performance of the
firm.
Resource Valuable Rare Costly to imitate
Exploited Implication Econ. performance
System of Play Yes Yes Yes Yes Sust. comp. advantage Above normal
59
Resource Valuable Rare Costly to imitate
Exploited Implication Econ. performance
Brand Yes Yes Yes Yes Sust. comp. advantage Above normal
Stores + ambassadors Yes Somewhat Yes Yes Competitive parity Normal
Production capabilities Yes Yes Yes Yes Sust. comp. advantage Above normal
Table 3-5 – Overview of identified VRIO-resources
3.3 Summary
The strategic analysis of Lego and the industry has arguably revealed an exciting future
ahead. Various risk, resources and capabilities were identified and the overall assumption is
that Lego is prepared for growth. The next sections will dive into the Lego’s as well as peer
firms Hasbro’s and Mattel’s financials, to illuminate whether such growth assumption is
reasonable.
4 Financial Analysis
The purpose of the following sections is to provide a thorough understanding of the
economic operation and financing aspects of Lego and its competitors (peer group firms) by
analyzing their respective financial statements. Financial statements, including income,
balance and reformulation can be found in Appendix 8.13.
4.1 Accounting policies and reformulation notes
In total, 30 financial statements of three different firms are analyzed and reformulated. Peer
firms were selected based on the findings in the strategic analysis, which indicated that
Mattel and Hasbro were the closest competition in terms of current revenue and market size.
However, growth and development over the period 2006-2015 shows little resemblance
among the firms, which therefor can indicate an ‘in-optimal’ peer group selection. It is
assumed that Mattel and Hasbro are the best possible candidates available.
Reformulation of financial statements is conducted to separate operating activities from
financing activities. The reformulation and separation of line items is based, to a large extent
on valuation guidelines provided by Sørensen (2009) and Koller et al. (2010). Using
reformulated numbers, a Du Pont analysis is performed to gauge and compare the
performance of the individual peer firms. Net operating profit less adjusted taxes (NOPLAT)
and Return on Invested Capital (ROIC) are used as main components for budgeting and
valuation in later sections.

60
The financial statement analysis used as foundation for valuation, covers a period of ten
years from 2006-2015. Prior to 2007, the Lego financial statements were not following IFRS.
When Lego changed to IFRS in 2007, rules of International Accounting Standards §1 and
IFRS 1, states that “[…] at least one year of comparative prior period financial information
be presented” (Deloitte, 2013) and as such the 2006 financial statement was adopted to
comply with the rules set out. In contrast to Lego, peer firms Hasbro and Mattel employ
United States Generally Accepted Accounting Policies (GAAP). This can lead to
comparison problems as various items in the financial statements can be treated differently
using GAAP vs IFRS. IFRS is currently adopted by 116 countries including the European
Union (Pacter, 2015), while GAAP is only employed within the USA. Major differences
between IFRS and GAAP relates to the way intangibles, inventories, and write-downs
(Nguyen, 2010) are treated in financial statements. As example, GAAP permits inventories
to be treated on cost-basis using the Last-in, First-out (LIFO) accounting method, while IFRS
does only permit First-in, First-out (FIFO)-method. All peer firms are using the FIFO-
method, so in this particular example, comparison is not considered an issue. Similarly,
intangibles are treated differently – with IFRS intangibles are only recognized if they have
“future economic benefit and has measured reliability” (Nguyen, 2010), while GAAP
recognizes all intangibles at fair value. The fair value measurement was aligned for IFRS
and GAAP in 2011 to eliminate cross-border comparison difficulties (IFRS, 2011).
Comparison of peer firms’ financial statements in relation to intangibles has raised no
concerns. Write-downs can give mixed results in comparison when using either IFRS or
GAAP accounting, as each method use different measurements of carrying value for the
inventories. In the financial statements Mattel and Hasbro states they use “lower of cost or
market”, while Lego uses “lower of cost and net realizable value” for measuring value of
their inventories. According to GAAP Accounting Standards Codification (ASC) 330-10-
20, “market” is defined as “current replacement cost (by purchase or by reproduction, as
the case may be)”, and in addition “market” shall not exceed net realizable value or be lower
than net realizable value less profit margin. Net realizable value is defined in both IRFS and
GAAP as “estimated selling price in the ordinary course of business less reasonably
predictable costs of completion and disposal”. It is assumed that the different measurements
of inventory value will have no impact on the analysis in this thesis.
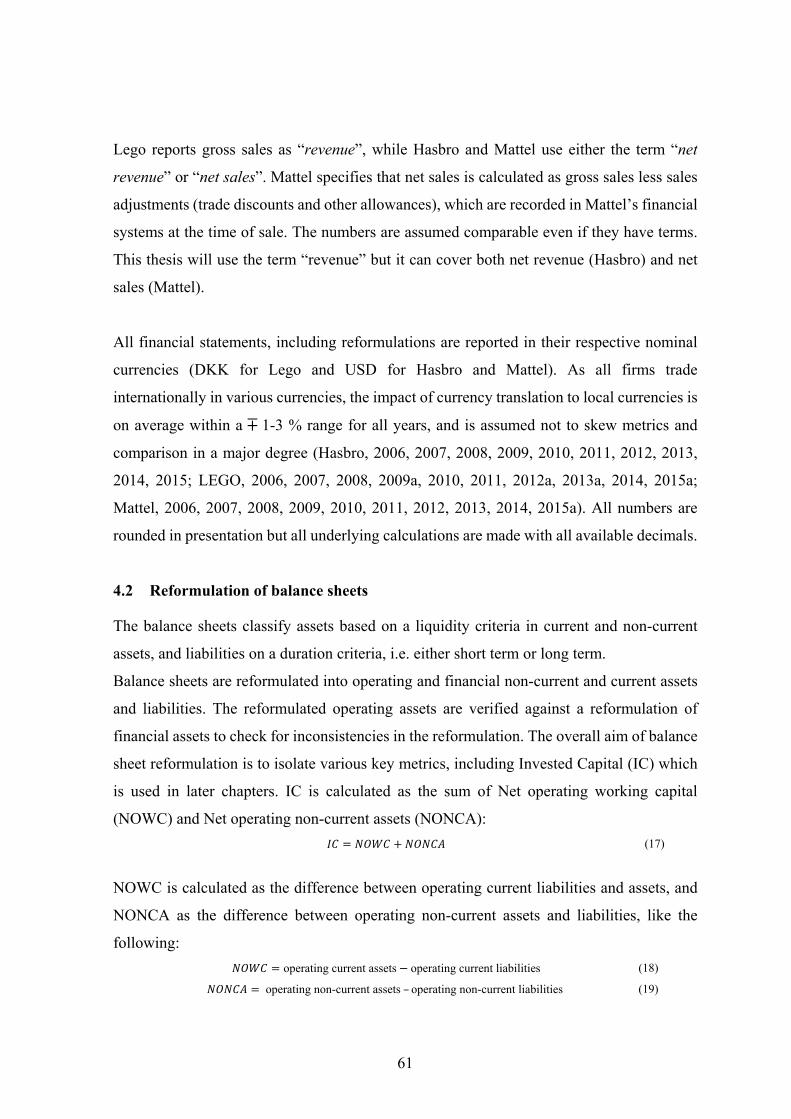
61
Lego reports gross sales as “revenue”, while Hasbro and Mattel use either the term “net
revenue” or “net sales”. Mattel specifies that net sales is calculated as gross sales less sales
adjustments (trade discounts and other allowances), which are recorded in Mattel’s financial
systems at the time of sale. The numbers are assumed comparable even if they have terms.
This thesis will use the term “revenue” but it can cover both net revenue (Hasbro) and net
sales (Mattel).
All financial statements, including reformulations are reported in their respective nominal
currencies (DKK for Lego and USD for Hasbro and Mattel). As all firms trade
internationally in various currencies, the impact of currency translation to local currencies is
on average within a ∓1-3 % range for all years, and is assumed not to skew metrics and
comparison in a major degree (Hasbro, 2006, 2007, 2008, 2009, 2010, 2011, 2012, 2013,
2014, 2015; LEGO, 2006, 2007, 2008, 2009a, 2010, 2011, 2012a, 2013a, 2014, 2015a;
Mattel, 2006, 2007, 2008, 2009, 2010, 2011, 2012, 2013, 2014, 2015a). All numbers are
rounded in presentation but all underlying calculations are made with all available decimals.
4.2 Reformulation of balance sheets
The balance sheets classify assets based on a liquidity criteria in current and non-current
assets, and liabilities on a duration criteria, i.e. either short term or long term.
Balance sheets are reformulated into operating and financial non-current and current assets
and liabilities. The reformulated operating assets are verified against a reformulation of
financial assets to check for inconsistencies in the reformulation. The overall aim of balance
sheet reformulation is to isolate various key metrics, including Invested Capital (IC) which
is used in later chapters. IC is calculated as the sum of Net operating working capital
(NOWC) and Net operating non-current assets (NONCA):
(17)
NOWC is calculated as the difference between operating current liabilities and assets, and
NONCA as the difference between operating non-current assets and liabilities, like the
following:
operating current assets operating current liabilities (18)
operating non-current assets– operating non-current liabilities (19)

62
The Appendix 8.12 specifies the line items for both NOWC and NONCA. The line items
classification follows the guidelines indicated previously and will not be commented as such.
A few of the line items, however, is described below as these are calculated and subsequently
added to the reformulated balance sheets. These items include operating cash and operating
leases.
4.2.1 Operating cash
Operating cash is added manually to the balance sheets for all peer firms, as the firms
themselves do not report numbers. Instead, all peer firms state combined cash and cash
equivalents (CCE). Operating cash is calculated as the difference between CCE and excess
cash, which in turn is also not reported in the peer firms’ financial statements. Empirical
evidence have shown that operating cash varies from industry to industry (Chudson, 1945),
and that larger firms typically have a lower cash-to-sales ratio than smaller firms (D’Mello,
Krishnaswami, & Larkin, 2008; Vogel & Maddala, 1967). In similar fashion, Opler,
Pinkowitz, Stulz, & Williamson (1999) found evidence that firms with high credit ratings as
well as larger firms with easy access to capital markets often have lower cash-to-sales ratios
than comparable but minor peers and furthermore that cash-to-assets ratio has declined over
the past fifty years or so. Koller et al. (2010), concluded from a study of all the S&P 500
non-financial firms between 1993-2000, that operating cash-ratios were as low as 2% of
sales for some firms. Given these findings and the fact that Lego and peers are all large firms,
a 2 % rate of revenue is assumed a good benchmark for calculating the operating cash line
item.
4.2.2 Operating leases
All peers in the peer group including Lego employ operating leases to claim rights to various
tangible assets instead of purchasing these. The operating leases include e.g. retail and office
space, warehouses, plant and machinery. In contrast to debt acquisition (to acquire rights for
assets), operating leases do not figure in a balance sheet. Instead, expenses related to leases
are recorded in the income statements. This practice is referred to as off-balance sheet (OBS)
financing. OBS financing can produce skewed financial ratios, thus hide true performance,
making it difficult to compare peer firms’ key figures like Return on Invested Capital (ROIC)

63
and others (Koller et al., 2010). Lego and peers specify in their respective statements that
their operating leasing contracts have different lengths and terms. A value estimation of the
leases is conducted to approach and counter any imbalanced financial ratios. The operating
leases are valued using the following equation:
1
(20)
Where is time, " " is the expected life of the lease, and equals cost of debt on
the lease. Asset life is calculated as an average of asset life for all peer firms. Please see table
4-1 below.
Asset life (years) Buildings Installations Plant & mach Moulds Fittings Average
Lego 40.0 12.5 10.0 2.0 6.5 14.2
Hasbro 20.0 17.0 7.5 14.8
Mattel 20.0 15.0 6.5 3.0 11.1
Average across peers: 13.4
Table 4-1 – Average asset life (years) for peer firms
Data from (Hasbro, 2015; LEGO, 2015a; Mattel, 2015a)
While the reported asset life for e.g. buildings typically are higher than for the remaining
assets, the average across peers (13.4 years) is on par with previous research conducted by
Lim, Mann & Mihov (2003). In 2003, they studied more than 7,000 firms in relation to
market valuation of off-balance sheet items and concluded that the median useful life for
OBS items (property, plant and equipment) was 10.9 years. The average asset life differs
among Lego, Hasbro and Mattel but 13.4 years life is employed at all firms to equalize
comparison. As leases are secured by the underlying assets and, thereby less risky than a
firm’s unsecured debt, Koller et al., (2010), specifies that “can be estimated by using AA-
rated yields”. The average US Aaa Corporate Bond by Moody’s (Federal Reserve System
(US), 2016) is calculated to 4.67 % yielding a discount factor of .
0.121.
Bond yields – Dec 31 2007 2008 2009 2010 2011 2012 2013 2014 2015 Avg
US Aaa corporate bond 5.56% 5.63% 5.31% 4.94% 4.64% 3.67% 4.24% 4.16% 3.89% 4.67%
Asset life 13.4
Discount factor 0.121
Table 4-2 – US Aaa Corporate bond yields
Data from (Federal Reserve System (US), 2016)
The capital value of the operating leases (COL) are located in Appendix 8.13.2.

64
4.3 Reformulation of income statements
All peer firms employ dirty surplus accounting thus impacting comprehensive income. To
avoid skewed income data, dirty surplus items are cleaned. These items differ in both size
and character amongst peers and relate largely to cash flow hedging, currency translation,
tax items, reclassification of revenue, and pension plans.
4.4 Profitability analysis
To compare the individual performance of the peer firms, the Du Pont framework is
employed. The Du Pont framework decomposes firm performance into profitability drivers
related to operating activities and financing activities. Du Pont has an emphasis on return on
equity (ROE). It is, however, argued by Koller et al. (2010, p. 166) that ROIC is a better
performance indicator than ROE because ROE mixes operating activities with capital
structure, thus making comparison amongst peers less meaningful. ROIC is a measure that
indicates how well a firm is using its capital (free of financing) to generate value for its
investors. Koller et al. (2010, p. 4) continues to argue, that ROIC relative to cost with a
combination of growth is what drives value. Therefore, to avoid a skewed picture of true
value creation, ROIC is used as the main metric in performance comparison. In the following
sections, however, all profitability drivers are calculated and compared against peer group
firms, as this will provide an overview of origin of performance (i.e. financing and/or
operating activities). The value drivers are used as reference points for the valuation and
reflection thereof in later chapters.
Figure 4-1 – Adapted Du Pont framework
Source: (Koller et al., 2010, p. 18; Sørensen, 2009, p. 255).
The entire Du Pont framework breakdown is located in Appendix 8.13.3.
Return on Equity
Return on operating activities ROIC & Growth Cash flow & Cost of
capital Value
Return on financing activities
Financial leverageFLEV
Operating spread, SPREAD

65
4.4.1 Peer performance comparison
Comparing peer firms on top-line growth gives an indication on how sales are developing
for the respective firms. A host of different elements, including standard demand and supply,
capacity utilization and more, can fuel growth. The following figure compares Year-on-Year
∆% revenue growth rates unadjusted for currency impact.
2.9%
18.7%22.4%
37.3%
17.0%
25.0%
8.1%13.0%
25.2%21.8%
4.8%1.2%
-1.6%
7.1%
-4.6% -0.2%
4.8% 4.0%5.7%
-0.9%-8.2%
7.8%
7.0%
2.5%1.0%
-7.1%
-5.3%
-20.0%
-10.0%
0.0%
10.0%
20.0%
30.0%
40.0%
2007 2008 2009 2010 2011 2012 2013 2014 2015
Δ%
gro
wth
Lego Δ % Hasbro Δ % Mattel Δ %
Figure 4-2 – Revenue growth compared to previous year
Over the period, Lego is showing larger year-on-year growth than peer firms, except for
2007. While a large increase in the average dollar rate (equivalent to more than DKK 1.00)
to some extent has increased revenue “artificially” for Lego, according to the firm,
adjustments for currency translation shrink the actual growth to 19% vs. 25.2 % (LEGO,
2015a). In previous years 2006-2014, the USD/DKK currency conversion rates have been
somewhat steady (average of USD/DKK 5.54), hence only a minor impact due to currency.
Without comparing the underlying numbers, growth percentages can give a distorted picture.
In order to compare top-line performance among the firms, a currency translation between
USD and DKK is made using yearly averaged currency rates. The following table is
produced which shows Lego is growing more in absolute terms, than peer firms are. With
an annual average growth rate over the period by Lego of DKK 3.10bn vs. ~DKK 0.81bn
for Hasbro and only a negative ~DKK 0.033bn for Mattel, Lego has historically been
performing better than peers. The compounded annual growth rates (CAGR16) show a
similar trend with Lego toping the charts: ~16% annual growth versus 3.5% and 0.09 % for
Hasbro and Mattel. Lego surpassed Hasbro in 2013 to become the world’s second largest
16 CAGR = Revenue2015
Revenue1
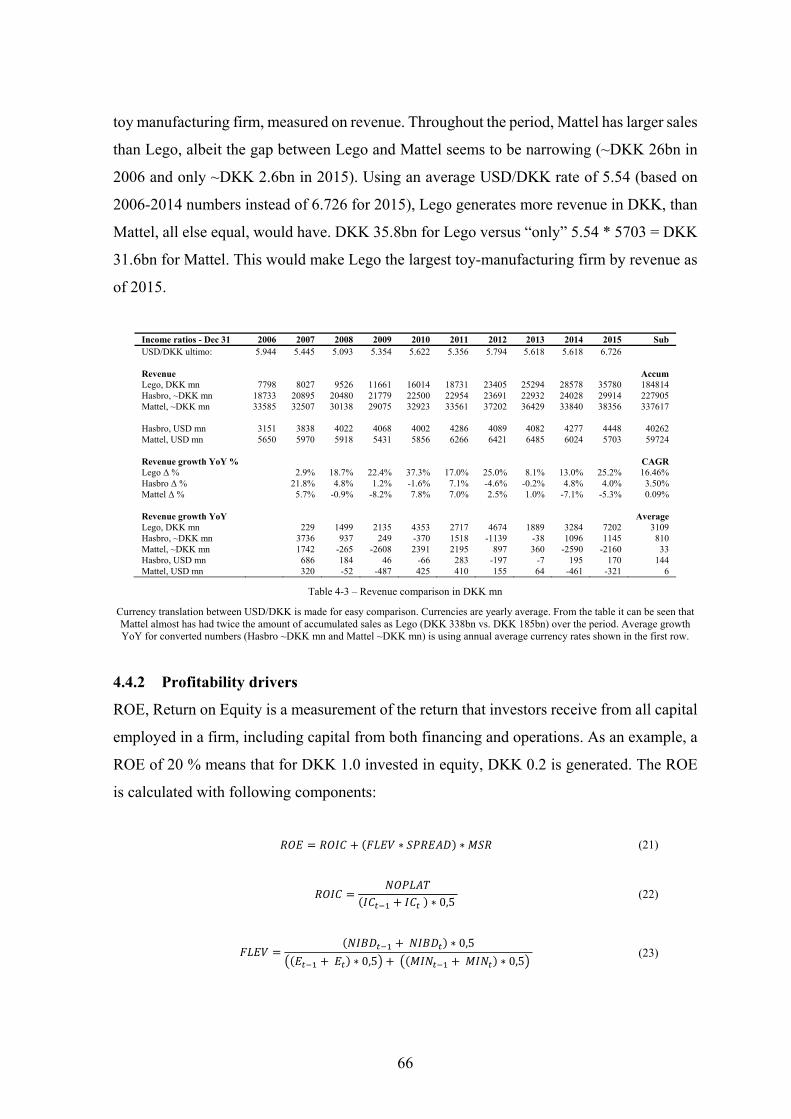
66
toy manufacturing firm, measured on revenue. Throughout the period, Mattel has larger sales
than Lego, albeit the gap between Lego and Mattel seems to be narrowing (~DKK 26bn in
2006 and only ~DKK 2.6bn in 2015). Using an average USD/DKK rate of 5.54 (based on
2006-2014 numbers instead of 6.726 for 2015), Lego generates more revenue in DKK, than
Mattel, all else equal, would have. DKK 35.8bn for Lego versus “only” 5.54 * 5703 = DKK
31.6bn for Mattel. This would make Lego the largest toy-manufacturing firm by revenue as
of 2015.
Income ratios - Dec 31 2006 2007 2008 2009 2010 2011 2012 2013 2014 2015 Sub USD/DKK ultimo: 5.944 5.445 5.093 5.354 5.622 5.356 5.794 5.618 5.618 6.726 Revenue Accum Lego, DKK mn 7798 8027 9526 11661 16014 18731 23405 25294 28578 35780 184814 Hasbro, ~DKK mn 18733 20895 20480 21779 22500 22954 23691 22932 24028 29914 227905 Mattel, ~DKK mn 33585 32507 30138 29075 32923 33561 37202 36429 33840 38356 337617 Hasbro, USD mn 3151 3838 4022 4068 4002 4286 4089 4082 4277 4448 40262 Mattel, USD mn 5650 5970 5918 5431 5856 6266 6421 6485 6024 5703 59724 Revenue growth YoY % CAGR Lego Δ % 2.9% 18.7% 22.4% 37.3% 17.0% 25.0% 8.1% 13.0% 25.2% 16.46% Hasbro Δ % 21.8% 4.8% 1.2% -1.6% 7.1% -4.6% -0.2% 4.8% 4.0% 3.50% Mattel Δ % 5.7% -0.9% -8.2% 7.8% 7.0% 2.5% 1.0% -7.1% -5.3% 0.09% Revenue growth YoY Average Lego, DKK mn 229 1499 2135 4353 2717 4674 1889 3284 7202 3109 Hasbro, ~DKK mn 3736 937 249 -370 1518 -1139 -38 1096 1145 810 Mattel, ~DKK mn 1742 -265 -2608 2391 2195 897 360 -2590 -2160 33 Hasbro, USD mn 686 184 46 -66 283 -197 -7 195 170 144 Mattel, USD mn 320 -52 -487 425 410 155 64 -461 -321 6
Table 4-3 – Revenue comparison in DKK mn
Currency translation between USD/DKK is made for easy comparison. Currencies are yearly average. From the table it can be seen that Mattel almost has had twice the amount of accumulated sales as Lego (DKK 338bn vs. DKK 185bn) over the period. Average growth YoY for converted numbers (Hasbro ~DKK mn and Mattel ~DKK mn) is using annual average currency rates shown in the first row.
4.4.2 Profitability drivers
ROE, Return on Equity is a measurement of the return that investors receive from all capital
employed in a firm, including capital from both financing and operations. As an example, a
ROE of 20 % means that for DKK 1.0 invested in equity, DKK 0.2 is generated. The ROE
is calculated with following components:
∗ ∗ (21)
∗ 0,5
(22)
∗ 0,5
∗ 0,5 ∗ 0,5 (23)
67
(24)
/
∗ 0,5 / ∗ 0,5 ∗ 0,5 (25)
All equations adapted from (Koller et al., 2010; Sørensen, 2009)
Where FLEV is financial leverage of a firm, that measures impact of financing sources
equity and debt, SPREAD is the difference between ROIC and r17 and MSR is the minority
shares ratio. SPREAD measures the rate of return on operating activities (invested capital)
minus financing rents. MSR is calculated only for Lego and Hasbro as Mattel has no minority
interest (MIN). In accordance, FLEV is calculated without the MIN term for Mattel. Net
interest bearing debt (NIBD) is calculated as the difference between Invested Capital (IC)
and Equity (incl. MIN). A few of the equations use two-year averages to avoid over-
estimating numbers, as firms have changed capital-wise during the year, while the financial
statements reported only annually. The two-year average construct removes 2006 from some
of the tables. All components are described and calculated in the following.
Figure 4-3 further down, shows a comparison of the profitability drivers for all peers and
indicates that Lego is outperforming its competitors in terms of both ROE and ROIC for all
years.
In 2007-2009 Lego is more leveraged (FLEV of 223 %, 147 % and 101 %)
than its peers are, which is also captured in the high ROE of 75 % for 2007. The leverage
stems primarily from the restructuring of Lego (LEGO, 2006, 2007, 2008, 2009b). The
numbers show that Lego’s ROE was more than halved to 35 %, still with a relatively high
FLEV of 147 % in 2008. The reason behind this is a large negative net financial income in
2008 for Lego, mixed with a better utilization of IC (24 % vs. 35 % ROIC) and payoff on
debt regarding firm restructuring. In 2006-2008, a subordinated loan capital line item is high
as well but finally eliminated in 2009. However, the two-year averaging explained
previously, results in the full impact to be visible first in 2010 where FLEV has fallen to 68
%. Operating spread, SPREAD captures the effect in similar fashion, where Lego’s ROIC
increases more than Lego’s net borrowing costs therefore yielding a growing SPREAD.
17 r not to be confused with r in discount factor, r is net borrowing costs measured as the ratio between net financial income/expenses after tax and a two-year average of net financial obligations (NFO avg). NFO is the difference between total financial liabilities and assets.
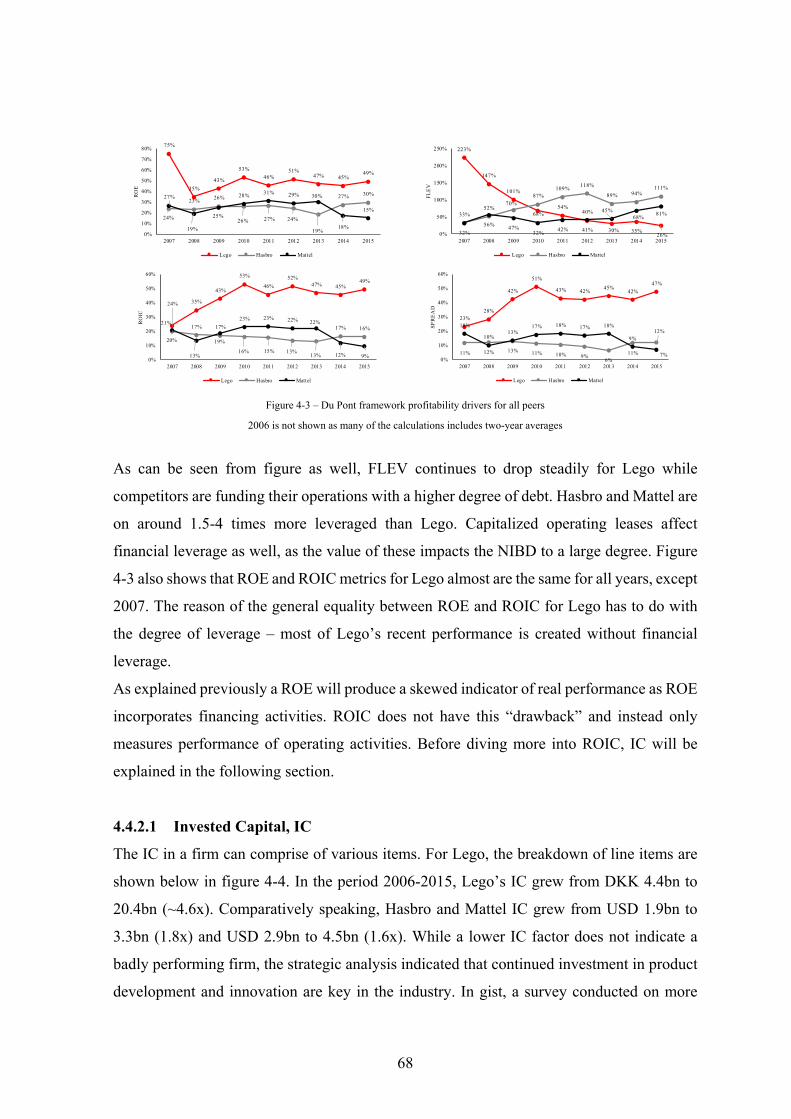
68
75%
35%
43%
53%
46%51%
47% 45%49%
24%
23%26%
26% 27% 24%
19%
27% 30%27%
19%
25%
28% 31% 29% 30%
18%
15%
0%
10%
20%
30%
40%
50%
60%
70%
80%
2007 2008 2009 2010 2011 2012 2013 2014 2015
RO
E
Lego Hasbro Mattel
223%
147%
101%
68%54%
40%
30% 35%26%
33%52%
70%87%
109%118%
89% 94%111%
32%
56%47%
32%42% 41%
45%68%
81%
0%
50%
100%
150%
200%
250%
2007 2008 2009 2010 2011 2012 2013 2014 2015
FL
EV
Lego Hasbro Mattel
24% 35%
43%
53%
46%
52%47% 45%
49%
20%
17% 17%
16% 15% 13%13%
17% 16%21%
13%
19%
23% 23% 22% 22%
12% 9%0%
10%
20%
30%
40%
50%
60%
2007 2008 2009 2010 2011 2012 2013 2014 2015
RO
IC
Lego Hasbro Mattel
23%28%
42%
51%
43% 42%45%
42%
47%
11% 12% 13% 11% 10% 9%6%
11%
12%18%
10%13%
17% 18% 17% 18%
9%
7%0%
10%
20%
30%
40%
50%
60%
2007 2008 2009 2010 2011 2012 2013 2014 2015
SP
RE
AD
Lego Hasbro Mattel
Figure 4-3 – Du Pont framework profitability drivers for all peers
2006 is not shown as many of the calculations includes two-year averages
As can be seen from figure as well, FLEV continues to drop steadily for Lego while
competitors are funding their operations with a higher degree of debt. Hasbro and Mattel are
on around 1.5-4 times more leveraged than Lego. Capitalized operating leases affect
financial leverage as well, as the value of these impacts the NIBD to a large degree. Figure
4-3 also shows that ROE and ROIC metrics for Lego almost are the same for all years, except
2007. The reason of the general equality between ROE and ROIC for Lego has to do with
the degree of leverage – most of Lego’s recent performance is created without financial
leverage.
As explained previously a ROE will produce a skewed indicator of real performance as ROE
incorporates financing activities. ROIC does not have this “drawback” and instead only
measures performance of operating activities. Before diving more into ROIC, IC will be
explained in the following section.
4.4.2.1 Invested Capital, IC
The IC in a firm can comprise of various items. For Lego, the breakdown of line items are
shown below in figure 4-4. In the period 2006-2015, Lego’s IC grew from DKK 4.4bn to
20.4bn (~4.6x). Comparatively speaking, Hasbro and Mattel IC grew from USD 1.9bn to
3.3bn (1.8x) and USD 2.9bn to 4.5bn (1.6x). While a lower IC factor does not indicate a
badly performing firm, the strategic analysis indicated that continued investment in product
development and innovation are key in the industry. In gist, a survey conducted on more

69
than 400 US CEOs revealed that 55% of CEOs would prevent investing in “very positive”
NPV projects if it meant failing projected earnings targets (Graham, Harvey, & Rajgopal,
2005). The reason being that uncertainty hurt stock prices. This may explain some of the
peer firms’ lower investment rates, although this is purely a speculation. The three largest
drivers of the IC in Lego is NOWC, Property, plant & equipment (PPE) and as well as
capitalized operating leases (COL). In total, these drivers comprise around 100 % of Lego’s
invested capital. From the figure, it is clear that Lego is investing its capital for the most part
in PPE – growing from 34% (DKK 1.5bn) to 52% (DKK 10.6bn). The PPE line item
indicates that Lego is investing heavily in own production facilities. NOWC and COL have
largely been decreasing, however in absolute terms still growing over the period.
42% 42% 35% 30% 36% 38% 34% 32% 28% 27%
34% 25% 31% 34% 33% 34% 37% 45% 49% 52%
24%33% 35% 36% 31% 28% 28%
27% 25% 22%
-20%
0%
20%
40%
60%
80%
100%
120%
2006 2007 2008 2009 2010 2011 2012 2013 2014 2015
Rat
ios
of I
nves
ted
Cap
ital
NOWC Property, plant, equipment Other (taxes + prepayments) Capitalized opera ting leases Operating non-current liab.
Figure 4-4 – Lego, line items of Invested Capital
Suming all line items will yield 100 % Invested Capital. Percentages for operating non-current liabilities as well as “other” are not shown. Similar graphs for Hasbro and Mattel are available in Appendix 8.13.5.
The next section, describes how well Lego is allocating IC as measured by the ROIC ratio.
4.4.2.2 Return on Invested Capital
ROIC assesses a firm’s efficiency at allocating capital into profitable investments. A ROIC
of 50 % means that for DKK 1.00 invested, a return (NOPLAT) of DKK 0.50 is generated.
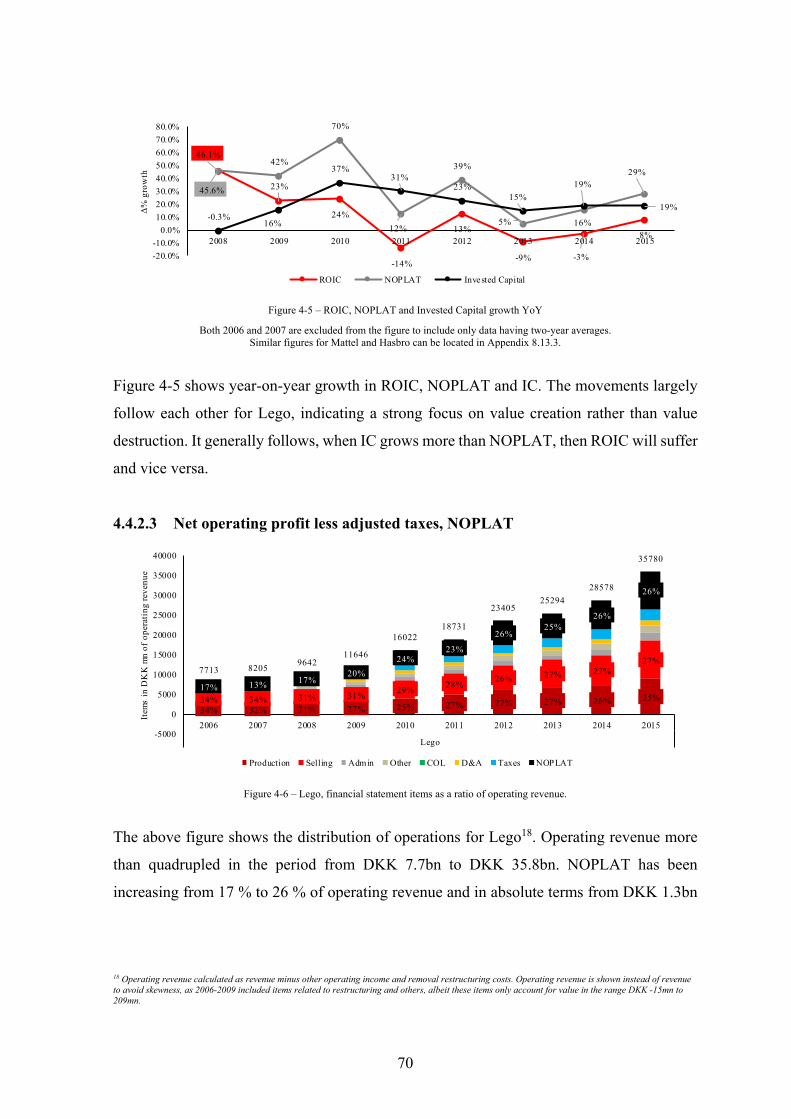
70
46.1%
23%
24%
-14%
13%
-9% -3%
8%
45.6%
42%
70%
12%
39%
5% 16%
29%
-0.3%16%
37%31%
23%15%
19%
19%
-20.0%
-10.0%
0.0%
10.0%
20.0%
30.0%
40.0%
50.0%
60.0%
70.0%
80.0%
2008 2009 2010 2011 2012 2013 2014 2015
Δ%
gro
wth
ROIC NOPLAT Invested Capital
Figure 4-5 – ROIC, NOPLAT and Invested Capital growth YoY
Both 2006 and 2007 are excluded from the figure to include only data having two-year averages. Similar figures for Mattel and Hasbro can be located in Appendix 8.13.3.
Figure 4-5 shows year-on-year growth in ROIC, NOPLAT and IC. The movements largely
follow each other for Lego, indicating a strong focus on value creation rather than value
destruction. It generally follows, when IC grows more than NOPLAT, then ROIC will suffer
and vice versa.
4.4.2.3 Net operating profit less adjusted taxes, NOPLAT
34% 32% 31% 27% 25% 27% 27% 27% 26% 25%34% 34% 31% 31%29%
28%26% 27% 27%
27%
17% 13% 17%20%
24%23%
26%25%
26%
26%
7713 82059642
11646
1602218731
2340525294
28578
35780
-5000
0
5000
10000
15000
20000
25000
30000
35000
40000
2006 2007 2008 2009 2010 2011 2012 2013 2014 2015
Lego
Item
s in
DK
K m
n o
f o
pera
ting
rev
enu
e
Production Selling Admin Other COL D&A Taxes NOPLAT
Figure 4-6 – Lego, financial statement items as a ratio of operating revenue.
The above figure shows the distribution of operations for Lego18. Operating revenue more
than quadrupled in the period from DKK 7.7bn to DKK 35.8bn. NOPLAT has been
increasing from 17 % to 26 % of operating revenue and in absolute terms from DKK 1.3bn
18 Operating revenue calculated as revenue minus other operating income and removal restructuring costs. Operating revenue is shown instead of revenue to avoid skewness, as 2006-2009 included items related to restructuring and others, albeit these items only account for value in the range DKK -15mn to 209mn.

71
to 9.4bn, equivalent to a seven doubling of NOPLAT in 10 years. Selling, administrative and
other costs combined have steadily been falling from 74 % (DKK 3.6bn) in 2006 to 58 %
(DKK 13.5bn) of operating revenue in 2015. From this can be inferred that Lego over the
period has become better at utilizing production- and sales capabilities (i.e. operating at
lower costs), while operating revenue at the same time have increased, indicating larger
sales. From Lego’s annual reports, it is evident that Lego does not grow by mergers and
acquisitions but instead via growth in sales. It is unknown whether higher-priced products,
more customers or a combination of both fuels larger revenue. However, for the most part,
more customers and products seems to be the major drivers as a seven-fold increase in selling
prices, c. p. would affect revenues and bottom-line negatively. While selling, administrative
and other costs have been falling steadily so has production costs. For the most part the fall
in production costs is attributed to production facility investments in countries featuring
lower wage costs and more automation, as well as recycling/reutilizing of production
materials, as well as insourcing of production capabilities.
Compared to peers, Lego’s NOPLAT ratio of revenue is 3 times larger (26%) in 2015, than
that of Mattel’s (8%), and two times larger than Hasbro’s (12%). Throughout the period
Lego’s NOPLAT ratio have been higher than both Hasbro’s and Mattel’s. This indicates that
Lego is effectively returning a larger bottom-line on the products it sells compared to Mattel
and Hasbro. For full overview on peers, see Appendix 8.13.6.
4.4.2.4 Asset turnover ratio and inverse
Asset turnover ratio (ATR) demonstrates a firm’s ability to “convert” assets effectively into
revenue generation. ATR is calculated as the ratio between average invested capital and
revenue. With Lego’s invested capital equaling DKK 20.4bn in 2015, using an ATR of 1.86
would yield the revenue of Lego (i.e. 20.4 * 1.86 = DKK 37.9bn19). The Inverse of ATR
(1/ATR) tells how much capital is required to generate DKK 1.00 of revenue. E.g. 1/1.86 =
DKK 0.54 to create DKK 1.00 of revenue.
19 37.9b is 2.0b larger than Lego’s actual revenue of 2015. The reason is that the IC capital is a two-year average distorts the picture in a minor degree. Using a non-averaged IC, the ATR is 1.75.

72
2007 2008 2009 2010 2011 2012 2013 2014 2015
Lego 1.73 2.06 2.18 2.18 1.96 1.99 1.86 1.77 1.86
Hasbro 1.98 1.91 1.60 1.33 1.35 1.28 1.36 1.40 1.35
Mattel 1.91 1.72 1.59 1.73 1.68 1.60 1.42 1.16 1.13
-
0.50
1.00
1.50
2.00
2.50
Ass
et t
urn
ov
er
Lego Hasbro Mattel
2007 2008 2009 2010 2011 2012 2013 2014 2015
Lego 0.58 0.48 0.46 0.46 0.51 0.50 0.54 0.57 0.54
Hasbro 0.50 0.52 0.62 0.75 0.74 0.78 0.74 0.71 0.74
Mattel 0.52 0.58 0.63 0.58 0.59 0.62 0.70 0.87 0.89
0.00
0.20
0.40
0.60
0.80
1.00
Inv
erse
Ass
et t
urn
ov
er
Lego Hasbro Mattel
Figure 4-7 – Comparison of Asset turnover ratio and inverse ATR
Left: Asset turnover ratio. Right: Inverse ATR.
It is evident that Lego outperforms its peers on ATR in every year except for 2007 (again
caused by the impact of restructuring costs). Hasbro and Mattel are, on average over the full
period performing equally (i.e. Hasbro’s ATRavg of 1.51 vs Mattel’s ATRavg 1.55), while
Lego’s average ATR clocking in at 1.96.
4.4.2.5 Net operating profit margin, NOPM
This figure shows how peer firms stack up in terms of net operating profit margin, NOPM
(calculated as NOPLAT / revenue). NOPM indicates how much revenue contributes to
bottom-line, NOPLAT. Lego is ahead of both Mattel and Hasbro with more than double the
profit margins.
14%17%
20%
24% 23%26% 25% 26% 26%
10%
9%11%
12% 11% 10%10%
12% 12%
11%
8%
12%
13% 14% 14% 15%
10% 8%
0%
5%
10%
15%
20%
25%
30%
2007 2008 2009 2010 2011 2012 2013 2014 2015
NO
PM
Lego Hasbro Mattel
Figure 4-8 – Net operating profit margin for all peers
Overall, Mattel seemingly underperforms throughout the period despite generating the
largest revenue of the three firms.
4.5 Summary
The purpose of this chapter was to provide financial insights of Lego in comparison to its
peer firms, Hasbro and Mattel during the 10 years of 2006-2015.

73
Lego has shown higher growth rates than peers and Lego is currently placed second in terms
of revenue but is closing the gap to Mattel. Lego’s revenue more than quadrupled from DKK
7.8bn in 2006 to DKK 35.8bn in 2015, resulting in a CAGR of 16.46 %. Hasbro almost
doubled its revenue in the same period to DKK 29bn (converted from USD), yielding a
CAGR of 3.50 %. Mattel showed a period CAGR of only 0.09% resulting in a revenue for
2015 of DKK 38.4bn largely fueled by a high increase in USD/DKK compared to previous
years as Mattel’s revenues fell year-on-year. NOPLAT for Lego more than seven doubled
in period. Selling, administrative and other costs combined ratio fell from 74 % (DKK 3.6bn)
in 2006 to 58 % (DKK 13.5bn) in 2015.
The findings reveal that Lego has undergone a transformation from a highly leveraged firm
in 2006-2010 to a leverage ratio (FLEV) below that of its peers, while still performing better
than peers in terms of ROE, ROIC, ATR and NOPM. FLEV for Lego felt from 223 % to 23
% in the period, while peers have maintained double and triple digit FLEV ratios throughout
the period. The findings also revealed that Lego has invested majority of its capital in
properties, plants and equipment, starting with 34 % in 2006, ending with 52 % in 2015.
Furthermore, Lego has shown to be better at utilizing invested capital by yielding more
revenue from production facilities and other assets, than both its competitors have managed.
Overall, it is concluded, that Lego has increased its spending in PPE, it has become better at
utilizing its production- and sales capabilities (i.e. operating at lower costs), while revenue
and NOPLAT at the same time have increased, indicating larger sales and market shares and
overall a better performing company than its peers. These findings indicate that, all else
equal, Lego calls for a higher valuation that its peers. In addition, the strong historic
development of Lego is expected to continue. The next section will dive into the valuation
of Lego and benchmark the firm against peers.

74
PART III
Budgeting & Valuation
75
5 Valuation of Lego
For valuation of firms, a number of models are available, including Discounted Cash Flow
(DCF), Real Option pricing and others. This valuation employs the DCF model. The purpose
of the DCF model is to calculate an enterprise value (EV) or valuation of a firm based on a
number of cash flows. As stated previously, this thesis’ chosen paradigm calls for testing
various methods and benchmarks in the research process. In line with the discontinuous
innovation approach described in the first chapter, methods and calculations of relevancy are
included along the analysis process to test interim results. The following sections
demonstrate the methods selected.
5.1 Discounted Cash flow model
The DCF model is a sum of present values of forecasted free cash flows (FCFs) as well as a
terminal value (horizon value). To calculate the present values, a discount rate is used. The
equation for the DCF model is shown below:
horizonvalue
11
1∗ (26)
The DCF model relies on forecasting of amount of free cash flows, s, discount rate
and a growth rate . In relation to the cause-relationship effect, previously illustrated with
equation (1), in equation (26) would be equal to yielding the following equation:
lim
→ ∓∞for all
(27)
Recall that can be zero and hence result in a true and fair valuation but as explained
previously it is impossible to determine whether the valuation is true and fair.
Using ‘going concern qualification’, a reflection hereby inevitably leads to question how
many free cash flows a potential investor can or should expect, as the equation allows for an
infinite amount. In accordance, the forecasting practice easily becomes a tradeoff between
uncertainty and flexibility, i.e. if the forecasting period is non-optimal, it may not match the
required risk and return profile. As argued by Brealey et al. (2011) and Damodaran (2013),
the amount of varies case by case and whatever amount is selected will naturally

76
impact the valuation. For Lego I have opted for a 10 year forecasting (9 years + 1 year
horizon) for a couple of reasons; First, taking into perspective both market- and technology
outlooks described in previous chapters, 10 years is assumed a fair period. Second, the 10
years follows the 10-year risk-free interest rate government bond duration. It can be argued,
that a simulation accounting for cash flow duration of varying length, would provide
perspective. However, this is avoided for brevity, and instead a simulation of the discount
factor is included. In similar fashion for the terminal value, a constant growth rate in
perpetuity is assumed. Moreover, assuming that a firm will continue in perpetuity and with
a constant growth rate, is perhaps too optimistic. The discount rate , or opportunity cost in
the DCF model can be calculated by different methods. In accordance with best practice by
Koller et al., (2010) and Damodaran (2013), I have opted for a calculation using the
Weighted Average Cost of Capital (WACC) equation. The WACC takes into account the
cost of debt and equity as proposed by Modigliani & Miller (1958, 1963). WACC is
described in the next section.
5.1.1 Weighted Average Cost of Capital, WACC
WACC is calculated using the following parameters:
∗ ∗ 1 ∗ (28)
As Lego employs operating leases, the WACC is adjusted according to Lim et al. (2003) and
Damodaran (1999), yielding the following:
∗ ∗ 1 ∗ ∗ ∗ 1 (29)
Parameters
= adjusted enterprise value cost of equity
debt corporate tax rate
cost of debt capitalized operating lease value
risk-free interest rate = Cost of operating lease
corporate default spread = beta of equity, = market risk premium
equity
Table 5-1 – Parameters for adjusted WACC

77
The risk-free interest rate is not shown in the equations for WACC and WACCadj but is
instead “concealed” as a component of both cost of equity and cost of debt. All parameters
are calculated in the following sections.
5.1.1.1 Corporate tax rate
The Danish corporate tax is 23.5 % for 2015, however Lego’s effective tax rate for 2015
was 24.48 %. The effective rate is used in subsequent calculations for Lego. Similarly, tax
rate calculations for Hasbro and Mattel is based on their effective tax rates yielding 26.00 %
and 20.37 % respectively.
5.1.1.2 Risk-free interest rate
The risk-free interest rate is a rate of return, which an investor can earn at virtually no risk.
Typically, the risk-free rate is linked to a risk profile of a country in the form of government
issued bonds. Such bonds rarely default, hence providing a good measure of something “risk-
free”. To determine the risk-free interest rate for the WACC, the Danish 10-years central
government bond is used, shown in the figure below.
Dip 12/1988 = 9.03%
Dip 01/1994 = 6.00%
Dip 01/1999 = 4.05%
Dip 08/2005 = 3.08%
Dip 08/2010 = 2.17%
Dip 02/2015 = .12%
12/2015 = .92%
y = 139.94e-2E-04x
R² = 0.7732
0%
2%
4%
6%
8%
10%
12%
14%
16%
1987
1988
1989
1990
1991
1992
1993
1994
1995
1996
1997
1998
1999
2000
2001
2002
2003
2004
2005
2006
2007
2008
2009
2010
2011
2012
2013
2014
2015
Inte rest Expon. (Interest)
Figure 5-1 – 10-year Danish government bond, nominal (1987/1/1 - 2015/12/1)
All available and comparable data was taken from (Danmarks Nationalbank, 2016)
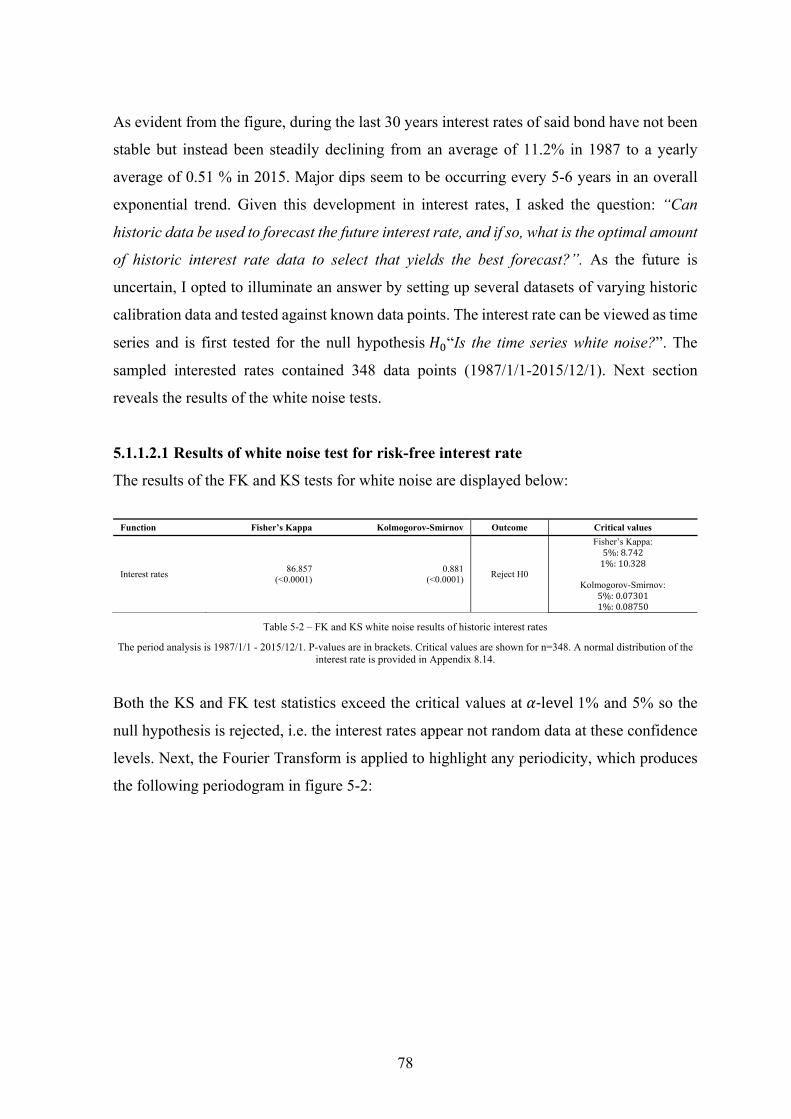
78
As evident from the figure, during the last 30 years interest rates of said bond have not been
stable but instead been steadily declining from an average of 11.2% in 1987 to a yearly
average of 0.51 % in 2015. Major dips seem to be occurring every 5-6 years in an overall
exponential trend. Given this development in interest rates, I asked the question: “Can
historic data be used to forecast the future interest rate, and if so, what is the optimal amount
of historic interest rate data to select that yields the best forecast?”. As the future is
uncertain, I opted to illuminate an answer by setting up several datasets of varying historic
calibration data and tested against known data points. The interest rate can be viewed as time
series and is first tested for the null hypothesis “Is the time series white noise?”. The
sampled interested rates contained 348 data points (1987/1/1-2015/12/1). Next section
reveals the results of the white noise tests.
5.1.1.2.1 Results of white noise test for risk-free interest rate
The results of the FK and KS tests for white noise are displayed below:
Function Fisher’s Kappa Kolmogorov-Smirnov Outcome Critical values
Interest rates 86.857
(<0.0001) 0.881
(<0.0001) Reject H0
Fisher’s Kappa: 5%:8.742 1%:10.328
Kolmogorov-Smirnov:
5%:0.07301 1%:0.08750
Table 5-2 – FK and KS white noise results of historic interest rates
The period analysis is 1987/1/1 - 2015/12/1. P-values are in brackets. Critical values are shown for n=348. A normal distribution of the interest rate is provided in Appendix 8.14.
Both the KS and FK test statistics exceed the critical values at ‐level 1% and 5% so the
null hypothesis is rejected, i.e. the interest rates appear not random data at these confidence
levels. Next, the Fourier Transform is applied to highlight any periodicity, which produces
the following periodogram in figure 5-2:
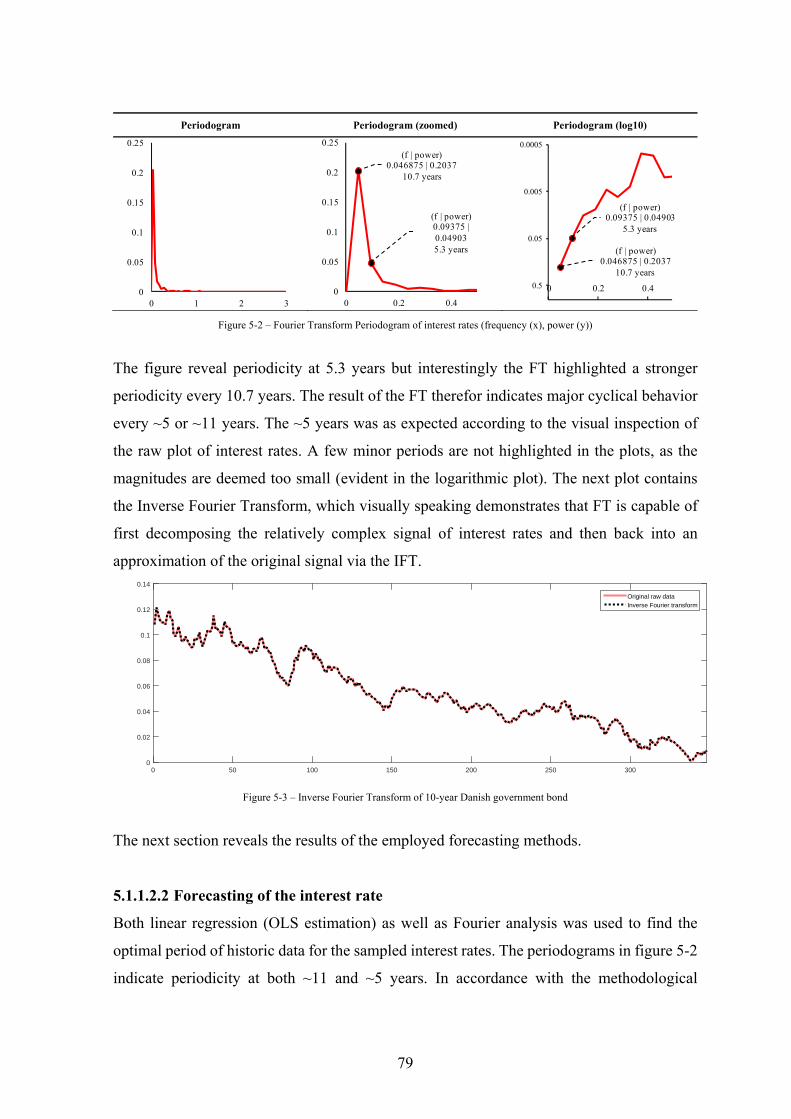
79
Periodogram Periodogram (zoomed) Periodogram (log10)
0
0.05
0.1
0.15
0.2
0.25
0 1 2 3
(f | power)0.046875 | 0.2037
10.7 years
(f | power)0.09375 | 0.049035.3 years
0
0.05
0.1
0.15
0.2
0.25
0 0.2 0.4
(f | power)0.046875 | 0.2037
10.7 years
(f | power)0.09375 | 0.04903
5.3 years
0.0005
0.005
0.05
0.5 0 0.2 0.4
Figure 5-2 – Fourier Transform Periodogram of interest rates (frequency (x), power (y))
The figure reveal periodicity at 5.3 years but interestingly the FT highlighted a stronger
periodicity every 10.7 years. The result of the FT therefor indicates major cyclical behavior
every ~5 or ~11 years. The ~5 years was as expected according to the visual inspection of
the raw plot of interest rates. A few minor periods are not highlighted in the plots, as the
magnitudes are deemed too small (evident in the logarithmic plot). The next plot contains
the Inverse Fourier Transform, which visually speaking demonstrates that FT is capable of
first decomposing the relatively complex signal of interest rates and then back into an
approximation of the original signal via the IFT.
0 50 100 150 200 250 3000
0.02
0.04
0.06
0.08
0.1
0.12
0.14
Original raw dataInverse Fourier transform
Figure 5-3 – Inverse Fourier Transform of 10-year Danish government bond
The next section reveals the results of the employed forecasting methods.
5.1.1.2.2 Forecasting of the interest rate
Both linear regression (OLS estimation) as well as Fourier analysis was used to find the
optimal period of historic data for the sampled interest rates. The periodograms in figure 5-2
indicate periodicity at both ~11 and ~5 years. In accordance with the methodological

80
challenges and theory described in the introduction chapter, other periods are included in the
analysis for benchmarking purposes. To benchmark results, mean absolute deviation (MAD)
was used. While other methods such as the squared standard deviation exist, MAD was
selected as it expresses accuracy in the same units as the input data. MAD was calculated
with the following equation:
1∗ | | (30)
equals benchmarked data, forecasted values and the amount of data. In this case,
varying amounts of historic (calibration) data was used to forecast months 1 to 12 of 2015
and finally benchmarked against the real data for 2015 to expose the MAD.
Benchmarks are shown in table 5-3.
Calibration data MAD
Detrending 5:1 (2010-2014 : 2015) 0.398%
Detrending 6 months (2015 : 2015) 0.542%
Detrending 10:1 (2005-2014 : 2015) 0.606%
Detrending 3:1 (2012-2014 : 2015) 0.647%
Fourier (2009-2014 [apr] : 2015) 0.701%
Detrending 1:1 (2014 : 2015) 0.702%
Detrending 20:1 (1995-2014 : 2015) 0.721%
Detrending 5:5 (2006-2010 : 2011-2015) 1.045%
Fourier (2000-2010 [aug] : 2011-2015) 2.048%
Fourier (2004-2014 [aug] : 2015) 2.371%
Fourier (1993-2014 [aug] : 2015) 2.965%
Tests conducted 11
Median of tests conducted 0.702%
Mean of tests conducted 1.159%
Std. dev. of tests conducted 0.835%
Table 5-3 – Interest rate forecasts benchmarked using MAD The table lists the results of regression and Fourier analysis with calibration data of varying length. The total data analysis comprised of around 36,000 data points which were too large to fit in the appendix – instead, please refer to the Excel spreadsheet for data. Detrending 5:1 (2010-2014 : 2015) means: 5 years, i.e. 2010-2014 of historical data was used for calibration and 1 year, i.e. 2015 was forecasted and finally benchmarked with MAD. In general, OLS estimation seems to produce a lower MAD than Fourier Transform albeit the difference between the OLS estimation with lowest MAD (0.398 %) is relatively close to the FT with lowest MAD (0.701 %). For all tests, Excel was used. Excels’ built-in Fourier Analysis algorithm requires the amount of calibration data to be a power of 2 (i.e. 2, 4, 8, … 64, 128 etc), which is why some calibration periods are selected to end at April or August instead of selecting a full year. This means that not all tests are directly comparable, which, c. p. yields skewed results. However, I assume this not to be a major drawback.
Below are plots of the OLS estimation and Fourier Transform with the lowest MAD.
0.00%0.50%1.00%1.50%2.00%2.50%3.00%3.50%4.00%
0 12 24 36 48 60 72
Months
Detrending 5:1 (2010-2014 : 2015)
Rate Detrended Benchmarked Forecast
Figure 5-4 – Interest rate OLS estimation and forecast
0.00%0.50%1.00%1.50%2.00%2.50%3.00%3.50%4.00%
0 12 24 36 48 60 72 84
Months
Fourier (2009-2014 [apr] : 2015)
Rate Fourier - 1st year Benchmarked Forecast
Figure 5-5 – Interest rate Fourier Transform estimation and forecast
As shown from the plots, the OLS estimation forecast follows the downward trend of
previous data as expected (Newbold et al., 2010), while the FT forecast quickly resumes to
the trend of the benchmarked data but in this case lies above the actual benchmark. I ascribe
this deviation from the benchmarked data as the way the Fourier algorithm works, only being
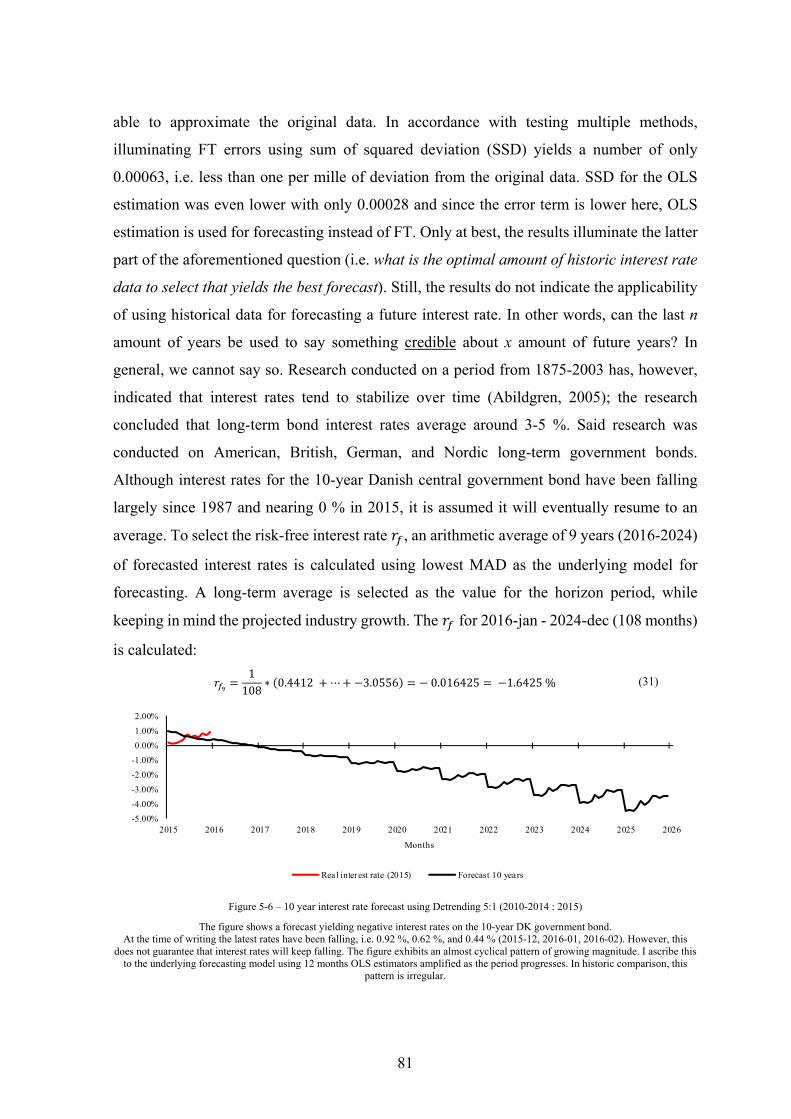
81
able to approximate the original data. In accordance with testing multiple methods,
illuminating FT errors using sum of squared deviation (SSD) yields a number of only
0.00063, i.e. less than one per mille of deviation from the original data. SSD for the OLS
estimation was even lower with only 0.00028 and since the error term is lower here, OLS
estimation is used for forecasting instead of FT. Only at best, the results illuminate the latter
part of the aforementioned question (i.e. what is the optimal amount of historic interest rate
data to select that yields the best forecast). Still, the results do not indicate the applicability
of using historical data for forecasting a future interest rate. In other words, can the last n
amount of years be used to say something credible about x amount of future years? In
general, we cannot say so. Research conducted on a period from 1875-2003 has, however,
indicated that interest rates tend to stabilize over time (Abildgren, 2005); the research
concluded that long-term bond interest rates average around 3-5 %. Said research was
conducted on American, British, German, and Nordic long-term government bonds.
Although interest rates for the 10-year Danish central government bond have been falling
largely since 1987 and nearing 0 % in 2015, it is assumed it will eventually resume to an
average. To select the risk-free interest rate , an arithmetic average of 9 years (2016-2024)
of forecasted interest rates is calculated using lowest MAD as the underlying model for
forecasting. A long-term average is selected as the value for the horizon period, while
keeping in mind the projected industry growth. The for 2016-jan - 2024-dec (108 months)
is calculated:
1108
∗ 0.4412 ⋯ 3.0556 0.016425 1.6425% (31)
-5.00%
-4.00%
-3.00%
-2.00%
-1.00%
0.00%
1.00%
2.00%
2015 2016 2017 2018 2019 2020 2021 2022 2023 2024 2025 2026
Months
Real interest rate (2015) Forecast 10 years
Figure 5-6 – 10 year interest rate forecast using Detrending 5:1 (2010-2014 : 2015)
The figure shows a forecast yielding negative interest rates on the 10-year DK government bond. At the time of writing the latest rates have been falling, i.e. 0.92 %, 0.62 %, and 0.44 % (2015-12, 2016-01, 2016-02). However, this
does not guarantee that interest rates will keep falling. The figure exhibits an almost cyclical pattern of growing magnitude. I ascribe this to the underlying forecasting model using 12 months OLS estimators amplified as the period progresses. In historic comparison, this
pattern is irregular.
82
From the figure above the risk-free interest rate becomes negative over time, which
translates into “paying for safety” for holding the risk-free government bond, rather than
earning an economic return. The bond interest rate is calculated in nominal terms and the
real interest rate will naturally be offset by the fluctuations of inflation. It is assumed, that
holding a risk-free government bond, does not equate into investors changing behavior, i.e.
wanting to “pay for safety”. Investors may simply go somewhere else and invest in other
securities even if these are more risky. Assuming that interest rates must be positive in the
long term, the OLS forecasting model fails at approximation. While we cannot know if past
data is a good measure for prediction, we know from empirical evidence that interest rates
generally return to an average. In light of these findings, and to match the selected DCF
period, 10 years of average historical interest rates will be used to predict the next 10 years.
However, it being understood that this may be an over-simplification of the prediction model
possibly fueling the residual effect challenges described in the scientific framework section.
The arithmetic average of monthly interest rates of past 10 years (2006-2015) yields a risk-
free rate of 2.6225:
1120
∗ 0.0345… 0.009200 0.026225 2.6225% (32)
5.1.1.3 Corporate default spread
The corporate default spread measures the credit risk of the firm in question. Lego’s own
estimation of its latest credit risk (LEGO, 2015a), is considered “low”. Using the interest
coverage ratio (ITR) by Damodaran (2016a) yields an “AAA” rating equal to a of 0.75 %.
Conjugating this with Standard & Poor’s definition of “AAA” means “The obligor's (Lego)
capacity to meet its financial commitment on the obligation is extremely strong” (Standard
& Poor’s, 2011, p. 3). This definition is assumed a good approximation for Lego given the
firm’s strong financial performance since 2005-2006.
5.1.1.4 Cost of debt
The cost of debt is the effective rate a firm pays on its debt. The following shows the
calculation of the cost of debt:
r 0.75% 2.6225% 3.373% (33)

83
5.1.1.5 Capital structure for Lego
The general idea behind selecting an optimal capital structure is to select one that maximizes
firm value. Firm value is inversely related with cost of capital, e.g. PV/WACC and by using
debt financing a firm can lower its capital costs while increasing firm value. However, a
higher degree of debt financing leads to an increased risk profile for the firm. To calculate
the capital structure, typically the market values of debt and equity are used but since Lego
is a private firm these values are not available and instead only the book values can be
obtained. This poses an obstacle since the market values are needed for deriving a beta value
and later the WACC. Various approaches exist to mitigate the obstacle – for example using
peer values (Brealey et al., 2011; Damodaran, 2013; Koller et al., 2010). Using debt and
equity from peers suggests that Lego should be performing similarly. However, the study of
all peers’ financials indicate that Lego is generally a better performing firm. Due to this
finding, I find it inappropriate to rely solely on peers as benchmarks for the Lego’s market
values of debt and equity. Instead, I will assume Lego’s latest book capital structure mixed
with a weighted average of peer beta values is optimal. While this does not produce true
market values of equity and beta, it is assumed that this will provide good approximated
ratios for later calculations.
(34)
2679 17751 4555 24985 (35)
5.1.1.6 Beta of equity
The beta value is a measurement of sensitivity of an asset’s movements in relation to the
market. A beta of one indicates that in theory the underlying asset will be just as volatile as
the market itself, while an asset beta of e.g. 0.7 indicates 30 % less volatility than the market.
Since Lego is an unlisted firm, Lego’s beta value is derived based on weighted averages of
beta values of Lego’s peers, Hasbro and Mattel. As beta values for the peers are reported on
levered equity , the beta values are first unlevered and then the beta for Lego is
calculated. The standard Modigliani & Miller (M&M) beta relation, also known as
Hamada’s equation (Hamada, 1972)
is used to derive the unlevered beta values:
1 1 ∗ (36)
Rearranging gets the levered beta:

84
∗ 1 1 ∗ (37)
As pointed out by Hansen & Erhardi (2002), M&M’s beta relation implicitly assumes
constant debt in infinity and in similar fashion, that future cash flows remain constant in
infinity. To avoid such scenario, they highlight the benefits of using the beta relation
described by Chambers, Harris & Pringle (1982): if the levered firm rebalances its debt to
maintain a constant debt/value ratio, the beta value will depend on operations rather than
constant debt. However, this requires forecasting of the debt, which will be avoided for
brevity. The following table shows the calculated unlevered and levered beta value for Lego
using the M&M beta relation:
Firm Beta lev Debt USD mn Share price # million shares Equity USD mn Debt/equity Tax rate Beta unlev
Hasbro 0.9703 1269 24.86 124.975 3107 40.8% 26.00% 0.7451 Mattel 0.8931 1190 27.17 339.748 9231 12.9% 20.37% 0.8099 Averages 0.9317 26.9% 0.7775 Lego 0.9858 15.1% 24.48% 0.8849
Table 5-4 – Beta values for Lego
All numbers are ultimo 2015. Debt is calculated as NIBD minus capitalized operating leases. Beta unlevered is using a weighted average with more weight (76 % = [1-(12.9%/(40.8%+12.9%))]) to Mattel than Hasbro’s debt/equity. The reason for the weighted average is because Mattel has a lower debt/equity ratio than Hasbro. Lego’s debt/equity ratio is using book values adjusted for operating leases.
Beta values are taken from YCharts which are calculated using 60 months average market return.
Lego’s levered beta value is calculated to 0.9858.
5.1.1.7 Expected market risk premium
The market risk premium captures the additional risk (return) an investor requires to
acquire a given asset. While the topic and methods for calculations is widely debated, Koller
et al. (2010) have found the appropriate market risk premium to be somewhere in the range
of 4.5 - 5.5 %. Koller et al. reached this conclusion by looking at research on market risk
premiums using extrapolation, regression analysis and DCF calculations related to market
risk premiums. In reflection, Lego is a Danish company, and so a market risk premium for
Denmark is taken into consideration. Damodaran (2015a) calculates the market risk
premium for Denmark to 5.81 %. Using an arithmetic average of 4.5 %, 5.5% and 5.81 %
yields a market risk premium of 5.27 %, which is used in the following sections.

85
5.1.1.8 Cost of equity
To calculate the cost of equity, the original capital asset pricing model (CAPM) described
by Sharpe (1964), Lintner (1965) and Black (1972) is used. Grounded in portfolio theory by
Markowitz (1959), the CAPM specifies a linear relationship between risk-free rate and
expected market return to derive expected return on an asset .
R ∗ – (38)
Arguably, the CAPM has its shortcomings as pointed out by various scholars. Banz (1981)
for example, found that there is a difference between smaller and larger firms when risk
adjusting returns. On average, smaller firms have higher adjustments than larger firms do
and moreover the relationship is not linear. In contrast, the risk adjustment effects for equally
sized firms were found to be minor. Other scholars such as Fama & French (1993, 1996)
have found empirical evidence that more factors should be included to estimate cost of
capital, denouncing the original specifications of the CAPM. Fama & French (1993, 1996)
proposes a multiple regression model consisting of three factors i.e. market return minus risk
free rate and proxies for both firm size and book-to-market value. The beta values from
Hasbro and Mattel shown in a previous section follow the three-factor model but as this
model requires calculation on the return of an asset and Lego is unlisted firm, the model
cannot be applied to Lego. Instead, I have opted for CAPM for Lego using the averaged peer
betas (which actually are based on the three factor model). The result is weighted values of
the Fama & French three-factor model, applied within the original CAPM. All parameters
are already calculated in previous sections and the result of the CAPM is then revealed:
R 0.026225 0.9848 ∗ 0.0527– 0.026255 4.9631% (39)
5.1.1.9 Adjusted WACC
The adjusted WACC can now be derived. Since debt and operating leases are impacted by
taxes, the WACC is adjusted accordingly. The following table shows the adjusted WACC
and ROIC-WACC spread for all firms in 2015.
Parameter Lego Hasbro Mattel
WACCadj 4.4423% 3.9948% 4.4800%
ROIC 49.29% 16.08% 9.41%
ROIC-WACCadj spread 44.85% 12.09% 4.93%
Table 5-5 – ROIC-WACC spread for all firms
For calculation of WACCadj please refer to Appendix 8.15
86
The spread is a measure of an investors expected return on an investment in a given firm.
For instance, a spread of 20.00 % means that pure economic value of 0.2000 is created for
each unit of currency invested. In reflection of these numbers, Lego has published the firm’s
overall WACC in the annual reports for 2010, 2011, and 2012, equal to 13.54% (LEGO,
2010, 2011, 2012a). The Lego WACC is in relatively sharp contrast to the 4.4423 %
calculated here, even considering the time difference of 4-6 years. This highlights the
problem with information asymmetry and/or the input parameters in the WACC model. For
example, debt, equity and value ratios can differ among investors. Here we rely solely on
reformulated book values for debt (i.e. NIBD) but other investors may use a different metric
for debt. Kirkbi A/S’s annual report for 2015 reveals a WACC of 8% for both 2014 and
2015, albeit related only to Lego’s trademarks and not the Lego firm as a whole (Kirkbi,
2015). Damodaran calculates the industry cost of capital20 (global perspective) to 8.32 % in
2015 based on a sample size of 293 firms in the “recreational” sector. This recreational sector
includes both toy firms (e.g. Hasbro and Mattel) but also unrelated firms such as local
traveling, sports and amusement park firms (Damodaran, 2015b) and as such is not the best
comparison. Although the calculated WACC differs from the ‘WACC by Lego’, it is used
in the following sections to arrive at a valuation of Lego.
5.2 Budgeting
The budgeting takes into account the strategic and financial analyses explained in previous
chapters. Lego’s historic revenue was tested for randomness to determine whether FT should
be used for forecasting. NOPLAT was tested as well to see if this was a better parameter for
forecasting. However, test results are questionable (see Appendix 8.16) and instead, OLS
estimation, lowest R squared, and lowest Euclidean Distance (ED) as determining factors
are used for best model selection to forecast the budget. To forecast the budget I have opted
for revenue as the main driver. The budgeted numbers in general appear to be in-line with
historical growth, indicating that the budget is not deviating from the norm. The growth rate
20 Damodaran notes: “The weighted average of the cost of equity and after-tax cost of debt, weighted by the market values of equity and debt: Cost of Capital = Cost of Equity (E/(D+E)) + After-tax Cost of Debt (D/(D+E)) - For the weights, we use cumulated market values for the entire sector.”(Damodaran, 2016b)

87
‘g’ was estimated in previous chapters to 2.34 % and is used for the terminal period. The
budget is found in Appendix 8.17.
5.3 Valuation with DCF
The following shows the valuation of Lego. The valuation uses the adjusted WACC and
growth rates calculated in previous sections.
Lego, DCF, DKK mn Budget Terminal
1 2 3 4 5 6 7 8 9 10
2016 2017 2018 2019 2020 2021 2022 2023 2024 2025
Free Cash Flow (FCF) 8155 9084 9965 10780 11509 12134 12635 12994 13191 11811
Discount factor 0.9575 0.9167 0.8777 0.8404 0.8046 0.7704 0.7376 0.7062 0.6762 0.6762
PV of FCF 7808 8327 8747 9059 9261 9348 9320 9177 8920 7986
Terminal value 379918
WACC 4.4439%
Growth rate, terminal (g) 2.34%
Valuation:
Sum FCF (budget) 79966
Sum FCF (terminal) 379918
= Enterprise value 459884
NIBD 2679
= Equity value 457205
Table 5-6 – Valuation of Lego
The enterprise value of Lego is calculated to the sum of DKK ~460bn and is put into
perspective in the following.
5.3.1 Sensitivity analysis with Monte Carlo simulation
The adjusted WACC comprises constant parameters that fail to account for changing
scenarios, including but not limited to cases where a firm changes capital structure, or the
markets change perception of a firm’s risk profile. As explained previously, firms are not
static entities and utilizing constant parameters will c.p. result in skewed valuation as it is
expected that parameters can and perhaps will change over time. To illuminate these
dynamics, a WACC sensitivity analysis is created using Monte Carlo simulation. The
following figure is produced by mapping WACC against growth rate.

88
Figure 5-7 – EV sensitivity analysis – two dimensions
The plot shows a mapping of the two dimensions WACC and growth g yielding various enterprise values for Lego. The upper bound WACC rate is the one calculated by Lego (13.54%) while the lower bound is 4.4439 %. On the z-axis, growth rate ranges from 1-3%.
Actual numbers can be found in the appendix. Coloring may be difficult to discern in print.
Included in appendix 8.18 is a normal distribution plot of a one-side sensitivity analysis
holding growth constant (2.34%) while keeping the WACC variable in the same range as
above. This distribution is also reflected in the figure above albeit with less detail. The
normal plot indicates that majority of the valuation is in the range DKK 87bn-354bn with a
mean value of DKK 178bn. It also indicates that the enterprise value is rather sensitive to
‘small’ changes in WACC and g.
5.3.2 Comparison with peer companies
To put the valuation of Lego into perspective, the firm is compared against the peer group
current valuation of 2015.
Valuation Dec 31 - DKK bn 2007 2008 2009 2010 2011 2012 2013 2014 2015
Hasbro market cap 20.22 20.68 23.53 36.45 21.97 26.82 40.50 38.47 56.46 NIBD 3.46 4.05 6.91 8.53 9.53 9.74 6.47 10.18 11.06 Hasbro EV 23.69 24.73 30.44 44.97 31.50 36.56 46.97 48.65 67.52 Mattel 37.46 29.21 38.71 49.91 50.11 72.63 90.69 58.79 62.02 NIBD 5.95 7.04 4.22 4.71 7.30 5.58 10.40 13.36 14.37 Mattel EV 43.41 36.26 42.93 54.62 57.41 78.20 101.09 72.14 76.39
Figure 5-8 – EV, Hasbro, Mattel in DKK bn
Stock prices are annual averages. Market cap data from Bloomberg and Yahoo Finance. All numbers are converted to DKK using annual averaged currency exchange rates.

89
Lego EV was calculated to DKK ~460 and Hasbro’s and Mattel’s EVs in 2015 are 8x and
6x lower as can be seen from the table above. It is worth noting that EVs for peer firms may
or may not include forward-looking views in term of projected cash flows, i.e. investors may
have ‘variable-length perspectives’ and value the firm differently. It is fair to assume that
reported market caps are averages of all investors. However, even averages may still not
reflect optimal EVs as investors can still be biased and speculative causing market caps (and
therefore EVs) to be skewed. Accordingly, benchmarking against peers may therefor
produce skewed conclusions. The valuation of Lego can seem high but when factoring in
Lego’s current growth as well as its potential strategically and economically, its historically
larger cash flows, higher performance and underlying budgeting, the valuation is assumed a
fair approximation. In reflection hereof and in relation to the research design, the underlying
data, models and chosen framework may be incomplete and not capture all aspects of the
firm and market situation thus changing the resulting valuation.
90
PART IV
Concluding Remarks

91
6 Conclusion
The aim of this thesis has been to arrive at a fair valuation of Lego. The valuation of Lego
is estimated to be DKK ~460bn using a 10 year budget of discounted cash flows, covering
the period 2016-2025. The WACC rate was calculated to 4.4439 % and the terminal growth
rate, g to 2.34 %.
Lego being an unlisted firm and analyzing from an outside perspective,
indicates challenges with information asymmetry and as such, the research design was
adapted. A cause-and-effect relationship between drivers of value creation/destruction and a
given firm was assumed deterministic of valuation. As argued, a correct identification and
estimation of such value drivers is not easy and perhaps impossible. Furthermore, bias and
information asymmetry makes the valuation a challenging endeavor. The results is that one
cannot know if the valuation is correct, but instead should anticipate a valuation
encompassed with errors. Furthermore, it was argued that the ‘trueness’ of valuations cannot
be empirically verified. In light of this, theory asks to try to minimize potential errors, bias
and to answer the research question by using benchmark testing, reflection of model
selection, as well as peer group comparison.
Various models were benchmarked against each other in accordance with the research
design. As the valuation relies (amongst others) on time series data, Fourier function
approximation was included to try to minimize anticipated errors. The 10-year Danish
government bond interest rate, as well as metrics based on reformulated financials, revenue
and NOPLAT, were tested for white noise before any use of Fourier. The testing for revenue
and NOPLAT revealed mixed results and Fourier analysis was therefore avoided. On the
other hand, interest rates showed no randomness at 1% and 5% -levels and Fourier analysis
revealed major fluctuations at ~5 and ~11 years intervals for the interest rate data, making it
an exciting case for further analysis. The time series transform was benchmarked against
regression models to see which would be better at forecasting. It was found that regression
performed marginally better than Fourier forecasting of the interest rates did. Forecasting of
interest rates yielded negative values and therefore an average interest rate based on historic
data was used instead for further calculations.

92
To derive a budget for Lego, 10 years of prior data using revenue as guiding factor was
modelled. The budget was in line with the strategic analysis and financial analysis of Lego,
Lego’s two main competitors Hasbro and Mattel, as well the toys and games industry. To
include the ‘fairness’ definition, the valuation was simulated with Monte Carlo on one- and
two dimensions to yield ‘what if’ scenarios. The simulation indicated majority of the
estimated enterprise values to be in the range DKK 87bn-354bn with a mean value of DKK
178bn. The original valuation of DKK ~460bn showed to be 8x-6x higher than peer firms
Hasbro and Mattel. It was argued that Lego has been performing better according to financial
statement analysis than the peer firms. Furthermore, the strategical analysis indicated an
exciting future for Lego, which gives credit to the original valuation, and as such, it is
assumed that the valuation is fair.
6.1 Future research
As the findings in this thesis are based on secondary data, naturally it would be interesting
to see if primary data would reveal different results and perhaps narrow the gap between the
WACC rate calculated and the one Lego has reported. As outlined previously in the strategic
analysis sections, demand in the toy industry is highly seasonal and driven by short product
life cycles. In addition, Lego has been struggling to keep up with demands during holiday
seasons, therefore missing sales. According to the firm, the number of temporary workers in
Lego’s brand stores increased in 2015 from around an average of 300 people to around 750
during the last quarter of the year. Managing the supply chain optimally is expected to
become an even larger challenge given the projected growth over the next 10 years. In
relation thereof, two areas of further research could be interesting to dive into: 1) forecasting
of demand for toys by applying Fourier analysis on daily time series sales data from Lego
and 2) applying machine learning (ML) to grasp demographic factors’ impact in relation to
sales demand. The nature (e.g. characteristic, size and most importantly timing) of data
material related to demographics, such as population composition (age, wealth, education
level, age compression, transition to adulthood) gathered on an entire population could yield
large and complex datasets consisting of perhaps millions or even billions of data points.
This is where machine learning comes in handy as the scope, scale and time constraints
require fast response in order for the supply chain to cope with the ever-changing demand
situation in the toy industry. Billari, Fürnkranz, and Prskawetz (2006) have previously

93
successfully used ML in a related field (specifically related to people in Italy and Austria).
They used ML to identify “pathways” into adulthood, i.e. “what events mark transition into
adulthood?”. Empirically we know that customers eventually grow too old to be considered
primary users of toys – in Lego’s case the primary age group is 1½-11 years old, even if
adults still use their products. Knowing exact pathways into adulthood is something that
could be important for toy firms to know, especially in relation to supply chain optimization
to avoid over-stocking but also to develop new products aimed at maintaining existing
customers longer. Keeping these findings in mind as well as the socio-cultural challenges
Lego and the toy industry faces, I think that makes ML in combination with demand
forecasting an interesting further topic of research. Analogous to research conducted on fast
moving consumer goods (i.e. fashion items) by Fumi et al., (2013), Fourier and ML research
may reveal how Lego’s supply chain could be further optimized in relation to “out-of-stock”-
situations or overstocked stores and warehouses. Further optimizing the supply chain at Lego
with stronger demand forecasting tools could result in improved financials, c. p. yielding an
even higher valuation.

94
7 References
Abildgren, K. (2005). A historical perspective on interest rates in Denmark 1875-2003 (Working paper No. 24) (pp. 1–68). Danmarks Nationalbank. Retrieved from http://www.nationalbanken.dk/en/publications/Pages/2005/02/A-historical-perspective-on-interestrates-in-Denmark-1875-2003.aspx
Ahsan, K., & Gunawan, I. (2014). Analysis of Product Recalls: Identification of Recall Initiators and Causes of Recall. Operations and Supply Chain, 7(3), 97–106.
Andersen, L. (2005, December 12). LEGO kan ikke følge med salget. Finans. Retrieved from http://finans.dk/artikel/ECE5033337/LEGO-kan-ikke-f%C3%B8lge-med-salget/?ctxref=ext
Ang, J. S. (1991). Small Business Uniqueness and the Theory of Financial Management. The Journal of Entrepreneurial Finance.
Anwar, S. T. (2014). Product recalls and product-harm crises: A case of the changing toy industry. Competitiveness Review, 24(3), 190–210. http://doi.org/10.1108/CR-02-2013-0011
Armstrong, C. S., Core, J. E., Taylor, D. J., & Verrecchia, R. E. (2011). When Does Information Asymmetry Affect the Cost of Capital? Journal of Accounting Research, 49(1), 1–40. http://doi.org/10.1111/j.1475-679X.2010.00391.x
Baker, G. P., Jensen, M. C., & Murphy, K. J. (1988). Compensation and Incentives: Practice vs. Theory. The Journal of Finance, 43(3), 593–616. http://doi.org/10.1111/j.1540-6261.1988.tb04593.x
Balakrishnan, S., & Fox, I. (1993). Asset specificity, firm heterogeneity and capital structure: Specificity, Capital Structure. Strategic Management Journal, 14(1), 3–16. http://doi.org/10.1002/smj.4250140103
Banz, R. W. (1981). The relationship between return and market value of common stocks. Journal of Financial Economics, 9(1), 3–18. http://doi.org/10.1016/0304-405X(81)90018-0
Barney, J. B. (1991). Firm Resources and Sustained Competitive Advantage. Journal of Management, 17(1), 99–120. http://doi.org/10.1177/014920639101700108
Barney, J. B. (1995). Looking inside for competitive advantage. Academy of Management Perspectives, 9(4), 49–61. http://doi.org/10.5465/AME.1995.9512032192
BASF. (2015). Interim Report, 3rd Quarter. Berger, T. (2014, November 8). Lego melder udsolgt inden jul. Skalvilege.nu. Retrieved
from http://www.skalvilege.nu/2014/11/lego-melder-udsolgt-inden-jul/ Billari, F. C., Fürnkranz, J., & Prskawetz, A. (2006). Timing, Sequencing, and Quantum of
Life Course Events: A Machine Learning Approach. European Journal of Population / Revue Européenne de Démographie, 22(1), 37–65. http://doi.org/10.1007/s10680-005-5549-0
Black, F. (1972). Capital Market Equilibrium with Restricted Borrowing. The Journal of Business, 45(3), 444–455.
Bloomfield, P. (2000). Fourier analysis of time series: an introduction (2nd ed). New York: Wiley.
95
Brealey, R. A., Myers, S. C., & Allen, F. (2011). Principles of corporate finance (10. ed., global ed). New York, NY: McGraw-Hill Irwin.
Brown, L. D., & Rozeff, M. S. (1978). The Superiority of Analyst Forecasts as Measures of Expectations: Evidence from Earnings. The Journal of Finance, 33(1), 1. http://doi.org/10.2307/2326346
Carrero, V., Peiro, J. M., & Salanova, M. (2000). Studying radical organizational innovation through grounded theory. European Journal of Work and Organizational Psychology, 9(4), 489–514. http://doi.org/10.1080/13594320050203102
Carr, P., & Madan, D. B. (1999). Option valuation using the fast Fourier transform. Journal of Computational Finance, 1–18.
Carstensen, N. (2006, October 26). Lego må melde udsolgt før jul. Børsen. Retrieved from http://borsen.dk/nyheder/generelt/artikel/1/97426/lego_maa_melde_udsolgt_foer_jul.html
Chambers, D. R., Harris, R. S., & Pringle, J. J. (1982). Treatment of Financing Mix in Analyzing Investment Opportunities. Financial Management, 11(2), 24–41.
Chudson, W. A. (1945). Cash, Marketable Securities, and Receivables. In The Pattern of Corporate Financial Structure: A Cross-Section View of Manufacturing, Mining, Trade, and Construction, 1937 (Vol. National Bureau of Economic Research, pp. 34 – 45). NBER. Retrieved from http://www.nber.org/chapters/c9211.pdf
Cohen, B. D., & Dean, T. J. (2005). Information asymmetry and investor valuation of IPOs: top management team legitimacy as a capital market signal. Strategic Management Journal, 26(7), 683–690. http://doi.org/10.1002/smj.463
Cook, T. D., Campbell, D. T., & Day, A. (1979). Quasi-experimentation: Design & analysis issues for field settings (Vol. 351). Boston: Houghton Mifflin.
Coppel, W. A. (1969). J. B. Fourier--On the Occasion of His Two Hundredth Birthday. The American Mathematical Monthly, 76(5), 468. http://doi.org/10.2307/2316953
Creswell, J. W. (2003). Research design: qualitative, quantitative, and mixed method approaches (2nd ed). Thousand Oaks, Calif: Sage Publications.
Cross Validated. (2016, March 24). How to create a distribution table of Fisher ξ? Retrieved from http://stats.stackexchange.com/questions/203410/how-to-create-a-distribution-table-of-fisher-xi
Damanpour, F. (1996). Organizational complexity and innovation: developing and testing multiple contingency models. Management Science, 693–716.
Damodaran, A. (1999). Dealing with Operating leases in Valuation. NYU Working Paper, (FIN-99-023). Retrieved from http://papers.ssrn.com/sol3/papers.cfm?abstract_id=1297077
Damodaran, A. (2013, Spring). AN INTRODUCTION TO VALUATION. Damodaran, A. (2015a). Country Risk: Determinants, Measures and Implications - The 2015
Edition. SSRN Electronic Journal. http://doi.org/10.2139/ssrn.2630871 Damodaran, A. (2015b, January). Useful Data Sets. Retrieved from
http://people.stern.nyu.edu/adamodar/New_Home_Page/dataarchived.html#region

96
Damodaran, A. (2016a, January). Ratings, Interest Coverage Ratios and Default Spread. Retrieved from http://pages.stern.nyu.edu/~adamodar/New_Home_Page/datafile/ratings.htm
Damodaran, A. (2016b, January). Variables used in Data Set. Retrieved from http://pages.stern.nyu.edu/~adamodar/New_Home_Page/datafile/variable.htm
Danmarks Nationalbank. (2016). 10 årig statsobligation. Retrieved from http://www.statistikbanken.dk/statbank5a/SelectVarVal/Define.asp?MainTable=MPK3&PLanguage=0&PXSId=0&wsid=cftree
Davidsson, P., Steffens, P., & Fitzsimmons, J. (2009). Growing profitable or growing from profits: Putting the horse in front of the cart? Journal of Business Venturing, 24(4), 388–406. http://doi.org/10.1016/j.jbusvent.2008.04.003
Davis, H. T. (1941). The Analysis of Economic Time Series. Deloitte. (2013, December 12). IFRS 1 — First-time Adoption of International Financial
Reporting Standards. Retrieved from http://www.iasplus.com/en/standards/ifrs/ifrs1 Dengsøe, P. (2015, September 2). Ninjaer og elverfolk skaffer Lego milliarder. Berlingske
Business. Retrieved from http://www.business.dk/detailhandel/ninjaer-og-elverfolk-skaffer-lego-milliarder
D’Mello, R., Krishnaswami, S., & Larkin, P. J. (2008). Determinants of corporate cash holdings: Evidence from spin-offs. Journal of Banking & Finance, 32(7), 1209–1220. http://doi.org/10.1016/j.jbankfin.2007.10.005
Duhamel, P., & Vetterli, M. (1990). Fast fourier transforms: A tutorial review and a state of the art. Signal Processing, 19(4), 259–299. http://doi.org/10.1016/0165-1684(90)90158-U
EFSA. (2015). No consumer health risk from bisphenol A exposure. Retrieved from http://www.efsa.europa.eu/en/press/news/150121
Euromonitor. (2015a). Euromonitor, various statistics and market data. Euromonitor. (2015b). LEGO GROUP IN TOYS AND GAMES (WORLD). Euromonitor. (2015c). Toys and Games: Euromonitor from trade sources/national statistics. Euromonitor. (2015d, December). Category Definitions - Toys and Games. Retrieved from
http://www.portal.euromonitor.com/portal/help/definitions Euromonitor. (2016, March 2). Nexo Knights and LEGO Dimensions to Sustain Growth
Throughout 2016. European Commission. (2015). Report on EU customs enforcement of intellectual property
rights. Results at the EU border 2014. Fama, E. F., & French, K. R. (1993). Common risk factors in the returns on stocks and bonds.
Journal of Financial Economics, 33(1), 3–56. http://doi.org/10.1016/0304-405X(93)90023-5
Fama, E. F., & French, K. R. (1996). Multifactor Explanations of Asset Pricing Anomalies. The Journal of Finance, 51(1), 55–84. http://doi.org/10.1111/j.1540-6261.1996.tb05202.x

97
Fama, E. F., & Jensen, M. C. (1985). Organizational forms and investment decisions. Journal of Financial Economics, 14(1), 101–119. http://doi.org/10.1016/0304-405X(85)90045-5
Farrell, J., & Klemperer, P. (2007). Coordination and lock-in: Competition with switching costs and network effects. In Handbook of industrial organization (Vol. 3, pp. 1967–2072).
Federal Reserve System (US). (2016, February). Moody’s Seasoned Aaa Corporate Bond Yield. Retrieved from https://research.stlouisfed.org/fred2/series/AAA
Feloni, R. (2014, February 10). How Lego Came Back From The Brink Of Bankruptcy. Business Insider. Retrieved from http://www.businessinsider.com/how-lego-made-a-huge-turnaround-2014-2
Fine, G. A., & Elsbach, K. D. (2000). Ethnography and Experiment in Social Psychological Theory Building: Tactics for Integrating Qualitative Field Data with Quantitative Lab Data. Journal of Experimental Social Psychology, 36(1), 51–76. http://doi.org/10.1006/jesp.1999.1394
Fisher, R. A. (1929). Tests of Significance in Harmonic Analysis. Proceedings of the Royal Society of London. Series A, Containing Papers of a Mathematical and Physical Character, 125(796), 54–59.
Fons, J. S. (1994). Using Default Rates to Model the Term Structure of Credit Risk. Financial Analysts Journal, 50(5), 25–32. http://doi.org/10.2469/faj.v50.n5.25
Francis, J., Nanda, D., & Olsson, P. (2008). Voluntary Disclosure, Earnings Quality, and Cost of Capital. Journal of Accounting Research, 46(1), 53–99. http://doi.org/10.2307/40058085
Fried, D., & Givoly, D. (1982). Financial analysts’ forecasts of earnings. Journal of Accounting and Economics, 4(2), 85–107. http://doi.org/10.1016/0165-4101(82)90015-5
Friedman, M. (1953). Essays in positive economics. University of Chicago Press., 3–43. Fuller, W. A. (1996). Introduction to statistical time series (2nd ed). New York: Wiley. Fumi, A., Pepe, A., Scarabotti, L., & Schiraldi, M. M. (2013). Fourier Analysis for Demand
Forecasting in a Fashion Company. International Journal of Engineering Business Management, 1. http://doi.org/10.5772/56839
Gertsen, F., Lassen, A. H., & Hansen, P. H. K. (2008). Søgeprocessen i diskontinuert innovation. Center for Industriel Produktion, Aalborg Universitet, 19.
Gilbert, B. (2015, June 1). LEGO created its own “Minecraft” and you can play it right now. Business Insider UK. Retrieved from http://uk.businessinsider.com/lego-worlds-announced-2015-6?r=US&IR=T
Graham, J. R., Harvey, C. R., & Rajgopal, S. (2005). The economic implications of corporate financial reporting. Journal of Accounting and Economics, 40(1-3), 3–73. http://doi.org/10.1016/j.jacceco.2005.01.002
Grant, R. M. (2010). Contemporary strategy analysis: text and cases (7th ed). Hoboken, N.J: Wiley.
98
Grant, R. M., Jammine, A. P., & Thomas, H. (1988). DIVERSITY, DIVERSIFICATION, AND PROFITABILITY AMONG BRITISH MANUFACTURING COMPANIES 1972-84. Academy of Management Journal, 31(4), 771–801. http://doi.org/10.2307/256338
Guba, E. G. (1990). The Paradigm Dialog. Sage Publications. Guba, E. G., & Lincoln, Y. S. (1994). Competing paradigms in qualitative research.
Handbook of Qualitative Research, 2, 163–194. Hamada, R. S. (1972). The Effect of the Firm’s Capital Structure on the Systematic Risk of
Common Stocks. The Journal of Finance, 27(2), 435. http://doi.org/10.2307/2978486
Hansen, M. B., & Erhardi, J. (2002, November). Memorandum on beta relations. PowerPoint, PricewaterhouseCoopers. Retrieved from http://www.hha.dk/regn/corpval/material/powerpoint/other_slides/PWC-beta-rel.pdf
Hasbro. (2006). Annual Report 2006. Hasbro. (2007). Annual Report 2007. Hasbro. (2008). Annual Report 2008. Hasbro. (2009). Annual Report 2009. Hasbro. (2010). Annual Report 2010. Hasbro. (2011). Annual Report 2011. Hasbro. (2012). Annual Report 2012. Hasbro. (2013). Annual Report 2013. Hasbro. (2014). Annual Report 2014. Hasbro. (2015). Annual Report 2015 - 10K. Haugaard, S. (2007, August 1). Lego risikerer at skuffe jule-kunder igen. Børsen. Retrieved
from http://www.business.dk/detailhandel/lego-risikerer-at-skuffe-jule-kunder-igen Healy, P. M., & Palepu, K. G. (2001). Information asymmetry, corporate disclosure, and the
capital markets: A review of the empirical disclosure literature. Journal of Accounting and Economics, 31(1-3), 405–440. http://doi.org/10.1016/S0165-4101(01)00018-0
Hendrikse, G. (2003). Economics and management of organizations: co-ordination, motivation and strategy. London: McGraw-Hill.
Henriksen, K. (2010, September 9). Lego tæt på at løbe tør for klodser. Børsen. Herfindahl, O. C. (1950). Concentration in the U.S. Steel Industry. Columbia University. Hirschman, A. O. (1945). National Power and the Structure of Foreign Trade. Berkeley:
University of California. Hirschman, A. O. (1964). The Paternity of an Index. American Economic Review, 761–762. Hjarvard, S. (2004). From bricks to bytes : The Mediatization of a Global Toy Industry. In
I. Bondebjerg & P. Golding (Eds.), European Culture and the Media (pp. 43–63). Intellect Ltd.
Hughes, J. (2010). Brick Fetish. Retrieved from http://brickfetish.com/index.html
99
IFRS. (2011, May 12). IASB and FASB issue common fair value measurement and disclosure requirements. Retrieved December 2, 2015, from http://www.ifrs.org/news/press-releases/Pages/ifrs-13-fvm-may-2011.aspx
Ildor, A. (2015, October 21). Lego løber tør for klodser inden jul. Business. IMDB. (2016). Box Office Mojo. Retrieved January 12, 2016, from
http://www.boxofficemojo.com/studio/?view=parent&view2=allstudios&view3=detail&sort=releases&order=DESC&p=.htm
IVTO. (2016). Macro, Meso and Micro environment. Johnson, M. E. (2001). Learning From Toys: Lessons in Managing Supply Chain Risk from
the Toy Industry. California Management Review, 43(3), 106–124. http://doi.org/10.2307/41166091
Jørgensen, M. B. (2012, November 2). Lego går glip af massivt julesalg. Børsen. Retrieved from http://www.business.dk/detailhandel/lego-gaar-glip-af-massivt-julesalg
Kipp, R., & Robertson, D. C. (2013). Innovating Inside the Brick. Knowledge@Wharton. Retrieved from http://knowledge.wharton.upenn.edu/article/how-lego-stopped-thinking-outside-the-box-and-innovated-inside-the-brick/
Kirkbi. (2015). Annual Report 2015. Knott, A., Hayes, A., & Neslin, S. A. (2002). Next-product-to-buy models for cross-selling
applications. Journal of Interactive Marketing, 16(3), 59–75. http://doi.org/10.1002/dir.10038
Knowledge@Wharton. (2012, July 18). Innovation Almost Bankrupted Lego — Until It Rebuilt with a Better Blueprint. Retrieved from http://knowledge.wharton.upenn.edu/article/innovation-almost-bankrupted-lego-until-it-rebuilt-with-a-better-blueprint/
Knudstorp, J. V. (2008, February 19). Another strong year for the LEGO Group. Retrieved from http://www.lego.com/da-dk/aboutus/news-room/2008/february/another-strong-year-for-the-lego-group
Knudstorp, J. V. (2014, April 14). The Man Who Rescued Lego. Retrieved from https://www.youtube.com/watch?t=136&v=JlVyiFqIg0w
Koller, T., Goedhart, M. H., & Wessels, D. (2010). Valuation: Measuring and Managing the Value of Companies (5th ed). Hoboken, N.J: John Wiley & Sons, Inc.
Kvale, S., & Brinkmann, S. (2009). Interview: introduktion til et håndværk. Kbh.: Hans Reitzel.
Lambert, R. A., Leuz, C., & Verrecchia, R. E. (2012). Information Asymmetry, Information Precision, and the Cost of Capital. Review of Finance, 16(1), 1–29. http://doi.org/10.1093/rof/rfr014
Larsen, M. M., Pedersen, T., & Slepniov, D. (2010). LEGO GROUP: AN OUTSOURCING JOURNEY (Case No. 910M94) (p. 16). Richard Ivey School of Business, The University of Western Ontario.
LEGO. (1997). Developing a Product Leaflet. LEGO. (2006). Annual Report 2006. Retrieved from http://aboutus.lego.com/da-dk/lego-
group/annual-report/

100
LEGO. (2007). Annual Report 2007. Retrieved from http://aboutus.lego.com/da-dk/lego-group/annual-report/
LEGO. (2008). Annual Report 2008. Retrieved from http://aboutus.lego.com/da-dk/lego-group/annual-report/
LEGO. (2009a). Annual Report 2009. Retrieved from http://aboutus.lego.com/da-dk/lego-group/annual-report/
LEGO. (2009b). Progress Report 2009. LEGO. (2010). Annual Report 2010. Retrieved from http://aboutus.lego.com/da-dk/lego-
group/annual-report/ LEGO. (2011). Annual Report 2011. Retrieved from http://aboutus.lego.com/da-dk/lego-
group/annual-report/ LEGO. (2012a). Annual Report 2012. Retrieved from http://aboutus.lego.com/da-dk/lego-
group/annual-report/ LEGO. (2012b). The LEGO Story. LEGO. Retrieved from
https://www.youtube.com/watch?v=NdDU_BBJW9Y LEGO. (2013a). Annual Report 2013. Retrieved from http://aboutus.lego.com/da-dk/lego-
group/annual-report/ LEGO. (2013b, March 18). LEGO Group to build factory in China. Retrieved from
http://www.lego.com/en-us/aboutus/news-room/2013/march/lego-group-to-build-factory-in-china
LEGO. (2014). Annual Report 2014. Retrieved from http://aboutus.lego.com/da-dk/lego-group/annual-report/
LEGO. (2015a). Annual Report 2015. Retrieved from http://aboutus.lego.com/da-dk/lego-group/annual-report/
LEGO. (2015b). Company Profile 2015 (p. 28). LEGO. (2016a). The LEGO Group Responsibility Report 2015 (p. 72). LEGO. (2016b, February 22). The Lego Brand. Retrieved from http://www.lego.com/en-
us/aboutus/lego-group/the_lego_brand Levy, H., & Sarnat, M. (1994). Capital investment and financial decisions (5th ed). New
York: Prentice Hall. Lim, S. C., Mann, S. C., & Mihov, V. T. (2003). Market Evaluation of Off-Balance Sheet
Financing: You Can Run But You Can’t Hide. SSRN Electronic Journal. http://doi.org/10.2139/ssrn.474784
Lintner, J. (1965). The Valuation of Risk Assets and the Selection of Risky Investments in Stock Portfolios and Capital Budgets. The Review of Economics and Statistics, 47(1), 13–37. http://doi.org/10.2307/1924119
Ljungqvist, A., & Wilhelm, W. J. (2003). IPO Pricing in the Dot-com Bubble. The Journal of Finance, 58(2), 723–752. http://doi.org/10.1111/1540-6261.00543
Lunde, N. (2012). Miraklet i LEGO. Jyllands-Posten. Mainz, P. (2010, February 9). Kemikalie-lov kan kvæle Lego-klassiker. Politiken. Retrieved
from
101
http://politiken.dk/forbrugogliv/sundhedogmotion/forbrugerkemi/ECE897196/kemikalie-lov-kan-kvaele-lego-klassiker/
Markman, G. D., & Gartner, W. B. (2002). Is Extraordinary Growth Profitable? A Study of Inc. 500 High-Growth Companies*. Entrepreneurship Theory and Practice, 27(1), 65–75. http://doi.org/10.1111/1540-8520.t01-2-00004
Markowitz, H. (1959). Portfolio selection: efficient diversification of investments. Massey, F. J. (1951). The Kolmogorov-Smirnov Test for Goodness of Fit. Journal of the
American Statistical Association, 46(253), 68–78. http://doi.org/10.1080/01621459.1951.10500769
Matsuda, K. (2004). Introduction to Option Pricing with Fourier Transform: Option Pricing with Exponential Lévy Models.
Mattel. (2006). Annual Report 2006. Mattel. (2007). Annual Report 2007. Mattel. (2008). Annual Report 2008. Mattel. (2009). Annual Report 2009. Mattel. (2010). Annual Report 2010. Mattel. (2011). Annual Report 2011. Mattel. (2012). Annual Report 2012. Mattel. (2013). Annual Report 2013. Mattel. (2014). Annual Report 2014. Mattel. (2015). Annual Report 2015 - 10K. Merlin Entertainments. (2015). Annual Report and Accounts 2015. Retrieved from
http://www.merlinentertainments.biz/results-and-presentations Metropolis, N., & Ulam, S. (1949). The Monte Carlo Method. Journal of the American
Statistical Association, 44(247), 335–341. http://doi.org/10.1080/01621459.1949.10483310
Michaely, R., & Roberts, M. R. (2012). Corporate Dividend Policies: Lessons from Private Firms. Review of Financial Studies, 25(3), 711–746. http://doi.org/10.1093/rfs/hhr108
Miel, R. (2014, February 18). Lego looking for a sustainable replacement for ABS. Plastic News. Retrieved from http://www.plasticsnews.com/article/20140218/NEWS/140219915/lego-looking-for-a-sustainable-replacement-for-abs
Modigliani, F., & Miller, M. H. (1958). The Cost of Capital, Corporation Finance and the Theory of Investment. The American Economic Review, 48(3), 261–297.
Modigliani, F., & Miller, M. H. (1963). Corporate Income Taxes and the Cost of Capital: A Correction. The American Economic Review, 53(3), 433–443.
Mortensen, T. F. (2012, January 9). The LEGO Group History. Retrieved from http://www.lego.com/en-us/aboutus/lego-group/the_lego_history
Myers, S. C. (1968). A Time-State-Preference Model of Security Valuation. The Journal of Financial and Quantitative Analysis, 3(1), 1. http://doi.org/10.2307/2330046

102
Nash, J. (1951). Non-Cooperative Games. The Annals of Mathematics, 54(2), 286. http://doi.org/10.2307/1969529
Newbold, P., Carlson, W. L., & Thorne, B. M. (2010). Statistics for business and economics (7. ed., global ed). Upper Saddle River, NJ: Pearson.
Nguyen, J. (2010, January 13). What are some of the key differences between IFRS and U.S. GAAP? Retrieved December 5, 2015, from http://www.investopedia.com/ask/answers/09/ifrs-gaap.asp
Nowroozi, A. A. (1967). Table for Fisher’s Test of Significance in Harmonic Analysis. Geophysical Journal International, 12(5), 517–520. http://doi.org/10.1111/j.1365-246X.1967.tb03132.x
OHIM. (2015). The economic cost IPR infringement in toys and games. Office for Harmonization in the Internal Market (OHIM). Retrieved from https://euipo.europa.eu/tunnel-web/secure/webdav/guest/document_library/observatory/resources/research-and-studies/ip_infringement/study4/toys_games_en.pdf
Omekara, C. O., Ekpenyong, E. J., & Ekerete, M. P. (2013). Modeling the Nigerian Inflation Rates Using Periodogram and Fourier Series Analysis. CBN Journal of Applied Statistics, 4(2), 51–68.
Opler, T., Pinkowitz, L., Stulz, R., & Williamson, R. (1999). The determinants and implications of corporate cash holdings. Journal of Financial Economics, 52(1), 3–46. http://doi.org/10.1016/S0304-405X(99)00003-3
Pacter, P. (2015, September 2). The global reach of IFRS is expanding. Retrieved December 2, 2015, from http://www.ifrs.org/Features/Pages/Global-reach-of-IFRS-is-expanding.aspx
Page, H. (Harry) F. (1940, November 25). Improvements in toy building blocks. Surrey. Retrieved from http://worldwide.espacenet.com/publicationDetails/biblio?CC=GB&NR=529580&KC=&FT=E&locale=en_EP
Page, H. (Harry) F. (1946). Plastics as a Medium for Toys. Daily Graphic Plastics Exhibition, 1946, 112–114.
Page, H. (Harry) F. (1949, December 12). Improvements in toy building blocks. Surrey. Retrieved from http://worldwide.espacenet.com/publicationDetails/biblio?CC=GB&NR=633055&KC=&FT=E&locale=en_EP
Parkes, A. (1862). Certain preparations of oils for, and solutions used when waterproofing, and for the manufacture of various articles by the use of such compounds. Retrieved from https://archive.org/stream/patentsinventions00grearich/patentsinventions00grearich_djvu.txt
Perry, J. S., & Herd, T. J. (2004). Reducing M&A risk through improved due diligence. Strategy & Leadership, 32(2), 12–19. http://doi.org/10.1108/10878570410525089
103
Porter, M. E. (1979). How competitive forces shape strategy. Harvard Business Review, 1979.
Reputation Institute. (2016, March). RepTrak 100. Retrieved from https://www.reputationinstitute.com/research/Global-RepTrak-100.aspx
Robertson, A. (2015, June 8). “LEGO Worlds” Expands Beyond “Minecraft” Horizons. Forbes. Retrieved from http://www.forbes.com/sites/andyrobertson/2015/06/08/lego-worlds-minecraft-review/
Robertson, D. C., & Breen, B. (2013). Brick by brick: how LEGO rewrote the rules of innovation and conquered the global toy industry (27 Jun. 2013). Random House Business.
Rossi, P. E., McCulloch, R. E., & Allenby, G. M. (1996). The Value of Purchase History Data in Target Marketing. Marketing Science, 15(4), 321–340. http://doi.org/10.1287/mksc.15.4.321
Rothaermel, F. T. (2015). Strategic Management (Second edition). New York, NY: McGraw-Hill Education.
Ryrsø, M. (2014, oktober). LEGO dropper Shell, men ikke olien [News]. Retrieved August 8, 2015, from http://navisen.dk/blog/lego-dropper-shell-men-ikke-olien/
Sale, J. E. M., Lohfeld, L. H., & Brazil, K. (2002). Revisiting the Quantitative-Qualitative Debate: Implications for Mixed-Methods Research. Quality and Quantity, 36(1), 43–53.
Saunter, C., & Hughes, J. (2008, May 11). Hilary Page Toys. Retrieved November 20, 2015, from http://www.hilarypagetoys.com/
Schrøder, C. F. (2007, September 19). Lego-mænd får dyr olie at føle. Børsen. Retrieved from http://borsen.dk/nyheder/investor/artikel/1/116624/lego-maend_faar_dyr_olie_at_foele.html
Schrøder, J. (2005, September 5). Oliepris koster Lego millioner. Business.dk. Retrieved from http://www.business.dk/diverse/oliepris-koster-lego-millioner
Shah, S. K., & Corley, K. G. (2006). Building Better Theory by Bridging the Quantitative-Qualitative Divide. Journal of Management Studies, 43(8), 1821–1835. http://doi.org/10.1111/j.1467-6486.2006.00662.x
Sharpe, W. F. (1964). Capital Asset Prices: A Theory of Market Equilibrium under Conditions of Risk. The Journal of Finance, 19(3), 425. http://doi.org/10.2307/2977928
Shimshoni, M. (1971). On Fisher’s Test of Significance in Harmonic Analysis. Geophysical Journal International, 23(4), 373–377. http://doi.org/10.1111/j.1365-246X.1971.tb01829.x
Simonsen, C. (2011, November 4). LEGO® Universe to close in 2012. LEGO Newsroom. Retrieved from http://www.lego.com/en-us/aboutus/news-room/2011/november/lego-universe-to-close-in-2012

104
Smirnov, N. (1948). Table for Estimating the Goodness of Fit of Empirical Distributions. The Annals of Mathematical Statistics, 19(2), 279–281. http://doi.org/10.1214/aoms/1177730256
Sørensen, O. (2009). Regnskabsanalyse og værdiansættelse: en praktisk tilgang. (3rd ed.). Kbh.: Gjellerup.
Standard & Poor’s. (2011). Standard & Poor’s Ratings Definitions. TEA. (2015, June 4). The Global Attractions Attendance Report. Themed Entertainment
Association (TEA). Retrieved from http://www.teaconnect.org/images/files/TEA_104_611784_150604.pdf
The New York Times. (2008, October 12). Lego loses trademark ruling in EU. Retrieved from http://www.nytimes.com/2008/11/12/business/worldbusiness/12iht-lego.4.17764329.html?_r=1
Toy Industry Association. (2015). Economic Impact of the Toy Industry. Retrieved from http://www.toyassociation.org/app_themes/tia/pdfs/economicimpact/unitedstates.pdf
Trangbæk, R. R. (2015, June 16). LEGO Koncernen investerer en milliard i at finde bæredygtige materialer. Retrieved from http://www.lego.com/da-dk/aboutus/news-room/2015/june/sustainable-materials-centre
USA DOE. (2015, October 27). Europe Brent Crude Oil Spot Price FOB [Database]. Retrieved October 27, 2015, from https://www.quandl.com/data/DOE/RBRTE-Europe-Brent-Crude-Oil-Spot-Price-FOB?utm_medium=graph&utm_source=quandl
USA EIA. (2015). What drives crude oil prices? (p. 23). U.S. Energy Information Administration. Retrieved from http://www.eia.gov/finance/markets/reports_presentations/eia_what_drives_crude_oil_prices.pdf
Veryzer, R. W. (1998). Discontinuous Innovation and the New Product Development Process. Journal of Product Innovation Management, 15(4), 304–321. http://doi.org/10.1111/1540-5885.1540304
Vogel, R. C., & Maddala, G. S. (1967). CROSS-SECTION ESTIMATES OF LIQUID ASSET DEMAND BY MANUFACTURING CORPORATIONS. The Journal of Finance, 22(4), 557–575. http://doi.org/10.1111/j.1540-6261.1967.tb00292.x
Wong, C. Y., Arlbjørn, J. S., & Johansen, J. (2005). Supply chain management practices in toy supply chains. Supply Chain Management: An International Journal, 10(5), 367–378. http://doi.org/10.1108/13598540510624197
World Bank. (2016). World Development Indicators (NY.GDP.PCAP.PP.KD). The World Bank. Retrieved from http://databank.worldbank.org/data/reports.aspx?source=2&type=metadata&series=NY.GDP.PCAP.PP.KD
Young, H. D., Freedman, R. A., Ford, A. L., Sears, F. W., & Zemansky, M. W. (2012). Sears and Zemansky´s University Physics with Modern Physics (13. ed., international ed). Boston, Mass.: Addison-Wesley.
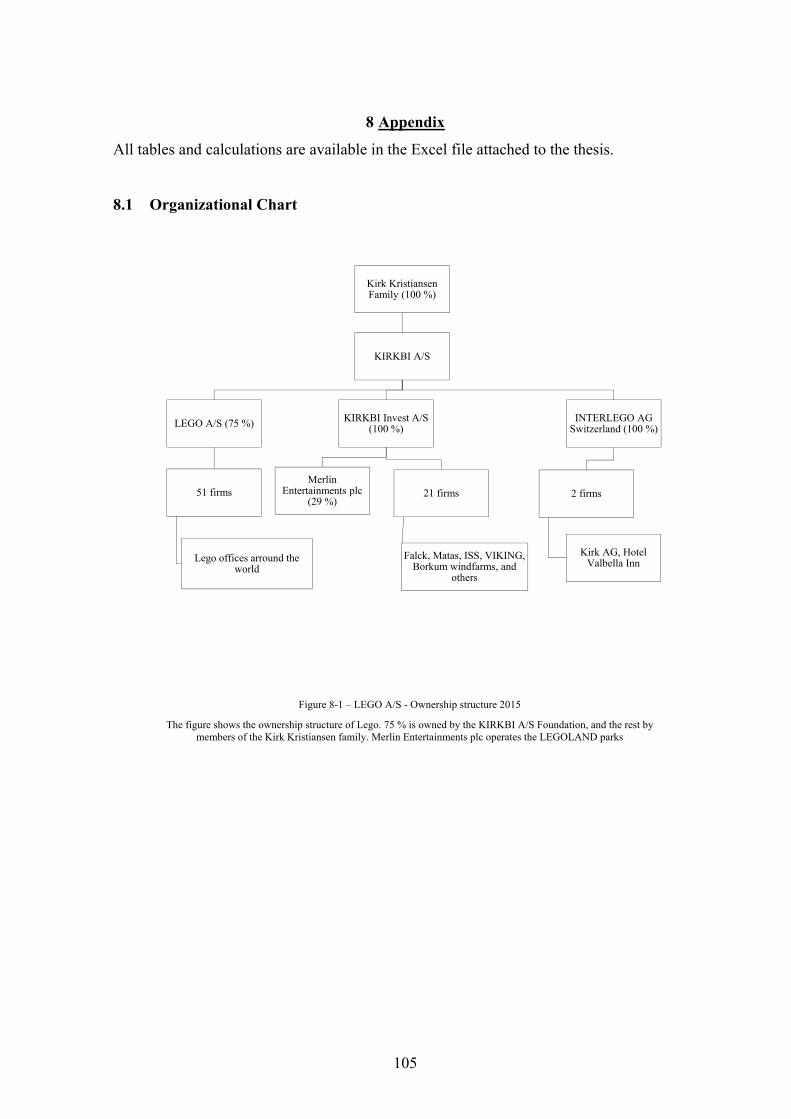
105
8 Appendix
All tables and calculations are available in the Excel file attached to the thesis.
8.1 Organizational Chart
Kirk Kristiansen Family (100 %)
KIRKBI A/S
LEGO A/S (75 %)
51 firms
Lego offices arround the world
KIRKBI Invest A/S (100 %)
Merlin Entertainments plc
(29 %)21 firms
Falck, Matas, ISS, VIKING, Borkum windfarms, and
others
INTERLEGO AG Switzerland (100 %)
2 firms
Kirk AG, Hotel Valbella Inn
Figure 8-1 – LEGO A/S - Ownership structure 2015
The figure shows the ownership structure of Lego. 75 % is owned by the KIRKBI A/S Foundation, and the rest by members of the Kirk Kristiansen family. Merlin Entertainments plc operates the LEGOLAND parks
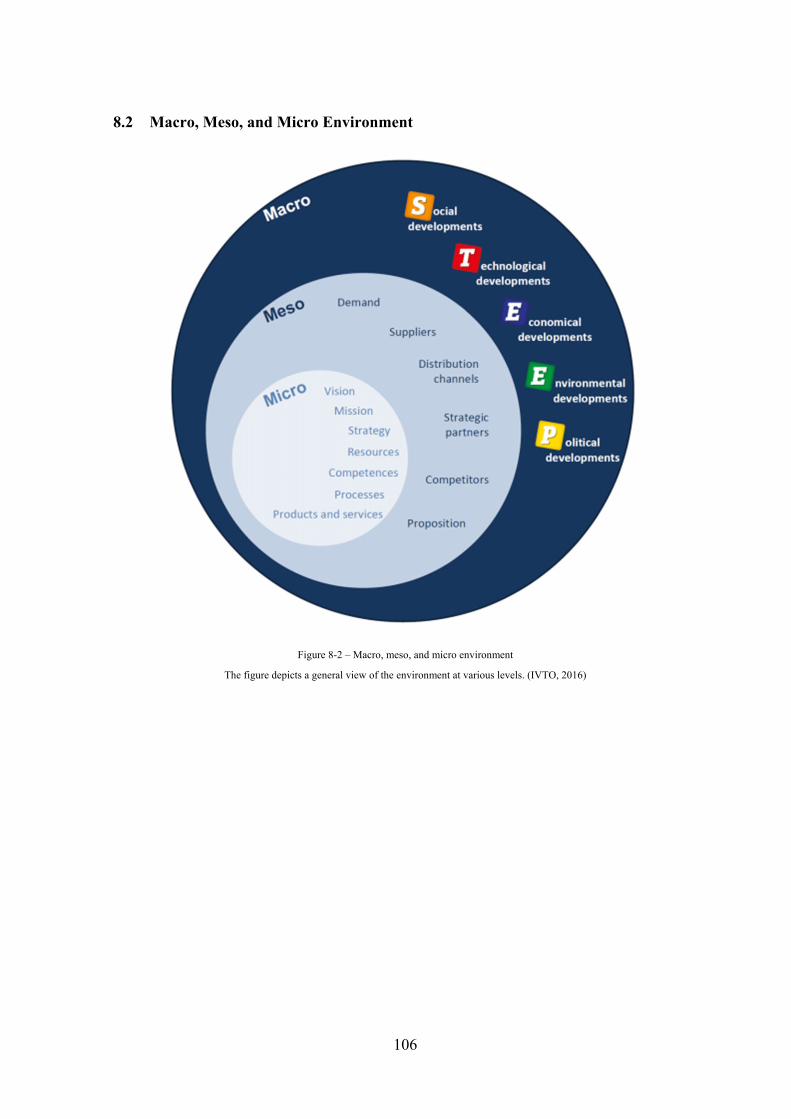
106
8.2 Macro, Meso, and Micro Environment
Figure 8-2 – Macro, meso, and micro environment
The figure depicts a general view of the environment at various levels. (IVTO, 2016)
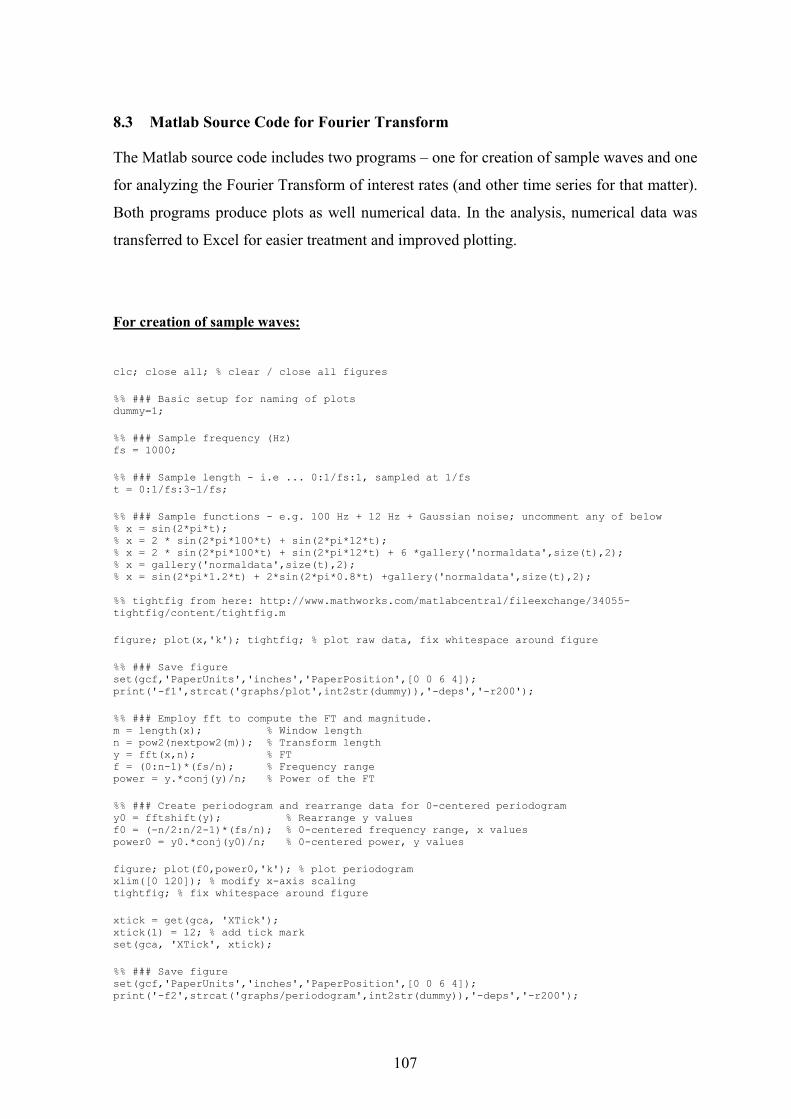
107
8.3 Matlab Source Code for Fourier Transform
The Matlab source code includes two programs – one for creation of sample waves and one
for analyzing the Fourier Transform of interest rates (and other time series for that matter).
Both programs produce plots as well numerical data. In the analysis, numerical data was
transferred to Excel for easier treatment and improved plotting.
For creation of sample waves:
clc; close all; % clear / close all figures %% ### Basic setup for naming of plots dummy=1; %% ### Sample frequency (Hz) fs = 1000; %% ### Sample length - i.e ... 0:1/fs:1, sampled at 1/fs t = 0:1/fs:3-1/fs; %% ### Sample functions - e.g. 100 Hz + 12 Hz + Gaussian noise; uncomment any of below % x = sin(2*pi*t); % x = 2 * sin(2*pi*100*t) + sin(2*pi*12*t); % x = 2 * sin(2*pi*100*t) + sin(2*pi*12*t) + 6 *gallery('normaldata',size(t),2); % x = gallery('normaldata',size(t),2); % x = sin(2*pi*1.2*t) + 2*sin(2*pi*0.8*t) +gallery('normaldata',size(t),2); %% tightfig from here: http://www.mathworks.com/matlabcentral/fileexchange/34055-tightfig/content/tightfig.m figure; plot(x,'k'); tightfig; % plot raw data, fix whitespace around figure %% ### Save figure set(gcf,'PaperUnits','inches','PaperPosition',[0 0 6 4]); print('-f1',strcat('graphs/plot',int2str(dummy)),'-deps','-r200'); %% ### Employ fft to compute the FT and magnitude. m = length(x); % Window length n = pow2(nextpow2(m)); % Transform length y = fft(x,n); % FT f = (0:n-1)*(fs/n); % Frequency range power = y.*conj(y)/n; % Power of the FT %% ### Create periodogram and rearrange data for 0-centered periodogram y0 = fftshift(y); % Rearrange y values f0 = (-n/2:n/2-1)*(fs/n); % 0-centered frequency range, x values power0 = y0.*conj(y0)/n; % 0-centered power, y values figure; plot(f0,power0,'k'); % plot periodogram xlim([0 120]); % modify x-axis scaling tightfig; % fix whitespace around figure xtick = get(gca, 'XTick'); xtick(1) = 12; % add tick mark set(gca, 'XTick', xtick); %% ### Save figure set(gcf,'PaperUnits','inches','PaperPosition',[0 0 6 4]); print('-f2',strcat('graphs/periodogram',int2str(dummy)),'-deps','-r200');
108
For analyzing interest rate time series data: clc; close all; fontSize = 10; lineWidth = 2; markerSize = 8; set(0,'defaultTextFontSize',fontSize); set(0,'defaultLineLineWidth',lineWidth); set(0,'defaultLineMarkerSize',markerSize); set(0,'defaultTextInterpreter','latex'); %% tightfig from here: http://www.mathworks.com/matlabcentral/fileexchange/34055-tightfig/content/tightfig.m %% Configuration (choose dataset file) datasetset = 'interest'; % hasbro mattel interest dataset = load(strcat('data/', datasetset, '.txt')); savefile = 1; % 0 don't save files, 1 save files. subtitle = ''; %' $$\dataset$$ - '; %% Sampling configuration fs = 24; % Samples/unit time m = length(dataset); % Window length (number of samples) i = 1; % increment variable for plot windows. %% Plot raw dataset, k = black line figure; plot(dataset, 'k'); tightfig; title(strcat(datasetset, subtitle, ' \bf', sprintf(' Raw dataset - %d samples', m))); xlabel('months', 'Interpreter','latex'); ylabel('$$rate$$', 'Interpreter','latex'); if savefile == 1 set(gcf,'PaperUnits','inches','PaperPosition',[0 0 6 4]); print(strcat('graphs\', datasetset,'-',int2str(i)),'-deps','-r200'); end %% Compute discrete Fourier of dataset n = pow2(nextpow2(m)); Y = fft(dataset,n); f = (0:n-1)*(fs/n); power = Y.*conj(Y)/n; %% Single-sided periodogram % Compute two-sided spectrum P2. Then compute the single-sided spectrum P1 % based on P2 and the even-valued signal length L. P2 = abs(Y/m); P1 = P2(1:m/2+1); P1(2:end-1) = 2*P1(2:end-1); f = fs*(0:(m/2))/m; figure; plot(f,P1,'k'); tightfig; xlim([-.5 3]); % added limit here for better overview title(strcat(datasetset, subtitle, ' {\bf DFT - Single-sided periodogram}')); xlabel('Frequency (Hz)', 'Interpreter','latex'); ylabel('Power', 'Interpreter','latex'); if savefile == 1 i=i+1;set(gcf,'PaperUnits','inches','PaperPosition',[0 0 6 4]); print(strcat('graphs\', datasetset,'-',int2str(i)),'-deps','-r200'); end

109
8.4 Fisher’s Test for Significance – Distribution Table
Figure 8-3 – Fisher’s test of significance critical values
Own creation
m p = 10 % p = 5 % p = 1 %
2 1.900 1.950 1.990
3 2.452 2.613 2.827
4 2.830 3.072 3.457
5 3.120 3.419 3.943
6 3.354 3.697 4.331
7 3.552 3.928 4.651
8 3.722 4.125 4.921
9 3.872 4.297 5.154
10 4.005 4.450 5.358
11 4.125 4.586 5.539
12 4.234 4.709 5.701
13 4.334 4.821 5.848
14 4.426 4.924 5.981
15 4.511 5.019 6.103
16 4.590 5.108 6.216
17 4.665 5.190 6.321
18 4.734 5.267 6.418
19 4.800 5.340 6.509
20 4.862 5.408 6.594
21 4.921 5.473 6.675
22 4.977 5.534 6.750
23 5.031 5.592 6.822
24 5.081 5.648 6.890
25 5.130 5.701 6.955
26 5.177 5.752 7.016
27 5.222 5.801 7.075
28 5.265 5.847 7.132
29 5.306 5.892 7.186
30 5.346 5.935 7.237
31 5.385 5.977 7.287
32 5.422 6.017 7.335
33 5.458 6.056 7.381
34 5.493 6.093 7.425
35 5.527 6.130 7.468
36 5.559 6.165 7.510
37 5.591 6.199 7.550
38 5.622 6.232 7.588
39 5.652 6.264 7.626
40 5.681 6.295 7.663
41 5.710 6.326 7.698
42 5.738 6.355 7.732
43 5.765 6.384 7.766
44 5.791 6.412 7.798
45 5.817 6.440 7.830
46 5.842 6.466 7.861
47 5.867 6.493 7.891
48 5.891 6.518 7.920
49 5.914 6.543 7.949
50 5.937 6.567 7.977
51 5.960 6.591 8.004
52 5.982 6.615 8.031
53 6.004 6.637 8.057
54 6.025 6.660 8.082
55 6.046 6.682 8.107
56 6.066 6.703 8.132
57 6.086 6.724 8.156
58 6.106 6.745 8.179
59 6.125 6.765 8.202
60 6.144 6.785 8.225
61 6.162 6.805 8.247
62 6.181 6.824 8.268
63 6.199 6.843 8.290
64 6.216 6.862 8.311
65 6.234 6.880 8.331
66 6.251 6.898 8.351
67 6.268 6.915 8.371
68 6.284 6.933 8.390
69 6.300 6.950 8.410
70 6.317 6.967 8.428
71 6.332 6.983 8.447
72 6.348 7.000 8.465
73 6.363 7.016 8.483
74 6.378 7.032 8.501
75 6.393 7.047 8.518
76 6.408 7.063 8.535
77 6.423 7.078 8.552
78 6.437 7.093 8.569
79 6.451 7.108 8.585
80 6.465 7.122 8.601
81 6.479 7.136 8.617
82 6.492 7.151 8.632
83 6.506 7.165 8.648
84 6.519 7.178 8.663
85 6.532 7.192 8.678
86 6.545 7.205 8.693
87 6.558 7.219 8.708
88 6.570 7.232 8.722
89 6.583 7.245 8.736
90 6.595 7.258 8.750
91 6.607 7.270 8.764
92 6.619 7.283 8.778
93 6.631 7.295 8.792
94 6.643 7.307 8.805
95 6.655 7.319 8.818
96 6.666 7.331 8.831
97 6.677 7.343 8.844
98 6.689 7.355 8.857
99 6.700 7.366 8.869
100 6.711 7.378 8.882
101 6.722 7.389 8.894
102 6.732 7.400 8.906
103 6.743 7.411 8.919
104 6.754 7.422 8.930
105 6.764 7.433 8.942
106 6.774 7.444 8.954
107 6.785 7.455 8.965
108 6.795 7.465 8.977
109 6.805 7.475 8.988
110 6.815 7.486 8.999
111 6.825 7.496 9.010
112 6.835 7.506 9.021
113 6.844 7.516 9.032
114 6.854 7.526 9.043
115 6.863 7.536 9.054
116 6.873 7.546 9.064
117 6.882 7.555 9.075
118 6.891 7.565 9.085
119 6.900 7.574 9.095
120 6.910 7.584 9.105
121 6.919 7.593 9.115
122 6.927 7.602 9.125
123 6.936 7.611 9.135
124 6.945 7.620 9.145
125 6.954 7.629 9.155
126 6.962 7.638 9.164
127 6.971 7.647 9.174
128 6.979 7.656 9.183
129 6.988 7.665 9.193
130 6.996 7.673 9.202
131 7.005 7.682 9.211
132 7.013 7.690 9.220
133 7.021 7.699 9.229
134 7.029 7.707 9.238
135 7.037 7.715 9.247
136 7.045 7.723 9.256
137 7.053 7.732 9.265
138 7.061 7.740 9.273
139 7.069 7.748 9.282
140 7.076 7.756 9.290
141 7.084 7.764 9.299
142 7.092 7.771 9.307
143 7.099 7.779 9.316
2
4
6
8
10
12
14
0 1000 2000 3000 4000 5000
Cri
tica
l val
ues
m
p = 10 %
p = 5 %
p = 1 %

110
144 7.107 7.787 9.324
145 7.114 7.795 9.332
146 7.121 7.802 9.340
147 7.129 7.810 9.348
148 7.136 7.817 9.356
149 7.143 7.825 9.364
150 7.151 7.832 9.372
151 7.158 7.839 9.380
152 7.165 7.847 9.388
153 7.172 7.854 9.396
154 7.179 7.861 9.403
155 7.186 7.868 9.411
156 7.193 7.875 9.418
157 7.199 7.882 9.426
158 7.206 7.889 9.433
159 7.213 7.896 9.441
160 7.220 7.903 9.448
161 7.226 7.910 9.455
162 7.233 7.917 9.463
163 7.240 7.924 9.470
164 7.246 7.930 9.477
165 7.253 7.937 9.484
166 7.259 7.944 9.491
167 7.266 7.950 9.498
168 7.272 7.957 9.505
169 7.278 7.963 9.512
170 7.285 7.970 9.519
171 7.291 7.976 9.526
172 7.297 7.983 9.533
173 7.303 7.989 9.539
174 7.310 7.995 9.546
175 7.316 8.002 9.553
176 7.322 8.008 9.559
177 7.328 8.014 9.566
178 7.334 8.020 9.572
179 7.340 8.026 9.579
180 7.346 8.032 9.585
181 7.352 8.039 9.592
182 7.358 8.045 9.598
183 7.363 8.051 9.604
184 7.369 8.056 9.611
185 7.375 8.062 9.617
186 7.381 8.068 9.623
187 7.386 8.074 9.629
188 7.392 8.080 9.636
189 7.398 8.086 9.642
190 7.403 8.092 9.648
191 7.409 8.097 9.654
192 7.415 8.103 9.660
193 7.420 8.109 9.666
194 7.426 8.114 9.672
195 7.431 8.120 9.678
196 7.436 8.125 9.684
197 7.442 8.131 9.689
198 7.447 8.136 9.695
199 7.453 8.142 9.701
200 7.458 8.147 9.707
201 7.463 8.153 9.713
202 7.468 8.158 9.718
203 7.474 8.164 9.724
204 7.479 8.169 9.729
205 7.484 8.174 9.735
206 7.489 8.179 9.741
207 7.494 8.185 9.746
208 7.500 8.190 9.752
209 7.505 8.195 9.757
210 7.510 8.200 9.763
211 7.515 8.205 9.768
212 7.520 8.211 9.773
213 7.525 8.216 9.779
214 7.530 8.221 9.784
215 7.535 8.226 9.789
216 7.540 8.231 9.795
217 7.544 8.236 9.800
218 7.549 8.241 9.805
219 7.554 8.246 9.810
220 7.559 8.251 9.816
221 7.564 8.256 9.821
222 7.569 8.260 9.826
223 7.573 8.265 9.831
224 7.578 8.270 9.836
225 7.583 8.275 9.841
226 7.588 8.280 9.846
227 7.592 8.285 9.851
228 7.597 8.289 9.856
229 7.601 8.294 9.861
230 7.606 8.299 9.866
231 7.611 8.303 9.871
232 7.615 8.308 9.876
233 7.620 8.313 9.881
234 7.624 8.317 9.886
235 7.629 8.322 9.890
236 7.633 8.327 9.895
237 7.638 8.331 9.900
238 7.642 8.336 9.905
239 7.647 8.340 9.909
240 7.651 8.345 9.914
241 7.655 8.349 9.919
242 7.660 8.354 9.924
243 7.664 8.358 9.928
244 7.668 8.362 9.933
245 7.673 8.367 9.937
246 7.677 8.371 9.942
247 7.681 8.376 9.947
248 7.686 8.380 9.951
249 7.690 8.384 9.956
250 7.694 8.389 9.960
251 7.698 8.393 9.965
252 7.703 8.397 9.969
253 7.707 8.401 9.974
254 7.711 8.406 9.978
255 7.715 8.410 9.982
256 7.719 8.414 9.987
257 7.723 8.418 9.991
258 7.727 8.422 9.996
259 7.731 8.427 10.000
260 7.735 8.431 10.004
261 7.739 8.435 10.009
262 7.743 8.439 10.013
263 7.748 8.443 10.017
264 7.752 8.447 10.021
265 7.755 8.451 10.026
266 7.759 8.455 10.030
267 7.763 8.459 10.034
268 7.767 8.463 10.038
269 7.771 8.467 10.042
270 7.775 8.471 10.046
271 7.779 8.475 10.051
272 7.783 8.479 10.055
273 7.787 8.483 10.059
274 7.791 8.487 10.063
275 7.794 8.491 10.067
276 7.798 8.495 10.071
277 7.802 8.499 10.075
278 7.806 8.502 10.079
279 7.810 8.506 10.083
280 7.813 8.510 10.087
281 7.817 8.514 10.091
282 7.821 8.518 10.095
283 7.825 8.521 10.099
284 7.828 8.525 10.103
285 7.832 8.529 10.107
286 7.836 8.533 10.111
287 7.839 8.536 10.115
288 7.843 8.540 10.118
289 7.847 8.544 10.122
290 7.850 8.548 10.126
291 7.854 8.551 10.130
292 7.857 8.555 10.134
293 7.861 8.559 10.138
294 7.865 8.562 10.141
295 7.868 8.566 10.145
296 7.872 8.569 10.149
297 7.875 8.573 10.153
298 7.879 8.577 10.156
299 7.882 8.580 10.160
300 7.886 8.584 10.164
301 7.889 8.587 10.167
302 7.893 8.591 10.171
303 7.896 8.594 10.175
304 7.900 8.598 10.178
305 7.903 8.601 10.182
306 7.907 8.605 10.186
307 7.910 8.608 10.189
308 7.913 8.612 10.193
309 7.917 8.615 10.197
310 7.920 8.619 10.200
311 7.924 8.622 10.204
312 7.927 8.626 10.207
313 7.930 8.629 10.211
314 7.934 8.632 10.214
315 7.937 8.636 10.218
316 7.940 8.639 10.221
317 7.944 8.642 10.225
318 7.947 8.646 10.228
319 7.950 8.649 10.232
320 7.953 8.652 10.235
321 7.957 8.656 10.239
322 7.960 8.659 10.242
323 7.963 8.662 10.246
324 7.966 8.666 10.249
325 7.970 8.669 10.252
326 7.973 8.672 10.256
327 7.976 8.675 10.259
328 7.979 8.679 10.262
329 7.982 8.682 10.266
330 7.986 8.685 10.269
331 7.989 8.688 10.272
332 7.992 8.692 10.276
333 7.995 8.695 10.279
334 7.998 8.698 10.282
335 8.001 8.701 10.286
336 8.004 8.704 10.289
337 8.007 8.707 10.292
338 8.011 8.711 10.296
339 8.014 8.714 10.299
340 8.017 8.717 10.302
341 8.020 8.720 10.305
342 8.023 8.723 10.308
343 8.026 8.726 10.312
344 8.029 8.729 10.315
345 8.032 8.732 10.318
346 8.035 8.735 10.321
347 8.038 8.738 10.324
348 8.041 8.742 10.328
349 8.044 8.745 10.331
350 8.047 8.748 10.334
351 8.050 8.751 10.337
352 8.053 8.754 10.340
353 8.056 8.757 10.343
354 8.059 8.760 10.346
355 8.062 8.763 10.349
356 8.065 8.766 10.352
357 8.068 8.769 10.356
358 8.071 8.772 10.359
359 8.074 8.774 10.362
360 8.076 8.777 10.365
361 8.079 8.780 10.368
362 8.082 8.783 10.371
363 8.085 8.786 10.374
364 8.088 8.789 10.377
365 8.091 8.792 10.380

111
366 8.094 8.795 10.383
367 8.096 8.798 10.386
368 8.099 8.801 10.389
369 8.102 8.804 10.392
370 8.105 8.806 10.395
371 8.108 8.809 10.398
372 8.111 8.812 10.401
373 8.113 8.815 10.404
374 8.116 8.818 10.406
375 8.119 8.821 10.409
376 8.122 8.823 10.412
377 8.125 8.826 10.415
378 8.127 8.829 10.418
379 8.130 8.832 10.421
380 8.133 8.835 10.424
381 8.135 8.837 10.427
382 8.138 8.840 10.430
383 8.141 8.843 10.432
384 8.144 8.846 10.435
385 8.146 8.848 10.438
386 8.149 8.851 10.441
387 8.152 8.854 10.444
388 8.154 8.857 10.447
389 8.157 8.859 10.449
390 8.160 8.862 10.452
391 8.162 8.865 10.455
392 8.165 8.867 10.458
393 8.168 8.870 10.460
394 8.170 8.873 10.463
395 8.173 8.875 10.466
396 8.176 8.878 10.469
397 8.178 8.881 10.472
398 8.181 8.883 10.474
399 8.184 8.886 10.477
400 8.186 8.889 10.480
401 8.189 8.891 10.482
402 8.191 8.894 10.485
403 8.194 8.897 10.488
404 8.196 8.899 10.491
405 8.199 8.902 10.493
406 8.202 8.904 10.496
407 8.204 8.907 10.499
408 8.207 8.910 10.501
409 8.209 8.912 10.504
410 8.212 8.915 10.507
411 8.214 8.917 10.509
412 8.217 8.920 10.512
413 8.219 8.922 10.514
414 8.222 8.925 10.517
415 8.224 8.928 10.520
416 8.227 8.930 10.522
417 8.229 8.933 10.525
418 8.232 8.935 10.528
419 8.234 8.938 10.530
420 8.237 8.940 10.533
421 8.239 8.943 10.535
422 8.242 8.945 10.538
423 8.244 8.948 10.540
424 8.247 8.950 10.543
425 8.249 8.953 10.546
426 8.252 8.955 10.548
427 8.254 8.958 10.551
428 8.256 8.960 10.553
429 8.259 8.962 10.556
430 8.261 8.965 10.558
431 8.264 8.967 10.561
432 8.266 8.970 10.563
433 8.268 8.972 10.566
434 8.271 8.975 10.568
435 8.273 8.977 10.571
436 8.276 8.979 10.573
437 8.278 8.982 10.576
438 8.280 8.984 10.578
439 8.283 8.987 10.581
440 8.285 8.989 10.583
441 8.287 8.991 10.586
442 8.290 8.994 10.588
443 8.292 8.996 10.590
444 8.295 8.999 10.593
445 8.297 9.001 10.595
446 8.299 9.003 10.598
447 8.302 9.006 10.600
448 8.304 9.008 10.603
449 8.306 9.010 10.605
450 8.308 9.013 10.607
451 8.311 9.015 10.610
452 8.313 9.017 10.612
453 8.315 9.020 10.615
454 8.318 9.022 10.617
455 8.320 9.024 10.619
456 8.322 9.027 10.622
457 8.324 9.029 10.624
458 8.327 9.031 10.626
459 8.329 9.033 10.629
460 8.331 9.036 10.631
461 8.333 9.038 10.633
462 8.336 9.040 10.636
463 8.338 9.043 10.638
464 8.340 9.045 10.640
465 8.342 9.047 10.643
466 8.345 9.049 10.645
467 8.347 9.052 10.647
468 8.349 9.054 10.650
469 8.351 9.056 10.652
470 8.354 9.058 10.654
471 8.356 9.060 10.657
472 8.358 9.063 10.659
473 8.360 9.065 10.661
474 8.362 9.067 10.663
475 8.364 9.069 10.666
476 8.367 9.072 10.668
477 8.369 9.074 10.670
478 8.371 9.076 10.673
479 8.373 9.078 10.675
480 8.375 9.080 10.677
481 8.377 9.083 10.679
482 8.380 9.085 10.681
483 8.382 9.087 10.684
484 8.384 9.089 10.686
485 8.386 9.091 10.688
486 8.388 9.093 10.690
487 8.390 9.095 10.693
488 8.392 9.098 10.695
489 8.395 9.100 10.697
490 8.397 9.102 10.699
491 8.399 9.104 10.701
492 8.401 9.106 10.704
493 8.403 9.108 10.706
494 8.405 9.110 10.708
495 8.407 9.113 10.710
496 8.409 9.115 10.712
497 8.411 9.117 10.714
498 8.413 9.119 10.717
499 8.415 9.121 10.719
500 8.418 9.123 10.721
600 8.606 9.313 10.916
700 8.764 9.473 11.079
800 8.901 9.612 11.220
900 9.022 9.733 11.344
1000 9.130 9.842 11.454
1100 9.227 9.939 11.553
1200 9.316 10.029 11.644
1300 9.397 10.111 11.727
1400 9.473 10.186 11.803
1500 9.543 10.257 11.875
1600 9.608 10.323 11.941
1700 9.670 10.384 12.003
1800 9.728 10.443 12.062
1900 9.783 10.498 12.118
2000 9.834 10.550 12.170
2100 9.884 10.599 12.220
2200 9.931 10.647 12.268
2300 9.976 10.692 12.313
2400 10.019 10.735 12.357
2500 10.060 10.776 12.399
2600 10.100 10.816 12.439
2700 10.138 10.854 12.477
2800 10.175 10.891 12.514
2900 10.210 10.927 12.550
3000 10.244 10.961 12.585
3100 10.278 10.994 12.618
3200 10.310 11.026 12.650
3300 10.341 11.058 12.681
3400 10.371 11.088 12.712
3500 10.400 11.117 12.741
3600 10.428 11.146 12.770
3700 10.456 11.173 12.798
3800 10.483 11.200 12.825
3900 10.509 11.226 12.851
4000 10.535 11.252 12.877
4100 10.560 11.277 12.902
4200 10.584 11.301 12.926
4300 10.607 11.325 12.950
4400 10.631 11.348 12.973
4500 10.653 11.371 12.996
4600 10.675 11.393 13.019
4700 10.697 11.415 13.040
4800 10.718 11.436 13.062
4900 10.739 11.457 13.082
5000 10.759 11.477 13.103

112
8.5 R-language Source Code for producing Fisher’s Test of significance table
The distribution (Fuller, 1996, p. 364):
1 1
Source code in R:
####################
f = function(g, m) { if (g >= 1) { return(0) } else if (g <= 0) { return(1) } k = floor(1 / g) if (k > 150) { k = 150 } xi = sapply(1:k, function(j) {(-1)^(j - 1) * choose(m, j) * (1 - j * g)^(m - 1)}) return(sum(xi)) } fisherKappa = function(m, p) { u = 1 l = 0 x = (u + l) / 2 y = f(x, m) - p while (abs(y) >= 1e-08) { if (sign(y) == sign(f(u, m) - p)) { u = x } else { l = x } x = (u + l) / 2 y = f(x, m) - p } return(x) } # change 5000 to a different size here as well as step for different sized table. m = seq(2, 5000, by = 1) xi1 = m * sapply(m, fisherKappa, p = 0.1) xi2 = m * sapply(m, fisherKappa, p = 0.05) xi3 = m * sapply(m, fisherKappa, p = 0.01) xi = cbind(xi1, xi2, xi3) colnames(xi) = c("0.10", "0.05", "0.01") rownames(xi) = m round(xi, 3)
####################
The source code is very similar to source code from Cross Validated (2016), which in turn is based on A. A.
Nowroozi (1967).
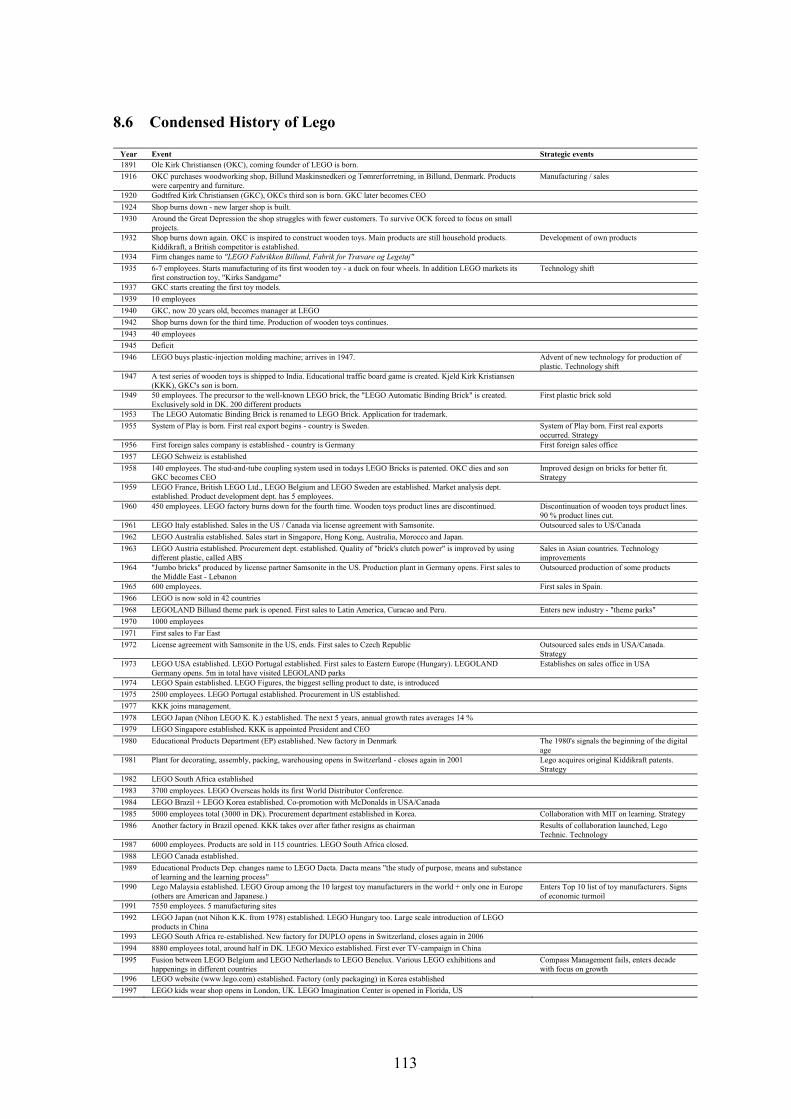
113
8.6 Condensed History of Lego
Year Event Strategic events 1891 Ole Kirk Christiansen (OKC), coming founder of LEGO is born.
1916 OKC purchases woodworking shop, Billund Maskinsnedkeri og Tømrerforretning, in Billund, Denmark. Products were carpentry and furniture.
Manufacturing / sales
1920 Godtfred Kirk Christiansen (GKC), OKCs third son is born. GKC later becomes CEO
1924 Shop burns down - new larger shop is built.
1930 Around the Great Depression the shop struggles with fewer customers. To survive OCK forced to focus on small projects.
1932 Shop burns down again. OKC is inspired to construct wooden toys. Main products are still household products. Kiddikraft, a British competitor is established.
Development of own products
1934 Firm changes name to "LEGO Fabrikken Billund, Fabrik for Trævare og Legetøj"
1935 6-7 employees. Starts manufacturing of its first wooden toy - a duck on four wheels. In addition LEGO markets its first construction toy, "Kirks Sandgame"
Technology shift
1937 GKC starts creating the first toy models.
1939 10 employees
1940 GKC, now 20 years old, becomes manager at LEGO
1942 Shop burns down for the third time. Production of wooden toys continues.
1943 40 employees
1945 Deficit
1946 LEGO buys plastic-injection molding machine; arrives in 1947. Advent of new technology for production of plastic. Technology shift
1947 A test series of wooden toys is shipped to India. Educational traffic board game is created. Kjeld Kirk Kristiansen (KKK), GKC's son is born.
1949 50 employees. The precursor to the well-known LEGO brick, the "LEGO Automatic Binding Brick" is created. Exclusively sold in DK. 200 different products
First plastic brick sold
1953 The LEGO Automatic Binding Brick is renamed to LEGO Brick. Application for trademark.
1955 System of Play is born. First real export begins - country is Sweden. System of Play born. First real exports occurred. Strategy
1956 First foreign sales company is established - country is Germany First foreign sales office
1957 LEGO Schweiz is established
1958 140 employees. The stud-and-tube coupling system used in todays LEGO Bricks is patented. OKC dies and son GKC becomes CEO
Improved design on bricks for better fit. Strategy
1959 LEGO France, British LEGO Ltd., LEGO Belgium and LEGO Sweden are established. Market analysis dept. established. Product development dept. has 5 employees.
1960 450 employees. LEGO factory burns down for the fourth time. Wooden toys product lines are discontinued. Discontinuation of wooden toys product lines. 90 % product lines cut.
1961 LEGO Italy established. Sales in the US / Canada via license agreement with Samsonite. Outsourced sales to US/Canada
1962 LEGO Australia established. Sales start in Singapore, Hong Kong, Australia, Morocco and Japan.
1963 LEGO Austria established. Procurement dept. established. Quality of "brick's clutch power" is improved by using different plastic, called ABS
Sales in Asian countries. Technology improvements
1964 "Jumbo bricks" produced by license partner Samsonite in the US. Production plant in Germany opens. First sales to the Middle East - Lebanon
Outsourced production of some products
1965 600 employees. First sales in Spain.
1966 LEGO is now sold in 42 countries
1968 LEGOLAND Billund theme park is opened. First sales to Latin America, Curacao and Peru. Enters new industry - "theme parks"
1970 1000 employees
1971 First sales to Far East
1972 License agreement with Samsonite in the US, ends. First sales to Czech Republic Outsourced sales ends in USA/Canada. Strategy
1973 LEGO USA established. LEGO Portugal established. First sales to Eastern Europe (Hungary). LEGOLAND Germany opens. 5m in total have visited LEGOLAND parks
Establishes on sales office in USA
1974 LEGO Spain established. LEGO Figures, the biggest selling product to date, is introduced
1975 2500 employees. LEGO Portugal established. Procurement in US established.
1977 KKK joins management.
1978 LEGO Japan (Nihon LEGO K. K.) established. The next 5 years, annual growth rates averages 14 %
1979 LEGO Singapore established. KKK is appointed President and CEO
1980 Educational Products Department (EP) established. New factory in Denmark The 1980's signals the beginning of the digital age
1981 Plant for decorating, assembly, packing, warehousing opens in Switzerland - closes again in 2001 Lego acquires original Kiddikraft patents. Strategy
1982 LEGO South Africa established
1983 3700 employees. LEGO Overseas holds its first World Distributor Conference.
1984 LEGO Brazil + LEGO Korea established. Co-promotion with McDonalds in USA/Canada
1985 5000 employees total (3000 in DK). Procurement department established in Korea. Collaboration with MIT on learning. Strategy
1986 Another factory in Brazil opened. KKK takes over after father resigns as chairman Results of collaboration launched, Lego Technic. Technology
1987 6000 employees. Products are sold in 115 countries. LEGO South Africa closed.
1988 LEGO Canada established.
1989 Educational Products Dep. changes name to LEGO Dacta. Dacta means "the study of purpose, means and substance of learning and the learning process"
1990 Lego Malaysia established. LEGO Group among the 10 largest toy manufacturers in the world + only one in Europe (others are American and Japanese.)
Enters Top 10 list of toy manufacturers. Signs of economic turmoil
1991 7550 employees. 5 manufacturing sites
1992 LEGO Japan (not Nihon K.K. from 1978) established. LEGO Hungary too. Large scale introduction of LEGO products in China
1993 LEGO South Africa re-established. New factory for DUPLO opens in Switzerland, closes again in 2006
1994 8880 employees total, around half in DK. LEGO Mexico established. First ever TV-campaign in China
1995 Fusion between LEGO Belgium and LEGO Netherlands to LEGO Benelux. Various LEGO exhibitions and happenings in different countries
Compass Management fails, enters decade with focus on growth
1996 LEGO website (www.lego.com) established. Factory (only packaging) in Korea established
1997 LEGO kids wear shop opens in London, UK. LEGO Imagination Center is opened in Florida, US

114
1998 First deficit since 1945. Factories in DK, Switzerland, USA, Brazil and Korea is 360,000 m2. Around 80 % is in DK. Close to 10,000 employees
Lego Mindstorms launched based on MIT collaboration. Technology
1999 Undergoes restructuring, 1000 employees laid off. LEGOLAND California, US opens. License deal with Lucas Film on LEGO Star Wars franchise.
Franchise license agreement
2000 DKK 0.8bn deficit. Factory in Czech Republic opens. Partnership deal with Warner Bros on Harry Potter franchise Franchise license agreement. Deficit again, too much focus on growth
2001 Refocus to core business "which is materials for open-ended play for children", Poul Plougmann LEGO COO - due to deficit previous year. Profits DKK 400mn
2002 Retail stores in Germany, England, and Russia. LEGOLAND Germany opens. Profits DKK 400mn
2003 Revenue drops DKK 4.5bn. DKK 0.9bn deficit. COO Poul Plougmann leaves LEGO. Around 300 employees fired from production and corporate functions.
Deficit, COO leaves Lego
2004 New CEO, Jørgen Vig Knudstorp is appointed in October. Year ends with DKK 1.0bn deficit Deficit, new CEO from outside the Kirk family
2005 LEGOLAND parks divested, 1/3 ownership is transferred to Kirkbi parent company. Packaging factory in Korea closes, 60 employees fired. Sales office in Seoul remains. Result DKK 200mn.
Divestiture of theme parks to parent company
2006 5000 employees. Factory in Switzerland closes. Plans to outsource major parts of production. Outsourcing agreement with Flextronics.
Major parts of manufacturing outsourced
2007 4200 employees. License agreement with Lucasfilm on LEGO Indiana Jones. Distribution for all EU/Asian markets moved to Czech Republic.
2008 5400 employees. Production is insourced again after outsourcing to Flextronics proved to be wrong decision. Production insourced
2009 7000 employees. LEGO Group is 5th largest toy manufacturer (sales). License deal with Disney on entire Disney and Pixar franchise. LEGO Board Games product line launched
Franchise license agreements. New industry entered "Board games"
2010 8400 employees. Online gaming industry entered (LEGO Universe) New industry entered "online gaming"
2011 9400 employees. Now third largest toy manufacturer (sales). LEGOLAND Florida opens
2012 10400 employees. Management reduced from 22 employees to 6. Digital game, LEGO Universe shut down Leaves "online gaming" industry.
2013 11800 employees. Plan commenced for factory in China by 2017
2014 12500 employees. Lego name has 80-year birthday. The Lego Movie premieres. Significant impact on the result next year. Now 2nd largest toy manufacturing firm
First movie launched
2015 14000 employees. Lego Worlds online game introduced. Another record-breaking year. Now no. 1 globally when using an averaged currency translation
Enters online gaming again
2016
2017 Factory opens in China. Additional 2000 employees Factory in Asia. Sequel movie to be launched
Ovn creation
8.7 Top products in the traditional toy and games industry
Brand Firm 2008 2009 2010 2011 2012 2013 2014 Hannah Montana JAKKS Pacific 249 295 72 24 1 - 0 Lamaze RC2 Corp 151 157 161 - - - 0 Learning Curve RC2 Corp 228 211 197 - - - 0 Mega Bloks Mega Brands Inc 367 391 475 503 562 586 0 Rastar Xinghui Auto Model Co 14 21 33 54 80 95 0
Total Total 74140 7167
9 7615
8 8186
1 8247
6 8331
3 8509
1
Others Others 48003 4480
8 4637
8 4889
5 4859
6 4889
6 4957
1 Lego LEGO 2584 2844 3367 4152 4841 5311 6058 Fisher-Price Mattel 3212 3011 3173 3183 3205 3173 2823 Barbie Mattel 2119 2041 2169 2332 2228 2098 1857 Private label Private Label 1527 1491 1597 1737 1737 1650 1624 Crayola Hallmark Cards 1025 1192 1233 1244 1288 1347 1357 VTech Vtech 861 854 921 1008 1126 1244 1310 Playmobil Brandstätter 797 803 857 911 905 953 1007 Hot Wheels Mattel 893 933 914 822 870 866 854 Monster High Mattel 0 0 178 470 694 823 716 Playskool Hasbro 580 565 601 653 644 650 629 Nerf Hasbro 355 351 481 493 472 523 621 MEGA Bloks Mattel - - - - - - 612 Ravensburger Ravensburger 490 494 501 510 453 501 488 LeapFrog LeapFrog Enterprises 269 288 327 373 382 414 440 My Little Pony Hasbro 53 86 153 217 282 354 421 Play-Doh Hasbro 282 289 325 339 343 367 403 Disney Princess Mattel 82 255 385 414 444 433 401 Monopoly Hasbro 399 382 382 395 387 390 401 Transformers Hasbro 453 511 440 506 392 325 390 Nabi Fuhu Inc - 0 23 83 144 244 387 Little Tikes MGA Entertainment 372 339 368 371 358 365 379 Star Wars Hasbro 378 375 382 381 377 347 377 Lalaloopsy MGA Entertainment - - 86 246 335 340 366 Teenage Mutant Ninja Turtles
Playmates Toys 2 3 3 10 58 225 361
American Girl Mattel 278 279 282 293 321 362 352 Magic: The Gathering Hasbro 148 158 222 252 286 315 329 Frozen Mattel - - - - - 40 321 Yaoji Poker Shanghai Yaoji Playing Cards Co 130 164 208 238 250 284 294 Smoby Simba-Dickie 253 237 255 288 282 282 272 Littlest Pet Shop Hasbro 289 277 290 288 260 244 257 Chicco Artsana, Gruppo 197 196 206 226 225 238 242 Air Hogs Spin Master 185 190 200 217 223 230 240

115
Brand Firm 2008 2009 2010 2011 2012 2013 2014 Cars Mattel 263 237 245 547 427 272 240 Yo-Kai Watch BANDAI NAMCO - - - - - - 229 Build-a-bear Build-A-Bear Workshop Inc 318 241 234 207 197 193 204 Matchbox Mattel 170 171 190 213 206 199 191 Tomy Takara Tomy 218 226 257 231 221 189 185 FurReal Friends Hasbro 234 219 240 232 196 189 185 LeapPad LeapFrog Enterprises - 0 0 129 203 236 184 Haba Habermaass GmbH 161 155 161 179 171 178 181 Power Rangers BANDAI NAMCO 104 105 126 153 169 187 175 World Wrestling Entertainment
Mattel 87 71 95 183 197 186 173
Uno Mattel 139 127 130 170 175 179 172 Lego Games LEGO - 155 220 217 208 168 170 Furby Hasbro 1 - - - 61 178 167 Bratz MGA Entertainment 479 296 263 245 211 197 167 TOMICA Takara Tomy 140 141 170 184 175 153 146
Auby Guangdong Alpha Animation & Culture Co
58 42 54 84 111 132 143
Yu-Gi-Oh! Konami Corp 167 186 192 240 220 154 138 K'NEX K'NEX Industries 114 104 106 119 128 129 138 Bandai BANDAI NAMCO 75 95 119 183 186 153 136 Mobile Suit Gundam BANDAI NAMCO 115 119 132 152 160 140 135 Moxie Girlz MGA Entertainment 12 76 130 135 137 142 135 Sylvanian Families Epoch Co 37 53 112 131 139 136 134 Beanie Babies Ty Inc 203 172 167 142 124 125 133 Duel Masters Takara Tomy 214 253 275 239 198 144 132 Learning Curve Takara Tomy - - - 191 142 135 128 Simba Simba-Dickie 83 85 94 109 117 125 127 Lamaze Takara Tomy - - - 161 138 136 126
Carrera Stadlbauer Marketing + Vertrieb GmbH
108 105 105 117 119 119 126
Tonka Hasbro 144 139 152 150 143 135 126 Trivial Pursuit Hasbro 133 134 139 139 128 126 125 Masked Rider BANDAI NAMCO 94 131 141 168 168 140 125 Mega House Mega House Corp 151 158 168 186 185 139 123 Max Steel Mattel 105 99 128 136 131 134 121 AAA-Poker Ningbo Three A Group Co 63 76 87 101 106 113 117 Planes Mattel - - - - - 112 116 Brio Brio AB 79 77 93 109 103 105 116 Tyco Mattel 191 154 131 130 123 118 114 Liv Spin Master - 70 118 118 119 109 111 Ben 10 BANDAI NAMCO 267 272 296 238 180 134 111 Disney Princess JAKKS Pacific 178 75 101 97 94 91 111 Scrabble Mattel 112 102 104 115 114 113 110 Gundam BANDAI NAMCO 65 61 80 101 108 108 109 KRE-O Hasbro 1 1 18 80 92 84 108 Clementoni Clementoni SpA 88 94 96 108 104 113 106 Rastar Rastar Group - - - - - - 105 Lego Duplo LEGO 44 54 70 79 90 94 102
Race Tin Flash & Dash Guangdong Alpha Animation & Culture Co
31 27 46 62 75 88 98
QunXing Guangdong Qunxing Toys Joint-Stock Co
57 69 78 80 87 94 96
Revell Hobbico Inc - - - - 82 86 95
Battle of King Guangdong Alpha Animation & Culture Co
- - - - 39 55 93
Hasbro Hasbro 94 85 87 92 93 95 91 Wanshengda Zhejiang Wanshengda Industry Co 48 58 66 77 84 88 91 Leapster LeapFrog Enterprises 87 94 114 92 118 108 90 Frozen JAKKS Pacific - - - - - - 89 Moon Sand Spin Master 60 67 80 87 88 90 88 Meccano Spin Master - - - - - 76 87 Silverlit Silverlit Toys Manufactory 68 68 73 79 78 85 86 BanBao BanBao Co 4 17 40 63 81 82 86
Estrela Manufatura de Brinquedos Estrela SA
60 59 73 78 82 84 85
The Settlers of Catan Mayfair Games Inc 0 37 70 79 81 82 84 Beyblade Hasbro 3 17 103 335 232 114 83
Armor Hero Guangdong Alpha Animation & Culture Co
- 51 90 103 57 66 82
Pinoccio Agatsuma Co 89 94 98 103 101 82 77 Vanguard Bushiroad Inc 11 26 40 83 112 84 75 Sega Sega Sammy Holdings Inc 136 140 132 97 91 76 74 Zoobles Spin Master - 3 60 125 104 84 72 Scrabble Hasbro 55 52 88 83 77 77 72
Nenuco FAMOSA - Fábricasrupadas de Muñecas de Onil SA
73 74 71 76 70 66 63
Toy Story Walt Disney Co, The 59 64 139 87 69 63 63
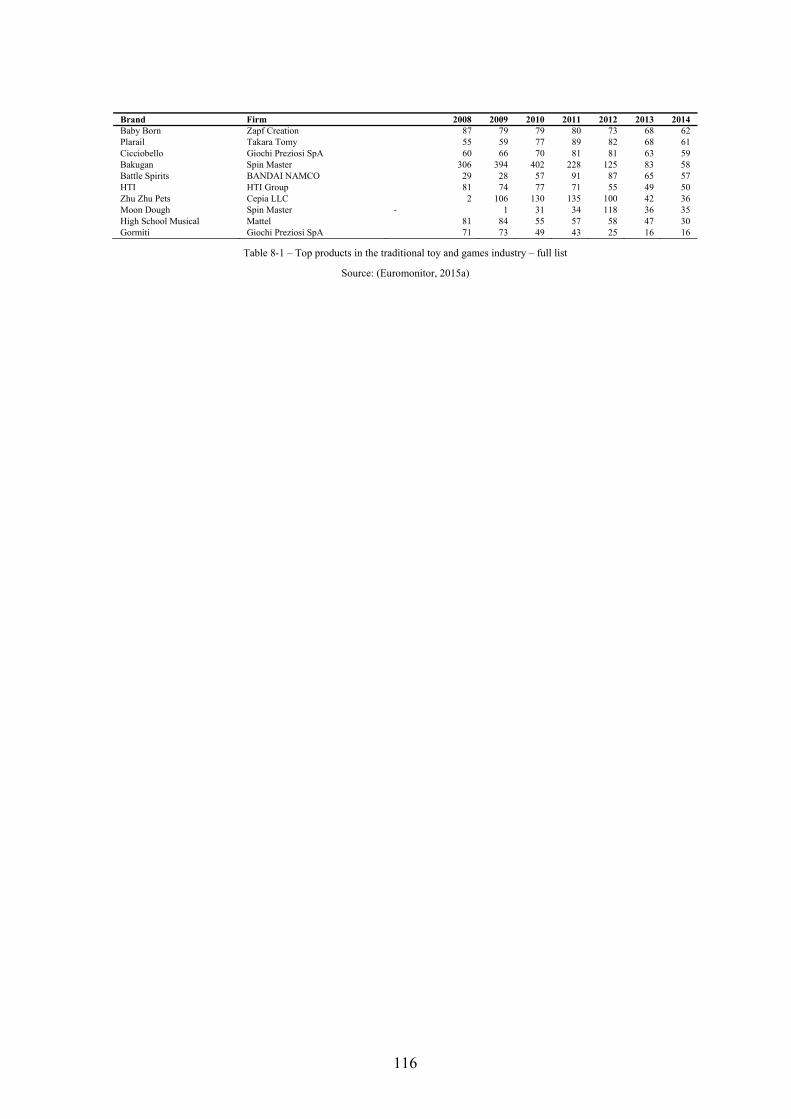
116
Brand Firm 2008 2009 2010 2011 2012 2013 2014 Baby Born Zapf Creation 87 79 79 80 73 68 62 Plarail Takara Tomy 55 59 77 89 82 68 61 Cicciobello Giochi Preziosi SpA 60 66 70 81 81 63 59 Bakugan Spin Master 306 394 402 228 125 83 58 Battle Spirits BANDAI NAMCO 29 28 57 91 87 65 57 HTI HTI Group 81 74 77 71 55 49 50 Zhu Zhu Pets Cepia LLC 2 106 130 135 100 42 36 Moon Dough Spin Master - 1 31 34 118 36 35 High School Musical Mattel 81 84 55 57 58 47 30 Gormiti Giochi Preziosi SpA 71 73 49 43 25 16 16
Table 8-1 – Top products in the traditional toy and games industry – full list
Source: (Euromonitor, 2015a)
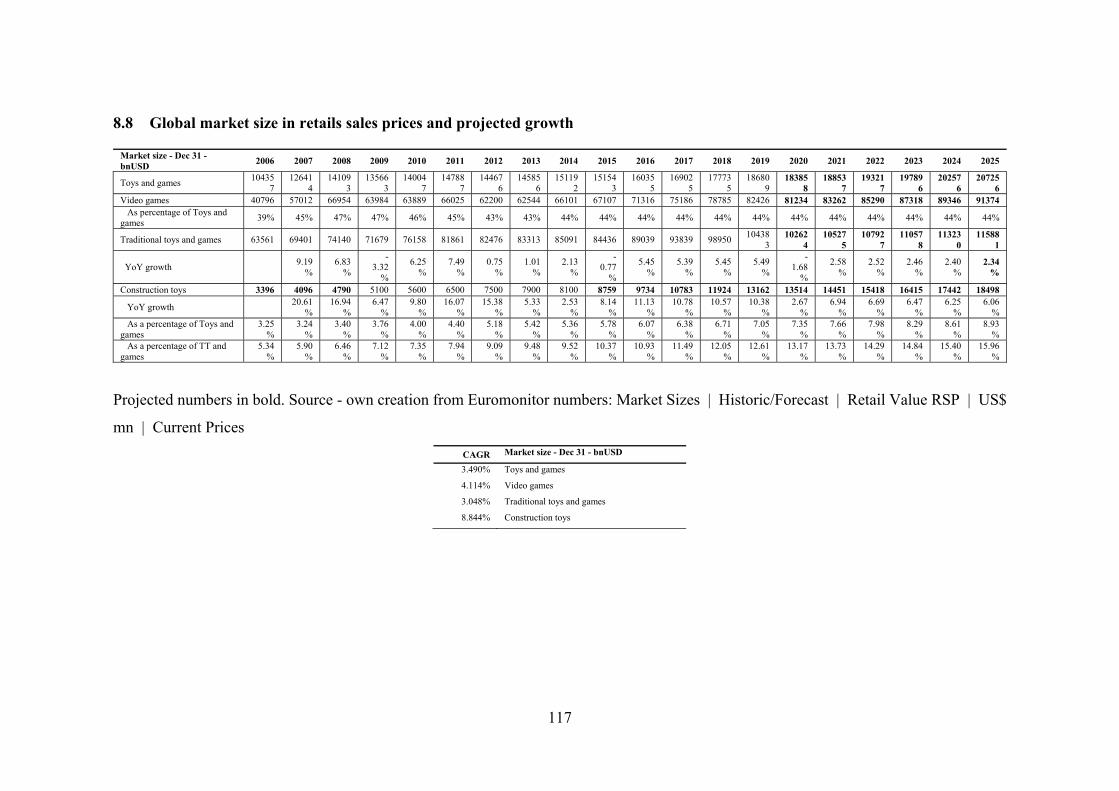
117
8.8 Global market size in retails sales prices and projected growth
Market size - Dec 31 - bnUSD
2006 2007 2008 2009 2010 2011 2012 2013 2014 2015 2016 2017 2018 2019 2020 2021 2022 2023 2024 2025
Toys and games 10435
7 12641
4 14109
3 13566
3 14004
7 14788
7 14467
6 14585
6 15119
2 15154
3 16035
5 16902
5 17773
5 18680
9 18385
8 18853
7 19321
7 19789
6 20257
6 20725
6 Video games 40796 57012 66954 63984 63889 66025 62200 62544 66101 67107 71316 75186 78785 82426 81234 83262 85290 87318 89346 91374 As percentage of Toys and games
39% 45% 47% 47% 46% 45% 43% 43% 44% 44% 44% 44% 44% 44% 44% 44% 44% 44% 44% 44%
Traditional toys and games 63561 69401 74140 71679 76158 81861 82476 83313 85091 84436 89039 93839 98950 10438
3 10262
4 10527
5 10792
7 11057
8 11323
0 11588
1
YoY growth 9.19
% 6.83
%
-3.32
%
6.25%
7.49%
0.75%
1.01%
2.13%
-0.77
%
5.45%
5.39%
5.45%
5.49%
-1.68
%
2.58%
2.52%
2.46%
2.40%
2.34%
Construction toys 3396 4096 4790 5100 5600 6500 7500 7900 8100 8759 9734 10783 11924 13162 13514 14451 15418 16415 17442 18498
YoY growth 20.61
% 16.94
% 6.47
% 9.80
% 16.07
% 15.38
% 5.33
% 2.53
% 8.14
% 11.13
% 10.78
% 10.57
% 10.38
% 2.67
% 6.94
% 6.69
% 6.47
% 6.25
% 6.06
% As a percentage of Toys and games
3.25%
3.24%
3.40%
3.76%
4.00%
4.40%
5.18%
5.42%
5.36%
5.78%
6.07%
6.38%
6.71%
7.05%
7.35%
7.66%
7.98%
8.29%
8.61%
8.93%
As a percentage of TT and games
5.34%
5.90%
6.46%
7.12%
7.35%
7.94%
9.09%
9.48%
9.52%
10.37%
10.93%
11.49%
12.05%
12.61%
13.17%
13.73%
14.29%
14.84%
15.40%
15.96%
Projected numbers in bold. Source - own creation from Euromonitor numbers: Market Sizes | Historic/Forecast | Retail Value RSP | US$
mn | Current Prices
CAGR Market size - Dec 31 - bnUSD
3.490% Toys and games
4.114% Video games
3.048% Traditional toys and games
8.844% Construction toys

118
8.9 Lego Brand
Figure 8-4 – The Lego Brand Framework
Source: (LEGO, 2016b)
Lego describes its brand in the following way (LEGO, 2016b):
“The LEGO brand is more than simply our familiar logo. It is the expectations that people have of the company towards its products
and services, and the accountability that the LEGO Group feels towards the world around it. The brand acts as a guarantee of quality
and originality.
The LEGO® Brand values
Imagination: Curiosity asks why? and imagines explanations or possibilities. Playfulness asks what if? and imagines how the ordinary
becomes extraordinary, fantasy or fiction. Dreaming it is a first step towards doing it. Free play is how children develop their
imagination – the foundation for creativity.
Creativity: Creativity is the ability to come up with ideas and things that are new, surprising and valuable. Systematic creativity is a
particular form of creativity that combines logic and reasoning with playfulness and imagination.
Fun: Fun is the happiness we experience when we are fully engaged in something (hard fun) that requires mastery, when our abilities
are in balance with the challenge at hand and we are making progress towards a goal. Fun is being active together, the thrill of an
adventure, the joyful enthusiasm of children and the delight in surprising both yourself and others in what you can do or create.
Learning: Learning is about being curious, experimenting and collaborating – expanding our thinking and doing (hands-on, minds-on),
helping us develop new insights and new skills. We learn through play by putting things together, taking them apart, and putting them
together in different ways, thereby creating new things, and developing new ways of thinking about ourselves, and the world.
Caring: Caring is about the desire to make a positive difference in the lives of children, for our partners, colleagues and the world we
live in, and considering their perspective in everything we do. Doing that little extra, not because we have to – but because it feels right
and because we care.
Quality: From a reputation for manufacturing excellence to becoming trusted by all – we believe in quality that speaks for itself and
earns us the recommendation of all. For us quality means the challenge of continuous improvement to be the best play material, the best
for children and their development and the best to our community and partners.”

119
8.10 Brand reputation
Firm 2011 2012 2013 2014 2015 2016 Sum Avg
BMW 79.42 80.08 79.39 77.2 78.98 77.9 473 78.83 Google 79.99 78.05 77.15 77.3 78.26 78.1 469 78.14 Disney 79.51 78.92 77.76 77.3 77.11 78.2 469 78.13 Sony 79.05 79.31 76.3 75.9 76.49 76.7 464 77.29 Lego 79.26 76.35 75.02 75.1 77.55 77.4 461 76.78 Canon 78.07 76.98 76.02 75.7 76.64 76.9 460 76.72 Apple 79.77 78.49 75.6 76.5 76.6 387 77.39 Daimler 79.03 75.54 76.58 77.85 77.7 387 77.34 Microsoft 77.29 77.98 76.23 75 77 384 76.70 Rolex 77.23 77.2 77.68 78.4 311 77.63 Volkswagen 77.33 77.04 76.16 231 76.84 Intel 77.56 78 77.56 Nestle 75.21 75 75.21
The data is produced by measuring 7 dimesions of reputation: products & services, innovation, workplace, governance, citizenship, leadership, performance. The numbers are based on a range 160,000-240,000 ratings, 50,000-61,000 interviews in 15 of the largest
economies and of the 100 most ‘highly regarded’ firms in the period: Australia, Brazil, Canada, China, France, Germany, India, Italy, Japan, Mexico, Russia, South Korea, Spain, United Lingdom, USA. Source data: (Reputation Institute, 2016)
Reputation Institute explains the dimensions and score like this (2016):
“Product/Services: Offers high quality products and services - it offers excellent products and reliable services
Innovation: Is an innovative company - it makes or sells innovative products or innovates in the way it does business
Workplace: Is an appealing place to work - it treats its employees well
Governance: Is a responsibly-run company - it behaves ethically and is open & transparent in its business dealings
Citizenship: Is a good corporate citizen - it supports good causes & protects the environment
Leadership: Is a company with strong leadership - it has visible leaders & is managed effectively
Performance: Is a high-performance company - it delivers good financial results
Above 80 Excellent/Top Tier
70-79 Strong/Robust
60-69 Average/Moderate
40-59 Weak/Vulnerable
Below 40 Poor/Bottom Tier
”
473 469 469 464 461 460
387 387 384
311 231
78 75
78.83 78.14
78.13 77.29
76.78
76.72 77.39
77.34 76.70
77.63 76.84
77.56 75.21 73.00
74.00
75.00
76.00
77.00
78.00
79.00
80.00
050
100150200250300350400450500
Summed reputation Avg reputation

120
8.11 Firm concentration ratio
Firm 2014% HHI % C60 HHI, C60 1 Mattel 11.7 136.89 23.31% 5.432% 2 Hasbro 8.0 64.00 15.94% 2.540% 3 LEGO Group 7.5 56.25 14.94% 2.232% 4 BANDAI NAMCO 2.0 4.00 3.98% 0.159% 5 Takara Tomy 1.9 3.61 3.78% 0.143% 6 Vtech 1.8 3.24 3.59% 0.129% 7 Hallmark Cards 1.6 2.56 3.19% 0.102% 8 MGA Entertainment 1.4 1.96 2.79% 0.078% 9 Brandstätter Group 1.2 1.44 2.39% 0.057%
10 LeapFrog 1.2 1.44 2.39% 0.057% 11 Spin Master 1.2 1.44 2.39% 0.057% 12 Simba-Dickie Group 1.0 1.00 1.99% 0.040% 13 JAKKS Pacific 0.8 0.64 1.59% 0.025% 14 Giochi Preziosi 0.6 0.36 1.20% 0.014% 15 Ravensburger 0.6 0.36 1.20% 0.014% 16 Guangdong Alpha Animation & Culture 0.6 0.36 1.20% 0.014% 17 Fuhu 0.5 0.25 1.00% 0.010% 18 Walt Disney, The 0.4 0.16 0.80% 0.006% 19 Playmates Toys 0.4 0.16 0.80% 0.006% 20 FAMOSA 0.3 0.09 0.60% 0.004% 21 Clementoni 0.3 0.09 0.60% 0.004% 22 Artsana, Gruppo 0.3 0.09 0.60% 0.004% 23 Epoch 0.3 0.09 0.60% 0.004% 24 Shanghai Yaoji Playing Cards 0.3 0.09 0.60% 0.004% 25 Build-A-Bear Workshop 0.2 0.04 0.40% 0.002% 26 Zapf Creation 0.2 0.04 0.40% 0.002% 27 Konamirp 0.2 0.04 0.40% 0.002% 28 Ty 0.2 0.04 0.40% 0.002% 29 Habermaass 0.2 0.04 0.40% 0.002% 30 Candide Indústria emércio a 0.2 0.04 0.40% 0.002% 31 K'NEX Industries 0.2 0.04 0.40% 0.002% 32 Brio 0.2 0.04 0.40% 0.002% 33 Grow Jogos e Brinquedos 0.2 0.04 0.40% 0.002% 34 Manufatura de Brinquedos Estrela 0.2 0.04 0.40% 0.002% 35 Asmodee Group 0.2 0.04 0.40% 0.002% 36 Bushiroad 0.2 0.04 0.40% 0.002% 37 Segammy Holdings 0.1 0.01 0.20% 0.000% 38 Mega Houserp 0.1 0.01 0.20% 0.000% 39 Hornby 0.1 0.01 0.20% 0.000% 40 HTI Group 0.1 0.01 0.20% 0.000% 41 Character Group 0.1 0.01 0.20% 0.000% 42 Stadlbauer Marketing + Vertrieb 0.1 0.01 0.20% 0.000% 43 Tamiya 0.1 0.01 0.20% 0.000% 44 Agatsuma 0.1 0.01 0.20% 0.000% 45 Silverlit Toys Manufactory 0.1 0.01 0.20% 0.000% 46 Vivid Imagination 0.1 0.01 0.20% 0.000% 47 Ningbo Three A Group 0.1 0.01 0.20% 0.000% 48 Guangdong Qunxing Toys Joint-Stock 0.1 0.01 0.20% 0.000% 49 Zhejiang Wanshengda Industry 0.1 0.01 0.20% 0.000% 50 Toyroyal 0.1 0.01 0.20% 0.000% 51 Young Toys 0.1 0.01 0.20% 0.000% 52 BanBao 0.1 0.01 0.20% 0.000% 53 Mayfair Games 0.1 0.01 0.20% 0.000% 54 Rastar Group 0.1 0.01 0.20% 0.000% 55 Hobbico 0.1 0.01 0.20% 0.000% 56 RC2rp - - 0.00% 0.000% 57 Mega Brands - - 0.00% 0.000% 58 Revell - - 0.00% 0.000% 59 Xinghui Auto Model - - 0.00% 0.000% 60 Cepia - - 0.00% 0.000%
Total 50.2 2.81% 100.0% 11.160%
Table 8-2 – Firm concentration ratio
HHI = Herfindal-Hirschman Index, C60 calculated as percent of total 50.2 %. Market share source data from (Euromonitor, 2015a).
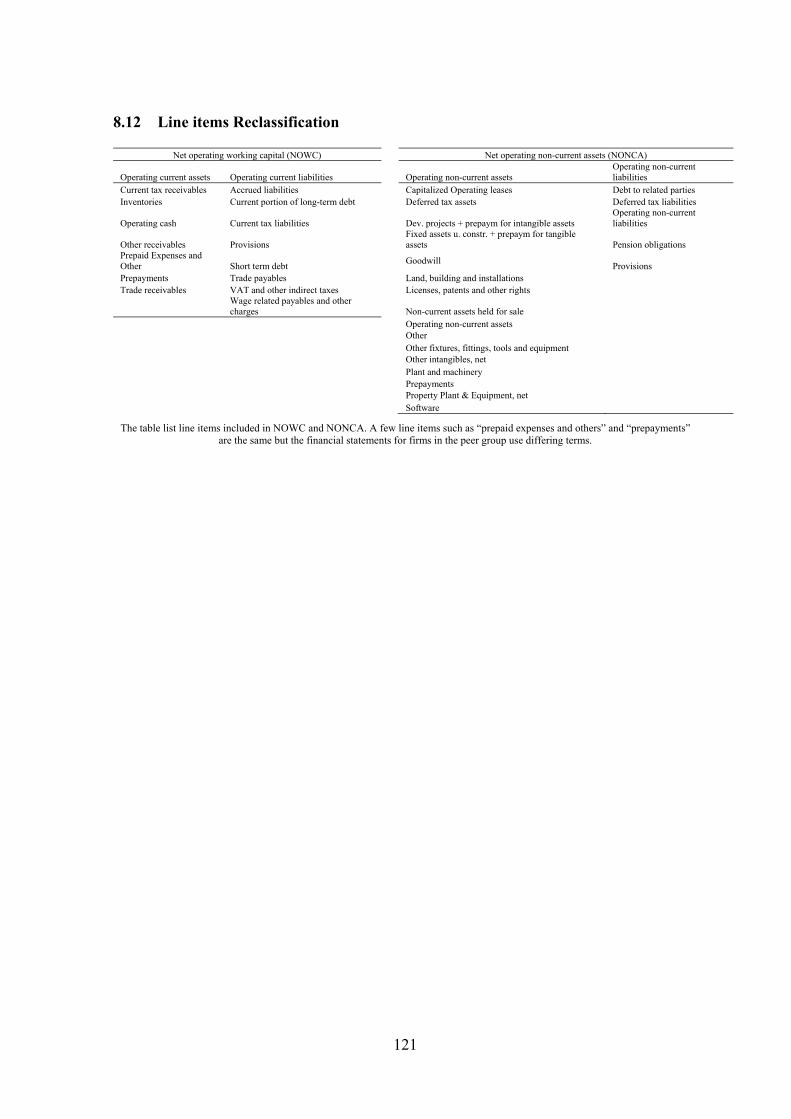
121
8.12 Line items Reclassification
Net operating working capital (NOWC) Net operating non-current assets (NONCA)
Operating current assets Operating current liabilities Operating non-current assets Operating non-current liabilities
Current tax receivables Accrued liabilities Capitalized Operating leases Debt to related parties Inventories Current portion of long-term debt Deferred tax assets Deferred tax liabilities
Operating cash Current tax liabilities Dev. projects + prepaym for intangible assets Operating non-current liabilities
Other receivables Provisions Fixed assets u. constr. + prepaym for tangible assets Pension obligations
Prepaid Expenses and Other Short term debt
Goodwill Provisions
Prepayments Trade payables Land, building and installations Trade receivables VAT and other indirect taxes Licenses, patents and other rights
Wage related payables and other charges Non-current assets held for sale
Operating non-current assets Other Other fixtures, fittings, tools and equipment Other intangibles, net Plant and machinery Prepayments Property Plant & Equipment, net Software
The table list line items included in NOWC and NONCA. A few line items such as “prepaid expenses and others” and “prepayments” are the same but the financial statements for firms in the peer group use differing terms.
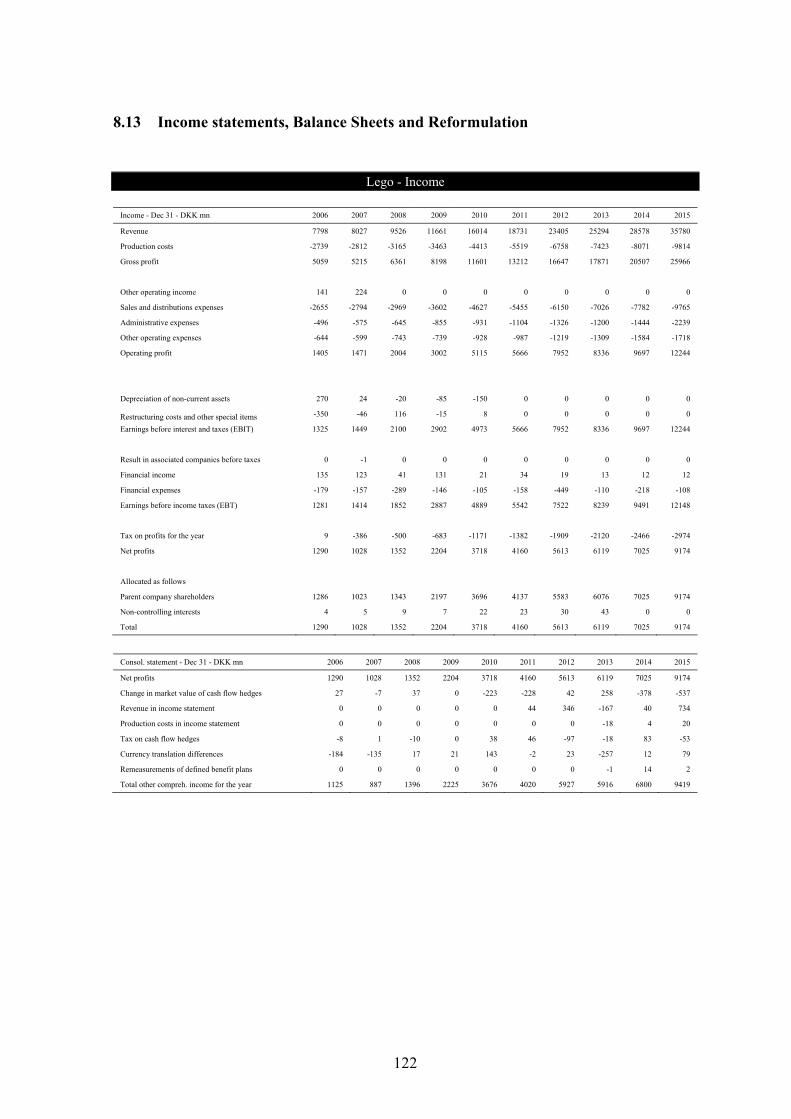
122
8.13 Income statements, Balance Sheets and Reformulation
Lego - Income
Income - Dec 31 - DKK mn 2006 2007 2008 2009 2010 2011 2012 2013 2014 2015
Revenue 7798 8027 9526 11661 16014 18731 23405 25294 28578 35780
Production costs -2739 -2812 -3165 -3463 -4413 -5519 -6758 -7423 -8071 -9814
Gross profit 5059 5215 6361 8198 11601 13212 16647 17871 20507 25966
Other operating income 141 224 0 0 0 0 0 0 0 0
Sales and distributions expenses -2655 -2794 -2969 -3602 -4627 -5455 -6150 -7026 -7782 -9765
Administrative expenses -496 -575 -645 -855 -931 -1104 -1326 -1200 -1444 -2239
Other operating expenses -644 -599 -743 -739 -928 -987 -1219 -1309 -1584 -1718
Operating profit 1405 1471 2004 3002 5115 5666 7952 8336 9697 12244
Depreciation of non-current assets 270 24 -20 -85 -150 0 0 0 0 0
Restructuring costs and other special items -350 -46 116 -15 8 0 0 0 0 0
Earnings before interest and taxes (EBIT) 1325 1449 2100 2902 4973 5666 7952 8336 9697 12244
Result in associated companies before taxes 0 -1 0 0 0 0 0 0 0 0
Financial income 135 123 41 131 21 34 19 13 12 12
Financial expenses -179 -157 -289 -146 -105 -158 -449 -110 -218 -108
Earnings before income taxes (EBT) 1281 1414 1852 2887 4889 5542 7522 8239 9491 12148
Tax on profits for the year 9 -386 -500 -683 -1171 -1382 -1909 -2120 -2466 -2974
Net profits 1290 1028 1352 2204 3718 4160 5613 6119 7025 9174
Allocated as follows
Parent company shareholders 1286 1023 1343 2197 3696 4137 5583 6076 7025 9174
Non-controlling interests 4 5 9 7 22 23 30 43 0 0
Total 1290 1028 1352 2204 3718 4160 5613 6119 7025 9174
Consol. statement - Dec 31 - DKK mn 2006 2007 2008 2009 2010 2011 2012 2013 2014 2015
Net profits 1290 1028 1352 2204 3718 4160 5613 6119 7025 9174
Change in market value of cash flow hedges 27 -7 37 0 -223 -228 42 258 -378 -537
Revenue in income statement 0 0 0 0 0 44 346 -167 40 734
Production costs in income statement 0 0 0 0 0 0 0 -18 4 20
Tax on cash flow hedges -8 1 -10 0 38 46 -97 -18 83 -53
Currency translation differences -184 -135 17 21 143 -2 23 -257 12 79
Remeasurements of defined benefit plans 0 0 0 0 0 0 0 -1 14 2
Total other compreh. income for the year 1125 887 1396 2225 3676 4020 5927 5916 6800 9419

123
Lego – Reformulated Income
Reformulated Income - Dec 31 - DKK mn 2006 2007 2008 2009 2010 2011 2012 2013 2014 2015
Revenue 7798 8027 9526 11661 16014 18731 23405 25294 28578 35780
Other operating income 141 224 0 0 0 0 0 0 0 0
Restructuring costs and other special items -350 -46 116 -15 8 0 0 0 0 0
Operating revenue 7589 8205 9642 11646 16022 18731 23405 25294 28578 35780
Production costs -2739 -2812 -3165 -3463 -4413 -5519 -6758 -7423 -8071 -9814
Production costs adjustments 107 213 201 276 347 441 529 598 763 854
= Gross profit 4957 5606 6678 8459 11956 13653 17176 ### 21270 ###
- Sales and distributions expenses -2655 -2794 -2969 -3602 -4627 -5455 -6150 -7026 -7782 -9765
-/+ Sales and distributions expenses, adjusted 42 26 25 27 59 125 111 109 122 131
- Administrative expenses -496 -575 -645 -855 -931 -1104 -1326 -1200 -1444 -2239
-/+ Administrative expenses, adjusted 58 37 41 40 49 70 13 57 62 96
- Other operating expenses -644 -599 -743 -739 -928 -987 -1219 -1309 -1584 -1718
-/+ Other operating expenses, adjusted 1 1 3 1 1 1 1 0 0 0
Interest expense, operating lease 0 50 75 72 108 119 143 168 182 213
= EBITDA 1263 1752 2465 3403 5687 6422 8749 9268 ### 13538
- Depreciation and amortization -208 -277 -270 -344 -456 -637 -654 -764 -947 -1081
-/+ Reversal of impairment of fixed assets 270 24 -20 -85 -150 0 0 0 0 0
= EBIT 1325 1499 2175 2974 5081 5785 8095 8504 9879 12457
Check 0 0 0 0 0 0 0 0 0
Taxes
Tax on profits for the year 9 -386 -500 -683 -1171 -1382 -1909 -2120 -2466 -2974
Net financial income/expenses -44 -35 -248 -15 -84 -124 -430 -97 -206 -96
Tax rate -0.7% 27.3% 27.0% 23.7% 24.0% 24.9% 25.4% 25.7% 26.0% 24.5%
Tax shield, net financial income/expenses 0 -10 -67 -4 -20 -31 -109 -25 -54 -24
Total tax 9 -396 -567 -687 -1191 -1413 -2018 -2145 -2520 -2998
NOPLAT 1334 1104 1608 2288 3890 4372 6077 6359 7360 9459
Net financial income after tax -44 -25 -181 -11 -64 -93 -321 -72 -152 -72
Interest expense, operating lease 0 -50 -75 -72 -108 -119 -143 -168 -182 -213
Dirty surplus -161 -136 44 21 -20 -140 314 -203 -225 245
Net comprehensive income 1129 892 1396 2225 3698 4020 5927 5916 6800 9419
Non-controlling interests 4 5 9 7 22 23 30 43 0 0
Comprehensive income 1125 887 1387 2218 3676 3997 5897 5873 6800 9419
Verification, comprehensive income 0 0 0 0 0 0 0 0 0 0
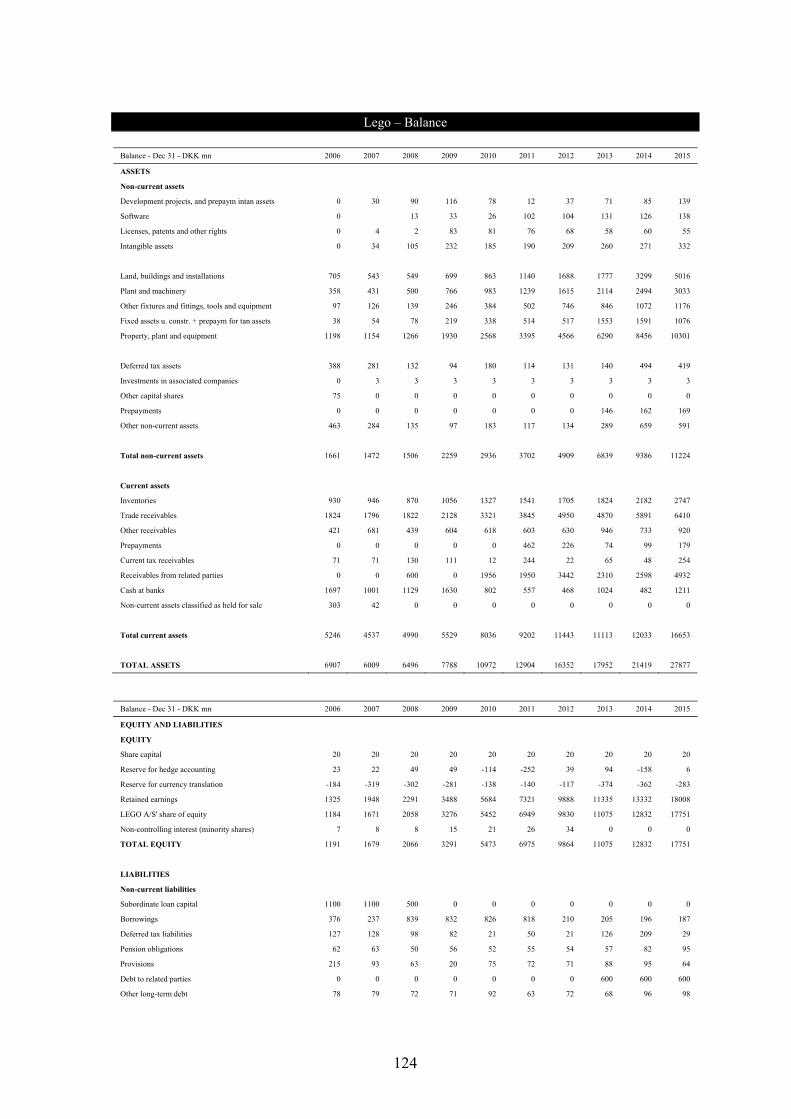
124
Lego – Balance
Balance - Dec 31 - DKK mn 2006 2007 2008 2009 2010 2011 2012 2013 2014 2015
ASSETS
Non-current assets
Development projects, and prepaym intan assets 0 30 90 116 78 12 37 71 85 139
Software 0 13 33 26 102 104 131 126 138
Licenses, patents and other rights 0 4 2 83 81 76 68 58 60 55
Intangible assets 0 34 105 232 185 190 209 260 271 332
Land, buildings and installations 705 543 549 699 863 1140 1688 1777 3299 5016
Plant and machinery 358 431 500 766 983 1239 1615 2114 2494 3033
Other fixtures and fittings, tools and equipment 97 126 139 246 384 502 746 846 1072 1176
Fixed assets u. constr. + prepaym for tan assets 38 54 78 219 338 514 517 1553 1591 1076
Property, plant and equipment 1198 1154 1266 1930 2568 3395 4566 6290 8456 10301
Deferred tax assets 388 281 132 94 180 114 131 140 494 419
Investments in associated companies 0 3 3 3 3 3 3 3 3 3
Other capital shares 75 0 0 0 0 0 0 0 0 0
Prepayments 0 0 0 0 0 0 0 146 162 169
Other non-current assets 463 284 135 97 183 117 134 289 659 591
Total non-current assets 1661 1472 1506 2259 2936 3702 4909 6839 9386 11224
Current assets
Inventories 930 946 870 1056 1327 1541 1705 1824 2182 2747
Trade receivables 1824 1796 1822 2128 3321 3845 4950 4870 5891 6410
Other receivables 421 681 439 604 618 603 630 946 733 920
Prepayments 0 0 0 0 0 462 226 74 99 179
Current tax receivables 71 71 130 111 12 244 22 65 48 254
Receivables from related parties 0 0 600 0 1956 1950 3442 2310 2598 4932
Cash at banks 1697 1001 1129 1630 802 557 468 1024 482 1211
Non-current assets classified as held for sale 303 42 0 0 0 0 0 0 0 0
Total current assets 5246 4537 4990 5529 8036 9202 11443 11113 12033 16653
TOTAL ASSETS 6907 6009 6496 7788 10972 12904 16352 17952 21419 27877
Balance - Dec 31 - DKK mn 2006 2007 2008 2009 2010 2011 2012 2013 2014 2015
EQUITY AND LIABILITIES
EQUITY
Share capital 20 20 20 20 20 20 20 20 20 20
Reserve for hedge accounting 23 22 49 49 -114 -252 39 94 -158 6
Reserve for currency translation -184 -319 -302 -281 -138 -140 -117 -374 -362 -283
Retained earnings 1325 1948 2291 3488 5684 7321 9888 11335 13332 18008
LEGO A/S' share of equity 1184 1671 2058 3276 5452 6949 9830 11075 12832 17751
Non-controlling interest (minority shares) 7 8 8 15 21 26 34 0 0 0
TOTAL EQUITY 1191 1679 2066 3291 5473 6975 9864 11075 12832 17751
LIABILITIES
Non-current liabilities
Subordinate loan capital 1100 1100 500 0 0 0 0 0 0 0
Borrowings 376 237 839 832 826 818 210 205 196 187
Deferred tax liabilities 127 128 98 82 21 50 21 126 209 29
Pension obligations 62 63 50 56 52 55 54 57 82 95
Provisions 215 93 63 20 75 72 71 88 95 64
Debt to related parties 0 0 0 0 0 0 0 600 600 600
Other long-term debt 78 79 72 71 92 63 72 68 96 98

125
Total non-current liabilities 1958 1700 1622 1061 1066 1058 428 1144 1278 1073
Current liabilities
Liabilities related to restructuring of the firm 1288 0 0 0 0 0 0 0 0 0
Borrowings 4 77 4 5 6 7 608 88 162 189
Trade payables 749 778 1036 1336 1518 1611 2112 2201 2530 3143
Current tax liabilities 108 121 83 94 297 97 96 85 154 230
Provisions 176 174 138 100 3 34 64 110 228 158
Other current liabilities (short term debt) 1433 1480 1547 1901 2609 3122 3180 3249 4235 5333
Total current liabilities 3758 2630 2808 3436 4433 4871 6060 5733 7309 9053
TOTAL LIABILITIES 5716 4330 4430 4497 5499 5929 6488 6877 8587 10126
TOTAL EQUITY AND LIABILITIES 6907 6009 6496 7788 10972 12904 16352 17952 21419 27877

126
Lego – Reformulated Balance
Operating assets - Dec 31 - DKK mn 2006 2007 2008 2009 2010 2011 2012 2013 2014 2015
Operating current assets
Inventories 930 946 870 1056 1327 1541 1705 1824 2182 2747
Trade receivables 1824 1796 1822 2128 3321 3845 4950 4870 5891 6410
Other receivables 421 681 439 604 618 603 630 946 733 920
Prepayments 0 0 0 0 0 462 226 74 99 179
Current tax receivables 71 71 130 111 12 244 22 65 48 254
+ Operating cash 156 161 191 233 320 375 468 506 572 716
Total operating currents assets 3402 3655 3452 4132 5598 7070 8001 8285 9525 11226
Operating current liabilities
Trade payables 749 778 1036 1336 1518 1611 2112 2201 2530 3143
Current tax liabilities 108 121 83 94 297 97 96 85 154 230
Wage related payables and other charges 518 566 649 679 780 915 1074 1084 1282 1844
VAT and other indirect taxes 188 262 266 330 408
Provisions 176 174 138 100 3 103 64 110 228 158
Total operating current liabilities 1551 1639 1906 2209 2598 2914 3608 3746 4524 5783
NOWC 1851 2016 1546 1923 3000 4156 4393 4539 5001 5443
Operating non-current assets
Deferred tax assets 388 281 132 94 180 114 131 140 494 419
Development projects + prepay for intan assets 0 30 90 116 78 12 37 71 85 139
Software 0 0 13 33 26 102 104 131 126 138
Licenses, patents and other rights 0 4 2 83 81 76 68 58 60 55
Land, building and installations 705 543 549 699 863 1140 1688 1777 3299 5016
Plant and machinery 358 431 500 766 983 1239 1615 2114 2494 3033
Other fixtures, fittings, tools and equipment 97 126 139 246 384 571 746 846 1072 1176
Fixed assets u. constr. + prepaym for tan assets 38 54 78 219 338 514 517 1553 1591 1076
Non-current assets held for sale 303 42 0 0 0 0 0 0 0 0
Prepayments 146 162 169
+ Capitalized operating leases 1079 1598 1548 2306 2553 3064 3599 3904 4555 4555
Total operating non-current assets 2968 3109 3051 4562 5486 6832 8505 10740 13938 15776
Operating non-current liabilities
Deferred tax liabilities 127 128 98 82 21 50 21 126 209 29
Pension obligations 62 63 50 56 52 55 54 57 82 95
Provisions 215 93 63 20 75 72 71 88 95 64
Debt to related parties 600 600 600
Total operating non-current liabilities 404 284 211 158 148 177 146 871 986 788
NONCA 2564 2825 2840 4404 5338 6655 8359 9869 12952 14988
Invested capital 4415 4840 4386 6327 8338 10810 12752 14408 17952 20430
Financial assets - Dec 31 - DKK mn 2006 2007 2008 2009 2010 2011 2012 2013 2014 2015
Financial assets
Remaining cash and cash equivalents (excess cash) 1541 840 938 1397 482 182 0 518 -90 495
Marketable securities (bonds) 75 0 0 0 0 0 0 0 0 0
Investments in associates 0 3 3 3 3 3 3 3 3 3
Receivables from related parties 0 0 600 0 1956 1950 3442 2310 2598 4932
Total financial assets 1616 843 1541 1400 2441 2135 3445 2831 2511 5430
Financial liabilities
Subordinate loan capital 1100 1100 500 0 0 0 0 0 0 0
Borrowings, credit institutions - non-current 376 237 839 832 826 818 210 205 196 187
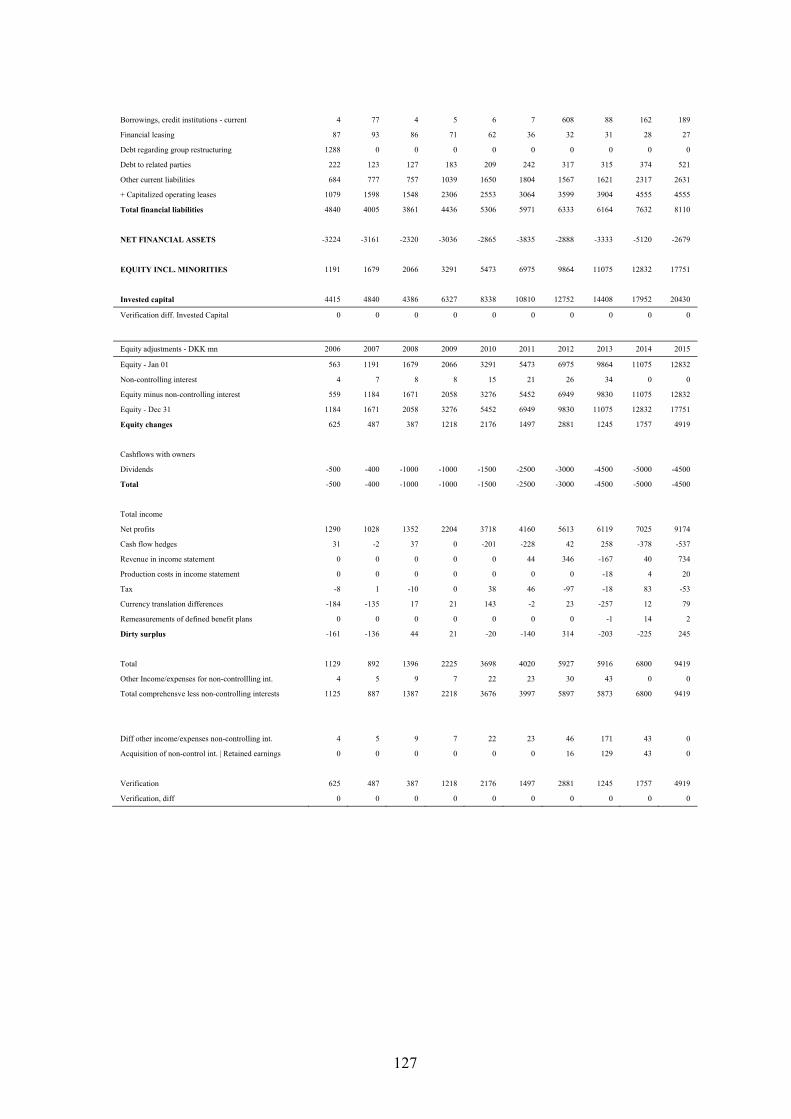
127
Borrowings, credit institutions - current 4 77 4 5 6 7 608 88 162 189
Financial leasing 87 93 86 71 62 36 32 31 28 27
Debt regarding group restructuring 1288 0 0 0 0 0 0 0 0 0
Debt to related parties 222 123 127 183 209 242 317 315 374 521
Other current liabilities 684 777 757 1039 1650 1804 1567 1621 2317 2631
+ Capitalized operating leases 1079 1598 1548 2306 2553 3064 3599 3904 4555 4555
Total financial liabilities 4840 4005 3861 4436 5306 5971 6333 6164 7632 8110
NET FINANCIAL ASSETS -3224 -3161 -2320 -3036 -2865 -3835 -2888 -3333 -5120 -2679
EQUITY INCL. MINORITIES 1191 1679 2066 3291 5473 6975 9864 11075 12832 17751
Invested capital 4415 4840 4386 6327 8338 10810 12752 14408 17952 20430
Verification diff. Invested Capital 0 0 0 0 0 0 0 0 0 0
Equity adjustments - DKK mn 2006 2007 2008 2009 2010 2011 2012 2013 2014 2015
Equity - Jan 01 563 1191 1679 2066 3291 5473 6975 9864 11075 12832
Non-controlling interest 4 7 8 8 15 21 26 34 0 0
Equity minus non-controlling interest 559 1184 1671 2058 3276 5452 6949 9830 11075 12832
Equity - Dec 31 1184 1671 2058 3276 5452 6949 9830 11075 12832 17751
Equity changes 625 487 387 1218 2176 1497 2881 1245 1757 4919
Cashflows with owners
Dividends -500 -400 -1000 -1000 -1500 -2500 -3000 -4500 -5000 -4500
Total -500 -400 -1000 -1000 -1500 -2500 -3000 -4500 -5000 -4500
Total income
Net profits 1290 1028 1352 2204 3718 4160 5613 6119 7025 9174
Cash flow hedges 31 -2 37 0 -201 -228 42 258 -378 -537
Revenue in income statement 0 0 0 0 0 44 346 -167 40 734
Production costs in income statement 0 0 0 0 0 0 0 -18 4 20
Tax -8 1 -10 0 38 46 -97 -18 83 -53
Currency translation differences -184 -135 17 21 143 -2 23 -257 12 79
Remeasurements of defined benefit plans 0 0 0 0 0 0 0 -1 14 2
Dirty surplus -161 -136 44 21 -20 -140 314 -203 -225 245
Total 1129 892 1396 2225 3698 4020 5927 5916 6800 9419
Other Income/expenses for non-controllling int. 4 5 9 7 22 23 30 43 0 0
Total comprehensve less non-controlling interests 1125 887 1387 2218 3676 3997 5897 5873 6800 9419
Diff other income/expenses non-controlling int. 4 5 9 7 22 23 46 171 43 0
Acquisition of non-control int. | Retained earnings 0 0 0 0 0 0 16 129 43 0
Verification 625 487 387 1218 2176 1497 2881 1245 1757 4919
Verification, diff 0 0 0 0 0 0 0 0 0 0
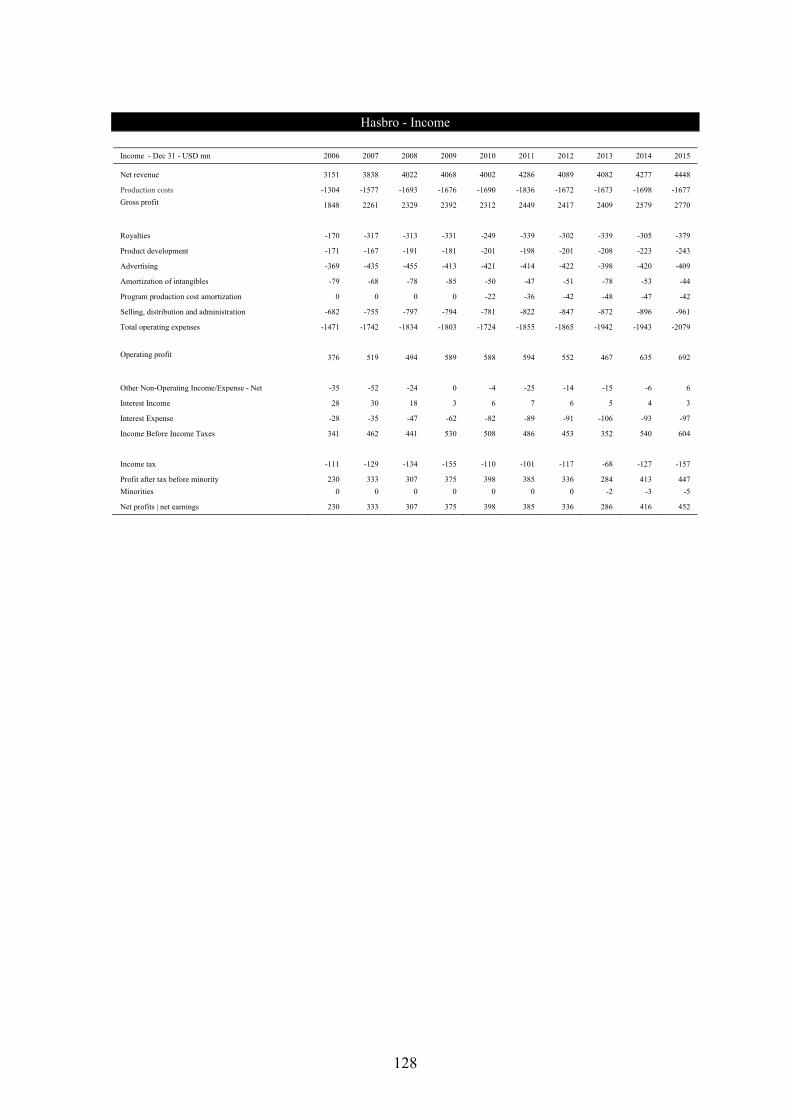
128
Hasbro - Income
Income - Dec 31 - USD mn 2006 2007 2008 2009 2010 2011 2012 2013 2014 2015
Net revenue 3151 3838 4022 4068 4002 4286 4089 4082 4277 4448
Production costs -1304 -1577 -1693 -1676 -1690 -1836 -1672 -1673 -1698 -1677
Gross profit 1848 2261 2329 2392 2312 2449 2417 2409 2579 2770
Royalties -170 -317 -313 -331 -249 -339 -302 -339 -305 -379
Product development -171 -167 -191 -181 -201 -198 -201 -208 -223 -243
Advertising -369 -435 -455 -413 -421 -414 -422 -398 -420 -409
Amortization of intangibles -79 -68 -78 -85 -50 -47 -51 -78 -53 -44
Program production cost amortization 0 0 0 0 -22 -36 -42 -48 -47 -42
Selling, distribution and administration -682 -755 -797 -794 -781 -822 -847 -872 -896 -961
Total operating expenses -1471 -1742 -1834 -1803 -1724 -1855 -1865 -1942 -1943 -2079
Operating profit 376 519 494 589 588 594 552 467 635 692
Other Non-Operating Income/Expense - Net -35 -52 -24 0 -4 -25 -14 -15 -6 6
Interest Income 28 30 18 3 6 7 6 5 4 3
Interest Expense -28 -35 -47 -62 -82 -89 -91 -106 -93 -97
Income Before Income Taxes 341 462 441 530 508 486 453 352 540 604
Income tax -111 -129 -134 -155 -110 -101 -117 -68 -127 -157
Profit after tax before minority 230 333 307 375 398 385 336 284 413 447
Minorities 0 0 0 0 0 0 0 -2 -3 -5
Net profits | net earnings 230 333 307 375 398 385 336 286 416 452
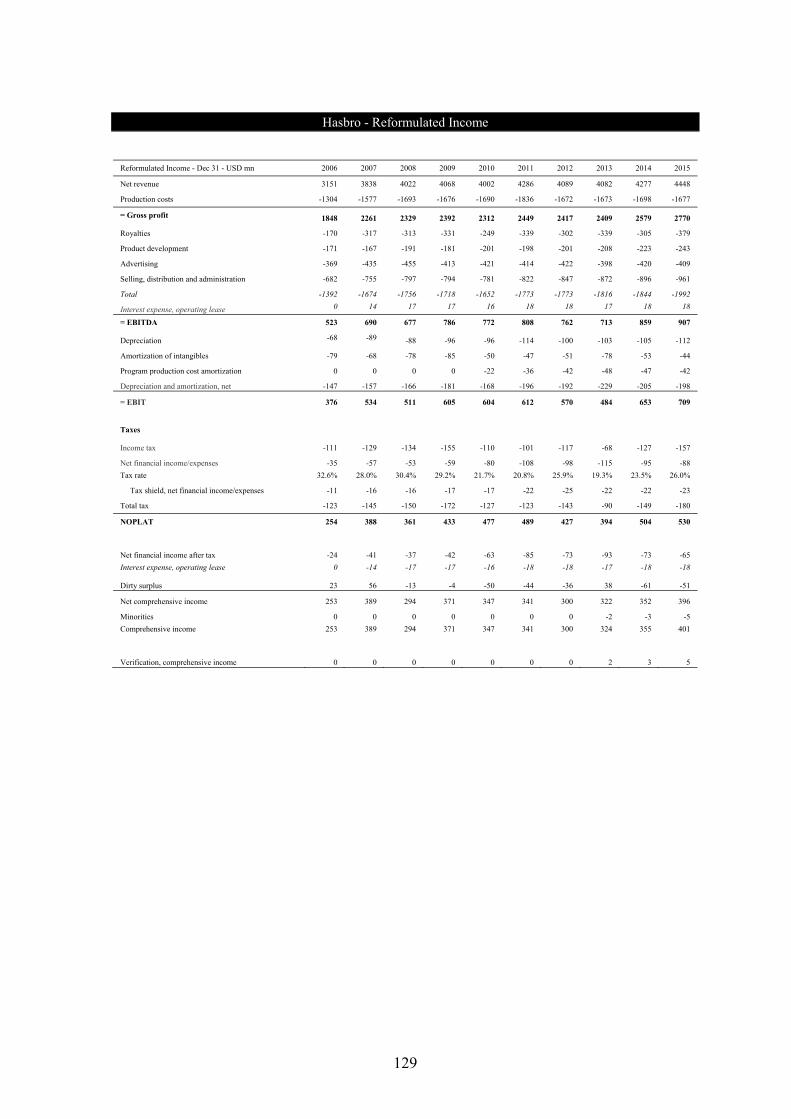
129
Hasbro - Reformulated Income
Reformulated Income - Dec 31 - USD mn 2006 2007 2008 2009 2010 2011 2012 2013 2014 2015
Net revenue 3151 3838 4022 4068 4002 4286 4089 4082 4277 4448
Production costs -1304 -1577 -1693 -1676 -1690 -1836 -1672 -1673 -1698 -1677
= Gross profit 1848 2261 2329 2392 2312 2449 2417 2409 2579 2770
Royalties -170 -317 -313 -331 -249 -339 -302 -339 -305 -379
Product development -171 -167 -191 -181 -201 -198 -201 -208 -223 -243
Advertising -369 -435 -455 -413 -421 -414 -422 -398 -420 -409
Selling, distribution and administration -682 -755 -797 -794 -781 -822 -847 -872 -896 -961
Total -1392 -1674 -1756 -1718 -1652 -1773 -1773 -1816 -1844 -1992
Interest expense, operating lease 0 14 17 17 16 18 18 17 18 18
= EBITDA 523 690 677 786 772 808 762 713 859 907
Depreciation -68 -89 -88 -96 -96 -114 -100 -103 -105 -112
Amortization of intangibles -79 -68 -78 -85 -50 -47 -51 -78 -53 -44
Program production cost amortization 0 0 0 0 -22 -36 -42 -48 -47 -42
Depreciation and amortization, net -147 -157 -166 -181 -168 -196 -192 -229 -205 -198
= EBIT 376 534 511 605 604 612 570 484 653 709
Taxes
Income tax -111 -129 -134 -155 -110 -101 -117 -68 -127 -157
Net financial income/expenses -35 -57 -53 -59 -80 -108 -98 -115 -95 -88
Tax rate 32.6% 28.0% 30.4% 29.2% 21.7% 20.8% 25.9% 19.3% 23.5% 26.0%
Tax shield, net financial income/expenses -11 -16 -16 -17 -17 -22 -25 -22 -22 -23
Total tax -123 -145 -150 -172 -127 -123 -143 -90 -149 -180
NOPLAT 254 388 361 433 477 489 427 394 504 530
Net financial income after tax -24 -41 -37 -42 -63 -85 -73 -93 -73 -65
Interest expense, operating lease 0 -14 -17 -17 -16 -18 -18 -17 -18 -18
Dirty surplus 23 56 -13 -4 -50 -44 -36 38 -61 -51
Net comprehensive income 253 389 294 371 347 341 300 322 352 396
Minorities 0 0 0 0 0 0 0 -2 -3 -5
Comprehensive income 253 389 294 371 347 341 300 324 355 401
Verification, comprehensive income 0 0 0 0 0 0 0 2 3 5

130
Hasbro – Balance
Balance - Dec 31 - USD mn 2006 2007 2008 2009 2010 2011 2012 2013 2014 2015
ASSETS
Current assets
Cash and cash equivalents 715 774 630 636 728 642 850 682 893 977
Trade receivables 556 655 612 1039 961 1035 1030 1094 1095 1218
Inventories 203 259 300 208 364 334 316 349 340 384
Prepaid expenses 243 200 171 162 168 243 312 356 392 287
Total current assets 1718 1888 1714 2045 2221 2254 2508 2480 2719 2866
Non-current assets
Property, plant and equipment
Gross property, plant and equipment 561 589 615 652 664 672 712 737 746 601
Accumulated Depreciation -379 -401 -403 -432 -430 -454 -482 -500 -509 -364
Net property, plant and equipment 182 188 212 221 234 218 230 236 237 238
Goodwill 470 471 474 476 475 475 475 594 593 593
Intangible assets 532 486 568 555 501 467 417 376 325 281
Other long-term assets 195 203 200 601 663 717 695 715 658 744
Total non-current assets 1379 1349 1455 1852 1872 1877 1817 1922 1813 1855
TOTAL ASSETS 3097 3237 3169 3897 4093 4131 4325 4402 4532 4721
Balance - Dec 31 - USD mn 2006 2007 2008 2009 2010 2011 2012 2013 2014 2015
EQUITY AND LIABILITIES
LIABILITIES
Current liabilities
Short-term debt 11 10 8 14 15 180 224 8 252 165
Current portion of long-term debt 0 135 0 0 0 0 0 428 0 0
Trade payables 160 186 184 173 133 135 140 199 213 241
Taxes payable 0 0 0 0 0 53 41 0 0 0
Accrued liabilities 735 556 608 628 572 574 555 728 610 659
Total current liabilities 906 888 800 816 719 942 960 1363 1075 1065
Non-current liabilities
Long-term debt 495 710 710 1132 1398 1401 1396 960 1560 1547
Other long-term liabilities 158 255 268 354 361 370 461 397 432 445
Total non-current liabilities 653 964 978 1486 1759 1771 1858 1357 1992 1992
TOTAL LIABILITIES 1559 1852 1778 2302 2478 2713 2818 2720 3066 3057
EQUITY
Common stock 105 105 105 105 105 105 105 105 105 105
Additional paid-in capital 322 369 450 467 626 630 656 734 806 894
Retained earnings 2020 2262 2457 2721 2978 3205 3355 3432 3630 3852
Treasury stock -921 -1425 -1683 -1756 -2102 -2487 -2536 -2555 -2980 -3041
Accumulated other comprehensive income 11 75 62 59 8 -36 -72 -34 -95 -146
TOTAL EQUITY 1538 1385 1391 1595 1615 1418 1507 1682 1466 1664
TOTAL EQUITY AND LIABILITIES 3097 3237 3169 3897 4093 4131 4325 4402 4532 4721
Verification 0 0 0 0 0 0 0 0 0 0
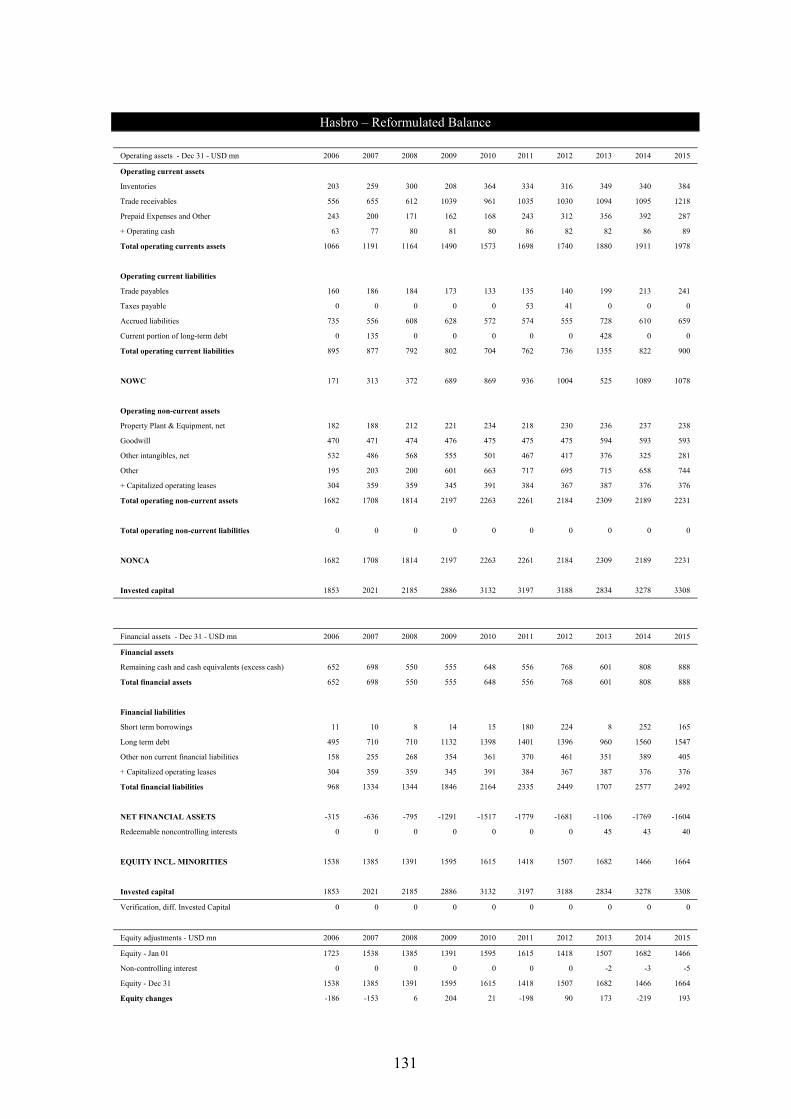
131
Hasbro – Reformulated Balance
Operating assets - Dec 31 - USD mn 2006 2007 2008 2009 2010 2011 2012 2013 2014 2015
Operating current assets
Inventories 203 259 300 208 364 334 316 349 340 384
Trade receivables 556 655 612 1039 961 1035 1030 1094 1095 1218
Prepaid Expenses and Other 243 200 171 162 168 243 312 356 392 287
+ Operating cash 63 77 80 81 80 86 82 82 86 89
Total operating currents assets 1066 1191 1164 1490 1573 1698 1740 1880 1911 1978
Operating current liabilities
Trade payables 160 186 184 173 133 135 140 199 213 241
Taxes payable 0 0 0 0 0 53 41 0 0 0
Accrued liabilities 735 556 608 628 572 574 555 728 610 659
Current portion of long-term debt 0 135 0 0 0 0 0 428 0 0
Total operating current liabilities 895 877 792 802 704 762 736 1355 822 900
NOWC 171 313 372 689 869 936 1004 525 1089 1078
Operating non-current assets
Property Plant & Equipment, net 182 188 212 221 234 218 230 236 237 238
Goodwill 470 471 474 476 475 475 475 594 593 593
Other intangibles, net 532 486 568 555 501 467 417 376 325 281
Other 195 203 200 601 663 717 695 715 658 744
+ Capitalized operating leases 304 359 359 345 391 384 367 387 376 376
Total operating non-current assets 1682 1708 1814 2197 2263 2261 2184 2309 2189 2231
Total operating non-current liabilities 0 0 0 0 0 0 0 0 0 0
NONCA 1682 1708 1814 2197 2263 2261 2184 2309 2189 2231
Invested capital 1853 2021 2185 2886 3132 3197 3188 2834 3278 3308
43% 70% 71% 94% 110% 138% 138% 78% 150% 127%
Financial assets - Dec 31 - USD mn 2006 2007 2008 2009 2010 2011 2012 2013 2014 2015
Financial assets
Remaining cash and cash equivalents (excess cash) 652 698 550 555 648 556 768 601 808 888
Total financial assets 652 698 550 555 648 556 768 601 808 888
Financial liabilities
Short term borrowings 11 10 8 14 15 180 224 8 252 165
Long term debt 495 710 710 1132 1398 1401 1396 960 1560 1547
Other non current financial liabilities 158 255 268 354 361 370 461 351 389 405
+ Capitalized operating leases 304 359 359 345 391 384 367 387 376 376
Total financial liabilities 968 1334 1344 1846 2164 2335 2449 1707 2577 2492
NET FINANCIAL ASSETS -315 -636 -795 -1291 -1517 -1779 -1681 -1106 -1769 -1604
Redeemable noncontrolling interests 0 0 0 0 0 0 0 45 43 40
EQUITY INCL. MINORITIES 1538 1385 1391 1595 1615 1418 1507 1682 1466 1664
Invested capital 1853 2021 2185 2886 3132 3197 3188 2834 3278 3308
Verification, diff. Invested Capital 0 0 0 0 0 0 0 0 0 0
Equity adjustments - USD mn 2006 2007 2008 2009 2010 2011 2012 2013 2014 2015
Equity - Jan 01 1723 1538 1385 1391 1595 1615 1418 1507 1682 1466
Non-controlling interest 0 0 0 0 0 0 0 -2 -3 -5
Equity - Dec 31 1538 1385 1391 1595 1615 1418 1507 1682 1466 1664
Equity changes -186 -153 6 204 21 -198 90 173 -219 193
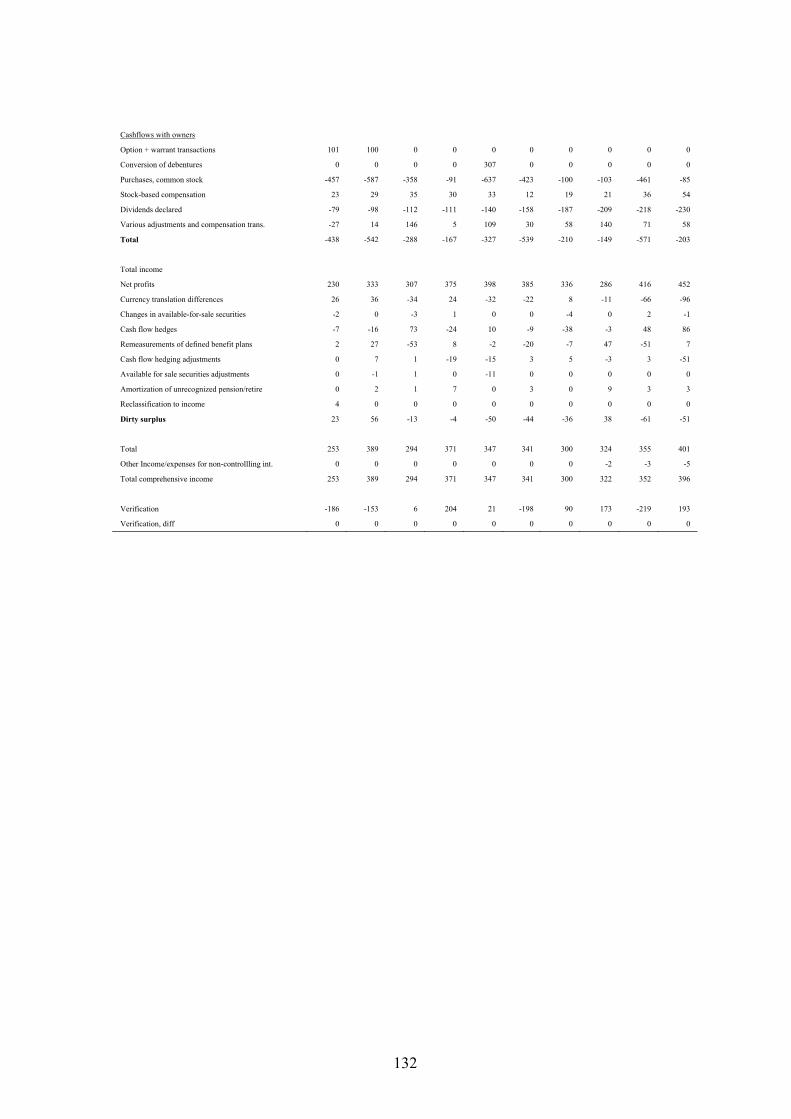
132
Cashflows with owners
Option + warrant transactions 101 100 0 0 0 0 0 0 0 0
Conversion of debentures 0 0 0 0 307 0 0 0 0 0
Purchases, common stock -457 -587 -358 -91 -637 -423 -100 -103 -461 -85
Stock-based compensation 23 29 35 30 33 12 19 21 36 54
Dividends declared -79 -98 -112 -111 -140 -158 -187 -209 -218 -230
Various adjustments and compensation trans. -27 14 146 5 109 30 58 140 71 58
Total -438 -542 -288 -167 -327 -539 -210 -149 -571 -203
Total income
Net profits 230 333 307 375 398 385 336 286 416 452
Currency translation differences 26 36 -34 24 -32 -22 8 -11 -66 -96
Changes in available-for-sale securities -2 0 -3 1 0 0 -4 0 2 -1
Cash flow hedges -7 -16 73 -24 10 -9 -38 -3 48 86
Remeasurements of defined benefit plans 2 27 -53 8 -2 -20 -7 47 -51 7
Cash flow hedging adjustments 0 7 1 -19 -15 3 5 -3 3 -51
Available for sale securities adjustments 0 -1 1 0 -11 0 0 0 0 0
Amortization of unrecognized pension/retire 0 2 1 7 0 3 0 9 3 3
Reclassification to income 4 0 0 0 0 0 0 0 0 0
Dirty surplus 23 56 -13 -4 -50 -44 -36 38 -61 -51
Total 253 389 294 371 347 341 300 324 355 401
Other Income/expenses for non-controllling int. 0 0 0 0 0 0 0 -2 -3 -5
Total comprehensive income 253 389 294 371 347 341 300 322 352 396
Verification -186 -153 6 204 21 -198 90 173 -219 193
Verification, diff 0 0 0 0 0 0 0 0 0 0

133
Mattel - Income
Income - Dec 31 - USD mn 2006 2007 2008 2009 2010 2011 2012 2013 2014 2015
Net sales 5650 5970 5918 5431 5856 6266 6421 6485 6024 5703
Production costs -3038 -3193 -3234 -2716 -2901 -3120 -3012 -3006 -3023 -2896
Gross profit 2612 2777 2684 2715 2955 3146 3409 3479 3001 2806
Selling General and Administrative Expenses -1232 -1338 -1423 -1374 -1406 -1405 -1670 -1561 -1614 -1548
Sales/Marketing/Advertising Expenses -651 -709 -719 -610 -647 -699 -718 -750 -733 -718
Operating income 729 730 542 731 902 1041 1021 1168 654 541
Other Non-Operating Income/Expense - Net 4 11 3 -7 1 -3 6 4 5 1
Interest Income 30 33 25 8 8 8 7 6 7 7
Interest Expense -80 -71 -82 -72 -65 -75 -89 -79 -79 -85
Income Before Income Taxes 684 703 488 660 847 971 945 1099 587 464
Income tax -91 -103 -108 -131 -162 -202 -169 -195 -88 -94
Net profits 593 600 380 529 685 769 776 904 499 369

134
Mattel - Reformulated Income
Reformulated Income - Dec 31 - USD mn 2006 2007 2008 2009 2010 2011 2012 2013 2014 2015
Net sales 5650 5970 5918 5431 5856 6266 6421 6485 6024 5703
Production costs -3038 -3193 -3234 -2716 -2901 -3120 -3012 -3006 -3023 -2896
= Gross profit 2612 2777 2684 2715 2955 3146 3409 3479 3001 2806
Selling General and Administrative Expenses -1232 -1338 -1423 -1374 -1406 -1405 -1670 -1561 -1614 -1548
Sales/Marketing/Advertising Expenses -651 -709 -719 -610 -647 -699 -718 -750 -733 -718
Total -1883 -2047 -2143 -1984 -2053 -2105 -2388 -2311 -2347 -2265
Interest expense, operating lease 0 36 41 47 45 44 45 43 47 44
= EBITDA 901 938 754 948 1113 1246 1240 1407 949 851
Depreciation -166 -161 -160 -152 -150 -147 -158 -179 -208 -233
Amortization -6 -11 -12 -18 -16 -14 -17 -17 -41 -32.4
Depreciation and amortization, net -172 -172 -172 -170 -166 -161 -174 -196 -249 -265
= EBIT 729 766 582 778 947 1085 1066 1211 700 585
Taxes
Income tax -91 -103 -108 -131 -162 -202 -169 -195 -88 -94
Net financial income/expenses -45 -27 -54 -71 -55 -70 -76 -69 -67 -77
Tax rate 13.3% 14.7% 22.2% 19.9% 19.1% 20.8% 17.8% 17.8% 15.0% 20.4%
Tax shield, net financial income/expenses -6 -4 -12 -14 -11 -15 -14 -12 -10 -16
Total tax -97 -107 -120 -145 -172 -217 -182 -207 -98 -110
NOPLAT 632 659 462 633 775 868 884 1003 602 475
Net financial income after tax -39 -23 -42 -57 -45 -56 -62 -57 -57 -61
Interest expense, operating lease 0 -36 -41 -47 -45 -44 -45 -43 -47 -44
Dirty surplus 80 101 -255 51 20 -87 -18 21 -178 -227
Net comprehensive income 673 701 125 580 705 681 759 925 320 143
Comprehensive income 673 701 125 580 705 681 759 925 320 143
Verification, comprehensive income 0 0 0 0 0 0 0 0 0 0

135
Mattel – Balance
Balance - Dec 31 - USD mn 2006 2007 2008 2009 2010 2011 2012 2013 2014 2015
ASSETS
Current assets
Cash and cash equivalents 1206 901 618 1117 1281 1369 1336 1039 972 893
Trade receivables 944 991 874 749 1146 1247 1227 1260 1093 1145
Inventories 383 429 486 356 464 487 465 569 562 588
Prepaid expenses 318 272 410 333 336 341 529 510 559 571
Total current assets 2850 2593 2387 2555 3227 3444 3557 3378 3186 3197
Non-current assets
Property, plant and equipment
Gross property, plant and equipment 1716 1820 1753 1823 1876 1986 2133 2240 2395 2508
Accumulated Depreciation -1180 -1301 -1217 -1318 -1391 -1462 -1540 -1580 -1657 -1767
Net property, plant and equipment 537 519 536 505 485 524 593 659 #### 741
Goodwill 845 846 816 828 824 822 1081 1083 1394 1385
Intangible assets 71 199 236 216 214 207 706 681 739 700
Deferred income taxes 503 468 524 481 477 474 375 374 385 317
Other long-term assets 150 182 176 196 192 201 215 265 280 212
Total non-current assets 2106 2213 2288 2226 2191 2228 2970 3062 3536 3356
TOTAL ASSETS 4956 4805 4675 4781 5418 5672 6527 6440 6722 6553
Balance - Dec 31 - USD mn 2006 2007 2008 2009 2010 2011 2012 2013 2014 2015
EQUITY AND LIABILITIES
LIABILITIES
Current liabilities
Short term debt / Current portion of long-term debt 64 50 150 52 250 58 410 4 0 317
Trade payables 376 441 422 351 406 335 385 375 430 652
Taxes payable 162 17 39 40 52 87 33 98 19 19
Accrued liabilities 980 713 649 618 642 239 888 570 640 658
Other current liabilities 0 349 0 0 0 320 0 0 0 0
Total current liabilities 1583 1570 1260 1061 1350 1039 1716 1047 1089 1646
Non-current liabilities
Long-term debt 636 550 750 700 950 1500 1100 1600 2100 1800
Other long-term liabilities 305 378 548 489 489 522 644 541 584 474
Total non-current liabilities 940 928 1298 1189 1439 2022 1744 2141 2684 2274
TOTAL LIABILITIES 2523 2499 2558 2250 2789 3061 3460 3188 3773 3919
EQUITY
Common stock 441 441 441 441 441 441 441 441 441 441
Additional paid-in capital 1613 1635 1642 1685 1706 1690 1728 1784 1767 1790
Retained earnings 1652 1977 2086 2340 2721 3168 3515 3918 3896 3746
Treasury stock -997 -1572 -1621 -1555 -1881 -2243 -2153 -2449 -2534 -2495
Accumulated other comprehensive income -277 -176 -431 -380 -359 -447 -464 -444 -622 -849
TOTAL EQUITY 2432.960 2307 2117 2531 2629 2611 3067 3252 2949 2633
TOTAL EQUITY AND LIABILITIES 4956 4805 4675 4781 5418 5672 6527 6440 6722 6553
Verification 0 0 0 0 0 0 0 0 0 0

136
Mattel – Reformulated Balance
Operating assets - Dec 31 - USD mn 2006 2007 2008 2009 2010 2011 2012 2013 2014 2015
Operating current assets
Inventories 383 429 486 356 464 487 465 569 562 588
Trade receivables 944 991 874 749 1146 1247 1227 1260 1093 1145
Prepaid Expenses and Other 318 272 410 333 336 341 529 510 559 571
+ Operating cash 113 119 118 109 117 125 128 130 120 114
Total operating currents assets 1758 1811 1888 1546 2063 2200 2350 2468 2335 2418
Operating current liabilities
Trade payables 376 441 422 351 406 335 385 375 430 652
Income taxes accrued 162 17 39 40 52 27 33 28 19 19
Accrued liabilities 980 713 649 618 642 619 888 640 640 658
Short term debt 64 50 150 50 250 50 400 0 0 317
Total operating current liabilities 1583 1221 1260 1059 1350 1031 1706 1043 1089 1646
NOWC 175 590 628 487 712 1169 643 1425 1246 773
Operating non-current assets
Property Plant & Equipment 537 519 536 505 485 524 593 659 #### 741
Goodwill 845 846 816 828 824 822 1081 1083 1394 1385
Other non-current assets 724 848 936 893 882 882 1296 1319 1404 1230
+ Capitalized operating leases 766 867 1004 970 933 960 914 996 946 946
Total operating non-current assets 2872 3080 3292 3196 3124 3187 3884 4057 4482 4302
Operating non-current liabilities
Deferred tax liabilities 9 121 133 109 114 104 214 186 171 109
Pension obligations 177 149 287 255 257 278 285 193 230 196
Total operating non-current liabilities 185 270 419 364 371 382 498 379 401 305
NONCA 2686 2810 2873 2832 2754 2805 3386 3678 4081 3997
Invested capital 2861 3400 3500 3320 3466 3974 4029 5104 5327 4770
Financial assets - Dec 31 - USD mn 2006 2007 2008 2009 2010 2011 2012 2013 2014 2015
Financial assets
Remaining cash and cash equivalents (excess cash) 1093 782 499 1008 1164 1244 1207 910 851 779
Total financial assets 1093 782 499 1008 1164 1244 1207 910 851 779
Financial liabilities
Short term borrowings 0 349 0 2 0 8 10 4 0 0
Long term debt 636 550 750 700 950 1500 1100 1600 2100 1800
Other non current financial liabilities 119 109 129 125 118 140 145 162 183 169
+ Capitalized operating leases 766 867 1004 970 933 960 914 996 946 946
Total financial liabilities 1521 1875 1883 1797 2001 2607 2170 2762 3229 2915
NET FINANCIAL ASSETS -428 -1093 -1383 -789 -837 -1364 -962 -1852 -2378 -2137
EQUITY INCL. MINORITIES 2433 2307 2117 2531 2629 2611 3067 3252 2949 2633
Invested capital 2861 3400 3500 3320 3466 3974 4029 5104 5327 4770
Verification diff. Invested Capital 0 0 0 0 0 0 0 0 0 0
Equity adjustments - USD mn 2006 2007 2008 2009 2010 2011 2012 2013 2014 2015
Equity - Jan 01 2102 2433 2307 2117 2531 2629 2611 3067 3252 2949
Equity - Dec 31 2433 2307 2117 2531 2629 2611 3067 3252 2949 2633
Equity changes 331 -126 -190 414 98 -18 456 185 -302 -316
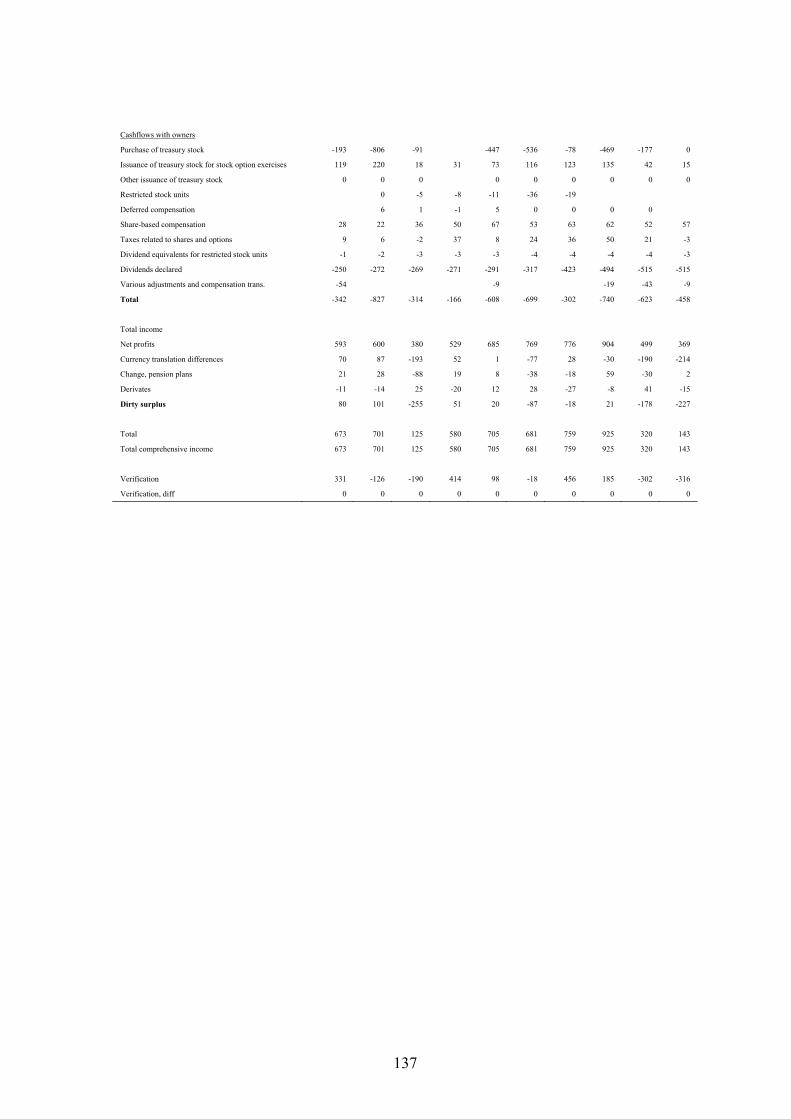
137
Cashflows with owners
Purchase of treasury stock -193 -806 -91 -447 -536 -78 -469 -177 0
Issuance of treasury stock for stock option exercises 119 220 18 31 73 116 123 135 42 15
Other issuance of treasury stock 0 0 0 0 0 0 0 0 0
Restricted stock units 0 -5 -8 -11 -36 -19
Deferred compensation 6 1 -1 5 0 0 0 0
Share-based compensation 28 22 36 50 67 53 63 62 52 57
Taxes related to shares and options 9 6 -2 37 8 24 36 50 21 -3
Dividend equivalents for restricted stock units -1 -2 -3 -3 -3 -4 -4 -4 -4 -3
Dividends declared -250 -272 -269 -271 -291 -317 -423 -494 -515 -515
Various adjustments and compensation trans. -54 -9 -19 -43 -9
Total -342 -827 -314 -166 -608 -699 -302 -740 -623 -458
Total income
Net profits 593 600 380 529 685 769 776 904 499 369
Currency translation differences 70 87 -193 52 1 -77 28 -30 -190 -214
Change, pension plans 21 28 -88 19 8 -38 -18 59 -30 2
Derivates -11 -14 25 -20 12 28 -27 -8 41 -15
Dirty surplus 80 101 -255 51 20 -87 -18 21 -178 -227
Total 673 701 125 580 705 681 759 925 320 143
Total comprehensive income 673 701 125 580 705 681 759 925 320 143
Verification 331 -126 -190 414 98 -18 456 185 -302 -316
Verification, diff 0 0 0 0 0 0 0 0 0 0

138
8.13.1 Income ratios
Income ratios - Dec 31 2006 2007 2008 2009 2010 2011 2012 2013 2014 2015
Gross profit
Lego 63.6% 69.8% 70.1% 72.5% 74.7% 72.9% 73.4% 73.0% 74.4% 75.0%
Hasbro 58.6% 58.9% 57.9% 58.8% 57.8% 57.2% 59.1% 59.0% 60.3% 62.3%
Mattel 46.2% 46.5% 45.4% 50.0% 50.5% 50.2% 53.1% 53.6% 49.8% 49.2%
EBITDA
Lego 16.2% 21.8% 25.9% 29.2% 35.5% 34.3% 37.4% 36.6% 37.9% 37.8%
Hasbro 16.6% 18.0% 16.8% 19.3% 19.3% 18.9% 18.6% 17.5% 20.1% 20.4%
Mattel 15.9% 15.7% 12.7% 17.5% 19.0% 19.9% 19.3% 21.7% 15.8% 14.9%
EBIT
Lego 17.0% 18.7% 22.8% 25.5% 31.7% 30.9% 34.6% 33.6% 34.6% 34.8%
Hasbro 11.9% 13.9% 12.7% 14.9% 15.1% 14.3% 13.9% 11.9% 15.3% 16.0%
Mattel 12.9% 12.8% 9.8% 14.3% 16.2% 17.3% 16.6% 18.7% 11.6% 10.3%
NOPLAT
Lego 17.1% 13.8% 16.9% 19.6% 24.3% 23.3% 26.0% 25.1% 25.8% 26.4%
Hasbro 8.0% 10.1% 9.0% 10.7% 11.9% 11.4% 10.4% 9.7% 11.8% 11.9%
Mattel 11.2% 11.0% 7.8% 11.6% 13.2% 13.9% 13.8% 15.5% 10.0% 8.3%
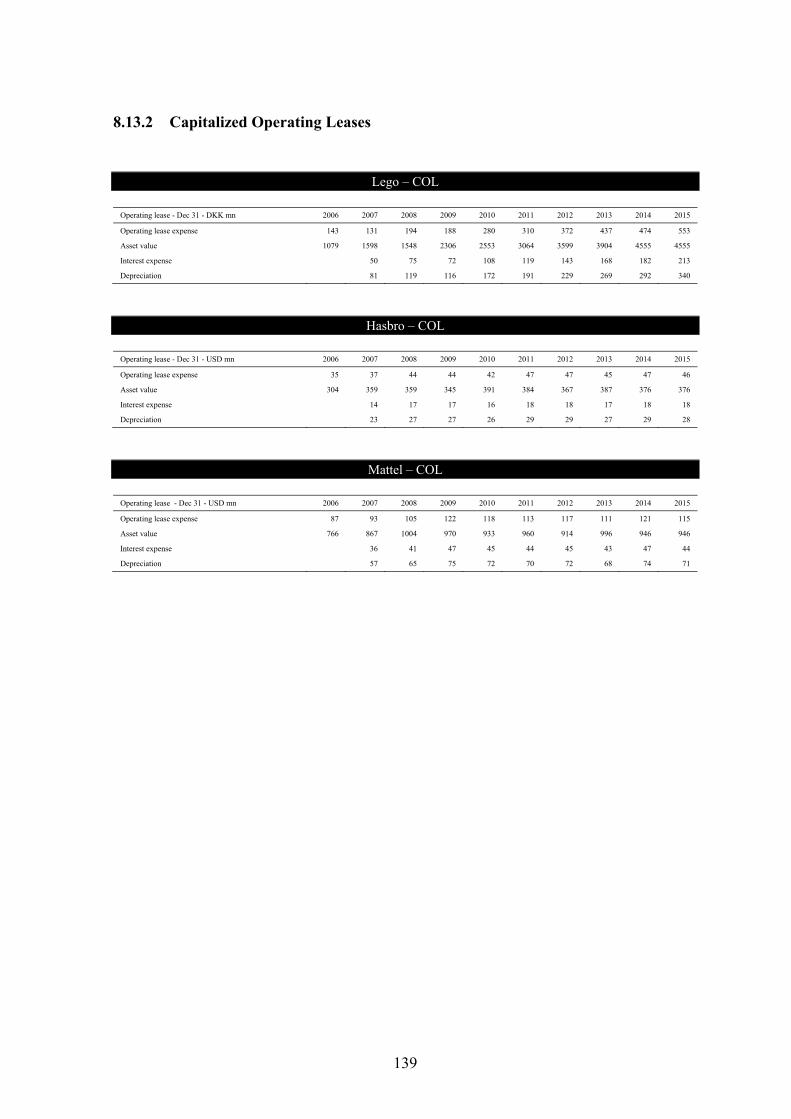
139
8.13.2 Capitalized Operating Leases
Lego – COL
Operating lease - Dec 31 - DKK mn 2006 2007 2008 2009 2010 2011 2012 2013 2014 2015
Operating lease expense 143 131 194 188 280 310 372 437 474 553
Asset value 1079 1598 1548 2306 2553 3064 3599 3904 4555 4555
Interest expense 50 75 72 108 119 143 168 182 213
Depreciation 81 119 116 172 191 229 269 292 340
Hasbro – COL
Operating lease - Dec 31 - USD mn 2006 2007 2008 2009 2010 2011 2012 2013 2014 2015
Operating lease expense 35 37 44 44 42 47 47 45 47 46
Asset value 304 359 359 345 391 384 367 387 376 376
Interest expense 14 17 17 16 18 18 17 18 18
Depreciation 23 27 27 26 29 29 27 29 28
Mattel – COL
Operating lease - Dec 31 - USD mn 2006 2007 2008 2009 2010 2011 2012 2013 2014 2015
Operating lease expense 87 93 105 122 118 113 117 111 121 115
Asset value 766 867 1004 970 933 960 914 996 946 946
Interest expense 36 41 47 45 44 45 43 47 44
Depreciation 57 65 75 72 70 72 68 74 71

140
8.13.3 Du Pont framework breakdown – level 1 & 2
Lego – Du Pont
Du Pont Analysis, level 1 - Dec 31 - DKK mn 2006 2007 2008 2009 2010 2011 2012 2013 2014 2015
IC 4415 4840 4386 6327 8338 10810 12752 14408 17952 20430
IC avg 4628 4613 5357 7333 9574 11781 13580 16180 19191
NOPLAT 1334 1104 1608 2288 3890 4372 6077 6359 7360 9459
ROIC (NOPLAT / IC avg) 24% 35% 43% 53% 46% 52% 47% 45% 49%
Net interest bearing debt (NIBD) 3231 3169 2328 3051 2886 3861 2922 3333 5120 2679
NIBD (avg) 3200 2749 2690 2969 3374 3392 3128 4227 3900
Equity 1184 1671 2058 3276 5452 6949 9830 11075 12832 17751
Equity (avg) 1428 1865 2667 4364 6201 8390 10453 11954 15292
MIN 4 5 9 7 22 23 30 43 0 0
MIN (avg) 5 7 8 15 23 27 37 22 0
Financial leverage, FLEV 223% 147% 101% 68% 54% 40% 30% 35% 26%
Net financial income/expenses (after tax) -44.31 -25.45 -181.05 -11.45 -63.88 -93.08 #### -72.04 -152.48 -72.50
Net financial obligations, NFO 3224 3161 2320 3036 2865 3835 2888 3333 5120 2679
NFO avg 3193 2741 2678 2951 3350 3362 3111 4227 3900
r 1% 7% 0% 2% 3% 10% 2% 4% 2%
SPREAD (ROIC - |r|) 23% 28% 42% 51% 43% 42% 45% 42% 47%
1.00 1.00 1.00 1.00 1.00 1.00 1.00 1.00 1.00
1.00 0.99 0.99 1.00 0.99 0.99 0.99 0.99 1.00
MSR 1.00 1.00 1.00 1.00 1.00 1.00 1.00 0.99 1.00
ROE = (ROIC + (FLEV * SPREAD)) * MSR 75% 35% 43% 53% 46% 51% 47% 45% 49%
Du Pont Analysis, level 2 - Dec 31 - DKK mn 2006 2007 2008 2009 2010 2011 2012 2013 2014 2015
Revenue 7798 8027 9526 11661 16014 18731 23405 25294 28578 35780
Net Operating Profit Margin (NOPM) 17% 14% 17% 20% 24% 23% 26% 25% 26% 26%
IC 4415 4840 4386 6327 8338 10810 12752 14408 17952 20430
IC avg 4628 4613 5357 7333 9574 11781 13580 16180 19191
Asset turnover ratio = Revenue / IC avg 1.73 2.06 2.18 2.18 1.96 1.99 1.86 1.77 1.86
1 / Asset turnover ratio 0.58 0.48 0.46 0.46 0.51 0.50 0.54 0.57 0.54
ROIC = NOPM * Asset turnover ratio 24% 35% 43% 53% 46% 52% 47% 45% 49%
Verification, ROIC 0 0 0 0 0 0 0 0 0
46.1%
23%
24%
-14%
13%
-9% -3%
8%
45.6%
42%
70%
12%
39%
5% 16%
29%
-0.3%16%
37%31%
23%15%
19%
19%
-20.0%
-10.0%
0.0%
10.0%
20.0%
30.0%
40.0%
50.0%
60.0%
70.0%
80.0%
2008 2009 2010 2011 2012 2013 2014 2015
Δ%
gro
wth
ROIC NOPLAT Invested Capital
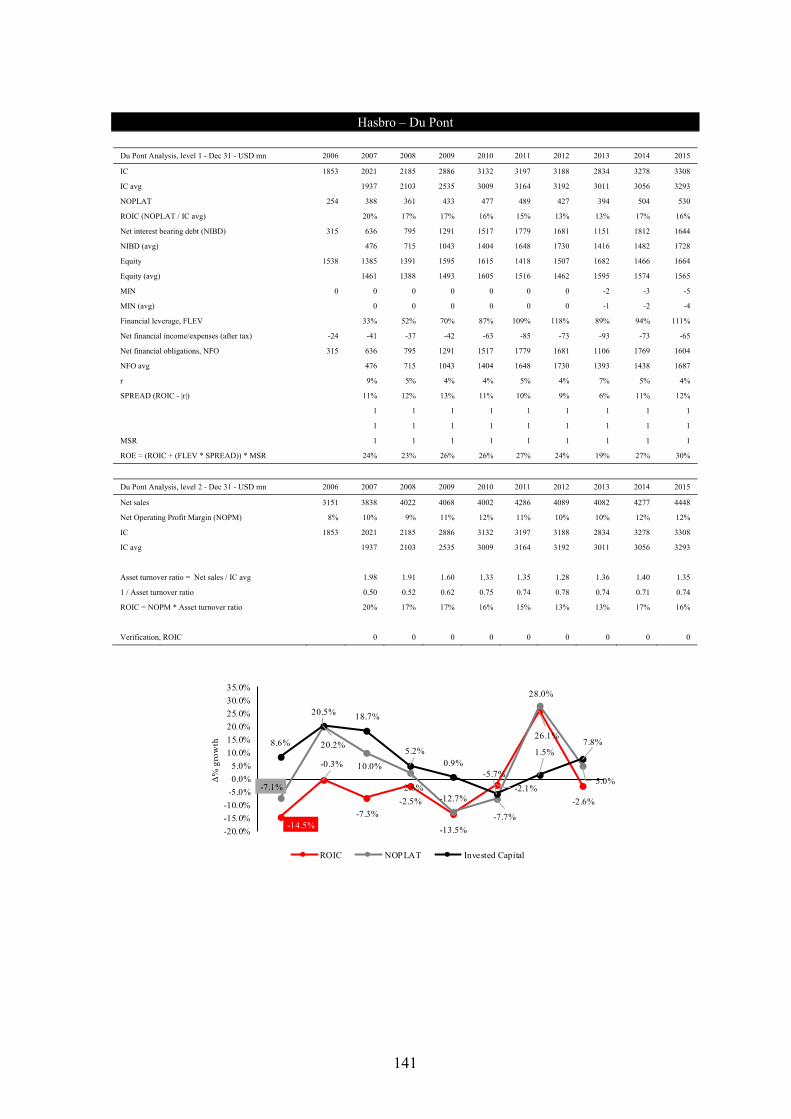
141
Hasbro – Du Pont
Du Pont Analysis, level 1 - Dec 31 - USD mn 2006 2007 2008 2009 2010 2011 2012 2013 2014 2015
IC 1853 2021 2185 2886 3132 3197 3188 2834 3278 3308
IC avg 1937 2103 2535 3009 3164 3192 3011 3056 3293
NOPLAT 254 388 361 433 477 489 427 394 504 530
ROIC (NOPLAT / IC avg) 20% 17% 17% 16% 15% 13% 13% 17% 16%
Net interest bearing debt (NIBD) 315 636 795 1291 1517 1779 1681 1151 1812 1644
NIBD (avg) 476 715 1043 1404 1648 1730 1416 1482 1728
Equity 1538 1385 1391 1595 1615 1418 1507 1682 1466 1664
Equity (avg) 1461 1388 1493 1605 1516 1462 1595 1574 1565
MIN 0 0 0 0 0 0 0 -2 -3 -5
MIN (avg) 0 0 0 0 0 0 -1 -2 -4
Financial leverage, FLEV 33% 52% 70% 87% 109% 118% 89% 94% 111%
Net financial income/expenses (after tax) -24 -41 -37 -42 -63 -85 -73 -93 -73 -65
Net financial obligations, NFO 315 636 795 1291 1517 1779 1681 1106 1769 1604
NFO avg 476 715 1043 1404 1648 1730 1393 1438 1687
r 9% 5% 4% 4% 5% 4% 7% 5% 4%
SPREAD (ROIC - |r|) 11% 12% 13% 11% 10% 9% 6% 11% 12%
1 1 1 1 1 1 1 1 1
1 1 1 1 1 1 1 1 1
MSR 1 1 1 1 1 1 1 1 1
ROE = (ROIC + (FLEV * SPREAD)) * MSR 24% 23% 26% 26% 27% 24% 19% 27% 30%
Du Pont Analysis, level 2 - Dec 31 - USD mn 2006 2007 2008 2009 2010 2011 2012 2013 2014 2015
Net sales 3151 3838 4022 4068 4002 4286 4089 4082 4277 4448
Net Operating Profit Margin (NOPM) 8% 10% 9% 11% 12% 11% 10% 10% 12% 12%
IC 1853 2021 2185 2886 3132 3197 3188 2834 3278 3308
IC avg 1937 2103 2535 3009 3164 3192 3011 3056 3293
Asset turnover ratio = Net sales / IC avg 1.98 1.91 1.60 1.33 1.35 1.28 1.36 1.40 1.35
1 / Asset turnover ratio 0.50 0.52 0.62 0.75 0.74 0.78 0.74 0.71 0.74
ROIC = NOPM * Asset turnover ratio 20% 17% 17% 16% 15% 13% 13% 17% 16%
Verification, ROIC 0 0 0 0 0 0 0 0 0
-14.5%
-0.3%
-7.3%
-2.5%
-13.5%
-2.1%
26.1%
-2.6%
-7.1%
20.2%
10.0%
2.6%-12.7%
-7.7%
28.0%
5.0%
8.6%
20.5% 18.7%
5.2%0.9%
-5.7%
1.5%7.8%
-20.0%
-15.0%
-10.0%
-5.0%
0.0%
5.0%
10.0%
15.0%
20.0%
25.0%
30.0%
35.0%
Δ%
gro
wth
ROIC NOPLAT Invested Capital

142
Mattel – Du Pont
Du Pont Analysis, level 1 - Dec 31 - USD mn 2006 2007 2008 2009 2010 2011 2012 2013 2014 2015
IC 2861 3400 3500 3320 3466 3974 4029 5104 5327 4770
IC avg 3131 3450 3410 3393 3720 4002 4566 5215 5049
NOPLAT 632 659 462 633 775 868 884 1003 602 475
ROIC (NOPLAT / IC) 21% 13% 19% 23% 23% 22% 22% 12% 9%
Net interest bearing debt (NIBD) 428 1093 1383 789 837 1364 962 1852 2378 2137
NIBD (avg) 761 1238 1086 813 1100 1163 1407 2115 2257
Equity 2433 2307 2117 2531 2629 2611 3067 3252 2949 2633
Equity (avg) 2370 2212 2324 2580 2620 2839 3159 3100 2791
Financial leverage, FLEV 32% 56% 47% 32% 42% 41% 45% 68% 81%
Net financial income/expenses (after tax) -39 -23 -42 -57 -45 -56 -62 -57 -57 -61
Net financial obligations, NFO 428 1093 1383 789 837 1364 962 1852 2378 2137
NFO avg 761 1238 1086 813 1100 1163 1407 2115 2257
r 3% 3% 5% 5% 5% 5% 4% 3% 3%
SPREAD (ROIC - |r|) 18% 10% 13% 17% 18% 17% 18% 9% 7%
ROE = (ROIC + (FLEV * SPREAD)) 27% 19% 25% 28% 31% 29% 30% 18% 15%
Du Pont Analysis, level 2 - Dec 31 - USD mn 2006 2007 2008 2009 2010 2011 2012 2013 2014 2015
Net sales 5650 5970 5918 5431 5856 6266 6421 6485 6024 5703
Net Operating Profit Margin (NOPM) 11% 11% 8% 12% 13% 14% 14% 15% 10% 8%
IC 2861 3400 3500 3320 3466 3974 4029 5104 5327 4770
IC avg 3131 3450 3410 3393 3720 4002 4566 5215 5049
Asset turnover ratio = Net sales / IC avg 1.91 1.72 1.59 1.73 1.68 1.60 1.42 1.16 1.13
1 / Asset turnover ratio 0.52 0.58 0.63 0.58 0.59 0.62 0.70 0.87 0.89
ROIC = NOPM * Asset turnover ratio 21% 13% 19% 23% 23% 22% 22% 12% 9%
Verification, ROIC 0 0 0 0 0 0 0 0 0
-36%-43.0%
6.2%
62.9%
-29.4%
92.5%
28.4%
-10.1%
-29.8%
36.9%
22.5%
12.0%
1.8% 13.5%
-40.0%
-21.1%
10.2%
-1.2%
-0.5%9.6% 7.6%
14.1%14.2%
-3.2%
-60%
-40%
-20%
0%
20%
40%
60%
80%
100%
Δ%
gro
wth
ROIC NOPLAT Invested Capital

143
8.13.4 Du Pont Ratios Du Pont ratios - Dec 31 2006 2007 2008 2009 2010 2011 2012 2013 2014 2015
ROE Lego 75% 35% 43% 53% 46% 51% 47% 45% 49% Hasbro 24% 23% 26% 26% 27% 24% 19% 27% 30% Mattel 27% 19% 25% 28% 31% 29% 30% 18% 15%
ROIC Lego 24% 35% 43% 53% 46% 52% 47% 45% 49% Hasbro 20% 17% 17% 16% 15% 13% 13% 17% 16% Mattel 21% 13% 19% 23% 23% 22% 22% 12% 9%
FLEV Lego 223% 147% 101% 68% 54% 40% 30% 35% 26% Hasbro 33% 52% 70% 87% 109% 118% 89% 94% 111% Mattel 32% 56% 47% 32% 42% 41% 45% 68% 81%
SPREAD Lego 23% 28% 42% 51% 43% 42% 45% 42% 47% Hasbro 11% 12% 13% 11% 10% 9% 6% 11% 12% Mattel 18% 10% 13% 17% 18% 17% 18% 9% 7%
NOPM Lego 14% 17% 20% 24% 23% 26% 25% 26% 26% Hasbro 10% 9% 11% 12% 11% 10% 10% 12% 12% Mattel 11% 8% 12% 13% 14% 14% 15% 10% 8%
Asset turnover Lego 1.73 2.06 2.18 2.18 1.96 1.99 1.86 1.77 1.86 Hasbro 1.98 1.91 1.60 1.33 1.35 1.28 1.36 1.40 1.35 Mattel 1.91 1.72 1.59 1.73 1.68 1.60 1.42 1.16 1.13
Inverse Asset turnover Lego 0.58 0.48 0.46 0.46 0.51 0.50 0.54 0.57 0.54 Hasbro 0.50 0.52 0.62 0.75 0.74 0.78 0.74 0.71 0.74 Mattel 0.52 0.58 0.63 0.58 0.59 0.62 0.70 0.87 0.89

144
8.13.5 Invested Capital line items
Lego – Invested Capital, Line Items
Invested Capital breakdown - Dec 31 2006 2007 2008 2009 2010 2011 2012 2013 2014 2015
Invested Capital 4415 4840 4386 6327 8338 10810 12752 14408 17952 20430
NOWC 1851 2016 1546 1923 3000 4156 4393 4539 5001 5443
Property, plant, equipment 1501 1230 1371 2162 2753 3654 4775 6550 8727 10633
Other (taxes + prepayments) 388 281 132 94 180 114 131 286 656 588
Capitalized operating leases 1079 1598 1548 2306 2553 3064 3599 3904 4555 4555
Total operating non-current liabilities -404 -284 -211 -158 -148 -177 -146 -871 -986 -788
Verification 0 0 0 0 0 0 0 0 0 0
Ratios of Invested Capital
NOWC 42% 42% 35% 30% 36% 38% 34% 32% 28% 27%
Property, plant, equipment 34% 25% 31% 34% 33% 34% 37% 45% 49% 52%
Other (taxes + prepayments) 9% 6% 3% 1% 2% 1% 1% 2% 4% 3%
Capitalized operating leases 24% 33% 35% 36% 31% 28% 28% 27% 25% 22%
Operating non-current liab. -9% -6% -5% -2% -2% -2% -1% -6% -5% -4%
42% 42% 35% 30% 36% 38% 34% 32% 28% 27%
34% 25% 31% 34% 33% 34% 37% 45% 49% 52%
24%33% 35% 36% 31% 28% 28%
27% 25% 22%
-20%
0%
20%
40%
60%
80%
100%
120%
2006 2007 2008 2009 2010 2011 2012 2013 2014 2015
Rat
ios
of I
nves
ted
Cap
ital
NOWC Property, plant, equipment Other (taxes + prepayments)
Capitalized operating leases Operating non-current liab.

145
Hasbro – Invested Capital, Line Items
Invested Capital breakdown - Dec 31 2006 2007 2008 2009 2010 2011 2012 2013 2014 2015
Invested Capital 1853 2021 2185 2886 3132 3197 3188 2834 3278 3308
NOWC 171 313 372 689 869 936 1004 525 1089 1078
Property, plant, equipment 182 188 212 221 234 218 230 236 237 238
Other, intangibles 727 690 769 1155 1164 1184 1112 1091 982 1025
Capitalized operating leases 304 359 359 345 391 384 367 387 376 376
Total operating non-current liabilities 0 0 0 0 0 0 0 0 0 0
Goodwill 470 471 474 476 475 475 475 594 593 593
Verification 0 0 0 0 0 0 0 0 0 0
Ratios of Invested Capital - breakdown
NOWC 9% 15% 17% 24% 28% 29% 31% 19% 33% 33%
Property, plant, equipment 10% 9% 10% 8% 7% 7% 7% 8% 7% 7%
Other, intangibles 39% 34% 35% 40% 37% 37% 35% 39% 30% 31%
Capitalized operating leases 16% 18% 16% 12% 12% 12% 11% 14% 11% 11%
Total operating non-current liabilities 0% 0% 0% 0% 0% 0% 0% 0% 0% 0%
Goodwill 25% 23% 22% 16% 15% 15% 15% 21% 18% 18%
9% 15% 17% 24% 28% 29% 31%19%
33% 33%10%9% 10%
8% 7% 7% 7%8%
7% 7%39% 34% 35%40% 37% 37% 35%
39%30% 31%
16% 18% 16%12% 12% 12% 11%
14% 11% 11%25% 23% 22% 16% 15% 15% 15% 21% 18% 18%
0%
20%
40%
60%
80%
100%
120%
2006 2007 2008 2009 2010 2011 2012 2013 2014 2015
Rat
ios
of I
nves
ted
Cap
ital
-br
eakd
own
NOWC Property, plant, equipment
Other, intangibles Capitalized operating leases
Total operating non-current liabilities Goodwill
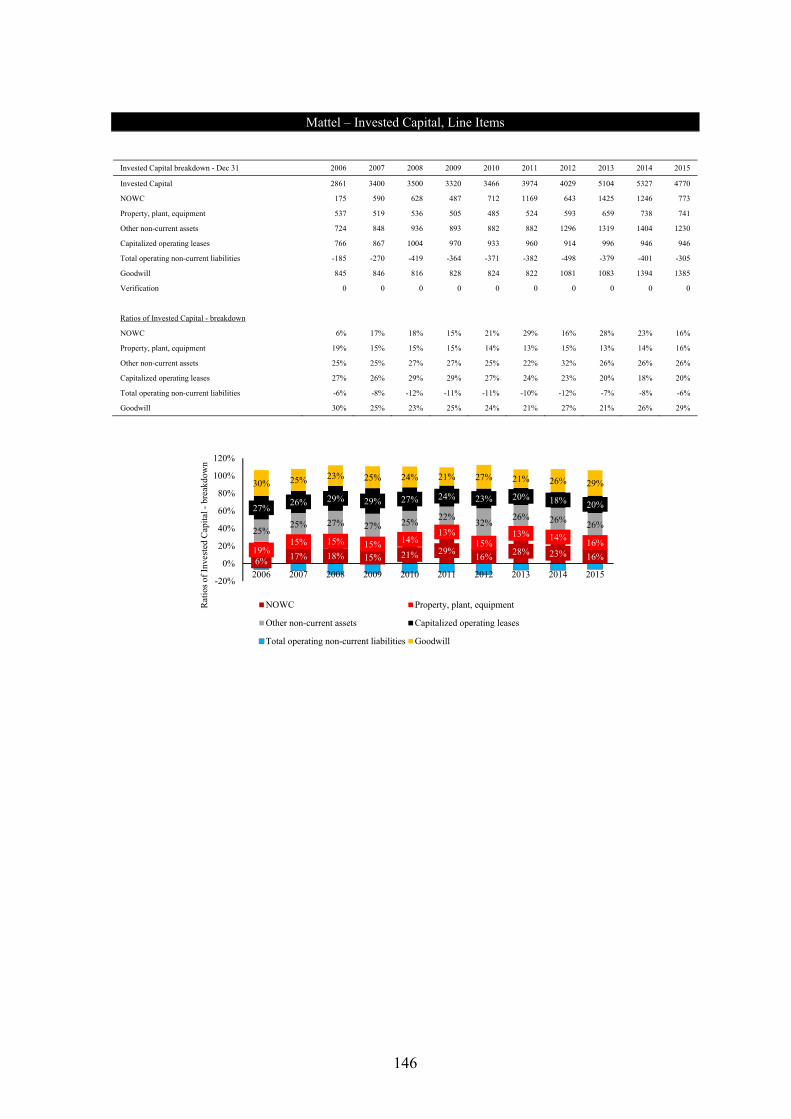
146
Mattel – Invested Capital, Line Items
Invested Capital breakdown - Dec 31 2006 2007 2008 2009 2010 2011 2012 2013 2014 2015
Invested Capital 2861 3400 3500 3320 3466 3974 4029 5104 5327 4770
NOWC 175 590 628 487 712 1169 643 1425 1246 773
Property, plant, equipment 537 519 536 505 485 524 593 659 738 741
Other non-current assets 724 848 936 893 882 882 1296 1319 1404 1230
Capitalized operating leases 766 867 1004 970 933 960 914 996 946 946
Total operating non-current liabilities -185 -270 -419 -364 -371 -382 -498 -379 -401 -305
Goodwill 845 846 816 828 824 822 1081 1083 1394 1385
Verification 0 0 0 0 0 0 0 0 0 0
Ratios of Invested Capital - breakdown
NOWC 6% 17% 18% 15% 21% 29% 16% 28% 23% 16%
Property, plant, equipment 19% 15% 15% 15% 14% 13% 15% 13% 14% 16%
Other non-current assets 25% 25% 27% 27% 25% 22% 32% 26% 26% 26%
Capitalized operating leases 27% 26% 29% 29% 27% 24% 23% 20% 18% 20%
Total operating non-current liabilities -6% -8% -12% -11% -11% -10% -12% -7% -8% -6%
Goodwill 30% 25% 23% 25% 24% 21% 27% 21% 26% 29%
6% 17% 18% 15% 21% 29%16%
28% 23% 16%19%
15% 15% 15% 14%13%
15%13% 14%
16%25%
25% 27% 27% 25%22%
32%26% 26% 26%
27%26% 29% 29% 27% 24% 23% 20% 18% 20%
30% 25% 23% 25% 24% 21% 27% 21% 26% 29%
-20%
0%
20%
40%
60%
80%
100%
120%
2006 2007 2008 2009 2010 2011 2012 2013 2014 2015
Rat
ios
of I
nves
ted
Cap
ital
-br
eakd
own
NOWC Property, plant, equipment
Other non-current assets Capitalized operating leases
Total operating non-current liabilities Goodwill
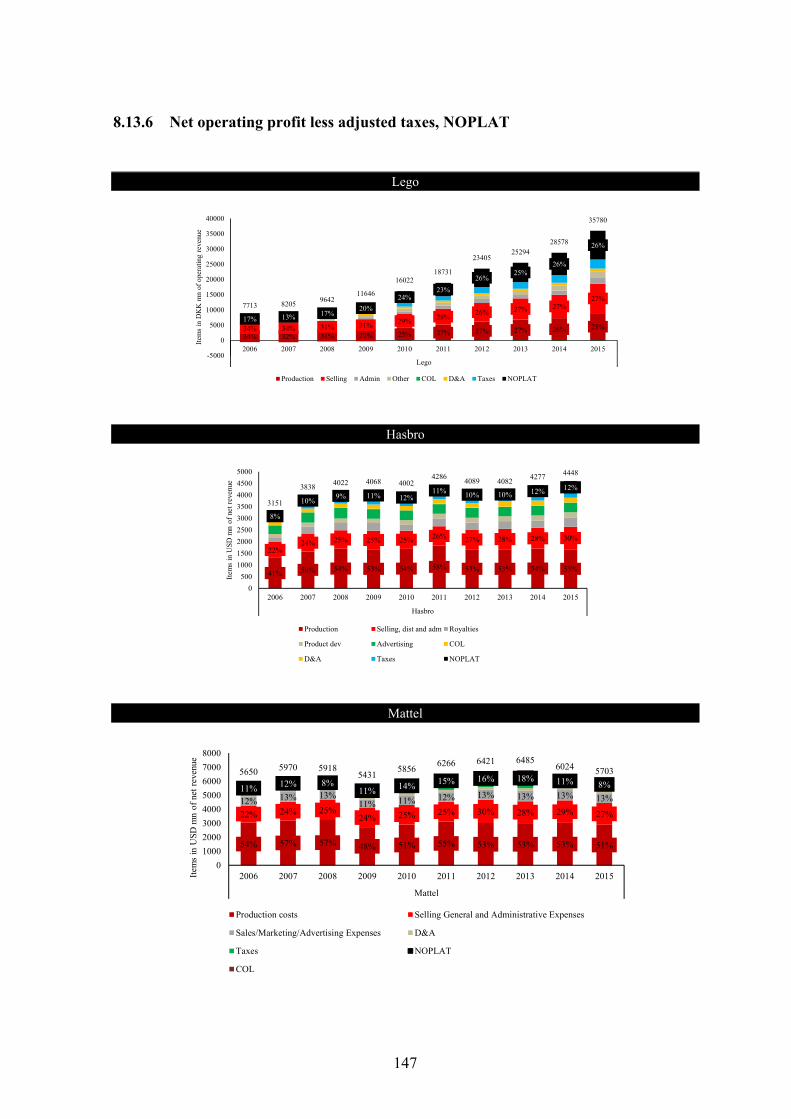
147
8.13.6 Net operating profit less adjusted taxes, NOPLAT
Lego
Hasbro
Mattel
34% 32% 31% 27% 25% 27% 27% 27% 26% 25%34% 34% 31% 31%29%
28%26% 27% 27%
27%
17% 13% 17%20%
24%23%
26%25%
26%
26%
7713 82059642
11646
1602218731
2340525294
28578
35780
-5000
0
5000
10000
15000
20000
25000
30000
35000
40000
2006 2007 2008 2009 2010 2011 2012 2013 2014 2015
Lego
Item
s in
DK
K m
n of
ope
ratin
g re
venu
e
Production Selling Admin Other COL D&A Taxes NOPLAT
41% 50% 54% 53% 54% 58% 53% 53% 54% 53%
22%24% 25% 25% 25% 26% 27% 28% 28% 30%
8%
10%9% 11% 12%
11% 10% 10% 12% 12%
3151
38384022 4068 4002
42864089 4082
4277 4448
0
500
1000
1500
2000
2500
3000
3500
4000
4500
5000
2006 2007 2008 2009 2010 2011 2012 2013 2014 2015
Hasbro
Item
s in
USD
mn
of n
et r
even
ue
Production Selling, dist and adm Royalties
Product dev Advertising COL
D&A Taxes NOPLAT
54% 57% 57% 48% 51% 55% 53% 53% 53% 51%
22% 24% 25%24% 25% 25% 30% 28% 29% 27%
12% 13% 13%11% 11% 12% 13% 13% 13% 13%
11% 12% 8%11% 14% 15% 16% 18% 11% 8%
5650 5970 59185431
58566266 6421 6485
6024 5703
0
1000
2000
3000
4000
5000
6000
7000
8000
2006 2007 2008 2009 2010 2011 2012 2013 2014 2015
Mattel
Item
s in
USD
mn
of n
et r
even
ue
Production costs Selling General and Administrative Expenses
Sales/Marketing/Advertising Expenses D&A
Taxes NOPLAT
COL

148
8.14 Normal Distribution of the 10-year Danish Government Bond
0
2
4
6
8
10
12
14
16
0 0.02 0.04 0.06 0.08 0.1 0.12
Mean 0.0553 Standard Error 0.0016 Median 0.0497 Mode 0.0432 Standard Deviation 0.0296 Sample Variance 0.0009 Kurtosis -0.8615 Skewness 0.2863 Range 0.1198 Minimum 0.12% Maximum 12.10% Count 348
Figure 8-5 – Normal distribution 10-year Danish government bond
The period covered is 1987/1/1 - 2015/12/1
8.15 Calculation of WACC
WACC Lego Hasbro Mattel
rf 2.623% 2.623% 2.623%
Corporate default spread, rc 0.750% 1.000% 1.000%
rm 5.270% 5.270% 5.270%
Lego beta 0.8849 0.7451 0.8099
Tax, Tc (effective) 24.48% 26.00% 20.37%
1-Tax 75.52% 74.00% 79.63%
Cost of debt, Rd 3.37% 3.62% 3.62%
E[rm] = Cost of equity (capm) 4.9653% 4.60% 4.77%
Cost of lease, RL 4.67% 4.67% 4.67%
D 2679 1269 1190
E 17751 3107 9231
L 4555 376 946
Vadj 24985 4751 11368
D/Vadj 11% 27% 10%
E/Vadj 71% 65% 81%
L/Vadj 18% 8% 8%
D/E 15.09% 40.84% 12.90%
Parameter Lego Hasbro Mattel
WACCadj 4.4439% 3.9939% 4.4825%
ROIC 49.29% 16.08% 9.41%
ROIC-WACCadj spread 44.85% 12.09% 4.93%
∗ ∗ 1 ∗ ∗ ∗ 1
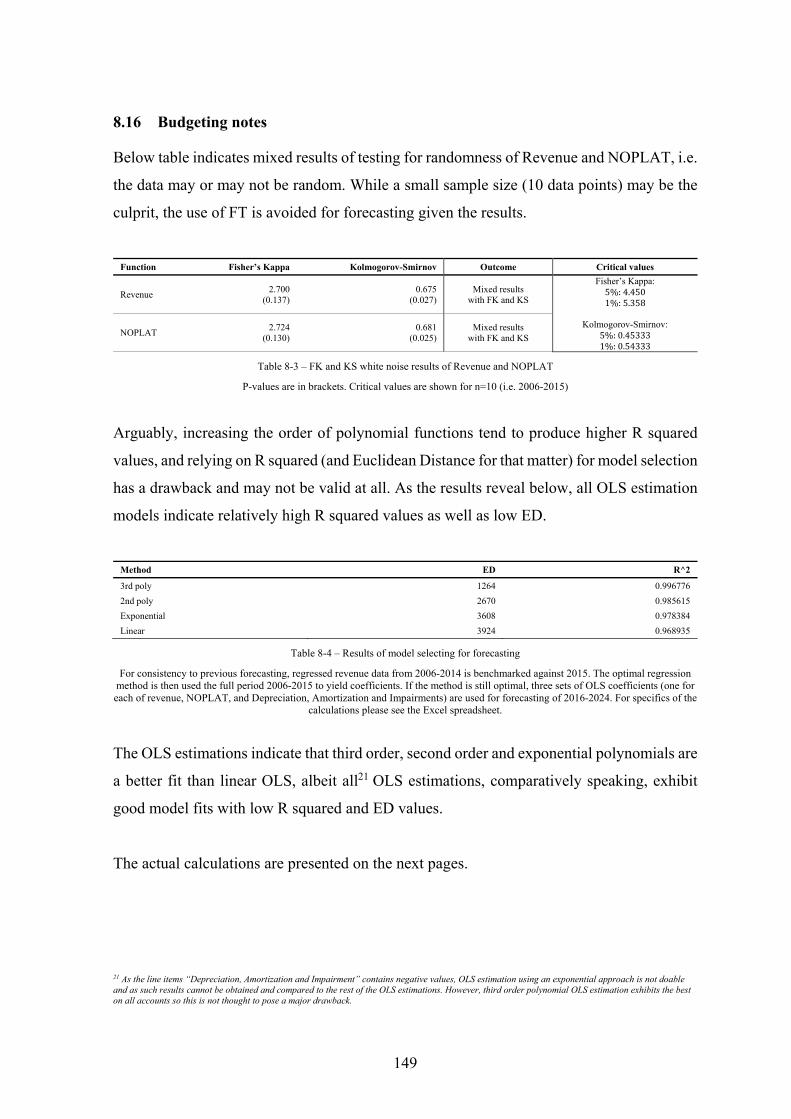
149
8.16 Budgeting notes
Below table indicates mixed results of testing for randomness of Revenue and NOPLAT, i.e.
the data may or may not be random. While a small sample size (10 data points) may be the
culprit, the use of FT is avoided for forecasting given the results.
Function Fisher’s Kappa Kolmogorov-Smirnov Outcome Critical values
Revenue 2.700
(0.137) 0.675
(0.027) Mixed results
with FK and KS
Fisher’s Kappa: 5%:4.450 1%:5.358
Kolmogorov-Smirnov:
5%:0.45333 1%:0.54333
NOPLAT 2.724
(0.130) 0.681
(0.025) Mixed results
with FK and KS
Table 8-3 – FK and KS white noise results of Revenue and NOPLAT
P-values are in brackets. Critical values are shown for n=10 (i.e. 2006-2015)
Arguably, increasing the order of polynomial functions tend to produce higher R squared
values, and relying on R squared (and Euclidean Distance for that matter) for model selection
has a drawback and may not be valid at all. As the results reveal below, all OLS estimation
models indicate relatively high R squared values as well as low ED.
Method ED R^2
3rd poly 1264 0.996776
2nd poly 2670 0.985615
Exponential 3608 0.978384
Linear 3924 0.968935
Table 8-4 – Results of model selecting for forecasting
For consistency to previous forecasting, regressed revenue data from 2006-2014 is benchmarked against 2015. The optimal regression method is then used the full period 2006-2015 to yield coefficients. If the method is still optimal, three sets of OLS coefficients (one for each of revenue, NOPLAT, and Depreciation, Amortization and Impairments) are used for forecasting of 2016-2024. For specifics of the
calculations please see the Excel spreadsheet.
The OLS estimations indicate that third order, second order and exponential polynomials are
a better fit than linear OLS, albeit all21 OLS estimations, comparatively speaking, exhibit
good model fits with low R squared and ED values.
The actual calculations are presented on the next pages.
21 As the line items “Depreciation, Amortization and Impairment” contains negative values, OLS estimation using an exponential approach is not doable and as such results cannot be obtained and compared to the rest of the OLS estimations. However, third order polynomial OLS estimation exhibits the best on all accounts so this is not thought to pose a major drawback.

150
x y y_noplat y_D&A,I
2006 7798 1334 62
2007 8027 1104 -253
2008 9526 1608 -290
2009 11661 2288 -429
2010 16014 3890 -606
2011 18731 4372 -637
2012 23405 6077 -654
2013 25294 6359 -764
2014 28578 7360 -947
2015 35780 9459 -1081
Table 8-5 – Budgeting: Input data for model building
The input data is used to estimate coefficients for OLS and results are shown in the next table.
2006-2014 2006-2015 Revenue Revenue NOPLAT D&A,I 3rd poly y = (c3 * x^3) + (c2 * x^2) + (c1 *x) + b c3 -62.29 -11.85 -6.97 -2.79 c2 375800 71701 42116 16819 c1 -755684446 -144575254 -84792248 -33820756 b 506524453749 97169309586 56903080311 22669520051 ED 1264 6311 r2 0.9968 0.9899 0.9823 0.9844 3rd poly forecasting is selected because 2006-2014 shows lowest ED & highest r2 2nd poly y = (c2 * x^2) + (c1 *x) + b c2 163.83 210.91 59.01 2.88 c1 -655785 -844959 -236372 -11701 b 656236298 846290000 236687828 11873125 ED 2670 3379 r2 0.9856 0.9894 0.9803 0.9615 Linear y = c * x + b c 2829.15 3105.96 924.39 -110.43 b -5670032 -6226058 -1854099 221460 ED 3924 6415 r2 0.9689 0.9611 0.9554 0.9573 Exponential y = c *e ^(b * x) c 2.767E-155 7.665E-154 2.9409E-213 - b 1.818E-01 1.802E-01 0.247461691 - ED 3608 3772 r2 0.9784 0.9837 0.9516 -
Table 8-6 – Budgeting: estimated model coefficients
The table shows estimated model coefficients for various regression models (1-3 order polynomials) and exponetial regression as well. 2006-2014 is benchmarked on 2015 data. For consistency, the full period 2006-2015 was benchmarked again with all OLS models to see
if ED and R squared still shows good results. Coefficients are determined with Excel’s LINEST function, e.g. =INDEX(MMULT(LINEST(y;(x-AVERAGE(x))^{1,2,3});IFERROR(COMBIN({3;2;1;0};{3,2,1,0})*(-AVERAGE(x))^({3;2;1;0}-
{3,2,1,0});0));1) to determine c3 coefficient for ‘3rd poly’. The results are shown in the next table.
Forecasting robustess - Dec 31 - DKK mn 2006 2007 2008 2009 2010 2011 2012 2013 2014 2015 Revenue 7798 8027 9526 11661 16014 18731 23405 25294 28578 35780 3rd poly Revenue 7818 7931 9492 12129 15467 19133 22753 25952 28359 29597 Error 20 -96 -34 468 -547 402 -652 658 -219 -6183 Squared Error 416 9237 1133 219030 299095 161500 425707 433410 48178 38226149 Euclidean Distance (ED) 20 98 104 479 727 831 1056 1245 1264 6311 2nd poly Revenue 6772 8454 10464 12802 15467 18460 21781 25429 29405 33709 Error -1026 427 938 1141 -547 -271 -1624 135 827 -2071 Squared Error 1052974 182469 880110 1301398 299095 73393 2638215 18242 684019 4290225 Euclidean Distance (ED) 1026 1112 1454 1848 1928 1947 2535 2539 2670 3379 Linear Revenue 5243 8072 10901 13730 16559 19388 22218 25047 27876 30705 Error -2555 45 1375 2069 545 657 -1187 -247 -702 -5075 Squared Error 6529388 2015 1890717 4281520 297388 432284 1409840 61116 492898 25754779 Euclidean Distance (ED) 2555 2556 2902 3564 3606 3665 3853 3861 3924 6415 Exponential Revenue 7179 8611 10328 12388 14858 17821 21375 25637 30749 36881 Error -619 584 802 727 -1156 -910 -2030 343 2171 1101 Squared Error 382931 340864 643175 527882 1336701 828562 4122919 117607 4714872 1212903 Euclidean Distance (ED) 619 851 1169 1377 1798 2015 2861 2881 3608 3772
Table 8-7 – Budgeting: applied coefficients
The table shows the results of applying previously described coefficients. Euclidean Distance was calculated using
√∑

151
8.17 Budget
Forecasting of FCF Historical Budget Termin
al FCF - Dec 31 - DKK mn 2006 2007 2008 2009 2010 2011 2012 2013 2014 2015 2016 2017 2018 2019 2020 2021 2022 2023 2024 2025 Revenue 7798 8027 9526 11661 16014 18731 23405 25294 28578 35780 39187 43715 48202 52577 56770 60709 64323 67541 70292 71938 growth g 2.9% 15.7% 18.3% 27.2% 14.5% 20.0% 7.5% 11.5% 20.1% 8.7% 10.4% 9.3% 8.3% 7.4% 6.5% 5.6% 4.8% 3.9% 2.34% Δ growth 229 1499 2135 4353 2717 4674 1889 3284 7202 3407 4527 4487 4375 4193 3939 3614 3218 2751 1646 NOPLAT 1334 1104 1608 2288 3890 4372 6077 6359 7360 9459 10169 11149 11975 12605 12998 13111 12903 12332 11356 9933 Depreciation, amort and impairment
62 -253 -290 -429 -606 -637 -654 -764 -947 -1081 -1343 -1680 -2120 -2679 -3375 -4224 -5243 -6449 -7857 -8041
Gross cash flow 1272 1357 1898 2717 4496 5009 6731 7123 8307 10540 11512 12829 14095 15284 16373 17335 18146 18781 19213 17974 Δ Invested capital 425 -454 1941 2011 2472 1942 1656 3544 2478 3357 3745 4130 4504 4864 5201 5511 5786 6022 6163 Free cash flow 931 2352 775 2484 2537 4789 5468 4762 8062 8155 9084 9965 10780 11509 12134 12635 12994 13191 11811 FCF - Dec 31 2006 2007 2008 2009 2010 2011 2012 2013 2014 2015 2016 2017 2018 2019 2020 2021 2022 2023 2024 2025
% of revenue: Historical
avg.
NOPLAT 22.35% 17.11
% 13.75
% 16.88
% 19.62
% 24.29
% 23.34
% 25.96
% 25.14
% 25.75
% 26.44
% 25.95
% 25.50
% 24.84
% 23.97
% 22.90
% 21.60
% 20.06
% 18.26
% 16.16
% 13.81%
Depreciation, amort and impairment
-3.25% 0.80% -
3.15% -
3.04% -
3.68% -
3.78% -
3.40% -
2.79% -
3.02% -
3.31% -
3.02% -
3.43% -
3.84% -
4.40% -
5.10% -
5.95% -
6.96% -
8.15% -
9.55%
-11.18
%
-11.18%
Gross cash flow 25.60% 16.32
% 16.90
% 19.92
% 23.30
% 28.07
% 26.74
% 28.76
% 28.16
% 29.07
% 29.46
% 29.38
% 29.35
% 29.24
% 29.07
% 28.84
% 28.55
% 28.21
% 27.81
% 27.33
% 24.99%
Δ Invested capital 8.57% 5.30% -
4.77% 16.65
% 12.56
% 13.20
% 8.30% 6.55%
12.40%
6.93% 8.57% 8.57% 8.57% 8.57% 8.57% 8.57% 8.57% 8.57% 8.57% 8.57%
Free cash flow 17.03% 11.60
% 24.69
% 6.65%
15.51%
13.55%
20.46%
21.62%
16.66%
22.53%
20.81%
20.78%
20.67%
20.50%
20.27%
19.99%
19.64%
19.24%
18.77%
16.42%
Table 8-8 – Budgeting: using third order polynomials
Third order polynomials was applied to Revenue, NOPLAT, D, A and Imp., in the budget period. A sum of these values yield the ‘gross cash
flow’. Deducted with ‘Δ invested capital’ from the balance, the ‘Free cash flow’ is derived.
0
10000
20000
30000
40000
50000
60000
70000
80000
2006
2007
2008
2009
2010
2011
2012
2013
2014
2015
2016
2017
2018
2019
2020
2021
2022
2023
2024
2025
DK
K m
n
NOPLAT Revenue Free cash flow

152
8.18 Sensitivity analysis
WACC | g 1% 2% 2.34% 3% 4% 358 497 582 912
4.4438% 312 407 460 633 5% 268 332 364 459 6% 214 249 265 307 7% 178 199 209 231 8% 152 166 172 186 9% 133 143 146 155
10% 118 125 127 133 11% 105 111 113 117 12% 96 99 101 104
13.54% 84 86 87 89
Table 8-9 – Sensitivity analysis – two dimensions, numbers
Enterprise value
Mean 178379 Standard Error 1250 Median 147667 Standard Deviation 88369 Sample Variance 7809135958 Kurtosis 0.8793 Skewness 1.2709 Range 372087 Minimum 87037 Maximum 459125 Sum 891894294 Count 5000 Confidence Level(95.0%) 2450
Figure 8-6 – Normal distribution plot EV
The plot is generated based on 5000 samples in a Monte Carlo simulation. Lower/Upper: 4.4439%-13.54%. A kurtosis of 0.8793 (calculated in the appendix) indicates fewer extreme outliers compared to a standard normal distribution
Figure 8-7 – Sensitivity analysis – one dimension
WACC is variable, growth rate is constant 2.34%
178
90 178 266 354 442
Enterprise value, DKK bn
0.00%
2.00%
4.00%
6.00%
8.00%
10.00%
12.00%
14.00%
16.00%
0 50 100 150 200 250 300 350 400 450 500
WA
CC
Enterprise value, DKK bn
Related Documents