THE SOCIAL IMPACT OF OPEN DATA Júlia Keserű - James Kin-sing Chan

Welcome message from author
This document is posted to help you gain knowledge. Please leave a comment to let me know what you think about it! Share it to your friends and learn new things together.
Transcript

THE SOCIAL IMPACT OF OPEN DATA
Júlia Keserű - James Kin-sing Chan

1
Abstract ................................................................................................................................................... 2
Introduction and overview ............................................................................................................... 3 Definitions ................................................................................................................................ 5 The repository .......................................................................................................................... 5 Outcome Mapping .................................................................................................................... 6
Evidence Base for Open Data Impact ............................................................................................. 8 Open Data vs. Non-open Data Initiatives ................................................................................ 9 Project Areas ............................................................................................................................ 9 Categories of Outcome ........................................................................................................... 11
Mapping social change in three countries ................................................................................. 13 Chile – Vota Inteligente .......................................................................................................... 14 Kenya - Open Duka ................................................................................................................ 20 Uruguay - A Tu Servicio ......................................................................................................... 26
Conclusions .......................................................................................................................................... 30 Next steps ................................................................................................................................ 31
Bibliography ........................................................................................................................................ 32
ANNEX I: Outcome Mapping workshop questions .................................................................. 34
ANNEX II: Indicators of change ...................................................................................................... 35
2
Abstract The impact of open data and technology-enabled transparency does not lie solely in the economic sphere. Government openness produces tremendous other benefits for our societies through increasing state or institutional responsiveness, reducing levels of corruption, building new democratic spaces for citizens, empowering local and disadvantaged voices or enhancing service delivery and effective service utilization. However, proof on the social and political impact of open data initiatives is incredibly scarce. This paper intends to tackle some of the methodological challenges through building evidence base that can empower further generalizations in the open government field; as well as developing a methodological framework to unpack theories of change and to evaluate the social impact of open data and digital transparency initiatives. Assessing impact means we should be able to prove if there has been some kind of change in the ecosystem. Whether that change is “good” or “bad” will always depend on a normative position, while attribution is incredibly challenging – let alone impossible – for most open government projects. Therefore, the authors of this paper believe that focusing on mid-term outcomes as opposed to long-term impact or short-term output might be the right next step for the open data community in order to create a solid base for evaluation. The Outcome Mapping approach – as well as other robust evaluation methods – has a strong potential for the long-term evaluation of complex projects through detecting and documenting the desired change model in the behaviors, relationships and activities of people and organizations an open data initiative interacts with. Keywords: Open Data, Open Government, Government Transparency, Social Impact, Political Impact, Social Change, Theory of Change, Global South, Outcome Mapping. ------------------------------------------------------------------------------------------------------------------
3
Introduction and overview Analyzing the economic benefit of open data is one good way to describe the impact of government openness, and provides a great rationale for the release of relevant datasets. However, the impact of open data and technology-enabled transparency does not lie solely in the economic sphere. Government openness produces tremendous other benefits for our societies through increasing state or institutional responsiveness, reducing levels of corruption, building new democratic spaces for citizens, empowering local and disadvantaged voices or enhancing service delivery and effective service utilization. How effective open data and government transparency actually are at producing these social benefits is not yet at all evident, though. According to a comprehensive synthesis report prepared by the Institute of Development Studies, much of the existing literature seeking to measure the impact and effectiveness of transparency and open data accountability initiatives face a common challenge: It is incredibly difficult to come up with definitive, evidence-based generalizations on how "x" type of initiatives produce "y" kinds of effects. The field has yet to coalesce around a theory of change, for one, and there are significant methodological challenges around comparability and unevenness of evidence1. Other, more recent academic literature also suggests that evidence on the social and political impact of open data initiatives is incredibly scarce. The second edition of the Open Data Barometer (2015), a global assessment of open data initiatives points out that most evidence remains anecdotal and describes output rather than outcomes and impact2, while in-country analyses also underscore the absence of impact stories3. Open data experts tend to agree that the lack of compelling evidence is partly due to the relative novelty of the field, but also to the inherent difficulties in measuring good governance and social change4. We know that much of the impact of policy advocacy, for instance, occurs even before a new law or policy is introduced and, is thus, incredibly difficult to evaluate. At the same time, it is also very hard to detect the causality between a direct change in the legal environment and the specific activities of a policy advocacy group5. Attribution is equally challenging when it comes to assessing behavioral changes – who gets to take credit for increased political engagement and greater participation in democratic processes? Furthermore, many open data and digital transparency projects tend to operate in an environment where the contribution of other stakeholders and initiatives is essential to achieving sustainable change, making it even more difficult to show the causality between a project’s activities and the impact it thrives to achieve. Other, more established fields have long been struggling with the same dilemma and have yet been unable to come up with a perfect methodology to provide evidence on social impact. However, many of the existing efforts to build stronger narratives around theories of change and to better document impact could easily be applied to the digital transparency and accountability field.6 With support from the Open Data for Development Research Fund of the Open Government Partnership Open Data Working Group7, the Sunlight Foundation has been working to tackle some of the aforementioned methodological
1 McGee, R. & Gaventa J. (2010). Synthesis Report on Review of Impact and Effectiveness of Transparency and Accountability Initiatives. Institute of Development Studies. Retrieved from https://www.ids.ac.uk/files/dmfile/IETASynthesisReportMcGeeGaventaFinal28Oct2010.pdf. 2 World Wide Web Foundation. (2015). Open Data Barometer Global Report: Second Edition. Retrieved from http://www.opendatabarometer.org/assets/downloads/Open%20Data%20Barometer%20-%20Global%20Report%20-%202nd%20Edition%20-%20PRINT.pdf. 3 Zuiderwijk, A. & Janssen, M. (2013). Open data policies, their implementation and impact: A framework for comparison. Government Information Quarterly. 31(1), p.17-29. Retrieved from http://www.sciencedirect.com/science/article/pii/S0740624X13001202 4 Special thanks to Becky Hogge, Savita Bailur and Jose M. Alonso (Web Foundation), Mor Rubinstein and Jonathan Gray (Open Knowledge); Laura Bacon (Omidyar Network); Fiona Smith (Open Data Institute), David McNair (ONE); Dustin Homerm, Joshua Powell and Samantha Custer (AidData) to their valuable input. 5 Coe, J. & Majot, J. (2013). Monitoring, Evaluating and Learning in NGO Advocacy: Findings from Comparative Policy Advocacy MEL Review Project. Overseas Development Institute & Oxfam. Retrieved from http://www.oxfamamerica.org/static/media/files/mel-in-ngo-advocacy-full-report.pdf. 6 Chambers, L. (2015). Utopian and Dystopian Theories of Change - A Template. Tech to Human. Retrieved from http://techtohuman.com/theory_of_change/. 7 See OGP’s website (http://www.opengovpartnership.org/groups/opendata/resources/od4d-cfp-2014) for more information of the research grant.
4
challenges through building a strong evidence base that can empower further generalizations in the open government field. Sunlight has also sought to create better understanding through unpacking theories of change and applying a methodological framework to evaluate the social impact of open data and digital transparency initiatives. The outputs of our research include:
1. A searchable repository of more than 100 examples on the outputs, outcomes and impacts of open data and digital technology projects;
2. Three distinctive theories of change for open data and digital transparency initiatives from the Global South; 3. A methodological framework to help develop more robust indicators of social and political change for the
ecosystem of open data initiatives, by applying and revising the approach of Outcome Mapping to the field. Not surprisingly, the submitted case stories to our repository approached ‘impact’ in various different ways, ranging from mere output (such as publishing X amount of raw data), through mid-term outcomes (through for instance increasing participation in a democratic process), to long-lasting impact (such as increasing social equity). In some cases, the descriptions focused on short-term outputs only, even when the project does seem to achieve long-lasting change, while other cases claimed impact without credible proof on attribution. Our aim with the repository has been to boost the conversation around impact assessment in the open government field, as well as to provide a base for advocacy purposes, and maybe further research. The authors of this paper believe that focusing on mid-term outcomes as opposed to long-term impact or short-term output might be the right next step for the open data community, in order to create a solid base for evaluation. We also think that further work is needed to develop clear change models for most of the submitted case stories. Furthermore, more research is needed to refine the assessment frameworks designed for the investigated open data projects. After the launch of this paper, Sunlight’s international policy team intends to conduct another round of group interviews with the three teams from the Global South to make some adjustments to the social change indicators developed for their projects, to identify organizational metrics and to define the data collection methods for documenting the boundary partner’s achievements to the desired outcome, as well as the organization’s progress toward the vision. ------------------------------------------------------------------------------------------------------------------
5
Methodology To address our research question, we used a mixed method approach tailored to the field, including tools such as crowdsourcing, content analysis, qualitative stakeholder interviews and outcome mapping workshops.
Definitions Since many of the cases we were dealing with – especially from the Global South, where open data infrastructures are less established – did not satisfy the requirements of existing definitions and principles created by open government experts8, we decided to define open data initiatives for our research as projects using data that can be “freely used, reused and redistributed by anyone”. Other relevant definitions for our research include:
• Output: defined as the final product, or goods and services a project produces or delivers. Typical examples in the open government include a new tool or info-graphics based on government datasets, the number of unique visitors to a website, etc.
• Outcome: defined as the medium-term results for specific beneficiaries that are the consequence of achieving specific outputs, for instance: improved data-mining skills, more informed citizenry, changes in policies related to government transparency, etc.
• Impact: defined as the long-term change in a society, such as reduced poverty or increased equity.
The repository After consulting some of the leading experts of the open data research community, we selected and reviewed a wide range of existing academic literature on open data and social change. Our research team compiled a list of few case stories to demonstrate the social and political impact of open data initiatives as well as digital transparency and accountability projects, and created a repository for the case stories. We promoted the repository through our blog, all major international mail lists and by individually reaching out to Sunlight’s partner groups. Besides the crowd-sourced examples, we manually collected stories from other databases and case studies9. We were looking for examples on how users are empowered by open government initiatives, and how open data and digital transparency projects are changing the behavior, relationships, activities and actions of users. Instead of basic project descriptions and mere output, we were seeking evidence on how open data and technology help to influence governance and improve lives, both directly and indirectly10. After reviewing 136 examples, our research team compiled the data to form a database with basic facts, short descriptions and links, and categorized the repository into a couple of significant fields/sectors. In the beginning of our research, we intentionally kept the definitions for both open data initiatives and social change vague enough to encourage all kinds of interpretations that better reflect the complexity of this broad agenda. For more information on how we later categorized and filtered the case stories, see the section on the Evidence Base for Open Data Impact. After a review of the submitted examples, we selected three non-governmental projects from the Global South to work more closely with: Vota Inteligente11 from Chile, Open Duka12 from Kenya and A Tu Servicio13 from Uruguay. All three
8 Such as Sunlight’s “Ten Principles”, Open Knowledge’s Open Definition, Tim Berners Lee’s “Five Stars” of linked open data, etc. 9 Similar databases include: Technology for Transparency Network (http://transparency.globalvoicesonline.org/projects/all), OKF’s Global Initiative for Fiscal Transparency Report (http://community.openspending.org/research/gift/), Follow the money database (https://docs.google.com/a/one.org/spreadsheets/d/1Rj47jJzF-lBoaF1_cvvY4rM9DIQ3Bw2b6dy-BEQuDno/edit#gid=1240396981), etc. 10 For example, in case of a digital tool that empowers investigative journalism by providing better access to publicly available data sets, we asked people to describe how media outlets and journalistic communities use the tool for their investigations, or what types of collaborations have been inspired by their project, instead of citing the launch of the tool as the ultimate impact. 11 Retrieved from http://votainteligente.cl/ 12 Retrieved from http://www.openduka.org/

6
projects have been developed by civil society organizations (CSOs) and build on open data in the areas of parliament, elections and elected officials (Chile), business and procurements (Kenya) and health (Uruguay).
Outcome Mapping After the selection of the case stories, we developed a methodological framework to build distinctive theories of change for all three projects, through testing and revising the approach of Outcome Mapping14—originally created by the International Development Research Centre for evaluating development projects. The reason why we chose Outcome Mapping for capturing longer term social change instead of other, more linear assessment methods was the underlying assumption that open data initiatives cannot be described through simple “cause and effect” relationships, as they mostly achieve changes through their contribution to outcomes produced by a complex ecosystem of stakeholders, including journalists, think tanks, CSOs, public officials, etc. (In a report assessing the impact of the National Institute on Money in State Politics, McGovern and Greenberg (2014) refer to the inclusion of intermediary users in the evaluation approach as the “Ecological View of Impact.”15) The Outcome Mapping approach focuses on the changes within the behavior, relationships, activities or actions of the people, groups and organizations with whom an initiative works directly. These mostly mid-term outcomes can be logically linked to a program's activities, but are not necessarily directly caused by them. As Patton (2001) points out:
“(...) longer term outcomes and impacts often occur a long way downstream from program implementation and may not take the form anticipated. These longer term outcomes depend on responsiveness to context-specific factors, creating diversity across initiatives. The outcomes examined include the depth and breadth of involvement by many stakeholders, processes that become results in and of themselves when done in ways that are sustainable. These characteristics make it difficult for external agencies to identify and attribute specific outcomes to specific components of their programs or to aggregate and compare results across initiatives. Outcome Mapping offers a methodology that can be used to create planning, monitoring and evaluation mechanisms enabling organizations to document, learn from, and report on their achievements. It is designed to assist in understanding an organization's results, while recognizing that contributions by other actors are essential to achieving the kinds of sustainable, large-scale improvements in human and ecological well-being toward which the organization is working.”
Through a rigorous process of unpacking a project’s theory of change, Outcome Mapping provides a strong framework for various different open government projects by developing a unique change model for each initiative. The approach has great potential for impact assessment through detecting and documenting the changes in the behaviors, relationships and activities of people and organizations a program interacts with, and can be applied to both organizational evaluation and long-term impact assessment in complex contexts. The methodology is less effective for demonstrating an initiative’s direct contribution to impacts, or producing generalizable findings that allow for comparative analysis between different contexts. However, Outcome Mapping might provide a good framework for identifying other research methods (such as randomized control trials or quantitative surveys) to prove causality. Besides developing a robust theory of change, the approach works best when accompanied by rigorous documentation and data collection. Outcome Mapping is usually conducted through a three-day workshop, however, for the sake of scalability and financial sustainability, the original format has been replaced by a series of group interviews through video conferencing techniques, involving all members of the three project implementing teams in the process. We slightly revised the workshop questions to fit the videoconferencing format and to better address our research goal. (For more details on the workshop questions, see Annex I.) We worked closely with the selected stakeholder groups to establish consensus on
13 Retrieved from http://atuservicio.uy 14 Earl, S., Carden, F. & Smutylo, T. (2001). Outcome Mapping: Building Learning and Reflection into Development Programs. International Development Research Centre. Retrieved from http://www.outcomemapping.ca/download/OM_English_final.pdf. 15 McGovern, G. & Greenberg, M. (2014). Shining a Light on State Campaign Finance. RAND Corporation.

7
the macro level changes their open data initiatives have helped to bring about, and to provide a framework for the monitoring of their program's actions and their partners' progress toward the desired outcomes. After a historical scan of each project, we first developed a vision for all three initiatives to describe the economic, political, social or environmental changes they hope to help bring about, as well as the broad behavioral changes in their key boundary partners. The stakeholder groups then drafted a mission statement for each project to explain in broad terms how the program intends to support the vision. In the next phase, we identified the key boundary partner groups for each project, including all the individuals, groups or organizations with whom the program interacts directly and with whom the program can anticipate opportunities for influence. To further unpack the theories of change, workshop participants then developed specific outcome challenges for each boundary partner, describing how the behavior, relationships, activities or actions of an individual, group or institution will change ideally if the program is extremely successful. Once the boundary partners and outcome challenges had been identified, the project implementing group collected several milestones (graduated progress markers) for each boundary partner, to show the complexity of the change process associated with each boundary partner and to represent the information that the program can gather in order to monitor achievements toward the desired outcome. After conducting the workshops, Sunlight's research team developed a distinctive theory of change for all three projects building on their vision, mission and outcome challenges for each boundary partner; as well as a set of social change indicators based on the identified progress markers. The methodology we used for creating the indicators was inspired by the outcome journal of the Outcome Mapping approach, however, it slightly differs from the original method. By weighing the difficulty of the identified milestones, the project team put the progress markers in order, so that they advance in degree from the minimum the project implementing team would expect to see the boundary partner doing (relatively easy to achieve), to what they would like to see them doing (activities that require more active learning or engagement), to what they would love to see them doing (truly transformative milestones). As Carden and Smutylo (2001) emphasize, progress markers can be considered as sample indicators of behavioral change, but their real strength rests in their utility as a set, as they illustrate the complexity and logic of the change process. Our research team created a rating scheme for each set of change indicators, and a formula that quantifies the outcome journal in order to facilitate comparison over time, though this is not as an absolute number for “scoring.” The formula is straightforward: the optimum value for any outcome journal is 100, which does not allow for comparison between boundary partners or different projects (as the formula is arbitrary and independently defined for each stakeholder group). However, it provides a robust tool for monitoring the complex changes happening in each boundary partner group over time. The issue is not the number, but the sequence of numbers and whether progress is being made. For a full list of all the indicators, see Annex II. After the launch of this paper, Sunlight’s international policy team intends to conduct another round of group interviews with the three implementing teams to make some adjustments to the social change indicators developed for their projects, to identify organizational metrics and to define the data collection methods for documenting the boundary partner’s achievements to the desired outcome, as well as the organization’s progress toward the vision. The project implementing groups will have to define what they will monitor on an ongoing basis and what they will evaluate in depth in the next few years. In each case, they will have to revisit the indicators on a regular basis for the best impact.
8
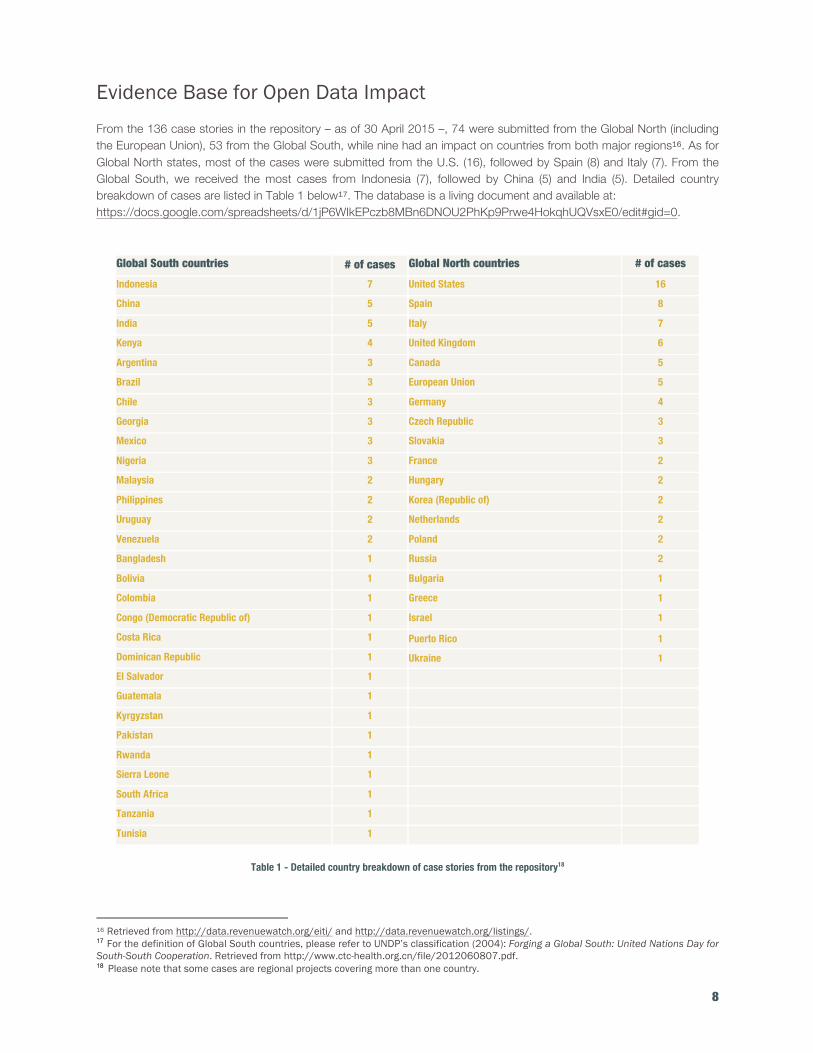
Evidence Base for Open Data Impact From the 136 case stories in the repository – as of 30 April 2015 –, 74 were submitted from the Global North (including the European Union), 53 from the Global South, while nine had an impact on countries from both major regions16. As for Global North states, most of the cases were submitted from the U.S. (16), followed by Spain (8) and Italy (7). From the Global South, we received the most cases from Indonesia (7), followed by China (5) and India (5). Detailed country breakdown of cases are listed in Table 1 below17. The database is a living document and available at: https://docs.google.com/spreadsheets/d/1jP6WIkEPczb8MBn6DNOU2PhKp9Prwe4HokqhUQVsxE0/edit#gid=0.
Global South countries # of cases Global North countries # of cases Indonesia 7 United States 16
China 5 Spain 8
India 5 Italy 7
Kenya 4 United Kingdom 6
Argentina 3 Canada 5
Brazil 3 European Union 5
Chile 3 Germany 4
Georgia 3 Czech Republic 3
Mexico 3 Slovakia 3
Nigeria 3 France 2
Malaysia 2 Hungary 2
Philippines 2 Korea (Republic of) 2
Uruguay 2 Netherlands 2
Venezuela 2 Poland 2
Bangladesh 1 Russia 2
Bolivia 1 Bulgaria 1
Colombia 1 Greece 1
Congo (Democratic Republic of) 1 Israel 1
Costa Rica 1 Puerto Rico 1 Dominican Republic 1 Ukraine 1 El Salvador 1 Guatemala 1 Kyrgyzstan 1 Pakistan 1 Rwanda 1 Sierra Leone 1 South Africa 1 Tanzania 1 Tunisia 1
Table 1 - Detailed country breakdown of case stories from the repository18
16 Retrieved from http://data.revenuewatch.org/eiti/ and http://data.revenuewatch.org/listings/. 17 For the definition of Global South countries, please refer to UNDP’s classification (2004): Forging a Global South: United Nations Day for South-South Cooperation. Retrieved from http://www.ctc-health.org.cn/file/2012060807.pdf. 18 Please note that some cases are regional projects covering more than one country.
9
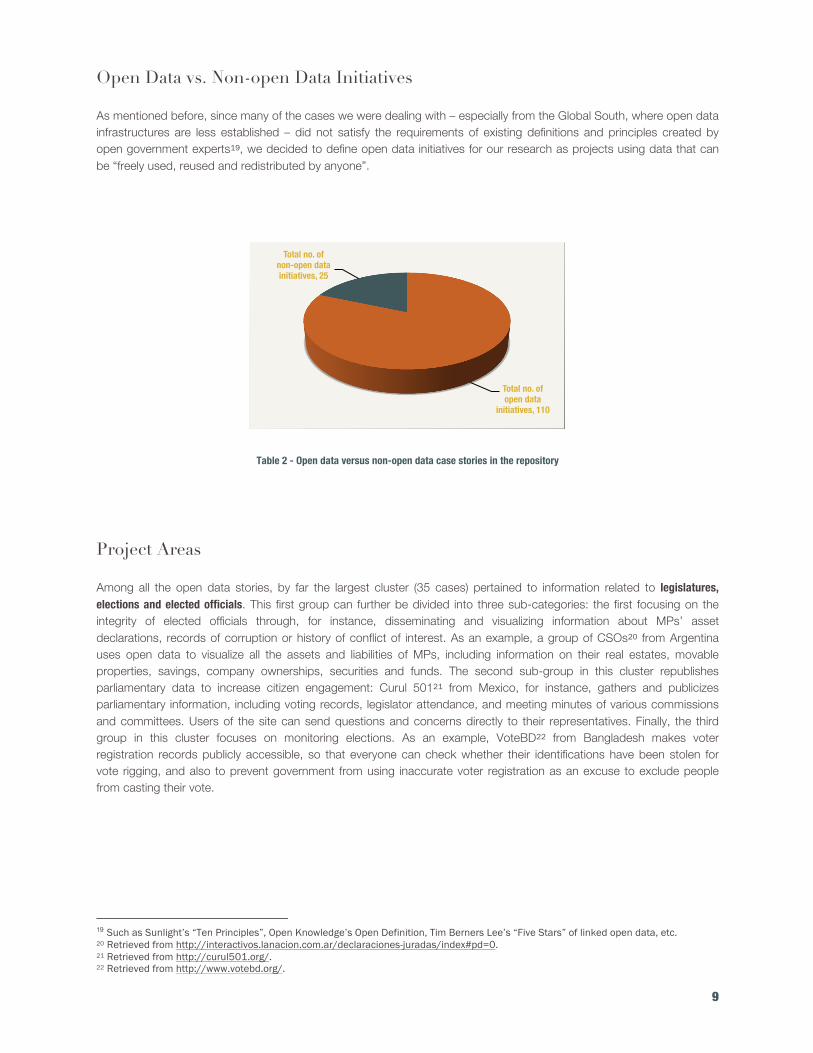
Open Data vs. Non-open Data Initiatives As mentioned before, since many of the cases we were dealing with – especially from the Global South, where open data infrastructures are less established – did not satisfy the requirements of existing definitions and principles created by open government experts19, we decided to define open data initiatives for our research as projects using data that can be “freely used, reused and redistributed by anyone”.
Table 2 - Open data versus non-open data case stories in the repository
Project Areas Among all the open data stories, by far the largest cluster (35 cases) pertained to information related to legislatures, elections and elected officials. This first group can further be divided into three sub-categories: the first focusing on the integrity of elected officials through, for instance, disseminating and visualizing information about MPs’ asset declarations, records of corruption or history of conflict of interest. As an example, a group of CSOs20 from Argentina uses open data to visualize all the assets and liabilities of MPs, including information on their real estates, movable properties, savings, company ownerships, securities and funds. The second sub-group in this cluster republishes parliamentary data to increase citizen engagement: Curul 50121 from Mexico, for instance, gathers and publicizes parliamentary information, including voting records, legislator attendance, and meeting minutes of various commissions and committees. Users of the site can send questions and concerns directly to their representatives. Finally, the third group in this cluster focuses on monitoring elections. As an example, VoteBD22 from Bangladesh makes voter registration records publicly accessible, so that everyone can check whether their identifications have been stolen for vote rigging, and also to prevent government from using inaccurate voter registration as an excuse to exclude people from casting their vote.
19 Such as Sunlight’s “Ten Principles”, Open Knowledge’s Open Definition, Tim Berners Lee’s “Five Stars” of linked open data, etc. 20 Retrieved from http://interactivos.lanacion.com.ar/declaraciones-juradas/index#pd=0. 21 Retrieved from http://curul501.org/. 22 Retrieved from http://www.votebd.org/.
Total no. of open data
initiatives, 110
Total no. of non-open data initiatives, 25

10
The second most common type of open data initiatives focused on budget and spending information, including procurement data (18 cases). The Brazilian Transparency Portal23, for instance, provides granular information on how public resources are spent, while the Access Maps and Information for Neighborhood Planning project from Indonesia gathers and visualizes spending data about housing, sanitation, poverty, health and other indicators for all neighborhoods in the city of Surakarta to help citizens make more informed decisions in the local participatory budgeting initiative. The third largest cluster of open data initiatives in the repository was the group of open data portals (12 cases). While most of these portals from the Global South follow the model of countries from the Global North where such websites are operated by the government, some of these portals are, however, run by CSOs or academic institutions. For a more detailed breakdown on the project areas, see Table 3 below. Further project areas include business, environment, the judiciary, extractive industries, health and lobbying.
Project areas # of cases
Parliament, elections and elected officials 35
Budget 18
Data portals 12
Business 8
Environment 8
Judiciary 7
Extractive industry 5
Health 5
Lobbying 5
Table 3 - Top ten project areas from the repository
23 Retrieved from http://www.portaltransparencia.gov.br/.
11
Categories of Outcome Not surprisingly, the submitted case stories approach ‘impact’ in various different ways, ranging from mere output (such as publishing X amount of raw data), through mid-term outcomes (through for instance increasing participation in a democratic process), to long-lasting impact (such as increasing social equity). In some cases, the descriptions focus on short-term outputs only, even when the project does seem to achieve long-lasting change, while other cases claim impact without credible proof on attribution. As described above, the relative novelty of the field as well as the problems of attribution make it extremely difficult to provide strong evidence on long-term social change, which is why focusing on mid-term outcomes as opposed to long-term impact or short-term output might be the right next step for the open government community, in order to create a solid base for evaluation. While acknowledging that the open government and open data agenda is much broader than the scope of this repository, based on the case stories, we identified a few potential benefit categories for project outcomes in the open government space:
1. Educate or inform citizens so that they can make more informed choices: Initiatives that provide citizens with information to help them make more informed decisions about their everyday lives, such as voting, education, healthcare, public utilities, transportation, etc. Illustrative examples from the Global South include Subsidios al Campo in Mexico24, Congreso Transparente by Asociación Civil Guatecambia in Guatemala25, or Curul 501 by Fundar & Citivox in Mexico26.
2. Promote direct civic engagement and increase citizen participation in democratic processes: Initiatives that provide a platform for direct civic engagement, such as social audits, communication with public officials, participatory budgeting projects, etc. Illustrative examples from the Global South include the China Pollution Map27 or Aduanku.my, the Malaysian version of FixmyStreet Malaysia28.
3. Gather feedback for policy-makers and/or the private sector: Initiatives that provide feedback from citizens to policymakers, to make better public decision or improve service delivery, usually involving crowdsourcing mechanisms. Illustrative examples from the Global South include Game My Village29, or the Mini-atlases for participatory budgeting30 from Indonesia.
4. Monitor and hold officials and/or the private sector accountable: Initiatives that disclose information about the decision of public officials (from legislative, executive and judiciary branches of the government), in order to facilitate public oversight over potential corruption, conflict of interests or any other form of malpractice.31 Illustrative examples from the Global South include TenderMonitor.ge by TI Georgia32, or the Bahawalpu Service Delivery Unit from Pakistan33.
24 Retrieved from http://subsidiosalcampo.org.mx/ 25 Retrieved from www.congresotransparente.org 26 Retrieved from http://curul501.org/ 27 Retrieved from http://www.ipe.org.cn/pollution/index.aspx 28 Retrieved from Aduanku.my 29 Retrieved from http://sinergantara.or.id/en/ 30 Retrieved from http://solokotakita.org/en/ 31 By accountability, we mean both answerability, referring to the obligation of public authorities to provide information about their decisions and to justify their actions; and enforceability, referring to the possibility that an accountability-seeker has to impose sanctions on an accountability holder. Schedler, A., Diamond, L. & Plattner, M.F. (Eds) (1999). The Self-restraining State: Power and Accountability in New Democracies. Boulder, US: Lynne Rienner. 32 Retrieved from http://TenderMonitor.ge 33 Retrieved from http://www.makingallvoicescount.org/project/bahawalpur-service-delivery-unit-bsdu/
12
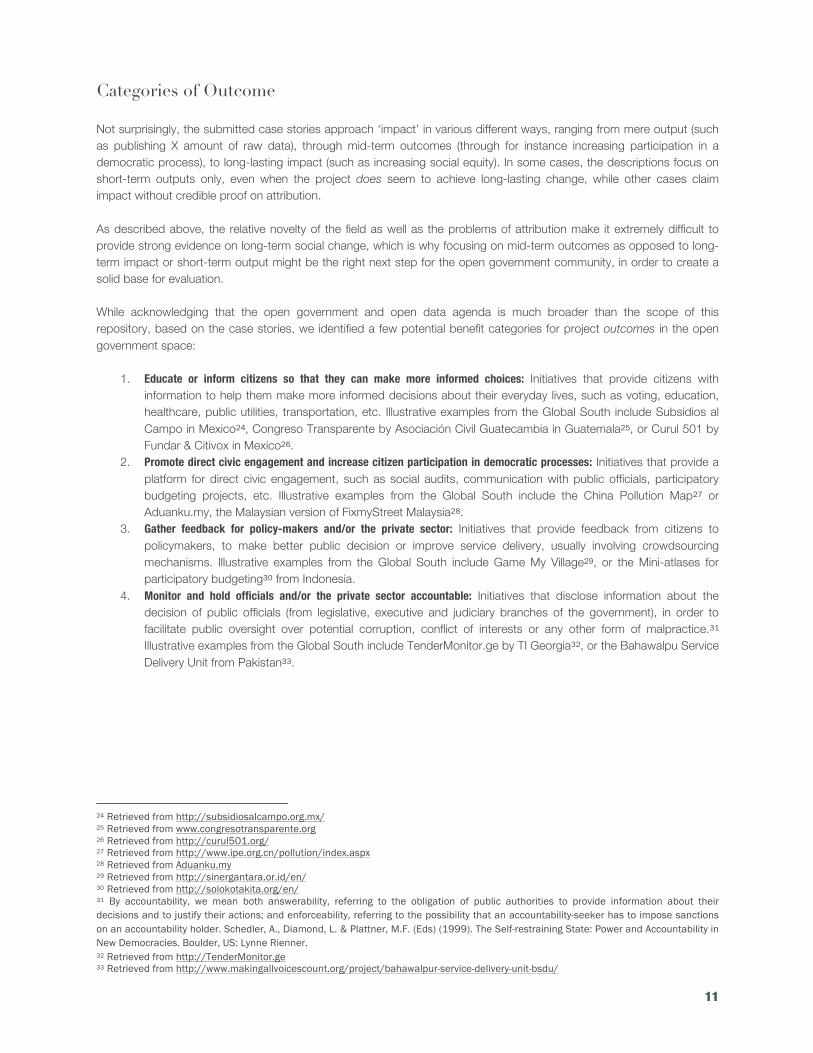
The above categories build on other relevant research, such as OKF’s Global Initiative for Fiscal Transparency Report34. Some of the submitted projects fall into more than one (if not all) benefit categories, while some of them only provided mere output, such as publishing raw data or visualizing information.
Table 4 - Breakdown of benefit categories of social impact for cases stories from the repository ------------------------------------------------------------------------------------------------------------------
34 Open Knowledge Foundation. (n.d.). Global Initiative for Fiscal Transparency Report. Retrieved from http://community.openspending.org/research/gift/
Educate or inform citizens
38%
Promote direct civic
engagement and citizen
participation 16%
Gather feedback for
policy-makers and/or the private
sector: 9%
Monitor and hold officials and/or
the private sector
accountable 37%
13
Mapping social change in three countries
After a review of the submitted examples, we selected three projects from the Global South: Vota Inteligente35 from Chile, Open Duka36 from Kenya and A Tu Servicio37 from Uruguay. All three projects have been developed by CSOs and build on open data in the areas of parliament, elections and elected officials (Chile), business and procurements (Kenya) and health (Uruguay). The underlying assumption behind our selection process was that third party actors play a crucial role in making government data more impactful, and CSOs are the well positioned in several contexts to drive long-lasting social change. As an organization focusing on government accountability, we were specifically interested in projects that increase answerability or enforceability. Needless to say, examples for the latter were extremely scarce in our repository. After conducting the workshops, Sunlight's research team developed a distinctive theory of change for all three projects building on their vision, mission and outcome challenges for each boundary partner; as well as a set of social change indicators based on the identified progress markers. When creating the indicators, we used a revised version of the Outcome Mapping rating scheme. For more details, see Section II on Methodology. For the full set of indicators, see Annex II. We believe that more work is needed to refine the assessment framework for all three of the investigated projects. After the launch of this research, Sunlight’s international policy team intends to conduct another round of group interviews with the three implementing teams to further refine the social change indicators developed for their projects, to identify organizational metrics and to define the data collection methods for documenting their boundary partner’s achievements to the desired outcome as well as the organization’s progress toward the vision. The project implementing groups will define what they will monitor on an ongoing basis and what they will evaluate in depth in the next few years. In each case, they will need to revisit the indicators on a regular basis for the best impact.
35 See case #77: Vota Inteligente, Fundación Ciudadano Inteligente (FCI). Retrieved from http://votainteligente.cl/ 36 See case #61: Open Duka, Open Institute. Retrieved from http://www.openduka.org/ 37 See case #135: A Tu Servicio, DATA Uruguay. Retrieved from http://atuservicio.uy

14
Chile – Vota Inteligente
Country background information Chile is a high-income country38 in South America with a population of almost 18 million and a relatively low poverty rate of 14.4 percent39. The country ranks 41st on the UN’s human development index40, and 21st on Transparency International’s Corruption Perception Index (CPI)41. Despite the country’s strong political and economical leadership position in the region, Chileans have repeatedly expressed lukewarm interests in political engagement with relatively low voter turnout rates for both presidential and parliamentary elections42. Press freedom has been recognized as “partly free” by both Freedom House43 and Reporters Without Borders44, and according to our interviewees, Chileans have a general distrust in their politics and politicians. With an Internet penetration rate of 67.3 percent45, Chile is well positioned to be a regional leader in digital transparency. The Open Data Barometer puts Chile in the cluster of “emerging and advancing” countries, with a great potential to develop innovative approaches to open data, but also facing some challenges to mainstreaming open data across government and institutionalizing it as a sustainable practice. Chile’s freedom of information (FOI) law – regarded as relatively strong by the Global Right to Information Rating46 – was passed in 200947, and the country joined the Open Government Partnership (OGP) in 2011. Chile is considered to have the second most transparent legislature in Latin America48. The country ranks 16th in the world for its budget openness49 and as 19th on the Open Knowledge Foundation's (OKF’s) Global Open Data Index50. Despite being a resource-rich country, Chile is not part of the Extractive Industries Transparency Initiative (EITI)51, nor a member of Publish What You Pay (PWYP)52.
Project background Vota Inteligente is an online platform that aims to strengthen participatory democracy and reduce information asymmetries between Chilean citizens and their government.53 Developed in 2009 by the Smart Citizen Foundation (Fundación Ciudadano Inteligente - FCI), a non-governmental organization promoting transparency and citizen participation through the innovative use of technology, the tool was created as an electoral platform that gathers data on different candidates and thus increases the chances of informed voting. Vota Inteligente was one of the first civic technology projects building on electoral information, and the project has gone through various different stages since its launch. In the past few years, Vota Inteligente received worldwide recognition and the project was deployed in other Latin American countries54. The different features and functionalities on Vota Inteligente led to several conversations with other organizations working on legislative transparency and government openness, and FCI became a founding member of Poplus, a global community of developers to share knowledge and technology. Our assessment framework focuses on Vota Inteligente`s impact on Chile only.
Theory of change The vision behind Vota Inteligente is to better engage Chileans in public matters, and to transfer power from a privileged few to a larger circle of informed citizens. As for the project’s long-term impact, Fundación Ciudadano Inteligente (FCI)
38 Chile’s GDP: US$277.2 billion (World Bank, 2013). Retrieved from http://data.worldbank.org/country/chile. 39 World Bank (2011). Retrieved from http://data.worldbank.org/country/chile. 40 UNDP (2014). Human Development Report 2014. Retrieved from http://hdr.undp.org/sites/default/files/hdr14-report-en-1.pdf. 41 Transparency International (2014). Retrieved from http://www.transparency.org/cpi2014/results. 42 International Institute for Democracy and Electoral Assistance (2013). Retrieved from http://www.idea.int/vt/countryview.cfm?CountryCode=CL. 43 Freedom House (2014). Retrieved from https://freedomhouse.org/sites/default/files/FIW%202014%20Scores%20-%20Countries%20and%20Territories.pdf. 44 Reporters Without Borders (2014). Retrieved from http://rsf.org/index2014/en-index2014.php. 45 Internet World Stat (2014). Retrieved from http://www.internetworldstats.com/stats.htm. 46 Global Right to Information Rating (2013). Retrieved from http://www.rti-rating.org/country_data.php# 47 Full legal text: http://www.leychile.cl/Navegar?idNorma=276363. 48 Indice de Transparencia Legislativa (2014). Retrieved from http://ciudadanointeligente.github.io/indice/. 49 Open Budget Survey (2012). Retrieved from http://internationalbudget.org/wp-content/uploads/OBI2012-Report-English.pdf. 50 Open Knowledge Foundation (2014). Retrieved from http://index.okfn.org/place/chile/. 51 Extractive Industries Transparency Initiative (2014). Retrieved from https://eiti.org/countries. 52 Publish What You Pay (2014). Retrieved from http://www.publishwhatyoupay.org/where/latin-america. 53 Belbis, J. I. (2014). Vota Inteligente: Ciudadano Inteligente’s Flagship. Fundación Ciudadano Inteligente. 54 The countries are: Argentina, Bolivia, Guatemala, Paraguay and Venezuela.
15
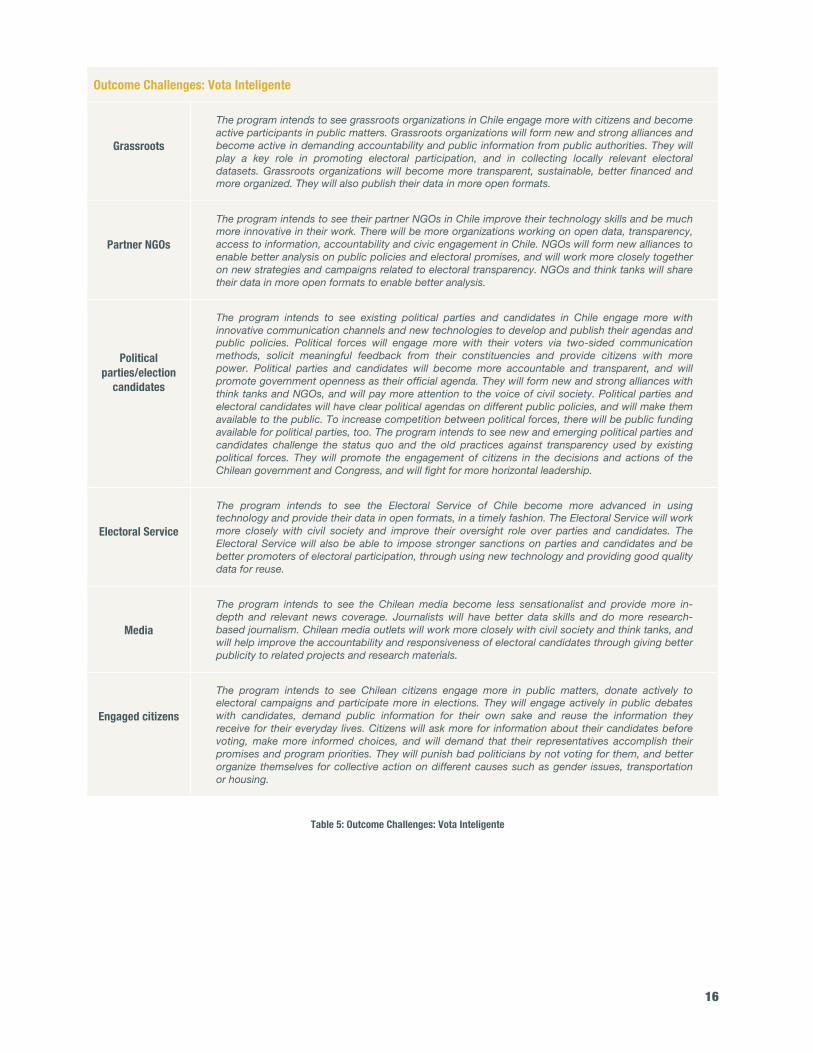
envisions the information flow between politicians and citizens to become more symmetric; electoral participation and the trust in the electoral process to increase significantly; public officials to become more accountable, responsive and transparent; and information about the electoral process in Chile to be released in open formats to enable public dialogues, better analysis and improved investigation. In support of that vision, FCI has been working to turn Vota Inteligente into the online version of the Greek polis that brings together all the electoral stakeholders to generate open debates. According to the project team, Vota Inteligente best serves the long-term vision as the number one information resource and communication platform by Chileans participating in the electoral process. Ideally, electoral candidates and MPs should communicate directly with their constituencies through Vota Inteligente, and submit prompt updates and responses on their programs and profiles. To support the vision of increasing public sector accountability, the platform should also include detailed information on the performance of electoral candidates, including their voting records, previous political history and performance indicators. As for the individuals, groups, and organizations with whom Vota Inteligente interacts directly and with whom the project team anticipates opportunities for influence, FCI identified six boundary partner groups: a, grassroots (e.g., offline organizing communities, local neighborhood unions, university unions); b, partner NGOs (such as human rights groups, environmental NGOs, organizations working around poverty, education and gender issues, etc.); c, political parties/election candidates (including both existing and newly emerging political forces); d, the Electoral Service; e, the media (including small local newspapers and national media outlets, too); and f, engaged citizens. Regarding the desired behavioral changes, Table 5 provides a detailed breakdown for the outcome challenges associated with each boundary partner group.
16
Outcome Challenges: Vota Inteligente
Grassroots
The program intends to see grassroots organizations in Chile engage more with citizens and become active participants in public matters. Grassroots organizations will form new and strong alliances and become active in demanding accountability and public information from public authorities. They will play a key role in promoting electoral participation, and in collecting locally relevant electoral datasets. Grassroots organizations will become more transparent, sustainable, better financed and more organized. They will also publish their data in more open formats.
Partner NGOs
The program intends to see their partner NGOs in Chile improve their technology skills and be much more innovative in their work. There will be more organizations working on open data, transparency, access to information, accountability and civic engagement in Chile. NGOs will form new alliances to enable better analysis on public policies and electoral promises, and will work more closely together on new strategies and campaigns related to electoral transparency. NGOs and think tanks will share their data in more open formats to enable better analysis.
Political parties/election
candidates
The program intends to see existing political parties and candidates in Chile engage more with innovative communication channels and new technologies to develop and publish their agendas and public policies. Political forces will engage more with their voters via two-sided communication methods, solicit meaningful feedback from their constituencies and provide citizens with more power. Political parties and candidates will become more accountable and transparent, and will promote government openness as their official agenda. They will form new and strong alliances with think tanks and NGOs, and will pay more attention to the voice of civil society. Political parties and electoral candidates will have clear political agendas on different public policies, and will make them available to the public. To increase competition between political forces, there will be public funding available for political parties, too. The program intends to see new and emerging political parties and candidates challenge the status quo and the old practices against transparency used by existing political forces. They will promote the engagement of citizens in the decisions and actions of the Chilean government and Congress, and will fight for more horizontal leadership.
Electoral Service
The program intends to see the Electoral Service of Chile become more advanced in using technology and provide their data in open formats, in a timely fashion. The Electoral Service will work more closely with civil society and improve their oversight role over parties and candidates. The Electoral Service will also be able to impose stronger sanctions on parties and candidates and be better promoters of electoral participation, through using new technology and providing good quality data for reuse.
Media
The program intends to see the Chilean media become less sensationalist and provide more in-depth and relevant news coverage. Journalists will have better data skills and do more research-based journalism. Chilean media outlets will work more closely with civil society and think tanks, and will help improve the accountability and responsiveness of electoral candidates through giving better publicity to related projects and research materials.
Engaged citizens
The program intends to see Chilean citizens engage more in public matters, donate actively to electoral campaigns and participate more in elections. They will engage actively in public debates with candidates, demand public information for their own sake and reuse the information they receive for their everyday lives. Citizens will ask more for information about their candidates before voting, make more informed choices, and will demand that their representatives accomplish their promises and program priorities. They will punish bad politicians by not voting for them, and better organize themselves for collective action on different causes such as gender issues, transportation or housing.
Table 5: Outcome Challenges: Vota Inteligente
17
Indicators of change As explained in the methodology section, once the boundary partners and outcome challenges had been identified, the Vota Inteligente team collected milestones for each boundary partner, to show the complexity of the change process associated with each boundary partner and to represent the information that the program can gather in order to monitor achievements toward the desired outcome. The workshop participants then turned to organizational practices and created a potential strategy map for each boundary partner and outcome challenge. Sunlight's research team then developed a set of social change indicators based on the identified progress markers. After the research phase is over, we will conduct another round of group interviews with the team to identify the organizational metrics and data collection methods for documenting the boundary partner’s achievements to the desired outcome, as well as the organization’s progress towards the vision. Table 6 provides a detailed breakdown for the change indicators created for one of the boundary partners of Vota Inteligente (grassroots). For the rest of the indicators developed for Vota Inteligente's boundary partners, see Annex II. For a more detailed explanation on the methodology, see Section II.
18
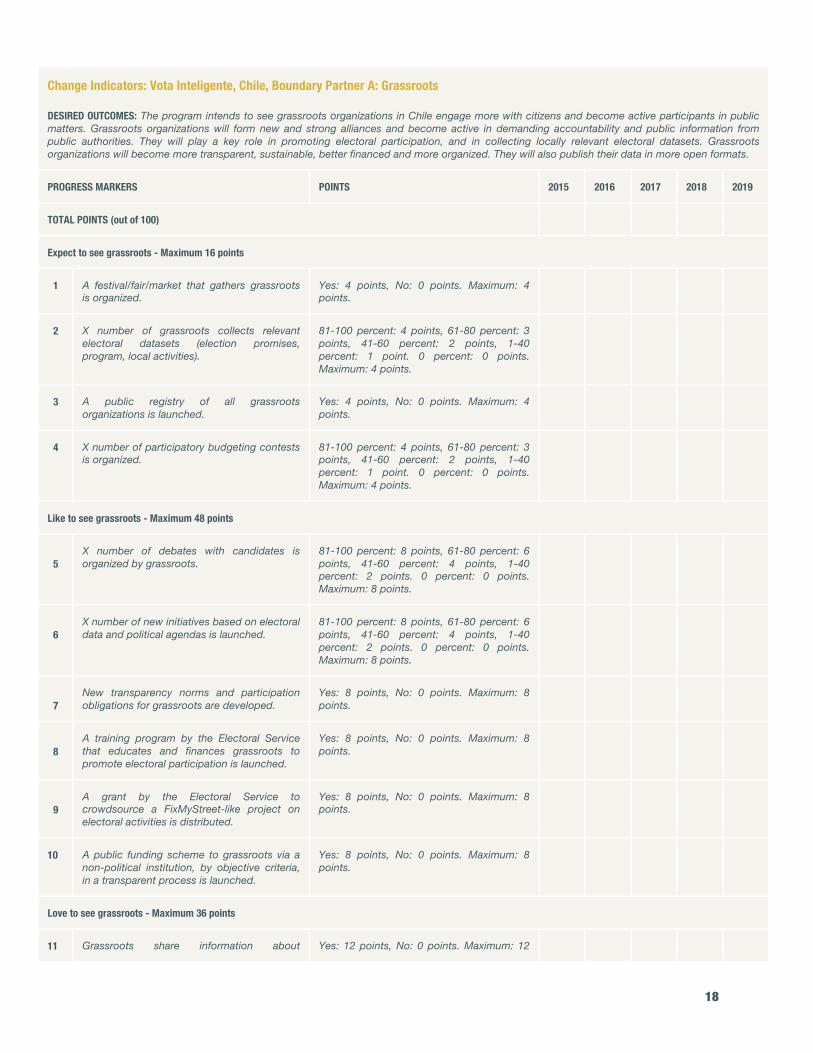
Change Indicators: Vota Inteligente, Chile, Boundary Partner A: Grassroots DESIRED OUTCOMES: The program intends to see grassroots organizations in Chile engage more with citizens and become active participants in public matters. Grassroots organizations will form new and strong alliances and become active in demanding accountability and public information from public authorities. They will play a key role in promoting electoral participation, and in collecting locally relevant electoral datasets. Grassroots organizations will become more transparent, sustainable, better financed and more organized. They will also publish their data in more open formats.
PROGRESS MARKERS POINTS 2015 2016 2017 2018 2019
TOTAL POINTS (out of 100)
Expect to see grassroots - Maximum 16 points
1 A festival/fair/market that gathers grassroots is organized.
Yes: 4 points, No: 0 points. Maximum: 4 points.
2 X number of grassroots collects relevant electoral datasets (election promises, program, local activities).
81-100 percent: 4 points, 61-80 percent: 3 points, 41-60 percent: 2 points, 1-40 percent: 1 point. 0 percent: 0 points. Maximum: 4 points.
3 A public registry of all grassroots organizations is launched.
Yes: 4 points, No: 0 points. Maximum: 4 points.
4 X number of participatory budgeting contests is organized.
81-100 percent: 4 points, 61-80 percent: 3 points, 41-60 percent: 2 points, 1-40 percent: 1 point. 0 percent: 0 points. Maximum: 4 points.
Like to see grassroots - Maximum 48 points
5
X number of debates with candidates is organized by grassroots.
81-100 percent: 8 points, 61-80 percent: 6 points, 41-60 percent: 4 points, 1-40 percent: 2 points. 0 percent: 0 points. Maximum: 8 points.
6
X number of new initiatives based on electoral data and political agendas is launched.
81-100 percent: 8 points, 61-80 percent: 6 points, 41-60 percent: 4 points, 1-40 percent: 2 points. 0 percent: 0 points. Maximum: 8 points.
7
New transparency norms and participation obligations for grassroots are developed.
Yes: 8 points, No: 0 points. Maximum: 8 points.
8
A training program by the Electoral Service that educates and finances grassroots to promote electoral participation is launched.
Yes: 8 points, No: 0 points. Maximum: 8 points.
9
A grant by the Electoral Service to crowdsource a FixMyStreet-like project on electoral activities is distributed.
Yes: 8 points, No: 0 points. Maximum: 8 points.
10 A public funding scheme to grassroots via a non-political institution, by objective criteria, in a transparent process is launched.
Yes: 8 points, No: 0 points. Maximum: 8 points.
Love to see grassroots - Maximum 36 points
11 Grassroots share information about Yes: 12 points, No: 0 points. Maximum: 12
19
themselves in open formats. points.
12
A new institution in charge of educating citizens on how to organize themselves in a sustainable way is established.
Yes: 12 points, No: 0 points. Maximum: 12 points.
13 Low legal entry barriers to create grassroots are introduced.
Yes: 12 points, No: 0 points. Maximum: 12 points.
Table 6: Change Indicators - template (Vota Inteligente, Chile, Boundary Partner A: Grassroots)
------------------------------------------------------------------------------------------------------------------
20
Kenya - Open Duka
Country background information Kenya is a low-income country in Africa55 with a population of almost 45 million and a high poverty rate of 45.9 percent56. The country ranks 147th on the UN’s human development index57 and 145th on Transparency International’s Corruption Perception Index (CPI)58. Press freedom is considered restricted by both Freedom House59 and the Reporters Without Borders60, while the country’s governance is seen as ineffective61. The country has an Internet penetration rate of 47.3 percent – the lowest among our three case stories62. Despite the country’s rather poor indicators, citizens of Kenya show great enthusiasm toward politics, with more than 85 percent voter turnout63 for both the latest parliamentary and presidential elections (as a comparison: the OECD country average is 70 percent64). The Open Data Barometer puts Kenya in the cluster of “capacity constrained” countries, with an established open data initiative, but one that remains highly dependent upon a small network of leaders and technical experts. A freedom of information bill was developed in the country in 2007, but has yet to be introduced by the Parliament.65 Kenya joined the Open Government Partnership (OGP) in 2011, and is now developing its second action plan with 10 current commitments66 on government openness. The country ranks 46th out of 100 countries for its budget openness67 and 85th on the Open Knowledge Foundation's (OKF’s) Global Open Data Index68. Three Kenyan CSOs have joined PWYP69 as coalition members but the country is not a member of EITI70.
Project background Open Duka is an online platform that aims to provide citizens, journalists and civic activists in Kenya with a practical and easy-to-use tool to understand the ownership structure of their country, while also demonstrating the practical applications of open data for average citizens. The project collects data from a wide variety of sources ranging from shareholder information and procurement data, to legal cases, land data and company information. Developed by the Open Institute, Open Duka was launched in early 2014 with a special emphasis on producing compelling data visualizations and republishing government data in formats that allow more third-party applications.
Theory of change The vision behind Open Duka is that in the next few years, Kenyan public institutions and politicians are more likely to choose the public interest instead of their private gains. As for the project’s long-term impact, Open Institute envisions Kenyan politicians to be more accountable, responsive and transparent, and citizens to make more conscious decisions in their everyday lives – such as when voting, land buying or job seeking. Part of the vision of the project is that Kenyan citizens will want to know more about the political and social history of the individuals, institutions or assets before they make any decision, and there will be a cultural shift toward openness in general. Media outlets will publish more in-depth and compelling stories with stronger investigations and better visualizations on relationships and power networks.
55 Kenya’s GDP: US$55.24 billion (World Bank, 2013). Retrieved from http://data.worldbank.org/country/kenya. 56 World Bank (2005). Retrieved from http://data.worldbank.org/country/kenya. 57 UNDP (2014). Human Development Report 2014. Retrieved from http://hdr.undp.org/sites/default/files/hdr14-report-en-1.pdf. 58 Transparency International (2014). Retrieved from http://www.transparency.org/cpi2014/results 59 Freedom House (2014). Retrieved from https://freedomhouse.org/sites/default/files/FIW%202014%20Scores%20-%20Countries%20and%20Territories.pdf 60 Reporters Without Borders (2014). Retrieved from http://rsf.org/index2014/en-index2014.php 61 Kenya scores for World Governance Indicators are in the 40th percentile for “Political Stability,” “Governance Effectiveness,” “Regulatory Quality,” “Rule of Law” and “Control of Corruption.” 62 Internet World Stat (2014). Retrieved from http://www.internetworldstats.com/stats.htm 63 International Institute for Democracy and Electoral Assistance (2013). Retrieved from http://www.idea.int/vt/countryview.cfm?CountryCode=KE 64 Fairvote (2012). Retrieved from http://www.fairvote.org/research-and-analysis/voter-turnout/ 65 Jalipa, R. (2014). Kenya: Clear Need to Respect the Right of Access to Information. Freedominfo.org. Retrieved from http://www.freedominfo.org/2014/10/kenyan-development-makes-clear-need-respect-right-access-information/ 66 See OGP’s website (http://www.opengovpartnership.org/country/kenya/action-plan) for Kenya’s detailed commitments. 67 Open Budget Survey (2012). Retrieved from http://internationalbudget.org/wp-content/uploads/OBI2012-Report-English.pdf 68 Open Knowledge Foundation (2014). Retrieved from http://index.okfn.org/place/chile/. 69 Publish What You Pay (2014). Retrieved from http://www.publishwhatyoupay.org/where/coalitions/kenya. 70 Extractive Industries Transparency Initiative (2014). Retrieved from https://eiti.org/countries.

21
In support of that vision, Open Institute has been working to engage the Kenyan government, public institutions, citizens, the media, CSOs and developers in using the datasets collected and published on Open Duka. The project team intends to engage all relevant stakeholders to provide their datasets through Open Duka, and to use the platform for further collaboration. Ideally, government bodies should use the platform to get more information about their contractors and, thus, reduce corruption and fraud, whereas CSOs should use Open Duka as a watchdog tool to hold the government and corporations accountable. The developer community will have access to datasets they did not access to before, allowing them to build better applications for their communities. Finally, in support of the vision, Open Institute will work to have more compelling and easily embeddable visualizations and work to reach communities without access to digital technology. As for the individuals, groups and organizations with whom Open Duka interacts directly and with whom the project team anticipates opportunities for influence, Open Institute identified seven boundary partner groups: a, the government and government agencies (including the Lands Ministry and Company Registry); b, the Stock Exchange of Kenya; c, the media; d, investors (including land buyers and company owners); e, developers; f, researchers; and g, civil society organizations (including watchdog and human rights NGOs). Regarding the desired behavioral changes, Table 7 provides a detailed breakdown for the outcome challenges associated with each boundary partner group.

22
Outcome Challenges: Open Duka
Government and government agencies
The program intends to see government agencies in Kenya provide their data in open formats and in a timely manner, to embrace the feedback they receive on their data, and to become data users themselves. Governmental responsiveness and efficiency will increase, while the data literacy skills within government agencies will also improve. The Kenyan government will work more closely with citizens and implement policy changes toward better data release. Agencies will publish more detailed information on the candidates running for public office and become less protective of vested interests in public contracting procedures thanks to the risk of potential exposure and sanctions.
Stock Exchange
The program intends to see the Stock Exchange of Kenya provide their data – including the board memberships of companies and the compensation they receive – in open formats and in a timely manner. Through better data release and the use of new technologies, their ability to connect with decision-makers for approvals or disapprovals will increase. Thus, the efficiency of the Stock Exchange will grow, too. They will become more vocal about transparency and accountability and work closer with the government and CSOs to tackle private and public sector corruption. The Kenya Stock Exchange will provide information on the relationships between subsidiary companies, their parent/holding companies and beneficial owners, and pay special attention to the inclusion of women and minority groups in financial decisions.
Media
The program intends to see journalists in Kenya provide depth to their stories by becoming more analytical and thorough, and by disclosing data about relationships and power networks and how these networks influence government contracts. Kenyan media outlets will become more data-driven and will publish appealing info graphics and visualizations (especially within their investigative pieces, business reporting and political coverage), while journalist adopt new digital skills, such as embedding files or cleaning datasets. Media owners will play a crucial role in understanding the power of new technologies and new ways of storytelling, and information about media ownership structures will become public. Media outlets will also provide the data they are gathering in more open formats, enabling further collaborations and tools. Journalists will play a crucial role in getting data keepers (such as government agencies) to release their data in better formats, proactively and in a timely fashion.
Investors
The program intends to see investors in Kenya use open data as part of their due diligence to verify information about their investment targets, and how they relate to each other. They will use data to research whether a piece of land is disputed or not, to see who are the previous owners of the same land, or to check if a person they want to hire has a conflicting previous employment history. Conducting business in Kenya will become a much easier process.
Developers
The program intends to see developers in Kenya use APIs and contribute to scraping data from government, civil society and the media. The developer community will build applications based on open data, develop new software and even create new startups around open datasets to engage citizens, improve service delivery (such as speeding up company registration or tender announcements) and generate revenue. The developer community in Kenya will use Github and engage more in collaborative projects.
Academics
The program intends to see academics in Kenya have more facts at their disposal. Conducting research will become easier and less time-consuming, and researchers will use more data visualizations and widgets to make their analyses digestible and easier to consume. Researchers will engage more in verifying the data provided by governments and the public sector, and, thus, increase the credibility of data. They will work more around power networks and government contracts, and will provide more analysis on the influence of such networks and relationships on government policies. The research community becomes more open about sharing their findings with the general public.
Civil society
The program intends to see civil society in Kenya to have more trust in working with their government, increase their advocacy capacities and improve their relationships with public agencies. CSOs will have improved internal capacities and better digital skills to analyze the datasets related to their work. Civil society becomes more open to share their data in better ways and formats.
Table 7: Outcome Challenges: Open Duka
23
Indicators of change As explained in the methodology section, once the boundary partners and outcome challenges had been identified, the Open Duka team collected milestones for each boundary partner, to show the complexity of the change process associated with each boundary partner and to represent the information that the program can gather in order to monitor achievements toward the desired outcome. The workshop participants then turned to organizational practices and created a potential strategy map for each boundary partner and outcome challenge. Sunlight’s research team then developed a set of social change indicators based on the identified progress markers. After the research phase is over, we will conduct another round of group interviews with Open Institute to identify the organizational metrics and data collection methods for documenting the boundary partner’s achievements to the desired outcome, as well as the organization’s progress towards the vision. Table 8 provides a detailed breakdown for the change indicators created for one of the boundary partners of Open Duka (the media). For the rest of the indicators developed for Open Duka's boundary partners, see Annex II. For a more detailed explanation on the methodology, see Section II.
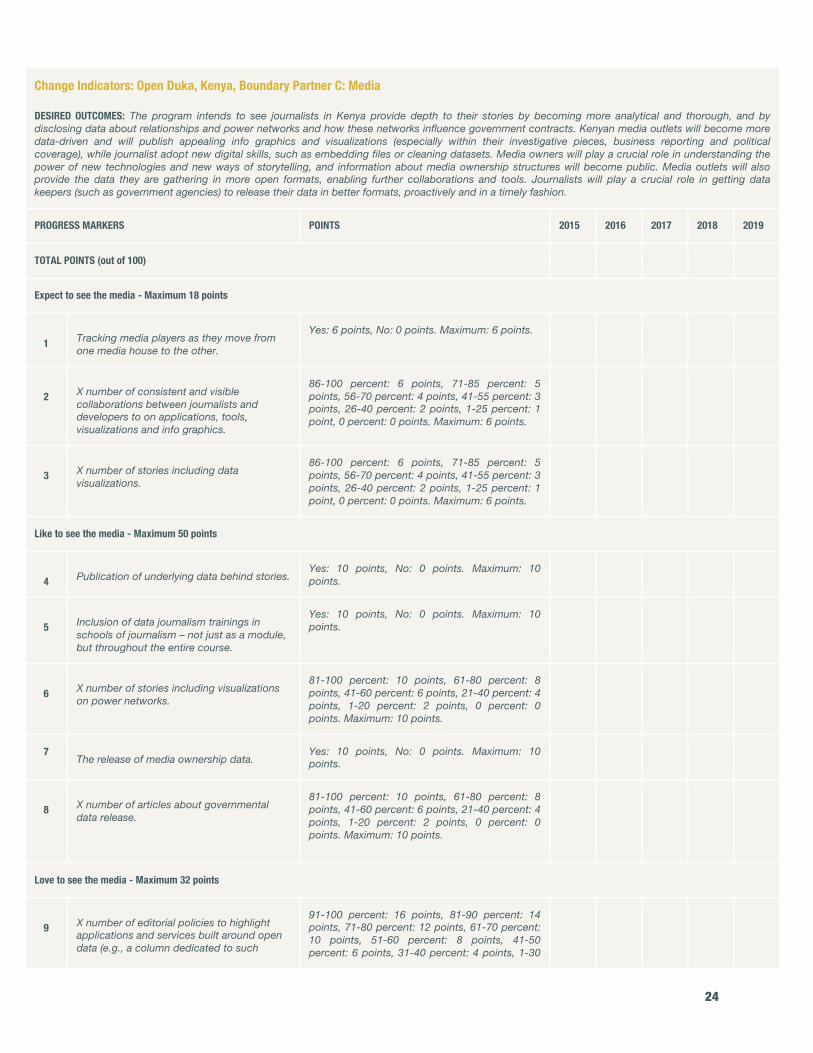
24
Change Indicators: Open Duka, Kenya, Boundary Partner C: Media DESIRED OUTCOMES: The program intends to see journalists in Kenya provide depth to their stories by becoming more analytical and thorough, and by disclosing data about relationships and power networks and how these networks influence government contracts. Kenyan media outlets will become more data-driven and will publish appealing info graphics and visualizations (especially within their investigative pieces, business reporting and political coverage), while journalist adopt new digital skills, such as embedding files or cleaning datasets. Media owners will play a crucial role in understanding the power of new technologies and new ways of storytelling, and information about media ownership structures will become public. Media outlets will also provide the data they are gathering in more open formats, enabling further collaborations and tools. Journalists will play a crucial role in getting data keepers (such as government agencies) to release their data in better formats, proactively and in a timely fashion.
PROGRESS MARKERS POINTS 2015 2016 2017 2018 2019
TOTAL POINTS (out of 100)
Expect to see the media - Maximum 18 points
1 Tracking media players as they move from
one media house to the other.
Yes: 6 points, No: 0 points. Maximum: 6 points.
2 X number of consistent and visible
collaborations between journalists and developers to on applications, tools, visualizations and info graphics.
86-100 percent: 6 points, 71-85 percent: 5 points, 56-70 percent: 4 points, 41-55 percent: 3 points, 26-40 percent: 2 points, 1-25 percent: 1 point, 0 percent: 0 points. Maximum: 6 points.
3 X number of stories including data
visualizations.
86-100 percent: 6 points, 71-85 percent: 5 points, 56-70 percent: 4 points, 41-55 percent: 3 points, 26-40 percent: 2 points, 1-25 percent: 1 point, 0 percent: 0 points. Maximum: 6 points.
Like to see the media - Maximum 50 points
4 Publication of underlying data behind stories.
Yes: 10 points, No: 0 points. Maximum: 10 points.
5 Inclusion of data journalism trainings in
schools of journalism – not just as a module, but throughout the entire course.
Yes: 10 points, No: 0 points. Maximum: 10 points.
6 X number of stories including visualizations
on power networks.
81-100 percent: 10 points, 61-80 percent: 8 points, 41-60 percent: 6 points, 21-40 percent: 4 points, 1-20 percent: 2 points, 0 percent: 0 points. Maximum: 10 points.
7 The release of media ownership data.
Yes: 10 points, No: 0 points. Maximum: 10 points.
8 X number of articles about governmental
data release.
81-100 percent: 10 points, 61-80 percent: 8 points, 41-60 percent: 6 points, 21-40 percent: 4 points, 1-20 percent: 2 points, 0 percent: 0 points. Maximum: 10 points.
Love to see the media - Maximum 32 points
9 X number of editorial policies to highlight
applications and services built around open data (e.g., a column dedicated to such
91-100 percent: 16 points, 81-90 percent: 14 points, 71-80 percent: 12 points, 61-70 percent: 10 points, 51-60 percent: 8 points, 41-50 percent: 6 points, 31-40 percent: 4 points, 1-30

25
initiatives). percent: 2 points, 0 percent: 0 points. Maximum: 16 points.
10 Proactive disclosure of information about
media shareholders.
Yes: 16 points, No: 0 points. Maximum: 16 points.
Table 8: Change Indicators - template (Open Duka, Kenya, Boundary Partner C: Media) ------------------------------------------------------------------------------------------------------------------

26
Uruguay - A Tu Servicio
Country background information Uruguay is a high-income country71 in South America with a population of 3.4 million72 and a relatively low poverty rate of 11.5 percent. The country ranks 50th on the UN’s human development index73 and 21st on Transparency International’s Corruption Perception Index (CPI)74. Press freedom is considered free by both Freedom House75 and the Reporters Without Borders76 – the best among our three case stories. Similarly to Chile, Uruguay is also well positioned to be a leading Latin American country in the field of digital transparency. The country has an Internet penetration rate of 60.5 percent77, and the Open Data Barometer puts Uruguay in the cluster of “emerging and advancing” countries, with a great potential to develop innovative approaches to open data, but also facing some challenges to mainstreaming open data across government and institutionalizing it as a sustainable practice. Uruguay’s Freedom of Information Act78 – regarded as relatively strong by the Global Right to Information Rating79 – was passed in 2008, and the country joined the Open Government Partnership (OGP) in 2011. The country ranks 12th on the Open Knowledge Foundation's (OKF’s) Global Open Data Index80. Uruguay is not part of the Extractive Industries Transparency Initiative (EITI)81, or Publish What You Pay (PWYP)82.
Project background A Tu Servicio is an online platform that aims to make it easier for citizens in Uruguay to view and compare information about their health care providers. Key performance indicators have been published as raw data by the government, leaving little room for citizens to consult the data when choosing between providers. Developed by DATA Uruguay and launched in February 2015, A Tu Servicio provides easily digestible, searchable and visualized infographics based on open government data.
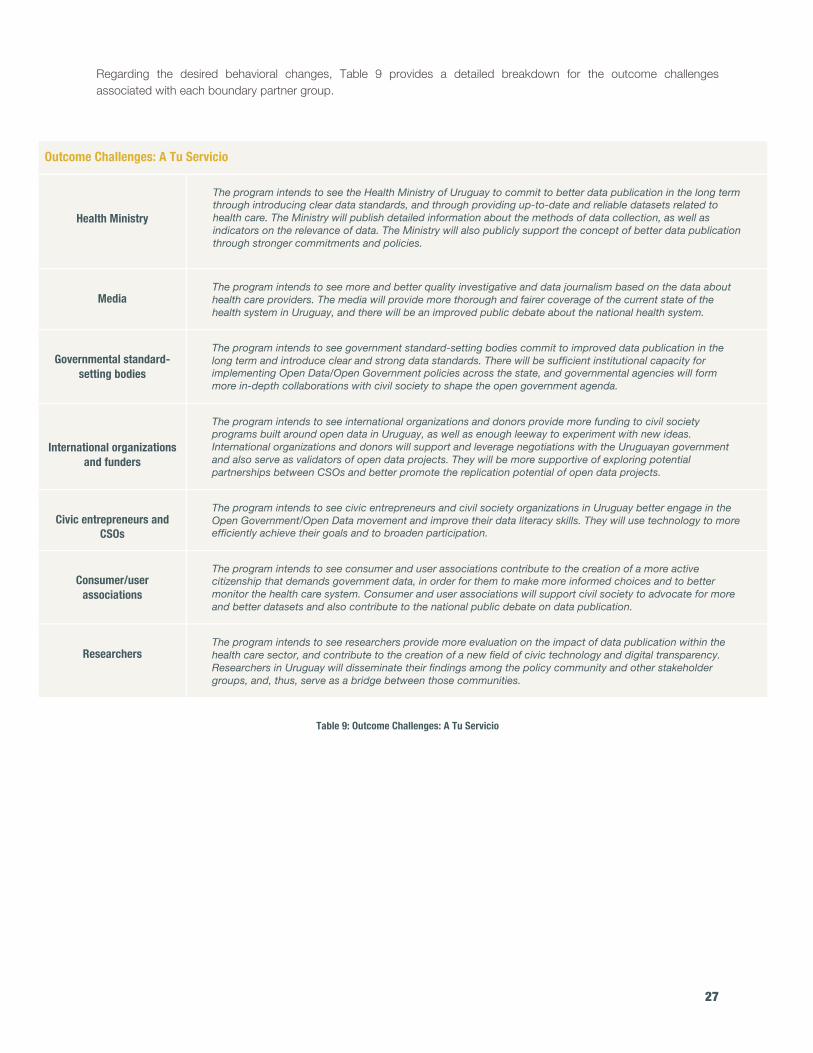
Theory of change The vision behind A Tu Servicio is that in the next few years, people in Uruguay will make more informed decisions about health issues based on complete, granular, reliable and accessible information. There will be greater demand from citizens on health-related data and people will participate in the monitoring and evaluation of the data and health care services. As for the project’s long-term impact, DATA Uruguay envisions a more efficient, fair and accountable public health system. In support of that vision, A Tu Servicio has been working to provide open source tools, create an alliance with the public sector and citizens, and help establish a set of standards for health-related data. The project team also intends to broaden the reach of the tool by adding feedback modules. As for the individuals, groups and organizations with whom A Tu Servicio interacts directly and with whom the project team anticipates opportunities for influence, DATA Uruguay identified seven boundary partner groups: a, the Health Ministry; b, media; c, governmental standard-setting bodies, d, international organizations (including the World Bank or IADB) and funders (such as ILDA); e, civic entrepreneurs and CSOs; f, consumer/user associations and g, researchers.
71 Uruguay’s GDP: US$55.71 billion (World Bank, 2013). Retrieved from http://data.worldbank.org/country/uruguay. 72 World Bank (2013). Retrieved from http://data.worldbank.org/country/uruguay. 73 UNDP (2014). Human Development Report 2014. Retrieved from http://hdr.undp.org/sites/default/files/hdr14-report-en-1.pdf. 74 Transparency International (2014). Retrieved from http://www.transparency.org/cpi2014/results. 75 Freedom House (2014). Retrieved from https://freedomhouse.org/sites/default/files/FIW%202014%20Scores%20-%20Countries%20and%20Territories.pdf. 76 Reporters Without Borders (2014). Retrieved from http://rsf.org/index2014/en-index2014.php. 77 Internet World Stat (2014). Retrieved from http://www.internetworldstats.com/stats.htm. 78 Full legal text: http://www.rti-rating.org/files/pdf/Uruguay.pdf. 79 Global Right to Information Rating (2013). Retrieved from http://www.rti-rating.org/country_data.php#. 80 Open Knowledge Foundation (2014). Retrieved from http://index.okfn.org/place/uruguay/. 81 Extractive Industries Transparency Initiative (2014). Retrieved from https://eiti.org/countries. 82 Publish What You Pay (2014). Retrieved from http://www.publishwhatyoupay.org/where/latin-america.
27
Regarding the desired behavioral changes, Table 9 provides a detailed breakdown for the outcome challenges associated with each boundary partner group.
Outcome Challenges: A Tu Servicio
Health Ministry
The program intends to see the Health Ministry of Uruguay to commit to better data publication in the long term through introducing clear data standards, and through providing up-to-date and reliable datasets related to health care. The Ministry will publish detailed information about the methods of data collection, as well as indicators on the relevance of data. The Ministry will also publicly support the concept of better data publication through stronger commitments and policies.
Media
The program intends to see more and better quality investigative and data journalism based on the data about health care providers. The media will provide more thorough and fairer coverage of the current state of the health system in Uruguay, and there will be an improved public debate about the national health system.
Governmental standard-
setting bodies
The program intends to see government standard-setting bodies commit to improved data publication in the long term and introduce clear and strong data standards. There will be sufficient institutional capacity for implementing Open Data/Open Government policies across the state, and governmental agencies will form more in-depth collaborations with civil society to shape the open government agenda.
International organizations and funders
The program intends to see international organizations and donors provide more funding to civil society programs built around open data in Uruguay, as well as enough leeway to experiment with new ideas. International organizations and donors will support and leverage negotiations with the Uruguayan government and also serve as validators of open data projects. They will be more supportive of exploring potential partnerships between CSOs and better promote the replication potential of open data projects.
Civic entrepreneurs and
CSOs
The program intends to see civic entrepreneurs and civil society organizations in Uruguay better engage in the Open Government/Open Data movement and improve their data literacy skills. They will use technology to more efficiently achieve their goals and to broaden participation.
Consumer/user
associations
The program intends to see consumer and user associations contribute to the creation of a more active citizenship that demands government data, in order for them to make more informed choices and to better monitor the health care system. Consumer and user associations will support civil society to advocate for more and better datasets and also contribute to the national public debate on data publication.
Researchers
The program intends to see researchers provide more evaluation on the impact of data publication within the health care sector, and contribute to the creation of a new field of civic technology and digital transparency. Researchers in Uruguay will disseminate their findings among the policy community and other stakeholder groups, and, thus, serve as a bridge between those communities.
Table 9: Outcome Challenges: A Tu Servicio
28
Indicators of change As explained in the methodology section, once the boundary partners and outcome challenges had been identified, the A Tu Servicio team collected milestones for each boundary partner to show the complexity of the change process associated with each boundary partner and to represent the information that the program can gather in order to monitor achievements toward the desired outcome. The workshop participants then turned to organizational practices and created a potential strategy map for each boundary partner and outcome challenge. Sunlight’s research team then developed a set of social change indicators based on the identified progress markers. After the research phase is over, we will conduct another round of group interviews with DATA Uruguay to identify the organizational metrics and data collection methods for documenting the boundary partner’s achievements to the desired outcome and the organization’s progress toward the vision. Table 10 provides a detailed breakdown for the change indicators created for one of the boundary partners of A Tu Servicio (the Health Ministry). For the rest of the indicators developed for A Tu Servicio's boundary partners, see Annex II. For a more detailed explanation on the methodology, see Section II.
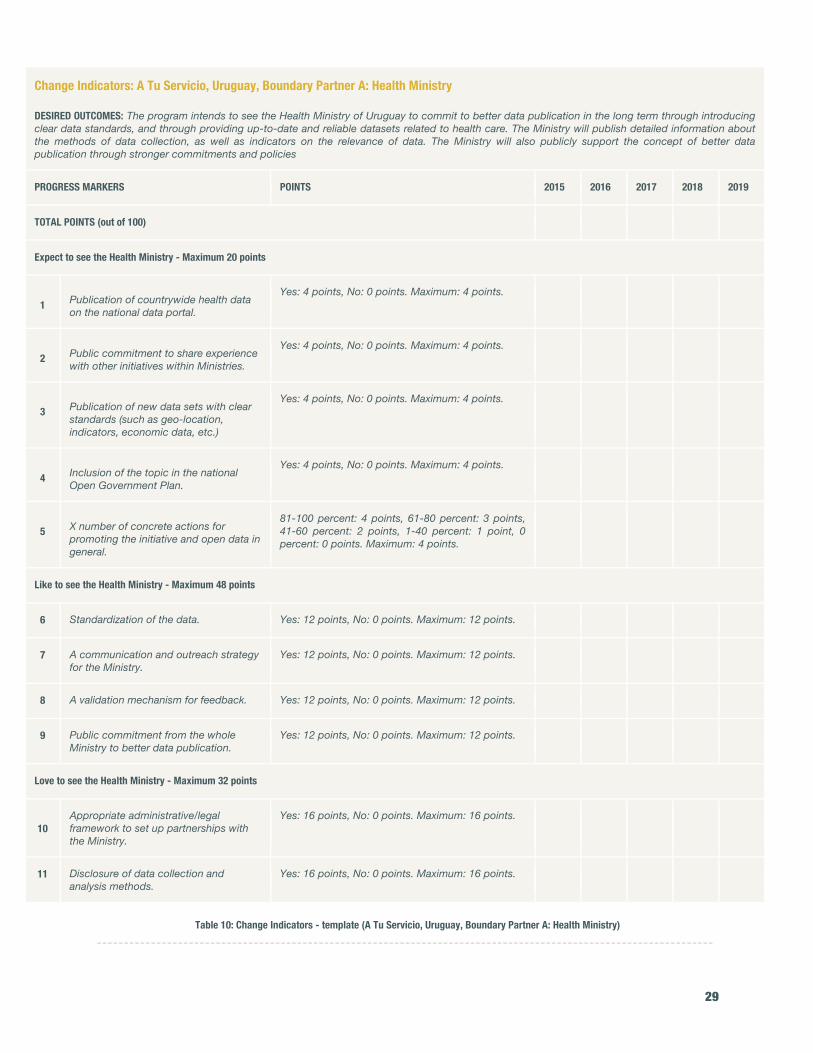
29
Change Indicators: A Tu Servicio, Uruguay, Boundary Partner A: Health Ministry DESIRED OUTCOMES: The program intends to see the Health Ministry of Uruguay to commit to better data publication in the long term through introducing clear data standards, and through providing up-to-date and reliable datasets related to health care. The Ministry will publish detailed information about the methods of data collection, as well as indicators on the relevance of data. The Ministry will also publicly support the concept of better data publication through stronger commitments and policies
PROGRESS MARKERS POINTS 2015 2016 2017 2018 2019
TOTAL POINTS (out of 100)
Expect to see the Health Ministry - Maximum 20 points
1 Publication of countrywide health data
on the national data portal.
Yes: 4 points, No: 0 points. Maximum: 4 points.
2 Public commitment to share experience
with other initiatives within Ministries.
Yes: 4 points, No: 0 points. Maximum: 4 points.
3 Publication of new data sets with clear
standards (such as geo-location, indicators, economic data, etc.)
Yes: 4 points, No: 0 points. Maximum: 4 points.
4 Inclusion of the topic in the national
Open Government Plan.
Yes: 4 points, No: 0 points. Maximum: 4 points.
5 X number of concrete actions for
promoting the initiative and open data in general.
81-100 percent: 4 points, 61-80 percent: 3 points, 41-60 percent: 2 points, 1-40 percent: 1 point, 0 percent: 0 points. Maximum: 4 points.
Like to see the Health Ministry - Maximum 48 points
6 Standardization of the data. Yes: 12 points, No: 0 points. Maximum: 12 points.
7 A communication and outreach strategy for the Ministry.
Yes: 12 points, No: 0 points. Maximum: 12 points.
8 A validation mechanism for feedback. Yes: 12 points, No: 0 points. Maximum: 12 points.
9 Public commitment from the whole Ministry to better data publication.
Yes: 12 points, No: 0 points. Maximum: 12 points.
Love to see the Health Ministry - Maximum 32 points
10
Appropriate administrative/legal framework to set up partnerships with the Ministry.
Yes: 16 points, No: 0 points. Maximum: 16 points.
11 Disclosure of data collection and analysis methods.
Yes: 16 points, No: 0 points. Maximum: 16 points.
Table 10: Change Indicators - template (A Tu Servicio, Uruguay, Boundary Partner A: Health Ministry)
------------------------------------------------------------------------------------------------------------------
30
Conclusions Strong evidence on the long-term impact of open data initiatives is incredibly scarce. The lack of compelling proof is partly due to the relative novelty of the open government field, but also to the inherent difficulties in measuring good governance and social change. Open data initiatives cannot be described through simple “cause and effect” relationships, as they mostly achieve changes through their contribution to outcomes produced by a complex ecosystem of stakeholders, including journalists, think tanks, civil society organizations, public officials and many more – making it even more challenging to measure their direct impact. This paper from the Sunlight Foundation intended to tackle some of the methodological challenges through building an evidence base that can empower further generalizations and advocacy efforts in the open government field; as well as developing a methodological framework to unpack theories of change and to evaluate the impact of open data and digital transparency initiatives. The outputs of our research include:
• A searchable repository of more than 100 examples on the outputs, outcomes and impacts of open data and digital technology projects;
• Three distinctive theories of change for open data and digital transparency initiatives from the Global South; • A methodological framework to help develop more robust indicators of social and political change for the
ecosystem of open data initiatives, by applying and revising the approach of Outcome Mapping to the field. The case stories we collected aim to illustrate the social impact of open data and digital transparency initiatives in different countries, cities and communities. We gathered examples on how users are empowered by open government initiatives, and how open data and digital transparency projects are changing the behavior, relationships, activities and actions of users. Instead of basic project descriptions and mere output, we wanted to seek evidence on how open data and technology help to influence governance and improve lives, both directly and indirectly. After reviewing the examples, our research team compiled the data to form a database with basic facts, short descriptions and links, and categorized the repository into a couple of significant fields/sectors. The database is a living document and available at: https://docs.google.com/spreadsheets/d/1jP6WIkEPczb8MBn6DNOU2PhKp9Prwe4HokqhUQVsxE0/edit#gid=0. From the 136 case stories in the repository, 74 were from the Global North, 53 from the Global South, while nine claimed they had an impact on countries from both major regions. For the sake of our research, we defined open data initiatives as projects using data that can be freely used, reused and redistributed by anyone. After filtering all the cases, we had a total of 110 open data initiatives in our repository, with 64 cases from the Global North, 37 from the Global South and nine with impact on both regions. The most common type of open data initiatives focused on legislatures, elections and elected officials; budget and spending information (including procurements); open data portals; business; environment; the judiciary; extractive industries; health and lobbying. Not surprisingly, the submitted case stories to our repository approached ‘impact’ in various different ways, ranging from mere output (such as publishing X amount of raw data), through mid-term outcomes (through for instance increasing participation in a democratic process), to long-lasting impact (such as increasing social equity). In some cases, the descriptions focused on short-term outputs only, even when the project does seem to achieve long-lasting change, while other cases claimed impact without credible proof on attribution. While acknowledging that the open government and open data agenda is much broader than the scope of our repository, based on the case stories, we identified a few potential benefit categories for project outcomes in the open government space. The identified outcome categories are the following:
1) Educate or inform citizens so that they can make more informed choices, 2) Promote direct civic engagement and increase citizen participation in democratic processes, 3) Gather feedback for policy-makers and/or the private sector, and, 4) Monitor and hold officials and/or the private sector accountable.
31
In the second phase of our research, we selected three projects from the Global South: Vota Inteligente from Chile, Open Duka from Kenya and A Tu Servicio from Uruguay to work more closely with. All three projects have been developed by CSOs, and build on open data in the areas of legislatures, elections and elected officials (Chile), business and procurements (Kenya) and health (Uruguay). We developed a methodological framework to build distinctive theories of change for all three projects, as well as a set of social change indicators, through testing and revising the approach of Outcome Mapping. When creating the indicators, we used a revised version of the Outcome Mapping rating scheme.
Next steps Assessing impact means we should be able to prove if there has been some kind of change in the ecosystem. Whether that change is “good” or “bad” will always depend on a normative position, while attribution is incredibly challenging – let alone impossible – for most open government projects. The Outcome Mapping approach – as well as other robust evaluation methods – has a strong potential for the long-term evaluation of complex projects through detecting and documenting the desired change model in the behaviors, relationships and activities of people and organizations an open data initiative interacts with. It might also provide a good framework for identifying other research methods (such as randomized control trials or quantitative surveys) to prove causality. Our aim with the repository has been to boost the conversation around impact assessment in the open government field, as well as to provide a base for advocacy purposes, and maybe further research. The authors of this paper believe that focusing on mid-term outcomes as opposed to long-term impact or short-term output might be the right next step for the open data community, in order to create a solid base for evaluation. We also think that further work is needed to develop clear change models for most of the submitted case stories. Furthermore, more research is needed to refine the assessment frameworks designed for the investigated open data projects. After the launch of this paper, Sunlight’s international policy team intends to conduct another round of group interviews with the three implementing teams to make some adjustments to the social change indicators developed for their projects, to identify organizational metrics and to define the data collection methods for documenting the boundary partner’s achievements to the desired outcome, as well as the organization’s progress toward the vision. The project implementing groups will have to define what they will monitor on an ongoing basis and what they will evaluate in depth in the next few years. In each case, they will have to revisit the indicators on a regular basis for the best impact. ------------------------------------------------------------------------------------------------------------------
32
Bibliography Anderson, A. (2005). The community builder's approach to theory of change: A practical guide to theory and development. New York: The Aspen Institute Roundtable on Community Change. Belbis, J. I. (2014). Vota Inteligente: Ciudadano Inteligente’s Flagship. Fundación Ciudadano Inteligente Chambers, L. (2015). Utopian and Dystopian Theories of Change - A Template. Tech to Human. Retrieved from http://techtohuman.com/theory_of_change/ Clark, H. & Anderson, A. (2004). Theories of Change and Logic Models: Telling Them Apart [PowerPoint]. Retrieved from http://www.theoryofchange.org/wp-content/uploads/toco_library/pdf/TOCs_and_Logic_Models_forAEA.pdf Coe, J. & Majot, J. (2013). Monitoring, Evaluating and Learning in NGO Advocacy: Findings from Comparative Policy Advocacy MEL Review Project. Overseas Development Institute & Oxfam. Retrieved from http://www.oxfamamerica.org/static/media/files/mel-in-ngo-advocacy-full-report.pdf Davis, R. & Dart, J. (2005). The ‘Most Significant Change’ (MSC) Technique: A Guide to Its Use. CARE International. Retrieved from http://www.mande.co.uk/docs/MSCGuide.pdf Davis, T. (2013). Notes on open government data evaluation and assessment frameworks. Open Data Impacts. Retrieved from http://www.opendataimpacts.net/2013/02/506/
Gibson, R., Cantijoch, M. & Galandini, S. (2014). The Third Sector and Online Citizen Empowerment: the Case of mySociety. University of Manchester. Retrieved from https://www.mysociety.org/files/2014/12/manchester.pdf
Green, A. (2013). The Impact of Opening up Lobbying Data. Sunlight Foundation. Retrieved from http://sunlightfoundation.com/blog/2013/05/10/the-impact-of-opening-up-lobbying-data/ Green, A. (2013). The Impact of Opening up Municipal Campaign Finance Data. Sunlight Foundation. Retrieved from http://sunlightfoundation.com/blog/2013/10/25/the-impact-of-opening-up-municipal-campaign-finance-data/ Guijt, I. (2007). Assessing and Learning for Social Change: A Discussion Paper. Institute of Development Studies. Retrieved from http://www.ids.ac.uk/files/dmfile/ASClowresfinalversion.pdf Heath, T. (2014). ODI Research Priorities for 2014. Open Data Institute. Retrieved from http://theodi.org/blog/odi-research-priorities-for-2014 Jalipa, R. (2014). Kenya: Clear Need to Respect the Right of Access to Information. Freedominfo.org. Retrieved from http://www.freedominfo.org/2014/10/kenyan-development-makes-clear-need-respect-right-access-information/ Keserű, J. (2015). Help us build an evidence base on the social impact of open data. Sunlight Foundation. Retrieved from http://sunlightfoundation.com/blog/2015/01/23/help-us-build-an-evidence-base-on-the-social-impact-of-open-data/ McGee, R. & Gaventa J. (2010). Synthesis Report on Review of Impact and Effectiveness of Transparency and Accountability Initiatives. Institute of Development Studies. Retrieved from https://www.ids.ac.uk/files/dmfile/IETASynthesisReportMcGeeGaventaFinal28Oct2010.pdf McGovern, G. & Greenberg, M. (2014). Shining a Light on State Campaign Finance. RAND Corporation. New York University (2014). Towards common methods for assessing open data: workshop report & draft framework. Retrieved from http://opendataresearch.org/sites/default/files/posts/Common percent20Assessment percent20Workshop percent20Report.pdf

33
Open Data Research Network (n.d.) Open Data Research Network Bibliography. Retrieved from http://opendataresearch.org/news/2015/mapping-existing-open-data-research Open Knowledge Foundation. (n.d.). Global Initiative for Fiscal Transparency Report. Retrieve from http://community.openspending.org/research/gift/ Open Knowledge Foundation (n.d.). Open Data Handbook. Retrieved from http://opendatahandbook.org/en/what-is-open-data/ Open Knowledge Foundation (n.d.). Open Definition ver 2.0. Retrieved from http://opendefinition.org/od/ Pande, R. (2011). Can Informed Voters Enforce Better Governance? Experiments in Low-Income Democracies. Annual Review of Economic. Retrieved from http://economics.annualreviews.org Schedler, A., Diamond, L. & Plattner, M.F. (Eds) (1999). The Self-restraining State: Power and Accountability in New Democracies. Boulder, US: Lynne Rienner. Stachowiak, S (n.d.). Pathways for Change: 6 Theories about How Policy Change Happens. Organizational Research Services. Organizational Research Services. Retrieved from http://www.organizationalresearch.com/publicationsandresources/pathways_for_change_6_theories_about_how_policy_change_happens.pdf Taylor-Powell, E., Jones, L. & Henert, E. (2003). Enhancing Program Performance with Logic Models. University of Wisconsin-Extension. Retrieved from http://www.uwex.edu/ces/pdande/evaluation/pdf/lmcourseall.pdf Ubaldi, B. (2013), “Open Government Data: Towards Empirical Analysis of Open Government Data Initiatives”, OECD Working Papers on Public Governance, No. 22, OECD Publishing. "Retrieved from http://dx.doi.org/10.1787/5k46bj4f03s7-en UNDP (2004). Forging a Global South: United Nations Day for South-South Cooperation. Retrieved from http://www.ctc-health.org.cn/file/2012060807.pdf Verhulst, S., Noveck, B., Caplan, R., Brown, K. & Paz, C. (2014). The Open Data Era in Health and Social Care. Retrieved from http://images.thegovlab.org/wordpress/wp-content/uploads/2014/10/nhs-full-report-21.pdf World Wide Web Foundation (2015). Open Data Barometer Global Report: Second Edition. Retrieved from http://www.opendatabarometer.org/assets/downloads/Open percent20Data percent20Barometer percent20- percent20Global percent20Report percent20- percent202nd percent20Edition percent20- percent20PRINT.pdf Zuiderwijk, A. & Janssen, M. (2013). Open data policies, their implementation and impact: A framework for comparison. Government Information Quarterly. 31(1), p.17-29. Retrieved from http://www.sciencedirect.com/science/article/pii/S0740624X13001202

34
ANNEX I: Outcome Mapping workshop questions Historical scan
● What are the key events (positive or negative) in the past for your project? What do you think has the project accomplished since its existence? What has the project failed to accomplish yet?
● What are the key events (both positive or negative milestones) in the past 5 years that were important to you? Professionally? Organizationally? Nationally? Globally? Personally?
● What do you personally like the most about the project? Vision
● Picture your project three to five years from now and imagine that it has been extremely successful in developing and implementing its activities. In this ideal situation, assuming everything went well, what changes did it help to bring about? What does the ideal world look like from your project's perspective? What have your target groups, major beneficiaries and partner groups achieved? What are they doing differently? In other words, what would total success look like? Think about changes in procedure or content (such as written policies), discourse (such as language) or behavior and attitudes.
Mission
● Given the vision you described above, how can your organization best contribute to the success of your project? What areas do you need to work in to promote and support the realization of the vision? What else do you think you need to do as an organization to best accomplish this vision?
Key boundary partners
● What individuals, organizations or groups will your project need to work with to effect these changes? Who will you work with most directly? Who can help or hinder your work? Who are the ultimate beneficiaries? Focus on the actors with whom your project works directly (or should be working directly!) and actors that the program tries to have an impact on.
Outcome challenges (for each boundary partner)
● Ideally, in order to contribute to the vision, how will the boundary partner be behaving or acting differently? What new relationships will have been formed? How will existing ones change? Focus on the effects of the program “being there,” with an emphasis on how actors behave as a result of being reached. An outcome challenge describes how the behavior, relationships, activities or actions of an individual, group or institution will change if the program is extremely successful.
Progress markers (for each boundary partner) ● How can the program know that the boundary partner is moving towards the outcome? What milestones will
be reached as the boundary partners move towards their intended role in contributing to the vision? Try to think of changes in behavior, activities or relationships that would happen early on, as well as those that represent deeper change and take more time.
Strategy map
● How will the program contribute to the achievement of the outcome challenge in the next 12 months? Think about both the changes in the environment and the changes aimed directly at specific groups. These can be new strategies or, if applicable, ones that are already being used. The purpose of the strategy map is to identify the strategies used by the program to contribute to the achievement of an outcome.
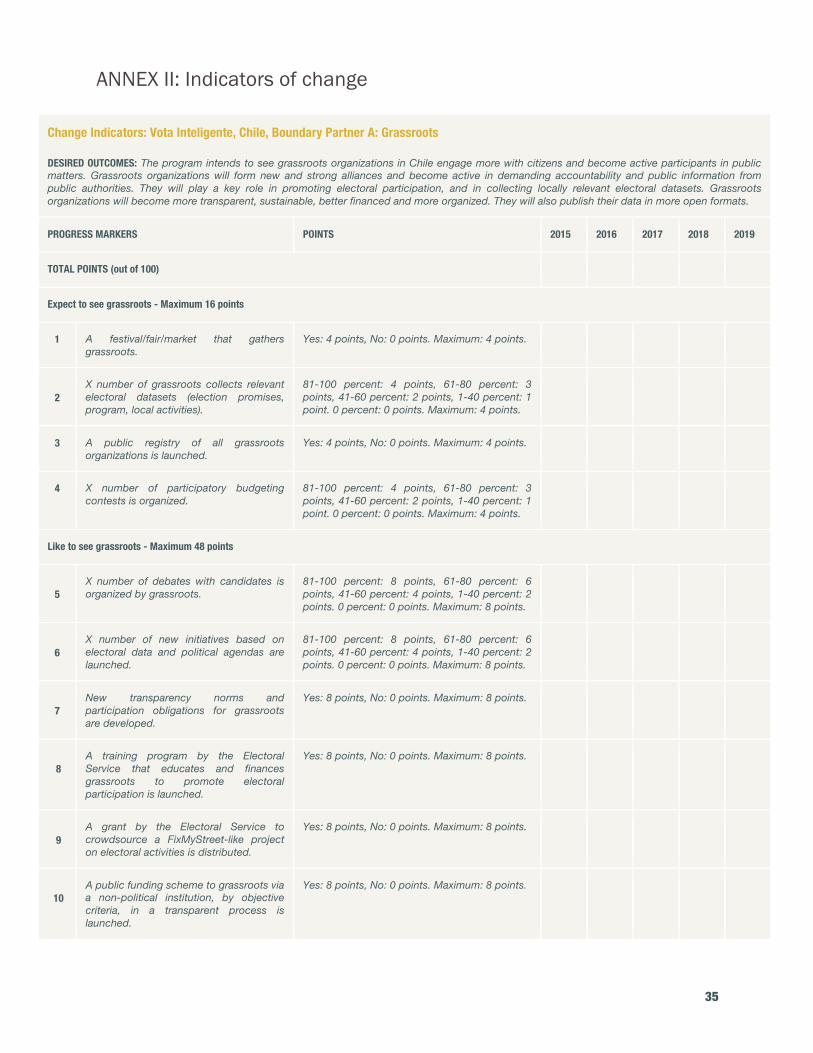
35
ANNEX II: Indicators of change
Change Indicators: Vota Inteligente, Chile, Boundary Partner A: Grassroots DESIRED OUTCOMES: The program intends to see grassroots organizations in Chile engage more with citizens and become active participants in public matters. Grassroots organizations will form new and strong alliances and become active in demanding accountability and public information from public authorities. They will play a key role in promoting electoral participation, and in collecting locally relevant electoral datasets. Grassroots organizations will become more transparent, sustainable, better financed and more organized. They will also publish their data in more open formats.
PROGRESS MARKERS POINTS 2015 2016 2017 2018 2019
TOTAL POINTS (out of 100)
Expect to see grassroots - Maximum 16 points
1 A festival/fair/market that gathers grassroots.
Yes: 4 points, No: 0 points. Maximum: 4 points.
2
X number of grassroots collects relevant electoral datasets (election promises, program, local activities).
81-100 percent: 4 points, 61-80 percent: 3 points, 41-60 percent: 2 points, 1-40 percent: 1 point. 0 percent: 0 points. Maximum: 4 points.
3 A public registry of all grassroots organizations is launched.
Yes: 4 points, No: 0 points. Maximum: 4 points.
4 X number of participatory budgeting contests is organized.
81-100 percent: 4 points, 61-80 percent: 3 points, 41-60 percent: 2 points, 1-40 percent: 1 point. 0 percent: 0 points. Maximum: 4 points.
Like to see grassroots - Maximum 48 points
5
X number of debates with candidates is organized by grassroots.
81-100 percent: 8 points, 61-80 percent: 6 points, 41-60 percent: 4 points, 1-40 percent: 2 points. 0 percent: 0 points. Maximum: 8 points.
6
X number of new initiatives based on electoral data and political agendas are launched.
81-100 percent: 8 points, 61-80 percent: 6 points, 41-60 percent: 4 points, 1-40 percent: 2 points. 0 percent: 0 points. Maximum: 8 points.
7
New transparency norms and participation obligations for grassroots are developed.
Yes: 8 points, No: 0 points. Maximum: 8 points.
8
A training program by the Electoral Service that educates and finances grassroots to promote electoral participation is launched.
Yes: 8 points, No: 0 points. Maximum: 8 points.
9
A grant by the Electoral Service to crowdsource a FixMyStreet-like project on electoral activities is distributed.
Yes: 8 points, No: 0 points. Maximum: 8 points.
10
A public funding scheme to grassroots via a non-political institution, by objective criteria, in a transparent process is launched.
Yes: 8 points, No: 0 points. Maximum: 8 points.
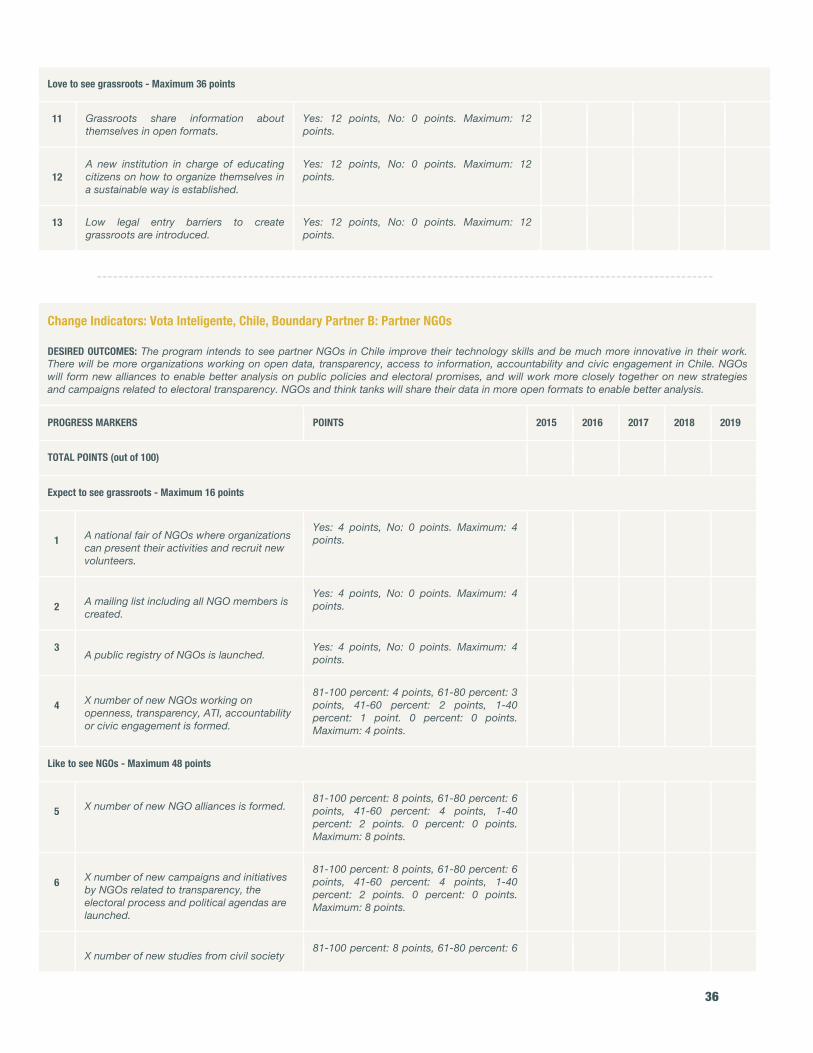
36
Love to see grassroots - Maximum 36 points
11 Grassroots share information about themselves in open formats.
Yes: 12 points, No: 0 points. Maximum: 12 points.
12
A new institution in charge of educating citizens on how to organize themselves in a sustainable way is established.
Yes: 12 points, No: 0 points. Maximum: 12 points.
13 Low legal entry barriers to create grassroots are introduced.
Yes: 12 points, No: 0 points. Maximum: 12 points.
------------------------------------------------------------------------------------------------------------------
Change Indicators: Vota Inteligente, Chile, Boundary Partner B: Partner NGOs DESIRED OUTCOMES: The program intends to see partner NGOs in Chile improve their technology skills and be much more innovative in their work. There will be more organizations working on open data, transparency, access to information, accountability and civic engagement in Chile. NGOs will form new alliances to enable better analysis on public policies and electoral promises, and will work more closely together on new strategies and campaigns related to electoral transparency. NGOs and think tanks will share their data in more open formats to enable better analysis.
PROGRESS MARKERS POINTS 2015 2016 2017 2018 2019
TOTAL POINTS (out of 100)
Expect to see grassroots - Maximum 16 points
1 A national fair of NGOs where organizations
can present their activities and recruit new volunteers.
Yes: 4 points, No: 0 points. Maximum: 4 points.
2 A mailing list including all NGO members is
created.
Yes: 4 points, No: 0 points. Maximum: 4 points.
3 A public registry of NGOs is launched.
Yes: 4 points, No: 0 points. Maximum: 4 points.
4 X number of new NGOs working on
openness, transparency, ATI, accountability or civic engagement is formed.
81-100 percent: 4 points, 61-80 percent: 3 points, 41-60 percent: 2 points, 1-40 percent: 1 point. 0 percent: 0 points. Maximum: 4 points.
Like to see NGOs - Maximum 48 points
5 X number of new NGO alliances is formed.
81-100 percent: 8 points, 61-80 percent: 6 points, 41-60 percent: 4 points, 1-40 percent: 2 points. 0 percent: 0 points. Maximum: 8 points.
6 X number of new campaigns and initiatives
by NGOs related to transparency, the electoral process and political agendas are launched.
81-100 percent: 8 points, 61-80 percent: 6 points, 41-60 percent: 4 points, 1-40 percent: 2 points. 0 percent: 0 points. Maximum: 8 points.
X number of new studies from civil society
81-100 percent: 8 points, 61-80 percent: 6
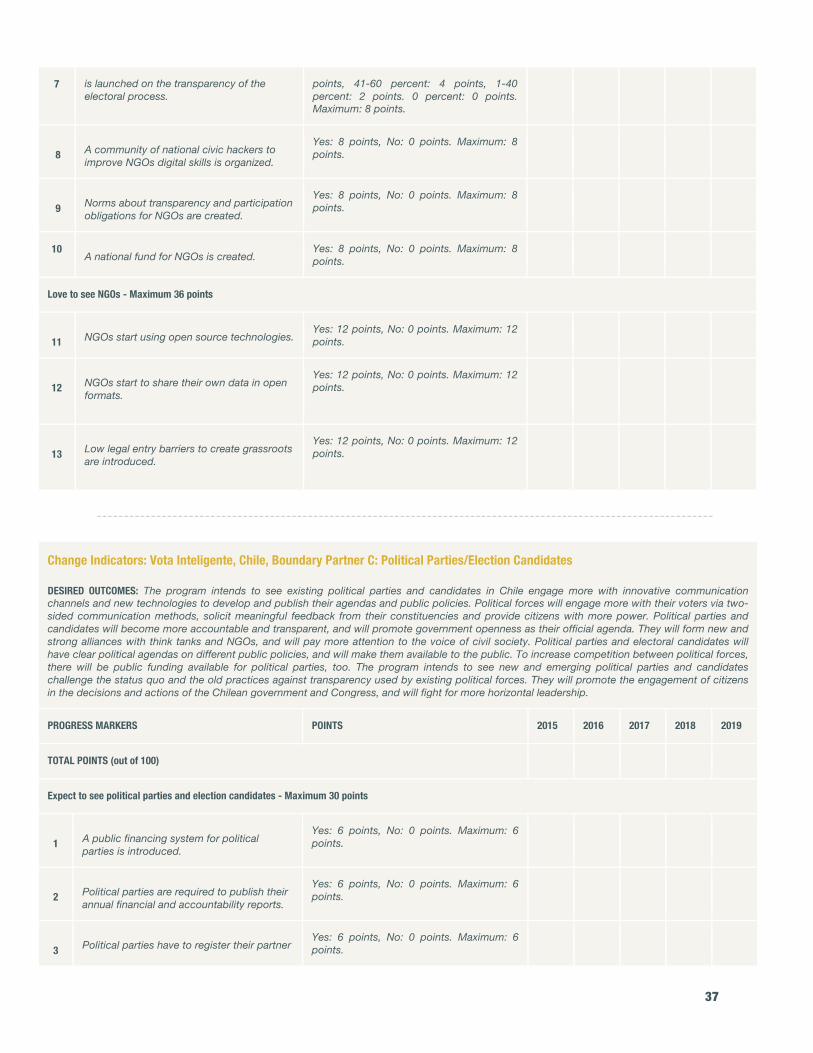
37
7 is launched on the transparency of the electoral process.
points, 41-60 percent: 4 points, 1-40 percent: 2 points. 0 percent: 0 points. Maximum: 8 points.
8 A community of national civic hackers to
improve NGOs digital skills is organized.
Yes: 8 points, No: 0 points. Maximum: 8 points.
9 Norms about transparency and participation
obligations for NGOs are created.
Yes: 8 points, No: 0 points. Maximum: 8 points.
10 A national fund for NGOs is created.
Yes: 8 points, No: 0 points. Maximum: 8 points.
Love to see NGOs - Maximum 36 points
11 NGOs start using open source technologies.
Yes: 12 points, No: 0 points. Maximum: 12 points.
12 NGOs start to share their own data in open
formats.
Yes: 12 points, No: 0 points. Maximum: 12 points.
13 Low legal entry barriers to create grassroots
are introduced.
Yes: 12 points, No: 0 points. Maximum: 12 points.
------------------------------------------------------------------------------------------------------------------
Change Indicators: Vota Inteligente, Chile, Boundary Partner C: Political Parties/Election Candidates DESIRED OUTCOMES: The program intends to see existing political parties and candidates in Chile engage more with innovative communication channels and new technologies to develop and publish their agendas and public policies. Political forces will engage more with their voters via two-sided communication methods, solicit meaningful feedback from their constituencies and provide citizens with more power. Political parties and candidates will become more accountable and transparent, and will promote government openness as their official agenda. They will form new and strong alliances with think tanks and NGOs, and will pay more attention to the voice of civil society. Political parties and electoral candidates will have clear political agendas on different public policies, and will make them available to the public. To increase competition between political forces, there will be public funding available for political parties, too. The program intends to see new and emerging political parties and candidates challenge the status quo and the old practices against transparency used by existing political forces. They will promote the engagement of citizens in the decisions and actions of the Chilean government and Congress, and will fight for more horizontal leadership.
PROGRESS MARKERS POINTS 2015 2016 2017 2018 2019
TOTAL POINTS (out of 100)
Expect to see political parties and election candidates - Maximum 30 points
1 A public financing system for political
parties is introduced.
Yes: 6 points, No: 0 points. Maximum: 6 points.
2 Political parties are required to publish their
annual financial and accountability reports.
Yes: 6 points, No: 0 points. Maximum: 6 points.
3 Political parties have to register their partner
Yes: 6 points, No: 0 points. Maximum: 6 points.
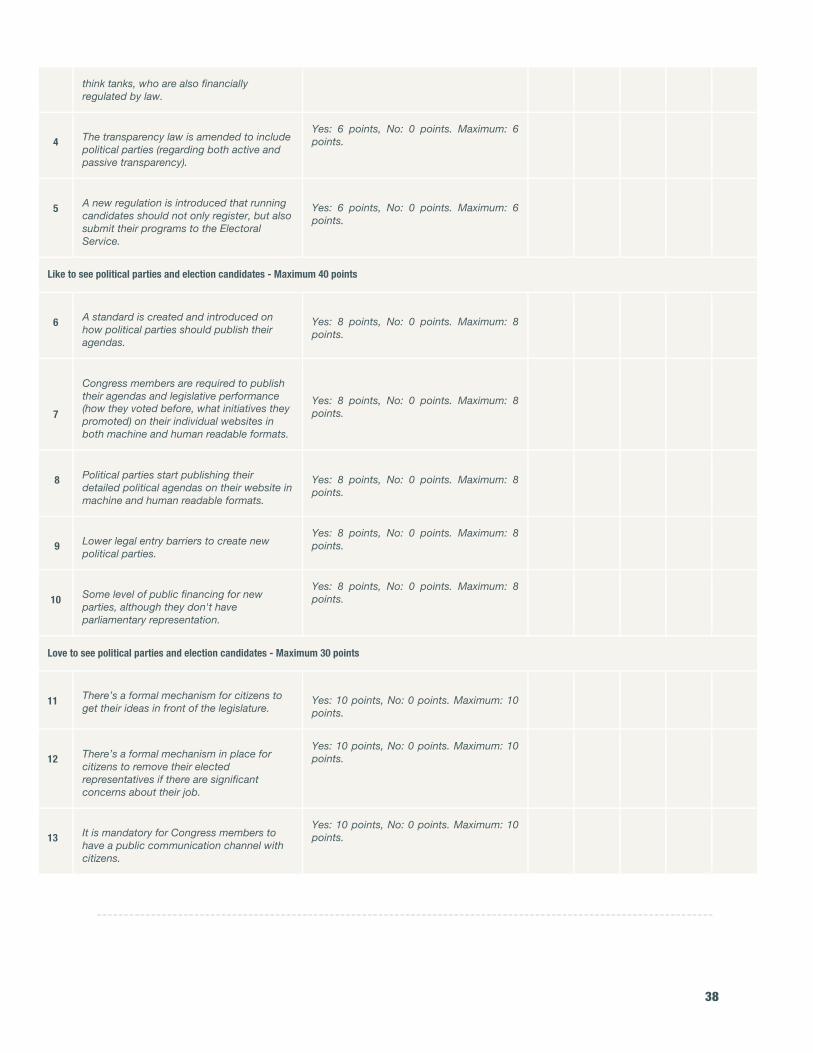
38
think tanks, who are also financially regulated by law.
4 The transparency law is amended to include
political parties (regarding both active and passive transparency).
Yes: 6 points, No: 0 points. Maximum: 6 points.
5 A new regulation is introduced that running
candidates should not only register, but also submit their programs to the Electoral Service.
Yes: 6 points, No: 0 points. Maximum: 6 points.
Like to see political parties and election candidates - Maximum 40 points
6 A standard is created and introduced on
how political parties should publish their agendas.
Yes: 8 points, No: 0 points. Maximum: 8 points.
7
Congress members are required to publish their agendas and legislative performance (how they voted before, what initiatives they promoted) on their individual websites in both machine and human readable formats.
Yes: 8 points, No: 0 points. Maximum: 8 points.
8 Political parties start publishing their
detailed political agendas on their website in machine and human readable formats.
Yes: 8 points, No: 0 points. Maximum: 8 points.
9 Lower legal entry barriers to create new
political parties.
Yes: 8 points, No: 0 points. Maximum: 8 points.
10 Some level of public financing for new
parties, although they don't have parliamentary representation.
Yes: 8 points, No: 0 points. Maximum: 8 points.
Love to see political parties and election candidates - Maximum 30 points
11 There’s a formal mechanism for citizens to
get their ideas in front of the legislature.
Yes: 10 points, No: 0 points. Maximum: 10 points.
12 There’s a formal mechanism in place for
citizens to remove their elected representatives if there are significant concerns about their job.
Yes: 10 points, No: 0 points. Maximum: 10 points.
13 It is mandatory for Congress members to
have a public communication channel with citizens.
Yes: 10 points, No: 0 points. Maximum: 10 points.
------------------------------------------------------------------------------------------------------------------
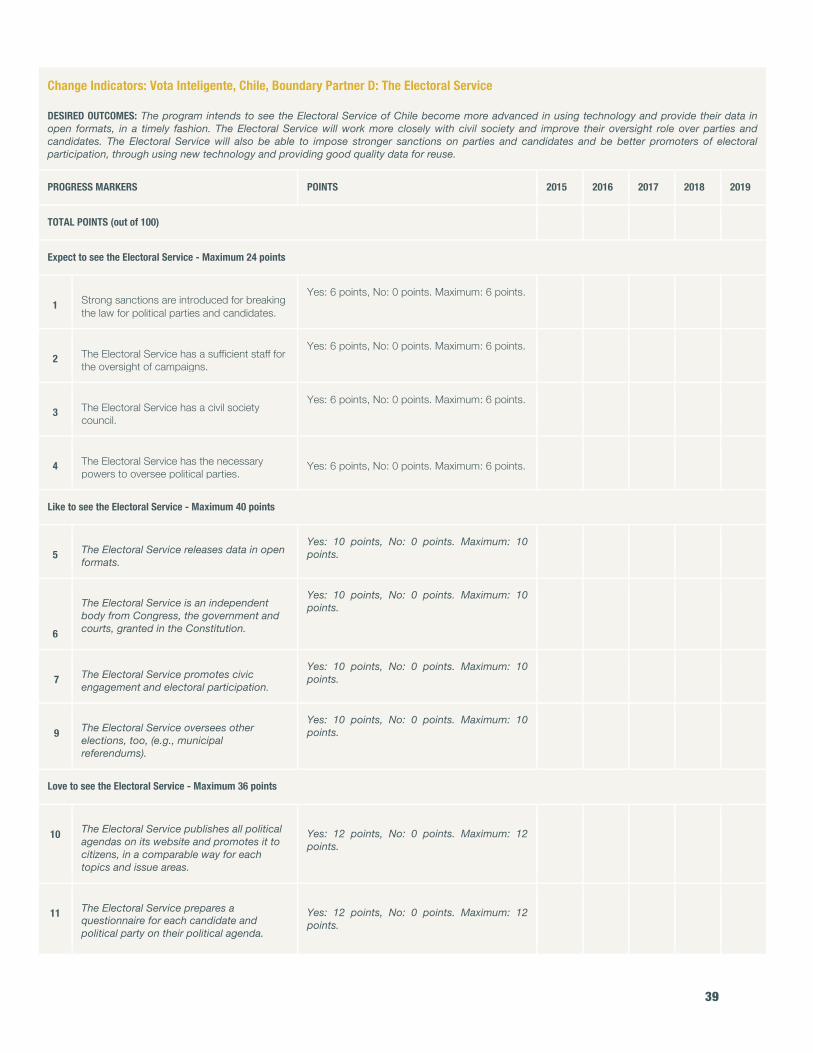
39
Change Indicators: Vota Inteligente, Chile, Boundary Partner D: The Electoral Service DESIRED OUTCOMES: The program intends to see the Electoral Service of Chile become more advanced in using technology and provide their data in open formats, in a timely fashion. The Electoral Service will work more closely with civil society and improve their oversight role over parties and candidates. The Electoral Service will also be able to impose stronger sanctions on parties and candidates and be better promoters of electoral participation, through using new technology and providing good quality data for reuse.
PROGRESS MARKERS POINTS 2015 2016 2017 2018 2019
TOTAL POINTS (out of 100)
Expect to see the Electoral Service - Maximum 24 points
1 Strong sanctions are introduced for breaking
the law for political parties and candidates.
Yes: 6 points, No: 0 points. Maximum: 6 points.
2 The Electoral Service has a sufficient staff for
the oversight of campaigns.
Yes: 6 points, No: 0 points. Maximum: 6 points.
3 The Electoral Service has a civil society
council.
Yes: 6 points, No: 0 points. Maximum: 6 points.
4 The Electoral Service has the necessary
powers to oversee political parties.
Yes: 6 points, No: 0 points. Maximum: 6 points.
Like to see the Electoral Service - Maximum 40 points
5 The Electoral Service releases data in open
formats.
Yes: 10 points, No: 0 points. Maximum: 10 points.
6
The Electoral Service is an independent body from Congress, the government and courts, granted in the Constitution.
Yes: 10 points, No: 0 points. Maximum: 10 points.
7 The Electoral Service promotes civic
engagement and electoral participation.
Yes: 10 points, No: 0 points. Maximum: 10 points.
9 The Electoral Service oversees other
elections, too, (e.g., municipal referendums).
Yes: 10 points, No: 0 points. Maximum: 10 points.
Love to see the Electoral Service - Maximum 36 points
10 The Electoral Service publishes all political
agendas on its website and promotes it to citizens, in a comparable way for each topics and issue areas.
Yes: 12 points, No: 0 points. Maximum: 12 points.
11 The Electoral Service prepares a
questionnaire for each candidate and political party on their political agenda.
Yes: 12 points, No: 0 points. Maximum: 12 points.
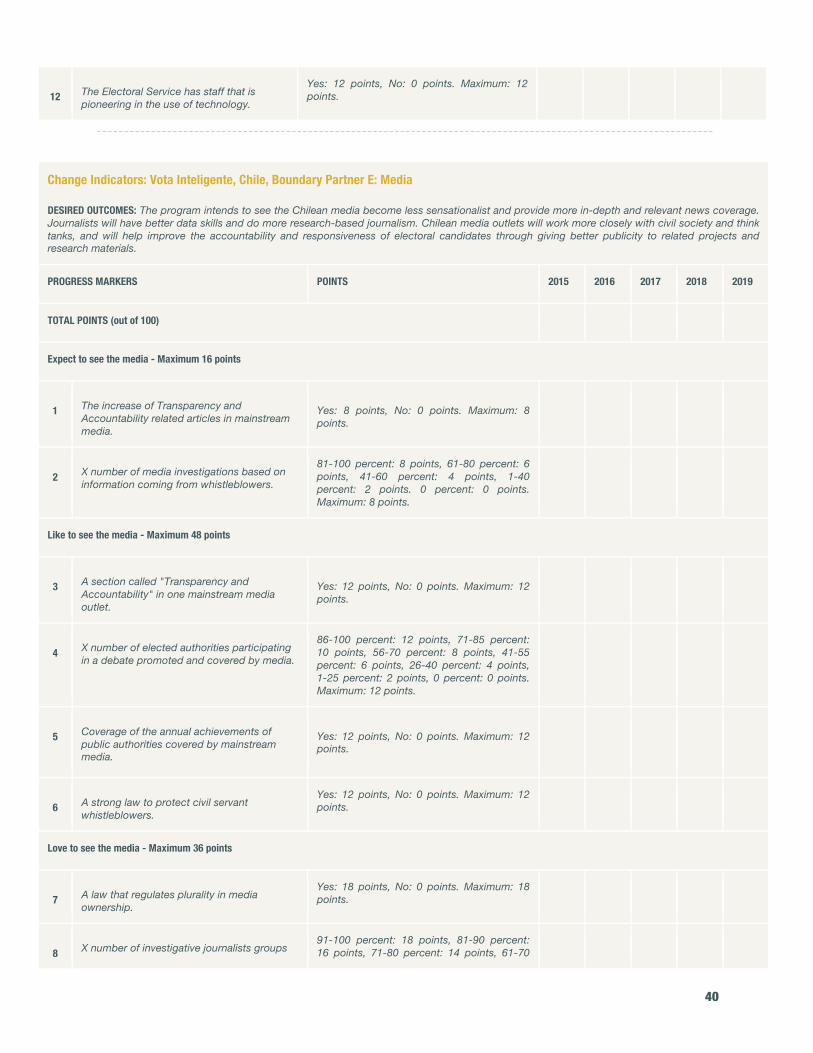
40
12 The Electoral Service has staff that is
pioneering in the use of technology.
Yes: 12 points, No: 0 points. Maximum: 12 points.
------------------------------------------------------------------------------------------------------------------
Change Indicators: Vota Inteligente, Chile, Boundary Partner E: Media DESIRED OUTCOMES: The program intends to see the Chilean media become less sensationalist and provide more in-depth and relevant news coverage. Journalists will have better data skills and do more research-based journalism. Chilean media outlets will work more closely with civil society and think tanks, and will help improve the accountability and responsiveness of electoral candidates through giving better publicity to related projects and research materials.
PROGRESS MARKERS POINTS 2015 2016 2017 2018 2019
TOTAL POINTS (out of 100)
Expect to see the media - Maximum 16 points
1 The increase of Transparency and
Accountability related articles in mainstream media.
Yes: 8 points, No: 0 points. Maximum: 8 points.
2 X number of media investigations based on
information coming from whistleblowers.
81-100 percent: 8 points, 61-80 percent: 6 points, 41-60 percent: 4 points, 1-40 percent: 2 points. 0 percent: 0 points. Maximum: 8 points.
Like to see the media - Maximum 48 points
3 A section called "Transparency and
Accountability" in one mainstream media outlet.
Yes: 12 points, No: 0 points. Maximum: 12 points.
4 X number of elected authorities participating
in a debate promoted and covered by media.
86-100 percent: 12 points, 71-85 percent: 10 points, 56-70 percent: 8 points, 41-55 percent: 6 points, 26-40 percent: 4 points, 1-25 percent: 2 points, 0 percent: 0 points. Maximum: 12 points.
5 Coverage of the annual achievements of
public authorities covered by mainstream media.
Yes: 12 points, No: 0 points. Maximum: 12 points.
6 A strong law to protect civil servant
whistleblowers.
Yes: 12 points, No: 0 points. Maximum: 12 points.
Love to see the media - Maximum 36 points
7 A law that regulates plurality in media
ownership.
Yes: 18 points, No: 0 points. Maximum: 18 points.
8 X number of investigative journalists groups
91-100 percent: 18 points, 81-90 percent: 16 points, 71-80 percent: 14 points, 61-70
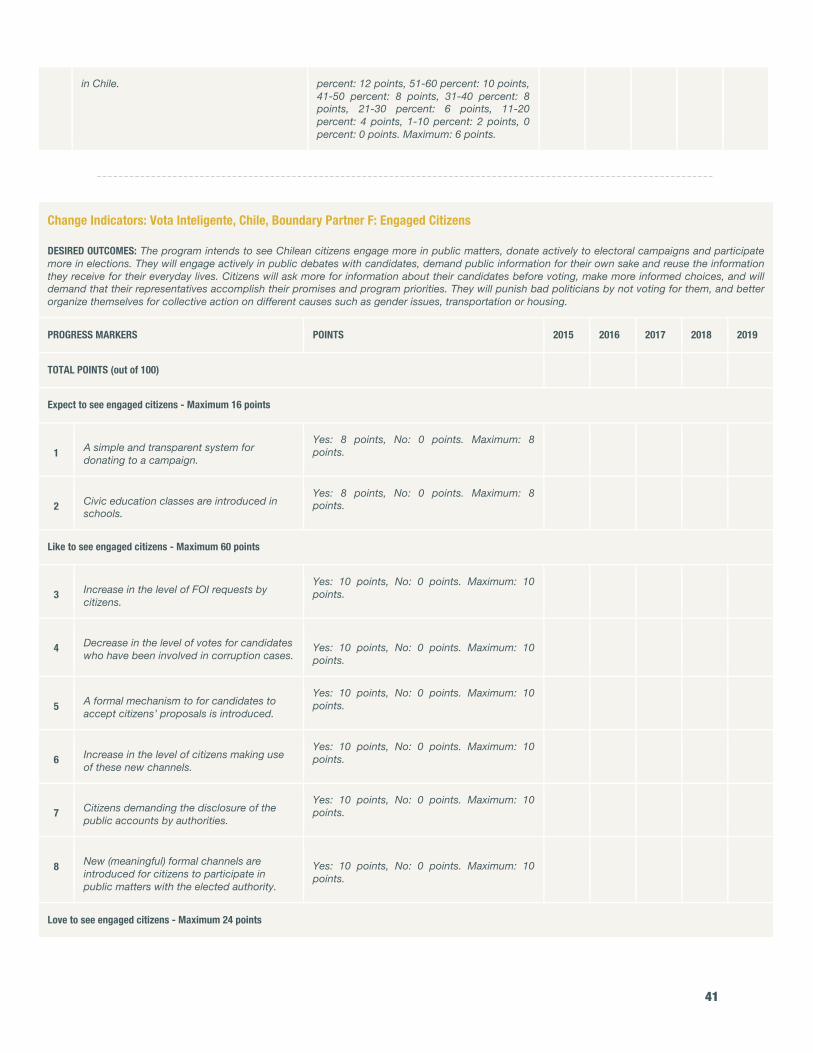
41
in Chile. percent: 12 points, 51-60 percent: 10 points, 41-50 percent: 8 points, 31-40 percent: 8 points, 21-30 percent: 6 points, 11-20 percent: 4 points, 1-10 percent: 2 points, 0 percent: 0 points. Maximum: 6 points.
------------------------------------------------------------------------------------------------------------------
Change Indicators: Vota Inteligente, Chile, Boundary Partner F: Engaged Citizens DESIRED OUTCOMES: The program intends to see Chilean citizens engage more in public matters, donate actively to electoral campaigns and participate more in elections. They will engage actively in public debates with candidates, demand public information for their own sake and reuse the information they receive for their everyday lives. Citizens will ask more for information about their candidates before voting, make more informed choices, and will demand that their representatives accomplish their promises and program priorities. They will punish bad politicians by not voting for them, and better organize themselves for collective action on different causes such as gender issues, transportation or housing.
PROGRESS MARKERS POINTS 2015 2016 2017 2018 2019
TOTAL POINTS (out of 100)
Expect to see engaged citizens - Maximum 16 points
1 A simple and transparent system for
donating to a campaign.
Yes: 8 points, No: 0 points. Maximum: 8 points.
2 Civic education classes are introduced in
schools.
Yes: 8 points, No: 0 points. Maximum: 8 points.
Like to see engaged citizens - Maximum 60 points
3 Increase in the level of FOI requests by
citizens.
Yes: 10 points, No: 0 points. Maximum: 10 points.
4 Decrease in the level of votes for candidates
who have been involved in corruption cases.
Yes: 10 points, No: 0 points. Maximum: 10 points.
5 A formal mechanism to for candidates to
accept citizens’ proposals is introduced.
Yes: 10 points, No: 0 points. Maximum: 10 points.
6 Increase in the level of citizens making use
of these new channels.
Yes: 10 points, No: 0 points. Maximum: 10 points.
7 Citizens demanding the disclosure of the
public accounts by authorities.
Yes: 10 points, No: 0 points. Maximum: 10 points.
8 New (meaningful) formal channels are
introduced for citizens to participate in public matters with the elected authority.
Yes: 10 points, No: 0 points. Maximum: 10 points.
Love to see engaged citizens - Maximum 24 points

42
9 Increase in the level of citizens
spontaneously getting together to form groups for causes that are not necessarily related to an election.
Yes: 12 points, No: 0 points. Maximum: 12 points.
10 Increase in the level of trust in the political
system and politicians.
Yes: 12 points, No: 0 points. Maximum: 12 points.
------------------------------------------------------------------------------------------------------------------
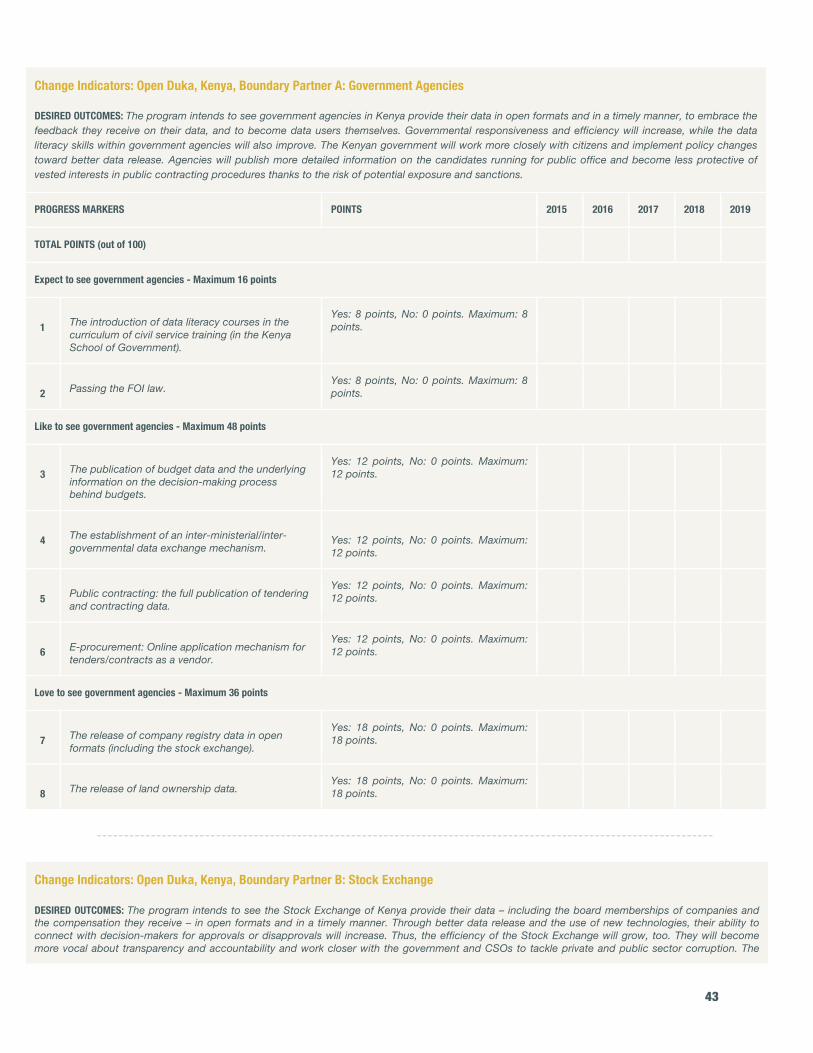
43
Change Indicators: Open Duka, Kenya, Boundary Partner A: Government Agencies DESIRED OUTCOMES: The program intends to see government agencies in Kenya provide their data in open formats and in a timely manner, to embrace the feedback they receive on their data, and to become data users themselves. Governmental responsiveness and efficiency will increase, while the data literacy skills within government agencies will also improve. The Kenyan government will work more closely with citizens and implement policy changes toward better data release. Agencies will publish more detailed information on the candidates running for public office and become less protective of vested interests in public contracting procedures thanks to the risk of potential exposure and sanctions.
PROGRESS MARKERS POINTS 2015 2016 2017 2018 2019
TOTAL POINTS (out of 100)
Expect to see government agencies - Maximum 16 points
1 The introduction of data literacy courses in the
curriculum of civil service training (in the Kenya School of Government).
Yes: 8 points, No: 0 points. Maximum: 8 points.
2 Passing the FOI law.
Yes: 8 points, No: 0 points. Maximum: 8 points.
Like to see government agencies - Maximum 48 points
3 The publication of budget data and the underlying
information on the decision-making process behind budgets.
Yes: 12 points, No: 0 points. Maximum: 12 points.
4 The establishment of an inter-ministerial/inter-
governmental data exchange mechanism.
Yes: 12 points, No: 0 points. Maximum: 12 points.
5 Public contracting: the full publication of tendering
and contracting data.
Yes: 12 points, No: 0 points. Maximum: 12 points.
6 E-procurement: Online application mechanism for
tenders/contracts as a vendor.
Yes: 12 points, No: 0 points. Maximum: 12 points.
Love to see government agencies - Maximum 36 points
7 The release of company registry data in open
formats (including the stock exchange).
Yes: 18 points, No: 0 points. Maximum: 18 points.
8 The release of land ownership data.
Yes: 18 points, No: 0 points. Maximum: 18 points.
------------------------------------------------------------------------------------------------------------------
Change Indicators: Open Duka, Kenya, Boundary Partner B: Stock Exchange DESIRED OUTCOMES: The program intends to see the Stock Exchange of Kenya provide their data – including the board memberships of companies and the compensation they receive – in open formats and in a timely manner. Through better data release and the use of new technologies, their ability to connect with decision-makers for approvals or disapprovals will increase. Thus, the efficiency of the Stock Exchange will grow, too. They will become more vocal about transparency and accountability and work closer with the government and CSOs to tackle private and public sector corruption. The
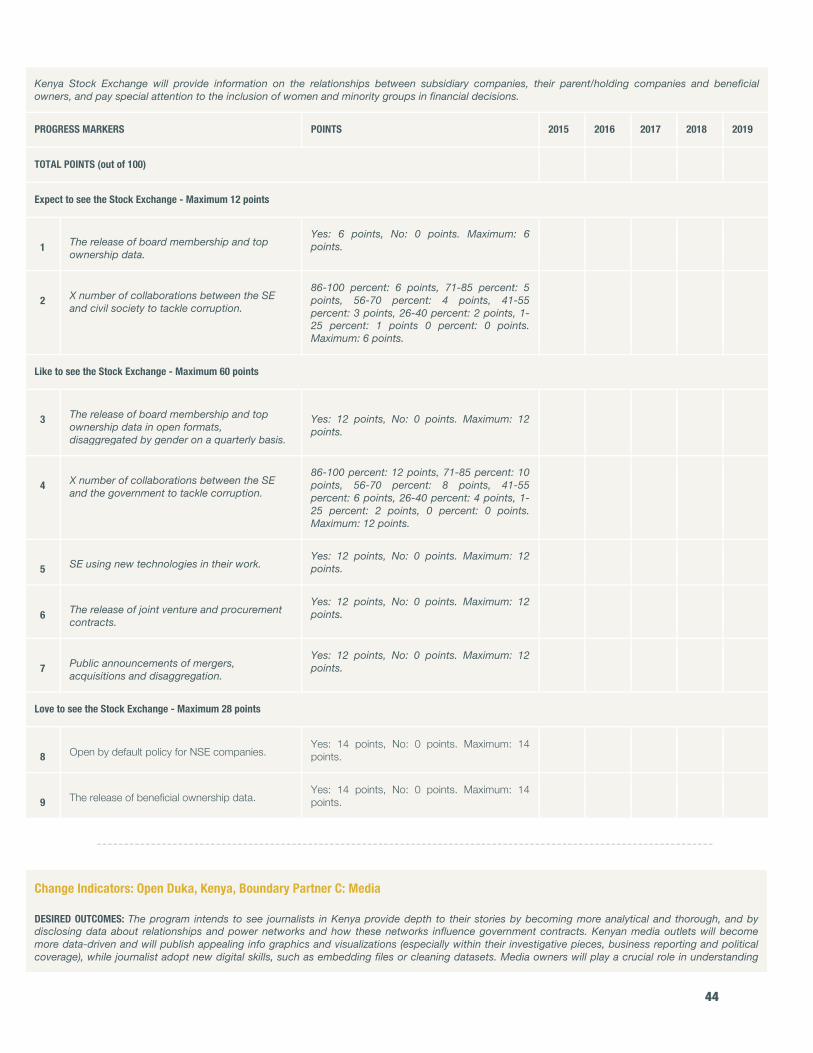
44
Kenya Stock Exchange will provide information on the relationships between subsidiary companies, their parent/holding companies and beneficial owners, and pay special attention to the inclusion of women and minority groups in financial decisions.
PROGRESS MARKERS POINTS 2015 2016 2017 2018 2019
TOTAL POINTS (out of 100)
Expect to see the Stock Exchange - Maximum 12 points
1 The release of board membership and top
ownership data.
Yes: 6 points, No: 0 points. Maximum: 6 points.
2 X number of collaborations between the SE
and civil society to tackle corruption.
86-100 percent: 6 points, 71-85 percent: 5 points, 56-70 percent: 4 points, 41-55 percent: 3 points, 26-40 percent: 2 points, 1-25 percent: 1 points 0 percent: 0 points. Maximum: 6 points.
Like to see the Stock Exchange - Maximum 60 points
3 The release of board membership and top
ownership data in open formats, disaggregated by gender on a quarterly basis.
Yes: 12 points, No: 0 points. Maximum: 12 points.
4 X number of collaborations between the SE
and the government to tackle corruption.
86-100 percent: 12 points, 71-85 percent: 10 points, 56-70 percent: 8 points, 41-55 percent: 6 points, 26-40 percent: 4 points, 1-25 percent: 2 points, 0 percent: 0 points. Maximum: 12 points.
5 SE using new technologies in their work.
Yes: 12 points, No: 0 points. Maximum: 12 points.
6 The release of joint venture and procurement
contracts.
Yes: 12 points, No: 0 points. Maximum: 12 points.
7 Public announcements of mergers,
acquisitions and disaggregation.
Yes: 12 points, No: 0 points. Maximum: 12 points.
Love to see the Stock Exchange - Maximum 28 points
8 Open by default policy for NSE companies.
Yes: 14 points, No: 0 points. Maximum: 14 points.
9 The release of beneficial ownership data.
Yes: 14 points, No: 0 points. Maximum: 14 points.
------------------------------------------------------------------------------------------------------------------
Change Indicators: Open Duka, Kenya, Boundary Partner C: Media DESIRED OUTCOMES: The program intends to see journalists in Kenya provide depth to their stories by becoming more analytical and thorough, and by disclosing data about relationships and power networks and how these networks influence government contracts. Kenyan media outlets will become more data-driven and will publish appealing info graphics and visualizations (especially within their investigative pieces, business reporting and political coverage), while journalist adopt new digital skills, such as embedding files or cleaning datasets. Media owners will play a crucial role in understanding

45
the power of new technologies and new ways of storytelling, and information about media ownership structures will become public. Media outlets will also provide the data they are gathering in more open formats, enabling further collaborations and tools. Journalists will play a crucial role in getting data keepers (such as government agencies) to release their data in better formats, proactively and in a timely fashion.
PROGRESS MARKERS POINTS 2015 2016 2017 2018 2019
TOTAL POINTS (out of 100)
Expect to see the media - Maximum 18 points
1 Tracking media players as they move from one
media house to the other.
Yes: 6 points, No: 0 points. Maximum: 6 points.
2 X number of consistent and visible collaborations
between journalists and developers on applications, tools, visualizations and infographics.
86-100 percent: 6 points, 71-85 percent: 5 points, 56-70 percent: 4 points, 41-55 percent: 3 points, 26-40 percent: 2 points, 1-25 percent: 1 point, 0 percent: 0 points. Maximum: 6 points.
3 X number of stories including data visualizations.
86-100 percent: 6 points, 71-85 percent: 5 points, 56-70 percent: 4 points, 41-55 percent: 3 points, 26-40 percent: 2 points, 1-25 percent: 1 point, 0 percent: 0 points. Maximum: 6 points.
Like to see the media - Maximum 50 points
4 Publication of underlying data behind stories.
Yes: 10 points, No: 0 points. Maximum: 10 points.
5 Inclusion of data journalism trainings in schools of
journalism – not just as a module, but throughout the entire course.
Yes: 10 points, No: 0 points. Maximum: 10 points.
6 X number of stories including visualizations on
power networks.
81-100 percent: 10 points, 61-80 percent: 8 points, 41-60 percent: 6 points, 21-40 percent: 4 points, 1-20 percent: 2 points, 0 percent: 0 points. Maximum: 10 points.
7 The release of media ownership data.
Yes: 10 points, No: 0 points. Maximum: 10 points.
8 X number of articles about governmental data
release.
81-100 percent: 10 points, 61-80 percent: 8 points, 41-60 percent: 6 points, 21-40 percent: 4 points, 1-20 percent: 2 points, 0 percent: 0 points. Maximum: 10 points.
Love to see the media - Maximum 32 points
9 X number of editorial policies to highlight
applications and services built around open data (e.g., a column dedicated to such initiatives).
91-100 percent: 16 points, 81-90 percent: 14 points, 71-80 percent: 12 points, 61-70 percent: 10 points, 51-60 percent: 8 points, 41-50 percent: 6 points, 31-40 percent: 4 points, 1-30 percent: 2 points, 0 percent: 0 points. Maximum: 16 points.
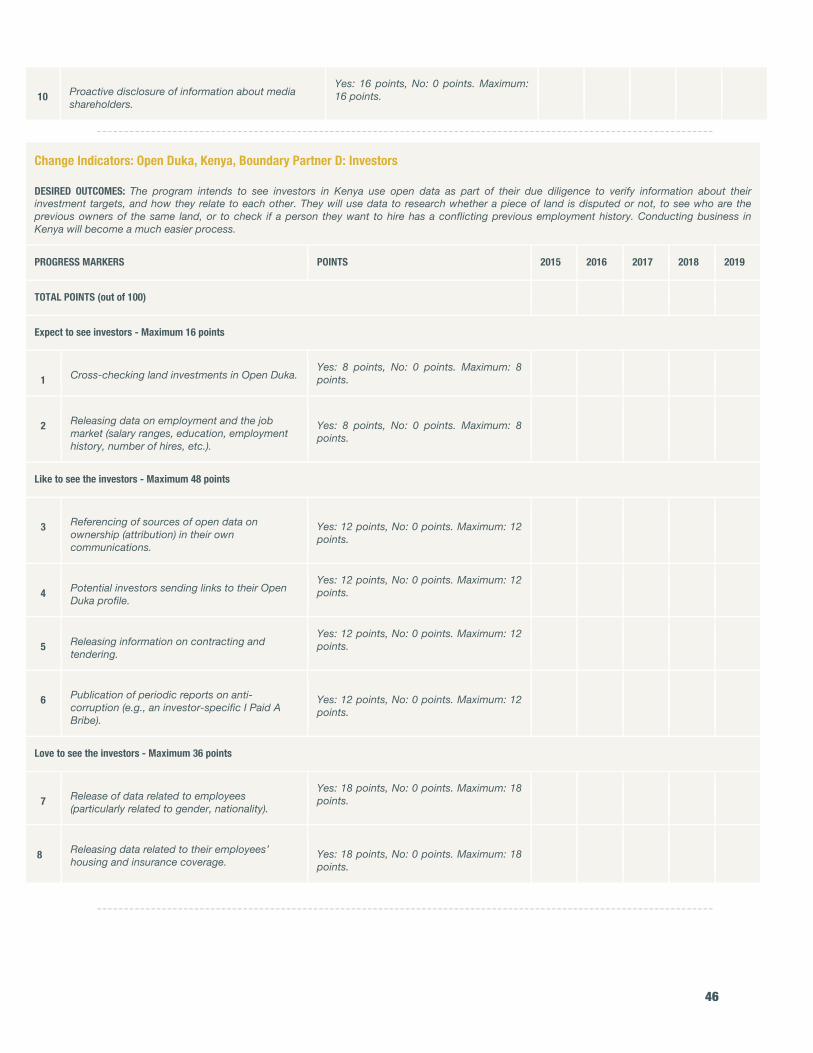
46
10 Proactive disclosure of information about media
shareholders.
Yes: 16 points, No: 0 points. Maximum: 16 points.
------------------------------------------------------------------------------------------------------------------
Change Indicators: Open Duka, Kenya, Boundary Partner D: Investors DESIRED OUTCOMES: The program intends to see investors in Kenya use open data as part of their due diligence to verify information about their investment targets, and how they relate to each other. They will use data to research whether a piece of land is disputed or not, to see who are the previous owners of the same land, or to check if a person they want to hire has a conflicting previous employment history. Conducting business in Kenya will become a much easier process.
PROGRESS MARKERS POINTS 2015 2016 2017 2018 2019
TOTAL POINTS (out of 100)
Expect to see investors - Maximum 16 points
1 Cross-checking land investments in Open Duka.
Yes: 8 points, No: 0 points. Maximum: 8 points.
2 Releasing data on employment and the job
market (salary ranges, education, employment history, number of hires, etc.).
Yes: 8 points, No: 0 points. Maximum: 8 points.
Like to see the investors - Maximum 48 points
3 Referencing of sources of open data on
ownership (attribution) in their own communications.
Yes: 12 points, No: 0 points. Maximum: 12 points.
4 Potential investors sending links to their Open
Duka profile.
Yes: 12 points, No: 0 points. Maximum: 12 points.
5 Releasing information on contracting and
tendering.
Yes: 12 points, No: 0 points. Maximum: 12 points.
6 Publication of periodic reports on anti-
corruption (e.g., an investor-specific I Paid A Bribe).
Yes: 12 points, No: 0 points. Maximum: 12 points.
Love to see the investors - Maximum 36 points
7 Release of data related to employees
(particularly related to gender, nationality).
Yes: 18 points, No: 0 points. Maximum: 18 points.
8 Releasing data related to their employees’
housing and insurance coverage.
Yes: 18 points, No: 0 points. Maximum: 18 points.
------------------------------------------------------------------------------------------------------------------
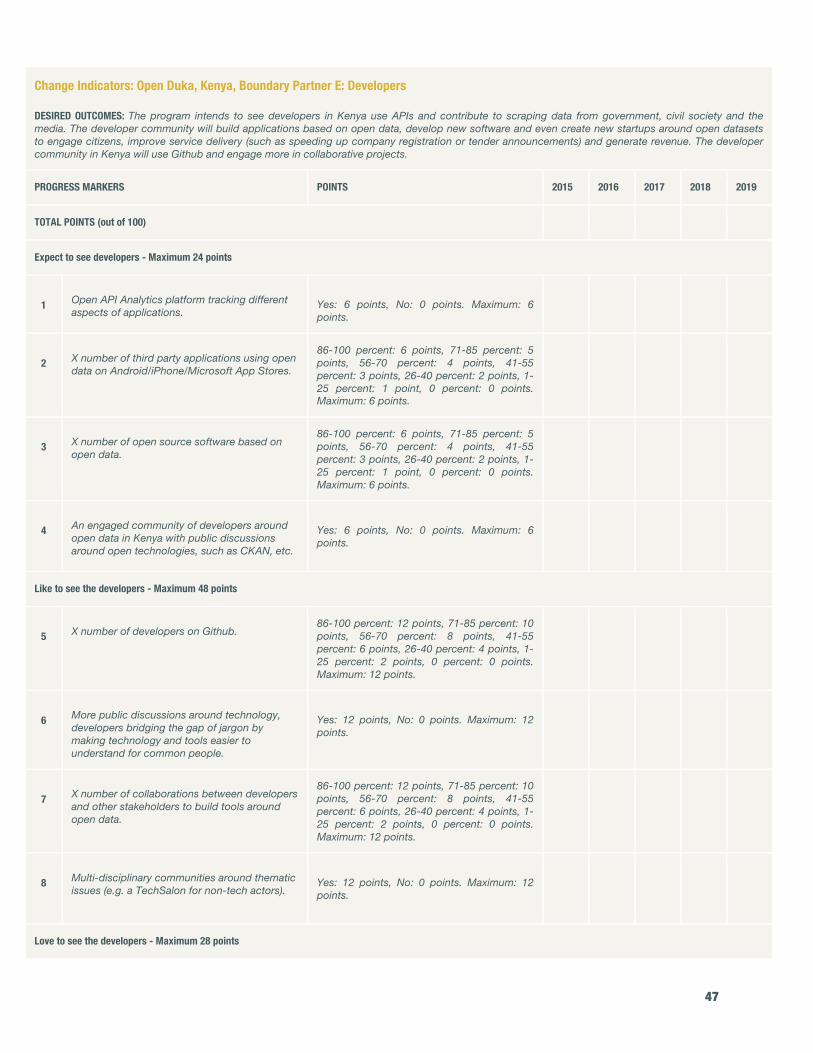
47
Change Indicators: Open Duka, Kenya, Boundary Partner E: Developers DESIRED OUTCOMES: The program intends to see developers in Kenya use APIs and contribute to scraping data from government, civil society and the media. The developer community will build applications based on open data, develop new software and even create new startups around open datasets to engage citizens, improve service delivery (such as speeding up company registration or tender announcements) and generate revenue. The developer community in Kenya will use Github and engage more in collaborative projects.
PROGRESS MARKERS POINTS 2015 2016 2017 2018 2019
TOTAL POINTS (out of 100)
Expect to see developers - Maximum 24 points
1 Open API Analytics platform tracking different
aspects of applications.
Yes: 6 points, No: 0 points. Maximum: 6 points.
2 X number of third party applications using open
data on Android/iPhone/Microsoft App Stores.
86-100 percent: 6 points, 71-85 percent: 5 points, 56-70 percent: 4 points, 41-55 percent: 3 points, 26-40 percent: 2 points, 1-25 percent: 1 point, 0 percent: 0 points. Maximum: 6 points.
3 X number of open source software based on
open data.
86-100 percent: 6 points, 71-85 percent: 5 points, 56-70 percent: 4 points, 41-55 percent: 3 points, 26-40 percent: 2 points, 1-25 percent: 1 point, 0 percent: 0 points. Maximum: 6 points.
4 An engaged community of developers around
open data in Kenya with public discussions around open technologies, such as CKAN, etc.
Yes: 6 points, No: 0 points. Maximum: 6 points.
Like to see the developers - Maximum 48 points
5 X number of developers on Github.
86-100 percent: 12 points, 71-85 percent: 10 points, 56-70 percent: 8 points, 41-55 percent: 6 points, 26-40 percent: 4 points, 1-25 percent: 2 points, 0 percent: 0 points. Maximum: 12 points.
6 More public discussions around technology,
developers bridging the gap of jargon by making technology and tools easier to understand for common people.
Yes: 12 points, No: 0 points. Maximum: 12 points.
7 X number of collaborations between developers
and other stakeholders to build tools around open data.
86-100 percent: 12 points, 71-85 percent: 10 points, 56-70 percent: 8 points, 41-55 percent: 6 points, 26-40 percent: 4 points, 1-25 percent: 2 points, 0 percent: 0 points. Maximum: 12 points.
8 Multi-disciplinary communities around thematic
issues (e.g. a TechSalon for non-tech actors).
Yes: 12 points, No: 0 points. Maximum: 12 points.
Love to see the developers - Maximum 28 points
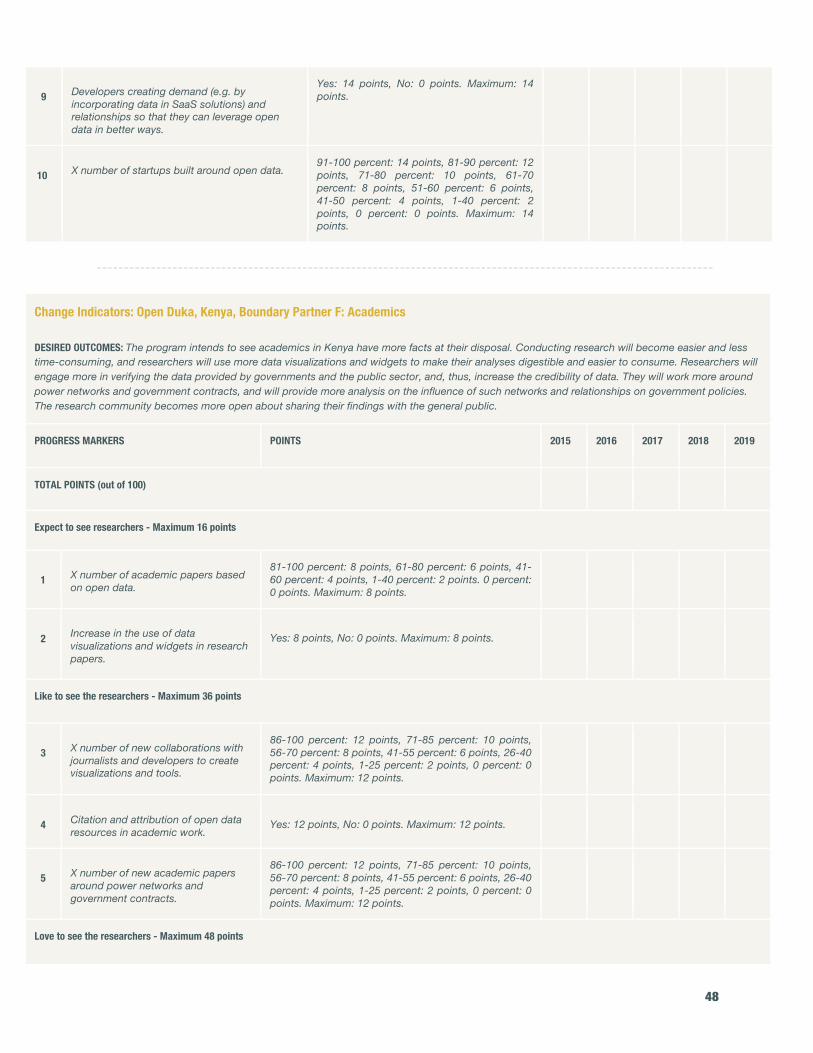
48
9 Developers creating demand (e.g. by
incorporating data in SaaS solutions) and relationships so that they can leverage open data in better ways.
Yes: 14 points, No: 0 points. Maximum: 14 points.
10 X number of startups built around open data.
91-100 percent: 14 points, 81-90 percent: 12 points, 71-80 percent: 10 points, 61-70 percent: 8 points, 51-60 percent: 6 points, 41-50 percent: 4 points, 1-40 percent: 2 points, 0 percent: 0 points. Maximum: 14 points.
------------------------------------------------------------------------------------------------------------------
Change Indicators: Open Duka, Kenya, Boundary Partner F: Academics DESIRED OUTCOMES: The program intends to see academics in Kenya have more facts at their disposal. Conducting research will become easier and less time-consuming, and researchers will use more data visualizations and widgets to make their analyses digestible and easier to consume. Researchers will engage more in verifying the data provided by governments and the public sector, and, thus, increase the credibility of data. They will work more around power networks and government contracts, and will provide more analysis on the influence of such networks and relationships on government policies. The research community becomes more open about sharing their findings with the general public.
PROGRESS MARKERS POINTS 2015 2016 2017 2018 2019
TOTAL POINTS (out of 100)
Expect to see researchers - Maximum 16 points
1 X number of academic papers based
on open data.
81-100 percent: 8 points, 61-80 percent: 6 points, 41-60 percent: 4 points, 1-40 percent: 2 points. 0 percent: 0 points. Maximum: 8 points.
2 Increase in the use of data
visualizations and widgets in research papers.
Yes: 8 points, No: 0 points. Maximum: 8 points.
Like to see the researchers - Maximum 36 points
3 X number of new collaborations with
journalists and developers to create visualizations and tools.
86-100 percent: 12 points, 71-85 percent: 10 points, 56-70 percent: 8 points, 41-55 percent: 6 points, 26-40 percent: 4 points, 1-25 percent: 2 points, 0 percent: 0 points. Maximum: 12 points.
4 Citation and attribution of open data
resources in academic work.
Yes: 12 points, No: 0 points. Maximum: 12 points.
5 X number of new academic papers
around power networks and government contracts.
86-100 percent: 12 points, 71-85 percent: 10 points, 56-70 percent: 8 points, 41-55 percent: 6 points, 26-40 percent: 4 points, 1-25 percent: 2 points, 0 percent: 0 points. Maximum: 12 points.
Love to see the researchers - Maximum 48 points

49
6 The release of underlying data in
academic work in open formats.
Yes: 16 points, No: 0 points. Maximum: 16 points.
7 Dissemination channels for academic
papers to extend beyond journals and share their research with the wider public.
Yes: 16 points, No: 0 points. Maximum: 16 points.
8 The release of grant/funding information on research projects.
Yes: 16 points, No: 0 points. Maximum: 16 points.
------------------------------------------------------------------------------------------------------------------

50
Change Indicators: A Tu Servicio, Uruguay, Boundary Partner A: Health Ministry DESIRED OUTCOMES: The program intends to see the Health Ministry of Uruguay to commit to better data publication in the long term through introducing clear data standards, and through providing up-to-date and reliable datasets related to health care. The Ministry will publish detailed information about the methods of data collection, as well as indicators on the relevance of data. The Ministry will also publicly support the concept of better data publication through stronger commitments and policies.
PROGRESS MARKERS POINTS 2015 2016 2017 2018 2019
TOTAL POINTS (out of 100)
Expect to see the Health Ministry - Maximum 20 points
1 Publication of countrywide health data on
the national data portal.
Yes: 4 points, No: 0 points. Maximum: 4 points.
2 Public commitment to share experience
with other initiatives within Ministries.
Yes: 4 points, No: 0 points. Maximum: 4 points.
3 Publication of new datasets with clear
standards (such as geo-location, indicators, economic data, etc.)
Yes: 4 points, No: 0 points. Maximum: 4 points.
4 Inclusion of the topic in the national Open
Government Plan.
Yes: 4 points, No: 0 points. Maximum: 4 points.
5 X number of concrete actions for
promoting the initiative and open data in general.
81-100 percent: 4 points, 61-80 percent: 3 points, 41-60 percent: 2 points, 1-40 percent: 1 point, 0 percent: 0 points. Maximum: 4 points.
Like to see the Health Ministry - Maximum 48 points
6 Standardization of the data. Yes: 12 points, No: 0 points. Maximum: 12 points.
7 A communication and outreach strategy for the Ministry.
Yes: 12 points, No: 0 points. Maximum: 12 points.
8 A validation mechanism for feedback. Yes: 12 points, No: 0 points. Maximum: 12 points.
9 Public commitment from the whole Ministry to better data publication.
Yes: 12 points, No: 0 points. Maximum: 12 points.
Love to see the Health Ministry - Maximum 32 points
10
Appropriate administrative/legal framework to set up partnerships with the Ministry.
Yes: 16 points, No: 0 points. Maximum: 16 points.
11 Disclosure of data collection and analysis methods.
Yes: 16 points, No: 0 points. Maximum: 16 points.
------------------------------------------------------------------------------------------------------------------
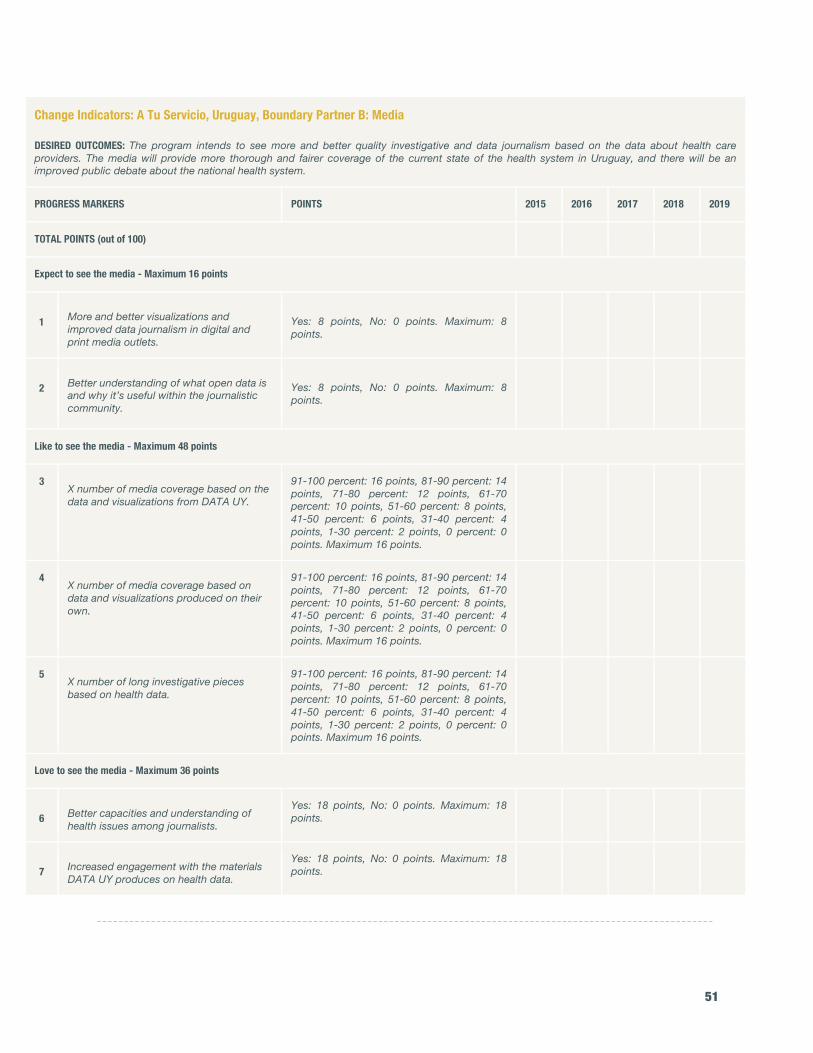
51
Change Indicators: A Tu Servicio, Uruguay, Boundary Partner B: Media DESIRED OUTCOMES: The program intends to see more and better quality investigative and data journalism based on the data about health care providers. The media will provide more thorough and fairer coverage of the current state of the health system in Uruguay, and there will be an improved public debate about the national health system.
PROGRESS MARKERS POINTS 2015 2016 2017 2018 2019
TOTAL POINTS (out of 100)
Expect to see the media - Maximum 16 points
1 More and better visualizations and
improved data journalism in digital and print media outlets.
Yes: 8 points, No: 0 points. Maximum: 8 points.
2 Better understanding of what open data is
and why it’s useful within the journalistic community.
Yes: 8 points, No: 0 points. Maximum: 8 points.
Like to see the media - Maximum 48 points
3 X number of media coverage based on the data and visualizations from DATA UY.
91-100 percent: 16 points, 81-90 percent: 14 points, 71-80 percent: 12 points, 61-70 percent: 10 points, 51-60 percent: 8 points, 41-50 percent: 6 points, 31-40 percent: 4 points, 1-30 percent: 2 points, 0 percent: 0 points. Maximum 16 points.
4 X number of media coverage based on data and visualizations produced on their own.
91-100 percent: 16 points, 81-90 percent: 14 points, 71-80 percent: 12 points, 61-70 percent: 10 points, 51-60 percent: 8 points, 41-50 percent: 6 points, 31-40 percent: 4 points, 1-30 percent: 2 points, 0 percent: 0 points. Maximum 16 points.
5 X number of long investigative pieces based on health data.
91-100 percent: 16 points, 81-90 percent: 14 points, 71-80 percent: 12 points, 61-70 percent: 10 points, 51-60 percent: 8 points, 41-50 percent: 6 points, 31-40 percent: 4 points, 1-30 percent: 2 points, 0 percent: 0 points. Maximum 16 points.
Love to see the media - Maximum 36 points
6 Better capacities and understanding of
health issues among journalists.
Yes: 18 points, No: 0 points. Maximum: 18 points.
7 Increased engagement with the materials
DATA UY produces on health data.
Yes: 18 points, No: 0 points. Maximum: 18 points.
------------------------------------------------------------------------------------------------------------------

52
Change Indicators: A Tu Servicio, Uruguay, Boundary Partner C: Government Standard-setting Bodies DESIRED OUTCOMES: The program intends to see government standard-setting bodies commit to improved data publication in the long term and introduce clear and strong data standards. There will be sufficient institutional capacity for implementing Open Data/Open Government policies across the state, and governmental agencies will form more in-depth collaborations with civil society to shape the open government agenda.
PROGRESS MARKERS POINTS 2015 2016 2017 2018 2019
TOTAL POINTS (out of 100)
Expect to see government standard-setting bodies - Maximum 18 points
1 Working groups and roundtables on the
issue.
Yes: 6 points, No: 0 points. Maximum: 6 points.
2 Technical support for public bodies
engaging in open government projects.
Yes: 6 points, No: 0 points. Maximum: 6 points.
3 Guidelines for public bodies engaging in open government projects.
Yes: 6 points, No: 0 points. Maximum: 6 points.
Like to see government standard-setting bodies - Maximum 50 points
4 A clear regulation for civil society
participation in the OGP agenda.
Yes: 10 points, No: 0 points. Maximum: 10 points.
5 A clear regulation to increase capacities
across the state for open government policies.
Yes: 10 points, No: 0 points. Maximum: 10 points.
6 Clear regulations on data provision.
Yes: 10 points, No: 0 points. Maximum: 10 points.
7 The introduction of data standards.
Yes: 10 points, No: 0 points. Maximum: 10 points.
8 Legal obligation for public bodies to publish
their data in open formats.
Yes: 10 points, No: 0 points. Maximum: 10 points.
Love to see government standard-setting bodies - Maximum 32 points
9 Increased institutional capacity across the
state for implementing open government policies.
Yes: 16 points, No: 0 points. Maximum: 16 points.
10 Adequate funding for public bodies
engaging in open government projects.
Yes: 16 points, No: 0 points. Maximum: 16 points.
------------------------------------------------------------------------------------------------------------------
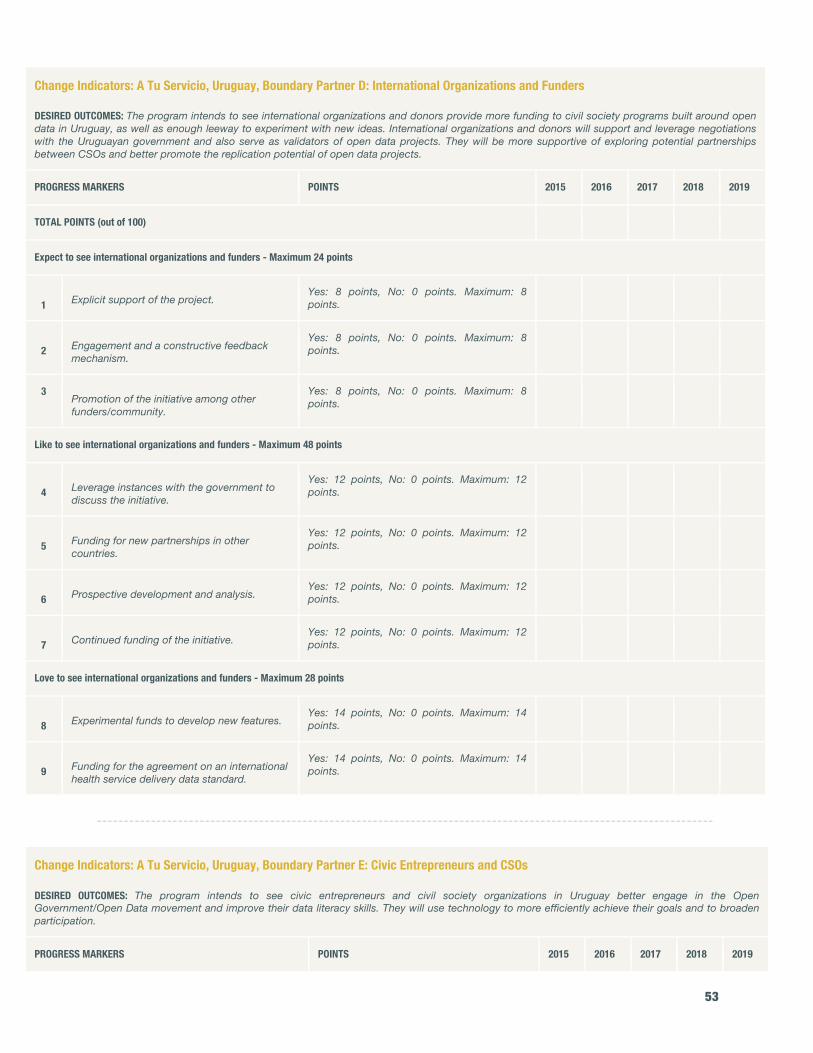
53
Change Indicators: A Tu Servicio, Uruguay, Boundary Partner D: International Organizations and Funders DESIRED OUTCOMES: The program intends to see international organizations and donors provide more funding to civil society programs built around open data in Uruguay, as well as enough leeway to experiment with new ideas. International organizations and donors will support and leverage negotiations with the Uruguayan government and also serve as validators of open data projects. They will be more supportive of exploring potential partnerships between CSOs and better promote the replication potential of open data projects.
PROGRESS MARKERS POINTS 2015 2016 2017 2018 2019
TOTAL POINTS (out of 100)
Expect to see international organizations and funders - Maximum 24 points
1 Explicit support of the project.
Yes: 8 points, No: 0 points. Maximum: 8 points.
2 Engagement and a constructive feedback
mechanism.
Yes: 8 points, No: 0 points. Maximum: 8 points.
3 Promotion of the initiative among other funders/community.
Yes: 8 points, No: 0 points. Maximum: 8 points.
Like to see international organizations and funders - Maximum 48 points
4 Leverage instances with the government to
discuss the initiative.
Yes: 12 points, No: 0 points. Maximum: 12 points.
5 Funding for new partnerships in other
countries.
Yes: 12 points, No: 0 points. Maximum: 12 points.
6 Prospective development and analysis.
Yes: 12 points, No: 0 points. Maximum: 12 points.
7 Continued funding of the initiative.
Yes: 12 points, No: 0 points. Maximum: 12 points.
Love to see international organizations and funders - Maximum 28 points
8 Experimental funds to develop new features.
Yes: 14 points, No: 0 points. Maximum: 14 points.
9 Funding for the agreement on an international
health service delivery data standard.
Yes: 14 points, No: 0 points. Maximum: 14 points.
------------------------------------------------------------------------------------------------------------------
Change Indicators: A Tu Servicio, Uruguay, Boundary Partner E: Civic Entrepreneurs and CSOs DESIRED OUTCOMES: The program intends to see civic entrepreneurs and civil society organizations in Uruguay better engage in the Open Government/Open Data movement and improve their data literacy skills. They will use technology to more efficiently achieve their goals and to broaden participation.
PROGRESS MARKERS POINTS 2015 2016 2017 2018 2019
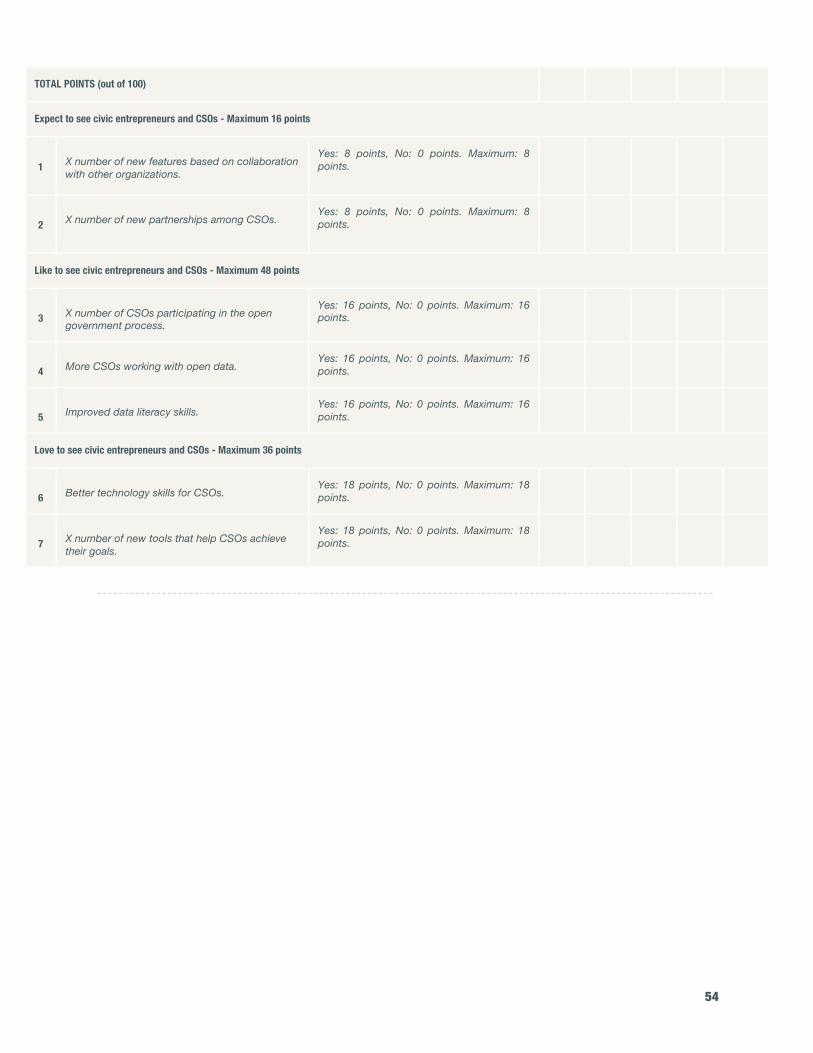
54
TOTAL POINTS (out of 100)
Expect to see civic entrepreneurs and CSOs - Maximum 16 points
1 X number of new features based on collaboration
with other organizations.
Yes: 8 points, No: 0 points. Maximum: 8 points.
2 X number of new partnerships among CSOs.
Yes: 8 points, No: 0 points. Maximum: 8 points.
Like to see civic entrepreneurs and CSOs - Maximum 48 points
3 X number of CSOs participating in the open
government process.
Yes: 16 points, No: 0 points. Maximum: 16 points.
4 More CSOs working with open data.
Yes: 16 points, No: 0 points. Maximum: 16 points.
5 Improved data literacy skills.
Yes: 16 points, No: 0 points. Maximum: 16 points.
Love to see civic entrepreneurs and CSOs - Maximum 36 points
6 Better technology skills for CSOs.
Yes: 18 points, No: 0 points. Maximum: 18 points.
7 X number of new tools that help CSOs achieve
their goals.
Yes: 18 points, No: 0 points. Maximum: 18 points.
------------------------------------------------------------------------------------------------------------------
Related Documents