Hauser Center Harvard University Working Paper No. 16 Kennedy School of Government Harvard University Working Paper Series No. RWP03-005 March 2003 The Single Audit Act: How Compliant Are Nonprofit Organizations? Elizabeth K. Keating Harvard University; Northwestern University Mary Fischer University of Texas Teresa P. Gordon University of Idaho Janet S. Greenlee University of Dayton This paper can be downloaded without charge from the Social Science Research Network Electronic Paper Collection at: http://ssrn.com/abstract=372263

Welcome message from author
This document is posted to help you gain knowledge. Please leave a comment to let me know what you think about it! Share it to your friends and learn new things together.
Transcript
Hauser Center Harvard University
Working Paper No. 16
Kennedy School of Government Harvard University
Working Paper Series No. RWP03-005
March 2003
The Single Audit Act: How Compliant Are Nonprofit Organizations?
Elizabeth K. Keating
Harvard University; Northwestern University
Mary Fischer University of Texas
Teresa P. Gordon University of Idaho
Janet S. Greenlee University of Dayton
This paper can be downloaded without charge from the
Social Science Research Network Electronic Paper Collection at: http://ssrn.com/abstract=372263
The Single Audit Act: How Compliant Are Nonprofit Organizations? By
Elizabeth K. Keating, Teresa P. Gordon, Mary Fischer, & Janet Greenlee
The Hauser Center for Nonprofit Organizations The John F. Kennedy School of Government
Harvard University
March 2003 Working Paper No. 16
This paper can be downloaded without charge from the Social Sciences Research Network Electronic Paper Collection: http://ssrn.com/abstract=372263
We acknowledge the helpful comments of the participants of the 2001 ARNOVA conference. We thank Jodi Piippo and Jennifer Hsu for their research support and Charles Cullinan, Paul Copley, and Daniel Tinkelman for their helpful comments.
The data used for this paper is available from the National Center for Charitable Statistics and US Census Bureau.
Elizabeth K. Keating is an Assistant Professor of Public Policy at the John F. Kennedy School of Government at Harvard University. Teresa P. Gordon is a Professor of Accounting at the College of Business & Economics at the University of Idaho. Mary Fischer is a Professor of Accounting in the College of Business Administration at the University of Texas at Tyler. Janet Greenlee is an Associate Professor of Accounting at the University of Dayton.
Abstract
Audits are an important legal accountability tool used by resource providers (donors,
grantors, and others) to assure that resources are spent by nonprofit organizations in accordance
with the resource provider’s intentions. This paper reports on audits that are required by the
government of the United States for organizations receiving large amounts of federal financial
assistance. Since 1990, nonprofits receiving substantial federal funds are required to undergo
this rigorous and expensive form of federal oversight. We report on 11,841 nonprofit entities
that underwent such audits, and the 3,592 audit firms that conducted them, from 1997 to 1999.
Overall, compliance with federal regulations appears to be high. Our study indicates that smaller
nonprofits, those that are new to government grants, and those with prior audit findings have a
significantly higher rate of adverse audit findings. Perhaps for cost or other reasons, these
nonprofits are being audited by less experienced auditors. Current federal funding does not
provide any additional funds for Single Audit Act compliance. One policy implication of our
work might be to provide federal funding specifically for Single Audit Act compliance to these
nonprofits.
1
The Single Audit Act: How Compliant are Nonprofit Organizations?
by
Elizabeth K. Keating, Teresa P. Gordon, Mary Fischer, & Janet Greenlee
INTRODUCTION
Nonprofit accountability has been thrust on to the public agenda by a series of financial
scandals, revelations of excessive compensation, and concerns over unethical behavior. Lapses in
accountability have affected nonprofit organizations as varied as the United Way of America
(Murawski 1995), Adelphi University (Thornburg 1997), and the NAACP (Greene 1995). In
response to increasing public concern, Congress has instituted measures designed to increase
accountability and oversight in this sector.1 However, little attention has focused on the impact
of these measures. The particular measure examined in this paper is the effectiveness of a long-
standing form of oversight, the Single Audit Act (SAA). Single audits were mandated by
Congress to improve financial management of the over $100 billion in annual federal assistance
through a uniform set of auditing requirements for federal grants.
Effective January 1, 1990, most nonprofit organizations receiving government funding
became subject to the SAA and its associated regulations as promulgated in OMB Circular A-
133: Audits of States, Local Governments, and Nonprofit Organizations. Since 1996, any
nonprofit entity expending at least $300,000 in federal funds in any one year must undergo an
annual A-133 audit. Each A-133 audit consists of a traditional audit conducted by a licensed
certified public accountant (CPA), an assessment of the internal control structure, and procedures
that assess the use of federal funds and compliance with certain laws and regulations. Since an
A-133 audit demands skills beyond those necessary for a standard CPA audit, auditors are
required to obtain specialized training and expertise. Overall, A-133 audits are a highly rigorous
2
form of nonprofit oversight, which is expensive and challenging for both the auditor and the
auditee.
Kearns (1996, 9) describes nonprofit accountability, in part, as that “wide spectrum of
public expectations dealing with organizational performance, responsiveness . . . of nonprofit
organizations.” Under the Kearns framework, single audits would be categorized as a
compliance-type of accountability designed to fulfill legal and regulatory requirements. They are
externally imposed by a higher authority and implemented through explicit standards. Several
researchers have questioned the effectiveness of the monitoring and enforcement of other forms
of legal accountability imposed upon nonprofit organizations (Chisholm 1995, Brody 2002) but
did not address the implementation of the Single Audit Act. According to Kearns, nonprofit
organizations make strategic and tactical decisions to respond to the accountability system.
Our study is designed to empirically examine nonprofit organizations’ response to legal
accountability requirements imposed by the Single Audit Act. Anecdotally, we observe that
some nonprofit organizations, such as Tuskegee University, have lost government funding due to
adverse audit findings arising from its A-133 audit (Tuskegee 1998). This loss of funding for
Tuskegee resulted in significant declines in service provision and weakened the financial health
of the university. McKenzie College, established in 1885, went of out business in 1992 when it
lost both government financial aid funding and accreditation (HED 1993). These potentially
unfavorable outcomes from noncompliance with the Single Audit Act suggest that nonprofits
may make strategic and tactical decisions to comply, in fact and/or appearance, with the A-133
requirements. We examine two research questions that are indicative of these decisions:
3
1. Nonprofits can select from a large pool of potential auditors who may vary in their level
of experience. Are nonprofits choosing audit firms with extensive general and/or
specialized A-133 audit experience?
2. Nonprofits can undertake measures to reduce the likelihood of adverse audit findings.
What is the likelihood that a nonprofit is found to be out of compliance with the A-133
requirements? Are particular characteristics (such as, industry subsector, organizational
size, experience with federal grants or auditor’s experience) factors that effect the
likelihood of an adverse finding?
The remainder of the paper is organized as follows. Information about the requirements
of the Single Audit Act is provided in Section II, followed by a review of empirical research on
A-133 audits in Section III. The sample and methodology are presented in Section IV. Results
and discussion of findings conclude the paper in Sections V and VI, respectively.
BACKGROUND ON THE SINGLE AUDIT ACT
History Of The Single Audit Act2
The General Accounting Office (GAO) became concerned over the laxity of internal
controls of organizations receiving federal funds that surfaced in the 1970s (GAO 1986a, 1986b,
1989). These concerns led to the issuance of uniform audit requirements embodied in the Office
of Management and Budget (OMB) Circulars A-110 for certain nonprofit organizations and A-
102 for state and local governments. Unfortunately, the guidance was not effectively
implemented (Gross et al. 2000) and resulted in federal agencies requiring recipient
organizations to have audits conducted on each separate grant or contract. The Single Audit Act
(SAA) of 1984 was adopted to improve audit efficiency and reduce audit costs through uniform
audit requirements that eliminated these duplicate audit processes. The issuance of OMB
4
Circular A-133 in 1990 expanded the coverage to federally-funded nonprofit organizations as
well. Currently, recipients of federal financial assistance that expend $300,000 or more in federal
awards during a fiscal year are required to undergo a single audit for that fiscal year.
Organizations receiving less than the $300,000 threshold amount must still keep adequate
accounting records and make them available for inspection and audit upon request.
Prior Empirical Studies of the Single Audit Act
The academic research on single audits can be grouped into four areas: impact on auditee
compliance, quality of the audit work, auditor selection, and frequency of adverse findings.
Although all of the studies have focused on single audits of governmental entities, the findings
may be generalizable to nonprofit organizations.
The findings of studies examining the impact of the SAA on auditee compliance have
been somewhat mixed. Engstrom (1992) reported that CPAs (but not their municipal clients)
believe that audits were more effective and efficient under the SAA and that single audits had
improved over time. However, neither group believed that the SAA had resulted in more
effective or efficient use of federal funds. In contrast, Brannan (1993) found that auditors
believe that the SAA had improved recipient compliance with applicable federal rules and
regulations. Overall, however, both papers suggest some improvement in the level of
compliance by organizations receiving government funding.
The literature examining the quality of work done by auditors examining governmental
entities is extensive (see, for example, Marks and Raman 1986; Hardiman, Squires and Smith
1987; Palmrose 1988; Roberts, Glezen and Jones 1990; Raman and Wallace 1994; Deis and
Giroux 1992; Lawrence 1999). Studies of single audits began when GAO reports criticized the
quality of audits of governmental entities conducted by certified public accounting firms (GAO
5
1986a, 1986b, 1989). The 1986 GAO report indicated that as many as one-third of all audits of
recipients of federal financial assistance failed to conform to professional standards. Using the
GAO data, Copley and Doucet (1993) found a positive relationship between fixed fee
arrangements and single audits deemed substandard, suggesting that audit quality suffers when
the auditor has an incentive to limit the amount of audit testing to assure the engagement remains
profitable. Brown and Raghunandan (1995 and 1997) found little improvement in the quality of
governmental audits since the original 1986 GAO report despite government standards (known
as the “Yellow Book”) that require government-specific continuing education for auditors
conducting single audits and increased use of quality reviews. The President’s Council on
Integrity and Efficiency found that 34 percent of A-133 audits of governmental entities report
some significant shortcoming in the audit work performed (Broadus and Comtois 1987).
Auditor selection in the nonprofit sector was studied by Krishman and Schauer (2000)
through an examination of the quality of United Way operating agency audits (A-133 audits were
not separately analyzed). They found that the extent of noncompliance decreased as audit firm
size increased (2000, p. 17). Other researchers have examined the role of audit fees in auditor
selection. The audit fee research hypothesizes that the Single Audit Act has increased auditing
fees due to additional audit procedures, more potential liability, and requirements that auditors
receive supplemental audit training. However, this increase in costs might be offset by reducing
the number of audits conducted and/or enhancing auditor efficiency. One notable study (Raman
and Wilson 1992) provides evidence indicating no significant gains in auditor efficiency. They
also found that independent accounting firms absorbed the incremental costs associated with the
SAA rather than passing them along to their municipal clients.
6
Finally, some researchers have focused on the frequency of adverse findings. In
particular, Jakubowski (1995) looked at which auditors conducted A-133 audits and the
frequency of audit findings for governmental entities. He found that state auditors conducting A-
133 audits report more internal control weaknesses than do private audit firms. In addition when
the frequency of reported internal control weaknesses during the first four years of single audits
was examined, he found significant differences between cities and counties. In the first year of
the SAA, an average of 2.8 material internal control weaknesses were found in counties and 1.8
in cities. By the third and fourth years of the SAA, the number of reported material internal
control weaknesses had fallen by 42 percent for cities, but only by 13 percent for counties. As a
result, Jakubowski concluded that county governments made few changes in their control
structures while municipal governments made significant improvements. This confirms earlier
findings by Coe and Ellis (1991) that improper acts were more common in county government
than in municipalities.
SAMPLE AND METHODOLOGY
Sample Selection
While Jakubowski studied governmental entities, our investigation focuses on nonprofit
organizations. Our data set is derived from A-133 audit information available from the Federal
Audit Clearinghouse and Form 990 IRS tax data available from the National Center for
Charitable Statistics (NCCS). The A-133 database provides data collected from auditors
conducting the single audits and includes the auditee, auditor, cognizant or oversight federal
agency, total awards amount, and audit findings. After our efforts to eliminate incomplete and
duplicate data and standardize spelling of audit firm names, the resulting data set includes 83,708
single audits of both nonprofit and governmental organizations conducted from 1997 through
7
2000. We combined the single audit act data with the IRS Business Master File using the
employer identification number (EIN). From this we identified 37,540 audit reports representing
17,363 nonprofit organizations. We then matched the dataset to the NCCS 1999 “core file” using
name and audit year.3 The core file covers one year of tax filings and contains 228,011 nonprofit
organizations for 125 variables, including descriptive information and financial variables from
the IRS Return Transaction Files after they have been cleaned4 by NCCS. Some nonprofits in the
resulting sample reported multiple 990 filings under different EINs. Due to the uncertainty
associated with determining which EIN represented the main entity, these organizations were
excluded. The final sample includes audit findings and financial information on 11,841 nonprofit
organizations and 12,654 audit reports covering periods ending between June 30, 1997 and
August 31, 1999.
Descriptive Statistics
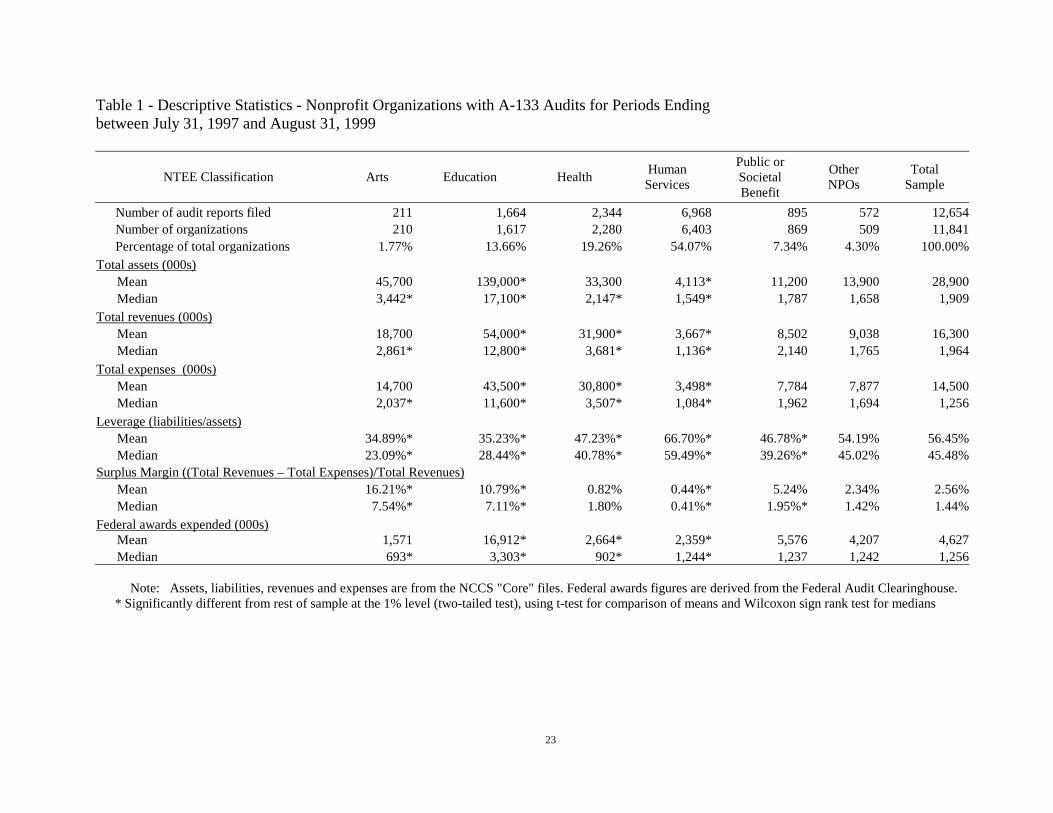
The nonprofit sector is quite diverse. For descriptive purposes, we partitioned the
database into the five largest industry sectors based on the National Taxonomy of Exempt
Entities (NTEE): arts, education, health, human services, and public or societal benefit. All
other nonprofit organizations (environmental, international and foreign affairs,
mutual/membership benefit, etc.) are included in the “Other NPOs” column in Table 1. The
majority (54.1 percent) of nonprofit organizations (NPOs) undergoing single audits during this
period were human service entities. Health and educational organizations accounted for 19.3
percent and 13.7 percent of the audits, respectively. In contrast, only 210 arts, culture and
humanities organizations (less than two percent of the audits) expended enough federal funds to
be covered by the SAA.
8
Although human service agencies represented the majority of single audits, their average
total assets ($4.1 million) and total revenues ($3.7 million) were substantially smaller than the
other sectors. In contrast, the health and education sectors had the most assets ($33.3 and $139.0
million, respectively) and revenues ($31.9 and $54.0 million, respectively). Educational
organizations, on average, expended the most federal awards annually ($16.9 million), probably
due to the inclusion of financial aid and educational loans to students. Arts organizations, at the
other extreme, expended the least federal award amounts ($1.6 million). Note that medians for
the dollar figures in Table 1 were often dramatically different than the averages indicating wide
variability in organizational size and award amounts – particularly for the education sector.
To assess the relative financial health of these organizations, we computed two ratios,
financial leverage (debt/assets) and the surplus margin (net income/total revenue). While the
sectors differ based on average assets, liabilities, revenues, and expenses, these differences were
accentuated when examining the ratios. The average financial leverage for the entire sample was
56.5 percent, yet only 34.9 and 35.2 percent of art and educational organizations’ assets,
respectively, were financed through debt. In contrast, human services agencies relied on debt to
finance 66.7 percent of their assets. Arts organizations reported the highest mean surplus margin
(16.2 percent). Human service agencies have the lowest mean and median surplus margin (0.4
percent for both measures).
RESULTS OF ANALYSIS
Nonprofit Organizations’ Audit Firm Selection
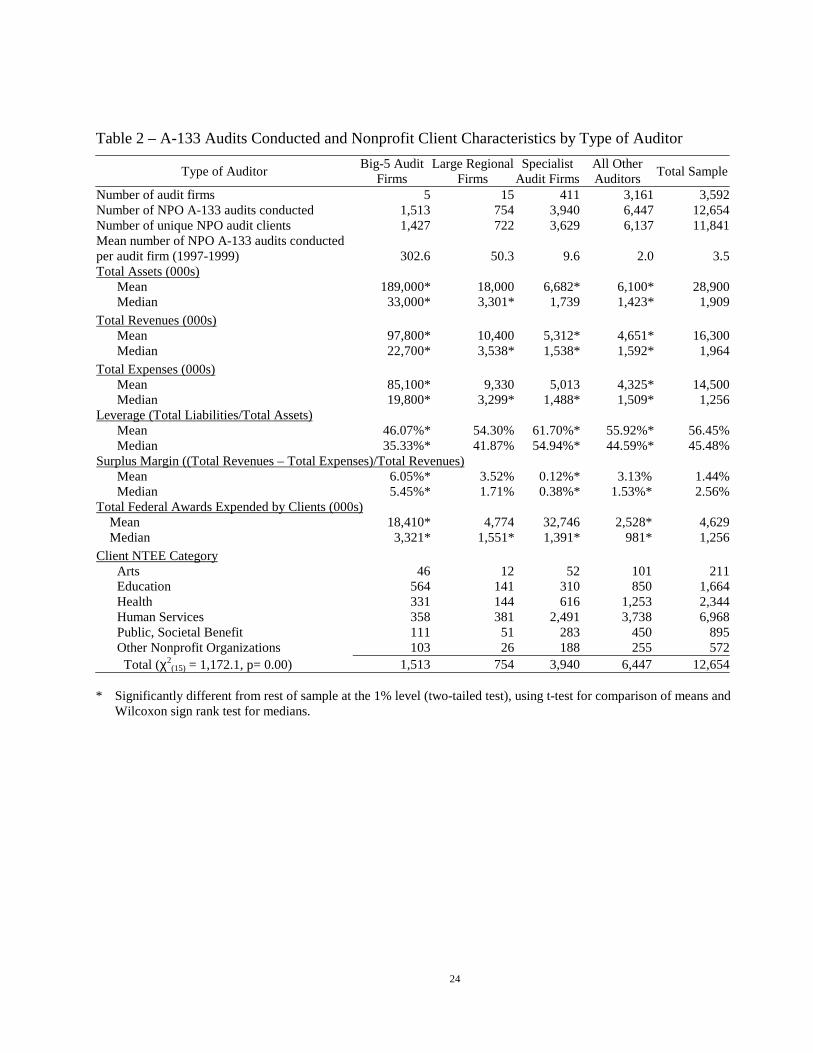
In Table 2, we examine which audit firms were selected by nonprofit organizations to
conduct single audits of nonprofit organizations. During the three-year period under
examination, 3,592 audit firms conducted 12,654 A-133 nonprofit audits for 11,841 separate
9
NPO clients, an overall average of 3.5 NPO audits per firm during the period. The mean per
audit firm was 23 for A-133 audits during the period. We divided the firms into four
classifications that correspond to general and/or specialized A-133 audit experience:
1. Big-5: the five largest international public accounting and auditing firms5. These firms
audit most of the large publicly traded corporations in the United States and have offices
in all of the largest cities and many smaller cities.
2. Regional: the next 25 largest public accounting firms in the United States based on
revenue reported to Accounting Today.6 Of these 25, only 15 firms reported conducting
A-133 audits in the Census Bureau dataset.
3. Specialist: those firms that are neither “Big-5” nor “Regional” but conducted 30 or more
A-133 audits of both governmental and nonprofit entities over the sample period.
4. Other: those smaller audit firms not included in the previous groups and a few
government auditors.7
As Table 2 indicates, larger nonprofit organizations tend to hire the Big-5 firms, which is
not surprising since these auditors are the firms that typically audit the largest business
enterprises in the for-profit sector. Nonprofit organizations with higher mean and median total
assets, total revenues, total expenses, and federal awards expended were significantly more likely
to select these firms. Although each Big-5 firm performed an average of 303 nonprofit A-133
audits, this represented only 12 percent of the total number of A-133 audits conducted. In
contrast, the 15 regional firms completed an average of 50 nonprofit A-133 audits (6 percent of
audits), while 411 specialist firms conducted an average of 10 nonprofit A-133 audits (30 percent
of audits) during the study period. The remaining firms performed the majority of the NPO
10
single audits, but averaged only 2.0 NPO audits during the entire study period. The smallest
nonprofit organizations (in terms of mean and median total assets, total revenues, total expenses
and federal awards expended) tended to use these small, non-specialist audit firms. This auditor
group was selected by a disproportionately high number of human services organizations and a
disproportionately low number of educational organizations. In contrast, the Big-5 firms
performed 34 percent of the A-133 audits of educational institutions and a disproportionately
high percentage of the arts organizations (22 percent).
Frequency of Adverse Audit Findings
1. Overview
When completing a single audit, the auditor must produce numerous reports. First, the
auditor reports whether the financial statements were in conformity with generally accepted
accounting principles (GAAP) and the schedule of Federal award expenditures were fairly
presented in all material respects (financial statement opinion). The opinion8 can be unqualified
or “clean,” qualified, adverse or a disclaimer of opinion. The audit opinion may also contain
language that questions whether the nonprofit can continue to operate as a going concern.
Second, the auditor must provide an opinion on whether the major programs are in material
compliance with laws, regulations, and the provisions of contract or grant agreements (material
compliance opinion). Since the auditee may have multiple programs, the opinion can be mixed,
where some programs receive an unqualified opinion, and others receive qualified or adverse
opinions or disclaimers of opinion. Third, a schedule of any reportable conditions in internal
controls must be filed.9 If a finding is reported, the auditor must indicate whether or not it is a
material weakness. Finally, the auditor must indicate if there is any material noncompliance with
laws, regulations or cost allocations. For each major program, the auditor must also provide an
11
opinion on whether the particular program is in compliance with laws, regulations, and cost
allocations. If the auditor observes a failure by the auditee to comply, then the audit firm issues
an adverse finding.
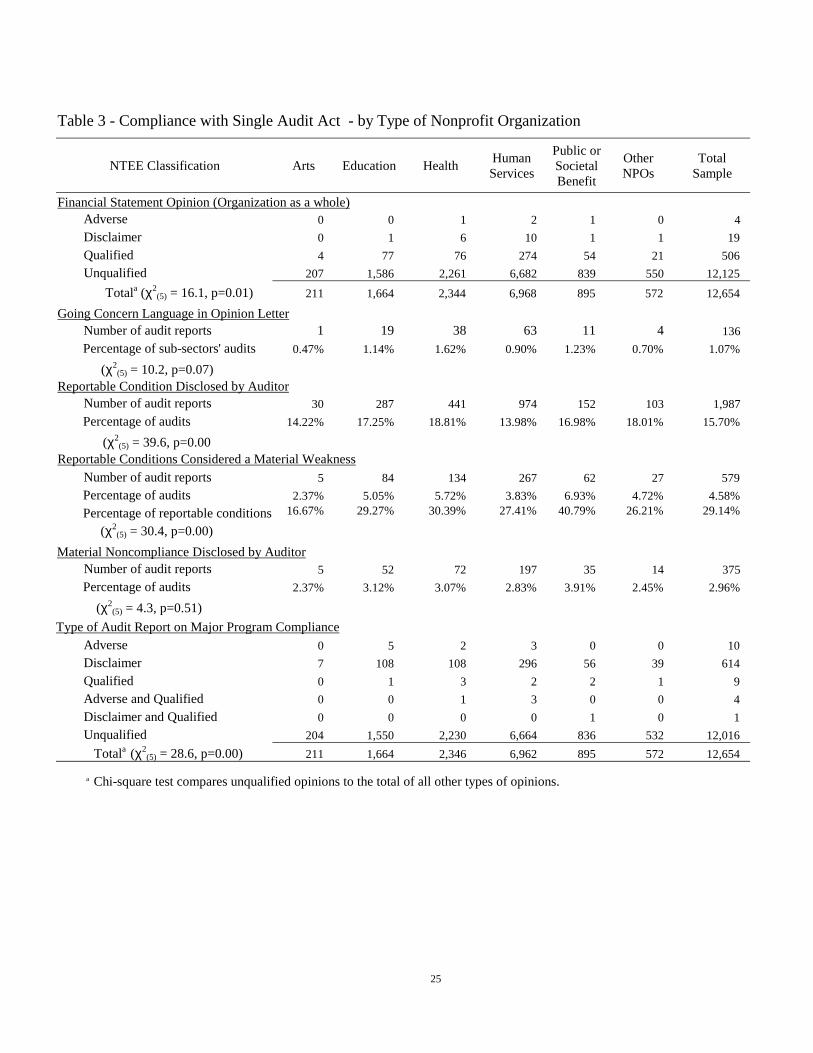
Overall, 95.8 percent of the financial statement opinions were unqualified (Table 3). Of
the 529 financial statement opinions that were not unqualified, the majority (95.7 percent) was
qualified, indicating some limitation of the audit, such as the inability to gather certain
information or the use of a nonstandard accounting practice that affected some aspect of the
financial statements. Public/societal benefit organizations were more likely to receive a qualified
opinion (6.0 percent as compared to 4.0 percent overall), while arts organizations were the least
likely to receive a qualified opinion (1.9 percent). Just over one percent (136) of the financial
statement opinions questioned the organization’s ability to continue in existence (going concern).
Arts organizations had the lowest (0.5 percent), while health care had the highest rate of going
concern disclosures (1.6 percent). Interestingly, more than 75 percent of these “going concern”
nonprofits received an unqualified financial statement audit opinion.
A reportable condition was disclosed in 15.7 percent of the single audits and 29.1 percent
of these conditions were considered to be a material weakness in internal control. Health care
organizations had the highest rate of reportable conditions and human service organizations had
the lowest. Reportable conditions that were considered to be a material weakness were reported
at the highest rate for public or societal benefit organizations, with 6.9 percent of all audit
reports. This was over 40 percent of the reportable conditions in the public and societal benefit
organizations. Arts organizations reported the fewest, with only 2.4 percent of all audit reports.
Arts had the lowest rate of material weaknesses at 16.7 percent (5 material weaknesses out of 30
audits with reportable conditions).
12
When looking at contract and legal compliance, auditors disclosed that only 3.0 percent
of nonprofits were not in material compliance, and this finding was not affected by nonprofit
industry sector. Most nonprofit organizations (95.0 percent) received unqualified opinions on all
their major programs. Disclaimers of opinion comprised the bulk of the remaining reports. Other
and educational organizations received the highest rates of disclaimers of opinion (6.8 and 6.5
percent respectively, compared to 4.9 percent overall); arts institutions had the lowest disclaimer
rate (3.3 percent).
2. Low vs. Not Low-Risk Auditees
The extent of a nonprofit’s audit under SAA is determined by a risk-based approach that
considers current and prior audit experience, the amount of funding, and nature of the federal
program. Each federal award is categorized as either Type A (major) or Type B (minor) based
on the size of the grant. Some programs are then identified as either low risk or not low risk
using various criteria.10 Finally, certain nonprofits can gain low-risk auditee status by having
single audits in the past two years in which the financial statements were unqualified with no
reported material weaknesses in internal controls or legal compliance problems. Hence, a
nonprofit that is inexperienced with government grants will not receive low-risk status and will
be subject to a more stringent set of audit procedures.
Once the auditor has determined the status of the programs and the auditee, the auditor
must audit as a “major program” all high risk Type A programs, at least half of low-risk Type A
programs, and at least half of high risk Type B programs. For many nonprofits, the auditor must
expand the audit scope to ensure that the audited programs encompass at least 50 percent of all
federal award money expended by the recipient. In addition, each Type A program must be
audited at least once every three years as a major program, regardless of risk classification.
13
Nonprofits that do not obtain low-risk status are ex ante deemed more likely to be noncompliant.
By virtue of being subject to more extensive audit procedures, these organizations have a higher
probability of being found noncompliant ex post.
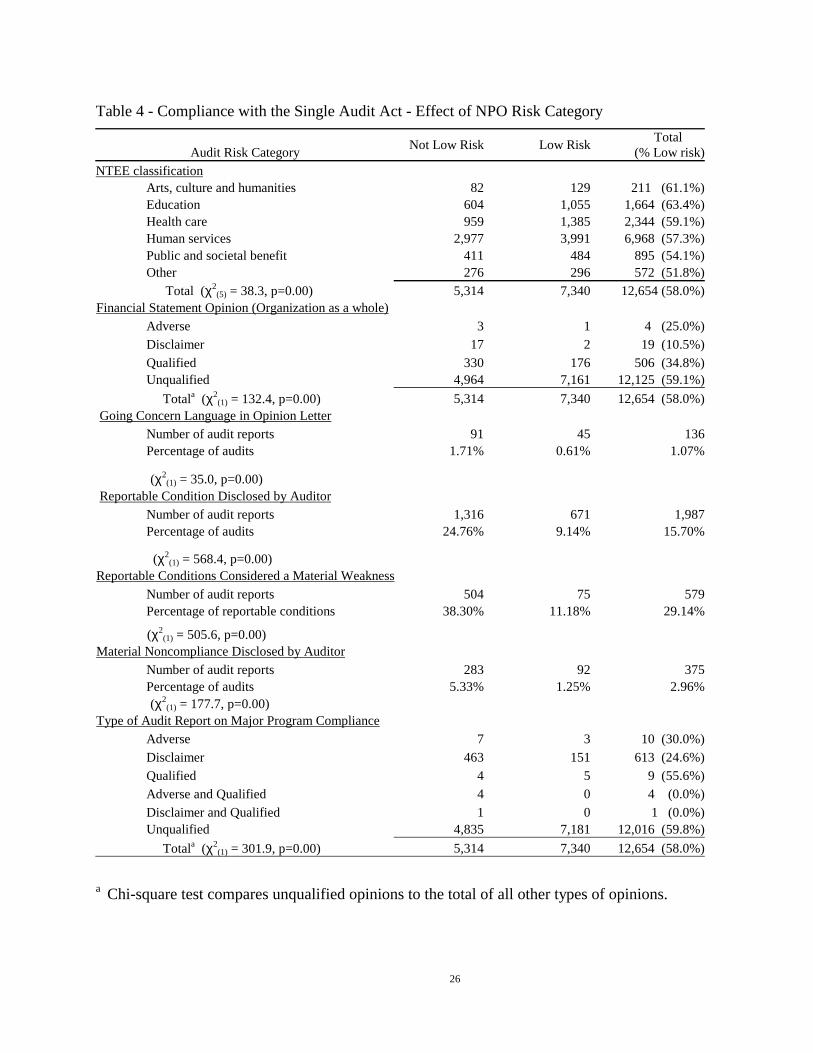
In our sample, 58 percent of the audits were classified as low-risk. Table 4 shows the rate
at which nonprofit organizations met the A-133 criteria for classification as low risk auditees and
the effect of this classification on the rate at which adverse audit findings were reported. The
classification varied significantly by industry sub-sector. Educational and arts institutions had the
highest percentage of low-risk auditees (63.4 and 61.1 percent, respectively, as compared to 58
percent overall). Other and public/societal benefit organizations were less likely to be classified
as low-risk auditees (51.8 and 54.1 percent, respectively). Low-risk auditees were much less
likely to have qualified audit opinions (2.4 percent versus 6.2 percent for other than low-risk
auditees). The auditees with low risk status were three times less likely to receive going concern
language (0.6 percent to 1.7 percent for their higher risk counterparts). The low-risk auditees
were also less likely to have reportable conditions (9.1 percent to 24.8 percent for those without
low-risk status). Note that the reportable conditions were less often material for the low-risk
entities (11.2 percent) than for the other auditees (38.3 percent). Material noncompliance was
also significantly less likely for low risk auditees.
3. The Role of Auditor Selection
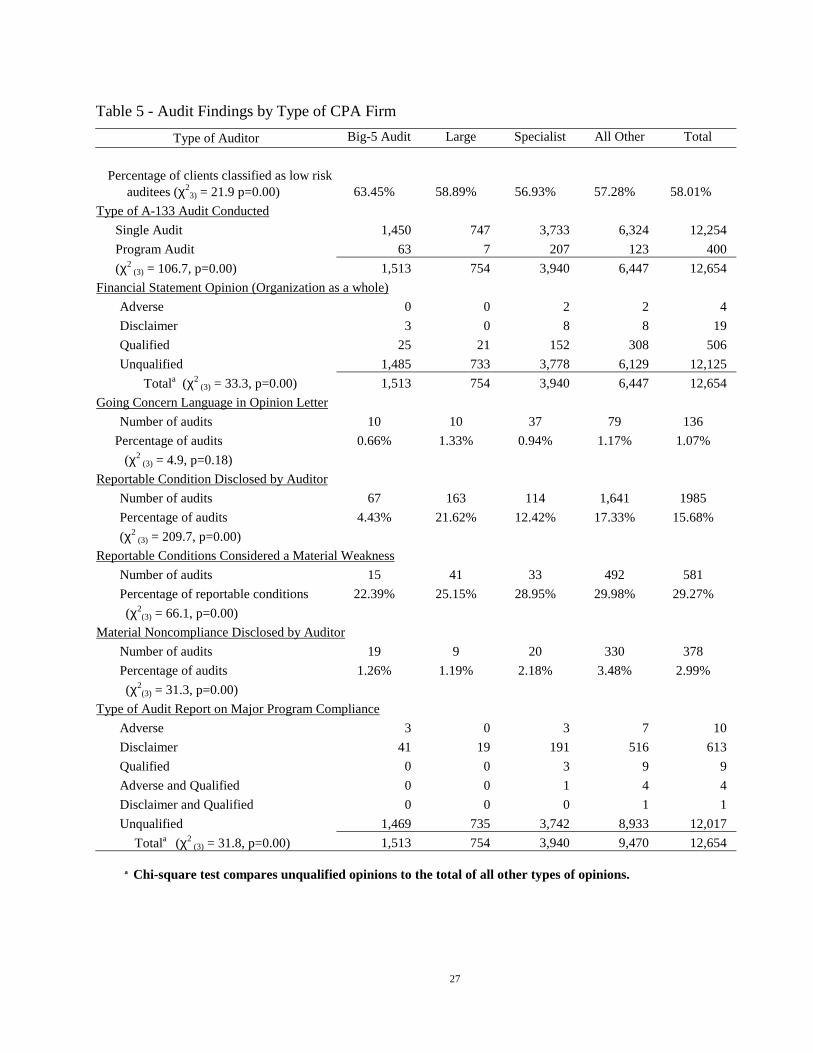
Table 5 shows the effect of auditor type on the disclosure of adverse audit findings. Big-5
firms were the most likely to have clients classified as low-risk auditees (63.5 percent), and they
were also the most likely to render a clean opinion on the financial statements (98.2 percent
versus 95.8 percent overall). Their clients were also among the least likely to have going concern
language (0.7 percent to 1.1 percent overall), reportable conditions (4.4 percent to 15.7 percent
14
overall), and reportable conditions considered material weaknesses (22.4 percent to 29.3 percent
overall). In contrast, the large regional firms disclosed reportable conditions in internal controls
at a disproportionately higher rate (21.6 percent) and were the most likely type of firm to include
going concern language in their financial statement opinions (1.33 percent). Specialist auditors
audited a disproportionately higher percentage of higher risk clients and were substantially more
likely to conduct a program-specific audit (5.3 percent of all specialist audits as compared to 3.2
percent overall). While nonprofits that did not receive low-risk status were on a percentage basis,
more likely to select a specialist auditor, numerically most of these organizations selected the
small, non-specialist audit firms. Despite the relative lack of experience in conducting A-133
audits, these small non-specialist audit firms were more likely to issue financial statements that
were qualified (4.8 percent to 4.0 percent overall) and reportable conditions that were material
weaknesses (30.0 percent to 29.3 percent overall).
4. The Role of Organizational and Grant Size
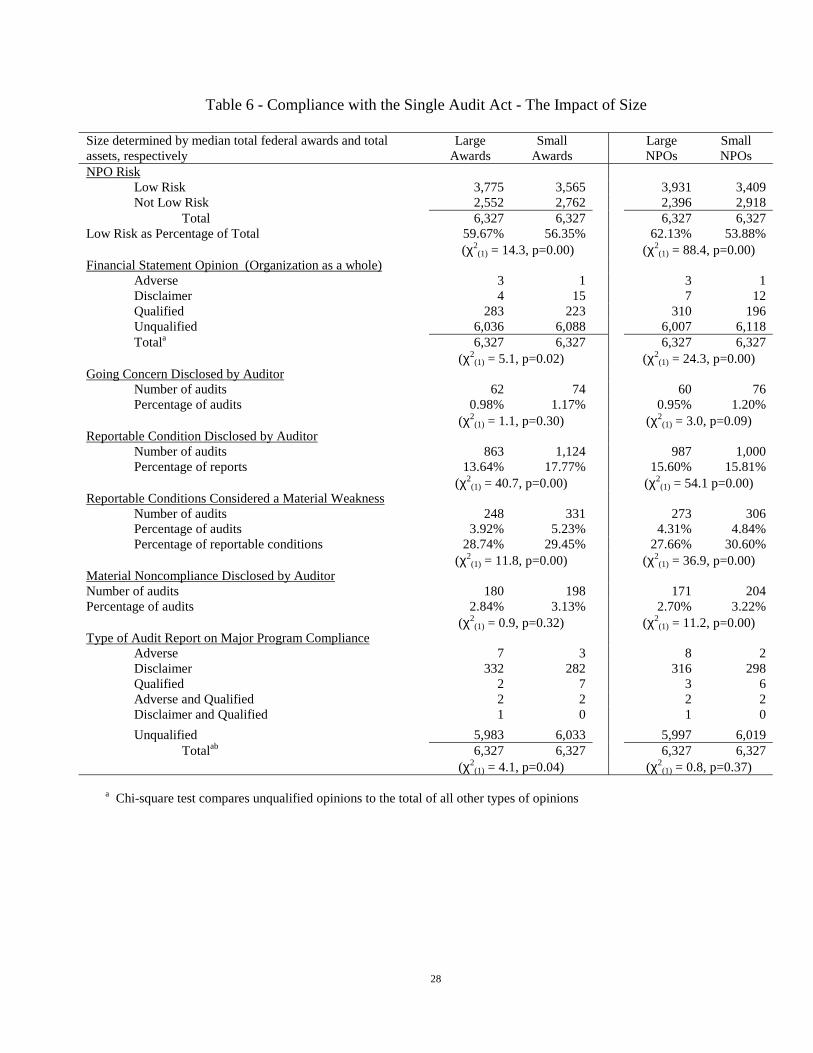
Finally, we examined the relation between audit findings and federal grant size and
nonprofit organization size as measured by total revenues. Table 6 splits the sample at the
median for each of the size-related measures. Large organizations or those expending large
grants were more likely to be classified as low risk. Interestingly, organizations with smaller
federal grants received significantly more clean opinions than those with large grants (96.2
percent versus 95.4 percent). Similarly, organizations with lower revenues received significantly
more clean opinions (96.7 versus 94.9 percent). Smaller engagements (under both measurement
criteria) more frequently received opinions containing going concern language, had
proportionally more reportable conditions, and the reportable conditions were more likely to be
15
considered material. In addition, the auditors more often reported material noncompliance with
legal and program requirements.
DISCUSSION AND CONCLUSIONS
Audits are an important legal accountability tool used by resource providers (donors,
grantors, and others) to assure that resources are spent by nonprofit organizations in accordance
with the resource provider’s intentions. This paper reports on audits that are required by the
government of the United States for organizations receiving large amounts of federal financial
assistance. In accordance with the Single Audit Act, these nonprofit organizations must undergo
an A-133 audit, a rigorous and expensive form of federal oversight. During the period we
examined (1997 to 1999), 3,592 audit firms conducted A-133 audits for 11,841 nonprofit
entities. Overall, compliance with federal regulations appears to be high. Although the audit
reports indicated relatively few reportable conditions and even fewer instances of material
noncompliance, we did observe some variations in audit findings depending on both the type of
audit firm, the specific industry sub-sector of their clients, size of the organization, federal award
amount, and risk classification.
Our study indicates that smaller nonprofits and those who are not classified as low-risk
have a significantly higher rate of adverse audit findings. This suggests that small organizations,
those with less experience with federal funding or with audit findings in prior years have the
greatest difficulty complying with the Single Audit Act. Perhaps, due to cost or other factors,
these organizations more frequently select specialist or small, non-specialist auditors rather than
the Big 5 or regional audit firms. Hence, the nonprofits that may need more assistance to comply
are obtaining advice and being audited by the less experienced auditors. Overall, these findings
indicate that these organizations, in particular, need assistance to comply with the Single Audit
16
Act. Current federal funding does not provide any additional funds for Single Audit Act
compliance. One policy implication of our work might be to provide federal funding specifically
for Single Audit Act compliance to these nonprofits.
We found the arts and education sectors to be similar in several respects, having the most
assets, the highest profit margins, and the least reliance on debt. Possibly because of these
attributes, more low-risk audits were identified in these two sectors. Interestingly, in spite of
appearing to be in excellent financial health, the education sector tended to have far more
adverse audit findings than the arts sector.
The human service and public and societal benefit sectors are similar in terms of asset
size: both are small. However, they differ in almost all other respects. The human service
sector, which constitutes the largest number of organizations in our study, appears to be in
relatively poor financial condition with the smallest surplus margin and the most reliance on
debt. Organizations in the public and societal benefit sector, on the other hand, appear to be in
much better financial condition. They have an above average surplus margin and lower than
average reliance on debt. The average size of federal awards in public and societal benefit sector
is, well above average, yet it has a lower than average proportion of organizations falling into the
low-risk category. In addition, the public and societal benefit organizations reported the fewest
unqualified audit opinions on financial statements and the most material weakness in internal
controls and noncompliance items. In contrast, the human services organizations received on
average small federal awards (only the arts sector had smaller grants). They also had close to an
average percentage of low risk audits. Finally, their audits resulted in relatively few reportable
conditions, and their A-133 audits were more likely to result in unqualified opinions.
17
Health care organizations appear from this study to be in poor financial condition as well.
Although this sector had, on average, the third most assets, only human service organizations
reported a lower surplus margin. In addition, they rank third highest in their reliance on debt. In
addition, audits of health care organizations resulted in the most reportable conditions and going
concern issues.
Unlike for-profit firms, nonprofit organizations do not predominantly select Big-5 audit
firms. Instead, we found that numerous specialist and small audit firms are selected to conduct
most of these audits. Auditees that are smaller and less likely to be classified as low risk tend to
choose small audit firms. Not surprising given the risks inherent in accepting higher risk clients,
the small audit firms issued the majority of the qualified audit opinions. The smaller audit firms
that conducted less than three single audits of the nonprofit organizations during the period were
the dominant force in this market. These non-specialist firms accounted for half of the audit
reports.
Since little research has been conducted in the nonprofit area, many avenues for further
research are available. Different cognizant agencies may require additional or more complex
reporting requirements. Thus, an analysis of the type and source of federal awards might shed
further light on the different audit outcomes. A majority of the accounting firms conducting
these complex audits complete, on average, fewer than two per year. An analysis of the quality
of these audits would be useful. Since each organization can choose which auditor will perform
its A-133 audit, an exploration of why an organization chooses a particular audit firm could be
an important extension of this study. Public or societal benefit agencies and educational
institutions were generally more likely to receive adverse audit findings, while the arts
institutions were relatively less likely. Again, further research is needed to ascertain why the
18
recipients of federal financial assistance in some sub-sectors appear to have more internal control
and other adverse audit findings than in other sub-sectors. It may be that the program compliance
requirements associated with some grants or cognizant agencies may be more stringent than
those in others.
This study only examined nonprofit organizations that underwent a financial audit as part
of an A-133 audit. The results of these audits are publicly available. Because the audit findings
of nonprofits (unlike those of both for-profit and governmental entities) are generally not
publicly available, we were unable to compare the two groups. Thus, an analysis of the
differences in attributes (if any) between nonprofits required to undergo A-133 audits and those
who are not so required, both cross-sectionally and longitudinally, would be a very important
extension of our study.
19
REFERENCES
Accounting Today. (2002). The 2002 Top 100 Tax and Accounting Firms. The Electronic
Accountant. <http://www.electronicaccountant.com> (2002, October 15).
Brannan, R. (1993). The Single Audit Act of 1984: A survey of practitioners. Public Budgeting
and Finance, 13, 66-75.
Broadus, W.A., Jr., & Comtois, J.D. (1987). The single audit: A progress report, Journal of
Accountancy, 164, 92-100.
Brody, E. 2002. Accountability and Public Trust In L. Salomon. (Ed.) The State of America’s
Nonprofit Sector. Aspen Institute and Brookings Institute Press.
Brown, C.D., & Raghunandan, K. (1997). Audit quality in audits of federal programs by non-
federal auditors: A reply, Accounting Horizons, 11, 72-75.
Brown, C.D., & Raghunandan, K. (1995). Audit quality in audits of federal programs by
nonfederal auditors, Accounting Horizons, 9, 1-10.
Chisolm, L. B. (1995) Accountability of Nonprofit Organizations and Those Who Control Them:
The Legal Framework. Nonprofit Management & Leadership, 6 (2), 141-156.
Coe, C.K. & Ellis, C. (1991). Internal Controls in State, Local and Nonprofit Agencies, Public
Budgeting and Finance, 43-55.
Copley, P. & Doucet, M. (1993). Auditor tenure, fixed fee contracts and the supply of
substandard single audits, Public Budgeting & Finance, 13, 23-35.
20
Deis, D. & Giroux, G. (1992). Determinants of audit quality in the public sector, The Accounting
Review, 67, 462-479.
Engstrom, J.H. (1992). The Single Audit Act of 1984: Perspectives of Local Government
Officials and Auditors, Government Accountants Journal, 41, 13-22.
Freeman, R.J., & Shoulders, C.D. (2000). Governmental and Nonprofit Accounting: Theory and
Practice (6th ed.). Upper Saddle River, NJ: Prentice Hall.
Greene, E. (1995). The NAACP: What Went Wrong?, Chronicle of Philanthropy, 27-29.
Gross, M.J., Jr., Larkin, R.F & McCarthy, J.H. (2000). Financial and Accounting Guide for Not-
for-Profit Organizations (6th ed.). New York: John Wiley and Sons.
Hardiman, P.F., Squires, Q. & Smith, R. (1987). Audit quality for governments units - Part I and
Part II, The CPA Journal, 57, 22-30, 58-66.
Higher Education Directory (HED). (1993). Falls Church, VA: Higher Educations Publications,
Inc.
Jakubowski, S. (1995). Reporting on the internal control structures of local government under the
Single Audit Act of 1984. Public Budgeting & Finance, 58-71.
Kearns, K. (1996). Managing for Accountability. San Francisco, CA: Jossey-Bass Publishers.
Krishman, J., & Schauer, P.C. (2000). The differentiation of quality among auditors: Evidence
from the Not-for-Profit Sector, Auditing: A Journal of Practice and Theory, 19, 9-25.
21
Lawrence, J.E. (1999). Determinates of irregularities reported by audits of a federal loan
program, Journal of Public Budgeting, Accounting & Financial Management, 11, 1-18.
Marks, B.R., & Raman, K.K. (1986). State audit budgets and market assessments of credit risk,
Journal of Accounting & Public Policy, 5, 233-250.
Murawski, J. (1995). Former United Way Chief Gets 7 Years in Jail; Sentence Praised by
Charities, Chronicle of Philanthropy, 37-8.
Palmrose, Z. (1988). An analysis of auditor litigation and audit service quality, Accounting
Review, 63, 55-73.
Raman, K. K., & Wallace, W.A. (1994). The association between state audit budgets and
specialized audit inputs, Public Budgeting & Financial Management, 6, 444-491.
Raman, K. K., & Wilson, E.R. (1992). An empirical investigation of the market for single audit
services, Journal of Accounting and Public Policy, 11, 271-295.
Roberts, R.W., Glezen, G.W. & Jones, T.W. (1990). Determinants of auditor change in the
public sector, Journal of Accounting Research, 28, 220-228.
Thornburg, D. (1997, March 13). Adelphi, Weathering Crisis, Will Endure. Newsday, p. A57.
Tuskegee University 1997 Financial Statement Disclosure Notes, Numbers 4, 5 and 10. In
Tuskegee University Financial Statements (pp. 6-12). Atlanta, GA: Tuskegee University.
U.S. General Accounting Office. (1989). Single Audit Act: Single Audit Quality Has Improved
But Some Implementation Problems Remain, Washington DC: U.S. GAO/AFMD-89-72.
22
U.S. General Accounting Office. (1986a). CPA Audit Quality: Many Governmental Audits Do
Not Comply with Professional Standards, Washington DC: U.S. GAO/AFMD-86-20.
U.S. General Accounting Office. (1986b). CPA Audit Quality: Inspectors General Find
Significant Problems, Washington DC: U.S. GAO/AFMD-86-33.
23
Table 1 - Descriptive Statistics - Nonprofit Organizations with A-133 Audits for Periods Ending between July 31, 1997 and August 31, 1999
NTEE Classification Arts Education Health Human Services
Public or Societal Benefit
Other NPOs
Total Sample
Number of audit reports filed 211 1,664 2,344 6,968 895 572 12,654 Number of organizations 210 1,617 2,280 6,403 869 509 11,841 Percentage of total organizations 1.77% 13.66% 19.26% 54.07% 7.34% 4.30% 100.00%
Total assets (000s) Mean 45,700 139,000* 33,300 4,113* 11,200 13,900 28,900 Median 3,442* 17,100* 2,147* 1,549* 1,787 1,658 1,909
Total revenues (000s) Mean 18,700 54,000* 31,900* 3,667* 8,502 9,038 16,300 Median 2,861* 12,800* 3,681* 1,136* 2,140 1,765 1,964
Total expenses (000s) Mean 14,700 43,500* 30,800* 3,498* 7,784 7,877 14,500 Median 2,037* 11,600* 3,507* 1,084* 1,962 1,694 1,256
Leverage (liabilities/assets) Mean 34.89%* 35.23%* 47.23%* 66.70%* 46.78%* 54.19% 56.45% Median 23.09%* 28.44%* 40.78%* 59.49%* 39.26%* 45.02% 45.48%
Surplus Margin ((Total Revenues – Total Expenses)/Total Revenues) Mean 16.21%* 10.79%* 0.82% 0.44%* 5.24% 2.34% 2.56% Median 7.54%* 7.11%* 1.80% 0.41%* 1.95%* 1.42% 1.44%
Federal awards expended (000s) Mean 1,571 16,912* 2,664* 2,359* 5,576 4,207 4,627 Median 693* 3,303* 902* 1,244* 1,237 1,242 1,256
Note: Assets, liabilities, revenues and expenses are from the NCCS "Core" files. Federal awards figures are derived from the Federal Audit Clearinghouse.
* Significantly different from rest of sample at the 1% level (two-tailed test), using t-test for comparison of means and Wilcoxon sign rank test for medians
24
Table 2 – A-133 Audits Conducted and Nonprofit Client Characteristics by Type of Auditor
Type of Auditor Big-5 Audit
Firms Large Regional
Firms Specialist
Audit Firms All Other Auditors Total Sample
Number of audit firms 5 15 411 3,161 3,592 Number of NPO A-133 audits conducted 1,513 754 3,940 6,447 12,654 Number of unique NPO audit clients 1,427 722 3,629 6,137 11,841 Mean number of NPO A-133 audits conducted per audit firm (1997-1999) 302.6 50.3 9.6 2.0 3.5 Total Assets (000s)
Mean 189,000* 18,000 6,682* 6,100* 28,900 Median 33,000* 3,301* 1,739 1,423* 1,909
Total Revenues (000s) Mean 97,800* 10,400 5,312* 4,651* 16,300 Median 22,700* 3,538* 1,538* 1,592* 1,964
Total Expenses (000s) Mean 85,100* 9,330 5,013 4,325* 14,500 Median 19,800* 3,299* 1,488* 1,509* 1,256
Leverage (Total Liabilities/Total Assets) Mean 46.07%* 54.30% 61.70%* 55.92%* 56.45% Median 35.33%* 41.87% 54.94%* 44.59%* 45.48%
Surplus Margin ((Total Revenues – Total Expenses)/Total Revenues) Mean 6.05%* 3.52% 0.12%* 3.13% 1.44% Median 5.45%* 1.71% 0.38%* 1.53%* 2.56%
Total Federal Awards Expended by Clients (000s) Mean 18,410* 4,774 32,746 2,528* 4,629 Median 3,321* 1,551* 1,391* 981* 1,256
Client NTEE Category Arts 46 12 52 101 211 Education 564 141 310 850 1,664 Health 331 144 616 1,253 2,344 Human Services 358 381 2,491 3,738 6,968 Public, Societal Benefit 111 51 283 450 895 Other Nonprofit Organizations 103 26 188 255 572 Total (χ2
(15) = 1,172.1, p= 0.00) 1,513 754 3,940 6,447 12,654
* Significantly different from rest of sample at the 1% level (two-tailed test), using t-test for comparison of means and Wilcoxon sign rank test for medians.
25
Table 3 - Compliance with Single Audit Act - by Type of Nonprofit Organization
NTEE Classification Arts Education Health Human Services
Public or Societal Benefit
Other NPOs
Total Sample
Financial Statement Opinion (Organization as a whole) Adverse 0 0 1 2 1 0 4
Disclaimer 0 1 6 10 1 1 19
Qualified 4 77 76 274 54 21 506
Unqualified 207 1,586 2,261 6,682 839 550 12,125
Totala (χ2(5) = 16.1, p=0.01) 211 1,664 2,344 6,968 895 572 12,654
Going Concern Language in Opinion Letter Number of audit reports 1 19 38 63 11 4 136
Percentage of sub-sectors' audits 0.47% 1.14% 1.62% 0.90% 1.23% 0.70% 1.07%
(χ2(5) = 10.2, p=0.07)
Reportable Condition Disclosed by Auditor Number of audit reports 30 287 441 974 152 103 1,987
Percentage of audits 14.22% 17.25% 18.81% 13.98% 16.98% 18.01% 15.70%
(χ2(5) = 39.6, p=0.00
Reportable Conditions Considered a Material Weakness Number of audit reports 5 84 134 267 62 27 579
Percentage of audits 2.37% 5.05% 5.72% 3.83% 6.93% 4.72% 4.58%
Percentage of reportable conditions (χ2
(5) = 30.4, p=0.00) 16.67% 29.27% 30.39% 27.41% 40.79% 26.21% 29.14%
Material Noncompliance Disclosed by Auditor Number of audit reports 5 52 72 197 35 14 375
Percentage of audits 2.37% 3.12% 3.07% 2.83% 3.91% 2.45% 2.96%
(χ2(5) = 4.3, p=0.51)
Type of Audit Report on Major Program Compliance Adverse 0 5 2 3 0 0 10
Disclaimer 7 108 108 296 56 39 614
Qualified 0 1 3 2 2 1 9
Adverse and Qualified 0 0 1 3 0 0 4
Disclaimer and Qualified 0 0 0 0 1 0 1
Unqualified 204 1,550 2,230 6,664 836 532 12,016
Totala (χ2(5) = 28.6, p=0.00) 211 1,664 2,346 6,962 895 572 12,654
a Chi-square test compares unqualified opinions to the total of all other types of opinions.
26
Table 4 - Compliance with the Single Audit Act - Effect of NPO Risk Category
Audit Risk Category Not Low Risk
Low Risk
Total (% Low risk)
NTEE classification Arts, culture and humanities 82 129 211 (61.1%) Education 604 1,055 1,664 (63.4%) Health care 959 1,385 2,344 (59.1%) Human services 2,977 3,991 6,968 (57.3%) Public and societal benefit 411 484 895 (54.1%) Other 276 296 572 (51.8%)
Total (χ2(5) = 38.3, p=0.00) 5,314 7,340 12,654 (58.0%)
Financial Statement Opinion (Organization as a whole) Adverse 3 1 4 (25.0%) Disclaimer 17 2 19 (10.5%) Qualified 330 176 506 (34.8%) Unqualified 4,964 7,161 12,125 (59.1%)
Totala (χ2(1) = 132.4, p=0.00) 5,314 7,340 12,654 (58.0%)
Going Concern Language in Opinion Letter Number of audit reports 91 45 136 Percentage of audits 1.71% 0.61% 1.07%
(χ2(1) = 35.0, p=0.00)
Reportable Condition Disclosed by Auditor Number of audit reports 1,316 671 1,987 Percentage of audits 24.76% 9.14% 15.70%
(χ2(1) = 568.4, p=0.00)
Reportable Conditions Considered a Material Weakness Number of audit reports 504 75 579 Percentage of reportable conditions 38.30% 11.18% 29.14%
(χ2(1) = 505.6, p=0.00)
Material Noncompliance Disclosed by Auditor Number of audit reports 283 92 375 Percentage of audits 5.33% 1.25% 2.96% (χ2
(1) = 177.7, p=0.00) Type of Audit Report on Major Program Compliance
Adverse 7 3 10 (30.0%) Disclaimer 463 151 613 (24.6%) Qualified 4 5 9 (55.6%) Adverse and Qualified 4 0 4 (0.0%) Disclaimer and Qualified 1 0 1 (0.0%) Unqualified 4,835 7,181 12,016 (59.8%)
Totala (χ2(1) = 301.9, p=0.00) 5,314 7,340 12,654 (58.0%)
a Chi-square test compares unqualified opinions to the total of all other types of opinions.
27
Table 5 - Audit Findings by Type of CPA Firm
Type of Auditor Big-5 Audit Large Specialist All Other Total
Percentage of clients classified as low risk
auditees (χ23) = 21.9 p=0.00) 63.45% 58.89% 56.93% 57.28% 58.01%
Type of A-133 Audit Conducted
Single Audit 1,450 747 3,733 6,324 12,254
Program Audit 63 7 207 123 400
(χ2 (3) = 106.7, p=0.00) 1,513 754 3,940 6,447 12,654
Financial Statement Opinion (Organization as a whole)
Adverse 0 0 2 2 4
Disclaimer 3 0 8 8 19
Qualified 25 21 152 308 506
Unqualified 1,485 733 3,778 6,129 12,125
Totala (χ2 (3) = 33.3, p=0.00) 1,513 754 3,940 6,447 12,654
Going Concern Language in Opinion Letter
Number of audits 10 10 37 79 136
Percentage of audits 0.66% 1.33% 0.94% 1.17% 1.07%
(χ2 (3) = 4.9, p=0.18)
Reportable Condition Disclosed by Auditor
Number of audits 67 163 114 1,641 1985
Percentage of audits 4.43% 21.62% 12.42% 17.33% 15.68%
(χ2 (3) = 209.7, p=0.00)
Reportable Conditions Considered a Material Weakness
Number of audits 15 41 33 492 581
Percentage of reportable conditions 22.39% 25.15% 28.95% 29.98% 29.27%
(χ2(3) = 66.1, p=0.00)
Material Noncompliance Disclosed by Auditor
Number of audits 19 9 20 330 378
Percentage of audits 1.26% 1.19% 2.18% 3.48% 2.99%
(χ2(3) = 31.3, p=0.00)
Type of Audit Report on Major Program Compliance
Adverse 3 0 3 7 10
Disclaimer 41 19 191 516 613
Qualified 0 0 3 9 9
Adverse and Qualified 0 0 1 4 4
Disclaimer and Qualified 0 0 0 1 1
Unqualified 1,469 735 3,742 8,933 12,017
Totala (χ2 (3) = 31.8, p=0.00) 1,513 754 3,940 9,470 12,654
a Chi-square test compares unqualified opinions to the total of all other types of opinions.
28
Table 6 - Compliance with the Single Audit Act - The Impact of Size
Size determined by median total federal awards and total assets, respectively
Large Awards
Small Awards
Large
NPOs Small NPOs
NPO Risk Low Risk 3,775 3,565 3,931 3,409 Not Low Risk 2,552 2,762 2,396 2,918 Total 6,327 6,327 6,327 6,327 Low Risk as Percentage of Total 59.67% 56.35% 62.13% 53.88% (χ2
(1) = 14.3, p=0.00) (χ2(1) = 88.4, p=0.00)
Financial Statement Opinion (Organization as a whole) Adverse 3 1 3 1 Disclaimer 4 15 7 12 Qualified 283 223 310 196 Unqualified 6,036 6,088 6,007 6,118
Totala 6,327 6,327 6,327 6,327 (χ2
(1) = 5.1, p=0.02) (χ2(1) = 24.3, p=0.00)
Going Concern Disclosed by Auditor Number of audits 62 74 60 76 Percentage of audits 0.98% 1.17% 0.95% 1.20% (χ2
(1) = 1.1, p=0.30) (χ2(1) = 3.0, p=0.09)
Reportable Condition Disclosed by Auditor Number of audits 863 1,124 987 1,000 Percentage of reports 13.64% 17.77% 15.60% 15.81% (χ2
(1) = 40.7, p=0.00) (χ2(1) = 54.1 p=0.00)
Reportable Conditions Considered a Material Weakness Number of audits 248 331 273 306 Percentage of audits 3.92% 5.23% 4.31% 4.84% Percentage of reportable conditions 28.74% 29.45% 27.66% 30.60% (χ2
(1) = 11.8, p=0.00) (χ2(1) = 36.9, p=0.00)
Material Noncompliance Disclosed by Auditor Number of audits 180 198 171 204 Percentage of audits 2.84% 3.13% 2.70% 3.22% (χ2
(1) = 0.9, p=0.32) (χ2(1) = 11.2, p=0.00)
Type of Audit Report on Major Program Compliance Adverse 7 3 8 2 Disclaimer 332 282 316 298 Qualified 2 7 3 6 Adverse and Qualified 2 2 2 2 Disclaimer and Qualified 1 0 1 0
Unqualified 5,983 6,033 5,997 6,019 Totalab 6,327 6,327 6,327 6,327 (χ2
(1) = 4.1, p=0.04) (χ2(1) = 0.8, p=0.37)
a Chi-square test compares unqualified opinions to the total of all other types of opinions
29
ENDNOTES
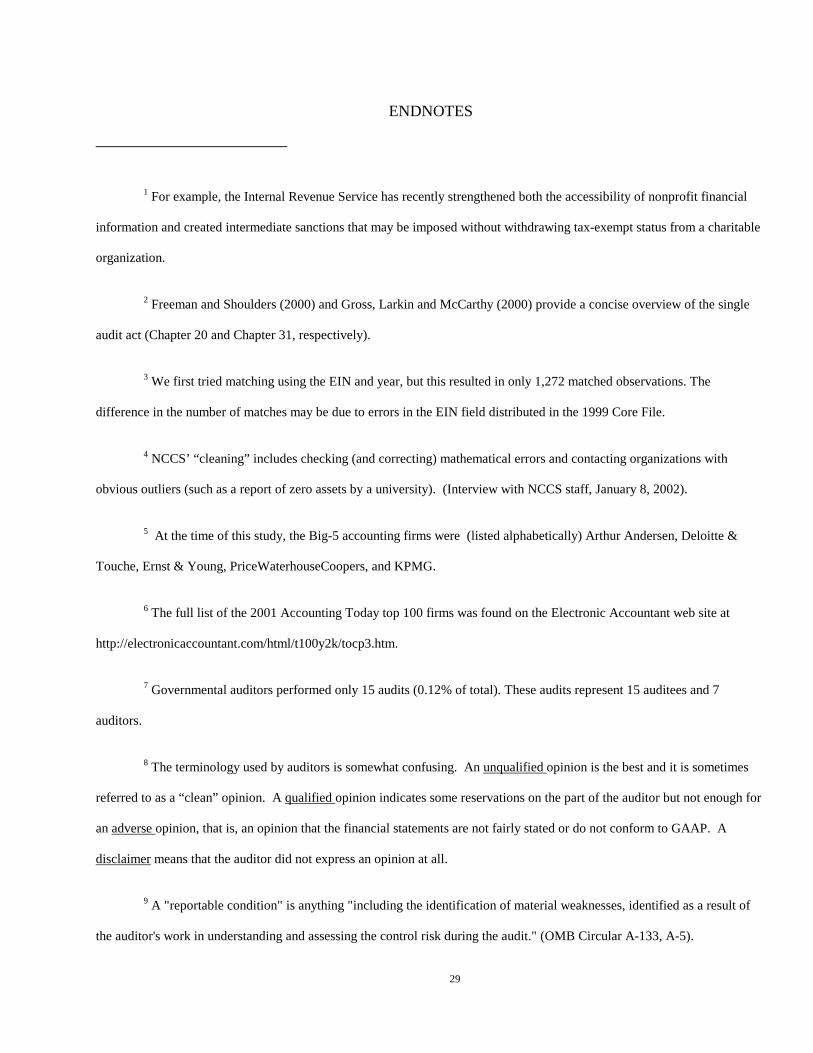
1 For example, the Internal Revenue Service has recently strengthened both the accessibility of nonprofit financial
information and created intermediate sanctions that may be imposed without withdrawing tax-exempt status from a charitable
organization.
2 Freeman and Shoulders (2000) and Gross, Larkin and McCarthy (2000) provide a concise overview of the single
audit act (Chapter 20 and Chapter 31, respectively).
3 We first tried matching using the EIN and year, but this resulted in only 1,272 matched observations. The
difference in the number of matches may be due to errors in the EIN field distributed in the 1999 Core File.
4 NCCS’ “cleaning” includes checking (and correcting) mathematical errors and contacting organizations with
obvious outliers (such as a report of zero assets by a university). (Interview with NCCS staff, January 8, 2002).
5 At the time of this study, the Big-5 accounting firms were (listed alphabetically) Arthur Andersen, Deloitte &
Touche, Ernst & Young, PriceWaterhouseCoopers, and KPMG.
6 The full list of the 2001 Accounting Today top 100 firms was found on the Electronic Accountant web site at
http://electronicaccountant.com/html/t100y2k/tocp3.htm.
7 Governmental auditors performed only 15 audits (0.12% of total). These audits represent 15 auditees and 7
auditors.
8 The terminology used by auditors is somewhat confusing. An unqualified opinion is the best and it is sometimes
referred to as a “clean” opinion. A qualified opinion indicates some reservations on the part of the auditor but not enough for
an adverse opinion, that is, an opinion that the financial statements are not fairly stated or do not conform to GAAP. A
disclaimer means that the auditor did not express an opinion at all.
9 A "reportable condition" is anything "including the identification of material weaknesses, identified as a result of
the auditor's work in understanding and assessing the control risk during the audit." (OMB Circular A-133, A-5).

30
10 These criteria include audit findings in the previous period, length of time since the last audit, the life cycle of the
federal program (first and last years may be higher risk), the auditor’s professional judgment of risk, and whether the OMB
has made the program eligible for low-risk status.
Related Documents