microorganisms Article The Simplified Human Intestinal Microbiota (SIHUMIx) Shows High Structural and Functional Resistance against Changing Transit Times in In Vitro Bioreactors Stephanie Serena Schäpe 1, † , Jannike Lea Krause 2, † , Beatrice Engelmann 1 , Katarina Fritz-Wallace 1 , Florian Schattenberg 3 , Zishu Liu 3 , Susann Müller 3 , Nico Jehmlich 1 , Ulrike Rolle-Kampczyk 1 , Gunda Herberth 2, † and Martin von Bergen 1,4, * , † 1 Department of Molecular Systems Biology, Helmholtz-Centre for Environmental Research—UFZ GmbH, 04316 Leipzig, Germany; [email protected] (S.S.S.); [email protected] (B.E.); [email protected] (K.F.-W.); [email protected] (N.J.); [email protected] (U.R.-K.) 2 Department of Environmental Immunology, Helmholtz-Centre for Environmental Research—UFZ GmbH, 04316 Leipzig, Germany; [email protected] (J.L.K.); [email protected] (G.H.) 3 Department of Environmental Microbiology, Helmholtz-Centre for Environmental Research—UFZ GmbH, 04316 Leipzig, Germany; fl[email protected] (F.S.); [email protected] (Z.L.); [email protected] (S.M.) 4 Institute of Biochemistry, Faculty of Biosciences, Pharmacy and Psychology, University of Leipzig, 04103 Leipzig, Germany * Correspondence: [email protected]; Tel.: +49-341-235-1211 † These authors contributed equally to this work. Received: 14 June 2019; Accepted: 20 September 2019; Published: 3 December 2019 Abstract: Many functions in host–microbiota interactions are potentially influenced by intestinal transit times, but little is known about the effects of altered transition times on the composition and functionality of gut microbiota. To analyze these effects, we cultivated the model community SIHUMIx in bioreactors in order to determine the effects of varying transit times (TT) on the community structure and function. After five days of continuous cultivation, we investigated the influence of different medium TT of 12 h, 24 h, and 48 h. For profiling the microbial community, we applied flow cytometric fingerprinting and revealed changes in the community structure of SIHUMIx during the change of TT, which were not associated with changes in species abundances. For pinpointing metabolic alterations, we applied metaproteomics and metabolomics and found, along with shortening the TT, a slight decrease in glycan biosynthesis, carbohydrate, and amino acid metabolism and, furthermore, a reduction in butyrate, methyl butyrate, isobutyrate, valerate, and isovalerate concentrations. Specifically, B. thetaiotaomicron was identified to be affected in terms of butyrate metabolism. However, communities could recover to the original state afterward. This study shows that SIHUMIx showed high structural stability when TT changed—even four-fold. Resistance values remained high, which suggests that TTs did not interfere with the structure of the community to a certain degree. Keywords: In vitro model; microbial community; flow cytometry; metaproteomics; metabolomics; short-chain fatty acids; intestinal microbiota; SIHUMIx; bioreactor 1. Introduction The human intestine harbors hundreds of bacterial species that are associated with human health and disease [1,2]. This association is mainly due to changes in metabolic interactions with the host Microorganisms 2019, 7, 641; doi:10.3390/microorganisms7120641 www.mdpi.com/journal/microorganisms

Welcome message from author
This document is posted to help you gain knowledge. Please leave a comment to let me know what you think about it! Share it to your friends and learn new things together.
Transcript

microorganisms
Article
The Simplified Human Intestinal Microbiota(SIHUMIx) Shows High Structural and FunctionalResistance against Changing Transit Times inIn Vitro Bioreactors
Stephanie Serena Schäpe 1,†, Jannike Lea Krause 2,†, Beatrice Engelmann 1,Katarina Fritz-Wallace 1 , Florian Schattenberg 3, Zishu Liu 3 , Susann Müller 3,Nico Jehmlich 1 , Ulrike Rolle-Kampczyk 1 , Gunda Herberth 2,† and Martin von Bergen 1,4,*,†
1 Department of Molecular Systems Biology, Helmholtz-Centre for Environmental Research—UFZ GmbH,04316 Leipzig, Germany; [email protected] (S.S.S.); [email protected] (B.E.);[email protected] (K.F.-W.); [email protected] (N.J.); [email protected] (U.R.-K.)
2 Department of Environmental Immunology, Helmholtz-Centre for Environmental Research—UFZ GmbH,04316 Leipzig, Germany; [email protected] (J.L.K.); [email protected] (G.H.)
3 Department of Environmental Microbiology, Helmholtz-Centre for Environmental Research—UFZ GmbH,04316 Leipzig, Germany; [email protected] (F.S.); [email protected] (Z.L.);[email protected] (S.M.)
4 Institute of Biochemistry, Faculty of Biosciences, Pharmacy and Psychology, University of Leipzig,04103 Leipzig, Germany
* Correspondence: [email protected]; Tel.: +49-341-235-1211† These authors contributed equally to this work.
Received: 14 June 2019; Accepted: 20 September 2019; Published: 3 December 2019�����������������
Abstract: Many functions in host–microbiota interactions are potentially influenced by intestinaltransit times, but little is known about the effects of altered transition times on the compositionand functionality of gut microbiota. To analyze these effects, we cultivated the model communitySIHUMIx in bioreactors in order to determine the effects of varying transit times (TT) on thecommunity structure and function. After five days of continuous cultivation, we investigated theinfluence of different medium TT of 12 h, 24 h, and 48 h. For profiling the microbial community,we applied flow cytometric fingerprinting and revealed changes in the community structure ofSIHUMIx during the change of TT, which were not associated with changes in species abundances.For pinpointing metabolic alterations, we applied metaproteomics and metabolomics and found,along with shortening the TT, a slight decrease in glycan biosynthesis, carbohydrate, and amino acidmetabolism and, furthermore, a reduction in butyrate, methyl butyrate, isobutyrate, valerate, andisovalerate concentrations. Specifically, B. thetaiotaomicron was identified to be affected in terms ofbutyrate metabolism. However, communities could recover to the original state afterward. This studyshows that SIHUMIx showed high structural stability when TT changed—even four-fold. Resistancevalues remained high, which suggests that TTs did not interfere with the structure of the communityto a certain degree.
Keywords: In vitro model; microbial community; flow cytometry; metaproteomics; metabolomics;short-chain fatty acids; intestinal microbiota; SIHUMIx; bioreactor
1. Introduction
The human intestine harbors hundreds of bacterial species that are associated with human healthand disease [1,2]. This association is mainly due to changes in metabolic interactions with the host
Microorganisms 2019, 7, 641; doi:10.3390/microorganisms7120641 www.mdpi.com/journal/microorganisms

Microorganisms 2019, 7, 641 2 of 19
caused by changes in the bacterial community structure and function. One of the primary rolesof intestinal microbiota is the conversion of nutrients into bioactive compounds, which are takenup by the host [3,4]. Due to the enzymatic break-down of carbohydrates, proteins, and fatty acids,the intestinal microbiota produces essential nutrients, such as short-chain fatty acids (SCFA) andvitamins [5]. SCFA provide energy for intestinal epithelial cells and modulate the host immune systemand, therefore, play a beneficial role in the host’s health [6]. While carbohydrate fermentation results inSCFA production, the fermentation of proteins and amino acids results in the production of branchedshort-chain fatty acids (BCFA). BCFA such as isovalerate, isobutyrate, and 2-methyl butyrate areproduced due to the fermentation of valine, leucine, and isoleucine and serve as precursors for fattyacid synthesis or as nitrogen donors for the production of other amino acids [7,8]. The concentrationof these bioactive compounds depends on daily food intake and the type of food. Hence, nutrientconcentrations in the gut change and can, thereby, affect metabolic interactions. Changes in nutrientconcentrations can not only vary due to different amounts of food intake but also due to variations inintestinal transit times, dietary amount, and health state (e.g., infections) [9].
In the human population, differences in intestinal transit times (TTs) are often observed. They havebeen associated with differences in stool frequency and, therefore, have been linked to changes inthe gut microbiota composition [10,11]. In healthy human individuals, the whole gut TT varies buttakes approximately 27 h from which 18 h refer to the colonic TT [12–14]. Child et al. compared20 h and 60 hTTs and found that 20 hTT resulted in a decrease or loss of bacterial populations,e.g., Rumminococcus and Roseburia compared to 60 hTT [15]. In addition to the community composition,the metabolism was also affected. Tottey et al. observed, at an increased TT from 48 h to 96 h,a decrease in biomass and an increase in protein fermentation, while SCFA production remainedmainly unaffected [16]. Furthermore, changes in TT also affected the fermentation production of asingle species. For example, C. tyrobutyricum showed a higher butyrate production within a shorter TTof 8 h compared to 16.7 h [17]. Nevertheless, all of these intestinal in vitro models used complex fecalcommunities, which evolve differently in in vitro systems [18,19].
The effect of intestinal TTs was investigated in the past in various bioreactor models by the use ofdifferent TTs, but effects on structure and function have not been fully understood [15,16,20]. In vitrobioreactor systems are useful tools to investigate environmental stressors on microbial communities,since they overcome the limitations of conventional culture techniques [5]. Most in vitro bioreactormodels use fecal inocula and, therefore, face the problem of missing the establishment of a reproduciblecomplex microbial community [21]. Moreover, for metaproteome analysis of complex microbialcommunities, the major challenge is to achieve sufficient proteome coverage in order to generate acomprehensive picture of the community structure and function [22,23]. To overcome these challenges,we recently established an extended simplified human intestinal microbiota (SIHUMIx) for in vitrouse (Krause et al., in revision at Gut Microbes journal). This model community consists of eightbacterial species resembling, to a large extent, the metabolic activities found in the human intestine [24].Rothe et al. [25] also selected the strains because the genome sequences were available. Functions thatare known to be fulfilled by each species are given in Supplementary Material Table S1. Several previousstudies with SIHUMIx have been published in which gnotobiotic mice were seeded with SIHUMIxor part of the SIHUMIx strains to investigate an interaction between host and gut microbiota [26–29].Data from Becker et al. were also used for modelling approaches [30]. We found that SIHUMIxmaintained its structure to a high degree when cultivated continuously and reached the ability to stayessentially unchanged after five days, which serves as the starting point for experimental treatments(Krause et al., in revision at Gut Microbes journal). In contrast to complex microbial communities, it iseasier to unravel the impact of environmental stressors on a structural and functional level in simplifiedmicrobiota [5]. However, low complex bacterial communities are expected to be less stable againstperturbations compared to complex communities [11].
Since different intestinal TTs have been shown to affect complex bacterial communities, the effectson structure and function are not fully understood. Therefore, we cultivated SIHUMIx with a 24-hTT

Microorganisms 2019, 7, 641 3 of 19
until the communities adapted to the system. The adaptation was followed by changes in TT toa faster (12 h) and a slower value (48 h), which results in a high, medium, and low availability ofnutrients. The community structure and activity of SIHUMIx were investigated using microbial flowcytometry, metaproteomics, and short-chain fatty acids (SCFA) metabolomics analysis. We aimed toinvestigate, if (1) SIHUMIx shows structural or functional changes in response to a shift in TT, if (2)these parameters recover from lower and higher TTs to the original state, and if (3) visualized changesare restricted to specific species.
2. Materials and Methods
2.1. Simplified Human Intestinal Microbiota—SIHUMIx
The extended simplified human intestinal microbiota (SIHUMIx) consist of the followingeight bacterial strains: Anaerostipes caccae (DSMZ 14662), Bacteroides thetaiotaomicron (DSMZ 2079),Bifidobacterium longum (NCC 2705), Blautia producta (DSMZ 2950), Clostridium butyricum (DSMZ10702), Clostridium ramosum (DSMZ 1402), Escherichia coli K-12 (MG1655), and Lactobacillus plantarum(DSMZ 20174) [24]. Further information on functions fulfilled by SIHUMIx is provided (Table S1).The cultivation protocol, growth conditions, and medium ingredients are provided in SupplementaryMaterial S2.
2.2. Experimental Set-Up
For inoculation of the bioreactor system, the single strain bacteria were thawed from a freshglycerol stock two weeks before the experiment started and grown in Brain-Heart-Infusion (BHI),as described (Supplementary Material Table S2). Bacteria from three-day-old cultures were countedat the Multi-Sizer 3 (Beckman Coulter, Brea, United States) and used for inoculation. On the day ofinoculation (d0) 1 × 10⁹ bacteria per strain (a total of 8 × 10⁹ bacteria per 250 mL) were inoculated intothe bioreactor. The continuous cultivation started after 24 h.
The bioreactor run can be divided into three phases: (i) the adaptation phase where the bacterialcommunity was established (d1–d5), (ii) the intermediary phase where the effect of different nutrientflowrates on the community was investigated (d6–d10), and (iii) the last phase in which the varyingTTs were set back and the communities were rebalanced (d11–d15). The control bioreactors (labeledas 24 hTTI and II) were run with a dilution rate of 0.04 h−1 (24 h transit time, hTT) during the wholeexperiment (d1–d15). The dilution rate was calculated as reported in Macfarlane et al. [20], whichis equal to the physiological TT of the human colon [13]. In four other bioreactors, dilution rates of0.04 h−1 were maintained for the adaptation phase and the set-back phase and were set to a dilutionrate of 0.08 h−1 (labeled as 12 hTTI and II) and 0.02 h−1 (labeled as 48 hTTI and II), respectively, withinthe intermediary phase (d6–d10) (Figure 1).

Microorganisms 2019, 7, 641 4 of 19
Microorganisms 2019, 7, x FOR PEER REVIEW 4 of 19
Figure 1. Set up of the bioreactor experiment: six bioreactors were run sterile for 24 h and inoculated with SIHUMIx (1 × 10⁹ cells per species per 250 mL) on day zero. On day one, medium pumps were set to a dilution rate of 0.04 h−1 until day five (adaptation). On day five, the dilution rate was changed to 0.02 h−1 (48 hTTI and II) or 0.08 h−1 (12 hTTI and II) in two bioreactors, respectively (change of TT), and set back to 0.04 h-1 on day 10 to day 15 (set back of TT). By setting the dilution rate to 0.08h−1/0.04 h−1/0.02 h−1, the medium in the bioreactor was fully exchanged, which resulted in TTs of 12 h, 24 h, and 48 h, respectively. S = sterile run. I = inoculation.
2.4. Microbial Flow Cytometry
2.4.1. Sample Preparation
The bacterial suspension was centrifuged (3200× g, 10 min, 4 °C) in conic glass tubes. Bacteria were treated with 2% formaldehyde [stock: 8% formaldehyde pH 7, diluted with PBS (6 mM Na2HPO4, 1.8 mM NaH2PO4, and 145 mM NaCl with bi-distilled water, pH 7)] for 30 min. The bacteria were centrifuged and resuspended in 70% ethanol for further fixation and long-term storage at −20 °C.
After a minimum of one day at −20 °C, the samples were stained with 0.24 µM 4′,6-di-amidino-2-phenyl-indole (DAPI, Sigma-Aldrich, St-Louis, USA) overnight, according to Koch et al. [31]. The measurement was performed according to Gelder et al. [34], but with a different neutral density filter (ND 2.6) for the side scatter (SSC) and measuring 250,000 cells in the cell gate (Supplementary Material, Figure S1). Raw cytometric data can be found at www.flowrespository.org with the flow repository ID: FR-FCM-Z24C.
For flow cytometric analysis and statistical data analysis, FlowJo V10 (FlowJo, LLC, Ashland, USA) was used to visualize each sample in 2D plots using forward scatter (FSC) vs. DAPI fluorescence. The relative cell abundance per gate was exported as .txt and jointly evaluated in R (vegan package) [35].
2.4.2. Calculation of Stability Properties
The stability properties (i.e., constancy, resistance, and recovery) of SIHUMIx were quantified on the basis of cytometric data. For each bioreactor, constancy was interpreted by a constancy space, which is a multi-dimensional dissimilarity space where the radius is determined by the variation of chosen community states (deviation values determined by Canberra distance, CD). The constancy space was defined using samples from the two 24 hTTI and II using community states from the end of the adaptation phase (day 5) to the end of the experiment (day 15, n = 11), which resembles intrinsic community variation over time. The larger radius of the two constancy spaces from the two control bioreactors (i.e., 24 hTTI, tr = 0.1447, Supplementary Material Figure S2.1) was used as the threshold value to indicate the highest possible community deviation without TT changes.
Additionally, stability properties were calculated by resistance values (RS) (i.e., the ability of a community to stay unchanged) and recovery values (i.e., the ability of a community to return into the constancy space). For that, the community states at the end of the respective adaptation phases (reference state, SRef, day 5 per bioreactor) were successively compared with the community states
Figure 1. Set up of the bioreactor experiment: six bioreactors were run sterile for 24 h and inoculatedwith SIHUMIx (1 × 10⁹ cells per species per 250 mL) on day zero. On day one, medium pumps wereset to a dilution rate of 0.04 h−1 until day five (adaptation). On day five, the dilution rate was changedto 0.02 h−1 (48 hTTI and II) or 0.08 h−1 (12 hTTI and II) in two bioreactors, respectively (change of TT),and set back to 0.04 h−1 on day 10 to day 15 (set back of TT). By setting the dilution rate to 0.08 h−1/0.04h−1/0.02 h−1, the medium in the bioreactor was fully exchanged, which resulted in TTs of 12 h, 24 h,and 48 h, respectively. S = sterile run. I = inoculation.
2.3. Sampling and Analysis
During the whole experiment, samples were taken every 24 h starting the day after inoculation(d1). The stability properties of the community structure were analyzed using microbial flowcytometry [31,32]. Cell numbers were determined with electrical sensing using a Multisizer 3 CoulterCounter (Beckman Coulter, Brea, United States). The community structure and the functionality ofSIHUMIx were analyzed using meta-proteomics. After sampling, the bacterial suspensions werecentrifuged at 3200× g for 10 min at 4 ◦C and immediately frozen at −80 ◦C for subsequent sampleanalysis or used for the fixation of microbial flow cytometry or dry weight assessment. Supernatantsof bacterial pellets were used for functional analysis with targeted metabolomics to perform SCFAprofiling [33].
2.4. Microbial Flow Cytometry
2.4.1. Sample Preparation
The bacterial suspension was centrifuged (3200× g, 10 min, 4 ◦C) in conic glass tubes. Bacteriawere treated with 2% formaldehyde [stock: 8% formaldehyde pH 7, diluted with PBS (6 mM Na2HPO4,1.8 mM NaH2PO4, and 145 mM NaCl with bi-distilled water, pH 7)] for 30 min. The bacteria werecentrifuged and resuspended in 70% ethanol for further fixation and long-term storage at −20 ◦C.
After a minimum of one day at −20 ◦C, the samples were stained with 0.24 µM4′,6-di-amidino-2-phenyl-indole (DAPI, Sigma-Aldrich, St-Louis, USA) overnight, according toKoch et al. [31]. The measurement was performed according to Gelder et al. [34], but with a differentneutral density filter (ND 2.6) for the side scatter (SSC) and measuring 250,000 cells in the cell gate(Supplementary Material, Figure S1). Raw cytometric data can be found at www.flowrespository.orgwith the flow repository ID: FR-FCM-Z24C.
For flow cytometric analysis and statistical data analysis, FlowJo V10 (FlowJo, LLC, Ashland,USA) was used to visualize each sample in 2D plots using forward scatter (FSC) vs. DAPI fluorescence.The relative cell abundance per gate was exported as .txt and jointly evaluated in R (vegan package) [35].
2.4.2. Calculation of Stability Properties
The stability properties (i.e., constancy, resistance, and recovery) of SIHUMIx were quantifiedon the basis of cytometric data. For each bioreactor, constancy was interpreted by a constancy space,which is a multi-dimensional dissimilarity space where the radius is determined by the variation of

Microorganisms 2019, 7, 641 5 of 19
chosen community states (deviation values determined by Canberra distance, CD). The constancyspace was defined using samples from the two 24 hTTI and II using community states from the end ofthe adaptation phase (day 5) to the end of the experiment (day 15, n = 11), which resembles intrinsiccommunity variation over time. The larger radius of the two constancy spaces from the two controlbioreactors (i.e., 24 hTTI, tr = 0.1447, Supplementary Material Figure S2) was used as the thresholdvalue to indicate the highest possible community deviation without TT changes.
Additionally, stability properties were calculated by resistance values (RS) (i.e., the ability of acommunity to stay unchanged) and recovery values (i.e., the ability of a community to return intothe constancy space). For that, the community states at the end of the respective adaptation phases(reference state, SRef, day 5 per bioreactor) were successively compared with the community statesduring the following days of cultivation. The resulting CD values were used to calculate the resistantbehavior and recovery strength of the microbial community following published guidelines [32].
2.5. Metaproteomics
2.5.1. Protein Extraction
An amount of 2 mL bioreactor liquid was taken, centrifuged (3200× g, 10 min, 4 ◦C), and thepellet was dissolved in 1 mL lysis buffer (10 mM Tris-HCl, NaCl 2 mg/mL, 1 mM PMSF, 4 mg/mLSDS). Bacteria were disrupted by bead beating (FastPrep-24, MP Biomedicals, Sanra Ana, CA, USA,5.5 ms, 1 min, 3 cycles) followed by 15 min at 60 ◦C (Thermomixer comfort 5355, Eppendorf, Hamburg,Germany) and ultra-sonication (UP50H, Hielscher, Teltow, Germany, cycle 0.5, amplitude 60%). Proteinconcentration was determined with the bicinchoninic acid assay, according to the user manual (Pierce™BCA Protein Assay Kit, Thermo Fischer Scientific, Waltham, MA, USA). Furthermore, 100 µg ofprotein was precipitated overnight at −20 ◦C with ice-cold acetone 1:5 (v/v) and centrifuged for10 min at 14,000× g. The pellet was used for sodium dodecyl sulfate poly acryl amid one-dimensionalgel electrophorese (SDS–PAGE). SDS-PAGE analysis, in-gel digestion, and protein purification withZipTip®treatment were performed [36].
2.5.2. Liquid chromatography mass spectrometry (LC-MS/MS) Measurement
An amount of 5 µg peptide lysate was injected into nanoHPLC (UltiMate 3000 RSLCnano,Dionex, Thermo Fisher Scientific, Waltham, MA, USA). Peptide separation was performed on aC18-reverse-phase trapping column (C18 PepMap100, 300 µm × 5 mm, particle size 5 µm, nano viper,Thermo Fischer Scientific, Waltham, MA, USA), which was followed by a C18-reverse-phase analyticalcolumn (Acclaim PepMap® 100, 75µm× 25 cm, particle size 3µm, nanoViper, Thermo Fischer Scientific).Mass spectrometric analysis of peptides was performed on a Q Exactive HF mass spectrometer (ThermoFisher Scientific, Waltham, MA, USA) coupled with a TriVersa NanoMate (Advion, Ltd., Harlow, UK)source in the liquid chromatography (LC) chip coupling mode. LC gradient, ionization mode, and themass spectrometry mode were described [37].
2.5.3. Data Analysis
Raw data were processed with Proteome Discoverer (v 2.2, Thermo Fischer Scientific, Waltham,MA, USA). The search settings for the Sequest HT search engine were set to Trypsin (Full), Max. MissedCleavage: 2, precursor mass tolerance: 10 ppm, fragment mass tolerance: 0.02 Da. The protein-codingsequences of the eight SIHUMIx strains were downloaded from UniProt (Available online: http://www.uniprot.org/), combined, and used as database resulting in 29,558 protein sequences. Individual*.fasta entries per species are given (Table S3). The false discovery rates (FDR) were determined withthe node Percolator [38] embedded in Proteome Discoverer (v 2.2) and we set the FDR threshold ata peptide level of 5%. The same threshold was set for the protein FDR (5%). Redundant proteinsfrom the protein-coding database were automatically grouped in protein groups by applying the strictparsimony principle. Only the protein groups that explain at least one unique identified peptide

Microorganisms 2019, 7, 641 6 of 19
were reported. Only the peptides that were not shared between different proteins or protein groupswere used for the protein quantification through the Top3 approach implemented in the ProteomeDiscoverer (v 2.2). GhoastKOALA was used to assign KEGG orthology (KO) numbers of KEGG tothe identified functions of identified protein sequences. A protein report from Proteome Discovererwith assigned taxa and functional information from KEEG are provided (Supplementary Material S4).Only pathways with sufficient coverage (>10%) on the total amount per sample were used for statisticalanalysis. For specific pathway abundances, only pathways with sufficient relative abundance (>0.01%)per sample were evaluated. Visualization and statistical analysis were carried out with the GraphPadPrism (v. 8.0.2) using unpaired multiple t-tests per row. A Pearson correlation was performed within-house written R scripts (Hmisc package using the rcorr function).
2.6. Metabolomics
2.6.1. Metabolite Extraction
For the analysis of short-chain fatty acids (SCFAs), the method of Han et al. was modified [33,39].The sample was mixed with acetonitrile to a final concentration of 50% acetonitrile. SCFAs werederivatized with 0.5 volumes of 200 mM 3-nitrophenylhydrazine and 0.5 volumes of 120 mMN-(3-dimethylaminopropyl)-N′-ethylcarbodiimide hydrochloride in pyridine for 30 min at 40 ◦C.The mix was then diluted 1:50 in 10% acetonitrile.
2.6.2. LC-MS/MS Measurement and Data Analysis
An amount of 50 µL of the diluted SCFA derivatives was injected into the LC-MS/MS system.Chromatographic separation of SCFAs was performed on an Acquity UPLC BEH C18 column (1.7 µm,Waters, Eschborn, Germany) using H2O (0.01% formic acid, FA) and acetonitrile (0.01% FA) as themobile phases. The column flow rate was set to 0.35 mL/min and the column temperature was setat 40 ◦C. The gradient elution was performed as follows: 2 min at 15% B, 15%–50% B in 15 min,and then held at 100% B for 1 min. Lastly, the column was equilibrated for 3 min at 15% B. Massspectrometric analysis of metabolites was performed QTRAP®5500 (AB Sciex, Framingham, MA,USA). For identification and quantitation, a scheduled multiple reaction monitoring (MRM) methodwas used, with specific transitions for every SCFA. Peak areas were determined in Analyst® Software(v. 1.6.2, AB Sciex) and areas for single SCFAs were exported. Normalization and statistics wereperformed with in-house written R scripts.
3. Results
3.1. Adaptation Phase of SIHUMIx under Continuous Cultivation Conditions
Bioreactors (n = 6) were inoculated with 1 × 10⁹ cells/250 mL per species of the SIHUMIx bacteriaand cultivated for five days (adaptation phase) until reaching a structural and functional constantstate (Figure 2A) (Krause et al., in revision at the Gut Microbes Journal). To evaluate the speciesdistribution of SIHUMIx, the community composition was analyzed based on the abundance ofspecies-specific proteins [33,40]. In total (n = 90 samples), 7307 protein groups were identified. Proteingroup identification per sample is given (Supplementary Material Table S4). Within the first 24 h afterinoculation, the relative abundance of Clostridia (C. ramosum, C. butyricum), Lactobacillus (L. plantarum),and Bifidobacterium (B. longum) clearly decreased, whereas the other SIHUMIx members, Anerostipes(A. caccae), Bacteroides (B. thetaiotaomicron), Blautia (B. producta) and Escherichia (E. coli), increased(Figure 2B). During the following four days, the abundance of B. thetaiotaomicron continued to increase,whereas the relative abundance of A. caccae and E. coli decreased. At the end of the adaptation phase(day 5), B. thetaiotaomicron, B. producta, E. coli, and A. caccae were the dominant members of SIHUMIxwith 66%, 12%, 10.2%, and 2.7%, respectively.

Microorganisms 2019, 7, 641 7 of 19
Microorganisms 2019, 7, x FOR PEER REVIEW 7 of 19
Figure 2. (A) Schematic overview of sample analysis to describe a stable functional state. CIM = Complex Intestinal Medium, S = sterile run, I = Inoculation, and A = adaptation. (B) The stacked bar graphs show taxa distribution over time (TT 24 h, n = 2) based on the relative protein abundance per species. (C) Absolute acetate, butyrate, and propionate concentrations over time.
The impacts on the community structure and SCFA production were followed with two fingerprinting methods: flow cytometric fingerprinting based on flow cytometric data and short-chain fatty acid analysis based on the SCFA concentrations. With dissimilarity analysis (visualized as non-metric multidimensional scaling (NMDS) plots), the effects of different TTs on the community structures were indicated. The end of the adaptation phase of all six bioreactors was included as a landmark for the following changes of both the community structures and the metabolic activities (Figures 3B,C, grey ellipse without outline, “end of adaptation”). Grouping refers to the different phases of the experiment (see legend in Figures 2B,2C). All the Bray-Curtis Dissimilarity’s (BD) of flow cytometric data, which were used for the NMDS plotting, are given (Table S5). All groups were compared by pairwise ANOVA. R2 and P values of all group comparisons are given (Table S6).
Flow cytometric fingerprinting showed that SIHUMIx was affected by the increase and decrease of the TT regarding the community structure (Figure 3B). A slight difference was visible within the control, referring to days 8 to 10 of the control bioreactors, and the setback phase of the control, referring to days 13 to 15 of the control bioreactors. This indicates that there was a time-dependent structural shift of the community since TT did not change. The constancy spaces were determined for the two control bioreactors and a value of tr = 0.1447 (24 hTTI) was chosen as the accepted maximal intrinsic community variation (Figure S2.1). The proportion of the intrinsic variance between bioreactors and over time was small with regard to the result from pairwise ANOVA testing (control vs. set back control: R2 = 0.61) even though the changes were found to be insignificant (P adjusted = 0.515, Supplementary Material S6). In contrast, a comparison of the
Figure 2. (A) Schematic overview of sample analysis to describe a stable functional state. CIM = ComplexIntestinal Medium, S = sterile run, I = Inoculation, and A = adaptation. (B) The stacked bar graphsshow taxa distribution over time (TT 24 h, n = 2) based on the relative protein abundance per species.(C) Absolute acetate, butyrate, and propionate concentrations over time.
To evaluate the metabolic activity of SIHUMIx, SCFA concentrations were measured daily(Figure 2C). The butyrate concentration was slightly higher on day one (1.1 mM) and stabilized on dayfive (1.02 mM). Acetate and propionate started at 1.3 mM and 0.3 mM, respectively, and increaseduntil day five to 3.94 mM and 3.40 mM. At day 5, the concentration of acetate and propionate was 3.8(SD = ±0.268) and 3.3 (SD = ±0.377) times higher when compared to butyrate.
3.2. SIHUMIx Shows Slight Changes during Varying Transit Times
The adaptation phase was followed by the intermediary phase in whichTTs were shifted (day 6 to10). In two bioreactors, the TT was set to 12 h and, in another set of two bioreactors, it was set to 48 h,respectively. On day 11, the TTs were set to 24 h again for all bioreactors and maintained until the end ofthe experiment on day 15 (Figure 1). The bacterial cell number was determined (Figure 3A). Comparedto the end of the adaptation phase, the cell numbers stayed unchanged for 12 hTT, but decreasedslightly at 24 hTT and 48 hTT.

Microorganisms 2019, 7, 641 8 of 19
Microorganisms 2019, 7, x FOR PEER REVIEW 8 of 19
communities revealed that, within the changes in the TT, the communities changed significantly (P adjusted = 0.004) during 12 hTT and 48 hTT, which indicates a TT-dependent shift of the community structure. The proportion of intrinsic variance between 12 hTT and 48 hTT (R2 = 6.36) was the highest calculated proportion of variance of all the calculated proportions of variances between the experimental groups. After the TT was set back to 24 h, the communities of the 12 hTT bioreactors reached a state comparable to the end of the adaptation. In contrast, after 48 hTT, the communities did not reach a state comparable to the end of the adaptation.
Additionally, short-chain fatty acid analysis revealed differences during the phases of varying TTs (Figure 3C). All Bray-Curtis Dissimilarity’s of SCFA concentrations, which were used for the NMDS plots, are given (Table S5). All the groups were compared by pairwise ANOVA testing. The P values of all the group comparisons are given (Table S6). During 12 hTT and 48 hTT, the SCFA composition was significantly changed (R2 = 7.33, P adjusted = 0.012), but reached a state comparable to the end of the adaptation afterward (end of adaptation vs. set back at 48 hTT R2 = 1.87, P adjusted = 0.191, end of adaptation vs. setback 12 hTT R2 = 1.93, P adjusted = 0.817). Only one further significant difference was found, namely between 12 hTT and the set back control (R2 = 5.23, P adjusted = 0.035), but the proportion of variance between bioreactors was smaller compared to 12 hTT vs. 48 hTT.
Figure 3. (A) Cell numbers of SIHUMIx. The NMDS plots show community dynamics during the experiment (Bray-Curtis dissimilarity) based on flow cytometry subpopulations (B) and absolute SCFA concentrations (C). The end of the adaptation of SIHUMIx is marked with a light grey ellipse. Control: dark grey ellipse with the dashed outline including days 8 to 10 and set back control: dark grey ellipse with the bold outline including days 13 to 15.
Figure 3. (A) Cell numbers of SIHUMIx. The NMDS plots show community dynamics during theexperiment (Bray-Curtis dissimilarity) based on flow cytometry subpopulations (B) and absolute SCFAconcentrations (C). The end of the adaptation of SIHUMIx is marked with a light grey ellipse. Control:dark grey ellipse with the dashed outline including days 8 to 10 and set back control: dark grey ellipsewith the bold outline including days 13 to 15.
The impacts on the community structure and SCFA production were followed with twofingerprinting methods: flow cytometric fingerprinting based on flow cytometric data and short-chainfatty acid analysis based on the SCFA concentrations. With dissimilarity analysis (visualized asnon-metric multidimensional scaling (NMDS) plots), the effects of different TTs on the communitystructures were indicated. The end of the adaptation phase of all six bioreactors was included as alandmark for the following changes of both the community structures and the metabolic activities(Figure 3B,C, grey ellipse without outline, “end of adaptation”). Grouping refers to the differentphases of the experiment (see legend in Figure 2B,C). All the Bray-Curtis Dissimilarity’s (BD) of flowcytometric data, which were used for the NMDS plotting, are given (Table S5). All groups werecompared by pairwise ANOVA. R2 and P values of all group comparisons are given (Table S6).
Flow cytometric fingerprinting showed that SIHUMIx was affected by the increase and decrease ofthe TT regarding the community structure (Figure 3B). A slight difference was visible within the control,referring to days 8 to 10 of the control bioreactors, and the setback phase of the control, referring todays 13 to 15 of the control bioreactors. This indicates that there was a time-dependent structuralshift of the community since TT did not change. The constancy spaces were determined for the two
Microorganisms 2019, 7, 641 9 of 19
control bioreactors and a value of tr = 0.1447 (24 hTTI) was chosen as the accepted maximal intrinsiccommunity variation (Figure S2). The proportion of the intrinsic variance between bioreactors and overtime was small with regard to the result from pairwise ANOVA testing (control vs. set back control:R2 = 0.61) even though the changes were found to be insignificant (P adjusted = 0.515, SupplementaryMaterial Figure S6). In contrast, a comparison of the communities revealed that, within the changesin the TT, the communities changed significantly (P adjusted = 0.004) during 12 hTT and 48 hTT,which indicates a TT-dependent shift of the community structure. The proportion of intrinsic variancebetween 12 hTT and 48 hTT (R2 = 6.36) was the highest calculated proportion of variance of all thecalculated proportions of variances between the experimental groups. After the TT was set back to24 h, the communities of the 12 hTT bioreactors reached a state comparable to the end of the adaptation.In contrast, after 48 hTT, the communities did not reach a state comparable to the end of the adaptation.
Additionally, short-chain fatty acid analysis revealed differences during the phases of varying TTs(Figure 3C). All Bray-Curtis Dissimilarity’s of SCFA concentrations, which were used for the NMDSplots, are given (Table S5). All the groups were compared by pairwise ANOVA testing. The P values ofall the group comparisons are given (Table S6). During 12 hTT and 48 hTT, the SCFA composition wassignificantly changed (R2 = 7.33, P adjusted = 0.012), but reached a state comparable to the end of theadaptation afterward (end of adaptation vs. set back at 48 hTT R2 = 1.87, P adjusted = 0.191, end ofadaptation vs. setback 12 hTT R2 = 1.93, P adjusted = 0.817). Only one further significant differencewas found, namely between 12 hTT and the set back control (R2 = 5.23, P adjusted = 0.035), but theproportion of variance between bioreactors was smaller compared to 12 hTT vs. 48 hTT.
Pairwise ANOVA analysis revealed less significant differences between the groups based on theSCFA concentrations when compared to those based on flow cytometric data.
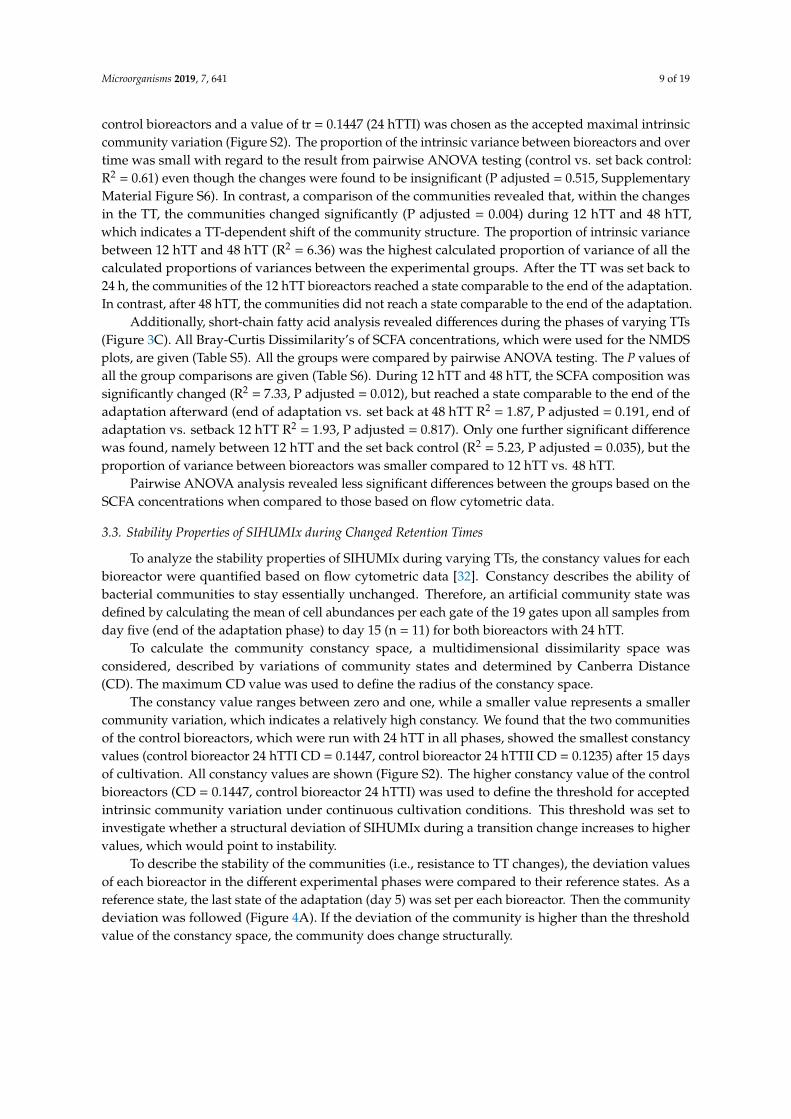
3.3. Stability Properties of SIHUMIx during Changed Retention Times
To analyze the stability properties of SIHUMIx during varying TTs, the constancy values for eachbioreactor were quantified based on flow cytometric data [32]. Constancy describes the ability ofbacterial communities to stay essentially unchanged. Therefore, an artificial community state wasdefined by calculating the mean of cell abundances per each gate of the 19 gates upon all samples fromday five (end of the adaptation phase) to day 15 (n = 11) for both bioreactors with 24 hTT.
To calculate the community constancy space, a multidimensional dissimilarity space wasconsidered, described by variations of community states and determined by Canberra Distance(CD). The maximum CD value was used to define the radius of the constancy space.
The constancy value ranges between zero and one, while a smaller value represents a smallercommunity variation, which indicates a relatively high constancy. We found that the two communitiesof the control bioreactors, which were run with 24 hTT in all phases, showed the smallest constancyvalues (control bioreactor 24 hTTI CD = 0.1447, control bioreactor 24 hTTII CD = 0.1235) after 15 daysof cultivation. All constancy values are shown (Figure S2). The higher constancy value of the controlbioreactors (CD = 0.1447, control bioreactor 24 hTTI) was used to define the threshold for acceptedintrinsic community variation under continuous cultivation conditions. This threshold was set toinvestigate whether a structural deviation of SIHUMIx during a transition change increases to highervalues, which would point to instability.
To describe the stability of the communities (i.e., resistance to TT changes), the deviation valuesof each bioreactor in the different experimental phases were compared to their reference states. As areference state, the last state of the adaptation (day 5) was set per each bioreactor. Then the communitydeviation was followed (Figure 4A). If the deviation of the community is higher than the thresholdvalue of the constancy space, the community does change structurally.

Microorganisms 2019, 7, 641 10 of 19
Microorganisms 2019, 7, x FOR PEER REVIEW 10 of 19
Figure 4. (A) The deviation of SIHUMIx from SRef. Tr = threshold of constancy space. Sref = reference state. (B) Resistance calculation based on flow cytometric data. (C) The stacked bar graphs show the taxa distribution of SIHUMx (12 h/24 h/48 h, n = 2) based on the abundance of species-specific proteins during the phase of changed TT and during the set back of TT afterward.
Although relative species abundance was not affected (Figure 4C), differences were found in specific functions of SIHUMIx (Figure 5A). Differences were observed between 12 hTT and 48 hTT for the following KEGG pathways: ribosome (p = 0.0013), chaperones and folding catalysts (p = 0.0008), RNA degradation (p = 0.0311), alanine, aspartate, and glutamate metabolism (p = 0.002), butanoate metabolism (p = 0.0027), amino sugar and nucleotide sugar metabolism (p = 0.036), propanoate metabolism (p = 0.049), arginine biosynthesis (p = 0.0111), phosphotransferase system (PTS) (p = 0.004), and peptidoglycan biosynthesis and degradation proteins (p = 0.0016). All the pathways were less abundant at 12 hTT compared to 48 hTT, except for the ribosome, which were more abundant at 12 hTT. On a species level, slight changes in relative abundances were found for 27 pathways identified in A. caccae, B. thetaiotaomicron, B. producta, and E. coli, which are the most abundant species in the SIHUMIx community (Figure 5B).
Figure 4. (A) The deviation of SIHUMIx from SRef. Tr = threshold of constancy space. Sref = referencestate. (B) Resistance calculation based on flow cytometric data. (C) The stacked bar graphs show thetaxa distribution of SIHUMx (12 h/24 h/48 h, n = 2) based on the abundance of species-specific proteinsduring the phase of changed TT and during the set back of TT afterward.
The deviation values of the control bioreactors were close to the threshold value after 15 daysof cultivation, which indicates that the community deviation was similar to the intrinsic variation,calculated by the constancy space. For 12 hTT, the community deviated, with a maximum value of0.275 (bioreactor 12 hTTI, at day 8) and 0.233 (bioreactor 12 hTTII, at day 10). The community statesof the samples from bioreactor 48 hTTI showed at day 10, with a maximum deviation value of 0.188,the state that has a deviation higher than the threshold. In contrast, even with the same settings,bioreactor 48 hTTII deviated from its reference state immediately and reached the highest deviationvalue of 0.2765 at day 14.
Furthermore, resistance (RS) values for all the bioreactors were calculated based on the deviationvalues. The RS values of all the bioreactors were within the range of 0.72 to 0.85, which indicates arelatively high resistance against changing TTs (all the resistance values are shown in the SupplementaryMaterial, Figure S2). The mean RS values for the duplicate bioreactors with the same TTs are shownin Figure 4B. The control showed the highest RS (RS = 0.8114), which is followed by the 48 hTT(RS = 0.7674) and the 12 hTT (RS = 0.7459) bioreactors.
3.4. Changes in TT are Associated with Differences in Specific Pathways
To investigate whether the structural differences were associated with changes in speciesdistribution or function, the metaproteomic analysis was performed. There were no changes inthe taxa distribution of SIHUMIx in all the bioreactors since the end of the adaptation (day 5), despitethe varied TTs (Figure 4C). Relative species abundances are given (Table S7).
Although relative species abundance was not affected (Figure 4C), differences were found inspecific functions of SIHUMIx (Figure 5A). Differences were observed between 12 hTT and 48 hTT for

Microorganisms 2019, 7, 641 11 of 19
the following KEGG pathways: ribosome (p = 0.0013), chaperones and folding catalysts (p = 0.0008),RNA degradation (p = 0.0311), alanine, aspartate, and glutamate metabolism (p = 0.002), butanoatemetabolism (p = 0.0027), amino sugar and nucleotide sugar metabolism (p = 0.036), propanoatemetabolism (p = 0.049), arginine biosynthesis (p = 0.0111), phosphotransferase system (PTS) (p = 0.004),and peptidoglycan biosynthesis and degradation proteins (p = 0.0016). All the pathways were lessabundant at 12 hTT compared to 48 hTT, except for the ribosome, which were more abundant at 12 hTT.On a species level, slight changes in relative abundances were found for 27 pathways identified in A.caccae, B. thetaiotaomicron, B. producta, and E. coli, which are the most abundant species in the SIHUMIxcommunity (Figure 5B).Microorganisms 2019, 7, x FOR PEER REVIEW 11 of 19
Figure 5. (A) Log transformed relative abundance of all proteins identified per pathway for SIHUMIx. (B) Relative pathway abundances of A. caccae, B. thetaiotaomicron, B. producta, and E. coli based on the average of six for the end of adaptation (day 5) or four for 12 h/24 h/48 h (day 9 and 10).
3.5. Changes in TT are Associated with Differences in SCFA Concentrations
In addition to differences in specific functions, SCFA concentrations changed during the varying TTs (Figure 6).
Figure 5. (A) Log transformed relative abundance of all proteins identified per pathway for SIHUMIx.(B) Relative pathway abundances of A. caccae, B. thetaiotaomicron, B. producta, and E. coli based on theaverage of six for the end of adaptation (day 5) or four for 12 h/24 h/48 h (day 9 and 10).

Microorganisms 2019, 7, 641 12 of 19
3.5. Changes in TT are Associated with Differences in SCFA Concentrations
In addition to differences in specific functions, SCFA concentrations changed during the varyingTTs (Figure 6).Microorganisms 2019, 7, x FOR PEER REVIEW 12 of 19
Figure 6. SCFA and branched-chain fatty acids (BCFA) concentrations under different transit times based on the average of six for the end of adaptation (day 5) or four for 12 h/24 h/48 h (day 9 and 10). p value was calculated with multiple t-test (using no p-value adjustment) between 12 hTT and 48hTT. * p < 0.05, ** p < 0.001.
The absolute concentrations of butyrate (p = 0.0049) and valerate (p = 0.0404) were lower at 12 hTT compared to 48 hTT. This was also true for the BCFA methylbutyrate (p = 0.0012), isobutyrate (p = 0.039), and isovalerate (p = 0.0381), which decreased at 12 hTT compared to 48 hTT. The amount of total SCFA and the concentration of acetate and propionate were not affected by changes in TT.
4. Discussion
The colon transit time (TT) has been described as a driving force that affects the composition and metabolism of complex intestinal communities, but the results differ between studies[15,16,20,21]. We recently established an extended simplified human intestinal microbiota (SIHUMIx) for bioreactor used to investigate physiological stressors on a species-specific level (Krause et al., in revision at the Gut Microbes Journal). Since the effects of varying TT on structure and function are not fully understood, we investigated the effects of three physiological colonic TT (48 h, 24 h, 12 h) on SIHUMIx. SIHUMIx was grown for 15 days in a colon simulating bioreactor system. Daily samples were analyzed with metaproteomics, SCFA analysis, and two fingerprinting techniques using flow cytometry data and SCFA concentrations to visualize the effect of changing TT on the community structure and function of SIHUMIx. This study shows that the structure of SIHUMIx was only slightly affected by changing TT and showed high stabilizing abilities after adapting to the bioreactor conditions. Functional changes during changing TT are only partly in accordance with changes found for complex communities, i.e., it could be associated with the relative abundance changes of B. thetaiotaomicron, B. producta, and E. coli, which are the most abundant members of SIHUMIx.
Figure 6. SCFA and branched-chain fatty acids (BCFA) concentrations under different transit timesbased on the average of six for the end of adaptation (day 5) or four for 12 h/24 h/48 h (day 9 and 10).p value was calculated with multiple t-test (using no p-value adjustment) between 12 hTT and 48hTT.* p < 0.05, ** p < 0.001.
The absolute concentrations of butyrate (p = 0.0049) and valerate (p = 0.0404) were lower at12 hTT compared to 48 hTT. This was also true for the BCFA methylbutyrate (p = 0.0012), isobutyrate(p = 0.039), and isovalerate (p = 0.0381), which decreased at 12 hTT compared to 48 hTT. The amount oftotal SCFA and the concentration of acetate and propionate were not affected by changes in TT.
4. Discussion
The colon transit time (TT) has been described as a driving force that affects the composition andmetabolism of complex intestinal communities, but the results differ between studies [15,16,20,21].We recently established an extended simplified human intestinal microbiota (SIHUMIx) for bioreactorused to investigate physiological stressors on a species-specific level (Krause et al., in revision at theGut Microbes Journal). Since the effects of varying TT on structure and function are not fully understood,we investigated the effects of three physiological colonic TT (48 h, 24 h, 12 h) on SIHUMIx. SIHUMIxwas grown for 15 days in a colon simulating bioreactor system. Daily samples were analyzed withmetaproteomics, SCFA analysis, and two fingerprinting techniques using flow cytometry data andSCFA concentrations to visualize the effect of changing TT on the community structure and function ofSIHUMIx. This study shows that the structure of SIHUMIx was only slightly affected by changing TTand showed high stabilizing abilities after adapting to the bioreactor conditions. Functional changes

Microorganisms 2019, 7, 641 13 of 19
during changing TT are only partly in accordance with changes found for complex communities,i.e., it could be associated with the relative abundance changes of B. thetaiotaomicron, B. producta, andE. coli, which are the most abundant members of SIHUMIx.
4.1. SIHUMIx Shows Slight Changes During Varying Transit Times
TT in the bioreactor system can be influenced by differences in pump speed and clogging of thetubes. In order to prevent this (i), all medium pumps were calibrated before the experiments to assureno technical differences between the individual feed pumps and (ii) medium bottles were constantlystirred during the experiment to prevent particle formation.
The total cell number of SIHUMIx fluctuated during the whole experiment, but stayed mainlyunchanged at 12 hTT, whereas the total cell numbers at the 24 hTT (control) and 48 hTT bioreactorsslightly decreased during varying TTs (Figure 3A). The effect of the total cell numbers during 12 hTT isin contrast with studies conducted on complex bacterial communities [15]. In this study, the total cellnumbers were not affected differently by varying TTs.
The different TTs also showed changes in the cytometric community structure using flow cytometricfingerprinting. During the phase of changed TT, communities of 48 hTT and 12 hTT were clearlydifferent from each other but not to the control. To determine whether the structural differences in theSIHUMIx communities were higher than the normal community variation in the control at 24 hTT,the deviation of community states that the end of the adaptation was calculated. Accelerating theTT affected the community structure at 12 hTT. Both bioreactor communities deviated out of theconstancy space. For the longer 48 hTT, the duplicate communities behaved differently. One of the48 hTT bioreactors deviated from the reference state and out of the constancy space, whereas theother mostly stayed unchanged. Since only one replicate bioreactor deviated from the reference state,we assume that the microbial community in this bioreactor was not constant at day five. Althoughwe expected that SIHUMIx reaches a constant state on day five (Krause et al., in revision at the GutMicrobes Journal), the adaptation phase should be prolonged to seven days in order to assure balancedgrowth in future studies.
In addition, with regard to larger structural deviations (Figure 4A) and significant communityvariations (Figure 3B,C), smaller resistance values were found in the groups of 12 hTT and 48 hTT butthey were close to the values of controls. This shows that SIHUMIx is highly resistant against variationof TTs. During faster TTs, cell growth is likely to be supported since absolute cell numbers were alsothe highest at 12 hTT.
Bacterial cells modify their metabolism during the cell cycle and, thus, the community structurechanges. Since flow cytometric fingerprinting is based on the measurement of cell size and DNAcontent, structural changes caused by different TTs can also be related to changes in the division statesof community members or to a shift in species abundances. Metaproteomics revealed that speciesabundances stayed unchanged, which indicates that the communities were clearly not affected basedon phylogenetic affiliation but by cell cycle activities. All the species, including the slow-growingbacterium L. plantarum, remained in the bioreactor system until the end of the experiment on day15 [41].
4.2. Changes are Associated with Cell Division
In bacterial cell division, the final step is dependent on certain cell size. Bacterial cells need to atleast double their biomass before division in order to prevent biomass losses. Individual cell sizesvary within a population and exhibit intrinsic variability, even under constant growth conditions [42].Medium TT directly affects the availability of the medium ingredients. Carbon availability is higher at ashorter TT and, therefore, is likely to cause a functional change and faster growth. This functional changemight be associated with changes in cell size and, hence, the time of division of cell subpopulations.
Functional differences were found for specific pathways in the KEGG sub-roles: translation,folding, sorting and degradation, membrane transport, and amino acid and glycan metabolism,

Microorganisms 2019, 7, 641 14 of 19
which are relevant for DNA replication and cell division (Figure 5A). During cell division, bacterialcells need to replicate two main components: the chromosomes and the peptidoglycan cell wall [43].In fact, the glycan metabolism of SIHUMIx was affected differently during varying TTs. During the12 hTT, the relative protein abundance of the pathways peptidoglycan biosynthesis and degradationproteins decreased. It is probable that, at 12 hTT, more alternative carbon and nitrogen sourceswere available and cell wall synthesis could be maintained without energy consumption recycling ofpeptidoglycans [44], but it is still unknown exactly how peptidoglycan chains are synthesized [43].When bacteria are shifted from low to high nutrient availability, the expression of ribosomal RNAand ribosomal proteins is likely to accelerate [45]. Hence, in this study, the relative abundance of theproteins related to the KEGG pathway ribosome of SIHUMIx was higher at 12 hTT compared to 48 hTT.Apparently, this shift was slightly higher for B. thetaiotaomicron than B. producta. For other members ofSIHUMIx, changes in relative abundances of ribosomal proteins were not assigned.
4.3. A Faster Transit Time Slightly Reduces Butyrate Metabolism of SIHUMIx And Favors ProteinFermentation
Short-chain fatty acid analysis revealed changes between 12 hTT and 48 hTT, even though changeson the functional level were smaller than those on the structural level. These changes were caused by adecrease in butyrate, methylbutyrate, isovalerate, and valerate concentrations at 12 hTT, whereas totalSCFA concentrations were not significantly changed (Figure 6). In accordance with the SCFA analysis,the butyrate metabolism also decreased, which was shown by less protein abundance of butanoatemetabolism at 12 hTT (Figure 5A). The reduction of butanoate metabolic proteins was specificallyshown for B. thetaiotaomicron and E. coli (Figure 5B).
Furthermore, we found a decrease in the amino acid metabolism of SIHUMIx at 12 hTT by theless relative abundance of alanine, aspartate, and glutamate metabolism and arginine biosynthesis.Together with a reduced butanoate metabolism, this indicates reduced carbohydrate fermentation atfaster TTs. In contrast to carbohydrate fermentation, the fermentation of proteins and amino acidsresulted in the production of BCFA. The concentrations of the BCFA methylbutyrate, isovalerate, andisobutyrate increased (Figure 6), which indicates that protein fermentation was favored at faster TT.These findings are in accordance with previous results and strengthen the hypothesis that proteinfermentation is favored with faster TT [46,47]. Functional changes in the pathway abundances of lowabundant SIHUMIx bacteria were not detected. This is most likely due to the low proteome coverageof low abundant species (less than 1%), which is still a bottleneck in metaproteome analysis [48,49].
Fermentation end products are well studied, but the association between a specific substrateand SCFA formation is not well understood since several amino acids can be used for both SCFAand BCFA synthesis [50]. Although the absolute acetate concentration did not significantly increaseat 12 hTT, correlation analysis revealed that acetate was slightly negatively correlated with the TT(Figure 7). The final steps of butyrate synthesis can be realized by two different enzymes: butyratekinase, which uses butyryl-CoA, or butyryl-CoA:acetate-CoA transferase, which uses acetate to formbutyrate. The latter has been suggested as the preferred route used by intestinal bacteria [51]. It hasbeen shown that these enzymes are possessed simultaneously or depend on external metabolites [51,52].It is likely that the decreased butyrate metabolism caused an increased acetate availability at 12 hTT.
Microorganisms 2019, 7, 641 15 of 19
Microorganisms 2019, 7, x FOR PEER REVIEW 15 of 19
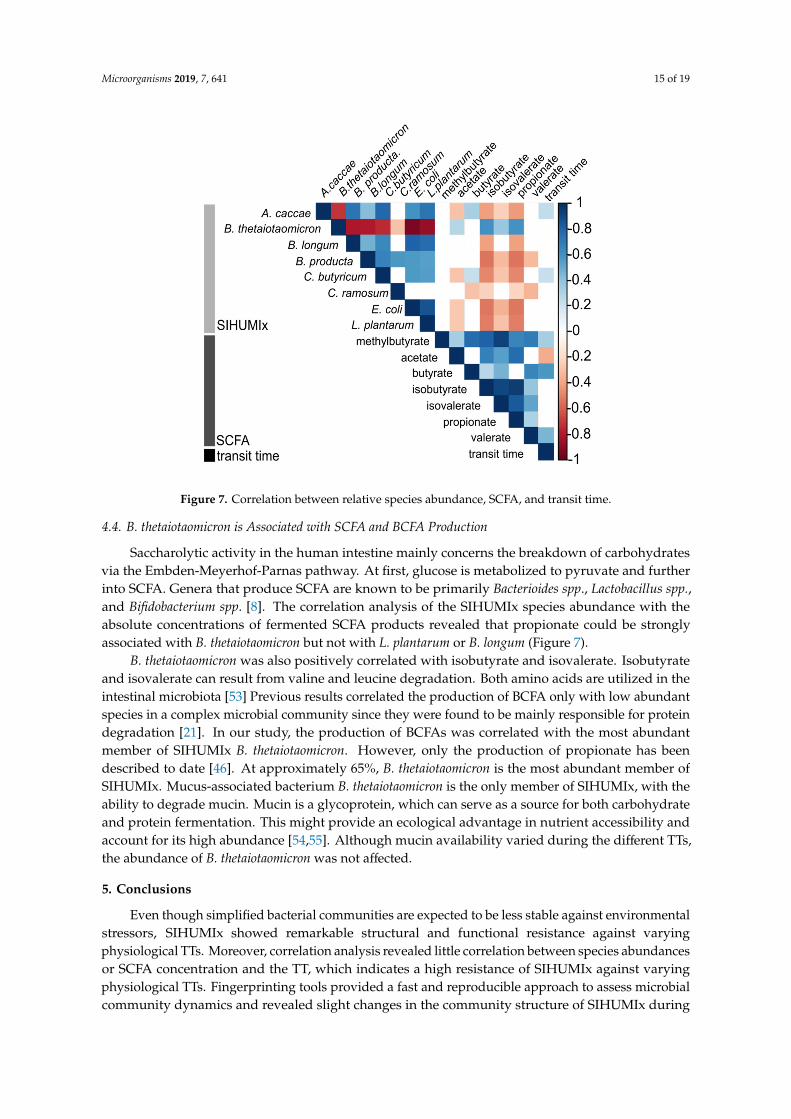
Figure 7. Correlation between relative species abundance, SCFA, and transit time.
B. thetaiotaomicron was also positively correlated with isobutyrate and isovalerate. Isobutyrate and isovalerate can result from valine and leucine degradation. Both amino acids are utilized in the intestinal microbiota [53] Previous results correlated the production of BCFA only with low abundant species in a complex microbial community since they were found to be mainly responsible for protein degradation [21]. In our study, the production of BCFAs was correlated with the most abundant member of SIHUMIx B. thetaiotaomicron. However, only the production of propionate has been described to date [46][. At approximately 65%, B. thetaiotaomicron is the most abundant member of SIHUMIx. Mucus-associated bacterium B. thetaiotaomicron is the only member of SIHUMIx, with the ability to degrade mucin. Mucin is a glycoprotein, which can serve as a source for both carbohydrate and protein fermentation. This might provide an ecological advantage in nutrient accessibility and account for its high abundance [54,55]. Although mucin availability varied during the different TTs, the abundance of B. thetaiotaomicron was not affected.
5. Conclusions
Even though simplified bacterial communities are expected to be less stable against environmental stressors, SIHUMIx showed remarkable structural and functional resistance against varying physiological TTs. Moreover, correlation analysis revealed little correlation between species abundances or SCFA concentration and the TT, which indicates a high resistance of SIHUMIx against varying physiological TTs. Fingerprinting tools provided a fast and reproducible approach to assess microbial community dynamics and revealed slight changes in the community structure of SIHUMIx during varying TTs. According to our metaproteomics data, these changes were associated with differences in membrane transport, glycan and protein metabolism, and, consequently, absolute SCFA and BCFA concentrations. B. thetaiotaomicron was identified to be affected in terms of butyrate metabolism, which has an important implication concerning intestinal health. Despite the limitation due to the relatively low abundant species, this study shows that the low complexity of SIHUMIx allowed the description of the effect of physiological stressors on a species-specific level.
Figure 7. Correlation between relative species abundance, SCFA, and transit time.
4.4. B. thetaiotaomicron is Associated with SCFA and BCFA Production
Saccharolytic activity in the human intestine mainly concerns the breakdown of carbohydratesvia the Embden-Meyerhof-Parnas pathway. At first, glucose is metabolized to pyruvate and furtherinto SCFA. Genera that produce SCFA are known to be primarily Bacterioides spp., Lactobacillus spp.,and Bifidobacterium spp. [8]. The correlation analysis of the SIHUMIx species abundance with theabsolute concentrations of fermented SCFA products revealed that propionate could be stronglyassociated with B. thetaiotaomicron but not with L. plantarum or B. longum (Figure 7).
B. thetaiotaomicron was also positively correlated with isobutyrate and isovalerate. Isobutyrateand isovalerate can result from valine and leucine degradation. Both amino acids are utilized in theintestinal microbiota [53] Previous results correlated the production of BCFA only with low abundantspecies in a complex microbial community since they were found to be mainly responsible for proteindegradation [21]. In our study, the production of BCFAs was correlated with the most abundantmember of SIHUMIx B. thetaiotaomicron. However, only the production of propionate has beendescribed to date [46]. At approximately 65%, B. thetaiotaomicron is the most abundant member ofSIHUMIx. Mucus-associated bacterium B. thetaiotaomicron is the only member of SIHUMIx, with theability to degrade mucin. Mucin is a glycoprotein, which can serve as a source for both carbohydrateand protein fermentation. This might provide an ecological advantage in nutrient accessibility andaccount for its high abundance [54,55]. Although mucin availability varied during the different TTs,the abundance of B. thetaiotaomicron was not affected.
5. Conclusions
Even though simplified bacterial communities are expected to be less stable against environmentalstressors, SIHUMIx showed remarkable structural and functional resistance against varyingphysiological TTs. Moreover, correlation analysis revealed little correlation between species abundancesor SCFA concentration and the TT, which indicates a high resistance of SIHUMIx against varyingphysiological TTs. Fingerprinting tools provided a fast and reproducible approach to assess microbialcommunity dynamics and revealed slight changes in the community structure of SIHUMIx during

Microorganisms 2019, 7, 641 16 of 19
varying TTs. According to our metaproteomics data, these changes were associated with differences inmembrane transport, glycan and protein metabolism, and, consequently, absolute SCFA and BCFAconcentrations. B. thetaiotaomicron was identified to be affected in terms of butyrate metabolism,which has an important implication concerning intestinal health. Despite the limitation due to therelatively low abundant species, this study shows that the low complexity of SIHUMIx allowed thedescription of the effect of physiological stressors on a species-specific level.
Supplementary Materials: The following are available online at http://www.mdpi.com/2076-2607/7/12/641/s1,Figure S1: Master cell gate template for flow cytometric fingerprinting, Figure S2: Constancy space and resistancevalues per bioreactors based on flow cytometric data, Table S1: Additional information about SIHUMIx, Table S2:Growth media (Brain-Heart-Infusion, BHI), Complex intestinal medium, CIM), and growth conditions, Table S3:Protein-coding sequences per species, Table S4: Protein report of metaproteomic analysis, Table S5: Bray-CurtisDissimilarity’s of NMDS evaluation of flow cytometric data and SCFA concentrations, Table S6: P values fromPairwise ANOVA of flow cytometric data and SCFA concentrations, Table S7: Relative species abundanceof SIHUMIx.
Author Contributions: Conceptualization, S.S.S., J.L.K., N.J., and M.v.B. Data curation, S.S.S., J.L.K., B.E., K.F.-W.,F.S., and Z.L. Formal analysis, S.S.S. Funding acquisition, M.v.B., G.H., and J.L.K. Methodology, S.S.S., J.L.K., B.E.,K.F.-W., and F.S. Supervision, S.M., N.J., U.R.-K., G.H., and M.v.B. Validation, S.S.S., J.L.K., Z.L., S.M., and U.R.-K.Visualization, S.S.S., J.L.K., and Z.L. Writing—original draft, S.S.S. and J.L.K. Writing—review & editing, B.E.,K.F.-W., F.S., Z.L., S.M., N.J., U.R.-K., G.H., and M.v.B.
Funding: S.S.S. acknowledges funding by DFG SPP 1656. J.L.K. is thankful for funding by the German FederalEnvironmental Foundation (DBU) and M.v.B. is grateful for the partial funding by DFG Priority Program 2002.
Acknowledgments: We thank Michael Blaut (German Institute of Human Nutrition, Potsdam-Rehbruecke) forproviding the SIHUMIx bacteria. We are thankful for technical assistance from Jeremy Knespel, Eva-AnnamariaStier, Kathleen Eismann, and Nicole Gröger and for culture medium supply from Martina Kolbe.
Conflicts of Interest: The authors declare no conflict of interest.
References
1. Almeida, A.; Mitchell, A.L.; Boland, M.; Forster, S.C.; Gloor, G.B.; Tarkowska, A.; Lawley, T.D.; Finn, R.D.A new genomic blueprint of the human gut microbiota. Nature 2019, 568, 499. [CrossRef] [PubMed]
2. Marques, F.Z.; Mackay, C.R.; Kaye, D.M. Beyond gut feelings: How the gut microbiota regulates bloodpressure. Nat. Rev. Cardiol. 2017, 15, 20. [CrossRef] [PubMed]
3. Hemarajata, P.; Versalovic, J. Effects of probiotics on gut microbiota: Mechanisms of intestinalimmunomodulation and neuromodulation. Therap. Adv. Gastroenterol. 2013, 6, 39–51. [CrossRef][PubMed]
4. Den Besten, G.; van Eunen, K.; Groen, A.K.; Venema, K.; Reijngoud, D.J.; Bakker, B.M. The role of short-chainfatty acids in the interplay between diet, gut microbiota, and host energy metabolism. J. Lipid Res. 2013, 54,2325–2340. [CrossRef] [PubMed]
5. Guzman-Rodriguez, M.; McDonald, J.A.K.; Hyde, R.; Allen-Vercoe, E.; Claud, E.C.; Sheth, P.M.; Petrof, E.O.Using bioreactors to study the effects of drugs on the human microbiota. Methods 2018, 149, 31–41. [CrossRef]
6. Morrison, D.J.; Preston, T. Formation of short chain fatty acids by the gut microbiota and their impact onhuman metabolism. Gut Microbes 2016, 7, 189–200. [CrossRef]
7. Hamer, H.M.; Jonkers, D.; Venema, K.; Vanhoutvin, S.; Troost, F.J.; Brummer, R.J. Review article: The role ofbutyrate on colonic function. Aliment. Pharmacol. Ther. 2008, 27, 104–119. [CrossRef]
8. Nyangale, E.P.; Mottram, D.S.; Gibson, G.R. Gut microbial activity, implications for health and disease:The potential role of metabolite analysis. J. Proteome Res. 2012, 11, 5573–5585. [CrossRef]
9. Baxter, N.T.; Schmidt, A.W.; Venkataraman, A.; Kim, K.S.; Waldron, C.; Schmidt, T.M. Dynamics of humangut microbiota and short-chain fatty acids in response to dietary interventions with three fermentable fibers.mBio 2019, 10, e02566-18. [CrossRef]
10. Lewis, S.J.; Heaton, K.W. Stool form scale as a useful guide to intestinal transit time. Scand. J. Gastroenterol.1997, 32, 920–924. [CrossRef]
11. Vandeputte, D.; Falony, G.; Vieira-Silva, S.; Tito, R.Y.; Joossens, M.; Raes, J. Stool consistency is stronglyassociated with gut microbiota richness and composition, enterotypes and bacterial growth rates. Gut 2016,65, 57–62. [CrossRef] [PubMed]

Microorganisms 2019, 7, 641 17 of 19
12. Sarosiek, I.; Selover, K.H.; Katz, L.A.; Semler, J.R.; Wilding, G.E.; Lackner, J.M.; Sitrin, M.D.; Kuo, B.;Chey, W.D.; Hasler, W.L.; et al. The assessment of regional gut transit times in healthy controls and patientswith gastroparesis using wireless motility technology. Aliment. Pharmacol. Ther. 2010, 31, 313–322. [CrossRef][PubMed]
13. Wang, Y.T.; Mohammed, S.D.; Farmer, A.D.; Wang, D.; Zarate, N.; Hobson, A.R.; Hellstrom, P.M.; Semler, J.R.;Kuo, B.; Rao, S.S.; et al. Regional gastrointestinal transit and ph studied in 215 healthy volunteers using thewireless motility capsule: Influence of age, gender, study country and testing protocol. Aliment. Pharmacol. Ther.2015, 42, 761–772. [CrossRef]
14. Maurer, J.M.; Schellekens, R.C.; van Rieke, H.M.; Wanke, C.; Iordanov, V.; Stellaard, F.; Wutzke, K.D.; Dijkstra, G.;van der Zee, M.; Woerdenbag, H.J.; et al. Gastrointestinal ph and transit time profiling in healthy volunteers usingthe intellicap system confirms ileo-colonic release of colopulse tablets. PLoS ONE 2015, 10, e0129076. [CrossRef]
15. Child, M.W.; Kennedy, A.; Walker, A.W.; Bahrami, B.; Macfarlane, S.; Macfarlane, G.T. Studies on the effect ofsystem retention time on bacterial populations colonizing a three-stage continuous culture model of thehuman large gut using fish techniques. FEMS Microbiol. Ecol. 2006, 55, 299–310. [CrossRef]
16. Tottey, W.; Feria-Gervasio, D.; Gaci, N.; Laillet, B.; Pujos, E.; Martin, J.F.; Sebedio, J.L.; Sion, B.; Jarrige, J.F.;Alric, M.; et al. Colonic transit time is a driven force of the gut microbiota composition and metabolism:In vitro evidence. J. Neurogastroenterol. Motil. 2017, 23, 124–134. [CrossRef]
17. Mitchell, R.J.; Kim, J.S.; Jeon, B.S.; Sang, B.I. Continuous hydrogen and butyric acid fermentation byimmobilized clostridium tyrobutyricum ATCC 25755: Effects of the glucose concentration and hydraulicretention time. Bioresour. Technol. 2009, 100, 5352–5355. [CrossRef]
18. Payne, A.N.; Zihler, A.; Chassard, C.; Lacroix, C. Advances and perspectives in in vitro human gutfermentation modeling. Trends Biotechnol. 2012, 30, 17–25. [CrossRef]
19. Liu, Z.; Cichocki, N.; Hubschmann, T.; Suring, C.; Ofiteru, I.D.; Sloan, W.T.; Grimm, V.; Muller, S. Neutralmechanisms and niche differentiation in steady-state insular microbial communities revealed by single cellanalysis. Environ. Microbiol. 2019, 21, 164–181. [CrossRef]
20. Macfarlane, G.T.; Macfarlane, S.; Gibson, G.R. Validation of a three-stage compound continuous culturesystem for investigating the effect of retention time on the ecology and metabolism of bacteria in the humancolon. Microb Ecol 1998, 35, 180–187. [CrossRef]
21. Fehlbaum, S.; Chassard, C.; Haug, M.C.; Fourmestraux, C.; Derrien, M.; Lacroix, C. Design and investigation ofpolyferms in vitro continuous fermentation models inoculated with immobilized fecal microbiota mimickingthe elderly colon. PLoS ONE 2015, 10, e0142793. [CrossRef] [PubMed]
22. Hinzke, T.; Kleiner, M.; Markert, S. Centrifugation-based enrichment of bacterial cell populations formetaproteomic studies on bacteria-invertebrate symbioses. Methods Mol. Biol. 2018, 1841, 319–334. [PubMed]
23. Starke, R.; Jehmlich, N.; Bastida, F. Using proteins to study how microbes contribute to soil ecosystemservices: The current state and future perspectives of soil metaproteomics. J. Proteomics 2019, 198, 50–58.[CrossRef] [PubMed]
24. Becker, N.; Kunath, J.; Loh, G.; Blaut, M. Human intestinal microbiota: Characterization of a simplified andstable gnotobiotic rat model. Gut Microbes 2011, 2, 25–33. [CrossRef]
25. Rothe, M.; Blaut, M. Evolution of the gut microbiota and the influence of diet. Benef. Microbes 2013, 4, 31–37.[CrossRef]
26. Woting, A.; Pfeiffer, N.; Hanske, L.; Loh, G.; Klaus, S.; Blaut, M. Alleviation of high fat diet-induced obesityby oligofructose in gnotobiotic mice is independent of presence of bifidobacterium longum. Mol. Nutr. FoodRes. 2015, 59, 2267–2278. [CrossRef]
27. Woting, A.; Pfeiffer, N.; Loh, G.; Klaus, S.; Blaut, M. Clostridium ramosum promotes high-fat diet-inducedobesity in gnotobiotic mouse models. MBio 2014, 5, e01530-14. [CrossRef]
28. Slezak, K.; Krupova, Z.; Rabot, S.; Loh, G.; Levenez, F.; Descamps, A.; Lepage, P.; Dore, J.; Bellier, S.; Blaut, M.Association of germ-free mice with a simplified human intestinal microbiota results in a shortened intestine.Gut Microbes 2014, 5, 176–182. [CrossRef]
29. Weitkunat, K.; Schumann, S.; Petzke, K.J.; Blaut, M.; Loh, G.; Klaus, S. Effects of dietary inulin on bacterialgrowth, short-chain fatty acid production and hepatic lipid metabolism in gnotobiotic mice. J. Nutr. Biochem.2015, 26, 929–937. [CrossRef]
30. Bauer, E.; Zimmermann, J.; Baldini, F.; Thiele, I.; Kaleta, C. Bacarena: Individual-based metabolic modelingof heterogeneous microbes in complex communities. PLoS Comput. Biol. 2017, 13, e1005544. [CrossRef]

Microorganisms 2019, 7, 641 18 of 19
31. Koch, C.; Muller, S. Personalized microbiome dynamics—Cytometric fingerprints for routine diagnostics.Mol. Aspects Med. 2018, 59, 123–134. [CrossRef] [PubMed]
32. Liu, Z.; Cichocki, N.; Bonk, F.; Gunther, S.; Schattenberg, F.; Harms, H.; Centler, F.; Muller, S. Ecologicalstability properties of microbial communities assessed by flow cytometry. mSphere 2018, 3, e00564-17.[CrossRef] [PubMed]
33. Wissenbach, D.K.; Oliphant, K.; Rolle-Kampczyk, U.; Yen, S.; Hoke, H.; Baumann, S.; Haange, S.B.; Verdu, E.F.;Allen-Vercoe, E.; von Bergen, M. Optimization of metabolomics of defined in vitro gut microbial ecosystems.Int. J. Med. Microbiol. 2016, 306, 280–289. [CrossRef] [PubMed]
34. Van Gelder, S.; Rohrig, N.; Schattenberg, F.; Cichocki, N.; Schumann, J.; Schmalz, G.; Haak, R.; Ziebolz, D.;Muller, S. A cytometric approach to follow variation and dynamics of the salivary microbiota. Methods 2018,134–135, 67–79. [CrossRef] [PubMed]
35. Oksanen, J. Multivariate Analysis of Ecological Communities in R: Vegan Tutorial; University of Oulu: Oulu,Finland, 2007.
36. Starke, R.; Kermer, R.; Ullmann-Zeunert, L.; Baldwin, I.T.; Seifert, J.; Bastida, F.; von Bergen, M.; Jehmlich, N.Bacteria dominate the short-term assimilation of plant-derived n in soil. Soil Biol. Biochem. 2016, 96, 30–38.[CrossRef]
37. Haange, S.B.; Jehmlich, N.; Hoffmann, M.; Weber, K.; Lehmann, J.; von Bergen, M.; Slanina, U. Diseasedevelopment is accompanied by changes in bacterial protein abundance and functions in a refined model ofdextran sulfate sodium (dss)-induced colitis. J. Proteome Res. 2019, 18, 1774–1786. [CrossRef]
38. Käll, L.; Canterbury, J.D.; Weston, J.; Noble, W.S.; MacCoss, M.J. Semi-supervised learning for peptideidentification from shotgun proteomics datasets. Nat. Methods 2007, 4, 923–925. [CrossRef]
39. Han, J.; Lin, K.; Sequeira, C.; Borchers, C.H. An isotope-labeled chemical derivatization method for thequantitation of short-chain fatty acids in human feces by liquid chromatography-tandem mass spectrometry.Anal. Chim. Acta 2015, 854, 86–94. [CrossRef]
40. Kleiner, M.; Thorson, E.; Sharp, C.E.; Dong, X.; Liu, D.; Li, C.; Strous, M. Assessing species biomasscontributions in microbial communities via metaproteomics. Nat. Commun. 2017, 8, 1558. [CrossRef]
41. Storelli, G.; Defaye, A.; Erkosar, B.; Hols, P.; Royet, J.; Leulier, F. Lactobacillus plantarum promotes drosophilasystemic growth by modulating hormonal signals through tor-dependent nutrient sensing. Cell Metab. 2011,14, 403–414. [CrossRef]
42. Taheri-Araghi, S.; Bradde, S.; Sauls, J.T.; Hill, N.S.; Levin, P.A.; Paulsson, J.; Vergassola, M.; Jun, S. Cell-sizecontrol and homeostasis in bacteria. Curr. Biol. 2015, 25, 385–391. [CrossRef] [PubMed]
43. Egan, A.J.; Vollmer, W. The physiology of bacterial cell division. Ann. N. Y. Acad. Sci. 2013, 1277, 8–28.[CrossRef]
44. Reith, J.; Mayer, C. Peptidoglycan turnover and recycling in gram-positive bacteria. Appl. Microbiol. Biotechnol.2011, 92, 1–11. [CrossRef] [PubMed]
45. Kief, D.R.; Warner, J.R. Hierarchy of elements regulating synthesis of ribosomal proteins in saccharomycescerevisiae. Mol. Cell Biol. 1981, 1, 1016–1023. [CrossRef]
46. Adamberg, K.; Adamberg, S. Selection of fast and slow growing bacteria from fecal microbiota usingcontinuous culture with changing dilution rate. Microb Ecol. Health Dis. 2018, 29, 1549922. [CrossRef][PubMed]
47. Tottey, W.; Denonfoux, J.; Jaziri, F.; Parisot, N.; Missaoui, M.; Hill, D.; Borrel, G.; Peyretaillade, E.; Alric, M.;Harris, H.M.; et al. The human gut chip “hugchip”, an explorative phylogenetic microarray for determininggut microbiome diversity at family level. PLoS ONE 2013, 8, e62544. [CrossRef] [PubMed]
48. Wenzel, L.; Heyer, R.; Schallert, K.; Löser, L.; Wünschiers, R.; Reichl, U.; Benndorf, D. Sds-page fractionationto increase metaproteomic insight into the taxonomic and functional composition of microbial communitiesfor biogas plant samples. Eng. Life Sci. 2018, 18, 498–509. [CrossRef]
49. Hinzke, T.; Kouris, A.; Hughes, R.A.; Strous, M.; Kleiner, M. More is not always better: Evaluation of 1d and2d-lc-ms/ms methods for metaproteomics. Front. Microbiol. 2019, 10, 238. [CrossRef]
50. Neis, E.P.; Dejong, C.H.; Rensen, S.S. The role of microbial amino acid metabolism in host metabolism.Nutrients 2015, 7, 2930–2946. [CrossRef]
51. Louis, P.; Duncan, S.H.; McCrae, S.I.; Millar, J.; Jackson, M.S.; Flint, H.J. Restricted distribution of the butyratekinase pathway among butyrate-producing bacteria from the human colon. J. Bacteriol. 2004, 186, 2099–2106.[CrossRef]

Microorganisms 2019, 7, 641 19 of 19
52. Diez-Gonzalez, S.; Kaur, H.; Zinn, F.K.; Stevens, E.D.; Nolan, S.P. A simple and efficient copper-catalyzedprocedure for the hydrosilylation of hindered and functionalized ketones. J. Org. Chem. 2005, 70, 4784–4796.[CrossRef] [PubMed]
53. Dai, Z.L.; Li, X.L.; Xi, P.B.; Zhang, J.; Wu, G.; Zhu, W.Y. Metabolism of select amino acids in bacteria from thepig small intestine. Amino Acids 2012, 42, 1597–1608. [CrossRef]
54. Salyers, A.A.; Vercellotti, J.R.; West, S.E.; Wilkins, T.D. Fermentation of mucin and plant polysaccharides bystrains of bacteroides from the human colon. Appl. Environ. Microbiol. 1977, 33, 319–322. [PubMed]
55. Flint, H.J.; Scott, K.P.; Louis, P.; Duncan, S.H. The role of the gut microbiota in nutrition and health. Nat. Rev.Gastroenterol. Hepatol. 2012, 9, 577–589. [CrossRef] [PubMed]
© 2019 by the authors. Licensee MDPI, Basel, Switzerland. This article is an open accessarticle distributed under the terms and conditions of the Creative Commons Attribution(CC BY) license (http://creativecommons.org/licenses/by/4.0/).
Related Documents