MNRAS 476, 961–978 (2018) doi:10.1093/mnras/sty151 Advance Access publication 2018 January 18 The second Herschel–ATLAS Data Release – III. Optical and near-infrared counterparts in the North Galactic Plane field C. Furlanetto, 1, 2 ‹ S. Dye, 2‹ N. Bourne, 3 S. Maddox, 3 , 4 L. Dunne, 3, 4 S. Eales, 4 E. Valiante, 4 M. W. Smith, 4 D. J. B. Smith, 5 R. J. Ivison 3 , 6 and E. Ibar 7 1 Instituto de F´ ısica, Universidade Federal do Rio Grande do Sul, Av. Bento Gonc ¸alves 9500, 91501-970, Porto Alegre, RS, Brazil 2 School of Physics and Astronomy, University of Nottingham, University Park, Nottingham NG7 2RD, UK 3 Institute for Astronomy, University of Edinburgh, Royal Observatory, Edinburgh EH9 3HJ, UK 4 School of Physics and Astronomy, Cardiff University, The Parade, Cardiff CF24 3AA, UK 5 Centre for Astrophysics Research, School of Physics, Astronomy and Mathematics, University of Hertfordshire, College Lane, Hatfield AL10 9AB, UK 6 European Southern Observatory, Karl Schwarzschild Strasse 2, D-85748 Garching, Germany 7 Instituto de F´ ısica y Astronom´ ıa, Universidad de Valpara´ ıso, Avda. Gran Breta˜ na 1111, Valpara´ ıso, Chile Accepted 2018 January 8. Received 2017 December 22; in original form 2017 October 10 ABSTRACT This paper forms part of the second major public data release of the Herschel Astrophysical Terahertz Large Area Survey (H-ATLAS). In this work, we describe the identification of optical and near-infrared counterparts to the submillimetre detected sources in the 177 deg 2 North Galactic Plane (NGP) field. We used the likelihood ratio method to identify counterparts in the Sloan Digital Sky Survey and in the United Kingdom InfraRed Telescope Imaging Deep Sky Survey within a search radius of 10arcsec of the H-ATLAS sources with a 4σ detection at 250 μm. We obtained reliable (R ≥ 0.8) optical counterparts with r < 22.4 for 42 429 H-ATLAS sources (37.8 per cent), with an estimated completeness of 71.7 per cent and a false identification rate of 4.7per cent. We also identified counterparts in the near- infrared using deeper K-band data which covers a smaller ∼25 deg 2 . We found reliable near- infrared counterparts to 61.8 per cent of the 250-μm-selected sources within that area. We assessed the performance of the likelihood ratio method to identify optical and near-infrared counterparts taking into account the depth and area of both input catalogues. Using catalogues with the same surface density of objects in the overlapping ∼25 deg 2 area, we obtained that the reliable fraction in the near-infrared (54.8 per cent) is significantly higher than in the optical (36.4per cent). Finally, using deep radio data which covers a small region of the NGP field, we found that 80–90 per cent of our reliable identifications are correct. Key words: methods: statistical – catalogues – submillimetre: galaxies – submillimetre: stars. 1 INTRODUCTION This paper presents the identification of counterparts to detected submillimetre (submm) sources for the second major public data release (DR) of the Herschel Astrophysical Terahertz Large Area Survey (H-ATLAS). H-ATLAS is the largest single key project in area carried out in open time with the Herschel Space Observatory (Pilbratt et al. 2010). In its entirety, H-ATLAS covers approxi- mately 600 deg 2 in five photometric bands: 100, 160, 250, 350, and 500 μm. The area is split into three distinct regions, selected to avoid bright continuum emission from dust in the Galaxy and to maximize the amount of data in other wavebands: the North Galactic Plane E-mail: [email protected] (CF); [email protected] (SD) (NGP) comprising a single contiguous 177 deg 2 field centred at ap- proximately (200 ◦ , 29 ◦ ); three equatorial fields which cover a total area of 161 deg 2 and coincide with the equatorial areas surveyed in the Galaxy And Mass Assembly (GAMA) redshift survey (Driver et al. 2011; Liske et al. 2015); and a strip in the vicinity of the Southern Galactic Plane (SGP) with an area of ∼317.6 deg 2 . Full details of the survey design are given in Eales et al. (2010). Note that the survey geometry reported for the SGP field in this reference has since been superseded with a single contiguous strip. The first public data release (DR1) of H-ATLAS covered the equatorial fields. Details of the processing and characterization of image data and submm source catalogues within DR1 were given in Valiante et al. (2016, hereafter V16). Optically identi- fied counterparts to the submm-detected H-ATLAS sources in DR1 were discussed by Bourne et al. (2016, hereafter B16). The DR1 release also includes the area previously known as the Science Demonstration Phase (SDP), which was described in Ibar C 2018 The Author(s) Published by Oxford University Press on behalf of the Royal Astronomical Society Downloaded from https://academic.oup.com/mnras/article-abstract/476/1/961/4816749 by Periodicals Department , Hallward Library, University of Nottingham user on 07 March 2018

Welcome message from author
This document is posted to help you gain knowledge. Please leave a comment to let me know what you think about it! Share it to your friends and learn new things together.
Transcript

MNRAS 476, 961–978 (2018) doi:10.1093/mnras/sty151Advance Access publication 2018 January 18
The second Herschel–ATLAS Data Release – III. Optical andnear-infrared counterparts in the North Galactic Plane field
C. Furlanetto,1,2‹ S. Dye,2‹ N. Bourne,3 S. Maddox,3,4 L. Dunne,3,4 S. Eales,4
E. Valiante,4 M. W. Smith,4 D. J. B. Smith,5 R. J. Ivison3,6 and E. Ibar7
1Instituto de Fısica, Universidade Federal do Rio Grande do Sul, Av. Bento Goncalves 9500, 91501-970, Porto Alegre, RS, Brazil2School of Physics and Astronomy, University of Nottingham, University Park, Nottingham NG7 2RD, UK3Institute for Astronomy, University of Edinburgh, Royal Observatory, Edinburgh EH9 3HJ, UK4School of Physics and Astronomy, Cardiff University, The Parade, Cardiff CF24 3AA, UK5Centre for Astrophysics Research, School of Physics, Astronomy and Mathematics, University of Hertfordshire, College Lane, Hatfield AL10 9AB, UK6European Southern Observatory, Karl Schwarzschild Strasse 2, D-85748 Garching, Germany7Instituto de Fısica y Astronomıa, Universidad de Valparaıso, Avda. Gran Bretana 1111, Valparaıso, Chile
Accepted 2018 January 8. Received 2017 December 22; in original form 2017 October 10
ABSTRACTThis paper forms part of the second major public data release of the Herschel AstrophysicalTerahertz Large Area Survey (H-ATLAS). In this work, we describe the identification ofoptical and near-infrared counterparts to the submillimetre detected sources in the 177 deg2
North Galactic Plane (NGP) field. We used the likelihood ratio method to identify counterpartsin the Sloan Digital Sky Survey and in the United Kingdom InfraRed Telescope ImagingDeep Sky Survey within a search radius of 10 arcsec of the H-ATLAS sources with a 4σ
detection at 250 μm. We obtained reliable (R ≥ 0.8) optical counterparts with r < 22.4 for42 429 H-ATLAS sources (37.8 per cent), with an estimated completeness of 71.7 per centand a false identification rate of 4.7 per cent. We also identified counterparts in the near-infrared using deeper K-band data which covers a smaller ∼25 deg2. We found reliable near-infrared counterparts to 61.8 per cent of the 250-μm-selected sources within that area. Weassessed the performance of the likelihood ratio method to identify optical and near-infraredcounterparts taking into account the depth and area of both input catalogues. Using catalogueswith the same surface density of objects in the overlapping ∼25 deg2 area, we obtained that thereliable fraction in the near-infrared (54.8 per cent) is significantly higher than in the optical(36.4 per cent). Finally, using deep radio data which covers a small region of the NGP field,we found that 80–90 per cent of our reliable identifications are correct.
Key words: methods: statistical – catalogues – submillimetre: galaxies – submillimetre: stars.
1 IN T RO D U C T I O N
This paper presents the identification of counterparts to detectedsubmillimetre (submm) sources for the second major public datarelease (DR) of the Herschel Astrophysical Terahertz Large AreaSurvey (H-ATLAS). H-ATLAS is the largest single key project inarea carried out in open time with the Herschel Space Observatory(Pilbratt et al. 2010). In its entirety, H-ATLAS covers approxi-mately 600 deg2 in five photometric bands: 100, 160, 250, 350, and500 μm. The area is split into three distinct regions, selected to avoidbright continuum emission from dust in the Galaxy and to maximizethe amount of data in other wavebands: the North Galactic Plane
� E-mail: [email protected] (CF); [email protected](SD)
(NGP) comprising a single contiguous 177 deg2 field centred at ap-proximately (200◦, 29◦); three equatorial fields which cover a totalarea of 161 deg2 and coincide with the equatorial areas surveyed inthe Galaxy And Mass Assembly (GAMA) redshift survey (Driveret al. 2011; Liske et al. 2015); and a strip in the vicinity of theSouthern Galactic Plane (SGP) with an area of ∼317.6 deg2. Fulldetails of the survey design are given in Eales et al. (2010). Notethat the survey geometry reported for the SGP field in this referencehas since been superseded with a single contiguous strip.
The first public data release (DR1) of H-ATLAS covered theequatorial fields. Details of the processing and characterizationof image data and submm source catalogues within DR1 weregiven in Valiante et al. (2016, hereafter V16). Optically identi-fied counterparts to the submm-detected H-ATLAS sources in DR1were discussed by Bourne et al. (2016, hereafter B16). The DR1release also includes the area previously known as the ScienceDemonstration Phase (SDP), which was described in Ibar
C© 2018 The Author(s)Published by Oxford University Press on behalf of the Royal Astronomical Society
Downloaded from https://academic.oup.com/mnras/article-abstract/476/1/961/4816749by Periodicals Department , Hallward Library, University of Nottingham useron 07 March 2018
962 C. Furlanetto et al.
et al. (2010b), Rigby et al. (2011), Pascale et al. (2011), and Smithet al. (2011).
The second public data release (DR2) products encompass theNGP and SGP fields. The DR2 is described herein and in twoaccompanying papers, Smith et al. (2017, hereafter Paper I) andMaddox et al. (2017, hereafter Paper II). Paper I describes theHerschel images of the NGP and SGP fields and an investigationof their noise properties. Paper II presents the catalogues of submmsources detected on the images. The imaging and source catalogueproducts from the NGP and SGP fields can be obtained from theH-ATLAS web page.1
In this paper, we describe the identification of submm sourcecounterparts across the whole NGP field in the optical via theSloan Digital Sky Survey (SDSS, Abazajian et al. 2009) and theircorresponding matches in the near-infrared (NIR) via the UnitedKingdom InfraRed Telescope (UKIRT) Infrared Deep Sky Survey(UKIDSS; Lawrence et al. 2007). In addition, we investigate theidentification of counterparts in the K band within a deeper ∼25 deg2
subset of the NGP field observed with UKIRT, with a view to un-derstanding the properties of sources not identified in the shalloweroptical and NIR data. The imaging and catalogue products of thisdeeper survey in the K band are also part of the H-ATLAS DR2.Finally, we carry out an assessment of the performance of the likeli-hood ratio (LR) technique used in identifying counterparts by com-paring to deep radio interferometric data which covers a small regionof the NGP, common to both the optical and deeper K-band data sets.
The layout of this paper is as follows. In Sections 2 and 3, wedetail identification of counterparts to the submm-detected sourcesin the optical and NIR respectively. In Section 4, we compare theperformance of the LR method in identifying counterparts in theoptical and NIR. Section 5 investigates submm source counterpartsdetected in radio interferometric data. Finally, we summarize ouranalysis and the DR products in Section 6.
2 O P T I C A L C O U N T E R PA RTS TO SU B M MS O U R C E S
In this section, we present the optical identifications of the250 μm Spectral and Photometric Imaging REceiver (SPIRE)sources. We use the SDSS because of its astrometric accuracy andcomplete coverage of the NGP field.
The low angular resolution of Herschel observations and theintrinsic faintness of the counterpart due to dust obscuration arelimiting factors when characterizing the submm sources at longerwavelengths. The large positional uncertainties of bright submmsources and the presence of multiple possible counterparts withinthe large beam (due to the high surface density of objects in opticalsurveys) means that the identification of counterparts must rely onstatistical methods (e.g. Smith et al. 2017).
One method often applied to decide which objects are truly asso-ciated and which are unrelated background or foreground objects isthe LR method (Sutherland & Saunders 1992; Ciliegi et al. 2003).The LR method was used to identify optical and NIR counter-parts to SPIRE sources in previous releases of H-ATLAS data. Forexample, the technique was adopted by Smith et al. (2011, here-after S11) to identify SDSS counterparts in the H-ATLAS SDP,by Bond et al. (2012) to identify the Wide-field Infrared Surveycounterparts to the sources of Phase-1 GAMA15 field, by Fleurenet al. (2012, hereafter F12) to identify Visible and Infrared Survey
1 http://www.h-atlas.org/
Telescope for Astronomy (VISTA) Kilo-degree Infrared GalaxySurvey (VIKING) counterparts in the Phase-1 GAMA9 field, andby B16 to identify SDSS counterparts in the three equatorial H-ATLAS fields in the DR1.
In the following, we describe the application of the LR method toidentify optical counterparts to H-ATLAS NGP sources. In order toconsistently identify the optical counterparts across all H-ATLASfields, we adopted the same assumptions as in the analysis of B16for DR1.
2.1 Optical data
We constructed our optical object catalogue by selecting all pri-mary objects (the ‘main’ observations given multiple observationsof the objects) in the 10th data release (DR10; Ahn et al. 2014)of SDSS with rmodel < 22.4 in the NGP field. The rmodel = 22.4limit is essentially the completeness limit of SDSS photomet-ric survey. There are 2744 529 objects satisfying these criteriaincluded in our optical object catalogue. Unlike S11 and B16,which used SDSS DR7 to identify optical counterpart to H-ATLASsources, we opted for DR10 because it contains a larger sampleof objects with spectroscopic redshifts when compared to previousreleases.
In order to remove spurious objects from the catalogue, usu-ally associated with erroneous deblends of nearby galaxies ordiffraction spikes of stars, we visually inspected all SDSS objectswith deblend flags within 10 arcsec of each SPIRE source. In thisprocess, we removed 3671 SDSS objects from the optical inputcatalogue.
Since the H-ATLAS NGP field has almost complete NIR cov-erage from the UKIDSS Large Area Survey (UKIDSS-LAS,Lawrence et al. 2007), we added the YJHK photometry from its9th DR to our optical object catalogue by performing a simplenearest neighbour matching to the SDSS objects. We found that61.6 per cent of the primary SDSS DR10 candidates in NGP fieldhave a match in UKIDSS-LAS within 3 arcsec. By generating acatalogue of random positions with the same source density asUKIDSS-LAS and matching it to our optical object catalogue, weestimated that the probability of false UKIDSS-LAS association issmaller than 3 per cent. The remaining SDSS candidates are toofaint to be detected in the UKIDSS-LAS.
Our optical object catalogue contains 39 073 spectroscopicredshifts (zspec) obtained with SDSS DR10, corresponding to1.4 per cent of the sample. In addition, a further 1128 spectro-scopic redshifts were added from the CfA Redshift Survey (Huchraet al. 1995). Given the lack of a quality flag in the latter redshiftcatalogue, for objects that have redshifts in both surveys, we use theCfA redshift only if there is a redshift warning flag for the object inSDSS DR10.
For the objects without spectra, photometric redshifts were ob-tained from SDSS DR10 (for details see Csabai et al. 2007).
2.1.1 Star–galaxy separation
We separated stars and galaxy populations in our optical objectcatalogue following a similar prescription to that used in S11 andB16. This consists of a slightly modified version of the proceduredescribed in Baldry et al. (2010) to select the galaxy sample for theGAMA input catalogue by using a combination of shape and colourparameters. The colour criteria are based on our SDSS–UKIDSS-matched catalogue, as illustrated in the colour–colour diagram ofFig. 1. In summary, an object is classified as a galaxy if it satisfies
MNRAS 476, 961–978 (2018)Downloaded from https://academic.oup.com/mnras/article-abstract/476/1/961/4816749by Periodicals Department , Hallward Library, University of Nottingham useron 07 March 2018

The Herschel–ATLAS Data Release 2 Paper III 963
Figure 1. The colour–colour diagram of SDSS objects with UKIDSS-LASidentifications. We used a slightly modified version of the relationship ofBaldry et al. (2010) to separate stars (blue points), galaxies (red points), andQSOs (green points). The solid line shows the stellar locus, obtained fromfitting a quadratic equation (see equation 4) to the combined SDSS/UKIDSS-LAS data set. The dashed line is offset +0.4 mag from the stellar locus, rep-resenting one of the adopted separation criteria between stars and galaxies.Objects without UKIDSS-LAS counterpart are classified according to theirrmodel magnitude only.
the following constraints
�sg > 0.25
or
�sg > 0.05 and �sg,jk > 0.40, (1)
where �sg is the SDSS star–galaxy separation parameter that quan-tifies the fraction of extended flux, defined as
�sg = rpsf − rmodel, (2)
where rpsf is the r-band magnitude determined from a fit using thepoint spread function (PSF), and
�sg,jk = JAB − KAB − flocus(g − i) (3)
is a new star–galaxy separation parameter defined as the J − Kseparation from the stellar locus, flocus, in the J − K versus g − icolour space (see Fig. 1). The stellar locus in this colour space isdefined as in Baldry et al. (2010)
flocus(x) =
⎧⎪⎪⎨⎪⎪⎩
−0.7172, x < 0.3
−0.89 + 0.615x − 0.13x2, 0.3 < x < 2.3
−0.1632, x > 2.3,
(4)
where x = g − i. The stellar locus is shown as the black solid linein colour–colour diagram of Fig. 1. In this process, we used modelmagnitudes g and i from SDSS DR10 and J and K magnitudes(2-arcsec aperture) from UKIDSS-LAS.
For the remaining SDSS objects in our optical object cataloguenot satisfying the first part of equation (1) and with no UKIDSScounterpart, galaxies are defined as objects satisfying
�sg > fsg,slope(rmodel) (no J − K measurement), (5)
where
fsg,slope(x) =
⎧⎪⎪⎨⎪⎪⎩
0.25, x < 19.0
0.25 − 115 (x − 19), 19.0 < x < 20.5
0.15, x > 20.5.
(6)
We also added the constraint zspec > 0.001 to the classificationabove for the objects with spectroscopic redshift available.
We identified the objects that do not satisfy any of the con-straints above as unresolved. Among this class of objects, thosewith zspec > 0.001 were classified as quasars [quasi-stellar objects(QSOs)]. The remaining unresolved objects were classified as stars.
Fig. 1 shows the colour–colour diagram of the objects in ouroptical object catalogue with an NIR counterpart, the location ofthe stellar locus and the separation criteria used. We identified1981 642 galaxies (72.30 per cent of the sample), 754 999 stars(27.55 per cent), and 4216 quasars (0.15 per cent). There are 3439objects classified as quasars with zspec > 1. Among the stellarsample, there are 171 018 unresolved sources whose classificationwas based purely on the optical information. Those correspond to16.2 per cent of the optical sources that do not have an NIR coun-terpart in UKIDSS-LAS (i.e. are not in Fig. 1) and to 6.2 per cent ofthe entire sample. It is important to note that this stellar subsampleis more likely to be biased by faint unresolved galaxies.
2.2 Likelihood ratio analysis
We used the LR method to identify the most reliable optical coun-terparts to the 250-μm sources selected in the H-ATLAS NGP field.The LR method was developed by Sutherland & Saunders (1992)and received additional improvements by Ciliegi et al. (2003), Brusaet al. (2007), and Chapin et al. (2011).
The LR technique uses the ratio between the probability of amatch being the correct identification and the corresponding prob-ability of being an unrelated background object. The method usesthe intrinsic positional uncertainty of the sources and the magnitudedistributions of the true counterparts as well as of the backgroundobjects.
The LR is defined as
L = q(m, c)f (r)
n(m, c), (7)
where q(m, c) is the probability distribution of the true counterpartswith magnitude m and class c (e.g. star/galaxy or other additionalproperty), f(r) is the probability distribution of the source positionalerrors, and n(m, c) is the magnitude distribution of the unrelatedbackground objects with class c.
The reliability Rj is the probability that an object j is the correctidentification of a given SPIRE source. It is defined as
Rj = Lj∑i Li + (1 − Q0)
, (8)
where the sum in the denominator is to account for the presence ofother potential counterparts to the same SPIRE source and the term(1 − Q0) is the probability that there is no counterpart in the opticalsurvey (see Section 2.2.2). We consider objects with Rj ≥ 0.8 asreliably identified counterparts to the SPIRE source, following S11and B16.
In the following, we describe how the quantities described aboveare measured.
2.2.1 Estimation of f(r)
As probability distribution of positional errors we adopted a Gaus-sian distribution with standard deviation σ pos:
f (r) = 1
2πσ 2pos
exp
(−r2
2σ 2pos
), (9)
MNRAS 476, 961–978 (2018)Downloaded from https://academic.oup.com/mnras/article-abstract/476/1/961/4816749by Periodicals Department , Hallward Library, University of Nottingham useron 07 March 2018
964 C. Furlanetto et al.
where r is the offset between the 250 μm and r-band positionsand σpos = √
σασδ is the geometric mean of positional errors inRA and Dec. of the submillimetre source with respect to the opticalposition. This expression is based on the assumption that the sourcesextracted in H-ATLAS 250-μm maps are point-like sources.
The positional error σ pos is empirically estimated using the offsetdistribution of all potential counterparts. Following the methodsof S11 and B16, we derived a two-dimensional histogram of theseparation in RA and Dec. of the SDSS objects within a 50-arcsecbox around each SPIRE source. We modelled this distribution asconsisting of three components: the contribution of the backgrounddensity, which is constant across the histogram, the contributionfrom real counterparts, and the contribution from other correlatedsources due to the clustering of the SDSS objects. We can describethese components by the equation:
n(�RA, �Dec.) = n0 + Q0f (r) + w(r) ∗ f (r), (10)
where n0 is the constant background density of our optical objectcatalogue and Q0 is the fraction of the true counterparts that aredetected in SDSS. The additional contribution of the nearby SDSSobjects that are correlated with the SPIRE source due to the galaxyclustering (but are not the correct counterparts) is given by theangular cross-correlation function w(r) between SPIRE and SDSSpositions convolved with the positional error function f(r). Thecross-correlation between SPIRE and SDSS samples is modelled asa power law
w(r) =(
r
r0
)δ
, (11)
where r0 is the correlation length and δ is the power-law index.We assumed that the SDSS positional errors are negligible in
comparison to the SPIRE errors, so the width (σ pos) of f(r) is simplythe SPIRE positional error, which can be obtained in �RA and�Dec. from the modelling of the two-dimensional positional offsethistogram.
According to Ivison et al. (2007), the theoretical form for σ pos de-pends on the full-width at half-maximum (FWHM) and the signal-to-noise ratio (S/N) of the 250-μm detection:
σth(S/N) = 0.6FWHM
S/N. (12)
Bourne et al. (2014) showed that redder and brighter submmsources have optical associations with a broader distribution of po-sitional offsets than would be expected if these offsets were due torandom positional errors in the source extraction. They concludedthat this effect is most likely to be explained by the significant con-tribution from foreground structures in the line of sight to the SPIREsources, which are not physically associated but may be lensing thesource. This interpretation is supported by the lens modelling ofthe H-ATLAS sample in Gonzalez-Nuevo et al. (2017). In order toavoid this bias, which can increase the L values for optical associ-ations to red SPIRE sources, we measured the σ pos from the offsethistogram of blue SPIRE sources with S250/S350 > 2.4, followingthe method described in B16.
We fitted the two-dimensional histogram of the separation inRA and Dec. using the model given in equation (10) to obtain thewidth σ pos of the Gaussian positional errors f(r), the backgrounddensity n0, and fraction of the true counterparts that are detectedin SDSS Q0. During the fitting process, we fixed the power-lawparameters of w(r) to the values obtained by Bourne et al. (2014)
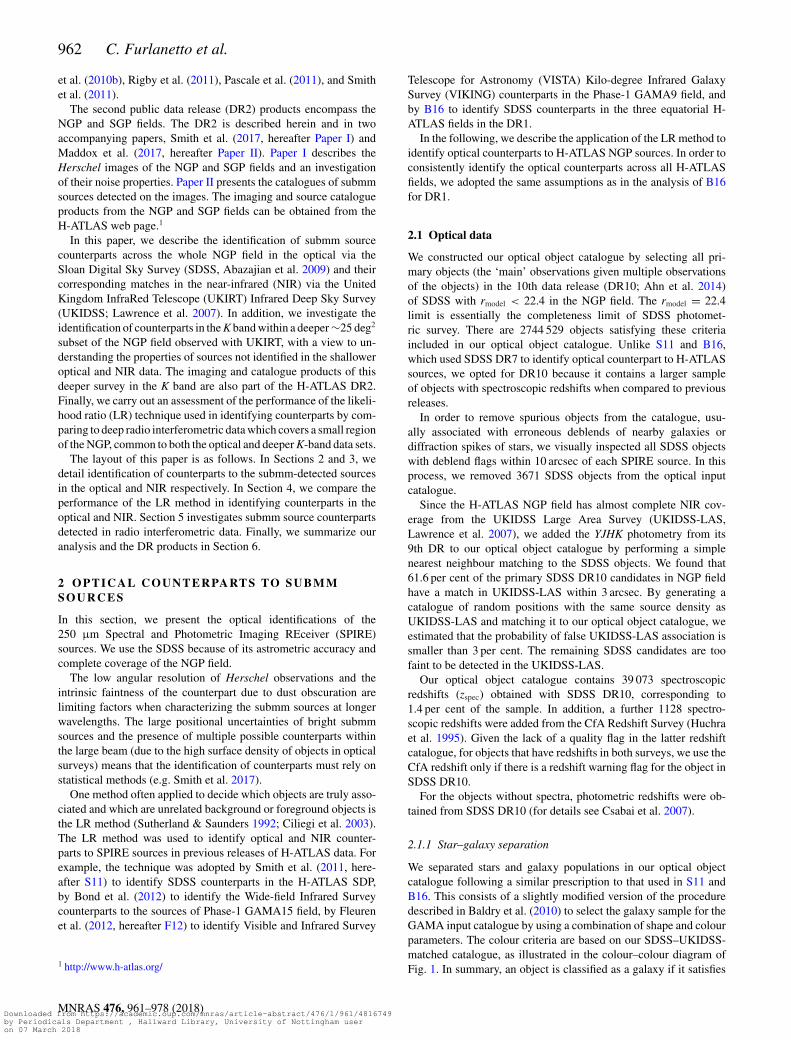
Table 1. Results of the fitting of positional offsets between SDSS and blueSPIRE sources with S250/S350 > 2.4 in bins of 250-µm S/N. The values forthe correlation length r0 were taken from B16.
S/N250 NSPIRE r0 (arcsec) σ pos (arcsec) Q0
4–5 3285 0.20 ± 0.02 2.40 ± 0.02 0.699 ± 0.0085–6 1583 0.61 ± 0.05 1.88 ± 0.02 0.810 ± 0.0096–8 1316 0.38 ± 0.05 1.53 ± 0.01 0.873 ± 0.0088–12 799 0.38 ± 0.08 1.19 ± 0.01 0.924 ± 0.008
Figure 2. σ pos measured from the fitting of the two-dimensional offsethistogram as a function of the mean value of 250 µm S/N in each S/Nbin for six bins of S250/S350 colour. The symbols indicate the colour bins.The grey solid line corresponds to the theoretical prediction for σ pos givenin equation (12). Dotted lines show the best-fitting models for σ pos as afunction of S/N for each colour bin. The results for bluest colour bin aresummarized in Table 1.
for the angular cross-correlation function between SPIRE and SDSSsources (δ = −0.7 and r0 as given in Table 1). We examined thebehaviour of σ pos as a function of the S/N. In Table 1, we present thebest-fitting parameters obtained in the modelling of SDSS positionaloffsets to blue SPIRE sources in four bins of 250-μm S/N. Thedependence of the width σ pos as a function of S/N is shown inFig. 2. In the same figure, we also show the colour dependence ofσ pos in six bins of colour to illustrate the need to measure this widthusing blue SPIRE sources due to the bias discussed above, whichis likely to be caused by lensing. The fitting results summarized inTable 1 correspond to the bluest colour bin in Fig. 2.
We modelled the dependence of the positional errors on the S/Nas a power law:
σpos(S/N) = σpos(5)
(S/N
5
)α
. (13)
The best-fitting model for each colour bin is shown as dotted linesin Fig. 2. For the bluest bin (SPIRE sources with S250/S350 > 2.4), weobtained that α = −0.84 ± 0.07 and σ pos(5) = 1.99 ± 0.05 arcsec.This result shows that the empirical dependence of σ pos on S/Nis not significantly different from the theoretical prediction ofequation (12).
We adopted the description of equation (13) for the expectedpositional errors used to compute f(r) in our LR calculations. Inorder to avoid unrealistically small errors for very bright sources, weimposed a restriction that σ pos > 1 arcsec, as in S11. This minimumpositional error also accounts for the possibility that the submm
MNRAS 476, 961–978 (2018)Downloaded from https://academic.oup.com/mnras/article-abstract/476/1/961/4816749by Periodicals Department , Hallward Library, University of Nottingham useron 07 March 2018
The Herschel–ATLAS Data Release 2 Paper III 965
and optical emission may not arise at exactly the same position in agalaxy.
2.2.2 Estimation of n(m) and q(m)
We computed the probability distributions n(m) and q(m) for extra-galactic objects (galaxies and QSOs) and stars separately.
The n(m) term in equation (7) corresponds to the probabilitydensity that a given SDSS source has magnitude m. It is estimatedfrom the object counts of the optical object catalogue normalizedto the area.
The distribution q(m) is the probability that a true counterpartto a SPIRE source has magnitude m. This distribution is estimatedusing the method described in Ciliegi et al. (2003), which beginsby counting all objects in the optical catalogue with magnitude mand within a fixed search radius rmax around each SPIRE source togive total(m). The contribution of the background source counts,nback(m) = n(m)Nπr2
max, is subtracted from this distribution, pro-ducing the magnitude distribution of all true counterparts, real(m),which is given by
real(m) = total(m) − nback(m), (14)
where N is the number of SPIRE sources. In our analysis, we usedrmax = 10 arcsec. The q(m) distribution is then derived by normal-izing real(m) and scaling it by the overall probability Q0
q(m) = Q0real(m)∑m real(m)
. (15)
The term Q0 is an estimate of Q
Q =∫ mlim
0q(m) dm, (16)
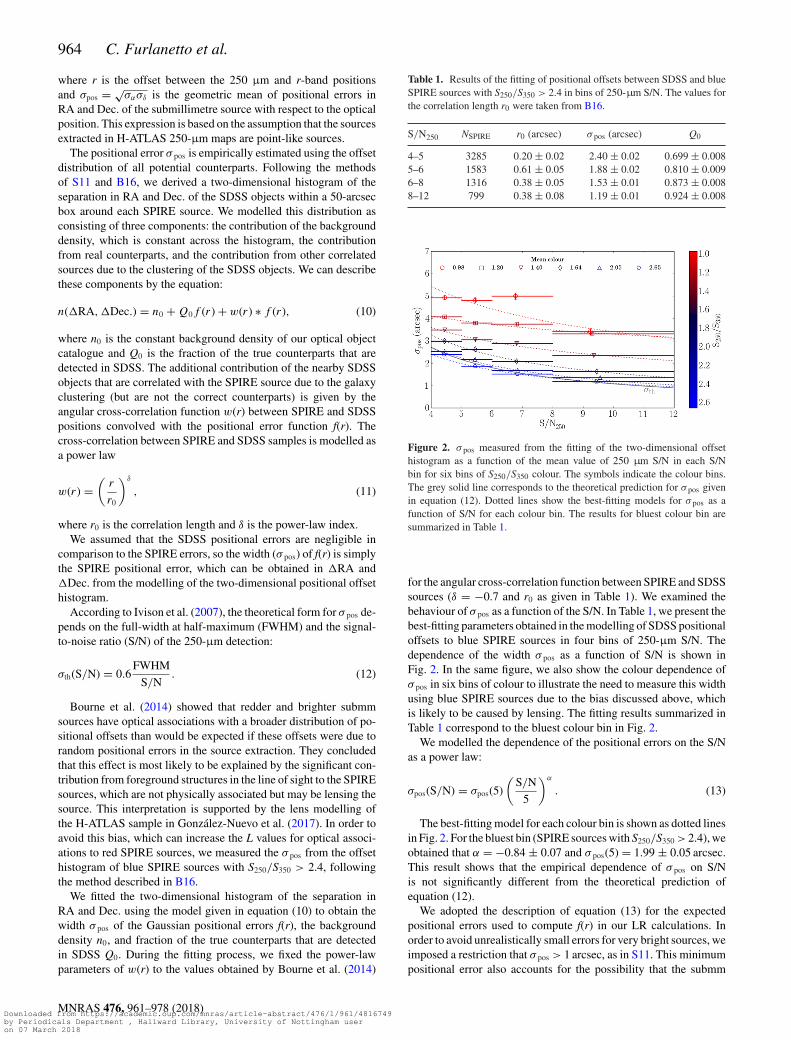
which is the fraction of all true counterparts that are above the SDSSmagnitude limit Mlim. The distributions total(m), nback(m), and q(m)derived by this method are shown in Fig. 3.
We estimated the normalization term Q0 for stars and extra-galactic objects following the method outlined in F12. To avoidmulticounting counterparts due to clustering or genuine multiplecounterparts, which can overestimate the value of Q0, this methodmeasures 1 − Q0 by counting objects without any counterpart can-didate within the search radius. These objects are referred to as‘blanks’. The fraction of SPIRE sources that are true blanks isgiven by the ratio between the observed number of SPIRE blanksand the number of random blanks for a given search radius. Anestimate of Q0 that is independent of the radius can be obtained bycomputing 1 − Q0 for radii in the range 1–15 arcsec and modellingthe dependence of the true blanks on the search radius as
B(r) = 1 − Q0F (r), (17)
where
F (r) = 1 − exp(−r2/2σ 2). (18)
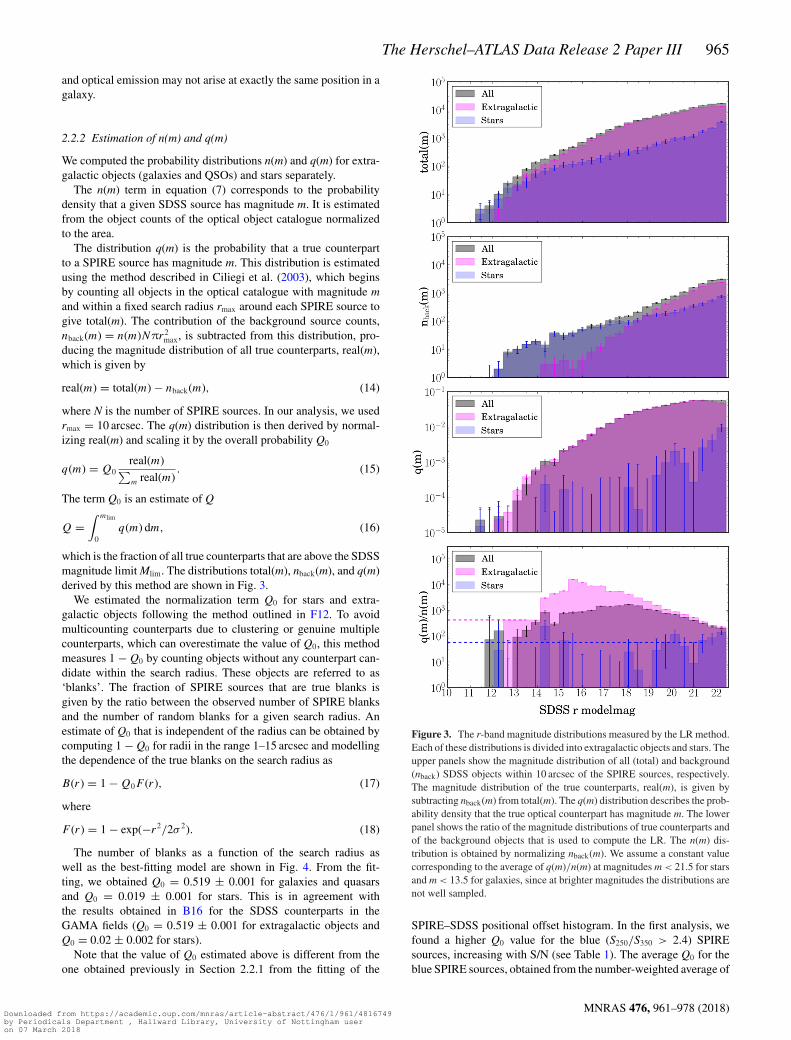
The number of blanks as a function of the search radius aswell as the best-fitting model are shown in Fig. 4. From the fit-ting, we obtained Q0 = 0.519 ± 0.001 for galaxies and quasarsand Q0 = 0.019 ± 0.001 for stars. This is in agreement withthe results obtained in B16 for the SDSS counterparts in theGAMA fields (Q0 = 0.519 ± 0.001 for extragalactic objects andQ0 = 0.02 ± 0.002 for stars).
Note that the value of Q0 estimated above is different from theone obtained previously in Section 2.2.1 from the fitting of the
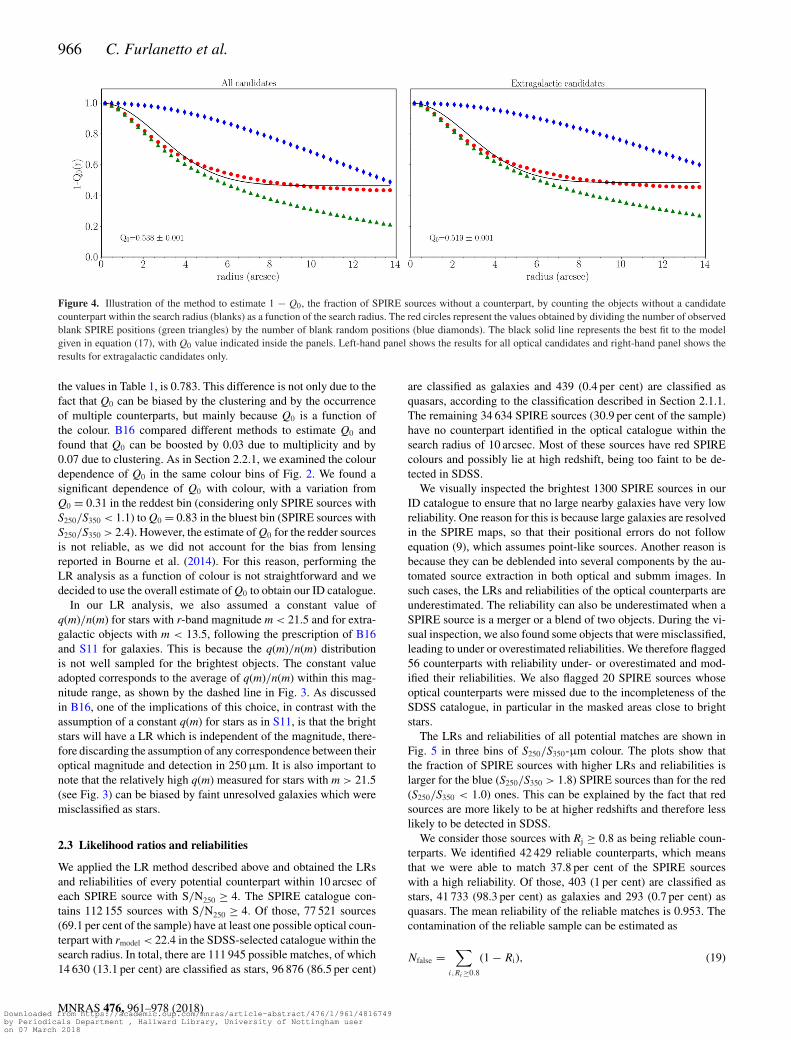
Figure 3. The r-band magnitude distributions measured by the LR method.Each of these distributions is divided into extragalactic objects and stars. Theupper panels show the magnitude distribution of all (total) and background(nback) SDSS objects within 10 arcsec of the SPIRE sources, respectively.The magnitude distribution of the true counterparts, real(m), is given bysubtracting nback(m) from total(m). The q(m) distribution describes the prob-ability density that the true optical counterpart has magnitude m. The lowerpanel shows the ratio of the magnitude distributions of true counterparts andof the background objects that is used to compute the LR. The n(m) dis-tribution is obtained by normalizing nback(m). We assume a constant valuecorresponding to the average of q(m)/n(m) at magnitudes m < 21.5 for starsand m < 13.5 for galaxies, since at brighter magnitudes the distributions arenot well sampled.
SPIRE–SDSS positional offset histogram. In the first analysis, wefound a higher Q0 value for the blue (S250/S350 > 2.4) SPIREsources, increasing with S/N (see Table 1). The average Q0 for theblue SPIRE sources, obtained from the number-weighted average of
MNRAS 476, 961–978 (2018)Downloaded from https://academic.oup.com/mnras/article-abstract/476/1/961/4816749by Periodicals Department , Hallward Library, University of Nottingham useron 07 March 2018
966 C. Furlanetto et al.
Figure 4. Illustration of the method to estimate 1 − Q0, the fraction of SPIRE sources without a counterpart, by counting the objects without a candidatecounterpart within the search radius (blanks) as a function of the search radius. The red circles represent the values obtained by dividing the number of observedblank SPIRE positions (green triangles) by the number of blank random positions (blue diamonds). The black solid line represents the best fit to the modelgiven in equation (17), with Q0 value indicated inside the panels. Left-hand panel shows the results for all optical candidates and right-hand panel shows theresults for extragalactic candidates only.
the values in Table 1, is 0.783. This difference is not only due to thefact that Q0 can be biased by the clustering and by the occurrenceof multiple counterparts, but mainly because Q0 is a function ofthe colour. B16 compared different methods to estimate Q0 andfound that Q0 can be boosted by 0.03 due to multiplicity and by0.07 due to clustering. As in Section 2.2.1, we examined the colourdependence of Q0 in the same colour bins of Fig. 2. We found asignificant dependence of Q0 with colour, with a variation fromQ0 = 0.31 in the reddest bin (considering only SPIRE sources withS250/S350 < 1.1) to Q0 = 0.83 in the bluest bin (SPIRE sources withS250/S350 > 2.4). However, the estimate of Q0 for the redder sourcesis not reliable, as we did not account for the bias from lensingreported in Bourne et al. (2014). For this reason, performing theLR analysis as a function of colour is not straightforward and wedecided to use the overall estimate of Q0 to obtain our ID catalogue.
In our LR analysis, we also assumed a constant value ofq(m)/n(m) for stars with r-band magnitude m < 21.5 and for extra-galactic objects with m < 13.5, following the prescription of B16and S11 for galaxies. This is because the q(m)/n(m) distributionis not well sampled for the brightest objects. The constant valueadopted corresponds to the average of q(m)/n(m) within this mag-nitude range, as shown by the dashed line in Fig. 3. As discussedin B16, one of the implications of this choice, in contrast with theassumption of a constant q(m) for stars as in S11, is that the brightstars will have a LR which is independent of the magnitude, there-fore discarding the assumption of any correspondence between theiroptical magnitude and detection in 250 μm. It is also important tonote that the relatively high q(m) measured for stars with m > 21.5(see Fig. 3) can be biased by faint unresolved galaxies which weremisclassified as stars.
2.3 Likelihood ratios and reliabilities
We applied the LR method described above and obtained the LRsand reliabilities of every potential counterpart within 10 arcsec ofeach SPIRE source with S/N250 ≥ 4. The SPIRE catalogue con-tains 112 155 sources with S/N250 ≥ 4. Of those, 77 521 sources(69.1 per cent of the sample) have at least one possible optical coun-terpart with rmodel < 22.4 in the SDSS-selected catalogue within thesearch radius. In total, there are 111 945 possible matches, of which14 630 (13.1 per cent) are classified as stars, 96 876 (86.5 per cent)
are classified as galaxies and 439 (0.4 per cent) are classified asquasars, according to the classification described in Section 2.1.1.The remaining 34 634 SPIRE sources (30.9 per cent of the sample)have no counterpart identified in the optical catalogue within thesearch radius of 10 arcsec. Most of these sources have red SPIREcolours and possibly lie at high redshift, being too faint to be de-tected in SDSS.
We visually inspected the brightest 1300 SPIRE sources in ourID catalogue to ensure that no large nearby galaxies have very lowreliability. One reason for this is because large galaxies are resolvedin the SPIRE maps, so that their positional errors do not followequation (9), which assumes point-like sources. Another reason isbecause they can be deblended into several components by the au-tomated source extraction in both optical and submm images. Insuch cases, the LRs and reliabilities of the optical counterparts areunderestimated. The reliability can also be underestimated when aSPIRE source is a merger or a blend of two objects. During the vi-sual inspection, we also found some objects that were misclassified,leading to under or overestimated reliabilities. We therefore flagged56 counterparts with reliability under- or overestimated and mod-ified their reliabilities. We also flagged 20 SPIRE sources whoseoptical counterparts were missed due to the incompleteness of theSDSS catalogue, in particular in the masked areas close to brightstars.
The LRs and reliabilities of all potential matches are shown inFig. 5 in three bins of S250/S350-μm colour. The plots show thatthe fraction of SPIRE sources with higher LRs and reliabilities islarger for the blue (S250/S350 > 1.8) SPIRE sources than for the red(S250/S350 < 1.0) ones. This can be explained by the fact that redsources are more likely to be at higher redshifts and therefore lesslikely to be detected in SDSS.
We consider those sources with Rj ≥ 0.8 as being reliable coun-terparts. We identified 42 429 reliable counterparts, which meansthat we were able to match 37.8 per cent of the SPIRE sourceswith a high reliability. Of those, 403 (1 per cent) are classified asstars, 41 733 (98.3 per cent) as galaxies and 293 (0.7 per cent) asquasars. The mean reliability of the reliable matches is 0.953. Thecontamination of the reliable sample can be estimated as
Nfalse =∑
i,Ri≥0.8
(1 − Ri), (19)
MNRAS 476, 961–978 (2018)Downloaded from https://academic.oup.com/mnras/article-abstract/476/1/961/4816749by Periodicals Department , Hallward Library, University of Nottingham useron 07 March 2018

The Herschel–ATLAS Data Release 2 Paper III 967
Figure 5. LRs and reliabilities of the optical counterparts in three bins of SPIRE sources colour.
Figure 6. Completeness η and cleanness C of the optical counterpart sampleas a function of the reliability cut.
which is based on the assumption that the probability of a counter-part being false is (1 − Ri). Statistically, we expect there to be 2002falsely identified objects with Rj ≥ 0.8, corresponding to 4.7 per centof the reliable matches. The same false ID rate was obtained by B16for the optical IDs in the GAMA fields.
We define the completeness of the reliable sample as
η = 1
Q0
n(R ≥ 0.8)
n(S/N250 ≥ 4), (20)
where η = 1 means that the fraction of the reliable counterpartsreaches Q0, and the cleanness of the reliable sample as
C = 1 − Nfalse
NSPIRE. (21)
For the reliable extragalactic counterparts, we obtainedη = 71.7 per cent, which is similar to the completeness of theIDs in the GAMA fields (73 per cent) obtained by B16. In Fig. 6,we show how completeness and cleanness change as a function ofthe reliability cut. The figure shows that the reliability cut chosenin equations (20) and (21), R ≥ 0.8, corresponds to a good com-promise between cleanness and completeness. A higher reliabilitycut would imply a modest increase in the cleanness at the cost of a
Table 2. Number of SPIRE sources as a function of the mul-tiplicity (mid) of candidate IDs within the 10-arcsec searchradius, counting either all candidates and reliable ones.
mid N (SPIRE) N (reliable)
0 34 634 0 (0 per cent)1 50 168 27 082 (54 per cent)2 21 370 12 155 (57 per cent)3 5032 2740 (54 per cent)4 837 396 (47 per cent)5 97 47 (48 per cent)6 12 5 (42 per cent)7 4 3 (75 per cent)8 1 1 (100 per cent)
drastic reduction of the completeness, while a lower cut would notresult in a significant increase of the completeness.
2.4 Multiplicity of the counterparts
The likelihood method assigns reliabilities in a self-consistent way,in order to deal with the case of multiple counterparts. The methodassumes that there is only one true counterpart and that the sum ofreliabilities of multiple candidates cannot exceed unity. This meansthat there is a bias against multiple genuine counterparts, such asmerging galaxies or members of the same cluster, resulting fromthe fact that multiple counterparts in the search radius reduce thereliability of the true counterpart. For example, in case of multiplecandidates, if one of them has Rj > 0.2, it is not possible to find areliable counterpart.
In Table 2, we present the distribution of the number of SPIREsources as a function of the multiplicity (mid) of the counterpartswith rmodel < 22.4 within the 10-arcsec search radius. We alsoshow the fraction of those with reliable counterparts. For instance,we found that 50 168 SPIRE sources have only one counterpart inthe optical catalogue, of which 54 per cent are reliable, and that21 370 have two potential IDs, of which 57 per cent are reliable.The fraction of reliable counterparts falls slowly with increasingmultiplicity, except for the last two bins. However, the number ofsources in the last two bins are so small that they are statisticallyinsignificant. The results of this table reflect the incompleteness ofthe ID sample due to multiplicity.
MNRAS 476, 961–978 (2018)Downloaded from https://academic.oup.com/mnras/article-abstract/476/1/961/4816749by Periodicals Department , Hallward Library, University of Nottingham useron 07 March 2018

968 C. Furlanetto et al.
Figure 7. Redshift distribution of the optical counterparts to the SPIREsources. The solid lines represent the redshift distribution for all potentialcounterparts, while the filled histograms represent the distribution for thereliable counterparts only. The black histogram corresponds to the pho-tometric redshift distribution and the red histogram to the spectroscopicredshift distribution.
Redshift information could be used to confirm whether multiplecounterparts are physically associated, either as interacting systemsor members of the same cluster. However, such investigation isdifficult, due to the large errors in the photometric redshifts andbecause only 1.4 per cent of the objects in our optical cataloguehave spectroscopic redshifts measured.
Another approach to avoid the effects of multiplicity is to usethe LR values instead of the reliabilities, as described in S11 andB16. From equation (8), it is easy to demonstrate that for the caseswhere there is only one extragalactic counterpart the threshold Rj ≥0.8 corresponds to a cut in LR of 1.924. We found 46 220 possibleextragalactic counterparts with LRs above that threshold, of which41 813 also satisfy the Rj ≥ 0.8 threshold. The remaining 4407(9.5 per cent) counterparts that fail these reliability criteria could beconsidered as missed candidates of SPIRE sources with multiplecounterparts. This fraction is smaller than the one obtained by B16(13.0 per cent) using the same approach. However, those missedcounterparts could be either genuine multiple associations or chancealignments.
Alternatively, we can estimate the number of missed multiplecounterparts by following the prescription from F12, which as-sumes that candidate matches are all associated with the sameSPIRE source if the sum of their reliabilities exceeds the thresh-old R = 0.8. We found that 2449 SPIRE sources have multipleextragalactic counterparts whose sum of their reliabilities exceedsthe threshold R = 0.8, but with no individual counterpart meet-ing the threshold. This means that those potentially true multiplecounterparts are missed by applying a threshold in the reliability ofindividual matches.
2.5 Redshift distribution
The redshift distribution of all potential counterparts and reliablecounterparts is shown in Fig. 7. Of the 111 945 potential opticalcounterparts, 8175 (7.3 per cent) have spectroscopic redshifts. Thisfraction increases by a factor of 2 for the reliable counterparts: 6975of the 42 429 (16.4 per cent) reliable counterparts have a spectro-scopic redshift, all of which originate from the SDSS DR10. Only30 reliable counterparts have a spectroscopic redshift with quality
Qz < 3. The larger fraction of objects in the ID catalogue with spec-troscopic redshift if compared to the input optical catalogue can beexplained by the fact that the LR method is more likely to find areliable that is brighter and the brighter objects are more likely tobe targeted by SDSS to have their spectroscopic redshift measured.
From the comparison of photometric and spectroscopic redshiftsdistributions in Fig. 7, it can be seen that the majority of our potentialcounterparts have zphot < 1, as expected from the magnitude limitof our SDSS catalogue. The figure also shows that most of the IDswith a spectroscopic redshift that is higher than 1 are reliable.
A more detailed discussion of the redshift distribution of theoptical counterparts to the H-ATLAS sources can be found in B16,since the GAMA fields have more spectroscopic redshift data.
3 N E A R - I N F R A R E D C O U N T E R PA RT STO SUBMM SOURCES
NIR wavelengths are better suited to study galaxies at high redshiftthan optical wavelengths, since the rest-frame UV and visible bandsare shifted to the IR part of the spectrum. The NIR is also lessattenuated by dust which facilitates detection of the dusty and star-forming sources found by Herschel. We therefore expect to identifya higher number of reliable counterparts to the SPIRE sources bymatching with an NIR catalogue than with SDSS for a given sourcenumber density.
For this reason, we have also investigated the identification ofNIR counterparts to the SPIRE sources with 250 μm S/N≥4 in asmaller area within the NGP field, using deeper data obtained withUKIRT. Although the entire NGP field is covered by the shallowerUKIDSS-LAS survey and therefore the optical identifications fromthe previous section have NIR photometry obtained from this survey,only in this small area observed by UKIRT, the data are deep enoughfor an independent ID analysis. Comparing the counterparts found inthis deeper data set with those in the shallower optical and NIR dataallows additional quantification of the efficiency of the identificationprocess as well as an understanding of the properties of the sourcesnot identified in the fainter data.
3.1 Near-infrared data
We obtained deeper NIR imaging in a smaller field of size 25.93 deg2
using the Wide Field Camera (WFCAM) on the UKIRT (Casaliet al. 2007). The field is centred approximately on the coordinatesRA=13h21m and Dec.=27d21m and is displayed in Fig. 8. Theobservations comprise 136 pointings, resulting in 34 tiles. The totalexposure time of each tile was 640 s, made up of 64 exposures of10 s. The seeing of the individual exposures ranges from 0.43 to1.21 arcsec, with an average of 0.72 arcsec.
The raw images were processed with the WFCAM pipeline inexactly the same way as for the UKIDSS-LAS (Dye et al. 2006).This stacks four sets of 10 s observations belonging to one ditherpattern into stacks of 40 s, then four of these are stacked into a stackof 160 s. We visually inspected the 160 s stacks and discarded thosewith poor data quality before stacking them into 640 or 320 s tiles.As a result, three tiles (12 of the 136 pointings) have a total exposuretime of 320 s.
The stacked tiles were then mosaicked together into a singleimage using SWARP (Bertin et al. 2002). When co-adding the tiles tocreate the mosaic, we used the normalized inverse variance weightmaps provided by the WFCAM pipeline and we scaled the fluxesto take into account that some tiles have different exposure times.
MNRAS 476, 961–978 (2018)Downloaded from https://academic.oup.com/mnras/article-abstract/476/1/961/4816749by Periodicals Department , Hallward Library, University of Nottingham useron 07 March 2018
The Herschel–ATLAS Data Release 2 Paper III 969
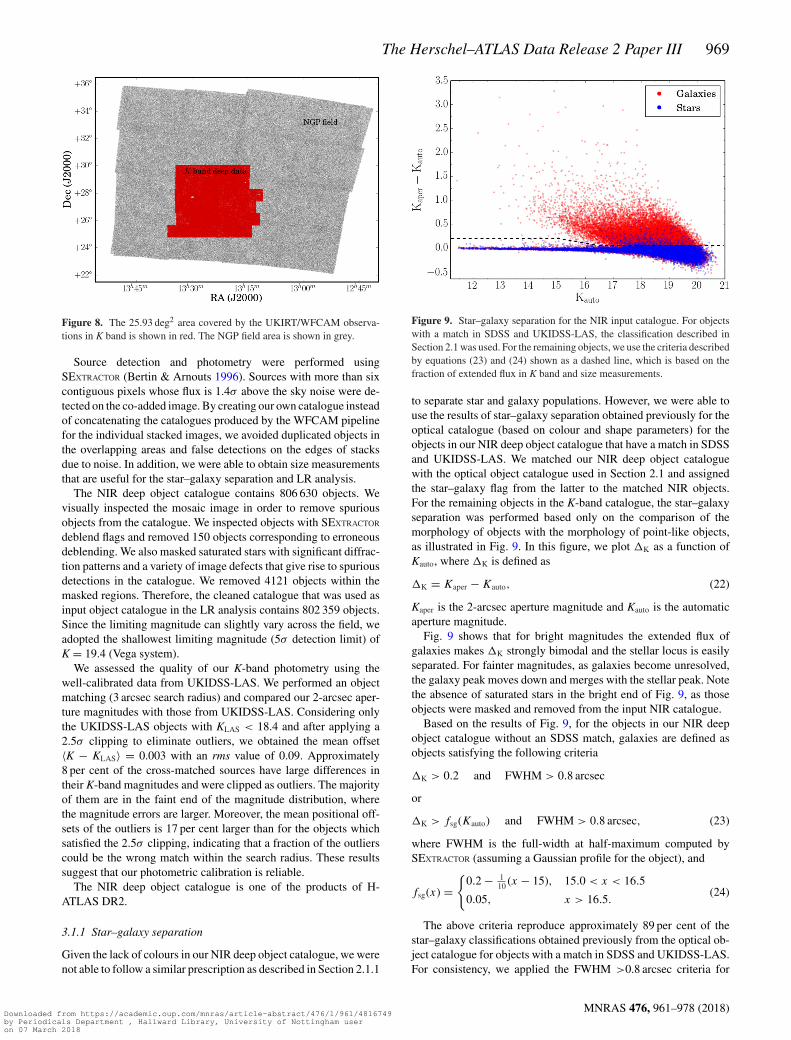
Figure 8. The 25.93 deg2 area covered by the UKIRT/WFCAM observa-tions in K band is shown in red. The NGP field area is shown in grey.
Source detection and photometry were performed usingSEXTRACTOR (Bertin & Arnouts 1996). Sources with more than sixcontiguous pixels whose flux is 1.4σ above the sky noise were de-tected on the co-added image. By creating our own catalogue insteadof concatenating the catalogues produced by the WFCAM pipelinefor the individual stacked images, we avoided duplicated objects inthe overlapping areas and false detections on the edges of stacksdue to noise. In addition, we were able to obtain size measurementsthat are useful for the star–galaxy separation and LR analysis.
The NIR deep object catalogue contains 806 630 objects. Wevisually inspected the mosaic image in order to remove spuriousobjects from the catalogue. We inspected objects with SEXTRACTOR
deblend flags and removed 150 objects corresponding to erroneousdeblending. We also masked saturated stars with significant diffrac-tion patterns and a variety of image defects that give rise to spuriousdetections in the catalogue. We removed 4121 objects within themasked regions. Therefore, the cleaned catalogue that was used asinput object catalogue in the LR analysis contains 802 359 objects.Since the limiting magnitude can slightly vary across the field, weadopted the shallowest limiting magnitude (5σ detection limit) ofK = 19.4 (Vega system).
We assessed the quality of our K-band photometry using thewell-calibrated data from UKIDSS-LAS. We performed an objectmatching (3 arcsec search radius) and compared our 2-arcsec aper-ture magnitudes with those from UKIDSS-LAS. Considering onlythe UKIDSS-LAS objects with KLAS < 18.4 and after applying a2.5σ clipping to eliminate outliers, we obtained the mean offset〈K − KLAS〉 = 0.003 with an rms value of 0.09. Approximately8 per cent of the cross-matched sources have large differences intheir K-band magnitudes and were clipped as outliers. The majorityof them are in the faint end of the magnitude distribution, wherethe magnitude errors are larger. Moreover, the mean positional off-sets of the outliers is 17 per cent larger than for the objects whichsatisfied the 2.5σ clipping, indicating that a fraction of the outlierscould be the wrong match within the search radius. These resultssuggest that our photometric calibration is reliable.
The NIR deep object catalogue is one of the products of H-ATLAS DR2.
3.1.1 Star–galaxy separation
Given the lack of colours in our NIR deep object catalogue, we werenot able to follow a similar prescription as described in Section 2.1.1
Figure 9. Star–galaxy separation for the NIR input catalogue. For objectswith a match in SDSS and UKIDSS-LAS, the classification described inSection 2.1 was used. For the remaining objects, we use the criteria describedby equations (23) and (24) shown as a dashed line, which is based on thefraction of extended flux in K band and size measurements.
to separate star and galaxy populations. However, we were able touse the results of star–galaxy separation obtained previously for theoptical catalogue (based on colour and shape parameters) for theobjects in our NIR deep object catalogue that have a match in SDSSand UKIDSS-LAS. We matched our NIR deep object cataloguewith the optical object catalogue used in Section 2.1 and assignedthe star–galaxy flag from the latter to the matched NIR objects.For the remaining objects in the K-band catalogue, the star–galaxyseparation was performed based only on the comparison of themorphology of objects with the morphology of point-like objects,as illustrated in Fig. 9. In this figure, we plot �K as a function ofKauto, where �K is defined as
�K = Kaper − Kauto, (22)
Kaper is the 2-arcsec aperture magnitude and Kauto is the automaticaperture magnitude.
Fig. 9 shows that for bright magnitudes the extended flux ofgalaxies makes �K strongly bimodal and the stellar locus is easilyseparated. For fainter magnitudes, as galaxies become unresolved,the galaxy peak moves down and merges with the stellar peak. Notethe absence of saturated stars in the bright end of Fig. 9, as thoseobjects were masked and removed from the input NIR catalogue.
Based on the results of Fig. 9, for the objects in our NIR deepobject catalogue without an SDSS match, galaxies are defined asobjects satisfying the following criteria
�K > 0.2 and FWHM > 0.8 arcsec
or
�K > fsg(Kauto) and FWHM > 0.8 arcsec, (23)
where FWHM is the full-width at half-maximum computed bySEXTRACTOR (assuming a Gaussian profile for the object), and
fsg(x) ={
0.2 − 110 (x − 15), 15.0 < x < 16.5
0.05, x > 16.5.(24)
The above criteria reproduce approximately 89 per cent of thestar–galaxy classifications obtained previously from the optical ob-ject catalogue for objects with a match in SDSS and UKIDSS-LAS.For consistency, we applied the FWHM >0.8 arcsec criteria for
MNRAS 476, 961–978 (2018)Downloaded from https://academic.oup.com/mnras/article-abstract/476/1/961/4816749by Periodicals Department , Hallward Library, University of Nottingham useron 07 March 2018
970 C. Furlanetto et al.
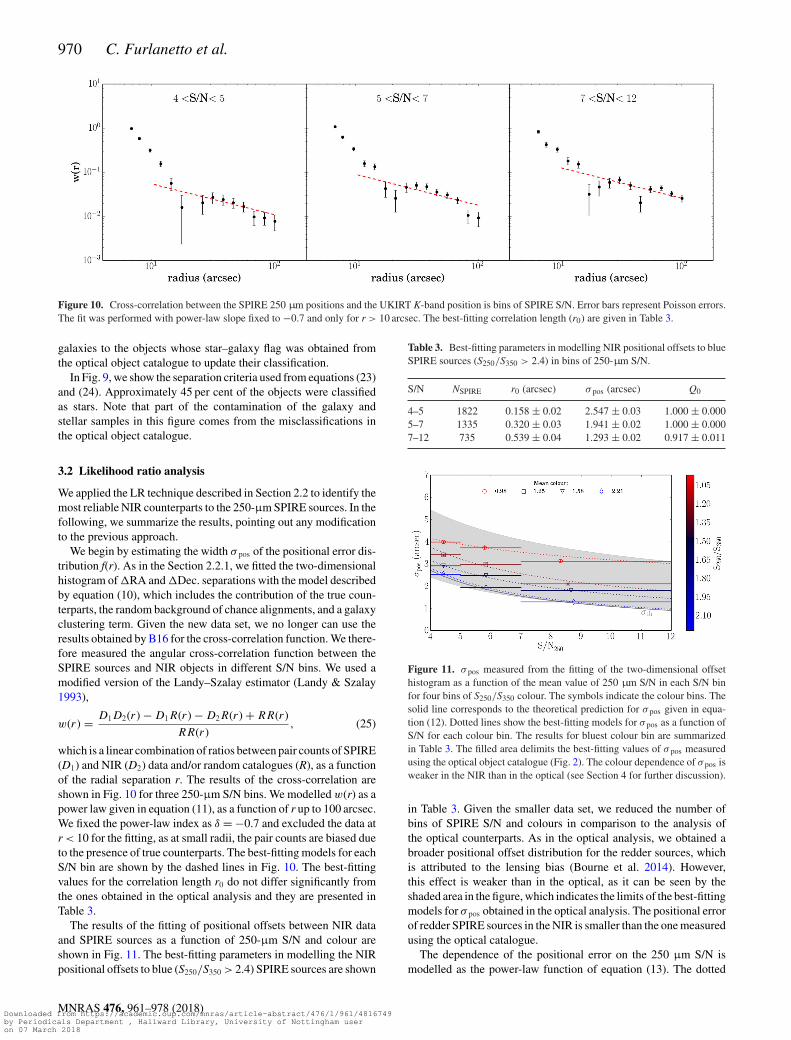
Figure 10. Cross-correlation between the SPIRE 250 µm positions and the UKIRT K-band position is bins of SPIRE S/N. Error bars represent Poisson errors.The fit was performed with power-law slope fixed to −0.7 and only for r > 10 arcsec. The best-fitting correlation length (r0) are given in Table 3.
galaxies to the objects whose star–galaxy flag was obtained fromthe optical object catalogue to update their classification.
In Fig. 9, we show the separation criteria used from equations (23)and (24). Approximately 45 per cent of the objects were classifiedas stars. Note that part of the contamination of the galaxy andstellar samples in this figure comes from the misclassifications inthe optical object catalogue.
3.2 Likelihood ratio analysis
We applied the LR technique described in Section 2.2 to identify themost reliable NIR counterparts to the 250-μm SPIRE sources. In thefollowing, we summarize the results, pointing out any modificationto the previous approach.
We begin by estimating the width σ pos of the positional error dis-tribution f(r). As in the Section 2.2.1, we fitted the two-dimensionalhistogram of �RA and �Dec. separations with the model describedby equation (10), which includes the contribution of the true coun-terparts, the random background of chance alignments, and a galaxyclustering term. Given the new data set, we no longer can use theresults obtained by B16 for the cross-correlation function. We there-fore measured the angular cross-correlation function between theSPIRE sources and NIR objects in different S/N bins. We used amodified version of the Landy–Szalay estimator (Landy & Szalay1993),
w(r) = D1D2(r) − D1R(r) − D2R(r) + RR(r)
RR(r), (25)
which is a linear combination of ratios between pair counts of SPIRE(D1) and NIR (D2) data and/or random catalogues (R), as a functionof the radial separation r. The results of the cross-correlation areshown in Fig. 10 for three 250-μm S/N bins. We modelled w(r) as apower law given in equation (11), as a function of r up to 100 arcsec.We fixed the power-law index as δ = −0.7 and excluded the data atr < 10 for the fitting, as at small radii, the pair counts are biased dueto the presence of true counterparts. The best-fitting models for eachS/N bin are shown by the dashed lines in Fig. 10. The best-fittingvalues for the correlation length r0 do not differ significantly fromthe ones obtained in the optical analysis and they are presented inTable 3.
The results of the fitting of positional offsets between NIR dataand SPIRE sources as a function of 250-μm S/N and colour areshown in Fig. 11. The best-fitting parameters in modelling the NIRpositional offsets to blue (S250/S350 > 2.4) SPIRE sources are shown
Table 3. Best-fitting parameters in modelling NIR positional offsets to blueSPIRE sources (S250/S350 > 2.4) in bins of 250-µm S/N.
S/N NSPIRE r0 (arcsec) σ pos (arcsec) Q0
4–5 1822 0.158 ± 0.02 2.547 ± 0.03 1.000 ± 0.0005–7 1335 0.320 ± 0.03 1.941 ± 0.02 1.000 ± 0.0007–12 735 0.539 ± 0.04 1.293 ± 0.02 0.917 ± 0.011
Figure 11. σ pos measured from the fitting of the two-dimensional offsethistogram as a function of the mean value of 250 µm S/N in each S/N binfor four bins of S250/S350 colour. The symbols indicate the colour bins. Thesolid line corresponds to the theoretical prediction for σ pos given in equa-tion (12). Dotted lines show the best-fitting models for σ pos as a function ofS/N for each colour bin. The results for bluest colour bin are summarizedin Table 3. The filled area delimits the best-fitting values of σ pos measuredusing the optical object catalogue (Fig. 2). The colour dependence of σ pos isweaker in the NIR than in the optical (see Section 4 for further discussion).
in Table 3. Given the smaller data set, we reduced the number ofbins of SPIRE S/N and colours in comparison to the analysis ofthe optical counterparts. As in the optical analysis, we obtained abroader positional offset distribution for the redder sources, whichis attributed to the lensing bias (Bourne et al. 2014). However,this effect is weaker than in the optical, as it can be seen by theshaded area in the figure, which indicates the limits of the best-fittingmodels for σ pos obtained in the optical analysis. The positional errorof redder SPIRE sources in the NIR is smaller than the one measuredusing the optical catalogue.
The dependence of the positional error on the 250 μm S/N ismodelled as the power-law function of equation (13). The dotted
MNRAS 476, 961–978 (2018)Downloaded from https://academic.oup.com/mnras/article-abstract/476/1/961/4816749by Periodicals Department , Hallward Library, University of Nottingham useron 07 March 2018

The Herschel–ATLAS Data Release 2 Paper III 971
Figure 12. The K-band magnitude distribution q(m)/n(m) for extragalacticobjects and stars. We assume a constant value corresponding to the averageof q(m)/n(m) at magnitudes m < 18 for stars and m < 12 for extragalacticobjects, since at brighter magnitudes the distributions are not well sampled.
lines in Fig. 11 correspond to best-fitting models for each colourbin. For the bluest sources, we obtained that σ (5) = 2.26 ± 0.11and the slope of the power law is α = −0.99 ± 0.04. This empiricaldependence of σ pos on S/N for the blue SPIRE sources is very closeto the theoretical prediction of equation (12), which is plotted as agrey solid line figure.
We then measured the K magnitude distributions n(m) and q(m)for the NIR counterparts, following the prescription of Section 2.2.2.The SEXTRACTOR automatic aperture magnitude (MAG_AUTO) wasadopted in this case. In Fig. 12, we show the magnitude distributionq(m)/n(m), which is used in the LR analysis (equation 7). As forthe optical case, the value of q(m)/n(m) for brighter magnitudes(K < 18 for stars and K < 12 for extragalactic objects) is fixed atthe average within that range.
We estimated the normalization of the probability distributionq(m), Q0, by counting blanks (sources without a counterpart can-
didate) as a function of the search radius and fitting the model ofequation (17). In Fig. 13, we present the results of the method.We measured Q0 = 0.754 ± 0.001 for extragalactic objects andQ0 = 0.082 ± 0.001 for stellar objects. This is similar to the valuemeasured by F12, Q0 = 0.72 ± 0.03, using VISTA VIKING datadown to Ks = 19.2 (Vega system) for the Phase 1 GAMA9 field(≈54 deg2). We ascribe the slight increase in our measurement of Q0
to the increased depth of our NIR catalogue. The Q0 value obtainedfor stars is much higher than the one obtained by F12, Q0 = 0.01.This is mainly due to the contamination of unresolved galaxies inour stellar sample.
Finally, we calculated the LRs and reliabilities of every poten-tial counterpart with K < 19.4 within 10 arcsec of each SPIREsource, using equations (7) and (8), respectively. There are 17 247SPIRE sources with S/N250 ≥ 4 in the area observed with WF-CAM. We found 32 041 possible counterparts with K < 19.4within a 10-arcsec search radius to 15 780 SPIRE sources. Ofthose 7490 are classified as stars, 24 488 as galaxies and 63 asQSOs. The remaining 1467 SPIRE sources without a counterpartidentified in the NIR data are too faint to be detected in the WF-CAM imaging or lie in masked areas around bright stars and imagedefects.
We visually inspected the NIR image around the brightest sourcesin our ID catalogue down to S250 = 120 mJy (approximately 400sources) and flagged 16 sources with reliability under- or overesti-mated, following the same procedure as for the optical ID catalogue(see Section 2.3).
We identified 10 668 reliable NIR counterparts. This means thatwe were able to match 61.8 per cent of the SPIRE sources withR ≥ 0.8. In comparison, F12 found a reliable counterpart in theVISTA VIKING data for 51 per cent of the SPIRE sources in thePhase 1 GAMA9 field. To test whether the increase in the frac-tion of reliable NIR counterparts is due to the increase in Q0 andin the depth of the NIR catalogue, we recalculated the LR usingthe same Q0 values and magnitude limit as F12. We obtained that55.3 per cent of the SPIRE sources have a reliable identification.The effect of increasing Q0 and the depth of the catalogue is sig-nificant, but is not the only factor responsible for the improvementin the reliable fraction. According to V16, the use of a matchedfilter in the source extraction of NGP sources has reduced the
Figure 13. The method of determining the fraction of SPIRE sources without a counterpart (1 − Q0), by counting the objects with no candidate counterpartwith K < 19.4 within the search radius as a function of the search radius. The red circles represent the values obtained by dividing the number of observedblank SPIRE positions (green triangles) by the number of blank random positions (blue diamonds). The black solid line represents the best fit to the modelgiven in equation (17), with Q0 value indicated inside the panels. Left-hand panel shows the results for all optical candidates and right-hand panel shows theresults for extragalactic candidates only. Dashed lines correspond to the best-fitting model obtained for the optical case.
MNRAS 476, 961–978 (2018)Downloaded from https://academic.oup.com/mnras/article-abstract/476/1/961/4816749by Periodicals Department , Hallward Library, University of Nottingham useron 07 March 2018

972 C. Furlanetto et al.
Table 4. Number of SPIRE sources as a function of the multiplicity (mid)of NIR candidate IDs within the 10-arcsec search radius, counting either allcandidates and reliable ones, in both deep and shallow K-band matching.
Deep K matching Shallow K matchingK < 19.40 K < 18.69
mid N (SPIRE) N (reliable) N (SPIRE) N (reliable)
0 1467 0 (0 per cent) 3227 0 (0 per cent)1 5884 48 587 (78 per cent) 7383 5429 (74 per cent)2 5505 3752 (68 per cent) 4566 2946 (64 per cent)3 2921 1626 (56 per cent) 1580 852 (54 per cent)4 1081 534 (49 per cent) 389 193 (50 per cent)5 300 136 (45 per cent) 83 34 (41 per cent)6 66 22 (33 per cent) 18 5 (28 per cent)7 20 9 (45 per cent) 1 0 (0 per cent)8 3 2 (67 per cent) 0 0 (0 per cent)
positional uncertainties compared with the PSF filtering, as usedin F12. This also improves the LR and reliability of the identifiedcounterparts.
Using equation (19), we estimated that there are 477 false NIRcounterparts with R ≥ 0.8, corresponding to a false ID rate of4.5 per cent. For the reliable extragalactic counterparts, from equa-tion (20), we obtained the completeness η = 0.74. The contamina-tion rates and completeness in the NIR are similar to those obtainedin F12 and in the previous optical analysis, indicating that the appli-cation of the LR method was consistent and that the performance ofthe method is independent of the wavelength or depth of the inputcatalogue.
In Table 4, we show the number of SPIRE sources matched andthe fraction of reliable as a function of the multiplicity (numberof candidate IDs per position, mid). For a more detailed discussionabout the multiplicity and the comparison with the optical matchingresults, please see Section 4.
The LRs and reliabilities are shown in Fig. 14 for three bins ofSPIRE S250/S350 colour. For comparison, we also show the results ofthe optical counterparts to the reddest SPIRE sources (from Fig. 5)as filled histograms. We can see a significant improvement in theNIR matching of the number of highly reliable counterparts toredder SPIRE sources.
4 C O M PA R I N G O P T I C A L A N D N I RI D E N T I F I C AT I O N S
In this section, we investigate the performance of the LR methodto identify optical and NIR counterparts to the SPIRE sources.We present a comparison of the counterparts identified by the LRmethod in the SDSS and in our K-band object catalogue. We alsoinvestigate the optical and NIR properties of the H-ATLAS coun-terparts.
In Table 5, we summarize the results from previous sectionsfor the optical and NIR identifications to the SPIRE sources withS/N250 ≥ 4 (second and third columns).
The number of reliably identified sources in both optical and NIRmatching corresponds to approximately 70 per cent of the estimatednumber of true counterparts which are above the magnitude limit,given by Q0. The remaining sources can be associated with oneor more low-reliability match(es). Our estimates also indicate thatcontamination of misidentified sources (Nfalse) is 4.7 per cent forthe optical ID catalogue and 4.5 per cent for the NIR ID catalogue.These estimates are lower limits, as these contamination fractionsdo not include the effects of lensing, for which we cannot correct inthis work. Follow-up observations in radio/submm with subarcsecposition are required to confirm these estimates.
We compare the magnitude distribution of the reliable and un-reliable counterparts for the r- and K-band matchings in Fig. 15.In the figure, we also show the magnitude distribution of all ob-jects in the corresponding input catalogue. We can see that in bothcases, the magnitude distribution of the unreliable identifications issimilar to the overall magnitude distribution of the objects in theinput catalogue. This indicates, as expected, that a significant frac-tion of unreliable counterparts may consist of unrelated backgroundobjects.
In Fig. 16, we compare the S250/S350 colour distribution of SPIREsources with reliable counterparts identified to the distribution ofsources with no counterpart (blanks) for both optical matching (up-per panel) and NIR matching (lower panel). The redder colours ofthe blank SPIRE sources in both panels (median S250/S350 = 1.24for the optical matching and median S250/S350 = 1.16 for the NIRmatching) suggests that those are at higher redshifts and are too faintto be detected in SDSS and K-band catalogues. The SPIRE sourcesreliably identified are distinctively bluer in the optical matching
Figure 14. LRs and reliabilities of the NIR counterparts with K < 19.4 in three bins of SPIRE sources colour. The filled histograms correspond to the resultsof the optical counterparts to the reddest SPIRE sources.
MNRAS 476, 961–978 (2018)Downloaded from https://academic.oup.com/mnras/article-abstract/476/1/961/4816749by Periodicals Department , Hallward Library, University of Nottingham useron 07 March 2018

The Herschel–ATLAS Data Release 2 Paper III 973
Table 5. Summary of results for optical and NIR identifications to the SPIRE sources. The second column correspondsto the results of the LR method for the full NGP area. The third column represents the results of the LR method appliedto the WFCAM data, using its original estimated depth (K < 19.40). The fourth column shows the results of the opticalID catalogue in the area overlapping to the WFCAM observations. The last column corresponds to the results of theLR method applied to the WFCAM data using a shallower limiting magnitude, chosen so that the NIR surface densitymatches the SDSS one (K < 18.69).
r-band full area K band (K < 19.40) r-band overlap K band (K < 18.69)
Area (deg2) 177.13 25.93 25.93 25.93SPIRE S/N250 ≥ 4 112 155 17 247 17 247 17 247Q0 0.538 0.836 0.538 0.723Counterparts ≤10 arcsec 111 945 32 041 17 107 23 341Reliable counterparts 42 429 10 668 6285 9459SPIRE with counterpart 77 521 15 780 11 829 14 020SPIRE blanks 34 634 1467 5417 3227
Figure 15. Magnitude distribution of all objects in the input catalogue andof objects identified as reliable or unreliable counterparts of a SPIRE sourcein the optical (upper panel) and NIR (lower panel) matching cases.
(median S250/S350 = 1.84) than in the NIR matching (medianS250/S350 = 1.58). In both optical and NIR matching, the colours ofSPIRE sources with unreliable counterparts lie in between the reli-able and blank populations, suggesting that this subset of sources isformed by both populations.
The results above indicate that, as expected, our deeper K-banddata are more effective than the SDSS r-band data for reliablyidentifying SPIRE sources, especially the redder ones. However, amore direct comparison between the identification of counterpartsin two different wavelengths should take into account the depth(and surface density of objects) of both catalogues. Moreover, the
Figure 16. S250/S350 colour distribution of the SPIRE sources. The greyhistogram correspond to the colour distribution of all SPIRE sources withS/N250 ≥ 4. The red histogram corresponds to those sources with a reliablematch and the blue histogram to those with no match (blanks). Upper panelshows the results for sources in the r-band matching, while lower panelpresents the results of K-band matching. The vertical lines correspond to themedian values of the distributions.
comparison should be done using similar areas, in order to mini-mize any differences arising from cosmic variance. Therefore, weassessed the performance of the LR to identify optical and NIRcounterparts to the SPIRE sources considering only the opticalidentifications in the area overlapping to the NIR observations andusing a shallower magnitude limit in K-band catalogue (K < 18.69),chosen so that the object surface density matches the SDSS one.
MNRAS 476, 961–978 (2018)Downloaded from https://academic.oup.com/mnras/article-abstract/476/1/961/4816749by Periodicals Department , Hallward Library, University of Nottingham useron 07 March 2018
974 C. Furlanetto et al.
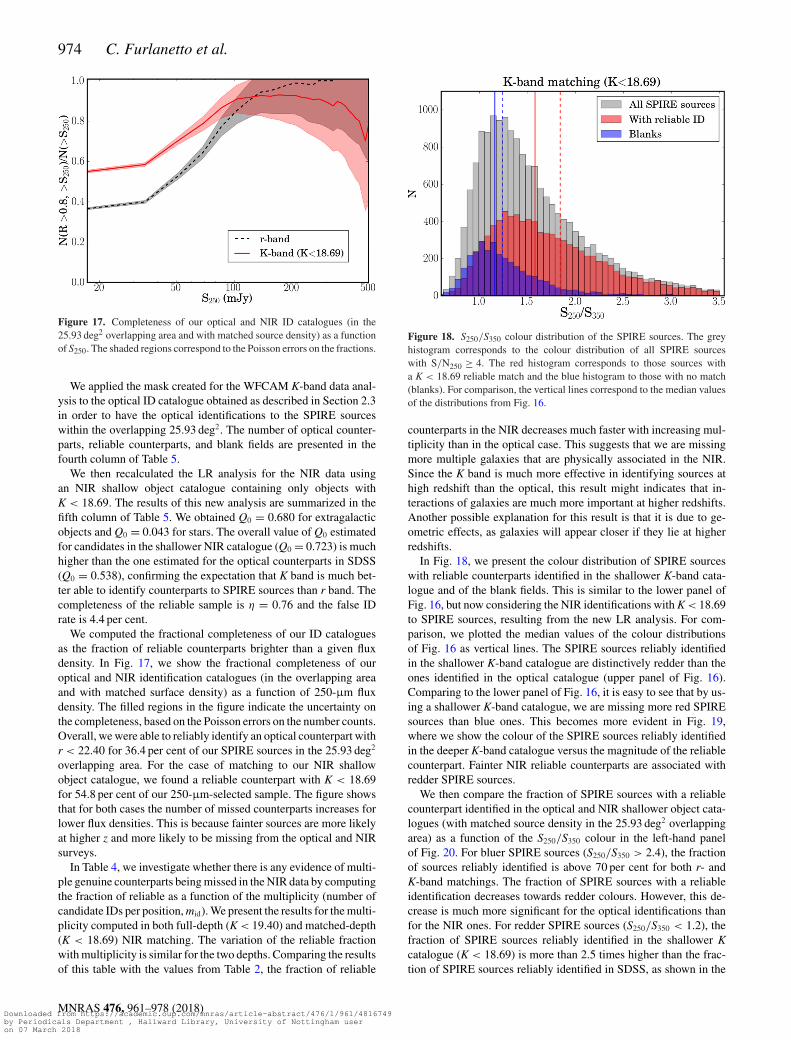
Figure 17. Completeness of our optical and NIR ID catalogues (in the25.93 deg2 overlapping area and with matched source density) as a functionof S250. The shaded regions correspond to the Poisson errors on the fractions.
We applied the mask created for the WFCAM K-band data anal-ysis to the optical ID catalogue obtained as described in Section 2.3in order to have the optical identifications to the SPIRE sourceswithin the overlapping 25.93 deg2. The number of optical counter-parts, reliable counterparts, and blank fields are presented in thefourth column of Table 5.
We then recalculated the LR analysis for the NIR data usingan NIR shallow object catalogue containing only objects withK < 18.69. The results of this new analysis are summarized in thefifth column of Table 5. We obtained Q0 = 0.680 for extragalacticobjects and Q0 = 0.043 for stars. The overall value of Q0 estimatedfor candidates in the shallower NIR catalogue (Q0 = 0.723) is muchhigher than the one estimated for the optical counterparts in SDSS(Q0 = 0.538), confirming the expectation that K band is much bet-ter able to identify counterparts to SPIRE sources than r band. Thecompleteness of the reliable sample is η = 0.76 and the false IDrate is 4.4 per cent.
We computed the fractional completeness of our ID cataloguesas the fraction of reliable counterparts brighter than a given fluxdensity. In Fig. 17, we show the fractional completeness of ouroptical and NIR identification catalogues (in the overlapping areaand with matched surface density) as a function of 250-μm fluxdensity. The filled regions in the figure indicate the uncertainty onthe completeness, based on the Poisson errors on the number counts.Overall, we were able to reliably identify an optical counterpart withr < 22.40 for 36.4 per cent of our SPIRE sources in the 25.93 deg2
overlapping area. For the case of matching to our NIR shallowobject catalogue, we found a reliable counterpart with K < 18.69for 54.8 per cent of our 250-μm-selected sample. The figure showsthat for both cases the number of missed counterparts increases forlower flux densities. This is because fainter sources are more likelyat higher z and more likely to be missing from the optical and NIRsurveys.
In Table 4, we investigate whether there is any evidence of multi-ple genuine counterparts being missed in the NIR data by computingthe fraction of reliable as a function of the multiplicity (number ofcandidate IDs per position, mid). We present the results for the multi-plicity computed in both full-depth (K < 19.40) and matched-depth(K < 18.69) NIR matching. The variation of the reliable fractionwith multiplicity is similar for the two depths. Comparing the resultsof this table with the values from Table 2, the fraction of reliable
Figure 18. S250/S350 colour distribution of the SPIRE sources. The greyhistogram corresponds to the colour distribution of all SPIRE sourceswith S/N250 ≥ 4. The red histogram corresponds to those sources witha K < 18.69 reliable match and the blue histogram to those with no match(blanks). For comparison, the vertical lines correspond to the median valuesof the distributions from Fig. 16.
counterparts in the NIR decreases much faster with increasing mul-tiplicity than in the optical case. This suggests that we are missingmore multiple galaxies that are physically associated in the NIR.Since the K band is much more effective in identifying sources athigh redshift than the optical, this result might indicates that in-teractions of galaxies are much more important at higher redshifts.Another possible explanation for this result is that it is due to ge-ometric effects, as galaxies will appear closer if they lie at higherredshifts.
In Fig. 18, we present the colour distribution of SPIRE sourceswith reliable counterparts identified in the shallower K-band cata-logue and of the blank fields. This is similar to the lower panel ofFig. 16, but now considering the NIR identifications with K < 18.69to SPIRE sources, resulting from the new LR analysis. For com-parison, we plotted the median values of the colour distributionsof Fig. 16 as vertical lines. The SPIRE sources reliably identifiedin the shallower K-band catalogue are distinctively redder than theones identified in the optical catalogue (upper panel of Fig. 16).Comparing to the lower panel of Fig. 16, it is easy to see that by us-ing a shallower K-band catalogue, we are missing more red SPIREsources than blue ones. This becomes more evident in Fig. 19,where we show the colour of the SPIRE sources reliably identifiedin the deeper K-band catalogue versus the magnitude of the reliablecounterpart. Fainter NIR reliable counterparts are associated withredder SPIRE sources.
We then compare the fraction of SPIRE sources with a reliablecounterpart identified in the optical and NIR shallower object cata-logues (with matched source density in the 25.93 deg2 overlappingarea) as a function of the S250/S350 colour in the left-hand panelof Fig. 20. For bluer SPIRE sources (S250/S350 > 2.4), the fractionof sources reliably identified is above 70 per cent for both r- andK-band matchings. The fraction of SPIRE sources with a reliableidentification decreases towards redder colours. However, this de-crease is much more significant for the optical identifications thanfor the NIR ones. For redder SPIRE sources (S250/S350 < 1.2), thefraction of SPIRE sources reliably identified in the shallower Kcatalogue (K < 18.69) is more than 2.5 times higher than the frac-tion of SPIRE sources reliably identified in SDSS, as shown in the
MNRAS 476, 961–978 (2018)Downloaded from https://academic.oup.com/mnras/article-abstract/476/1/961/4816749by Periodicals Department , Hallward Library, University of Nottingham useron 07 March 2018

The Herschel–ATLAS Data Release 2 Paper III 975
Figure 19. S250/S350 colour of the SPIRE sources reliably identified in thedeeper K-band catalogue (K < 19.40) as a function of the counterpart Kmagnitude. Fainter counterparts are associated with redder SPIRE sources.
right-hand panel of the figure (red squares), where the ratio betweenthe NIR and optical reliable fractions is shown. Considering the re-liable identifications in the deeper K catalogue (K < 19.40), thisratio can be higher than 3.5 (black circles).
In order to quantify the effect of the increasing of the depth ofthe input catalogue on the identification of the red SPIRE sources,we compared the fraction of SPIRE sources with a reliable coun-terpart identified applying the LR method to shallower (K < 18.69)and deeper (K < 19.40) K-band catalogues. In Fig. 21, we showthe ratio of those fractions. For the bluer SPIRE sources, a similarfraction of reliable identifications is found in both the shallower anddeeper K-band catalogue. The bluer SPIRE sources are generallyassociated with bright NIR objects and increasing the depth of theNIR catalogue does not improve the detection of those sources.For the redder SPIRE sources, the depth of the catalogue has animportant role on the identification of their NIR counterparts. Go-ing 0.7 mag deeper increases the fraction of redder SPIRE sources(S250/S350 < 1.2) reliably identified by more than 20 per cent. Theredder SPIRE sources are likely to be at higher redshifts and canbe too faint to be detected in K < 18.69 catalogue. As discussedin Bourne et al. (2014), the larger positional error of red sources
Figure 21. Ratio between the fraction of SPIRE sources with a reliablecounterpart identified by the LR method in the deeper (K < 19.40) catalogueand the fraction of SPIRE sources with a reliable counterpart identified inshallower (K < 18.69) catalogue as a function of the SPIRE S250/S350 colour.The error bars correspond to the Poisson errors on the ratios.
is due to lensing (the red submm sources being falsely identifiedto a low-redshift lensing structure) and/or clustering effects (redsources constitute a more clustered population than the blue ones).We found that this effect was weaker in the NIR than in the opti-cal. The larger σ pos values for red SPIRE sources when fitting theSPIRE-optical offsets (see Fig. 2) can be explained by the lack ofsome true counterpart in the optical, inducing the cross-correlationbetween the foreground lensing structures and background high-zSPIRE sources (Gonzalez-Nuevo et al. 2017).
Finally, it is interesting to quantify how many SPIRE sourcesthe optical and NIR matching agree or disagree on reliable iden-tifications. In order to compare our results, we cross-matched ourSDSS candidate IDs with the shallower K-band ID catalogue. Weused a 2 arcsec search radius and considered the nearest match. Wechecked that for all the matches, both optical and NIR counterpartsare associated with the same SPIRE source. We found that 9388of the 23 341 NIR counterparts are not detected in the optical IDcatalogue within 2 arcsec. Conversely, 3154 of 17 107 optical iden-tifications are not detected in the NIR ID catalogue within the same
Figure 20. Left-hand panel: fraction of SPIRE sources with S/N250 ≥ 4 with a reliable counterpart identified in the optical and shallower NIR (K < 18.69)catalogues as a function of the source S250/S350 colour. Right-hand panel: ratio between the NIR and optical fractions. The red squares correspond to the ratioof the fractions shown in the left-hand panel. The black circles correspond to the case where the reliable identifications in the deeper K catalogue (K < 19.40)are considered. The error bars represent Poisson counting errors.
MNRAS 476, 961–978 (2018)Downloaded from https://academic.oup.com/mnras/article-abstract/476/1/961/4816749by Periodicals Department , Hallward Library, University of Nottingham useron 07 March 2018

976 C. Furlanetto et al.
Figure 22. S250/S350 colour of the SPIRE sources whose reliabilities in theoptical and NIR agree or disagree. The grey histogram shows the colour dis-tribution of the SPIRE sources reliably identified in both wavelengths. Thered histogram shows the colour distribution of the SPIRE sources identifiedas reliable in the NIR, but as unreliable in the optical. The colour distributionof the opposite situation (SPIRE sources identified as reliable in the optical,but as unreliable in the NIR) is shown in blue.
radius search. There are 5497 SPIRE sources reliably identified inboth ID catalogues. This corresponds to ∼88 per cent of the reliableoptical matches and to ∼58 per cent of the K-band reliable matches.503 reliable identifications in the optical are classified as unreliablein the NIR ID (although 234 of them have R ≥ 0.6), while 902reliable NIR candidates are classified as unreliable in the optical IDcatalogue (539 of them have R ≥ 0.6). We found that 3060 SPIREsources reliably identified in the NIR are blank in the SDSS. Amuch smaller number (285) of SPIRE sources identified in the op-tical are blank in the NIR catalogue. In Fig. 22, we show the colourdistribution of SPIRE sources whose reliabilities in the optical andNIR agree or disagree. The subset of SPIRE sources identified asreliable in the NIR but as unreliable in the optical is slightly redder(median S250/S350 = 1.45) than the opposite case, where SPIREsources identified as reliable in the optical but as unreliable in theNIR (median S250/S350 = 1.59). The fact that both subsets (wherea reliable ID was only found in either optical or NIR) have reddercolours than the subset of IDs which are reliable in both cataloguesindicates that its more likely that the identification is ambiguous orwrong if the SPIRE colour is redder.
The NIR bands offer a significant improvement for the identifi-cation of counterparts to SPIRE sources, particularly the red ones.
5 R A D I O C O U N T E R PA RTS TO SU B M MS O U R C E S
Radio observations are particularly useful to unambiguously iden-tify counterparts to submm sources. The low surface density of radiosources combined with the significantly higher resolution offeredvia interferometry reduces the probability of a chance associationwith a submm source. Moreover, searching for the radio emission ofsubmm sources exploits the well-known correlation between radioand far-infrared (FIR) emission (Helou, Soifer & Rowan-Robinson1985; Condon, Anderson & Helou 1991; Ivison et al. 2010). Once aradio counterpart of a submm source is identified, its accurate posi-tion can be used to easily identify the source at other wavelengths.The disadvantage of matching to radio counterparts is that, becauseof the radio–FIR correlation, radio counterparts are more likely to
be found for the brightest submm sources, which may not representthe entire population. Another disadvantage is that a large fractionof submm sources do not have radio counterparts (Chapman et al.2003; Barger, Cowie & Wang 2007; Ivison et al. 2007; Ibar et al.2010a). Because the radio observations do not benefit from a nega-tive K-correction, normal galaxies (with α = 0.7, where S ∝ ν−α;e.g. Ibar et al. 2009) at high redshift (z > 3) are very difficult todetect at 1.4 GHz. This means that submm sources without a radiocounterpart are likely to be at higher z.
Unfortunately, using radio interferometric data as a gateway toidentifying optical and NIR counterparts in large area submm sur-veys is not yet practical with the current instruments (e.g. FIRST,SUMMS, NVSS, etc). Upcoming and future radio surveys, such asthe Square Kilometre Array and the Low Frequency Array will beable to provide the required depth and area, so that this method canbe extended to larger areas.
The radio data were obtained during nine transits of the SubaruDeep Field (SDF) in 2009 March and April using National RadioAstronomy Observatory Very Large Array (VLA), in its B config-uration (Project AM979). Data were recorded every 3.3 sec, with14 × 3.125-MHz dual-polarization channels, centred roughly at1315 MHz, or 22.8 cm. Of 42 h in total spent on-sky, around 36 hcomprised 30-min scans of a single pointing in SDF (13h24m38.s9,+27◦29′25.′′9 J2000), sandwiched between 2-min scans of 3C 286,which was used to calibrate the phase and amplitude of the visibil-ities, as well as the bandpass, and to set the absolute flux densityscale.
The flagging, calibration, and imaging of these data followed theprocedures outlined in Biggs & Ivison (2006), yielding a map cov-ering the VLA’s primary beam (31′, FWHM), with 1-arcsec2 pixels.No correction was applied for the primary beam response. The rmsnoise level in regions close to the pointing centre, free of sources,is around 11 μJy beam−1. A catalogue of 602 sources with peakflux densities above 5 σ was then selected from a field of radius24 arcmin.
We start by identifying the radio counterparts to the SPIREsources. We used the p statistics (Downes et al. 1986) to quan-tify the likelihood of a radio source being a chance association withthe SPIRE source. This procedure is more appropriate to identifyradio counterparts than the LR method, since the surface density ofradio sources is much lower than the optical and NIR catalogues.The p-values are calculated as
p = 1 − exp(−πnθ2) (26)
where n is the surface density of radio sources and θ is the radio-SPIRE positional offset. We searched for radio counterparts within10 arcsec from the SPIRE sources. We define robustly matchedradio sources as those satisfying p < 0.05.
Using this technique, we found that 128 SPIRE sources withS/N250 > 4 have at least one robust radio counterpart. This corre-sponds to ∼ 45 per cent of SPIRE sources with S/N250 > 4 in theSDF area. We found 139 robust radio identifications to those 128SPIRE sources. There are 11 SPIRE sources with two robust radiocounterparts. The colour distribution of SPIRE sources with radiocounterparts follows the overall colour distribution of the SPIREsources, as shown in Fig. 23. In this figure, we also show the nor-malized colour distribution of SPIRE sources with optical and NIRreliable identifications. A Kolmogorov–Smirnov test was used todetermine whether the colour distribution of SPIRE sources withradio counterparts differ significantly from the overall distribution.The result indicates that the two distributions are statistically indis-tinguishable.
MNRAS 476, 961–978 (2018)Downloaded from https://academic.oup.com/mnras/article-abstract/476/1/961/4816749by Periodicals Department , Hallward Library, University of Nottingham useron 07 March 2018

The Herschel–ATLAS Data Release 2 Paper III 977
Figure 23. Normalized colour distribution of the SPIRE sources with optical (left-hand panel), NIR (central panel), and radio (right-hand panel) reliablecounterparts identified.
Figure 24. Normalized photometric redshift distribution of all optical reli-able counterparts (grey histogram) and of those that match to a robust radioidentification (red histogram).
We then matched the position of our robust radio identificationsto the positions of the optical and NIR IDs. For a fair comparison,we used the NIR ID catalogue resulting from the LR analysis basedon the shallower NIR data, with a source density matching theSDSS catalogue. We found that 84 SPIRE sources with a robustradio counterpart also have a reliable ID in the NIR. Of those, 73(87 per cent) lie within 2 arcsec of the radio source. For the radio-optical matching, we found that 51 SPIRE sources with a robustradio counterpart also have a reliable ID in the optical, of which 42(82 per cent) have offset smaller than 2 arcsec. Assuming that theradio identification is the true counterpart, these results indicate thatmore than the 80 per cent of the reliable identifications provided bythe likelihood method are correct. This estimate of the cleanness ofthe reliable IDs from the likelihood method is smaller than the oneobtained from equation (21), ∼95 per cent for both optical and NIRcases. A larger radio data set is required to confirm these results.
We also investigated the photometric redshifts of the robust radioidentifications. In Fig. 24, we compare the photometric redshiftdistribution of all optical reliable counterparts to that of the opticalreliable counterparts that also match to a robust radio identification.
The results from Fig. 23 indicate that the radio is less biasedagainst identifying redder SPIRE sources than the NIR and optical.This is expected given the correlation between the radio and FIR
emission. Our radio catalogue is deep enough to detect SPIREsources at higher redshifts, as it can be seen in Fig. 24.
6 C O N C L U S I O N S
In this paper, we described the results of the identification of mul-tiwavelength counterparts to submm sources in the NGP area.
We described the process to obtain the SDSS counterparts atr < 22.4 for the 250-μm-selected sources detected at ≥4σ overthe entire NGP field. We used the LR method to measure the reli-ability of all potential counterparts within 10 arcsec of the SPIREsources. We obtained, using a blank-field comparison, that the frac-tion of SPIRE sources that should have a counterpart detectionwith r < 22.4 in SDSS is Q0 = 0.538 ± 0.001, which is in agree-ment with the results obtained by B16 for the GAMA fields in thePhase 1 H-ATLAS DR. We determined reliable (R ≥ 0.8) op-tical counterparts to 42 429 SPIRE sources, corresponding to37.8 per cent of the SPIRE sources with S/N≥4 in the NGP field.We estimated that this sample has a completeness of 70.3 per centand a false identification rate of 4.7 per cent.
We also identified counterparts to the 250-μm-selected sourcesin the NIR using K-band data obtained with UKIRT/WFCAM ina smaller ∼25 deg2 area within NGP using the LR method. Wesearched for NIR counterparts with K < 19.4 within 10 arcsec ofthe SPIRE sources with S/N≥4. We estimated that the fraction ofall counterparts which are above the magnitude limit (K < 19.4) isQ0 = 0.836 ± 0.001 (0.0754 ± 0.001 for extragalactic objects and0.08 ± 0.001 for stars). We were able to find a reliable match to61.8 per cent of the SPIRE sources within that area. We estimated anoverall completeness of 74 per cent and cleanness of 95.5 per centfor this NIR reliable sample.
We visually inspected the brightest sources in our optical andNIR ID catalogues in order to validate the automated counterpartidentification process and to correct missing or misclassified IDinformation when necessary.
We investigated the performance of the LR method to identifyoptical and NIR counterparts. Using input catalogue for the match-ing with the same surface density, we compared the optical and NIRcounterparts identified by the LR technique in the region of NGPwith SDSS and WFCAM coverage. We obtained that 54.8 per centof the 250-μm-selected sample have an NIR reliable counterpartwith K < 18.69. This reliable fraction is much higher than the oneobtained for the optical matching, in which we were able to reliably
MNRAS 476, 961–978 (2018)Downloaded from https://academic.oup.com/mnras/article-abstract/476/1/961/4816749by Periodicals Department , Hallward Library, University of Nottingham useron 07 March 2018

978 C. Furlanetto et al.
match 36.4 per cent of the SPIRE sources in the overlapping area.This result confirms that NIR bands are much better placed thanoptical bands to reliably identify submm sources, although somereliable counterparts found in the optical are not found in the Kband. Moreover, K band is particularly useful to identify redderSPIRE sources. The fraction of redder (S250/S350 < 1.2) SPIREsources reliably identified in the shallower K catalogue (K < 18.69)is more than 2.5 times higher than the fraction of SPIRE sources reli-ably identified in SDSS. We demonstrated that fainter NIR reliablecounterparts are generally associated with redder SPIRE sourcesand that going 0.7 deeper in the K magnitude limit (from K = 18.69to 19.40) the fraction of redder SPIRE sources reliably identified isincreased by ∼20–45 per cent.
Finally, we assessed the efficacy of our identification of opticaland NIR counterparts by using deep radio interferometric data. Weused p-values to find the radio counterparts to the SPIRE sources.We determined robust (p < 0.05) radio identifications to 128 SPIREsources. We matched the position of the robust radio identificationsto the positions of the optical and NIR IDs. Assuming the radiocounterpart as the true one, we obtained that 80–90 per cent ofthe reliable identifications provided by the likelihood method forboth optical and NIR matching are correct. Future large area radiosurveys will be able to confirm this result for a larger sample ofsubmm sources.
AC K N OW L E D G E M E N T S
The authors thank Soh Ikarashi for the providing radio maps and cat-alogues and Mike Read for stacking the UKIRT/WFCAM data usedin this work. SD is supported by an STFC Ernest Rutherford Fellow-ship. EV and SE acknowledge funding from the UK Science andTechnology Facilities Council consolidated grant ST/K000926/1.MS and SE have received funding from the European Union Sev-enth Framework Programme (FP7/2007-2013 and FP7/2007-2011)under grant agreement no. 607254. SM and LD acknowledge sup-port from the European Research Council (ERC) in the form of theConsolidator Grant COSMICDUST (ERC-2014-CoG-647939, PI: H. L.Gomez). NB, SM, LD, and RJI acknowledge support from the ERCin the form of the Advanced Investigator Program, COSMICISM (ERC-2012-ADG_20120216, PI: R. J. Ivison). EI acknowledges partialsupport from FONDECYT through grant no. 1171710. Herschel isan ESA space observatory with science instruments provided byEuropean-led Principal Investigator consortia and with importantparticipation from NASA. Funding for SDSS-III has been providedby the Alfred P. Sloan Foundation, the Participating Institutions, theNational Science Foundation, and the U.S. Department of EnergyOffice of Science. The SDSS-III web site is http://www.sdss3.org/.SDSS-III is managed by the Astrophysical Research Consortiumfor the Participating Institutions of the SDSS-III Collaborationincluding the University of Arizona, the Brazilian ParticipationGroup, Brookhaven National Laboratory, Carnegie Mellon Uni-versity, University of Florida, the French Participation Group, theGerman Participation Group, Harvard University, the Instituto deAstrofisica de Canarias, the Michigan State/Notre Dame/JINA Par-ticipation Group, Johns Hopkins University, Lawrence BerkeleyNational Laboratory, Max–Planck Institute for Astrophysics, Max–Planck Institute for Extraterrestrial Physics, New Mexico State Uni-versity, New York University, Ohio State University, PennsylvaniaState University, University of Portsmouth, Princeton University,the Spanish Participation Group, University of Tokyo, Universityof Utah, Vanderbilt University, University of Virginia, Universityof Washington, and Yale University.
R E F E R E N C E S
Abazajian K. et al., 2009, ApJS, 182, 543Ahn C. P. et al., 2014, ApJS, 211, 17Baldry I. K. et al., 2010, MNRAS, 404, 86Barger A. J., Cowie L. L., Wang W. H., 2007, ApJ, 654, 764Bertin E., Arnouts S., 1996, A&AS, 117, 393Bertin E., Mellier Y., Radovich M., Missonnier G., Didelon P., Morin B.,
2002, in Bohlender D. A., Durand D., Handley Th. H., eds, ASP Conf.Ser. Vol. 281, Astronomical Data Analysis Software and Systems XI.Astron. Soc. Pac., San Francisco, p. 228
Biggs A. D, Ivison R. J., 2006, MNRAS, 371, 963Bond N., Gawiser E., Guaita L., Padilla N., Gronwall C., Ciardullo R., Lai
K., 2012, ApJ, 753, 95Bourne N. et al., 2014, MNRAS, 444, 1884Bourne N. et al., 2016, MNRAS, 462, 1714 (B16)Brusa M. et al., 2007, ApJS, 172, 353Casali M. et al., 2007, A&A, 467, 777Chapin E. L. et al., 2011, MNRAS, 411, 505Chapman S. C. et al., 2003, ApJ, 585, 57Ciliegi P., Zamorani G., Hasinger G., Lehmann I., Szokoly G., Wilson G.,
2003, A&A, 398, 901Condon J. J., Anderson M. L., Helou G., 1991, ApJ, 376, 95Csabai I., Dobos I., Trencseni M., Herczegh G., Joozsa P., Purger N., Bu-
davari T., Szalay A. S., 2007, Astron. Nachr., 328, 852Downes A. J. B., Peacock J. A., Savage A., Carrie D. R., 1986, MNRAS,
218, 31Driver S. et al., 2011, MNRAS, 413, 971Dye et al., 2006, MNRAS, 372, 1227Eales S. et al., 2010, PASP, 122, 499Fleuren S. et al., 2012, MNRAS, 423, 2407 (F12)Gonzalez-Nuevo J. et al., 2017, J. Cosmol. Astropart. Phys. 10, 024Helou G., Soifer B. T., Rowan-Robinson M., 1985, ApJ, 298, L7Huchra J. P., Geller M. J., Corwin H. G., Jr, 1995, ApJS, 99, 391Ibar E., Ivison R. J., Biggs A. D., Lal D. V., Best P. N., Green D. A., 2009,
MNRAS, 4397, 281Ibar E., Ivison R. J., Best P. N., Coppin K., Pope A., Smail I., Dunlop J. S.,
2010a, MNRAS, 401, 53Ibar E. et al., 2010b, MNRAS, 409, 38Ivison R. J. et al., 2007, MNRAS, 380, 199Ivison R. J. et al., 2010, A&A, 518, 31Landy S. D., Szalay A. S., 1993, ApJ, 412, 64Lawrence A. et al., 2007, MNRAS, 379, 1599Liske J. et al., 2015, MNRAS, 452, 2087Maddox S. et al., 2017, preprint (arXiv:1712.07241) (Paper II)Pascale E. et al., 2011, MNRAS, 415, 911Pilbratt G. L. et al., 2010, A&A, 518, L1Rigby E. E. et al., 2011, MNRAS, 415, 2336Smith D. J. B. et al., 2011, MNRAS, 416, 857 (S11)Smith M. W. et al., 2017, ApJS, 233, 26 (Paper I)Smith D. J. B. et al., 2017, MNRAS, 471, 2453Sutherland W., Saunders W., 1992, MNRAS, 259, 413Valiante E. et al., 2016, MNRAS, 462, 3146 (V16)
S U P P O RT I N G IN F O R M AT I O N
Supplementary data are available at http://www.h-atlas.org.
Please note: Oxford University Press is not responsible for thecontent or functionality of any supporting materials supplied bythe authors. Any queries (other than missing material) should bedirected to the corresponding author for the article.
This paper has been typeset from a TEX/LATEX file prepared by the author.
MNRAS 476, 961–978 (2018)Downloaded from https://academic.oup.com/mnras/article-abstract/476/1/961/4816749by Periodicals Department , Hallward Library, University of Nottingham useron 07 March 2018
Related Documents