Herschel 1 Far-Infrared Spectroscopy of the Galactic Center. Hot Molecular Gas: Shocks versus Radiation near Sgr A * Javier R. Goicoechea 2 , M. Etxaluze 2 , J. Cernicharo 2 , M. Gerin 3 , D. A. Neufeld 4 , A. Contursi 5 , T. A. Bell 2 , M. De Luca 3 , P. Encrenaz 3 , N. Indriolo 4 , D. C. Lis 6 , E. T. Polehampton 7,8 , P. Sonnentrucker 9 [email protected] Received ; accepted To appear in ApJ Letters 1 Herschel is an ESA space observatory with science instruments provided by European- led Principal Investigator consortia and with important participation from NASA. 2 Departamento de Astrof´ ısica. Centro de Astrobiolog´ ıa. CSIC-INTA. Carretera de Ajalvir, Km 4. Torrej´ on de Ardoz, 28850, Madrid, Spain. 3 LERMA, UMR 8112 du CNRS, Observatoire de Paris, ´ Ecole Normale Sup´ erieure, France 4 The Johns Hopkins University, Baltimore, MD 21218, USA 5 Max-Planck-Institut f¨ ur extraterrestrische Physik (MPE), Postfach 1312, D-85741 Garching, Germany 6 California Institute of Technology, Pasadena, CA 91125, USA 7 RAL Space, Rutherford Appleton Laboratory, Chilton, Didcot, Oxfordshire, OX11 0QX, UK 8 Institute for Space Imaging Science, University of Lethbridge, 4401 University Drive, Lethbridge, Alberta T1J 1B1, Canada 9 Space Telescope Science Institute, Baltimore, MD 21218, USA arXiv:1305.1119v1 [astro-ph.GA] 6 May 2013

Welcome message from author
This document is posted to help you gain knowledge. Please leave a comment to let me know what you think about it! Share it to your friends and learn new things together.
Transcript

Herschel 1 Far-Infrared Spectroscopy of the Galactic Center.
Hot Molecular Gas: Shocks versus Radiation near SgrA∗
Javier R. Goicoechea2, M. Etxaluze2, J. Cernicharo2, M. Gerin3, D. A. Neufeld4,
A. Contursi5, T. A. Bell2, M. De Luca3, P. Encrenaz3, N. Indriolo4,
D. C. Lis6, E. T. Polehampton7,8, P. Sonnentrucker9
Received ; accepted
To appear in ApJ Letters
1Herschel is an ESA space observatory with science instruments provided by European-
led Principal Investigator consortia and with important participation from NASA.
2Departamento de Astrofısica. Centro de Astrobiologıa. CSIC-INTA. Carretera de
Ajalvir, Km 4. Torrejon de Ardoz, 28850, Madrid, Spain.
3LERMA, UMR 8112 du CNRS, Observatoire de Paris, Ecole Normale Superieure, France
4The Johns Hopkins University, Baltimore, MD 21218, USA
5Max-Planck-Institut fur extraterrestrische Physik (MPE), Postfach 1312, D-85741
Garching, Germany
6California Institute of Technology, Pasadena, CA 91125, USA
7RAL Space, Rutherford Appleton Laboratory, Chilton, Didcot, Oxfordshire, OX11 0QX,
UK
8Institute for Space Imaging Science, University of Lethbridge, 4401 University Drive,
Lethbridge, Alberta T1J 1B1, Canada
9Space Telescope Science Institute, Baltimore, MD 21218, USA
arX
iv:1
305.
1119
v1 [
astr
o-ph
.GA
] 6
May
201
3

– 2 –
ABSTRACT
We present a ∼52-671µm spectral scan toward Sgr A∗ taken with the PACS
and SPIRE spectrometers onboard Herschel. The achieved angular resolution
allows us to separate, for the first time at far-IR wavelengths, the emission toward
the central cavity (gas in the inner central parsec of the galaxy) from that of the
surrounding circum-nuclear disk. The spectrum toward Sgr A∗ is dominated by
strong [O iii], [O i], [C ii], [N iii], [N ii], and [C i] fine structure lines (in decreasing
order of luminosity) arising in gas irradiated by UV-photons from the central
stellar cluster. In addition, rotationally excited lines of 12CO (from J=4-3 to 24-
23), 13CO, H2O, OH, H3O+, HCO+ and HCN, as well as ground-state absorption
lines of OH+, H2O+, H3O+, CH+, H2O, OH, HF, CH and NH are detected. The
excitation of the 12CO ladder is consistent with a hot isothermal component at
Tk ' 103.1 K and n(H2).104 cm−3. It is also consistent with a distribution of
temperature components at higher density with most CO at Tk .300 K. The
detected molecular features suggest that, at present, neither very enhanced X-
ray, nor cosmic-ray fluxes play a dominant role in the heating of the hot molecular
gas. The hot CO component (either the bulk of the CO column or just a small
fraction depending on the above scenario) results from a combination of UV-
and shock-driven heating. If irradiated dense clumps/clouds do not exist, shocks
likely dominate the heating of the hot molecular gas. This is consistent with the
high-velocity gas detected toward Sgr A∗.
Subject headings: black hole physics — Galaxy: center — infrared: ISM — ISM:
molecules, shocks waves

– 3 –
1. Introduction
The Galactic center (GC), in particular the interstellar material in the immediate
vicinity (< 5 pc) of the central black hole, represents a unique environment for our
understanding of galactic nuclei and galaxy evolution. At a distance d = 8.0 ± 0.5 kpc
(Reid 1993), the nucleus of our galaxy is a few hundred times closer than the nearest active
galactic nuclei (AGNs), thus allowing high spatial resolution studies. The distribution of
gas and dust toward the GC (Genzel et al. 2010) consists of a central cavity of radius
∼1.5 pc containing warm dust and gas heated and ionized by the central cluster of massive
stars orbiting close to the black hole (Sgr A∗ radio source position). Some of the ionized gas
streamers (the “mini-spiral”) bring material close to the very center (Yusef-Zadeh & Morris
1987, see Figure 1).
Between ∼1.5 pc and ∼5 pc, a disk of denser molecular gas exists (the circum-nuclear
disk or CND; Guesten et al. 1987). However, its density is not well constrained (∼ 104-
108 cm−3) and it is not yet clear whether all the material in the CND is stable against
the strong tidal forces in the region or has a more transient nature (Bradford et al. 2005;
Montero-Castano et al. 2009; Requena-Torres et al. 2012). The molecular gas toward the
central cavity has been less studied, first because high angular resolution is required to
separate the different components and also because column densities are inevitably lower
and emission lines are intrinsically weak. Nevertheless, the detection of CO ro-vibrational
lines in absorption (Moneti et al. 2001) and of broad NH3 (6,6) emission lines close to
Sgr A∗ (Herrnstein & Ho 2002) suggests that hot molecular gas must exist interior to the
CND.
Owing to the lower dust extinction at far-IR wavelengths and because of the strong
emission from the interstellar component related to AGN and star formation activity, the
relevance of far-IR spectroscopy to characterize extragalactic nuclei has notably increased

– 4 –
(e.g., van der Werf et al. 2010). The far-IR spectrum of the Milky Way’s nucleus is
obviously a key template.
The angular resolution achieved by the Herschel Space Observatory (∼ 10′′ − 40′′;
Pilbratt et al. 2010) allows us to separate the emission of the central cavity from the CND.
In this Letter we present initial results from a Herschel far–IR spectroscopic study of the
GC. We present the complete PACS (Poglitsch et al. 2010) and SPIRE (Griffin et al. 2010)
spectra toward Sgr A∗ that are part of the PRISMAS and SPECHIS Guaranteed-Time
Programs. We discuss the properties and possible origin of the atomic and of the hot
molecular gas.
2. Observations and Data Reduction
PACS spectra between ∼52 and ∼190µm were obtained during 2011 March and 2012
March. The PACS spectrometer provides 25 spectra over a 47′′×47′′ field-of-view (FoV)
resolved in 5×5 “spaxels”, each with a size of ∼9.4′′. The resolving power varies between
R=λ/∆λ'1000 at ∼100µm and R'5000 at ∼70µm. The central spaxel was centered on
Sgr A∗ (α2000: 17h45m40.04s, δ2000: −29o00′28.19′′). The observations were carried out in the
“unchopped” mode (IDs 1342217802 and 342242442). Background subtraction was achieved
by removing the telescope background spectrum measured on a distant off-position. The
observing time was ∼2.4 hr. The measured width of the point spread function is relatively
constant for λ.100µm (∼spaxel size) but increases at longer wavelengths. In particular
only '40% of a point source emission would fall in the central spaxel at '190µm. Therefore,
owing to the extended nature of the emission, the flux measured by a single spaxel cannot
be used individually. Instead, we added the 3×3 central spaxels (∼30′′×30′′).
SPIRE-FTS observations between ∼194 and ∼671µm were obtained during 2011
– 5 –
February (ID1342214845). The SPIRE-FTS uses two bolometer arrays covering the
194-313µm and 303-671µm bands at 0.04 cm−1 resolution (R'500-1000). The two arrays
contain 19 and 37 detectors separated by ∼2 beams (51′′ and 33′′ respectively). The
unvignetted FoV is ∼2′. The observing time was 798 s. The Herschel data were processed
with HIPE 9.2. Table 1 summarizes the atomic and CO line intensities obtained in a
∼30′′×30′′ aperture.
3. Results: Spectroscopy
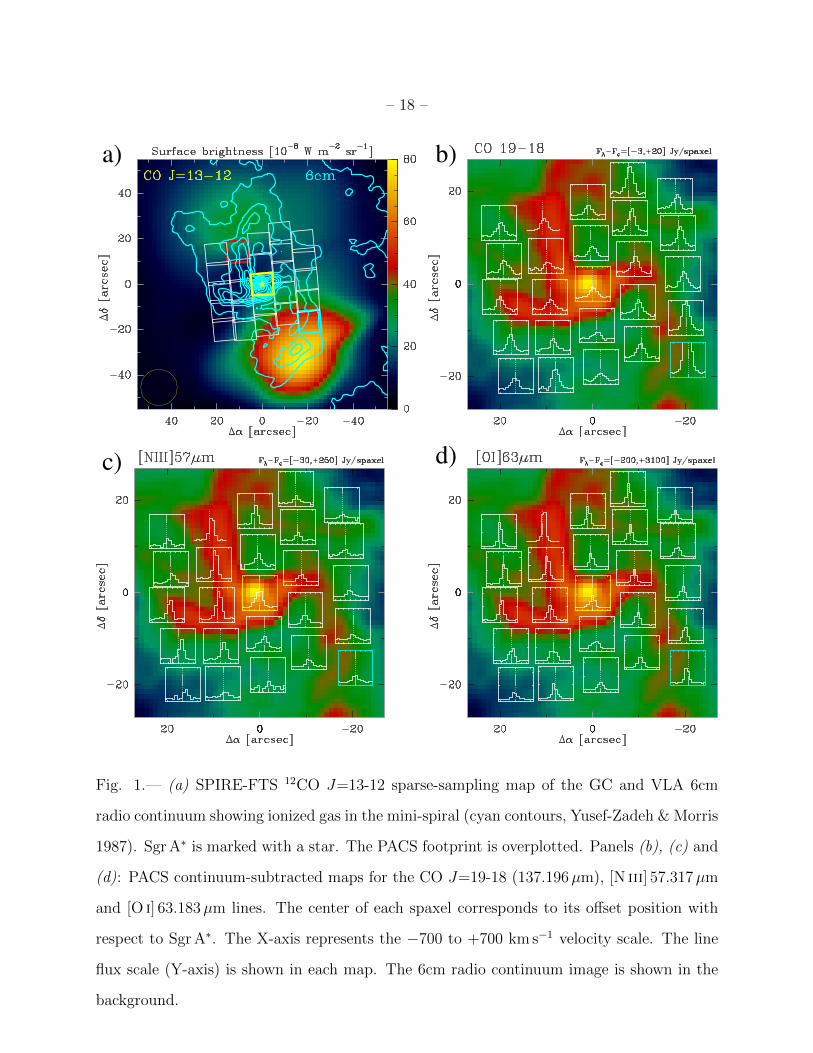
Figure 1a shows the CO J=13-12 line intensity map of the central ∼4 pc of the Galaxy
displaying extended excited CO emission that peaks toward the northern and southern lobes
of the CND (hereafter N -CND and S-CND). Figures 1b, c and d show the CO J=19-18,
[N iii] 57 and [O i] 63µm line spectral-maps respectively.
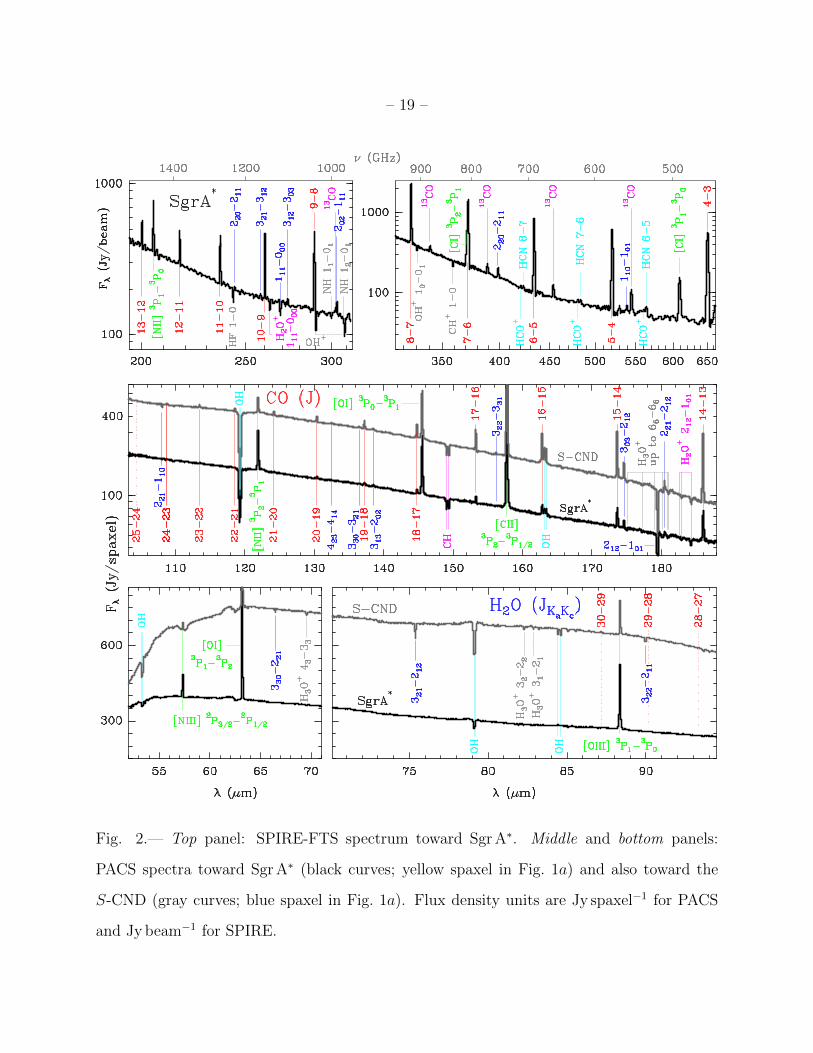
Figure 2 shows the complete ∼52-671µm spectrum toward Sgr A∗ (black curves) and
toward a bright position at the inner edge of the S-CND, ∼1 pc from Sgr A∗ (only for
PACS; gray curves). The far-IR spectrum toward Sgr A∗ is dominated by strong emission
from atomic fine structure lines ([O iii], [O i], [C ii], [N iii], [N ii], and [C i]), high-J CO
rotational lines (up to J=24-23 toward the central cavity and up to J=30-29 in the CND),
mid-J HCO+ and HCN emission lines and ground-state absorption lines from light hydrides
(OH+, H2O+, H3O+, CH+, HF, CH, NH, OH and H2O). Among the molecular ions, only
H3O+ shows absorption lines from excited levels (metastable levels up to JK=66 toward
the central cavity). The detection of rotationally excited lines from H2O, OH and H3O+
in absorption, suggests that a non negligible fraction of excited molecular gas resides at
relatively low densities.
Owing to the AV'30 mag of extinction toward the GC (Genzel et al. 2010), in the

– 6 –
following discussion we correct all line intensities (I0=CλIobs) using an extrapolation of the
mid-IR extinction-law derived by Lutz (1999) for Sgr A∗. These corrections are <15 %
in the far-IR (Table 1). The corrected line luminosities in the inner ∼30′′×30′′ (∼0.6 pc
in radius) are1 L[OIII]'885L�, L[OI]'855L�, L[CII]'230L�, L[NIII]'130L�, L[NII]'120L�,
L12CO'125L�, L13CO'4L� and L[CI]'6L� (adopting d=8 kpc).
3.1. Ionized Gas and Neutral Atomic Gas
The velocity resolution of PACS spectra at short wavelengths, .100 km s−1, allows one
to resolve shifts in the line profile peak velocity if they are large. Figures 1c and d show
the [O i] 63 and [N iii] 57µm line maps. The Doppler shifts of both lines reveal motions of
the neutral and of the ionized gas, with blueshifted velocities observed toward the S-CND
and redshifted toward the N -CND. The [N iii] 57µm lines show a similar pattern to the
[Ne ii] 13µm lines observed at higher spatial and spectral resolution (Irons et al. 2012).
They are consistent with ionized gas streamers orbiting or falling in a potential dominated
by the central black hole (Serabyn & Lacy 1985; Paumard et al. 2004). Note that both the
[O i] 63 and [N iii] 57µm lines show high-velocity wing emission (& ±300 km s−1) toward
Sgr A∗ and narrower profiles at greater distances from the center. This high-velocity gas is
likely associated with clouds/clumps moving fast and close to Sgr A∗.
The spatial distribution of the [N iii] lines follows the dense filaments (ne > 103.5 cm−3)
of ionized gas orbiting Sgr A∗ (the mini-spiral shown in Figure 1, Yusef-Zadeh & Morris
1987). This lower limit to the electron density (ne) is estimated by comparing the
[O iii] 88–to–[O iii] 52 line intensity ratio of 0.21 ± 0.12 (hereafter [O iii] 88/52) with the
1We obtain LFIR(50-1000µm)'105.1 L� using Herschel photometric data from Etxaluze
et al. (2011).
– 7 –
semi-empirical prescription of Rubin et al. (1994).
The [N iii] 57 and [N ii] 122µm line intensities can also be used to estimate the effective
temperature of the ionizing radiation (Teff) for a given ne (Rubin et al. 1994). The
[N iii] 57/[N ii] 122 = 1.31± 0.51 intensity ratio toward Sgr A∗ results in Teff'35,000±1000 K
(see Shields & Ferland 1994, for photoionization detailed models).
The strong UV radiation field from stars in the central parsec is thought to dominate
the heating of the dust grains and of the neutral atomic gas (Genzel et al. 1985; Jackson
et al. 1993). The low (L[OI]+L[CII])/LFIR'8×10−3 luminosity ratio toward the central
cavity agrees with the low efficiency heating mechanisms expected in photodissociation
regions (PDRs). In addition, [O i] 63/[C ii] 158 = 3.32± 1.31 and [O i] 145/63 = 0.12± 0.05
line intensity ratios are observed toward Sgr A∗. These are similar to the ratios observed
in strongly irradiated PDRs like the Orion Bar (Bernard-Salas et al. 2012) but are
significantly lower than the expected ratios in shocked gas and in X-ray dominated regions
(XDRs; Maloney et al. 1996). Therefore, the neutral atomic gas (nH ∼104−5 cm−3) is
predominantly heated by UV photons (G0 > 104 times the mean interstellar radiation
field). Atomic gas temperatures .500 K are expected in this PDR range (Wolfire et al.
1990). Nevertheless, narrow (unresolved) absorption components from foreground gas in
the GC (e.g., Sonnentrucker et al. 2013) can affect the total [O i] 63 and [C ii] 158µm fluxes
measured by PACS at medium spectral resolution (both are ground-state transitions).
Hence, the actual ratios may be different, and our unresolved [O i] and [C ii] intensities may
have less diagnostic power.
– 8 –
3.2. Hot Molecular Gas
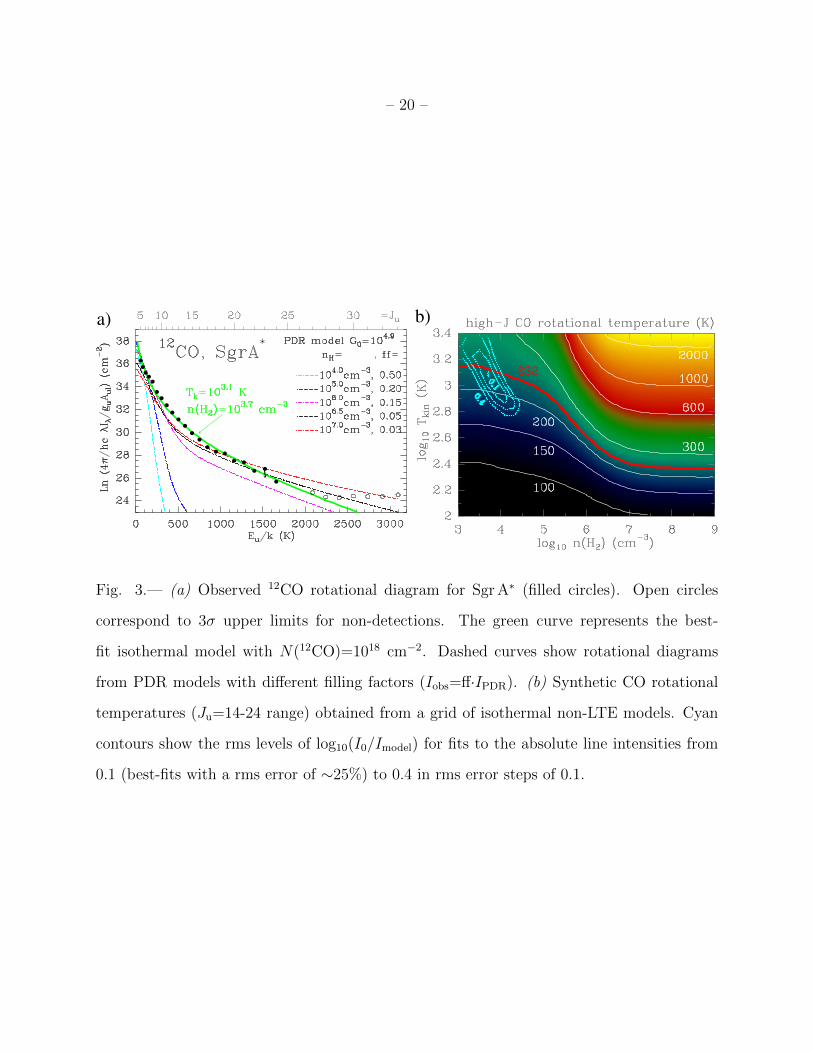
Figure 3a shows all detected 12CO lines toward the central cavity on a rotational
diagram that assumes extended emission. The average 12CO/13CO line intensity ratio
is 22±9 (lines J=5-4 to 10-9), thus consistent with the 12C/13C'20-25 isotopic ratio
inferred in the Sgr A complex (Penzias 1980). Hence, the observed line intensity ratios are
compatible with optically thin 12CO line emission (see the next section).
By fitting the 12CO lines detected by SPIRE and PACS independently, we obtain
Trot(SPIRE)'87 K and Trot(PACS)'232 K respectively. Trot is a good measure of the gas
temperature only in the high density limit (close to local thermodynamic equilibrium, LTE).
In this case, the two slopes could be associated with two different temperature components,
the hotter one representing .4 % of the total 12CO column density. Alternatively, Trot can
reflect much higher gas temperatures if the density is significantly lower than the critical
density for collisional excitation (ncr(H2) > 107 cm−3 for the observed high-J lines).
In fact, a closer inspection of the rotational diagram shows that Trot increases with J ,
from Trot(14-18)'160 K to Trot(19-24)'250 K. Therefore, the rotational diagram shows a
moderate positive curvature and thus even a single temperature component in LTE cannot
explain the CO emission detected by PACS. Neufeld (2012) pointed out that a moderate
positive curvature can be explained either by (1) a subthermally excited single temperature
component (Tk � Trot) or (2) multiple-temperature components (that could be in LTE).
In order to constrain the range of physical conditions that reproduce the observed
CO intensities, we have run a grid of non-local, non-LTE isothermal models (Goicoechea
et al. 2006) using 12CO-H2 collisional rates from Yang et al. (2010). We used
a constant beam-averaged CO column density, N(CO), and a nonthermal velocity
dispersion σ = 65 km s−1 (from turbulence and macroscopic gas motions), implying
∆v ' 150 km s−1 line-widths. These broad widths are consistent with the mid-J CO
– 9 –
line-widths observed with Herschel/HIFI (T.A. Bell 2013, private communication). We
adopt N(CO)=χ(CO)×N(H2)=1018 cm−2 (Genzel et al. 1985), i.e., we assume a CO
abundance of '10−4 and take, from photometric measurements, N(H2)'1022 cm−2 (AV∼10)
in the central cavity (Etxaluze et al. 2011).
Figure 3b shows the model results in the form of iso-Trot contours. To make this plot,
we first created rotational diagrams from each model and determined Trot by fitting a
straight line to the synthetic CO line intensities in the Jup=16-24 range. Figure 3b shows
that in terms of excitation alone, the same Trot(PACS)≈232 K can be obtained for different
combinations of density and temperature. In a second step, we searched for the range of
n(H2) and Tk values that better reproduce the observed 12CO lines by fitting their absolute
intensities. For the adopted N(CO), the best-fit parameters are obtained around Tk'103.1 K
and n(H2)'103.7 cm−2. The resulting best-fit rotational diagram is shown as a green curve
in Figure 3a (note that it is also consistent with the 3σ upper limits for higher-J undetected
lines).
In a third step, we compared the observations with the more extensive model grid
of Neufeld (2012) and studied the dependence of our results on the assumed N(CO). For
isothermal models, the gas temperature is well constrained and Tk'103.1 K reproduces the
observed CO rotational ladder (also the lines detected by PACS alone) independently of the
assumed N(CO). Even lower densities (for less realistic higher N(CO) columns) can also
reproduce the CO ladder.
In addition to the isothermal solution, multiple gas temperature components can also
explain a CO rotational diagram with positive curvature. Neufeld (2012) studied the case of
a medium with a power-law distribution of temperatures, dN(CO)/dTk = aT−bk . Including
all CO lines observed by Herschel in the fit gives b ' 2.0− 2.5 and n(H2)'104−5 cm−3. In
other words, although a small fraction of the total 12CO column exists at Tk>300 K (.4%),
– 10 –
most of the N(CO) column will be at lower temperatures and higher densities than those
implied by the isothermal solution. We therefore conclude that the observed CO lines are
consistent with either a single, hot (Tk'103.1 K), low-density (n(H2).104 cm−3) component,
or with multiple, cooler components at a higher density. In the latter case, the required
density will be above the beam-averaged gas densities in the central cavity (∼103−4 cm−3;
Etxaluze et al. 2011), implying that the hot molecular gas in the vicinity of Sgr A∗ does not
have a homogeneous distribution but fills a small fraction of the volume.
4. Discussion
In this section we discuss the possible heating mechanisms of the hot molecular gas
toward the central parsec. In order to evaluate the role of UV radiation in the heating
and excitation of CO, we used an updated version of the Meudon PDR code (Le Bourlot
et al. 2012) to compute synthetic CO rotational diagrams for the integrated CO emission
from AV=0 to 10. We adopted G0=104.9 (Wolfire et al. 1990) and different gas densities.
Our photochemical model includes selective photodissociation of CO-isotopologues and 13C
fractionation. For the considered range of densities, selective photodissociation slightly
increases the 12CO/13CO column density ratio over the 12C/13C isotopic ratio (by .25%)
at the AV<2 surface layers where CO columns are still low. Deeper inside, as the gas
temperature decreases, 13C isotope exchange starts to be important and the 12CO/13CO
column density ratio can be lower than the 12C/13C ratio. All in all, we conclude that the
beam-averaged N(12CO) toward Sgr A∗ cannot be much larger than the adopted ∼1018 cm−2.
For these columns and large velocity dispersions, the observed 12CO lines are optically
thin. Figure 3a shows the resulting CO diagrams for different PDR models and filling
factors. By comparing with observations, we see that low-density PDRs (nH≤105 cm−3) are
not able to reproduce the high-J CO emission and an extra heating/excitation source is
– 11 –
needed. In addition to photoelectric heating, denser PDRs (nH'106−7 cm−3) heat larger
columns of molecular gas (to Tk∼103 K) by vibrational heating from collisional deexcitation
of UV-pumped H2 molecules. Therefore, in addition to an extended low-density medium, a
small filling factor ensemble of irradiated dense clumps/clouds could be responsible of the
high-J CO emission (Burton et al. 1990). Our best combined PDR models, however, do
not provide an entirely satisfactory fit of the CO rotational ladder. This result is consistent
with the lack of good high-density fits to the high-J CO lines (see previous the section) and
suggests that UV radiation alone can not heat the hot molecular gas.
Interestingly, the SPIRE-FTS spectrum toward Sgr A∗ resembles that of the M82
starburst galaxy (Kamenetzky et al. 2012). However, the hot CO rotational temperatures
inferred toward Sgr A∗ are significantly higher than those seen in strongly irradiated
PDRs like the Orion Bar, which shows a rotational diagram (up to J=21-20) that can
be fitted with a single Trot(CO)'150 K component (Habart et al. 2010, C. Joblin et al.
in preparation). In addition, even toward the strongly UV-irradiated central cavity, the
observed L(CO)/LFIR'10−3 luminosity ratio is higher than the expected ratio in PDRs and
XDRs models (Meijerink et al. 2013), and it is indeed higher than the observed value in the
Orion Bar (L(CO)/LFIR'3×10−4; C. Joblin 2013, private communication).
The current X-ray luminosity near Sgr A∗ is rather low (LX(2-120 keV)< 1036 erg s−1;
Belanger et al. 2006), far lower than that expected from black hole accretion models.
Hence, any incident X-ray flux at a typical distance of ∼0.5 pc from the source
(FX < 0.03 erg cm−2 s−1) would be too low to heat a significant fraction of the molecular
gas well above Tk∼100 K (Maloney et al. 1996).
High cosmic-ray (CR) ionization rates (ζCR & 10−15 s−1) have been inferred in
the GC region from H+3 observations, and even higher rates have been proposed for the
vicinity of Sgr A∗ (∼2×10⁻¹⁴ s−1; Goto et al. 2008). At least qualitatively, our detection
– 12 –
of H3O+ absorption lines from excited metastable levels indeed suggests that ζCR may
be high. Nevertheless, the ionization fraction of the molecular gas in the central parsec
seems lower than that in much more extreme X-ray dominated AGNs like Mrk 231
(LX(2-10 keV)' 6 × 1043 erg s−1), where strong CH+, OH+ and H2O+ emission lines have
been detected (van der Werf et al. 2010). It also has to be lower than in the ULIRG
galaxy Arp 220, where the detection of many excited OH+ and H2O+ absorption lines
has been associated with very enhanced X-ray/CR ionization rates (ζX,CR > 10−13 s−1;
Gonzalez-Alfonso et al. 2013). Our observations toward Sgr A∗ show that OH+ and H2O+
only produce appreciable ground-state absorption lines, and they are known to arise from
semi-atomic diffuse clouds, where their columns are proportional to ζCR (Gerin et al.
2010; Neufeld et al. 2010; Hollenbach et al. 2012). Hence, ζCR toward Sgr A∗ is very likely
higher than in Galactic disk clouds, but lower than ζX,CR in Mrk 231 or Arp 220. Simple
thermodynamic considerations show that even ζCR=2×10⁻¹⁴ s−1 would only heat the gas to
a few tens of K (see also Glassgold et al. 2012). Therefore, neither X-rays nor CRs presently
dominate the heating of the hot molecular gas near Sgr A∗.
Low-density shocks (and related supersonic turbulence dissipation and magnetic viscous
heating) are promising candidates in the highly magnetized GC environment (Morris &
Serabyn 1996). In particular, non-dissociative, magnetohydrodynamic shocks tend to
produce regions that are roughly isothermal, reaching very high temperatures without
destroying molecules (Tk>1000 K for shock velocities vs>20 km s−1 in C-type shock models
by Kaufman & Neufeld 1996). In fact, shocks with a variety of densities, vs and magnetic
field strengths dominate the heating of the hot molecular gas seen in protostellar outflows
(with L(CO)/LFIR'2×10−3 observed in Serpens SMM1; Goicoechea et al. 2012). Hence,
the hot CO gas inferred toward Sgr A∗, the high L(CO)/LFIR ratio and the almost thermal
H2 rovibrational spectrum (Tanaka et al. 1989) suggest that, in addition to UV-driven
excitation, shocks contribute to the heating of the hot molecular gas in the nucleus of the

– 13 –
Galaxy. Indeed, if a small filling factor ensemble of dense clumps/clouds does not exist,
shocks likely dominate.
Whether the required shocks are produced within high-velocity molecular gas falling
toward the very center region (Gillessen et al. 2012), arise in clump-clump collisions
(Martın-Pintado et al. 1997) or in outflows driven by high-velocity stellar winds (Najarro
et al. 1997) or by protostars in the central parsec (Nishiyama & Schodel 2013) is still
uncertain.
We thank C. Lang and M.A. Requena-Torres for providing us with the VLA 6 cm
radiocontinuum image in CLASS format, and C. Joblin and O. Berne for useful discussions
on the Orion Bar. We thank the Spanish MINECO for funding support from grants
AYA2009-07304, CSD2009-00038 and S2009ESP-1496, and NASA through an award issued
by JPL/Caltech. J.R.G. is supported by a Ramon y Cajal research contract.

– 14 –
REFERENCES
Belanger, G., Glowworm, A., Renaud, M., et al. 2006, ApJ, 636, 275
Bernard-Salas, J., Habart, E., Arab, H., et al. 2012, A&A, 538, A37
Bradford, C. M., Stacey, G. J., Nikola, T., et al. 2005, ApJ, 623, 866
Burton, M. G., Hollenbach, D. J., & Tielens, A. G. G. M. 1990, ApJ, 365, 620
Etxaluze, M., Smith, H. A., Tolls, V., Stark, A. A., & Gonzalez-Alfonso, E. 2011, AJ, 142,
134
Genzel, R., Crawford, M. K., Townes, C. H., & Watson, D. M. 1985, ApJ, 297, 766
Genzel, R., Eisenhauer, F., & Gillessen, S. 2010, Reviews of Modern Physics, 82, 3121
Gerin, M., de Luca, M., Black, J., et al. 2010, A&A, 518, L110
Gillessen, S., Genzel, R., Fritz, T. K., et al. 2012, Nature, 481, 51
Glassgold, A. E., Galli, D., & Padovani, M. 2012, ApJ, 756, 157
Goicoechea, J. R., Cernicharo, J., Karska, A., et al. 2012, A&A, 548, A77
Goicoechea, J. R., Pety, J., Gerin, M., et al. 2006, A&A, 456, 565
Gonzalez-Alfonso, E., Fischer, J., Bruderer, S., et al. 2013, A&A, 550, 25
Goto, M., Usuda, T., Nagata, T., et al. 2008, ApJ, 688, 306
Griffin, M. J., Abergel, A., Abreu, A., et al. 2010, A&A, 518, L3
Guesten, R., Genzel, R., Wright, M. C. H., et al. 1987, ApJ, 318, 124
Habart, E., Dartois, E., Abergel, A., et al. 2010, A&A, 518, L116

– 15 –
Herrnstein, R. M., & Ho, P. T. P. 2002, ApJ, 579, L83
Hollenbach, D., Kaufman, M. J., Neufeld, D., Wolfire, M., & Goicoechea, J. R. 2012, ApJ,
754, 105
Irons, W. T., Lacy, J. H., & Richter, M. J. 2012, ApJ, 755, 90
Jackson, J. M., Geis, N., Genzel, R., et al. 1993, ApJ, 402, 173
Kamenetzky, J., Glenn, J., Rangwala, N., et al. 2012, ApJ, 753, 70
Kaufman, M. J., & Neufeld, D. A. 1996, ApJ, 456, 611
Le Bourlot, J., Le Petit, F., Pinto, C., Roueff, E., & Roy, F. 2012, A&A, 541, A76
Lutz, D. 1999, The Universe as Seen by ISO, 427, 623
Maloney, P. R., Hollenbach, D. J., & Tielens, A. G. G. M. 1996, ApJ, 466, 561
Martın-Pintado, J., de Vicente, P., Fuente, A., & Planesas, P. 1997, ApJ, 482, L45
Meijerink, R., Kristensen, L. E., Weiß, A., et al. 2013, ApJ, 762, L16
Moneti, A., Cernicharo, J., & Pardo, J. R. 2001, ApJ, 549, L203
Montero-Castano, M., Herrnstein, R. M., & Ho, P. T. P. 2009, ApJ, 695, 1477
Morris, M., & Serabyn, E. 1996, ARA&A, 34, 645
Najarro, F., Krabbe, A., Genzel, R., et al. 1997, A&A, 325, 700
Neufeld, D. A. 2012, ApJ, 749, 125
Neufeld, D. A., Goicoechea, J. R., Sonnentrucker, P., et al. 2010, A&A, 521, L10
Nishiyama, S., & Schodel, R. 2013, A&A, 549, A57
– 16 –
Paumard, T., Maillard, J.-P., & Morris, M. 2004, A&A, 426, 81
Penzias, A. A. 1980, Science, 208, 663
Pilbratt, G. L., Riedinger, J. R., Passvogel, T., et al. 2010, A&A, 518, L1
Poglitsch, A., Waelkens, C., Geis, N., et al. 2010, A&A, 518, L2
Reid, M. J. 1993, ARA&A, 31, 345
Requena-Torres, M. A., Gusten, R., Weiß, A., et al. 2012, A&A, 542, L21
Rubin, R. H., Simpson, J. P., Lord, S. D., et al. 1994, ApJ, 420, 772
Serabyn, E., & Lacy, J. H. 1985, ApJ, 293, 445
Shields, J. C., & Ferland, G. J. 1994, ApJ, 430, 236
Sonnentrucker, P., Neufeld, D. A., Gerin, M., De Luca, M., Indriolo, N., Lis, D. C. , &
Goicoechea, J.R. 2013, ApJ, 763, L19
Tanaka, M., Hasegawa, T., Hayashi, S. S., Brand, P. W. J. L., & Gatley, I. 1989, ApJ, 336,
207
van der Werf, P. P., Isaak, K. G., Meijerink, R., et al. 2010, A&A, 518, L42
Wolfire, M. G., Tielens, A. G. G. M., & Hollenbach, D. 1990, ApJ, 358, 116
Yang, B., Stancil, P. C., Balakrishnan, N., & Forrey, R. C. 2010, ApJ, 718, 1062
Yusef-Zadeh, F., & Morris, M. 1987, ApJ, 320, 545
This manuscript was prepared with the AAS LATEX macros v5.2.

– 17 –
Table 1. Atomic and CO Line Intensities Toward Sgr A∗
Species Transition λ(µm) Eu/k (K) Iobsa Cλ
b
[O iii] 3P2 − 3P1 51.815 441 1.52E-05c 1.152
[N iii] 2P3/2 − 2P1/2 57.317 251 2.69E-06 1.132
[O i] 3P1 − 3P2 63.184 228 1.62E-05 1.116
[O iii] 3P1 − 3P0 88.356 163 3.30E-06 1.076
[N ii] 3P2 − 3P1 121.898 188 2.21E-06 1.051
[O i] 3P0 − 3P1 145.525 327 2.11E-06 1.041
[C ii] 2P3/2 − 2P1/2 157.741 91 5.26E-06 1.037
[N ii] 3P1 − 3P0 205.178 70 4.51E-07 1.026
[C i] 3P2 − 3P1 370.414 63 1.22E-07 1.013
[C i] 3P1 − 3P0 609.133 24 1.95E-08 1.007
12CO J=24-23 108.763 1656.6 1.40E-08 1.058
12CO J=23-22 113.458 1524.3 3.49E-08d 1.055
12CO J=22-21 118.581 1397.4 2.37E-08 1.052
12CO J=21-20 124.193 1276.1 3.95E-08 1.049
12CO J=20-19 130.369 1160.3 3.58E-08 1.047
12CO J=19-18 137.196 1049.9 5.26E-08 1.044
12CO J=18-17 144.784 945.0 4.67E-08 1.041
12CO J=17-16 153.267 845.6 5.23E-08 1.038
12CO J=16-15 162.812 751.8 7.54E-08 1.035
12CO J=15-14 173.631 663.4 9.66E-08 1.032
12CO J=14-13 185.999 580.5 1.30E-07 1.030
12CO J=13-12 200.272 503.2 1.59E-07 1.027
12CO J=12-11 216.927 431.3 1.94E-07 1.025
12CO J=11-10 236.613 365.0 2.38E-07 1.022
12CO J=10-9 260.240 304.2 2.75E-07 1.020
12CO J=9-8 289.120 248.9 2.84E-07 1.017
12CO J=8-7 325.225 199.1 3.89E-07 1.015
12CO J=7-6 371.650 154.9 3.08E-07 1.013
12CO J=6-5 433.556 116.2 2.02E-07 1.011
12CO J=5-4 520.231 83.0 1.34E-07 1.009
12CO J=4-3 650.252 55.3 7.81E-08 1.007
13CO J=12-11 226.898 412.4 6.53E-09 1.023
13CO J=11-10 247.490 348.9 6.68E-09 1.021
13CO J=10-9 272.205 290.8 8.52E-09 1.019
13CO J=9-8 302.415 237.9 1.94E-08 1.016
13CO J=8-7 340.181 190.4 2.00E-08 1.014
13CO J=7-6 388.743 148.1 1.63E-08 1.012
13CO J=6-5 453.498 111.1 6.25E-09 1.010
13CO J=5-4 544.161 79.3 1.08E-08 1.008
aObserved lines intensities above 3σ in Wm−2 sr−1. Absolute calibration
accuracy up to ∼30%.
bExtinction correction factors. cFrom Shields & Ferland (1994).
dBlended with the o-H2O 414-303 line.
– 18 –
a) b)
c) d)
Fig. 1.— (a) SPIRE-FTS 12CO J=13-12 sparse-sampling map of the GC and VLA 6cm
radio continuum showing ionized gas in the mini-spiral (cyan contours, Yusef-Zadeh & Morris
1987). Sgr A∗ is marked with a star. The PACS footprint is overplotted. Panels (b), (c) and
(d): PACS continuum-subtracted maps for the CO J=19-18 (137.196µm), [N iii] 57.317µm
and [O i] 63.183µm lines. The center of each spaxel corresponds to its offset position with
respect to Sgr A∗. The X-axis represents the −700 to +700 km s−1 velocity scale. The line
flux scale (Y-axis) is shown in each map. The 6cm radio continuum image is shown in the
background.
– 19 –
Fig. 2.— Top panel: SPIRE-FTS spectrum toward Sgr A∗. Middle and bottom panels:
PACS spectra toward Sgr A∗ (black curves; yellow spaxel in Fig. 1a) and also toward the
S-CND (gray curves; blue spaxel in Fig. 1a). Flux density units are Jy spaxel−1 for PACS
and Jy beam−1 for SPIRE.
– 20 –
a) b)
Fig. 3.— (a) Observed 12CO rotational diagram for Sgr A∗ (filled circles). Open circles
correspond to 3σ upper limits for non-detections. The green curve represents the best-
fit isothermal model with N(12CO)=1018 cm−2. Dashed curves show rotational diagrams
from PDR models with different filling factors (Iobs=ff·IPDR). (b) Synthetic CO rotational
temperatures (Ju=14-24 range) obtained from a grid of isothermal non-LTE models. Cyan
contours show the rms levels of log10(I0/Imodel) for fits to the absolute line intensities from
0.1 (best-fits with a rms error of ∼25%) to 0.4 in rms error steps of 0.1.
Related Documents