The Science of Complex Networks and the Internet: Lies, Damned Lies, and Statistics Walter Willinger AT&T Labs-Research [email protected] University of Adelaide, February 22-23, 2009

Welcome message from author
This document is posted to help you gain knowledge. Please leave a comment to let me know what you think about it! Share it to your friends and learn new things together.
Transcript

The Science of Complex Networks
and the Internet:
Lies, Damned Lies, and Statistics
Walter Willinger
AT&T Labs-Research
University of Adelaide, February 22-23, 2009

2
Objectives
• Objectives
– Apply your Internet-specific domain knowledge
– Use this domain knowledge to gauge the suitability of
a novel theory to gain an improved understanding of
the Internet
– Recognize that highly engineered systems like the
Internet are not like particle systems studied by
physicists
• Non-objectives
– This is not a course about TCP, BGP, OSPF, …
– This is not a course about Web 1.0, Web 2.0, P2P, …
– I will say little (or nothing) about optical networking,
wireless, ad-hoc mobile networks, sensor networks, …

3
Expectations
• Warning
– I will be harsh in my comments about the current
applications of the theory of complex networks to the
Internet
– I will support my statements with empirical evidence,
mathematical arguments, and appropriate domain
knowledge
– I am not offering any ―easy‖ solutions, but will try and
convince you that there is ―no free lunch‖ when it
comes to developing a scientifically sound
foundation for a theory of Internet-like systems
• Guiding principle (quoting B.B. Mandelbrot)
– “When exactitude is elusive, it is better to be
approximately right than certifiably wrong.”

4
Schedule
• Part I (Monday, 2/22/10)
– The theory of complex networks and the Internet
– The Internet as a highly engineered system
– Internet measurements – Know your data!
• Part II (Tuesday, 2/23/10)
– Analysis of Internet data – Know your statistics!
– Internet modeling – From data-fitting to reverse-engineering
– Challenges in Internet modeling
• Main reference
W. Willinger, D. Alderson, and J.C. Doyle,
―Mathematics and the Internet: A Source of Enormous Confusion and great Potential‖
Notices Amer. Math. Soc. 56, No. 5, 586-599 (2009).
Reprinted in: Princeton Anthology of Best Writing in Mathematics, Princeton University Press (to appear, Fall 2010)

5
Acknowledgments
• John Doyle (Caltech)
• David Alderson (Naval Postgraduate School)
• Steven Low (Caltech)
• Yin Zhang (Univ. of Texas at Austin)
• Matthew Roughan (U. Adelaide, Australia)
• Anja Feldmann (TU Berlin)
• Lixia Zhang (UCLA)
• Reza Rejaie (Univ. of Oregon)
• Mauro Maggioni (Duke Univ.)
• Bala Krishnamurthy, Alex Gerber, Shubho Sen, Dan Pai (AT&T)
• … and many of their students and postdocs
6
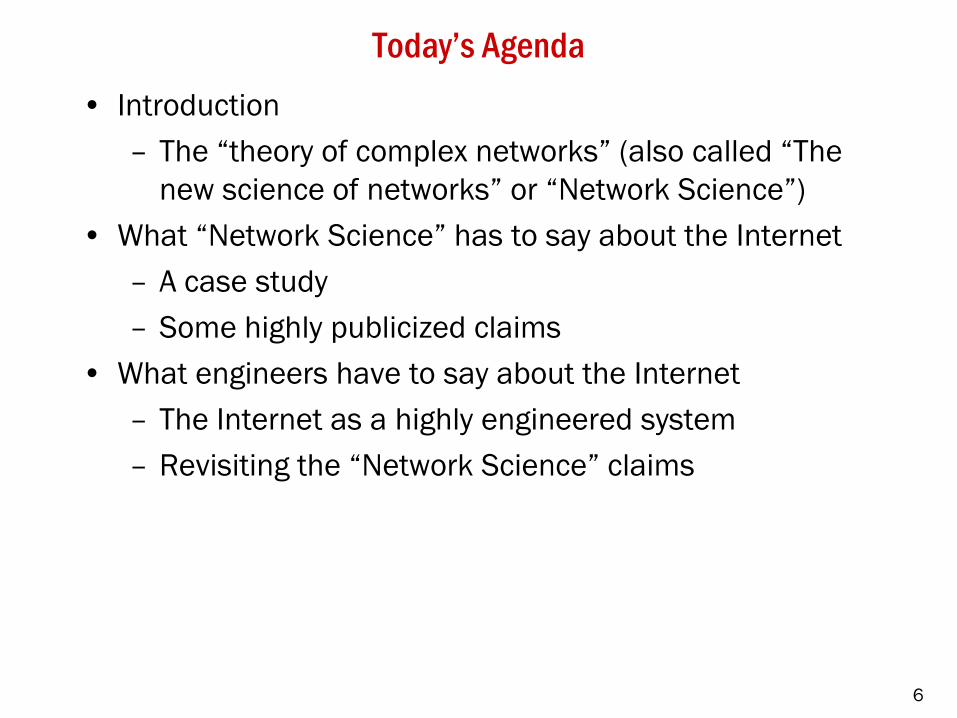
Today’s Agenda
• Introduction
– The ―theory of complex networks‖ (also called ―The
new science of networks‖ or ―Network Science‖)
• What ―Network Science‖ has to say about the Internet
– A case study
– Some highly publicized claims
• What engineers have to say about the Internet
– The Internet as a highly engineered system
– Revisiting the ―Network Science‖ claims

The Science of Complex Networks
and the Internet
February 22, 2010
8
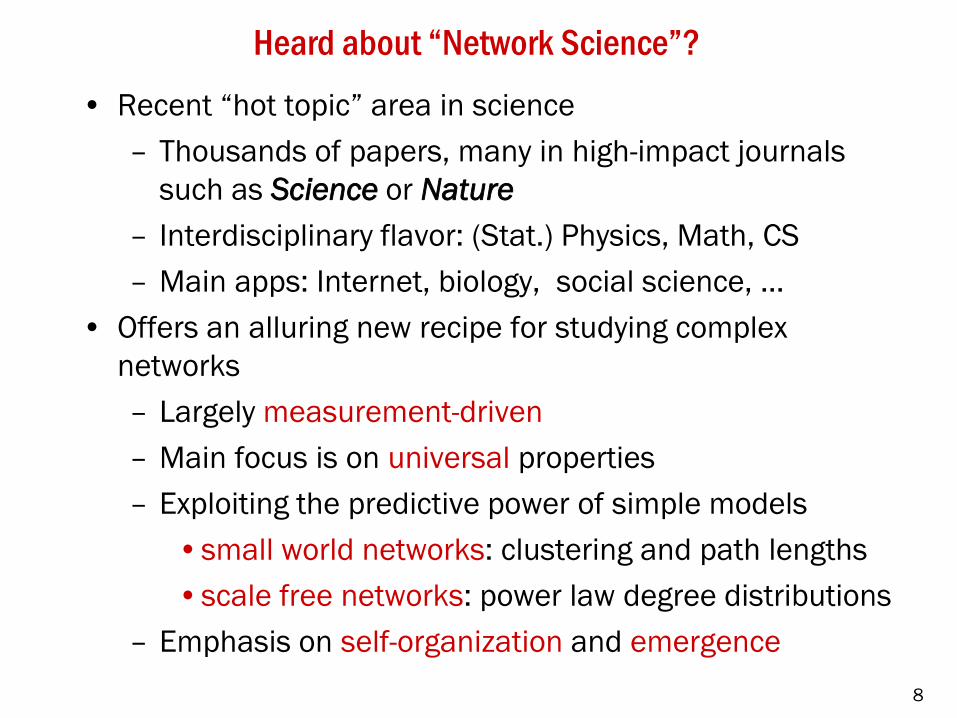
Heard about “Network Science”?
• Recent ―hot topic‖ area in science
– Thousands of papers, many in high-impact journals
such as Science or Nature
– Interdisciplinary flavor: (Stat.) Physics, Math, CS
– Main apps: Internet, biology, social science, …
• Offers an alluring new recipe for studying complex
networks
– Largely measurement-driven
– Main focus is on universal properties
– Exploiting the predictive power of simple models
•small world networks: clustering and path lengths
•scale free networks: power law degree distributions
– Emphasis on self-organization and emergence

9
NETWORK SCIENCE
http://www.nap.edu/catalog/11516.html
•―First, networks lie at the core of the economic, political, and
social fabric of the 21st century.‖
•―Second, the current state of knowledge about the structure,
dynamics, and behaviors of both large infrastructure networks
and vital social networks at all scales is primitive.‖
•―Third, the United States is not on track to consolidate the
information that already exists about the science of large,
complex networks, much less to develop the knowledge that
will be needed to design the networks envisaged…‖
January, 2006

10
Network Science
• What?
“The study of network representations of physical, biological, and social phenomena leading to predictive models of these phenomena.” (National Research Council Report, 2006)
• Why?
“To develop a body of rigorous results that will improve the predictability of the engineering design of complex networks and also speed up basic research in a variety of applications areas.” (National Research Council Report, 2006)
• Who?
– Physicists (statistical physics), mathematicians (graph theory), computer scientists (algorithm design), etc.

11
Basic Questions ask by Network Scientists
Question 1
To what extent does there exist a ―network structure‖ that is
responsible for large-scale properties in complex systems?
• Performance
• Robustness
• Adaptability / Evolvability
• ―Complexity‖
12
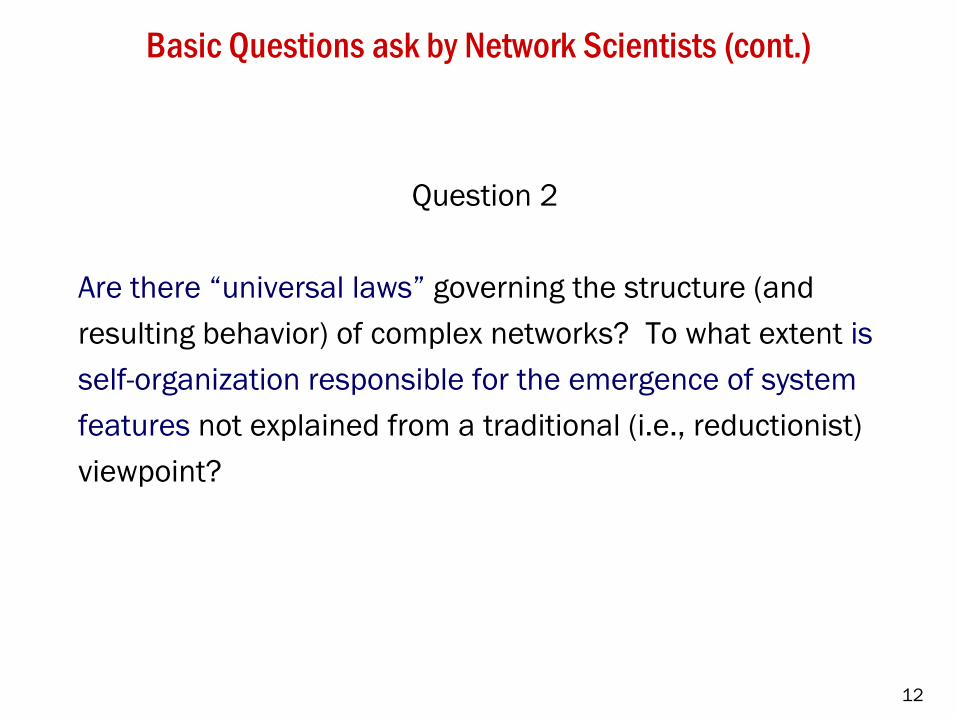
Basic Questions ask by Network Scientists (cont.)
Question 2
Are there ―universal laws‖ governing the structure (and
resulting behavior) of complex networks? To what extent is
self-organization responsible for the emergence of system
features not explained from a traditional (i.e., reductionist)
viewpoint?

13
Basic Questions ask by Network Scientists (cont.)
Question 3
How can one assess the vulnerabilities or fragilities
inherent in these complex networks in order to avoid
―rare yet catastrophic‖ disasters? More practically,
how should one design, organize, build, and manage
complex networks?
14
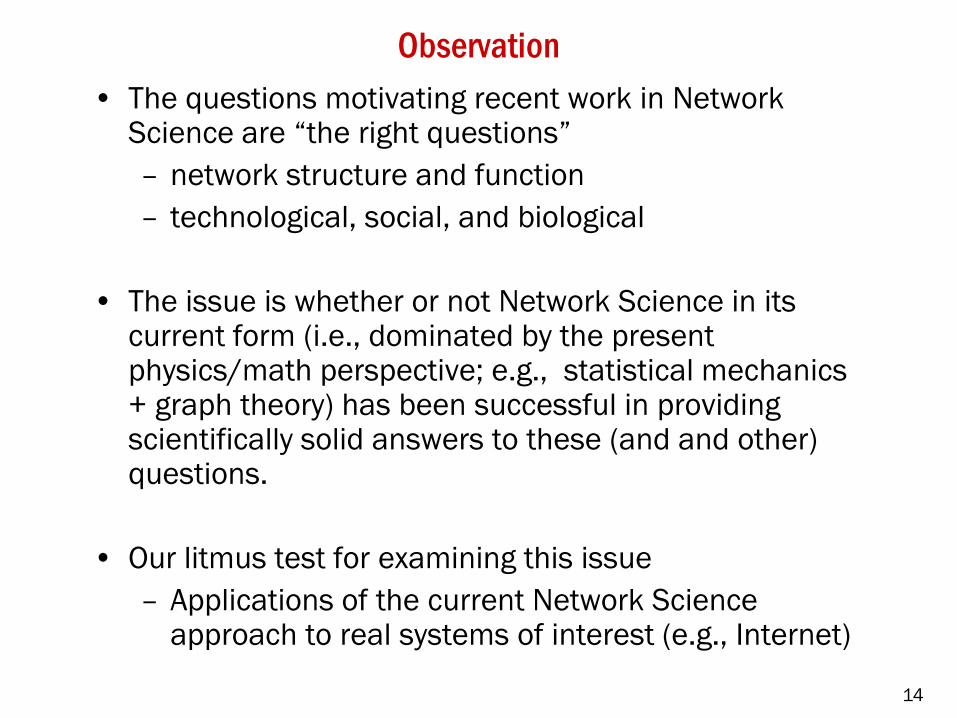
Observation
• The questions motivating recent work in Network Science are ―the right questions‖
– network structure and function
– technological, social, and biological
• The issue is whether or not Network Science in its current form (i.e., dominated by the present physics/math perspective; e.g., statistical mechanics + graph theory) has been successful in providing scientifically solid answers to these (and and other) questions.
• Our litmus test for examining this issue
– Applications of the current Network Science approach to real systems of interest (e.g., Internet)

15
A Fundamental Issue in the Study of Complex Systems
purposeful behavior of
interacting components
FUNCTIONSTRUCTURE
• components
• interactions
• constraints
• uncertainties
?
• One approach (reflects a physics-inspired view)
– Structure determines function
– Study the system of interest as an artifact
– Requires no prior knowledge about system
– Hard to know what ―matters‖ from outside looking in
• Another approach (reflects an engineering-inspired view)
– Emphasizes the design of components/interactions to ensure system function
– Requires knowledge of relationship: structure and function

16
purposeful behavior of
interacting components
FUNCTIONSTRUCTURE
• components
• interactions
• constraints
• uncertainties
?
Network Science Approach:
• a graph theoretic foundation
• descriptive models
– graph connectivity (structure)
– graph evolution (dynamics)
• null hypothesis: random graphs
• large data samples, uncertainty
random ensembles
• dynamics, statistical properties
statistical mechanics
• emphasis: ―likely‖ configurations
Common theme:
•self-organization and “emergent” structure (i.e., “emergent complexity”)
The Appeal of the Network Science Approach
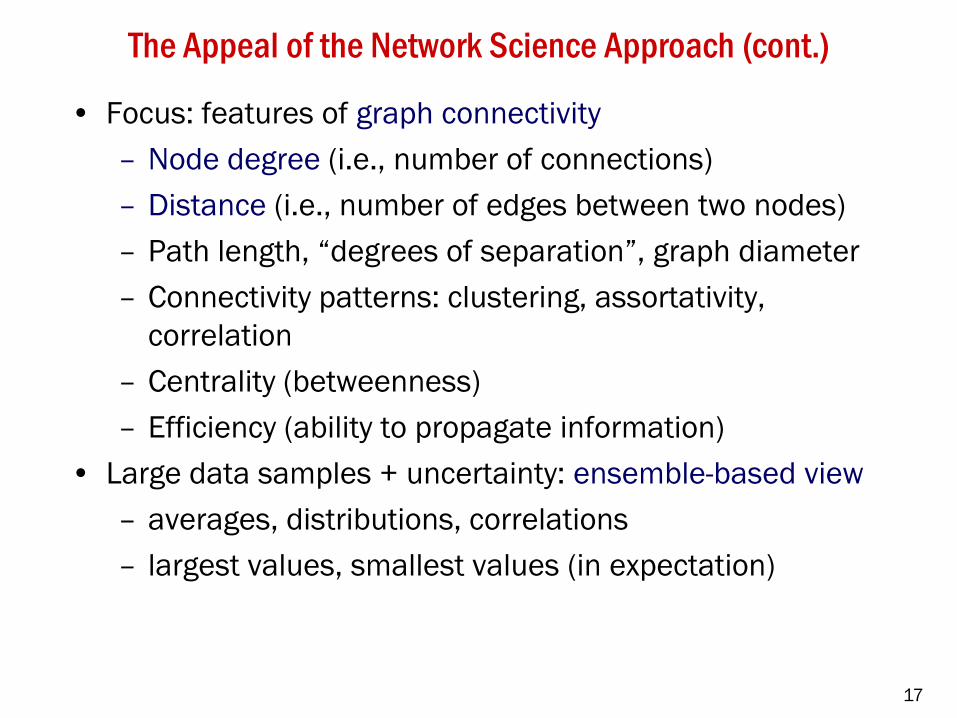
17
The Appeal of the Network Science Approach (cont.)
• Focus: features of graph connectivity
– Node degree (i.e., number of connections)
– Distance (i.e., number of edges between two nodes)
– Path length, ―degrees of separation‖, graph diameter
– Connectivity patterns: clustering, assortativity,
correlation
– Centrality (betweenness)
– Efficiency (ability to propagate information)
• Large data samples + uncertainty: ensemble-based view
– averages, distributions, correlations
– largest values, smallest values (in expectation)

18
From: M.E.J. Newman. The Structure and Function of Complex
Networks, SIAM Review 45, 167-256 (2003).
# nodes# edges
avg, degree avg,path
length
scalingexponent
clustering coeff.
deg. corr.coeff.

19
Making Sense of Network Structure: Random Graphs
• Study of random graphs popularized by Erdös and Rényi
(c.1960)
• One of most popular models: Gn,p
– n vertices
– each edge appears independently with probability p
• ―Emergence of giant component‖: p = c/n for c near 1
– for c < 1 size of largest component is a.s. O(log n)
– for c = 1 size of largest component is a.s. O(n2/3)
– for c > 1 size of largest component (called the giant component ) is a.s. O(n)
• p=1/n is called the critical point or critical threshold
• Similarity to phase transition in physics makes random
graphs popular with those trained in statistical mechanics
• Random graphs as the null hypothesis for complex
networks Source: P. Erdös and A. Rényi. 1960. On the evolution of random graphs.
Publ. Math. Inst. Hungar. Acad. Sci. 5, 17-61.

20
Basic Observation in Network Science
• Many important complex network systems do not look
like random graphs (a la Erdos-Renyi)…!
• How do real networks compare to random graphs?
• Are there universal patterns in structure or behavior?
• How to ―explain‖ these patterns?

21
Alternative 1: “Small-World” Networks
• Networks that share properties of
both regular and random graphs
– clustering coefficient (C)
– characteristic path length (L)
• ―Six degrees of separation‖
phenomenon
• Empirical evidence
– social networks (e.g. film actors)
– power grid
– neural networks
• Easily generated via rewiring
– start with a lattice
– p = prob of rewiring each edge
– ―shortcuts‖ at small values of p
regular small world random
C high high low
L high low low
Source: Watts, DJ; Strogatz, S H. 1998. Collective
dynamics of 'small-world' networks, NATURE 393(668).

22
• Networks with a distribution of node
degree (# connections) that follows a
power law in the tail:
P(X>x) cx- as x
( >0, c constant)
• Empirical evidence
– Internet (router, AS, WWW)
– biology (gene regulation)
– social networks (film actors)
• Not found in random graphs
• Can be generated via preferential
attachment (PA) in growth
• PA models exhibit striking features
– error tolerance (random loss)
– attack vulnerability (hubs)
– zero epidemic threshold
Reference: A.-L. Barabási and R. Albert. 1999. Emergence of
scaling in random networks. Science 286, 509-512.
101
101
102
100
No
de
Ra
nk:
R(d
) =
P (D
>d
) x
#n
od
es
Node Degree: d = # connections
Alternative 2: “Scale-free” Networkslog(P(X>x)) log(c)- log(x)
slope -

23
Current Network Science Approach: Recap
• Studying complex networks as artifacts
• Primarily treat complex systems as simple graphs
– Universality, at a price of abstracting away domain-specific info
• Heavily influenced by graph theory:
– random graphs as a null hypothesis
– generative models that are likely to reproduce graph statistics
– analysis based on statistical equilibrium (statistical physics)
• Graph characterization based on statistical signature
– Small-world networks: clustering and path lengths
– Scale-free networks: power law degree distributions
• Emphasis on self-organization and emergence
As Internet researchers, WHY SHOULD WE CARE ?

24
As Internet researchers, why should we care?
• ―Network Science‖ as a new scientific discipline …

25
Publications in Network Science Literature by Discipline(As recorded by the Web of Science1 on October 1, 2007; coutesy D. Alderson)
Caveats:
• A search of the terms “scale free” or “small world” returned 3151 entries, from which 560 were irrelevant to
network science.
• The Web of Science only lists peer-reviewed journal publications and does not include conference proceedings
(important for Computer Science).
• “High Impact” includes Nature, Science, Proc. Nat. Acad. Sci., Scientific American, and American Scientist
• “Physics” publications include: Phys. Rev. Letters, Physica, Physical Review, Journal of Physics, Modern Physics
Letters, Journal of Statistical Physics, Int’l J. of Modern Physics, Europhysics Letters, European Physical Journal,
Chinese Physics Letters, Journal of the Korean Physical Society, and more…
1998 1999 2000 2001 2002 2003 2004 2005 2006 2007*
"high impact" 1 1 5 4 17 13 22 16 9 4 92
physics 1 7 26 62 124 139 230 260 350 286 1485
biology, chemistry, medicine 0 1 4 16 22 31 67 80 94 77 392
computer science 0 1 2 7 10 22 47 61 64 19 233
sociology, economics 0 1 2 6 7 11 14 22 15 16 94
engineering 0 0 1 2 7 4 13 15 22 12 76
complex systems 0 1 1 2 3 7 11 13 18 22 78
applied mathematics 0 0 0 0 2 6 6 10 29 21 74
earth science 0 1 1 2 7 4 6 11 11 0 43
business, management 0 0 0 1 2 1 4 6 9 1 24
2 13 42 102 201 238 420 494 621 458 2591

26
Publications in Network Science Literature by Discipline(As recorded by the Web of Science1 on October 1, 2007; courtesy D. Alderson)
0
500
1000
1500
2000
2500
3000
1998 1999 2000 2001 2002 2003 2004 2005 2006 2007*
Jou
rna
l P
ub
lic
ati
on
s (
cu
mu
lati
ve)
"high impact"
physics
biology, chemistry, medicine
computer science
sociology, economics
applied mathematics
engineering
earth science
complex systems
business, management
1998 1999 2000 2001 2002 2003 2004 2005 2006 2007*
"high impact" 1 1 5 4 17 13 22 16 9 4 92
physics 1 7 26 62 124 139 230 260 350 286 1485
biology, chemistry, medicine 0 1 4 16 22 31 67 80 94 77 392
computer science 0 1 2 7 10 22 47 61 64 19 233
sociology, economics 0 1 2 6 7 11 14 22 15 16 94
engineering 0 0 1 2 7 4 13 15 22 12 76
complex systems 0 1 1 2 3 7 11 13 18 22 78
applied mathematics 0 0 0 0 2 6 6 10 29 21 74
earth science 0 1 1 2 7 4 6 11 11 0 43
business, management 0 0 0 1 2 1 4 6 9 1 24
2 13 42 102 201 238 420 494 621 458 2591

27
Article cites
1. Watts, DJ; Strogatz, SH. 1998. Collective dynamics of 'small-world' networks, NATURE 393(668). 2244
2. Barabasi AL, Albert R. 1999. Emergence of scaling in random networks. SCIENCE 286 (543). 2110
3. Albert R, Barabasi AL. 2002. Statistical Mechanics of Complex Networks. REV. OF MODERN PHYSICS 74 (1). 1972
4. Newman MEJ. 2003. The structure and function of complex networks. SIAM REVIEW 45 (2). 960
5. Jeong H, Tombor B, Albert R, et al. 2000. The large-scale organization of metabolic networks. NATURE 407
(6804).903
6. Strogatz, SH. 2001. Exploring complex networks, NATURE 410(6825). 884
7. Albert R, Jeong H, Barabasi AL. 2000. Error and attack tolerance of complex networks. NATURE 406 (6794). 747
8. Dorogovtsev SN, Mendes JFF. 2002. Evolution of networks. ADV IN PHYSICS 51 (4). 636
9. Giot, L; Bader, J.S.; Brouwer, C; Chaudhuri, A; Kuang, B; et al. 2003. A protein interaction map of Drosophila
melanogaster, SCIENCE, 302(5651).550
10. Milo, R; Shen-Orr, S; Itzkovitz, S; Kashtan, N; Chklovskii, D; Alon, U. 2002. Network motifs: Simple building
blocks of complex networks, SCIENCE 298(5594).489
11. Amaral LAN, et al. 2000. Classes of small-world networks. PROC. NAT. ACAD. SCI. 97 (21). 475
12. Ravasz, E; Somera, AL; Mongru, DA; Oltvai, ZN; Barbasi, AL. 2002. Hierarchical organization of modularity in
metabolic networks, SCIENCE 297(5586).457
13. Pastor-Satorras, R; Vespignani, A. 2001. Epidemic spreading in scale-free networks, PHYS. REV. LETT. 86(14). 440
14. Tong, AHY, et al. 2004. Global mapping of the yeast genetic interaction network. SCIENCE 303(5659) 412
15. Barabasi, AL; Albert, R; Jeong, H. 1999. Mean-field theory for scale-free random networks, PHYSICA A 272. 364
13279
Most Cited Publications in Network Science Literature (As recorded by the Web of Science1 on October 1, 2007; courtesy D. Alderson)

28
As Internet researchers, why should we care?
• ―Network Science‖ as a new scientific discipline …
• ―Network Science‖ for the masses …

29
The “New Science of Networks”

30
As Internet researchers, why should we care?
• ―Network Science‖ as a new scientific discipline …
• ―Network Science‖ for the masses …
• ―Network Science‖ for the (Internet) experts …

31
The “New Science of Networks”
32
As Internet researchers, why should we care?
• ―Network Science‖ as a new scientific discipline …
• ―Network Science‖ for the masses …
• ―Network Science‖ for the Internet experts …
• ―Network Science‖ for undergraduate/graduate students
in Computer Science/Electrical Engineering

33
The “New Science of Networks”
• New course offerings
– http://www.cc.gatech.edu/classes/AY2010/cs8803
ns_fall/
– http://www.netscience.usma.edu/about.php
– http://nicomedia.math.upatras.gr/courses/mnets/in
dex_en.html
– http://www-
personal.umich.edu/~mejn/courses/2004/cscs535
/index.html
– http://www.phys.psu.edu/~ralbert/phys597_09-fall

34
As Internet researchers, why should we care?
• ―Network Science‖ as a new scientific discipline …
• ―Network Science‖ for the masses …
• ―Network Science‖ for the Internet experts …
• ―Network Science‖ for undergraduate/graduate students
in Computer Science/Electrical Engineering
• … and most importantly, because ―Network Science‖ has
been a constant source for basic mis-conceptions …

35
Common (Mis)perceptions
• Power laws in network connectivity…
– Are necessary and sufficient for ―scale-free structure‖
– Imply critically connected ―hubs‖
– Create an Achilles’ heel vulnerability
– Yield a zero epidemic threshold for contagion
• Power laws in network connectivity show …
– Evidence of fundamental self-organization in networks
– This self-organization is a universal feature of
technological, biological, social and business networks
• Power laws in network connectivity mean …
– Efforts to protect complex networks should focus on the
most highly-connected components

36
The Main Point of these Talks …
I will show that in the case of the Internet …
The application of ―Network Science‖ in its current form
has led to conclusions that are not controversial but simply
wrong.
I will deconstruct the existing arguments and generalize the potential pitfalls common to ―Network Science.‖
I will also be constructive and illustrate an alternative approach to ―Network Science‖ based on
engineering considerations.

37
What does “Network Science” say about the Internet
• Illustration with a case study
– Problem: Internet topology
– Approach: Measurement-based
– Result: Predictive models with far-reaching implications
• Textbook example for the power of ―Network Science‖
– Appears solid and rigorous
– Appealing approach with surprising findings
– Directly applicable to other domains
• Based on 3 seminal papers
– J.-J. Pansiot and D. Grad, CCR 1998
– M.Faloutsos, P. Faloutsos, and C. Faloutsos, Sigcomm’99
– R. Albert, H. Jeong, and A.-L. Barabasi, Nature 2000.

38
What does “Network Science” say about the Internet
• Measurement technique
– traceroute tool
– traceroute discovers compliant (i.e., IP) routers along
path between selected network host computers

39
Running traceroute: Basic Experiment
• Basic ―experiment‖
– Select a source and destination
– Run traceroute tool
• Example
– Run traceroute from my machine in Florham Park,
NJ, USA to maths.adelaide.edu.au

Running “traceroute maths.adelaide.edu.au” from NJ• 1 135.207.176.3 1 ms 1 ms 1 ms
• 2 fp-core.research.att.com (135.207.3.1) 1 ms 1 ms 1 ms
• 3 ngx19.research.att.com (135.207.1.19) 1 ms 0 ms 0 ms
• 4 12.106.32.1 1 ms 1 ms 0 ms
• 5 12.119.12.73 2 ms 2 ms 2 ms
• 6 cr81.nw2nj.ip.att.net (12.122.105.114) 3 ms 4 ms 3 ms
• 7 cr1.n54ny.ip.att.net (12.122.105.29) 4 ms 4 ms 3 ms
• 8 n54ny01jt.ip.att.net (12.122.81.57) 3 ms 3 ms 3 ms
• 9 * xe-2-2.r03.nycmny01.us.bb.gin.ntt.net (129.250.8.41) 4 ms *
• 10 ae-1.r21.nycmny01.us.bb.gin.ntt.net (129.250.2.220) 3 ms 3 ms 3 ms
• 11 as-0.r20.chcgil09.us.bb.gin.ntt.net (129.250.6.13) 27 ms 24 ms 25 ms
• 12 ae-0.r21.chcgil09.us.bb.gin.ntt.net (129.250.3.98) 24 ms 24 ms 24 ms
• 13 as-5.r20.snjsca04.us.bb.gin.ntt.net (129.250.3.77) 76 ms 80 ms 76 ms
• 14 ae-1.r21.plalca01.us.bb.gin.ntt.net (129.250.5.32) 77 ms 85 ms 77 ms
• 15 po-3.r04.plalca01.us.bb.gin.ntt.net (129.250.2.218) 81 ms 81 ms 81 ms
• 16 140.174.28.138 80 ms 80 ms 77 ms
• 17 so-3-3-1.bb1.a.syd.aarnet.net.au (202.158.194.173) 239 ms 237 ms 239 ms
• 18 ge-0-0-0.bb1.b.syd.aarnet.net.au (202.158.194.198) 235 ms 234 ms 235 ms
• 19 so-2-0-0.bb1.a.mel.aarnet.net.au (202.158.194.33) 246 ms 250 ms 250 ms
• 20 so-2-0-0.bb1.a.adl.aarnet.net.au (202.158.194.17) 254 ms 258 ms 258 ms
• 21 gigabitethernet0.er1.adelaide.cpe.aarnet.net.au (202.158.199.245) 259 ms 255 ms 258 ms
• 22 gw1.er1.adelaide.cpe.aarnet.net.au (202.158.199.250) 258 ms 255 ms 254 ms
• 23 pulteney-pix.border.net.adelaide.edu.au (192.43.227.18) 256 ms 283 ms 281 ms
• 24 129.127.254.237 260 ms 256 ms 256 ms
• 25 * * *
• 26 staff.maths.adelaide.edu.au (129.127.5.1) 263 ms 273 ms 255 ms
40

41
traceroute-paths: (many) source-destination pairs

42
What does “Network Science” say about the Internet
• Measurement technique
– traceroute tool
– traceroute discovers compliant (i.e., IP) routers along
path between selected network host computers
• Available data: from large-scale traceroute experiments
– Pansiot and Grad (router-level, around 1995, France)
– Cheswick and Burch (mapping project 1997--, Bell-Labs)
– Mercator (router-level, around 1999, USC/ISI)
– Skitter (ongoing mapping project, CAIDA/UCSD)
– Rocketfuel (state-of-the-art router-level maps of
individual ISPs, UW Seattle)
– Dimes (ongoing EU project)
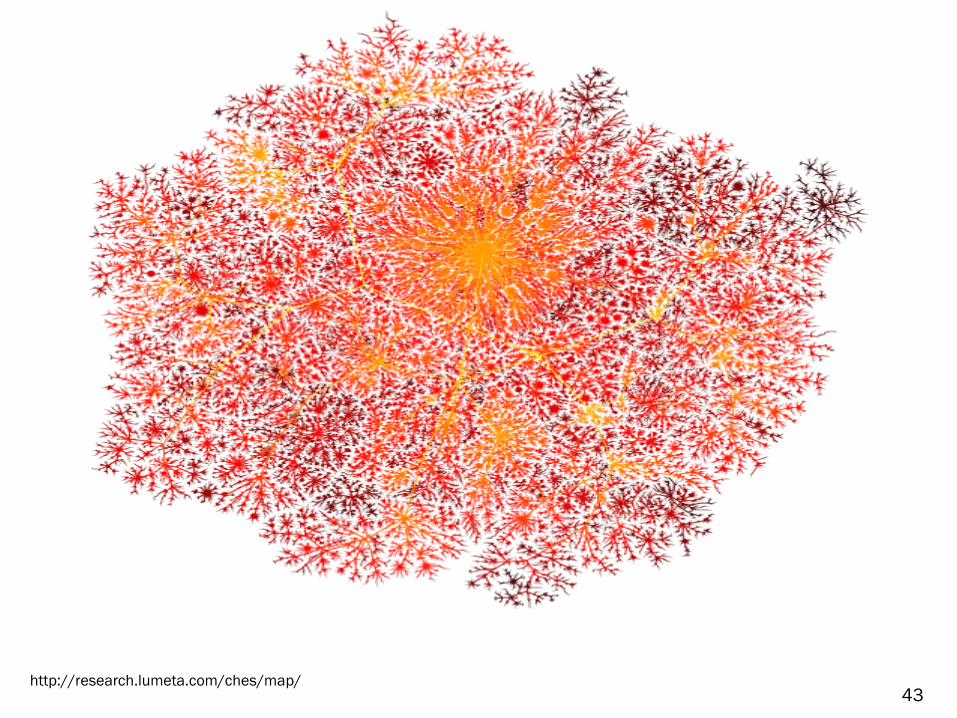
43http://research.lumeta.com/ches/map/

44
http://www.isi.edu/scan/mercator/mercator.html

45
http://www.caida.org/tools/measurement/skitter/

46
http://www.cs.washington.edu/research/networking/rocketfuel/bb

47http://www.cs.washington.edu/research/networking/rocketfuel/

48
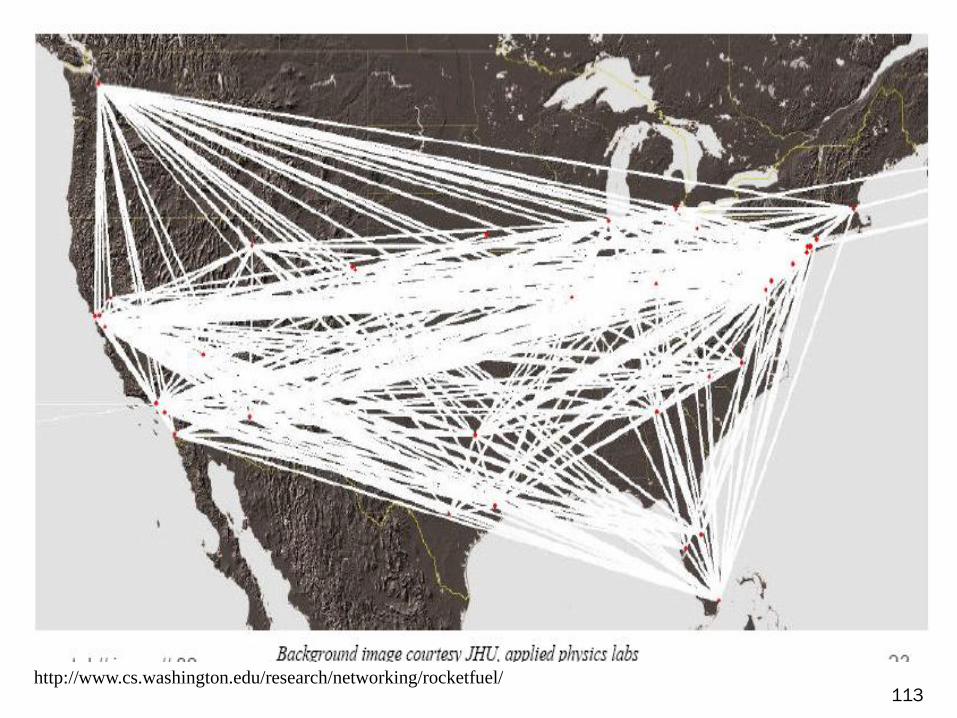
What does “Network Science” say about the Internet (cont.)
• Inference
– Given: traceroute-based map (graph) of the router-
level Internet (Internet service provider)
– Wanted: Metric/statistics that characterizes the
inferred connectivity maps
– Main metric: Node degree distribution

49
http://www.isi.edu/scan/mercator/mercator.html

50
What does “Network Science” say about the Internet (cont.)
• Inference
– Given: traceroute-based map (graph) of the router-
level Internet (Internet service provider)
– Wanted: Metric/statistics that characterizes the
inferred connectivity maps
– Main metric: Node degree distribution
• Surprising finding
– Inferred node degree distributions follow a power law
– A few nodes have a huge degree, while the majority
of nodes have a small degree

51
Power Laws and Internet Topology
Source: Faloutsos et al (1999)
Most nodes have few connections
A few nodes have lots of connections

52
What does “Network Science” say about the Internet (cont.)
• Inference
– Given: traceroute-based map (graph) of the router-
level Internet (Internet service provider)
– Wanted: Metric/statistics that characterizes the
inferred connectivity maps
– Main metric: Node degree distribution
• Surprising finding
– Inferred node degree distributions follow a power law
– A few nodes have a huge degree, while the majority
of nodes have a small degree
• Motivation for developing new network/graph models
– Dominant graph models: Erdos-Renyi random graphs
– But: Node degrees of Erdos-Renyi random graph
models follow a Poisson distribution

53
What does “Network Science” say about the Internet (cont.)
• New class of network models
– Preferential attachment (PA) growth model
• Incremental growth: New nodes/links are added
one at a time
•Preferential attachment: a new node is more
likely to connect to an already highly connected
node (p(k) degree of node k)
– Captures popular notion of ―the rich get richer‖
– There exist many variants of this basic PA model
– Generally referred to as ―scale-free‖ network models
• Key features of PA-type network models
– Randomness enters via attachment mechanism
– Exhibit power law node degree distributions
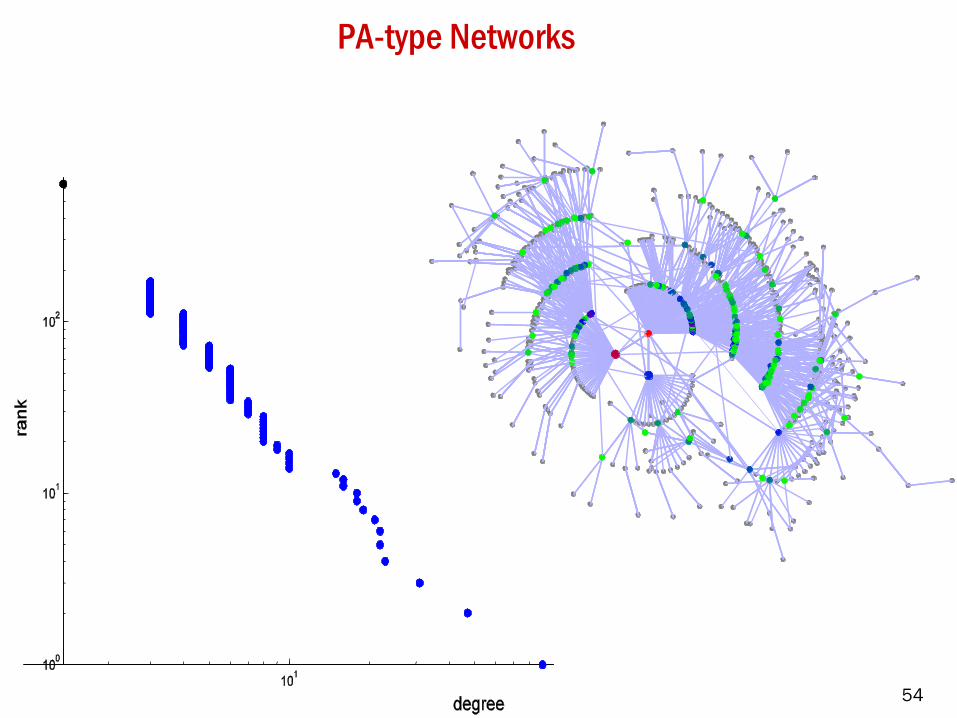
54
PA-type Networks

55
What does “Network Science” say about the Internet (cont.)
• Model validation
– The models ―fit the data‖ because they reproduce
the observed node degree distributions
– The models are simple and parsimonious
• PA-type models have resulted in highly publicized claims
about the Internet and its properties
– High-degree nodes form a hub-like core
– Fragile/vulnerable to targeted node removal
– Achilles’ heel
– Zero epidemic threshold
56
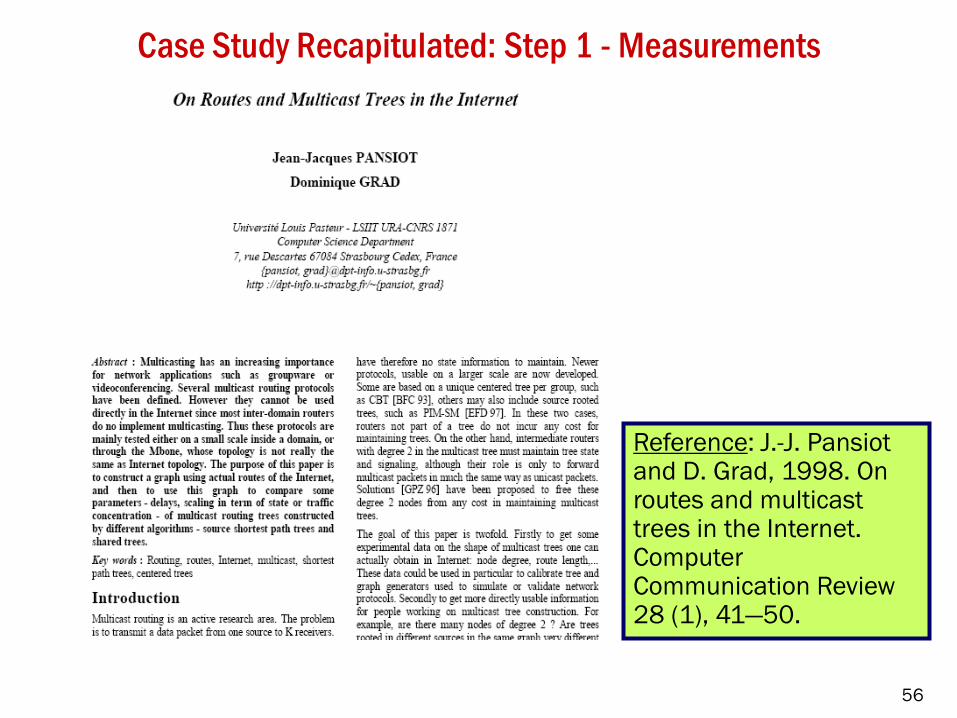
Case Study Recapitulated: Step 1 - Measurements
Reference: J.-J. Pansiot and D. Grad, 1998. On routes and multicast trees in the Internet. Computer Communication Review 28 (1), 41—50.

57
Case Study Recapitulated: Step 2 - Analysis
Reference: M. Faloutsos, P. Faloutsos, and C. Faloutsos, 1999. On power-law relationships in the Internet topology. Proc. ASM Sigcomm ’99, Computer Communication Review 29 (4), 251—262.

58
Case Study Recapitulated: Step 3 - Modeling
Reference: R. Albert, H. Jeong, A.-L. Barabasi, 2000. The Internet’s Achilles’ heel: Error and attack tolerance of complex networks. Nature 406, 378—382.

59
Case Study Recapitulated: Step 4 – Prediction/Implications
Cover Story: Nature 406, 2000.

60
CNN.com: Scientists spot Achilles heel of the Internet
• An estimated three percent of nodes are down at an given time but no one
notices because the system copes with it.
• "The reason this is so is because there are a couple of very big nodes and all
messages are going through them. But if someone maliciously takes down
the biggest nodes you can harm the system in incredible ways. You can very
easily destroy the function of the Internet," he added.
• Barabasi, whose research is published in the science journal Nature,
compared the structure of the Internet to the airline network of the United
States.
• "That's exactly the situation on the Internet: there are a couple of hubs that
are crucial to the system," Barabasi explained.
http://archives.cnn.com/2000/TECH/computing/07/26/science.internet.reut/index.html

61
Beyond the Internet …
• Social networks
• Information networks
• Technological networks
• Biological networks
Reference: M.E.J. Newman. The Structure and Function of
Complex Networks, SIAM Review 45, 167-256 (2003).

62
# nodes # edgesavg, degree avg,
pathlength
scalingexponent
clustering coeff. deg. corr.
coeff.
63
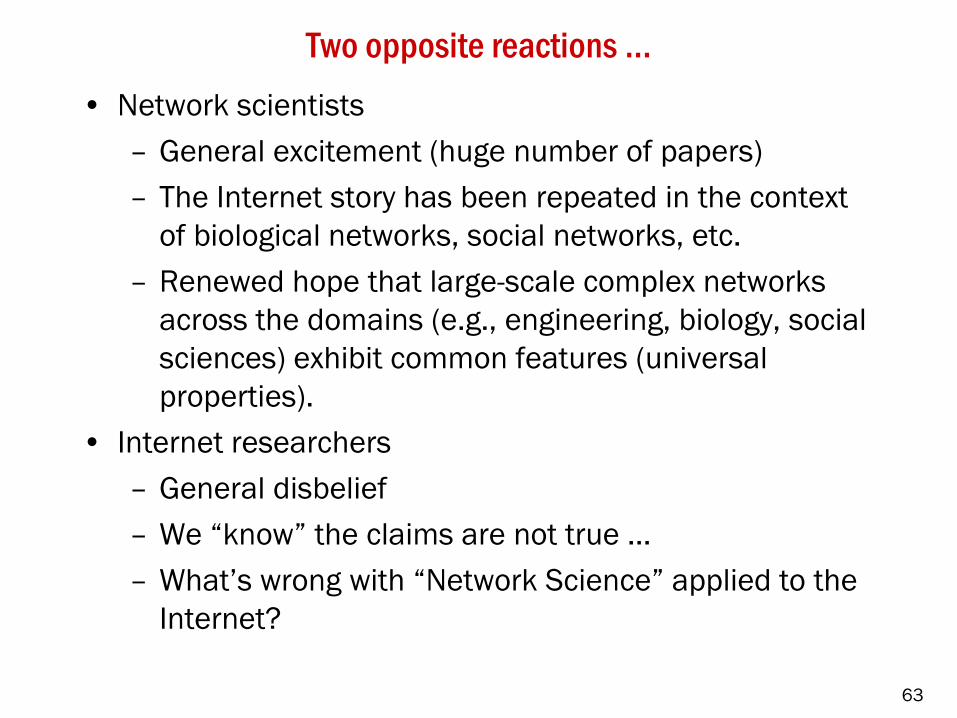
Two opposite reactions …
• Network scientists
– General excitement (huge number of papers)
– The Internet story has been repeated in the context
of biological networks, social networks, etc.
– Renewed hope that large-scale complex networks
across the domains (e.g., engineering, biology, social
sciences) exhibit common features (universal
properties).
• Internet researchers
– General disbelief
– We ―know‖ the claims are not true …
– What’s wrong with ―Network Science‖ applied to the
Internet?
64
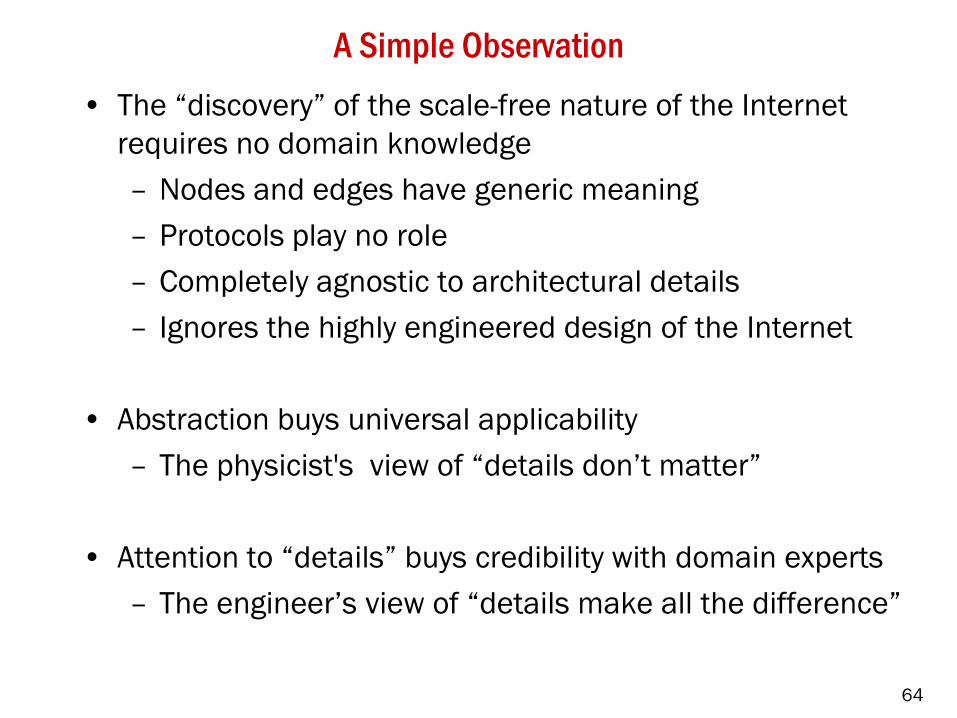
A Simple Observation
• The ―discovery‖ of the scale-free nature of the Internet
requires no domain knowledge
– Nodes and edges have generic meaning
– Protocols play no role
– Completely agnostic to architectural details
– Ignores the highly engineered design of the Internet
• Abstraction buys universal applicability
– The physicist's view of ―details don’t matter‖
• Attention to ―details‖ buys credibility with domain experts
– The engineer’s view of ―details make all the difference‖

65
A Look at the Internet as a Highly Engineered System
• Scrutinizing the ―Network Science‖ view of the Internet
– Use of domain knowledge
– Use of measurements
• Topics to be discussed
– The layered architecture of the Internet
– Vertical decomposition
– Horizontal decomposition
• Implications
– Internet connectivity
– What Internet topology?

66
The Internet: The User Perspective
my
computer
router router
web
server

67
The Internet: The Engineering Perspective
HTTP
TCP
IP
LINK
my
computer
router router
web
server

68
The Internet is a LAYERED Network
HTTP
TCP
IP
LINK
my
computer
router router
web
server
packetpacketpacketpacketpacketpacket
The perception of the Internet as a simple, user-
friendly, and robust system is enabled by
FEEDBACK and other CONTROLS that operate
both WITHIN LAYERS and ACROSS LAYERS.
These ARCHITECTURAL DETAILS
(protocols, layers, etc.) are MOST
ESSENTIAL to the nature of the Internet.

69
Internet Architecture: Vertical Decomposition
HTTP
TCP
IP
LINK
my
computer
router router
web
server
Ve
rtic
al d
eco
mp
osit
ion
Pro
toco
l S
tack Benefits:
• Each layer can evolve independently
• Substitutes, complements
Requirements:
1. Each layer follows the rules
2. Every other layer does “good
enough” with its implementation

70
The Internet hourglass
IP
Web FTP Mail News Video Audio ping napster
Applications
TCP SCTP UDP ICMP
Transport protocols
Ethernet 802.11 SatelliteOpticalPower lines BluetoothATM
Link technologies

71
The Internet hourglass
IP
Web FTP Mail News Video Audio ping napster
Applications
TCP SCTP UDP ICMP
Transport protocols
Ethernet 802.11 SatelliteOpticalPower lines BluetoothATM
Link technologies
Courtesy Hari Balakrishnan
Everything
on IP
IP on
everything

72
Internet Traffic
Bits, bytes
Packet traces
IP flows
TCP connections
Web traffic
Email traffic
P2P traffic
and many others …Applications
WWW, FTP, Email, P2P, …
TCP
IP
TransmissionEthernet, ATM, POS, WDM, …

73
Internet Architecture: Horizontal Decomposition
HTTP
TCP
IP
LINK
my
computer
router router
web
server
Horizontal decompositionEach level is decentralized and asynchronous
Benefit: Individual components can fail
(provided that they “fail off”) without
disrupting the network.

74
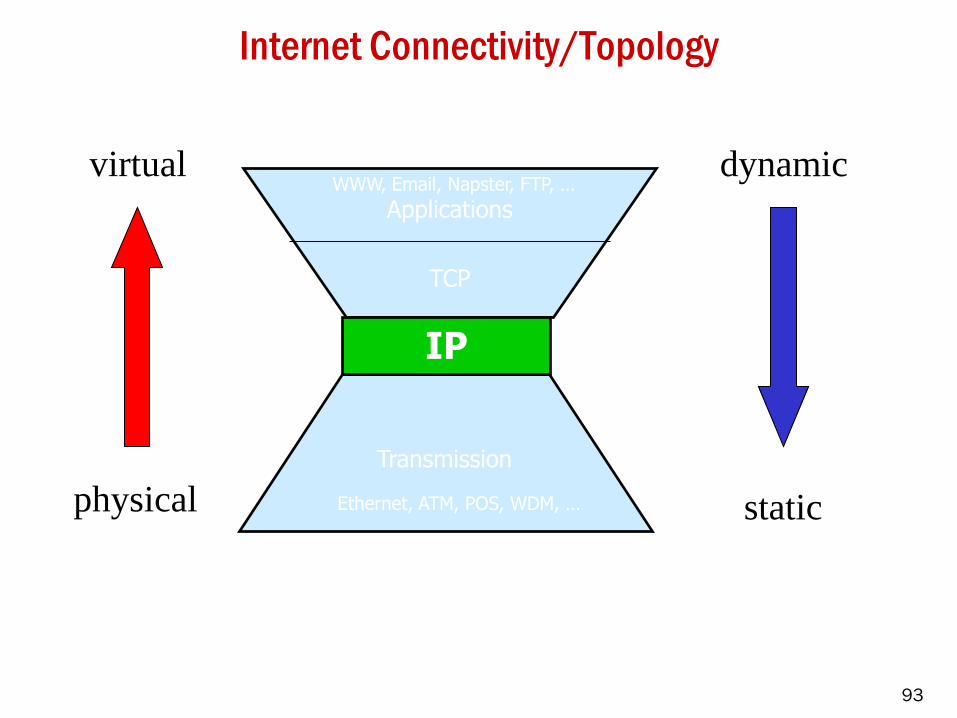
Internet Connectivity/Topology
Applications
TCP
IP
Transmission
WWW, Email, Napster, FTP, …
Ethernet, ATM, POS, WDM, …
• Consider a (vertical) layer of the Internet hourglass
• Expand it horizontally
• Give layer-specific meaning to “nodes” and “links”

75
“links”
“nodes”
76
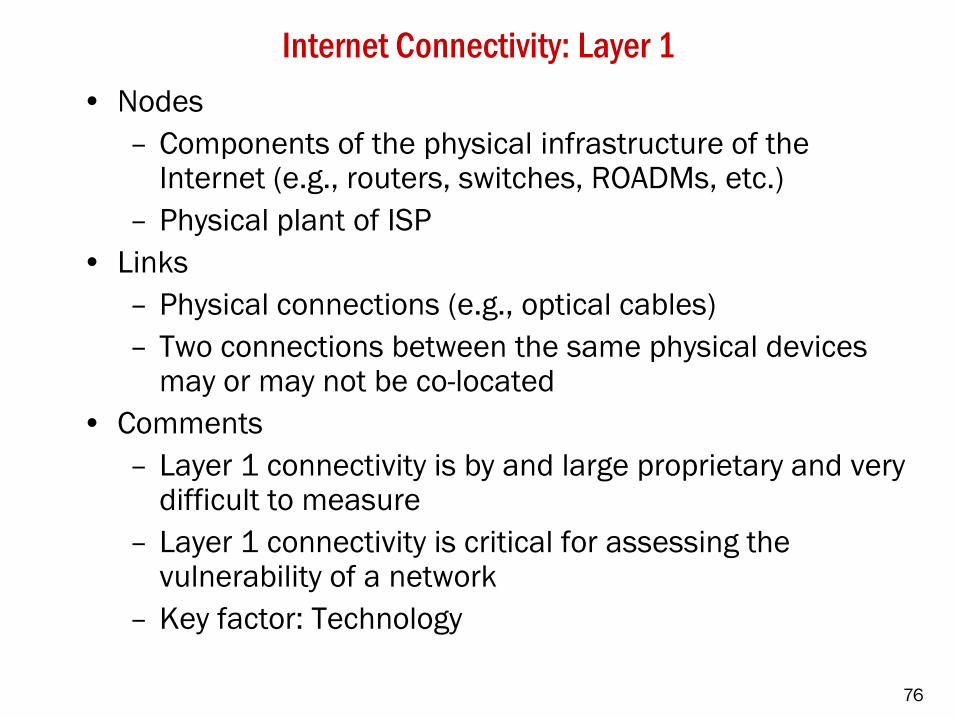
Internet Connectivity: Layer 1
• Nodes
– Components of the physical infrastructure of the Internet (e.g., routers, switches, ROADMs, etc.)
– Physical plant of ISP
• Links
– Physical connections (e.g., optical cables)
– Two connections between the same physical devices may or may not be co-located
• Comments
– Layer 1 connectivity is by and large proprietary and very difficult to measure
– Layer 1 connectivity is critical for assessing the vulnerability of a network
– Key factor: Technology

77
Internet Connectivity: Layer 2
• Nodes
– Routers and switches
• Links
– Layer 2 connectivity
– Typically consists of many Layer 1 connections
• Comments
– Layer 2 connectivity is very hard to measure
– Given the difficulties with Layer 1 connectivity, Layer
2 connectivity is often referred to as the ―physical
topology‖ or ―router-level topology‖ of the Internet
– Key factors: Technology, economics

78
Router-Level Internet

79
Internet Connectivity: Layer 3 (IP router)
• Nodes
– IP Routers
• Links
– 1-hop IP-level connectivity
• Comments
– Layer 3 connectivity is relatively easy to measure
– Layer 3 connectivity is more ―logical‖ or ―virtual‖ than
Layer 2 connectivity in the sense that it is ignorant of
Layer 2 technologies such as ATM or MPLS
– Key factors: Technology, economics

80
http://www.caida.org/tools/measurement/skitter/

81
Internet Connectivity: Layer 3 (PoP)
• Nodes
– Point-of-Presence (PoP)
• Links
– IP-level connectivity between PoPs
– Typically consists of multiple router-level connections
• Comments
– PoP-level connectivity is relatively easy to measure
– PoP-level connectivity is more ―logical‖ or ―virtual‖
than IP router-level connectivity in the sense that it
groups IP routers by their roles as backbone and
access routers
– Key factors: Technology, economics

82

83
Internet Connectivity: Layer 3 (AS)
• Nodes
– Autonomous system or domain (AS)
• Links
– Well-defined business relationship between two ASes
– Examples: Customer-provider, peer-to-peer, sibling
relationship
• Comments
– AS-level connectivity is ―logical‖ or ―virtual‖ in the
sense that it’s about business relationships
– AS-level connectivity says little about physical
connectivity, except that two ASes that have an
established business relationship can also exchange
traffic on some physical link
– Key factors: Economy

84
From Router-Level to Autonomous System (AS)-Level Internet

85
AS Graphs = Business Relationships
AS 1 AS 3
AS 4AS 2
Nodes = ASes
Links = peering
relationships

86
AS Graphs Obscure Physical Connectivity!
The AS graph
may look like this. Reality may be closer to this…
Courtesy Tim Griffin

87
Internet Connectivity: Layer 3 (Internet Eco-system)
• Nodes
– Company/business (e.g., ISP, Content provider, CDN,
large enterprise, educational institution)
• Links
– Business relationship between two companies
– Derived from existing AS relationships
• Comments
– Build on top of the AS-level connectivity
– Each company consists of at least one AS
– Large companies consist of many different ASes and
use them to implement their business model (e.g.,
AT&T has about 20-30 ASes, main one is 7018)
– Key factors: Economics

88
Internet Connectivity: Application Layer (Web)
• Nodes
– Static html pages
• Links
– Hyperlinks
• Comments
– Huge (directed) graph
– Connectivity in the Web graph says nothing about the
underlying physical connectivity of the Internet
– Key factors: User behavior, socio-economic

89
(Part of the) Web Graph
Nodes = documents, connections = hyperlinks
90
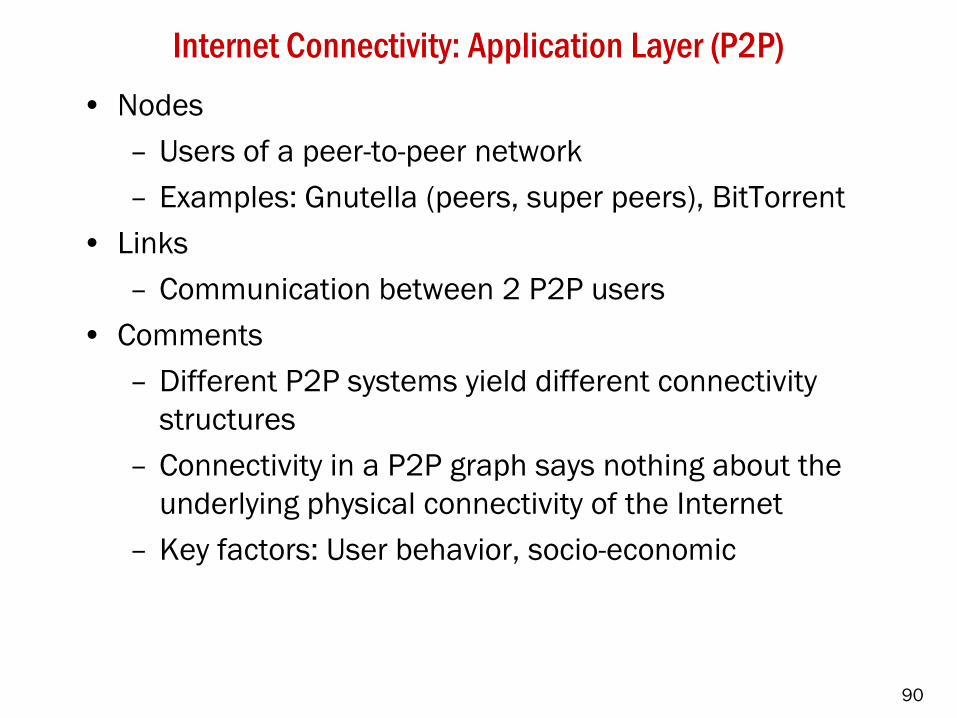
Internet Connectivity: Application Layer (P2P)
• Nodes
– Users of a peer-to-peer network
– Examples: Gnutella (peers, super peers), BitTorrent
• Links
– Communication between 2 P2P users
• Comments
– Different P2P systems yield different connectivity
structures
– Connectivity in a P2P graph says nothing about the
underlying physical connectivity of the Internet
– Key factors: User behavior, socio-economic

91
Internet Connectivity: Application Layer (OSN)
• Nodes
– Users of an Online Social Network (OSN)
– Examples: Facebook, MySpace, Flickr, Twitter
• Links
– Friendship relationship
– Interaction
• Comments
– Different OSNs yield different connectivity structures
– Connectivity in an OSN says nothing about the
underlying physical connectivity of the Internet
– Key factors: User behavior, socio-economic

92
The Many Facets of Internet Topology
Applications
TCP
IP
Transmission
Router-level connectivity (i.e., layer 2)
IP-level connectivity (i.e., layer 3)
Web graph
Email graph
P2P graph
OSN graphs, etc.
Autonomous System (AS) or AS-level ecosystem
93
Internet Connectivity/Topology
Applications
TCP
IP
Transmission
WWW, Email, Napster, FTP, …
Ethernet, ATM, POS, WDM, …
virtual
physical static
dynamic

94
What Internet topology?
• There is no ―generic‖ Internet topology
• The many facets of Internet topology
– Router-level (physical)
– IP-, AS-level (logical)
– Application-level (logical)
• Details of each connectivity structure make a big difference
– Some are constrained by existing technology
– Some are the result of prevailing economic conditions
– Some are shaped by user behavior
– Some involve a combination of all of the above
• Lack of specificity can cause confusion
– Knocking out nodes in the AS graph???
– Spread of viruses in the Web graph???

95
The Many Facets of Internet Connectivity/Topology
Applications
TCP
IP
Transmission
Router-level connectivity (i.e., layer 2)
IP-level connectivity (i.e., layer 3)
Web graph
Email graph
P2P graph
and many others …
Autonomous System (AS) or AS-level ecosystem

96
The Internet looks nothing like this …
R. D’Souza et al., PNAS, 2007

97Liljenstam, Liu, and Nicol (2003)
... but more like this!

98
The Real Story about the Internet …
• The ―scale-free story‖ for the Internet and its implications
(e.g. Achilles’ heel) is wrong
• The dramatic differences in perspective can be attributed
to a complete lack of data hygiene, errors in the analysis of
the data, incompatible modeling assumptions, and faulty
reasoning.
• On a more constructive note, I will illustrate an alternative
approach to ―Network Science‖ that complements the
dominant physics perspective with a much needed
engineering-based perspective.

99
Main Problems with the “Network Science” Approach
• No critical assessment of available data
• Ignores all networking-related ―details‖
• Overarching desire to reproduce observed properties of the
data even though the quality of the data is insufficient to say
anything about those properties with sufficient confidence
• Reduces model validation to the ability to reproduce an
observed statistics of the data (e.g., node degree distribution)

100
How to fix “Network Science”?
• Know your data!
– Importance of data hygiene
• Know your statistics!
– Every dataset can be ―mined‖ to yield power-laws
• Take model validation more serious!
– Model validation ≠ data fitting
• Apply an engineering perspective to engineered systems!
– Design principles vs. random coin tosses

Internet Measurements – Know your Data!
February 22, 2010

102
Internet Measurements: Connectivity (1)
• Recent example of measurement-driven Internet research
– What is the structure of the real (wired) Internet?
– Answer: Go and measure it!
• Difficulties with measuring Internet connectivity
– No central agency/repository
– Economic incentive for ISPs to obscure network structure
– Direct inspection is typically not possible
• Practical approaches
– No tailor-made tools exist to measure any connectivity
structure that arises in the Internet context
– The tools that are used are based on measurement
experiments/engineering hacks

103
Internet Measurements: Connectivity (2)
• Main difference compared to Internet traffic research
– There is always a mismatch between what we can
measure and what we want to measure!
– How to make sense of what we can measure?
– ―Are the available measurements of good enough quality
for the purpose of inferring a particular Internet
connectivity structure?‖
• Illustration of the physicist’s vs. the engineer’s views
– Example 1: Internet router-level connectivity
– Example 2: Internet AS-level connectivity
– Example 3: Internet overlay connectivity (OSNs)

104
Example 1: Internet Router-level Connectivity
• Nodes
– IP routers or switches
• Links
– Physical connection between two IP routers or
switches
• Measurement technique
– traceroute tool
– traceroute discovers compliant (i.e., IP) routers along
path between selected network host computers

105
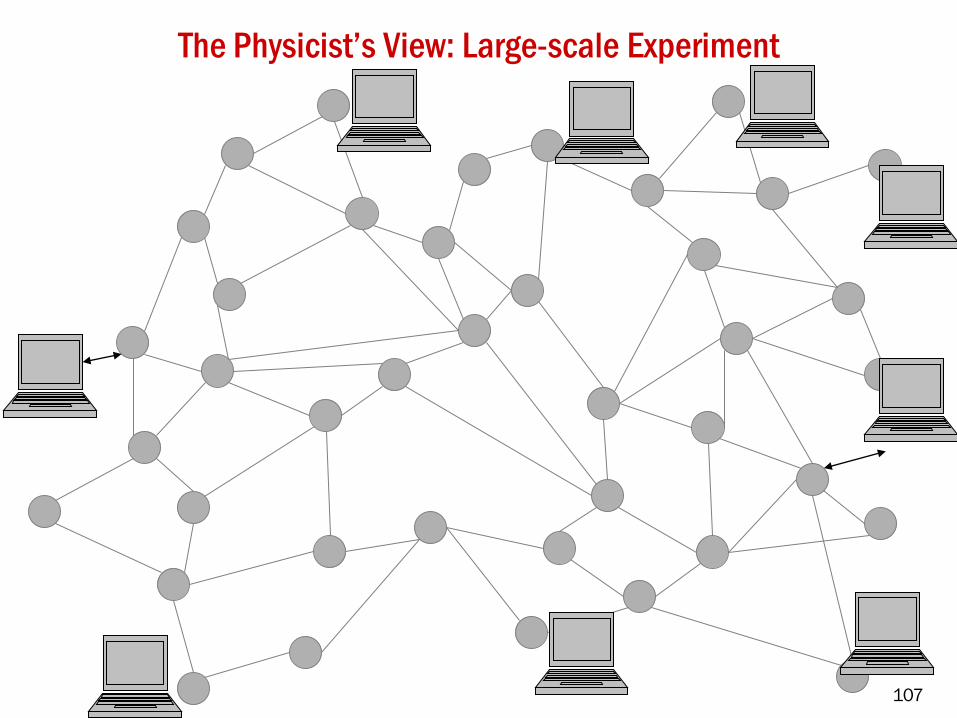
The Physicist’s View: Basic Experiment
• Basic ―experiment‖
– Select a source and destination
– Run traceroute tool
• Example
– Run traceroute from my machine in Florham Park,
NJ, USA to maths.adelaide.edu.au
Running “traceroute maths.adelaide.edu.au” from NJ• 1 135.207.176.3 1 ms 1 ms 1 ms
• 2 fp-core.research.att.com (135.207.3.1) 1 ms 1 ms 1 ms
• 3 ngx19.research.att.com (135.207.1.19) 1 ms 0 ms 0 ms
• 4 12.106.32.1 1 ms 1 ms 0 ms
• 5 12.119.12.73 2 ms 2 ms 2 ms
• 6 cr81.nw2nj.ip.att.net (12.122.105.114) 3 ms 4 ms 3 ms
• 7 cr1.n54ny.ip.att.net (12.122.105.29) 4 ms 4 ms 3 ms
• 8 n54ny01jt.ip.att.net (12.122.81.57) 3 ms 3 ms 3 ms
• 9 * xe-2-2.r03.nycmny01.us.bb.gin.ntt.net (129.250.8.41) 4 ms *
• 10 ae-1.r21.nycmny01.us.bb.gin.ntt.net (129.250.2.220) 3 ms 3 ms 3 ms
• 11 as-0.r20.chcgil09.us.bb.gin.ntt.net (129.250.6.13) 27 ms 24 ms 25 ms
• 12 ae-0.r21.chcgil09.us.bb.gin.ntt.net (129.250.3.98) 24 ms 24 ms 24 ms
• 13 as-5.r20.snjsca04.us.bb.gin.ntt.net (129.250.3.77) 76 ms 80 ms 76 ms
• 14 ae-1.r21.plalca01.us.bb.gin.ntt.net (129.250.5.32) 77 ms 85 ms 77 ms
• 15 po-3.r04.plalca01.us.bb.gin.ntt.net (129.250.2.218) 81 ms 81 ms 81 ms
• 16 140.174.28.138 80 ms 80 ms 77 ms
• 17 so-3-3-1.bb1.a.syd.aarnet.net.au (202.158.194.173) 239 ms 237 ms 239 ms
• 18 ge-0-0-0.bb1.b.syd.aarnet.net.au (202.158.194.198) 235 ms 234 ms 235 ms
• 19 so-2-0-0.bb1.a.mel.aarnet.net.au (202.158.194.33) 246 ms 250 ms 250 ms
• 20 so-2-0-0.bb1.a.adl.aarnet.net.au (202.158.194.17) 254 ms 258 ms 258 ms
• 21 gigabitethernet0.er1.adelaide.cpe.aarnet.net.au (202.158.199.245) 259 ms 255 ms 258 ms
• 22 gw1.er1.adelaide.cpe.aarnet.net.au (202.158.199.250) 258 ms 255 ms 254 ms
• 23 pulteney-pix.border.net.adelaide.edu.au (192.43.227.18) 256 ms 283 ms 281 ms
• 24 129.127.254.237 260 ms 256 ms 256 ms
• 25 * * *
• 26 staff.maths.adelaide.edu.au (129.127.5.1) 263 ms 273 ms 255 ms
106
107
The Physicist’s View: Large-scale Experiment

108
The Physicist’s View (cont.)
• Measurement technique
– traceroute tool
– traceroute discovers compliant (i.e., IP) routers along
path between selected network host computers
• Available data: from large-scale traceroute experiments
– Pansiot and Grad (router-level, around 1995, France)
– Cheswick and Burch (mapping project 1997--, Bell-Labs)
– Mercator (router-level, around 1999, USC/ISI)
– Skitter (ongoing mapping project, CAIDA/UCSD)
– Rocketfuel (state-of-the-art router-level maps of
individual ISPs, UW Seattle)
– Dimes (ongoing EU project)

109http://research.lumeta.com/ches/map/

110
http://www.isi.edu/scan/mercator/mercator.html

111
http://www.caida.org/tools/measurement/skitter/

112
http://www.cs.washington.edu/research/networking/rocketfuel/bb
113http://www.cs.washington.edu/research/networking/rocketfuel/
114
The Physicist’s View (cont.)
• Inference
– Given: traceroute-based map (graph) of the router-
level Internet (Internet service provider)
– Wanted: Metric/statistics that characterizes the
inferred connectivity maps
– Main metric: Node degree distribution

115
http://www.isi.edu/scan/mercator/mercator.html

116
The Engineer’s View
• Measurement technique
– traceroute tool
– traceroute discovers compliant (i.e., IP) routers along
path between selected network host computers
– The reported IP addresses are not the routers’ IP
addresses, but the IP addresses of the routers’
interfaces (outgoing packet)

Running “traceroute maths.adelaide.edu.au” from NJ• 1 135.207.176.3 1 ms 1 ms 1 ms
• 2 fp-core.research.att.com (135.207.3.1) 1 ms 1 ms 1 ms
• 3 ngx19.research.att.com (135.207.1.19) 1 ms 0 ms 0 ms
• 4 12.106.32.1 1 ms 1 ms 0 ms
• 5 12.119.12.73 2 ms 2 ms 2 ms
• 6 cr81.nw2nj.ip.att.net (12.122.105.114) 3 ms 4 ms 3 ms
• 7 cr1.n54ny.ip.att.net (12.122.105.29) 4 ms 4 ms 3 ms
• 8 n54ny01jt.ip.att.net (12.122.81.57) 3 ms 3 ms 3 ms
• 9 * xe-2-2.r03.nycmny01.us.bb.gin.ntt.net (129.250.8.41) 4 ms *
• 10 ae-1.r21.nycmny01.us.bb.gin.ntt.net (129.250.2.220) 3 ms 3 ms 3 ms
• 11 as-0.r20.chcgil09.us.bb.gin.ntt.net (129.250.6.13) 27 ms 24 ms 25 ms
• 12 ae-0.r21.chcgil09.us.bb.gin.ntt.net (129.250.3.98) 24 ms 24 ms 24 ms
• 13 as-5.r20.snjsca04.us.bb.gin.ntt.net (129.250.3.77) 76 ms 80 ms 76 ms
• 14 ae-1.r21.plalca01.us.bb.gin.ntt.net (129.250.5.32) 77 ms 85 ms 77 ms
• 15 po-3.r04.plalca01.us.bb.gin.ntt.net (129.250.2.218) 81 ms 81 ms 81 ms
• 16 140.174.28.138 80 ms 80 ms 77 ms
• 17 so-3-3-1.bb1.a.syd.aarnet.net.au (202.158.194.173) 239 ms 237 ms 239 ms
• 18 ge-0-0-0.bb1.b.syd.aarnet.net.au (202.158.194.198) 235 ms 234 ms 235 ms
• 19 so-2-0-0.bb1.a.mel.aarnet.net.au (202.158.194.33) 246 ms 250 ms 250 ms
• 20 so-2-0-0.bb1.a.adl.aarnet.net.au (202.158.194.17) 254 ms 258 ms 258 ms
• 21 gigabitethernet0.er1.adelaide.cpe.aarnet.net.au (202.158.199.245) 259 ms 255 ms 258 ms
• 22 gw1.er1.adelaide.cpe.aarnet.net.au (202.158.199.250) 258 ms 255 ms 254 ms
• 23 pulteney-pix.border.net.adelaide.edu.au (192.43.227.18) 256 ms 283 ms 281 ms
• 24 129.127.254.237 260 ms 256 ms 256 ms
• 25 * * *
• 26 staff.maths.adelaide.edu.au (129.127.5.1) 263 ms 273 ms 255 ms
117
118
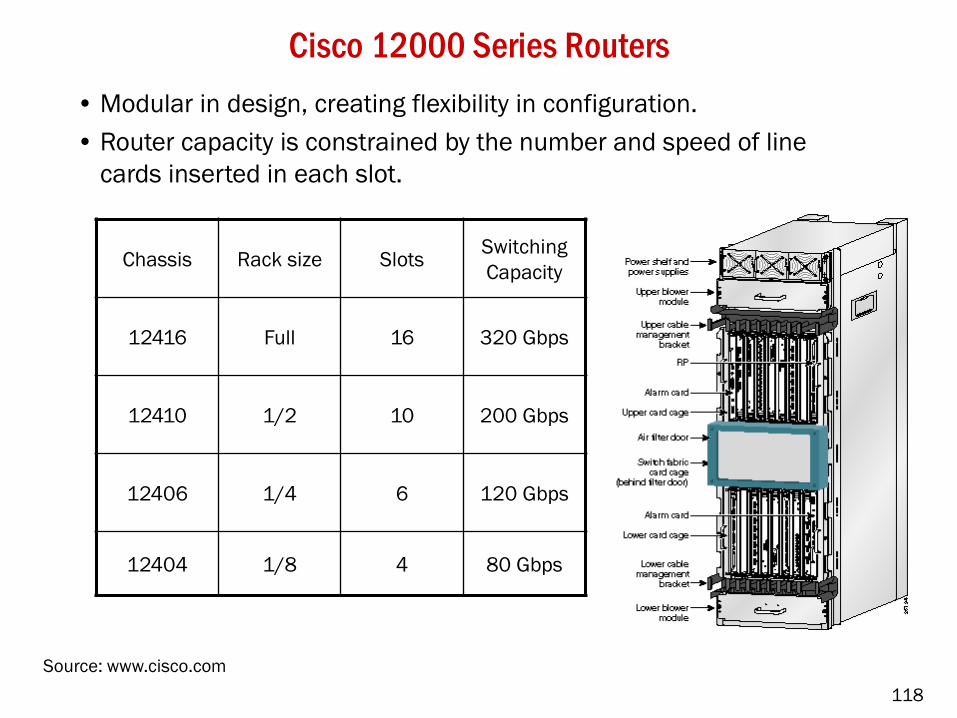
Cisco 12000 Series Routers
Chassis Rack size SlotsSwitching
Capacity
12416 Full 16 320 Gbps
12410 1/2 10 200 Gbps
12406 1/4 6 120 Gbps
12404 1/8 4 80 Gbps
• Modular in design, creating flexibility in configuration.
• Router capacity is constrained by the number and speed of line
cards inserted in each slot.
Source: www.cisco.com

119
The Engineer’s View: traceroute tool
• Basic ―experiment‖
– Run traceroute tool
– Select a source and destination
• Example
– Run traceroute from my machine in Florham Park,
NJ, USA to maths.adelaide.edu.au

Running “traceroute maths.adelaide.edu.au” from NJ• 1 135.207.176.3 1 ms 1 ms 1 ms
• 2 fp-core.research.att.com (135.207.3.1) 1 ms 1 ms 1 ms
• 3 ngx19.research.att.com (135.207.1.19) 1 ms 0 ms 0 ms
• 4 12.106.32.1 1 ms 1 ms 0 ms
• 5 12.119.12.73 2 ms 2 ms 2 ms
• 6 cr81.nw2nj.ip.att.net (12.122.105.114) 3 ms 4 ms 3 ms
• 7 cr1.n54ny.ip.att.net (12.122.105.29) 4 ms 4 ms 3 ms
• 8 n54ny01jt.ip.att.net (12.122.81.57) 3 ms 3 ms 3 ms
• 9 * xe-2-2.r03.nycmny01.us.bb.gin.ntt.net (129.250.8.41) 4 ms *
• 10 ae-1.r21.nycmny01.us.bb.gin.ntt.net (129.250.2.220) 3 ms 3 ms 3 ms
• 11 as-0.r20.chcgil09.us.bb.gin.ntt.net (129.250.6.13) 27 ms 24 ms 25 ms
• 12 ae-0.r21.chcgil09.us.bb.gin.ntt.net (129.250.3.98) 24 ms 24 ms 24 ms
• 13 as-5.r20.snjsca04.us.bb.gin.ntt.net (129.250.3.77) 76 ms 80 ms 76 ms
• 14 ae-1.r21.plalca01.us.bb.gin.ntt.net (129.250.5.32) 77 ms 85 ms 77 ms
• 15 po-3.r04.plalca01.us.bb.gin.ntt.net (129.250.2.218) 81 ms 81 ms 81 ms
• 16 140.174.28.138 80 ms 80 ms 77 ms
• 17 so-3-3-1.bb1.a.syd.aarnet.net.au (202.158.194.173) 239 ms 237 ms 239 ms
• 18 ge-0-0-0.bb1.b.syd.aarnet.net.au (202.158.194.198) 235 ms 234 ms 235 ms
• 19 so-2-0-0.bb1.a.mel.aarnet.net.au (202.158.194.33) 246 ms 250 ms 250 ms
• 20 so-2-0-0.bb1.a.adl.aarnet.net.au (202.158.194.17) 254 ms 258 ms 258 ms
• 21 gigabitethernet0.er1.adelaide.cpe.aarnet.net.au (202.158.199.245) 259 ms 255 ms 258 ms
• 22 gw1.er1.adelaide.cpe.aarnet.net.au (202.158.199.250) 258 ms 255 ms 254 ms
• 23 pulteney-pix.border.net.adelaide.edu.au (192.43.227.18) 256 ms 283 ms 281 ms
• 24 129.127.254.237 260 ms 256 ms 256 ms
• 25 * * *
• 26 staff.maths.adelaide.edu.au (129.127.5.1) 263 ms 273 ms 255 ms
120

121
The Engineer’s View (cont.)
• traceroute is strictly about IP-level connectivity
– Originally developed by Van Jacobson (1988)
– Designed to trace out the route to a host
• Using traceroute to map the router-level topology
– Engineering hack
– Example of what we can measure, not what we want to
measure!
• Basic problem #1: IP alias resolution problem
– How to map interface IP addresses to IP routers
– Largely ignored or badly dealt with in the past
– New efforts in 2008 for better heuristics …

122
Interfaces 1 and 2 belong to the same router

123
Measurements: Large-scale traceroute experiments
1 million x 1 million traceroutes: 1PB

124
IP Alias Resolution Problem for Abilene (thanks to Adam Bender)

125
Node Degree
Actual vs Inferred Node Degrees
0
5
10
15
20
25
0 1 2 3 4 5 6 7 8 9 10 11 12 13 14 15 16 17
Co
un
t
actual
inferred

126
The Engineer’s View (cont.)
• traceroute is strictly about IP-level connectivity
• Basic problem #2: Layer-2 technologies (e.g., MPLS, ATM)
– MPLS is an example of a circuit technology that hides the
network’s physical infrastructure from IP
– Sending traceroutes through an opaque Layer-2 cloud results
in the ―discovery‖ of high-degree nodes, which are simply an
artifact of an imperfect measurement technique.
– This problem has been largely ignored in all large-scale
traceroute experiments to date.

127
(a) (b)

128
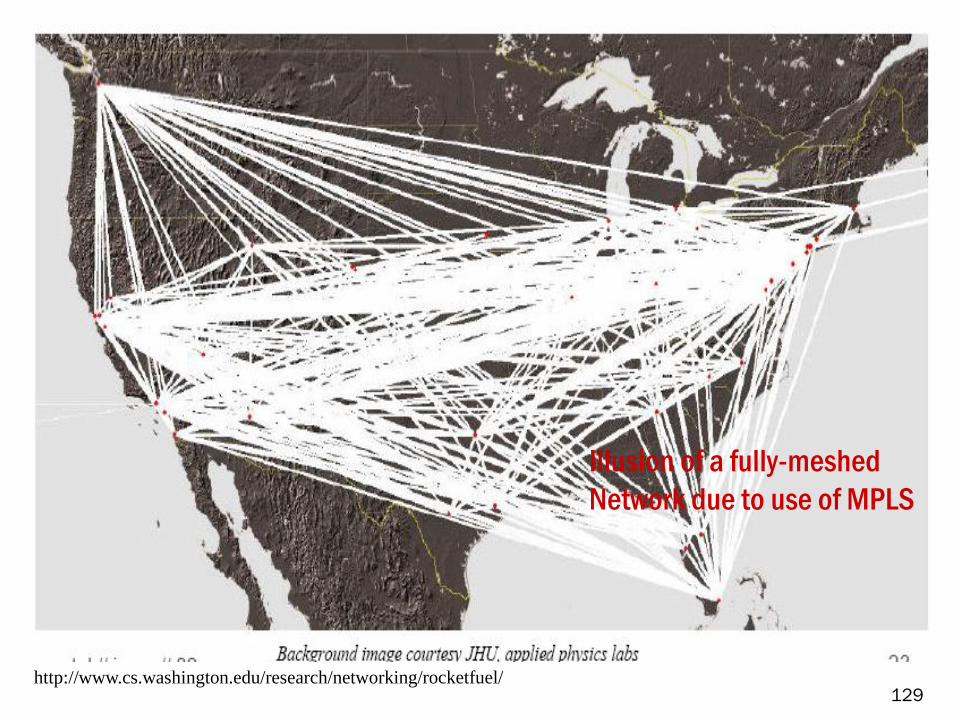
129http://www.cs.washington.edu/research/networking/rocketfuel/
Illusion of a fully-meshed
Network due to use of MPLS

130
http://www.caida.org/tools/measurement/skitter/

131
http://www.caida.org/tools/measurement/skitter/
www.savvis.net
managed IP and
hosting company
founded 1995
offering “private IP
with ATM at core”
This “node” is an
entire network!
(not just a router)

132
The Engineer’s View (cont.)
• The irony of traceroute measurements
– The high-degree nodes in the middle of the network that traceroute reveals are not for real …
– If there are high-degree nodes in the network, they can only exist at the edge of the network where they will never be revealed by generic traceroute-based experiments …
• Additional sources of errors
– Bias in (mathematical abstraction of) traceroute
– Has been a major focus within CS/Networking literature
– Non-issue in the presence of above-mentioned problems

133
The Engineer’s View on Traceroute measurements
• Bottom line
– (Current) traceroute measurements are of little use for
inferring router-level connectivity
– It is unlikely that future traceroute measurements will be
more useful for the purpose of router-level inference
• Lessons learned
– Key question: Can you trust the available data?
– Critical role of Data Hygiene in the Petabyte Age
– Corollary: Petabytes of garbage = garbage
– Data hygiene is often viewed as ―dirty/unglamorous‖ work

134
Revisiting the 1998 Pansiot and Grad paper
• The purpose for performing their traceroute
measurements is explicitly stated

135
Reference: J.-J. Pansiot and D. Grad, 1998. On routes and multicast trees in the Internet. Computer Communication Review 28 (1), page 41.

136
Revisiting the 1998 Pansiot and Grad paper
• The purpose for performing their traceroute
measurements is explicitly stated
• The main problems with the traceroute measurements
are explicitly mentioned (IP alias resolution and Layer-2
technology)

137
Reference: J.-J. Pansiot and D. Grad, 1998. On routes and multicast trees in the Internet. Computer Communication Review 28 (1), page 43.

138
Reference: J.-J. Pansiot and D. Grad, 1998. On routes and multicast trees in the Internet. Computer Communication Review 28 (1), pages 45/46.

139
Revisiting the 1998 Pansiot and Grad paper
• The purpose for performing their traceroute
measurements is explicitly stated
• The main problems with the traceroute measurements
are explicitly mentioned (IP alias resolution and Layer-2
technology)
• The Pansiot and Grad paper is an early textbook
example for what information a measurement paper
should provide.

140
Revisiting the 1998 Pansiot and Grad paper
• The purpose for performing their traceroute measurements is explicitly stated
• The main problems with the traceroute measurements are explicitly mentioned (IP alias resolution and Layer-2 technology)
• The Pansiot and Grad paper is an early textbook example for what information a measurement paper should provide.
• Unfortunately, subsequent papers in this area have completely ignored the essential details provided by Pansiot and Grad and ultimately don’t even cite this work anymore!

141
Reference: M. Faloutsos, P. Faloutsos, and C. Faloutsos, 1999. On power-law relationships in the Internet topology. Proc. ASM Sigcomm ’99, Computer Communication Review 29 (4), p. 253.

142
Reference: R. Albert, H. Jeong, A.-L. Barabasi, 2000. The Internet’s Achilles’ heel: Error and attack tolerance of complex networks. Nature 406, 378—382.

143
Reference: R. Albert, H. Jeong, A.-L. Barabasi, 2000. The Internet’s Achilles’ heel: Error and attack tolerance of complex networks. Nature 406, 378—382.

144
Example 2: Internet AS-level Connectivity
• Nodes
– Autonomous systems (ASes) or domains
• Links
– Business relationship between 2 ASes
•Customer-provider relationship
•Peer-to-peer relationship
•Sibling relationship
• Comments
– AS-level connectivity is ―logical‖ or ―virtual‖ in the sense that it’s about business relationships
– AS-level connectivity says little about physical connectivity, except that two ASes that have an established business relationship can also exchange traffic on some physical link

145
From Router-level to AS-level Connectivity

146
AS Graphs = Business Relationships
AS 1 AS 3
AS 4AS 2
Nodes = ASes
Links = peering
relationships

147
AS Graphs Obscure Physical Connectivity!
The AS graph
may look like this. Reality may be closer to this…
Courtesy Tim Griffin

148
Internet
AS-level Hierarchy
148
Tier-1
AS
AT&TAS7018
Tier-1
AS
Tier-2
AS
Tier-2
AS
Tier-2
AS
Tier-2
AS
Tier-3 Tier-3 Tier-3 Tier-3 Tier-3
Tier-4 Tier-4 Tier-4 Tier-4 Tier-4 Tier-4

149
Internet
Customer-Provider Links
149
Tier-1
AS
AT&TAS701
8
Tier-1
AS
Tier-2
AS
Tier-2
AS
Tier-2
AS
Tier-2
AS
Tier-3 Tier-3 Tier-3 Tier-3 Tier-3
Tier-4 Tier-4 Tier-4 Tier-4 Tier-4 Tier-4
Provider
Customer
c2p

150
Internet
Peer-to-Peer Link
150
Tier-1
AS
AT&TAS7018
Tier-1
AS
Tier-2
AS
Tier-2
AS
Tier-2
AS
Tier-2
AS
Tier-3 Tier-3 Tier-3 Tier-3 Tier-3
Tier-4 Tier-4 Tier-4 Tier-4 Tier-4 Tier-4
PeerPeer p2p
151
On Measuring AS-level Connectivity
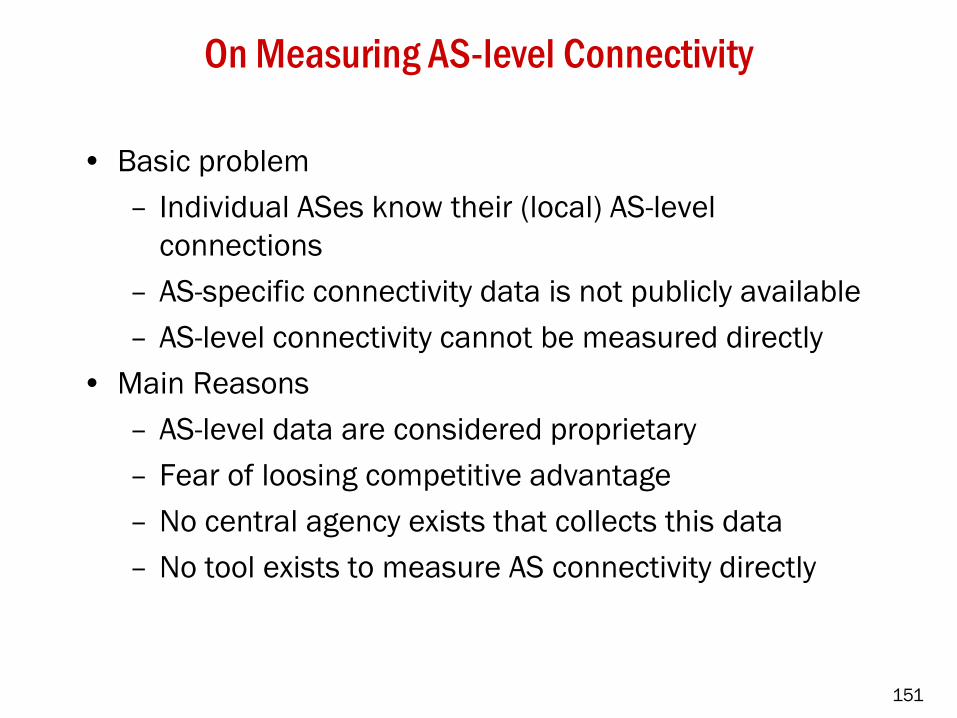
• Basic problem
– Individual ASes know their (local) AS-level
connections
– AS-specific connectivity data is not publicly available
– AS-level connectivity cannot be measured directly
• Main Reasons
– AS-level data are considered proprietary
– Fear of loosing competitive advantage
– No central agency exists that collects this data
– No tool exists to measure AS connectivity directly

152
On Measuring AS-level Connectivity (cont.)
• Generic approach to overcome basic problem
– Identify and collect appropriate ―surrogate‖ data
– Surrogate data should be publicly available/obtainable
– May require substantial efforts to collect surrogate data
– What does the surrogate data really say about AS-level
connectivity?
• Practical solution
– Rely on BGP, the de facto inter-domain routing protocol
– Use BGP RIBs (routing information base)
– RIBs contain routing information maintained by the router

153
Measurements: BGP RIBs
• Typical BGP RIB table entry
• Typical Routing table size
– About 200K entries or 100MB

154
BGP Measurements for AS-level Connectivity
• Daily BGP tables/updates are collected as part of ongoing
projects from multiple routers across the Internet
– RouteViews (Univ. of Oregon)
– RIPE RIS (Europe)
• On using BGP data to map the Internet AS-level topology
– Engineering hack – the role of BGP is not to obtain
connectivity information
– Another example of what we can measure, not what
we want to measure!

155
The Physicist’s View of BGP Measurements
• Easy to download publicly available BGP datasets
• Take the data at ―face value‖
• Easy to reconstruct a graph (often already provided,
courtesy of your friendly networking researchers)
• Resulting graph is taken to represent the Internet’s AS-
level connectivity (―ground truth‖)
• Blame the networking community, because it has done
little in the past to dispel this impression ….

156
The Engineer’s View of BGP Measurements
• Key observation
– BGP is not a mechanism by which ASes distribute
connectivity information
– BGP is a protocol by which ASes distribute the
reachability of their networks via a set of routing paths
that have been chosen by other ASes in accordance with
their policies.
• Main challenge
– BGP measurements are an example of ―surrogate‖ data
– Using this ―surrogate‖ data to obtain accurate AS-level
connectivity information is notoriously hard
– Examining the hygiene of BGP measurements requires
significant commitment and domain knowledge

157
The Engineer’s View of BGP Measurements (cont.)
• Basic problem #1: Incompleteness
– Many peering links/relationships are not visible from the
current set of BGP monitors
– An estimated 40-50% of peer-to-peer links are missing,
most of them in the lower tiers
• Basic problem #2: Ambiguity
– Need heuristics to infer ―meaning‖ of AS links: customer-
provider, peer-to-peer, sibling, and a few others
– Existing heuristics are known to be inaccurate
– Renewed recent efforts to develop better heuristics …

158
The Engineer’s View of BGP Measurements (cont.)
• The dilemma with current BGP measurements
– Parts of the available data seem accurate and solid (i.e.,
customer-provider links, nodes)
– Parts of the available data are highly problematic and
incomplete (i.e., peer-to-peer links)
• Bottom line
– (Current) BGP-based measurements are of questionable
quality for accurately inferring AS-level connectivity
– It is expected that future BGP-based measurements will be
more useful for the purpose of AS-level inference
– Very difficult to get to the ―ground truth‖

159
Traceroute Measurements for AS-level Connectivity
• Ongoing projects
– Archipelago (Ark, previously Skitter), CAIDA
– Dimes (EU project)
• Unsolved problems
– Problem #1: Mapping interface IP addresses to
routers (IP alias resolution problem)
– Problem #2: Mapping routers to ASes
• Bottom line
– Without novel solutions to problems #1 and #2,
current traceroute-based measurements are of very
questionable quality for accurately inferring AS-level
connectivity

160
Other Measurements for AS-level Connectivity
• Other available sources
– Public databases (WHOIS)
– Internet Routing Registry IRR)
• Main problems
– Voluntary efforts to populate the databases
– Inaccurate, stale, incomplete information
• Bottom line
– These databases are of insufficient quality to even
approximately infer AS-level connectivity

161
Internet Connectivity: Layer 3 (Internet Eco-system)
• Nodes
– Company/business (e.g., ISP, Content provider, CDN,
large enterprise, educational institution)
• Links
– Business relationship between two companies
– Derived from existing AS relationships
• Comments
– Build on top of the AS-level connectivity
– Each company consists of at least one AS
– Large companies consist of many different ASes and
use them to implement their business model (e.g.,
AT&T has about 20-30 ASes, main one is 7018)
• Has not been studied (no measurements)

162
Internet Connectivity: Application Layer (Web)
• Nodes
– Static html pages
• Links
– Hyperlinks
• Comments
– Huge (directed) graph
– Connectivity in the Web graph says nothing about the
underlying physical connectivity of the Internet
– Key factors: User behavior, socio-economic

163
(Part of the) Web Graph
Nodes = documents, connections = hyperlinks

164
http://www.almaden.ibm.com/cs/k53/www9.final/
Graph structure in the web
A. Broder, R. Kumar, F. Maghoul, P. Raghavan2, S. Rajagopalan, R. Stata, A. Tomkins, J. Wiener

165
Internet Connectivity: Application Layer (P2P)
• Nodes
– Users of a peer-to-peer network
– Examples: Gnutella (peers, super peers), BitTorrent
• Links
– Communication between 2 P2P users
• Comments
– Different P2P systems yield different connectivity
structures
– Connectivity in a P2P graph says nothing about the
underlying physical connectivity of the Internet
– Key factors: User behavior, socio-economic

166
On Measuring Overlay Connectivity Structures
• World-Wide-Web (WWW)
– AltaVista crawls (Broder et al,) in 1999
– Duration is a couple of weeks
– Google …
• P2P networks
– Structured (e.g., Kad DHT): Central control
– Unstructured (e.g., Gnutella): Crawler

167
HOWEVER: Problems with existing measurements
• High degree of dynamics of overlay networks
– Connectivity structure changes underneath the crawler
– Fast vs. slow crawls
• Enormous size of overlay networks
– Complete crawls take too long
– Partial crawls produce biased samples
– Promising alternative: Sampling
• Issues with sampling
– Bias due to temporal dynamics of nodes (peers)
– Bias due to spatial features of overlay network

168
Internet Connectivity: Application Layer (OSN)
• Nodes
– Users of an Online Social Network (OSN)
– Examples: Facebook, MySpace, Flickr, Twitter
• Links
– Friendship relationship
– Interaction
• Comments
– Different OSNs yield different connectivity structures
– Connectivity in an OSN says nothing about the
underlying physical connectivity of the Internet
– Key factors: User behavior, socio-economic

169
Online Social Networks (OSNs)
• Examples of some of the more popular OSNs
– MySpace
– YouTube
– LiveJournal
– Flickr
• Typical user activity in OSNs
– Listing ―friends‖, joining ―groups‖
– Send messages, post photos and ―notes‖
– Post on friends’ walls
– Update profiles, advertise events
– Subscribe to ―feeds‖

170
Particular example of an OSN: Facebook
• Some numbers for Facebook
– Launched in 2004, open to all since Sept. 2006
– About 150M users
– About 300K new users per day
– Typical usage: about 20 min/day per user
• More numbers for Facebook (as of Oct. 2008)
– Hosts 10 billion photos
– Each photo is stored in 4 sizes: 40 billion files
– 2-3 TB of photos are being uploaded to the site each day
– Photo traffic peaks at over 300,000 images per second
– Has just over 1 PB of photo storage
– As of early ’08: 10,000 servers worldwide and growing
– Uses CDNs

171
OSN measurements
• Provided by your friendly OSN owner
– 1 known instance: Cyworld (South Korea)
– About 20 million users (more than 1/3 of SK)
– 2 years of (anonymized) guestbook logs
• Not-so-friendly OSN owners (typical case)
– OSN supports well-defined API (e.g. Flickr)
•Crawling
•A few OSNs allow unrestricted crawling
•Most OSNs impose rate limit on #queries
– OSN does not support well-defined API (e.g., Facebook)
•Parsing/scrubbing html files

172
OSN measurements revisited (1)
• Most available measurements are crawler-based
– Need OSN-specific crawlers: One per supported API
– Wanted: General-purpose crawler
• Difficulties with crawling OSNs
– Completely unknown strucuture
– Full crawl takes too long because …
•Some OSNs are huge
•Most rate limit #queries
– Partial crawl takes less time, but …
•When should you stop? (bias)
•What do you miss? (representativeness)
• Promising alternative: Sampling
– Initial results, many open problems

173
OSN measurements revisited (2)
• OSNs
– OSN owners have no incentives to actively support
third-party crawlers
– How to design crawlers to explore a completely
unknown structure?
• Problem #1: Dynamics
– OSNs are believed to be highly dynamic
– The structure is changing underneath the crawler
– How to accurately and efficiently crawl an evolving
structure?

174
OSN measurements revisited (3)
• OSNs
– OSN owners have no incentives to actively support
third-party crawlers
– How to design crawlers to explore a completely
unknown structure?
• Problem #2: Quality of crawler-based data
– Bias?
– Representativeness?
– Completeness?
– Ambiguities?

175
OSN measurements revisited (4)
• The problem with current OSN measurements
– Most of the available OSN measurements are of unknown quality
– Some of the available data is informative/useful
– Deciding which parts of the data are useful is non-trivial
• Typical use of OSN measurements in Network Science literature
– The data is used as if it represents the ―ground truth‖
– Main object of interest: friendship graph (may turn out to be the least
interesting/relevant aspect of OSNs)
– Completely ignores dynamic aspects of OSNs
• The engineer’s/social scientist’s view
– Challenge #1: How to get to the ―ground truth‖?
– Challenge #2: Study of the ―active‖ part of the friendship graph
– Challenge #3: How to deal with the dynamic nature of OSNs?

176
Main lesson: There is no free lunch!
• Know your data!
– Internet data typically reflect what we can measure rather
than what we would like to measure
– Determining if the measured data can be used to make
solid statements about the Internet involves hard work
• Practice data hygiene!
– Beware of layers, protocols, feedback loops, technology,
economics, social behavior, etc.
– Details do matter and domain knowledge is critical
– Useful data via engineering hacks that may or may not be
obvious to non-experts
Related Documents

![Complex Reaction Networks in High Temperature Hydrocarbon ... · Science of Networks [6]" and Newman’s book \Networks: An Introduction [7]" are widely accepted introductory textbooks.](https://static.cupdf.com/doc/110x72/5f9182696f3b4267f33953ed/complex-reaction-networks-in-high-temperature-hydrocarbon-science-of-networks.jpg)


