1 The Salzburg QOL-GIS Interface: Spatial analysis of 293 urban QOL interviews Alexander G. Keul¹, Thomas Prinz² & Stefan Lang³ ¹ Psychology Department, University of Salzburg, Austria ² ARC Research Studio iSPACE, Salzburg, Austria ³ Z_GIS, University of Salzburg, Austria Abstract Robert W.Marans promotes an interface of unit record based subjective measures of urban QOL with GIS-based spatial objective measures of QOL. To enter this „open door of GIS“ (Golledge, 2002), environmental psychology joined with geoinformatics experts at Salzburg, Austria. After a Detroit Area Study pilot and a city council group meeting, a QOL-GIS project with ten student interviewers was started in 2006. The Salzburg QOL-GIS Interface is the unfunded prototype for Austrian GIS-based QOL research. Potential data users are city planners, administrators and politicians. Project results are shown 2007 at ERSA and nationally at AGIT (Salzburg), a main conference of the German-speaking geoinformatics community. The QOL-GIS Interface is situated in Salzburg City, Austria (N 47°47 E 13°04), east and west of the southern main road Alpenstrasse. It covers 1 square km (0.386 square miles) and has 100 grid squares 100x100 m with existing GIS data on population, buildings, infrastructure and greenery. The total population is 5,307 people. Of 100 grid squares, 56 have population desitities over 30 inhabitants. From an address-based master list, randomized interviews were planned using 22 (mostly Detroit Area Study) QOL items including sociodemographic and qualitative data. Fieldwork was finished in the mild 2006 winter with 293 interviews (a 5.5% sample) in 55 grid squares. QOL data were computed by SPSS and geocoded to a Salzburg GIS surface. Marked desity-related QOL differences were detected between four quarters of the Interface area. Infrastructure and leisure QOL values are more uniform. Maps and results will be shown to motivate larger, funded, comparative urban QOL-GIS research. Introduction Contemporary spatial planning faces the challenge of ecological, social and economic aspects in the same planning process. Quality of Life (QOL) has to be tested and spatial development should meet sustainability criteria. At Salzburg City, Austria, an evaluating GIS tool has been designed and tested together with the City Council. It uses a set of quantitative spatial indicators operated by methods of Applied Geoinformatics. This indicator set has now been matched with qualitative data by the collection of 293 geocoded population interviews on local Quality of Life in the same grid. Sustainable town-planning requires a feedback on environmental and infrastructural ressources by subjective QOL data of the local population. What are housing areas with a high QOL? What are the right infrastructure decisions to enhance QOL? The ongoing discussion on housing and residential quality and on residents’ QOL runs on different levels (citizens, planners, politicians etc.) with different interests and content.

Welcome message from author
This document is posted to help you gain knowledge. Please leave a comment to let me know what you think about it! Share it to your friends and learn new things together.
Transcript
1
The Salzburg QOL-GIS Interface: Spatial analysis of 293 urban QOL interviews
Alexander G. Keul¹, Thomas Prinz² & Stefan Lang³ ¹ Psychology Department, University of Salzburg, Austria
² ARC Research Studio iSPACE, Salzburg, Austria ³ Z_GIS, University of Salzburg, Austria
Abstract Robert W.Marans promotes an interface of unit record based subjective measures of urban QOL with GIS-based spatial objective measures of QOL. To enter this „open door of GIS“ (Golledge, 2002), environmental psychology joined with geoinformatics experts at Salzburg, Austria. After a Detroit Area Study pilot and a city council group meeting, a QOL-GIS project with ten student interviewers was started in 2006. The Salzburg QOL-GIS Interface is the unfunded prototype for Austrian GIS-based QOL research. Potential data users are city planners, administrators and politicians. Project results are shown 2007 at ERSA and nationally at AGIT (Salzburg), a main conference of the German-speaking geoinformatics community.
The QOL-GIS Interface is situated in Salzburg City, Austria (N 47°47 E 13°04), east and west of the southern main road Alpenstrasse. It covers 1 square km (0.386 square miles) and has 100 grid squares 100x100 m with existing GIS data on population, buildings, infrastructure and greenery. The total population is 5,307 people. Of 100 grid squares, 56 have population desitities over 30 inhabitants. From an address-based master list, randomized interviews were planned using 22 (mostly Detroit Area Study) QOL items including sociodemographic and qualitative data. Fieldwork was finished in the mild 2006 winter with 293 interviews (a 5.5% sample) in 55 grid squares. QOL data were computed by SPSS and geocoded to a Salzburg GIS surface. Marked desity-related QOL differences were detected between four quarters of the Interface area. Infrastructure and leisure QOL values are more uniform. Maps and results will be shown to motivate larger, funded, comparative urban QOL-GIS research.
Introduction
Contemporary spatial planning faces the challenge of ecological, social and economic aspects in the same planning process. Quality of Life (QOL) has to be tested and spatial development should meet sustainability criteria. At Salzburg City, Austria, an evaluating GIS tool has been designed and tested together with the City Council. It uses a set of quantitative spatial indicators operated by methods of Applied Geoinformatics. This indicator set has now been matched with qualitative data by the collection of 293 geocoded population interviews on local Quality of Life in the same grid.
Sustainable town-planning requires a feedback on environmental and infrastructural ressources by subjective QOL data of the local population. What are housing areas with a high QOL? What are the right infrastructure decisions to enhance QOL? The ongoing discussion on housing and residential quality and on residents’ QOL runs on different levels (citizens, planners, politicians etc.) with different interests and content.
2
The spatial indicator set used at Salzburg City contains variables of basic everyday life value like children welfare, play areas, public transport, green leisure areas, food shops and others. The indicator set and its GIS maps have been discussed at national and international meetings (Prinz & Reithofer, 2005; Hölbling, Schöpfer, Lang, Jekel, Kloyber & Prinz, 2006).
For the user-oriented evaluation of local residential attraction, a combination of different indicators into a general view is important. One possibility is a top-down approach, i.e. an expert-rating of the overall importance of singular indicators. A bottom-up approach looks more promising: Local residents have to express subjective QOL using different aspects of residential quality. In European research, QOL is a colorful topic. Noll (2004) lists seven main avenues of research (EC Eurobarometer, International Social Survey Program, European Values Study etc.).
Whereas GIS systems and data are already widely used by public health (e.g. Pearce, Witten & Bartie, 2006), biology, criminology, political science or in environmental protection, they have only been noticed as an „open door“ by environmental psychology (Golledge, 2002). GIS tests have been done on orientation and environmental cognition (e.g. Berglund & Nordin, 2005). Ester, Vinken, van Dun, Beckers and Koning (2002) did a large QOL survey on Brabant, Netherlands. But GIS was not regularly applied to the QOL area. In Austria, the latest and biggest citizen survey at Linz, Upper Austria (21,069 respondents; Stadtforschung Linz, 2005) did not geocode the data.
Robert W. Marans (2003, 2004) has pointed out the potential of GIS for QOL Surveys like the Detroit Area Study and has encouraged the Salzburg project in 2006. At the 2007 ERSA meeting in Paris, GIS-based QOL contributions come from Queensland, Australia (McCrea, 2007; Stimson, Marans & Chhetri, 2007), Istanbul, Turkey (Türkoglu, Bolen, Baran & Marans, 2007), Famagusta, North Cyprus (Oktay, 2007), Detroit, USA (Marans, 2007) and Salzburg, Austria.
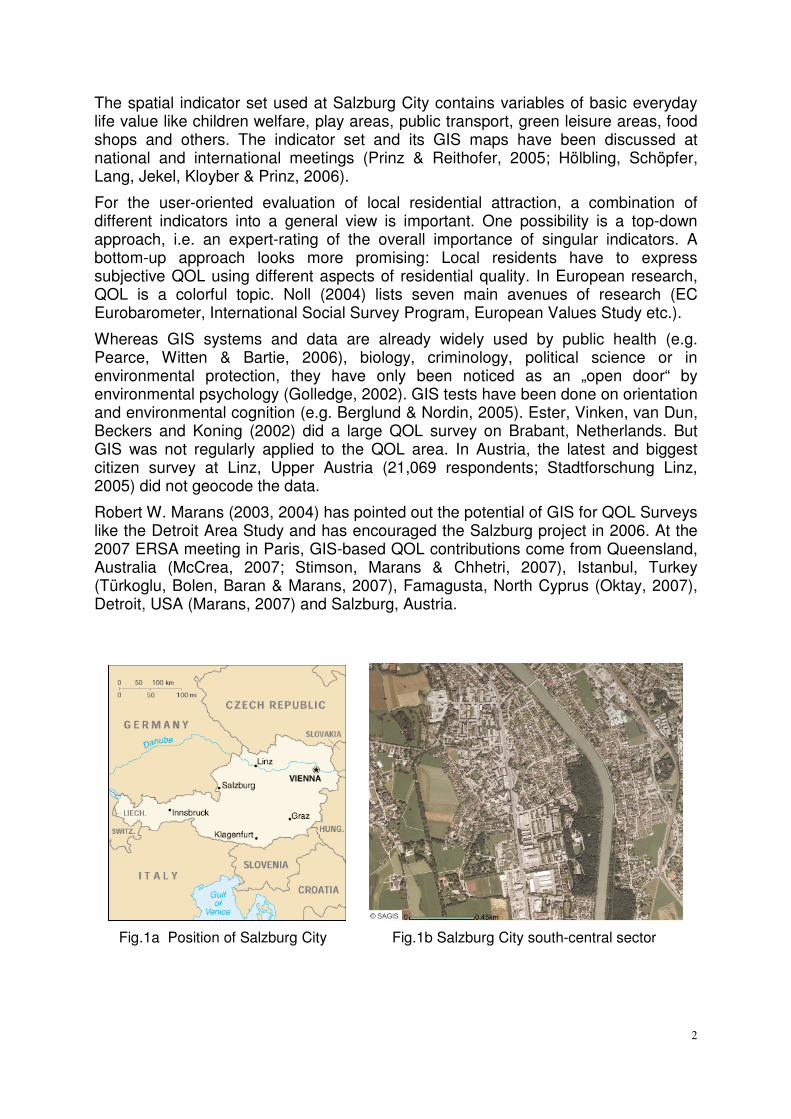
Fig.1a Position of Salzburg City Fig.1b Salzburg City south-central sector
3
Method, population and area
The Salzburg QOL-GIS Interface deals with a geobased subjective evaluation of the residential environment at southern Salzburg City, Austria (Fig. 1a & 1b). The city has about 150,000 inhabitants and is the capital of Salzburg, one of nine Austrian Federal Provinces. QOL data were personally interviewed using 22 items of the „Detroit Area Study“ (Michigan, USA) and additional sociodemographic data. The questionnaire dealt with general QOL, housing satisfaction, public transport satisfaction, quality of food shops, of local green leisure areas as well as personal safety. The field interviews were done by the Salzburg psychology students Susanne Bachler, Anna Enz, Rene Hackstock, Julia Hochfilzer, Lars Larsen, Gerald Moser, Judith Schider, Eva-Mareile Strasser, Sonja Tejkl and Melanie Trieb.
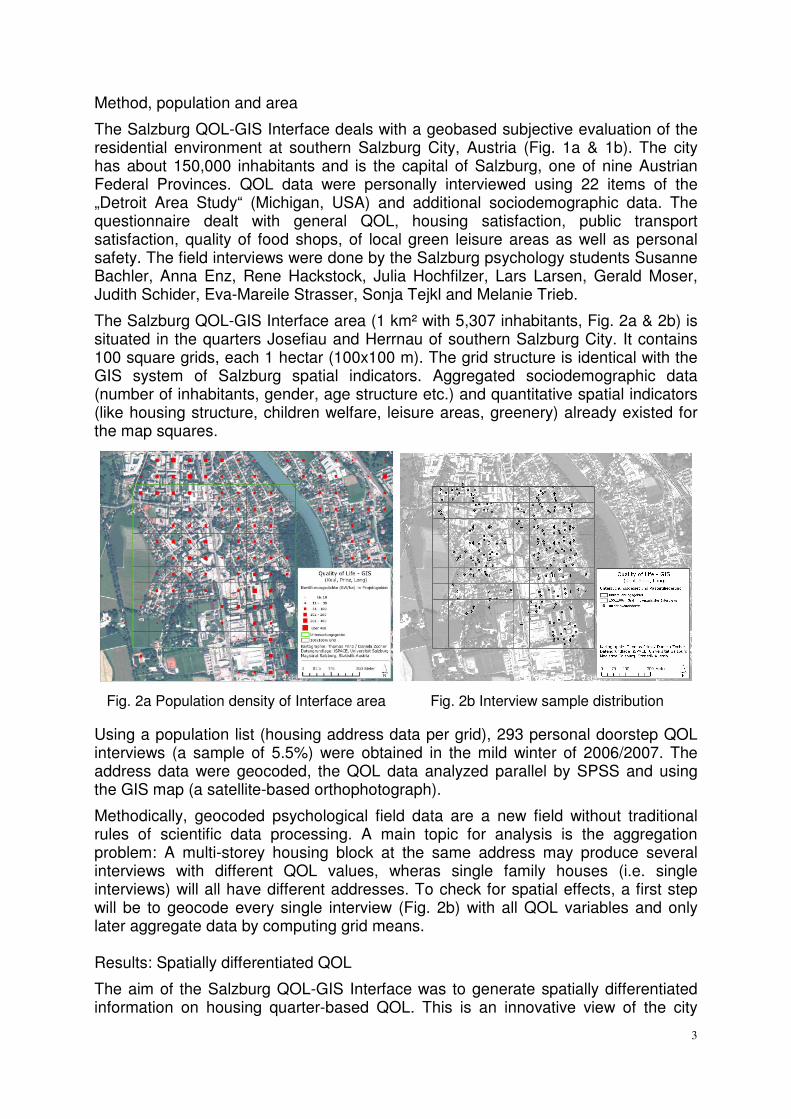
The Salzburg QOL-GIS Interface area (1 km² with 5,307 inhabitants, Fig. 2a & 2b) is situated in the quarters Josefiau and Herrnau of southern Salzburg City. It contains 100 square grids, each 1 hectar (100x100 m). The grid structure is identical with the GIS system of Salzburg spatial indicators. Aggregated sociodemographic data (number of inhabitants, gender, age structure etc.) and quantitative spatial indicators (like housing structure, children welfare, leisure areas, greenery) already existed for the map squares.
Fig. 2a Population density of Interface area Fig. 2b Interview sample distribution
Using a population list (housing address data per grid), 293 personal doorstep QOL interviews (a sample of 5.5%) were obtained in the mild winter of 2006/2007. The address data were geocoded, the QOL data analyzed parallel by SPSS and using the GIS map (a satellite-based orthophotograph).
Methodically, geocoded psychological field data are a new field without traditional rules of scientific data processing. A main topic for analysis is the aggregation problem: A multi-storey housing block at the same address may produce several interviews with different QOL values, wheras single family houses (i.e. single interviews) will all have different addresses. To check for spatial effects, a first step will be to geocode every single interview (Fig. 2b) with all QOL variables and only later aggregate data by computing grid means. Results: Spatially differentiated QOL
The aim of the Salzburg QOL-GIS Interface was to generate spatially differentiated information on housing quarter-based QOL. This is an innovative view of the city
4
through the eyes of local inhabitants and able to improve the diagnostic value of top-down GIS spatial indicator systems.
The Salzburg QOL-GIS Interface, analyzed by SPSS (nonparametric correlations, Kendall’s tau, only values with p<.000 reported), showed several interrelations: 1) Of the seven QOL-relevant inhabitant ratings (5-point Likert scales) on general QOL, satisfaction with housing, food shops, greenery, leisure, neighbors and safety, housing (.314), greenery (.310), neighbors (.307), and safety (.193) correlated highly with general QOL, whereas food shops did not. Also, there were relations between greenery and leisure satisfaction (.427) and between neighbors and safety (.232). 2) Housing satisfaction significantly increased with dwelling duration (.235) and age (.279) – rootedness to the local community – and was inversely related to the distance to public transport (-.214).
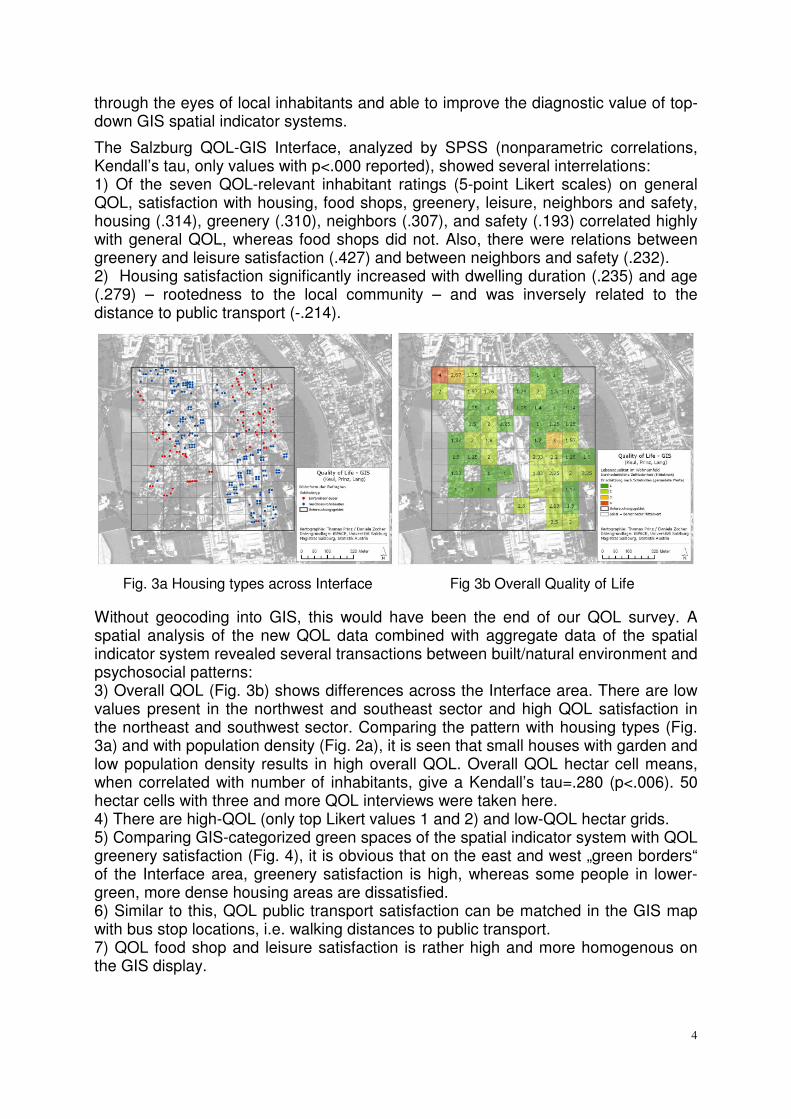
Fig. 3a Housing types across Interface Fig 3b Overall Quality of Life
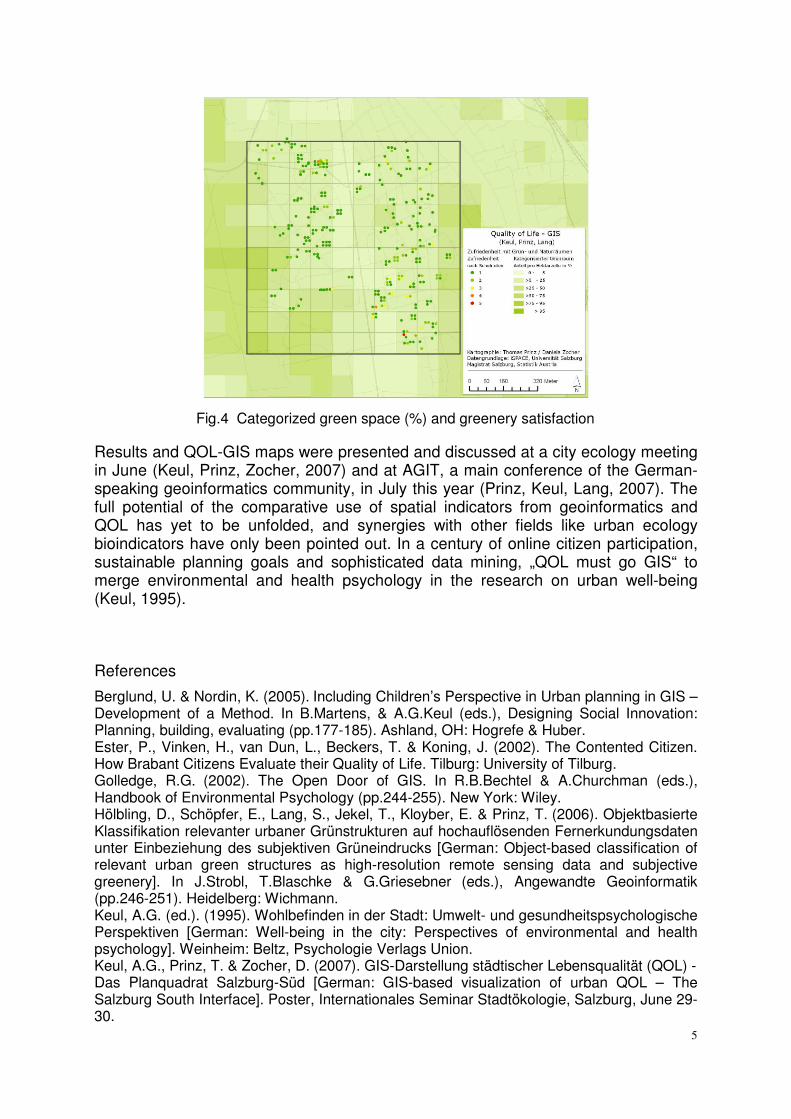
Without geocoding into GIS, this would have been the end of our QOL survey. A spatial analysis of the new QOL data combined with aggregate data of the spatial indicator system revealed several transactions between built/natural environment and psychosocial patterns: 3) Overall QOL (Fig. 3b) shows differences across the Interface area. There are low values present in the northwest and southeast sector and high QOL satisfaction in the northeast and southwest sector. Comparing the pattern with housing types (Fig. 3a) and with population density (Fig. 2a), it is seen that small houses with garden and low population density results in high overall QOL. Overall QOL hectar cell means, when correlated with number of inhabitants, give a Kendall’s tau=.280 (p<.006). 50 hectar cells with three and more QOL interviews were taken here. 4) There are high-QOL (only top Likert values 1 and 2) and low-QOL hectar grids. 5) Comparing GIS-categorized green spaces of the spatial indicator system with QOL greenery satisfaction (Fig. 4), it is obvious that on the east and west „green borders“ of the Interface area, greenery satisfaction is high, whereas some people in lower-green, more dense housing areas are dissatisfied. 6) Similar to this, QOL public transport satisfaction can be matched in the GIS map with bus stop locations, i.e. walking distances to public transport. 7) QOL food shop and leisure satisfaction is rather high and more homogenous on the GIS display.
5
Fig.4 Categorized green space (%) and greenery satisfaction
Results and QOL-GIS maps were presented and discussed at a city ecology meeting in June (Keul, Prinz, Zocher, 2007) and at AGIT, a main conference of the German-speaking geoinformatics community, in July this year (Prinz, Keul, Lang, 2007). The full potential of the comparative use of spatial indicators from geoinformatics and QOL has yet to be unfolded, and synergies with other fields like urban ecology bioindicators have only been pointed out. In a century of online citizen participation, sustainable planning goals and sophisticated data mining, „QOL must go GIS“ to merge environmental and health psychology in the research on urban well-being (Keul, 1995).
References
Berglund, U. & Nordin, K. (2005). Including Children’s Perspective in Urban planning in GIS – Development of a Method. In B.Martens, & A.G.Keul (eds.), Designing Social Innovation: Planning, building, evaluating (pp.177-185). Ashland, OH: Hogrefe & Huber. Ester, P., Vinken, H., van Dun, L., Beckers, T. & Koning, J. (2002). The Contented Citizen. How Brabant Citizens Evaluate their Quality of Life. Tilburg: University of Tilburg. Golledge, R.G. (2002). The Open Door of GIS. In R.B.Bechtel & A.Churchman (eds.), Handbook of Environmental Psychology (pp.244-255). New York: Wiley. Hölbling, D., Schöpfer, E., Lang, S., Jekel, T., Kloyber, E. & Prinz, T. (2006). Objektbasierte Klassifikation relevanter urbaner Grünstrukturen auf hochauflösenden Fernerkundungsdaten unter Einbeziehung des subjektiven Grüneindrucks [German: Object-based classification of relevant urban green structures as high-resolution remote sensing data and subjective greenery]. In J.Strobl, T.Blaschke & G.Griesebner (eds.), Angewandte Geoinformatik (pp.246-251). Heidelberg: Wichmann. Keul, A.G. (ed.). (1995). Wohlbefinden in der Stadt: Umwelt- und gesundheitspsychologische Perspektiven [German: Well-being in the city: Perspectives of environmental and health psychology]. Weinheim: Beltz, Psychologie Verlags Union. Keul, A.G., Prinz, T. & Zocher, D. (2007). GIS-Darstellung städtischer Lebensqualität (QOL) - Das Planquadrat Salzburg-Süd [German: GIS-based visualization of urban QOL – The Salzburg South Interface]. Poster, Internationales Seminar Stadtökologie, Salzburg, June 29-30.

6
Marans, R.W. (2003). Modeling Residential Quality using Subjective and Objective Indicators: Opportunities through Quality of Life Studies. Presentation, IAPS Methodologies in Housing Research Conference, Stockholm, Sweden, September 22-24. Marans, R.W. (2004). The 2001 Detroit Area Study (DAS) on the Quality of Community Life. Presentation, Board Session, 18th IAPS Conference, Vienna, Austria, July 7-10. Marans, R.W. (2007). Theory and policy driven quality of urban life studies: Examples from the Detroit metropolitan area. Paper for the session „Analysing Urban Quality of Life“, ERSA, Paris, Aug.29-Sep.2. McCrea, R. (2007). Urban Quality of Life: Linking objective dimensions and subjective evaluations of the urban environment. Paper for the session „Analysing Urban Quality of Life“, ERSA, Paris, Aug.29-Sep.2. Noll, H.-H. (2004). Subjektives Wohlbefinden im Europäischen Vergleich [German: Subjective Well-being in a European Comparison]. Presentation, Workshop „Subjektives Wohlbefinden und subjektive Indikatoren: Konzepte, Daten und Analysen“, ZUMA Mannheim, Germany, 2.-3.December. Oktay, D. (2007). Analyzing the Quality of Life in Famagusta, North Cyprus. Paper for the session „Analysing Urban Quality of Life“, ERSA, Paris, Aug.29-Sep.2. Pearce, J., Witten, K. & Bartie, P. (2006). Neighborhoods and health: A GIS approach to measuring community resource accessibility. Journal of Epidemology and Community Health, 60 (5), 389-395. Prinz, T., Keul, A.G. & Lang, S. (2007). Räumlich differenzierte Lebensqualität – GIS-gestützte Analyse von 293 QOL-Interviews in der Stadt Salzburg [German: Spatially differentiated QOL – GIS-based analysis of 293 QOL interviews in Salzburg City]. Presentation, AGIT 2007, Salzburg, July 4-6. Prinz, T. & Reithofer, J. (2005): Infrastrukturelle Wohnstandort-Attraktivität in der Stadt Salzburg [German: Infrastructural attraction factors for housing in Salzburg City]. In J.Strobl, T.Blaschke & G.Griesebner (eds.), Angewandte Geographische Informationsverarbeitung XVII (pp.547-552). Heidelberg: Wichmann. Stadtforschung Linz (2005). Analyse Bürgerbefragung 2004 [German: Analysis of the 2004 citizen survey]. Linz: Magistrat Linz. Stimson, R.J., Marans, R.W. & Chhetri, P. (2007). Does geography matter? Exploring spatial differences in Urban Quality of Life between Detroit and Brisbane-South East Queensland. Paper for the session „Analysing Urban Quality of Life“, ERSA, Paris, Aug.29-Sep.2. Türkoglu, H.D., Bolen, F., Baran, M. & Marans, R.W. (2007). Towards a sustainable future: Initial findings from an ongoing Quality of Life study in metropolitan Istanbul. Paper for the session „Analysing Urban Quality of Life“, ERSA, Paris, Aug.29-Sep.2. Contact: Alexander G. Keul, [email protected] , office phone 0043 662 8044 5127
Related Documents